Odor Representations in Olfactory Cortex: Distributed Rate ...

Downregulation of PEBP1 in Rat Brain Cortex in Hypoxia
Sandeepta Burgula & Rajesh Medisetty &
Nalini Jammulamadaka & Sairam Musturi &Govindan Ilavazhagan & Surya S. Singh
Received: 14 April 2009 /Accepted: 22 July 2009# Humana Press 2009
Abstract In order to understand dementia and other ail-ments associated with high altitude hypoxia, adult SpragueDawley male rats were exposed to simulated conditions ofhigh altitude (7,500 m above sea level, 59 mmHg) for aperiod of 5 days and analyzed for changes in neuronalproteome by 2-D sodium dodecyl sulfate polyacrylamide gelelectrophoresis. Protein extracts obtained from the braincortex and hippocampus of the hypoxic rats were separatedby 2-D gel electrophoresis. Differentially expressed proteins(analysis by 2-D gel analysis software, Bio-2D, Vilber-Lourmat, France and Delta2d, Decodon, Germany) weresubjected to matrix-assisted laser desorption/ionizationtime-of-flight analysis. Among the proteins identified, thespot corresponding to pI 5.4 and molecular weight 21 kDa,identified as phosphatidylethanolamine binding protein(PEBP1), was consistently lowered (54%) in hypoxic cortexsamples. PEBP1, also known as Raf kinase inhibitor protein,is a precursor of hippocampus cholinergic neurostimulatorypeptide (HCNP). Western blot analysis revealed elevatedphospho-extracellular signal-regulated kinase in hypoxic ratcortex samples, indicating activation of Raf/mitogen-activatedprotein kinase pathway under hypoxia. Lowered HCNPlevels leading to 23% decrease in choline acetyltransferaseand 63% increase in acetylcholinesterase activity weredetected in hypoxic rat brain cortex, while no significantchange was noted in hippocampus. Since PEBP1 is lowered
in a number of neurological disorders associated withdementia, we speculate that lowered expression of PEBP1might be responsible for dementia associated with high-altitude hypoxia. Further studies targeting PEBP1 might giveclues about signaling pathways associated with hypoxia anddementia.
Keywords Hypoxia . High altitude . PEBP1 . Dementia
Introduction
Slight reductions in normal oxygen concentrations (hypoxia)can cause the induction of specific genes involved inmammalian oxygen homeostasis such as erythropoietin,vascular endothelial growth factor, hypoxia-induciblefactor-1 (HIF-1), endothelin, etc. Investigations of suchhypoxia-inducible genes performed in many differentcultured cell lines suggest that every mammalian (perhapseven every vertebrate and insect) cell possesses one orseveral oxygen-sensing mechanism(s), i.e., a molecularoxygen sensor.
Although the central nervous system occupies only 2%of the total body mass, its O2 consumption is as high as20% of total resting oxygen and hence is highly sensitive tothe smallest changes in ambient O2 partial pressure.Chronic hypoxia in particular plays a major role in systemicdegeneration of tissues, leading to varied disorders likeatherosclerosis, sleep apnea, high-altitude pulmonary ede-ma, high-altitude cerebral edema, dementia, memory loss,and eventually death in susceptible individuals. Ourknowledge of pathophysiology of hypoxia lacks under-standing of several aspects with respect to its effect onneuronal gene expression. Several unresolved issues per-taining to the signal transduction mechanisms linking
S. Burgula : R. Medisetty :N. Jammulamadaka : S. S. Singh (*)Department of Biochemistry, Osmania University,Hyderabad 500007 Andhra Pradesh, Indiae-mail: [email protected]
S. Musturi :G. IlavazhaganDefence Institute of Physiology and Allied Sciences,Lucknow Road, Timarpur,Delhi 110054, India
J Mol NeurosciDOI 10.1007/s12031-009-9275-7

dementia, hypoxia, and neurotransmission prevail. Interest-ingly, several complex proteins, such as HIF-1, mitogen-activated protein kinase (MAPK), phosphoinositide-3 kinase,protein kinase C, amyloid beta, involved in neuronalfunction, regulation of cell proliferation, adaptation tohypoxic stress, etc., have other complex roles especially inmetastasis and tumor progression.
In this study, we have studied the effect of hypoxichypoxia (at 25,000 ft above sea level) on the rat brain. Wefocused herein on the effect in context of dementia andmemory loss which are some of the major side effects oflong-term exposure to hypoxia. Previous investigationshave indicated that hypoxia can leave subjects highlysusceptible to Alzheimer’s disease (Sun et al. 2006).
To understand the molecular mechanisms associatedwith hypoxia-mediated dementia, we carried out total ratbrain proteome analysis under hypoxic conditions. In ourpresent study, we found that hypoxia significantly reducedPEBP1 levels in the rat brain cortex. In rats, PEBP1 ishighly expressed in the brain and is a major component ofepididymal secretions and sperm plasma membranes (Uni-ProtKB/Swiss-Prot entry P31044). PEBP1 is a precursor forthe undecapeptide hippocampus cholinergic neurostimula-tory peptide (HCNP; Mitake et al. 1996) which plays amajor role in indirectly stimulating the secretion of acetylcholine. HCNP stimulates the secretion of choline acetyl-transferase but not acetylcholine esterase and has a role inAlzheimer’s disease (George et al. 2006). PEBP1 regulatesactivation of MAPK, nuclear factor kappa-B, and Gprotein-coupled receptors and is implicated in severalhuman disorders (Odabaei et al. 2004). PEBP is shown tobe involved with several signaling cascades, interferingwith MAPK/extracellular signal-regulated kinase (ERK)kinase (MEK) phosphorylation and activation by Raf-1.Moreover, it was also postulated that PEBP1 is involved ingrowth, transformation, and differentiation, which are oftenderegulated in many forms of cancer. In a normal cell,PEBP1 is known to the regulate cell proliferation by itsinteraction with raf kinase. ERK-1 is a downstream targetphosphorylated by MEK, which in turn is phosphorylatedby Raf-1 kinase. Mutations resulting in dysregulation ofPEBP1 lead to loss of this interaction, leading to activationof ERK-1-mediated MAPK cascade, which is known toresult in tumor development and progression (Schuierer etal. 2006).
Materials and Methods
Animals
Adult male Sprague Dawley rats (weights ∼175 g) weremaintained at Defence Institute of Physiological and Allied
Sciences (DIPAS), DRDO, Delhi, India. Animals were main-tained at a constant temperature (22±2°C) with 12-h light–dark cycle. Animals had access to food and water ad libitum,and all efforts were made to minimize animal suffering. Theexperimental protocols followed were in accordance with theguidelines approved by the DIPAS ethical committee (DRDO,Delhi, India) in compliance with the European CommunitiesCouncil directive.
Exposure to Hypoxia
Adult male rats were exposed to simulated hypobarichypoxia of 7,500 m in an animal decompression chamber(Decibel instruments, Delhi, India) at 22±2°C coupled tomercury barometer (Bhatia et al. 1966). The animals werekept in this chamber operated under 12-h light–dark cycles.Ambient CO2 in the chamber was constantly monitored andmaintained at <0.03% by adjustments in overall chamberventilation, and humidity was maintained at <40%. Ani-mals (n=6/group) were exposed to either normoxia in roomair or continuous simulated hypobaric hypoxia corres-ponding to oxygen partial pressure at 7,500 m altitude fora period of 5 days with a break of 30 min each day forreplacing food and water.
Sample Preparation
After hypoxic exposure, both control and hypoxiatreated rats were sacrificed under ketamine chlorhydrate(80 mg/kg) anesthesia, and their brains were dissected outafter thorough perfusion and stored at −80°C for furtheranalysis. One hundred milligrams (wet weight) of hippo-campus and cortex was homogenized on ice with a tissuetearer in 500 μl lysis buffer (20 mM Tris (pH 7.5), 7 Murea, 2 M thiourea, 4% 3-[(3-cholamidopropyl)dimethy-lammonio]-1-propanesulfonate (CHAPS), 10 mM dithio-threitol (DTT), 1 mM ethylenediaminetetraacetic acid(EDTA), 1 mM phenylmethylsulfonyl fluoride (PMSF),and protease inhibitor cocktail). The homogenate wassonicated, vortexed, and centrifuged at 15,000×g at 4°Cfor 45 min. Supernatants were stored at −80°C. Onemicroliter of sample was used for protein estimation byBradford’s method (Bradford 1976).
2-D Electrophoresis
Samples were diluted with rehydration sample buffer (4 Murea, 2% CHAPS, 1 mM DTT, 0.2% Biolyte 3/10ampholytes, and traces of bromophenol blue) to get a finalconcentration of 500 μg protein in 300 μl. The sampleswere loaded onto an immobilized pH gradient (IPG) strip(17 cm), and isoelectric focusing (IEF) was carried out asspecified by the supplier (Biorad, USA). After IEF, the IPG
J Mol Neurosci

strips were equilibrated in equilibration buffer I (0.375 MTris-Cl (pH 8.8), 6 M urea, 2% sodium dodecyl sulfate(SDS), 20% glycerol, 130 mM DTT) for 10 min and thenequilibration buffer II (0.375 M Tris-Cl (pH 8.8), 6 M urea,2% SDS, 20% glycerol, 135 mM iodoacetamide) for10 min. The IPG strips were then loaded onto 1-mm-thick9–16% gradient gels and electrophoresed at 16 mA instacking gel and 24 mA in resolving gel. After electropho-resis, gels were fixed in 40% methanol and 10% acetic acidand stained by 0.2% Coomassie stain and destained in 40%methanol and 10% acetic acid. For analysis by Vilber-Lourmat Bio-2D software (France), gels were stained usingSYPRO ruby gel stain (Biorad), wherein the gels werefixed in 40% methanol and 10% acetic acid, washedthoroughly in deionized water, and were exposed to thestain overnight. The gels were then destained in 10%methanol and 7% acetic acid for a period of 30 min andthen rinsed in ultrapure water for at least 5 min beforeviewing. The images of the gels were then acquired at awavelength of 300 nm in case of sypro ruby gel stained gelsand in visible light for Coomassie stained gels on aSYNGENE gel documentation system (USA).
Analysis
Proteins resolved by 2-D electrophoresis were analyzed forchanges using Bio Profil (Bio-2D, Vilber-Lourmat, France)and Delta2D (Decodon, Germany) softwares. Several brainproteome databases available on worldwide web likeSWISS-PROT, www.hprd.org, www.phosphoelm.org, etc.and the latest literature were also used for analysis.Differentially expressed proteins were theoretically identi-fied (Gozal et al. 2002; Lubec et al. 2003; Fountoulakis etal. 2005) based on pI and molecular weight after quantita-tion by densitometry analysis.
Identification of Differentially Expressed Proteinsby MALDI-TOF
For identification and sequencing, Coomassie-stained 2-Dgel slabs were extensively washed with ultrapure water, andeach gel spot was excised with a clean scalpel. The spotswere destained in ammonium bicarbonate (0.2 M) in 40%acetonitrile (ACN) at room temperature (21°C) for 30 minon a tilt table. The solvent was removed, and the gel pieceswere dried using a Savant Speed Vac System (Ramsey,MN, USA). In-gel tryptic digestion was carried out in0.1 mg of modified trypsin (Sigma-Aldrich) per 15 mm3 ofgel in 40 mM NH4CO3 and 9% of acetonitrile for 16–24 hat 37°C. Samples were extracted in 0.1% trifluoroaceticacid (TFA) and 50% ACN and subjected to matrix-assistedlaser desorption/ionization time-of-flight (MALDI-TOF)analysis.
Analysis of Peptide Sequence
Protein identification from tryptic fragment sizes was madeusing the Mascot search engine (www.matrixscience.com)based on the entire National Center for BiotechnologyInformation (NCBI) protein database using the assumptionthat peptides are monoisotopic, oxidized at methionineresidues, and carbamidomethylated at cysteine residues.Original protein size based on the portion of the gel fromwhich the spot was excised was not restricted. Probability-based molecular weight search (Mowse) score definedas −10×log (p), where p was the probability that theobserved watch was a random event, was determined(Perkins et al. 1999; Pappin 1997). Scores greater than>43 were considered significant (p<0.05). Protein scoreswere derived from ions scores as a nonprobabilistic basisfor ranking protein hits. All protein identifications were inthe expected size range based on position in the gel.
Sequencing and Identification of PEBP1 by LC–MS/MS
The Coomassie-stained 2-D gel electrophoresis slabs wereextensively washed with deionized water, and each gel spotwas excised with a clean scalpel. The spots were destainedin ammonium bicarbonate (0.2 M) in 40% acetonitrile atroom temperature (21°C) for 30 min on a tilt table. Thesolvent was removed and the gel pieces were dried using aSavant Speed Vac System (Ramsey, MN, USA). In-geltryptic digestion was carried out in 0.1 mg of modifiedtrypsin (Sigma-Aldrich) per 15 mm3 of gel in 40 mMNH4CO3 and 9% of acetonitrile for 16–24 h at 37°C. Thepeptides were extracted in 0.1% TFA, 60% ACN, andsubjected to liquid chromatography–mass spectrometry(LC–MS)/MS analysis to determine peptide fragment sizeand sequence. Gel spots from 2-D gels were excised, in-gel-digested with trypsin, and analyzed by liquid chromatogra-phy electrospray ionization mass spectrometry (Adams etal. 2002). Briefly, samples were loaded onto a fused silicacapillary column (PicoFrit Column, New Objective,Woburn, MA, USA) packed with reversed phase material(Zorbax C-18, 5-μ particle size, Agilent, Santa Clara, CA,USA). The mobile phase consisted of aqueous 0.1% formicacid (A buffer) and 0.1% formic acid in 80% acetonitrile/water (B buffer). Elution was achieved by a gradient of 5%to 70% B buffer in 65 min at a flow rate of 150 nl/min. Theeluent was electrosprayed into a Bruker Esquire 3000 Plusquadrupole ion trap mass spectrometer (Bruker Daltonics,Billerica, MA, USA). Spectra were measured for the threemost intense species in each time window. For each mass,MS and MS/MS spectra were recorded. After two sets ofspectra, the parent mass was excluded for 1 min. Thecomplete data set for each gel spot was searched using theMascot algorithm (Matrix Science, London, UK) against a
J Mol Neurosci
recent release of the nonredundant NCBI database. Onlyresults that gave significant Mascot scores were reported.
Cloning of Rat PEBP1 into Bacterial Expression VectorpGEX4T-1
Rat PEBP1 cDNA clone was purchased from Geneservice,UK. Primers were designed as follows to amplify thecomplete coding sequence from the cDNA clone: forwardprimer—5′ GGA TCC GTC ATG GCC GCC GAC ATC 3′containing BamHI restriction site and reverse primercontaining XhoI restriction site—5′ CTC GAG CCC CTACTT CCC AGC CAG CTG 3′. The PCR product wasstabilized in T/A vector (Fermentas, USA) and sequencedin both directions to confirm fidelity of the reactions. Toconstruct pGEX-PEBP1, the open reading frame of PEBP1was excised from T/A-PEBP1 by BamH1 and XhoIdigestion and ligated into BamHI- and XhoI-digestedpGEX-4T-1 (Amersham Biosciences). Escherichia coli(BL-21) was transformed with pGEX-PEBP1 and expres-sion of GST-PEBP1 was induced with 0.5 mM isopropyl-beta-D-thiogalactopyranoside. The fusion protein waspurified using GSH-Sepharose (Sigma, USA) column asdescribed by the suppliers.
Antibody Production
Anti-GST-PEBP1 antisera were made by immunization ofmale New Zealand white rabbits using standard protocols.
Preparation of Whole-Cell, Nuclear, and CytoplasmicExtracts
For whole-cell extracts, 100 mg of rat hippocampus andcortex samples was lysed in 500 μl lysis buffer (100 mMTris (pH 7.4), 200 mM NaCl, 0.1% Triton X-100, 2.5 mMEDTA, 2 mM ethylene glycol tetraacetic acid, 50 mM NaF,1 mM Na3VO4, 1 mM DTT, 1.4 mM PMSF) homogeni-zation. The homogenates were pushed through 26 gaugesyringe needle two to three times to ensure uniform lysisand vortexed again. The homogenate was then centrifugedat 15,000×g at 4°C for 30 min. For preparation of nuclearextracts, four volumes of cold buffer A (10 mM 4-(2-hydroxyethyl)-1-piperazineethanesulfonic acid (HEPES;pH 7.9), 0.5 M sucrose, 1.5 mM MgCl2, 10 mM KCl,10% glycerol, 1 mM EDTA, 1 mM DTT, 1 mM PMSF)were added to the whole brain tissue, homogenized, and thehomogenate was kept on ice for 15 min. To this, nonidetP-40 was added to a final concentration of 0.6% and thesample was centrifuged at 20,000×g for 10 min at 4°C. Thesupernatant was collected as cytosolic fraction. The pelletwas washed with one volume of buffer A and centrifugedunder same conditions for 10 min. The pellet was
suspended in one volume of buffer C (20 mM HEPES(pH 7.9), 1.5 mM MgCl2, 300 mM NaCl, 20% glycerol,0.2 mM EDTA, 1 mM DTT, 1 mM PMSF), incubated for30 min, and was centrifuged at 20,000×g for 15 min at 4°C.The protein concentration of supernatant collected (nuclearfraction) was estimated, and the samples were stored in−80°C until further use.
Western Blotting
Protein samples (50 μg) were subjected to electrophoresison 10% SDS-polyacrylamide gels and electroblotted ontonitrocellulose membranes. Membranes were blocked with3% BSA (Sigma, USA) and probed with primary anti-bodies. We used polyclonal PEBP1 antibodies raised at ourlaboratory or the monoclonal mouse pERK antibody (SantaCruz, USA). The secondary horseradish peroxidase-linkedantibodies (Genei, India) were visualized by enhancedchemiluminescence (Amersham) using Kodak X-ray filmsand alkaline phosphatase (ALP)-linked goat anti-rabbitantibodies were visualized using Nitroblue tetrazoliumchloride/5-bromo-4-chloro-3′-indolyphosphate p-toluidinesalt substrate.
Enzyme-Linked Immunosorbent Assay
Five hundred micrograms of rat whole brain, cortex, andhippocampus whole-cell protein extracts was taken andacetone-precipitated (Wessel and Flugge 1984). The super-natants were taken and dried in vacuum (Savant, USA).The dried supernatant was suspended in coating buffer(0.1 M NaHCO3, pH 8.6) and coated onto a 96-wellenzyme-linked immunosorbent assay (ELISA) titer plate upto a dilution of 1:32. ELISA was carried out using primary(polyclonal rabbit PEBP1) and secondary (goat anti-rabbitALP-labeled) antibodies. The reaction was developed using0.00125% paranitrophenol phosphate in substrate buffercontaining 0.5 mM MgCl2 (pH 9.6) in 10% diethanolaminefor 30 min. Five normal NaOH was used to stop thereaction and the reaction was measured at 405 nm.
Choline Acetyltransferase Assay
Choline acetyltransferase (ChAT) activity in hypoxia-treated rat brain cortex and whole brain was estimatedby determining the rate of acetylation of choline with14C-acetyl CoAwith rat brain cortex extract as the source ofenzyme. The method was adapted from previous studies ofPotter et al. (1968). Briefly, in a final volume of 30 μlcontaining 10 μl of crude enzyme and 20 μl of reactionmixture containing 2.0 mM choline chloride, 0.2 mM14C-acetyl CoA, 0.2 mM physostigmine sulfate, 0.2 mMneutralized EDTA, 20 mM phosphate buffer (pH 7.4),
J Mol Neurosci

600 mM KCl, and 2% 1-butanol were incubated at 37°C for10 min. The reaction was stopped by the addition of 10 μlof 1 N acetic acid containing unlabelled carrier acetylcho-line chloride (0.02 M) and cooled in an ice bath. Productformed (10 μl) was spotted onto strips of Whatman No. 1filter paper and electrophoresed in 0.125 M acetic acid and0.125 M sodium acetate (pH 4.7). After electrophoresis, thepaper was air-dried in a hood for developing spotscorresponding to acetylcholine using iodine vapors. Theobserved spots were cut out and counted by a liquidscintillation technique, in a toluene base phosphor. Appro-priate enzyme blanks were utilized to cancel out anyresidual or background values.
Estimation of AChE Activity
Estimation of acetylcholinesterase activity was carried outusing the method of Ellman et al. (1961). Whole brain andcortex samples were dissected out from exposed rats and a10% (w/v) homogenate was prepared in sodium phosphatebuffer (30 mM, pH 7.0) and centrifuged at 10,000×g for10 min at 4°C. The supernatant was used for estimation ofAChE. Briefly, the extracted supernatant was mixed with acocktail of 5,5′-dithiobis(2-nitrobenzoic acid) and phosphatebuffer (pH 8) followed by incubation for 5 min. To this, thesubstrate acetylcholine iodide was added, and the sample wasread at 420 nm continuously for 5 min at 1-min intervals.
Results
2-D Gel Analysis
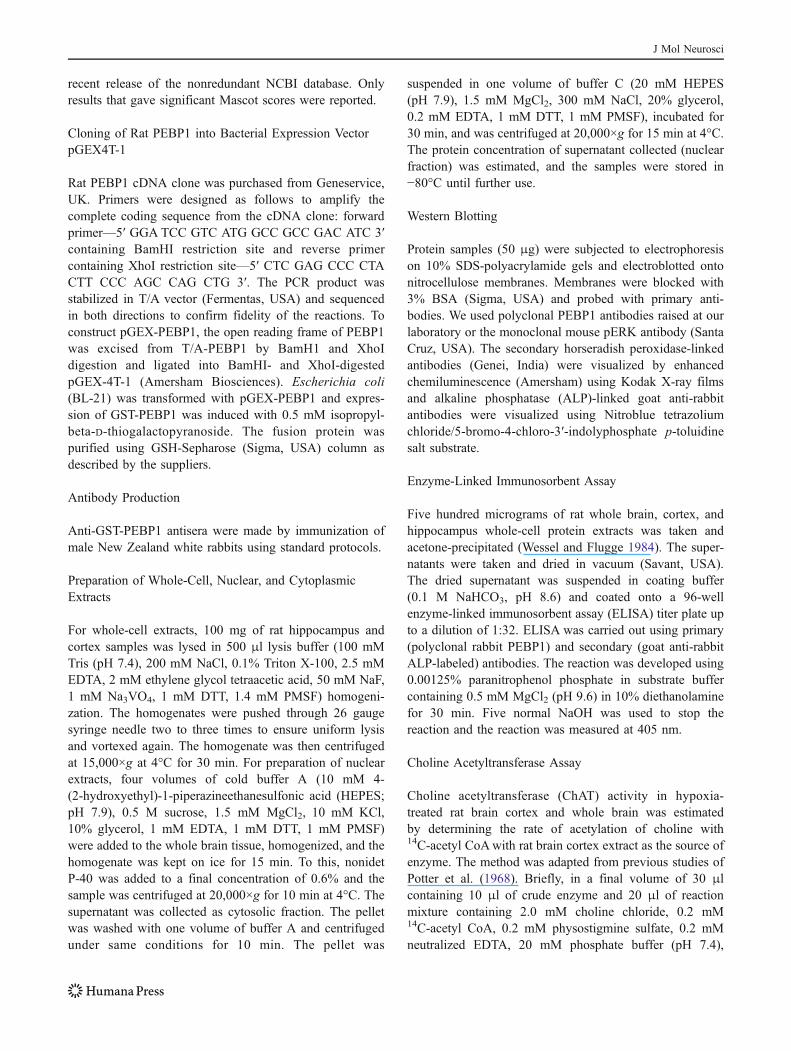
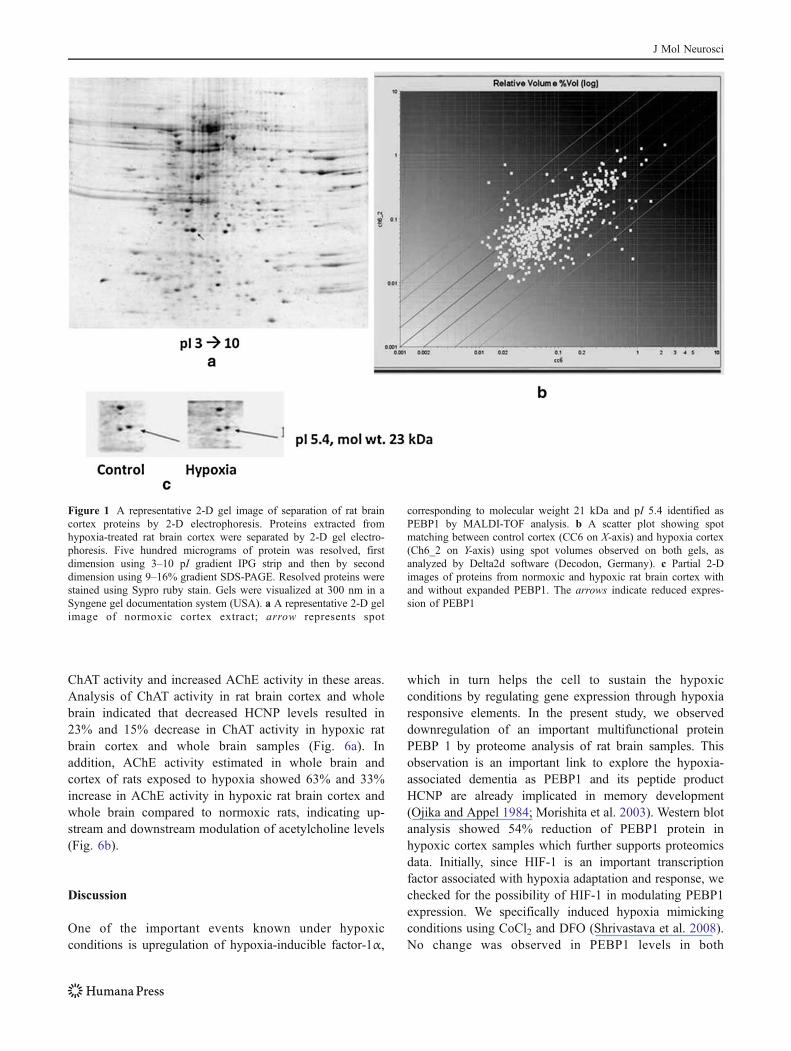
Cortex and hippocampus extracts from adult male SpragueDawley rats exposed to hypoxia were separated by 2-Delectrophoresis, and the protein spots were visualizedfollowing staining with Sypro ruby gel stain (Fig. 1a, b).The figure represents a typical protein profile of duplicateruns of six individual samples and also a scatter plotshowing relative spot volumes in control and hypoxicsamples (Fig. 1c). In case of brain cortex, approximately880 spots in normoxia and 905 spots from hypoxia weredetected and in case of hippocampus, 892 spots innormoxia and 950 spots in hypoxia were detected byDelta2D software (Decodon, Germany). At least 500 spotswere found to match in control and hypoxic samples and atleast 150 proteins were found to be differentially expressed,not taking into consideration, loading error and gel rundifferences. The proteins showing differential expressionwere theoretically matched based on their theoreticalmolecular weight and pI with available databases (www.expasy.org). From the analysis, eight randomly selectedspot showing consistent differential volumes in hypoxia
were subjected to MALDI-TOF-MS analysis, following in-gel digestion with trypsin. Differentially expressed proteinsin case of cortex were identified. Of the eight proteinsidentified, phosphatidylethanolamine binding protein (Uni-ProtKB/Swiss-Prot entry P31044) levels lowered consis-tently in all six rat brain cortex samples (0.74±0.02-foldlower; Table 1). Gel spots corresponding to PEBP1 and twoneighboring spots were compared (Fig. 2a). In all the threegels, compared to neighboring two reference spots, PEBP1was observed to have lowered spot volume (Fig. 2b).Figure 3 indicates the sequence of PEBP1 and the aminoacid sequence covered by the peptide analysis in trypticdigests. A significant portion of the PEBP1 sequence iscovered by seven peptides analyzed.
Western Blot Analysis of PEBP1 in Cortexand Hippocampus
PEBP1 levels were quantitated in normoxic and hypoxiccortex and hippocampus lysates from three different sets ofanimals. In agreement with proteomic findings, consistentlylower PEBP1 levels were observed in the cortex. Westernblot analysis with the antibodies raised against recombinantPEBP1 indicated up to 54% reduction in PEBP1 levels inrat brain cortex under hypoxia but not in hippocampus(Fig. 4a, c). Further, agents known to stabilize hypoxia-inducible factor-1α, such as desferrioxamine (DFO) andcobalt chloride (CoCl2) did not affect PEBP1 levels in cortex(Fig. 4b, d) indicating that mere stabilization of HIF-1 maynot be associated with lowered PEBP1 expression.
Elevation of pERK
Since PEBP1 is known as Raf kinase inhibitor, we checkedfor phosphorylation of ERK-1 in normal and hypoxic ratbrain cortex extracts. We observed increased phosphoryla-tion of ERK-1 in nuclear fractions of hypoxic cortexsamples, indicating that decreased levels of PEBP1 activat-ed Raf-1 and leading to elevated phospho-ERK both incytosolic and nuclear fractions (Fig. 4e, f).
Downregulation of HCNP in Hypoxia
Analysis of supernatants after acetone precipitation of wholebrain, cortex, and hippocampus samples by using in-houseraised antibodies indicated reduced HCNP (undecapeptide)levels in cortex and whole brain tissues, while no significantchanges were observed in hippocampus (Fig. 5).
ChAT and AChE Status in Hypoxia
Observation of decreased HCNP levels in hypoxic rat braincortex and whole brain extracts may indicate decreased
J Mol Neurosci
ChAT activity and increased AChE activity in these areas.Analysis of ChAT activity in rat brain cortex and wholebrain indicated that decreased HCNP levels resulted in23% and 15% decrease in ChAT activity in hypoxic ratbrain cortex and whole brain samples (Fig. 6a). Inaddition, AChE activity estimated in whole brain andcortex of rats exposed to hypoxia showed 63% and 33%increase in AChE activity in hypoxic rat brain cortex andwhole brain compared to normoxic rats, indicating up-stream and downstream modulation of acetylcholine levels(Fig. 6b).
Discussion
One of the important events known under hypoxicconditions is upregulation of hypoxia-inducible factor-1α,
which in turn helps the cell to sustain the hypoxicconditions by regulating gene expression through hypoxiaresponsive elements. In the present study, we observeddownregulation of an important multifunctional proteinPEBP 1 by proteome analysis of rat brain samples. Thisobservation is an important link to explore the hypoxia-associated dementia as PEBP1 and its peptide productHCNP are already implicated in memory development(Ojika and Appel 1984; Morishita et al. 2003). Western blotanalysis showed 54% reduction of PEBP1 protein inhypoxic cortex samples which further supports proteomicsdata. Initially, since HIF-1 is an important transcriptionfactor associated with hypoxia adaptation and response, wechecked for the possibility of HIF-1 in modulating PEBP1expression. We specifically induced hypoxia mimickingconditions using CoCl2 and DFO (Shrivastava et al. 2008).No change was observed in PEBP1 levels in both
Figure 1 A representative 2-D gel image of separation of rat braincortex proteins by 2-D electrophoresis. Proteins extracted fromhypoxia-treated rat brain cortex were separated by 2-D gel electro-phoresis. Five hundred micrograms of protein was resolved, firstdimension using 3–10 pI gradient IPG strip and then by seconddimension using 9–16% gradient SDS-PAGE. Resolved proteins werestained using Sypro ruby stain. Gels were visualized at 300 nm in aSyngene gel documentation system (USA). a A representative 2-D gelimage of normoxic cortex extract; arrow represents spot
corresponding to molecular weight 21 kDa and pI 5.4 identified asPEBP1 by MALDI-TOF analysis. b A scatter plot showing spotmatching between control cortex (CC6 on X-axis) and hypoxia cortex(Ch6_2 on Y-axis) using spot volumes observed on both gels, asanalyzed by Delta2d software (Decodon, Germany). c Partial 2-Dimages of proteins from normoxic and hypoxic rat brain cortex withand without expanded PEBP1. The arrows indicate reduced expres-sion of PEBP1
J Mol Neurosci

conditions indicating that downregulation of PEBP1 isassociated directly with changes in intracellular oxygenlevels.
PEBP1 is a highly conserved protein, whose homologsare found in both prokaryotes and eukaryotes. It is alsopresent in cytosol and plasma membranes from a variety oftissues and also shown to be secreted into serum andfunction as endocrine factors involved in cardiac physiol-ogy (Goumon et al. 2004). The function of PEBP1 and itscleavage product, HCNP in Alzheimer’s disease, anddementia is still unclear. Some studies confirm theaccumulation of HCNP (Taiji and Ojika 1996), whereasothers show decreased PEBP mRNA and protein expres-sion (Maki et al. 2002) which was correlated with increasedamyloid beta plaques. Downregulation of PEBP1 mayresult in lower levels of HCNP or altered coordination ofsignal transduction pathways that may contribute toneuronal dysfunction and pathogenesis in AD (Odabaeiet al. 2004).
PEBP1 and its homolog Raf kinase inhibitor protein(RKIP) are shown to interact with Raf-1 leading tosuppression of Raf–MEK–ERK pathway (Yeung et al.1999). PEBP1 dissociates Raf-1–MEK complexes byacting as a competitive inhibitor of MEK phosphoryla-tion. Human MEK and Raf-1 have been shown to bind tooverlapping sites in RKIP (Wang et al. 2004). Disruptionof both the Raf-1- and MEK-binding sites in RKIP isnecessary to relieve RKIP-mediated suppression of theRaf-1–MEK–ERK pathway. Binding of either Raf-1 or
Figure 2 Comparison of PEBP1 spot volume with reference spotsfrom 2-D gels. 2-D gel image analysis of cortex samples was carriedout using Bio Profil (Bio-2D, Vilber-Lourmat, France) software. Inorder to quantitate changes in spot volume of PEBP1 in different 2-Druns, we took the ratio of PEBP1 volumes with two neighboring spotsfrom three independent experiments. a Spots 1 and 2 adjacent toPEBP1 (spot 3 in figure) were used to check reduction in spot volumeof PEBP1. b Table shows ratio of spot 3 (PEBP1) to spot 1 and 2 incontrol and hypoxic conditions
Table 1 Identification of eight differentially expressed proteins in rat brain cortex
Identified protein Levels inhypoxia
Swiss Prot. ID Predicted/observed Function Fold change
pI Mw (kDa)
Hypothetical protein,Zn responsive protein
High Q64LC9 5.5/6.2 27.12/39.9 May play a role pre mRNA splicing 4.9
β-actin Low P60711 5.93/5.29 39.3/42 Cell motility, Expressed ubiquitously 0.37
Phosphatidylethanolaminebinding protein1
Low P31044 5.5/5.4 23/21 Stimulates acetylcholine secretionin CNS, binds small moleculeslike ATP, PE, PC, GTP, etc.
0.74
0, β-globin Low Q62669 7.5/7.9 10/16 Oxygen binding and transport 2.0
β-tubulin High Q4QRB4 4.7/4.82 25.8/50.4 Constituent of microtubules, bindsCa2+, GTP
1.24
β-tubulin (chain 15) Low Q3KRE8 7.1/4.7 57.3/49.9 Constituent of microtubules, bindsCa2+, GTP
0.087
Chain A-rat liverF1 Atpase
High P19511 8.5/9.39 48.2/28.8 ATP synthase (complex V) 2
Phosphoglyceratemutase
Low P25113 7/6.67 26.5/28.8 Interconversion of 3- and2-phosphoglycerate with2,3-bisphosphoglycerate asthe primer of the reaction
0.63
Five hundred micrograms of rat brain cortex lysates was separated by 2-D gel electrophoresis. The gel images obtained after staining with Syproruby stain were analyzed using Bio Profil 2D software (Bio-2D, Vilber-Lourmat, France) and eight of the spots which were estimated to have adifferential volume when compared to normoxic control rat brain cortex lysates were taken and excised from a representative cortex 2-D gel. Thespots were identified by MALDI-TOF mass spectrometry following in-gel digestion with trypsin as described in “Materials and Methods” section.The table represents the name of the protein identified from corresponding spot, change in levels, SWISSPROT accession number, theoretical andexperimental pI, and Mw, function, and fold change in protein spot volume in hypoxia
J Mol Neurosci

MEK is sufficient for inhibition (Yeung et al. 2000; Rathet al. 2008). Since PEBP1 was observed to be lowered inhypoxic rat brain cortex, we looked for the downstreamactivation of signaling events. Western blot analysis ofERK-1 indicated increased phosphorylation of ERK-1 inboth cytosol and nuclear extracts of hypoxic rat braincortex (Fig. 4e, f). This indicates that lowered PEBP1results in activation of Raf-1 and downstream eventsassociated with it.
One possible mechanism of PEBP1 downregulationmight be mediated by calpain. Previous studies indicatethat hypoxia results in increased influx of calcium(Vannucci et al. 2001), which results in calpain activation.
Increased calcium under hypoxia may also trigger acascade of signaling events among which noteworthy isprotein kinase C activation which is shown to phosphor-ylate PEBP1 (Corbit et al. 2003), in turn triggering itsdissociation from Raf–PEBP1 complex. Once Raf-1 is freeand is phosphorylated (Seko et al. 1996), it may activateMEK/ERK pathway leading to activation of MAPKcascade which leads to cellular adaptation to hypoxia.Increased phosphorylation of Raf-1 causing dissociationof PEBP1 complex raises the question regarding itsstability. Recent studies have established PEBP1, a serineprotease inhibitor (Hengst et al. 2001), as a calpainsubstrate. We speculate that degradation of PEBP1 in
Figure 3 LC–MS/MS analysis of PEBP1 in hypoxic rat braincortex. The spot corresponding to Mw 21 kDa and pI 5.4 identifiedby MALDI-TOF as PEBP1 was sequenced by LC–MS/MS (Bruker-Esquire 3000). a The amino acid sequence of rat PEBP1 representingthe peptide matches obtained by LC–MS/MS analysis. b A
representative MS/MS spectrum of the underlined peptide in a;1,559.82 (2+) is shown. The sequence interpretation was performedusing y-ions and b-ions. The MS/MS data were matched to PEBP1 inthe NCBI database using the Mascot search engine (http://www.matrixscience.com)
J Mol Neurosci

hypoxia might be due to its dissociation from PEBP1–Raf-1 complex and due to increased calpain activity (Zhang etal. 1998). Further studies exploring calpain activity link-ing with PEBP1 downregulation will be enlightening inmapping a relevant signaling mechanism of PEBP1expression. This inference is strongly supported byfindings of Chen et al. (2006), who previously observedthe decrease in PEBP1 levels of up to 20–30% intraumatic brain injury using mouse models. Chronichypoxia conditions used in the present study would beconcurrent with the above findings as it is known thatrapid ascent to extreme high altitudes leads to permanentbrain damage (Garrido et al. 1993; Fayed et al. 2006).
HCNP, an undecapeptide obtained after processing ofits precursor PEBP1, seems to be degraded in hypoxicrat brain cortex, as depicted in the Fig. 5. HCNP activityis considered to be one of the most sensitive markers ofthe functional state of cholinergic neurons in the centralnervous system (Bakhit et al. 1991), and thus, itsdecreased levels can be correlated with decreased acetyl-choline synthesis due to downregulation of HCNP(Gibson et al. 1978) and decreased choline acetyltransfer-ase activity in cholinergic neurons in hypoxia as observedin the present work. HCNP acts on early neuronaldevelopment by enhancing phenotypic maturation. Re-duced ChAT activity in hypoxia has also been previously
Figure 4 Expression of PEBP1and ERK in rat brain afterexposure to hypoxia. Adult malerats were exposed to hypoxiaequivalent to that found at analtitude of 7,500 m above sealevel for a period of 5 days.Fifty milligrams of proteinextracted from brain cortex andhippocampus was subjected toWestern blotting as described.In a separate experiment, adultmale Sprague Dawley rats wereexposed to 1 mM CoCl2 (oral)or 100 μM desferrioxamine(intraperitonial) for a period of5 days in normoxic conditions toestablish hypoxia-mimickingconditions. Brain cortex extractswere used to detect PEBP1 insuch cases. The band volumesobserved were calculated usingBio Profil (Bio-2D, Vilber-Lourmat, France) software. a, bBlots probed with anti-PEBP1and anti-actin antibodies.b Scanning densitograph of blotprobed for PEBP1 in cortex andhippocampus with or withouthypoxia treatment and in case ofrat brain cortex lysates aftertreatment with 1 mM CoCl2 and100 μM DFO. N normoxia,H hypoxia. c Blot probed withanti-ERK and anti-pERK anti-bodies in case of rat brain cortexlysates. N cortex normoxia,H cortex hypoxia. d Scanningdensitograph of ERK and pERKblot. Cy cytosolic extracts,Nu nuclear extracts. In case ofdensitometric analysis, arbitraryband volume units were takenfor quantitation
J Mol Neurosci

demonstrated (Row et al. 2007). These findings coupled withobservation of increased acetylcholinesterase activity in braincortex of rats exposed to high-altitude simulating conditionssupport the two-way regulation of acetylcholine secretion inhypoxic conditions. Similarities of PEBP1 expression inAlzheimer’s and other conditions—such as cholinergicdeficit particularly observed in the brain cortex region(Araujo et al. 1988; Kratzsch et al. 2002) associated withdementia—are interesting to note and if the signalingpathways governing them are understood, several clinicalconsequences (including cancer) concerning the abovedisorders can be established (Klysik et al. 2008). This wouldbe highly relevant in diagnosis and therapy of such disordersin future.
Stress plays an important role in modulation of acetyl-cholinesterase and another cholinesterase, namely butyr-ylcholinesterase activity (Loewenstein-Lichtenstein et al.1995). Butyrylcholinesterase is a known marker forAlzheimer’s disease, its levels being higher in diseasedsubjects (Geula and Mesulam 1995). It is known thatconditions leading to physiological stress target on BChEand AChE downstream and choline acetyltransferaseupstream together, leading to impaired cognitive and otherneurological dysfunctions. The observation is supported byincreased acetylcholine levels on selective inhibition ofBChE in Alzheimer’s disease (Greig et al. 2005). Interest-ingly, BChE is known to be upregulated in certaincarcinomas and leukemias where PEBP1 is known to bedownregulated (Zakut et al. 1990).
In conclusion, low levels of PEBP1 and its undecapep-tide product HCNP in conditions of chronic high-altitudehypoxia in rat brain cortex and subsequent activation ofRAF/MAPK pathway indicates that PEBP1 might be animportant control switch in hypoxic adaptation and cellsurvival. Further, the importance of hypoxia in a number ofcancers and low levels of PEBP under these conditionsindicate importance of this signaling molecule.
Acknowledgments Authors wish to thank Dr. Wolfgang H. Fischer,Ms. Jessica Read, Mr. Bill Low, and Dr. KVN Radhika, Salk Institutefor Biological Studies, San Diego, USA, for their help with LC–MS/MS analysis. Authors also wish to thank Dr. Dhananjay Shukla,DIPAS, DRDO, Timarpur, New Delhi, for providing rat tissuesposttreatment to hypoxia. Research Fellowships provided by UGCand CSIR to Ms. Sandeepta Burgula and Dr. Rajesh Medisetty areduly acknowledged. The authors are thankful to DIPAS, DRDODelhi for providing the funding for the presented work fromsubproject DIP/240.
Figure 6 Choline acetyltransferase and acetylcholinesterase activityin hypoxic rat brain. Adult male rats exposed to hypobaric hypoxia at7,500 m above sea level (59 mmHg) for a period of 5 days weresacrificed, and their cortex and whole brain extracts were analyzed forchanges in choline acetyltransferase and acetylcholinesterase activity.
a In case of ChAT, graph represents nanomoles of 14C-acetyl cholineproduced per minute per milligram protein. In case of AChE, graphrepresents millimoles of acetylcholine hydrolyzed per minute per gramof tissue (b). Results obtained present an average of three independentexperiments
Figure 5 HCNP levels in hypoxic rat brain. Adult male rats exposedto hypobaric hypoxia at 7,500 m above sea level (59 mmHg) for aperiod of 5 days were sacrificed by anesthetizing with ketaminehydrochloride. Five hundred micrograms of protein from brain cortex,hippocampus, and whole brain was acetone precipitated, and thesupernatant was used to carry out ELISA in 96-well titer plate forestimating HCNP levels. The relative optical density values taken at405 nm are shown in the figure
J Mol Neurosci

References
Adams, B. A., Vickers, E. D., Warby, C., et al. (2002). Three forms ofgonadotropin-releasing hormone, including a novel form, in abasal salmonid, Coregonus clupeaformis. Biology of Reproduc-tion, 67, 232–239.
Araujo, D. M., Lapchak, P. A., Robitaille, Y., Gauthier, S., & Quirion,R. (1988). Differential alteration of various cholinergic markersin cortical and subcortical regions of human brain in Alzheimer'sdisease. Journal of Neurochemistry, 50, 1914–1923.
Bakhit, C., Armanini, M., Wong, W. L., Bennett, G. L., & Wrathall, J.R. (1991). Increase in nerve growth factor-like immunoreactivityand decrease in choline acetyltransferase following contusivespinal cord injury. Brain Research, 554, 264–271.
Bhatia, B., Thomas, S., & Purkayastha, S. S. (1966). Seasonalvariations in the survival index of rats at simulated high altitudes.International Journal of Biometeorology, 10, 63–69.
Bradford, M. M. (1976). A rapid and sensitive method for thequantitation of microgram quantities of protein utilizing the principleof protein-dye binding. Analytical Biochemistry, 72, 248–254.
Chen, Q., Wang, S., Thompson, S. N., Hall, E. D., & Guttmann, R. P.(2006). Identification and characterization of PEBP as a calpainsubstrate. Journal of Neurochemistry, 99, 1133–1141.
Corbit, K. C., Trakul, N., Eves, E. M., Diaz, B., Marshall, M., &Rosner, M. R. (2003). Activation of Raf-1 signaling by proteinkinase C through a mechanism involving Raf kinase inhibitoryprotein. Journal of Biological Chemistry, 278, 13061–13068.
Ellman, G. L., Courtney, K. D., Andres, V., Jr., & Feather-Stone, R. M.(1961). A new and rapid colorimetric determination of acetylcho-linesterase activity. Biochemical Pharmacology, 7, 88–95.
Fayed, N., Modrego, P. J., & Morales, H. (2006). Evidence of braindamage after high-altitude climbing by means of magneticresonance imaging. American Journal of Medicine, 119(168),e161–e166.
Fountoulakis, M., Tsangaris, G. T., Maris, A., & Lubec, G. (2005).The rat brain hippocampus proteome. Journal of Chromatogra-phy B: Analytical Technologies in the Biomedical and LifeSciences, 819, 115–129.
Garrido, E., Castello, A., Ventura, J. L., Capdevila, A., & Rodriguez,F. A. (1993). Cortical atrophy and other brain magneticresonance imaging (MRI) changes after extremely high-altitudeclimbs without oxygen. International Journal of Sports Medi-cine, 14, 232–234.
George, A. J., Holsinger, R. M., McLean, C. A., et al. (2006).Decreased phosphatidylethanolamine binding protein expressioncorrelates with Abeta accumulation in the Tg2576 mouse modelof Alzheimer's disease. Neurobiology of Aging, 27, 614–623.
Geula, C., & Mesulam, M. M. (1995). Cholinesterases and pathologyof Alzheimer disease. Alzheimer Disease and Associated Dis-orders, 9, 23–28.
Gibson, G. E., Shimada, M., & Blass, J. P. (1978). Alterations inacetylcholine synthesis and cyclic nucleotides in mild cerebralhypoxia. Journal of Neurochemistry, 31, 757–760.
Goumon, Y., Angelone, T., Schoentgen, F., et al. (2004). Thehippocampal cholinergic neurostimulating peptide, the N-terminal fragment of the secreted phosphatidylethanolamine-binding protein, possesses a new biological activity on cardiacphysiology. Journal of Biological Chemistry, 279, 13054–13064.
Gozal, E., Gozal, D., Pierce, W. M., et al. (2002). Proteomic analysisof CA1 and CA3 regions of rat hippocampus and differentialsusceptibility to intermittent hypoxia. Journal of Neurochemistry,83, 331–345.
Greig, N. H., Utsuki, T., Ingram, D. K., Wang, Y., Pepeu, G., Scali, C.,et al. (2005). Selective butyrylcholinesterase inhibition elevates
brain acetylcholine, augments learning and lowers Alzheimerbeta-amyloid peptide in rodent. Proceedings of the NationalAcademy of Sciences of the United States of America, 102,17213–17218.
Hengst, U., Albrecht, H., Hess, D., & Monard, D. (2001). Thephosphatidylethanolamine-binding protein is the prototype of anovel family of serine protease inhibitors. Journal of BiologicalChemistry, 276, 535–540.
Klysik, J., Theroux, S. J., Sedivy, J. M., Moffit, J. S., & Boekelheide,K. (2008). Signaling crossroads: the function of Raf kinaseinhibitory protein in cancer, the central nervous system andreproduction. Cellular Signalling, 20, 1–9.
Kratzsch, T., Peters, J., & Frolich, L. (2002). Etiology andpathogenesis of Alzheimer dementia. Wiener MedizinischeWochenschrift, 152, 72–76.
Loewenstein-Lichtenstein, Y., Schwarz, M., Glick, D., Norgaard-Pedersen, B., Zakut, H., & Soreq, H. (1995). Genetic pre-disposition to adverse consequences of anti-cholinesterases in‘atypical’ BCHE carriers. Nature Medicine, 1, 1082–1085.
Lubec, G., Krapfenbauer, K., & Fountoulakis, M. (2003). Proteomicsin brain research: Potentials and limitations. Progress inNeurobiology, 69, 193–211.
Maki, M., Matsukawa, N., Yuasa, H., et al. (2002). Decreasedexpression of hippocampal cholinergic neurostimulating peptideprecursor protein mRNA in the hippocampus in Alzheimerdisease. Journal of Neuropathology and Experimental Neurology,61, 176–185.
Mitake, S., Ojika, K., Katada, E., Otsuka, Y., Matsukawa, N., &Fujimori, O. (1996). Distribution of hippocampal cholinergicneurostimulating peptide (HCNP) immunoreactivity in thecentral nervous system of the rat. Brain Research, 706, 57–70.
Morishita, M., Otsuka, Y., Matsukawa, N., et al. (2003). Specificbinding of 125I-hippocampal cholinergic neurostimulating pep-tide (HCNP) to rat brain membranes: characterization andregional distribution. Brain Research, 965, 194–202.
Odabaei, G., Chatterjee, D., Jazirehi, A. R., Goodglick, L., Yeung, K.,& Bonavida, B. (2004). Raf-1 kinase inhibitor protein: Structure,function, regulation of cell signaling, and pivotal role inapoptosis. Advances in Cancer Research, 91, 169–200.
Ojika, K., & Appel, S. H. (1984). Neurotrophic effects of hippocam-pal extracts on medial septal nucleus in vitro. Proceedings of theNational Academy of Sciences of the United States of America,81, 2567–2571.
Pappin, D. J. (1997). Peptide mass fingerprinting using MALDI-TOFmass spectrometry. Methods in Molecular Biology, 64, 165–173.
Perkins, D. N., Pappin, D. J., Creasy, D. M., & Cottrell, J. S. (1999).Probability-based protein identification by searching sequencedatabases using mass spectrometry data. Electrophoresis, 20,3551–3567.
Potter, L. T., Glover, V. A. S., & Saelens, J. K. (1968). Cholineacetyltransferase from rat brain. Journal of Biological Chemistry,243, 3864–3870.
Rath, O., Park, S., Tang, H. H., et al. (2008). The RKIP (Raf-1 kinaseinhibitor protein) conserved pocket binds to the phosphorylatedN-region of Raf-1 and inhibits the Raf-1-mediated activatedphosphorylation of MEK. Cellular Signalling, 20, 935–941.
Row, B. W., Kheirandish, L., Cheng, Y., Rowell, P. P., & Gozal, D.(2007). Impaired spatial working memory and altered cholineacetyltransferase (CHAT) immunoreactivity and nicotinic recep-tor binding in rats exposed to intermittent hypoxia during sleep.Behavioural Brain Research, 177, 308–314.
Schuierer, M. M., Bataille, F., Weiss, T. S., Hellerbrand, C., &Bosserhoff, A. K. (2006). Raf kinase inhibitor protein is down-regulated in hepatocellular carcinoma. Oncology Reports, 16,451–456.
J Mol Neurosci

Seko, Y., Tobe, K., Ueki, K., Kadowaki, T., & Yazaki, Y. (1996). Hypoxiaand hypoxia/reoxygenation activate Raf-1, mitogen-activated proteinkinase kinase, mitogen-activated protein kinases, and S6 kinase incultured rat cardiac myocytes. Circulation Research, 78, 82–90.
Shrivastava, K., Ram, M. S., Bansal, A., Singh, S. S., & Ilavazhagan,G. (2008). Cobalt supplementation promotes hypoxic toleranceand facilitates acclimatization to hypobaric hypoxia in rat brain.High Altitude Medicine & Biology, 9, 63–75.
Sun, X., He, G., Qing, H., et al. (2006). Hypoxia facilitatesAlzheimer's disease pathogenesis by up-regulating BACE1 geneexpression. Proceedings of the National Academy of Sciences ofthe United States of America, 103, 18727–18732.
Taiji, M., Tohdoh, N., & Ojika, K. (1996). Neuronal expression ofhippocampal cholinergic neurostimulating peptide (HCNP)-pre-cursor mRNA in rat brain. Journal of Neuroscience Research, 45,202–215.
Vannucci, R. C., Brucklacher, R. M., & Vannucci, S. J. (2001).Intracellular calcium accumulation during the evolution ofhypoxic–ischemic brain damage in the immature rat. BrainResearch. Developmental Brain Research, 126, 117–120.
Wang, X., Li, N., Liu, B., et al. (2004). A novel humanphosphatidylethanolamine-binding protein resists tumor necrosis
factor alpha-induced apoptosis by inhibiting mitogen-activatedprotein kinase pathway activation and phosphatidylethanolamineexternalization. Journal of Biological Chemistry, 279, 45855–45864.
Wessel, D., & Flugge, U. I. (1984). A method for the quantitativerecovery of protein in dilute solution in the presence of detergentsand lipids. Analytical Biochemistry, 138, 141–143.
Yeung, K., Seitz, T., Li, S., et al. (1999). Suppression of Raf-1kinase activity and MAP kinase signalling by RKIP. Nature,401, 173–177.
Yeung, K., Janosch, P., McFerran, B., et al. (2000). Mechanism ofsuppression of the Raf/MEK/extracellular signal-regulated kinasepathway by the raf kinase inhibitor protein. Molecular andCellular Biology, 20, 3079–3085.
Zakut, H., Ehrlich, G., Ayalon, A., Prody, C. A., Malinger, G.,Seidman, S., et al. (1990). Acetylcholinesterase and butyrylcho-linesterase genes coamplify in primary ovarian carcinomas.Journal of Clinical Investigation, 86, 900–908.
Zhang, J., Patel, J. M., & Block, E. R. (1998). Hypoxia-specificupregulation of calpain activity and gene expression in pulmo-nary artery endothelial cells. American Journal of Physiology,275, L461–L468.
J Mol Neurosci
Copyright © 2022 FDOKUMEN