![A chemically modified [alpha]-amylase with a molten-globule state has entropically driven enhanced thermal stability](https://static.fdokumen.com/doc/165x107/631965ccbc8291e22e0f1555/a-chemically-modified-alpha-amylase-with-a-molten-globule-state-has-entropically.jpg)
Exploring tryptophan dynamics in acid-induced molten globule state of bovine α-lactalbumin: a...
11
ORIGINAL PAPER Exploring tryptophan dynamics in acid-induced molten globule state of bovine a-lactalbumin: a wavelength-selective fluorescence approach Devaki A. Kelkar • Arunima Chaudhuri • Sourav Haldar • Amitabha Chattopadhyay Received: 4 January 2010 / Revised: 1 March 2010 / Accepted: 23 March 2010 / Published online: 7 April 2010 Ó European Biophysical Societies’ Association 2010 Abstract The relevance of partially ordered states of proteins (such as the molten globule state) in cellular pro- cesses is beginning to be understood. Bovine a-lactalbumin (BLA) assumes the molten globule state at acidic pH. We monitored the organization and dynamics of the functionally important tryptophan residues of BLA in native and molten globule states utilizing the wavelength-selective fluores- cence approach and fluorescence quenching. Quenching of BLA tryptophan fluorescence using quenchers of varying polarity (acrylamide and trichloroethanol) reveals varying degrees of accessibility of tryptophan residues, character- istic of native and molten globule states. We observed red edge excitation shift (REES) of 6 nm for the tryptophans in native BLA. Interestingly, we show here that BLA trypto- phans exhibit REES (3 nm) in the molten globule state. These results constitute one of the early reports of REES in the molten globule state of proteins. Taken together, our results indicate that tryptophan residues in BLA in native as well as molten globule states experience motionally restricted environment and that the regions surrounding at least some of the BLA tryptophans offer considerable restriction to the reorientational motion of the water dipoles around the excited-state tryptophans. These results are supported by wavelength-dependent changes in fluores- cence anisotropy and lifetime for BLA tryptophans. These results could provide vital insight into the role of trypto- phans in the function of BLA in its molten globule state in particular, and other partially ordered proteins in general. Keywords Molten globule a-Lactalbumin Red edge excitation shift Fluorescence quenching Fluorescence anisotropy Fluorescence lifetime Abbreviations BLA Bovine a-lactalbumin GLA Goat a-lactalbumin CD Circular dichroism MG Molten globule REES Red edge excitation shift TCE Trichloroethanol Introduction The molten globule state is considered to be an important intermediate in protein folding, and was initially proposed as a partially folded state with stable native-like secondary structure but lacking a specific tertiary structure (Dolgikh et al. 1981; Ohgushi and Wada 1983). Molten globule states are now considered to be a milieu of conformations with varying degrees of disorder (De Laureto et al. 2002). Over the years, the molten globule conformation has acquired much relevance in cellular processes, since it has been shown that molten globules are involved in interaction with molecular chaperones, translocation across biological membranes, amyloid formation, and in gene regulation D. A. Kelkar A. Chaudhuri S. Haldar A. Chattopadhyay (&) Centre for Cellular and Molecular Biology, Council of Scientific and Industrial Research, Uppal Road, Hyderabad 500 007, India e-mail: [email protected] Present Address: D. A. Kelkar Department of Biochemistry and Molecular Biology, Oregon Health and Science University, Portland, OR 97239, USA 123 Eur Biophys J (2010) 39:1453–1463 DOI 10.1007/s00249-010-0603-1
Transcript of Exploring tryptophan dynamics in acid-induced molten globule state of bovine α-lactalbumin: a...

ORIGINAL PAPER
Exploring tryptophan dynamics in acid-induced molten globulestate of bovine a-lactalbumin: a wavelength-selective fluorescenceapproach
Devaki A. Kelkar • Arunima Chaudhuri •
Sourav Haldar • Amitabha Chattopadhyay
Received: 4 January 2010 / Revised: 1 March 2010 / Accepted: 23 March 2010 / Published online: 7 April 2010
� European Biophysical Societies’ Association 2010
Abstract The relevance of partially ordered states of
proteins (such as the molten globule state) in cellular pro-
cesses is beginning to be understood. Bovine a-lactalbumin
(BLA) assumes the molten globule state at acidic pH. We
monitored the organization and dynamics of the functionally
important tryptophan residues of BLA in native and molten
globule states utilizing the wavelength-selective fluores-
cence approach and fluorescence quenching. Quenching of
BLA tryptophan fluorescence using quenchers of varying
polarity (acrylamide and trichloroethanol) reveals varying
degrees of accessibility of tryptophan residues, character-
istic of native and molten globule states. We observed red
edge excitation shift (REES) of 6 nm for the tryptophans in
native BLA. Interestingly, we show here that BLA trypto-
phans exhibit REES (3 nm) in the molten globule state.
These results constitute one of the early reports of REES in
the molten globule state of proteins. Taken together, our
results indicate that tryptophan residues in BLA in native as
well as molten globule states experience motionally
restricted environment and that the regions surrounding at
least some of the BLA tryptophans offer considerable
restriction to the reorientational motion of the water dipoles
around the excited-state tryptophans. These results are
supported by wavelength-dependent changes in fluores-
cence anisotropy and lifetime for BLA tryptophans. These
results could provide vital insight into the role of trypto-
phans in the function of BLA in its molten globule state in
particular, and other partially ordered proteins in general.
Keywords Molten globule � a-Lactalbumin �Red edge excitation shift � Fluorescence quenching �Fluorescence anisotropy � Fluorescence lifetime
Abbreviations
BLA Bovine a-lactalbumin
GLA Goat a-lactalbumin
CD Circular dichroism
MG Molten globule
REES Red edge excitation shift
TCE Trichloroethanol
Introduction
The molten globule state is considered to be an important
intermediate in protein folding, and was initially proposed
as a partially folded state with stable native-like secondary
structure but lacking a specific tertiary structure (Dolgikh
et al. 1981; Ohgushi and Wada 1983). Molten globule states
are now considered to be a milieu of conformations with
varying degrees of disorder (De Laureto et al. 2002). Over
the years, the molten globule conformation has acquired
much relevance in cellular processes, since it has been
shown that molten globules are involved in interaction
with molecular chaperones, translocation across biological
membranes, amyloid formation, and in gene regulation
D. A. Kelkar � A. Chaudhuri � S. Haldar �A. Chattopadhyay (&)
Centre for Cellular and Molecular Biology,
Council of Scientific and Industrial Research,
Uppal Road, Hyderabad 500 007, India
e-mail: [email protected]
Present Address:D. A. Kelkar
Department of Biochemistry and Molecular Biology,
Oregon Health and Science University,
Portland, OR 97239, USA
123
Eur Biophys J (2010) 39:1453–1463
DOI 10.1007/s00249-010-0603-1
(Flynn et al. 1993; Booth et al. 1997; Ren et al. 1999;
Wright and Dyson 1999). All these processes require par-
tially unfolded proteins.
Bovine a-lactalbumin (BLA) is a small acidic Ca2?-
binding protein (mol. wt. 14.2 kDa) present in milk; it
functions as a specificity modifier of galactosyltransferase.
Interestingly, BLA serves as a useful model for the protein
folding problem since it has several partially folded inter-
mediate states and is known to be present in molten globule
form under various conditions (Kuwajima 1996; Permyakov
and Berliner 2000). It is extensively used to study the
molten globule state since it assumes the molten globule
state at acidic pH and in the apo-state (Dolgikh et al. 1981;
Kuwajima 1996). a-Lactalbumins undergo conformational
transition induced by low pH, giving rise to molten globule
intermediates (referred to as A states), which are slightly
expanded compared with the native state but retain a
compact shape (Kuwajima 1989). Low-pH-induced molten
globules are regarded as prototypes of classical molten
globules. BLA is intrinsically fluorescent due to the pres-
ence of four tryptophans (at positions 26, 60, 104, and
118), of which Trp-118 belongs to aromatic cluster I while
the other three tryptophan residues are part of aromatic
cluster II (Chrysina et al. 2000). The tryptophans at posi-
tions 104 and 118 are conserved in a-lactalbumins among
various species, since they are involved in the binding of
a-lactalbumin to galactosyltransferase and the stimulation
of its lactose synthase activity (Vanhooren et al. 2006;
Grobler et al. 1994). Importantly, tryptophan residues have
been reported to be crucial for the global stability of
a-lactalbumin (Vanhooren et al. 2005).
In this work, we monitored the organization and
dynamics of the functionally important tryptophan residues
of BLA in native, and acid-induced molten globule
conditions by application of the wavelength-selective
fluorescence approach. Wavelength-selective fluorescence
comprises a set of approaches based on the red edge effect
in fluorescence spectroscopy which can be used to directly
monitor the environment and dynamics around a fluoro-
phore in a complex system (Mukherjee and Chattopadhyay
1995; Demchenko 2002, 2008; Chattopadhyay 2003;
Raghuraman et al. 2005). A shift in the wavelength of
maximum fluorescence emission toward higher wave-
lengths, caused by a shift in the excitation wavelength
toward the red edge of absorption band, is termed red edge
excitation shift (REES). This effect is mostly observed with
polar fluorophores in motionally restricted media such as
very viscous solutions or condensed phases where the
dipolar relaxation time for the solvent shell around a
fluorophore is comparable to or longer than its fluorescence
lifetime (Mukherjee and Chattopadhyay 1995; Demchenko
2002, 2008; Chattopadhyay 2003; Raghuraman et al.
2005). REES arises due to slow rates of solvent relaxation
(reorientation) around an excited-state fluorophore, which
depends on the motional restriction imposed on the solvent
molecules [or the dipolar environment, as in green fluo-
rescent protein (Haldar and Chattopadhyay 2007)] in the
immediate vicinity of the fluorophore. Utilizing this
approach, it becomes possible to probe the mobility
parameters of the environment itself (which is represented
by the relaxing solvent molecules) using the fluorophore
merely as a reporter group. The unique feature of REES is
that, while all other fluorescence techniques (such as
fluorescence quenching, energy transfer, and anisotropy
measurements) yield information about the fluorophore
itself, REES provides information about the relative rates
of solvent relaxation dynamics, which cannot be obtained
using other techniques. We have previously shown that
REES serves as a sensitive tool to monitor the organization
and dynamics of peptides and proteins in solution (Guha
et al. 1996; Chattopadhyay et al. 2003; Kelkar et al. 2005;
Raghuraman and Chattopadhyay 2006), and when bound to
membranes and membrane-mimetic systems (Raghuraman
and Chattopadhyay 2003; Kelkar and Chattopadhyay 2005;
Rawat et al. 2004). Since the dynamics of hydration is
directly associated with the function of proteins, REES has
proved to be a valuable tool to explore the organization and
dynamics of soluble and membrane proteins under varying
degrees of hydration (Raghuraman and Chattopadhyay
2003; Kelkar and Chattopadhyay 2005). This makes the
use of REES in particular, and the wavelength-selective
fluorescence approach in general, extremely useful, since
hydration plays a crucial modulatory role in a large number
of important cellular events, including protein folding
(Wyttenbach and Bowers 2009).
Materials and methods
Materials
Calcium-depleted BLA, CaCl2, trichloroethanol (TCE),
and Tris were obtained from Sigma Chemical Co. (St.
Louis, MO). Ultrapure-grade acrylamide was from Invit-
rogen Life Technologies (Carlsbad, CA). The purity of
acrylamide was checked from its absorbance using its
molar extinction coefficient (e) of 0.23 M-1cm-1 at
295 nm and optical transparency beyond 310 nm (Eftink
1991a). Water was purified through a Millipore (Bedford,
MA) Milli-Q system and used throughout.
Sample preparation
Native BLA solution was prepared by dissolving calcium-
depleted BLA in 10 mM Tris, 1 mM CaCl2, pH 7.4 buffer.
Acid-induced molten globule form of BLA was generated
1454 Eur Biophys J (2010) 39:1453–1463
123
by treatment of native BLA solution with 5 mM HCl at
room temperature (*23�C). The concentration of pure
BLA in buffer was estimated using the molar extinction
coefficient (e) of 28,540 M-1cm-1 at 280 nm (Engel et al.
2002). All experiments were carried out at *23�C.
Steady-state fluorescence measurements
Steady-state fluorescence measurements were performed by
using a Hitachi F-4010 spectrofluorometer using 1-cm-path-
length quartz cuvettes. Excitation and emission slits with
nominal bandpass of 5 nm were used. All spectra were
recorded using the correct spectrum mode. Background
intensities of samples in which BLA was omitted were
negligible in most cases and were subtracted from each
sample spectrum to cancel out any contribution due to the
solvent Raman peak. The spectral shifts obtained with dif-
ferent sets of samples were identical in most cases, or were
within ±1 nm of the ones reported. Fluorescence anisotropy
measurements were performed at room temperature
(*23�C) using a Hitachi polarization accessory. Anisotropy
values were calculated from the equation (Lakowicz 2006):
r ¼ IVV � GIVH
IVV þ 2GIVH
ð1Þ
where IVV and IVH are the measured fluorescence intensi-
ties (after appropriate background subtraction) with the
excitation polarizer vertically oriented and emission pola-
rizer vertically and horizontally oriented, respectively. G is
the grating correction factor that corrects for wavelength-
dependent distortion of the polarizers and is the ratio of the
efficiencies of the detection system for vertically and hor-
izontally polarized light, and is equal to IHV/IHH. All
experiments were performed with multiple sets of samples;
average values of anisotropy are shown in Fig. 5.
Fluorescence quenching measurements
Acrylamide and TCE quenching experiments of tryptophan
fluorescence were carried out by measurement of fluores-
cence intensity after serial addition of small aliquots of either
a freshly prepared stock solution of 2 M acrylamide in water
or neat TCE (10.42 M) to a stirred sample, followed by
incubation for 3 min in the sample compartment in the dark
(shutter closed). The excitation wavelength used was 295 nm,
and emission was monitored at 335 nm. The fluorescence
intensities obtained were corrected for dilution. Corrections
for inner filter effect for acrylamide quenching were made
using the following equation (Chattopadhyay et al. 2003):
F ¼ Fobs antilog Aex þ Aemð Þ=2½ �; ð2Þ
where F is the corrected fluorescence intensity and Fobs is
the background-subtracted fluorescence intensity of the
sample (also corrected for dilution). Aex and Aem are the
measured absorbance at the excitation and emission
wavelengths. The absorbances of the samples were
measured using a Hitachi U-2000 ultraviolet (UV)–
visible absorption spectrophotometer. Inner filter effects
in case of TCE quenching were negligible. Quenching data
were analyzed according to the Stern–Volmer equation
(Chattopadhyay et al. 2003):
F0=F ¼ 1þ KSV Q½ � ð3Þ
where F0 and F are the fluorescence intensities in the
absence and presence of the quencher (acrylamide or TCE),
respectively, [Q] is the molar quencher (acrylamide or
TCE) concentration, and KSV is the Stern–Volmer
quenching constant.
Time-resolved fluorescence measurements
Fluorescence lifetimes were calculated from time-resolved
fluorescence intensity decays using IBH 5000F NanoLED
equipment (Horiba Jobin Yvon, Edison, NJ) with DataS-
tation software in the time-correlated single-photon
counting mode. A pulsed light-emitting diode (LED)
(NanoLED-17) was used as an excitation source. This LED
generates optical pulses at 294 nm with pulse duration less
than 750 ps, and was run at 1 MHz repetition rate. The
LED profile (instrument response function) was measured
at the excitation wavelength using Ludox (colloidal silica)
as the scatterer. In order to optimize the signal-to-noise
ratio, 10,000 photon counts were collected in the peak
channel. All experiments were performed using emission
slits with bandpass of 6 nm or less. The sample and the
scatterer were alternated after every 5% acquisition to
ensure compensation for shape and timing drifts occurring
during the period of data collection. This arrangement also
prevents any prolonged exposure of the sample to the
excitation beam, thereby avoiding any possible photo-
damage to the fluorophore. Data were stored and analyzed
using DAS 6.2 software (Horiba Jobin Yvon, Edison, NJ).
Fluorescence intensity decay curves so obtained were
deconvoluted with the instrument response function and
analyzed as a sum of exponential terms:
F tð Þ ¼X
i
ai expð�t=siÞ ð4Þ
where F(t) is the fluorescence intensity at time t and ai is a
pre-exponential factor representing the fractional
contribution to the time-resolved decay of the component
with a lifetime si such thatP
iai = 1. The program also
includes statistical and plotting subroutine packages
(O’Connor and Phillips 1984). The goodness of fit of a
given set of observed data and the chosen function was
evaluated by the v2 ratio, the weighted residuals (Lampert
Eur Biophys J (2010) 39:1453–1463 1455
123
et al. 1983), and the autocorrelation function of the
weighted residuals (Grinvald and Steinberg 1974). A fit
was considered acceptable when plots of the weighted
residuals and the autocorrelation function showed random
deviation about zero with minimum v2 of not more
than 1.4. Intensity-averaged mean lifetimes hsi for
triexponential decays of fluorescence were calculated
from the decay times and pre-exponential factors using
the following equation (Lakowicz 2006):
hsi ¼ a1s21 þ a2s2
2 þ a3s23
a1s1 þ a2s2 þ a3s3
ð5Þ
Circular dichroism measurements
CD measurements were carried out at room temperature
(*23�C) on a JASCO J-815 spectropolarimeter which
was calibrated with (?)-10-camphorsulfonic acid. Spectra
were scanned in a quartz optical cell with path length of
0.1 cm, and recorded in 0.5 nm wavelength increments
with 2 s response and bandwidth of 2 nm. For monitoring
changes in secondary structure and tertiary structures,
spectra were scanned from 200 to 260 nm in the far-UV
range, and from 250 to 310 nm in the near-UV range. The
scan rate was 50 nm/min, and each spectrum is the aver-
age of four scans with full-scale sensitivity of 100 mdeg.
Spectra were corrected for background by subtraction of
appropriate blanks and were smoothed, ensuring that the
overall shape of the spectrum remained unaltered. Data are
represented as mean residue ellipticities and were calcu-
lated using the equation:
½h� ¼ hobs= 10Clð Þ ð6Þ
where hobs is the observed ellipticity in mdeg, l is the path
length in cm, and C is the concentration of peptide bonds in
BLA in mol/L.
Results and discussion
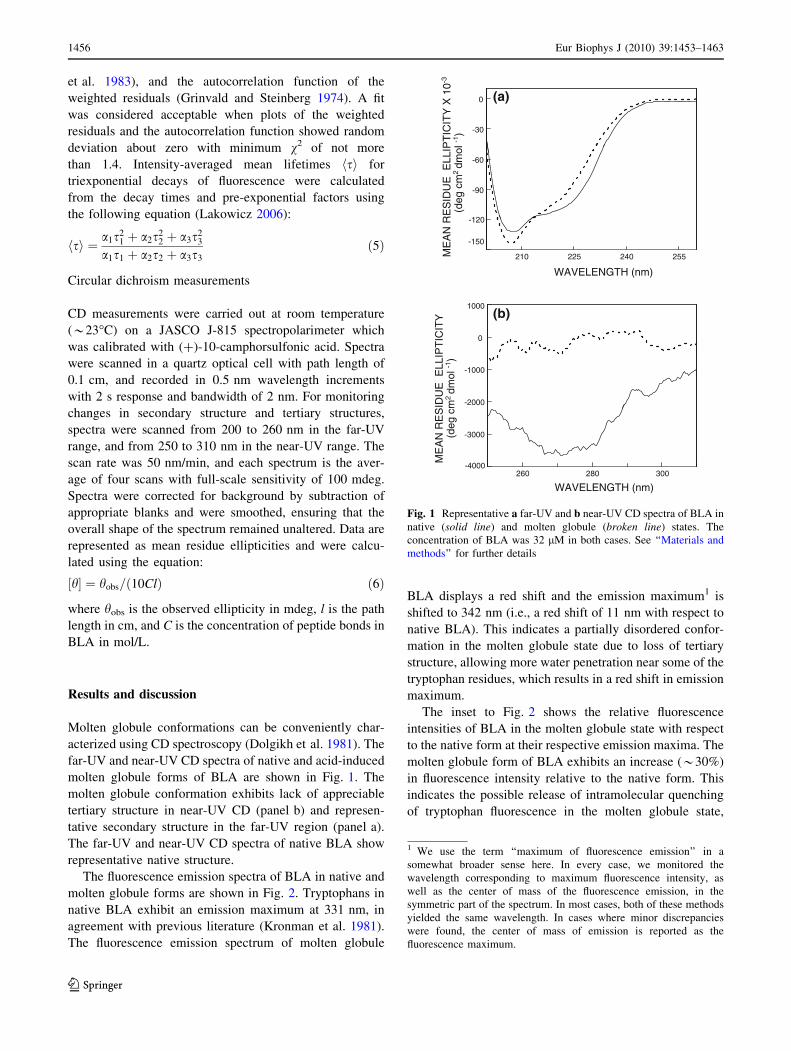
Molten globule conformations can be conveniently char-
acterized using CD spectroscopy (Dolgikh et al. 1981). The
far-UV and near-UV CD spectra of native and acid-induced
molten globule forms of BLA are shown in Fig. 1. The
molten globule conformation exhibits lack of appreciable
tertiary structure in near-UV CD (panel b) and represen-
tative secondary structure in the far-UV region (panel a).
The far-UV and near-UV CD spectra of native BLA show
representative native structure.
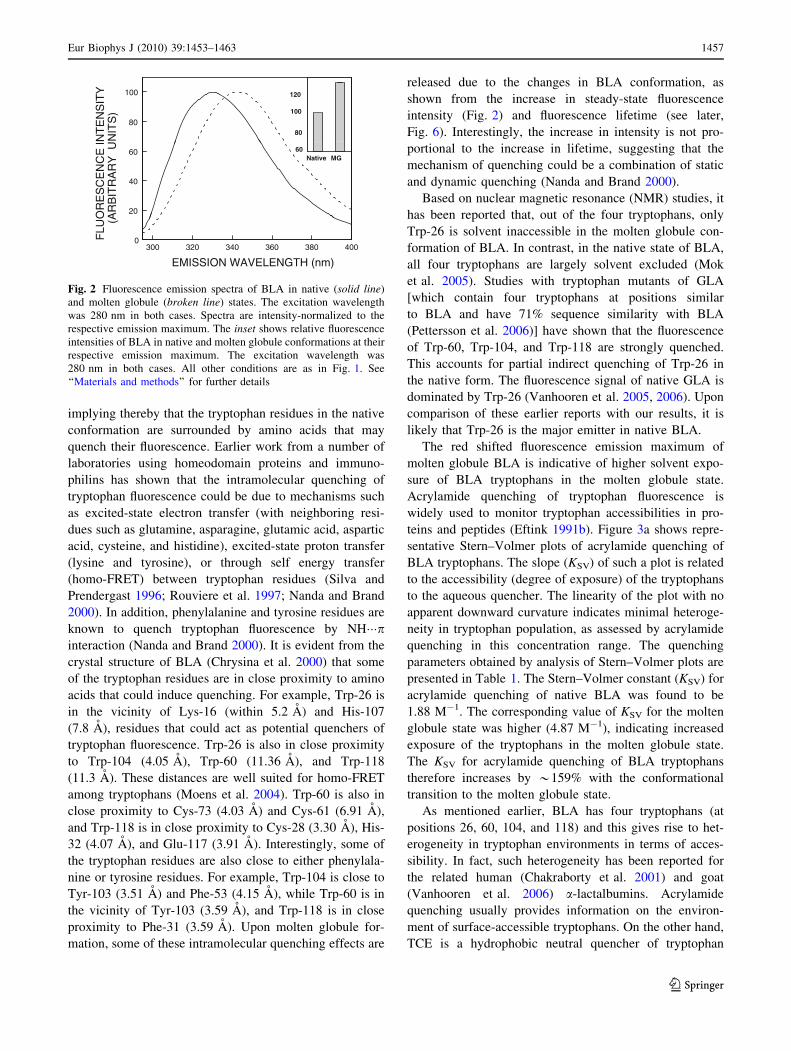
The fluorescence emission spectra of BLA in native and
molten globule forms are shown in Fig. 2. Tryptophans in
native BLA exhibit an emission maximum at 331 nm, in
agreement with previous literature (Kronman et al. 1981).
The fluorescence emission spectrum of molten globule
BLA displays a red shift and the emission maximum1 is
shifted to 342 nm (i.e., a red shift of 11 nm with respect to
native BLA). This indicates a partially disordered confor-
mation in the molten globule state due to loss of tertiary
structure, allowing more water penetration near some of the
tryptophan residues, which results in a red shift in emission
maximum.
The inset to Fig. 2 shows the relative fluorescence
intensities of BLA in the molten globule state with respect
to the native form at their respective emission maxima. The
molten globule form of BLA exhibits an increase (*30%)
in fluorescence intensity relative to the native form. This
indicates the possible release of intramolecular quenching
of tryptophan fluorescence in the molten globule state,
0
-30
(a)
(deg
cm
2 dm
ol -1
)
-60
-90
WAVELENGTH (nm)
ME
AN
RE
SID
UE
ELL
IPT
ICIT
Y X
10-3
255240225210
-120
-150
1000(b)
0
-1000
-2000
ME
AN
RE
SID
UE
ELL
IPT
ICIT
Y(d
eg c
m2 dm
ol -1
)-3000
-4000
WAVELENGTH (nm)300280260
Fig. 1 Representative a far-UV and b near-UV CD spectra of BLA in
native (solid line) and molten globule (broken line) states. The
concentration of BLA was 32 lM in both cases. See ‘‘Materials and
methods’’ for further details
1 We use the term ‘‘maximum of fluorescence emission’’ in a
somewhat broader sense here. In every case, we monitored the
wavelength corresponding to maximum fluorescence intensity, as
well as the center of mass of the fluorescence emission, in the
symmetric part of the spectrum. In most cases, both of these methods
yielded the same wavelength. In cases where minor discrepancies
were found, the center of mass of emission is reported as the
fluorescence maximum.
1456 Eur Biophys J (2010) 39:1453–1463
123
implying thereby that the tryptophan residues in the native
conformation are surrounded by amino acids that may
quench their fluorescence. Earlier work from a number of
laboratories using homeodomain proteins and immuno-
philins has shown that the intramolecular quenching of
tryptophan fluorescence could be due to mechanisms such
as excited-state electron transfer (with neighboring resi-
dues such as glutamine, asparagine, glutamic acid, aspartic
acid, cysteine, and histidine), excited-state proton transfer
(lysine and tyrosine), or through self energy transfer
(homo-FRET) between tryptophan residues (Silva and
Prendergast 1996; Rouviere et al. 1997; Nanda and Brand
2000). In addition, phenylalanine and tyrosine residues are
known to quench tryptophan fluorescence by NH���pinteraction (Nanda and Brand 2000). It is evident from the
crystal structure of BLA (Chrysina et al. 2000) that some
of the tryptophan residues are in close proximity to amino
acids that could induce quenching. For example, Trp-26 is
in the vicinity of Lys-16 (within 5.2 A) and His-107
(7.8 A), residues that could act as potential quenchers of
tryptophan fluorescence. Trp-26 is also in close proximity
to Trp-104 (4.05 A), Trp-60 (11.36 A), and Trp-118
(11.3 A). These distances are well suited for homo-FRET
among tryptophans (Moens et al. 2004). Trp-60 is also in
close proximity to Cys-73 (4.03 A) and Cys-61 (6.91 A),
and Trp-118 is in close proximity to Cys-28 (3.30 A), His-
32 (4.07 A), and Glu-117 (3.91 A). Interestingly, some of
the tryptophan residues are also close to either phenylala-
nine or tyrosine residues. For example, Trp-104 is close to
Tyr-103 (3.51 A) and Phe-53 (4.15 A), while Trp-60 is in
the vicinity of Tyr-103 (3.59 A), and Trp-118 is in close
proximity to Phe-31 (3.59 A). Upon molten globule for-
mation, some of these intramolecular quenching effects are
released due to the changes in BLA conformation, as
shown from the increase in steady-state fluorescence
intensity (Fig. 2) and fluorescence lifetime (see later,
Fig. 6). Interestingly, the increase in intensity is not pro-
portional to the increase in lifetime, suggesting that the
mechanism of quenching could be a combination of static
and dynamic quenching (Nanda and Brand 2000).
Based on nuclear magnetic resonance (NMR) studies, it
has been reported that, out of the four tryptophans, only
Trp-26 is solvent inaccessible in the molten globule con-
formation of BLA. In contrast, in the native state of BLA,
all four tryptophans are largely solvent excluded (Mok
et al. 2005). Studies with tryptophan mutants of GLA
[which contain four tryptophans at positions similar
to BLA and have 71% sequence similarity with BLA
(Pettersson et al. 2006)] have shown that the fluorescence
of Trp-60, Trp-104, and Trp-118 are strongly quenched.
This accounts for partial indirect quenching of Trp-26 in
the native form. The fluorescence signal of native GLA is
dominated by Trp-26 (Vanhooren et al. 2005, 2006). Upon
comparison of these earlier reports with our results, it is
likely that Trp-26 is the major emitter in native BLA.
The red shifted fluorescence emission maximum of
molten globule BLA is indicative of higher solvent expo-
sure of BLA tryptophans in the molten globule state.
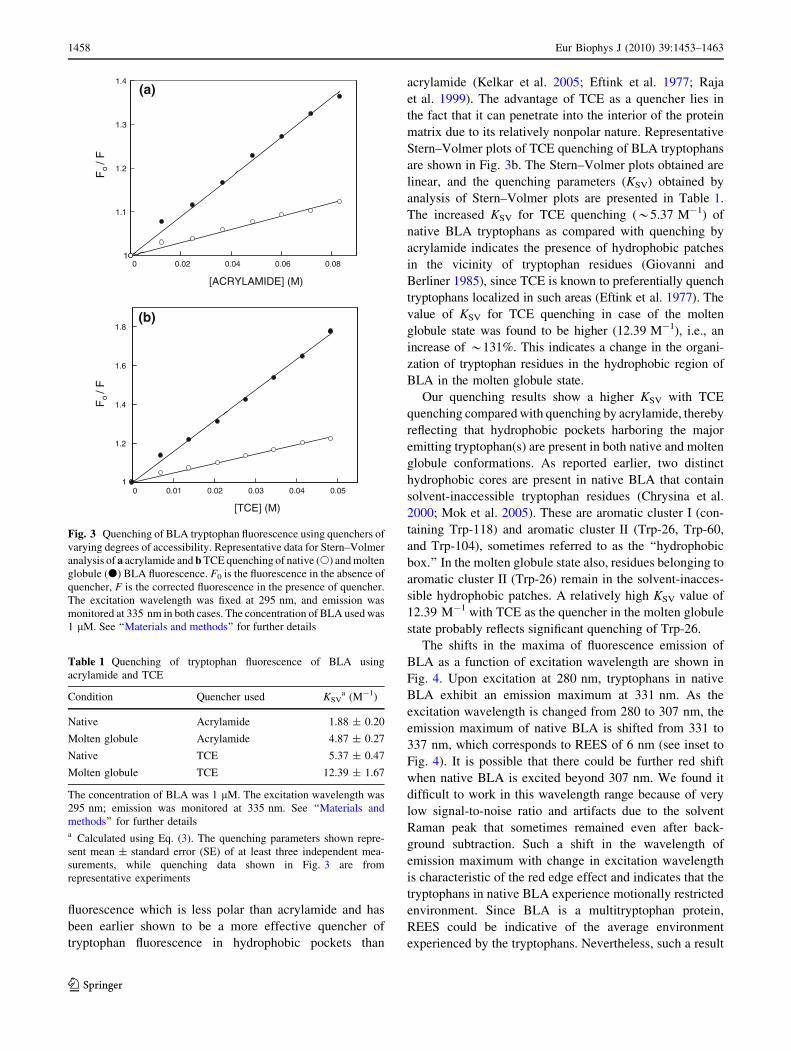
Acrylamide quenching of tryptophan fluorescence is
widely used to monitor tryptophan accessibilities in pro-
teins and peptides (Eftink 1991b). Figure 3a shows repre-
sentative Stern–Volmer plots of acrylamide quenching of
BLA tryptophans. The slope (KSV) of such a plot is related
to the accessibility (degree of exposure) of the tryptophans
to the aqueous quencher. The linearity of the plot with no
apparent downward curvature indicates minimal heteroge-
neity in tryptophan population, as assessed by acrylamide
quenching in this concentration range. The quenching
parameters obtained by analysis of Stern–Volmer plots are
presented in Table 1. The Stern–Volmer constant (KSV) for
acrylamide quenching of native BLA was found to be
1.88 M-1. The corresponding value of KSV for the molten
globule state was higher (4.87 M-1), indicating increased
exposure of the tryptophans in the molten globule state.
The KSV for acrylamide quenching of BLA tryptophans
therefore increases by *159% with the conformational
transition to the molten globule state.
As mentioned earlier, BLA has four tryptophans (at
positions 26, 60, 104, and 118) and this gives rise to het-
erogeneity in tryptophan environments in terms of acces-
sibility. In fact, such heterogeneity has been reported for
the related human (Chakraborty et al. 2001) and goat
(Vanhooren et al. 2006) a-lactalbumins. Acrylamide
quenching usually provides information on the environ-
ment of surface-accessible tryptophans. On the other hand,
TCE is a hydrophobic neutral quencher of tryptophan
100
80
120
100
80
60
40
20
Native MG60
EMISSION WAVELENGTH (nm)
FLU
OR
ES
CE
NC
E IN
TE
NS
ITY
(AR
BIT
RA
RY
UN
ITS
)
4003803603403203000
Fig. 2 Fluorescence emission spectra of BLA in native (solid line)
and molten globule (broken line) states. The excitation wavelength
was 280 nm in both cases. Spectra are intensity-normalized to the
respective emission maximum. The inset shows relative fluorescence
intensities of BLA in native and molten globule conformations at their
respective emission maximum. The excitation wavelength was
280 nm in both cases. All other conditions are as in Fig. 1. See
‘‘Materials and methods’’ for further details
Eur Biophys J (2010) 39:1453–1463 1457
123
fluorescence which is less polar than acrylamide and has
been earlier shown to be a more effective quencher of
tryptophan fluorescence in hydrophobic pockets than
acrylamide (Kelkar et al. 2005; Eftink et al. 1977; Raja
et al. 1999). The advantage of TCE as a quencher lies in
the fact that it can penetrate into the interior of the protein
matrix due to its relatively nonpolar nature. Representative
Stern–Volmer plots of TCE quenching of BLA tryptophans
are shown in Fig. 3b. The Stern–Volmer plots obtained are
linear, and the quenching parameters (KSV) obtained by
analysis of Stern–Volmer plots are presented in Table 1.
The increased KSV for TCE quenching (*5.37 M-1) of
native BLA tryptophans as compared with quenching by
acrylamide indicates the presence of hydrophobic patches
in the vicinity of tryptophan residues (Giovanni and
Berliner 1985), since TCE is known to preferentially quench
tryptophans localized in such areas (Eftink et al. 1977). The
value of KSV for TCE quenching in case of the molten
globule state was found to be higher (12.39 M-1), i.e., an
increase of *131%. This indicates a change in the organi-
zation of tryptophan residues in the hydrophobic region of
BLA in the molten globule state.
Our quenching results show a higher KSV with TCE
quenching compared with quenching by acrylamide, thereby
reflecting that hydrophobic pockets harboring the major
emitting tryptophan(s) are present in both native and molten
globule conformations. As reported earlier, two distinct
hydrophobic cores are present in native BLA that contain
solvent-inaccessible tryptophan residues (Chrysina et al.
2000; Mok et al. 2005). These are aromatic cluster I (con-
taining Trp-118) and aromatic cluster II (Trp-26, Trp-60,
and Trp-104), sometimes referred to as the ‘‘hydrophobic
box.’’ In the molten globule state also, residues belonging to
aromatic cluster II (Trp-26) remain in the solvent-inacces-
sible hydrophobic patches. A relatively high KSV value of
12.39 M-1 with TCE as the quencher in the molten globule
state probably reflects significant quenching of Trp-26.
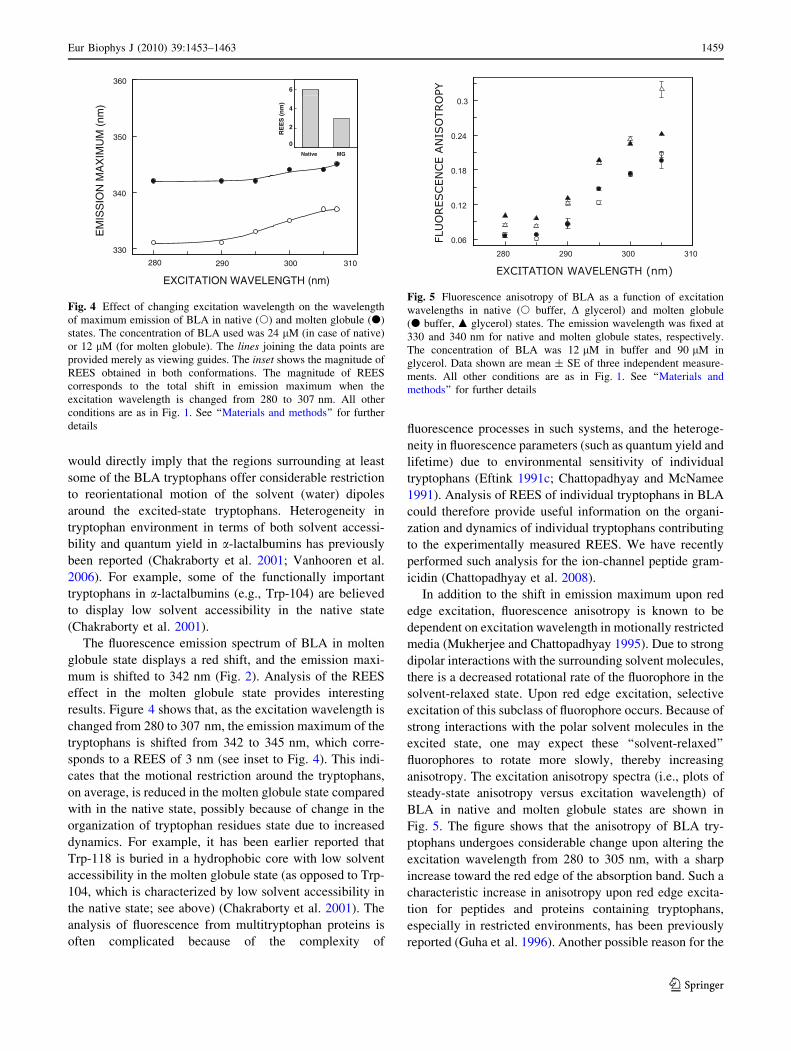
The shifts in the maxima of fluorescence emission of
BLA as a function of excitation wavelength are shown in
Fig. 4. Upon excitation at 280 nm, tryptophans in native
BLA exhibit an emission maximum at 331 nm. As the
excitation wavelength is changed from 280 to 307 nm, the
emission maximum of native BLA is shifted from 331 to
337 nm, which corresponds to REES of 6 nm (see inset to
Fig. 4). It is possible that there could be further red shift
when native BLA is excited beyond 307 nm. We found it
difficult to work in this wavelength range because of very
low signal-to-noise ratio and artifacts due to the solvent
Raman peak that sometimes remained even after back-
ground subtraction. Such a shift in the wavelength of
emission maximum with change in excitation wavelength
is characteristic of the red edge effect and indicates that the
tryptophans in native BLA experience motionally restricted
environment. Since BLA is a multitryptophan protein,
REES could be indicative of the average environment
experienced by the tryptophans. Nevertheless, such a result
1.4
/ F(a)
1.3
1.2
Fo
1.1
1
[ACRYLAMIDE] (M)
0.080.060.040.020
(b)1.8
Fo
/ F
1.6
1.4
1.2
1
[TCE] (M)
0.050.040.030.020.010
Fig. 3 Quenching of BLA tryptophan fluorescence using quenchers of
varying degrees of accessibility. Representative data for Stern–Volmer
analysis of a acrylamide and b TCE quenching of native (s) and molten
globule (d) BLA fluorescence. F0 is the fluorescence in the absence of
quencher, F is the corrected fluorescence in the presence of quencher.
The excitation wavelength was fixed at 295 nm, and emission was
monitored at 335 nm in both cases. The concentration of BLA used was
1 lM. See ‘‘Materials and methods’’ for further details
Table 1 Quenching of tryptophan fluorescence of BLA using
acrylamide and TCE
Condition Quencher used KSVa (M-1)
Native Acrylamide 1.88 ± 0.20
Molten globule Acrylamide 4.87 ± 0.27
Native TCE 5.37 ± 0.47
Molten globule TCE 12.39 ± 1.67
The concentration of BLA was 1 lM. The excitation wavelength was
295 nm; emission was monitored at 335 nm. See ‘‘Materials and
methods’’ for further detailsa Calculated using Eq. (3). The quenching parameters shown repre-
sent mean ± standard error (SE) of at least three independent mea-
surements, while quenching data shown in Fig. 3 are from
representative experiments
1458 Eur Biophys J (2010) 39:1453–1463
123
would directly imply that the regions surrounding at least
some of the BLA tryptophans offer considerable restriction
to reorientational motion of the solvent (water) dipoles
around the excited-state tryptophans. Heterogeneity in
tryptophan environment in terms of both solvent accessi-
bility and quantum yield in a-lactalbumins has previously
been reported (Chakraborty et al. 2001; Vanhooren et al.
2006). For example, some of the functionally important
tryptophans in a-lactalbumins (e.g., Trp-104) are believed
to display low solvent accessibility in the native state
(Chakraborty et al. 2001).
The fluorescence emission spectrum of BLA in molten
globule state displays a red shift, and the emission maxi-
mum is shifted to 342 nm (Fig. 2). Analysis of the REES
effect in the molten globule state provides interesting
results. Figure 4 shows that, as the excitation wavelength is
changed from 280 to 307 nm, the emission maximum of the
tryptophans is shifted from 342 to 345 nm, which corre-
sponds to a REES of 3 nm (see inset to Fig. 4). This indi-
cates that the motional restriction around the tryptophans,
on average, is reduced in the molten globule state compared
with in the native state, possibly because of change in the
organization of tryptophan residues state due to increased
dynamics. For example, it has been earlier reported that
Trp-118 is buried in a hydrophobic core with low solvent
accessibility in the molten globule state (as opposed to Trp-
104, which is characterized by low solvent accessibility in
the native state; see above) (Chakraborty et al. 2001). The
analysis of fluorescence from multitryptophan proteins is
often complicated because of the complexity of
fluorescence processes in such systems, and the heteroge-
neity in fluorescence parameters (such as quantum yield and
lifetime) due to environmental sensitivity of individual
tryptophans (Eftink 1991c; Chattopadhyay and McNamee
1991). Analysis of REES of individual tryptophans in BLA
could therefore provide useful information on the organi-
zation and dynamics of individual tryptophans contributing
to the experimentally measured REES. We have recently
performed such analysis for the ion-channel peptide gram-
icidin (Chattopadhyay et al. 2008).
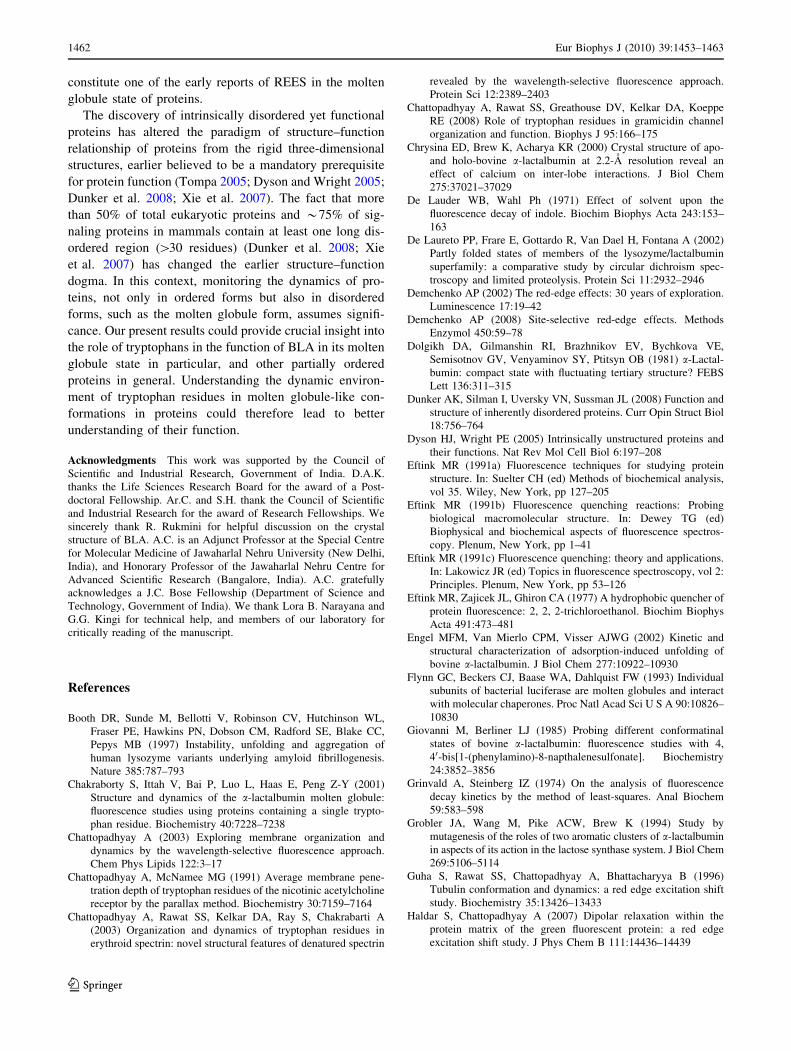
In addition to the shift in emission maximum upon red
edge excitation, fluorescence anisotropy is known to be
dependent on excitation wavelength in motionally restricted
media (Mukherjee and Chattopadhyay 1995). Due to strong
dipolar interactions with the surrounding solvent molecules,
there is a decreased rotational rate of the fluorophore in the
solvent-relaxed state. Upon red edge excitation, selective
excitation of this subclass of fluorophore occurs. Because of
strong interactions with the polar solvent molecules in the
excited state, one may expect these ‘‘solvent-relaxed’’
fluorophores to rotate more slowly, thereby increasing
anisotropy. The excitation anisotropy spectra (i.e., plots of
steady-state anisotropy versus excitation wavelength) of
BLA in native and molten globule states are shown in
Fig. 5. The figure shows that the anisotropy of BLA try-
ptophans undergoes considerable change upon altering the
excitation wavelength from 280 to 305 nm, with a sharp
increase toward the red edge of the absorption band. Such a
characteristic increase in anisotropy upon red edge excita-
tion for peptides and proteins containing tryptophans,
especially in restricted environments, has been previously
reported (Guha et al. 1996). Another possible reason for the
6360
MGNative
RE
ES
(n
m)
4
2
0350
EM
ISS
ION
MA
XIM
UM
(nm
)
340
330
EXCITATION WAVELENGTH (nm)
310300290280
Fig. 4 Effect of changing excitation wavelength on the wavelength
of maximum emission of BLA in native (s) and molten globule (d)
states. The concentration of BLA used was 24 lM (in case of native)
or 12 lM (for molten globule). The lines joining the data points are
provided merely as viewing guides. The inset shows the magnitude of
REES obtained in both conformations. The magnitude of REES
corresponds to the total shift in emission maximum when the
excitation wavelength is changed from 280 to 307 nm. All other
conditions are as in Fig. 1. See ‘‘Materials and methods’’ for further
details
0.3
0.24
0.18
0.12
FLU
ORESCEN
CE A
NIS
OTRO
PY
EXCITATION WAVELENGTH (nm)
3103002902800.06
Fig. 5 Fluorescence anisotropy of BLA as a function of excitation
wavelengths in native (s buffer, D glycerol) and molten globule
(d buffer, m glycerol) states. The emission wavelength was fixed at
330 and 340 nm for native and molten globule states, respectively.
The concentration of BLA was 12 lM in buffer and 90 lM in
glycerol. Data shown are mean ± SE of three independent measure-
ments. All other conditions are as in Fig. 1. See ‘‘Materials and
methods’’ for further details
Eur Biophys J (2010) 39:1453–1463 1459
123

increase in anisotropy at the red edge of excitation could be
the reduced efficiency of self energy transfer (homo-FRET)
among tryptophan residues, sometimes referred to as
Weber’s red edge effect (Weber and Shinitzky 1970). This
reinforces our earlier conclusion that tryptophans in BLA
are in a motionally restricted region in both states.
In order to damp the effect of rotational motion (present
in buffer) on the homotransfer, if any, we compared the
steady-state anisotropy excitation spectra of native and
molten globule forms of BLA in highly viscous medium
(90% glycerol, v/v) (Vincent et al. 1992). Under such
condition in multitryptophan proteins, excitation at the red
edge may predominantly reflect the release of homo-FRET
and an enhancement of anisotropy. Figure 5 shows that the
release of homo-FRET at the red edge of excitation is
greater in native form as compared with in the molten
globule form, particularly in viscous medium. This could
imply that the appreciable homo-FRET between the try-
ptophans (prominently Trp-26 and Trp-104 in the
‘‘hydrophobic box’’) in the native state may not be main-
tained in the molten globule state. This is supported by
NMR results which indicate that only Trp-26 is solvent
inaccessible in the molten globule state (Mok et al. 2005).
Fluorescence lifetime serves as a faithful indicator of the
local environment in which a given fluorophore is localized
(Prendergast 1991). A typical decay profile of BLA try-
ptophans with its triexponential fitting and the statistical
parameters used to check the goodness of fit are shown in
Fig. 6. Table 2 presents the tryptophan lifetimes for BLA
in native and molten globule states. All fluorescence decays
for BLA tryptophans could be fitted well using a triexpo-
nential function. We chose to use the mean fluorescence
lifetime as an important parameter, since it is independent
of the method of analysis and the number of exponentials
used to fit the time-resolved fluorescence decay. The mean
fluorescence lifetimes of BLA tryptophans were calculated
using Eq. (5) and are shown in the inset to Fig. 6. The inset
shows that, while the mean fluorescence lifetime of BLA
tryptophans in the native state is *2.4 ns, it is increased
considerably in the molten globule state to *3.7 ns. In
general, tryptophan lifetimes are known to be reduced
when exposed to polar environments (De Lauder and Wahl
1971). Since the molten globule state is less ordered than
the native state, more water penetration is expected,
resulting in reduction in fluorescence lifetime. However,
there are other factors that need to be considered when
(n
s)
4.0
3.0
CO
UN
TS
ME
AN
FL
UO
RE
SC
EN
CE
LIF
ET
IME
2.0
1.0MGNative
5.0
CHANNELS
0
5.0
0.1
Std
. Dev
.
0
0.1
Aut
ocor
rela
tion
Fig. 6 Representative time-resolved fluorescence intensity decay
profile of BLA in molten globule state. Excitation wavelength was
294 nm, corresponding to pulsed diode light source, and emission was
monitored at 340 nm. The sharp peak on the left corresponds to the
profile of the pulsed light-emitting diode (LED). The relatively broadpeak on the right is the decay profile, fitted to a triexponential
function. The two lower plots show the weighted residuals and the
autocorrelation function of the weighted residuals. The inset shows
the mean fluorescence lifetime of BLA in native and molten globule
conformations. The excitation wavelength used was 294 nm, while
the emission wavelength was fixed at 330 and 340 nm for native and
molten globule states, respectively. The concentration of BLA was
32 lM. See ‘‘Materials and methods’’ for further details
1460 Eur Biophys J (2010) 39:1453–1463
123

interpreting changes in fluorescence lifetime. The increase
in mean fluorescence lifetime of BLA tryptophans in the
molten globule state could be due to the reorganization of
the tryptophan residues in the molten globule conforma-
tion, thereby altering the solvent accessibility of some of
the tryptophan residues. An essential feature of the molten
globule conformation in a-lactalbumins is that the a-helical
domain (containing Trp-26, Trp-104, and Trp-118) is
highly structured, whereas the b-sheet domain (which
contains Trp-60) is partially ordered (more unfolded)
(Kuwajima 1996; Vanhooren et al. 2006). This results in
Trp-60 having the highest solvent accessibility in the
molten globule state (Chakraborty et al. 2001). The
increase in mean fluorescence lifetime in the molten
globule state of BLA could possibly be due to release of
quenching by neighboring amino acids [such as histidine
residues and disulfide bridge between cysteine residues
(Vanhooren et al. 2006)] as a result of reorganization of the
structure in these states.
The changes in mean fluorescence lifetime of BLA
tryptophans in native and molten globule states as a func-
tion of increasing emission wavelength are shown in Fig. 7.
Interestingly, the mean fluorescence lifetime displays a
considerable increase in both cases with increasing emis-
sion wavelength from 330 to 370 nm. Similar observation
of increasing lifetime with increasing emission wavelength
has previously been reported for tryptophans in environ-
ments of restricted mobilities (Guha et al. 1996). The
extent of increase in mean fluorescence lifetime was
*43% for native BLA and *12% for the molten globule
state. The difference in the extent of increase in mean
fluorescence lifetime is indicative of the difference in their
environments in the respective states. Such increasing
lifetimes across the emission spectrum may be interpreted
in terms of solvent reorientation around the excited-state
fluorophore as follows. Observation of emission spectra at
shorter wavelengths selects for predominantly unrelaxed
fluorophores. Their lifetimes are shorter because this pop-
ulation is decaying both at the rate of fluorescence emission
at the given excitation wavelength and by decay to longer
(unobserved) wavelengths. In contrast, observation at the
longer emission wavelength (red edge) selects for the more
relaxed fluorophores, which have spent enough time in the
excited state to allow increasingly larger extents of solvent
relaxation.
In this work, we utilized the wavelength-selective fluo-
rescence approach to monitor the organization and
dynamics of the functionally important tryptophan residues
of BLA in native and molten globule states. We observe
REES of 6 nm for the tryptophans in native BLA. This
indicates that the tryptophans in native BLA experience
motionally restricted environment and that the regions
surrounding at least some of the BLA tryptophans offer
considerable restriction to the reorientational motion of the
solvent (water) dipoles around the excited-state trypto-
phans. Interestingly, our results show that BLA tryptophan
residues exhibit 3 nm REES in acid-induced molten glob-
ule state. This is a novel observation since REES of par-
tially disordered yet functional proteins (such as the molten
globule state) is only beginning to be addressed (Leal and
Gomes 2007). We have previously reported REES of
tryptophan(s) in case of native (ordered) (Guha et al. 1996;
Raghuraman and Chattopadhyay 2006) and denatured
(Chattopadhyay et al. 2003) proteins. Our present results
show that tryptophan(s) in the molten globule state of BLA
exhibit REES. To the best of our knowledge, these results
Table 2 Representative fluorescence lifetimes of BLA in native and
molten globule states as a function of emission wavelength
Emission wavelength (nm) a1 s1 (ns) a2 s2 (ns) a3 s3 (ns)
(a) Native
330 0.19 0.12 0.65 0.95 0.16 3.86
340 0.20 0.23 0.60 1.05 0.20 4.07
350 0.19 0.26 0.57 1.10 0.24 4.26
360 0.55 1.13 0.17 0.23 0.28 4.33
370 0.21 0.34 0.47 1.31 0.32 4.46
(b) Molten globule
330 0.49 1.97 0.20 0.40 0.31 4.81
340 0.49 2.02 0.17 0.39 0.34 4.81
350 0.16 0.38 0.52 2.14 0.32 5.10
360 0.54 2.27 0.16 0.45 0.30 5.25
370 0.53 2.31 0.14 0.42 0.33 5.31
The excitation wavelength was 294 nm. The number of photons
collected at the peak channel was 10,000. All other conditions are as
in Fig. 6. See ‘‘Materials and methods’’ for further details
3.5
3.0
4.0
2.5
ME
AN
FLU
OR
ES
CE
NC
E L
IFE
TIM
E (
ns)
EMISSION WAVELENGTH (nm)
330 340 350 360 370
Fig. 7 Mean fluorescence lifetime of BLA as a function of emission
wavelengths in native (s) and molten globule (d) states. The
excitation wavelength used was 294 nm. Mean fluorescence lifetimes
were calculated from Table 1 using Eq. (5). Data shown are
mean ± SE of three independent measurements. The concentration
of BLA was 32 lM. See ‘‘Materials and methods’’ for further details
Eur Biophys J (2010) 39:1453–1463 1461
123
constitute one of the early reports of REES in the molten
globule state of proteins.
The discovery of intrinsically disordered yet functional
proteins has altered the paradigm of structure–function
relationship of proteins from the rigid three-dimensional
structures, earlier believed to be a mandatory prerequisite
for protein function (Tompa 2005; Dyson and Wright 2005;
Dunker et al. 2008; Xie et al. 2007). The fact that more
than 50% of total eukaryotic proteins and *75% of sig-
naling proteins in mammals contain at least one long dis-
ordered region ([30 residues) (Dunker et al. 2008; Xie
et al. 2007) has changed the earlier structure–function
dogma. In this context, monitoring the dynamics of pro-
teins, not only in ordered forms but also in disordered
forms, such as the molten globule form, assumes signifi-
cance. Our present results could provide crucial insight into
the role of tryptophans in the function of BLA in its molten
globule state in particular, and other partially ordered
proteins in general. Understanding the dynamic environ-
ment of tryptophan residues in molten globule-like con-
formations in proteins could therefore lead to better
understanding of their function.
Acknowledgments This work was supported by the Council of
Scientific and Industrial Research, Government of India. D.A.K.
thanks the Life Sciences Research Board for the award of a Post-
doctoral Fellowship. Ar.C. and S.H. thank the Council of Scientific
and Industrial Research for the award of Research Fellowships. We
sincerely thank R. Rukmini for helpful discussion on the crystal
structure of BLA. A.C. is an Adjunct Professor at the Special Centre
for Molecular Medicine of Jawaharlal Nehru University (New Delhi,
India), and Honorary Professor of the Jawaharlal Nehru Centre for
Advanced Scientific Research (Bangalore, India). A.C. gratefully
acknowledges a J.C. Bose Fellowship (Department of Science and
Technology, Government of India). We thank Lora B. Narayana and
G.G. Kingi for technical help, and members of our laboratory for
critically reading of the manuscript.
References
Booth DR, Sunde M, Bellotti V, Robinson CV, Hutchinson WL,
Fraser PE, Hawkins PN, Dobson CM, Radford SE, Blake CC,
Pepys MB (1997) Instability, unfolding and aggregation of
human lysozyme variants underlying amyloid fibrillogenesis.
Nature 385:787–793
Chakraborty S, Ittah V, Bai P, Luo L, Haas E, Peng Z-Y (2001)
Structure and dynamics of the a-lactalbumin molten globule:
fluorescence studies using proteins containing a single trypto-
phan residue. Biochemistry 40:7228–7238
Chattopadhyay A (2003) Exploring membrane organization and
dynamics by the wavelength-selective fluorescence approach.
Chem Phys Lipids 122:3–17
Chattopadhyay A, McNamee MG (1991) Average membrane pene-
tration depth of tryptophan residues of the nicotinic acetylcholine
receptor by the parallax method. Biochemistry 30:7159–7164
Chattopadhyay A, Rawat SS, Kelkar DA, Ray S, Chakrabarti A
(2003) Organization and dynamics of tryptophan residues in
erythroid spectrin: novel structural features of denatured spectrin
revealed by the wavelength-selective fluorescence approach.
Protein Sci 12:2389–2403
Chattopadhyay A, Rawat SS, Greathouse DV, Kelkar DA, Koeppe
RE (2008) Role of tryptophan residues in gramicidin channel
organization and function. Biophys J 95:166–175
Chrysina ED, Brew K, Acharya KR (2000) Crystal structure of apo-
and holo-bovine a-lactalbumin at 2.2-A resolution reveal an
effect of calcium on inter-lobe interactions. J Biol Chem
275:37021–37029
De Lauder WB, Wahl Ph (1971) Effect of solvent upon the
fluorescence decay of indole. Biochim Biophys Acta 243:153–
163
De Laureto PP, Frare E, Gottardo R, Van Dael H, Fontana A (2002)
Partly folded states of members of the lysozyme/lactalbumin
superfamily: a comparative study by circular dichroism spec-
troscopy and limited proteolysis. Protein Sci 11:2932–2946
Demchenko AP (2002) The red-edge effects: 30 years of exploration.
Luminescence 17:19–42
Demchenko AP (2008) Site-selective red-edge effects. Methods
Enzymol 450:59–78
Dolgikh DA, Gilmanshin RI, Brazhnikov EV, Bychkova VE,
Semisotnov GV, Venyaminov SY, Ptitsyn OB (1981) a-Lactal-
bumin: compact state with fluctuating tertiary structure? FEBS
Lett 136:311–315
Dunker AK, Silman I, Uversky VN, Sussman JL (2008) Function and
structure of inherently disordered proteins. Curr Opin Struct Biol
18:756–764
Dyson HJ, Wright PE (2005) Intrinsically unstructured proteins and
their functions. Nat Rev Mol Cell Biol 6:197–208
Eftink MR (1991a) Fluorescence techniques for studying protein
structure. In: Suelter CH (ed) Methods of biochemical analysis,
vol 35. Wiley, New York, pp 127–205
Eftink MR (1991b) Fluorescence quenching reactions: Probing
biological macromolecular structure. In: Dewey TG (ed)
Biophysical and biochemical aspects of fluorescence spectros-
copy. Plenum, New York, pp 1–41
Eftink MR (1991c) Fluorescence quenching: theory and applications.
In: Lakowicz JR (ed) Topics in fluorescence spectroscopy, vol 2:
Principles. Plenum, New York, pp 53–126
Eftink MR, Zajicek JL, Ghiron CA (1977) A hydrophobic quencher of
protein fluorescence: 2, 2, 2-trichloroethanol. Biochim Biophys
Acta 491:473–481
Engel MFM, Van Mierlo CPM, Visser AJWG (2002) Kinetic and
structural characterization of adsorption-induced unfolding of
bovine a-lactalbumin. J Biol Chem 277:10922–10930
Flynn GC, Beckers CJ, Baase WA, Dahlquist FW (1993) Individual
subunits of bacterial luciferase are molten globules and interact
with molecular chaperones. Proc Natl Acad Sci U S A 90:10826–
10830
Giovanni M, Berliner LJ (1985) Probing different conformatinal
states of bovine a-lactalbumin: fluorescence studies with 4,
40-bis[1-(phenylamino)-8-napthalenesulfonate]. Biochemistry
24:3852–3856
Grinvald A, Steinberg IZ (1974) On the analysis of fluorescence
decay kinetics by the method of least-squares. Anal Biochem
59:583–598
Grobler JA, Wang M, Pike ACW, Brew K (1994) Study by
mutagenesis of the roles of two aromatic clusters of a-lactalbumin
in aspects of its action in the lactose synthase system. J Biol Chem
269:5106–5114
Guha S, Rawat SS, Chattopadhyay A, Bhattacharyya B (1996)
Tubulin conformation and dynamics: a red edge excitation shift
study. Biochemistry 35:13426–13433
Haldar S, Chattopadhyay A (2007) Dipolar relaxation within the
protein matrix of the green fluorescent protein: a red edge
excitation shift study. J Phys Chem B 111:14436–14439
1462 Eur Biophys J (2010) 39:1453–1463
123
Kelkar DA, Chattopadhyay A (2005) Effect of graded hydration on
the dynamics of an ion channel peptide: a fluorescence approach.
Biophys J 88:1070–1080
Kelkar DA, Chattopadhyay A, Chakrabarti A, Bhattacharyya M
(2005) Effect of ionic strength on the organization and dynamics
of tryptophan residues in erythroid spectrin: a fluorescence
approach. Biopolymers 77:325–334
Kronman MJ, Sinha SK, Brew K (1981) Characteristics of the binding
of Ca2? and other divalent metal ions to bovine a-lactalbumin. J
Biol Chem 256:8582–8587
Kuwajima K (1989) The molten globule state as a clue for
understanding the folding and cooperativity of globular-protein
structure. Proteins 6:87–103
Kuwajima K (1996) The molten globule state of a-lactalbumin.
FASEB J 10:102–109
Lakowicz JR (2006) Principles of fluorescence spectroscopy, 3rd edn.
Springer, New York
Lampert RA, Chewter LA, Phillips D, O’Connor DV, Roberts AJ,
Meech SR (1983) Standards for nanosecond fluorescence decay
time measurements. Anal Chem 55:68–73
Leal SS, Gomes CM (2007) Studies of the molten globule state of
ferredoxin: structural characterization and implications on pro-
tein folding and iron-sulfur center assembly. Proteins 68:606–616
Moens PD, Helms MK, Jameson DM (2004) Detection of tryptophan
to tryptophan energy transfer in proteins. Protein J 23:79–83
Mok KH, Nagashima T, Day IJ, Hore PJ, Dobson CM (2005)
Multiple subsets of side-chain packing in partially folded states
of a-lactalbumins. Proc Natl Acad Sci U S A 102:8899–8904
Mukherjee S, Chattopadhyay A (1995) Wavelength-selective fluo-
rescence as a novel tool to study organization and dynamics in
complex biological systems. J Fluoresc 5:237–246
Nanda V, Brand L (2000) Aromatic interactions in homeodomains
contribute to the low quantum yield of a conserved, buried
tryptophan. Proteins 40:112–125
O’Connor DV, Phillips D (1984) Time-correlated single photon
counting. Academic, London, pp 180–189
Ohgushi M, Wada A (1983) ‘‘Molten-globule state’’: a compact form
of globular proteins with mobile side-chains. FEBS Lett 164:21–
24
Permyakov EA, Berliner LJ (2000) a-Lactalbumin: structure and
function. FEBS Lett 473:269–274
Pettersson J, Mossberg A-K, Svanborg C (2006) a-Lactalbumin
species variation, HAMLET formation, and tumor cell death.
Biochem Biophys Res Commun 345:260–270
Prendergast FG (1991) Time-resolved fluorescence techniques:
methods and applications in biology. Curr Opin Struct Biol
1:1054–1059
Raghuraman H, Chattopadhyay A (2003) Organization and dynamics
of melittin in environments of graded hydration: a fluorescence
approach. Langmuir 19:10332–10341
Raghuraman H, Chattopadhyay A (2006) Effect of ionic strength on
folding and aggregation of the hemolytic peptide melittin in
solution. Biopolymers 83:111–121
Raghuraman H, Kelkar DA, Chattopadhyay A (2005) Novel insights
into protein structure and dynamics utilizing the red edge
excitation shift approach. In: Geddes CD, Lakowicz JR (eds)
Reviews in fluorescence, vol 2. Springer, New York, pp 199–214
Raja SM, Rawat SS, Chattopadhyay A, Lala AK (1999) Localization
and environment of tryptophans in soluble and membrane-bound
states of a pore forming toxin from Staphylococcus aureus.
Biophys J 76:1469–1479
Rawat SS, Kelkar DA, Chattopadhyay A (2004) Monitoring gram-
icidin conformations in membranes: a fluorescence approach.
Biophys J 87:831–843
Ren J, Kachel K, Kim H, Malenbaum SE, Collier RJ, London E
(1999) Interaction of diptheria toxin T domain with molten
globule-like proteins and its implications for translocation.
Science 284:955–957
Rouviere N, Vincent M, Craescu CT, Gallay J (1997) Immunosup-
pressor binding to the immunophilin FKBP59 affects the local
structural dynamics of a surface b-strand: time-resolved fluores-
cence study. Biochemistry 36:7339–7352
Silva ND, Prendergast FG (1996) Tryptophan dynamics of the FK506
binding protein: time-resolved fluorescence and simulations.
Biophys J 70:1122–1137
Tompa P (2005) The interplay between structure and function in
intrinsically unstructured proteins. FEBS Lett 579:3346–3354
Vanhooren A, Chedad A, Farkas V, Majer Z, Joniau M, Van Dael H,
Hanssens I (2005) Tryptophan to phenylalanine substitutions
allow differentiation of short- and long-range conformational
changes during denaturation of goat a-lactalbumin. Proteins
60:118–130
Vanhooren A, Illyes E, Majer Z, Hanssens I (2006) Fluorescence
contributions of the individual Trp residues in goat a-lactalbu-
min. Biochim Biophys Acta 1764:1586–1591
Vincent M, Li De La Sierra IM, Berberan-Santos MN, Diaz A, Diaz
M, Padron G, Gallay J (1992) Time-resolved fluorescence study
of human recombinant interferon a2: association state of the
protein, spatial proximity of the two tryptophan residues. Eur J
Biochem 210:953–961
Weber G, Shinitzky M (1970) Failure of energy transfer between
identical aromatic molecules on excitation at the long wave edge
of the absorption spectrum. Proc Natl Acad Sci U S A 65:823–
830
Wright PE, Dyson HJ (1999) Intrinsically unstructured proteins: re-
assessing the protein structure-function paradigm. J Mol Biol
293:321–331
Wyttenbach T, Bowers MT (2009) Hydration of biomolecules. Chem
Phys Lett 480:1–16
Xie H, Vucetic S, Iakoucheva LM, Oldfield CJ, Dunker AK, Uversky
VN, Obradovic Z (2007) Functional anthology of intrinsic
disorder. 1. Biological processes and functions of proteins with
long disordered regions. J Proteome Res 6:1882–1898
Eur Biophys J (2010) 39:1453–1463 1463
123