The evaporation rates and mechanisms of cadmium from a bubble-stirred molten copper bath
11
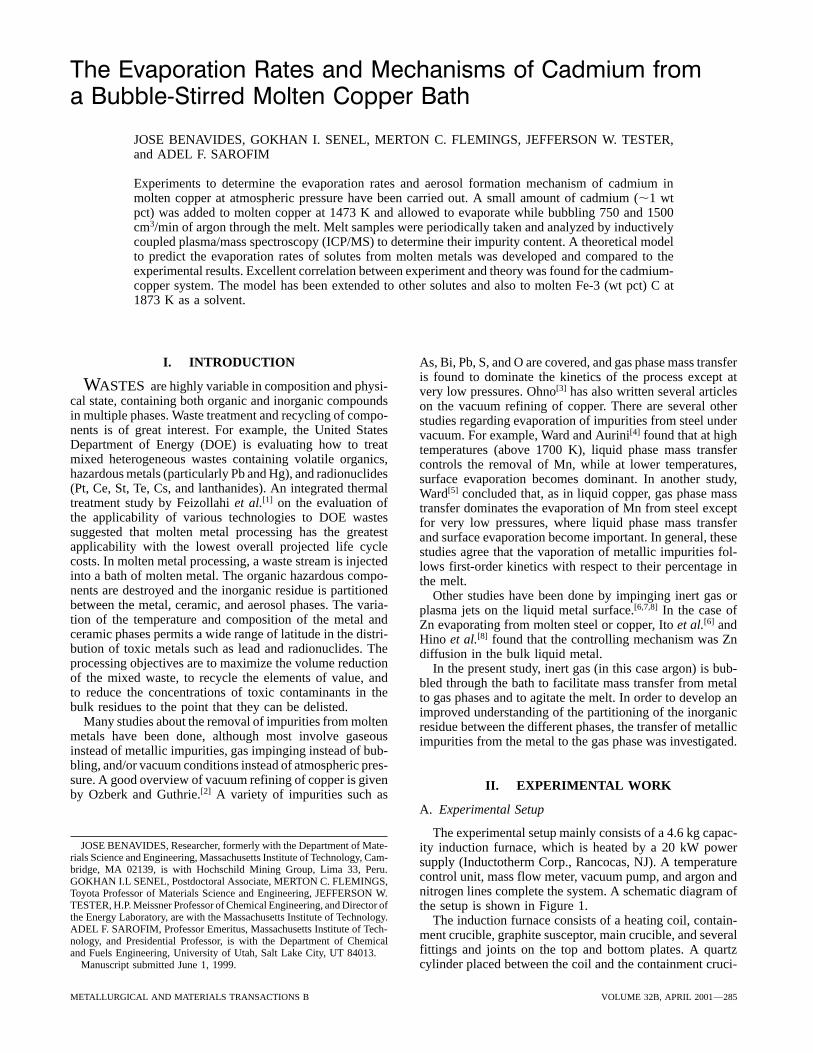
The Evaporation Rates and Mechanisms of Cadmium from a Bubble-Stirred Molten Copper Bath JOSE BENAVIDES, GOKHAN I. SENEL, MERTON C. FLEMINGS, JEFFERSON W. TESTER, and ADEL F. SAROFIM Experiments to determine the evaporation rates and aerosol formation mechanism of cadmium in molten copper at atmospheric pressure have been carried out. A small amount of cadmium (,1 wt pct) was added to molten copper at 1473 K and allowed to evaporate while bubbling 750 and 1500 cm 3 /min of argon through the melt. Melt samples were periodically taken and analyzed by inductively coupled plasma/mass spectroscopy (ICP/MS) to determine their impurity content. A theoretical model to predict the evaporation rates of solutes from molten metals was developed and compared to the experimental results. Excellent correlation between experiment and theory was found for the cadmium- copper system. The model has been extended to other solutes and also to molten Fe-3 (wt pct) C at 1873 K as a solvent. I. INTRODUCTION As, Bi, Pb, S, and O are covered, and gas phase mass transfer is found to dominate the kinetics of the process except at W ASTES are highly variable in composition and physi- very low pressures. Ohno [3] has also written several articles cal state, containing both organic and inorganic compounds on the vacuum refining of copper. There are several other in multiple phases. Waste treatment and recycling of compo- studies regarding evaporation of impurities from steel under nents is of great interest. For example, the United States vacuum. For example, Ward and Aurini [4] found that at high Department of Energy (DOE) is evaluating how to treat temperatures (above 1700 K), liquid phase mass transfer mixed heterogeneous wastes containing volatile organics, controls the removal of Mn, while at lower temperatures, hazardous metals (particularly Pb and Hg), and radionuclides surface evaporation becomes dominant. In another study, (Pt, Ce, St, Te, Cs, and lanthanides). An integrated thermal Ward [5] concluded that, as in liquid copper, gas phase mass treatment study by Feizollahi et al. [1] on the evaluation of transfer dominates the evaporation of Mn from steel except the applicability of various technologies to DOE wastes for very low pressures, where liquid phase mass transfer suggested that molten metal processing has the greatest and surface evaporation become important. In general, these applicability with the lowest overall projected life cycle studies agree that the vaporation of metallic impurities fol- costs. In molten metal processing, a waste stream is injected lows first-order kinetics with respect to their percentage in into a bath of molten metal. The organic hazardous compo- the melt. nents are destroyed and the inorganic residue is partitioned Other studies have been done by impinging inert gas or between the metal, ceramic, and aerosol phases. The varia- plasma jets on the liquid metal surface. [6,7,8] In the case of tion of the temperature and composition of the metal and Zn evaporating from molten steel or copper, Ito et al. [6] and ceramic phases permits a wide range of latitude in the distri- Hino et al. [8] found that the controlling mechanism was Zn bution of toxic metals such as lead and radionuclides. The diffusion in the bulk liquid metal. processing objectives are to maximize the volume reduction In the present study, inert gas (in this case argon) is bub- of the mixed waste, to recycle the elements of value, and bled through the bath to facilitate mass transfer from metal to reduce the concentrations of toxic contaminants in the to gas phases and to agitate the melt. In order to develop an bulk residues to the point that they can be delisted. improved understanding of the partitioning of the inorganic Many studies about the removal of impurities from molten residue between the different phases, the transfer of metallic metals have been done, although most involve gaseous impurities from the metal to the gas phase was investigated. instead of metallic impurities, gas impinging instead of bub- bling, and/or vacuum conditions instead of atmospheric pres- sure. A good overview of vacuum refining of copper is given II. EXPERIMENTAL WORK by Ozberk and Guthrie. [2] A variety of impurities such as A. Experimental Setup The experimental setup mainly consists of a 4.6 kg capac- JOSE BENAVIDES, Researcher, formerly with the Department of Mate- ity induction furnace, which is heated by a 20 kW power rials Science and Engineering, Massachusetts Institute of Technology, Cam- supply (Inductotherm Corp., Rancocas, NJ). A temperature bridge, MA 02139, is with Hochschild Mining Group, Lima 33, Peru. control unit, mass flow meter, vacuum pump, and argon and GOKHAN I.L SENEL, Postdoctoral Associate, MERTON C. FLEMINGS, nitrogen lines complete the system. A schematic diagram of Toyota Professor of Materials Science and Engineering, JEFFERSON W. TESTER, H.P. Meissner Professor of Chemical Engineering, and Director of the setup is shown in Figure 1. the Energy Laboratory, are with the Massachusetts Institute of Technology. The induction furnace consists of a heating coil, contain- ADEL F. SAROFIM, Professor Emeritus, Massachusetts Institute of Tech- ment crucible, graphite susceptor, main crucible, and several nology, and Presidential Professor, is with the Department of Chemical fittings and joints on the top and bottom plates. A quartz and Fuels Engineering, University of Utah, Salt Lake City, UT 84013. Manuscript submitted June 1, 1999. cylinder placed between the coil and the containment cruci- METALLURGICAL AND MATERIALS TRANSACTIONS B VOLUME 32B, APRIL 2001—285
-
Upload
independent -
Category
Documents
-
view
4 -
download
0
Transcript of The evaporation rates and mechanisms of cadmium from a bubble-stirred molten copper bath
The Evaporation Rates and Mechanisms of Cadmium froma Bubble-Stirred Molten Copper Bath
JOSE BENAVIDES, GOKHAN I. SENEL, MERTON C. FLEMINGS, JEFFERSON W. TESTER,and ADEL F. SAROFIM
Experiments to determine the evaporation rates and aerosol formation mechanism of cadmium inmolten copper at atmospheric pressure have been carried out. A small amount of cadmium (,1 wtpct) was added to molten copper at 1473 K and allowed to evaporate while bubbling 750 and 1500cm3/min of argon through the melt. Melt samples were periodically taken and analyzed by inductivelycoupled plasma/mass spectroscopy (ICP/MS) to determine their impurity content. A theoretical modelto predict the evaporation rates of solutes from molten metals was developed and compared to theexperimental results. Excellent correlation between experiment and theory was found for the cadmium-copper system. The model has been extended to other solutes and also to molten Fe-3 (wt pct) C at1873 K as a solvent.
I. INTRODUCTION As, Bi, Pb, S, and O are covered, and gas phase mass transferis found to dominate the kinetics of the process except atWASTES are highly variable in composition and physi- very low pressures. Ohno[3] has also written several articles
cal state, containing both organic and inorganic compounds on the vacuum refining of copper. There are several otherin multiple phases. Waste treatment and recycling of compo- studies regarding evaporation of impurities from steel undernents is of great interest. For example, the United States vacuum. For example, Ward and Aurini[4] found that at highDepartment of Energy (DOE) is evaluating how to treat temperatures (above 1700 K), liquid phase mass transfermixed heterogeneous wastes containing volatile organics, controls the removal of Mn, while at lower temperatures,hazardous metals (particularly Pb and Hg), and radionuclides surface evaporation becomes dominant. In another study,(Pt, Ce, St, Te, Cs, and lanthanides). An integrated thermal Ward[5] concluded that, as in liquid copper, gas phase masstreatment study by Feizollahi et al.[1] on the evaluation of transfer dominates the evaporation of Mn from steel exceptthe applicability of various technologies to DOE wastes for very low pressures, where liquid phase mass transfersuggested that molten metal processing has the greatest and surface evaporation become important. In general, theseapplicability with the lowest overall projected life cycle studies agree that the vaporation of metallic impurities fol-costs. In molten metal processing, a waste stream is injected lows first-order kinetics with respect to their percentage ininto a bath of molten metal. The organic hazardous compo- the melt.nents are destroyed and the inorganic residue is partitioned Other studies have been done by impinging inert gas orbetween the metal, ceramic, and aerosol phases. The varia- plasma jets on the liquid metal surface.[6,7,8] In the case oftion of the temperature and composition of the metal and Zn evaporating from molten steel or copper, Ito et al.[6] andceramic phases permits a wide range of latitude in the distri- Hino et al.[8] found that the controlling mechanism was Znbution of toxic metals such as lead and radionuclides. The diffusion in the bulk liquid metal.processing objectives are to maximize the volume reduction In the present study, inert gas (in this case argon) is bub-of the mixed waste, to recycle the elements of value, and bled through the bath to facilitate mass transfer from metalto reduce the concentrations of toxic contaminants in the to gas phases and to agitate the melt. In order to develop anbulk residues to the point that they can be delisted. improved understanding of the partitioning of the inorganic
Many studies about the removal of impurities from molten residue between the different phases, the transfer of metallicmetals have been done, although most involve gaseous impurities from the metal to the gas phase was investigated.instead of metallic impurities, gas impinging instead of bub-bling, and/or vacuum conditions instead of atmospheric pres-sure. A good overview of vacuum refining of copper is given II. EXPERIMENTAL WORKby Ozberk and Guthrie.[2] A variety of impurities such as
A. Experimental Setup
The experimental setup mainly consists of a 4.6 kg capac-JOSE BENAVIDES, Researcher, formerly with the Department of Mate- ity induction furnace, which is heated by a 20 kW power
rials Science and Engineering, Massachusetts Institute of Technology, Cam- supply (Inductotherm Corp., Rancocas, NJ). A temperaturebridge, MA 02139, is with Hochschild Mining Group, Lima 33, Peru.
control unit, mass flow meter, vacuum pump, and argon andGOKHAN I.L SENEL, Postdoctoral Associate, MERTON C. FLEMINGS,nitrogen lines complete the system. A schematic diagram ofToyota Professor of Materials Science and Engineering, JEFFERSON W.
TESTER, H.P. Meissner Professor of Chemical Engineering, and Director of the setup is shown in Figure 1.the Energy Laboratory, are with the Massachusetts Institute of Technology. The induction furnace consists of a heating coil, contain-ADEL F. SAROFIM, Professor Emeritus, Massachusetts Institute of Tech- ment crucible, graphite susceptor, main crucible, and severalnology, and Presidential Professor, is with the Department of Chemical
fittings and joints on the top and bottom plates. A quartzand Fuels Engineering, University of Utah, Salt Lake City, UT 84013.Manuscript submitted June 1, 1999. cylinder placed between the coil and the containment cruci-
METALLURGICAL AND MATERIALS TRANSACTIONS B VOLUME 32B, APRIL 2001—285
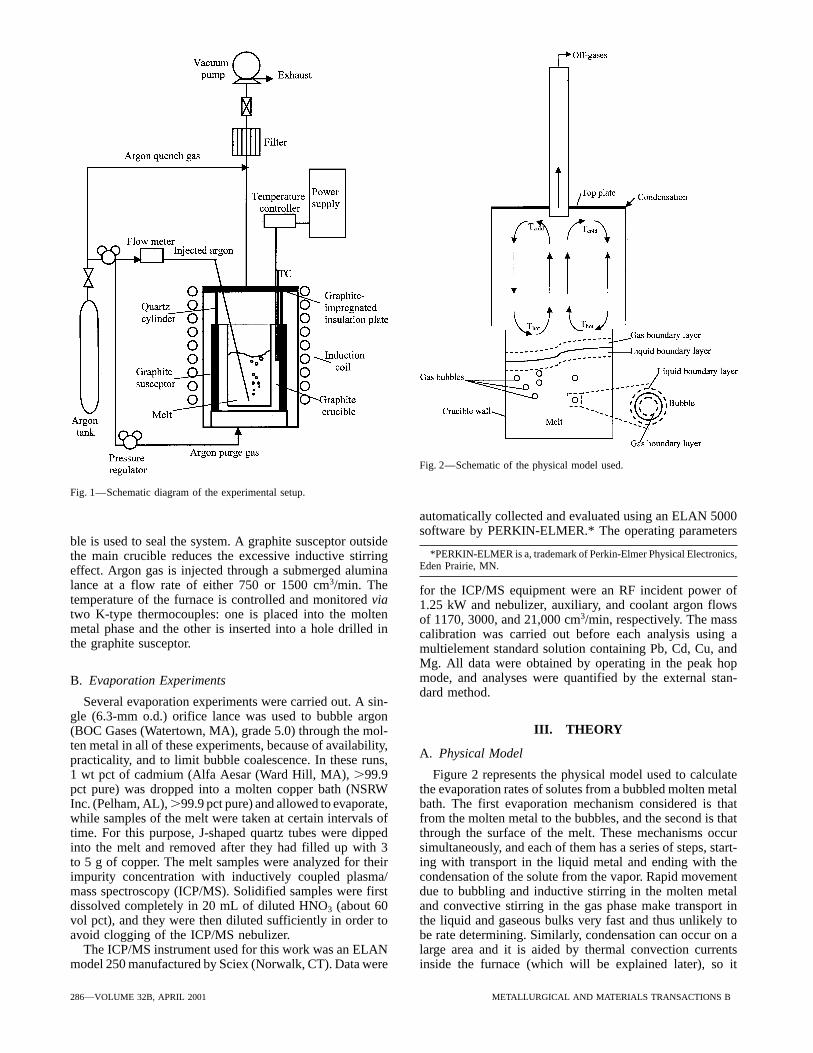
Fig. 2—Schematic of the physical model used.
Fig. 1—Schematic diagram of the experimental setup.
automatically collected and evaluated using an ELAN 5000software by PERKIN-ELMER.* The operating parameters
ble is used to seal the system. A graphite susceptor outside*PERKIN-ELMER is a, trademark of Perkin-Elmer Physical Electronics,the main crucible reduces the excessive inductive stirring
Eden Prairie, MN.effect. Argon gas is injected through a submerged aluminalance at a flow rate of either 750 or 1500 cm3/min. The for the ICP/MS equipment were an RF incident power oftemperature of the furnace is controlled and monitored via 1.25 kW and nebulizer, auxiliary, and coolant argon flowstwo K-type thermocouples: one is placed into the molten of 1170, 3000, and 21,000 cm3/min, respectively. The massmetal phase and the other is inserted into a hole drilled in calibration was carried out before each analysis using athe graphite susceptor. multielement standard solution containing Pb, Cd, Cu, and
Mg. All data were obtained by operating in the peak hopmode, and analyses were quantified by the external stan-B. Evaporation Experimentsdard method.
Several evaporation experiments were carried out. A sin-gle (6.3-mm o.d.) orifice lance was used to bubble argon
III. THEORY(BOC Gases (Watertown, MA), grade 5.0) through the mol-ten metal in all of these experiments, because of availability,
A. Physical Modelpracticality, and to limit bubble coalescence. In these runs,1 wt pct of cadmium (Alfa Aesar (Ward Hill, MA), .99.9 Figure 2 represents the physical model used to calculate
the evaporation rates of solutes from a bubbled molten metalpct pure) was dropped into a molten copper bath (NSRWInc. (Pelham, AL), .99.9 pct pure) and allowed to evaporate, bath. The first evaporation mechanism considered is that
from the molten metal to the bubbles, and the second is thatwhile samples of the melt were taken at certain intervals oftime. For this purpose, J-shaped quartz tubes were dipped through the surface of the melt. These mechanisms occur
simultaneously, and each of them has a series of steps, start-into the melt and removed after they had filled up with 3to 5 g of copper. The melt samples were analyzed for their ing with transport in the liquid metal and ending with the
condensation of the solute from the vapor. Rapid movementimpurity concentration with inductively coupled plasma/mass spectroscopy (ICP/MS). Solidified samples were first due to bubbling and inductive stirring in the molten metal
and convective stirring in the gas phase make transport indissolved completely in 20 mL of diluted HNO3 (about 60vol pct), and they were then diluted sufficiently in order to the liquid and gaseous bulks very fast and thus unlikely to
be rate determining. Similarly, condensation can occur on aavoid clogging of the ICP/MS nebulizer.The ICP/MS instrument used for this work was an ELAN large area and it is aided by thermal convection currents
inside the furnace (which will be explained later), so itmodel 250 manufactured by Sciex (Norwalk, CT). Data were
286—VOLUME 32B, APRIL 2001 METALLURGICAL AND MATERIALS TRANSACTIONS B

A 5 area
and the subscripts b and ms refer to the bubbles and themelt surface, respectively.
One important assumption in this model is that the solutesconsidered are present in sufficiently low concentrations inthe molten metal so that they can be taken as infinitely dilute.For this approximation, the equilibrium at the interface isgiven by
yXi 5Keq xXi fX
PAr[3]
Similary, the amount of solute carried out of the melt bythe bubbles, obtained by integrating the first term on theright-hand side of Eq. [2] is expressed as[9,10]
Fig. 3—Concentrations of solute X in the gas and liquid phases.100QZfXKeq MWXx
PAr MWl[4]
should not restrict the rate of the process. Additionally, the where Q is the flow rate of argon in mol/s, fX and MWX areinterface reaction resistance is neglected because the mean the Henry’s law-based activity coefficient and the molecularfree path of the evaporating atoms is small relative to the weight of the solute X, respectively; PAr is the argon partialconvective boundary layer at atmospheric pressure. Because pressure; and Z is the “efficiency of gas purging”[9] defined asof this, it will be assumed that the concentrations of soluteX in the liquid and gas phases at the interface are in
Z 5 1 2 exp (2fA) 5Pexit
X MWl
100fX MWXKeq x[5]equilibrium.
The preceding considerations suggest that the rate of evap-where PX
exit is the solute partial pressure in the bubble whenoration by each of the aforementioned mechanisms can beit bursts at the surface of the melt; and FA is the dimensionlesslimited by diffusion of the solute in either the melt boundarycontact area, which determines the extent to which equilib-layer or the gas boundary layer. The solute concentrationsrium is reached in the bubbles:[9]
in both of these boundary layers, as approximated in themodel used, are shown in Figure 3, where yx and xx are the
fA 5Kol,brlAbPAr
100fX MWXQKeq[6]mole fractions of X in the gas phase and melt, respectively;
d is the thickness of each boundary layer, and the subscriptsSince PX ¿ PAr, Eq. [4] can be evaluated easily by assum-l, g, and i represent liquid, gas, and interface, respectively.
ing PAr 5 Ptot 5 1 atm, where Ptot is the total gas pressure.These concentration profiles apply for the melt surface and(For other cases when this assumption does not hold, PXfor each bubble in the melt.has to be evaluated at each point I the bath.[10])
Regarding the second term on the right-hand side of Eq.B. Overall Mass Transfer Rates [2], which accounts for evaporation from the melt surface, it
contains the unknown quantity xeq,ms. This is the hypotheticalThe basic mass balance equation applying to the solutesolute concentration in the melt that would be in equilibriumcan be expressed as follows:with the solute partial pressure PX,top in the bulk gas abovethe melt. As will be explained later, it is assumed that this1Molar flux
from melt 2 5 1Molar fluxto bubbles2 1 1
Molar fluxthrough
melt surface2 [1] gas is sufficiently mixed by the convection currents and thatPX,top is uniform in the gas above the melt except for a smallboundary layer over the melt surface. It has been found
Since the metal bath is well mixed by bubbling and con- experimentally that the value of PX,top is very low andvective stirring, this equation translates to neglecting it increases the overall theoretical evaporation
rate only about 3 to 5 pct, depending on the solute. In anycase, the theoretical results remain within 610 pct of the2Mldx
MWl dt5 e
Ab
o
Kol,brl(x 2 xeq,b)
MWldAb
[2]actual evaporation rates. Thus, PX,top and xeq,ms were set tozero in obtaining theoretical evaporation curves.
The solution of the equation obtained by combining Eq.1
Kol,msrlAms(x 2 xeq,ms)
MWl [2] and [4] is
where the variables are defined as follows: xx0
5 exp F12100MWXQZfXKeq
MlPAr2
Kol,msrlAms
Ml2tG [7]
xeq 5 hypothetical solute mole fraction in the melt inequilibrium with the solute partial pressure Px where x0 is the initial solute mole fraction in the melt.in the bulk gas phase
MWl 5 molecular weight of the meltC. Overall Mass Transfer CoefficientsMl 5 mass of the melt
Kol 5 overall mass transfer coefficient based on liquid The expression used for the overall mass transfer coeffi-cient Kol is the following:[10]side concentrations (will be discussed later)
METALLURGICAL AND MATERIALS TRANSACTIONS B VOLUME 32B, APRIL 2001—287

solute partial pressure is achieved near the melt surface, just1Kol
51kl
11
1100PtotKeq MWX fX
rlRT 2kg
51kl
11k8g
[8] above the gas boundary layer. This in turn drives additionalmass transfer of solute from the melt surface into the gas.For the evaluation of kg,ms, a gas temperature difference of300 K was used for copper melts, which was experimen-As shown, Kol is composed of liquid and gas phase masstally determined.transfer resistances represented by 1/kl and 1/k8g respectively.
This situation can be approximated by the natural convec-In what follows, the calculation of kl and kg will be discussed.tion between two horizontal surfaces at different tempera-In the case of kg, different physical situations lead to differenttures. With the correlation recommended by McAdams[14]
expressions (kg,b and kg,ms) for evaporation of X into thefor the Nusset number, and the assumption that Sh 5 Nu,bubbles and from the melt surface, respectively. Thus, therethe following equation was obtained to calculate the gaswill be two expressions for Kol , which will be referred tophase mass transfer coefficient for the melt surface, kg,ms:as Kol,b and Kol,ms.
The liquid phase mass transfer coefficient is expressed inSh 5
kg,msL
DX2Ar5 0.54(GrPr)1/4
[14]the following way according to the surface renewal (Hig-bie’s) model:[11]
5 0.541L3r2ArgbAr(TAr,hot 2 TAr,cold)
m2Ar
Cp,ArmAr
kAr 21/4
kl 5 2 !DX2l
tp[9]
where L is taken as 9/10 of the average diameter of thewhere DX2l is the diffusivity of X in the melt and t is thefurnace interior, g is the acceleration of gravity, Cp ,Ar is thetime of contact of the liquid element with the surface layer.heat capacity of the gas, kAr its thermal conductivity, bAr itsFor a bubble of diameter db approaching the surface with athermal coefficient of volume expansion, rAr its density, andvelocity Ub , the contact time ismAr its viscosity. All gas properties were evaluated atT 5 0.5(TAr,hot 1 TAr, cold). Key assumptions and other detailst 5
db
Ub[10]
regarding the theoretical development are given in theAppendix.
The gas phase mass transfer coefficient for the bubbles is
IV. RESULTS AND DISCUSSIONkg,b 5DX2g
dg,b[11]
The calculated values of Kol, Keq, and the previously men-where dg,b is the gas phase concentration boundary layer tioned mass transfer equations were used to obtain the evapo-thickness in a bubble. The expression used for DX2g is ration rates of cadmium at 750 and 1500 cm3/min fromdiscussed in the Appendix. molten copper. On the basis of good agreement that will be
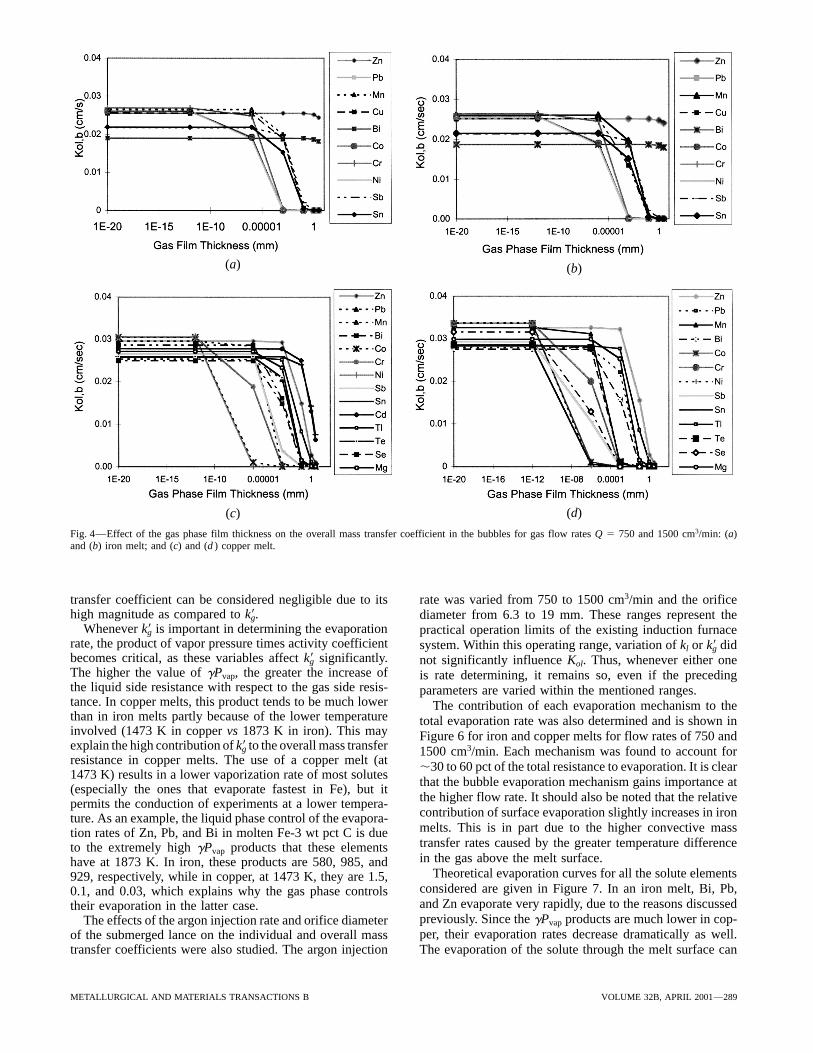
To estimate the value of dg,b, two approaches can be taken. shown to exist between measurements and calculations forThe first uses the viscous boundary layer thickness, obtained cadmium, the model was applied to predict the evaporationby equating the drag force to the inertial force of a mass rates of Zn, Bi, Pb, Mn, Co, Cr, Ni, Sb, Sn, Tl, Te, Se, andelement in the boundary layers.[12] After integrating the Mg from molten copper at 1473 K and of Zn, Bi, Pb, Mn,resulting expression over a characteristic length (in this case Co, Cr, Ni, Sb, and Sn from molten iron at 1873 K.db), an average boundary layer thickness is obtained: In the evaluation of the overall mass transfer coefficient
for the bubbles (Kol,b), a critical parameter to assess is thethickness of the gas boundary layer (db), which affects thedg,b 5
23
db
!Re[12]
gas phase mass transfer coefficient for the bubbles (kg,b).This parameter was calculated to be about 2 mm by the twoThe other approach is given by Drysdale et al.,[13] using theapproaches given by Eqs. [12] and [13]. The effect of db onfollowing formula:Kol,b becomes important when it is less than 1 mm, as shownin Figure 4 for iron and copper melts. For the evaluation of
dg,b 5DX2Art(1 2 yX)
db10.083 1 6.58
DX2Art
d 2b
221
[13] kg,ms in iron melts, a gas temperature difference of 500 Kwas assumed due to their higher temperature.
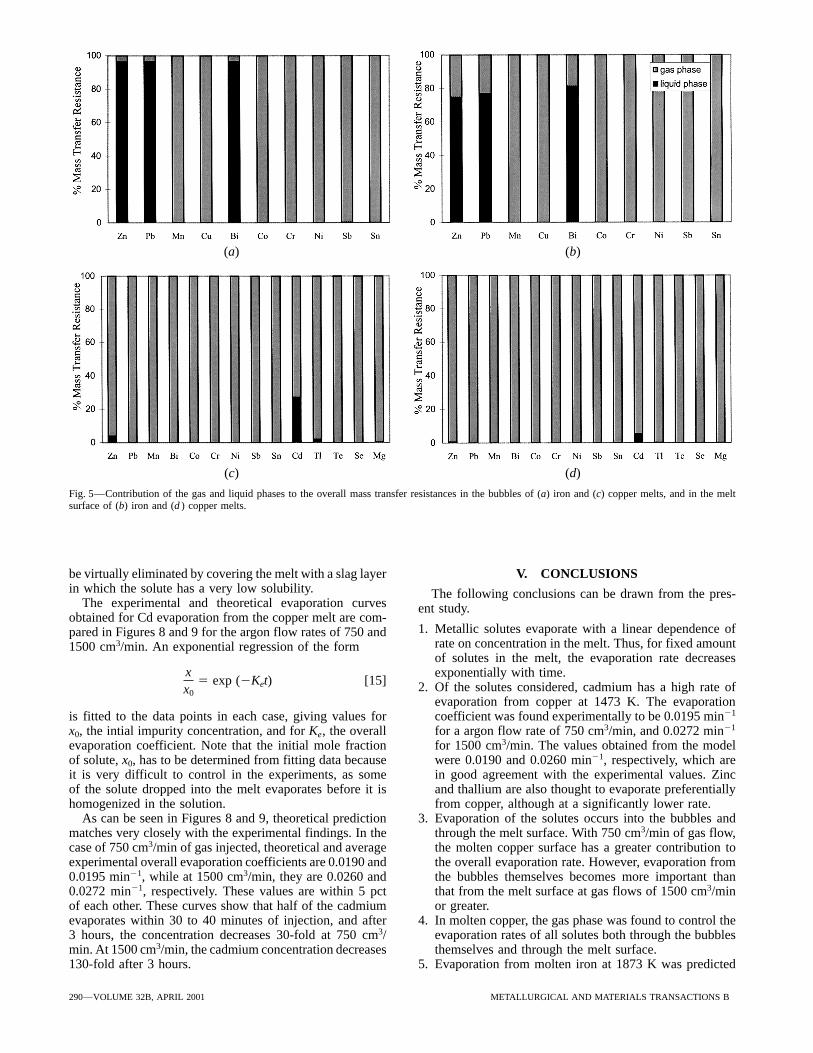
Liquid phase mass transfer (kl) was found to control thewhere t is the contact time used in Higbie’s theory. Thevalues obtained by the two approaches were very similar evaporation of Zn, Pb, and Bi from molten iron through the
bubbles and the top surface (Figure 5). Gas phase massand an average of the two was used in all calculations.At the melt surface, a physical situation different from transfer (k8g) determined the evaporation rate of the rest of
the elements (although resistances in both phases were con-that in the bubbles is encountered. Natural convection cur-rents are driven by the temperature difference between the sidered in the calculations). In all cases, the relative impor-
tance of the liquid side resistance decreases in the meltmelt surface and the inner surface of the top plate of thefurnace (Figure 2). The latter is the coldest part in contact surface mechanism as compared to the bubbles, as the gas
boundary layer above the melt surface is about seven timeswith the gas carrying the solute. When the hot gas reachesthe “cold” plate, a significant amount of the solute it is thicker than that in the bubbles. Although these charts con-
sider a flow rate of 750 cm3/min, those for 1500 cm3/mincarrying condenses on the plate, which lowers the partialpressure of the solute in the gas at the top. The same convec- are very similar. As mentioned previously, contribution of
the interface mass transfer coefficient to the overall masstion currents mix this gas with the rest so that the same low
288—VOLUME 32B, APRIL 2001 METALLURGICAL AND MATERIALS TRANSACTIONS B
(a) (b)
(d)(c)
Fig. 4—Effect of the gas phase film thickness on the overall mass transfer coefficient in the bubbles for gas flow rates Q 5 750 and 1500 cm3/min: (a)and (b) iron melt; and (c) and (d ) copper melt.
transfer coefficient can be considered negligible due to its rate was varied from 750 to 1500 cm3/min and the orificehigh magnitude as compared to k8g. diameter from 6.3 to 19 mm. These ranges represent the
Whenever k8g is important in determining the evaporation practical operation limits of the existing induction furnacerate, the product of vapor pressure times activity coefficient system. Within this operating range, variation of kl or k8g didbecomes critical, as these variables affect k8g significantly. not significantly influence Kol. Thus, whenever either oneThe higher the value of gPvap, the greater the increase of is rate determining, it remains so, even if the precedingthe liquid side resistance with respect to the gas side resis- parameters are varied within the mentioned ranges.tance. In copper melts, this product tends to be much lower The contribution of each evaporation mechanism to thethan in iron melts partly because of the lower temperature total evaporation rate was also determined and is shown ininvolved (1473 K in copper vs 1873 K in iron). This may Figure 6 for iron and copper melts for flow rates of 750 andexplain the high contribution of k8g to the overall mass transfer 1500 cm3/min. Each mechanism was found to account forresistance in copper melts. The use of a copper melt (at ,30 to 60 pct of the total resistance to evaporation. It is clear1473 K) results in a lower vaporization rate of most solutes that the bubble evaporation mechanism gains importance at(especially the ones that evaporate fastest in Fe), but it
the higher flow rate. It should also be noted that the relativepermits the conduction of experiments at a lower tempera-contribution of surface evaporation slightly increases in ironture. As an example, the liquid phase control of the evapora-melts. This is in part due to the higher convective masstion rates of Zn, Pb, and Bi in molten Fe-3 wt pct C is duetransfer rates caused by the greater temperature differenceto the extremely high gPvap products that these elementsin the gas above the melt surface.have at 1873 K. In iron, these products are 580, 985, and
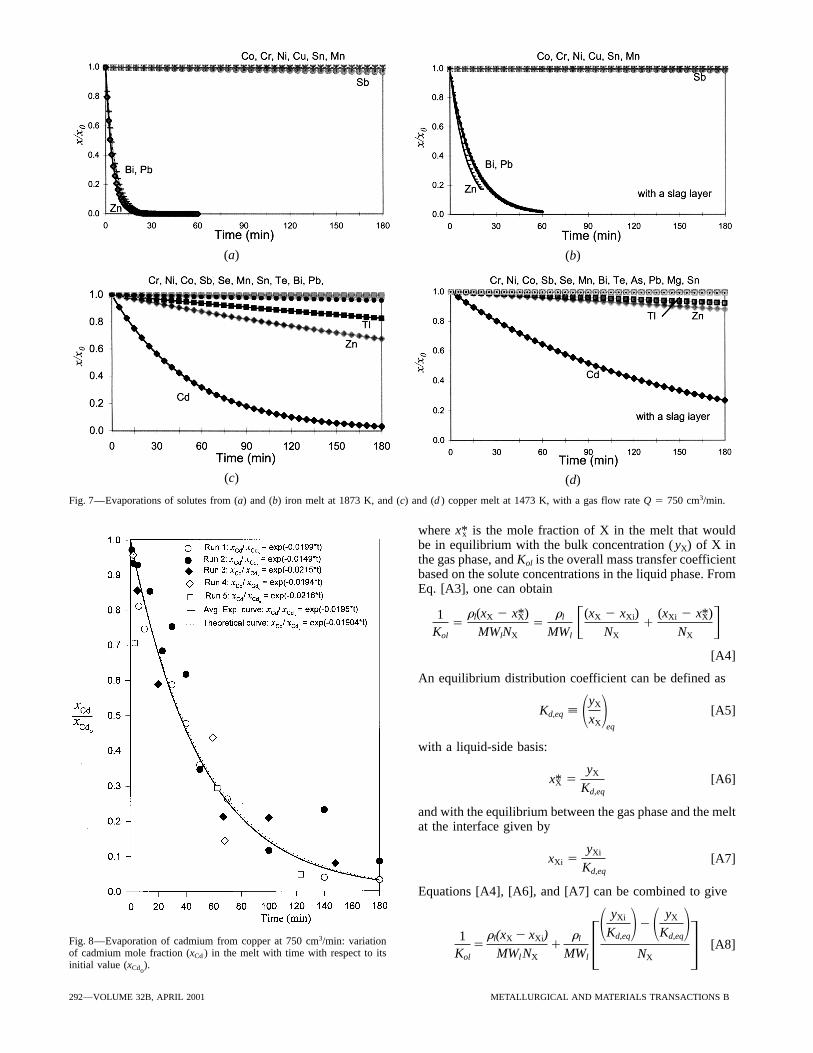
Theoretical evaporation curves for all the solute elements929, respectively, while in copper, at 1473 K, they are 1.5,considered are given in Figure 7. In an iron melt, Bi, Pb,0.1, and 0.03, which explains why the gas phase controlsand Zn evaporate very rapidly, due to the reasons discussedtheir evaporation in the latter case.previously. Since the gPvap products are much lower in cop-The effects of the argon injection rate and orifice diameterper, their evaporation rates decrease dramatically as well.of the submerged lance on the individual and overall mass
transfer coefficients were also studied. The argon injection The evaporation of the solute through the melt surface can
METALLURGICAL AND MATERIALS TRANSACTIONS B VOLUME 32B, APRIL 2001—289
(a) (b)
(c) (d)
Fig. 5—Contribution of the gas and liquid phases to the overall mass transfer resistances in the bubbles of (a) iron and (c) copper melts, and in the meltsurface of (b) iron and (d ) copper melts.
be virtually eliminated by covering the melt with a slag layer V. CONCLUSIONSin which the solute has a very low solubility. The following conclusions can be drawn from the pres-
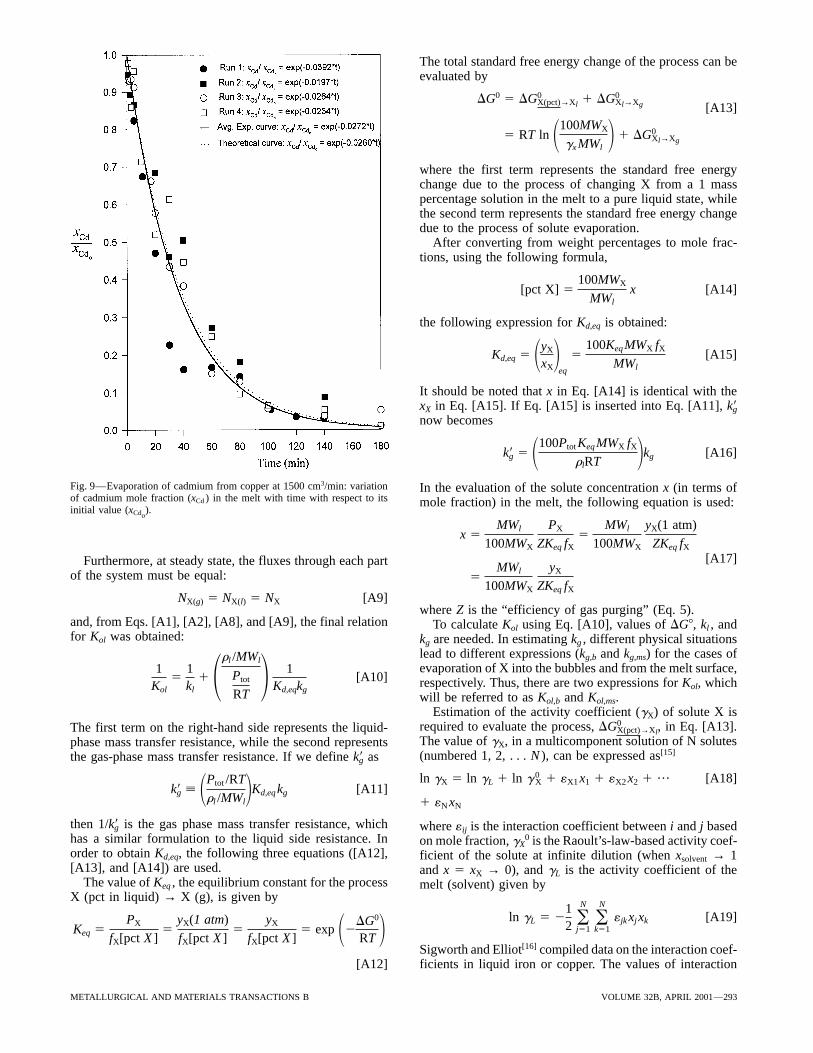
The experimental and theoretical evaporation curves ent study.obtained for Cd evaporation from the copper melt are com-
1. Metallic solutes evaporate with a linear dependence ofpared in Figures 8 and 9 for the argon flow rates of 750 andrate on concentration in the melt. Thus, for fixed amount1500 cm3/min. An exponential regression of the formof solutes in the melt, the evaporation rate decreasesexponentially with time.x
x05 exp (2Ket) [15] 2. Of the solutes considered, cadmium has a high rate of
evaporation from copper at 1473 K. The evaporationcoefficient was found experimentally to be 0.0195 min21is fitted to the data points in each case, giving values for
x0, the intial impurity concentration, and for Ke, the overall for a argon flow rate of 750 cm3/min, and 0.0272 min21
for 1500 cm3/min. The values obtained from the modelevaporation coefficient. Note that the initial mole fractionof solute, x0, has to be determined from fitting data because were 0.0190 and 0.0260 min21, respectively, which are
in good agreement with the experimental values. Zincit is very difficult to control in the experiments, as someof the solute dropped into the melt evaporates before it is and thallium are also thought to evaporate preferentially
from copper, although at a significantly lower rate.homogenized in the solution.As can be seen in Figures 8 and 9, theoretical prediction 3. Evaporation of the solutes occurs into the bubbles and
through the melt surface. With 750 cm3/min of gas flow,matches very closely with the experimental findings. In thecase of 750 cm3/min of gas injected, theoretical and average the molten copper surface has a greater contribution to
the overall evaporation rate. However, evaporation fromexperimental overall evaporation coefficients are 0.0190 and0.0195 min21, while at 1500 cm3/min, they are 0.0260 and the bubbles themselves becomes more important than
that from the melt surface at gas flows of 1500 cm3/min0.0272 min21, respectively. These values are within 5 pctof each other. These curves show that half of the cadmium or greater.
4. In molten copper, the gas phase was found to control theevaporates within 30 to 40 minutes of injection, and after3 hours, the concentration decreases 30-fold at 750 cm3/ evaporation rates of all solutes both through the bubbles
themselves and through the melt surface.min. At 1500 cm3/min, the cadmium concentration decreases130-fold after 3 hours. 5. Evaporation from molten iron at 1873 K was predicted
290—VOLUME 32B, APRIL 2001 METALLURGICAL AND MATERIALS TRANSACTIONS B

(b)(a)
(c) (d)
Fig. 6—Contribution of individual mechanisms to the overall evaporation of solutes (a) and (b) iron melt, T 5 1873 K, and (c) and (d ) copper melt, T 51473 K, for gas flow rates Q 5 750 and 1500 cm3/min, respectively.
theoretically to be very fast for Zn, Bi, and Pb (50-fold because at higher pressures the mean free path of the evapo-rating atoms is small (6.3 3 1028 m for argon at 1 atm),or greater decrease in concentration in about 1 hour)
because of their very large gPvap products. For these rendering the interface reaction resistance insignificant ascompared to the resistance in the gas boundary layer. There-elements, mass transfer resistance in the liquid phase
controls the evaporation rates of the solute. fore, it was assumed that the concentrations of X in theliquid and gas phases at the interface are in equilibrium.
An expression for an overall mass transfer coefficient(Kol), to be used with an overall mass transfer equation usingACKNOWLEDGMENTSliquid phase concentrations, is derived subsequently. ThisThis project has been funded by the Idaho National Engi- expression is valid for evaporation of X both into the bubblesneering and Environmental Laboratory (INEEL) University and from the melt surface.Research Consortium. At the time when the project was With reference to Figure 3, the molar fluxes for the firstunderway the INEEL was managed by Lockheed Martin and third steps can be written asIdaho Technologies Company for the Department of Energy,
Idaho Operations Office, under Contract No. DE-AC07-NX(l) 5
klrl
MWl(xX 2 xXi) [A1]94ID13223.
The experimental assistance and advice of Drs. ChrisNagel, Dale Sleczkoswki, Ravi Konduri, Kevin Sparks, andJohn Carrier, are greatly appreciated. The guidance and NX(g) 5
kgPtot
RT( yXi 2 yX) [A2]
advice provided by Professor Kenneth Smith, MIT, was veryhelpful and timely. where yX and xX are the mole fractions of X in the gas phase
and melt, respectively; and Ptot is the total pressure of thegas. The terms kg and kl are the gas and liquid phase massAPPENDIXtransfer coefficients, respectively. For the reasons outlined
The three most important steps in the majority of mass previously, the flux at the interface was not considered intransfer processes between liquid and gas phases are (1) the calculation of Kol.diffusion of solute in the melt boundary layer, (2) interface An overall flux of species X can also be described usingreaction, and (3) diffusion of solute in the gas boundary layer. a liquid-side basis by the equation
The interface reaction is important for low pressure opera-tions, but its contribution to the overall mass transfer process NX 5 Kol
rl
MWl(xX 2 x*X) [A3]
at higher pressures (.atmospheric) is negligible. This is
METALLURGICAL AND MATERIALS TRANSACTIONS B VOLUME 32B, APRIL 2001—291
(a) (b)
(c) (d)
Fig. 7—Evaporations of solutes from (a) and (b) iron melt at 1873 K, and (c) and (d ) copper melt at 1473 K, with a gas flow rate Q 5 750 cm3/min.
where x*x is the mole fraction of X in the melt that wouldbe in equilibrium with the bulk concentration ( yX) of X inthe gas phase, and Kol is the overall mass transfer coefficientbased on the solute concentrations in the liquid phase. FromEq. [A3], one can obtain
1Kol
5rl(xX 2 x*X)
MWlNX5
rl
MWlF(xX 2 xXi)
NX1
(xXi 2 x*X)
NXG[A4]
An equilibrium distribution coefficient can be defined as
Kd,eq [ 1yX
xX2eq
[A5]
with a liquid-side basis:
x*X 5yX
Kd,eq[A6]
and with the equilibrium between the gas phase and the meltat the interface given by
xXi 5yXi
Kd,eq[A7]
Equations [A4], [A6], and [A7] can be combined to give
Fig. 8—Evaporation of cadmium from copper at 750 cm3/min: variation 1Kol
5rl(xX 2 xXi)
MWl NX1
rl
MWl 31yXi
Kd,eq22 1 yX
Kd,eq2
NX 4 [A8]of cadmium mole fraction (xCd ) in the melt with time with respect to itsinitial value (xCdo
).
292—VOLUME 32B, APRIL 2001 METALLURGICAL AND MATERIALS TRANSACTIONS B
The total standard free energy change of the process can beevaluated by
DG0 5 DG0X(pct)→Xl 1 DG0
Xl→Xg [A13]
5 RT ln 1100MWX
gx MWl2 1 DG0
Xl→Xg
where the first term represents the standard free energychange due to the process of changing X from a 1 masspercentage solution in the melt to a pure liquid state, whilethe second term represents the standard free energy changedue to the process of solute evaporation.
After converting from weight percentages to mole frac-tions, using the following formula,
[pct X] 5100MWX
MWlx [A14]
the following expression for Kd,eq is obtained:
Kd,eq 5 1yX
xX2eq
5100Keq MWX fX
MWl[A15]
It should be noted that x in Eq. [A14] is identical with thexX in Eq. [A15]. If Eq. [A15] is inserted into Eq. [A11], k8gnow becomes
k8g 5 1100Ptot Keq MWX fX
rlRT 2kg [A16]
Fig. 9—Evaporation of cadmium from copper at 1500 cm3/min: variation In the evaluation of the solute concentration x (in terms ofof cadmium mole fraction (xCd ) in the melt with time with respect to its mole fraction) in the melt, the following equation is used:initial value (xCdo
).
x 5MWl
100MWX
PX
ZKeq fX5
MWl
100MWX
yX(1 atm)
ZKeq fX
[A17]Furthermore, at steady state, the fluxes through each partof the system must be equal: 5
MWl
100MWX
yX
ZKeq fXNX(g) 5 NX(l) 5 NX [A9]
where Z is the “efficiency of gas purging” (Eq. 5).and, from Eqs. [A1], [A2], [A8], and [A9], the final relation To calculate Kol using Eq. [A10], values of DG8, kl , andfor Kol was obtained: kg are needed. In estimating kg , different physical situations
lead to different expressions (kg,b and kg,ms) for the cases ofevaporation of X into the bubbles and from the melt surface,1
Kol5
1kl
1 1rl /MWl
Ptot
RT2 1
Kd,eqkg[A10] respectively. Thus, there are two expressions for Kol, which
will be referred to as Kol,b and Kol,ms.Estimation of the activity coefficient (gX) of solute X is
required to evaluate the process, DG0X(pct)→Xl, in Eq. [A13].The first term on the right-hand side represents the liquid-
The value of gX, in a multicomponent solution of N solutesphase mass transfer resistance, while the second represents(numbered 1, 2, . . . N ), can be expressed as[15]the gas-phase mass transfer resistance. If we define k8g as
ln gX 5 ln gL 1 ln g 0X 1 «X1 x1 1 «X2 x2 1 ??? [A18]
k8g [ 1Ptot /RT
rl /MWl2Kd,eq kg [A11]
1 «N xN
then 1/k8g is the gas phase mass transfer resistance, which where «ij is the interaction coefficient between i and j basedhas a similar formulation to the liquid side resistance. In on mole fraction, gX
0 is the Raoult’s-law-based activity coef-order to obtain Kd,eq, the following three equations ([A12], ficient of the solute at infinite dilution (when xsolvent → 1[A13], and [A14]) are used. and x 5 xX → 0), and gL is the activity coefficient of the
The value of Keq , the equilibrium constant for the process melt (solvent) given byX (pct in liquid) → X (g), is given by
ln gL 5 212 o
N
j51oN
k51«jk xj xk [A19]
Keq 5PX
fX[pct X ]5
yX(1 atm)
fX[pct X ]5
yX
fX[pct X ]5 exp 12
DG0
RT 2Sigworth and Elliot[16] compiled data on the interaction coef-ficients in liquid iron or copper. The values of interaction[A12]
METALLURGICAL AND MATERIALS TRANSACTIONS B VOLUME 32B, APRIL 2001—293

coefficients based on weight percent (eij) are taken from these wherecompilations. In order to convert eij’s to «ij’s, the following Vb 5 0.075 r 1/2
orif G [A25]relationship is used:
and«ij 5 230
MWj
MWleij 1
MWl 2 MWj
MWl[A20]
db 5 213Vb
4p21/3
[A26]
A very important variable in the determination of kl (Eq.[9]) is DX2l, which was approximated by two means. where rorif is the radius of the lance orifice in centimeters.
The bubble velocity, Ub , was also estimated using several(1) Hayduk–Minhas equation[17] (valid for non-polar sol- methods, which are given subsequently. Again, the average
vents): value found is used in the calculations for kl.
(1) The motion of gas bubbles in liquids was characterizedby the following dimensionless parameters: Eotvos
DX2l 5
1.55 3 1028 T 1.29 1s 0.25l MWl
rl2
0.5
m0.92l V 0.23
l 1s 0.25X MWX
rX 20.42 [A21] number, Neo (Eq. [A27]), Morton number, NM (Eq.
[A28]), and bubble Reynolds number, NRe (Eq. [A29]).From a study of the available data on the velocity of therise of bubbles and their shapes, a generalized correlationwhere sl and sX are the surface tension of the moltenlinking Neo and NM to NRe was obtained and plotted bymetal and the solute, respectively, and ml is the viscosityGrace[21] for Newtonian liquids. Thus, an approximateof the molten metal.value of Ub was calculated from the NRe obtained from(2) Tyn–Calus equation[18] (also valid for nonpolar sol-this plot, withvents):
N eo 5gd 2
b(rl 2 rb)
sl[A27]
DX2l 5 8.93 3 1028TV 1/6
X
mlV 1/3l 1
s0.25l MWl
rl
s0.25X MWX
rX
20.6
[A22] NM 5gm4
l
rls3l
[A28]
NRe 5rldbub
ml[A29]where Vl and VX are the molar volumes at the boiling point
of the molten metal and the solute, respectively.(2) Assuming that the steady-state rising velocity of gasThe bubble diameter, db , was estimated using the formulas
bubbles occurs when the buoyant force equals the dragdescribed subsequently. The average values are used in theforce on the bubbles, Mandelson and Maneri[22] reportedcalculations for kl.the following equation with db . 1.4 mm:
(1) Sano and Mori[19] derived the following equation byconsidering the widely accepted concept that the outer Ub 5 !12sl
dbrl1
db
2 2 [A30]diameter of the lance orifice should be used in the esti-mation of db when liquid metals do not wet the lance
(3) For 1000 , NRe , 200,000, Ub for low-viscosity fluidsmaterial. In this case, the gas lance was made of alumina,can be estimated from Newton’s law:[23]
which is not wetted by liquid metals, so this equationwas applied.
Ub 5 1.75 !1gdb(rl 2 rg)
rl2 [A31]
db 5 F16sldorif
rlg 22
1 0.0242 (G2dorif)0.867G1/6
[A23]
The gas phase mass transfer coefficient for the bubbles(kg,b) was estimated using Eq. [11]. In this equation, DX2g ,where dorif is the lance orifice diameter, g is the accelera-which is in fact DX2Ar since the gas used was argon, cantion of gravity, and G is the volumetric gas flow rate.be predicted by applying the Chapman–Enskog theory.[24](2) Wraith and Kakutani[20] modified the equation originallyFor ideal monatomic gases,derived by Davidson–Schuler considering the velocity
potential and pressure field around the growing bubble.It was found that the relative pressure at the orifice DX2Ar 5
0.001858T 3/2
Ptot (cX2Ar)2 VX2Ar! 1
MWX1
1MWAr
[A32]reaches a maximum when the distance from the orificeto the bubble center becomes 1.5 times the equivalent where cX2Ar 5 0.5(cX 1 cAr) is the collision diameter, andradius of the bubble. This is taken to be the criterion VX2Ar the collision integral for an X-Ar mixture at thefor the cut-off of the gas supply to the bubble by closing dimensionless temperature (T*) for the Lennard–Jonesoff the neck between the orifice and the bubble. With potential. The terms cX and cAr are the molecular size param-the definitions of maximum bubble frequency ( f ) and eter for X and argon, respectively, and t is the attractivethe bubble volume (Vb), as given subsequently, the bub- potential depth. In order to evaluate the collision integral,ble diameter, db , can be estimated by Eq. [A24]: (t /kB) values must be calculated by the following equations:
1 tkB2
X2Ar
5 !1 tkB2
Ar1 tkB2
X
[A31]f 5 13.4 r 20.5orif 5
GVb
[A24]
294—VOLUME 32B, APRIL 2001 METALLURGICAL AND MATERIALS TRANSACTIONS B

P0X vapor pressure of solute (atm or Pa)1 t
kB2
X
5 1.15Tb, 1 tkB2
Ar
1.92Tm [A32] PX partial pressure of solute (atm or Pa)Peq equilibrium partial pressure of solute (atm
or Pa)andPexit
X exit partial pressure of solute (atm or Pa)Pr Prandtl numberT* 5 1kB
t 2X2Ar
T [A33]Q molar gas flow rate (mol/s)R radius of bubble or universal gas constant
(cm)(J/molK)where Tb and Tm are the boiling and melting points, respec-Re Reynolds numbertively. Then, the collision integral can be obtained from plotsSh Sherwood numberof VX2Ar vs T* available in the literature.[24] The calculationT temperature (K)of kg is treated in the Theory Section (Part C).t time (s)Ub bubble rise velocity (cm/s)
NOMENCLATURE Vb volume of bubble (cm3)gX activity coefficient of solute XAb interfacial contact area between bubble andrl density of melt (g/cm3)melt or area of bubble cm2
rX density of solute (g/cm3)Ams area of melt surface cm2
rg density of gas (g/cm3)DX2l diffusivity of X in the melt cm2/ssl surface tension of melt (dyn/cm)DX2g diffusivity of X in the gas phase (cm2/s)sX surface tension of solute (dyn/cm)db bubble diameter (cm)mg viscosity of solute (g/cm s)dorif diameter of orifice (cm)ml viscosity of melt (g/cm s)G volumetric gas flow rate (cm3/s)
g acceleration due to gravity (981 cm/s2)REFERENCESDG0 standard Gibbs free energy change (J/mol)
1. F. Feizollahi, W.J. Quapp, H.G. Hemphill, and S.J. Graffie: Report No.DG0X(pct)→X(l) standard Gibbs energy for solution of X to 1
EGG-MS-11211, Contract No. DE-AC07-761D01570, Idaho Nationalmass pct solution in melt (J/mol)Engineering and Environmental Laboratory, Idaho Falls, ID, July 1994.DG0
X(l)→X(g) standard Gibbs energy change for solute 2. E. Ozberk and R.I.L. Guthrie: Mater. Sci. Technol., 1985, vol. 1, pp.evaporation (J/mol) 12-18.
3. R. Ohno: Metall. Trans. B, 1991, vol. 22B, pp. 447-65.DG change of Gibbs free energy (J/mol)4. R.G. Ward and T.D. Aurini: J. Iron Steel Inst., 1996, Sept., pp. 920-23.Gr Grashof number5. R. Ward: J. Iron Steel Inst., 1963, vol. 201, pp. 11-15.fx Henrian activity coefficient6. K. Ito, M. Kishimoto, and K. Mori: Tetsu-to-Hagane, 1992, vol. 9,
H height of the melt (cm) pp. 1441-48.h vertical distance between the bubble and bot- 7. I. Barin and M. Modigell: Erzmetallurgy, 1986, vol. 39, pp. 618-23.
8. M. Hino, S. Wang, T. Nagasaka, and S. Ban-Ya: J. Iron Steel Inst.,tom of the melt (cm)1994, vol. 34, pp. 491-97.Kol,b overall mass transfer coefficient to bubbles
9. T.A. Engh: Principles of Metal Refining, Oxford University Press,(cm/s) New York, NY, 1992, pp. 171-217 and 315-31.Ke overall evaporation coefficient (cm/s) 10. A. Sarofim, M. Flemings, J. Tester, G. Senel, and J. Benavides: Appli-
cation of Solution Thermodynamics and Aerosol Dynamics to Enhanceke interface mass transfer coefficient (cm/s)Residue Segregation in Molten Metal Waste Processing, Idaho Nationalkg gas phase mass transfer coefficient (cm/s)Engineering and Environmental Laboratory, Idaho Falls, ID, July 1997.k8g normalized gas phase mass transfer coeffi-
11. R. Higbie: Trans. Inst. Chem. Eng., 1935, vol. 31, pp. 365-89.cient (cm/s) 12. P. Yim: Ph.D. Thesis, Massachusetts Institute of Technology, Cam-
kl liquid phase mass transfer coefficient (cm/s) bridge, MA, 1996.13. C.V. Drysdale, A.H. Ferguson, A.E.M. Geddes, A.H. Gibson, F.R.W.Kol,ms overall mass transfer coefficient for the melt
Hunt, Sir H. Lamb, and Sir G.I. Taylor: The Mechanical Propertiessurface (cm/s)of Fluids; A Collective Work, 2nd ed., Blackie & Son, Ltd., 1946.MX mass of the solute (g) 14. W.H. McAdams: Heat Transmission, 3rd ed., McGraw-Hill, New York,
Ml mass of the melt (g) NY, 1954, p. 180.15. A. Pelton and C. Bale: Metall. Trans. A, 1986, vol. 17A, pp. 1211-15.MWX molecular weight of the solute (g/gmol)16. G. Sigworth and J. Elliot: Can. Met. Q., 1974, vol. 13, p. 455.MWl molecular weight of the melt (g/mol)17. W. Hayduk and B.S. Minhas: Can. J. Chem. Eng., 1982, vol. 60, p. 295.NX overall molar flux of solute X (mol/cm2s)18. M.T. Tyn and W.F. Calus: J. Chem. Data, 1975, vol. 20, p. 106.
NX(c) molar flux of solute X in the interface 19. M. Sano and K. Mori: Trans. JIM, 1976, vol. 17, p. 344.(mol/cm2s) 20. K. Wraith and T. Kakutani: Chem. Eng. Sci., 1974, vol. 29, p. 1.
21. J. Grace: Trans. Inst. Chem. Eng., 1973, vol. 51, p. 116.NX(g) molar flux of solute X in gas phase (mol/22. C.C. Maneri and H.D. Mendelson: AIChE J., 1968, vol. 14, p. 295.cm2s)23. W. McCabe, J. Smith, and P. Harriott: Unit Operations of ChemicalNX(l) molar flux of solute X in liquid phase Engineering, 4th ed., McGraw-Hill, New York, NY, 1985.
(mol/cm2s) 24. G. Geiger and D. Poirier: Transport Phenomena in Metallurgy, Addi-son-Wesley, New York, NY, 1973.P pressure (atm or Pa)
METALLURGICAL AND MATERIALS TRANSACTIONS B VOLUME 32B, APRIL 2001—295