Interactions between mixing on various scales in stirred tank reactors
10
Chemical Em&e-ming Science, Vol. 47, No. 8, pp. 1839-1648, 1992. ooo!a-2509/92 ss.00 + 0.00 Printed in Great Britain. Q 1992 Pergamooa Press Ltd INTERACTIONS BETWEEN MIXING ON VARIOUS SCALES IN STIRRED TANK REACTORS J. BALDYGA’ and J. R. BOURNE’ Technisch-Chemisches Laboratorium, ETH, CH-8092 Ziirich, Switzerland (Receioed 29 August 1991; accepted 28 October 1991) Abstract-Fast. competitive-consecutive reactions exhibit product distributions which are influenced by micro- and macroscale concentration gradients in a reactor. If a reaction is run many times under identical conditions in a semi-batch reactor, except that different feed rates are used, the product distribution is constant at low feed rates, but indicates increasing non-uniformity of composition at higher feed rates. Competition between micromixing and reaction determines product distribution at low feed rates. The additional inhomogeneity appearing at higher feed rates signals a mixing constraint at scales larger than microscopic. The relevant scale is not the macroscopic one of the whole vessel, but rather a mesoscale reflecting the interaction of the plume of fresh feed with its surroundings. Dispersion of this plume has been calculated for homogeneous turbulence, as well as when the mean plume velocity and the turbulence properties in its vicinity were spatially varying. Micromixing and chemical reaction could then be calculated in the concentration field resulting from turbulent dispersion. The relative importance of meso- and micromixing could be expressed by the ratio of their time constants. The description of simultaneous meso- and micromixing developed here successfully predicted product distributions from fast diazo- coupling reactions which had been measured at two scales, two feed points, three concentration levels and various stirrer speeds. The model requires knowledge of the reaction kinetics and the flow field, but does not, however, contain any arbitrary parameters. 1. INTRODUCTION When the competitive, consecutive reactions ki A+B+R (1) kz R+B-*S (2) are sufficiently rapid relative to fluid miiing, more S and correspondingly less R are produced than in the slow or chemically controlled regime [l]. Fine-scale concentration gradients, signalling inadequate mo- lecular-scale homogeneity and slow micromixing, have been intensively studied: under commonly oc- curring conditions, they are caused by an insuffici- ently high rate of fluid engulfment [2]. Bulk-scale concentration gradients, indicating inadequate flow and turbulent diffusion and hence slow macromixing, have mainly been studied in the context of physical blending, e.g. definition and determination of bulk mixing time. The simultaneous occurrence of macro- and microscale gradients in a reactor is a field where much remains to be done. The present contribution orients itself to a particular situation-the stirred tank reactor with semi-batch operation-although the approach can be applied to mixing and reaction in other types of equipment. Defining the product distribution of eqs (1) and (2) by Xs, which is the fraction of the limiting reagent B present in the secondary product S, Xs becomes xs = 2cs/(c, + 2cs). (3) ‘Present address: Instytut Inzynierii Chemicznej i Pro- cesowei Politechniki, PL 00645 Warszawa, Polska. fAu<hor to whom-correspondence should be addressed. Considering semi-batch operation, where all condi- tions (e.g. temperature, stirrer speed, solution volumes and concentrations) are held constant, except for the feed time t/ of the B-rich solution, Xs is found to vary with t, as indicated in Fig. 1. For sufficiently slow addition (t, > t,), Xs is independent of feed rate, but nevertheless greatly in excess of the value correspond- ing to the chemical or kinetically controlled regime when the reactions are fast [3]. Product distribution then depends upon micromixing and is modelled ac- cordingly [2]. When, however, the feed time is shorter than a critical value, t,, it is observed that Xs increases gradually with increasing feed rate (Fig. 1, [3])_ This rise in X, signals an increasing level of macroscale inhomogeneity in the reactor. The critical feed time t, is not a precise quantity, but designates the transition in Fig. 1 from a constant to a variable product distri- bution: examples are given later. Experimentally, t, is related to the operating con- centration level, the reactor volume, the rotational stirrer speed, N, and the number of feed nozzles [4]. There is a strong increase in t, when scaling-up at Fig. 1. Product distribution (X,) as a function of feed (2,) for a semi-batch stirred tank reactor. 1839
-
Upload
independent -
Category
Documents
-
view
0 -
download
0
Transcript of Interactions between mixing on various scales in stirred tank reactors
Chemical Em&e-ming Science, Vol. 47, No. 8, pp. 1839-1648, 1992. ooo!a-2509/92 ss.00 + 0.00 Printed in Great Britain. Q 1992 Pergamooa Press Ltd
INTERACTIONS BETWEEN MIXING ON VARIOUS SCALES IN STIRRED TANK REACTORS
J. BALDYGA’ and J. R. BOURNE’ Technisch-Chemisches Laboratorium, ETH, CH-8092 Ziirich, Switzerland
(Receioed 29 August 1991; accepted 28 October 1991)
Abstract-Fast. competitive-consecutive reactions exhibit product distributions which are influenced by micro- and macroscale concentration gradients in a reactor. If a reaction is run many times under identical conditions in a semi-batch reactor, except that different feed rates are used, the product distribution is constant at low feed rates, but indicates increasing non-uniformity of composition at higher feed rates. Competition between micromixing and reaction determines product distribution at low feed rates. The additional inhomogeneity appearing at higher feed rates signals a mixing constraint at scales larger than microscopic. The relevant scale is not the macroscopic one of the whole vessel, but rather a mesoscale reflecting the interaction of the plume of fresh feed with its surroundings. Dispersion of this plume has been calculated for homogeneous turbulence, as well as when the mean plume velocity and the turbulence properties in its vicinity were spatially varying. Micromixing and chemical reaction could then be calculated in the concentration field resulting from turbulent dispersion. The relative importance of meso- and micromixing could be expressed by the ratio of their time constants. The description of simultaneous meso- and micromixing developed here successfully predicted product distributions from fast diazo- coupling reactions which had been measured at two scales, two feed points, three concentration levels and various stirrer speeds. The model requires knowledge of the reaction kinetics and the flow field, but does not, however, contain any arbitrary parameters.
1. INTRODUCTION
When the competitive, consecutive reactions
ki A+B+R (1)
kz R+B-*S (2)
are sufficiently rapid relative to fluid miiing, more S and correspondingly less R are produced than in the slow or chemically controlled regime [l]. Fine-scale concentration gradients, signalling inadequate mo- lecular-scale homogeneity and slow micromixing, have been intensively studied: under commonly oc- curring conditions, they are caused by an insuffici- ently high rate of fluid engulfment [2]. Bulk-scale concentration gradients, indicating inadequate flow and turbulent diffusion and hence slow macromixing, have mainly been studied in the context of physical blending, e.g. definition and determination of bulk mixing time. The simultaneous occurrence of macro- and microscale gradients in a reactor is a field where much remains to be done. The present contribution orients itself to a particular situation-the stirred tank reactor with semi-batch operation-although the approach can be applied to mixing and reaction in other types of equipment.
Defining the product distribution of eqs (1) and (2) by Xs, which is the fraction of the limiting reagent B present in the secondary product S, Xs becomes
xs = 2cs/(c, + 2cs). (3)
‘Present address: Instytut Inzynierii Chemicznej i Pro- cesowei Politechniki, PL 00645 Warszawa, Polska.
fAu<hor to whom-correspondence should be addressed.
Considering semi-batch operation, where all condi- tions (e.g. temperature, stirrer speed, solution volumes and concentrations) are held constant, except for the feed time t/ of the B-rich solution, Xs is found to vary with t, as indicated in Fig. 1. For sufficiently slow addition (t, > t,), Xs is independent of feed rate, but nevertheless greatly in excess of the value correspond- ing to the chemical or kinetically controlled regime when the reactions are fast [3]. Product distribution then depends upon micromixing and is modelled ac- cordingly [2]. When, however, the feed time is shorter than a critical value, t,, it is observed that Xs increases gradually with increasing feed rate (Fig. 1, [3])_ This rise in X, signals an increasing level of macroscale inhomogeneity in the reactor. The critical feed time t, is not a precise quantity, but designates the transition in Fig. 1 from a constant to a variable product distri- bution: examples are given later.
Experimentally, t, is related to the operating con- centration level, the reactor volume, the rotational stirrer speed, N, and the number of feed nozzles [4]. There is a strong increase in t, when scaling-up at
Fig. 1. Product distribution (X,) as a function of feed (2,) for a semi-batch stirred tank reactor.
1839

1840 J. BALDYGA and J. R. BOURNE
constant power per unit volume. It has not yet been possible to predict rc from basic information (reaction kinetics and flow field), nor to predict how rapidly Xs would increase with falling tl (Fig. 1) as macromixing becomes important (tY < tc). Such predictions are ob- jectives of the present work.
2. MESOSCALE MIXING
It might be thought that bulk blending-mixing freshly entered reagent with the whole tank con- tents-is the limiting step in mixing when t/ =z t,. Critical feed times are however roughly two orders of magnitude longer than blending times [4]. Moreover, reaction does not occur throughout the tank contents, but is highly localised: reaction zones (seen in de- colourisation reactions) are typically a few cen- timetres in length [3, 51. It is more realistic to consider the transport of reagents in the neighbourhood of the reaction zone, whereby turbulent exchange between freshly entered material and its surroundings occurs. This exchange is coarse-scale relative to the micro- mixing, but localised relative to bulk blending: it seems appropriate to term it mesoscale mixing.
Figure 2 shows the feed pipe for B-rich feed, having an internal diameter, d’, much smaller than the tank diameter D. With a volumetric flow rate Qe, the feed represents a point source of strength Qe. The concen- tration distribution, expressed by the volume fraction of B-rich feed, X,“, sufficiently far downstream from the feed-pipe exit (x = 0) is given by [6,7]
XE(r, 4 = & -tit-’
f exp 4D,x . ( > The local fluid velocity in the surroundings, U, and the turbulent diffusivity, D,, are taken as constants and molecular diffusion is neglected relative to turbulent dispersion (the respective diffusivities were here of the order of lo-’ and 10e4 rn’s-l, respectively). B-rich fluid is dispersed radially, transverse to the direction of the local plug flow, denoted by x, giving a bivariate normal distribution, whose variance grows with x ac- cording to [6, 73, i.e.
a: = 40,x/U. (5)
Denoting with t the time since B left the feed pipe, x and t are obviously related by
x = lit. (6)
Writing eq. (4) in terms oft, rather than x, the follow- ing characteristic time for turbulent dispersion, rD,
Fig. 2. Steady-state radial concentration distribution at any position (x) downstream from a feed pipe.
can be identified:
zr, = Q&D,. (7)
Since rg = L$/D,, the characteristic length scale for the initial dispersion of the reaction zone, L,, is de- fined by
L, = (Q,,/ii)0.5. (8)
Dispersion is local when LD -@ D, while a point source requires LD + d’. Some general characteristics of this classical description of turbulent dispersion when micromixing is also considered will now be given.
When SC Q 4000 and cBo P cAo, micromixing de- pends upon the mutual fine-scale engulfment of fluids A and B, characterised by the engulfment rate coeffi- cient, E, where [2]
E = O.O58(~/u)~,~ (9)
A characteristic time for micromixing, r,, can be defined by
ml = E-‘. (10)
The relative rates of meso- and micromixing will be measured by the ratio, Q, of their time constants
Q = r&,,, = EQJiiD,. (11)
Mesomixing controls when Q $- 1, micromixing is most important when Q -+ 1 and both mechanisms have to be considered when Q x 1. Comparison of the half-life of a chemical reaction with zD and z, yields the rate-controlling mechanism.
3. MESO- AND MICROMIXING INTERACTIONS:
HOMOGENEOUS TURBULENCE
3.1. Formulation
Homogeneous turbulence, where the flow proper- ties remain unchanged throughout the mixing pro- cesses, is the simplest case for full development of the principles outlined in the last section.
Equation (4) can be written using eq. (6) as
Xg(r, t) = z&t exp (&)*
The time t is the physical time and is the same as in the engulfment model of micromixing [2] which may also be written as T in dimensionless form, where
T = Et. (12)
The radius r is non-dimensionalised as follows to define R:
R = r/(Dr/E)1f2 = r/(TmD,)l’z.
Equation (4’) then becomes
(13)
X,o(R, T) = -&exp(- R2/4T) (14)
where Q-refer eq. (1 l)---is an important parameter. Equation (14) describes the radial and axial distribu- tion of the volume fraction of B-rich feed downstream from the feed pipe (Fig. 1). Micromixing and chemical reaction occur within this field.
Interactions between mixing on various scales in stirred tank reactors 1841
Equation (14) follows from eq. (4) which is the solution of the two-dimensional dispersion equation, valid when the motions of the individual B-rich fluid elements are mutually independent [6,7-J. This only happens some distance downstream from the exit of the feed pipe (x = t = T = 0). Experimentally this distance is, on an average, about 7d’ [SJ. The dimen- sionless time T,(R), when X;(R) decreases below one, signifying the time when eq. (14) starts to have a phys- ica1. meaning, follows by setting Xs = 1 to give the following relationship between To and R:
To = $ exp (- R2/4To). (15)
This implies that the unmixed fluid emerging from the feed pipe mixes initially at its outer edge and the last part to mix is at its centre, where R = 0.
For subsequent micromixing computations the radial variation of X$ at any axial position will be expressed in discrete form by defining n rings in R- space. The radii will be chosen so that each ring contains the same amount of B, Qs/n, which is inde- pendent of time and axial position. Defining rl and ri+ r as the inner and outer radii of any ring, then
s r‘ + 1
27cr.Z QL3 rX,Odr = - ti n
(16)
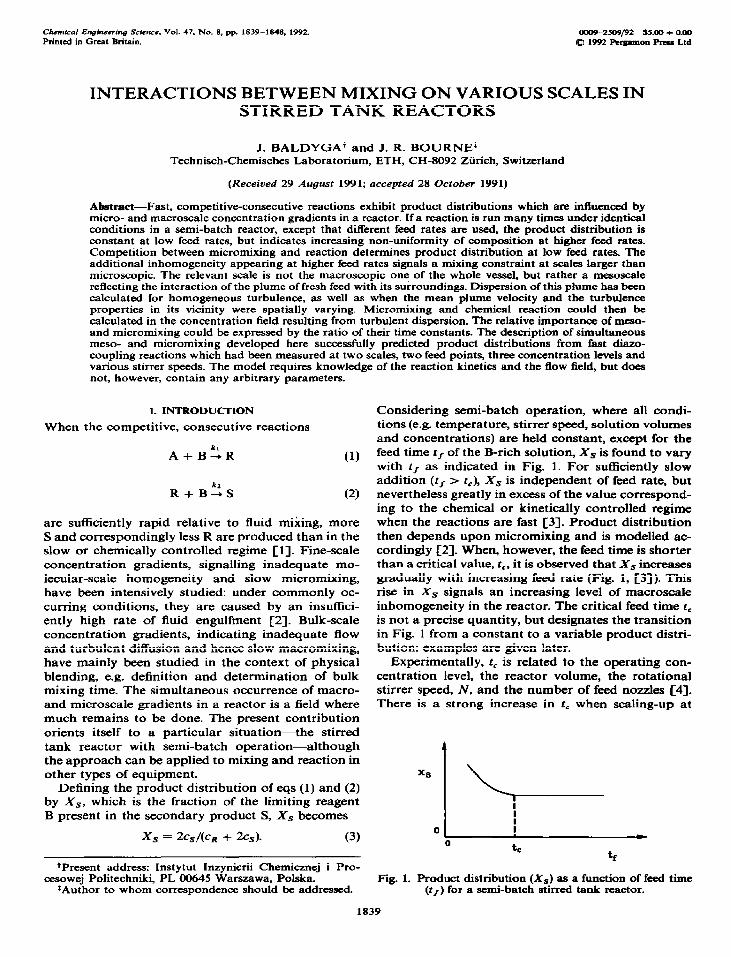
where X2 is given by eq. (4). Equation (16) permits the radii to be calculated for a chosen value of n. Ex- change of B-rich fluid between rings is excluded, which is the only simplification having a physical character--or closure approximation-needed to cal- culate simultaneous meso- and micromixing. Three rings are sketched in Fig. 3 using physical space (x- direction of local plug flow, r-direction of transverse turbulent dispersion). The inner and outer radii of a ring grow as (D,t)0.5, and its cross-sectional area as D,t.
When the rate of micromixing is controlled by fine-scale fluid engulfment [2], two independent types of equation may be developed [9]. The first expresses the rate of growth of the volume of the well-mixed reaction zone and can be modified to give the volume fractions of A- and B-rich fluids in this zone, denoted by X,, and Xs, as functions of time. The second is a mass balance for each substance in the reaction zone, containing its rates of incorporation by engulf- ment and of formation. These two principles were applied to modelling the simpler plug-flow reactor [2] and can also be used for the situation shown in Fig. 3.
I I x-d=0
:
Fig. 3. Schematic diagram of three rings.
The flow rate of the B-rich homogeneous mixture, forming the reaction zone, is Gs at any axial position x or time t in any one ring. Eddy engulfment occur- ring near the Kolmogorov scale [2] causes ps to grow when engulfment between A-rich and B-rich zones occurs, whereas when the eddies are alike, the mixing of A with A (or B with B), so-called self-engulfment causes no micromixing [2]. Hence, the reaction zone grows according to
dtis
dt = EtisX, = Eri,(l - X,). (17)
The volume fraction and local flow rate of well-mixed B-rich fluid are related through
xs= VB
7rP(r?+, + r:) (18)
where ri and ri + I are the inner and outer radii of any ring i.
Expansion of the rings occurs and, since ri is locally constant, r* - cr* - t [eq. (5)]. Equation (18) may be written as
xg = r&//4t (1%
where the proportionality constant fi is constant--see eq. (20).
/?I - iiD,.
Equation (17) now becomes
1 dtis - - = EX_,X,. fit dt
(20)
(21)
Differentiation of eq. (19) gives
dX, 1 dTi, Xa ---.
dt = p dt t
Substituting from eq. (21) into eq. (22) leads to
dXn -= dt
EX,X, - +. (23)
The reaction zones are formed from small elements of B-rich fluid which mix with their A-rich surroundings by engulfment. Until t > To/E, however, the local environment is still B-rich and Xs remains at one. [This was already discussed in connection with eq_ (15).] The integration of eq. (23) is initiated when t = To/E, for which Xs = 1. The first and second terms on the right-hand side of eq. (23) correspond to micromixing and dilution of the environment for micromixing by radial expansion, respectively.
Locally, within any ring, micromixing proceeds ac- cording to the engulfment model, including possible self-engulfment, given by [2]
dc j - = E(1 - Xs)(<c,> - c,) + rj dt
(24)
where c, and <cj> are the concentrations of j in the already mixed zone and in its surroundings, respect- ively, and the chemical kinetics determine the source term r,.
1842 J. BALDYGA and J. R. BOURNE
The modelling of meso- and micromixing in homo- geneous turbulence is simplified by the constancy of hydrodynamic quantities (a?, E, E and D,). Micromix- ing-including any chemical reaction-takes place within surroundings whose local composition de- pends upon mesoscale mixing. The local volume frac- tion of the material B emerging from the feed pipe with a flow rate QB is given by eqs (4) and (4’) and in a generalised form by eq. (14). The dimensionless parameter Q is important and is the ratio of character- istic times for meso- and micromixing. The concentra- tion of any reactant or product as a function of time or position downstream from the feed pipe is found by integrating simultaneously eqs (23) and (24), which are initiated for each radially discretised ring at the time given in eq. (15). Integration is along a line of constant R/T’@, corresponding to the positions of an element of B-rich fluid which has been acted on by turbulent radial dispersion. Equation (23) keeps track of changes in XB resulting from micromixing and turbu- lent dispersion. Upon integration it supplies the value of X, as a function of time for inclusion in eq. (24). Radially averaging the contents of each ring gives the mean composition at any position downstream from the feed pipe.
3.2. Results: homogeneous turbulence The first reaction [eq. (l)] is regarded as instan-
taneous, so that A and B do not coexist. Their concen- trations are found from a simple transformed variable as explained earlier [2]. An initial stoichiometric ratio of 1 mol B to 1.05 mol A and a volume ratio c( of one part of B-rich solution added to 10 parts of A-rich solution are considered. Semi-batch operation is simulated by discretising the feed addition into 20 equal parts [2]_ Integration of eqs (23) and (24) is made with a step length of 0.005 in units of T [2]. Transverse variations in the reacting fluid are dis- cretised by considering 10 concentric rings. Integra- tion is stopped when at any radial position the limiting reagent B is fully consumed. This occurred first at the edge (maximum radius) of the reaction zone and was completed on the centre line (r = 0). The shape of this zone showed, therefore, radial dispersion shortly after the feed pipe (as shown in Fig. 2 for the case of a non-reacting substance), but later the opposite
__._ 17.6 -
16.0 -
R ULS-
._______-.--.-.-----.__._._.__
..-&o,Qdo --.-__
10.0 - .-” %_
G-.B-o.l --..._
76 - __ --,
‘X.
6.0 - 'y--10. Q=w ‘h.
‘--lo. \ %.
ad- Q-o.1 ‘, \
oa-#- ?
cl 16 30 46 60 5s 90 101 la0
T
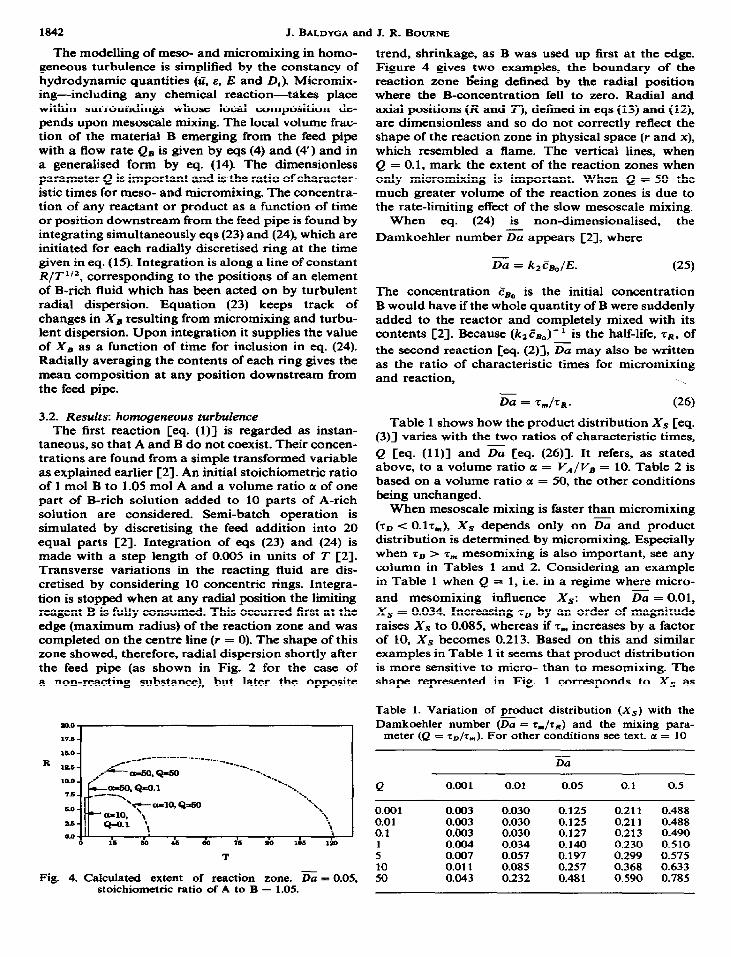
Fig. 4. Calculated extent of reaction zone. z = 0.05, stoichiometric ratio of A to B = 1.05.
trend, shrinkage, as B was used up first at the edge. Figure 4 gives two examples, the boundary of the reaction zone king defined by the radial position where the B-concentration fell to zero. Radial and axial positions (R and 7’), defined in eqs (13) and (12), are dimensionless and so do not correctly reflect the shape of the reaction zone in physical space (r and x), which resembled a flame. The vertical lines, when Q = 0.1, mark the extent of the reaction zones when only micromixing is important. When Q = 50 the much greater volume of the reaction zones is due to the rate-limiting effect of the slow mesoscale mixing.
When eq. (24) is non-dimensionalised, the
Damkoehler number % appears [2], where
i% = kp$,/E. (25)
The concentration EBO is the initial concentration B would have if the whole quantity of B were suddenly added to the reactor and completely mixed with its contents [2]. Because (k2EBo)- 1 is the half-life, zR, of the second reaction [eq. (2)], G may also bc written as the ratio of characteristic times for micromixing and reaction,
Da = T&R. (26)
Table 1 shows how the product distribution Xs [eq. (3)] varies with the two ratios of characteristic times,
Q [eq. (ll)] and % [eq. (26)]. It refers, a-s stated above, to a volume ratio a = VA/V, = 10. Table 2 is based on a volume ratio a = 50, the other conditions being unchanged.
When mesoscale mixing is faster than micromixing - (T,, < O.lz,), Xs depends only on Da and product distribution is determined by micromixing. Especially when ~~ > z,,, mesomixing is also important, see any column in Tables 1 and 2. Considering an example in Table 1 when Q = 1, i.e. in a regime where micro-
and mesomixing influence X,: when % = 0.01, Xs = 0.034. Increasing 7D by an order of magnitude
raises XS to 0.085, whereas if r,,, increases by a factor of 10, Xs becomes 0.213. Based on this and similar examples in Table 1 it seems that product distribution
is more sensitive to micro- than to mesomixing. The
shape represented in Fig. 1 corresponds to Xs as
Table 1. Variation of product distribution (X,) with the
Damkoehler number (Da = T,,,/T~) and the mixing para- meter (Q = 7J7+,,). For other conditions see text. a = 10
iG
Q 0.001 0.01 0.05 0.1 0.5
0.001 0.003 0.030 0.125 0.211 0.488 0.01 0.003 0.030 0.125 0.211 0.488 0.1 0.003 0.030 0.127 0.213 0.490
: 0.004 0.034 0.140 0.230 0.510 0.007 0.057 0.197 0.299 0.575
:: 0.011 0.085 0.257 0.368 0.633 0.043 0.232 0.48 1 0.590 0.785

Interactions between mixing on various scales in stirred tank reactors 1843
Table 2. Variation of product distribution (X,) with the Damkoehler number (z) and the mixing parameter (Q).
Other conditions: as in Table 1 except a = 50
Do
tial flow is zero. The velocity along the streamtube U, varies with x because of convergence and divergence of the flow, but is constant across it (du,/& = 0). The radial velocity associated with these changes in u, follows from the continuity equation
Q
0.001 0.01 0.1 1 5 10 SO
0.001 0.01 0.05 0.1 OS
0.006 0.052 0.187 0.283 0.540 0.006 0.052 0.187 0.283 0.540 0.006 0.053 0.190 0.287 0.545 0.008 0.07 1 0.230 0.333 0.590 0.025 0.164 0.392 0.504 0.728 0.046 0.244 0.496 0.602 a790 0.157 0.488 0.707 0.775 0.880
- a function of Q - ’ at constant Da and is at least qualitatively in agreement with the results in Tables 1 and 2.
4. MESO- AND MICROMIXING INTERACTIONS: lNHOMOGENEOl_JS TURBULENCE
4.1. Zntroduction Measured product distributions X,, when t, .c tC
(Fig. 1) as well as in the asymptotic region where t/ > tc, are available [lo] for the semi-batch opera- tion of two stirred tank reactors. Two feed points in the centre of the discharge stream from a Rushton turbine and at different radial positions were used in the experiments. Many recent hydrodynamic studies of stirred tanks have shown that the radial and tan- gential velocities, turbulent velocity fluctuations and rates of turbulent energy dissipation decay in the radial direction [ 1 l]_ Product distributions referring to this inhomogeneous flow iield are inappropriate to test the theoretical description of meso- and micro- mixing given in Section 3. For example, even when using a feed point just below the surface, reacting fluid moved down sufficiently far towards the impeller that it encountered rising turbulence levels [lo]. Thus, the model will first be extended to handle inhomogeneous turbulence before being compared with experimental results from stirred tank reactors.
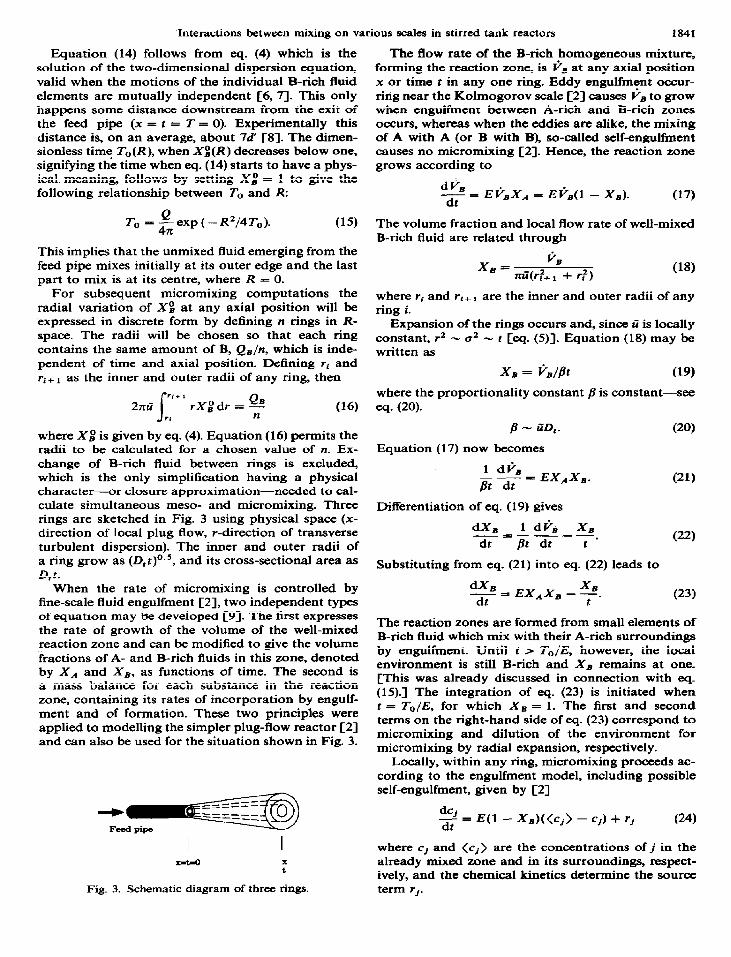
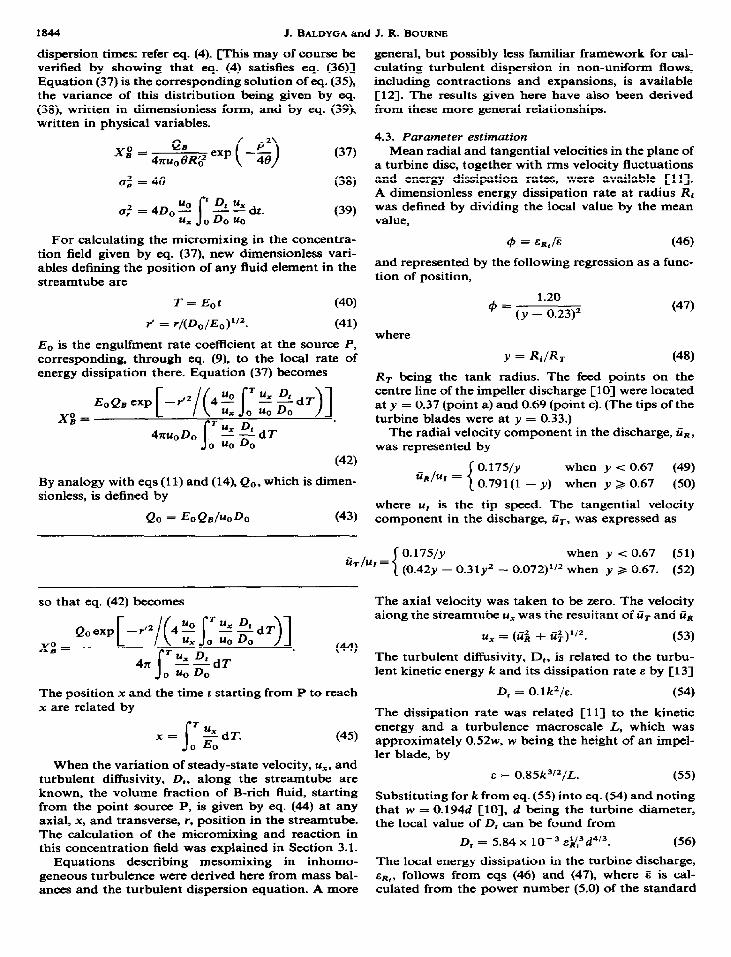
4.2. Formulation Figure 5 shows a streamtube for converging or
diverging flow. Fluid density is constant, flow is steady and the coordinate system has its origin at the source P. The distance from P along the streamline is x and r is measured normal to the streamline at any position x. It will be sufficient to consider axisym- metric turbulent dispersion in the r-direction. Tangen-
Fig. 5. Streamtube for converging or diverging flow. P = source or feed pipe.
~+$+$o
r au, u,= -2%
An overall mass balance on the streamtube gives
U&g = u,R;’ (29)
where R: is the radius of the tube at any position x (Fig. 5).
Mixing on the mesoscale, brought about by turbu- lent radial dispersion, may be described by
(30)
The turbulent diffusivity D, is assumed to vary along, but not across the streamtube, so that D, depends on x.
To follow micromixing and reaction in the time domain, eq. (30) will be transformed (in a number of stages) to express c as a function of t, rather than x.
dt = dx/u, (31)
p = r/R& (32)
Equation (32) introduces a dimensionless radial coor- dinate, p, based on the radius of the streamtube at any position x.
Appendix 1 shows that the left-hand side of eq. (30) may be written as &/at and the whole equation be- comes
(33)
where again D, depends upon position (x) and, through eq. (31) on time (r).
Appendix 2 introduces, as reference value of D,, its value D, at the source or feed point P and transforms the time t to a dimensionless value 0, giving
s * Dt ux - - dt.
ODOUO (34)
When eq. (33) is also expressed in terms of the dimen- sionless, transformed time 0, it becomes (Appendix 2)
ac I d ac as=pap Pap * ( > (35)
This is very similar to the dispersion equation ap- plicable to homogeneous turbulence, which (written in dimensional form) is
(36)
and whose solution is Gaussian for sufficiently long
1844 J. BALDYGA and J. R. BOURNE
dispersion times: refer eq. (4). mhis may of course be verified by showing that eq. (4) satisfies eq. (36)] Equation (37) is the corresponding solution of eq. (35), the variance of this distribution being given by eq. (38), written in dimensionless form, and by eq. (39), written in physical variables.
xi = QB P2 ( > -- 47cuofYK$ exp 40
(37)
63 = 48 (38)
(3%
For calculating the micromixing in the concentra- tion field given by eq. (37), new dimensionless vari- ables defining the position of any Auid element in the streamtube are
T= Eat (40)
r’ = r/(D,/E,)“*. (41)
E. is the engulfment rate coefficient at the source P, corresponding, through eq. (9), to the local rate of energy dissipation there. Equation (37) becomes
xp= EoQBexp[-r’z/(4~~~~ $dT)]
47ruo D,,
(42)
By analogy with eqs (11) and (14), Qo. which is dimen- sionless, is defined by
Qo = EoQs/uoDo (43)
general, but possibly less familiar framework for cal- culating turbulent dispersion in non-uniform flows, including contractions and expansions, is available [12]. The results given here have also been derived from these more general relationships.
4.3. Parameter estimation Mean radial and tangential velocities in the plane of
a turbine disc, together with rms velocity fluctuations and energy dissipation rates, were available [ll]. A dimensionless energy dissipation rate at radius R1 was defined by dividing the local value by the mean value,
and represented by the following regression as a func- tion of position,
d= 1.20
(y - 0.23)* (47)
where
Y = &IRr (48)
RT being the tank radius. The feed points on the centre line of the impeller discharge [lo] were located at y = 0.37 (point a) and 0.69 (point c). (The tips of the turbine blades were at y = 0.33.)
The radial velocity component in the discharge, &, was represented by
tiR/UI = {
0.175/y when y c 0.67 (49)
0.791(1 - y) when y 2 0.67 (50)
where u, is the tip speed. The tangential velocity component in the discharge, I&-, was expressed as
tiT/u, = 0.175/y when y < 0.67 (51)
(0.42~ - 0.31~~ - 0.072)“* when y > 0.67. (52)
so that eq. (42) becomes
x = Qoexp[-r”/~~~~~~d~)] B
s
T& D, 471 --dT
o uo Do
(44)
The position x and the time t starting from P to reach x are related by
c =u x= $ dT. (45)
Jo fro
When the variation of steady-state velocity, uxr and turbulent diffusivity, D,, along the streamtube are known, the volume fraction of B-rich fluid, starting from the point source P, is given by eq. (44) at any axial, x, and transverse, r, position in the streamtube. The calculation of the micromixing and reaction in this concentration field was explained in Section 3.1.
Equations describing mesomixing in inhomo- geneous turbulence were derived here from mass bal- ances and the turbulent dispersion equation. A more
The axial velocity was taken to be zero. The velocity along the streamtube u, was the resultant of iir and tiR
11, = (tii + f$)l’2. (53)
The turbulent diffusivity, D,, is related to the turbu- lent kinetic energy k and its dissipation rate E by [13]
D, = O.lk*/&. (54)
The dissipation rate was related [l l] to the kinetic energy and a turbulence macroscale L, which was approximately 0.52w, w being the height of an impel- ler blade, by
E = 0.85kJ/*/L. (55)
Substituting for k from eq. (55) into eq. (54) and noting that w = 0.194d [lo], d being the turbine diameter, the local value of D, can be found from
D = 5 84 x lo-” &{3d4’3. f . (56)
The local energy dissipation in the turbine discharge, es,. follows from eqs (46) and (47), where B is cal- culated from the power number (5.0) of the standard
Interactions between mixing on various scales in stirred tank reactors 1845
Rushton turbine:
I = 5N3d5/V. (57)
The engulfment rate coefficient, E, in the micromix- ing equation (24) is position-, and therefore also, time- dependent through eq. (9), i.e. E N &{/,‘. A reference value E. at the source P is chosen, so that the Damkoehler number for inhomogeneous turbulence becomes
- Da,, = k2Cs,/Eo (58)
whilst in dimensionless form eq. (24) is now -
(59)
where the dimensionless T is given by eq. (40).
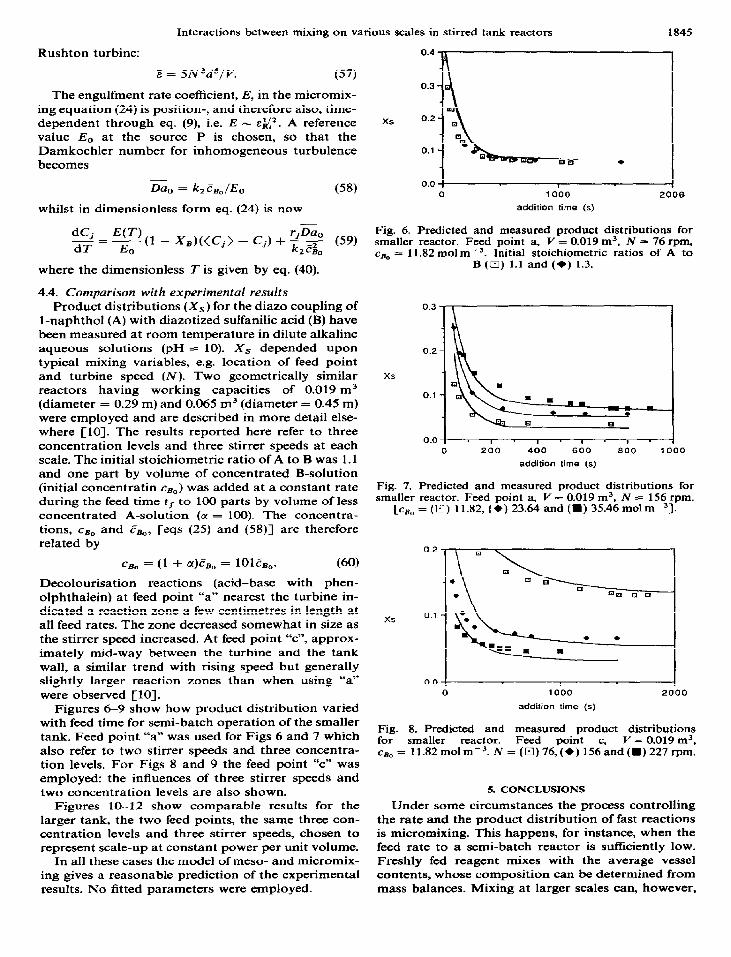
Fig. 6. Predicted and measured product distributions for smaller reactor. Feed point a, I’ = 0.019 m3, N = 76 rpm, cs, = 11.82 mol mM3. Initial stoichiometric ratios of A to
B (Ei) 1.1 and (q) 1.3.
4.4. Comparison with experimental results
Product distributions (X,) for the diazo coupling of 1-naphthol (A) with diazotized sulfanilic acid (B) have been measured at room temperature in dilute alkaline aqueous solutions (pH = 10). X, depended upon typical mixing variables, e.g. location of feed point and turbine speed (N). Two geometrically similar reactors having working capacities of 0.019 m3 (diameter = 0.29 m) and 0.065 m3 (diameter = 0.45 m) were employed and are described in more detail else- where [lo]. The results reported here refer to three concentration levels and three stirrer speeds at each scale. The initial stoichiometric ratio of A to B was 1.1 and one part by volume of concentrated B-solution (initial concentratin cBO) was added at a constant rate during the feed time tl to 100 parts by volume of Iess concentrated A-solution (CY = 100). The concentra- tions, cs,, and Es,,, [eqs (25) and (SS)] are therefore related by
XS
o.o! . I . 1 . I . , . I 0 200 400 600 800 3 000
addition time (s)
Fig. 7. Predicted and measured product distributions for smaller reactor. Feed point a, Y = 0.019 m3, N = 156 rpm.
[c, = (IX) 11.82, (+) 23.64 and (I) 35.46 mol m-“1.
c aa = (1 + cI)E& = lOlFe,. (60)
Decolourisation reactions (acid-base with phen- olphthalein) at feed point “a” nearest the turbine in- dicated a reaction zone a few centimetres in length at all feed rates. The zone decreased somewhat in size as the stirrer speed increased. At feed point “c”, approx- imately mid-way between the turbine and the tank wall, a similar trend with rising speed but generally slightly larger reaction zones than when using “a” were observed [lo].
Figures 6-9 show how product distribution varied with feed time for semi-batch operation of the smaller tank. Feed point “a” was used for Figs 6 and 7 which also refer to two stirrer speeds and three concentra- tion levels. For Figs 8 and 9 the feed point “c” was employed: the influences of three stirrer speeds and two concentration levels are also shown.
_._ , 0 1000
addition time (s)
2000
Fig. 8. Predicted and measured product distributions for smaller reactor. Feed point c, V = 0.019 ms, ca, = 11.82molm-3.N =(El)76,(+) 156and(m)227rpm.
5. CONCLUSIONS
Figures 10-12 show comparable results for the Under some circumstances the process controlling larger tank, the two feed points, the same three con- the rate and the product distribution of fast reactions centration levels and three stirrer speeds, chosen to is microtixing. This happens, for instance, when the represent scale-up at constant power per unit volume. feed rate to a semi-batch reactor is sufficiently low.
In all these cases the model of meso- and micromix- Freshly fed reagent mixes with the average vessel ing gives a reasonable prediction of the experimental contents, whose composition can be determined from results. No fitted parameters were employed. mass balances. Mixing at larger scales can, however,
X.3
_._ . 0 1000
addition time (s)

1846 J. BALDYGA and J. R. BOURNE
o.o! - , . , . , . , . 0 1000 2000 3000 4000 5000
addition time (s) O.O ;I00
addition time (s)
Fig. 9. Predicted and measured product distributions for smaller reactor. Feed point c. V = 0.019 m5, N = 156 rpm.
Fig. 12. Predicted and measured product distributions for
ic, = (El) 11.82, and (I) 35.46 molm-3]. larger reactor. Feed point c. V = 0.065 m3, N = 117 rpm.
cc,= (n) 11.82, (+) 23.64 and (I) 35.46 mol m-j].
0.10
0.08
XS 0.06
0.04
0.02 1 0
I I
1000 2000 3000 41 D
addition time (5)
Fig. 10. Predicted and measured product distributions for larger reactor. Feed point a, V = 0.065 mJ1 N = 117 rpm
[ccg, = (El) 11.82, and (e) 23.64molm-3].
xs
O.O ~00 addition time (s)
Fig. 11. Predicted and measured product distributions for larger reactor. Feed point c, V = 0.065 m3, cg, = 11.82
molm-3. N = (El) 57. (*) 117 and (I) 169 rpm.
also influence fast reactions. This arises in the semi- batch reactor when the feed rate is increased relative to the micromixing-controlled case. Concentration gradients on what has been termed the mesoscale become important. This was demonstrated by deter- mining the concentration field within which micro- mixing occurs from equations describing turbulent dispersion in the surroundings of the localised reac- tion zone (mesomixing), rather than over the whole vesssel (macromixing).
A point source, e.g. a feed pipe in a reactor, was considered and, as newly entered material was trans-
ported by the bulk flow in the vessel away from this source, turbulent dispersion transverse to a local streamline occurred. This mesomixing has been cal- culated from an eddy-diffusion type of model for both homogeneous and inhomogeneous turbulence. These two cases differed depending upon whether the local velocity along the streamline and the turbulence prop- erties (turbulent diffusivity and energy dissipation rate) were constant or variable. The interaction be- tween micro- and mesomixing depended upon the ratio, Q, of their time constants. The product distribu- tion of fast, competitive-consecutive chemical reac- tions depended upon Q and Damkoehler number, which is a ratio of characteristic times for micromix- ing and chemical reaction. Macromixing at the scale of the vessel did not need to be included when ap- plying the meso-/micromixing model to experiments made in stirred tank reactors of 0.019 and 0.065 m3 capacities. No parameters were fitted and the product distribution could be satisfactorily predicted from the reaction kinetics and the flow field when operating at two scales and with two feed points located at differ- ent radial positions in the turbine discharge and with various stirrer speeds and three levels of concentra- tion. These results were obtained using the analysis of turbulent dispersion developed in Section 4 to ac- count for spatial variations of the turbulent diffus- ivity, the energy dissipation rate and the velocity, which cause divergence and convergence of the streamtube. All these inhomogeneities occur in stirred tanks and the simpler model, applicable to homo- geneous turbulence, should not be applied to tanks. An illustration of this conclusion can be given in the context of scale-up at constant power per unit volume. It will first be supposed that turbulence is homogen-
eous. From eqs (9) and (25) it follows that Da would then be constant and that product distribution would become constant provided Q were held constant_ Equations (11) and (56) show that this requires
QB - ds13 or, applied at the critical condition (Fig. 1) that t, - d413. Experiments have shown however that LL - dBf3 [3,4]. These referred, of course, to in-

Interactions between mixing on various scales in stirred tank reactors 1847
homogeneous turbulence_ The decrease of energy dis- sipation rate and turbulent diffusivity along a stream- line together with the divergence of the decelerating flow, which reduces the concentration gradient for turbulent dispersion, were the likely reasons for the larger exponent than would be expected for homo- geneous flow.
i, B constant reagents, 1-naphthol and diazotized sul- fanilic acid
ci
ci d d D
D,
Do E
Eo
.i k
kz
concentration of B in feed stream concentration of B in reactor after feed has mixed with vessel contents concentration of substance j dimensionless concentration of substance j stirrer diameter feed-pipe diameter tank diameter turbulent diffusivity value of D, when x = 0 engulfment rate coefficient value of E when x = 0 any substance
L
LB n N
:
QB T r’, R
Ri
‘.i RT
K
R, S
t, T
TO
2,
tf
G u.a!
turbulent kinetic energy per unit mass second-order rate constant for formation of secondary product turbulence macroscale length scale for turbulent dispersion number of rings stirrrer rotational speed source, location of feed point ratio of characteristc times for dispersion and micromixing volumetric feed rate of B-rich solution radial coordinate transverse to streamline dimensionless radial coordinates radial position in impeller discharge stream rate of formation of substance j by reaction radius of tank radius of streamtube at position x primary and secondary reaction products physical and dimensionless times dimensionless time when XB = 1 critical feed time
UT
V
3 vB
feed time of B-rich solution velocity and position-dependent fluid velo- city along streamline value of u, when x = 0 radial velocity at position r stirrer-tip speed ( = nNd) radial fluid velocity in impeller discharge stream tangential fluid velocity in impeller dis- charge stream capacity of stirred tank reactor volume of j-rich solution volumetric flow rate of completely mixed B-rich fluid
W height of turbine blade
NOTATION
coordinate measured along streamline volume fraction of A-rich fluid in the reac- tion zone volume fraction of B-rich fluid in the reac- tion zone volume fraction of B-rich fluid due to turbu- lent dispersion yield of secondary reaction product dimensionless radial position in impeller discharge stream
Greek letters a volume ratio ( = VA/V,)
B constant & rate of dissipation of turbulent kinetic
energy per unit mass
: average value of E in whole tank dimensionless transformed time
V kinematic viscosity
P dimensionless radial coordinate u2 variance of distribution of composition
rD* tm characteristic times for dispersion and mi- cromixing
ZR characteristic time for reaction
9 dimensionless energy dissipation rate
Dimensionless numbers
Da Da, SC
Cl1
c21
c31
c41
CSI
Ml
c71
PI
c91
Cl01
Cl11
WI
Cl31
Damkoehler number
value of G when x = 0
Schmidt number
REFERENCES
Levenspiel, O., 1972, Chemical Reaction Engineering, Chap. 10. Wiley, New York. Baldyga, J. and Boume. J. R., 1989, Simplification of micr&xing calculations. Chem. En& i 42, 83, 93. Boume, J. R. and Hilber, C. P., 1990, The productivity of micromixing-controlled reactions: effect of feed di& tribution in stirred tanks. Chem. Engng Res. Des. 68, 51. Boumo, J. R. and Thoma, S., 1991, Some factors detar- mining the critical feed time of a semi-batch reactor. Chem. Engng Res. Des. 69. 321. Rice, A. W.. Toor, H. L. and Manning, F. S., 1964, Scale of mixing in a stirred vessel. A. I. Ch. E. J. IO, 125. Hinze, J., 1975, Turbulence, Chap. 5. McGraw-Hill, New York. Sherwood, T. K., Pigford, R. L. and Wilke, C. R., 1975, Mass Transfer, Chap. 4. McGraw-Hill, New York. Hartung, K. H. and Hiby, J. W., 1973, Untersuchung der Quer- und L%ngsmischung im Kreislaufrcaktor mit Hi6von Entftirbu&metho&. Chem. Ing. Techn. 45. 522. Baldyga, J. and Boume, J. R., 1990, Comparison of engulfment and IEM micromixing models. Chem. Engng J. 45, 25. Thoma, S., 1989, Interactions between macro- and mi- cromixing in stirred tank reactors. Dissertation No. 9012, ETH, Zilrich. Wu, H. and Patterson, G. K., 1989. Laser-Doppler measurements of turbulent-flow oarameters in a stirred mixer. Chem. Engng Sci. 44, 2267-2221. Hunt, J. C. R.. 1985. Turbulent diffusion from sources in complex flows. A. Rev. Fluid Mech. 17, 447-85. Bradshaw, P., Cebeci, T. and Whitelaw. J. H., 1981, Engineering Calculation Methods ]or Turbulent Flow. Academic Press, London.
1848 J. BALDYGA and J. R. BOURNE
APPENDIX 1: DERIVATION OF EQ. (33) here at/& = 0 and from eq. (32) ap/dr = l/R:,
Equation (30) expresses the concentration in a streamtube as a function of x and r, which has to be transformed to a function of t and p.
ac U, ac “‘;s;:=E;ap.
The left-hand side of eq. (30) is the sum of eqs (AS) and (A7):
ac ac ac ux~+u.-z$=t.
dt = dx/u,
p = r/R>
where a is a constant. Now,
From eq. (31)
ac ac at ac ap -_--+---_. ax at ax ap ax
at i _=_ ax U,
from eq. (32)
ap -r aR:
ax=R:Zax
and from eqs (29) and (28)
aR: --(I au, au, -= ax --= ~R;u: ax rR;u:’
Substituting eq. (A4) into eq. (A3) using eq. (29)
ap - uI ax=R:u,.
Equation (A 1) becomes
ac ac U, ac “I-=---;-.
ax at Rx ap
Similarly,
ac ac at ac ap
ar’ atar+-- ap ar
(30)
(31)
(32)
(29)
(Al)
(A2)
(A3)
(A4)
(A5)
(A@
(A7)
The right-hand side of eq. (30) can be transformed using eqs (32) and (A7),
ac I ac _=-- ar R; ap
Equation (30) becomes with the use- of cq. (29)
ac _=---- at
WI
(A9)
(33)
APPENDM 2: DERIVATION OF RQ. (35) D, and Y, in eq. (33) are known functions of x and, through
eq. (31), also of t. Defining 0 by
d,+:dt 0 0
(AlO)
the right-hand side is a function oft allowing 0 to be found by integration. Substituting in the left-hand side of eq. (33) gives
D, u, ac ---=---- R’: llo ae
which simplifies to eq. (35)
Equation (AlO) upon integration gives eq. (34).
(35)