
Microwave Initiated Atomic Spectra from Select Atomic Species
Upload
khangminh22Category
view
6download
0
O P E R A T I N G v o 1
EXPERIENCET ▼ H -M- M JL ---------------- {^'*ое4ес&*1^у<У/1е*г*г&, 4-<$ &*rve 1963_
POWER REACTORS
I N T E R N A T I O N A L A T O M I C E N E R G Y A G E N C Y , V I E N N A . 1 963


OPERATING EXPERIENCE
WITH POWER REACTORS
VOL. I

The following States are Members of the International Atomic Energy Agency:
AFGHANISTAN
ALBANIA
ARGENTINA
AUSTRALIA
AUSTRIA
BELGIUM
BOLIVIA
BRAZIL
BULGARIA
BURMA
BYELORUSSIAN SOVIET SOCIALIST REPUBLIC
CAMBODIA
CANADA
CEYLON
CHILE
CHINA
COLOMBIA
CONGO (LÉOPOLDVILLE)
CUBA
CZECHOSLOVAK SOCIALIST REPUBLIC
DENMARK
DOMINICAN REPUBLIC
ECUADOR
EL SALVADOR
ETHIOPIA
FINLAND
FRANCE
FEDERAL REPUBLIC OF GERMANY
GHANA
GREECE
GUATEMALA
HAITI
HOLY SEE
HONDURAS
HUNGARY
ICELAND
INDIA
INDONESIA
IRAN
IRAQ
ISRAEL
ITALY
JAPAN
REPUBLIC OF KOREA
LEBANON
LIBERIA
LUXEMBOURG
MALI
MEXICO
MONACO
MOROCCO
NETHERLANDS
NEW ZEALAND
NICARAGUA
NORWAY
PAKISTAN
PARAGUAY
PERU
PHILIPPINES
POLAND
PORTUGAL
ROMANIA
SAUDI ARABIA
SENEGAL
SOUTH AFRICA
SPAIN
SUDAN
SWEDEN
SWITZERLAND
SYRIAN ARAB REPUBLIC
THAILAND
TUNISIA
TURKEY •
UKRAINIAN SOVIET SOCIALIST REPUBLIC
UNION OF SOVIET SOCIALIST REPUBLICS
UNITED ARAB REPUBLIC
UNITED KINGDOM OF GREAT BRITAIN AND
NORTHERN IRELAND
UNITED KINGDOM OF LIBYA
UNITED STATES OF AMERICA
URUGUAY
VENEZUELA
VIET-NAM
YUGOSLAVIA
The Agency’s Statute was approved on 23 October 1956 by the Conference on the Statute of the IAEA
held at United Nations Headquarters, New York; it entered into force on 29 July 1957. The Headquarters of
the Agency are situated in Vienna. Its principal objective is "to accelerate and enlarge the contribution of
atomic energy to peace, health and prosperity throughout the world".
Printed by the IAEA in Austria
October 1963

PROCEEDINGS SERIES
OPERATING EXPERIENCE WITH POWER REACTORS
f
PROCEEDINGS OF THE CONFERENCE ON OPERATING
EXPERIENCE WITH P O W ER REACTORS
H E LD BY THE
INTERNATIONAL ATOMIC ENERGY AGENCY
AT VIENNA, 4-8 JUNE 1963
VOL. I
In two volumes
INTERNATIONAL ATOMIC ENERGY AGENÇY
VIENNA, 1963

OPERATING EXPERIENCE WITH POW ER REACTORS,
IAEA, VIENNA, 1963
STI/PUB/76

FOREWORD
At the beginning of 1963 nuclear power plants produced some 3 500 000kW
of electrical power to different distribution grids around the world. Much
significant operating experience has been gained with these power reactors,
but this experience is often not collected in such a way as to make it easily
available.
The International Atomic Energy Agency convened a Conference on Oper
ating Experience with Power Reactors in Vienna from 4-8 June 1963 which
was attended by 240 participants representing 27 of the Agency's Member
States and six international organizations. At the Conference, 42 papers
giving detailed experience with more than 20 nuclear power stations were
discussed. Although similar meetings on a national or regional scale have
been held earlier in various countries, this is the first arranged by the
Agency on a world-wide basis. Some of the detailed material may have
been given earlier but for the most part it represents new and recently
acquired experience, and for the first time it has been possible to compile
in one place such extensive material on the operating experience with power
reactors.
The Conference discussed the experience gained both generally in the
context of national and international nuclear power development programmes,
and more specifically in the detailed operating experience with different
power reactor stations. In addition, various plant components, fuel cycles,
staffing of nuclear plants and licensing of such staff were treated.
It is hoped that these Proceedings will be of interest not only to nuclear
plant designers and operators who daily encounter problems similar to those
discussed by the Conference, but also to those guiding the planning and im
plementation of power development programmes.

EDITORIAL NOTE
The papers and discussions incorporated in the Proceedings published
by the International Atomic Energy Agency are edited by the Agency 's edi
torial staff to the extent considered necessary for the reader's assistance.
The views expressed and the general style adopted rem ain, however, the
responsibility of the n am ed authors or participants.
F o r the sake of speed of publication the present Proceedings have been
printed by composition typing and photo-offset lithography. Within the limi
tations im posed by this method, every effort has been m ad e to maintain a
high editorial standard; in particular, the units and symbols employed are
to the fullest practicable extent those standardized or recom m ended by the
competent international scientific bodies.
The affiliations of authors are those given at the time of nomination.
The use in these Proceedings of particular designations of countries or
territories does not imply any judgment by the Agency as to the legal status
of such countries or territories, of their authorities and institutions or of
the delimitation of their boundaries.
The mention of specific companies or of their products or brand-names
does not imply any endorsement or recommendation on the part of the Inter
national Atomic Energy Agency.

CONTENTS OF VOL. I
I. G E N E R A L R E V IE W S O F E X P E R I E N C E W I T H N U C L E A R P L A N T S
IN T H E C O N T E X T O F N A T IO N A L P R O G R A M M E S
The evolution of the United States civilian power p r o g r a m m e ............................. 3
A . Giambusso and W .R . Voigt
Discussion............................................................................................................................. 10
L e développement en France de la filière uranium naturel-
graphite-gaz-carbonique. Expérience acquise et perspectives d'avenir. . . . 13
J. Horowitz et J.-P. RouxDiscussion ........................................................................................................................... 24
Operating experience in nuclear power-plants with boiling-water reactors . . . 27
R . J. AscherlDiscussion ........................................................................................................................... 33
Review of development status of nuclear superheat................................................ 37
P . H . Imhotf and R . T. Pennington
Discussion ........................................................................................................................... 83
II. E X P E R IE N C E W IT H S P E C IF IC N U C L E A R P O W E R P L A N T S
Post-construction testing of the Elk River, Hallam and Piqua Power
Reactor P lan ts ................................................................................................................ 89
C. A . Pursel
Discussion ........................................................................................................................... 124
Commissioning experience from the Agesta Nuclear Power P la n t ....................127
N . Rydell
Initial operating experience with the " N P D " reacto r ..............................................139
1.. G. McConnell
Discussion ........................................................................................................................... 148
The Enrico Ferm i Atomic Power P l a n t ..................................................................... 151
R . W . Hartwell
Discussion ........................................................................................................................... 186
Опыт эксплуатации реактора Б Р -5 ..........................................................................189
А .И . Лейпунский , О. Д . Ка зачковский, М. С. Пинхасик,
Н .Н . Аристархов, А .В . Карпов, Е .П . Ларин, И .А .Ефимов
Discussion ......................................................................... ................................................. 204
Ш . E X P E R I E N C E W IT H S P E C IF IC N U C L E A R P O W E R P L A N T S (continued)
Shippingport Atomic Power Station operating experience, developments
and future p la n s ............................................................................................. ................. 209
H . Feinroth, С . M . Oldham and J. T . Stiefel
Initial operational results of the first Belgian Nuclear Pow er Station B R 3 . . . 283
M . Guében and M . Potemans
Discussion ............................................................ .............................................................. 305
Operating experience with Indian Point Nuclear Electric Generating
Station............................................................................................................................... 307
W . C. Beattie and R . H . Freyberg
Discussion ........................................................................................................................... 323

Operating experience at the Yankee Atomic Electric Company
Nuclear Power Station................................................................................ .. 325
L . E . Minnie к
D is c u s s io n ........................................................................................................................ .. 330
The first two years of operating experience of the Kahl Nuclear Power
Station............................................................................................................................... t 335
H . J. Bruchner and A . Weckesser
Discussion ........................................................................................................................... 353
Performance characteristics of the experimental boiling water reactor
from 0 to 100 M W ( t ) ................................ . . .................................................................355
H . Iskenderian, W .C . Lipins ki, M . Petrick and E . A . Wim unc
IV . E X P E R I E N C E W I T H S P E C IF IC N U C L E A R P O W E R P L A N T S
(continued)
The development of Calder Hall and Chapelcross as base load nuclear
power stations................................................................................................................ 407
J . M cCrickard
D is c u s s io n ........................................................................................................................... 422
The performance of major plant items at Calder H a l l ........... .............................. 425
E . L . Desbruslais
D is c u s s io n ........................................................................................................................... 451
Quatre ans de fonctionnement des réacteurs G 2 et G3 ....................................... 453
F . Conte
L a détection de rupture de gaine'au réacteur G 3 .................................................... 471
J. PlissonSurveillance automatique des températures aux réacteurs G2 et G 3 ................487
J. Meiffren
Organisation et instruction du personnel aux réacteurs G2 et G 3 ...................... 505
F . Conte
D is c u s s io n ........................................................................................................................... 513
Intérêt de l’expérience neutronique acquise à Marcoule et à Chinon pour
le programme de centrale à graphite * ....................................................................515
P . Bâcher, M . Sagot, P . Tanguy et A . Teste du Bailler
D isc u ss io n ........................................................................................................................... 525

GENERAL REVIEWS OF EXPERIENCE WITH
NUCLEAR PLANTS IN THE CONTEXT OF NATIONAL
PROGRAMMES
I
1

I*

THE EVOLUTION OF THE UNITED STATES CIVILIAN POWER PROGRAMME
A. GIAMBUSSO AND W .R . VOIGT UNITED STATES ATOM IC ENERGY COMMISSION, WASHINGTON, D .C .
Abstract — Résumé — Аннотация — Resumen
THE EVOLUTION OF THE UNITED STATES CIVILIAN POWER PROGRAMME. The elements of major
importance in our civilian power programme are economics and efficient utilization of nuclear fuel resources.
Extensive development work will be required by each of these factors, but development work alone in the
absence of successful nuclear power plant operating experience will not suffice. An important start towards
this end has been made with water reactors and additional operating experience on these systems will accumulate
at an accelerated pace over the next few years. These efforts are producing results inasmuch as utility com-*
panies are beginning to undertake the construction of large water reactors on the basis of firm economics.
Operating experience with other reactor concepts is now beginning to be accumulated in the United States. To
the extent that these reactor concepts satisfy the requirement of economics and efficient utilization of nuclear
fuel, additional large nuclear power plants employing these reactor concepts will be undertaken by utility
companies.
ORIENTATION DU PROGRAMME DE PRODUCTION D'ÉNERGIE A DES FINS NON MILITAIRES AUX
ETATS-UNIS. Les considérations qui influent le plus sur l'orientation du programme de production d'énergie
à des fins non militaires aux Etats-Unis, sont la rentabilité et l'utilisation efficace des ressources en com
bustible nucléaire. L'un et l'autre de ces facteurs exigent non seulement des recherches approfondies, mais
aussi une bonne expérience pratique de l'exploitation de centrales nucléaires. On a déjà acquis d'importants
éléments d'information sur le fonctionnement des réacteurs à eau et on en recueillera de plus en plus au cours
des prochaines années. Ces efforts sont fructueux puisque les compagnies de distribution d'électricité com
mencent à faire construire de grands réacteurs à eau dont la rentabilité est pratiquement assurée. On commence
maintenant aux Etats-Unis à rassembler des données sur le fonctionnement d'autres types de réacteurs. Dans la
mesure où ces réacteurs satisferont aux critères de rentabilité et d'utilisation efficace du combustible nucléaire,
les compagnies de distribution d'électricité les utiliseront pour la construction de grandes centrales nucléaires
nouvelles.
ОЦЕНКА ГРАЖДАНСКОЙ ЭНЕРГЕТИЧЕСКОЙ ПРОГРАММЫ СОЕДИНЕННЫХ ШТАТОВ. Самыми важными элементами
нашей гражданской энергетической программы являются экономические аспекты и эффективное исполь
зование ресурсов ядерного топлива. Каждый из этих элементов потребует проведения обширных опытно-
конструкторских работ, однако одних опытно-конструкторских работ без опыта успешной эксплуатации
ядерной электростанции будет недостаточно. Важный первый шаг в этом направлении был сделан с
водяными реакторами, а в последующие несколько лет накопление дополнительного эксплуатационного
опыта в отношении этих систем будет происходить ускоренными темпами. Эти усилия дают свои ре
зультаты, так как коммунальные компании начинают строить крупные водяные реакторы на основе ус
тойчивой рентабельности. Эксплуатационный опыт в отношении других видов реакторов должен быть
накоплен сейчас в Соединенных Штатах в таком объеме, который позволял бы сделать эти виды реак
торов экономичными, а коммунальные компании осуществят эффективное использование ядерного топлива
и строительство новых крупных ядерных электростанций ç, этими видами реакторов.
EVOLUCIÓN DEL PROGRAMA CIVIL DE ENERGÍA ELÉCTRICA DE LOS ESTADOS UNIDOS. Los elementos
de mayor importancia en el programa civil de energía eléctrica de los Estados Unidos son los aspectos econó
micos y el aprovechamiento eficaz de los combustibles nucleares. El conocimiento cabal de estos factores
requerirá una extensa labor de desarrollo que» sin embargo, no será suficiente sí se carece de experiencia
práctica en materia de explotación normal de centrales nucleoeléctricas. Los reactores de agua constituyen
un primer paso muy importante hacia la consecución de ese objetivo y en los próximos anos se seguirá acumu
lando experiencia acerca de dichos sistemas. Estos esfuerzos comienzan a dar resultados positivos por cuanto
3

4 A. GIAMBUSSO and W.R. VOIGT
las compañías de electricidad están iniciando la construcción de grandes reactores de agua basados en paráme
tros económicos bien establecidos. En los Estados Unidos se está empezando a adquirir experiencia práctica con
otros conceptos de reactor; en la medida en que estos conceptos de reactor satisfagan los requerimientos eco
nómicos y aseguren un aprovechamiento eficaz del combustible nuclear, las compañías de electricidad irán
construyendo grandes centrales nucleoeléctricas basadas en estos conceptos de reactor.
1. INTRODUCTION
I am grateful for this opportunity to discuss with you the evolution of
the USAEG civilian power reactor programme, as it exists today as well
as the future programme based on the objectives established in the 1962
Civilian Nuclear Power Report to the President of the United States of
America.
2. HISTORY
In its early phases the programme was largely one of developing tech
nology. It relied to a great extent on knowledge gained from other reactor
programmes, such as the plutonium-producing production reactors, naval
propulsion reactors and research and test reactors used for scientific pur
poses. In 1953, the Commission embarked upon a five year experimental
programme to develop reactors holding promise for civilian power appli
cation. Construction was started on several experimental power producing
reactors on Commissioned-owned sites, and one prototype reactor, Shipping-
port, on a utility grid. In 1954-1955 increased emphasis was given to the
programme through the addition of a "Power Demonstration Program" under
which the Commission and industry have co-operated in building and oper
ating a number of nuclear power-plants on utility grids. One phase of this
programme consisted of the Commission building and owning "prototype"
reactors which are operated by utilities that buy steam; the other phase
being where utilities are given research and development assistance in de
signing and constructing their own reactors and for a few years no charge
is made for the lease of Government-owned nuclear fuel. This phase was
recently modified to the extent that, in addition to the above, the Commission
furnished Title I and II design assistance for the complete plant. In 1958,
as the five year experimental programme ended, the Commission conducted
a series of detailed studied and evaluations of all reactor concepts to assess
their economic and technical potential. On the basis of these studies, the
Commission published a series of reports, known as the "Ten Y ear Program",
which established short-range economic targets together with long-range
goals in economics, resources conservation and international leadership.
This programme has served as a general guide to the Commission until 1962,
at which time the President requested that the Commission take a "new and
hard look at the role of nuclear power in our economy" . This request resulted
in a very detailed review of the programme and a report has since been pre
pared and submitted to the President. I will discuss the conclusions of this
report later in these remarks.

UNITED STATES CIVILIAN POWER PROGRAMME 5
3. PR ESENT STATUS
The prime objective of the "Ten Year Program" was the achievement
of competitive nuclear power in high-fuel-cost areas by 1968. The achieve
ment of this objective now appears attainable with water-cooled and mod
erated reactors producing saturated steam. Probably no astounding tech
nical "break throughs", in the classical sense of the term, can be identified,
except perhaps the development of oxide fuels and the demonstration that
neither local nor bulk boiling of the coolant-moderator in these cores pro
duced deleterious consequences. Nevertheless, extremely importance pro
gress has been made, beginning with BOR AX 1-4, E B W R and VBW R , and
later supplemented by the only commercial size nuclear power-plants which
have thus far operated extensively in the United States of America —
SHIPPINGPORT, DRESDEN and YANKEE and supplemented recently by the
Consolidated Edison, Big Rock Point and Humboldt Bay plants. The former
three of these plants have, as of the end of April 1963, generated approxi
mately 1 516 675 500, 2 254 698 000 and 2 137 270 800 gross kWh, respectively.
Each has contributed, in part, to the state of knowledge being employed
in the v19 additional light-water civilian-power reactors now committed and
in various stages of negotiation, design, construction, start-up and operation
in the United States, Europe and the Far East.
Light-water reactors of 400 MW(e) and greater, producing saturated
steam, are now available for purchase on the basis of firm, warranted prices
applied to both capital and fuel costs with estimated resultant total power costs of approximately 6. 0- 7. 0 mill/kWh on a national basis. If certain
assumptions are correct, these reactors have thus reached a state of eco
nomic competitiveness in high-fuel-cost areas of the United States where
system loads permit the use of large units.
Perhaps the best over-all measure of accomplishments since the time
the Dresden and Yankee plants were committed is to compare their estimated
capital costs (approximately $ 350. to $ 400/k W) and initial fuel costs (approxi-
BODEGA BAY (USA) 313 MW(e)
BONUS (USA) 16. 3 MW(e)
BORAX V (USA) 3 MW(e)
BR-3 (Belgium) 11.5 MW(e)
City of Los Angeles (USA) 490 MW(e)
Connecticut Yankee (USA) 490 MW(e)
JAERI (Japan) 12 MW(e)
Jersey Central (USA) 500 MW(e)
KAHL (Fed. Rep. Germany) 15 MW(e)
KRB (Fed. Rep. Germany) 237 MW(e)
LACBWR (USA) 50 MW(e)
PATHFINDER (USA) 62 MW(e)
RAVENSWOOD (USA) 1000 MW(e)
RCPA (USA) 22 MW(e)
SAXTON (USA) 3. 2 MW(e)
SELNI (Italy) 165 MW(e)
SENA ' (Italy) 242 MW(e)
SENN (Italy) 150 MW(e)
S. Calif. Edison (USA) 375 MW(e)

6 A. GIAMBUSSO and W.R. VOIGT
mately 4 mill/kWh) with the warranted capital and fuel costs now being
offered on plants of 400 M W (e) or larger. These are respectively, $ 165
to $ 190/kW and roughly 1. 8 to 2. 25 mill/kWh corresponding tb reductions
of 50% in both capital and fuel costs.
The capital cost reductions cited are due in part to increase in plant size, but this in itself is a major accomplishment inasmuch as the 100-200 MW(e)
plants undertaken in the mid-fifties were about as large as could be
justified on the basis of then existing technology. I believe this trend of
increasing plant size is an important factor and in the formulation of our
development programmes we have taken into account its expected continuation.The fuel cost reductions are due to improvements in fabrication tech
nology and the higher fuel exposures which are being offered—of the order of
15 000-22000 MWd/t. Admittedly, the exposure of large reactor cores to
these levels is not yet an accomplished fact. The Y A N K E E Core I, for
example, containing 20. 9 metric tons of uranium, achieved an average ex
posure of 8350 MWd/t, with peak local exposures of roughly twice that value
Thus the attainment of the high average fuel exposures, on which present
fuel-cost estimates are predicated, necessarily presume continued success
in fuel development programmes.
It is believed that capital and fuel cost reductions of 20 - 25% beyond
present levels will be realized if programmes now in progress are successful.
4. SA T U R A T E D LIGHT- W ATER- REACTOR IM P R O V E M E N T S
The major areas of improvement which can now be identified are:
(1) More accurate knowledge of design limits;
(2) Scale-up of reactors to 1000 MW(e);
(3) Chemical shim and spectral-shift control; and
(4) Recycling of plutonium.
4 . 1. D e s ig n lim its
Virtually every water reactor, including experimental reactors, has
demonstrated the ability to operate at power levels substantially in excess
of the design power level. For example, the DRESDEN reactor had its
authorized thermal power increase from 629 to 700 MW(t); the YANKEE first
core, designed for 392 MW(t), operated for a large part of its lifetime at
485 MW(t)\ Y AN KEE Core II, identical in all respects to Core I (with the
exception of the retention of two Core I assemblies in the reactor for ex
tended burn-up) operated at 540 MW(t). While these power increases, ex
ceeding the design power levels, have been gratifying, they also indicate
the lack of precision which exists in our knowledge of design methods and
performance limits. Similarly, the ability to build plants within initial cost
estimates and schedules has not, in every instance, been demonstrated.
In August 1962 the Commission issued an invitation to utilities and in
dustrial firms requesting proposals for 400 MW(e) or larger water-reactor
plants. Under this invitación, the Commission, in addition to the previous
forms of research and development and waiver of use charge assistance

UNITED STATES CIVILIAN POWER PROGRAMME 7
available under the third round of our power demonstration reactor pro
gramme, extended Title I and II design assistance for the entire plant.
Two proposals were received as a result of this invitation: one from
the City of Los Angeles Department of Water and Power and the other from
Connecticut-Yankee. Both plants have a rating of 490 MW(e) with an excess
capacity being designed into the secondary system to allow for an anticipated
increase in reactor thermal ratings.
With respect to core-design methods and performance limits, uncertain
ties exist in the area of heat transfer and hydraulics, materials behaviour
and physics (particularly lifetime and reactivity coefficient predictions at
high fuel exposures). A programme has been undertaken to evaluate the
performance of the YANKEE Core I, involving destructive and non-destructive
examination of a large number of the discharged fuel assemblies. A Core I
control rod will similarly be examined. All mechanical, chemical, physical
and metallurgical properties of the fuel assemblies and control rod will be
determined, compared with design predictions and pre-irradiated values.
Design methods employed will then be revised where necessary, to provide
agreement prediction and experience.
It is planned that similar programmes on other reactor cores embodying
unique features will be undertaken in the near future.
4. 2. Scale-up of reactors to 1000 M W (e )
An important factor currently receiving attention in the drive to reduce
power-generation costs is the trend toward increased plant size. It is characteristically true for both fossil fuel and nuclear plants that unit costs
decrease with increasing plant size. Considering the projected pattern of
utility load growth and system interconnections in the United States, and
the somewhat higher ratio of nuclear-plant capital costs to fuel costs as
opposed to fossil-fuelled plants. It appears that optimum nuclear plants
must have the ability of being built in single-unit sizes of up to 1000 MW(e).
We have initiated design studies aimed at determining the technical and
economic feasibility of a 1000 MW(e) single unit indirect and direct cycle
saturated-steam water reactors. It is probable that problems will be en
countered in component design, fabrication and shipment, turbine design,
steam-water separation, and perhaps, core design.
4. 3. Chemical-shini and spectral-shift control
Development work on both chemical shim and spectral-shift control,
applied to indirect-cycle water reactors, has been in progress in the United
States under sponsorship by both government and industry. Both of these
concepts have the potential of extending core reactivity lifetime, and
achieving higher average power density and specific power through improved
power distributions.
Supplementary control via chemical means (boric acid) has been success
fully employed for cold shut-down of the Yankee reactor. Continuous
chemical-shim control will be tested in the SA XTON reactor and is also
provisionally included in the SELNI, SENA, Southern California Edison, City
of Los Angeles and Connecticut-Yankee reactors. The problem requiring

8 A. GIAMBUSSO and W.R. VOIGT
resolution is to control, in an optimum manner, the reactor power output
and fuel exposure.
The physics of the spectral-shift reactor has been the subject of an
USAEC sponsored programme of physics experiments and analysis such that
this reactor concept is now available from industry on a firm-price basis.
The novel features of this concept centre on the use of varying D20-H20 mix
tures to control reactivity during the core lifetime.
This concept's potential advantages are realized by absorption of neut
rons in fertile materials, thereby achieving high conversion ratios (up to
0. 95 in equilibrium U233 , thorium fuel). This is accomplished by hardening
the spectrum through the use of a high ratio of D20-H20 at the beginning of
life, thereby increasing resonance absorption in fertile material. As fuel
burn-up progresses, the spectrum is gradually softened by decreasing the
D20-H20 ratio to maintain core reactivity. This control concept also results
in minimizing the number of control rods in the core during operation, thus
permitting improved power distribution, higher specific power and power
density and higher average fuel exposures. Its principal uncertainties are
D20 loss rates and possible variations in reactivity coefficients at high fuel
exposures.
4 .4 . Plutonium recycle
Because of the potential extensions of our nuclear fuel resources through
the use of by-product plutonium as a reactor fuel and the effect of the as
signed plutonium value on nuclear fuel cost calculations, it is important that
the technology and economics of plutonium utilization in converter reactors,
and particularly in light-water reactors, he established as soon as possible.
We are now entering the stage in our over-all plutonium-recycle programme
where significant numbers of practical plutonium-bearing fuel elements will
be irradiated in typical light-water reactor environments. The first such
irradiation is expected to occur in the É BW R in early 1964 and will consist
of a partieil core loading of plutonium-bearing fuel assemblies. This experi
ment will reduce the present uncertainties in physics and extended burn-up
characteristics of plutonium-bearing fuels in a typical boiling-water-reactor
environment. Other experimental light-water reactors may be used in a
manner similar to EBWR. These experiments are expected ю establish the
minimum fuel value of plutonium, i. e. its value when used in a thermal con
verter reactor.
I have devoted a great deal of time to dicussing the saturated-water re
actor programme as well as its technical potential inasmuch as this concept,
through technology developed over the past years and favourable operating
experience, has resulted in acceptance by utility companies as a reliable
and economic source of power.In addition to the light-water reactors mentioned earlier the United States
has an additional seven commercial-power reactors in various stages of
design, construction and operation. These include the Hallam Nuclear Power
Facility, Carolinas-Virginia Tube Reactor, Enrico Fermi Atomic Power
Plant, Piqua Organic Moderated Reactor, Experimental Gas Cooled Reactor,
Peach Bottom Atomic Power Station and the EBR II. Widespread acceptance
by the utility industry of these concepts is expected to occur when successful

UNITED STATES CIVILIAN POWER PROGRAMME 9
operating experience of statistically significant proportions has been
accumulated.
5. FU T U R E
As I stated earlier, the President of the United States requested the
Commission to take a "new and hard look at the role of nuclear power in
our economy". This review was completed taking into account the need for
nuclear power, the responsibilities of the USAEC, the state of nuclear power
technology, its future possibilities and the existence and potentialities of
the nuclear industry. Based on these items, the USAEC arrived at the
following statement of objectives: The over-all objective of the Commission's
nuclear power programme should be to foster and support the growing use
of nuclear energy and, importantly, to guide the programme in such directions
as to make possible the exploitation of the vast energy resources latent in
the fertile materials, uranium-238 and thorium.
More specific objectives may be summarized as follows:(1) The demonstration of economic nuclear power by assuring the con
struction of plants incorporating the presently most competitive reactor
types.
(2) The early establishment of a self-sufficient and growing nuclear-
power industry that will assume an increasing share of the development
costs.
(3) The development of improved converter and, later, breeder reactors
to convert the fertile isotopes to fissionable ones, thus making available
the full potential of the nuclear fuels.
(4) The maintenance of United States technological leadership in the world
by means of a vigorous domestic nuclear power programme and-appropriate
co-operation with, and assistance to, our friends abroad.
The future programme for civilian nuclear power has been divided into
two phases, that is a programme for the immediate future and a long-range
programme. In the immediate future, emphasis will be given to other con
verter type reactors, i. e. light-water saturated systems, but only if they
promise early marked improvement in unit costs for power, are markedly
higher ratio converters, have direct, important technical bearing on breeder
systems, or offer potential for other applications such as process heat.
Several reactor systems give promise of meeting the above criteria and will
be continually evaluated to assess if these concepts possess significant ad
vantages to warrant prototype or full scale construction.
Major programme emphasis will be placed on development of thermal
and fast breeder reactors. Prime emphasis is being placed on this concept
to realize achievement of one of the major objectives of Commission's pro
gramme, that is, to make maximum utilization of energy resources. Experi
mental reactors will be built in the near future to assess control and safety
problems. It is hoped that in the late 1960's or early in the following decade
the stage of operating prototypes will be reached. In the absence of unforeseen
difficulties and continued vigorous developmental support, practical and
economic full-scale breeder reactors are expected to be achieved by late
1970's or early 1980's.
10 A. GIAMBUSSO and W.R. VOIGT
In summary I should like to reiterate the elements of major importance
in our civilian power programme — economics and efficient utilization of
nuclear fuel resources. Extensive development work will be required by
each of these factors, but development work alone, in the absence of success
ful nuclear power-plant operating experience will not suffice. An important
start towards this end has been made with water reactors and additional
operating experience on these systems will accumulate at an accelerated
pace over the next few years. These efforts are producing results inasmuch
as utility companies are beginning to undertake the construction of large
water reactors on the basis of firm economics.
Operating experience with other reactor concepts is now beginning to
be accumulated in the United States to the extent that these reactor concepts
satisfy the requirement of economics, and efficient utilization of nuclear fuel, additional large nuclear power-plants employing these reactor concepts
will be undertaken by utility, companies.
D IS C U S S IO N
S. YIFTAH: You mentioned average figures of 6. 7 mill/kWh and $165-
$ 190 per kW installed. You also said that there is a tendency to favour
larger plants, ranging from 500 to 1000 MW(e), and I wonder whether the
cost figures apply to these large plants. If not, to what sizes do they apply?
C .A . PURSEL (on behalf of A. Giambusso and W .R . Voigt): The figures
apply to light-water-moderated plants in the 400-500 MW(e) range. They
are based on quotations recently made to the Department of Water and Power
of the City of Los Angeles and to the Connecticut Yankee Power Company
for plants in this range.
U. ZELBSTEIN: Could you give us any idea of the increment that one
would have to pay in order to operate such reactors in Europe or the Far
East? In other words, what would be the real cost of operation, taking into
account transport and fuel reprocessing costs, if such reactors were in
stalled in countries other than their country of origin?
C .A . PURSEL: I understand that fuel-cycle costs are not appreciably
influenced by the cost of overseas shipment (United States to Europe and
return), and I presume that they have been estimated quite carefully in con
nection with, for example, the SENN and SELNI plants.
P . ED DY : Perhaps I can contribute a partial answer. The General
Electric Co. has devoted considerable study to the possibilities of boiling-
water plants in overseas areas. It has been found, in general, that the prices
which Mr. Pursel quoted for the United States would remain valid in most
countries. Local write-offs, taxes, the manner in which the utility keeps
its financial records and staffs its plant — all these things would probably
have a greater effect on operating costs than the mere fact of being located
outside the United States. Most light-water reactors use very slightly en
riched fuel which does not bring an extreme penalty. If anyone is interested
in a specific application for a particular area, we should be pleased to co
operate in providing more precise information.
6. SUM M ARY

UNITED STATES CIVILIAN POWER PROGRAMME 11
F .R . B E L O T : You mentioned a burn-up of 8350 M Wd/t for the first
YANKEE core. I should like to know what you consider the end of the core's
life to be. Is it assumed that the core has attained its maximum burn-up
when xenon poisoning makes it impossible to start up again promptly after
shut-down, or is it considered advantageous to exhaust the last reserves of
reactivity even at the risk of less reliable operation?
C .A . PURSEL: The YANKEE core was removed, as you probably know,
in order to obtain a higher price for the plutonium,which was guaranteed,
I believe, up to June 1963. Needless to say, it had not run out of reactivity
by the time it was removed. The question when to remove a core because
of fission-product poisoning is a continuing problem. I have long believed
that reactor cores are too expensive to be removed from service simply
because the combination of loss of enrichment and build-up of fission pro
ducts no longer permits full xenon override after shut-down. As a practical
matter, I believe that plants will be derated, if necessary, near the end of
core life to obtain as much thermal energy as possible.
B. SAITCEVSKY: What is the price per kilowatt installed in a con
ventional thermal plant as compared with the $ 165-$ 200 per kW quoted for
light-water nuclear plants?
C .A . PURSEL: I cannot give you precise figures, although I know that
the cost of a conventional fossil-fuelled plant is considerably less than that of a nuclear plant. Costs vary, of course, depending on the type and location
of the plant and the time when the estimate is made. I have heard of quo
tations varying frpm $ 100 to 0 125 per kW installed. Possibly someone else
here is better informed.
L . MINNICK: Perhaps I can shed a bit of light on the subject. Costs
vary throughout the United States depending on the proximity of the niant
to conventional fuel deposits.
In New England the cost of a conventional plant of 150 M W , built in 1960
and similar to the Yankee plant, would have been about 8.0 mill/kWh.
Y A N K E E is now operating at a cost of approximately 10 mill/kWh. The
Connecticut Yankee plant — to go into operation in 1967 — will produce power
at approximately 7. 0 mill/kWh, a cost comparable to that of a conventional
plant similar in size and bunt at the same time. Its initial capacity will be 490 MW(e), but this is expected to rise to something like 600 MW(e) once
the core has been thoroughly tested. I believe the total cost of the plant is
to be $70 million.G .B . SCURICINI: In further reply to Mr. Saitcevsky, it might be re
called that United States sources last year, in a statement before the Joint
Congressional Committee, gave a figure of about $ 50 as the difference be
tween the price per kW installed in conventional and nuclear plants. The
costs were approximately $ 120 for conventional plants and $ 175-$ 180for
nuclear plants. Perhaps a representative of General Electric would care
to comment on these figures, since they are now a year out of date.
P. EDDY: They are just about right, although the cost of nuclear plants
is gradually getting lower. In one specific easel know of in the U nit ed States,
where the construction of a 600 MW(e) coal-fired plant is being considered
in the neighbourhood of a coal mine, the capital cost will be something over
$ 100 per kW, and the transmission cost to the load centre will represent
an additional $ 20 per kW. W e have to bear in mind that there are many

12 A. GI AMBUSS О and W.R. VOIGT
extraneous factors which can affect the capital cost of a plant. One has to
consider whether a completely new plant is to be built, or whether additional
capacity is to be added to an already existing site; whether the site prepa
rations have already been paid for or must be reckoned into the capital cost;
the location of the plant and the climate prevalent there; whether the turbine
can be installed outside or an insulated building must be provided, and so
forth. For these reasons it is difficult to apply perfectly uniform standards
in calculating costs.
LE DÉVELOPPEMENT EN FRANCE DE LA FILIÈRE URANIUM NATUREL - GRAPHITE - GAZ CARBONIQUE. EXPÉRIENCE ACQUISE ET PERSPECTIVES D'AVENIR
J. HOROWITZ CENTRE D'ÉTUDES NUCLÉAIRES DE SACLAY
ETJ .-P . ROUX
ELECTRICITE DE FRANCE, PARIS, FRANCE
Abstract — Résumé — Аннотация — Resumen
THE DEVELOPMENT OF NATURAL URANIUM-GRAPHITE-CO2 REACTORS IN FRANCE: EXPERIENCE
GAINED AND FUTURE PROSPECTS. Natural uranium-graphite-СОг reactors are the foundation of the French
nuclear power station programme. The Chinon reactors EDF1, EDF2 and EDF3 follow on from tht Marcoule
plutonium producers G2 and G3, and this group will account for most of the 850 MW(e) to be installed under
the third equipment plan by 1965.
G2 and G3 have been supplying the French national grid since 1959 and 1960 respectively. EDF1
underwent preliminary tests at the beginning of 1963 preparatory to coming onto power operation; EDF2 is
expected to go into service at the end of 1964 and EDF3 during 1965.
The purpose of the paper is to summarize the development of this reactor type in the light of the experi
ence already acquired therefrom. Points considered are:
(a) Progress in the laboratory on various technical aspects, including neutron, thermal, mechanical and
metallurgical problems, and on the development prospects which this progress opens up;
(b) Experience gained from the construction of different reactors, and the technical and economic con
clusions to be drawn therefrom; and
(c) Experience gained from the operation of the Marcoule reactors and from the first tests of EDF1, together
with the implications of this experience for future reactor projects.
Finally, an attempt is made to evaluate the future prospects of this reactor type within the French
programme. In this assessment, a distinction is made between technical feasibility - which can be considered as
already established - and economic viability which, it is hoped, will be demonstrated by the reactors now
under construction.
LE DÉVELOPPEMENT EN FRANCE DE LA FILIÈRE A URANIUM NATUREL GRAPHITE - GAZ CARBONIQUE.
EXPERIENCE ACQUISE ET PERSPECTIVES D*AVENIR. Les réacteurs à uranium, graphite et gaz carbonique
constituent la base du programme français.de centrales électronucléaires. Les réacteurs de Chinon, EDFl,
EDF2 et EDF3 font suite aux piles plutonigènes de Marcoule G2 et G3, et cet ensemble représente la majeure
partie des 850 MWe dont le troisième plan d'équipement prévoyait l'installation pour 1965.
Les réacteurs G2 et G3 alimentent le réseau électrique français, respectivement depuis 1959 et 1960. EDFl est
soumis au début de 1963 aux essais préliminaires à la montée en puissance; la mise en service d'EDF2 est
prévue pour la fin de 1964 et celle d'EDF3 pour 1965.
Le présent rapport se propose de faire le point du développement de la filière à la lumière des enseigne
ments apportés par l'expérience déjà acquise sur ce type de réacteur. On passera successivement en revue:
a) les progrès réalisés dans les laboratoires sur les différents aspects techniques: neutronique, thermique,
mécanique, métallurgique et les perspectives de développement qui en résultent;
b) les enseignements apportés par la construction des différents réacteurs et les conclusions techniques et
économiques que l'on peut en tirer;
c) l'expérience du fonctionnement des réacteurs de Marcoule et des premiers essais du réacteur EDFl et ses
conséquences sur les projets des réacteurs à venir.
En conclusion, on s'efforcera de préciser les perspectives d'avenir de ce type de réacteur dans le pro
gramme français, en distinguant la praticabilité technique qui peut être considérée comme acquise et la
rentabilité économique dont on espère qu'elle sera démontrée par l'expérience des réacteurs en construction.
13

14 J. HOROWITZ et J.-P. ROUX
РЕЗУЛЬТАТЫ И ПЕРСПЕКТИВЫ РАЗРАБОТКИ ВО'ФРАНЦИИ УРАН-ГРАФИТОВЫХ РЕАКТОРОВ С ТЕПЛОНОСИТЕ
ЛЕМ С02 . Уран-графитовые реакторы (на природном уране) е углекислым газом в качес-ве теплоно
сителя представляют собой основу французской программы атомных электростанций. Реакторы в Шивоне
(EDF-1, EDF-2 и EDF-3) следуют за реакторами для производства плутония в Маркуле (0-2 и G-3),
и эта группа реакторов будет вырабатывать большую часть электроэнергии из общего количества
850 мгвт ( э л . ) , намеченных к производству в 1965 году по третьему плану.
G-2 и G-3 питают французскую электросеть соответственно с 1959 и 1960 годов. В начале 1963
.года прошел предварительно испытание по подъему мощности EDF-1; ввод в эксплуатацию EDF-2 пре
дусмотрен на конец 1964 года, a EDF-3 - в 1965 году.
Излагается вопрос о разработке семейства реакторов в свете данных, полученных в процессе
испытаний этого типа реактора. Дается обзор:
а) достижений лабораторий в различных технических областях: нейтронной, тепловой, механи
ческой, металлургической, и вытекающих из этого последствий и перспектив;
б) сведений, полученных в процессе строительства различных реакторов, а также технических
и экономических выводов, которые могут быть из этого извлечены;
в) опыта работы реакторов в Маркуле и первым испытаниям реактора EDF-1 вместе с его влиянием
на последующие проекты реакторов.
В заключение уточняются перспективы этого типа реактора во французской программе. При этом
проводится различие между технической практичностью,.которая может считаться достигнутой, и эко
номичностью, по поводу которой полагают, что она будет выявлена при испытаниях строящихся ре
акторов .
D ESARR OLLO EN F R A N C IA D E LA SERIE DE REACTORES DE U R A N IO N A T U R A L - G R A F IT O - C 0 2. E X
PERIENCIA A D Q U IR ID A - PERSPECTIVAS F U T U R A S . El programa francés de centrales nucleoeléctricas está
basado en los reactores de uranio-grafito-anhídrido carbónico. Los reactores de Chinon, EDF1, EDF2 y EDF3,
derivan de los reactores plutonígenos G 2 y G 3 de Marcoule, y la producción de este conjunto de reactores
representa la mayor parte de los 850 M W (e ) de potencia instalada previstos para 1965 en el tercer plan de
desarrollo de la electrificación.
Los reactores G 2 y G3 alimentan la red francesa de electricidad desde 1959 y 1960 respectivamente.
El EDF1 está sometido desde principios de 1963 a los ensayos preliminares a la puesta en m archa; el EDF2
comenzará a funcionar a fines de 1964 y el EDF3 en 1965.
En la memoria se expone el estado actual de desarrollo de esta serie de reactores. Se examinan
sucesivamente:
a) los progresos realizados en los laboratorios en lo que se refiere a los diversos aspectos técnicos - neutrónico,
térmico, m ecánico y metalúrgico - y las perspectivas d e desarrollo que dichos progresos ofrecen;
b) las enseñanzas aportadas por la construcción de los diversos reactores y las conclusiones técnicas y econó
micas que pueden sacarse de ellas;
c) la experiencia adquirida con el funcionamiento de los reactores de Marcoule y con los primeros ensayos
del reactor EDF1 y sus consecuencias para los futuros proyectos de reactores.
Por último, los autores de la memoria tratan de precisar las perspectivas de este tipo de reactores dentro
del programa francés, estableciendo una distinción entre su viabilidad técnica - problema que ya puede con
siderarse resuelto -ysu rentabilidad económica que, según se espera, quedará demostrada cuando entren en
servicio los reactores actualmente en construcción.
I. INTRODUCTION
Les réacteurs à uranium-naturel-graphite-gaz carbonique constituent
la base du programme français de centrales électronucléaires. Les ré
acteurs en construction à Chinon par l'Electricité de France (EDF) font suite
aux piles plutonigènes G2etG3, construites et exploitées à Marcoule par
le Commissariat à l'énergie atomique, et cet ensemble représente la ma
jeure partie des 850 M W e dont le troisième plan d'équipement prévoyait
l'installation pour 1965.

FILIÈRE URANIUM NATUREL 15
T A B LE A U I
PUISSANCE UNITAIRE ET DATE DE MISE EN SERVICE
DES RÉACTEURS G2, G3, EDF1, EDF2 et EDF3
G 2 G 3 EDF1 EDF2 EDF3
Puissance thermique (M W )
Puissance électrique
nette (M W )
Date de mise en service
250
37
avril 59
250
37
avril 60
300
68
m i 6 3 *
800
198
fin 6 4 *
1 5 6 0 * *
4 8 0 * *
début 6 6 *
* Prévision. Actuellement (avril 1963) EDFjest soumis depuis le début de l'annép aux essais
préliminaires à la montée en puissance.
* * Les caractéristiques seront atteintes avec le deuxième jeu d'éléments combustibles
Le tableau I donne pour chaque réacteur la puissance unitaire et la date
de mise en service (couplage sur le réseau électrique).
En accord avec les prescriptions du quatrième plan d'équipement couv
rant la période 1962-1965 qui prévoit l'engagement de 200 MWe en moyenne
par an, ED F vient de décider d'engager la réalisation d'une nouvelle cen
trale, EDF4, dont la construction débutera en 1964 sur le site de Saint -
Laurent des Eaux, d'une puissance égale à celle d'EDF3, 480 MWe net, et
dont la mise en service doit avoir lieu au cours de l'année 1968.
Nous nous proposons dans cette note de faire le point sur l'expérience
pratique acquise à cette date sur les réacteurs de ce programme.
II. P R O B L È M E S TECHNIQUES
De G2 à EDF3 des progrès considérables ont été effectués dans tous les
domaines comme on peut le constater sur les tableaux de caractéristiques
reproduits en annexe. Parmi les accroissements des performances du cœur,
on peut noter en particulier l'augmentation simultanée de la puissance spé
cifique maximum dans l'uranium, qui passe de 3, 5 MWth par tonne d'ura
nium dans G2etG3à 6, 2 MWth/t dans EDF3, et de la puissance extraite
du canal le plus chargé, 260 kW dans G2 comparé à 660 kW dans E D F 3 .
Ces progrès n'ont été possibles qu'à la suite de modifications impor
tantes dans la conception de l'élément combustible: utilisation d'un tube à
la place d'un barreau plein, alliage uranium-molybdène, gaines en chevrons,
etc. Les éléments combustibles font l'objet d'une autre communication pré
sentée à cette conférence [1] et nous n'examinerons pas ici dans le détail
les modifications intervenues de G2 à EDF3. Mais celles-ci reagissent égale
ment sur le bilan de réactivité dans le réacteur qu'il est nécessaire d'étudier
avec nn soin particulier.
C'est ainsi qu'avant la mise en service des réacteurs G2 etG3,on a pro
cédé, pendant les essais, à une série d'expériences neutroniques [2, 3], qui
ont permis, de mesurer les caractéristiques nucléaires de réseaux dans
lesquels on avait fait varier le type d'éléments combustibles. Des essais

16 J. HOROWITZ’ et J.-P. ROUX
nucléaires ont également eu lieu au démarrage du réacteur ED Fl, et font
l'objet d'une autre communication [4] . La connaissance du bilan de réacti
vité est loin d’être le seul but de ces essais; on étudie également les dé
formations de la distribution du flux dans le cœur en fonction de la position
des barres de contrôle et des absorbeurs fixes. L'expérience acquise dans
ce domaine au cours de l'exploitation des réacteurs G2etG3 a été appliquée
aux piles EDF : utilisation de barres grises pour le pilotage et la compen
sation, disposition d'absorbeurs ayant une capture voisine de celle de l'ura
nium dans des canaux combustibles pour améliorer J'aplatissement radial
du flux neutronique obtenu normalement par sous-modération dans la zone centrale.
Il est un autre aspect neutronique qui est particulièrement important;
c'est l'évolution de la réactivité et des coefficients de température en fonc
tion de l'irradiation du combustible. Dans ce domaine,un programme ex
périmental a été mis sur pied, combinant les résultats directs de l'exploi
tation des réacteurs G2etG3, avec des mesures spéciales sur réacteurs
(oscillations et perturbations) et des mesures indirectes sur combustibles
irradiés (analyses et oscillations). Ce programme est exposé dans une
autre communication [5]. Il semble qu'on puisse conclure des résultats
déjà obtenus que dans ce type de réacteur, du point de vue neutronique, l'ir
radiation moyenne des éléments déchargés doit pouvoir atteindre 3500 à
4000 MWj/t, et que ces valeurs peuvent être largement dépassées si l'on
accepte de compliquer les schémas de déchargement et de procéder à des
rearrangements de combustibles.Mentionnons enfin un dernier aspect neutronique: la cinetique et parti
culièrement les instabilités spatiales qui se produisent dans les réacteurs
de grandes dimensions lorsque le coefficient de température est positif.
Ici l'expérience de G2etG3 est insuffisante car ces piles sont de trop petites
dimensions; des essais ont pu cependant être effectués pour vérifier la va
lidité des modèles cinétiques utilisés sur machine à calculer électronique.
L'aspect neutronique n'est évidemment pas le seul qui intervient dans
l'augmentation des performances du cœur des réacteurs. Pour la thermo
dynamique, ce sont les essais hors-pile qui jouent le rôle essentiel; c'est
ainsi qu'ont été mis au point les profils de gaine dits «en chevrons» qui,
par rapport aux ailettes longitudinales utilisées dans G2, G3 et E D F l, ont
permis une augmentation considérable des coefficients d'échange mise à
profit dans EDF2et EDF3. Mais l'expérience du fonctionnement en pile
est également très importante, pour la vérification des résultats des essais
hors-pile et pour la connaissance expérimentale des facteurs points chauds,
facteurs qui fixent les performances des réacteurs en fonction des limites
de température admissibles sur l'élément combustible. Les réacteurs G2
et G3 se prêtent particulièrement bien à une connaissance étendue des varia
tions de température dans le cœur en raison de la présence de mesures de
température de sortie de gaz individuelles par canal, solution reprise sur
EDFl. Pour faciliter la surveillance poussée de ces températures, chaque
réacteur a été équipé d'un calculateur permettant une analyse rapide des
1200 mesures [6]. Par ailleurs, les réacteurs vont être prochainement
équipés de cartouches de mesure de température de gaine pouvant être char
gées en marche, cartouches munies de contacts pour transmission du signal
électrique, qui viendront s'ajouter aux cartouches de mesure à fil déjà uti-
FILtèb’F ГЧ '.NIT' M \ 'А П ' : 'П
liséi i-i, Mi’ n d e e ce i чааеЬен, deja eii pl.и e (¡an.. К I H ' 1 , snn cea U-meat lu e
vue sans j аена; ei
i l U , ; , | U a l 'a 1 !>.>!> d e ! J p t 0 S S I - HI Ü 1 y . î a c ¡ e l ¡ c a i q u e r i e Г a 4' 7 4 ) . >. 1 1 S У s.' [ .............
qui i'!-.; p.- sbci ■ .i» l-i кц 1 •: m - daiiri C, a’ e> ( . 3 ;i ¿ ’S ky /ette' i! i as; KHI* 1 , oí pu i
est ¡Ча!, 'ч à I е Ч e \ :tîeur Ih.ut' K i t l M D l ’ ù I aa i U f f I ’ .и,-;:,] mi',! a Í ; < 4ï ! la" ;;
i m p e d ..-It -K’ la pia ai-'aae; Lm; i • ( : î c, ii(4.c J e >a ïaiile, near, re uiui ¡ ,î p arler
d e s piifi 'ai!>’¡- s>his proM-îict., San.' eonnanttica! ion -.pce a 1.1 à с г м г confó-
reni 'i • al cñiis:;i [\ч- au>. е а е .е и п е ь e u h d nu pn-cimiriiiiîi |/( p iath<H(o:sa
seuii.unr.r. qui. lus ri'-Hull-ii.-; .r è a biiUai'j,i¿diit¡= übloiius a.pi-ùâ 1 aua d e loin,
tionneieo'ai (h “ - s , ,i vi ‘ ' a n . .le Si,<14 cuit-' ainsi ij'V e c ‘,i\ '.'.ter,,;.- -u;- пачр.о! ¡i1;.,
p e r i ' J IU4Ü > ) ‘ ) 4 ' , Í r I il" ! ' UIH e u 1 :014 <.-i n î ; . m e ' à . ‘.'I a f. liul 11 m , MliU.OSH ,(■ U ‘
d e d * ' , d ¡ppe tat r> a í 'imi.í->up p n ; s lîupi >ri ants qui- o c iU d e s cü._ o ,>;4!.s oit
a c i e r u ’ Г ce à l'Mtl- 1 o ! a .' K iiik ¡.n ,'UH'I cu i 1:4 1 d 'ee\ ¡ ь ,еа ‘" a re ,' ai;
m e r a uto a c „ , vmuiib u:; ( . i .,t i- m 1 la p r e b h .o n ou -■ o , o u pci ira1: epate-
m e n ! ¡¡ '- .¡ич'гачгп' V e t c , p p i " nu-i " e ne . a ; i а П н ч а о . а daart u ea :чич;,
c e ç n a i i M ' J a : 1,: O i t p 4 e e n u u i a . e a à u n а . м ü h J i i , i. a - 1 i i < u a i i è a
c o i r n e '4i!ii¡)(,irí .'il i h'tí I c « o r e e ates d e ! ; , t s u î h a o a i l e s v a a a t s e '
l e s f -oei Yk i ■-' <!• a i i,-.: a ' 4 , 1 p a e s e i i t a a 5 a ar-a u i u м s u i ' i î i ' ш Ь ' г . н ' ч ) » " ¡Hi , , ;
g r a i . d e , Il • • s ' e\ a ! e | , t i;a.> le : n i u ; i j U ' 1 i а ч а м ы : i V " ■. '> s m \ : c p c o 1
l e s n ” ici » arïs t'utiira ' Je ai- ■' p o . П а a > " u d e 4' s a >-оаг-.а a \ t i a1 i o : a . П о р и a.-1
dans-- u> m a d ' a t o i i u r '• da-> ? , m p i i i i c i : aie,;-, a i i . j ' i a o m f ï ; , at, lt V| * < i e o 'a e e r u e
e n p a r t , e a 1 ta r le r- : a u i d ¡ï-Oa-re* ï>a ln f.it'c ¡ c i e ñ a U a C H î-s n , . s H» р о и
s i g n a i a a à ai' au ¡ » ■ i q u e ! 4 " , ¡ ч' r ч r e¡ - (lu ' o i a. n un i ieraaa! d< < îd .- l a ! ....... <p'ale bi'tah p, ni auj'piii i. r sa m » ( ¡o m in a ; , ! 1 <¡t-h « с т р о г о : a r c a a» aa ,\( i>,(-í« c l i
vées (Ь I.Г а ' с '--a pas раЯ'О .ЬЬ' do pasHOt ,o; en r e v u e íuiis !aí р .ап !ч • c e *ч,a j,;>а>
im p , a-: „at a ai -¡Ч х .а и п и м leídos les ь о Ь р ш и я qui „nu c i " apço>4*a( a
G 2 ] i*;s* j i, *,\ t ¡>à.a N a iw men* muticroriri acu ! aiacîit U ' П . д ' о Ы а I'i.ai аапнчи
d é c b a j ’ i ai, .ага c! ios > :i‘ u :a ,a ie n .as . i >ti sail (рн Ь 1 г> миг , s-! ¡ana aj cu < cia
bustibb- ua iiK ta j et i,'A tía i'ai ' rôacioiic ch m a r c it c \pf-'s ¡ias 11 > 1 ï icu ü ан
d e raiaa a.- p(a m ;n mlnii h- ¡ .e r m u c snr.,ii.i la mita ca aaa-.ua [ a j i, > as-
stal.lal a tia 'Joaue'ü , » ’! üt *1 'taa r,l *uu!c sat;n!.ic!i,ni, a! ont аоа.Г. n i v u>at !’ :;Ha-
rêt du . lacha ra.ci'-b-at an m a w Sic; a c c r o i s s e m e n t «Su 'àie»aur uo >!isiч-чаа 1 1 a ,
postura i ata li'opt) ni ; s c r !аь pi o j ;r a u a n aa , di 14 m a i ( !iv tma'.t ci d ’a j a H 'c r h
tout lüs 'a ia la liiaî п Ь ц ) ua', (iv- p u i s s a a c i ’ pa i nu a; aoiai-a' (Í i.^ot ¡пчи' » .
et G,'* i'i.ail (!*. H 11 i I c ! i o r i ' , c a 1;! las, !ok ;!(!b:uoiia tdcpi ces: pjidr I a >)■'. ta i ' i i i- a
sont ;ia,‘i ( 't a aî< a; et i.’cr.i ,'a > ) 4 'ioo( .piijfpa'â p ia b a n ! ij.ic и Ч а .ь .а и h o a e a p ih
D e s î ü a i c a rca* с p,a’c ¡ 'ата aa l a u r s p e u r s.ux'p: d c : !. я u i c c a n i ^ t u c a •!<
charpe isn-ai ,loche ; v , ïaaia , a ¡ ¡aa'p.aií >îc^ ts.au: i ¡I ce ■ ifrVrit a p ar !t t <‘>'~
s o n , a ькЧсга lot' d ;s>p,»M i li f aiui ineorpoîa ’-s ¡lau.s le c .h üso 'i , <-»- (pu ,;-a)aic
un d c s i 1 1 а " "ч (Mjopaci pif'ur 1‘ * * п я е т Ы ^ «It; rrnctpi:r c> (U ь< s laiiexcs i ac
m aqu ette ,fe acitc a, ilu! i, ia (ta ac! iicUa:in'ùi or. ( м ч « .'Рейка e-.
l-.n aî iai it i‘<« - tîa'à t’ü 4 -,i, on a el iei -ehe ,i o b t e m j ' î 'a utetu.c i y.-i Moi. la piae-, c o m p l e ; I pci . i -inlt <!o l , c e i i a . . a ! iejà сана, ic.a mc Sül е,ч (Sa u n ,p é r a n i r e d, .--огНе dcia>e'ii ! . (ч, i i -nmit ihius l (a •• >ra- \ ae à a i e aaap, . a ta.ptdo p a r I a ¡C(l la i.eHC d e ICt-pie le s4\'S>cr!i, d e c l m r ¡ rcn i eu t a po etn; s la !).!!-(' ui point ù ' a a c u s í 1 mh U- mipc^'a-ai ( i ' -micmaa ¡ s m c í i s e quen ! l o i s . ivl"e,'- i 'i-ti d u e ' les r c i i a c u r s ci» i ’ l uno a i> ,e l ' . i ' i f c n i a a ; , .Hall a é té "--р-ч ) ieî ia ‘0,1 ¡' .(.ui-íi i . d é m a r r a g e et i r i ' ' ! ■) (И .Ч Ц .1 ! ираа еаа^аа' d( rean¡,<t ute Í i-nus isf ■ >r, .a.aa al . -
l i s a l ' o i i iK U ' t ' î i i m p c s г е е i î ; ck o c î r a h e m o t a d c ü m í o n i u i t i inis. C e ! t e
2
18 J. HOROWITZ et J.-P. ROUX
tendance résulte d'une part du nombre important des mesures et des appa
reils à contrôler et d'autre part d'un souci d'améliorer la sécurité de l'in
stallation. On espère obtenir ainsi un fonctionnement permanent de la cen
trale très sûr, avec une exploitation aisée par le personnel de quart.
Pour terminer cette revue des questions techniques, il nous faut mentionner les problèmes de sécurité [8, 9]. Rappelons que dans les réacteurs à uranium naturel-graphite-gaz carbonique ce sont des critères de sécurité, liés aux excursions de température dans le cas de l'accident maximum pré
visible, qui limitent les performànces du réacteur tout autant que les limites
métallurgiques en fonctionnement normal. L'accident maximum envisagé, de G2 à EDF3, c'est la rupture du circuit de gaz carbonique. Le concept
de circuit intégré, tel qu'il sera appliqué à EDF4, permet de repousser les
limites de sécurité, et d'envisager pour l'avenir une augmentation notable
des performances intrinsèques.
III. PR OB LÈM ES ÉCONOMIQUES
La France ne dispose actuellement d'une expérience de fonctionnement
que sur les piles plutonigènes de Marcoule, G2 etG3, qui, d'un point de
vue économique, ne sont pas représentatives des réacteurs électrogènes
de la filière, d'une part en raison de leur puissance unitaire trop faible
(37 M W par réacteur) et d'autre part en raison de leur mode de fonctionne
ment plutonigène qui conduit à limiter l'irradiation moyenne de la majorité
des éléments combustibles à un taux très inférieur à leur limite techno
logique ou neutronique.
Par ailleurs, le premier des réacteurs électrogènes de Chinon (EDF1)
est pratiquement achevé, mais il a un caractère de prototype (puissance
68 MWe). Les deux autres réacteurs, ED F2 et EDF3, sont en cours de
construction. On peut certes se faire une idée assez précise des coûts de
réalisation de ces piles, mais il est encore trop tôt pour avancer des
chiffres définitifs.
Les considérations précédentes doivent donc nous rendre très prudents
en matière de prévisions économiques; il nous paraît cependant possible
et utile de donner quelques éléments à la lumière de l'expérience déjà
acquise.
Nous examinerons d'abord le coût du cycle de combustible. En ce qui
concerne le coût de fabrication des élément combustibles, la France dispose
d'une expérience industrielle importante, tant sur la fabrication des re
charges G2etG3 que sur celle des premières charges EDF1 et EDF2. Pour
ce qui est du coût de l'uranium lui-même, le prix du concentré sur le mar
ché mondial a beaucoup baissé dans les dernières années. Dans ces condi
tions, on peut estimer que pour un prix de concentré de 80 F par kg d'ura
nium contenu (6 $/lb U 3Og) le coût d'un combustible du type EDF3etEDF4
(tube 0 43 X 23 mm, avec chemise de graphite) ne devrait pas dépasser
175 F/kg d'uranium gainé, pour une série importante, de l'ordre de quel
ques centaines de tonnes par an. Il faut noter que la complexité relative
de cet élément par rapport au barreau G2 entraîne une augmentation du coût
de fabrication par cartouche, mais que cette augmentation est plus que com
pensée par l'augmentation de la section d'uranium par canal, et par con
séquent du poids d'uranium par cartouche.
FILIÈRE URANIUM NATUREL 19
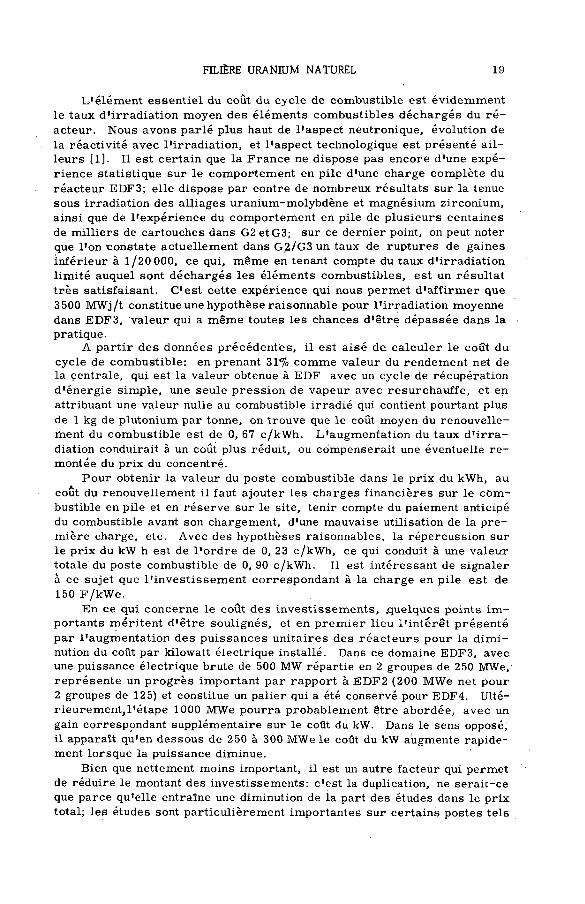
L'élément essentiel du coût du cycle de combustible est évidemment
le taux d'irradiation moyen des éléments combustibles déchargés du ré
acteur. Nous avons parlé plus haut de l'aspect neutronique, évolution de
la réactivité avec l'irradiation, et l'aspect technologique est présenté ail
leurs [1]. Il est certain que la France ne dispose pas encore d'une expé
rience statistique sur le comportement en pile d'une charge complète du
réacteur EDF3; elle dispose par contre de nombreux résultats sur la tenue
sous irradiation des alliages uranium-molybdène et magnésium zirconium,
ainsi que de l'expérience du comportement en pile de plusieurs centaines
de milliers de cartouches dans G2etG3; sur ce dernier point, on peut noter
que l'on ^constate actuellement dans G2/G3 un taux de ruptures de gaines
inférieur à 1/20 000, ce qui, même en tenant compte du taux d'irradiation
limité auquel sont déchargés les éléments combustibles, est un résultat
très satisfaisant. C'est cette expérience qui nous permet d'affirmer que
3500 MWj/t constitue une hypothèse raisonnable pour l'irradiation moyenne
dans EDF3, valeur qui a même toutes les chances d'être dépassée dans la
pratique.A partir des données précédentes, il est aisé de calculer le coût du
cycle de combustible: en prenant 31% comme valeur du rendement net de la centrale, qui est la valeur obtenue à EDF avec un cycle de récupération
d'énergie simple, une seule pression de vapeur avec resurchauffe, et en
attribuant une valeur nulle au combustible irradié qui contient pourtant plus
de 1 kg de plutonium par tonne, on trouve que le coût moyen du renouvelle
ment du combustible est de 0, 67 c/kWh. L'augmentation du taux d'irra
diation conduirait à un coût plus réduit, ou compenserait une éventuelle re
montée du prix du concentré.
Pour obtenir la valeur du poste combustible dans le prix du kWh, au
coût du renouvellement il faut ajouter les charges financières sur le com
bustible en pile et en réserve sur le site, tenir compte du paiement anticipé
du combustible avant son chargement, d'une mauvaise utilisation de la pre
mière charge, etc. Avec des hypothèses raisonnables, la répercussion sur
le prix du kW h est de l'ordre de 0, 23 c/kWh, ce qui conduit à une valeur
totale du poste combustible de 0, 90 c/kWh. U est intéressant de signaler
à ce sujet que l'investissement correspondant à la charge en pile est de
150 F /kW e.
En ce qui concerne le coût des investissements, .quelques points im
portants méritent d'être soulignés, et en premier lieu l'intérêt présenté
par l'augmentation des puissances unitaires des réacteurs pour la dimi
nution du coût par kilowatt électrique installé. Dans ce domaine EDF3, avec
une puissance électrique brute de 500 M W répartie en 2 groupes de 250 MWe,
représente un progrès important par rapport à E D F 2 (200 M W e net pour
2 groupes de 125) et constitue un palier qui a été conservé pour EDF4. Ulté-
rieurementjl'étape 1000 MWe pourra probablement être abordée, avec un
gain correspondant supplémentaire sur le coût du kW. Dans le sens opposé,
il apparaît qu'en dessous de 250 à 300 MWe le coût du kW augmente rapide
ment lorsque la puissance diminue.
Bien que nettement moins important, il est un autre facteur qui permet
de réduire le montant des investissements: c'est la duplication, ne seraic-ce
que parce qu'elle entraîne une diminution de la part des études dans le prix
total; les études sont particulièrement importantes sur certains postes tels

20 J. HOROWITZ et J.-P. ROUX
l'appareil de chargement et le caisson (pour EDF3 on a construit 3 maquettes
de caisson sur le site du Chinon). Ce point pourra être vérifie partiellement
pour EDF4, dont le cœur et toute la partie supérieure du réacteur sont iden
tiques à ceux d'EDF3. Pour ce qui est des conséquences de l'intégration du
circuit primaire dans le caisson, les simplifications constructives impor
tantes qu'elle entraîne devrait conduire à une réduction des coûts, mais il
est évidemment beaucoup trop tôt pour pouvoir l'affirmer avec certitude.
Ces diverses raison, jointes à l'expérience acquise par le CEA, l'EDF,
et les constructeurs, ont permis de diminuer le coût des investissements
par un facteur 1, 6 entre EDFletEDF2, et voisin de 3 entre EDFletEDF3.
U ne semble plus utopique maintenant d'espérer atteindre dans quelques
années un objectif de 1000 F /kW e.
A côté du cycle de combustible et des investissements, la durée de vie
de la centrale est un paramètre important du point de vue économique. C'est
également celui sur lequel il ne sera pas possible avant longtemps d'avoir
des certitudes absolues. L'expérience acquise permet cependant d'apporter
des éléments de réponse en ce qui concerne les points les plus délicats,
parce que inaccessibles après la mise en service: l'empilement de graphite
et le caisson.
Les données expérimentales obtenues sur l'accumulation d'énergie
Wigner dans le graphite aux températures rencontrées dans ces réacteurs
montrent que la vitesse d'accumulation de cette énergie se sature lorsque
l'irradiation croît et qu'il n'y a pas de risque d'atteindre un niveau d'énergie
emmagasinée dangereux et incompatible avec la poursuite d'un fonctionne
ment sûr du réacteur [10]. Quant aux problèmes posés par la déformation
du graphite sous rayonnement et ses conséquences possibles sur la géomé
trie de l'empilement et l'alignement des canaux, la structure entièrement
clavetée adoptée sur ED F2 et E D F 3 doit permettre à l'empilement de
s'accomoder des déformations prévisibles pendant toute la vie du réacteur.
U peut y avoir un risque de fissuration des briques de graphite due à des
contraintes excessives; ce risque est très limité dans EDF2 et EDF3où la
variation de température et de flux dans une brique est faible en raison de
la présence des chemises, et de toutes façons, d'éventuelles fissures ne
devraient pas avoir des conséquences graves sur la tenue de l'empilement
en raison des facteurs de sécurité élevés qui sont adoptés. La réaction
d'oxydation du graphite par le C 0 2 ne devrait pas quant à celle être d'une
importance significative pour les températures, pression et intensités de
rayonnement mis en jeu dans ces réacteurs.
L'expérience déjà acquise sur les caissons en béton précontraint donne
une grande confiance dans leur capacité à soutenir une longue durée de
vie. A G2etG3, après des ennuis mineurs résultant d'une surveillance
insuffisante des câbles de précontrainte, un système simple et sûr a été
mis en place permettant le contrôle permanent de la tension des câbles.
Si une anomalie est constatée, il est toujours possible de procéder au rem
placement des câbles. En ce qui concerne le comportement du béton lui-
même, il ne peut poser de problème que dans le cas où une détérioration
du calorifuge interne ou un incident sur le système de refroidissement de
la peau d'étanchéité conduirait à des échauffages anormaux. Des essais
récents semblent montrer que même dans ce cas le béton pourrait supporter

FILIÈRE URANIUM NATUREL 21
aisément des températures plus élevées que celles actuellement prévues
en fonctionnement normal
IV. CONCLUSION
La mise au point de centrales électro-nucléaires industrielles pouvant
être construites et fonctionner sans aléas est une entreprise qui, même si
on se limite à un seul type de réacteur, exige une somme considérable d'ef
forts et beaucoup de temps. L'expérience française dans le domaine des
réacteurs uranium naturel-graphite-gaz carbonique a été acquise à partir
du fonctionnement des piles de Marcoule, de la construction des réacteurs
de Chinon et des travaux effectués dans les bureaux d'études et les labora
toires du CEA, de l'EDF et de l'industrie. La technique est pratiquement
acquise, la rentabilité économique ne l'est pas encore,.mais les prévisions
que l'on est en mesure de faire à ce sujet sont des plus encourageantes,
et il n'est pas téméraire d'espérer que la compétitivité avec l'énergie clas
sique peut être atteinte dès EDF4 qui doit entrer en service au milieu de
1968, et ceci sans préjuger d'une utilisation future du plutonium contenu dans le combustible irradié.
Par ailleurs, et bien que ce ne soit pas le sujet de cette conférence,
nous ne saurions passer sous silence les importantes perspectives de progrès technique et économique que l'on aperçoit dès maintenant. L'utilisation
d'éléments combustibles annulaires, refroidis extérieurement et intérieure
ment, l'intégration plus poussée du réacteur et de ses annexes dans le
caisson en béton précontraint, sont actuellement à l'étude. Les premiers
résultats sont encourageants, et devraient permettre à bref délai la réali
sation de centrales de performaces spécifiques plus élevées et de puissance
unitaire supérieure, conduisant à une réduction supplémentaire des coûts
d'investissements et du prix de revient de l'énergie.
ANNEXE
Dans cet annexe on trouvera les caractéristiques d ’ensemble des reacteurs (tableau II), les caracté
ristiques du cœur (tableau III), du combustible (tableau IV), du circuit de C O 2 (tableau V), des circuits de
vapeur (tableau VI) et des groupes turbo-alternateurs (tableau VII).
TABLEAU II
CARACTÉRISTIQUES D 'ENSEM BLE
G 2 /G 3* EDFl EDF2 EDF3 * *
Puissance électrique nette (MW) 37 68 198 480
Puissance thermique (MW) 250 300 800 1560
Rendement net {% 15 23 25 31
* Les caractéristiques données pour G2/G3 sont les caractéristiques actuelles, sensible
ment supérieures à celles du projet.
* * Les caractéristiques du cœur EDF4 sont identiques à celles d*EDF3.

22 J. HOROWITZ et J.-P. ROUX
TABLEAU П1
CARACTÉRISTIQUES DU C Œ U R
G2/G3 EDF1 EDF2 EDF3
Tonnage d'uranium (t) 135 140 240 410
Volume du cœur (m 3) 410 490 840 1380
Nombre de canaux 1200 1148 1980 2 700
Nombre d'éléments combustibles 33600 17200 23 700 41000
Puissance spécifique maximum (MW/t) 3,5 4,4 5,8 6,2
Puissance volumique moyenne (M W /m 3) 0,6 0.6 1,0 1.1
Puissance électrique spécifique
moyenne (MWe/t)
0,3 0,5 0,8 1 2
Puissance canal central (kW) 260 380 500 660
TABLEAU IV
CARACTÉRISTIQUES DU COMBUSTIBLE
G2/G3 EDF1 EDF2 EDF3
Nature du combustible U métal U métal U métal U métal
traité 0, 97° Mo 1% Mo 1% Mo
Barreau plein tube tube tube
Diamètre (mm) 31 14 X 35 18X40 23X43
Longueur d'un élément (cm) 30 60 60 60
Orientation des canaux horiz. vert. vert. vert.
Supportage couché empilé chemise
graphite
chemise
graphite
Ailettes longit. longit. chevrons chevrons
Température max. gaine (*C) 455 410 425 445
Température max. uranium (*C) 590 520 570 590
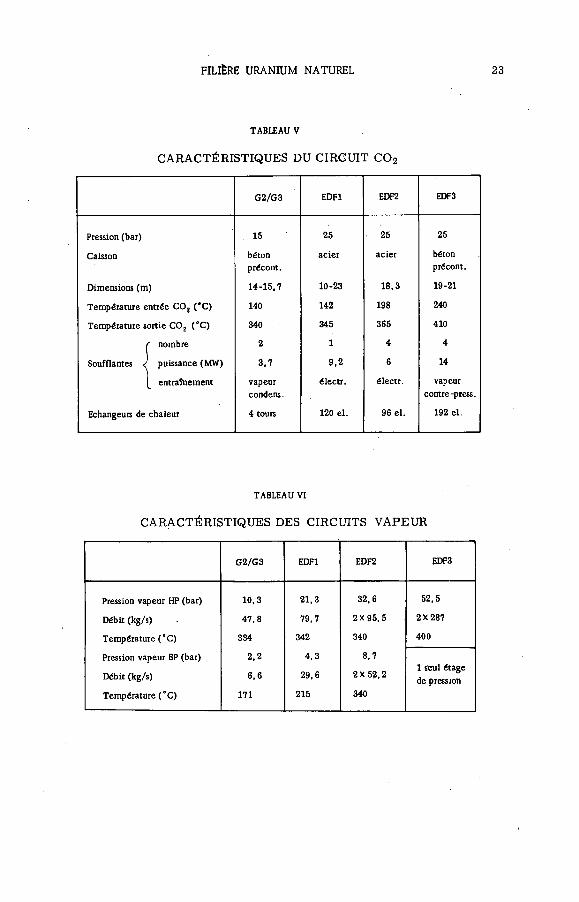
FILIÈRE URANIUM NATUREL
TABLEAU V
CARACTÉRISTIQUES DU CIRCUIT C 0 2
G2/G3 EDFl EDF2 EDF3
Pression (bar) 15 25 25 25
Caisson béton
précont.
acier acier béton
précont.
Dimensions (m) 14-15,7 10-23 18,3 19-21
Température entrée C 0 2 (*C) 140 142 198 240
Température sortie C 0 2 ( 'C) 340 345 365 410
r nombre 2 1 4 4
Soufflantes J puissance (MW) 3,7 9.2 6 14
(_ entraînement vapeur
condens.
électr. électr. vapeur
contre-press.
Echangeurs de chaleur 4 tours 120 el. 96 el. 192 el.
TABLEAU VI
CARACTÉRISTIQUES DES CIRCUITS VAPEUR
G2/G3 EDFl EDF2 EDF3
Pression vapeur HP (bar) 10,3 21,3 32,6 52,5
Débit (kg/s) 47,8 79,7 2X 95 .5 2X287
Température ("C) 334 342 340 400
Pression vapeur BP (bar) 2,2 4,3 8.7
1 seul étageDébit (kg/s) 6,6 29,6 2X 52,2
de pression
Température (°C) 171 215 340
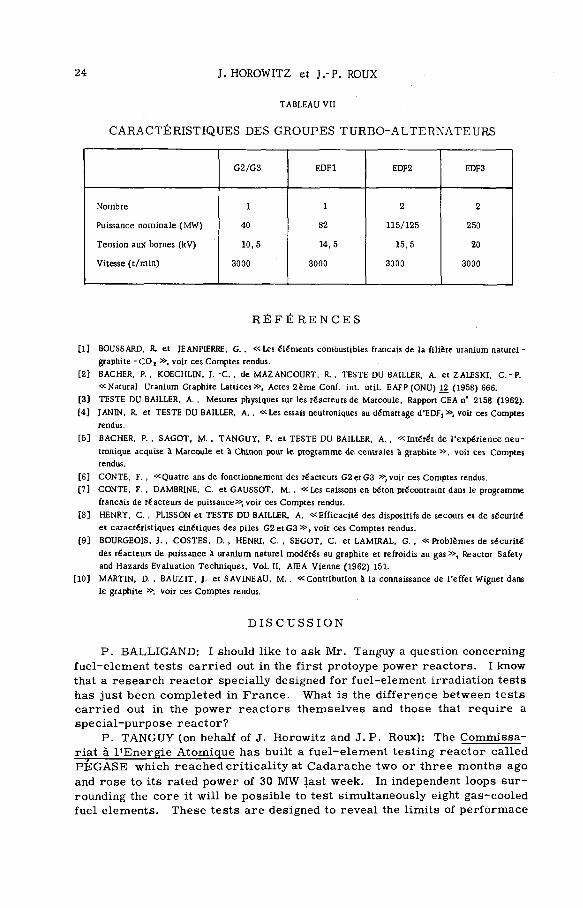
T A B LE A U VII
24 J. HOROWITZ et J.-P. ROUX
CARACTÉRISTIQUES DES GROUPES TURBO- ALTERNATEURS
G2/G3 EDF1 EDF2 EDF3
Nombre 1 1 2 2
Puissance nominale (MW) 40 82 115/125 250
Tension aux bornes (kV) 10,5 14, 5 15,5. 20
Vitesse (t/min) 3000 3000 3000 3000
R É F É R E N C E S
[1] BOUSSARD, R. et JEANPIERRE, G., « Les éléments combustibles français de la filière uranium naturel -
graphite - C 0 2 » , voir ces Comptes rendus.
[2] BACHER. P., KOECHLIN, J.-C. , de MAZANCOURT, R. , TESTE DU BAILLER, A. et ZALESKI, C.-P.
«Natural Uranium Graphite Lattices», Actes 2ème Conf. int. util. EAFP (ONU) 12 (1958) 666.
[3] TESTE DU BAILLER, A. , Mesures physiques sur les réacteurs de Marcoule, Rapport CEA n’ 2158 (1962).
[4] JANIN, R. et TESTE DU BAILLER, A. , «Les essais neutroniques au démarrage d'EDF: y>, voir ces Comptes
rendus.
[5] BACHER, P. , SAGOT, M. , TANGUY, P. et TESTE DU BAILLER, A. , «Intérêt de l'expérience neu-
tronique acquise à Marcoule et à Chinon pour le programme de centrales à graphite » , voir ces Comptes
rendus.
[6] CONTE, F. , «Quatre ans de fonctionnement des réacteurs G2etG3 », voir ces Comptes rendus.
[7] CONTE, F., DAMBRINE, C. et GAUSSOT, M. , «Les caissons en béton précontraint dans le programme
français de réacteurs de puissance», voir ces Comptes rendus.
[8] HENRY, C. , PL1SSON et TESTE DU BAILLER, A. «Efficacité des dispositifs de secours et de sécurité
et caractéristiques cinétiques des piles G 2 e tG 3 » , voir ces Comptes rendus.
[9] BOURGEOIS, J. , COSTES, D. , HENRI, C. , SEGOT, C. et LAMIRAL, G ., « Problèmes de sécurité
des réacteurs de puissance à uranium naturel modérés au graphite et refroidis au gas » , Reactor Safety
and Hazards Evaluation Techniques, Vol. II, AIEA Vienne (1962) 151.
[10] MARTIN, D. , BÁUZIT, J. et SAVINEAU, M. . «Contribution à la connaissance de l’effet Wigner dans
le graphite » , voir ces Comptes rendus.
D I S C U S S I O N
P. BALLIGAND: I should like to ask Mr. Tanguy a question concerning
fuel-element tests carried out in the first protoype power reactors. I know
that a research reactor specially designed for fuel-element irradiation tests
has just been completed in France. What is the difference between tests
carried out in the power reactors themselves and those that require a
special-purpose reactor?
P. TANGUY (on behalf of J. Horowitz and J. P. Roux): The Commissa
riat à l'Energie Atomique has built a fuel-element testing reactor called
PEGASE which reached criticality at Cadarache two or three months ago
and rose to its rated power of 30 M W last week. In independent loops sur
rounding the core it will be possible to test simultaneously eight gas-cooled
fuel elements. These tests are designed to reveal the limits of performace

FILIÈRE URANIUM NATUREL 25
for fuel elements for stations planned or under construction, by subjecting
them to conditions of temperature and power considerably in excess of what
they will actually undergo in the power reactors.
The tests conducted in the power reactors themselves involve large
numbers of fuel elements, but on the other hand the safety requirements
imposed on these reactors prevent the elements from being subjected to
the very stringent trials that can be carried out in PEGASE .
J. T E R PSTR A : Could Mr. Tanguy or someone from Electricité de
France describe the thermal insulation of the EDF3 pre-stressed concrete
vessel?
G. LAM IRAL : The thermal insulation will consist of an assembly of
special concrete bricks with a pumice-stone base; this will be lined on the
inside with an expandable leak-proof metal casing.
M. R. SRINIVASAN: What size of plant does the cost figure of F 1000
refer to, and when will such a station be commissioned?
P. TANGUY: The reference was to a 500 MW(e) station of the EDF4
type, which could go into service about 1968 or 1969.
A-K. HA N N ER Z : France is building CQj- cooled power reactors of
two types - graphite-moderated plants and the EL4 type moderated by heavy
water. Could you compare the economic potentialities of these two types?
P. TANGUY: EL4, which is a prototype reactor of 70 MW(e), is due to
reach criticality in 1966. The first loading will consist of slightly enriched
uranium oxide clad in stainless steel. However, the intention is that the
heavy-water reactors now being studied in France, of which EL4 is the
first, should use natural uranium and it is therefore essential to perfect
a low-absorption cladding. Studies are at present under way on beryllium
and other possible clads, such as iron-aluminium alloys and zirconium
alloys. These few remarks should suffice to show that the two types of re
actor are far from being in the same stage of development. It is impossible,
at present, to make a really useful economic comparison, although we do
feel that heavy-water reactors have great economic possibilities.


OPERATING EXPERIENCE IN NUCLEAR POWER- PLANTS WITH BOILING-WATER REACTORS
R. J. ASCHERL
GENERAL ELECTRIC COMPANY, SAN JOSE, CALIF.
Abstract — Résumé — Аннотация — Resumen
OPERATING EXPERIENCE IN NUCLEAR POWER-PLANTS WITH BOI LING - W A T ER REACTORS. Asignificant
amount of operating experience has now been accumulated by boiling-water-reactor power plants.
By the end of 1962, over 2200 million kWh of electricity have been generated by three plants operating
on utility.system - Dresden Nuclear Power Station, Commonwealth Edison Company, Morris, Illinois; Vallecitos
Atomic Power Plant, Pacific Gas and Electric Company and General Electric Company, Pleasanton, California;
and Kahl Nuclear Power Station, Rheinisch Westfálisches Elektrizit&tswerk and Bayemwerk, Kahl-am-Main,
West Germany.
В oiling-water-reactor power-plant performance, under routine electric-utility operating conditions, has
been excellent. Reactor and plant availability and capacity factor provide a sound basis for anticipation of
continuing reliable performance from boiling-water-reactor power stations.
During 1963, four additional boiling-water-reactor plants will begin power operation - Big Rock Point
Nuclear Plant, Consumers Power Company, Charlevoix, Michigan; Humboldt Bay Plant Nuclear Unit, Pacific
Gas and Electric Company, Eureka, California; Garigliano Nuclear Power Station, Società Elettronucleare
Nazionale, Scauri, Italy; and Japan Power Demonstration Reactor, Japan Atomic Energy Research Institute,
Tokai Mura, Japan. The start-up and initial operation of these plants confirms the expectation of reliable
performance established by Dresden, Kahl, and Vallecitos.
Performance records of Dresden, Kahl and Vallecitos have clearly proved the stability and safety of
boiling-water reactors. Additionally, radiation levels within the plant and in the environs have been
significantly below limits established by operating licences.
Simplicity and ease of operation of boiling-water reactors has been confirmed. Load following charac
teristics of the Dresden dual-cycle boiling-water reactor have been excellent.
Major and minor maintenance and repair work can be accomplished by ordinary craft unions, and without
undue hardship or time limits caused by radioactivity exposure considerations. Recent full-scale inspection
and overhaul of the Dresden turbine provided no maintenance problems, after over 12 000 h of operation on
direct-cycle steam and after operation with known failed fuel elements in the reactor.
EXPÉRIENCE ACQUISE DANS L'EXPLOITATION DES RÉACTEURS A EAU BOUILLANTE. On a maintenant
acquis une expérience appréciable dans l'exploitation des centrales équipées de réacteurs à eau bouillante.
Vers la fin de 1962, on avait produit plus de 2,2* 109 kWh dans trois centrales nucléaires rattachées à des
réseaux de distribution: la centrale de Dresden (Commonwealth Edison Company, Morris, Illinois), la centrale
de Vallecitos (Pacific Gas and Electric Company and General Electric Company, Pleasanton, Californie) et la
centrale de Kahl (Rheinish-Westfaiisches Elektrizitatswerk et Bayemwerk, à Kahl-sur-le-Main, République
fédérale d'Allemagne).
Le rendement de ces réacteurs à eau bouillante, exploités dans les conditions normales de production
d'électricité, est excellent. On peut donc s'attendre que les centrales à eau bouillante continueront d'être
sUres, étant donné le facteur de disponibilité et le facteur de puissance des réacteurs et des installations de ce
type.
Au cours de 1963, quatre nouvelles centrales équipées de réacteurs à eau bouillante entreront en service:
la centrale de Big Rock Point (Consumers Power Company, Charlevoix, Michigan), la centrale de HumboldtBay
(Pacific Gas and Electric Company, Eureka, Californie), la centrale de Garigliano (Società Elettronucleare
Nazionale, Scauri, Italie) et la centrale de démonstration japonaise (Institut de recherches nucléaires du Japon,
Tokai Mura, Japon).
Les résultats obtenus lors du démarrage et pendant le fonctionnement initial de ces installations con
firment les espoirs suscités par les centrales de Dresden, Kahl et Vallecitos.
27

28 R.J. ASCHHRL
Les journaux de marche des centrales de Dresden, Kahl et Vallecitos mettent en évidence la stabilité
et la sécurité des réacteurs à eau bouillante. De plus, les niveaux de rayonnements dans la centrale et aux
alentours restent nettement au-dessous des limites fixées par les permis d'exploitation.
La simplicité et la facilité d'exploitation des réacteurs à eau bouillante se sont confirmées. La rapidité
de réponse du réacteur de Dresden aux variations de la demande est excellente.
Aucun des travaux d'entretien et de réparation, quelle que soit leur importance, n'exige de qualification
spéciale ni ne comporte de risques de radioexposition excessifs. L'inspection générale et la révision de la
turbine de la centrale de Dresden n'ont révélé aucun problème d'entretien après 12 000 h de fonctionnement
avec la vapeur en cycle direct. Or, on avait continué l'exploitation après avoir constaté que des cartouches de
combustible étaient détériorées.
ОПЫТ ЭКСПЛУАТАЦИИ КИПЯЩАГО РЕАКТОРА. К настоящему времени приобретен значительный опыт в
эксплуатации электростанций с кипящим реактором.
К концу 1962 года произведено свыше 2200 млн.квт.ч электроэнергии на трех электростанциях
энергосистемы коммунального обслуживаниягна Дрезденской атомной электростанции, "Коммонвелс Эдисон
компани", Моррис, Иллинойс, на атомной электростанции Валлееитос,"Пасифик газ энд электрик ком-
пани", Плезантон, Калифорния, и на Кальской атомной электростанции, "Рейниш вестфалишес электри-
цитетсверк унд байернверк", Каль-на-Майне, Западная Германия.
Рабочая характеристика кипящего реактора атомной электростанции при обычном режиме работы
в коммунальной энергосистеме очень хорошая. Коэффициент использования и мощности реактора и
электростанции дает твердое основание полагать, что электростанции с кипящими реакторами являются
надежными с точки зрения их рабочей характеристики.
В течение 1963 года будут введены в строй четыре дополнительные электростанции с кипящими
реакторами: атомная электростанция в Биг Рок Пойнт, "Консьюмерс пауэр компани", Шарльвуа, Мичиган,
атомная энергетическая установка в Хамболдт Бей, "Пасифик газ энд электрик компани", Юрика, Кали
форния, атомная электростанция в Гаригьяно, Национальное общество по атомной энергии, Скаури,
Италия,и Японский демонстрационный энергетический реактор. Японский научно-исследовательский
институт по атомной энергии, Токаи-Мура, Япония. Пуск и первоначальная эксплуатация этих элек
тростанций подтверждают предположение о надежности^их работы, что уже продемонстрировано атомными
электростанциями в Дрездене, Кале и Валлеситосе.
Рабочая характеристика атомных электростанций в Дрездене, Кале и Валлеситосе является на
глядным доказательством стабильности и безопасности кипяших реакторов. Кроме того, уровни ра
диации на самой электростанции и в окружающей среде значительно ниже пределов, установленных
лицензиями на эксплуатацию.
Подтвердились простота и легкость эксплуатации кипящих реакторов. Характеристика контроля
за нагрузкой у кипящего реактора с двойным циклом Дрезденской электростанции оказалась очень
хорошей. *
Крупные и небольшие работы по уходу и ремонту могут осуществляться обычными ремонтными груп
пами без вредных последствий или без лимита времени, связанными с соображениями радиоактивного
облучения. В результате проведенных недавно полной инспекции и капитального ремонта турбины
Дрезденской электростанции не обнаружено никаких ремонтных проблем как после более 12 000-часовой
эксплуатации с прямым паровым циклом, так и после эксплуатации с заведомо неисправными топливными
элементами в реакторе.
EXPERIENCIA ADQUIRIDA CON LA EXPLOTACIÓN DE REACTORES DE AGUA HIRVIENTE. El autor
sefiala que la experiencia adquirida con la explotación de centrales nucleoeleonicas que utilizàn reactores de
agua hirviente es ya bastante considerable.
En efecto, al finalizar el aflo 1962 se habían generado más de 2,2* 109 kW h en tres centrales núcleo-
eléctricas integradas en redes de distribución: la central nucleoeléctrica de Dresden (Commonwealth Edison
Company, Moríis, Illinois), la central nucleoeléctrica de Vallecitos (Pacific Gas and Electric Company,
Pleasanton, California) y la central nucleoeléctrica de Kahl (Reinisch-Westfalisches Elektrizitátswerk y
Bayernwerk A. G . , Kahl-am-Main, República Federal de Alemania).
El rendimiento de estas centrales explotadas en condiciones normales de producción de electricidad es
excelente. Los factores de disponibilidad y de capacidad de los reactores y de las plantas constituyen una
base firme para prever que las centrales nucleoeléctricas dotadas de reactores de agua hirviente funcionarán a
régimen continuo en condiciones de seguridad.
BOILING-WATER REACTORS 29
En 1963 entrarán en servicio cuatro nuevas centrales equipadas con reactores de agua hirviente: la central
nucleoeléctrica de Big Rock Point (Consumere Power Company, Charlevoix, Michigan), la central nucleoeléc-
trica de Humboldt Bay (Pacific Gas and Electric Company, Eureka, California), la central nucleoeléctrica de
Garigliano (Societá Elettronucleare Nazionale, Scauri, Italia), y el reactor de potencia japonés para fines de
demostración (Instituto de Investigaciones Nucleares, Tokai Mura, Japón). La puesta en marcha y el funciona
miento inicial de estas centrales confirma las esperanzas despertadas por las centrales de Dresden, Kahl y
Vallecitos.
Los registros de rendimiento de las centrales de Dresden, Kahl y Vallecitos han puesto claramente de
manifiesto la estabilidad y seguridad de los reactores de agua hirviente. Además, los niveles de radiación
dentro de la central y en sus alrededores se han mantenido muy por debajo de los limites fijados en los per
misos de explotación.
Ha quedado confirmada la sencillez y facilidad de explotación de los reactores de agua hirviente. La
rapidez de la respuesta del reactor con doble ciclo de Dresden a las fluctuaciones de la demanda es excelente.
Ninguno de los trabajos de conservación y reparación, sea cual fuere su importancia, exige calificaciones
especiales ni entraña riesgos de irradiación excesivos. La inspección general y la revisión de la turbina de la
central de Dresden puso de manifiesto la inexistencia de problemas de conservación después de más de 12 000 h
de funcionamiento con el vapor en ciclo directo, a pesar de que la explotación prosiguió después de haberse
comDtobado algunas fallas en los elementos combustibles.
1. INTRODUCTION
Over the past few years, sufficient operating experience has been accu
mulated with boiling-water-reactor power plants to support a number of
significant and highly favourable conclusions regarding this reactor type
as applied in central stations in utility service. Perhaps of equal signifi
cance, this extensive operating experience also has furnished a firm base
for complete elimination of areas of concern and of some unknowns that
existed before the operation of these plants.
Through the end of 1962, over two thousand, two hundred million gross
kilowatt-hours were generated by three boiling-water-reactor plants oper
ating on utility systems — Dresden Nuclear Power Station, owned and oper
ated by the Commonwealth Edison Company at Morris, Illinois, Kahl Nu
clear Power Station, owned and operated by Rheinisch Westfálisches Elektri-
zitâtswerk and Bayernwerk, at Kahl-am-Main, West Germany, and Valle
citos Atomic Power Plant. The nuclear portion of this plant is primarily
devoted to testing of advanced fuel and is owned and operated by General
Electric. Pacific Gas and Electric Company owns and operates the remainder of the plant. Earlier this year, two more boiling-water-reactor
plants were placed in service: the Big Rock Point Nuclear Plant, owned
and operated by the Consumers Power Company at Charlevoix, Michigan,
and the Humboldt Bay Power Plant Nuclear Unit, owned and operated by
the Pacific Gas and Electric Company, located at Eureka, California.
The over-all performance of the boiling-water reactors in these nuclear
power-plants under standard electrical-utility operating conditions has been
uniformly excellent. Their safety, reliability, ease of maintenance by con
tact methods and high degree of availability have been clearly demonstrated.
To fully appreciate the meaning and significance of this general statement,
it is useful to. consider performance of these reactors in more detail.
30 R. J. ASCHERL
2. RELIABILITY OF BOILING-WATER REACTORS IN NUCLEAR POWER-
PLAN T SERVICE
Among the many important criteria for evaluating the performance of
a particular reactor type when applied to electrical generation service, one
of the most significant is reliability - the capability to operate over long
periods of time with a minimum outage time requirement. Operating sta
tistics from the Dresden, Kahl, Big Rock Point, and Humboldt Bay plants
clearly illustrate the high reliability of boiling-water reactors. Operating experience at Dresden, for example, shows the boiling-water-reactor plant
has a reliability as good as the best coal-fired plant on the Commonwealth
Edison system. There are three principal reasons for this: the relative
simplicity of the boiling-water-reactor steam supply system, the inherently
stable operating characteristics of the boiling-water reactor itself, and the
dual safety circuitry with-its high-quality components and its demonstrated
capability to effectively eliminate spurious scrams.
Another crucially important facet of "reliability" is the demonstrated
capability of the reactor safety devices to operate without fail to shut down
the reactor whenever such a shut-down is required. There lias never been
an instance of failure of a reactor safety device in any of these boiling-water
reactors. Specifically, there never has been an instance of failure of a con
trol rod to insert on scram signal and reduce reactivity at the specified rate. This is a unique advantage of General Electric-designed power re
actors which few others can match.
In the early operation of Dresden, some mechanical and material prob
lems with the locking-piston control-rod drives developed. These problems
were readily corrected and valuable information regarding various alloys
was disseminated broadly to the benefit of most other reactor manufacturers
and operators. Control-rod drives of similar design are in service at the
Big Rock Point and Humboldt Bay plants. They have had their share of
minor difficulties during the debugging and start-up phases, but never have
they failed to perform their safety-oriented function; never have they failed
to scram.
3. CONTACT M AINTENANCE AND RADIATION EXPOSURE
The significant capital and construction cost advantages of the direct-
cycle boiling-water reactors and to a lesser extent the dual-cycle system,
are obvious and generally accepted. Perhaps less weU known is the fact
that experience at Vallecitos and Dresden clearly demonstrates that contact
maintenance has been routinely carried out on turbines and all the other
equipment in such systems without significant radiation exposure to per
sonnel. This is particularly significant in the Dresden experience, where
turbine overhaul was accomplished in approximately the same time that
would have been required on a conventional turbine and without significant
radiation exposure to personnel, despite the fact that over many months
of operation before the overhaul the reactor was operating with several fuel-
cladding failures, and the steam passing through the turbine contained fission
BOILING-WATER REACTORS 31
products. These, of course, were subsequently removed either through
the demineralizers or the non-condensable gas-removal system.
Another important and interesting outcome of the overhaul of the Dres
den turbine, with its detailed inspections, was the verification that there
was essentially no corrosion or erosion of blades and diaphragms. Based
on these recent findings, Commonwealth Edison Company has elected to
place the Dresden turbine-generator on the same preventive maintenance
schedule that is used for their conventional units. In addition, the General
Electric Turbine Division is now designing and is ready to build turbine-
generators for these systems in sizes of at least 600 M W .
Further, Dresden experience has indicated that large boiling-water
reactors can operate at full power and with a significant number of leaking
fuel elements without any significant radiological effects on their environs. For example, the Dresden stack emission of radiogases for the whole ~oï~
1962 averaged only about l/300th of the permissible emission rate estab
lished in the USAEC licence. The calculated maximum off-plant dose for
all of 1962 wos about 0.5 mrem, compared to the natural background radi
ation present of about 150 mrem/yr.
The Dresden air release was indistinguishable in the ion chamber and
air filter measurements at the 18 environmental monitoring stations, which
are situated up to 15 miles from the plant. Milk samples from three farms
and vegetation samples showed radioactivity consistent with the National
Surveillance Network samples, indicating no detectable contributions attri
butable to the nuclear-power station.
Similarly, the Dresden liquid-waste experience was most favourable.
Samples taken upstream and downstream of the plant of water, silt, plankton
and algal slime indicated no increase in radioactivity due to plant operation.
Of course, most of the plant water is re-used.
4. POTENTIAL FOR UPRATING
Another significant advantage arising from boiling-water-reactor ex
perience is the high potential for uprating at relatively low cost. Illustrative
examples of this point are the following:
(1) With the addition of recirculating pumps and change in baffling within
the reactor vessel, the thermal output of the Vallecitos Boiling Water
Reactor was increased from about 25 MW(t) to about 40 MW(t).
(2) By making minor changes in the Dresden turbine, output was increased
from 626 MW(t) and 180 MW(e) to 700 MW(t) and 215 MW(e). The reactor
system has been demonstrated capable of operation to at least 270 MW(e).
(3) By adding more fuel and conducting additional thermal performance
tests on the core, it is expected that the Big Rock Point Plant can be up
rated from 50 M W(e) to about 75 M W(e) at 1500 lb/in2 .
(4) By conducting additional tests to evaluate steam carry-under, it is ex
pected that Humboldt Bay Nuclear Unit can be uprated from its already
demonstrated 53 M W(e) to at least 60 M W (e) and probably 70 MW(e).

32 R. J. ASCHERL
5. EASE O F O P E R A T IO N AND M A IN T E N A N C E O F BOILING-WATER
R E A C TO R S
Experience has shown that ease of operation and maintenance is an im
portant characteristic of the boiling-water reactor. Several illustrative
examples follow.
Early experience in the operation of some large reactors indicated that
flux cycling due to xenon transients |is a significant operating problem, im
posing a heavy burden on the operator and sometimes increasing the oper
ating manpower requirements. In contrast, operations at Dresden demons
trate that with the large boiling-water reactor the flux distribution remains
essentially constant once the basic control-rod patterns are established.
In practice, the movement of a small increment of one control rod once
each day is all that is required. As an aid to establishing appropriate control-
rod patterns, the in-core ion chambers have proved to be an extremely
useful operating tool. These miniature ion chambers are interspersed
through the core and provide an accurate measure of radial and axial flux
profiles within the core on a continuous basis. They also provide an im
portant mechanism for achieving the lowest possible fuel-cycle costs.
The ease of operation of the boiling-water reactor also has been demons
trated in "abnormal" operating conditions. A pertinent illustration has
been recorded in Dresden operating experience. A tornado passed near
the Station, tore the roofing on the turbine building and intake structure
and knocked out a transformer which fed two of the four reactor recircu
lating pumps. Reactor power decreased automatically to half of rated power
and the turbine-generator did likewise. Upon restoring auxiliary power to
the pumps, the operator placed them in service. In turn, the reactor and
turbine-generator recovered to full power. The only controls manipulated
during this entire process were those required to return the pumps to ser
vice. This experience also demonstrated the excellent load-following charac
teristics of a dual-cycle boiling-water-reactor system.
The Big Rock Point and Humboldt Bay plants provide more examples
of the ease with which a boiling-water reactor can be operated. In each
case, the controls were designed for one-man operation, and actual practice
has proven the validity of the design. Further, the basic-shift operating
crew consists of only three operators and one technician.
A significant amount of maintenance experience on B W R 's has been
accumulated during the past few years. Also important are the improve
ments that are continually being made to simplify maintenance procedures
further. Typical examples of these are:
(1) Control drives cannowbe removed from the bottom of the reactor vessel
of our most recently designed plants such as Bodega, KRB and Tarapur,
without removing the vessel head. Thus, the time required to remove a
drive for maintenance and replace it with a spare has beçn reduced to about
four hours (not including cool-down time).
(2) Because of recent improvements in hydraulic stud tensioners, reactor-
vessel heads designed to take advantage of this bolting method can be in
stalled in 20 h.

BOILING-WATER REACTORS 33
(3) In-core ion-chamber assemblies are now fabricated so that their signal
cables penetrate the vessel at the bottom. This means that these irradiated
assemblies do not have to be removed when the reactor-vessel head
is removed.
6. CONCLUSION
In conclusion, operating experience with boiling-water reactors in nu
clear power-plants clearly demonstrates that they are highly reliable, have
a remarkable availability record, an impeccable record of safety perfor
mance and a significant history demonstrating ease of operation and main
tenance. Their adaptability to continuing upgrading and new technology such
as superheat is unmatched. On the over-all picture, the boiling-water re
actor has no peer in today's nuclear power-plant application.
D I S C U S S I O N
U. ZELBSTEIN : Were the only fuel-element failures those which af
fected the experimental elements ? I should also like to know whether any
experiments have been carried out on plutonium-enriched elements; if so,
whether these have raised any special problems; and what the consequences
of such problems were from the operational point of view.
P. E D DY ( on behalf of R. J. Ascherl): The failures involved both ex
perimental and developmental elements. The zirconium-clad U 02 production
fuel elements gave only 0.007% failures. The developmental elements that
failed were of stainless-steel clad U 0 2 . None of these failures resulted
in operating problems or hazards, and the rélease of radioactive material
to the environment was about 0.02% of the limit provided for in the licence.
No plutonium elements were loaded in the DRESDEN reactor and I have
no knowledge personally of plutonium fuel. There have been some failures
in the Plutonium Recycle Test Reactor (PRTR) at Hanford, I believe, and
you may wish to discuss them with the USAEC.
C. A. PURSEL: In fact, the only failure of a plutonium-bearing fuel
assembly that I know of was the one which occurred in the PRTR some time
during the last few months, and all I know about that is that it took some
time to clean up the system.
G. B. SCURICINI: Will the system for removing control-rod drives
at K R B , Bodega Bay and Tarapura be the same as in the SENN reactor?
P. ED D Y : I am not sure how the control-rod drives are removed in
the SENN reactor, although I understand that the system represents a major
advanêe over the DRESDEN reactor. At SENN the drives can be removed
for inspection, maintenance and so on in a fraction of the time required at
DRESDEN.
B. SAITCEVSKY: I should like to know two figures for DRESDEN: first,
the availability, and secondly, the burn-up obtained with the first loading.
P. EDDY : I can best answer the first part of your question by quoting
a statement of the Commonwealth Edison Company. "For the year 1962.
DRESDEN 'S gross electrical output was 1250 million kWh with a capacity

34 R. J. ASCHERL
factor of 73% and availability of 79.4%. For the eleven-month period prior
to refuelling the capacity factor was 85.6% and availability was 93.1%. The
rather high capacity factor reflects our desire to obtain high fuel burn-up
for fuel development research, to gain experience in continuous high-level power operation of the reactor and to take advantage of AEC high plutonium
buy-back price. The six largest coal-fired units (rated at 315 to 340 M W net)
on our system had an average capacity factor of 67% and an average avail
ability of 82.4% for 1962. However, two of these units were put into service
during the year and were having the usual problems attendant with initial
operation. This adversely affected the capacity factor and availability of
the group. The coal-fired unit with the best performance of 1962 had a
capacity factor of 75.5% and availability of 87.9%. These figures indicate that Dresden Station has demonstrated reliable operating performance and
in this respect can hold its own with coal-fired units. "
The average burn-up for the 40% of fuel discharged was 6100 M W D/t.
A .K . H A N N E R Z : I have heard that after the last fuel charge in
D R ESDEN there was considerable delay in going to full power because of
crud in the inlet water and ion-exchange beds. Could you suggest how this
might be avoided in future?
P. E D D Y : There was some delay in performing tests of full-power
demonstration (which is greater than the current rated turbine power) be
cause of a pressure drop in the condensate demineralizers. The plant oper
ator wanted to continue using the resin beds, which became quite dirty
during the initial operating period, after refuelling. This limitation could
have been eliminated at any time by putting in fresh resin. There were
no abnormal amounts of crud in the system.
In any event the rise to full power after the refueUing outage was planned
to take several weeks. It is customary to hold half-power for a while'
so as to calibrate in-core instrumentation. In addition, a comprehensive
series of physics tests necessitated a progressive rise to full power.
K . E F F A T : What has been your experience with radioactive steam
in the turbine and other parts of the steam circuit? How does it affect the
operation of the plant and maintenance of the various components of the
system?
P. EDDY : There has been no difficulty due to radioactive steam either
in the turbine or in other parts of the steam system. The turbine was over
hauled by the regular turbine maintenance crew working a 56-h week, and
the average exposure per shift was of the order of 2-3 mrem. The turbine
had of course become contaminated with radioactive corrosion products
and special precautions, such as covering the parts with plastic sheets,
were taken to prevent the spread of contamination. Craftsmen engaged
in welding or grinding wore respiratory masks. However, these precau
tions did not add to the time or cost of the job.
The DRESDEN turbine is provided with a special decontamination system. This system was not used, however, and it is believed now that it will not
be required.
A. SCHNEIDER : I have two questions. First, do the boiling-water
reactors have a system for continuous detection of failed fúel elements or
is the monitoring done exclusively by radiochemical analyses ? Secondly,

BOILING-WATER REACTORS 35
has radiolysis of the water (steam) been a serious problem, and if so, has it been remedied satisfactorily by oxygen-hydrogen recombiners?
P. ED D Y : The main method of detecting fuel-element failure is con
tinuous monitoring of the off-gas to the stack. Any increase in fission gases
can be detected very rapidly, and the off-gas line is closed when the, content
of fission gases rises to a certain level (well below the limit provided for
in the licence). The primary water is routinely sampled and analysed for
radioactive isotopes of iodine. By manipulation of the control blades the
fluxcan be "titled" to establish the general location of a failure.
It is in fact known that the D R E S D E N reactor operated with a small
number of failed fuel elements for some time before shut-down.
So far as I know, radiolysis of water or steam has never presented
a problem; but I might ask Dr. Weckesser to comment on this part of your question.
A. W ECKESSER : The activity of the gases released is also indicated
by a check on the water itself. Normally the activity in the off-gas is fairly
low at the Kahl plant.
P. ERKES: What programme is being conducted with the 40% of fuel
unloaded from the D R E SD E N core, with a view to comparing theory and
operational results on plutonium production?
P. ED D Y : Some work of analysis and evaluation has been done, and
a programme similar to the one sponsored by the United States Atomic
Energy Commission for evaluation of the YANKEE fuel is being considered.
It will apply not only to D R E SD E N but to all boiling-water reactors. Un
fortunately I do not know how far advanced it is.

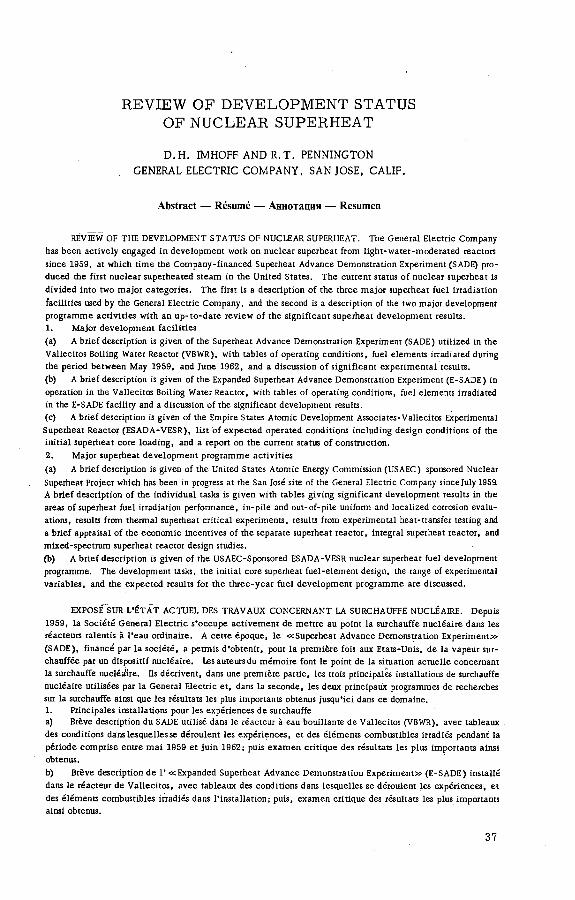
REVIEW OF DEVELOPMENT STATUS OF NUCLEAR SUPERHEAT
D .H . IMHOFF AND R.T. PENNINGTON
GENERAL ELECTRIC COMPANY, SAN JOSE, CALIF.
Abstract — Résumé — Аннотация — Resumen
REVIEW OF THE DEVELOPMENT STATUS OF NUCLEAR SUPERHEAT. The General Electric Company
has been actively engaged in development work on nuclear superheat from light-water-moderated reactors
since 1959, at which time the Company-financed Superheat Advance Demonstration Experiment (SADE) pro
duced the first nuclear superheated steam in the United States. The current status of nuclear superheat is
divided into two major categories. The first is a description of the three major superheat fuel irradiation
facilities used by the General Electric Company, and the second is a description of the two major development
programme activities with an up-to-date review of the significant superheat development results.
1. Major development facilities
(a) A brief description is given of the Superheat Advance Demonstration Experiment (SADE) utilized in the
Vallecitos Boiling Water Reactor (VBWR), with tables of operating conditions, fuel elements irradiated during
the period between May 1959, and June 1962, and a discussion of significant experimental results.
(b) A brief description is given of the Expanded Superheat Advance Demonstration Experiment (E-SADE) in
operation in the Vallecitos Boiling Water Reactor, with tables of operating conditions, fuel elements irradiated
in the E-SADE facility and a discussion of the significant development results.
(c) A brief description is given of the Empire States Atomic Development Associates-Vallecitos Experimental
Superheat Reactor (ESADA-VESR), list of expected operated conditions including design conditions of the
initial superheat core loading, and a report on the current status of construction.
2. Major superheat development programme activities
(a) A brief description is given of the United States Atomic Energy Commission (USAEC) sponsored Nuclear
Superheat Project which has been in progress at the San José site of the General Electric Company since July 1959
A brief description of the individual tasks is given with tables giving significant development results in the
areas of superheat fuel irradiation performance, in-pile and out-of-pile uniform and localized corrosion evalu
ations, results from thermal superheat critical experiments, results from experimental heat-transfer testing and
a brief appraisal of the economic incentives of the separate superheat reactor, integral superheat reactor, and
mixed-spectrum superheat reactor design studies.
(b) A brief description is given of the USAEC-Sponsored ESADA-VESR nuclear superheat fuel development
programme. The development tasks, the initial core superheat fuel-element design, the range of experimental
variables, and the expected results for the three-year fuel development programme are discussed.
EXPOSÉ SUR L'ÉTAT ACTUEL DES TRAVAUX CONCERNANT LA SURCHAUFFE NUCLÉAIRE. Depuis
1959, la Société General Electric s’occupe activement de mettre au point la surchauffe nucléaire dans les
réacteurs ralentis à l'eau ordinaire. A cette époque, le «Superheat Advance Demonstration Experiment»
(SADE), financé par la société, a permis d'obtenir, pour la première fois aux Etats-Unis, de la vapeur sur
chauffée par un dispositif nucléaire. Les auteurs du mémoire font le point de la situation actuelle concernant
la surchauffe nucléaire. Ils décrivent, dans une première partie, les trois principales installations de surchauffe
nucléaire utilisées par la General Electric et, dans la seconde, les deux principaux programmes de recherches
sur la surchauffe ainsi que les résultats les plus importants obtenus jusqu*ici dans ce domaine.
1. Principales installations pour les expériences de surchauffe
a) Brève description du SADE utilisé dans le réacteur à eau bouillante de Vallecitos (VBWR), avec tableaux
des conditions dans lesquelles se déroulent les expériences, et des éléments combustibles irradiés pendant la
période comprise entre mai 1959 et juin 1962; puis examen critique des résultats les plus importants ainsi
obtenus.
b) Brève description de 1* «Expanded Superheat Advance Demonstration Experiment» (E-SADE) installé
dans le réacteur de Vallecitos, avec tableaux des conditions dans lesquelles se déroulent les expériences, et
des éléments combustibles irradiés dans l'installation; puis, examen critique des résultats les plus importants
ainsi obtenus.
37

38 D. H. IMHOFF and R. T. PENNINGTON
c) Brève description de Empire States Atomic Development Associates - Vallecitos Experimental Superheat
Reactor (ESADA-VESR), liste des conditions dans lesquelles on compte effectuer les expériences, notamment
conception de la charg'e initiàle du coeur du surchauffeur; puis, description de l'état actuel de la construction
du dispositif.
2. Principaux programmes de recherches sur la surchauffe
a) Brève description du projet de surchauffe nucléaire patronné par la Commission de l*énergie atomique
et en cours de réalisation, depuis juillet 1959, au centre de San José, créé par la General Electric. Aperçu
des diverses tâches, avec tableaux des principaux résultats obtenus en ce qui concerne le rendement du com
bustible nucléaire utilisé pour la surchauffe, évaluations de la corrosion uniforme et localisée observée dans
la pile et hors de la pile, et tableaux des résultats obtenus lors d'expériences critiques de surchauffe thermique
et lors des essais expérimentaux de transfert de chaleur; enfin, bref examen des avantages économiques que
présentent, d'après les études, les réacteurs à surchauffe séparée, les réacteurs à surchauffe intégree et les ré
acteurs à surchauffe à spectre mixte.
b) Brève description du programme de mise au point des combustibles pour la surchauffe nucléaire, exécuté
sous l'égide de la Commission de l'énergie atomique par ESADA-VESR. Examen des travaux de recherche,
de l'étude des éléments combustibles du cœur initial, de la gamme des variables expérimentales et des résul
tats que l'on compte obtenir de l'exécution de ce programme de trois ans.
ОБЗОР РАЗРАБОТКИ ВОПРОСА О ЯДЕРНЫХ ПЕРЕГРЕВАТЕЛЯХ. Начиная с 1959 года компания "Дженерал
электрик" активно занималась проведением работы в области ядерного перегрева на реакторах с за
медлителем из обычной воды. За этот период в США впервые был произведен ядерный перегретый пар
в ходе проведения усовершенствованного демонстрационного эксперимента с перегревом ча установке
SADE. Этот проект финансировался компанией. Нынешнее состояние с ядерным перегревом подразде
ляется на две главные категории. Первая является описанием трех основных установок по облучению
перегретого топлива, используемых компанией "Дженерал электрик", и вторая - описанием двух глав
ных разработанных программ деятельности, вместе с обзором по состоянию на сегодняшний день зна
чительных результатов развития в области перегрева.
1 . Главные усовершенствованные установки: ^
а) Даэтся краткое описание эксперимента (SADE) на Валлеситосском реакторе с кипящей водой
(VBW R), приводятся таблицы эксплуатационных условий, данные о топливных элементах, облученных
в период между маем 1959 года и июнем 1962 года, и итоги обсуждения значительных эксперименталь
ных результатов.
б). Дается краткое описание расширенного усовершенстованного демонстрационного эксперимента
с перегревом (E-SADE) при работе Валлеситосского реактора с кипящей водой, приводятся таблицы
эксплуатационных условий, данные о топливных элементах, облученных на установке E-SADE, и итоги
обсуждения значительных результатов проделанной работы.
в) Дается краткое описание реактора Эмпайр Стейтс Атомик Девелопмент Ассошиейтс-Валлеситос-
ского экспериментального реактора с перегревом (ESAD-VESR), приводится список ожидаемых рабочих
условий, включая конструкционные условия первоначальной загрузки активной зоны с перегревом, и
отчет о текущем состоянии строительных работ.
2 . Главные виды деятельности по программе развития реактора с перегревом:
а) Дается краткое описание ядерного проекта с перегревом, осуществляемого при поддержке Ко
миссии по атомной энергии, который находится в стадии осуществления с июля 1959 года на уста
новке "Дженерал Электрик Компани" в Сан-Хосе. Приводятся краткое описание отдельных задач вместе
с таблицами, содержащими значительные результаты проделаной работы в ооласти характеристики об
лучения топлива при перегреве, оценки однородной и локализованной коррозий внутри и вне реактора,
результаты критических экспериментов с тепловым перегревом, результаты экспериментальной пере
дачи тепла и краткая оценка экономических выводов, полученных на отдельном реакторе с перегревом,
интегральном реакторе с перегревом и изучения конструкции реактора с перегревом при смешанном
спектре.
б) Дается краткое описание программы развития работ с ядерным перегревом топлива, проводимых
при поддержке Комиссии по атомной энергии на реакторах EASDA-VESR. Обсуждаются дальнейшие за
дачи по развитию работ, вопросы первоначальной конструкции топливных элементов с перегревом в
активной зоне, размера экпериментальных отклонений и ожидаемых результатов трехлетней программы
развития топлива.
ESTUDIO DE LOS PROGRESOS REALIZADOS EN NÍATERIA DE SOBRECALENTAMIENTO NUCLEAR. Desde
1959, la General Electric Company se ocupa activamente del desarrollo del sobrecalentamiento nuclear en
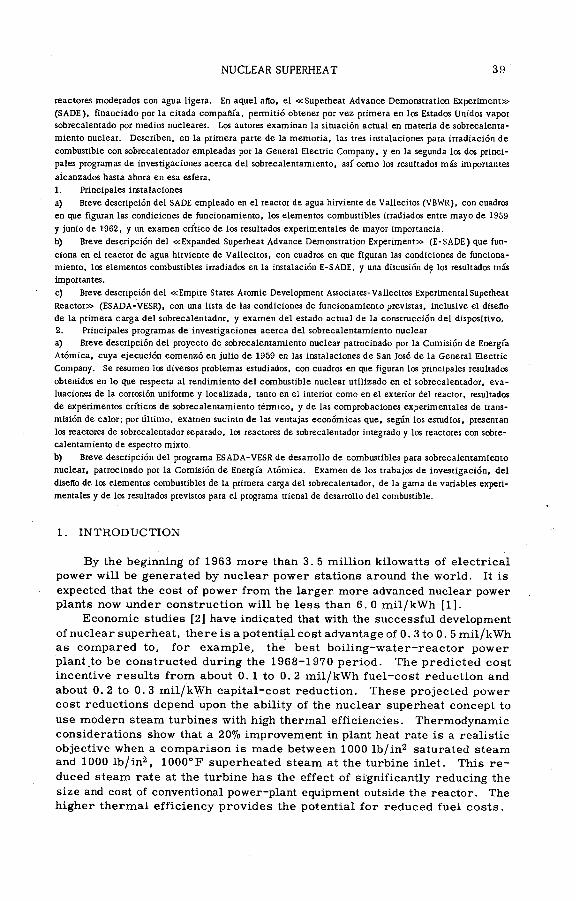
NUCLEAR SUPERHEAT 39
reactores moderados con agua ligera. En aquel aflo, el «Superheat Advance Demonstration Experiment»
(SADE), financiado por la citada compañía, permitió obtener por vez primera en los Estados Unidos vapor
sobrecalentado por medios nucleares. Los autores examinan la situación actual en materia de sobrecalenta
miento nuclear. Describen, en la primera parte de la memoria, las tres instalaciones para irradiación de
combustible con sobrecalentador empleadas por la General Electric Company, y en la segunda los dos princi
pales programas de investigaciones acerca del sobrecalentamiento, asi como los resultados más importantes
alcanzados hasta ahora en esa esfera.
1. Principales instalaciones
a) Breve descripción del SADE empleado en el reactor de agua hirviente de Vallecitos (VBWR), con cuadros
en que figuran las condiciones de funcionamiento, los elementos combustibles irradiados entre mayo de 1959
y junio de 1962, y un examen critico de los resultados experimentales de mayor importancia.
b) Breve descripción del «Expanded Superheat Advance Demonstration Experiment» (E-SADE) que fun
ciona en el reactor de agua hirviente de Vallecitos, con cuadros en que figuran las condiciones de funciona
miento, los elementos combustibles irradiados en la instalación E-SADE, y una discusión dç los resultados más
importantes.
c) Breve descripción del «Empire States Atomic Development Associates-Vallecitos Experimental Superheat
Reactor» (ESADA-VESR), con una lista de las condiciones de funcionamiento previstas, inclusive el diseflo
de la primera carga del sobrecalentador, y examen del estado actual de la construcción del dispositivo.
2. Principales programas de investigaciones acerca del sobrecalentamiento nuclear
a) Breve descripción del proyecto de sobrecalentamiento nuclear patrocinado por la Comisión de Energía
Atómica, cuya ejecución comenzó en julio de 1959 en las instalaciones de San José de la General Electric
Company. Se resumen los diversos problemas estudiados, con cuadros en que figuran los principales resultados
obtenidos en lo que respecta al rendimiento del combustible nuclear utilizado en el sobrecalentador, eva
luaciones de la corrosión uniforme y localizada, tanto en el interior como en el exterior del reactor, resultados
de experimentos críticos de sobrecalentamiento térmico, y de las comprobaciones experimentales de trans
misión de calor; por último, examen sucinto de las ventajas económicas que, según los estudios, presentan
los reactores de sobrecalentador separado, los reactores de sobrecalentador integrado y los reactores con sobre
calentamiento de espectro mixto.
b) Breve descripción del programa ESADA-VESR de desarrollo de combustibles para sobrecalentamiento
nuclear, patrocinado por la Comisión de Energía Atómica. Examen de los trabajos de investigación, del
diseflo de los elementos combustibles de la primera carga del sobrecalentador, de la gama de variables experi
mentales y de los resultados previstos para el programa trienal de desarrollo del combustible.
1. INTRODUCTION
By the beginning of 1963 more than 3. 5 million kilowatts of electrical
power will be generated by nuclear power stations around the world. It is
expected that the cost of power from the larger more advanced nuclear power
plants now -under construction will be less than 6. 0 mil/kWh [1].
Economic studies [2] have indicated that with the successful development
of nuclear superheat, there is a potential cost advantage of 0. 3 to 0. 5 mil/kWh
as compared to, for example, the best boiling-water-reactor power
plant to be constructed during the 1968-1970 period. The predicted cost
incentive results from about 0. 1 to 0.2 mil/kWh fuel-cost reduction and
about 0.2 to 0.3 mil/kWh capital-cost reduction. These projected power
cost reductions depend upon the ability of the nuclear superheat concept to
use modern steam turbines with high thermal efficiencies. Thermodynamic
considerations show that a 20% improvement in plant heat rate is a realistic
objective when a comparison is made between 1000 lb/in2 saturated steam
and 1000 lb/in2, 1000°F superheated steam at the turbine inlet. This re
duced steam rate at the turbine has the effect of significantly reducing the
size and cost of conventional power-plant equipment outside the reactor. The
higher thermal efficiency provides the potential for reduced fuel costs.
40 D. H. EMHOFF and R. T. PENNINGTON
Á look at the history of central station power development indicates that
the improvement in turbine conditions was based on evolutionary advances
over a relatively long period of time. In the case of nuclear power, there
may be a need to make a step improvement in technology since in general,
nuclear power plants are characterized by higher capital cost and lower fuel
cost as compared to fossil-fuelled power generation. There are two signifi
cant aspects to the demonstration of an economic incentive for nuclear super
heat.. The first is that reductions in conventional power costs seem to be
keeping pace with improvements in nuclear-power technology. The second
is that nuclear superheat should be utilized only if it provides a reduction in
the cost of power from nuclear plants utilizing saturated-steam conditions.
At the present time there is a very active programme for the develop
ment of nuclear superheat under the direction of the United States Atomic
Energy Commission (USAEC) [ 3]. This includes the construction of the
Northern States Power Plant [4], BONUS reactor [5], and BORAX V [6, 7].
In addition to these construction projects, the USAEC [8-14] is sponsoring
development work on the superheat concept at the Combustion Engineering
Corporation [15], Westinghouse [16] and the General Electric Company
[20,34].
In order to effect power-cost reductions and achieve the full potential
of higher thermal efficiencies resulting from nuclear superheat, it is neces
sary to find solutions to all of the new problems introduced with superheat
technology [19]. Recognizing this nèed, the USAEC initiated the Nuclear
Superheat Project at the General Electric Company to establish the experi
mental basis for nuclear superheat technology. As a result of almost four
years of development activity on the Nuclear Superheat Project, there has
been a significant amount of information obtained [20, 33] which is of value
in providing specific direction and emphasis for the continued development
of the nuclear superheat concept and for establishing economic incentives
and timing for power producing applications.It is the purpose of this paper to review the current technical status of
nuclear superheat development at the General Electric Company. This
review is composed of two parts, consisting of brief descriptions of the three
major superheat fuel-irradiation facilities, and secondly, a brief description
of the two major superheat development programme activities with up-to-
date reviews of results.
2. S U P E R H E A T A D V A N C E D E M O N ST R A T IO N E X P E R IM E N T (SADE)
The SADE produced the first nuclear superheated steam in the United
States on 4 May 1959 [17, 20]. This loop provided an in-pile superheated
fuel-element test facility which replaced one of the fuel elements in the
active core of the Vallecitos Boiling Water Reactor (VBWR). Saturated steam
from VBWR is introduced at the top of the hollow annular fuel element, makes
a down-pass between the fuel element outside diameter and the process tube,
and an up-pass between the fuel element inside diameter and a velocity
booster tube. The superheat steam exits from the VBW R reactor and goes
to the independent SADE heat sink. The initial fuel-elément configuration
was 1 1/2-in outside diam. X 3/4-in inside diam. X 36-in long. The
NUCLEAR SUPERHEAT 41
stainless-steel SADE process tube, which is provided to separate the VBWR
reactor water from the SADE saturated steam was uninsulated to improve
radiant heat transfer in the event of loss of steam coolant [37, 38]. For
normal start-up and shut-down, the SADE loop is provided with atmospheric
air coolant at 100 lb/in2 . The nominal design conditions for the SADE loop
are 825°F superheated steam exit at a thermal power of 50 kW. An external
loop and heat sink are provided to accommodate either air or steam cooling
of the superheat fuel (Figs. 1 and 2).
The external loop also provides for flow control, a radiation monitoring
and hold-up tank system for off-gas, and other required temperature,
pressure instrumentation. The SADE loop was utilized from May 1959 to
July 1962 to irradiate eight superheat fuel elements. Table I shows the
complete list of fuel elements irradiated in the SADE loop with pertinent
design characteristics such as cladding material, length of exposure, heat
fluxes and performance evaluation. Three of these fuel elements exhibited
a loss of cladding integrity [53]. These failures were attributed to stress-
corrosion cracking. The stress-corrosion cracking resulted from the combi
nation of strain cycling and chloride deposits on the steam side of the fuel
element.
3. EXPANDED SUPERHEAT ADVANCE DEMONSTRATION EXPERIMENT
(E-SADE)
The E-SADE loop installation was completed during the Spring of 1962
with the first superheated steam produced on 18 July 1962 [25, 31, 32]. The
replacement of SADE by E-SADE in the VBW R reactor was intended to im
prove on the two major limitations of the SADE loop as follows:
(a) To increase the irradiation capacity of the superheat fuel development
facility from a single superheat element occupying one 3 in X 3 in VBWR
fuel channel, to nine superheat fuel elements replacing four VBW R fuel
channels.
(b) To permit the accumulation of extended fuel burn-up by incorporation of
removable connections to permit reinsertion of new fuel elements in
bundles previously irradiated or insertion of previously-irradiated fuel
elements in new fuel bundles.
The major differences in the E-SADE and SADE systems are increased
power level and heat sink capability, utilization of VBW R reactor water for
decay heat removál and start-up mode of operation, provision for the intro
duction of VBWR steam to the E-SADE facility from within the VBWR vessel,
permitting the utilization of process tubes tKat are not designed for full VBWR
pressure differential, and in-pile facility mechanical arrangement to in
corporate both increased number of superheat fuel elements and the remov
able fuel feature (Fig.3).
During the nine-month period between initiation of the E-SADE operation
in July 1962 and 1 April 1963, the total integrated exposure of experimental
superheat fuel elements was increased threefold [32, 33] over that accumu
lated in three years of SADE operation. Tables II and III indicate the compo
sition of the first two fuel b'.ndles irradiated in the E-SADE facility. Based

42 D.H. MHOFF andR.T. PENNINGTON
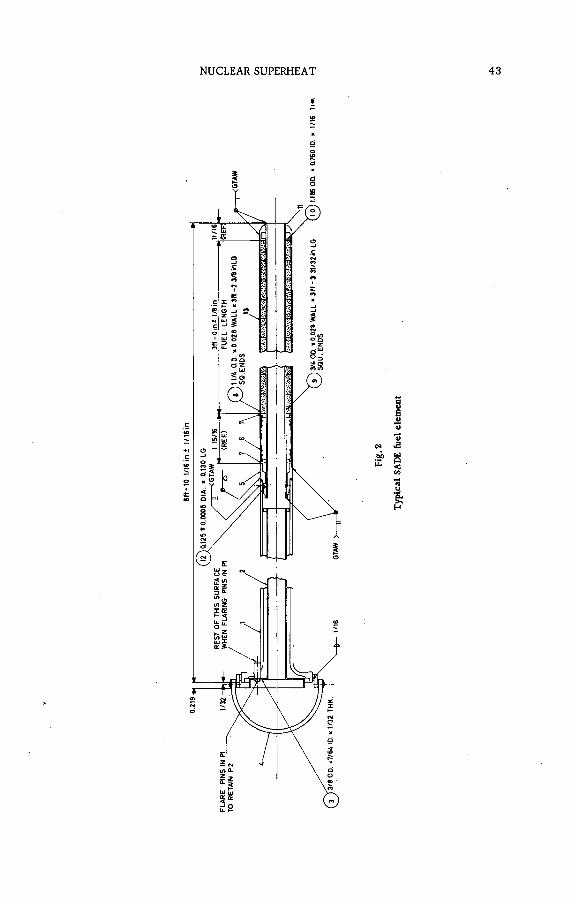
NUCLEAR SUPERHEAT 43
dоg<3
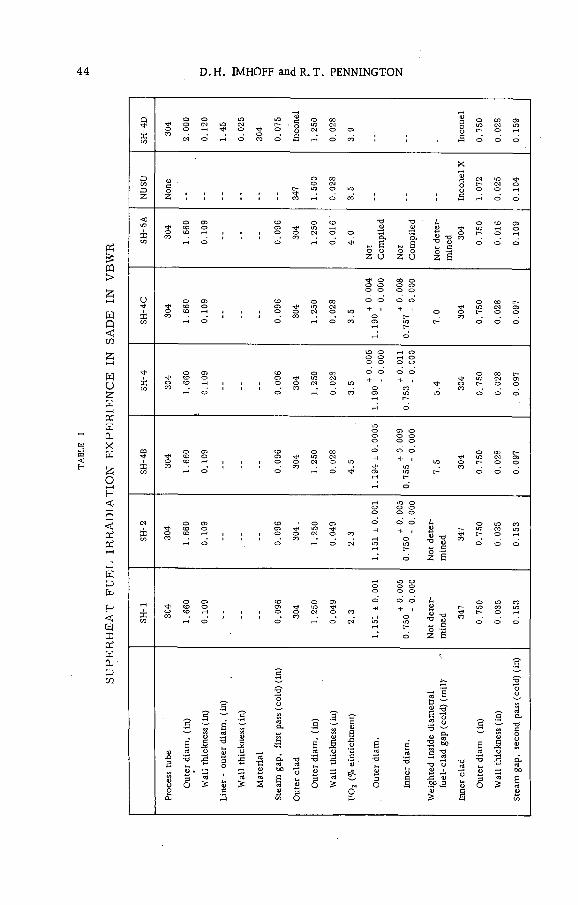
SU
PE
RH
EA
T
FU
EL
IRR
AD
IAT
ION
E
XP
ER
IE
NC
E
IN SADE
IN V
BW
R
44 D.H. IMHOFF and R.T. PENNINGTON
2 U 2 U 2 £
U
Z Ë
Z E
•3 E
(U <4 n
•2 .2
£ 23О
DO £’3£

NUCLEAR SUPERHEAT 45
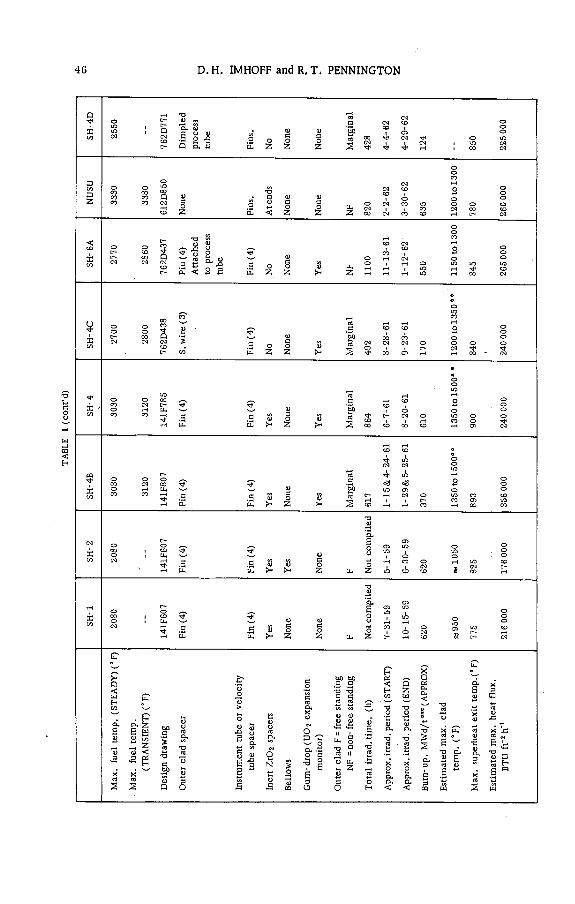
TABL
E I
(con
t’d)
46 D. H. IMHOFF and R.l\ PENNINGTON
b a s
•S °
?± Q
iH<£>
HCD
Ю(N (N
Ю
«8Ю 05iH (N
I—1 i-H
►«Q< "O "Oa д л rt
Hai<H
Xo
. HS* 2 e а2 w <u <
а а
2 2 D O
OЫ
o _ d 'Z:
S È
2s2
a , S a <
g .5
u c<u
E ~
pH

TABLE
I (c
on
t'd
)
NUCLEAR SUPERHEAT 47
JU ce g<Ü о ТЗ <5 2
«и .tí "оü ¿ u
I-1 g- % S
.2 3 ° 2(N Ë ^ лs ? S g
ï д t) u,
О л о- о -S о л
< < Ы WО О
tu .5 2 -о
сЕ <уО «3Q. •*-.S о
с§ оiü Л <Ц•S .2
о2 SDO ¿j
■S в¡5 34) о
¡Э £ H DO
Oí '~
^ *2 < < Ы WО О
> о

48 D. H. MHOFF and R. T. PENNINGTON
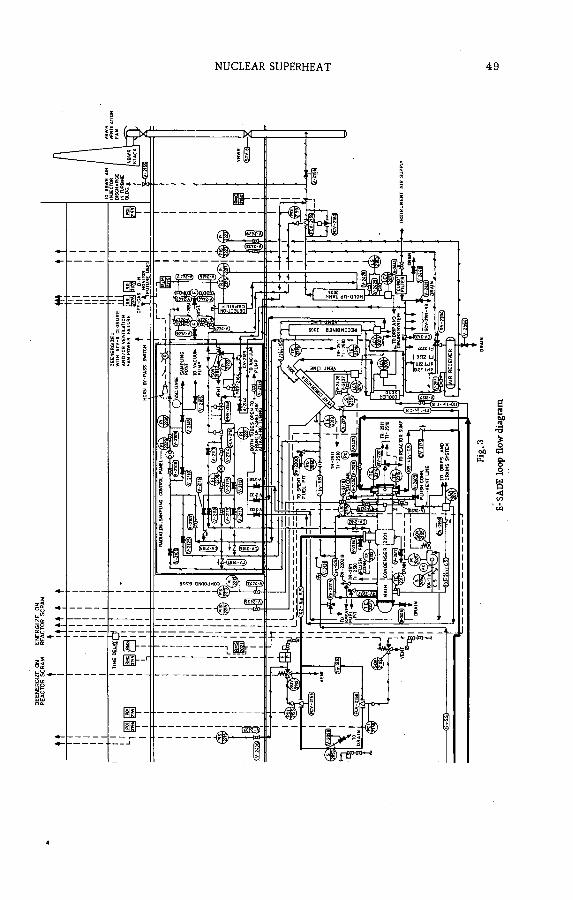
4
Fig
.3
H- SA
DE
loop
flow
dia
gram

DESI
GN
DATÁ
FO
R .E
SH
1.0
IN E
-SA
DE
IN
VB
WR
50 D.H. MHOFF andR.T. PENNINGTON
“ оCO 00 02
t o CO t s
,05 N g
Ф t- 'í
CO n 2 . . ©
N Ю
* S ° В Û,
ob .2 > -а ®
Л JÛ lfcj
V a D Й - 2 H 2^ -o ÇQ
4 О v x S
^ § * p<u <-> сS ft nj «J — s
_ л 4> <ü x :
igiSs 0 2 2
I g Q. D Й3 У о H я (3 « ^ “ sa, о <ü x о
а * 1 S « s I S g s I •л а u g .
S й C :Ô S'S
. û> CL, « 2
о =3 a . u -
s2
4*

TABLE
II (c
ont'd
)NUCLEAR SUPERHEAT 51
Accounts
fo
r power
scall
opin
g
ass
um
ing
com
ple
te
cir
cum
ferentia
l st
eam
mix
ing.

DESIG
N
DATA
AND
DESIG
N
CO
ND
ITIO
NS
-
ESH
-
(For
40
MW
reacto
r p
ow
er)
52 D. H. IMHOFF and R. T, PENNINGTON
О СО O 00
O 00 о со
O 00 о со
О О О
d 2 2
O C0 O 00
О О О
o 00 O 00
О О О
03 (N^Jt oO ■'fr
О О <J> I—l 1-H
2o
• 03 соЮ СО гЧсо ю о
05 (N ^ о о ¡У со соtí to . юо . ю со
2 (N 05 гН
о СО о03 dоО тг
о* о* 2 2 со
а
Е
"Опз 00
H w ц. О О м
2 3 t
j Я E ° Ё■ i S«Д W
о э о с о S «Jо. си >
Х> "Ои
' о à
S 'S
S ъ
и
х 3с
ор я 3 я
2 « -g •* >0 .а -ё з «г s 5 i s•ЕР Я — я •“1 S S Б 2> н и- <: си
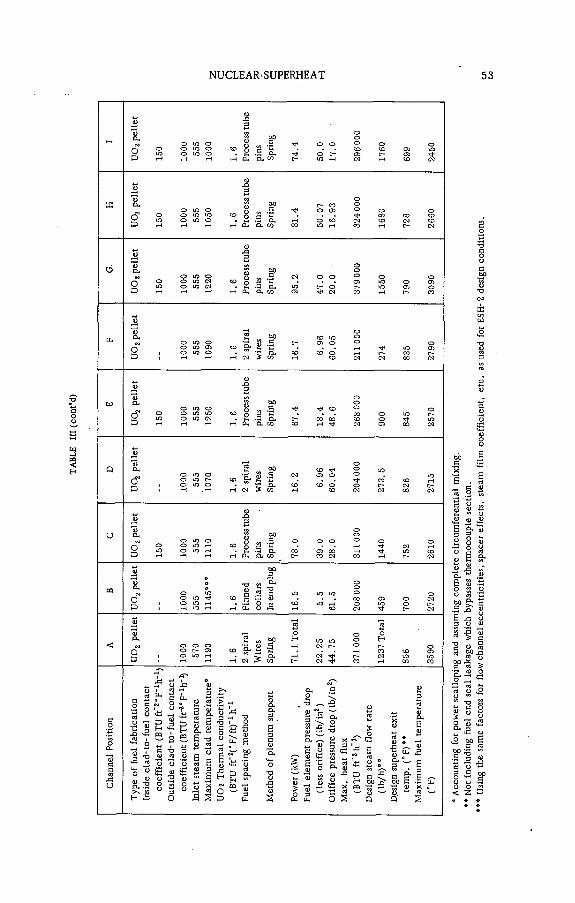
TABLE
III
(cont'd
)NUCLEAR'SUPERHEAT 53
d 1a
cTD
o,
C?
О 1Л Оо ю о о ю о
о ю о
О Ю 05о ю о
о ю о
tfl Он Ji •-
о ю оО Ю 1-Н О Ю гЧ
о
ооо
CO o s COtr CO <N со
О О О
" ^ ё ;?(j i та_ 2 f- eu.5 с n О о
.2 о V о у
I I ¡Í >2 gя i £ о «
о „ 7 ^7 ? , с тэ с§ -о « 5 ,2•*- _2 ‘о у оo ü S « j£й1 о « 2 вЙ тз о 5 о
° S üН в о
о се3 1ев д 3й В -Ол Й сS* оЁ ТЭ °О) q Н
чэ
* J§
о,2
Г ^ •О *•
“ £ 6 ° в°Г %Е й к О
з. ^ а х •4) 3 3 -
S I ^ gо) * £ Ю•S ^
> 1 ^ 2 м g о л
а) «
¡5 v о
а
1 Вта, а>
а> >-н •и ¿ XW « (J
О 2
та« </,
c i
Ё Я>£0) A
ccounti
ng
for
power
scal
lopin
g
and
assu
min
g
com
ple
te
cir
cum
ferenti
al
mix
ing.
Not
in
clu
din
g
fuel
en
d se
al
leakag
e whi
ch
bypas
ses
therm
ocouple
sectio
n.
Usi
ng
the
sam
e fa
ctor
s fo
r flow
channel
eccentr
icit
ies,
spac
er
eff
ects
, st
eam
film
coeff
icie
nt,
etc
. as
used
fo
r ESH
-2
desi
gn
condit
ions.

54 D.H. IMHOFF and R.T. PENNINGTON
on the results from fuel elements irradiated in both the SADE and E-SADE
loop, the following gener-Л conclusions can be drawn.
(a) Commercial 18-8 stainless steel may be subject to rapid failure due to
stress-corrosion cracking when placed in a nuclear superheat environ
ment. Both the magnitude of strain cycling and the presence of chlorides
are important factors in determining the length of time to failure.
(b) Based on in-pile and out-of-pile evaluations, alloy materials with in
creasing amounts of nickel inhibit stress-corrosion cracking and have
operated satisfactorily in the E-SADE at exposures up to 1100 MWd/t.
4. ESA D A V A LLE C IT O S E X P E R IM E N T A L S U P E R H E A T R E A C T O R
(EVESR)
The EVESR reactor is being constructed through the combined efforts
of the Empire States Atomic Development Associates, (ESADA) Incorporated,
an organization of New York State investor owned electric-utility corpo
rations, and the General Electric Company [18, 34]. The EVESR Nuclear
Superheat Development Project sponsored by the USAEC is described in
section 6.
The EVESR reactor has been designed as a flexible fuel test-bed with the
capability of testing a large number of superheat fuel elements in an operating
superheat reactor environment. The EVESR reactor utilizes externally
generated steam as the primary reactor coolant. This independence of
coolant source provides one of the key features of EVESR in terms of super
heat fuel-element irradiation flexibility, in that steam can be supplied by
either the fossil-fuelled saturated-steam boiler or the V B W R reactor, or
both. In order to perform experiments on superheated-fuel performance
limits, the reactor and associated systems are designed to operate with either purposely defected or in-service failed superheat fuel elements. Ex
perimental flexibility is additionally supplied by utilization of twelve coolant-
manifold systems with suitable bias control valves. The instrumentation
system provides for the determination of inlet and exit steam temperature,
steam pressure, steam flow and selected coolant-sampling stations. The
initial power level of the EVESR reactor is 12.5 MW(t) with provision for
eventual operation at 23 MW(t). The EVESR biological shielding is adequate
to operate at 30 MW(t). The 7 —ft inner diam. vessel is provided with blanked
connections for a forced circulation system for possible modification to per
mit.operation as a combination boiling-superheat reactor (Figs. 4 and 5).
For integral boiling-superheat operation the power level would be about
70 MW(t). Although the primary purpose of the EVESR reactor is to provide
a flexible engineering tool for the development of superheat fuel elements,
it is also expected that a significant technical first will be obtained with the
operation of V B W R and EVESR in series. In addition to reactor dynamics
and fuel-development information, it is expected that a significant amount of
operating experience will be obtained on direct-cycle nuclear superheated
systems including the distribution and level of radioactive contamination
resulting from operation with purposely defected and in-service failed super
heat fuel elements.

NUCLEAR SUPERHEAT 55
K g. 4
EVESR flow diagram
The initial core fuel-cladding material selection for the 32 fuel bundles
of 9 elements is shown in Table IV [35].
Sufficient experimental information is available to show that commercial
stainless steels are subject to gross failure from stress-corrosion cracking.
This has been shown through boiling MgCl2 tests, failures in the SADE loop
with and without in-leakage of VBWR reactor water and in out-of-pile testing
of Type 304, sensitized Type 304 and Type 348 stainless steels. A search of
available literature [54] indicated two different approaches to the solution of
the stress-corrosion cracking problem for cladding materials. These are
the use of high-purity stainless-steel alloy and use of alloy materials with
increased nickel content.
Recent tests performed at General Electric [31-33, 59, 62, 64] have
confirmed that low-impurity stainless steels exhibit a significant improvement
in resistance to chloride stress cracking in boiling MgCl2 tests. These
tests indicate that high-purity Type 304 stainless steel will not fail in less
than 6 h, as compared to consistent failures of commercial stainless steels
in less than 30 min. Out-of-pile corrosion tests on heat-transfer sheath
specimens have also shown an improvement of materials with increasing
nickel-alloy content.
Based on satisfactory performance in boiling MgCl2 tests and uniform
corrosion and cycling-corrosion tests performed out-of-pile at General
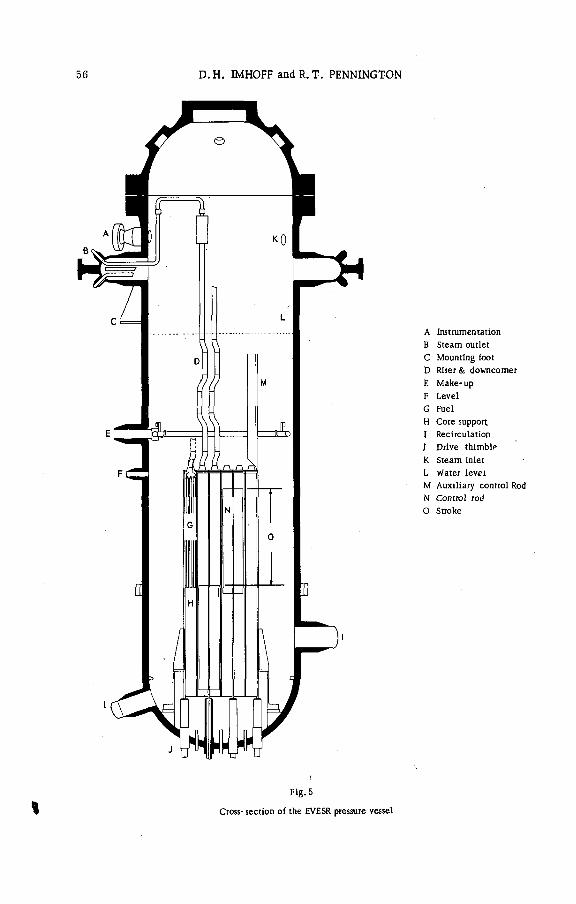
56 D. H. IMHOFF and R. T. PENNINGTON
A Instrumentation
B Steam outlet
C Mounting foot
D Riser & downcomer
E Make- up
F Level
G Fuel
H Core support
I Recirculation
J Drive thimble
К Steam inlet
L Water lev^i
M Auxiliary control Rod
N Control rod
О Stroke
Fig. 5
Cross- section of the EVESR pressure vessel

TABLE IV
PR OPOSED TEST CONDITIONS- FOR INITIAL EVESR CORE LOADING
NUCLEAR SUPERHEAT 57
Number of
bundles
Zone
numberMaterial
Power
local bundle
to
core average
Power
hot element
to
core average
Calculated
maximum
surface
temperature
(°F)
1 1 304 SS
Comm'l.
1.216 1.25 1250
3 1 304 VM 1.216 1.25 1250
4 3 Incoloy 1.162 1.41 1250
4 3 Incoloy 1.162 1.41 1000
4 5 Incoloy 0.790 1.11 1250
4 5 Incoloy 0.790 1.11 1000
4 . 4 ' Inconel 0.870 1.22 1250
4 4 Inconel 0.870 1.22 1000
4 2 310 VM 1.129 1.50 1250
Electric, and in recognition of the relatively improved high-temperature strength
properties and relatively small inprease in thermal cross-section. Incoloy
would seem to oe a promising superheat cladding material at present. For
this reason one-half of the initial fuel load for the EVESR will be fabricated
from fuel clad with this material.
The EVESR reactor is scheduled to go critical during July 1963. The
construction of the reactor facility will be completed duiing May 1963. Fuel
fabrication was initiated in February with the delivery of the initial core
loading now scheduled to be made at the reactor site by 15 June 1963. The
Final Hazards Report was submitted to the USAEC in October 1962. Meetings
were held with the USAEC staff during Spring 1963 and the final meeting with
the Auxiliary Committee on Reactor Safety was held on 11 April 1963. The
operating licence for EVESR will be effective on 24 June 1963.
5. USAEC BASE D E V E L O P M E N T , N U C L E A R SU PE R H E A T P R O JE C T
The USAEC-sponsored Nuclear Superheat Project was initiated in July
1959 and is still in progress. The objective of the Nuclear Superheat Project
[20] is to provide a fundamental basis for the extension of superheat technology
into the realm of practical competitive application for commercial production
of power. The following is a brief summary of significant result areas over
the period of the programme.

58 D. H. IMHOFF and R. T. PENNINGTON
Superbeat reactor conceptual design
The objective of these design evaluations has been to provide development-
programme direction and to establish realistic test conditions for the ex
perimental programme. This work has been implemented through the con
ceptual design studies of three different Reactor types. The first concept
studied was the separate-superheat reactor [41, 61] concept where saturated
steam from a conventional boiling-water reactor is used to provide the
source of primary coolant for the superheat reactor, which is physically
isolated from the boiling-water reactor in its own pressure vessel. The
separate-superheat reactor concept has the advantage of individual design
consideration of boiling-water and steam-cooled reactor fuel such that each
system may be optimized within its own performance limits. Since there is
no nuclear coupling between regions of different nuclear characteristics,
complete power level independence between the boiling and superheat region
leads to a number of major simplifications in reactor power-level control
and exit steam-temperature control (Fig. 6).
The second reactor concept studied is the once-through superheat
reactor [44, 46] where regions of boiling, transition boiling and superheating
of the steam all occur within a single reactor vessel. The conceptual design
studies indicated that this should be done in three different fuelled regions
in order to minimize the reduction of heat~transfer performance between
the various heat-transfer regions. The source of the cost incentive in this concept is the potential for elimination of the boiling-water recirculation
system; however, the once-through superheat reactor has several major
areas of technical uncertainty which are:
(a) Development of flow-control system to match local fuel-bundle flow rate
with local power as necessary to limit excessive superheat temperature
rise. This problem is due to the low ratio of enthalpy rise in superheat
to the total enthalpy rise.
(b) Local power perturbations and reactor power-level control difficulties
due to power interdependence between fuel regions of variable nuclear
properties due to geometric or other variances resulting from specific
heat-transfer limitations.(c) Possibility of increased radioactivity levels in primary coolant system
due to primary coolant system impurities which could be deposited on
the fuel surface in the high neutron-flux region. For a once-through
system, the amount of deposited material can be substantial even for
systems of extremely high purity.
The third reactor concept studied was the mixed-spectrum superheat
(MSSR) [42, 47, 60] concept which consists of a fast-energy fission spectrum,
superheated-steam cooled region surrounded by a conventional, light-water
moderated, thermal spectrum, boiling-water reactor. The boiling water and
superheat regions are separated by two buffer regions to reduce the power
perturbations between the two regions. This concept has a number of
significant advantages as compared to thermal, integral superheaters. In
general these advantages are obtained at the cost of a significantly more
complex neutron physics system (Fig. 7).
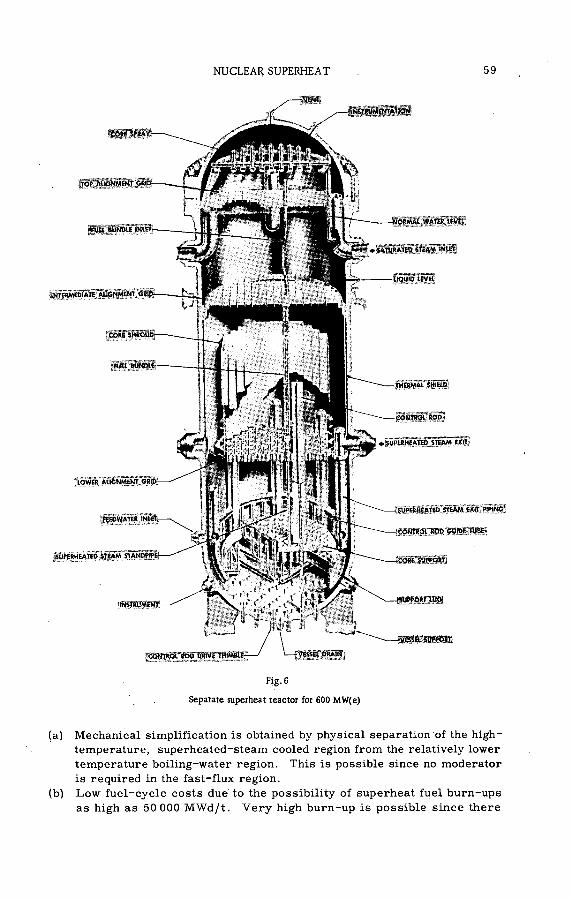
NUCLEAR SUPERHEAT 59
Formai water ttva
SUPERHEATED STEAM EXIT
"COMTüO lROD 'GU iDÍTUSÍ
SUPERHEATED STEAM STANDPIPE
f i ÿ ÿ j ' i i r î h - 1 - ; " í I.
ÜKtVE T H J M B lP - V — Ц « я
Pig. 6
Sepatate superheat reactor for 600 MW(e)
(a) Mechanical simplification is obtained by physical separation of the high-
temperature, superheated-steam cooled region from the relatively lower
temperature boiling-water region. This is possible since no moderator
is required in the fast-flux region.
(b) Low fuel-cycle costs due to the possibility of superheat fuel burn-ups
as high as 50 000 MWd/t. Very high burn-up is possible since there
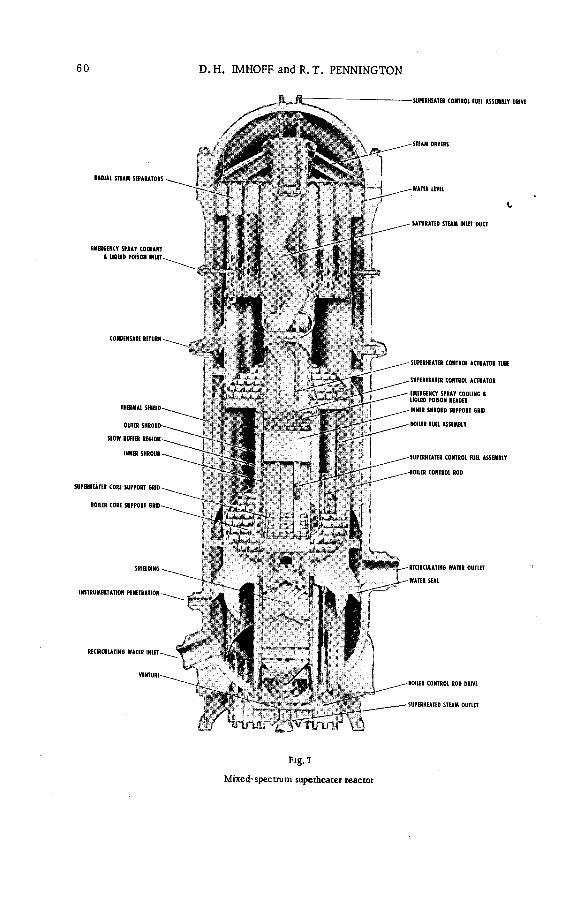
60 D. H. IMHOFF and R. T. PENNINGTON
RA D IAI STEAM SEPARATORS
EMER6ENCY SPRAY COOLANT 1 LIQUID POISON IN U T
CONDENSATE RETURN
THERMAL S HIHD
OUTER SHROUI
SLOW BUFFER REGION
INNER SHROUD
SUPERHEATER CORE SUPPORT GRID
BOILER CORE SUPPORT GRID
INSTRUMENTATION PENETRATION
RECIRCULATING WATER INLET
SUPERHEATER CONTROL FUEL ASSEMBLY DRIVE
SATURATED STEAM INLET DUCT
SUPERHEATER CONTROL ACTUATOR TUBE
SUPERHEATER CONTROL ACTUATOR
EMERGENCY SPRAY COOLING t LIQUID POISON HEADER
INNER SHROUD SUPPORT GRID
BOILER FUEL ASSEMBLY
SUPERHEATER CONTROL FUEL ASSEMBLY
IOIIER CONTROL ROD
RECIRCULATING WATER OUTLET
WATER SEAL
BOILER CONTROL ROD DRIVE
SUPERHEATED STEAM OUTLET
Fig. 7
Mixed-spectrum superheater reactor
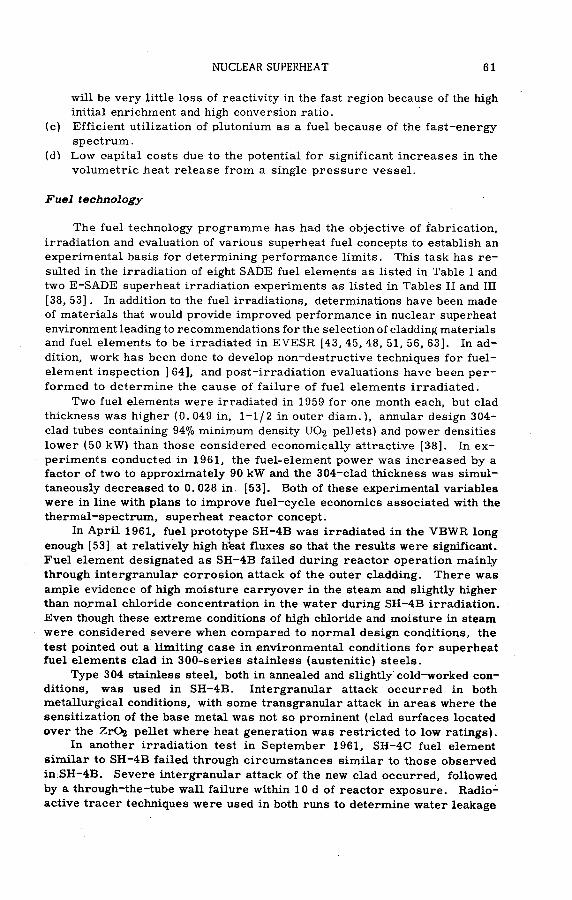
NUCLEAR SUPERHEAT 61
will be very little loss of reactivity in the fast region because of the high
initial enrichment and high conversion ratio.
(c) Efficient utilization of plutonium as a fuel because of the fast-energy
spectrum.
(d) Low capital costs due to the potential for significant increases in the
volumetric heat release from a single pressure vessel.
Fuel technology
The fuel technology programme has had the objective of fabrication,
irradiation and evaluation of various superheat fuel concepts to establish an
experimental basis for determining performance limits. This task has re
sulted in the irradiation of eight SADE fuel elements as listed in Table I and
two E-SADE superheat irradiation experiments as listed in Tables II and III
[38, 53]. In addition to the fuel irradiations, determinations have been made
of materials that would provide improved performance in nuclear superheat
environment leading to recommendations for the selection of cladding materials and fuel elements to be irradiated in EVESR [43, 45, 48, 51, 56, 63]. In ad
dition, work has been done to develop non-destructive techniques for fuel-
element inspection ] 64], and post-irradiation evaluations have been per
formed to determine the cause of failure of fuel elements irradiated.
Two fuel elements were irradiated in 1959 for one month each, but clad
thickness was higher (0. 049 in, 1-1/2 in outer diam.), annular design 304-
clad tubes containing 94% minimum density UO2 pellets) and power densities
lower (50 kW) than those considered economically attractive [38]. In ex
periments conducted in 1961, the fuel-element power was increased by a
factor of two to approximately 90 kW and the 304-clad thickness was simul
taneously decreased to 0.028 in. [53]. Both of these experimental variables
were in line with plans to improve fuel-cycle economics associated with the
thermal-spectrum, superheat reactor concept.
In April 1961, fuel prototype SH-4B was irradiated in the V B W R long
enough [53] at relatively high heat fluxes so that the results were significant.
Fuel element designated as SH-4B failed during reactor operation mainly
through intergranular corrosion attack of the outer cladding. There was
ample evidence of high moisture carryover in the steam and slightly higher
than normal chloride concentration in the water during SH-4B irradiation.
Even though these extreme conditions of high chloride and moisture in steam
were considered severe when compared to normal design conditions, the
test pointed out a limiting case in .environmental conditions for superheat fuel elements clad in 300-series stainless (austenitic) steels.
Type 304 stainless steel, both in annealed and slightly cold-worked con
ditions, was used in SH-4B. Intergranular attack occurred in both
metallurgical conditions, with some transgranular attack in areas where the
sensitization of the base metal was not so prominent (clad surfaces located
over the ZrC>2 pellet where heat generation was restricted to low ratings).
In another irradiation test in September 1961, SH-4C fuel element
similar to SH-4B failed through circumstances similar to those observed
in.-SH—4B. Severe intergranular attack of the new clad occurred, followed
by a through-the-tube wall failure within 10 d of reactor exposure. Radio
active tracer techniques were used in both runs to determine water leakage

62 D.H. MHOFF and R.T. PENNINGTON
into the fuel compartment from a flange which separates the incoming steam
from the reactor water.
Still another experiment,SH-5A, where the water leakage into the fuel
compartment was eliminated by welding a previously bolted flange, pointed
out that 304-type clad was subject to rapid, highly-localized corrosion attack.
Upon post-irradiation examination of the failed elements, it was found
that large quantities of chloride impurities deposited on the fuel-clad surface.
This evidence plus the morphology of the crack under careful metallographic
examination led to the conclusion that the jacket failures were due to stress-
corrosion attack. Further comparison of present knowledge regarding
stress-corrosion attack in áustenitic alloys, with the conditions prevalent
in SADE environment, led to the conclusions that there were three avenues
of approach for the solution of the superheat fuel cladding problem:
(a) The stress level in fuel elements must be minimized through improved
design or less severe performance requirements;
(b) Chloride deposits on fuel must be reduced either by reducing moisture
carryover or better control of chlorides in the reactor water; or
(c) Alternate materials must be selected which are less susceptible to
stress-corrosion attack.
Materials development
The purpose of the materials development evaluations is to investigate
mechanical properties of potential fuel-cladding materials as these materials
are affected by long term exposure to superheat environments of high-
temperature, corrosive atmosphere of hydrogen and oxygen, and neutron
flux. These evaluations have consisted of the experimental determination
of strain-cycle limits, the aging effect of alloys and tensile property meas
urements for irradiated samples at room temperature and elevated tempera
tures. In addition, an extensive literature survey [54] was conducted to find
potential superheated fuel-element cladding materials. This work provided
a basis for the selection of alternate cladding materials and also provided
a better understanding of the behaviour of materials in reactor environments.
Information regarding strain-cycle fatigue of 304, Incoloy, Hastelloy
X and Inconel has been obtained at General Electric. The results are sum
marized in Fig. 8. Irradiation of 304-type stainless steel at 1250-1300°F
reduced the time to failure at a given strain range by approximately a factor
of 2/3. These tests differ from those previously reported in that they were performed with tubular specimens and stresses were applied biaxially. Short
lengths of tubing (0. 016-in and 0. 02 8-in thick, 1. 25-in diam. ) were alternate
ly expanded and contracted pneumatically between rigid fixed mandrels.
Frequency of cycling was 30 min for a complete cycle. The gases used were
either argon or nitrogen and the strain was determined by the dimensions
of the mandrel. Failures occurred at the convex side of the specimen. For strains greater than 0. 01 the actual strain ranges cannot be accurately deter
mined because of the formation of wrinkles, which in some cases was
arrested by the size of the mandrel. The microstructural characteristics
of the fractures for Inconel, Hastelloy X and 304 are essentially identical.

NUCLEAR SUPERHEAT 63
1 10 100 1000 CYCLES TO FAILU R E
Fig. 8
Strain-cycle tests, Type-304 stainless steel at 1300“F
The grains remain equiaxed up to the fracture surface indicating little or no
plastic deformation before failure. There was evidence of considerable
deformation in Incoloy and fracture was transgranular. Incoloy exhibited
more ductility at fracture due to strain cycling than any of the materials
tested to date.
Experimental physics measurem ents
This work was intended to provide a basis for predicting the nuclear
physics characteristics of superheat reactors utilizing slightly-enriched UOa
annular fuel geometry [43] where the moderator to fuel ratio is subject to
step changes due to flooding and unflooding of steam passages adjacent to
fuel [55]. The experimental measurements included were:
(a) Critical size
(b) (Эр / ЭН) versus H ( p = reactivity, H = water height)
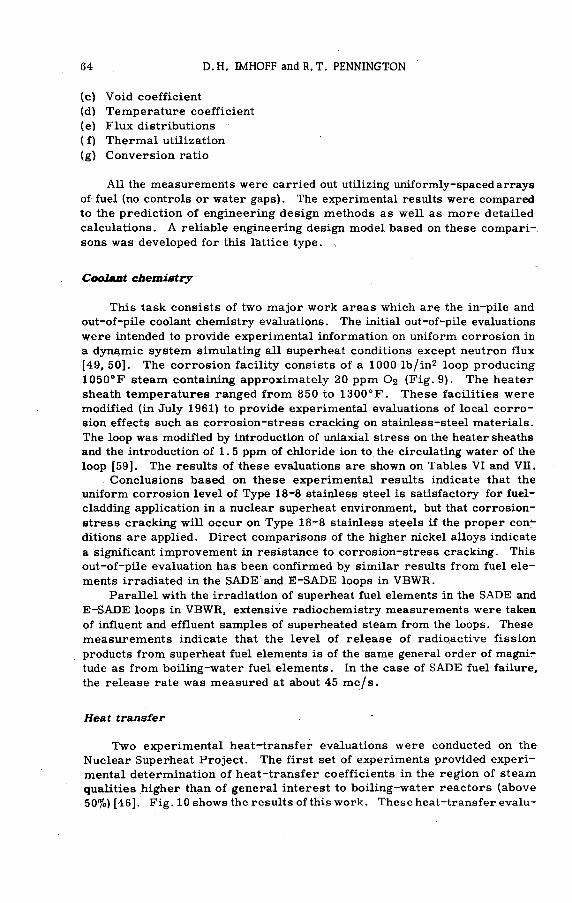
64 D.H. IMHOFF andR.T. PENNINGTON
(c) Void coefficient
(d) Temperature coefficient
(e) Flux distributions
( f) Thermal utilization
(g) Conversion ratio
All the measurements were carried out utilizing uniformly-spaced arrays
of fuel (no controls or water gaps). The experimental results were compared
to the prediction of engineering design methods as well as more detailed
calculations. A reliable engineering design model based on these compari
sons was developed for this lattice type.
Coolant chemistry
This task consists of two major work areas which are the in-pile and
out-of-pile coolant chemistry evaluations. The initial out-of-pile evaluations
were intended to provide experimental information on uniform corrosion in
a dynamic system simulating all superheat conditions except neutron flux
[49, 50]. The corrosion facility consists of a 1000 lb/in2 loop producing
1050°F steam containing approximately 20 ppm O 2 (Fig. 9). The heater
sheath temperatures ranged from 850 to 1300°F. These facilities were
modified (in July 1961) to provide experimental evaluations of local corro
sion effects such as corrosion-stress cracking on stainless-steel materials.
The loop was modified by introduction of uniaxial stress on the heater sheaths
and the introduction of 1. 5 ppm of chloride ion to the circulating water of the
loop [59]. The results of these evaluations are shown on Tables VI and VII.
Conclusions based on these experimental results indicate that the
uniform corrosion level of Type 18-8 stainless steel is satisfactory for fuel-
cladding application in a nuclear superheat environment, but that corrosion-
stress cracking will occur on Type 18-8 stainless steels if the proper con
ditions are applied. Direct comparisons of the higher nickel alloys indicate
a significant improvement in resistance to corrosion-stress cracking. This
out-of-pile evaluation has been confirmed by similar results from fuel ele
ments irradiated in the SADE and E-SADE loops in VBWR.
Parallel with the irradiation of superheat fuel elements in the SADE and
E-SADE loops in VBWR, extensive radiochemistry measurements were taken
of influent and effluent samples of superheated steam from the loops. These
measurements indicate that the level of release of radioactive fission
products from superheat fuel elements is of the same general order of magni
tude as from boiling-water fuel elements. In the case of SADE fuel failure,
the release rate was measured at about 45 mc/s.
Heat transfer
Two experimental heat-transfer evaluations were conducted on the
Nuclear Superheat Project. The first set of experiments provided experi
mental determination of heat-transfer coefficients in the region of steam
qualities higher than of general interest to boiling-water reactors (above
50%) [46]. Fig. 10 shows the results of this work. These heat-transfer evalu-

NUCLEAR SUPERHEAT 65
SUPERHEAT SYSTEM
Fig-9
Schematic diagram o f the superheat corrosion test facility
( ? ) Flow ( ? ) Temperature ( ? ) Pressure
ations were the technical basis for the once-through reactor study referred
to in the conceptual design studies mentioned previously.
The second phase of the experimental work consisted of the experimental
determination of heat transfer coefficients in the regions of Reynolds numbers
above 300 000. In these tests both circular and annular geometries were
utilized. The results of these experiments and heat-transfer equation pro
viding the best correlation of experimental results is shown in Fig. 11.
Mechanical development
The purpose of the mechanical development activity was to provide a
basis of design information for specialized mechanical equipments which are necessary for the operation of superheated-stearrrcooled reactor systems.
This work area has involved primarily the development of the radial steam
separator and mechanical seals [39, 40, 52].

TABLE V
66 D. H. IMHOFF and R. T. PENNINGTON
SUM M ARY OF C OOLA N T CHEMISTRY SURVEILLANCE
Sample points Parameters to be measured
Superheat steam, individual exit lines'(32)
Superheat steam, 8-in header*
Superheat-steam, 4-in divert header*
Satuiated steam, EVESR inlet*
Saturated steam, EVESR individual fuel bundle inlets (4)
Saturated steam, gas-fired boiler
Water, reactor ÍX inlet
Water, reactor IX outlet
Water, EVESR hotwell
Water, EVESR condensate demineralizer effluent
Water, boiler feed (near boiler)'
Water, gas-fired boiler
Water, make-up to EVESR hotwell
Water, make-up to condensate storage tank
Liquid poison
Gross activity
Chloride
Conductivity
Dissolved oxygen
PH
Gas content
Dissolved impurities
Insoluble impurities
Dissolved radioisotopes
Insoluble radioisotopes
* Special entrance tap to insure representative sample.
The work consisted of trying out several types of centrifugal separators.
The most promising of these appeared to be the radial vane separator. Sepa
ration is accomplished by directing the 2-phase steam-water mixture from
the reactor core onto a curved vane. The centrifugal field which results
from flow on a concave surface causes the separation of the steam from the
water.
Two air-water and one steam-water loops were used for this work. The
larger loop is capable of water flows up to 5 X 10⁶ lb/h and air flows to
15 000 lb/h. A 1000 lb/in2 steam-water test loop is located at the Pacific
Gas and Electric Company Moss Landing plant on Monterey Bay. This loop
is capable of up to 600 000 lb/h of water and 60 000 lb/h steam at 1000 lb/in2 abs.Steam-water tests of a radial vane separator with a 130° vane arc, 4 in
vane radius and 1/4 in X 18 in nozzle cross-section, showed the vane capaci
ty to be 9500 ft3/h with an inlet steam quality of 6 to 12% by weight. The
vane capacity is defined as the total volumetric flow rate per nozzle of per
pair of vanes.A full-circle radial vane separator having the vane and nozzle design
of the two-vane separator mentioned above has also been tested. This unit
has 36 vanes with only eighteen 18-in nozzles. Capacity limitations of the
equipment limit the operation to eighteen 6-in nozzles or six 18-in nozzles.

SU
PE
RH
EA
T
EX
PO
SU
RE
S
IN C
L-
(Type
304
stain
less
steel)
NUCLEAR SUPERHEAT 67
o ÿ *
gо2
о .2
•д о
щ О 5
•н ТЗ -О «5 Л -О -о
С У Й «- 4) Z
3 U ; 5 UJ2 Е ' о о.*- л
E Е
с о a i со
S ь ”1 со Iо. х а
х O'
а
O' ►« >*
О <£> \ S м ¡N
U со
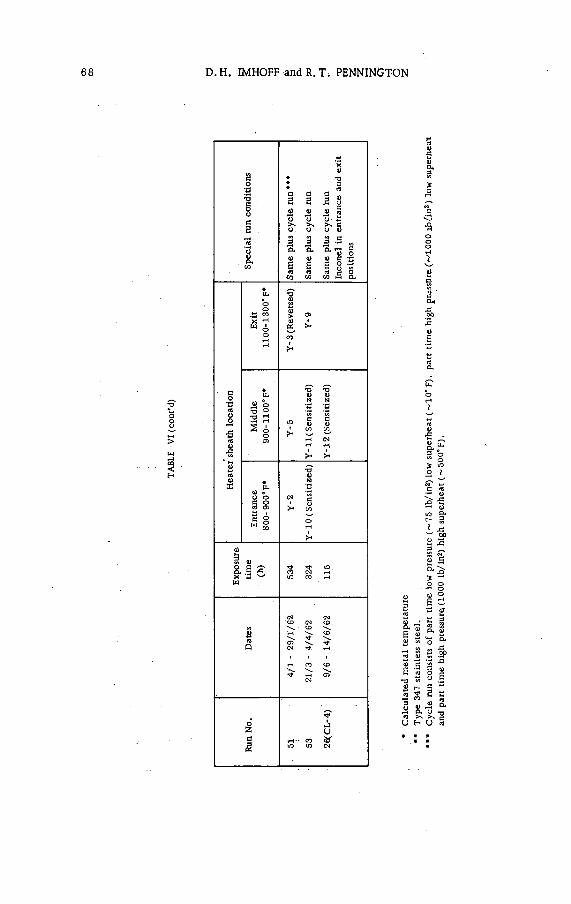
68 D. H. IMHOFF and R. Ti PENNINGTON
2 2 я
« с *зeg-5 я я а
>* |н
X üш
2tí
Uаг
смл
к 2
and
part
ti
me
high
pr
essu
re!
(100
0 lb
/in
) hi
gh
superh
eat
(~
500°
F).

NUCLEAR SUPERHEAT 69
TABLE VII
SUPERHEAT EXPOSURES
Alternate materials
FacilityRun
No.Dates Material
Exposure
time
■(h)
Type
of
run
Remarks
CL-1 52 5/2 - 19/3/62 Inconel 1000 Normal*
CL-1 53 21/3 - 4/4/62 Type 304 SS 324 Cycle** Entrance and
middle sheaths
presensitized
CL-1 54 12/4 - 27/4/62 Inconel 345 Cycle Entrance and
middle sheaths
presensitized
CL-1 55 5/5 - 19/5/62 Type 347 SS 327 Cycle
CL-1 56 26/5 - 6/7/62 Incoloy 965 Normal Entrance and
middle sheaths
presensitized
CL-1 57 16/7 27/8/62 Hastelloy X 988 "- Normal
CL-4 26 9/6 - 14/6/62 Inconel +
Type 304 SS
115 Cycle
Sensitized Type 304 SS for
middle sheath failed 1st step
of cycle; replaced by Inconel
for 26A
26A 14/6 - 26/6/62 Inconel 248
CL-4 27 12/7 - 6/8/62 Incoloy 361 Cycle
CL-4 28 14/8 - 2/9/62 Hastelloy X 361 Cycle
* Normal- Longitudinal stress on sheath - no chlorides added - continuous operation.
• • Cycle- Steam Temperature (°F)
Inlet Outlet Approximate
saturated superheat (d)
350 - 360 4
546 550 3
546 1060 2
350 360 3
546 '550 2
Steam-water tests using eighteen 6-in nozzles showed a vane capacity of
1900 ft3/h. Steam-water tests of the same unit using six 18-in nozzles
showed a vane capacity of 5200 ft3/h. However, this was accompanied by
poor carryunder performance (0. 5-0. 9% by weight steam) and an unstable
water level.
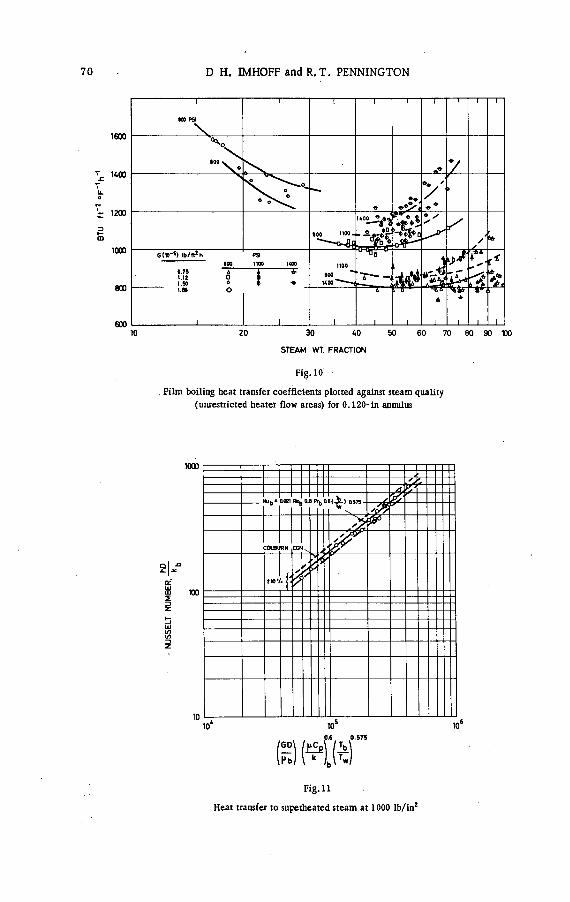
70 D H. IMHOFF and R.T. PENNINGTON
STEAM WT. FRACTION
Fig.10
. Film boiling heat transfer coefficients plotted against steam quality
(unrestricted heatei flow areas) for 0.120-in annulus
Fig. 11
Heat transfer to superheated steam at 1000 lb/in2
NUCLEAR SUPERHEAT 71
The air-water tests of the separator using six 18-in nozzles showed
good carryunder (< 0. 2% by weight) performance and smooth separation.
These tests showed a vane capacity at vane pressure and temperature of
7200 ft3/h with water level variation of 18 in. At 5200 ft3/h vane capacity,
the water level could be varied 26 in.
Mixed-spectrum critical assembly (M S C A )
The major area of uncertainty in the mixed-spectrum superheat concept
is in the complex nuclear physics of neutron flux dependence between the fast
and thermal neutron spectrum regions. In particular, the safety of the
system is dependent upon a negative Doppler coefficient. In addition, an
important aspect of the economic incentive is the ability to improve the
volumetric heat release of the MSSR reactor system as compared to boiling-
water reactor systems. This win depend upon utilization of efficient buffer
regions between the two regions of fast and thermal neutron fluxes which
minimize local power peaking. The construction of the MSCA was started
in April 1963 and will be completed during May 1963 [47]. The experimental
work is expected to last about one year. It is expected that the MSCA will
provide the first measurements on Doppler coefficient so that the programme
results will be of value to not only the mixed spectrum reactor concept but also to other fast reactor studies.
The M SCA will be located in the present Critical Experiment Facility
at the Vallecitos Atomic Laboratory. It will be a low-power (0-400 W) mock-
up of the 75 MW(e) MSSR prototype. The core will consist of four distinct
fuel regions as shown in Fig. 12. From the centre of the core outward, these
regions are: (a) central unmoderated fast core; (b) annular unmoderated
fast buffer; (c) annular moderated thermal buffer; and (d) annular moderated
thermal core. An elevation of the MSCA is shown in Fig. 13.
The outer cylindrical wall in the region between the fast and thermal
cores is the inner tank wall for the thermal core. The combination of this
wall and the fast-core shroud separated by the 3/8-in gap will prevent water
from entering the fast core if a leak should occur in the tank wall.
The location of the control elements in the MSCA can be seen in Fig. 13.
In the thermal core, the eight boral safety sheets can be dropped into the
core to scram the reactor. These eight sheets are used as safety sheets
only, and thermal core control is provided by changing the moderator level
in the thermal core tank. Interlocks are provided to prevent raising the
safety sheets unless the thermal core is dry. The four boral coupling control
sheets are used primarily to modify the power split between the fast and
thermal cores, but they can also be scrammed to provide additional shut
down capability.
In the fast core, six of the fuel assemblies are mounted on control drives
to provide fast-core control. Four of the assemblies are provided with B 4C
followers and act as safety scram controls. The remaining two assemblies
have Inconel followers and are used as shim controls.
There are 16 fused fuel assemblies. The purpose of the fuse is to shut
down the reactor during an excursion if the excursion is not stopped by
instrument scram or by other means. The fuse consists essentially of a
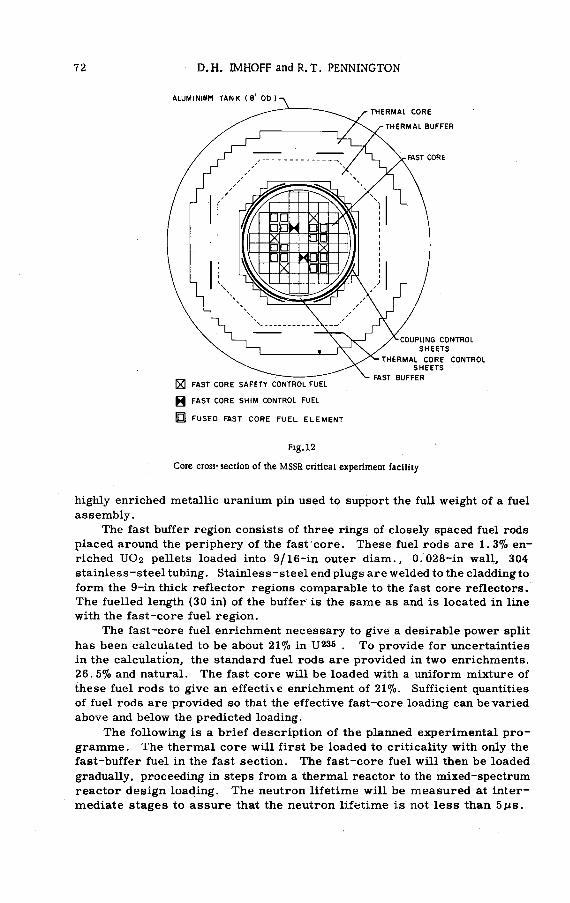
72 D.H. MHOFF andR.T. PENNINGTON
g PAST CORE SHIM CONTROL FUEL
П FUSED FAST CORE FUEL ELEM ENT
Fig.12
Core cross-section of the MSSR critical experiment facility
highly enriched metallic uranium pin used to support the full weight of a fuel
assembly.
The fast buffer region consists of three rings of closely spaced fuel rods
placed around the periphery of the fast core. These fuel rods are 1. 3% en
riched U O 2 pellets loaded into 9/16-in outer diam., 0.028-in wall, 304
stainless-steel tubing. Stainless-steel end plugs are welded to the cladding to
form the 9-in thick reflector regions comparable to the fast core reflectors.
The fuelled length (30 in) of the buffer is the same as and is located in line
with the fast-core fuel region.
The fast-core fuel enrichment necessary to give a desirable power split
has been calculated to be about 21% in U 235 . To provide for uncertainties
in the calculation, the standard fuel rods are provided in two enrichments.
26. 5% and natural. The fast core will be loaded with a uniform mixture of
these fuel rods to give an effective enrichment of 21%. Sufficient quantities
of fuel rods are provided so that the effective fast-core loading can be varied
above and below the predicted loading.
The following is a brief description of the planned experimental pro
gramme . The thermal core will first be loaded to criticality with only the
fast-buffer fuel in the fast section. The fast-core fuel will then be loaded
gradually, proceeding in steps from a thermal reactor to the mixed-spectrum
reactor design loading. The neutron lifetime will be measured at inter
mediate stages to assure that the neutron lifetime is not less than 5 ns.
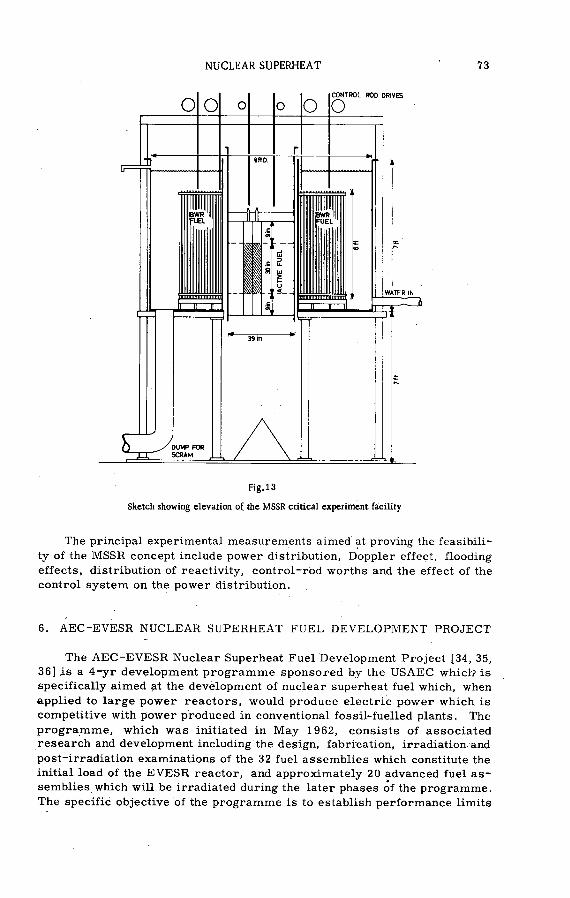
NUCLEAR SUPERHEAT 73
Fig.13
Sketch showing elevation of the MSSR critical experiment facility
The principal experimental measurements aimed at proving the feasibili
ty of the MSSR concept include power distribution, Doppler effect, flooding
effects, distribution of reactivity, control-rod worths and the effect of the
control system on the power distribution.
6. AEC-EVESR NUCLEAR SUPERHEAT FUEL DEVELOPM ENT PROJECT
The AEC-EVESR Nuclear Superheat Fuel Development Project [34, 35,
36] is a 4-yr development programme sponsored by the USAEC which is
specifically aimed at the development of nuclear superheat fuel which, when
applied to large power reactors, would produce electric power which is
competitive with power produced in conventional fossil-fuelled plants. The
programme, which was initiated in May 1962, consists of associated research and development including the design, fabrication, irradiation and
post-irradiation examinations of the 32 fuel assemblies which constitute the
initial load of the EVESR reactor, and approximately 20 advanced fuel as
semblies Which will be irradiated during the later phases of the programme.
The specific objective of the programme is to establish performance limits
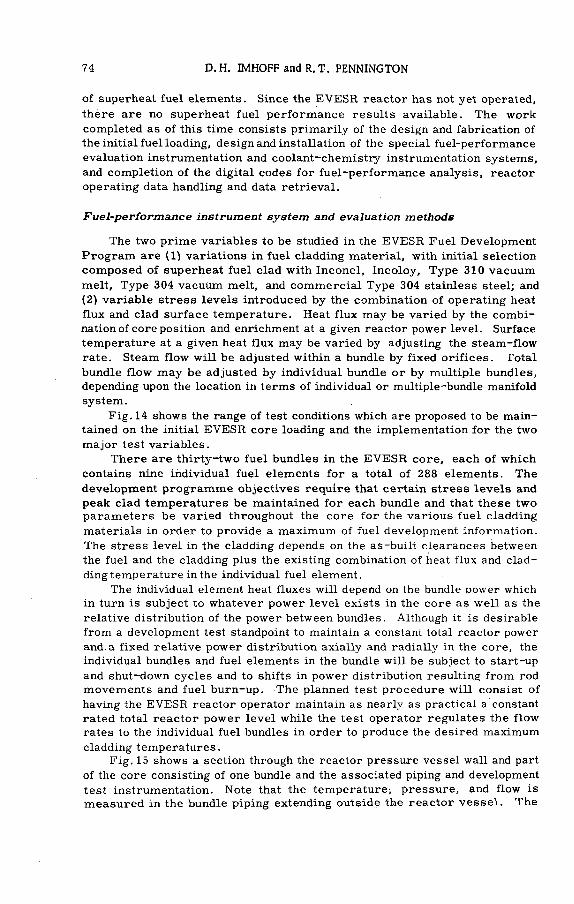
74 D. H. MHOFF and R. T. PENNINGTON
of superheat fuel elements. Since the EVESR reactor has not yet operated,
there are no superheat fuel performance results available. The work
completed as of this time consists primarily of the design and fabrication of
the initial fuel loading, design and installation of the special fuel-performance
evaluation instrumentation and coolant-chemistry instrumentation systems,
and completion of the digital codes for fuel-performance analysis, reactor
operating data handling and data retrieval.
Fuel-performance instrument system and evaluation methods
The two prime variables to be studied in the EVESR Fuel Development
Program are (1) variations in fuel cladding material, with initial selection
composed of superheat fuel clad with Inconel, Incoloy, Type 310 vacuum
melt. Type 304 vacuum melt, and commercial Type 304 stainless steel; and
(2) variable stress levels introduced by the combination of operating heat
flux and clad surface temperature. Heat flux may be varied by the combi
nation of core position and enrichment at a given reactor power level. Surface
temperature at a given heat flux may be varied by adjusting the steam-flow
rate. Steam flow will be adjusted within a bundle by fixed orifices. Total
bundle flow may be adjusted by individual bundle or by multiple bundles,
depending upon the location in terms of individual or multiple-bundle manifold
system.
Fig. 14 shows the range of test conditions which are proposed to be main
tained on the initial EVESR core loading and the implementation for the two
major test variables.
There are thirty-two fuel bundles in the EVESR core, each of which
contains nine individual fuel elements for a total of 288 elements. The
development programme objectives require that certain stress levels and
peak clad temperatures be maintained for each bundle and that these two parameters be varied throughout the core for the various fuel cladding
materials in order to provide a maximum of fuel development information.
The stress level in the cladding depends on the as-built clearances between
the fuel and the cladding plus the existing combination of heat flux and clad
ding temperature in the individual fuel element.
The individual element heat fluxes will depend on the bundle power which
in turn is subject to whatever power level exists in the core as well as the
relative distribution of the power between bundles. Although it is desirable
from a development test standpoint to maintain a constant total reactor power
and. a fixed relative power distribution axially and radially in the core, the
individual bundles and fuel elements in the bundle will be subject to start-up
and shut-down cycles and to shifts in power distribution resulting from rod
movements and fuel burn-up. The planned test procedure will consist of
having the EVESR reactor operator maintain as nearly as practical a constant
rated total reactor power level while the test operator regulates the flow
rates to the individual fuel bundles in order to produce the desired maximum
cladding temperatures.Fig. 15 shows a section through the reactor pressure vessel wall and part
of the core consisting of one bundle and the associated piping and development
test instrumentation. Note that the temperature; pressure, and flow is measured in the bundle piping extending outside the reactor vessel. The
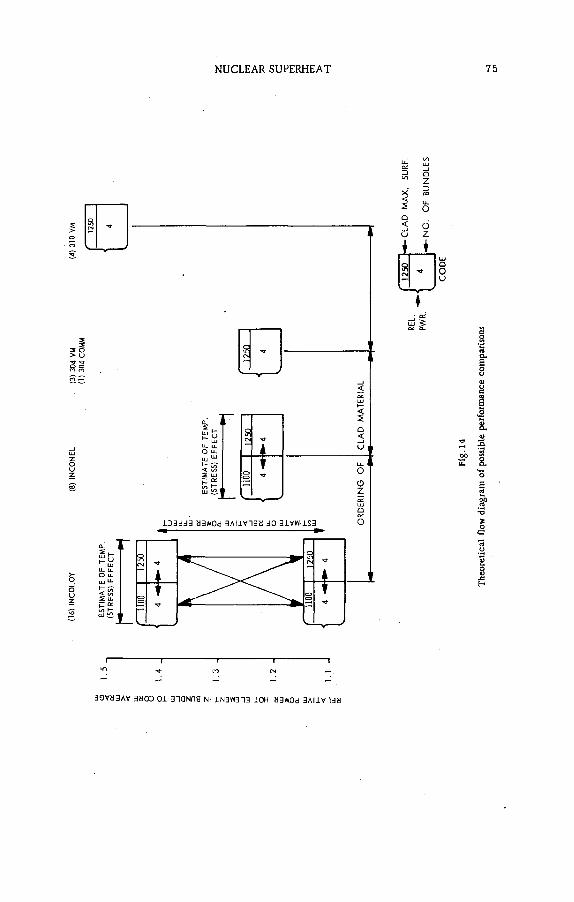
EST
IMA
TE
OF
TEM
P.
(ST
RES
S)
EF
FE
CT
NUCLEAR SUPERHEAT 75
x<2о<
оZD
J L iоОи
Г ---------------------------------- i l l l
U"í 43- ГО СМ —
30VÜзлу згюэ oí эпаыпе n i iNsrans ю н яэмсм з л и у п э я
Fig
.14
Theore
tical
flow
di
agra
m
of
poss
ible
perf
orm
ance
com
paris
ons
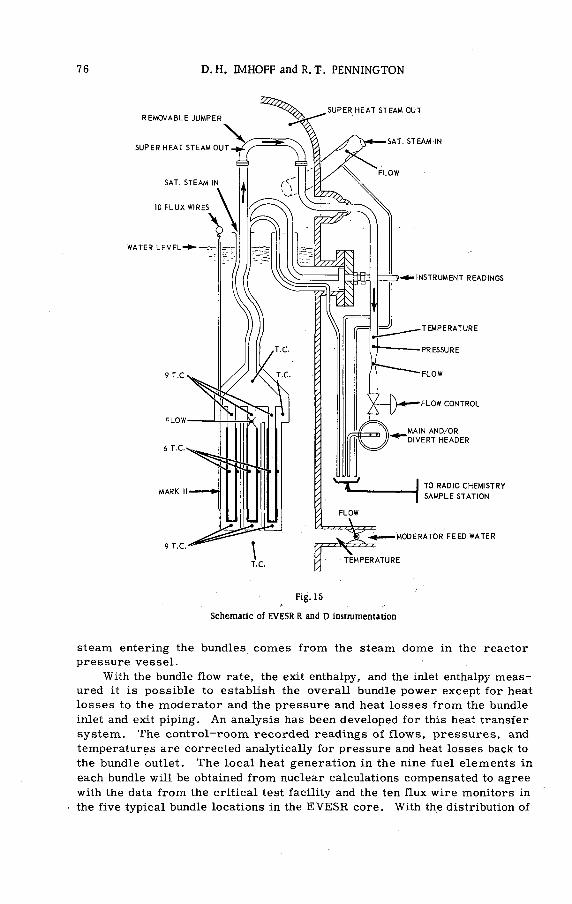
76 D. H. IMHOFF and R. T. PENNINGTON
Fig. 15
Schematic o f EVESR R and D instrumentation
steam entering the bundles comes from the steam dome in the reactor
pressure vessel.
With the bundle flow rate, the exit enthalpy, and the inlet enthalpy meas
ured it is possible to establish the overall bundle power except for heat
losses to the moderator and the pressure and heat losses from the bundle
inlet and exit piping. An analysis has been developed for this heat transfer
system. The control-room recorded readings of flows, pressures, and
temperatures are corrected analytically for pressure and heat losses back to
the bundle outlet. The local heat generation in the nine fuel elements in
each bundle will be obtained from nuclear calculations compensated to agree
with the data from the critical test facility and the ten flux wire monitors in
the five typical bundle locations in the EVESR core. With the distribution of

NUCLEAR SUPERHEAT 77
the heat generation set, the moderator heating established from appropriate
feedwater and moderator measurements, and the flow and bundle exit
enthalpy established, a complete solution of the cladding and fuel tempera
tures is possible for the fuel assembly.
This programme and the analysis procedure for the Philco 2000 computer
will be used initially to construct operating charts which will guide the test
operator in setting the proper flows in the bundles and will be used later in
the test programme to monitor da.y-to~day performance variations.
Except for the flux wire monitors the procedure for testing EVESR fuel
as outlined above involved no in-core instrumentation. Since the computer
analysis is subject to analysis discrepancies and accumulated errors, one-
quarter of the core has been highly instrumented to provide detailed test
checks against the machine calculations.
Fig. 16 shows how the flow-control valves for all of the thirty-two bundles
are distributed for the core. It will be noted that in some instances as many as four bundles are controlled by a single bias flow control valve. If the
test programme requires different flow rates in the four bundles controlled
by a single bias control valve, it will be necessary to orifice them differenti
ally to produce the desired flows.
*0 V 0
У i1-, V...... • j i : J 3
,0-tr
V
lf~~ -, ^,r. У -. _ _ _ _ _ J *
^ f ‘‘VU* 1о !J 1 1
1 a+ i11
LpY
l-«-'
&& \ 11
JJ ' 1
a^!J ii
кlo\vrr J s
ali
j
1 a r \ i ii, i \ ■ i— i 1
и; Л
/■ '
a r cTя..
)J 'r
a r
t fi— J 1 r 1 ' Г ' '
N ?\
Яч Q v .%
M M ARK II CORE R C W N O ZZLE
£ BIAS VALVE
^ FLOW NOZZLES FOR FUTURE USE
Fig. 16
EVESR exit steam manifold arrangement

78 D. H. IMHOFF and R. T. PENNINGTON
The thirty-two fuel assembly" flows, pressures, and temperatures are
measured in the individual piping extending outside the reactor pressure
vessel as shown in Fig. 15. These control room recorded readings are cor
rected analytically for pressure and heat losses back to the bundle outlet.
The local heat generation in the nine fuel elements in each of the fuel as
semblies will be obtained from nuclear calculations compensated to agree
with the data from the critical test facility and the ten flux wire monitors
in the five typical bundle locations in the EVESR core. With the distribution
of the heat generation set, the moderator heating established from appropriate
feedwater and moderator measurements, and the flow and exit enthalpy established from the readings in the external piping, a complete solution of
the cladding and fuel temperatures is possible for the fuel assembly. The flow-
control valves operated from the control room can be used to set up individual
test conditions in the various fuel assemblies.
The above data reduction procedure would permit a complete evaluation
of bundle performance with essentially no in-core instrumentation. To be of
value the accompanying analytical techniques must be checked out thoroughly
and corrected where required to improve accuracy. To enable such a check
to be made, extensive in-core instrumentation is planned for the EVESR core.
There is one fully instrumented assembly in the core. Included in the fully
instrumented fuel assembly are:
(a) Ten flux wire monitors for determining the axial and radial distribution
of the neutron flux within the assembly.
(b) Nine mid-pass and nine exit steam temperature readings to permit a
closer study of the power distribution between elements in the fuel as
sembly and to check the heat split between the inner and outer fuel clad
dings on all nine elements.
(c) The temperature in the inlet plenum is checked to determine the degree
of superheating obtained in the downcomer.
(d) The temperature in the exit steam plenum will be used to check the ana
lytical prediction based on corrected readings from the external piping.
(e) Six fuel-cladding temperatures will be measured in this one assembly.
This will require direct measurement of the cladding temperature
in-pile.
(f) Three of the typical element positions in the fuel assembly will be
checked for flow split between elements.
(g) A thermocouple will be attached to the bottom of the fuel assembly to
measure the moderator-inlet temperature to the bundle.
There are eight other bundles with lesser amounts of instrumentation of
greater reliability which will be arranged as shown in Fig. 17. The codes
key the instruments in the fully instrumented fuel assembly to each of the
eight assemblies. These eight fuel assemblies are located strategically in the quarter core symmetry. Some of the duplications in instrumentation
are intentional to provide cross-checks on readings and to allow for spares
in case of fuel failure.
As shown in Fig. 15, there are flow meters installed in the moderator
fuel water and the reactor inlet steam. Not shown are flow meters and
thermocouples in the main and divert headers. All of this instrumentation

NUCLEAR SUPERHEAT 79
A2 A3 A4 A5
B1 B2 B3 *ÿ
B4 B5 B6
Cl
á
C2 C3
âC4
Й»
C5 C6
Dl ^ D3 ^ 05
El E2 E3
âE4 ES
J PШE6
ШF2 F3 *
ÿ F 4 F5
^ F U E L E LE M E N T STEAM E X IT T E M P E R A T U R E , 9
©F U E L E L E M E N T STEAM T E M P . BETW EEN PASSES, 9
( ¿ ) F L U X WIRES. 6
W ATER T E M P E R A T U R E , 4
GROSS STEA M IN L E T T E M P E R A T U R E , 4
Ц П GROSS SJE A M O U T L E T T E M P E R A T U R E , 4
M ID P O IN T ON T H E PASSES, 1
E LE M E N T FLOW R A T E , 1
RAD IO C H E M IS TR Y , 32
IN-CO RE F L U X M ONITORS, 5
Fig. 17
Schematic of EVESR instrumentation in plan view
permits gross heat and mass balances to be made which, in turn, can be
checked against the data from the thirty-two fuel assemblies.
In Fig. 15, the principal radiochemistiy sample points around the reactor
are shown. These are as follows:
(a) Four fuel-assembly inlet samples to determine if centrally-located fuel
assemblies suffer from more or less moderator water carryover than
fringe-located fuel assemblies.

80 D. H. IMHOFF and R. T. PENNINGTON
(b) Exit steam samples from each of the thirty-two fuel assemblies will be drawn from the individual external steam pipes.
(c) Steam samples are also drawn from the incoming saturated steam and
the mixed outlet steam in the main and divert headers.
Reactoi water chemistry control and surveillance
The water chemical control and surveillance programmes are divided
into two categories: (1) routine process control, which comprises chemical
measurements of water environments essential to the safe operation of the
reactor and boiler and to the''interpretation of the experimental studies per
formed in the reactor, and (2) research and development programmes,
which are designed to answer specific questions of major importance to the
development of successful superheat reactors. Specifically, the objectives
of these programmes are as follows:
(a) To monitor various chemical parameters throughout the plant in order
to provide protection against undue corrosion, to assess the operation
of plant equipment, to assure compliance with established safety criteria,
and to provide background information essential for the interpretation
of research and development studies.
(b) To detect and locate defective fuel bundles and study the characteristics
of fission product release from defective superheat fuel.
(c) To develop an effective simplified system for the location of defective
fuel in superheat reactors.
(d) To determine the extent and character of radioactive contamination in
the steam and condensate systems, and to study mechanisms of
contamination build-up in superheat reactor systems as a function of
fuel failure mode, burn-up and operating history.
The equipment required to accomplish the above objectives includes
sample lines and analysis equipment for a variety of plant parameters as
shown in Table IV. Not all of the parameters would be measured on each
sample line; however, the sample system would be designed for a fair degree
of flexibility so that many sample lines can be analysed for the important process parameters. This is considered to be essential since the controlling
factors which will limit superheat fuel performance have not yet been identified.
Initial loading physics test program m e
It is planned to load the core to criticality with fuel having unflooded
superheat passages. After making a temperature coefficient measurement,
the loading will continue to the full core size (32 bundles). With the full core
loading at room temperature, control-rod calibrations and scram rod worth,
stainless-steel fuel-channel worth and temperature coefficient measurements
will be made.
Similar measurements will then be performed for the flooded core, be
ginning with a minimum critical loading. After completing the flooded, head-
off measurements, the pressure vessel head will be secured in place. By
the use of boiler steam the core water will be heated in steps from 68 to

NUCLEAR SUPERHEAT 81
545°F. The control-rod position for a just critical full coré will be deter
mined as a function of moderator temperature. Also, the minimum control-
rod shut-down margin will be demonstrated in the Hooded condition where
the reactivity is shown to be the greatest. Control-rod calibrations will be
made at two elevated temperatures ( ^400 and 545°F) after which the super
heat passages will be unflooded by the use of boiler steam. Control-rod
calibrations will be repeated for the unflooded core at two elevated tempera
tures. Maintaining steam flow, critical controls positions will be determined
as the core temperature is reduced from 545°F to a minimum of about 300°F.
Upon completion of the zero-power testing, low-power testing will be
used initially to calibrate power-range instruments against thermal data.
Then, an attempt will be made to measure void and fuel Doppler reactivity
for several power and steam flow combinations. Finally, power distribution
mapping and measurements of xenon transients will be made.
R E F E R E N C E S
[1] RICHARDS, R .B ., Technical and Economic Status of Central Station Boiling Water Reactors, General
Electric Company (22 March 1961).
[2] KAISER ENGINEERS, Steam Cooled Power Reactor Evaluation, Capital and Power Generation Costs,
USAEC Rpt. KE-60-31 (17 March 1961).
L3J PURSEL, C .A . , USAEC Superheat Program, USAEC (1 July 1960).
[4] ALLIS-CHALMERS MANUFACTURING COMPANY, Pathfinder Atomic Power Plant, Final Safeguards Rpt.
USAEC Rpt. ACNP-5910.
[5] GENERAL NUCLEAR ENGINEERING CORP., BONUS, Final Hazards Summary Report, USAEC Rpt.
■PRWRA- GNEC 5.
[6] ARGONNE NATIONAL LABORATORY, Preliminary Design and Hazards Report - Boiling Reactor Experiment
V ( BORAX V), USAEC Rpt. ANL-6120 (Feb. 1960).
[7] WALLIN, W .R , RICE, R.E. and NOVICK, М ., Power Reactor Experiments. IAEA. Vienna, II (1962) 9.
[8] CHICAGO OPERATIONS OFFICE, Nuclear Superheat Meeting No. 1 (21-23 Sept. 1959) San Jose, Calif.
USAEC Rpt. COO 260.
[9] CHICAGO OPERATIONS OFFICE, Nuclear Superheat Meeting No. 2 (7-8 April 1960) Dunedin, Florida,
USAEC Rpt. COO 261,
[10] CHICAGO OPERATIONS OFFICE, Nuclear Superheat Meeting No.3 (13-14 0ct.l960) Milwaukee
Wisconsin, • USAEC Rpt. COO 262.
[11] CHICAGO OPERATIONS OFFICE, Nuclear Superheat Meeting No.4 (13-14 April 1961) Idaho Falls, Idaho,
USAEC Rpt. COO 263.
[12] CHICAGO OPERATIONS OFFICE, Nuclear Superheat Meeting No. 5 (13-15 Sept. 1961), San Jose, Calif.
USAEC Rpt. COO 264.
[13] CHICAGO OPERATIONS OFFICE, Nuclear SuperheatMeeting No. 6 (7- 9March 1962) Windsor, Connecticut,
USAEC Rpt. COO 265.
[14] CHICAGO OPERATIONS OFFICE, Nuclear Superheat Meeting No. 7 (12-14 Sept. 1962) Sioux Falls, South
Dakota, USAEC Rpt. COO 266.
[15] GENERAL NUCLEAR ENGINEERING CORP., First Quarterly Progress Report,(July - Sept. 1959).Nuclear
Superheat Development Program, USAEC Rpt. GNEC 118.
[16] WESTINGHOUSE, First Quarterly Progress Report(5 Jan.1962 - 31 March 1962) for 1000 MWe Supercritical
Pressure Nuclear Reactor Plant Study, USAEC Rpt. WCAP-2009.
[17] IMHOFF, D .H ., COOK, W .H ., PENNINGTON, R.T. and SPALARIS, C .N ., Experimental Programs in
the Vallecitos Boiling Water Reactor, presented at Ann.Meeting Amer.Nucl. Soc., Gatlinburg, Tennessee
(17 June 1959).
[18] IMHOFF, D .H . , Power Reactor Experiments, IAEA, Vienna II (1962) 53.
[19] IMHOFF, D .H . and PENNINGTON, R. T . , Nuclear Superheat for Boiling Water Reactors, 1962 Nuclear
Congress, New York City Coliseum (4-6 June 1962.)

82 D. H. IMHOFF and R. T. PENNINGTON
[20]’ PENNINGTON, R .T ., Nuclear Superheat Project, First Quarterly Progress Rpt. (July-Sep.1959) USAECRpt.
GEAP- 3290.
[21] PENNINGTON, R. T . , Nuclear Superheat Project, Second Quarterly Progress Rpt. (Oct.-Dec.1959) USAEC
Rpt. GEAP-3371.
[22] PENNINGTON, R.T. , Nuclear Superheat Project, Third Quarterly Progress Rpt. (Jan.-March 1960) USAEC
; Rpt. GEAP-3468.
[23] PENNINGTON, R .T . , Nuclear Superheat Project, Fourth Quarterly Progress Rpt. (April-June 1960) USAEC
. Rpt. GEÀP-3538.
[24] PENNINGTON, R.T. . Nuclear Superheat Project, Fifth Quarterly Progress Rpt. (July-Sep.1960) USAEC
Rpt. GEAP-3581.
[25] PENNINGTON, R. T. ; Nuclear Superheat Project, Sixth Quarterly Progress Rpt. (Oct.-Dec. 1960), USAEC
Rpt. GEAP-3686.
[26] PENNINGTON, R .T ., Nuclear Superheat Project, Seventh Quarterly Progress Rpt. (Jan,-March 1961)
USAEC Rpt. GEAP-3724.
[27] PENNINGTON, R .T ., Nuclear Superheat Project, Eignth Quarterly Progress Rpt. (April-June 1961),
USAEC Rpt. GEAP-3785.
[28] PENNINGTON, R. T . , Nuclear Superheat Project, Ninth Quarterly Progress Rpt. (July-Sep.1961), USAEC
Rpt. GEAP-3877.
[29] PENNINGTON, R .T ., Nuclear Superheat Project, Tenth Quarterly Progress Rpt. (Oct -Dec.1961),USAEC
Rpt. GEAP-4024.
[30] PENNINGTON, R.T. , Nuclear Superheat Project, Eleventh Quarterly Progress Rpt. (Jan.-March 1962)
USAEC Rpt. GEAP-3924.
[31] PENNINGTON, R .T ., Nuclear Superheat Project, Twelfth Quarterly Progress Rpt. (April-June 1962)
USAEC Rpt. GEAP-4075.
[32] PENNINGTON, R .T ., Nuclear Superheat Project, Thirteenth Quarterly Progress Rpt. (July-Sep. 1962)
USAEC Rpt. GEAP- 4126.
[33] PENNINGTON, R .T . , Nuclear Superheat Project, Fourteenth Quarterly Progress Rpt. (Oct.-Dec. 1962)
USAEC Rpt. GEAP-4153.
[34] PENNINGTON, R. T . , EVESR Nuclear Superheat Fuel Development Project, First Quarterly Progress Rpt.
"(May- Aug. 1962) USAEC Rpt. GEAP-4105.
[35] PENNINGTON, R .T ., EVESR Nuclear Superheat Fuel Development Project, Second Quarterly Progress
Rpt. (Sep.-Nov. 1962) USAEC Rpt. GEAP-4146.
[36] PENNINGTON, R .T ., EVESR Nuclear Superheat Fuel Development Project, Third Quarterly Progress Rpt.
(Dec.1962 - Feb. 1963) USAEC Rpt. GEAP-4200.
[37] JANSSEN, E . , Superheat Process Tube Heat Transfer Tests, USAEC Rpt. GEAP-3319(5 Jan.1960).
[38] SPALARIS, C .N ., LEES, E.A. and BOYLE, R .F ., Fabrication, Irradiation and Evaluation of Superheat
Fuel Elements USAEC Rpt. GEAP-3387.
[39] RIESLAND, J. I. , Interim Report on Steam Dryer Development, USAEC Rpt. GEAP-3563'.
[40] ONGMAN, H .D . , and STEAMER, A .G . , Results of Air-Water Steam-Water Tests on Primary Steam
Separators, USAEC Rpt. GEAP-3564(7 0ct.l960).
[41] PENNINGTON, R .T ., Economic Study for 300 MW(e) Separate Superheat Reactor, USAEC Rpt. GEAP-3589
(Nov. 1960).
[42] WOLFE, B. , Economic Study of the Mixed Spectrum Superheater, USAEC Rpt. GEAP-3590 (April 1961).
[43] RAYMONT, W.R. and DANIELS, D .T , Manufacture of the Adhesive Bonded AEC Superheat Critical Fuel,
USAEC Rpt. GEAP-3591 (9 Dec. 1960).
[44] PENNINGTON, R.T. , Economic Study for 300 MW(e) Once-Through Superheat Reactor, USAEC Rpt.
GEAP-3633 (Jan. 1961).
[45] SPALARIS, C .N . , COMPRELLI, F.A. and SIEGLER, М ., Erosion Experiments of Powder Compacted
Uranium Dioxide Under Dynamic Steam Flow, USAEC Rpt. GEAP-3698 (21 March 1961).
[46] POLOMIK, E. E. .LEVY, S. and SAWOCHKA, S .G .. Heat Transfer Coefficients with Annular Flow During
"Once-Through" Boiling of Water to 100 Per Cent Quality at 800, 1100, and 1400 psi. USAEC Rpt.
GEAP-3703(1 May 1961).
[47] REYNOLDS, A .B ., Flood Safety of The Mixed Spectrum Superheater, USAEC Rpt. GEAP-3737 (25 May
1961).
[48] LYONS, M .F , et al. , Plastic.Strain in Thin Fuel Element Cladding Due to U 0 2 Thermal Expansion,
USAEC Rpt. GEAP-3739 (9 July 1961).
NUCLEAR SUPERHEAT 83
[49] PEARL, W .L . , FITZSIMMONS, M . D. and SIEGLER, М ., A Simulated Superheat Reactor Corrosion
Facility, USAEC Rpt. iGEAP-3778 (14 Aug. 1961).
[ 50] GAUL, G. G . and PEARL ,'"W. L ., Corrosion of Type 304 Stainless Steel in Simulated Superheat Reactor
Environments, USAEC Rpt. GEAP-3779 (16 Oct. 1961).
[51] ESCH, E .L ., Development of Process Tubes for Nuclear Superheat Applications, USAEC Rpt. GEAP- 3184
(15 Nov. 1961).
[52] RIESLAND, J .I ., Results of Air-Water and Steam-Water Tests on Radial Vane Steam Separator Models,
USAEC Rpt. GEAP-3787,
[53] SPALARIS, C .N ., BOYLE, R.F., EVANS, T.F. and ESCH, E .L ., Design, Fabrication and Irradiation
of Superheat Fuel Element SH-4B in VBWR, USAEC Rpt. GEAP-3796 (1 Sep.1961).
[54] SPALARIS, C .N . , COMPRELLI, F .A ., DOUGLASS, D.L. and REYNOLDS, M .B ., Materials for Nuclear
Superheat Applications, A Literature Survey, USAEC Rpt. GEAP-3875 (5 Jan.1962).
[ 55] PETERSEN, G. T . , AEC Superheat Criticáis - A Comparison of Experiment and Theory of Uniform Lattices,
. USAEC Rpt. GEAP-3882.
[56] REYNOLDS, M.B. , Slow Cycle Strain Fatigue in Thin Wall Tubing, Preliminary Rpt, USAEC Rpt. GEAP-
3983(19 July 1962).
[57] ROBBINS, C .H ., Analyses of the Radial Separator, USAEC Rpt. GEAP-4012 (6 Feb. 1962).
[58] BRYNSVOLD, G .V ., HIKIDO, K . , REYNOLDS, A.B. and RILEY, D .R ., Conceptual Design Study for a
75 MW(e) Mixed Spectrum Superheating Power Plant, USAEC Rpt. GEAP-4016 (25 Feb. 1962).
[59] PEARL, W .L ., GAUL, G .G . and SIEGLER, М ., Stress Corrosion of Type 304 Stainless Steel in Simulated
Superheat Reactor Environments, USAEC Rpt. GEAP-4025 (26 Feb. 1962).
[60] Summary Safeguards Report for the Critical Experimental Facility, USAEC Rpt. GEAP-4045.
[61] SCHMIDT, R .A ., ARMOUR, S.F. and CLANCEY, W .R ., Design Study of a 600 MW(e) Boiling Water-
Separate Superheat Reactor Plant, USAEC Rpt. GEAP-4057 (Sep.1962).
[62] KLEPFER, H .H . , DOUGLASS, D .L . , CUMMINGS, W .V . , REYNOLDS, M .B . and ANTONY, K .C . ,
Remarks Concerning Materials for Nuclear Superheat Cladding, USAEC Rpt. GEAP-4060 (4 Sep. 1962).
[63] HAZEL, V ., Studies of UO2 Cladding Mechanical Interactions, USAEC Rpt. GEAP-4088 (Oct. 1962).
[64] KIRBY, R .F ., Evaluation of 300 Series Stainless Steel, USAEC Rpt. GEAP-4095 (Oct. 1962).
[65] PEARL, W .L. and GAUL, G .G . , General and Stress Corrosion of High Nickel Alloys in Simulated Super
heat Reactor Environment, USAEC Rpt. GEAP-4165A (March 1963).
D I S C U S S I O N
E. PARKER : Do you think that the future of boiling-water reactors is
dependent on the success of nuclear superheat?
R .T . PENNINGTON: Not really. Superheat plants, after all, merely
complement boiling-water systems and are not essential to their economic
utilization.. The development of superheat can clearly be of direct benefit to
boiling-water reactors if it results in an improved technology, as it certainly will, but it is generally agreed that nuclear superheat should not be pursued
unless it can be shown that it will eventually produce power at lower cost.
E . PARKER: Thank you.I have, however, another question. A tremendous effort is being made throughout the world to develop fast, plutonium-fuelled
reactors, and these will have to be supplied with fuel by good converter
reactors - a fact which was stressed in the report addressed by the United
States Atomic Energy Commission (USAEC) to President Kennedy. Good
converters are reactors which not only produce electricity cheaply but also produce a large amount of plutonium per annum per MW(e) installed. Taking
into account the characteristics required of the fuel and the anticipated yield,
it would seem that superheat reactors could not be good converters. In fact,
they appear to be less valuable as converters than present-day boiling-water
reactors, especially those having Zircaloy cladding. A simple calculation is

84 D.H. IMHOFF and R.T. PENNINGTON
enough to show that a boiling-water reactor such as KRB in Grundremmingen
requires as long as 15 to 20 yr - depending on the assumptions one makes -
to produce the plutonium needed by a fast reactor of the same power. A
superheat reactor would require something of the order of 25 or 30 yr,
depending on the type of fuel and the yield obtained. Thus it is hard to see
how superheat reactors can have any place in a co-ordinated programme
for the development of plutonium breeders. It would be interesting to hear
your comments on this "programmatic" aspect of the superheat problem.
R . T . PENNINGTON : It is perfectly true that at the present stage of
development superheat reactors have higher cladding/fuel and water/fuel
ratios than boiling-water systems with zirconium-clad fuel; the conversion
ratio is therefore poorer and they are bound to produce less plutonium. It
should be remembered, however, that nuclear superheat is in an early stage
of development, and one should not assume that the poor conversion ratio is
an inherent defect that cannot be overcome. Future designs will tend to
emphasize those features - including a high conversion ratio and high ef
ficiency - which will make superheat reactors economically more attractive.
C .A . PURSEL: Mr. Parker has raised a very interesting question: the
problem of striking a balance between immediate commercial advantage and
long-term utilization of natural resources. The superheat reactor admittedly
has a poor conversion ratio; on the other hand the price of enriched uranium
and plutonium has decreased over the past few years, and this fact auto
matically makes the high conversion ratio less vital economically - less
essential, at least, than it appeared to be a few years ago. There is no in
centive to save neutrons that do not cost much, or to produce plutonium that
is not worth much. One of our immediate goals is to develop a commercially
self-sufficient nuclear industry, based on existing fuel-cycle economics,
such as will be able to bear a large share of the development costs for future
reactors. In the long run, however, the price of U 235 and plutonium is bound
to increase as they become more rare, and the breeder will then clearly
come into its own. The long-term programme must therefore aim at bring
ing a commercially acceptable breeder onto the market before that time
comes.
U. ZELBSTEIN: Let me point out first that any comparison of the cost
of a nuclear installation with that of fossil-fuelled plants should take into
account possible cost developments in the latter. That is merely a general
comment. Then I should like to know whether any experiments with plutonium
fuel elements are anticipated within the framework of the existing super
heat programme.
R .T . PENNINGTON: No work with plutonium is planned as part of the
USAEC superheat programme as plutonium technology is being dealt with
under other programmes - at Hanford and the Argonne National Laboratory.
If I may return for a moment to the previous topic of discussion, economic
studies have shown that the superheat reactor, if successfully developed,
will be able to produce power more cheaply than nuclear saturated-steam
systems. It is really impossible, however, to make broad generalizations
regarding the cost of different systems. Each new plant must be evaluated
and costed separately, account being taken of its size, location and the way
in which it is to be financed.

NUCLEAR SUPERHEAT 85
P. EDDY: Perhaps I could amplify some of the comments that have been
made. It has already been pointed out that the boiling-water programme is
not at all dependent on the superheat programme, though it certainly stands
to profit by superheat studies. Under the superheat programme the fuel will
be subjected to very stringent tests; we will learn a great deal about
materials, and all this is bound to assist the development of fuel for boiling-
water reactors.
As to the fast reactor programme, you may know that a fast ceramic
reactor is to be built for testing purposes in Arkansas. It will be backed by
a group of utilities in the southwestern United States and by the USAEC, and
will also receive some support from Karlsruhe and the General Electric
Company. Its purpose is to demonstrate that a fast ceraimic reactor using
plutonium fuel is feasible, and that it will work - or so we hope - as a partner
with the boiling-water or light-water reactors in establishing a realistic
price for plutonium. Onoe the fast ceramic reactor has been demonstrated,
we believe that it will in fact establish a price for plutonium somewhat above
the USAEC1 s current support price, and that by the 1970's this partnership
will result in better fuel-cycle economics for both the boiling-water reactor
and the fast ceramic reactor.


EXPERIENCE WITH SPECIFIC NUCLEAR
POWER PLANTS


POST-CONSTRUCTION TESTING OF THE ELK RIVER, HALLAM AND PIQUA POWER REACTOR PLANTS
C .A . PURSEL UNITED STATES ATOM IC ENERGY COM MISSION,
ARGONNE, ILL.
Abstract — Résumé — Аннотация — Resumen
POST-CONSTRUCTION TESTING OF THE ELK RIVER, HALLAM, AND PIQUA POWER REACTOR PLANTS.
Actual experience gained during the post-construction testing of three nuclear power plants, under the USAEC
Power Reactor Demonstration Program, may permit some generalizations concerning this phase of plant con
struction and operation.
The three plants, Elk River Reactor (ERR), Hallam Nuclear Power Facility (HN'PF), and the Piqua Nuclear
Power Facility (PNPF), represent three different reactor concepts: natural-circulation boiling water, sodium-
graphite, and organic cooled and moderated, respectively.
The post-construction testing period included the time between the end of construction (erection of
structures and installation of equipment) and the beginning of power operation (generation of significant net
electrical power). The tests were intended to: (a) verify the performance characteristics of the as-installed
equipment; (b) obtain initial criticality and reactivity coefficient measurements; and (c) determine reactor
physics and plant performance characteristics at a sequence of increasing power levels.
.The experience gained can be reported in six separate but interrelated categories: (1) schedule; (2) costs;
(3) staffing requirements; (4) procedures; (5) equipment performance (including malfunctions); and (6) actual,
as compared to predicted, system performance characteristics.
The average project staffing, including craftsmen, operators, supervisors, technical support and trainees,
was approximately 50 for ERR, 115 for HNPF, and 60 for PNPF.
Detailed written Pre-operational Test Procedures were prepared for each major component and system.
To the maximum possible extent, all tests were performed before fuel loading and operation of the integrated
plant.
Authorization procedures (duplicates of the licensing procedures for non-USAEC-owned plants) were in
progress during almost all of the post-construction testing periods.
The time required for post-construction testing of each of these plants significantly exceeded the original
estimates. The tests disclosed numerous, observed or suspected, deficiencies or malfunctions of components
which led to additional testing and analyses. In some instances, repair or modification of components was
necessary to correct fabrication or engineering errors.
Major problem areas are discussed:
Elk River Reactor. Discovery of cracks in portions of the reactor vessel surface cladding led to extensive in
vestigations and analyses and required some repairs and vessel modifications. Insufficient steam separation
capacity required replacement and modification of some reactor vessel internal hardware.
Hallam Nuclear Power Facility. Entrainment of the helium cover gas led to modifications of the secondary
sodium loops. Failure of a tube in the intermediate (sodium to sodium) heat exchanger led to analyses to
determine the cause of failure followed by removal and repair of the heat exchanger.
Piqua Nuclear Power Facility. Chemical cleaning of the piping system damaged several valves which required
mere repair or replacement. Leaks in the organic coolant and steam tracing systems caused repeated delays.
After completion of the necessary repairs and modifications, the actual performance characteristics of
each of the three reactors closely matched design predictions.
ESSAIS APRÈS CONSTRUCTION DES CENTRALES NUCLÉAIRES D'ELK RIVER, DE HALLAM ET DE PIQUA.
Les résultats des essais après construction de trois centrales nucléaires, dans le cadre du programme de démon
stration des centrales nucléaires de la Commission de l'énergie atomique des Etats-Unis (CEA-EU), permettront
peut-être de faire certaines généralisations concernant cette phase de la construction et de l’exploitation des
centrales.
89
90 C.A. PURSEL
Ces trois centrales, le réacteur de puissance d'Elk River (ERR), la centrale nucléaire de Hallam (HNPF),
et la centrale nucléaire de Piqua (PNPF), appartiennent à trois filières différentes: réacteur à eau bouillante à
circulation naturelle, réacteur à graphite et à sodium et réacteur ralenti et refroidi par un fluide organique.
La période des essais après construction a com m encé à la fin de la construction (érection des bâtiments
et installation du matériel) et s'est terminée au début du fonctionnement en puissance (production nette de
courant électrique appréciable). Les essais avaient pour but: a) de vérifier les performances du matériel ainsi
installé; b) de mesurer les valeurs initiales des coefficients d'état critique et de réactivité; c) de déterminer les
paramètres de physique dies réacteurs et les performances de l’ installation à différents niveaux de puissance
progressivement croissants.
L ‘expérience acquise peut être décrite sous six rubriques distinctes mais apparentées: 1 . calendrier;
2 . coûts; 3* besoins en personnel; 4 , méthodes; 5 . performances du matériel (y compris le mauvais fonctionne
ment); 6 . performances réelles de la filière par rapport aux prévisions.
Les effectifs moyens pour chaque installation, y compris les ouvriers, les opérateurs, les cadres supé
rieurs, le personnel technique d’appui et les stagiaires sont d ’environ 50 personnes pour l’ERR, 115 pour l'HNPF,
et 60 pour le PNPF.
Des listes détaillées d'essais à effectuer avant fonctionnement ont été préparées pour chaque pièce et
partie constitutive importante. Autant que possible on a procédé à tous les essais avant de charger le ré
acteur et de mettre en route l'ensemble de l'installation.
Les demandes d'autorisations (correspondant aux demandes de permis pour les installations qui n'appar
tiennent pas à la CEA-EU) ont été instruites pendant presque toute la période des essais après construction.
Le temps nécessaire pour les essais après construction de chacune de ces centrales a été nettement plus
long que prévu. Les essais ont mis en évidence de nombreux défauts ou vices de construction des pièces,
constatés ou supposés, qui ont nécessité des essais et des analyses supplémentaires. Dans certains cas, il a
fallu réparer ou modifier des pièces pour porter remède à des défauts de fabrication ou des erreurs techniques.
Les principaux défauts relevés ont été les suivants:
Réacteur de puissance d'Elk River. On a découvert des craquelures dans certaines parties du révêtement du
caisson du réacteur. Q a fallu faire des recherches et des analyses poussées ainsi que des réparations et apporter
des modifications à la cuve. La capacité de séparation de la vapeur était insuffisante; il a fallu remplacer et
modifier certaines parties du circuit à l'intérieur du caisson.
Centrale nucléaire de Hallam. On a constaté que de l'hélium était entzaîhé dans le sodium, et il a fallu
modifier le circuit secondaire du sodium. On a découvert une défaillance d'un tube dans l'échangeur de
chaleur intermédiaire (sodium-sodium) ; il a fallu procéder à des analyses pour en rechercher la cause, et
démonter l'échangeur pour le réparer.
Centrale nucléaire de Piqua. En nettoyant les canalisations avec des produits chimiques, on a endommagé
plusieurs vannes et il a fallu soit les réparer soit les remplacer. Des fuites dans le circuit du fluide de refroi
dissement organique et dans le circuit de réchauffage par circulation de vapeur ont provoqué des retards répétés.
Une fois terminées les réparations et apportées les modifications nécessaires, les performances de chacun
des trois réacteurs concordaient étroitement avec les prédictions des plans.
ПРЕДЭКСПЛУАТАЦИОННОЕ ИСПЫТАНИЕ ЭЛК-РИВЕРСКОЙ, ХЭЛПЕМСКОЙ И ПИКУАСКОЙ ЭНЕРГЕТИЧЕСКИХ РЕАК
ТОРНЫХ УСТАНОВОК. Фактический опыт, накопленный во время предэксплуатационных испытаний трех
ядерных энергетических установок, построенных по демонстрационной программе энергетических ре
акторов Комиссии по атомной энергии Соединенных Штатов, позволяет сделать некоторые обобщения
в отношении этой фазы строительства и эксплуатации установок.
Три установки, а именно Элк-риверский реактор (ER R), Хэллемская ядерная энергетическая уста
новка (HNPF) и Пикуаская ядерная энергетическая установка (R í P F ) , представляют три различных
типа реакторов: реактор с кипяшей водой с естественной циркуляцией, натриево-графитовый реактор
и реактор с органическим теплоносителем и замедлителем соответственно.
Период предэксплуатационных испытаний охватывает время между окончанием строительства (со
оружение эдакий и установка оборудования) и началом эксплуатации на мощности (производство зна
чительного количества электрической энергии н е тт о). Испытания преследовали следующие цели:
1) проверить рабочие характеристики установленного оборудования; 2) определить начальную кри
тичность и коэффициент реактивности и 3) определить физические характеристики реактора и рабочие
характеристики установки по мере увеличения мощности.
Накопленный опыт мохет быть изложен в шести отдельных, но взаимосвязанных разделах: 11 про
грамма; 2) стоимость; 3) потребности в кадрах; 4) технология проведения испытаний; 5) работа

POST-CONSTRUCTION TESTING 91
оборудования (включая неполадки) й 6) фактические (по сравнению с расчетными) характеристики
работы системы.
Средняя проектная численность персонала, включая рабочих, операторов, дозиметристов, вспо
могательный технический персонал и стажеров, составляет: для ERR - 5 0 , для HNPF - 115 и для
PNÍT - 60 человек.
Подробная технология предэксплуатационных испытаний в письменном виде была подготовленв
для каждого важного компонента и каждой системы установки. Насколько это было возможно, все
испытания были проведены до загрузки топлива и начала эксплуатации всей установки.
Оформление разрешений на экплуатацию установок (дубликаты лицензий на непринадлежащие КАЭ
США установки) заняло почти все время проведения предэксплуатационных испытаний.
Время, потребовавшееся для проведения предэксплуатационных испытаний каждой из этих уста
новок, значительно превысило первоначально намеченное время. Испытания вскрыли ряд явных и пред
полагаемых неисправностей компонентов, в результате чего потребовалось провести дополнительные
испытания и анализы. В ряде случаев для исправления ошибок, допущенных при изготовлении или
конструировании оборудования, компоненты пришлось ремонтировать или видоизменять.
Основными неполадками были:
Элк-риверский реактор. В некоторых частях бака реактора обнаружены трещины, что потребовало
обширных исследований и анализов, а также некоторого ремонта и модификации бака. Недостаточная
производительность пароотделителя потребовала замены к модификации некоторых металлических деталей
бака реактора.
Хэлдемская ядерная энергетическая установка. Увлечение защитного газа гелия привело к необходи
мости модифицировать вторичные натриевые контуры. Повреждение трубопровода в промежуточном
{натриево-натриевом; теплообменнике потребовало проведения анализов для определения причины по
вреждения, вслед за чем последовало извлечение и ремонт теплообменника.
Пикуаская ядерная энергетическая установка. При химической очистке системы трубопроводов по
вреждено несколько вентилей, что потребовало их ремонта или замены. Утечки в системе органичес
кого теплоносителя и в системе индикации пара привели к повторным задержкам.
После окончания необходимого ремонта и внесения изменений фактические рабочие характеристики
каждого из трех реакторов приблизились вплотную к проектным расчетам.
ENSAYOS POSTERIORES A LA CONSTRUCCIÓN DE LAS CENTRALES NUCLEOÉLECTRICAS DE ELK RIVER,
HALLAM Y PIQUA. La experiencia adquirida directamente en los ensayos efectuados después de terminada
la construcción de las tres centrales nucleoeléctricas del programa de demostración de reactores de potencia
de la Comisión de Energía Atómica de los Estados Unidos permite deducir ciertos principios generales acerca
de esta fase de la construcción y explotación de las centrales.
Las tres instalaciones, a saber, el reactor de Elk River (ERR), la central nucleoeléctrica de Hallam
(HNPF) y la central nucleoeléctrica de Piqua (PNPF), representan tres conceptos diferentes en materia de
reactores: el de agua hirviente con circulación natural, el de sodio-grafito y el de moderador y refrigerante
orgánicos, respectivamente.
El periodo de ensayos comenzó al concluirse la obra (construcción de las estructuras e instalación de los
equipos) y se terminó con la iniciación del desarrollo de potencia (producción neta de una cantidad apreciable
de energía eléctrica). Los ensayos tenían por finalidad: a) verificar las características de funcionamiento del
equipo instalado, b) determinar las condiciones de criticidad y el coeñciente de reactividad y c) determinar
los parámetros físicos del reactor y las características de rendimiento de la central para una serie creciente de
valores de la potencia.
La experiencia adquirida puede agruparseren seis categorías de datos distintos pero relacionados entre sí*
1) calendario, 2) costos, 3) necesidades de personal, 4) métodos, 5) comportamiento del equipo (incluso
defectos) y 6) características reales de rendimiento del sistema y comparación con los valores calculados.
En promedio, la plantilla de cada instalación, incluyendo operarios, operadores, jefes, técnicos auxi
liares y aprendices, comprende unas 50 personas para el ERR, 115 para el HNPF y 60 para el PNPF.
Para cada sección y circuito importante se prepararon normas detalladas de ensayos previos. Dentro de
lo posible, todas las pruebas se realizaron antes de cargar el combustible y de iniciar la explotación de la
central incorporada a la red.
Los trámites de autorización (idénticos a los de concesión de permisos para las centrales no dependientes
de la USAEC) siguieron su curso durante casi todo el período de ensayos posteriores a la construcción.
El tiempo exigido por los ensayos mencionados en cada una de las centrales excedió apreciablemente del

92 C.A. PURSEL
calculado en un principio. La pruebas pusieron en evidencia numerosos defectos, ya comprobados o supuestos,
de construcción o de funcionamiento de ciertos elementos, que obligaron a realizar nuevos ensayos y estudios.
En algunos casos, hubo que reparar o modificar partes de la instalación para subsanar defectos de fabricación
o errores de cálculo.
He aquí los principales defectos hallados:
Reactor de Elk River. Se descubrieron grietas en parte del revestimiento superficial del recipiente del reactor;
ello obligó a efectuar una serie de investigaciones y análisis, asi como ciertas reparaciones y modificaciones del
recipiente. La insuficiente capacidad de separación de vapor obligó a sustituir y modificar algunas piezas metá
licas en el interior del recipiente del reactor.
Central nucleoeléctrica de Hallam. Debido al arrastre de helio, hubo que modificar los circuitos secundarios
de sodio. La falla de un tubo del intercambiador de calor intermedio (sodio-sodio) obligó a llevar a cabo una
serie de análisis para descubrir su causa y extraer y reparar el intercambiador.
Central nucleoeléctrica de Piqua. Durante la limpieza de las tuberías con agentes químicos, se dallaron
varias válvulas que fue preciso reparar o sustituir. Las fugas en el circuito del refrigerante orgánico y del
vapor secundario provocaron demoras repetidas.
Una vez concluidas las reparaciones e introducidas las modificaciones necesarias, se comprobó que las
características de rendimiento reales de cada uno de los tres reactores se ajustaban estrictamente a las previstas
en el proyecto.
I. INTRODUCTION
One of the most important phases in the construction and operation of a
nuclear power plant is the period between the completion of physical con
struction and the first attainment of full power. In the early years of planning
nuclear power plants, the importance of this period, together with the time,
staffing and funding required, was frequently, but not always, significantly
underestimated.
Three small nuclear power projects, the Elk River Reactor (ERR), the
Hall'am Nuclear Power Facility (HNPF), and the Piqua Nuclear Power
Facility (PNPF), all of which are receiving substantial support under the
USAEC Power Reactor Demonstration Program, are each nearing the com
pletion of this post-construction testing period. These nuclear plants are
all in the small power range and represent three different reactor concepts:
ERR-22 MW(e) net, natural-circulation boiling-water reactor with fossil-
fired superheat; HNPF-75 MW(e) net, sodium-cooled and graphite moder
ated; and P N P F -11.4 MW(e) net, organic cooled and organic moderated.
The experienee obtained from these three nuclear power projects may
permit some generalizations which could be used in improving cost or
schedule estimates for future small nuclear power plants. Since all three
of these plants are sma Ll, demonstration, "first-of-a-kind" plants, the
experience may not be particularly applicable to large, "commercial",
second-generation nuclear power projects.
II. BACKGR OU N D
The E R R and the PNPF , but not the HNPF, were authorized under
"Second Round" legislation which provides for the construction and operation
of nuclear power plants under an arrangement between the USAEC and a
co-operatively or municipally-owned, as contrasted to an investor-owned,
utility company. The utility agrees: (1) To furnish the site and the generator
plant; (2) to purchase the steam generated by the reactor plant; (3) to purchase
POST-CONSTRUCTION TESTING 93
the reactor plant after a period (usually five years) of USAEC operation;
and (4) to supply a reactor operating staff during the period of USAEC owner
ship. The USAEC agrees: (1) to design and construct the reactor plant, and
(2) to operate the reactor plant for the period of USAEC ownership, uti
lizing the utility company’s operating staff. The co-operating utility com
pany for the ERR is the Rural Co-operative Power Association (RCPA) and
for the PNPF is the City of Piqua (CP).
The HNPF was authorized under an arrangement similar to that for the
"Second Round" plants. The essential differeaces in the arrangement are
that: (1) the co-operatively owned utility company. Consumers Public Power
District (CPPD), makes a financial contribution toward the construction of
the reactor plant, and (2) assumes responsibility for operating the reactor
plant, as well as the generating plant, as soon as the reactor achieves full
power. The USAEC furnishes some financial assistance for the initial five-
year period of operation.
Information concerning design power output, ownership and major con
tractors is listed in Table I. Detailed descriptions of these projects can be
found in the Bibliography.
III. SCHEDULES
The highlight schedules in existence at the start of the project, of con
struction, of post-construction testing, and as of 1 April 1963, are shown
in Table II.
The date given for the start of the project is the effective date of the
plant construction contract. The date given for the completion of construction
is less clearly defined and was arbitrarily chosen as that at which the first
post-construction test was begun. In each case, some construction work
remained to be completed at that time. Substantial amounts of rework and
plant modification were also required. This work, which usually involved
construction workers, proceeded concurrently with the test programmes
unless the extent of the work was too great to permit continuation of the tests.
It is apparent that, without exception, the time required for plant testing,
completion of construction, and plant and equipment modifications during
the post-construction testing period was underestimated in the early project
stages. There is no easy explanation for this. Certainly a lack of experi
ence in nuclear reactor construction for civilian use was a major factor.
' One of the goals of the Power Reactor Demonstration Program is to gain
this experience.
Another contributing factor was that these plants, with the exception of
the ERR, were first-generation plants. The major delays which were
easily identifiable were the result of faulty equipment or poor equipment
performance and can be traced to one or more of the following factors: poor
design, incomplete or ambiguous specifications, inadequate component proof
testing, sub-standard fabrication,inadequate inspection, or wrong installation.
Each of the three reactor plants is made up of hundreds of structural and
equipment components. Almost all of these components have proven to be
soundly engineered, fabricated and installed. However, the experience
gained from these reactor plants demonstrates that, at least at present, it
would be prudent to anticipate some problems with equipment and to make

94 C. A. PURSEL
TABLE I
P R O J E C T D A T A *
ERR HNPF PNPF
Type Boiling water Sodium graphite Organic
Design power (MW(t)) 58.2 240 45. 5
Fossil fired superheater (MW(t)) 14.8 - -
Electrical generation (MW(e)) gross 23 82 12.5
net 22 75 11.4
Steam conditions, turbine inlet, °F 825 825 550
lb/inf 600 800 445
Owner, reactor plant USAEC USAEC & CPPD USAEC
Owner, generating plant RCPA CPPD CP
Prime contractor AC USAEC AI
Major subcontractors:
Architect engineer S&L Bechtel Holmes & Narver
Construction Maxon Kiewit Messer
Reactor system AC AI AI
Reactor core Martin AI AI
* The abbreviations and shortened titles used in Table I refer to the following:
USAEC United States Atomic Energy Commission, Germantown, Maryland
CPPD Consumers Public Power District, Columbus, Nebraska
RCPA Rural Cooperative Power Association, Elk River. Minnesota
CP City of Piqua, Piqua, Ohio
A-С Allis-Chalmers Manufacturing C o ., Washington. D. C.
AI Atomics International, a Division of North American Aviation, Inc. Canoga Park,
California
Bechtel Bechtel Corporation, San Francisco, California
Kiewit Peter Kiewit Sons, Inc., Omaha, Nebraska
Messer Frank Messer & Sons, Inc., Cincinnati, Ohio
S&L Sargent & Lundy, Chicago. Illinois
Maxon Maxon Construction Company, Dayton, Ohio
Martin The Martin Company, Baltimore, Maryland
Holmes & Narver Holmes & Narver, Inc., Los Angeles, California
ERR Elk River Reactor
HNPF Hallam Nuclear Power Facility
PNPF Piqua Nuclear Power Facility
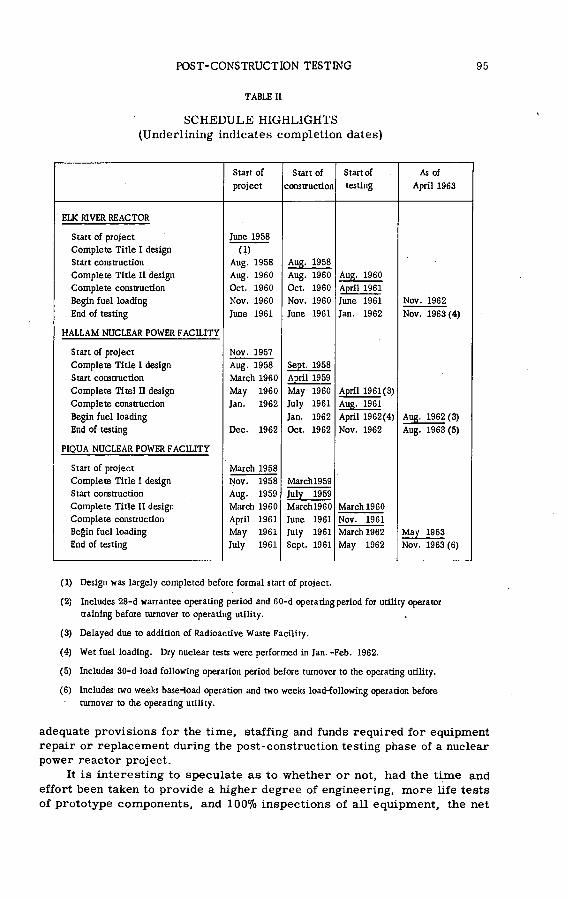
POST-CONSTRUCTION TESTING 95
TABLE II
SCHEDULE HIGHLIGHTS
(Underlining indicates completion dates)
Start of
project
Start of
construction
Start of
testing
As of
April 1963
ELK RIVER REACTOR
Start of project June 1958
Complete Title I design (1)
Start construction Aug. 1958 Aug. 1958
Complete Title II design Aug. 1960 Aug. 1960 Aug. 1960
Complete construction Oct. 1960 Oct. 1960 April 1961
Begin fuel loading Nov. 1960 Nov. 1960 June 1961 Nov. 1962
End of testing June 1961 June 1961 Jan. 1962 Nov. 1963(4)
HALLAM NUCLEAR POWER FACILITY
Start of project Nov. 1957
Complete Title I design Aug. 1958 Sept. 1958
Start construction March 1960 April 1959
Complete Titel II design May 1960 May 1960 April 1961(3)
Complete construction Jan. 1962 July 1961 Aug. 1961
Begin fuel loading Jan. 1962 April 1962(4) Aug. 1962(3)
End of testing Dec. 1962 Oct. 1962 Nov. 1962 Aug. 1963(5)
PIQUA NUCLEAR POWER FACILITY
Start of project March 1958
Complete Title I design Nov. 1958 Marchl959
Start construction Aug. 1959 July 1959
Complete Title II design March 1960 March 1960 March 1960
Complete construction April 1961 June 1961 Nov. 1961
Begin fuel loading May 1961 July 1961 March 1962 May 1963
End of testing July 1961 Sept. 1961 May 1962 Nov. 1963(6)
(1) Design was largely completed before formal start of project.
(2) Includes 28-d warrantee operating period and 60-d operating period for utility operator
training before turnover to operating utility.
(3) Delayed due to addition of Radioactive Waste Facility.
(4) Wet fuel loading. Dry nuclear tests were performed in Jan. -Feb. 1962.
(5) Includes 30-d load following operation period before turnover to the operating utility.
(6) Includes two weeks base-load operation and two weeks load-following operation before
turnover to the operating utility.
adequate provisions for the time, staffing and funds required for equipment
repair or replacement during the post-construction testing phase of a nuclear
power reactor project.
It is interesting to speculate as to whether or not, had the time and
effort been taken to provide a higher degree of engineering, more life tests
of prototype components, and 100% inspections of aH equipment, the net
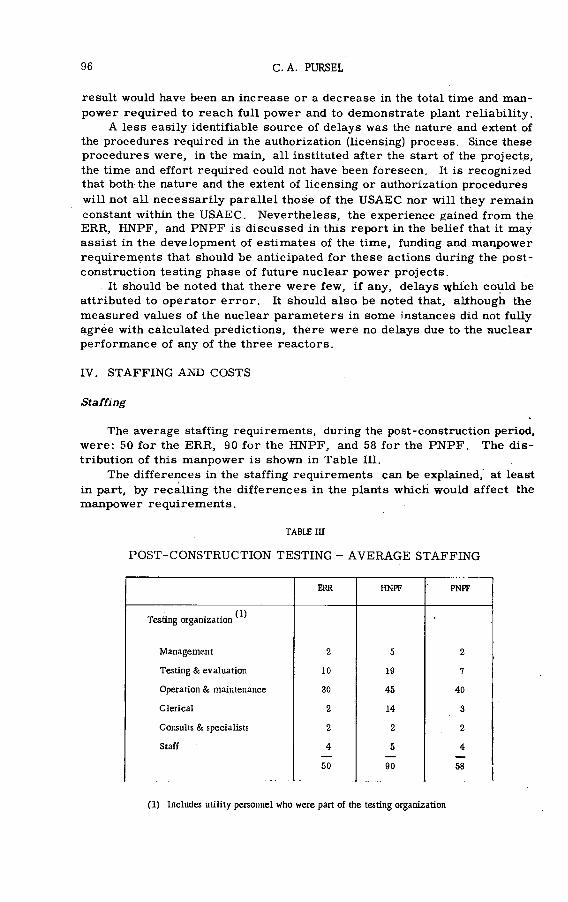
96 C.A. PURSEL
result would have been an increase or a decrease in the total time and man
power required to reach full power and to demonstrate plant reliability.
A less easily identifiable source of delays was the nature and extent of
the procedures required in the authorization (licensing) process. Since these
procedures were, in the main, all instituted after the start of the projects,
the time and effort required could not have been foreseen. It is recognized
that both the nature and the extent of licensing or authorization procedures
will not all necessarily parallel those of the USAEC nor will they remain
constant within the USAEC. Nevertheless, the experience gained from the ERR, HNPF, and PNPF is discussed in this report in the belief that it may
assist in the development of estimates of the time, funding and manpower
requirements that should be anticipated for these actions during the post
construction testing phase of future nuclear power projects.
It should be noted that there were few, if any, delays which could be
attributed to operator error. It should also be noted that, although the
measured values of the nuclear parameters in some instances did not fully
agrée with calculated predictions, there were no delays due to the nuclear
performance of any of the three reactors.
IV. STAFFING AND COSTS
Staffing
The average staffing requirements, during the post-construction period,
were: 50 for the ERR, 90 for the HNPF, and 58 for the PN PF . The dis
tribution of this manpower is shown in Table III.
The differences in the staffing requirements can be explained, at least
in part, by recalling the differences in the plants which would affect the
manpower requirements.
TABLE Ш
POST-CONSTRUCTION TESTING - AVERAGE STAFFING
ERR HNPF PNPF
Testing organization ^
Management 2 5 2
Testing & evaluation 10 19 7
Operation & maintenance 30 45 40
Clerical 2 14 3
Consults & specialists 2 2 2
Staff 4 5 4— — —
50 90 58
(1) Includes utility personnel who were part of the testing organization
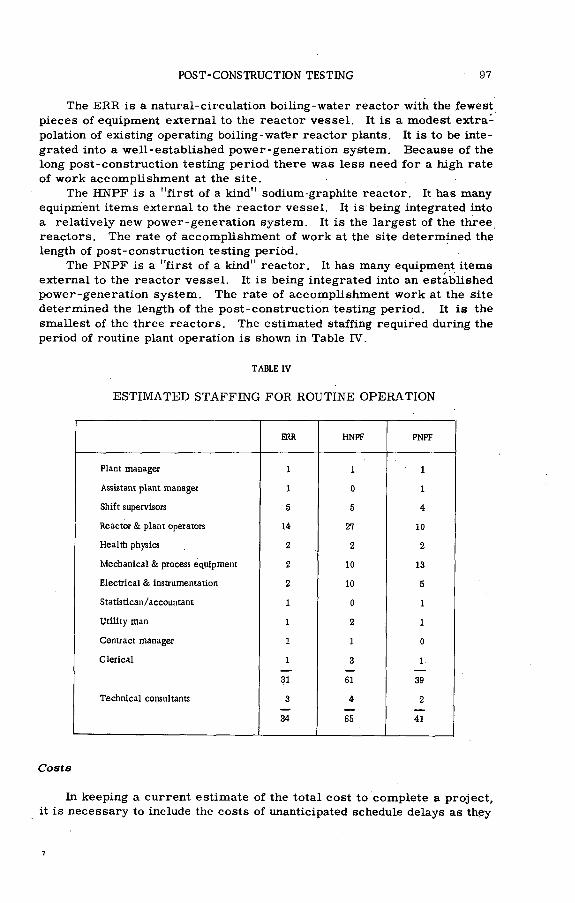
POST-CONSTRUCTION TESTING 97
The ERR is a natural-circulation boiling-water reactor with the fewest
pieces of equipment external to the reactor vessel. It is a modest extra
polation of existing operating boiling-watfer reactor plants. It is to be inte
grated into a well-established power-generation system. Because of the
long post-construction testing period there was less need for a high rate
of work accomplishment at the site.
The HNPF is a "first of a kind" sodium-graphite reactor. It has many
equipment items external to the reactor vessel. It is being integrated into
a relatively new power-generation system. It is the largest of the three
reactors. The rate of accomplishment of work at the site determined the
length of post-construction testing period.
The PNPF is a "first of a kind" reactor. It has many equipment items
external to the reactor vessel. It is being integrated into an established
power-generation system. The rate of accomplishment work at the site
determined the length of the post-construction testing period. It is the
smallest of the three reactors. The estimated staffing required during the
period of routine plant operation is shown in Table IV.
TABLE IV
ESTIM ATED STAFFING FOR ROUTINE OPERATION
ERR HNPF PNPF
Plant manager 1 1 1
Assistant plant manager 1 0 1
Shift supervisors 5 5 4
Reactor & plant operators 14 27 10
Health physics 2 2 2
Mechanical & process equipment 2 10 13
Electrical & instrumentation 2 10 5
Statistican/accountant 1 0 1
Utility man 1 2 1
Contract manager 1 1 0
Clerical 1 3 1
31 61 39
Technical consultants 3 4 2
34 65 41
Costs
In keeping a current estimate of the total cost to complete a project,
it is necessary to include the costs of unanticipated schedule delays as they
98 C. A. PURSEL
occur. This cost estimate is made up of two components: (1) The cost of any
necessary new or replacement equipment, plant modificatipn, or off-site
work, and (2) salaries, overhead costs, and the maintenance of essential
operating equipment. The first component is directly associated with the
cause of the delay. Experience gained on these three reactor projects has
shown that the costs of the second component are very nearly proportional to
the staffing requirements.
V . A U T H O R I Z A T I O N P R O C E D U R E S
The USAEC has established the principle that, for USAEC-owned and
operated nuclear power reactors, a set of authorization procedures must be
followed which are parallel to the licensing procedures required for investor-
owned plants.
Organizationally, the USAEC has two large sub-divisions — one re
presented by the General Manager and one represented by the Director of
Regulation. In effect, the "parallel procedures" concept requires that, in
sofar as licensing procedures are concerned, the major sub-division of the
USAEC, represented by the General Manager, must fill a role parallel to
that of the owner of an investor-owned nuclear power plant. In practice, the
General Manager, in turn, delegates this role of applicant to the prime con
tractor. The prime contractor applies directly to the Director of Regulation
for a construction or an operating authorization.
The prime contractor must, therefore, receive two authorizations to
proceed: one (parallel to a licence) from the Director of Regulation, and one
from the Contract Administrator, who represents the General Manager as
the contractor’s official point of contact with the USAEC. For each project,
there are two required authorizations — a construction authorization and an
operating authorization. However, in many instances it has been found de
sirable to issue operating authorizations in a series of steps, each at a higher
power level. Therefore, most of the authorization procedures occur in
connection with the operating authorization during the post-construction
testing period.
Typical procedures in acquiring an authorization at each step are as
follows: (1) The contractor prepares a Reactor Safeguards Report which
describes the plant and analyses the course of events which would follow
several credible postulated incidents involving combinations of.equipment
malfunctions and operator errors. One of these incidents is normally
selected as the "maximum credible" accident. (2) The Safeguards Report
is submitted to both the Contract Administrator and the Division óf Licensing
and Regulation. (3) The report is studied by USAEC personnel and, after
some correspondence with the contractor to clarify portions of the report,
meetings are held with the contractor and as a result certain revisions are
made to the Safeguards Report. (4) The Safeguards Report and the application
for an authorization are then referred to the Advisory Committee on Reactor
Safeguards (ACRS) for review. This is followed by one or more meetings
between the ACRS and the contractor. (5) A formal Public Hearing is held
concerning the pending application. Although the character of the Public
Hearings has changed in recent months, the Public Hearings held for the
POST-CONSTRUCTION TESTING 99
three reactors under discussion were quasi-legal in nature and were con
ducted by a Hearing Examiner.
As new information is developed, supplements to the Safeguards Reports
may be prepared. Not all of the above steps may be required for amend
ments to the authorization. At the present time, a Public Hearing may be
held for any portion of the authorization processes but is only obligatory for
the application for the initial construction authorization. At present, the
minimum possible elapsed time from the first submittal of a formal request
for an authorization to the receipt of an authorization is approximately:
60 days - Division of Licensing & Regulation (DL&R) action only
90 days - D L&R and Advisory Committee for Reactor Safeguards (ACRS)
action only
120 days - DL&R , ACRS and Public Hearing
An indication of the time, funds and the technical, legal and adminis
trative manpower required for the authorization processes can be assessed
from Table V.
VI. POST-CONSTRUCTION TESTING PROCEDURES
The primary purpose of the post-construction tests was to demonstrate
the functional adequacy of the individual items of equipment and sub-systems
before integration of the plant into the utility company’s power distribution
network. A related purpose was to permit the reactor plant operators to
become thoroughly familiar with the plant through actual operation of the
equipment.
The post-construction tests were rather arbitrarily divided into two
categories:
(a) Pre-ope rational tests
All systems and components were tested before nuclear operation of
the plant under conditions which duplicated actual operating conditions as
closely as possible. Testing of the reactor coolant loops with hot coolant
was one of the most important tests for the HNPF and PNPF. Recirculation
of the ERR primary coolant takes place within the reactor vessel.
(b) Operational tests
These tests began with reactor-fuel loading and were designed to evaluate plant performance characteristics during the approàch to full power oper
ation. Important tests in this series included the determination of nuclear
parameters.
Each test was conducted in accordance with an approved written pro
cedure which included the following information and instructions:
(a) Purpose or objective of test;
(b) Description of system to be tested;
(c) Summary of test method;
(d) Prerequisites to test performance;
(e) Precautions;

С. A. PURSEL
TABLE V
AU TH ORIZATION "P A R A L L E L " PROCEDURES
ERR HNPF PNPF
Construction authorization
Date of safeguards report March 1959 Jan. 1958
Feb. 1959
Oct. 1958
Date of public hearings None April 1960 Oct. 1959
Date of authorization Dec. 1959 July 1960 Feb. 1960
(1)Supplementary actions
Safeguards reports supplements 0 5 5
Unofficial meetings
Contractor & USAEC 4 2 2
ACRS meetings 3 3 7
Operating authorization
Date of safeguards report June 1960 April 1961 Feb. 196.1
Date of public hearings March 1961
Aug. 1962
Sept. 1962
Dry Critical:
Nov. 1961
Wet Critical &
Operation to 154b
of Full Power:
May 1962
Continuation of
1570 Power Hearing:
July 1962
Feb.
June
1961
1962
Date of authorization
Supplementary actions ^
Nov. 1962 Dry Critical:
Jan. 1962
15% of Full Power
Authorization:
Aug. 1962
Aug. 1962
Safeguards reports supplements 0 5 1
Unofficial meetings
Contractor & USAEC 13 10 3
ACRS meetings 8 4 (2> 4
(1) Does not include routine correspondence.
(2) ACRS Meetings on full power operation were held April 1963. As a result of a change
in the regulatory procedures, it is not expected that a Public Hearing will be required
for full power authorization.

POST-CONSTRUCTION TESTING 101
(f) Initial plaint conditions required;
(g) Procedure for test performance;
(h) Data sheets and illustrations, if required.
Each procedure, when used in conjunction with the plant-operating manual,
was self-sufficient.
The test procedures were written by the prime contractor and reviewed
by USAEC personnel. Performance of each individual test required the
approval of the contractors’ field organization manager and a USAEC Site
Representative. Their approvals were given only if all initial plant con
ditions and prerequisites to the test performance had been met, and the
necessary personnel were available and understood the test procedures and
precautions. Any necessary minor revisions to the test procedures required
the approval of the Site Representative. Substantial revisions required
review by the USAEC staff. The Site Representative witnessed all tests, as
necessary, to assure that they were performed safely and in accordance with
the written procedures.
After the performance of each test, a test report and evaluation was
prepared by the contractor and submitted to the USAEC staff The test
reports summarized the test and the results, including modifications and
repairs required for satisfactory performance, and an evaluation of both
the system operability and the significance of test results relative to further
testing. The completed master test procedure and data sheets were retained
at the site for reference.
The form and the manner of preparation of the test procedures and the
test reports varied somewhat among the various projects. Most of the
HNPF and PNPF test procedures were written well in advance of plant .com
pletion, and in many cases extensive revisions were required to conform to
"as-built" conditions or to improve test performance. In form, the pro
cedures were set up to test components collectively in "systems" tests. The
ERR test programme was based primarily on tests of individual components.
The written procedures were much less detailed than those of H N PF and
PNPF , and consisted of functional instructions for test performance and
data sheets which were included as a part of the written procedures. Topi
cal reports which analysed and correlated the test results of major sub
divisions of the test programme were subsequently prepared.
A listing of the titles of the test procedures for each of the three reactors
is shown in Tables VI, VII, VIII and IX.
VII. EQUIPM ENT FAILURE AND MALFUNCTIONS
Each of the reactor plants has hundreds of items of equipment. Almost
all of these have demonstrated satisfactory performance. Only relatively
few have failed to function properly, but these have caused both delays in
plant completion and increases in project costs. The more significant
failures and malfunctions are discussed below.
E lk River Reactor
The Elk River Reactor project was relatively free from the relatively
minor problems of improper installations, wiring, and pipe fitting. Almost
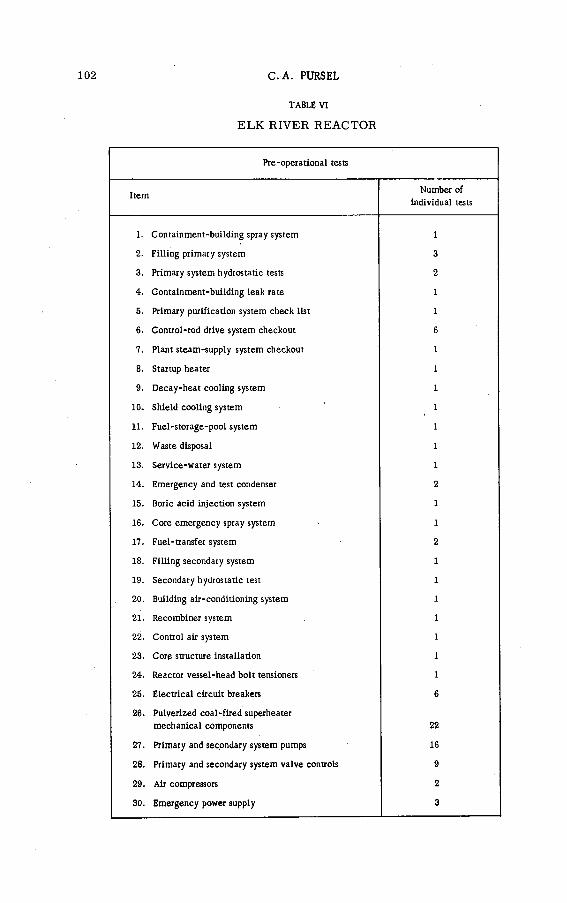
102 C. A. PURSEL
TABLE VI
E L K RIVER REACTOR
Pre-operational tests
ItemNumber of
individual tests
1. Containment-building spray system 1
2. Filling primary system
3. Primary system hydrostatic tests
4. Containment-building leak rate 1
5. Primary purification system check list 1
6. Control-rod drive system checkout
7. Plant steam-supply system checkout 1
8. Startup heater 1
9. Decay-heat cooling system 1
10. Shield cooling system 1
11. Fuel-storage-pool system 1
12. Waste disposal 1
13. Service-water system 1
14. Emergency and test condenser
15. Boric acid injection system 1
16. Core emergency spray system 1
17. Fuel-transfer system
18. Filling secondary system 1
19. Secondary hydrostatic test 1
20. Building air-conditioning system 1
21. Recombiner system 1
22. Control air system 1
23. Core structure installation 1
24. Reactor vessel-head bolt tensioners 1
25. Electrical circuit breakers 6
26. Pulverized coal-fired superheater
mechanical components 22
27. Primary and secondary system pumps 16
28. Primary and secondary system valve controls 9
29. Air compressors 2
30. Emergency power supply 3

PO ST-CONSTRUCTIO N TESTING
TABLE VI (continued)
103
ItemNumber of
individual tests
31. Primary and secondary system pressure, level,
flow, temperature, and other recorders 16
32. Primary and secondary system pressure, level,
temperature, and flow indicators or gauges 21
33. Level control systems 3
34. Nuclear instrumentation 9
35. Reactor scram circuits 1
36. Reactor start and withdraw permit 1
37. Control-rod insert and withdraw circuits
38. Radiation monitors 16
39. Level alarms 1
40. Pressure alarms 1
41. Temperature alarms 1
42. Breaker and auxiliary relay contacts 1
43. Recorder and indicator contacts 1
44. Valve limit switches 1
45. Annunciators 1
46. Miscellaneous devices 1
TOTAL PRE-OPERATIONAL TESTS 168
Retests required
ItemNumber of
individual tests
Process and mechanical
(a) Filling of primary system 3
(b) Control-rod-drive system (cold and hot) 4
(c) Reactor-vessel heat installation and removal 2
(d) Primary system hydrostatic test 1
(e) Purification system 1
(f) Startup heater (165°F to 425°F) 1
(g) Emergency and decay-heat cooling (425eF to 160eF) 2
(h) Emergency test condenser flow 1
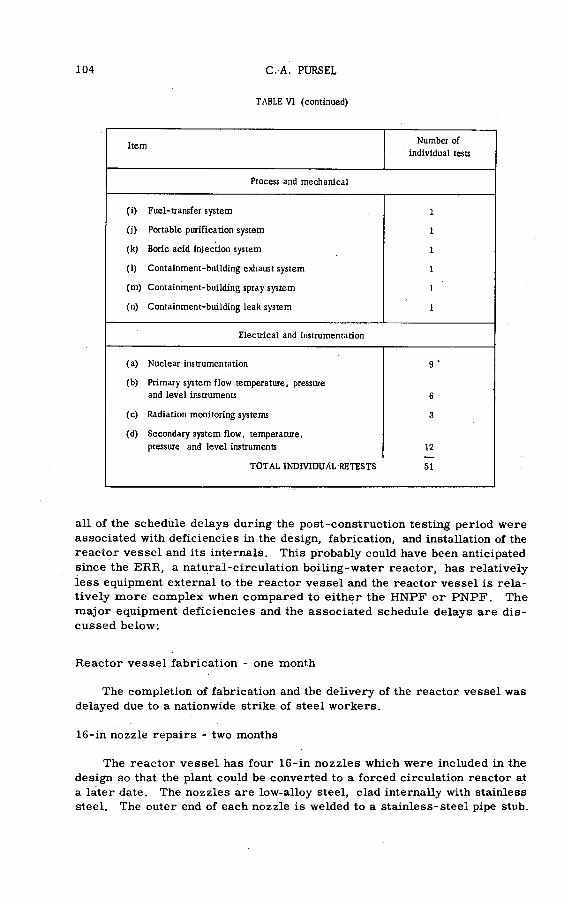
104
TABLE VI (continued)
C. A. PURSEL
ItemNumber of
individual tests
Process and mechanical
(i) Fuel-transfer system 1
(j) Portable purification system 1
(k) Boric acid injection system 1
(1) Containment-building exhaust system 1
(m) Containment-building spray system 1
(n) Containment-building leak system 1
Electrical and instrumentation
(a) Nuclear instrumentation 9 •
(b) Primary system flow temperature, pressure
and level instruments 6
(c) Radiation monitoring systems 3
(d) Secondary system flow, temperature,
pressure and level instruments 12
TOTAL INDIVIDUAL RETESTS 51
all of the schedule delays during the post-construction testing period were
associated with deficiencies in the design, fabrication, and installation of the
reactor vessel and its internals. This probably could have been anticipated
since the ERR, a natural-circulation boiling-water reactor, has relatively
less equipment external to the reactor vessel and the reactor vessel is rela
tively more complex when compared to either the H N P F or P N P F . The
major equipment deficiencies and the associated schedule delays are dis
cussed below:
Reactor vessel fabrication - one month
The completion of fabrication and the delivery of the reactor vessel was
delayed due to a nationwide strike of steel workers.
16-in nozzle repairs - two months
The reactor vessel has four 16-in nozzles which were included in the
design so that the plant could be converted to a forced circulation reactor at
a later date. The nozzles are low-alloy steel, clad internally with stainless
steel. The outer end of each nozzle is welded to a stainless-steel pipe stub.
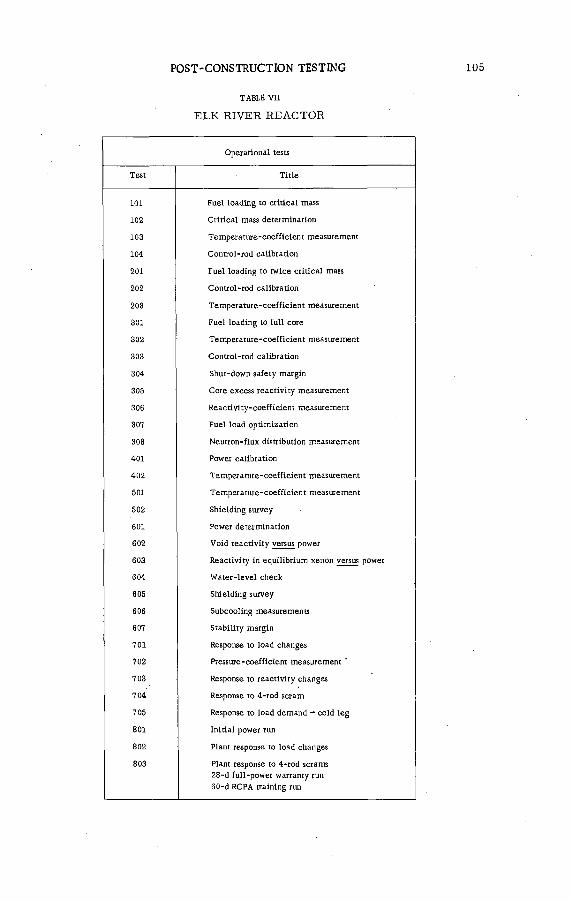
POST-CONSTRUCTION TESTING 105
TABLE Vil
ELK RIVER REACTOR
Operational tests
Test Title
101 Fuel loading to critical mass
102 Critical mass determination
103 Temperature-coefficient measurement
104 Control-rod calibration
201 Fuel loading to twice critical mass
202 Control-rod calibration
203 Temperature-coefficient measurement
301 Fuel loading to full core
302 Temperature-coefficient measurement
303 Control-rod calibration
304 Shut-down safety margin
305 Core excess reactivity measurement
306 Reactivity-coefficient measurement
307 Fuel load optimization
308 Neutron-flux distribution measurement
401 Power calibration
402 Temperature-coefficient measurement
501 Temperature-coefficient measurement
502 Shielding survey
601 Power determination
602 Void reactivity versus power
603 Reactivity in equilibrium xenon versus power
604 Water-level check
605 Shielding survey
606 Subcooling measurements
607 Stability margin
701 Response to load changes
702 Pressure-coefficient measurement ‘
703 Response to reactivity changes
704 Response to 4-rod scram
705 Response to load demand ** cold leg
801 Initial power run
802 Plant response to load changes
803 Plant response to 4-rod scrams
28-d full-power warranty run
60-d RCPA training run
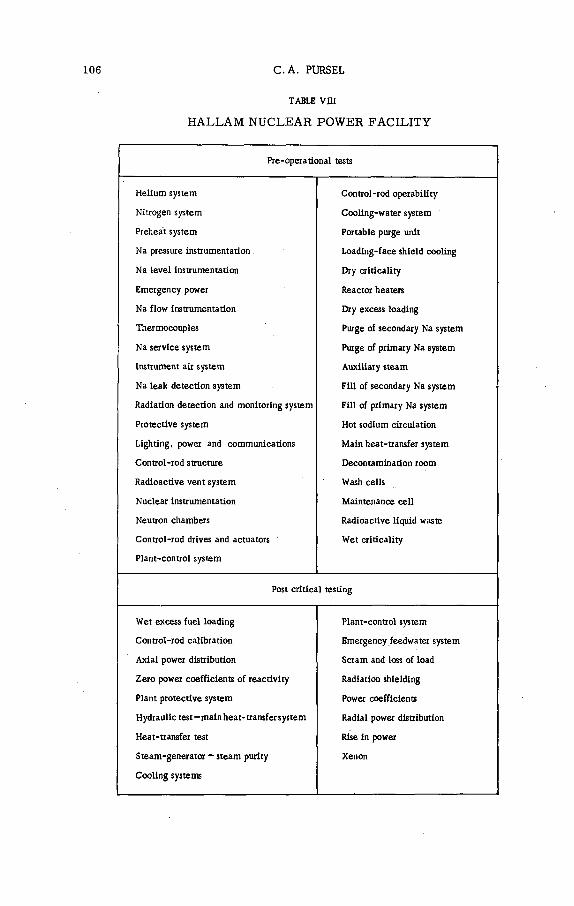
106 C. A. PURSEL
TABLE VIII
H A L L A M N U CLEAR P O W ER FACILITY
Pre-operational tests
Helium system Control-rod operability
Nitrogen system Cooling-water system
Preheat system Portable purge unit
Na pressure instrumentation. Loading-face shield cooling
Na level instrumentation Dry criticality
Emergency power Reactor heaters
Na flow instrumentation Dry excess loading
Thermocouples Purge of secondary Na system
Na service system Purge of primary Na system
Instrument air system Auxiliary steam
Na leak detection system Fill of secondary Na system
Radiation detection and monitoring system Fill of primary Na system
Protective system Hot sodium circulation
Lighting, power and communications Main heat-transfer system
Control-rod structure Decontamination room
Radioactive vent system Wash cells
Nuclear instrumentation Maintenance cell
Neutron chambers Radioactive liquid waste
Control-rod drives and actuators Wet criticality
Plant-control system
Post critical testing
Wet excess fuel loading Plant-control system
Control-rod calibration Emergency feedwa ter system
Axial power distribution Scram and loss of load
Zero power coefficients of reactivity Radiation shielding
Plant protective system Power coefficients
Hydraulic test -main heat-transfer system Radial power distribution
Heat-transfer test Rise in power
Steam-generator - steam purity Xenon
Cooling systems

POST-CONSTRUCTION TESTING 107
TABLE К
PIQUA N U C LEA R P O W E R FACILITY
Pre-operational tests
Test Title
1-1 New coolant storage
1-2 Coolant purification and waste gas systems
1-3 Main heat transfer, degasification and pressurization
and decay-heat removal systems
1-4 Organic waste-disposal system
1-5 Industrial aqueous waste disposal
1-6 Fuel-handling system
1-7 Nuclear instrumentation
1-8 Radiation detection and monitoring and failed-element
location system
1-9 Plant protective system
1-10 Auxiliary service system
Initial nuclear tests
П-1 Critical loading
II—2 Loading for excess reactivity
II-3 Measurement of isothermal temperature coefficient of
reactivity
II-4 Control-rod worth measurements
Post-critical-operational tests
III-l Approach to full power
III-2 Power-coefficient measurement
HI-3 Xenon effects
III-4 Sustained full-power operation
П1-5 Load-following power operation
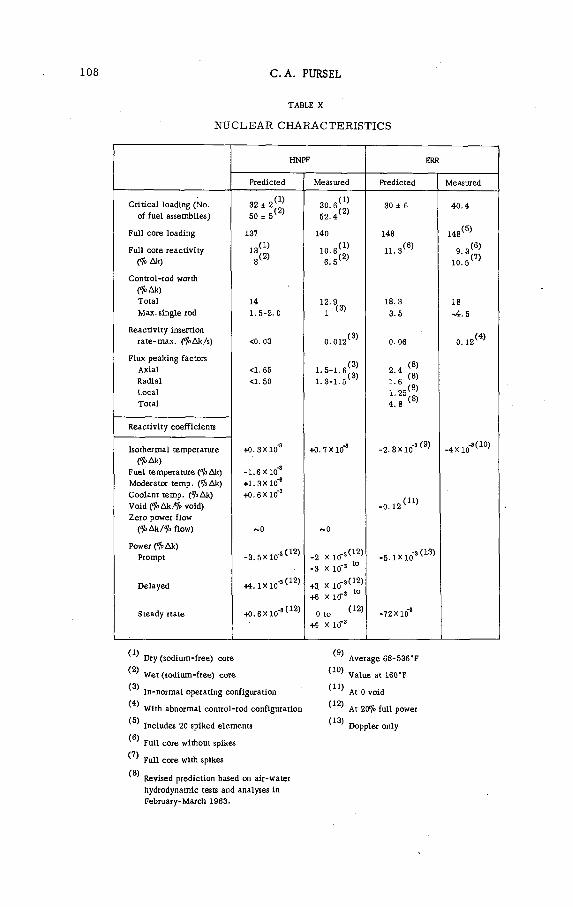
108 C.A. PURSEL
TABLE X
NUCLEAR CHARACTERISTICS
HNPF ERR
Predicted Measured Predicted Measured
Critical loading (No.
of fuel assemblies)3 2 ± 2 ((s!50 ± 5 '
- s52 .4 '
30 ± 6 4 0 .4
Full core loading
Full core reactivity
(7o Дк)
137
13(1)
8 (2)
140 148
11.3<6>
148(S)
9 3 (6) (7)
10 .5
Control-rod worth
OftAk)
Total
Max.single rod
14
1.5-2. 012г Ь )
18.3
3 .5
18
~4. 5
Reactivity insertion
rate-max. CftAk/s) <0.03(3)
0.012 0. 06 0 . 12(4)
Flux peaking factors
Axial
Radial
Local
Total
<1.65
<1.50i-5-i-6S1.3-1.5
2 .4 (8)
1 .6
1 25(8)
4 .8 K '
Reactivity coefficients
Isothermal temperature
ОУоДк)
Fuel temperature (^o Дк)
Moderator temp. (^oAk)
Coolant temp. (%Д к)
Void OftAk/ft void)
Zero power flow
(% Д к /% flow)
■Ю.ЗХ10"3
-1.6X10"8
+ 1 .3X 10 '3
+ 0 .6X 10 '3
~0
+ 0 .7 X 1 0 -3
~o
-2. 8X io '3 ^9)
- 0 .12 (11)
o'
i—lX4*1
Power 07o Дк)
Prompt
Delayed
Steady state
- 3.5X10’3 ^12*
44 .1Х 10 "з(12)
ч0.6Х10"®(12)
-2 Xlo-s(12) to
-3 x 10
+3 X 1 0 3(12) e to
+6 x 1(T
(12)0 to v '
+4 X 1СГ3
-5. I X 10 3(131
-72X 1 0 3
( 1)
( 2)
(3)
(4)
(5)
( 6)
(7)
(8)
Dry (sodium-free) core
Wet (sodium-free) core
ln-normal operating configuration
With abnormal control-rod configuration
Includes 20 spiked elements
Full core without spikes
Full core with spikes
Revised prediction based on air-water
hydrodynamic tests and analyses in
February-March 1963.
(9)
(10)
(11)
(12)
(13)
Average 68-536*F
Value at 160°F
At 0 void
At 20% full power
Doppler only
POST-CONSTRUCTION TESTING 109
A crack was discovered in the external surface of one of these nozzles
at a point near the dissimilar (carbon steel to stainless steel) weld. The
crack was of the weld shrinkage type. All four nozzle weld joints were re
paired by fabricating and welding in new stainless-steel clad, carbon-steel
tránsition sections.
Grout removal - two months
A space is provided below the reactor vessel to provide for thermal
expansion of the reactor vessel and attached control-rod nozzles. The vessel
is supported at the vessel flange. Cement grout was used to fill the cracks
between concrete shielding blocks in the reactor biological shielding piping
tunnels. Some of the grout unexpectedly ran down into the expansion space.
It was removed by chipping and high-pressure water jets.
Fuel-rod spacer straps - two months
The rods in each fuel assembly are positioned by spacer straps.
Originally, spacer straps were held in position by two side plates welded to
the spacer straps. In making the welds, some of the fuel-cladding tubes
were penetrated accidentally. The penetrated tubes were replaced and a
modified design was adopted which eliminated the side straps and, therefore,
the welding operations. The tubing of selected fuel rods was dimpled above
and below the spacer straps to prevent them from slipping either up or down
from their original position.
Reactor-vessel cladding cracks and resulting test programme - 12 months
The ERR vessel is constructed of low-alloy — ASTM A302B — steel, clad
with stainless steel for corrosion resistance. In April 1961, following the
initial non-nuclear heating and hydrostatic pressure tests of the primary
system, cracks were discovered in the stainless-steel cladding.
The cracks were confined to areas which were clad by the weld overlay
process. None were found in the areas clad by roll bondings. The defective
clad areas in the vessel and vessel head were repaired by removing the
cladding and replacing it. Instead of 308 SS weld material, 309 SS was used
for the first pass, and welding techniques were improved.
This discovery of cladding cracks led to an extensive analytical and
experimental programme to define the adequacy of the vessel for its intended
service. The principal consideration throughout the test programme was
the possibility that cladding cracks existed which had not been removed and
repaired, that these could spread as a result of pressure and temperature
cycling of the reactor vessel and that, in time, result in a leak or rupture
of the reactor vessel. The analytical programme included a detailed stress
analysis of critical areas under both steady state and transient conditions, a
complete review of all of the original vessel radiographs, and a complete
review of all vessel fabrication and inspection records.
The experimental programme included: (1) ultrasonic inspection of the
vessel and vessel-head nozzle strength welds, (2) vessel-head nozzle re

110 C. A. PURSEL
radiography, (3) chemical analysis of approximately 160 cladding samples
taken from defective cladding areas of both vessel and head, (4) a deter
mination of the material properties of the head and vessel flange steel by
cutting plugs from the reactor vessel flange, and (5) a determination of the
material properties of the reactor vessel base material by use of material
which had been prepared in the same manner as the base reactor vessel
material.
Reactor vessel modifications - two months
As a result of the analyses and experiments, the interior nozzle corners
of eight reactor vessel nozzle-to-vessel interior joints were rounded (radi-
used) and then reclad, thermal sleeves were inserted in the two feedwater
nozzles, and provisions were made for an annual inspection of the eight
surfaces adjacent to the rounded interior nozzle-to-^vessel joints.
This work was completed in April 1962, and it was decided that the
vessel was adequate for its intended service. As a result of regulatory
review, the vessel service life was limited to five full-power years or
250 full pressure cycles, whichever occurs first. In April 1963, an experi
mental programme was initiated at Southwest Research Institute to define the
useful life of the Elk River vessel, in terms of full pressure cycles, by tests
to destruction of geometries and materials similar to those used in the ERR
vessel.
Pre-operational retests - two months
As a result of the delay of more than one year in startup, several of the
system-oriented post-construction tests were repeated (Table VI) in order
to prepare the plant systems components, and instruments for the Nuclear
Startup Program (Table VII).
Steam separation analysis and resulting mpdifications - four months
In January 1963, as a result of the data obtained from EBWR high power
operation, the hydraulic performance of the ERR was re-evaluated. These
data are reported in "Performance characteristies of the Experimental
Boiling Water Reactor, (0 to 100 MWt)", Reactor Engineéring Division,
Argonne National Laboratory, April 1963 . It was concluded that steam carry- under into the downcomer, reactivity in voids, operating water level, and
water carry-over to the evaporators all might be significantly higher than
originally predicted. These adverse conclusions were then confirmed by
detailed analyses and concurrent air-water tests.
A core riser (chimney) with a new configuration, a steam collection
baffle, and in-core temperature and pressure instrumentation to measure
the magnitude of core inlet subcooling were made and installed. Core and
steam separation performance is now expected to closely approach design
predictions.
POST-CONSTRUCTION TESTING 111
Reactor startup heating system
The reactor startup heating system used an external heat exchanger
(steam heated) and a piping loop connected to the reactor vessel to heat the
primary water by natural circulation. Pre-operational checkout of this
system indicated that, because the lower piping loop connection to the reactor
vessel was above the bottom of the vessel, as the bulk temperature of the water in the vessel increased, cool water tended to stagnate in the lower
reactor vessel head. This situation remained until the bulk stagnant water
temperature difference was approximately 125°F. At this point, the cool
water in the bottom of the reactor vessel rose quickly to the top of the vessel
rapidly cooling the upper reactor vessel and vessel-head surfaces.
This condition was corrected by connecting the recirculation loop piping
to a line which enters the bottom head of the reactor vessel. Piping and
valving changes were also made which now permit the use of the decay-heat
cooling system pump during startup heating operations.
Control rods
As a result of Dresden reactor experience with the use of 17-4 pH steel
for certain control-rod drive parts, the ERR control-rod drives were removed
in 1961 to age harden the 17-4 pH parts at 1100°F instead of at 875 to 900°F.
This increased the ductility but decreased the hardness of the material.
Wear resistance tests using a spare ER R control-rod drive demonstrated
that the slight decrease in wear resistance was acceptable.
As a result of EBW R control-rod operating experience, the type 304 SS
rivets used to join the boron stainless-steel poison sections to the Zircaloy-2
follower sections were replaced with Inconel rivets to minimize the possi
bility of stress-corrosion cracking. Scram tests were performed to verify
the mechanical strength of this design change.
Containment vessel
Following Commission Safety and Regulatory Group review of plant
design features in May 1962, it was recommended that, in order to avoid the
possibility of brittle fracture when the containment vessel is pressurized in
cold weather, all pressure containing parts of the reactor containment vessel
should be maintained at a temperature 30°F above the nil ductility transition
temperature of the containment vessel materials.
The nil ductility transition temperature of the containment vessel material
is -20°F. Since the containment building is insulated on the outside and heated
on the inside, the only modifications required were to penetrations such as
the fresh-air inlet duct. Modification consisted of installing electrical cable
heaters and additional insulation. During the past winter, all portions of the
containment vessel were maintained above 10°F with an outside air tempera
ture as low as -35°F.
Hallam Nuclear Pow er Facility
In addition to numerous minor failures; such as poor electrical con
nections, incorrectly wired instrumentation, and wrong pipe connections,
112 C. A. PURSEL
none .of which were serious individually but in the aggregate were the cause
of significant delays in attempting to perform the post-construction tests
on schedule; there were several malfunctions of major equipment items.
These are discussed below.
Intermediate heat-exchanger tube failure
The H N P F has three separate cooling loops, each containing two
intermediate heat exchangers separating the radioactive sodium in the
primary loops from the non-radioactive sodium in the secondary loops. In
November 1962, during zero power testing, a leak developed in one of the
intermediate heat exchangers. This was detected by an increase in sodium
level in the reactor and a decrease in the sodium level in the expansion tank
in the secondary loop.
The leaking unit was removed and cleaned by washing with anhydrous
ammonia. The leak was located by use of an ultrasonic leak detector. The
failure had occurred in one tube in the periphery of the tube bundle and was
located at the first baffle above the tube sheet near the shell side inlet.
It has been determined that the failure was caused by metal fatigue.
Both analyses and vibration tests of the remaining units showed that a
vibration, near the calculated natural frequency of the heat exchanger tubes,
could occur at flow velocities equal to those present in a localized region
near the shell side inlet. Metal strip spacers have been installed at right
angles to the tubes betwèen the tube sheet and first baffle on the shell side
inlet. Tests of the heat exchangers in actual service have demonstrated
that these strip spacers eliminate the tube vibration.
Secondary system helium entrainment
The secondary loops contain expansion tanks. The cover gas is helium.
Originally, the full flow of the sodium in the loop passed through the expansion
tanks. During pre-operational testing of the main heat-transfer systems,
it was discovered that at high flow rates helium was being entrained causing
audible gurgling noises throughout the system and inducing pipe motion in
long flexible piping runs. The entrainment was eliminated by installing a
line which bypassed approximately 96% of the total mass flow around the
expansion tank.»
Reactor cavity moisture
The reactor vessel and core are contained in a welded and sealed reactor
cavity. During initial heating of the sodium in the primary system, it was
observed that some of the pipe hangers, which support the piping in the re
actor cavity, did not move as predicted. An inspection of the reactor cavity
revealed that the condensation of the moisture, which was being driven from
the reactor thermal insulation, had caused an accumulation of corrosion
products on the pipe hangers and that the pipe hangers had been installed
without the specified corrosion protection.
The pipe hangers were cleaned and coated with a radiation resistant
grease. Temporary ventilation was provided until most of the moisture
was driven from the insulation.
POST-CONSTRUCTION TESTING ИЗ
Sodium system valves
Throttle valves are used to control convection flow to prevent thermal
transients in the primary loops after a scram. During post-construction
testing, the throttle valve in primary loop No. 3 stuck in the open position.
Inspection showed that the operating shaft (valve stem) was bent and the shaft
guide bushing was cracked. After repair, the valve satisfactorily passed a
reliability test.
During low power testing, there were several failures of the throttle
valve operating mechanisms. The source of trouble was in the gear boxes
which operate the jacking mechanism which positions the valve stem. The
jacking mechanisms have been strengthened and the gear boxes modified.
During hydraulic tests, the throttle valve which controls the flow of
sodium around the graphite moderator logs was discovered to have been
installed in reverse. The valve was cut from the system and installed
properly.
Loading-face shield cooling system
The loading-face shield is cooled by nitrogen pressurized to 235lb/in2
gauge. The cooling system compressors are of the conventional reciprocating type. Pre-operational testing showed that the piping vibrated excessively,
and the compressors did not meet the required performance specifications.
The units were modified by the supplier and now meet the performance
specifications. Piping vibration has been eliminated by installing additional
piping supports. The leakage of nitrogen around the compressor shaft was
then found to be excessive. The compressors were modified to provide a
nitrogen recovery system which collects the nitrogen and returns it to service
by the use of a small diaphram type compressor.
Fuel assembly handling
Minor difficulties were encountered in removing some of the fuel as
semblies from the reactor after dry critical tests. The problem was traced to the disconnect sleeve between the process tube and the hanger rod which
apparently sometimes engaged the lower end of the loading-face shield sleeve.
The probability of this occurrence is believed to have been reduced by
increasing the length of a chamfer to eliminate a small flat surface above
the original chamfer. Theoretically, at least, binding could still occur
since there is enough clearance to allow the sleeve to shift off centre and
present a flat surface to the loading-face shield sleeve. If this should occur,
the problem of freeing the fuel assembly is more in the nature of an annoyance
than a major malperformance. During loading for the wet critical test,
about one-third of the fuel assemblies did not seat properly in the lower
support plate on the first attempt at insertion. The difficulty appeared to be
with the piston rings on the lower part of the fuel assembly which are intended to fit in the grid plate nozzles and prevent bypass flow of sodium. There
has been no proven explanation for this seating difficulty. It is believed
to be associated with high levels of sodium oxide in sodium since there were
114 C. A. PURSEL
no further seating difficulties after the sodium oxide content was reduced to
operating levels.
Loading-face shield
A large rotating stepped plug (loading-face shield) of reinforced dense
concrete, encased in ferritic stainless steel, provides shielding above the
reactor. A frozen metal seal, between the periphery of the loading-face
shield and the reactor cavity liner, prevents the escape of reactor cover
gas. Small vertical openings are provided in the loading-face shield for
the insertion and removal of core fuel assemblies. Three larger plugs are
provided, which by rotation of the shield, can be positioned over any of the
moderator or reflector elements.
During the first attempt to rotate the loading face shield, it began to
bind after it was rotated 110° . The rotation was reversed and after rotating
75°, it could not be moved. The shield was lifted from the reactor vessel
and it was determined that the cavity liner had a slight eccentricity. This
was corrected by machining to provide greater clearance.
Piqua Nuclear Po w e r Facility
The'Piqua Nuclear Power Facility, although not particularly complex
in principle, does contain a multitude of individual parts. Almost all of
these are quite conventional in nature. For example, steam tracing lines
are provided to maintain the primary loop piping temperatures above the
melting point of the organic coolant and the associated steam traps. In the
aggregate, the installation, maintenance and repair of these rather con
ventional components have contributed significantly to delays in the project
schedule.
Malfunctions of equipment are discussed below.
Cleaning of the reactor systems
Four attempts were made to clean the reactor system piping. Each
cleaning attempt left a film of ferric oxide. Successful cleaning was eventu
ally accomplished after modifying the cleaning process as follows: (1) The
citric acid cleaning solution concentration was reduced from 5% to 3%; (2) the
acid solution was buffered from a pH of 3.5 to 6; (3) the temperature of the
cleaning solution was reduced from 190°F to 160°F; and (4) the rinse wàter
pH was maintained above 9.
Small gear pumps
Gear pumps, used in the fuel storage system and organic fluid purifi
cation systems, developed leaks due to worn impeller bearings after a short
period of operation. The metal bearings on these pumps have been replaced
with teflon bearings and the pump speed has been reduced. The bearings
have an acceptable life expectancy.

POST-CONSTRUCTION TESTING 115
Steam tracing
Steam tracing is required around organic lines because of the high
melting point of the organic coolant. The steam tracing lines are made of
carbon-steel tubing. Sections of this tubing are connected by swage-lock
fittings. Steam leaks at these fittings, and through holes in the tubing due to
corrosiop, resulted in many delays. It was found that, by removing the
insulation from the fittings, they could be more easily maintained and further,
if an exposed fitting leaked, moisture did not get under the insulation and
travel along the tubing causing corrosion of the tubing.
With steam tracing throughout the plant, numerous steam traps are
required for collecting condensate. Bucket-type traps were installed in
itially. These were replaced with vertically mounted impulse traps. The
impulse traps require significantly less piping and better access to equip
ment. The number of trap failures is still high but may be reduced with
improvements to the pressure relief system.
Inadequate steam tracing at several points in the system permitted
freezing of the organic fluid. This occurred most often in relief and other
small process lines as well as in areas which permitted a concentration
of the para-terphenyl which has a relatively high melting point. The coolant
is a mixture of ortha, meta and para-terphenyl. Additional steam tracing
has been added.
Heating and ventilating system
Heat losses from the steam-tracing system and pump housings require
a large amount of cooling and ventilation to maintain the ambient tempera
tures in the plant at permissible levels. Exposure of steam-tracing fittings
also added to the heat load. As a result, the cooling capacity of the heating
and ventilating system was doubled. Peak ambient temperatures were main
tained below 110°F during the past summer.
Pump seal temperatures
After a short operating period, the temperature of one of the pressur-
ization pump seals exceeded its design limit. It was determined that scale
from the cooling water was collecting in the pump cooling cavity. The scale formation was traced to the use of tap water. The shield cooling system
(a demineralized system) was expanded to provide water for cooling the
pressurization pumps and the main heat-transfer pumps.
Further testing of the pumps, following the modification of the cooling
water system, demonstrated that the pressurization pump seals were still
running too hot. It was/then determined that holes in the hold-down plate
at the seal were permitting flow of hot coolant to the seal. After plugging
of these holes, operation has been satisfactory.
Organic leaks
The organic piping systems of the PNPF use flanged connectors. These
have required a very high level of maintenance to reduce flange leakage to
an acceptable level.
116 C.A. PURSEL
Many of the valves in the organic system were improperly assembled.
Reassembly and rework has reduced leakage. Overheating and failure of
valve seals has caused leaks in the large butterfly valves. Water-cooled
packing glands have been installed to reduce packing temperature and thus
reduce leakage.
Proper sealing of the reactor vessel head has been difficult and time
consuming. As the temperature of the system increased, leaks appeared.
This required retightening of the head bolts. The torque wrench, which
was provided by the contractor, was difficult to use and the care required
to prevent galling of the fine ground threads on the flange bolts added to the
problem of repeated tightening.
Rugged stud bolts, to replace the existing flange bolts, and stud tensioners,
to accurately and uniformly apply bolt stresses, are now on order. Their
use is expected to solve this leakage problem.
Control-rod operation
Checkout of the control-rod circuitry revealed operational difficulties
which required repairs and modifications. A short in the power lead to
the indicator coil (inside the reactor) required repair. Subsequent tests
led to the replacement of the circuit breakers and rectifiers with equipment
with a higher rating.
Rectifiers in the driver coil circuits failed due to high reverse voltages.
Suppressors have been installed. Additional shorts in the grip coil power
leads necessitated rework of the insulation around the coil case leads of
all 13 control rods. The sleeves on the movable armatures have been re
worked to obtain satisfactory tolerances.
VIII. RESULTS OF NU CLEAR TESTS
Nuclear tests were prepared and followed for each of the three reactors.
Initial nuclear parameters were measured with the major en phasis on critical
loading, full core reactivity, control-rod worth and shut-down margin, and
pertinent coefficients of reactivity. As of 1 April 1963,, core loading and
zero power, low-temperature tests had been performed at the ERR; wet and
dry zero power tests and power tests up to 15% of full power (38 MW(t)) had
been completed at HNPF; and fuel loading was anticipated within the month
at the P N P F . Major nuclear parameters determined by these tests are
compared to values predicted before the tests in Table X.
Fuelloading at each reactor was monitored by special in-reactor nuclear
instruments which were incorporated into the plant protective system. Plots
of inverse multiplication or count rate versus the number of fuel assemblies
loaded were developed, and incremental'fuel additions were limited to one-
half (one-third for PNPF) of the extrapolated critical fuel element loading
(rounded to the next higher integer). After the critical loading was reached,
incremental additions were limited to less than the prescribed shut-down
margin limits. The most significant aspects of the nuclear test programmes
are discussed in the following sections.
POST-CONSTRUCTION TESTING 117
Elk River Reactor
Fuel loading and zero power, low-temperature nuclear tests with a full
core have been performed at the ERR.
During fuel loading, the Pu-Be source produced 106 neutrons/s. Flux
levels were monitored by two proportional counters and one compensated
ion chamber in the reactor. These were relocated from channel to channel
as the loading progressed.
In general, the measured results were in reasonable agreement with
predictions. The predictions were made without benefit of a critical experi
ment using thoria-urania fuel.
The critical loading was 40.4 fuel assemblies, compared to a predicted
30±6. Part of the difference is attributable to a failure to include the stain
less steel in the dummy element containing the source in the calculated
prediction.
Isothermal temperature coefficient data were taken at fuel loadings of
45, 69 and 148 fuel assemblies. In the temperature range from 70°F to
160°F, the temperature coefficient was positive for the small core, becoming
negative at the 69-fuel assembly loading. This effect is largely due to the
increasing amount of control-rod material in the core and the corresponding
negative temperature coefficient of a thermally black absorber.
With all control rods, except the centre rod, banked near the core
centre-line and the centre rod out, a slight reactivity increase was observed
upon insertion of the centre rod. This was due to the expulsion of water
from the lower region of the core by the Zircaloy control-rod follower which
is 12 in shorter than the core height.
After loading 148 regular fuel assemblies (enrichment 4.2%), 20 were
removed and replaced with spike fuel assemblies (enrichment 5.3%). This
increased the core reactivity to approximately the maximum permissible
with a required reactivity shut-down margin of 2%.
Hallam Nuclear P o w e r Facility
Nuclear characteristics of the dry (sodium-free) H N P F core were
measured to provide data to establish the dry shut-down margin and the
sodium reactivity effect. The dry critical loading was 30.6 fuel assemblies,
compared to an original prediction of approximately 23. A check of thé
prediction showed that the reactivity worth of the Sb-Be source in a central
fuel-element position had not been taken into account. After accounting for
the source and the absence of the fuel assembly which it replaced, the calcu
lated critical loading was approximately 32 fuel assemblies.
During the testing, three in-reactor fission chambers were used to
monitor neutron flux levels. The useful range of these instruments was
restricted by procedural specifications to the range, 3 X 10² to 9 X 10⁵cpm.
It was necessary to reposition the chambers after the 26th and again after
the 30th fuel assemblies were loaded to maintain the count rate in this range.
After criticality was reached, the range of the in-reactor instrumen
tation was too limited for further period measurements. Withdrawal of the
chambers was not satisfactory for two reasons:
(a) Sensitivity remained too great until the chamber was withdrawn into
118 C. A. PURSEL
a borated sleeve surrounding the detector thimble, at which point virtually
all sensitivity was lost abruptly.
(b) Nuclear heating of the fuel (2°F to 3°F) was observed at flux levels too
low for accurate period measurements in the presence of the strong source
used in the test (1 to 2 X 10⁹ neutrons/s).
The source reduction was accomplished by mechanically withdrawing
the Sb capsule from the Be sleeve until the desired reduction was obtained.
This procedure, which reduced the source strength byafactorof 100 to 1000,
with the reactor slightly subcritic al and a flux level appropriately high in
the nuclear instrument range, was used repeatedly throughout the dry and
wet fuel-loading tests.
Dry fuel loading was continued until a total of 42 fuel assemblies were
loaded. At this point, the reactor was critical with all control rods one-
half withdrawn. Core reactivity was 3.8% Дк and control-rod worth for
this loading was approximately 12% Дк.
The dry isothermal temperature coefficient of reactivity was measured
at the 42 fuel-assembly loading; the average value was +0.36c/°F between
70°F and 313°F and decreased with increasing temperature.
The reactor was unloaded following these tests for the performance of
the hot sodium circulation tests, after which wet nuclear testing was begun.
The wet critical loading was 52.4 fuel assemblies, compared to a predicted
50±5 (after accounting for the source). Following the critical loading, fuel
was added in increments of 3, 6, 6, 6, 9, 9, 9, 9, 15, and 15 to a total of 140
fuel assemblies. The loading limits were: a maximum incremental addition
of 1% reactivity and a minimum calculated 2% reactivity shut-down margin.
The major reactivity parameters are as follows:
Because of perturbation effects, inherent in measuring large reactivities by rod calibration techniques, the absolute accuracy of these data remains
uncertain; however, the sodium draining tests established, with certainty,
the existence of a dry shut-down margin.
After the reactivity is reduced by fuel burn-up, additional fuel may be
added, up to a maximum of 182 fuel assemblies. All remaining core positions are now filled with dummy fuel assemblies. One hundred thirty-seven fuel
assemblies are required to provide full power output on the basis of fuel
temperature limits alone.
Piqua N uclear P o w e r Facility
Upto 1 April 1963, nuclear testing had not started at the PNPF. The
tests will be similar to those conducted at the H N P F and the ER R . It is
anticipated that the initial core loading will be limited to 60 fuel assemblies.
Fuel assemblies will be added to complete the full core loading of 85 fuel
assemblies after reactivity is reduced by fuel burn-up.
Full core reactivity (140 fuel assemblies)
Total control-rod worth
Sodium worth
Dry core shut-down margin
6.5%
12.9%
4.1%
2.3%

POST-CONSTRUCTION TESTING 119
IX. RESULTS OF SYSTEMS TESTS
E lk River Reactor
By 1 April 1963, after completion of the repairs and modifications
discussed in section VII of this report, the plant was believed to be in a
state of readiness for initiating the power tests.
The fuel-loading process was demonstrated during the critical tests.
It was accomplished quickly and efficiently. The time required for a fuel-
assembly loading cycle was usually less than 10 min per assembly. This
accomplishment was possible because of the inherent simplicity of the
manually operated fuel-loading equipment and the skill of the fuel-loading
crew.
Hallam N uclear P o w e r Facility
Pre-operational testing, zero-power nuclear testing, and testing to 15%
of full power have shown that the plant can be operated safely and perform
essentially as designed. Discrepancies and deficiencies found during testing
have been, or are in the process of being, corrected.
Low power operation
The plant has been operated up to 15% power in carrying out the low-
power portions of the test programme. Before initiating the tests, the
amplifier gains on the protective-system nuclear instrument channels were
advanced so that a flux-level scram trip would occur at 125% of 15% power.
The reactor was operated at 2.5 MW(t), 10 MW(t), 20MW(t) and
38 MW(t) to permit testing at these power levels. Before each power-level
increase, data reduction was completed to the extent necessary to determine
that the plant could be expected to operate satisfactorily and safely at the
next power level. This procedure will be fbllowed during the remaining
power testing. Total integrated power to date is shown in Fig. 1.
At each step, power levels were calculated by two methods: (1) Total
reactor mass flow as indicated by flow meters and temperature rise across
the core, and (2) steam flow and enthalpy loss across the heat sink. Power
level calculations were as follows:
NominalReactor flow and
temperature riseSteam flow and
enthalpy rise
2.5 2.3
8.7
18.0
38
10
2038
10.3
17.05
47.3
It was determined that the flow-meter calibration was in error. The cali
bration curve has been corrected for flows up to 50% of full flow.
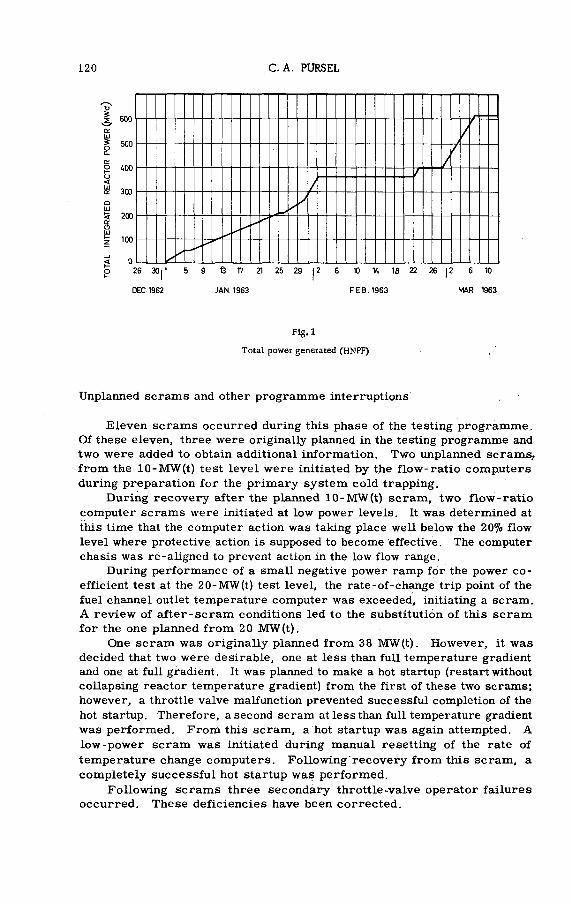
120 C. A. PURSEL
F ig .l
Total power generated (HNPF)
Unplanned scrams and other programme interruptions
Eleven scrams occurred during this phase of the testing programme.
Of these eleven, three were originally planned in the testing programme and
two were added to obtain additional information. Two unplanned scrams,
from the 10-MW(t) test level were initiated by the flow-ratio computers
during preparation for the primary system cold trapping.
During recovery after the planned 10-MW(t) scram, two flow-ratio
computer scrams were initiated at low power levels. It was determined at
this time that the computer action was taking place well below the 20% flow
level where protective action is supposed to become effective; The computer
chasis was re-aligned to prevent action in the low flow range.
During performance of a small negative power ramp for the power co
efficient test at the 20-MW(t) test level, the rate-of-change trip point of the
fuel channel outlet temperature computer was exceeded, initiating a scram.
A review of after-scram conditions led to the substitution of this scram
for the one planned from 20 MW(t).
One scram was originally planned from 38 MW(t). However, it was
decided that two were desirable, one at less than full temperature gradient
and one at full gradient. It was planned to make a hot startup (restart without
collapsing reactor temperature gradient) from the first of these two scrams;
however, a throttle valve malfunction prevented successful completion of the
hot startup. Therefore, a second scram at less than full temperature gradient
was performed. From this scram, a hot startup was again attempted. A
low-power scram was initiated during manual resetting of the rate of
temperature change computers. Following recovery from this scram, a
completely successful hot startup was performed.
Following scrams three secondary throttle-valve operator failures
occurred. These deficiencies have been corrected.

POST-CONSTRUCTION TESTING 121
Core alignment and control-rod operability
Subsequent to completion of testing at 38 MW(t), a reactor core align
ment test and a control-rod operability test were performed. The core
alignment test consisted of removing and reinserting three fuel elements
with the reactor at an isothermal temperature of about 400°F. No excess
binding or loading was indicated by the fuel-handling machine load cell.
The control-rod operability test consisted of operating the rods one at
a time from the control-rod test chart and recording the following data:
withdrawal and insertion times, latch release time, and drop times for the
first nine feet, and for full insertion. All of the above times were found to
be within the limits specified in the technical specifications.
Piping displacements
During the initial rise-in-power to 38 MW(t), the primary loop No. 1
reactor outlet did not move in the expected manner during the temperature
increase. Inadequate clearances were determined to exist between main
heat-transfer system and service system lines. Clearances were ade
quately increased by trimming insulation. A general inspection of the
primary pipeway revealed no further areas of interference.
During the development of full operating temperatures, the reactor
outlets of primary loops 1 and 3 moved in a manner that indicated an axial
restraint existed. Small bits of debris were found between the rubbing faces
of the restraint «addles.
Auxiliary cooling systems
The reactor cavity, concrete shielding surrounding the reactor, pipe
tunnel, equipment cells, nitrogen coolers, loading-face shield, and heating
and ventilating equipment are cooled by nitrogen or water-cooling systems.
The systems have all operated satisfactorily up to 15% power. All equip
ment ánd areas have been adequately cooled with the exception of a small
area in the reactor biological shielding between the upper section of the
reactor vessel and the first set of cooling coils. It is not anticipated that
the localized high temperatures will exceed full-power design requirements.
Hydraulic performance characteristics
The hydraulic head loss characteristics of the main heat-transfer system
are within less than ±15% of predictions.
Control system, protective system, and instrumentation performance
characteristics
The control and protective systems were calibrated during pre-
operational testing. The control limits, set points, control or protective
action, response time and accuracy have been satisfactory and within the
specified limits.

122 C.A. PURSEL
Control-rod operation
The control-rod operation was checked during pre-operational testing,
at room temperature and at 540°F and after operation at 15% of power. There
were no significant differences in operating characteristics. Latch release
time is between 50 and 60 ms, and the rod drop time is about 960 ms.
Fuel-handling machine
The fuel-handling machine has performed very satisfactorily, The
original estimate was that, during fuel loading, the machine would handle
one fuel element per hour. The actual fuel-loading rate was about one fuel
element for each 40 min.
Cold traps (sodium oxide)
The primary-system cold-trapping duty has been greater than originally
predicted. To date, five cold traps have been removed from the primary
system and one from the secondary. The traps were designed to remove
250 lb of sodium oxide. Design flow-rate through the traps is 30gal/min.
The calculated removal is about 200 to 250 lb of oxide per trap.
The flow of sodium through the cold traps is dependent on the main
pumps differential pressure. At low flow rates in the main heat-transfer
loops, adequate flow rates through the traps have been difficult to obtain at
times.
Hot trap (carbon)
After the repair of the electric heater which burned out during the first
startup of the hot trap, the trap has operated satisfactorily. The heater
is able to maintain the hot-trap temperature at the desired 1200°F operating
point.
Preheating system
Sodium pipe and equipment preheating is accomplished using automatically controlled electrical resistance heaters. The heaters are attached directly
to the equipment tobe heated. A sheet metal cover is placed over the heaters
and thermal insulation applied over this cover. The heaters are controlled
by thermocouples in the gap between the equipment and the cover.
Some of these thermocouples were found to read as much as 50 to 100° F
below actual equipment temperatures. It was necessary to relocate some
thermocouples closer to the equipment or attach them directly to get proper
control. The system now operates without difficulty and is capable of pre
heating and maintaining equipment at desired temperatures.

POST-CONSTRUCTION TESTING 123
Piqua Nuclear Po w e r Facility
New codant storage system
Organic coolant in the flaked form was added to the fuel storage tanks.
The bags were carried to the hopper of the storage tank with a conveyor.
The original hopper did not function properly because the coolant formed
into large masses which would not pass through the hopper throat. A new
hopper was fabricated with a larger throat. Modifications of the steam
tracing lines, steam trapping and Viking gear pumps were also required.
The system now operates satisfactorily.
Coolant purification
It was demonstrated that the purification systems will process 1000 lb/h
of new coolant in accordance with design requirements. Automation control
of the process was established and demonstrated to be satisfactory.
Tests were run at four lesser feed rates, 350, 500, 700 and 825 lb/h.
A total of more than 35 000 lb of coolant was processed. The column con
denser exceeded its design rating of 700 lb/h by condensing 825 lb/h of
coolant.
After the test, when the system was run at 1000 lb/h, the column con
denser condensed the 950 lb/h overhead flow without difficulty. Steam
consumption was 260 lb/h of 175 lb/in2 gauge steam. Thi'e predicted require
ment was 140 lb/h. The condensers and the aqueous waste holdup tank were
demonstrated to be adequate for the higher than anticipated steam load.
The purification column performed satisfactorily. The overhead output
was a clean, light-amber coloured product having a melting-point range of
140 to 304°F. An analysis of the bottoms showed a concentration of 2% high
boilers, beige in colour with a melting-point range of 250 to 370°F. The
feed to the purification system contained around 0.5% high boilers, light
beige in colour with a melting range of 140 to 310°F. The column showed
no signs of flooding at the maximum feed rate of 825 lb/h during the formal
test or at the feed rate of 1000 lb/h after the test.
Main heat-transfer system
The pressure drop in the system (including allowances for fuel elements)
was lower than calculated in the original design. The maximum measured
core pressure drop is 35 lb/in2 compared to the predicted 44.5 lb/in2. Flow
rates in the single-pump mode of operation are also higher than predicted.
The flow rate is now estimated to be 9000 gal/min as compared to the
7200 gal/min design value.
A portion of this excess hydraulic head is available for the recently
installed in-core filters. However, current indications are that the flow
rates will exceed the design goals. This additional hydraulic head is avail
able for use in obtaining the benefits of greater linear velocities and lower
fuel temperatures.
124 C. A. PURSEL
Pressurization and degasification systems
The pressurization and degasification systems operated satisfactorily.
No problems were encountered in maintaining a pressure of 5 lb/in2 abs. in
the degasifier tank. The pressurizing pump tests proved that these pumps,
with one or both in operation, can delivery 200 gal/min coolant flow against
the 105-lb/in2 gauge system pressure. This test also demonstrated that
a scram signal, which automatically causes flow to bypass the degasifier,
will initiate automatic pressurizing-pump speed reduction to a pre-set
condition.
Decay-heat removal
The decay-heat removal system exceeds performance requirements.
At 575°F, the system removes 2.6 X 10⁶ BTU/h. The design requirements
are 2.3 X 10⁶ BTU/h.
Control rods
Rod drop measurements were made at 575°F and 450°F. Total drop
time on each of the 12 rods tested (one rod was inoperable at the time)
measured less than 700 ms. These data were well below the required total
drop time of one second and compared favourably with test data which were
developed during acceptance tests at the component development loop.
A C K N O W L E D G E M E N T S
The assistance of D. E . Simpson, R . E . Aronstein, J .P . Lagowski,
R. M. Nack and J.J. Purcell of the Reactor Engineering Division, USAEC
Chicago Operations Office, as well as the contribution of Allis-Chalmers
Manufacturing Company and Atomics International, in the preparation of this
report is gratefully acknowledged.
D I S C U S S I O N
N. N. ARISTARKHOV: Could you give us further information about the
cause of tube failures in the heat-exchanger of the Hallam reactor? Was it
because the tubes were not fastened securely enough; i. e. was it due in the
first instance to vibration of the tubes?
C .A . PURSEL: Yes. The heat-exchanger in question is between the
primary and secondary loops. The pressure on the secondary-loop sodium
is higher than on the primary-loop sodium, so that when the leak occurred
sodium flowed from the secondary loop back into the primary loop; in fact,
that is how the leak was detected. One component of the inlet flow is at right
angles to the ducts, and this set up harmonic vibrations in a few tubes near
the inlet to the exchanger. They are now more firmly fastened and do not
vibrate.
N. N. ARISTARKHOV: Is there any device in the primary loop of the
Hallam reactor for cleansing the circuit of radioactive contamination due
to fission products?

POST-CONSTRUCTION TESTING 125
C.A. PURSEL.: No. There are, of course, the normal traps designed
to remove sodium oxide and carbon, but nothing specifically intended to
remove fission products.
N. N. ARISTARKHOV: What practical steps have been taken to prevent
the passage of gas into the primary loop of the H A LLA M reactor? Have you
considered the possibility of gas bubbles collecting in the'core and affecting
the reactivity? How significant might the change in reactivity be?
C .A . PUR SEL: I have heard about the gas bubbles collecting on the
jackets of the fuel assemblies in the BR-5 reactor. In the H ALLAM reactor
no provision has been made for the removal of such bubbles, should they
occur, and I rather think that the problem would not be so serious as it might
be in a fast breeder likeEBR-2. The H A LLA M reactor operates on a thermal
spectrum, and the physics characteristics should not be so sensitive to
changes in the gas content of the core. Since the problem has not arisen I
cannot tell you whether the nuclear characteristics Would be noticeably
affected.
U. ZELBSTEIN : Would you agree that it might be possible to divide
plant deficiencies into two broad categories: those resulting from failures of
the specifically nuclear components and affecting tightness, nuclear proper
ties, etc; and those relating to problems of engineering in general? The
latter category might be further divided into problems involving new tech
niques and new materials, and those that merely require the application of
conventional engineering principles.
C .A . PURSEL: I dealt only with the nuclear components of these plants
and not with the power generating equipment. As regards the fuel there have
been few, if any, difficulties apart from those I discussed in connection with
the fabrication of the fuel for the E LK RIVER reactor.
Of course, these being nuclear plants, some new materials are bound
to be used, and new uses made of more conventional materials; by and large,
however, the problems that have arisen could have been dealt with merely
by applying classical engineering principles. I believe it is M . Conte's
paper* that suggests that engineers are devoting so much attention to the
strictly nuclear components of their plants that the more conventional portions
are perhaps being neglected. In any case, with the benefit of hindsight, I
believe that most of the difficulties encountered in these plants could have
been avoided by sound classical engineering.
CONTE, F. et al., these Proceedings.5


COMMISSIONING EXPERIENCE FROM THE AGESTA NUCLEAR POWER PLANT
N. RYDELL AGESTA KRAFTVARMEWERK,
FARSTA, SWEDEN
Abstract — Résumé — Аннотация — Resumen
COMMISSIONING EXPERIENCE FROM THE ÂGESTA NUCLEAR POWER PLANT. The Agesta Nuclear
Power Plant is a pressurized heavy water reactor of the pressure vessel type, fuelled with natural uranium. It
was commissioned with light water from December 1962 to May 1963.
Observations of a more general interest were made during this commissioning essentially on the following
topics;(a) cleanliness of primary circuit (b) valve operation (c) pressurization of the primary circuit (d) water
leakage (e) refuelling machinery (f) containment testing.
EXPÉRIENCE ACQUISE LORS DES ESSAIS DE MISE EN SERVICE DE LA CENTRALE NUCLÉAIRE D'ÂGESTA.
Il s'agit d*un réacteur à uranium naturel et à eau lourde pressurisée, du type à caisson sous pression. Les essais
de mise en service ont été faits avec de l'eau ordinaire, de décembre 1962 à mai 1963.
La mise en service a permis de faire des observations d'intérêt général sur les sujets suivants: a) non-
contamination du circuit primaire; b) fonctionnement des vannes; c) maintien sous pression du circuit primaire;
d) fuites d’eau; e) appareils de chargement du combustible; f) essais d'isolement.
ОПЫТ ПО ВВЕДЕНИЮ В ЭКСПЛУАТАЦИЮ ЯДЕРНОЙ ЭНЕРГЕТИЧЕСКОЙ УСТАНОВКИ AGESTA. Ядерная энерге
тическая установка Agesta представляет собой тяжеловодный реактор под давлением, использующий
природный уран в качестве топлива. Реактор был введен в эксплуатацию на обычной воде в период
с декабря 1962 года по май 1963 года.
Замечания более общего характера были сделаны во время эксплуатации в основном по следухщим
темам: э) чистота первичного контура; б) работа клапанов; в) повышение давления в первичном кон
туре; г) утечка воды; д) установка по замене топлива; е) испытание на герметичность.
EXPERIENCIA ADQUIRIDA C ON LA PUESTA EN MARCHA DE LA CENTRAL NUCLÉOELECTRICA DE
AGESTA. La central nucleoeléctrica de Agesta posee un reactor de agua pesada del tipo de recipiente de
presión, con combustible de uranio natural. Se mantuvo en funcionamiento con agua ligera entre diciembre
de 1962 y mayo de 1963.
Durante esta prueba, se efectuaron observaciones de interés más general, relacionadas esencialmente con
las siguientes cuestiones: a) limpieza del circuito primario; b) funcionamiento de las válvulas; c) presión del
circuito primario; d) pérdidas de agua; e) dosposiciones de reposición del Combustible; f) ensayos de
confinamiento.
EXPERIENCE OF COMMISSIONING
оThe Agesta Nuclear Power Plant is a heavy-water-moderated and cooled
pressurized water reactor of the pressure-vessel type with natural uranium
oxide as fuel.
It is designed for the combined production of electrical power (10 MW)
and heating water for household use (55 M W ). A highly simplified flow dia
gram of its major circuits is given in Fig. 1 and the site layout in Fig. 2
127
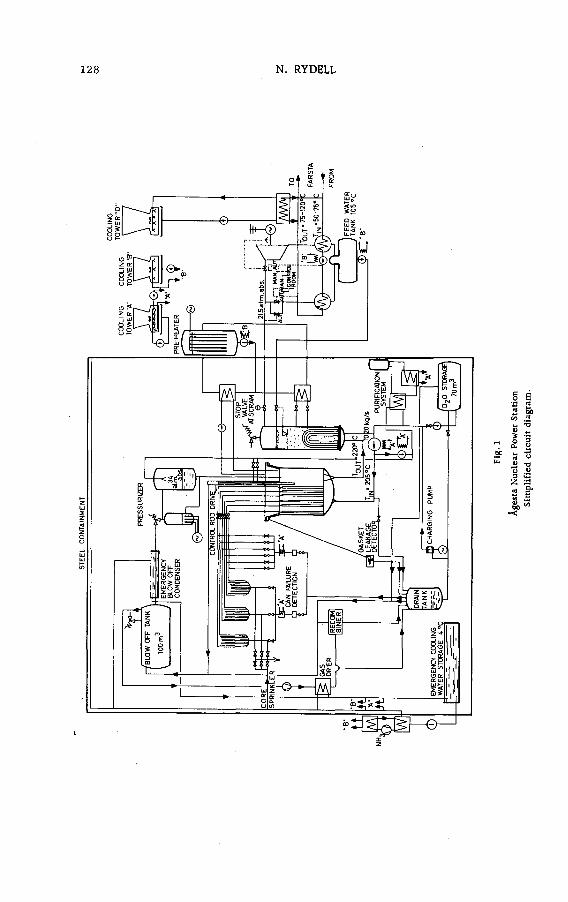
STEE
L C
ON
TAIN
ME
NT
128 N. RYDELL
Fig
-1
Age
sta
Nucle
ar
Power
Statio
n
Sim
pli
fied
circ
uit
dia
gram
.

COMMISSIONING EXPERIENCE 129
& 4)o .sо. fi«3 с4) л)
о а!

130 N. RYDELL
The process of putting the plant into commission, using light water,
began in December 1962. Commissioning tests have been run parallel with
the final stages of the installation work in the plant. The commissioning
programme contained the following major phases for the primary circuits
and, with appropriate omissions, also for the auxiliary circuits:
(a) Exchange of atmosphere in the circuits by means of evacuation and sub
sequent filling with nitrogen;
(b) Rinsing the circuits with water;
(c) Fuel loading;
(d) Water filling and hydrostatic testing;
(e) Component and system tests with water at room temperature;
(f) Heating the plant to operating temperature;
(g) Component and system tests at operating temperature.
Instrumentation and power supply tests were run parallel to the main
programme as a natural Off-shoot. In this connection those tests where
the external power supply was disconnected were of special interest. The
containment leakage test falls outside this circuit commissioning programme,
but is an important part of plant commissioning. The progress of the com
missioning can be seen from Table I.
SPECIAL POINTS OF INTEREST
1. Cleanliness of the primary circuit
The water rinsing, although of little scientific or technological interest,
is an important prerequisite for the subsequent tests of mechanical equipment.
The primary circuits have been installed under clean conditions. These
require that the work area is sealed off from the outside, that the ventilating
air is filtered, that all people entering wear coveralls and change shoes,
that all equipment brought in has been previously cleaned and is kept clean
while it is in the clean area and that all loose material is kept under control.
It is, however, extremely difficult to fulfil these requirements stringently
in actual practice, without completely stopping all activities in the clean area.
Clothes are worn out by use, wooden boards wear when walked on and
welding produces fumes which penetrate everywhere. It is also difficult
to maintain cleanliness discipline in the work force over a period of more
than a year.e
The clean area was maintained at Agesta with reasonable rigour, but without drastic measures. It was therefore far from clinically clean. The
rinsing of the primary circuits proved, however, that the cleanliness
measures had been well balanced. The rinsing water was passed through
filters. As little as a few grammes of dry material was collected there,
and this proves that very little dirt existed in these systems, even if the
walls of the reactor vessel and some other components could not be very
effectively flushed by the method used. Also further experience with, and
inspections of, these systems indicated no presence of dirt from installation
work.
COMMISSIONING P R O G R A M M E
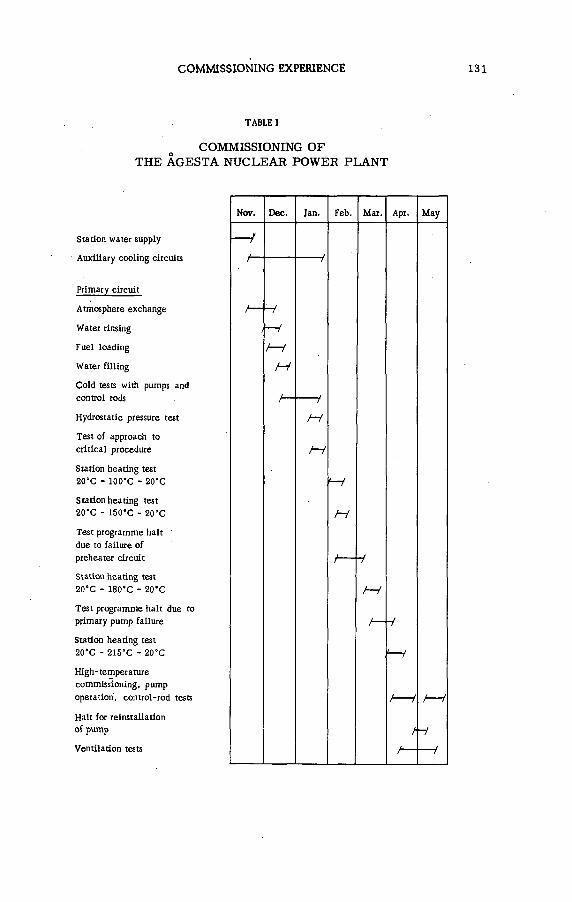
COMMISSIONING EXPERIENCE 131
TABLE 1
COMMISSIONING OF
TH E AGESTA N U C LEA R P O W ER PLANT
Station water supply
Auxiliary cooling circuits
Primary circuit
Atmosphere exchange
Water rinsing
Fuel loading
Water filling
Cold tests with pumps and
control rods
Hydrostatic pressure test
Test of approach to
critical procedure
Station heating test
20°C - 100°C - 20"C
Station heating test
2 0 'C - 150*C - 20°C
Test programme halt
due to failure of
preheater circuit
Station heating test
20"C - 180"C - 20“C
Test programme halt due to
primary pump failure
Station heating test
20"C - 215°C - 20°C
High- temperature
commissioning, pump
operation, control-rod tests
Halt for reinstallation
of pump
Ventilation tests
Nov. Dec. Jan. Feb. Mar. Apr. May
W
H
t-- 4
h 4
tf--
/ — i
-!— /
t
/— 4
/ — /
M
f—
/
--- iM
M

132 N. RYDELL
There is no doubt that the extra costs for the clean area work have paid
very well, already during the commissioning,since no equipment malfunction
has been caused by foreign bodies in the system.
2. Primary circuit pumps
The primary circuits contain 15 pumps of which 13 are centrifugal and
2 are piston pumps. The four main circulators are canned motor pumps,
whereas the remaining nine are of the canned rotor type. Unsatisfactory
manufacturing techniques had been used for the stator windings in one of the
main circulators. This caused a break in one of the phases in the stator.
This pump had to be disconnected from the circuit, dismantled and the stator
body sent to the manufacturer for rewinding. This caused a delay in the commissioning and is not likely to recur, but it has been the only case of
pump malfunction during the commissioning.
3. Valve operation
All valves with connections up to 50 mm are of bellows type, all bigger
valves (25) have double stuffing boxes with drainage. In general the valves
have performed weU. Only three of them show a leakage of any significance
across the seat when the valve is closed. About a third of the valves are
manually operated from a remote position through mechanical links¿ Our
experience with this type of transmission is poor and many of them had to
be redesigned as a result of tests in cold condition. Some of those which
must function both with hot and cold circuits have given almost insoluble
problems,whether due to the links or to the valves or to a combination of
the two. It is obvious that such links must be thoroughly tested for all pos
sible angles between incoming and outgoing shafts andfor possible movements
of the valve shaft with pipe expansion and that the experience from such
tests must be followed when the transmissions are installed in the station.
This may, however, be very difficult in actual practice, when the links are
installed after the jungle of pipes is installed. At that moment an unfore
seen pipe or ventilation duct or other obstacle may necessitate a change of
the linkage. Our experience is rather that it is both cheaper and safer to
make all valves, which must be remotely operated, either pneumatic or
motor driven, and avoid mechanical linkage entirely.
4. Control rod drives
The control rods are moved in steps bv a hvdraulic svstem with programme-operated solenoid threeway valves supplying the pressure to the three hydraulic connections for holding, gripping and lifting. An analysis
of the function of the system shows many possible sources for faults, e.g.
a leakage in the two mechanical joints in the mechanism and past the sealing
rings in the clutches, clogging of the mechanism due to crud deposition,
or sticking due to the long narrow clearances etc. Our experience is, how
ever, so far very good, the steps are regular, the fall times equal, the
necessary pressures to hold and lift the rod are smaller than expected and

COMMISSIONING EXPERIENCE 133
the leakage within tolerable limits. Inspection of eight rod mechanisms
after four months in the system showed that they were perfectly clean and
free from crud depositions. This is probably due to the settling effect on
the crud in the long hydraulic pipes through which only a minute flow passes.
It is probable that increasing leakage due to wear of the graphite seal rings
in the clutches will ultimately set the life-time between maintenance periods.
Efforts are therefore made to replace the seal rings with bellows.
5. Pressurization of the primary circuit
The primary loop is pressurized at operating temperature by steam
in a pressurizer vessel. The steam is produced in an electrically heated
boiler, with the power supply, 336 kW, regulated from pressure signals.
The pressure is maintained at34atm, i.e.11 atm above the saturation pressure
of the heavy water when it leaves the reactor. This effectively suppresses
boiling in the pumps.
The situation is, however, different at lower temperatures, since the
heavy-water mass is constant, and the volume thus decreases with tempera
ture. The heavy water will actually only just cover the core at room
temperature and will not reach the top lid until àt about 130°C or higher,
depending on the initial water level.
The high overpressure maintained at operating temperature cannot be
applied when the water level is low, since the steam condenses on the large
cold-water surface and on the cold lid walls, and thus cannot contribute to
any overpressure relative to the saturation pressure of the water. The
overpressure must thus be produced by a partial gas pressure. This pre
vents the water from boiling but saturates the water with gas instead. Gas
is released in all regions where the pressure is lower than at the water
surface, and particularly at the suction side of the pump. The worst situ -
ation occurs during the heating of the primary circuit. The water level is
low, the pressure margin against boiling is minute and the primary water
is heated in the heat exchangers before it enters the pumps. The circulation
may then easily become unstable. A slight drop in flow, e.g. due to gas
release in the pump, gives a higher temperature rise in the heat exchanger
and causes boiling in the pump, which further reduces the flow etc. There
would not be any problems with the pressurizing if, as in light-water re
actors, the primary circuits could be filled up to the operating level at room
temperature, and the temperature expansion could be compensated for by
the drainage of the surplus water. But this would require a considerable
extra heavy-water investment. Experience from the commissioning shows, how
ever, that a moderate increase in the originally specified room-temperature
level, is enough to bring the water level up in the lid below 130°C or so,
where the temperature margins start to be dangerously small with the rate
of heating used. While the pressurizing problems for routine operation can
be thus handled, it will be difficult to carry out the reactor physics pro
gramme, which calls for prolonged operation with low water levels at ele
vated temperatures. It is not yet clear by which method boiling or gas re
lease could be prevented in this situation, but it may be that a possible sol
ution is to do all the physical measurements at high temperature with the
water slowly cooled at a constant rate rather than heated.

134 N. RYDELL
The amount of water leakage is of particular importance in heavy-water
reactors both because of the heavy-water price and of the tritium hazard.
A very high degree of leak-tightness has been aimed at in Agesta. All piping
is welded, and most of the valves are of the bellows type. Where gaskets or
stuffing boxes have been unavoidable they are always doubled with drainage
between the seals. All welds have been radiographed and the majority leak -
tested with helium. The water leakage from the primary system is, however,
one of the most difficult plant data to establish. It can only be obtained by
measurements of the level of the accessible free water surfaces, and only
when the effective mean temperature of the water is known. This tempera
ture is in practice only known with sufficient accuracy at room temperature.
It is thus only by a comparison of levels before and after a period of high-
temperature operation that a change in water content can be established.
But even then there are large sources of error. It is almost impossible
to keep a complicated piping system completely filled with water, particularly
when, for pressure reasons, it is saturated with gas at the higher tempera
tures. Gas may be trapped in the water space and water may be left in the
gas space in the top of the primary system and particularly in the blanket
gas space in the low-pressure parts of the primary system.
An effort was made to establish the net water losses during two high-
temperature periods during the commissioning. The first was made at the
first run at full temperature, but before the valve gaskets had been drawn
tight. The apparent losses were 4.6 1/h, but a separate measurement showed
that most of this "loss" was due to gas volumes which had been driven out
from the system and replaced with water. Only 0.75 1/h could not be traced
in this way and most of this had been dripping out through loosely drawn
gaskets.
During the second hot run under more appropriate conditions for leakage
observations and after the gaskets had been drawn more tightly,the loss was
reduced to 0.25 1/h. The leakage through stuffing boxes and gaskets will
be returned to the heavy-water drainage tank during reactor operation. This
return system was, however, deliberately left open during the commissioning
to permit better localization of leaking gaskets and an unknown fraction of
the 0.25 1/h will be returned to the system when these leakage paths are closed. Already a loss of 0.25 1/h would be economically acceptable, but
there is every reason to predict considerably lower effective losses when
the system is properly closed and all water circuits are well filled.
Internal leaks from the high-pressure parts through, for example,
safety valves and drain valves, to low-pressure tanks may also be of concern
since the leakage must be cooled and the cooling capacity will limit the
amount of leakage that can be tolerated. The safety valves are presumed
to be the weakest type of component in this respect, but after the safety
valves had been set to correct relief pressures at operating temperatures,
no leakage of any concern could be detected. The development of leakage
with time for these components will, however, be of considerable interest
in the future.
6. Water leakage
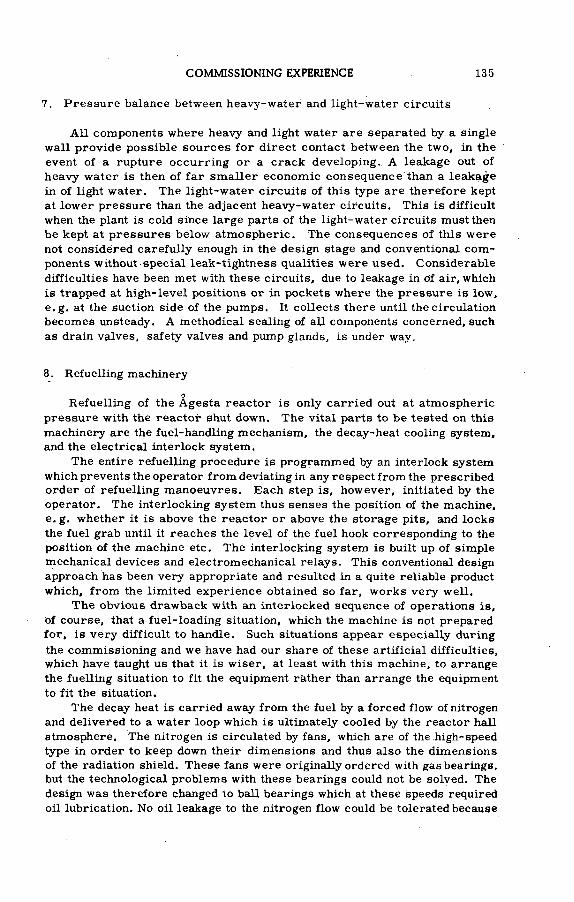
COMMISSIONING EXPERIENCE 135
7. Pressure balance between heavy-water and light-water circuits
All components where heavy and light water are separated by a single
wall provide possible sources for direct contact between the two, in the
event of a rupture occurring or a crack developing. A leakage out of
heavy water is then of far smaller economic consequence than a leakage
in of light water. The light-water circuits of this type are therefore kept
at lower pressure than the adjacent heavy-water circuits. This is difficult
when the plant is cold since large parts of the light-water circuits must then
be kept at pressures below atmospheric. The consequences of this were
not considered carefully enough in the design stage and conventional com
ponents without special leak-tightness qualities were used. Considerable
difficulties have been met with these circuits, due to leakage in of air, which
is trapped at high-level positions or in pockets where the pressure is low,
e.g. at the suction side of the pumps. It collects there until the circulation
becomes unsteady. A methodical sealing of all components concerned, such
as drain valves, safety valves and pump glands, is under way.
8. Refuelling machinery
О
Refuelling of the Agesta reactor is only carried out at atmospheric
pressure with the reactor shut down. The vital parts to be tested on this
machinery are the fuel-handling mechanism, the decay-heat cooling system,
and the electrical interlock system.
The entire refuelling procedure is programmed by an interlock system
which prevents the operator from deviating in any respect from the prescribed order of refuelling manoeuvres. Each step is, however, initiated by the
operator. The interlocking system thus senses the position of the machine,
e. g. whether it is above the reactor or above the storage pits, and locks
the fuel grab until it reaches the level of the fuel hook corresponding to the
position of the machine etc. The interlocking system is built up of simple
mechanical devices and electromechanical relays. This conventional design
approach has been very appropriate and resulted in a quite reliable product
which, from the limited experience obtained so far, works very well.
The obvious drawback with an interlocked sequence of operations is,
of course, that a fuel-loading situation, which the machine is not prepared
for, is very difficult to handle. Such situations appear especially during
the commissioning and we have had our share of these artificial difficulties, which have taught us that it is wiser, at least with this machine, to arrange
the fuelling situation to fit the equipment ràther than arrange the equipment
to fit the situation.
The decay heat is carried away from the fuel by a forced flow of nitrogen
and delivered to a water loop which is ultimately cooled by the reactor hall
atmosphere. The nitrogen is circulated by fans, which are of the high-speed
type in order to keep down their dimensions and thus also the dimensions
of the radiation shield. These fans were originally ordered with gas bearings,
but the technological problems with these bearings could not be solved. The
design was therefore changed to ball bearings which at these speeds required
oil lubrication. No oil leakage to the nitrogen flow could be tolerated because
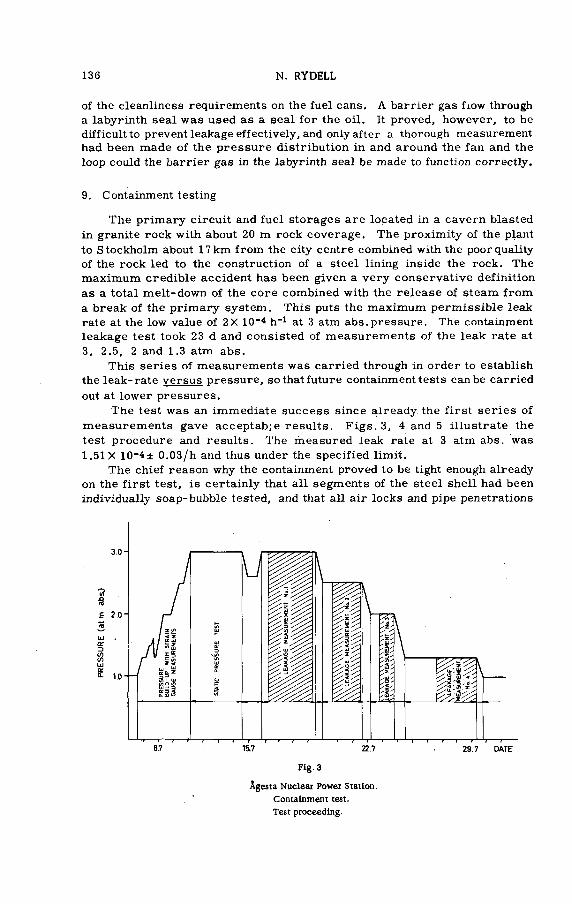
136 N. RYDELL
of the cleanliness requirements on the fuel cans. A barrier gas fiow through
a labyrinth seal was used as a seal for the oil. It proved, however, to be
difficult to prevent leakage effectively, and only after a thorough measurement had been made of the pressure distribution in and around the fan and the
loop could the barrier gas in the labyrinth seal be made to function correctly.
9. Containment testing
The primary circuit and fuel storages are located in a cavern blasted
in granite rock with about 20 m rock coverage. The proximity of the plant
to Stockholm about 17 km from the city centre combined with the poor quality
of the rock led to the construction of a steel lining inside the rock. The
maximum credible accident has been given a very conservative definition
as a total melt-down of the core combined with the release of steam from
a break of the primary system. This puts the maximum permissible leak
rate at the low value of 2X 10⁻⁴ h '1 at 3 atm abs. pressure. The containment
leakage test took 23 d and consisted of measurements of the leak rate at
3, 2.5, 2 and 1.3 atm abs.
This series of measurements was carried through in order to establish
theleak-rate versus pressure, sothatfuture containment tests can be carried
out at lower pressures.
The test was an immediate success since already the first series of
measurements gave acceptab;e results. Figs.3, 4 and 5 illustrate the
test procedure and results. The measured leak rate at 3 atm abs. was
1.51 X 10⁻⁴± 0.03/h and thus under the specified limit.
The chief reason why the containment proved to be tight enough already
on the first test, is certainly that all segments of the steel shell had been
individually soap-bubble tested, and that all air locks and pipe penetrations
Fig. 3
Agesta Nuclear Power Station
Containment test.
Test proceeding.
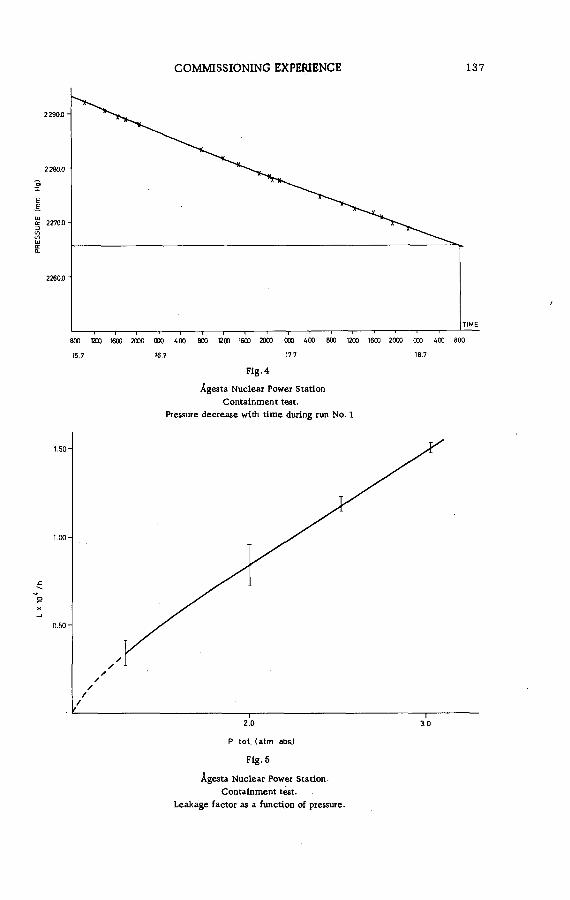
PR
ESS
UR
E (m
m H
g)
COMMISSIONING EXPERIENCE 137
15.7 J6.7 17.7 18.7
Fig.4
Agesta Nuclear Power Station
Containment test.
Fressure decrease with time during run No. 1
//
/ti--------------- 1--------------- r
2.0 3.0
P tot. (atm ab&)
Fig. 5
Agesta Nuclear Power Station.
Containment test.
Leakage factor as a function of pressure.

138 N. RYDELL
with their shut-off valves, and a statistical sample of the cable penetrations
had been tested before and improved where necessary.
CONCLUSION
The commissioning period has been a very demanding time, since it
has been run in parallel with the final stages of the plant construction.
A rather small number of more serious equipment failures or breakdowns
and a great many occasions of minor malfunctioning in both cases on
conventional equipment in light-water circuits have constantly acted as brakes
on the progress of commissioning and on three occasions caused inter
ruptions in the work. The test programme has, however, on the whole suc
ceeded very well and has demonstrated that the requirements that heavy -
water operation put on circuits and components have been sufficiently well
met. The plant has also worked well as an integrated unit during the hot
commissioning stages.
B I B L I O G R A P H Y
A rather detailed description of the plant is given in Nucl. Power, 8
No. 83 (1963) 40 - 52.

INITIAL OPERATING EXPERIENCE WITH THE "NPD" REACTOR
l .g . M cCo n n e l l
HYDRO-ELECTRIC POWER COMMISSION OF ONTARIO,
TORONTO, ONTARIO, CANADA
Abstract — Résumé — Аннотация — Resumen
INITIAL OPERATING EXPERIENCE WITH THE NPD REACTOR. Canada's first nuclear power station, the
Nuclear Power Demonstration station (NPD), is intended to serve as a means of proof-testing the performance
of the Canadian type of station using natural uranium as fuel and heavy water as moderator and coolant. It
reached full power on 28 June 1962. Although designed for base*load operation it will, during the early
stages, be operated part of the time on high-capacity.runs and part of the time on improvement periods.
Progress has been favourable so far; the first high-capacity run of six weeks'duration yielded a capacity factor
of 70%.
Improvements already made have increased safety, improved performance and demonstrated potential
methods of capital-cost reduction for future stations. For example, shaft seals on primary coolant pumps have
been modified for better performance, freezer-type vapour recovery equipment has been replaced in favour
of absorption columns to reduce heavy-water vapour loss, and flow limiters are being installed in sample lines
to reduce losses of heavy water in the event of joint failures.
During December 1962 two simultaneous leaks from the on-power refuelling machine led to an unusual
sequence of events in which a considerable amount of hot high-pressure heavy water was spilled into the reactor
vault where it suffered a slight downgrading in isotopic purity. It was upgraded and the reactor returned to
operation by the end of the month. All safety devices operated correctly during the incident as did the pro
visions for containment of heavy water.
EXPERIENCE RECUEILLIE PENDANT LES PREMIERS MOIS DE FONCTIONNEMENT DU RÉACTEUR NPD.
La première centrale nucléaire du Canada, NPD, est une centrale de démonstration, qui doit servir à vérifier
les performances des réacteurs fonctionnant à l'uranium naturel et utilisant de l'eau lourde comme ralen-
tisseur et comme fluide de refroidissement. Elle a atteint sa pleine puissance le 28 juin 1962 bien que conçue
pour être exploitée comme centrale de base, elle fonctionnera au début comme centrale d'appoint, ce qui
permettra d'y apporter des perfectionnements pendant les périodes d'arrêt complet. Les résultats obtenus jusqu*à
présent ont été positifs; la première expérience de fonctionnement, qui a duré six semaines, a permis d'obtenir
un facteur de puissance de 70%.
Les perfectionnements déjà apportés ont permis d'augmenter la sécurité, d'améliorer les performances et
ont montré en même temps qu*il était possible de réduire les dépenses d'investissement pour les centrales
futures. On a, par exemple, modifié les joints d'arbre des pompes du circuit primaire de refroidissement
pour obtenir de meilleures performances; les appareils de récupération de la vapeur, à congélation', ont été
remplacés par des colonnes d'absorption de façon à réduire les pertes de vapeur d'eau lourde; des régulateurs
de débit sont installés en certains points pour réduire les pertes d'eau lourde pour le cas où des joints céderaient.
En décembre 1962, deux fuites simultanées dans l'appareil de rechargement en puissance ont entraîhé
une série inhabituelle d'incidents; une quantité importante d'eau lourde à haute pression et haute température
a été projetée dans l'enceinte du réacteur où sa pureté isotopique a été légèrement altérée. On a redonné à
l’eau lourde la pureté voulue et le réacteur a pu recommencer à fonctionner à la fin du mois. Touslesdispositift
de sécurité, notamment ceux destinés à parer aux fuites d'eau lourde, ont fonctionné correctement pendant
l'accident.
ПЕРВЫЙ ОПЫТ ПО ЭКСПЛУАТАЦИИ РЕАКТОРА NPD. Рассматривается первая ядерная электростанция
Канады, демонстрационная электростанция, предназначенная для испытания эксплуатационных качеств
станций канадского типа, использующих в качестве топлива природный уран, а в качестве замедли
теля и теплоносителя - тяжелую воду. 28 июня 1962 года эта станция достигла полной мощности.
Несмотря на то , что она проектировалась для раооты на базовой нагрузке, в течение первых стадий
139

140 L . g . M cCo n n e l l
она будет часть времени работать на высоких уровнях мощности и часть времени - на пониженных
мощностях для в-несения усовершенствований. До сих пор наблюдался прогресс; первый период работы
на высокой мощности в течение шести недель дал коэффициент использования на мощность, равный 70^.
Улучшения, которые были достигнуты, увеличили безопасность, повысили эксплуатационные харак
теристики и продемонстрировали потенциальные методы снижения капитальных затрат для будущих стан
ций. Так, например, в целях улучшения эксплуатационных качеств были видоизменены уплотнения
валов на насосах охладителя первого контура; оборудование типа холодильников, использовавшееся
для регенерации пара, было заменено поглощающими колонками с целью уменьшения потери пара в тя
желой воде. Устанавливаются также ограничители потока воды в линиях для взятия проб с целью
уменьшения потери тяжелой воды в случаях неисправностей в соединениях.
В декабре 1962 года две одновременные утечки из машины, производящей загрузку топлива, при
вели к необычному обстоятельству, при котором значительное количество горячей тяжелой воды под
высоким давлением попало в камеру реактора, где произошло незначительное уменьшение ее изотопной
чистоты, которая затем была превышена и реактор был вновь пущен в конце месяца. Во время аварии
все устройства по безопасности работали точно и обеспечили удержание тяжелой воды.
EXPERIENCIA INICIAL DE FUNCIONAMIENTO DEL REACTOR NPD. La primera central nucleoeléctrica
del Canadá, NPD, constituye una instalación de demostración, destinada a comprobar el funcionamiento de
los reactores alimentados con uranio natural y moderados y refrigerados por agua pesada. Alcanzó su régimen
normal de potencia el 28 de junio de 1962. Aunque ha sido disenada como central para la carga básica, en
las primeras fases funcionará en parte como central para la carga de cresta, lo que permitirá introducir mejoras
durante los periodos de paro. Los resultados obtenidos hasta el presente fueron satisfactorios-, el primer ensayo de
explotación, que duró seis semanas, permitió alcanzar un factor de potencia del 70%.
Los perfeccionamientos introducidos han permitido mejorar el grado de seguridad y el rendimiento, y han
revelado la posibilidad de reducir los gastos de inversión en centrales futuras. Por ejemplo, se han modificado
las empaquetaduras de las bombas del circuito primario de refrigeración para alcanzar mayor rendimiento; el
equipo de recuperación de vapor por congelación ha sido sustituido por columnas de absorción a fin de reducir
las pérdidas de vapor de agua pesada; se están instalando limitadores de flujo en algunas tuberías para disminuir
las pérdidas de agua pesada en el caso de averias en las juntas.
En diciembre de 1962, dos escapes simultáneos que se produjeron en el aparato de realimentación del
reactor en marcha dieron origen a una serie de incidentes poco comunes; una cantidad considerable de agua
pesada a alta presión y temperatura se derramó en el recinto del reactor, alterándose ligeramente su pureza
isotópica. Luego de purificarse el agua, el reactor pudo reiniciar su funcionamiento a fines del mes. Todos
los dispositivos de seguridad y en especial los destinados a evitar los escapes de agua pesada funcionaron correc-
tamente durante el incidente.
Canada's first nuclear-electric station, the "Nuclear Power Demon
stration" station, is intended to demonstrate the Canadian type of station
which utilizes natural uranium as fuel and heavy water as both'moderator
and coolant. In particular, the station is intended to demonstrate high base
load capacity, continuity of service and safety. In addition, it is providing
information applicable to the design, construction and operation of similar
but larger nuclear-electric stations including information on fuel-element
performance, fluid loss, power regulation, response to load demand, res
ponse to system disturbances, reliability of components, operating techniques,
maintenance methods and last but not least "cost data" all of which will add
to the 20 yr of Canadia experience with this type of reactor.
First electricity was generated on 4 June 1962 followed by a smooth
increase to full power on 28 June 1962. Next, the station was subjected
to performance trials with associated modifications and the station was de
clared "In-Service" on 25 September 1962.
In this presentation, a brief description of the station is given first for
those persons not familiar with the design. The following subject matter
deals primarily with the commissioning and early operation.

NO
T D
IREC
TLY
AC
CES
SIBL
E __
____
_И
____
____
____
AC
CES
SIBL
E D
UR
ING
_H__
____
____
__
AC
CES
SIBL
E D
URI
NG
O
PER
ATI
ON
SHU
TDO
WN
INITIAL OPERATING EXPERIENCE 141
Desc
ripti
on
of
the
NPD
R
EA
CT
OR

142 L.G . M cCo n n e l l
The heat generated in the reactor is transported to the boiler using
heavy water as the heat transport agent. The boiler is essentially a heat
exchanger and steam drum in which steam is generated from ordinary water
to drive the turbine-generator.
The reactor utilizes an aluminium tank called the calandria. This tank,
approximately 4.6 m (15 ft) long and 5.2 m (17 ft) in diam, holds the heavy-
water moderator and is arranged, with its longitudinal axis in the horizontal.
Through this tank run 132 horizontal, aluminium tubes through which are
inserted zirconium-alloy pressure tubes. Each pressure tube is loaded
with 9 fuel bundles with each bundle containing about 15 kg (33 lb) of uranium
dioxide. The total fuel charge is approximately 17.8 t (metric) of uranium
dioxide.
Heavywater, pressurized to 28 kg/cm2 (1050 lb/in2 gauge), is increased
in temperature from 252°C (485°F) to 275°C (бЗОТ1) as it passes through
the pressure tubes. Steam is generated from ordinary water at a pressure
of 28.8 kg /cm 2(410 lb/in2 gauge) and a temperature of 232°C (450°F).
The dry and saturated steam is used to generate approximately 20 000 kW net electricity.
The control system does not require any moving parts in the reactor.
The heavy-water moderator is supported in the calandria by a helium gas
differential pressure provided by blowers. Power regulation is achieved
by varying the differential gas pressure which in turn determines the heavy-
water level. The reactor power is thus regulated through control of neutron
leakage.
To shut down the reactor, the helium pressure differential is reduced
to zero by opening helium dump valves, thereby dumoine the moderator into tne dump tanK. The automatic protective system, which initiates such
a dump, includes 22 trip (scram) functions and utilizes the "2 out of 3"
method. The dump valves, regulating valves and blowers are readily ac
cessible with the reactor shut-down.Two fuelling machines are utilized to change fuel as illustrated in Fig. 2.
One fuelling machine pushes new fuel bundles into one end of a pressure tube and spent bundles are at the same time pushed into a fuelling machine coupled on to the other end of the same tube. These fuelling machines are
operated from the control room and are intended to change fuel under on-
power conditions.
COMMISSIONING
The commissioning programme was classified into four time phases:
Phase A — Pre-critical
Phase В — Low-power reactor measurements
Phase С — Power run-up
Phase D — Full power tests
The Phase A work started before construction was complete. During
the early part of this period the service systems such as water, compressed
air, electricity and ventilation were placed in operation.
DESCRIPTION OF STATION (see Fig. 1)
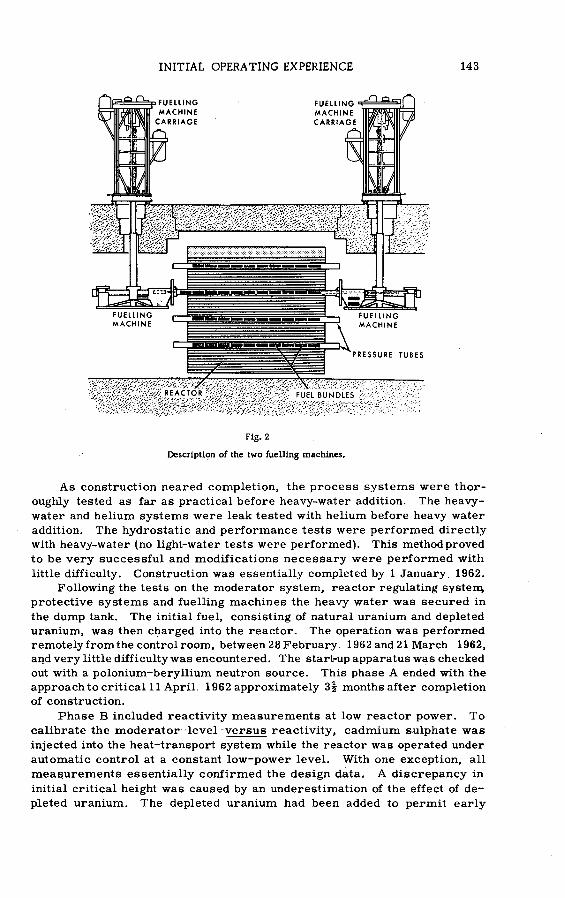
INITIAL OPERATING EXPERIENCE 143
Fig. 2
Description of the two fuelling machines.
As construction neared completion, the process systems were thor
oughly tested as far as practical before heavy-water addition. The heavy-
water and helium systems were leak tested with helium before heavy water
addition. The hydrostatic and performance tests were performed directly
with heavy-water (no light-water tests were performed). This method proved
to be very successful and modifications necessary were performed with
little difficulty. Construction was essentially completed by 1 January. 1962.
Following the tests on the moderator system, reactor regulating systeni
protective systems and fuelling machines the heavy water was secured in
the dump tank. The initial fuel, consisting of natural uranium and depleted
uranium, was then charged into the reactor. The operation was performed
remotely from the control room, between 28 February 1962 and 21 March 1962,
and very little difficulty was encountered. The start-up apparatus was checked
out with a polonium-beryIlium neutron source. This phase A ended with the
approach to critical 11 April. 1962 approximately months after completion
of construction.
Phase В included reactivity measurements at low reactor power. To
calibrate the moderator level versus reactivity, cadmium sulphate was
injected into the heat-transport system while the reactor was operated under
automatic control at a constant low-power level. With one exception, all
measurements essentially confirmed the design data. A discrepancy in
initial critical height was caused by an underestimation of the effect of de
pleted uranium. The depleted uranium had been added to permit early
144 L. g . M cCo n n e l l
operation at full power and the reasons for this discrepancy have now been
fully resolved. This phase ended on 8 May 1962 taking approximately 1
month.
During Phase C, the reactor was operated at power levels of 6%, 10%,
25%, 50%, 75% and 100% during which tests were performed to establish dynamic
performance of the reactor-boiler and turbine-generator. Also measure
ments were conducted to establish the adequacy of cooling, shielding, re
combination, etc. Generally, the power run-up went quite smoothly and
no major difficulties were encountered. First electricity was generated
4 June and full power was reached 28 June 1962.
During Phase D (power tests), the station was modified to eliminate
a number of early problems which caused poor performance. The station
was declared In-Service on 25 September 1962. At this time, the fuelling
machines had only been used for off-power fuelling and development work for
on-power fuelling was still in progress.
Although the commissioning programme went smoothly, a number of
problems were encountered as is usual with a new station. The following
are a few items arbitrarily selected for discussion.
One of the problems encountered was achieving adequate leak-tightness
of the vault ventilation system. Numerous leaks were encountered through
and around wall penetrations. Several techniques were used to correct such
leaks but, without doubt, the use of epoxy and fibreglass was most success
ful in achieving an acceptable leak rate of 40 1/min.
Gas locking of the moderator pumps was caused by helium entrainment
when the dump tank was operated at low level. This problem was corrected
by spilling the heavy water into the end of the dump tank permitting the gas
to evolve before reaching the pump suction at the centre of the tank.
Heavy water in the heat-transport system is cooled and depressurized
before passing through ion-exchange columns for purification. Gas locking
was experienced in the charging pumps which return the purified heavy water
back into the pressurized system. This problem was caused by the reduction
in solubility of helium with reduced temperature and pressure conditions.
This was corrected by providing degassing facilities.
The high-pressure heavy-water systems are generally fabricated using
carbon steel piping and instrument tubing. This method has proved good
with one exception, where they were cast into concrete and exposed to
water permeating into cracks surrounding the tubes. Such tubes were re
placed with stainless steel.
Ice plugs have been extensively used to isolate heavy-water lines where
no valves have been provided. Such plugs can be made quickly, effectively
and inexpensively using liquid nitrogen, solid C O 2, plastic sheeting and
paper tape.
One major weakness identified during commissioning was poor quality
workmanship in the mechanical joints of heavy-water instrument tubing.
This problem can be avoided by adopting proper quality control methods
for mechanical joints as stringent as those required for welded joints.
No measureable reduction in the isotopic content of the heavy water
took place in either the moderator or heat-transport system due to down
grading during commissioning. The total inventory of heavy water required
INITIAL OPERATING EXPERIENCE 145
was 74400kg (164 0001b) as contrasted with the original estimate of 72 600 kg (160 0001b). The total loss during the commissioning period was 5.4%which
is considered economically acceptable and less serious than that predicted.
The major loss during commissioning was caused by chronic vapour loss from numerous small leaks rather than acute spills. The heavy-water loss averaged 16 kg/d (35 lb/d) in the early stages of operation.
OPERATION
The station is designed as a base-load unit with an 80%-capacity factor
objective. Therefore, it is necessary to operate the station for continued
periods to obtain meaningful statistical data. Alternately, we consider it
vital to deliberately shut down the station to incorporate modifications aimed
at improved performance, safety etc. and to obtain further test data. Be
cause these two requirements are not naturally compatible, we alternate
between "capacity runs" and "improvement/test periods" to satisfy both
objectives.
A capacity factor of 70% was achieved during the first 6 weeks capacity
run from 1 October 1962 to 12 November 1962. Approximately half of the
lost production was due to the reactor-boiler and half was due to a problem
with the emergency stop valves on the turbine generator.
On 3 December 1962 a major problem was encountered during on-power
proof testing of the refuelling machines. Two simultaneous leaks developed
on one of the machines, one at the point where the machine connects to the
reactor pressure tube and the other in one of the hydraulic control lines of
the machine itself. Because of the first leak, hot high-pressure heavy-water
coolant was released into the reactor vault, and because of the second the
machine could not be moved to rectify the first. Gratifyingly, the automatic
spray of cold heavy water into the reactor vault was actuated in just the
fashion intended to reduce vault pressure in such emergencies, and indeed
all safety devices and provisions for containment of heavy water performed
successfully. Although the spilled heavy water suffered a small downgrading
in isotopic purity, operation was resumed at the end of December. Further
on-power trials are scheduled for mid-1963.
A capacity factor of 100% was achieved during the second 6 weeks
capacity run from 12 February 1963 to 25 March 1963. Further operation
is required to establish statistically significant conclusions. However, we
have no reason to believe that we will not meet or exceed our capacity factor target of 80%.
At the time of preparing this paper, we were in the second improvement/ test period which started on 25 March. 1963. Some of the problems re
quiring solution are discussed later. The following is a general discussion
of the behaviour of the station.
The average burn-up of the fuel is too low to demonstrate ultimate per
formance. To date, with a maximum burn-up of 1842 MWd/t, no fuel has
failed.
Exclusive of the incident associated with the development of on-power
fuelling mentioned earlier, the loss of heavy water has been favourable.
Continued improvements have reduced the chronic leakage from 16 kg/d (35 lb/d)
10

146 L. g . M cCo n n e l l
to approximately 5.5 kg/d (12 lb/d) which we find economically acceptable.
Further improvement is expected, the current target being 2.2 kg/d (5 lb/d)
which amounts to 1% of the total inventory per annum.
It is beyond the scope of this paper to discuss the design and detailed
operation of the power regulating equipment. However, to convey the general
kinetic behaviour, a start-up is described following a shut-down of 2 to 7 d
in duration. Further, let us assume that the moderator is down in the dump
tank and the heat transport system is cold and at a temperature of 38° С
(100T).
First, the heavy-water level is automatically raised to a preset level
of 183 cm (72 in) which is well below critical for any combination of circum
stances. At this point, the ion-chamber currents are checked and typically
are found to have increased to 10"6 full power. The neutron current, at this
stage, is primarily due to the subcritical multiplication of the photoneutron
source from the D 2(7 , n) H 1 reaction. This stage is completed at approxi
mately 7 min after start-up.
The design does not provide for àutomatic start-up below 10"5 full power.
Therefore, the second step in the start-up is to raise manually the heavy-
water level until criticality is reached and power is 10"5 full power. This
operation can be performed very smoothly because of the combined effects
of good heavy-water level regulation, the photoneutron source and the effect
of delayed neutrons. During this period of time, the power change is limited
to an e folding rate of 100 s (trip 10 s). This corresponds to an excess re
activity of 1 mk (keff = 1.001). This operation is performed very carefully,
although the rate of rise is inhibited by delayed neutrons for small reactivity
excursions and by the relatively long neutron lifetime (10'as) in a heavy-
water moderator and the negative power coefficient of 5 mk between zero
and full power. Next the power is raised to 10"3 of full power, the auto com
puter is checked for response and the control is transferred to automatic
low-power regulation. This stage is typically completed about 15 min after
start-up.
The third step in starting the reactor is to place the reactor on "auto
matic high power" regulation. The power is initially raised to a preset
value of 6% full power as this corresponds to that required to heat the
equipment and piping in the heat transport system at the limiting rate of
110°C/h (200°F/h). This condition is typically reached 20 min after start-up.
At this time the heat transport system will be at 52°C (125'T’) due to pre
vious heating by the pumps.
As the system is heated, the pressure in the boiler is gradually in
creased. To minimize the total start-up time, the turbine generator is pre
pared for operation in parallel with the raising of pressure in the boiler. The
nitrogen blanket in the boiler is purged to atmosphere and the steam mains
are heated through bleed valves. All operations are performed from the
control room.
The pressure in the boiler is approximately 19.3 kg/cm2 (275 lb/in2 gauge)
1 h 20 min after start-up and steam is admitted to roll the turbine and raise
vacuum. The reactor power automatically increases to sustain the maxi
mum heating rate of 110°C/h (200"F/h). Half an hour later the overspeed
tests are performed. Two hours after start-up the heat-transport system
is at 235°C (455°F) and the boiler pressure is 28.8 kg/cm2 (410 lb/in2 gauge).

INITIAL OPERATING EXPERIENCE 147
The turbine generator is then synchronized with an initial load of 2 MW(e).
The power is then raised at 1 MW(e)/min thereby reaching a maximum per
missible power of 12 MW(e) at time 2 h.12 min. Full power of 22 MW(e)
(gross) cannot be reached until the xenon fission product reaches near
equilibrium at approximately 30 h after start-up. The lost production during
start-up after a long shut-down is approximately 0.4 full power days.
The station can be restarted to full power in approximately 25 min after
a trip has taken place and the fault corrected. Under emergency conditions,
the heat-transport system can be cooled and depressurized in approximately 30 min.
Under normad conditions, the electrical output, system pressures, system
temperatures, reactor flux and moderator heavy-water level are very stable.
For example, the boiler pressure varies by less than±0.1 kg/cm2(1.01b/in2
gauge) and the electrical output can easily be maintained to±0.05 M W .
The electrical output can be changed at the design rate of 20% full
power/min without difficulty. The station can over-ride most disturbances
such as change-over of pumps, changing temperature controller set points,
line voltage changes, line frequency changes, on-power regulating channel
tests, on-power emergency stop valve tests, on-power dump valve tests
etc. However, further improvements are required to withstand the following
three major disturbances:
(a) Turbine overspeed trip — the turbine can handle a loss of line but trips
out on full load rejection of generator.
(b) Reactor overpressure trip — the reactor trips out on both generator
rejection and loss of line due to a small transient overpressure in the
surge tank.
(c) Reactor undervoltage trips — on major transmission line faults where
the 13.8 kV voltage drops to 10 kV, the reactor trips out on undervoltage
due to fail-safe protective relays.
Such large disturbances occur infrequently. Nevertheless, we antici
pate no major difficulty in correcting these problems and it is our intention
to demonstrate the ability of the station to stay on line under such circumstances.
The following are a few technical highlights associated with operation
since the In-Service date.
In the very early operation, the reactor tripped frequently because the
reactor regulating system was not adequate to cope with minor disturbances.
The major cause of this trouble was traced to a non-linear characteristic
in the ion-chamber amplifiers. Today the regulating system is giving top
performance and provides excellent response and stability. There were no interruptions of power during the second six weeks capacity run.
The moderator pumps and helium blowers employ multiple shaft seals.
The outboard seals are in contact with oil and the inboard seal is of course
in contact with heavy water. A labyrinth is provided between the inboard
and outboard seals to separate the heavy water and oil-seal leakage. The
interspace does not effectively separate oil and heavy-water leakage as in
tended and, as a result, oil was being added to the moderator system. Be
cause of this oil converted to acid under irradiation, the ion-exchange co
lumns in the moderator system were being consumed at the rate of one per
day rather than at the design rate of one per 4 months. This problem has
been temporarily solved by removing the oil before pumping the collected

148 L.G . M cCo n n e l l
heavy water back into the system. An improvement is planned to eliminate
the oil mixing in the first place.
In the early operation, the mechanical shaft seals of the primary pumps
typically lasted 200 h, which was entirely unacceptable. Improved degassing
and venting techniques have already increased the life to more than 1500 h
and we expect to demonstrate seal life in excess of 7000 h within the next
two years.
The original poor workmanship on mechanical tubing joints still con
tinues to worry us in N PD even though we know how to avoid this problem
in a new installation. Further changes are planned to correct this situation,
in view of the possibility of potential acute loss, not because of chronic vapour
loss.
Although the proving of on-power fuelling has been delayed, the station
performs acceptably with off-power fuelling and we are confident that on-
power fuelling will be satisfactorily demonstrated this year for this type
of station.
A chemical deposit was found on the spindle of the turbine emergency
stop valves. This of course is not acceptable as it can result in seizure
of the valves. The problem was not caused by the chemical quality of the
steam but was due to the accumulation of trace quantities being deposited
from the steam leaking off along the valve spindle. As the nearly dry steam
reduced in pressure, it became superheated and deposited the trace chemicals
on the spindle. It was corrected by utilizing a backseat which eliminated
the steam leak-off.
Initially, a freezer-dryer was provided to prevent loss of heavy water
from the vault ventilation system to the stack. A chemical sorber (electri
cally reactivated) which is less expensive than the freezer-dryer, is now
being used and gives trouble-free operation.
Some problems still exist, further improvements are anticipated, and
we await further performance information and cost data. However, chronic
heavy-water losses have been gratifyingly low, costs of operation and main
tenance have been close to the estimate and because the early performance
has been most encouraging our programme is proceeding with even greater
confidence.
D IS C U S S IO N
S. YIFTAH: There has been some mention in the literature of an "up
rated N P D ", i. e. a plant which, based on the N P D design, could produce about 80 MW(e) with only minor changes. Could you give us any further
information?
L .G . M cCONNELL: The Canadian General Electric Company has per
formed a design study with the object of uprating NPD to 80 MW(e). I cannot
give you precise data, but I am sure the company could provide information.
Génerally speaking, the fuel rating and the number of fuel channels have
been increased, the flux is flattened, and more 19-rod fuel elements are
to be installed.
S. YIFTAH: You mentioned that NPD has been in service since 25 Sep
tember 1962, i. e. about eight months. Since it was intended to beaproto-
type for the 200-MW(e) CANDU, could you give us some details about the

INITIAL OPERATING EXPERIENCE 149
latter reactor ? I should particularly like to know what stage of con
struction has been reached, and whether any changes have seemed advisable
in the light of experience with NPD.
•L. G. M cCON N ELL : The process equipment is now being installed in
the C A N D U plant. Commissioning will get under way next year and the
station should reach full power in mid-1965. Manufacturing, design, con
struction and commissioning experience gained at N P D has been turned to
good account at CANDU, although the construction of the larger plant is
already sofar advanced that some of our experience —especially in operation —
may come too late to influence its design.
The latest estimate of nuclear fuel cost for the CANDU reactor — con
sidered to be quite conservative — is in the range of 1.01 mill/kWh, based
on a burn-up of approximately 9000 MWd/t of uranium.
S. Y IFTAH : The economic viability of heavy-water reactors is pre
sumably very dependent on the price of heavy water. Some mention has
been made of Canadian D2O production at $ 22/lb, which is about $2 less
than the United States price. Could you tell us what the situation is now?
L. G. M cCONNELL: Atomic Energy of Canada Ltd. has invited tenders
for the construction of a heavy-water plant in Canada, and it has been
stipulated that the price must not exceed $22/lb; on the other hand, the com
pany has agreed to give certain minimum purchase guarantees. The price
of heavy water is important, certainly, but I doubt whether it would "make
or break" a D2O reactor.
.H .J . BRÜCHNER: A m I right in thinking that no heavy-water produc
tion plant is yet operating in Canada? If so, how can you specify the price?
L. G. M cC O N N E LL : Yes, you are quite right. Tenders have been
solicited, as I said before, and it is up to the concerns submitting tenders
to calculate the capital investment and quote a price at which they would
be prepared to deliver D 2O for a guaranteed period of time,
M . R. SRINIVASAN: Could you tell us something more about the on
load fuelling tests? If I understood you properly, the difficulties that cropped
up in December 1962 during on-load testing of the refuelling machines were
fairly serious. Do you expect to sove them satisfactorily in the near future?
L. G. M cCONNELL: We still look forward to on-load fuelling with con
siderable optimism, and the difficulty that arose in December 1962, though
serious, was the only one. In fact, we hope that on-load fuelling will be
demonstrated later this year. Even so, off-load fuelling in the NPD reactor
has worked very well.
K. EFFA T : Could the figures on heavy-water losses in NPD be extra
polated to the CANDU reactor, and have you estimated probable heavy-water
losses in the CANDU plant?
L. G. M cCONNEL: I can do no more than venture an opinion. N PD is
a 20-MW(e) plant, and the information we now have on heavy-water losses
is accurate to within a factor of 3. Certain methods of reducing these losses
have been discovered but not yet applied to NPD. Needless to say, all the
knowledge we have gleaned from N P D will be applied, insofar as that is
possible, to thé 200-MW(e) CANDU plant. You can imagine, however, that
there will be considerable scope for differences of opinion when it comes
to extrapolating N P D results to CANDU . Estimates of heavy-water loss

150 L .g . M cCo n n e l l
from CANDU now vary from 10 to 48 lb per day, including chronic as well
as average acute loss, and the average equivalent cost of upgrading resul
ting from periodic spills. A loss of 10 lb per day corresponds to a unit
energy cost of approximately 0.008 cents (Canadian) per kWh.

THE ENRICO FERMI ATOMIC POWER PLANT
R .W . HARTWELL POWER REACTOR DEVELOPMENT COMPANY,
DETROIT, MICH.
Abstract — Résumé — Аннотация — Resumen
THE ENRICO FERMI ATOMIC POWER PLANT. Construction of the Enrico Fermi Atomic Power Plant,
which utilizes a 100 MW(e) fast breeder reactor, was essentially completed in December 1961. During the
past eighteen-month period, systems and components have been extensively tested. This pre-operational
test programme has proved most valuable in verifying the design and in indicating needed modifications.
All the problems encountered have proved manageable. The more important modifications are summarized.
Graphite shielding. In December 1960, the primary system was filled with sodium, and extensive testing
began. When the primary shield tank was reopened after a 1000eF primary system test, it was found that much
of the graphite block shielding which had been installed around the reactor had deteriorated. These high-
temperature blocks which were impregnated with boron had increased in volume and lost strength. Extensive
analysis indicated that the graphite binder had failed.
It was decided to replace all of the graphite, to use boron carbide as the boronating agent, to install
the block with mechanical fasteners, and to keep moisture to a minimum.
Modifications within the reactor vessel. Repairs and design modifications were made to correct the cause of
sub-assembly sticking, the damage which resulted, and to prevent further malfunctions of the offset handling
mechanism.
In ocder to make repairs and alterations, the offset handling mechanism was removed, the reactor vessel
was drained of sodium, and trained personnel wearing specially designed protective suits entered the reactor
vessel. Entrance to the work area was through a special air lock since an argon atmosphere was maintained
inside the vessel.
Steam generator modifications. During hydrostatic testing of the No. 2 steam generator, several leaking tubes
were discovered. Tube failure was traced to stress corrosion cracking. The No. 2 bundle was retubed, all
units were stress relieved, and a hydrogen detector system was installed.
In December 1962, a sodium-water reaction took place in the No. 1 steam generator. The rupture
disc, which was installed for such an eventuality, operated correctly. The cause and effect of this failure is
currently being investigated.
Completion of pre-operational testing. Anticipating the issuance of a low power licence, the final assembly
and test programme is being completed in March.
LA CENTRAIS NUCLEAIRE ENRICO FERMI. La construction de la centrale nucléaire Enrico Fermi,
équipée d'un réacteur surgénérateur à neutrons rapides de 100 MWe, a été virtuellement terminée en
décembre 1961. Au cours des derniers 18 mois, on a minutieusement vérifié les circuits et les parties consti
tutives. Ce programme de vérifications avant la mise en service a été très utile pour vérifier les plans et
déterminer les modifications à y apporter.
Tous les problèmes ont pu être résolus. Voici la liste des principales modifications:
Bouclier de graphite. En décembre 1960, on a rempli le circuit primaire de sodium liquide et on a procédé à
1 des essais très poussés. Lorsqu’on a rouvert l’enceinte de protection primaire, après les essais à 540°C, on a
constaté que la plus grande partie des blocs de graphite entourant le réacteur s'était détériorée. Ces blocs,
destinés à supporter de hautes températures, étaient imprégnés de bore; ils s'étaient dilatés et avaient perdu
leur résistance. Une analyse approfondie a montré que le liant du graphite avait cédé.
On a décidé de remplacer tout le graphite, d'utiliser du carbure de bore à la place du bore, d'assujettir
les blocs par des dispositifs mécaniques et de maintenir l'humidité à la valeur minimum.
Modifications à l'intérieur du caisson du réacteur. On a procédé à des réparations et modifications pour suppri
mer la cause du collage des barreaux et les dommages qui en résultaient, et pour prévenir d'autres défaillances
du mécanisme de manutention des cartouches.
151
152 R. W. HARTWELL
Pour ce faire, on a dû retirer le mécanisme de manutention et vider le caisson contenant le sodium. Des
spécialistes, portant des vêtements de protection spéciaux, ont pénétré dans le caisson. On entrait dans la zone
de travail par.un sas spécial, car on maintenait une atmosphère d'argon à l’intérieur du caisson.
Modifications aux générateurs de vapeur. Au cours des essais hydrostatiques du générateur de vapeur № 2, on
a constaté que plusieurs tubes fuyaient. La défaillance des tubes résultait d'un fendillage provoqué par la
corrosion sous contrainte. On a donc remplacé les tubes du générateur №>2, on a fait disparaître les con
traintes auxquelles étaient soumises les pièces et on a installé un dispositif détecteur d'hydrogène.
En décembre 1962, il s*est produit une réaction sodium-eau dans le générateur de vapeur № 1. Le
disque de sécurité installé en prévision d'une telle éventualité a bien fonctionné. On cherche actuellement
la cause et les effets de cette défaillance.
Fin des essais avant la mise en service. Dans l'attente d'un permis d'exploitation à basse puissance, on termine
le montage et le programme d'essais (mars 1963).
АТОМНАЯ ЭЛЕКТРОСТАНЦИЯ им. ЭНРИКО ФЕРМИ. Строительство атомной электростанции им. Энрйко
Ферми с реактором-размножителем на быстрых нейтронах мощностью 100 мгвт (э л .) было в основном
закончено в декабре 1961 года. В течение последних 16 месяцев проводились широкие испытания
систем и компонентов. Эта предпусковая программа испытания оказалась очень полезной для про
верки конструкции и для определения необходимых изменений.
Все возникшие проблемы оказались разрешимыми. В докладе кратко освещаются наиболее ватные
изменения.
Графитовая защита. В декабре 1960 года первый контур был заполнен натрием и были начаты широ
кие испытания. Когда был снова открыт защитный бак первого контура после испытания первого кон
тура при температуре 1000°F, было обнаружено, что большая часть графитового блока защиты, .уста
новленного вокруг реактора, повреждена. Высокотемпературные блоки, насыщенные бором, увеличились
в объеме и потеряли прочность. Проведенный тщательный анализ показал, что графитовая связь по
вреждена .
Было решено заменить весь графит, использовать карбид бора в качестве соединения, содер
жащего бор, установить блок с помощью механического крепления и довести влажность до минимума.
Изменения в корпусе реактора. Был проведен ремонт и внесены изменения в конструкцию для устра
нения причины заедания сборок, для ликвидации повреждения, которое явилось результатом этого,
и для устранения в дальнейшем неисправности в перемещающем механизме управления.
Перед ремонтом был удален перемещающий механизм управления, корпус реактора был осушен от
натрия. После этого подготовленный пероонвл в специальных защитных костюмах был допущен внутрь
корпуса реактора. Вход в рабочую зону обеспечивался с помощью специального- воздушного шльза,
поскольку в корпусе реактора имелся аргон.
Изменения парогенератора. Во время гидростатических испытаний парогенератора К 2 были обнару
жены течи в нескольких трубках. Причиной неисправности трубок было их растрескивание в резуль
тате коррозии от напряжения металла.
Узел № 2 был снабжен новыми трубками, все секции были освобождены от напряжения, и была
установлена водородная детекторная система.
В декабре 1962 года в парогенераторе ffi 1 произошла реакция натрий - вода. Диск разрыва,
который был установлен на такой случай, работал правильно. В настоящее время исследуются при
чины и влияние этого повреждения.
Завершение предпусковых испытаний. Планируется закончить в марте программу окончательной сборки
и испытаний в ожидании выдачи лицензии на эксплуатацию реактора на малой мощности.
LA CENTRAL NUCLEOELÉCTRICA ENRICO FERMI. La construcción de la central nucleoeléctrica
Enrico Fermi, que está equipada con un reactor reproductor de neutrones rápidos de 100 MW(e), quedó prácti
camente terminada en diciembre de 1961. En el curso de los últimos 18 meses se han verificado minucio-
sámente los circuitos y partes constitutivas. Este programa dt. ensayos preliminares ha resultado en extremo
útil para comprobar la idoneidad del diseflo y obtener indicaciones sobre las modificaciones necesarias.
Todos los problemas con que se tropezó pudieron solucionarse. A continuación figura la lista de las
principales modificaciones introducidas en la construcción de la central.
Blindaje de grafito. En diciembre de 1960 se llenó de sodio el sistema primario, y se dio comienzo a una
amplia serie de ensayos. Cuando se volvió a abrir el recinto primario de protección después de someter este
sistema a una temperatura de 540°C, se comprobó que gran parte de los bloques de grafito que rodean al

THE ENRICO FERMI PLANT 153
reactor se había deteriorado. Esos bloques para altas temperaturas estaban impregnados con boro; se habían
dilatado y perdido resistencia. Un análisis detenido puso de manifiesto que el agente aglomerante del grafito
había cedido.
Se decidió sustituir todo el grafito, utilizar carburo de boroen vez de boro, sujetar los bloques con
dispositivos mecánicos y reducir al mínimo la humedad.
Modificaciones en el interior del recipiente del reactor. Se realizaron reparaciones y se introdujeron modifi
caciones en el diseflo a tin de evitar la adherencia de los subconjuntos y el dallo resultante, así como para
prevenir otras fallas del mecanismo de manejo de los elementos combustibles.
Para ello, se desmontó el mencionado mecanismo y se extrajo el sodio del recipiente del reactor. Per
sonal especializado que vestía trajes protectores especiales penetró en el interior del recipiente a través de
una esclusa neumática especial, ya que en el interior del recipiente se mantenía una atmósfera de argón.
Modificaciones en los generadores de vapor. Cuando se realizaron loe ensayos hidrostáticos del generador
de vapor №2, se descubrieron fugas en varias tuberías. Las investigaciones subsiguientes pusieron de manifiesto
que esa falla de las tuberías obedecía a un agrietamiento debido a la corrosión bajo tensión. Se cambiaron
las tuberías del generador № 2 , se eliminaron las tensiones de todas las unidades y se instaló un dispositivo
detector de hidrógeno.
En diciembre de 1962 el sodio reaccionó con el agua en el generador de vapor № 1. El disco de seguridad
instalado en previsión de tal contingencia funcionó correctamente. En la actualidad se están investigando las
causas y efectos de esa falla.
Terminación de los ensayos preliminares. A la espera de un permiso de explotación a baja potencia, se está
terminando el montaje y el programa de ensayos (marzo de 1963).
Pre-operational testing of the Enrico Fermi Atomic Power Plant has been successfully completed. Construction of the plant which utilizes a
200 MW(t) fast-breeder reactor was essentially completed in December 1961.
During the past eighteen-month period, systems and components have been
extensively tested.
A far more extensive pre-operational test programme was initially
planned for this project than has been customary with more conventional
ieactors. This decision proved to be a wise one. Major portions of the
plant have in effect been operated (without nuclear fuel) for almost two years.
This operation has served the dual purpose of verifying the adequacy of the
basic design and its major components and of exposing difficulties requiring
design modification or other correction. The information derived from this
extensive programme should be invaluable to later generations of fast- breeder reactors. Accordingly, a major portion of this review is devoted
to this topic. The attention given to analysis of the difficulties exposed and
of the way in which they have been corrected, however, should not obscure
the basic fact that the fundamental design has been found satisfactory and that all
troubles have proved capable of solution. An operating licence has been
issued by the Atomic Energy Commission (AEC). Final inspection by the
A E C has now been completed, and nuclear testing is about to start.
During the test period, all of the plant systems have been in operation,
some for a few weeks and others, such as the primary sodium system, for
longer periods of time — approaching two years. Delays were encountered
as the pre-operation tests were being run, which involved the installation
of systems and, in some cases, the installation of equipment. Considerable
interest has been exhibited in the test results, the modifications made, and
the method used in making the modifications.

154 R.W. HARTWELL
PRDC undertook construction of the nuclear portion of the plant which
it will own and operate; whereas The Detroit Edison Company designed, con
structed, and will operate the conventional facilities. The reactor plant
was designed by Atomic Power Development Associates, Inc. (APDA) with
Commonwealth Associates, Inc. serving as architect-engineer. United
Engineers & Constructors Inc. had responsibility of construction engineer
for the entire plant.
A large portion of the research and development for the reactor plant
amounting to more than 025 million was financed and directed by APDA and
PR DC . The AEC under their Civilian Power Demonstration Reactor Pro
gram provided important research and development assistance costing
approximately 03 million.
P L A N T DESCRIPTION
The Fermi Plant, shown in Figs. 1 and 2, is built on a 915-acre site
located 30 miles southwest of Detroit on the westerly shore of Lake Erie.
PR OJEC T ORGANIZATION
Ï Ï
Fig. 1
Aerial photograph of Fermi Plant - west side

THE ENRICO FERMI PLANT 155
Fig. 2
Aerial photograph of Fermi Plant - east side
The construction area measures 15 acres, and the exclusion area on the
land side has a radius of 3200 ft.
Schem atic diagram
Liquid sodium is used as both primary and secondary cooj>ant. Design
power for the first type of fuel loading to be used is 200 MW(t) (65. 9 MW(e)),
although the equipment installed is capable of removing the full design power
of the reactor which is 430 MW(t) (156 MW(e)).
The flow diagram. Fig. 3, shows schematically the arrangement of the
reactor and primary sodium systems within the reactor building, the secondary
sodium system which transports heat from heat exchangers to the steam
.generators, and the turbine-generator facility. Table I lists liquid metal
and steam plant conditions for initial operation with the uranium 10 wt.%
molybedenum alloy Core A .
Cross-section of reactor building
The relative position of major reactor components, piping, and shielding
is shown in the cross-section of the reactor containment building, Fig. 4.

156 R. W. HARTWELL\
PUMP
' — INTERMEDIATE HEAT EXCHANGER‘—REACTOR
Fig.3
Flow diagram - Fermi Plant
TABLE I
LIQUID M E T A L AND STEAM PLA N T CONDITIONS
Net thermal efficiency 30.5
Primary sodium temperatures
Leaving reactor 800"F
Entering reactor 550°F
Sodium flow 8 570 000 lb/h
Secondary sodium temperatures
Entering steam generator 767*F
Leaving steam generator 517”F
Steam pressure 600 lb/in2 abs.
Steam temperature 764'F
Stainless steel is used throughout the primary system, and complete carbon
steel secondary containment is provided around this system. Neutron and
gamma shielding is designed so that access for operating and maintenance
personnel to the operating floor is normal, that is a full eight-hour shift.
Building dimensions are 120 ft in height, 51 ft of which are below'grade, and
72 ft in diam.
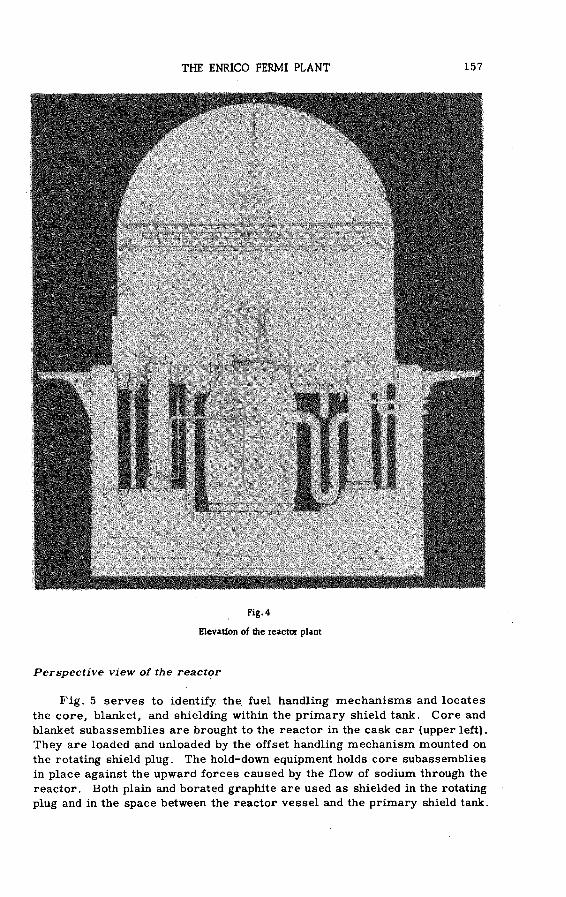
THE ENRICO FERMI PLANT 157
Fig. 4
Elevation of die reactor plant
Perspective view of the reactor
Fig. 5 serves to identify the fuel handling mechanisms and locates
the core, blanket, and shielding within the primary shield tank. Core and
blanket subassemblies are brought to the reactor in the cask car (upper left).
They are loaded and unloaded by the offset handling mechanism mounted on
the rotating shield plug. The hold-down equipment holds core subassemblies
in place against the upward forces caused by the flow of sodium through the
reactor. Both plain and borated graphite are used as shielded in the rotating
plug and in the space between the reactor vessel and the primary shield tank.

158 R.W. HARTWELL
Fig. 5
Perspective view of reactor
FUEL AND BLANKET DESIGN
The arrangement of core and blanket subassemblies within the reactor
vessel is shown in Fig. 6, a cross-section of the reactor. This diagram
shows the relative position of 870 removable units and the location of the
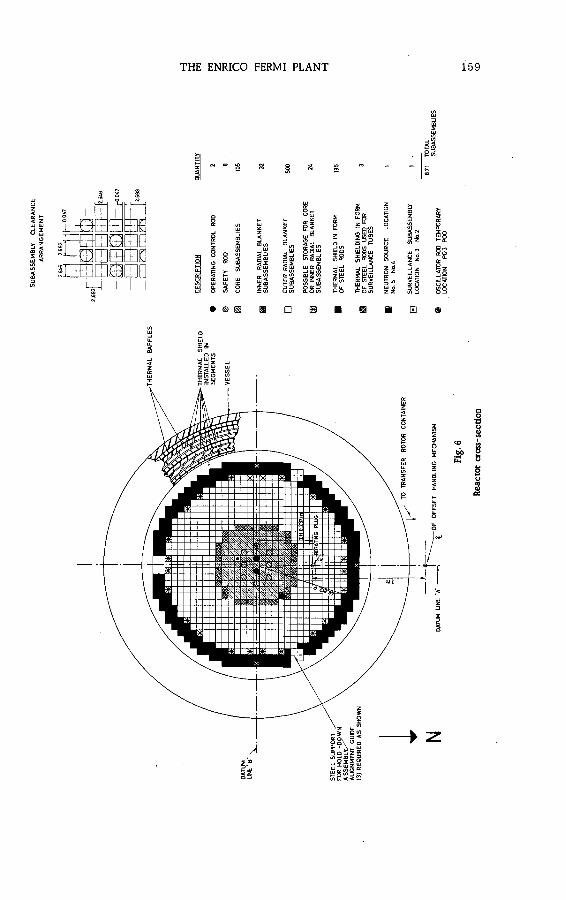
SUB
ASS
EMB
LY
CLE
AR
AN
CE
THE ENRICO FERMI PLANT 159
£</>
a 1/5 >
Я< (M
p
•dиЫ
83s

160 R. W. HARTWELL
eight safety and two operating control rods. It is to be noted that the core
region, in the central area of the reactor, is supplied by a high-pressure
plenum'whereas the blanket region in the adjacent area is supplied from a
lower pressure plenum.
Core subassem bly
There are 105 core subassemblies, pne of which is shown in Fig. 7. Each
assembly is composed of three sections — the core or fuel section in the
centre — and axial blanket sections at each end. All three sections are mechanically in'corporated into a single unit.
Core subassembly
Each of the two axial blanket sections (upper right enlargement) contains
16 uranium 3 wt.% molybdenum alloy rods, 0.396-in diam. , containing
uranium depleted to 0. 35% in U 235. These rods are enclosed and sodium-
bonded to 0. 010-in thick stainless-steel tubes having an outside diam. of
0.443 in.
The fuel section is made up of 140 uranium 10 wt.% molybdenum alloy
pins containing enriched uranium to 25. 6% in U235 . Each pin is clad with
0. 005 in of zirconium that is metallurgically bonded to the fuel alloy en
closed at the top and bottom with zirconium end caps. The pins are 32fg -in
over-all length and measure 0. 158 in in diam. They are maintained on a
THE ENRICO FERMI PLANT 161
square pitch of 0. 200 in in a support structure, referred to as a "birdcage, "
made of stainless-steel plates and "egg-crate" grids (lower left).
1000°F ISOTHERMAL TEST AND ITS RESULTS
In December 1960, the primary system was filled with sodium.and ex
tensive testing of that system and of principal reactor components began.
This test programme, conducted by A PD A , was lengthy and thorough, and
in addition to exposing certain difficulties which have now been corrected,
the results confirmed many of the basic design and engineering concepts
followed in the construction of the reactor plant and its principal components.
An important part of the APDA test consisted of maintaining the reactor
vessel and one loop of the primary sodium system at an isothermal tempera
ture of 1000"F for about four days, the necessary heat being supplied by
induction heating in conjunction with a temporary oil-fuelled sodium heater.
This isothermal test temperature imposed conditions on the primary system
which were in many respects considerably more severe than will be
encountered in operation.
Graphite shield description
The Enrico Fermi shield system was designed to provide biological
protection for personnel, to maintain a non-radioactive secondary sodium
system, and to prevent damage to concrete and other materials outside the
shield. It is the primary or graphite shield shown in Fig. 8 that has required
the major shielding effort during the last seven years. It was also the com
plete replacement of this graphite shield that constituted the major con
struction effort during 1962.
The graphite shield is contained in the gas-tight primary shield tank
surrounding the reactor vessel and in the rotating shield plugin the top of
the reactor vessel. It is divided into two general/zones: an inner row next
to the reactor vessel backed up by thermal insulation and lagging to cause
heat to flow back to the sodium coolant and an outer or field layer between
the thermal insulation and the primary shield tank wall.
Graphite shield blocks were installed in the "pan", the dished head at
the bottom of the lower reactor vessel; in the "tub", the bottom of the
primary shield tank directly under the lower reactor vessel; in the rotating
shield plug at the top of the reactor vessel; and adjacent to the vertical
walls of the reactor vessel inside the primary shield tank. This material consisted of non-borated and 5% borated graphite. Boron carbide was used
for borating.
A lower grade graphite block was used as the bulk shielding or "field"
graphite in the primary shield tank. It consisted of plain and 5 and 7% bo
rated graphite. Boronation was accomplished with sodium tetraborate.
Clearance difficulties
During testing at sodium temperatures of 500°F, it was observed that
clearances around anumber of pipes and parts'within the primary shield tank
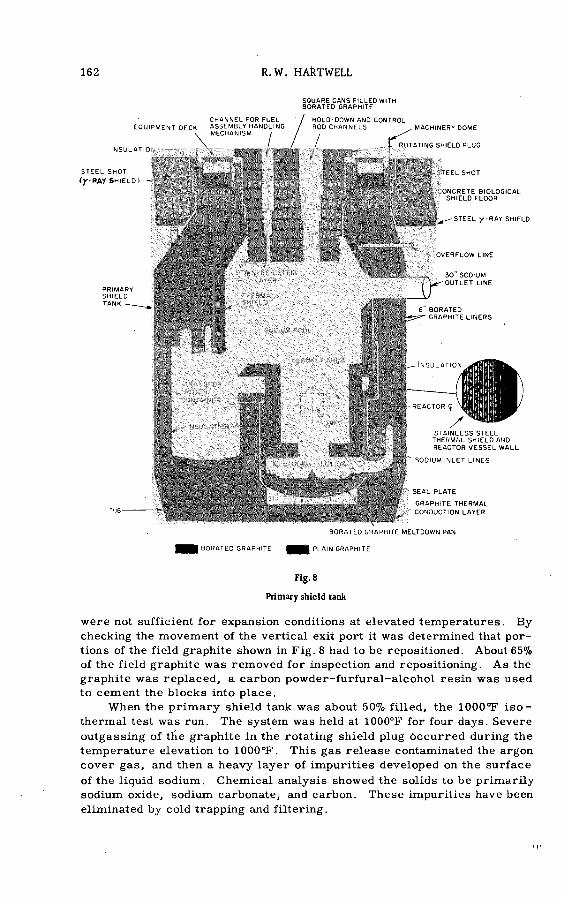
162 R. W. HARTWELL
SQ U A R E C A N S F IL L E D W ITH B O R A T E D G R A P H IT E
C H A N N E L FO R F U E L / H O LD -D O W N AN D CONTROL E Q U IP M E N T D E C K A S S E M B L Y H A N D L IN G / ROD C H A N N E L S , M A C H IN E R * OOM E
4 M E C H A N IS M I / ,
RO TAT ING SH IE L D PLUGI I43ULUI IU
S T E E L SH O T Ш И В Щ Ш S T E E L SH O T( f - f r A Y S H IE L D ) i l l »
C O N C R E T E B IO LO G IC A L S H IE L D FLO O R
- S T E E L y - R A Y SH IE L D
P R IM A R Y S H IE L D T A N K - __ _
O V E R F L O W L IN E
3 0 SO D IU M ' O U T L E T L IN E
6 B O R A T E D ==»" G R A P H IT E L IN E R S
S T A IN L E S S S T E E L T H E R M A L S H IE L D AN D R E A C T O R V E S S E L W A L L
S O D IU M IN L E T L IN E S
• S E A L P L A T E
G R A P H IT E T H E R M A L " CON DU CT ION L A Y E R
B O R A T E D G R A P H IT E M ELTDO W N PAN
I B O R A T E D G R A P H IT E P L A IN G R A P H IT E
Fig. 8
Primary shield tank
were not sufficient for expansion conditions at elevated temperatures. By
checking the movement of the vertical exit port it was determined that por
tions of the field graphite shown in Fig. 8 had to be repositioned. About 65%
of the field graphite was removed for inspection and repositioning. As the
graphite was replaced, a carbon powder-furfural-alcohol resin was used
to cement the blocks into place.
When the primary shield tank was about 50% filled, the 1000°F iso
thermal test was run. The system was held at 1000°F for four days. Severe
outgassing of the graphite in the rotating shield plug occurred during the
temperature elevation to 1000°F. This gas release contaminated the argon
cover gas, and then a heavy layer of impurities developed on the surface
of the liquid sodium. Chemical analysis showed the solids to be primarily
sodium oxide, sodium carbonate, and carbon. These impurities have been
eliminated by cold trapping and filtering.
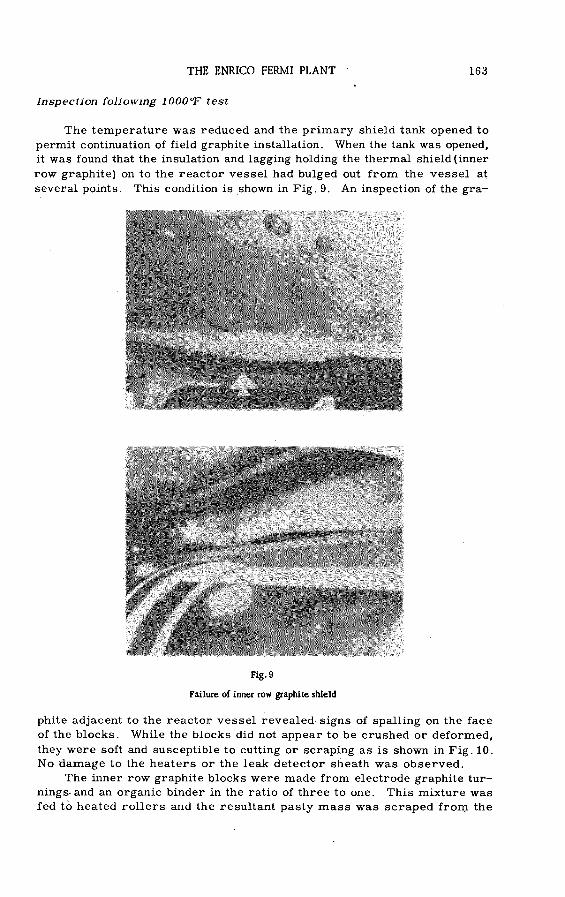
THE ENRICO FERMI PLANT 163
Inspection following 1000°F test
The temperature was reduced and the primary shield tank opened to
permit continuation of field graphite installation. When the tank was opened,
it was found that the insulation and lagging holding the thermal shield (inner
row graphite) on to the reactor vessel had bulged out from the vessel at
several points. This condition is shown in Fig. 9. An inspection of the gra-
Fig.9
Failure of inner row graphite shield
phite adjacent to the reactor vessel revealed signs of spalling on the face
of the blocks. While the blocks did not appear to be crushed or deformed,
they were soft and susceptible to cutting or scraping as is shown in Fig. 10.
No damage to the heaters or the leak detector sheath was observed.
The inner row graphite blocks were made from electrode graphite tur
nings-and an organic binder in the ratio of three to one. This mixture was
fed to heated rollers and the resultant pasty mass was scraped from the
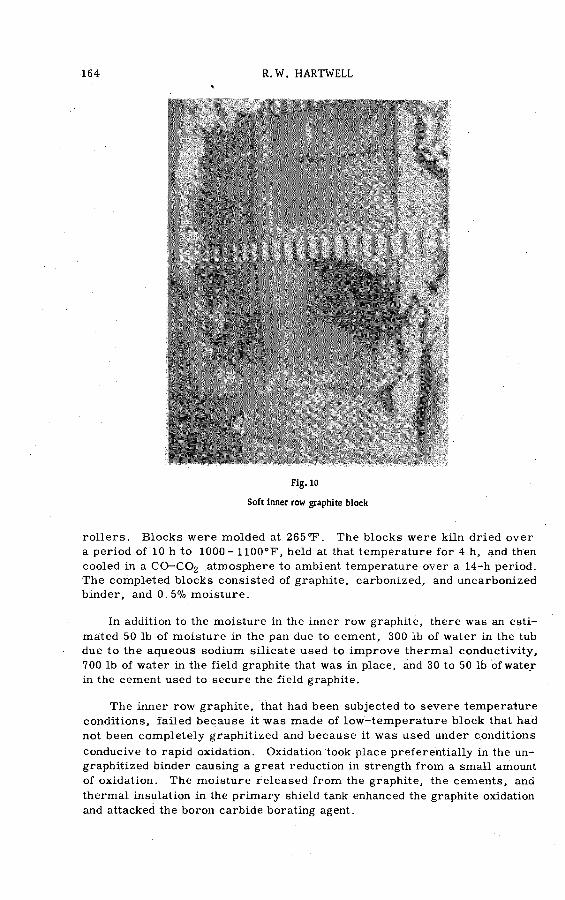
164 R.W. HARTWELL
Fig. 10
Soft inner tow graphite block
rollers. Blocks were molded at 265°F. The blocks were kiln dried over
a period of 10 h to 1000- 1100°F, held at that temperature for 4 h, and then
cooled in a C0-C02 atmosphere to ambient temperature over a 14-h period.
The completed blocks consisted of graphite, carbonized, and uncarbonized
binder, and 0. 5% moisture.
In addition to the moisture in the inner row graphite, there was an esti
mated 50 lb of moisture in the pan due to cement, 300 lb of water in the tub
due to the aqueous sodium silicate used to improve thermal conductivity,
700 lb of water in the field graphite that was in place, and 30 to 50 lb of water
in the cement used to secure the field graphite.
The inner row graphite, that had been subjected to severe temperature
conditions, failed because it was made of low-temperature block that had
not been completely graphitized and because it was used under conditions
conducive to rapid oxidation. Oxidation took place preferentially in the un-
graphitized binder causing a great reduction in strength from a small amount
of oxidation. The moisture released from the graphite, the cements, and
thermal insulation in the primary shield tank enhanced the graphite oxidation
and attacked the boron carbide borating agent.

THE ENRICO FERMI PLANT 165
Graphite replacem ent
After extensive study and consultation it was decided to replace both
the inner row graphite and field graphite with high-temperature, high-density
graphite. Boron carbide was chosen as the borating agent. Replacing the
graphite in the tub and pan would have been almost impossible. Therefore,
these areas were sealed off from the rest of the primary shield tank and
vented outside to the waste-gas disposal building. These areas are maintained
at a slightly lower pressure than the rest of the primary shield tank so that
if there is a transfer of atmospheres it will be from the primary shield tank
to the pan and tub.
In procuring the replacement graphite, all precautions were taken by
both the vendor and PRDC to assure that the material received would be of
the highest quality. The graphite was made from petroleum coke and coal
tar pitch. Boron carbide was added as the borating agent. The mix was
extruded into logs and baked at 1500°F for a six-week period. The material
was then pitch impregnated to give it a high density and then graphitized at
about 5500°F for a four-week period. For the inner row boronated material,
a special high-purity boron carbide was specified.
An extensive inspection programme was set up which required one per
cent sampling of all the blocks produced. Tests on these blocks were run
by both the vendor and an outside laboratory. The tests determined: density,
thermal conductivity, compressive strength (before and after oxidation) dry
air oxidation, wet nitrogen oxidation, ash, sulphur, chloride, and boron
content, thermal expansion, gas evolution, and moisture content.
Actual installation of the new graphite began on 6 May 1962, and was
completed on 15 December 1962. Fig. 11 is a photograph of the inner
row graphite installation. These blocks were precut wedge shaped. Figs.
12 and 13 show the field graphite installation. Since no cement was used
in the final installation, mechanical fasteners, including rings and pins, were
used to hold the blocks in position. These rings may be seen in Fig. 13.
P r im a r y shield tank purging
An estimated 200 lb of water were present in the primary shield tank
after completion of the graphite shield. Calculations indicated that approxi
mately 150 lb of this water could be removed at temperatures up to 300°F.
The graphite was heated to an average temperature of 300°F by means of
heaters attached externally to the primary shield tank and by heat transfer
from the molten sodium inside the reactor vessel. The graphite shield was
purged with dry air and then cycled between 16. 7 and 12.7 lb/in2 abs. These
methods weré continued until the 150 lb of available moisture were removed
as determined by monitoring the discharge purge air.
Now that the primary shield tank is in operation at high temperature,
it has been charged with dry nitrogen. Careful specifications have been set
on the maximum inner-row graphite temperature and maximum dew point.
As the dew point reaches the maximum, the tank is purged with dry nitrogen.
The laboratory and other studies which were undertaken in connection
with this problem and which were used to verify the adequacy of the replace-

166 R.W. HARTWELL
Fig. 11
Inner row graphite Installation
ment graphite finally chosen have added considerably to existing knowledge
of graphite technology and should be of considerable use to other reactor
designers in the future. These studies indicated the importance of mini
mizing the exposure of such graphite at elevated temperature to both mois
ture and oxygen.
MODIFICATIONS WITHIN THE REACTOR VESSEL
In the summer of 1961, PRDC went forward with the pre-operational
test programme including operation of the fuel-handling equipment and the
core-positioning device or hold-down mechanism. Fig. 14 shows the lo
cation of these large components in the reactor vessel.
In the course of the test programme, several of the dummy subassemblies,
which had been manufactured to less rigid specifications than the actual fuel
and blanket subassemblies, were found to be sticking in the lower support
plate. While removing these dummy subassemblies in order to determine
the cause of this condition, the offset handling mechanism was bent when
an inadvertent attempt was made to move it laterally before it was fully de
latched from a partially raised dummy subassembly. An interlock, which
would have prevented such movement during nuclear operation, had been
disconnected for the purpose of carrying out the test then in progress.
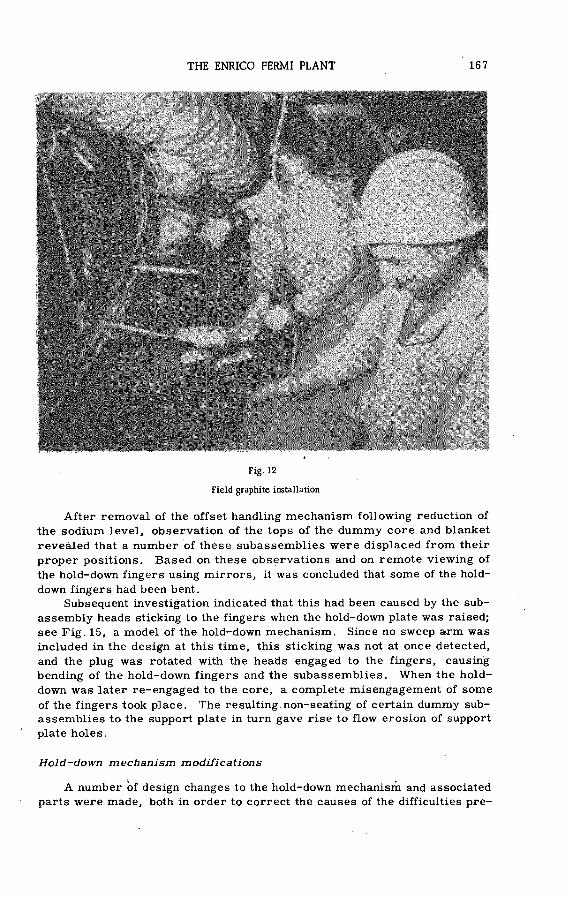
THE ENRICO FERMI PLANT 167
Fig. 12
Field graphite installation
After removal of the offset handling mechanism following reduction of
the sodium level, observation of the tops of the dummy core and blanket
revealed that a number of these subassemblies were displaced from their
proper positions. Based on these observations and on remote viewing of
the hold-down fingers using mirrors, it was concluded that some of the hold-
down fingers had been bent.Subsequent investigation indicated that this had been caused by the sub-
assembly heads sticking to the fingers when the hold-down plate was raised;
see Fig. 15, a model of the hold-down mechanism. Since no sweep arm was
included in the design at this time, this sticking was not at once detected,
and the plug was rotated with the heads engaged to the fingers, causing
bending of the hold-down fingers and the subassemblies. When the hold-
down was later re-engaged to the core, a complete misengagement of some
of the fingers took place. The resulting non-seating of certain dummy sub-
assemblies to the support plate in turn gave rise to flow erosion of support
plate holes.
Hold-down m echanism modifications
A number of design changes to the hold-down mechanism and associated
parts were made, both in order to correct the causes of the difficulties pre-

168 R.W. HARTWELL
Fig. 13
Field graphite installed dry - metal ring fasteners used
viously encountered and to improve the design in other areas. The hold-
down fingers have been strengthened so that if a similar malfunction occurs,
subassembly handling heads will be bent without bending the fingers. The
possibility of subassembly handling heads again sticking in the hold-down
finger sockets has been eliminated by redesigning the finger socket to apply
hold-down load on the end face of the subassembly handling head rather than
on the conical surface. This end-bearing finger socket design is the outcome
of a series of tests in high-temperature sodium which showed that sticking
could occur with application of hold-down load on the conical surface but not
with load on the end face. Fig. 16 shows the position of the finger-plate
assembly, and Fig. 17 is a photograph of the replacement assembly before
installation.
Offset handling m e c h a n is m m odifications
Several design changes were made to ensure operation of the offset
handling mechanism under conditions of abnormal stress. The gripper
linkage was strengthened so that, even for severe sticking in the mechanism,
enough strength exists to permit application of impact loads heavy enough
to force the gripper open. The stabilizer lower plate, or foot, was redesigned
to assure that the offset handling mechanism will not again be locked in po
sition over a partially raised subassembly. This was the situation at the
time the damage occurred. The stabilizer assembly and its attachment to

THE ENRICO FERMI PLANT 169
Fig. 14
Perspective view of reactor
the azimuth pipe has been strengthened to withstand higher lateral loads
against the lower end before the onset of permanent deformation in the struc
ture occurs. A completely separate digital position readout has been pro
vided in the control room to show the actual azimuth position of the plug and
offset handling mechanism at all times.
Addition of sw eep device
A sweep arm operated from the top of the rotating shield plug was in
stalled to determine if any subassemblies are raised before'plug rotation.

170 R. W. HARTWELL
í'
Fig. 15
Model of hold-down
Fig. 16
Hold-down (sectional elevation)
This device will traverse the region above the handling heads of the core
subassemblies.
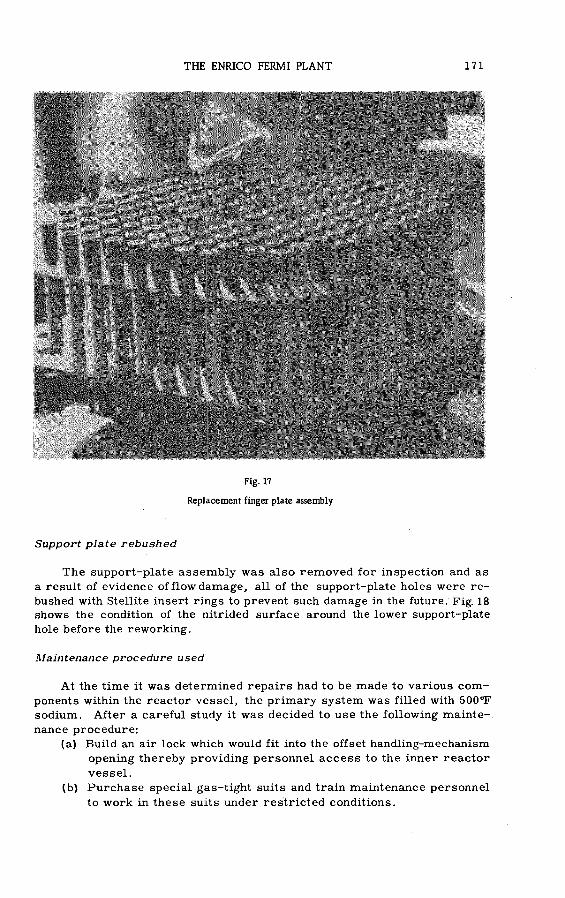
THE ENRICO FERMI PLANT 171
Fig. 17
Replacement finger plate assembly
Support plate rebushed
The support-plate assembly was also removed for inspection and as
a result of evidence of flow damage, all of the support-plate holes were re
bushed with Stellite insert rings to prevent such damage in the future. Fig. 18 shows the condition of the nitrided surface around the lower support-plate
hole before the reworking.
Maintenance procedure used
At the time it was determined repairs had to be made to various com
ponents within the reactor vessel, the primary system was filled with 500°F
sodium. After a careful study it was decided to use the following mainte
nance procedure:
(a) Build an air lock which would fit into the offset handling-mechanism
opening thereby providing personnel access to the inner reactor
vessel.
(b) Purchase special gas-tight suits and train maintenance personnel
to work in these suits under restricted conditions.
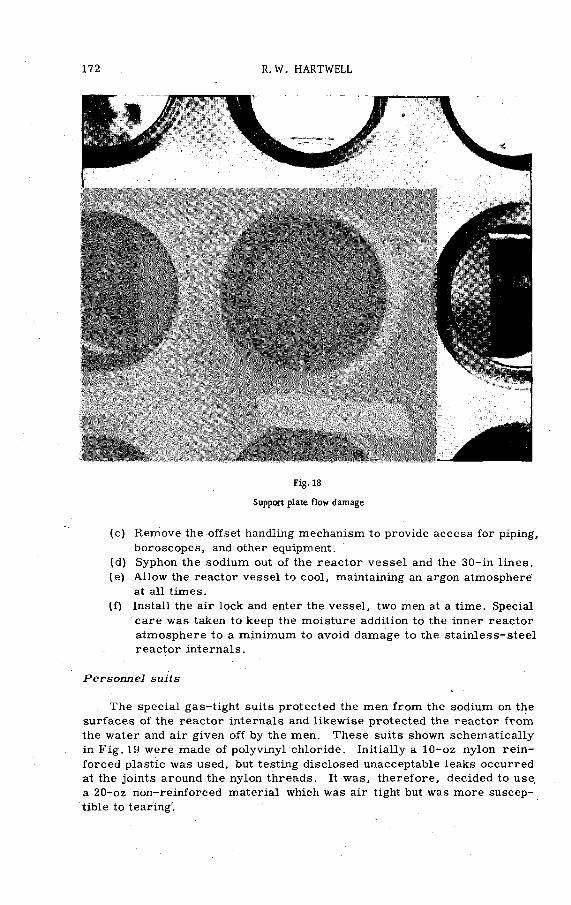
172 R.W. HARTWELL
Fig. 18
Support plate flow damage
(c) Remove the offset handling mechanism to provide access for piping,
horoscopes, and other equipment.
(d) Syphon the sodium out of the reactor vessel and the 30-in lines.
(e) Allow the reactor vessel to cool, maintaining an argon atmosphere
at all times.
(f) Install the air lock and enter the vessel, two men at a time. Special
care was taken to keep the moisture addition to the inner reactor
atmosphere to a minimum to avoid damage to the stainless-steel
reactor internals.
Personnel suits
The special gas-tight suits protected the men from the sodium on the
surfaces of the reactor internals and likewise protected the reactor from
the water and air given off by the men. These suits shown schematically
in Fig. 19 were made of polyvinyl chloride. Initially a 10-oz nylon rein
forced plastic was used, but testing disclosed unacceptable leaks occurred
at the joints around the nylon threads. It was, therefore, decided to use.
a 20-oz non-reinforced material which was air tight but was more suscep
tible to tearing'.
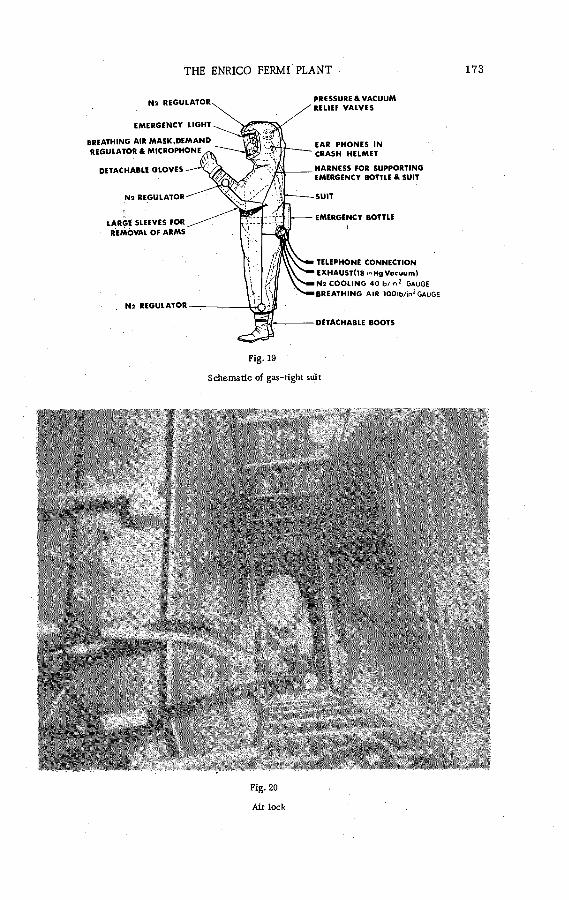
THE ENRICO FERMI PLANT 173
N 2 R E G U L A T O R
E M E R G E N C Y L IG H T
B R E A T H IN G A IR M A S K , D E M A N D
R E G U L A T O R & M IC R O P H O N E
D E T A C H A B L E G L O V E S
N 2 R E G U L A T O R
L A R G E S L E E V E S F O R
R E M O V A L O F A R M S
N 2 R E G U L A T O R
P R E S S U R E & V A C U U M
R E L IE F V A L V E S
E A R P H O N E S IN
C R A S H H E L M E T
H A R N E S S F O R S U P P O R T IN G
E M E R G E N C Y BO TTLE & S U IT
E M E R G E N C Y B O T T L E
T E L E P H O N E C O N N E C T IO N
E X H A U S T ( l8 in H g V o c u u m )
N 2 C O O L IN G 4 0 lb / in 2 G AUG E
B R E A T H IN G A IR 1 0 0 lb / in 2 G AUGE
D E T A C H A B L E B O O T S
Fig. 19
Schematic of gas-tight suit
Fig. 20
Air lock
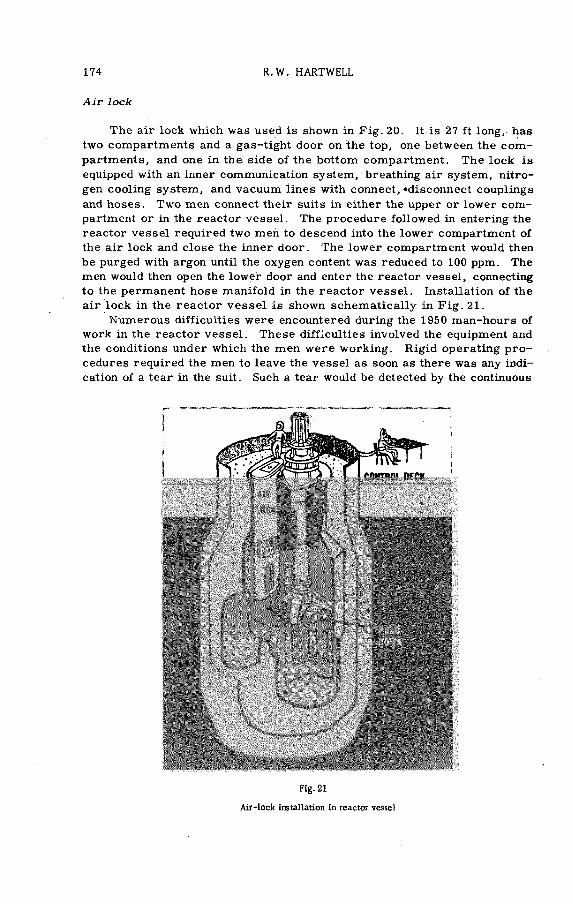
174 R. W. HARTWELL
The air lock which was used is shown in Fig. 20. It is 27 ft long, has
two compartments and a gas-tight door on the top, one between the com
partments, and one in the side of the bottom compartment. The lock is
equipped with an inner communication system, breathing air system, nitro
gen cooling system, and vacuum lines with connect, «disconnect couplings
and hoses. Two men connect their suits in either the upper or lower com
partment or in the reactor vessel. The procedure followed in entering the
reactor vessel required two men to descend into the lower compartment of
the air lock and close the inner door. The lower compartment would then
be purged with argon until the oxygen content was reduced to 100 ppm. The
men would then open the lower door and enter the reactor vessel, connecting
to the permanent hose manifold in the reactor vessel. Installation of the
air lock in the reactor vessel is shown schematically in Fig. 21.
Numerous difficulties were encountered during the 1950 man-hours of
work in the reactor vessel. These difficulties involved the equipment and
the conditions under which the men were working. Rigid operating pro
cedures required the men to leave the vessel as soon as there was any indi
cation of a tear in the suit. Such a tear would be detected by the continuous
A ir lock
Fig. 21
Air-lock installation in reactor vessel
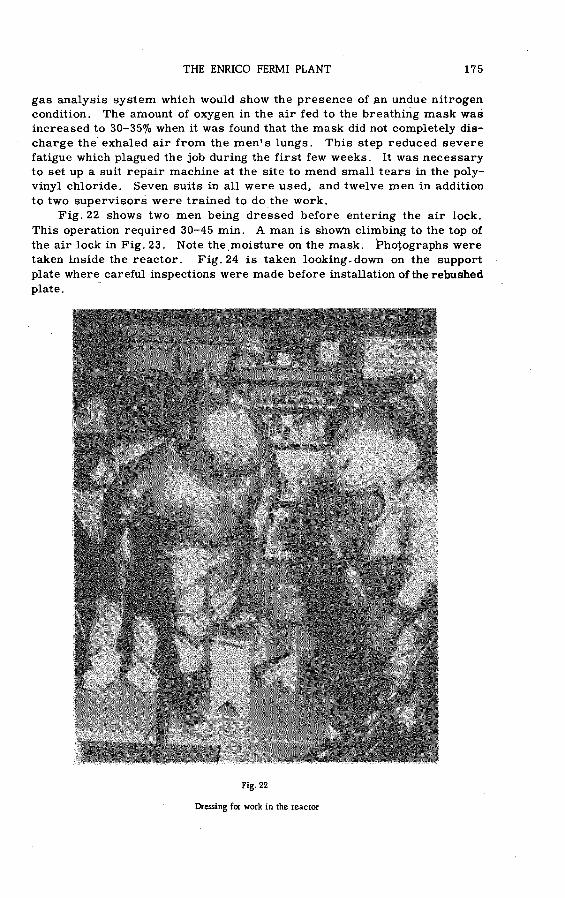
THE ENRICO FERMI PLANT 175
gas analysis system which would show the presence of an undue nitrogen
condition. The amount of oxygen in the air fed to the breathing mask was
increased to 30-35% when it was found that the mask did not completely dis
charge the exhaled air from the men's lungs. This step reduced severe
fatigue which plagued the job during the first few weeks. It was necessary
to set up a suit repair machine at the site to mend small tears in the poly
vinyl chloride. Seven suits in all were used, and twelve men in addition
to two supervisors were trained to do the work.
Fig. 22 shows two men being dressed before entering the air lock.
This operation required 30-45 min. A man is shown climbing to the top of
the air lock in Fig. 23. Note the.moisture on the mask. Photographs were
taken inside the reactor. Fig. 24 is taken looking.down on the support
plate where careful inspections were made before installation of the rebushed
plate.
Fig. 22
Dressing for work in the reactor

176 R. W. HARTWELL
Fig. 23
Climbing out of the air lock
STEAM GENERATOR MODIFICATIONS
A schematic diagram of the steam generator design is shown in Fig. 25.
Three identical liquid sodium-heated steam generators have been installed.
These are vertical shell and tube, counter flow, once-through type units
with water and steam in single wall tubes and sodium on the shell side.
Steam will leave these units at 600 lb/in2-764°F.
Fig. 26, a photograph of a scale model of one of the steam generators,
shows the unique tube arrangement and the liberal gas volume in the central
section of the unit. The blanket of inert gas protects the tube sheet from
sudden thermal transients in hot sodium and acts as a surge and expansion
tank for the entire secondary sodium system. This gas blanket also serves
to maintain a relatively constant temperature across the tube sheet.
Stress corrosion in No. 2 steam generator
Installation of the steam generators was completed in December 1961,
when Fig. 27 was taken. One unit is installed in each of the three separate
secondary sodium loops. The secondary sodium piping within the reactor

THE ENRICO FERMI PLANT 177
Fig. 24
Working in the support plate region
building is stainless steel. External to the reactor building the material
is 2^% chromium- 1% molybdenum steel. The secondary sodium pumps,
the steam generators, and the 1200 tubes in each steam generator bundle are also fabricated of this same type of steel. Hydrostatic tests of the No. 2
unit during June 1962, disclosed tube failures which were caused by stress-
corrosion cracking in the upper bend regions. Three conditions were found
to exist, each of which contributes to and is a factor in such a failure — an
active electrolyte, stressed tube material, and an elevated electrolyte
temperature. The corrodants which are known to cause stress-cracking
are nitrates and hydroxides, both of which were present in the cleaning sol
ution or were generated from chemicals which were used in the solution.
Nitrox (1/3 sodium hydroxide — NaOH and 2/3 sodium nitrite — N aN 02) was
used by the fabricator in the cleaning of the tubing during assembly. It is
speculated that the solution was not totally drained from the tubes and that
blowing with compressed air did not clear the tubes of this cleaning solution.
With the determination that there was extensive stress-corrosion
cracking within the No. 2 bundle, it was sent back to the fabricator for com
plete retubing. Numbers 1 and 3 steam generators were tested at 500°F and
1700 lb/in2 conditions and no leaks were detected. A sampling of tubes was
removed from the No. 1 and No. 3 units for metallurgical examination, even

178 R. W. HARTWELL
Fig. 25
Steam-generator design
though these units had not been exposed to the same adverse conditions as
the No. 2 unit. No such defects were discovered. To assure their integrity,
however, tube surfaces were acid cleaned, and all three units were stress
relieved in place in the field. Hydrogen detection equipment was installed
to monitor the argon cover gas above the sodium in each steam generator.
All bundles were back in their shells ready for service in November 1962.

THE ENRICO FERMI PLANT 179
Fig. 26
Model of the steam generator
Sodium testing
No. 1 unit, the first to be tested, was first filled with water and then
was filled with sodium on 28 November 1962. Cold trapping for purposes
of cleaning up the sodium system was started promptly. To effectively cold
trap and to test the secondary sodium pump, sodium was circulated continuously.
Sodium-water reaction
On the afternoon of 12 December, a sodium-water reaction took place
in this unit. The rupture disc operated properly, and the pressure resulting
from the reaction was relieved as planned through the relief piping and
centrifix. Only a small amount of sodium oxide was discharged from the
centrifix, and this was dissipated into the atmosphere without damage. There
were no injuries.

180 R. W. HARTWELL
Fig. 27
Interior of steam - generator building
A short time before this incident plant operators had noted a rise in
the hydrogen content and in the pressure in the No. 1 steam-generator cover
gas. As soon as this pressure rise was detected, the operators immediately
initiated isolation of this steam generator by manually operating the valves
which dump water from the unit. These valves acted to drop the pressure
from 500 lb/in2 gauge to essentially atmospheric. About five seconds after
opening of these valves was initiated, the rupture disc operated.
The steam and water manifolds were removed to determine the extent
of the failure. Six leaking tubes were found, all located in the same general
area in front of the east sodium inlet.
On 2 February, cold trapping of the sodium, which had been dumped
into the storage tank after the reaction, was completed, andtheNo.l secondary
sodium loop was refilled with this sodium. With a storage system tempera
ture of 325°F, the saturation temperature of the sodium was 220°F. This
indicates that this sodium, which had contained approximately 5000 ppm
sodium oxide, was reasonably clean before filling. Six hours after the sys
tem was filled, the system temperature was 400°F and the saturation
temperature was 380°F. Cold trapping of the system was started immedi
ately. The system contained considerable contamination which went into
solution in the clean sodium.
THE ENRICO FERMI PLANT 181
Vibration tests
Vibration tests were run shortly after filling with sodium at varying
secondary pump speeds, 100 rpm to the maximum of 800 rpm. These tests
indicated vibrations of only 0.0005- 0.0015-in amplitude and at frequencies
varying from 140-3000 Hz. Subsequent inspection of the bundle disclosed
that sodium-water reaction products formed around the tubes reduced the
vibration effect.
Subsequent to the vibration tests, more tube leakage was noted. Nitrogen,
which was maintained on the tube side, was first noticed in the argon cover
gas over the sodium. The rate of leakage continued to increase during the
five weeks of cold trapping and before draining the sodium in preparation
for removal of the bundle. The system plugging temperature had been
lowered below 300°F before draining. ,
Fig. 28
Steam-generator gas-tight removal equipment

182 R. W. HARTWELL
Additional leaking tubes
By removing the manifold covers and pressurizing the shell side with
argon gas, 39 additional leaking tubes were located. Thirty-six of the leaking
tubes were located in front of the west sodium inlet, while three additional
leaking tubes were located in the region of the sodium reaction in front of
the east sodium inlet.
Rem oval and cleaning
The bundle wasvremoved utilizing the special equipment shown in Fig.28.
By inspecting through viewing ports, it was observed that the area above
the location where the reaction occurred was covered with a heavy oxide
deposit.
Cleaning of the bundle was completed after approximately eight hours
exposure to ethyl alcohol. Alcohol was admitted slowly into the bottom of
the cleaning vessel, and nitrogen was bubbled up through the alcohol for
agitation; see Fig. 29. An inert atmosphere was maintained in the vessel
at all times, and extreme care was exercised to prevent combustion of the
alcohol or of the hydrogen which was evolved from the reaction. The gas
pressure in the cleaning vessel was controlled easily with a small valve
Fig. 29
Alcohol cleaning of steam-generator bundle

THE ENRICO FERMI PLANT 183
and the maximum pressure reached at any time was 4 lb/in2 gauge. The
maximum hydrogen content of the cover gas was 60%. Reaction between
the alcohol and the residual sodium was quite mild. A preliminary analysis
of the alcohol after cleaning showed that a total of 100 to 200 lb of sodium
had been cleaned from the unit.
Vibration dam age
A detailed visual and metallographic examination of the failures in the
west inlet area reveals that the tubes failed due to vibration in the support
bars. Figs. 30 and 31 show the enlarged support bar holes and evidence
of tube rubbing. The damage, which was quite severe, was all located about
four feet below the steam manifold where the tube makes the first horizontal
pass through the inner support bar. The support bar clearances have in
creased considerably due to the hammering and sawing of the tubes in the
support bars. Due to this action, the tubes finally wore thin and either par
tially or completely broke off. Several tubes were severed and these tubes
caused considerable rubbing damage to adjacent tubes. The original speci
fied support bar clearance was one-sixteenth inch. This clearance now
appears to be excessive and was great enough to allow sufficient movement
Fig. 30
Enlarged support bar holes

184 R. W. HARTWELL
Fig. 31
Tube rubbing in support bar
to start the tube and support bar wear. As the hole size increased and the
tube diameter reduced, the tube movement and damage rate increased.
Reaction area dam age
Although the analysis of the six tubes which had failed originally opposite
the east inlet nozzle has been somewhat masked by damage caused subse
quent to the reaction, it is now possible to develop an hypothesis of the events
before and subsequent to the reaction.
The failures in this area are all located at or near the inner support
bar in the same locations as the vibration failures which occurred on the
west side of the unit. Four failures occurred at the face of the support bar and were due to vibration damage. Four other failures (two tubes had two
types of failures) were pressure ruptures. It appears that the tube walls
of some tubes have thinned significantly due to the chemical action of the
reactants with the tube metal. Our metallographic examination reveals
that the tubes in the area of the reaction reached 1500°F, thus the reaction
temperature must have been higher. When the tube metal had thinned, the
internal pressure of 450 lb/in2 gauge was sufficient to cause blow holes in
the structurally and temperature weakened tube. One of the holes is a one-

THE ENRICO FERMI PLANT 185
inch long split which looks like a typical pressure failure. The other
pressure failures, however, are one eighth to one quarter-inch circular
shaped holes. It appears that the original failure in the reaction area was
caused by vibration damage. The other failures occurred subsequent to
the original failure and were due to a combination of chemical attack,
temperature, and pressure.
N o stress-corrosion cracking
All of the damaged tubes have been removed from the bundle and many
have been metallurgically examined. Randomly selected banks of tubes 90°
from the sodium inlet nozzles were removed and examined. There is no
evidence of stress-corrosion cracking.
Full-scale vibration test
Inlet and outlet nozzles will be welded into one of the shipping containers
so that full scale hydraulic flow testing can be conducted on the No. 3 steam
generator bundle. This bundle, which was installed in its shell ready for
service, will be removed and installed in the test loop. With full flow through
the unit and proper vibration instrumentation, it will be possible to design
suitable baffles and to study the effect of tube lacing. Baffles and possibly
lacing will be added to all three bundles before operation.
CONCLUSION
The problems described are those that have been most troublesome
and have had the greatest effect on the time schedule for the Fermi Plant.
Numerous other problems of a technical nature have also been encountered
during the three years the reactor plant has been subject to test. By the
same token, we have been well satisfied with the operation of many compo
nents. Much has been learned, all of which emphasizes the value of a com
plete pre-operational testing programme in the building of a first-generation
prototype reactor. While the emphasis in this review has been placed on
particular trouble areas, it is significant that techniques have been deve
loped for sampling and analysing sodium during the pre-operational test
period. The primary sodium pumps have operated in a very satisfactory
manner and the gas systems are performing well. The lessons learned
from the test programme are providing valuable information in nuclear tech
nology which should permit further advances in the development of power
reactors in general and sodium-cooled fast reactors in particular.
A C K N O W L D E G E M E N T S
This description of certain technical problems encountered in the con
struction and testing of the plant and the steps taken to solve these problems
reflects the efforts of many dedicated engineers. It is appropriate to express
186 R. W. HARTWELL
particular appreciation to the following for their assistance in the preparation
of this report:
(a) Hazen Van Vliet, Graphite Project Engineer for PRDC.
(b) William M . Everett, Project Engineer assigned to the reactor re
pair and remote maintenance work.
(c) Charles M. Heidel, project Engineer coordinating steam generator
repair.
D I S C U S S I O N
L . ZW INGENBERGER : Do you know how much water entered into the
reaction with the sodium?
R. H A R T W E L L : No, although it was clearly a fairly large quantity.
Cleaning the 10 000-gal system required 35 days of cold trapping, and sig
nificant amounts of "crud" were found above the reaction area when the bundle
was removed. Metallurgical examination showed that the tubing had reached
a temperature of 1500°F. A hydrogen detector was in the unit at the time
of. failure. Our procedurerfor operation prescribed that the operator would
shut off the unit and that the pressure would rise. The pressure did not rise
significantly but the hydrogen content of the cover gas did. In fact, hydro
gen detection may well prove useful in steam generators, and we are working
on the required instrumentation. When this sodium-water reaction occurred,
the operators actually dumped the unit a few seconds before the diaphragm
blew.
L . ZW INGENBERGER : Was there any device behind the rupture disc
for separating water and sodium?
R. H A R TW ELL : Yes, a simple centrifuge sepârator is installed about
35 ft from the disc, its purpose being to catch large burning particles. In
spection after the reaction showed little, if any, "crud" in the separator, so
it would appear that the reaction products stayed in the vessel.
As I said before, it took us quite a long' time to clean up the sodium
system, and during that time we tried to investigate the vibration effects
by installing vibration detectors in and around the tubing that had failed. We
determined that six tubes had failed in the initial accident. The vibration
detectors revealed no undue vibration, but when we removed the bundle and
found all the effects of the vibration we could see why: a lot of oxide had
been packed in around the tubing, and we had unknowingly tried to detect
vibration in tubes that were now held firmly by the reaction products.
L . Z W IN G E N B E R G E R : Was there an oxygen-hydrogen explosion?
R. H A R T W E L L : No. The hydrogen detector indicated a build-up in
the hydrogen content of the gas, but no pressure increase.was noted until
about 15 s before the reaction. The relief disc blew at about 60 lb/in* (nor
mal pressure is 1-3 lb/in2).
S. YIFTAH: It is generally accepted that future fast power reactors will
be fuelled with plutonium. Is it therefore definitely intended to operate the
Enrico rermi reactor at a later stage with plutonium fuel? If so, what type
of fuel will be used, and what is the present schedule for loading?
R. H A R TW ELL : We agree that future fast reactors will use plutonium,
but there is no definite plan to fuel the Enrico Fermi reactor with it. Our

THE ENRICO FERMI PLANT 187
present supply of uranium-molybdenum fuel will serve to complete low-
power testing and to operate at power for a period of 18-24 months. This
does not, of course, allow enough time to procure proven plutonium fuel
designs. We are therefore studying interim fuels that might be used after
this period, including plutonium ceramets and mixed plutonium-uranium
oxides.
N .N . ARISTARKHOV: In your recent published articles on the Enrico
Fermi reactor there is a reference to the discovery of fuel-element insta
bility due to coolant flow. Could you say what the causes of this instability
or deformation are, how it manifests itself, and what steps you have taken
to overcome it? Is the reduction of reactor power to 60 M W linked with this
phenomenon?
R. H A R TW ELL : Fig. 7 shows a cut-away fuel element with grid-type spacers along the 30-in pin length. It was found that the uranium-molybdenum
alloy did not provide the rigidity needed for the original, more flexible pin-
support system. The addition of these 17 grid supports, one every 2 in has
increased the pressure-drop through the fuel element. To avoid fuel-can
distortion, the flow was limited to the equivalent of 200 MW(t). This is a
limitation imposed by the particular core, however, and it will not be found
in future cores. The plant has a nominal rating of 300 MW(t) and should
be suitable for significant overload.

ОПЫТ ЭКСПЛУАТАЦИИ РЕАКТОРА БР-5
А.И. ЛЕЙПУНСКИЙ, О.Д. КАЗАЧКОВСКИЙ, М.С. ПИНХАСИК,
Н.Н. АРИСТАРХОВ, А.В. КАРПОВ, Е.П. ЛАРИН, И.А. ЕФИМОВ
СССР
Abstract — Résumé — Аннотация — Resumen
OPERATING EXPERIENCE WITH THE BR-5 REACTOR. The paper discusses the carrying-out of repair
and maintenance work on the radioactive liquid-metal circuit of the BR-5 fast neutron reactor. Attention is
also given to problems of reactor operation after achievement of the planned 2% fuel burn-up with some dis
turbance of leak-tightness in individual fuel elements. An account is given of experience in discharging the
active section, examining the condition and leak-tightness of the fuel elements, and decontaminating the
equipment and piping of the first radioactive circuit after reaching 5% fuel burn-up.
EXPÉRIENCE ACQUISE AUPRÈS DU RÉACTEUR BR-5. Dans ce mémoire les auteurs décrivent l’exécution
des réparations et des travaux d'entretien dans le circuit radioactif liquide-métal du réacteur à neutrons rapides
BR-5. Ils etudient également les problèmes liés au fonctionnement du réacteur au taux de combustion de 2%
prévu avec quelques défauts d'étanchéité dans des éléments combustibles particuliers. Ils décrivent le décharge-
menten zone active et examinent les conditions d'étanchéité des éléments combustibles. Ainsi que la dé
contamination de l'appareillage et des tuyauteries du premier circuit radioactif après avoir atteint un taux
de combustion de 5°}o.
ОПЫТ ЭКСПЛУАТАЦИИ РЕАКТОРА БР-5. В докладе рассматриваются вопросы производства ремонтных
работ на радиоактивном жидкометаллическом контуре реактора на быстрых нейтронах БР-5. Освещаются
вопросы эксплуатации реактора после достижения проектного 2%-ного выгорания топлива при наличии
некоторого нарушения плотности отдельных тепловыделяпцих элементов. Проводится опыт по разгрузке
активной зоны, исследованию состояния и герметичности тепловыделяпцих элементов, дезактивации
оборудования и трубопроводов I радиоактивного контура после достижения 5% выгорания топлива.
EXPERIENCIA PRACTICA CON EL REACTOR BR-5. En la memoria se examinan los problemas planteado#
por el mantenimiento del circuito radiactivo de metal liquido del reactor de neutrones rápidos BR-5. Se tratan
cuestiones relacionadas con la explotación del reactor una vez alcanzado el grado de combustión de 2%, pre
visto en el proyecto y luego de producirse ciertas alteraciones de la densidad de determinados elementos com
bustibles. Se describen la experiencia adquirida durante la descarga del cuerpo del reactor, las investigaciones
del estado general y de la hermeticidad de los elementos combustibles y las operaciones de descontaminación de
la instalación y de las tuberías del circuito radiactivo primario después de alcanzado un grado de combustión
de 5°¡o.
ВВЕДЕНИЕ
Для решения основных технических проблем, стоящих на пути
промышленного развития реакторов на быстрых нейтронах, в Совет
ском Союзе в 1958 и 1959 годах был сооружен исследовательский
инженерный реактор БР-5,с натриевым охлаждением, мощностью 5000
квт. По своим основным параметрам этот реактор близок к параме
трам экономически выгодных промышленных систем. Поток нейтронов
в центре активной зоны реактора составляет ~1015 н/см2 .сек, энер
гонапряженность ~500 квт/л и температура теплоносителя на выходе
из реактора ~500°С.
Краткое описание реакторной установки и опыт эксплуатации
реактора в первоначальный период были даны в работах [1 , 2J .
189

190 А.И. ЛЕЙПУНСКИЙ и др.
Рис. 1
Технологическая схема реактора БР-5:
1 - активная зона; 2 - циркуляционный насос I контура;
3 - теплообменник Na - NaK;4 - циркуляционный нэсос II
контура; 5 - теплообменник NaK - воздух; 6 - парогене
ратор;? - фильтр-ловушка окислов натрия; 8 - индикатор
окислов натрия;9 - фильтр-ловушка окислов NaK;10 - ин
дикатор окислов NaK; 11 - рекуператор; 12 - циркуляци
онный насос дистиллята; 13 - сливной бак NaK; 14-слив-
ной бак Na; 15 - сливной бак петли; 16 - циркуляцион
ный насос экспериментальной петли; 17 - фильтр-ловушка
окислов петли; 18 - промежуточный теплообменник петли;
19 - конденсатор; 20 - тракт воздушного охлаждения
экрана; 21 - тракт водяного охлаждения бака аппарата;
22 - электрокалорифер системы газового обогрева.

ОПЫТ ЭКСПЛУАТАЦИИ РЕАКТОРА БР-5 191
Начиная с января 1959 года, когда был осуществлен физический
пуск реактора с натриевым теплоносителем, реактор эксплуатируется
в различных режимах, в зависимости от требований экспериментов.
Успешная длительная эксплуатация установки позволила полу
чить большой опыт работы с радиоактивным натриевым теплоносите
лем; провести комплексное испытание оборудования; провести испы
тание оксидных тепловыделяющих элементов на достижимую глубину
выгорания в условиях, близких к рабочим.
Ниже приводятся некоторые результаты выполненных работ и
исследований.
ПРОВЕДЕНИЕ РЕМОНТНЫХ РАБОТ НА ЖИДКОМЕТАЛЛИЧЕСКИХ КОНТУРАХ
В процессе эксплуатации реактора БР-5 с января 1959 года
неоднократно возникала необходимость ремонта и замены оборудо
вания основных жидкометаллических контуров, как-то: циркуляцион
ных насосов, холодных ловушек окислов и т.п.
Насосы,осуществляющие циркуляцию натрия по I контуру и сплава
натрий - калий по I I контуру, представляют собой центробежные
насосы погружного типа с вертикальным расположением вала. Чертеж
насоса приведен на рис.2. Проточная часть насоса (рабочее колесо
с улиткой) расположена в баке насоса объемом ~0,6 м3 под уровнем
теплоносителя.Статор электродвигателя насоса герметизируется от
внешней среды стальным колпаком-кожухом. Газовая полость кожуха
электродвигателя через зазоры уплотнения вала насоса и по спе
циальному газовому трубопроводу сообщается с газовой полостью
бака насоса. Основными деталями насоса, определяющими продолжи
тельность его работы без замены либо ремонта, являются подшип
ники качения, срок службы которых ограничивается несколькими ты
сячами часов. После введения дополнительного водяного охлаждения
корпуса верхнего подшипника насоса срок работы насосов на нитках
кожухов установки в среднем составил 8 тыс. часов, время работы
отдельных насосов без их замены достигало 14 тыс. часов.
Замена или ремонт насосов I контура производились во время
остановки реактора, и указанные работы требовали приблизительно
недельной выдержки контура для спада активности натрия-24.
Нитка контура, насос которой выводился в ремонт, отсекалась
от остальной части контура вентилями.
В первое время эксплуатации замена насосов I контура про
изводилась при полностью сдренированном натрии из выведенной в
ремонт нитки. В дальнейшем производилось лишь.частичное дрениро
вание натрия из ремонтируемой нитки до уровня на ~ 1,5 м ниже дна
бака насоса. Оставшийся в нитке натрий замораживался для пре
дотвращения утечки натрия в сдренированную нитку из остальной
части контура через основные вентили. Частичное дренирование и
замораживание натрия позволяло существенно снижать загрязнение
контура окислами. После охлаждения выведенного в ремонт обору
дования и трубопроводов до температуры 30 + 40°С перед демонта
жем насоса производилось сбрасывание инертного газа из газовой

А.И. ЛЕЙПУНСКИЙ и др.
Рис. 2
Чертеж главного жидкометаллического насоса.

ОПЫТ ЭКСПЛУАТАЦИИ РЕАКТОРА БР-5 193
полости насоса и прилегающих трубопроводов до давления 1 ата.
Газовые трубопроводы демонтируемого насоса разрезались механи
ческим способом и глушились с обоих концов разжимными резиновыми
пробками.Далее разрезался трубопровод теплоносителя на напоре
насоса, и последний извлекался из бака. В течение всего времени
демонтажа насоса ( резка трубопроводов и извлечение насоса из ба
ка) в ремонтируемой нитке создавалась инертная среда путем не
большой протечки аргона, подаваемого в бак насоса.
После съема насоса с обоих концов разрезанного напорного
трубопровода и во всасывающий патрубок насосного бака устанавли
вались разжимные резиновые заглушки. Внутренняя полость насос
ного бака очищалась от остатков теплоносителя механическими
скребками и увлажненным тампоном из асбеста. Окончательная очист
ка бака производилась тампонами,смоченными в спирте. Все работы
по демонтажу и очистке оборудования от остатков теплоносителя
производились в защитных скафандрах с принудительной подачей воз
духа из-за наличия в боксах при производстве ремонтных работ
аэрозольной активности.
После установки в бак нового насоса и сварки трубопроводов
все сварные швы по контуру металла и газа подвергались рентге
носкопии и гелиевым испытаниям под вакуумом. • Гелиевым испыта
ниям под вакуумом подвергались также все фланцевые соединения
насоса.
По окончании замены насоса оборудование и трубопроводы разо
гревались до температуры ~150°С включением электрического обогре
ва, причем при частично сдренированной нитке электрообогрев тру
бопроводов включался в такой последовательности/ чтобы обеспечи
валось расширение расплавленного металла в сторону свободного
объема. Разогретая нитка заполнялась под вакуумом.
Замена насосов ниток I I контура производилась всегда при
полностью слитом сплаве натрий - калий из одной нитки и остановленной циркуляции сплава по другой.
Необходимость замены фильтров (холодных ловушек окислов на
трия в процессе эксплуатации) возникала несколько раз.
В связи с тем, что фильтр I контура располагался в боксе
1-й нитки I контура, при его замене приходилось останавливать
реактор и выжидать спада у-активности перед производством работ.
Первая 'замена фильтра-ловушки окислов I контура производи
лась при полностью сдренированной 1-й нитке и трубопроводов си
стемы фильтрации. Конструкция фильтра не позволяет производить
его дренирование. Поэтому натрий, оставшийся в фильтре после дре
нирования, объемом ~200 л замораживался. Для демонтажа фильтра
трубопроводы системы фильтрации разрезались механическим спосо
бом при одновременной непрерывной подаче в нитку аргона для пред
отвращения окисления остатков натрия на трубах.
Перед приваркой трубопроводов к новому фильтру последний
вакуумировался и заполнялся аргоном. Заполнение фильтра натрием
производилось вместе с 1-й ниткой I контура.
Вторая замена фильтра производилась без дренирования нитки.
Натрий в фильтре и подводящих трубопроводах замораживался. Тру
194 А.И. ЛЕЙПУНСКИЙ и др.
бопроводы с натрием разрезались механическим способом,и концы труб
на глубину ~100 мм очищались от натрия для надежной электро
сварки .
После предварительной продувки аргоном подготовленный для
замены фильтр вваривался в контур и вакуумировался через специ
альный вентиль, приваренный к входному коллектору фильтра. После
вакуумирования вентиль перекрывался и входной патрубок вентиля
заваривался. Заполнение фильтра натрием из контура производилось
после разогрева трубопроводов и оборудования системы фильтрации
до температуры t = 150°С.
Указанные замены фильтров производились, когда активность
контура и фильтров определялась в основном активностью натрия-24.
Опыт работ по замене фильтров-ловушек окислов показал, что
расположение фильтра в боксе совместно с основным оборудованием
и трубопроводами одной из ниток I контура является неудобным,так
как замена фильтра требовала длительной остановки реактора для
спада -y-активности в боксе I контура до уровня, позволяюще1 о про
изводить ремонтные работы. Поэтому фильтр I контура был вынесен
в специальный защитный бокс и предусмотрена возможность его ди
станционного демонтажа. Замена фильтра в этом боксе производилась
уже без прекращения циркуляции теплоносителя по контуру и оста
новки реактора. Демонтируемый фильтр отсекался от контура запор
ными вентилями, натрий в фильтре и его трубопроводах заморажи
вался. После спада -у-активности в боксе фильтра последний демон
тировался, а на его место устанавливался новый.
За период эксплуатации установки с января 1959 года по март
1963 года была произведена замена фильтра окислов: по I контуру
натрия - 4 раза, по I I контуру сплава - 1 раз.
Необходимо отметить, что содержание окислов в теплоно
сителе за время проведения ремонтных работ не поднималось
выше 0 ,0 0 7 % 02 . Снижение содержания окислов в контуре до нормаль
ного уровня (0 ,002 * 0 ,0 0 3 % 0 2) достигалось работой холодной ло
вушки в течение одних суток.
Опыт замены насосов и фильтров I и II контуров показал, что
замена и ремонт оборудования жидкометаллических контуров при со
ответствующей подготовке и принятии мер, не представляют особых
трудностей. При этом удается не допускать как значительного за
грязнения контуров окислами щелочных металлов, так и переоблуче
ния ремонтного персонала при ремонтных работах на радиоактивных
контурах.
Следует указать на определенные технологические преимущества
натрия по сравнению со сплавом натрий - калий.
Возможность замораживания натрия в трубопроводах и обору
дования контура при ремонтных работах, отсутствие возгорания
остатков натрия и продуктов его окислов в застывшем состоянии,
удобства в сварочных работах на трубопроводах с остатками тепло-
носи'теля и ряд других факторов дают основание считать, что при
выборе теплоносителя как для первого, так и для промежуточных
контуров ядерной установки следует отдавать предпочтение натрию.
ОПЫТ ЭКСПЛУАТАЦИИ РЕАКТОРА БР-5 195
ЭКСПЛУАТАЦИЯ РЕАКТОРА ПОСЛЕ ДОСТИЖЕНИЯ ПРОЕТНОГО ВЫГОРАНИЯ
В октябре 1960 года было достигнуто проектное 2%-яое выго
рание плутония в тепловыделяющих элементах активной зоны реактора.
Проведенные анализы радиоактивности теплоносителя и инертного га
за первого контура показали отсутствие в теплоносителе а-актив-
ности и осколков деления. В инертном газе было обнаружено при
сутствие радиоактивного ксенона.Это свидетельствовало о некото
ром нарушении плотности тепловыделяющих элементов, не приводяще
му к размыву делящегося материала топливных элементов. В связи
с тем, что одной из основных задач реактора БР-5 являлось мас
совое испытание оксидных тепловыделяющих элементов при глубоком
выгорании, было принято решение о продолжении эксплуатации реак
тора без замены тепловыделяющих элементов до появления заметных
признаков разрушения тепловыделяющих элементов. Контроль за це
лостностью тепловыделяющих элементов активной зоны в процессе
эксплуатации реактора в 1959 - 1961 годах проводился несколькими
методами:
а) по изменению реактивности реактора в процессе выгорания плу
тония;
б) по изменению остаточной активности теплоносителя первого кон
тура (после распада основного изотопа Na24) ;
в) по результатам радиохимического и спектрометрического анализа
отбиравшихся проб теплоносителя и инертного газа первого кон
тура .
В течение всей эксплуатации реактора изменение реактивности
реактора определялось выгоранием плутония,что указывало на отсут
ствие заметного вымывания горючего из тепловыделяющих элементов.
В течение 1959 - 1961 годов происходило изменение характера
спада активности теплоносителя после остановки реактора. Если в
начальный период работы реактора, когда выгорание горючег.р было
меньше 2% , активность теплоносителя спадала в 100 тыс. раз с пе
риодом полураспада 15 часов,то начиная с октября 1960 года, когда
выгорание плутония достигло ^2,4$, появилась остаточная активность.
Остаточная активность теплоносителя по мере увеличения выгорания
топлива увеличивалась (рис.З).
Остаточная активность натриевого теплоносителя связана с:
а) изотопом Na22 (T¿ = 2 ,6 г . ) , являющимся продуктом реакции
Na23 (n , 2n)Na22.
Активность Na22 в контуре пропорциональна интегральной мощ
ности реактора;
б) продуктами активации примесей теплоносителя. Активность при
месей зависит от чистоты теплоносителя и внутренних поверх
ностей контура при монтаже;
в) продуктами реакций (п, р ) , протекающих на конструкционных мате
риалах активной зоны, как,например:
Fé54(n, p)Mn54, Ti = 344 дня;
N i5e(n , р)Со5а, Т| = 72 дня;
г) продуктами деления топливного материала активной зоны, выхо
дящими из негерметичных тепловловыделяющих элементов.

196 А.И. ЛЕЙПУНСКИЙ и др.
t СУТКИ
Рис .3
Кривые спада -y-активности в боксах I контура при
заглушенном реакторе:
1 - спад -y-активности в боксах, обусловленной Na-24;
2 - спад ^-активности при остановках реактора в
1959 и 1960 годах;3 - спад у-активности в боксах при
остановке реактора в октябре 1960 года; 4 - останов
ка реактора в мае 1961 года; 5 - остановка реактора
в июле 1961 года; 6 - остановка реактора в сентябре
1'961 года.

ОПЫТ ЭКСПЛУАТАЦИИ РЕАКТОРА БР-5 197
Указанные радиоактивные примеси могут не только растворять
ся или взвешиваться в теплоносителе, но и высаживаться на вну
тренних стенках трубопроводов и оборудования первого контура
вследствие процесса переноса масс.
Активность проб теплоносителя, отобранных в феврале 1961
года (выгорание - 3 ,2 % ) , кроме Na22, в основном определялась изо
топом Cs137, образующимся в результате распада ксенона-137. Кроме
того, был обнаружен изотоп Cs136, который образуется при делении
непосредственно.
Абсолютное значение радиоактивной составляющей цезия отно
сительно радиоактивности изотопа Na22 составляло ~20%. Гамма-
спектрометрическйй анализ внутренней поверхности образцов трубо
провода, сделанный спустя 24 дня после остановки реактора пока
зал на наличие значительной радиоактивности с энергией -у-лучей
~0,82 Мэв и 0,51_ Мэв, что может быть приписано спектру изотопов
Со58 и Мп5 4 . Следует отметить, что обе эти активности не удава
лось удалить механическим способом (протиркой) и обработкой во
дой .
После остановки реактора 29 апреля 1961 года, когда выгора
ние топлива достигло 3 ,9 % , общая остаточная активность отобран
ной пробы теплоносителя после трехмесячной выдержки составляла
2,3-104 расп/сек на 1 г натрия и распределялась между компо
нентами следующим образом:
Cs ~1,0-104 расп/сек на 1 г натрия;
Na22 ~1,3-104 расп/сек на 1 г натрия.
Таким образом, за время с 22 февраля 1961 года по 29 апреля
1961 года содержание цезия относительно Na22 выросло вдвое. Оста
точная активность теплоносителя после остановки 17 июля 1961 го
да (выгорание 4,55%) выросла до ~2,5-105 расп/сек на 1 г Na, т.е.
в 10 раз по сравнению с апрелем.
Активность цезия составляла ~70% общей активности теплоно
сителя 1 сентября 1961 года, когда выгорание топлива достигло 5%-,
реактор был остановлен в связи с выходом из строя одного из цир
куляционных насосов первого контура. После полного распада изо
топа Na24, через 14 дней после остановки -y-фон в помещениях пер
вого контура составлял несколько тысяч мкр/сек. Дренирование те
плоносителя из отдельных ниток контура не снизило активности обо
рудования трубопроводов первого контура, что свидетельствовало
о высаждении значительной части активности на внутренних стен
ках контура. Характер -у-спектра проб теплоносителя не изменился,
по сравнению с пробами, отобранными в июле. Однако остаточная ак
тивность примесей теплоносителя выросла в десять раз, главным об
разом за счет цезия. Значительное увеличение радиоактивности те
плоносителя первого контура, обусловленной осколками деления, а
также появление a-активности, обязанной плутонию, свидетельство
вали о разрушении оболочек некоторых тепловыделяющих элементов.
В связи с необходимостью исследования герметичности оболочек
тепловыделяющих элементов и проведения дезактивации оборудования
и трубопроводов первого контура в октябре 1961 года была прове
дена полная разгрузка активной зоны реактора.
198 А.И. ЛЕЙПУНСКИЙ и др.
РАЗГРУЗКА АКТИВНОЙ ЗОНЫ И ОТБРАКОВКА ПАКЕТОВ ТЕПЛОВЫДЕЛЯЩИХ
ЭЛЕМЕНТОВ
В связи со значительной активностью рабочих пакетов, а такхе
радиоактивной загрязненностью натрия первого контура и негерме-
тичностью оболочек тепловыделяющих элементов части пакетов была
проведена тщательная подготовка к разгрузке реактора. Особое вни
мание было обращено на обеспечение радиационной техники безопас
ности.
Порядок разгрузки активной зоны реактора был принят от цен
тра к периферии. Выгрузка пакетов производилась с помощью раз
грузочного контейнера в ячейки хранилища пакетов. Принудитель
ное охлаждение пакета в контейнере при транспортировке не произ
водилось в связи с незначительным остаточным тепловыделением в
пакете.К моменту разгрузки активной зоны (через месяц после оста
новки реактора)-остаточное тепловыделение в пакетах за счет ос
колков деления снизилось до 40 - 60 вт на пакет. Проведенные рас
четы' показали, что при указанной величине тепловыделения, макси
мальная температура в центре тепловыделяющих элементов пакета,
установленного в ячейку хранилища и охлаждаемого только посред
ством естественной конвекции воздуха снаружи пакета, не может
превышать 500°С .
В связи с этим было принято решение ограничиться охлажде
нием пакетов в хранилище за счет естественной конвекции воздуха,
усиленной вытяжной вентиляцией хранилища. Полная разгрузка реак
тора заняла 8 дней. В хранилище были выгружены все 120 рабочих и
экранных пакетов.
Одиннадцать пакетов, выгруженных из активной зоны, были от
мыты в специальной системе паровой обдувки. Пакет, предзначенный
для отмывки* с помощью разгрузочного контейнера переносился в
предварительно прогретый паром специальный промывочный колодец.
Колодец герметично закрывался крышкой, и через него давался про
ток пара давлением ~2 ати с температурой ~130 * 140°С. После про
хода через промывочный колодец пар конденсировался в конденсато
ре. Конденсат охлаждался в доохладителе и сливался в сборники
промывочных вод.Проток пара через пакет продолжался в среднем
~1 час с расходом ~250 пара/кг час. В процессе отмывки контроли
ровалась -y-активность воды, сконденсированной из пара, проходя
щего через пакет. При отмывке четырех из одиннадцати пакетов было
замечено значительное повышение активности конденсата, что ука
зывало на наличие разрушения оболочек тепловыделяющих элементов
у этих четырех пакетов.Анализ обмывочной воды показал наличие в
ней плутония и осколков деления. Значительная активность обмы
вочной воды, присутствие в ней a-активности (плутония) и осколков деления подтвердили предположение о разрушении оболочек некото
рых тепловыделяющих элементов.
В связи с тем, что паровая отмывка приводила к вымыву плу
тония из тепловыделяющих элементов, имеющих дефекты в оболочках,
было принято решение паровую отмывку пакетов прекратить и про
извести исследование герметичности оболочек ТВЭЛ всех пакетов.
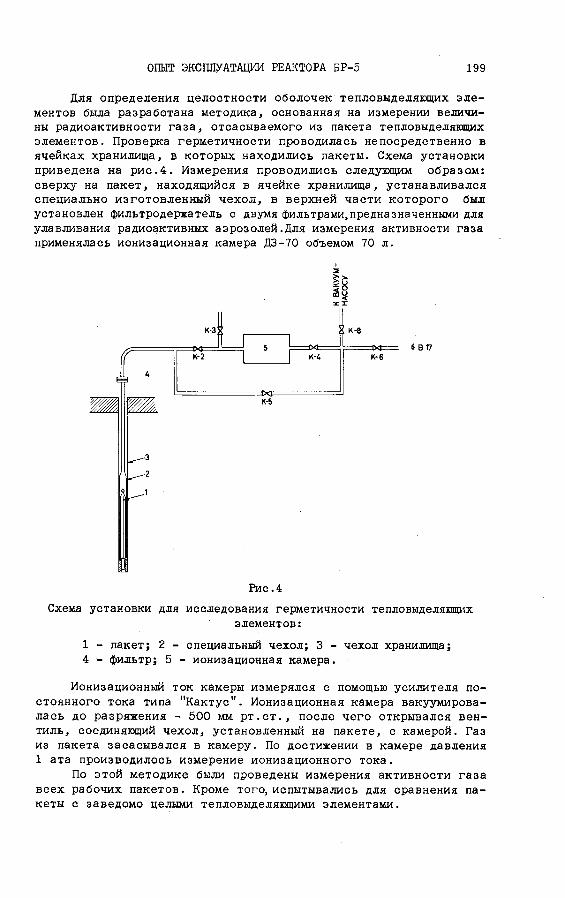
ОПЫТ ЭКСПЛУАТАЦИИ РЕАКТОРА БР-5 199
Для определения целостности оболочек тепловыделяющих эле
ментов была разработана методика, основанная на измерении величи
ны радиоактивности газа, отсасываемого из пакета тепловыделяющих
элементов. Проверка герметичности проводилась непосредственно в
ячейках хранилища, в которых находились пакеты. Схема установки
приведена на рис.4 . Измерения проводились следующим образом:
сверху на пакет, находящийся в ячейке хранилища, устанавливался
специально изготовленный чехол, в верхней части которого был
установлен фильтродержатель с двумя фильтрами,предназначенными для
улавливания радиоактивных аэрозолей.Для измерения активности газа
применялась ионизационная камера ДЗ-70 объемом 70 л.
Схема установки для исследования герметичности тепловыделяющих
элементов:
1 - пакет; 2 - специальный чехол; 3 - чехол хранилища;
4 - фильтр; 5 - ионизационная камера.
Ионизационный ток камеры измерялся с помощью усилителя по
стоянного тока типа "Кактус". Ионизационная камера вакуумирова-
лась до разряжения - 500 мм р т .с т ., после чего открывался вен
тиль, соединяющий чехол, установленный на пакете, с камерой. Газ
из пакета засасывался в камеру. По достижении в камере давления
1 ата производилось измерение ионизационного тока.
По этой методике были проведены измерения активности газа
всех рабочих пакетов. Кроме того, испытывались для сравнения па
кеты с заведомо целыми тепловыделяющими элементами.
200 А.И. ЛЕЙПУНСКИЙ и др.
Из 81 плутониевого пакета, подвергавшагося испытаниям,
8 пакетов были предварительно отмыты паром, 73 пакета отмывке не
подвергались.
Неотмытые пакеты по результатам испытаний разделяются на
две категории. К первой категории относятся 63 плутоние
вых пакета, относительная активность газа которых составляет
2 -г 7 мкр/сек. Следует отметить, что активность газа заведомо
целых неотмытых пакетов также равнялась 2 -5 -7 мкр/сек; следова
тельно, можно сделать вывод, что активность газа этих пакетов
обусловлена радиоактивными примесями натрия, оставшегося внутри
и снаружи неотмытых пакетов.
10 неотмытых плутониевых пакетов дали активность газа в ты
сячу раз превышающую активность газа первой группы пакетов
(1000 * 9000 мкр/сек). Многократные повторные измерения подтвер
дили аномально высокую активность газа в этих пакетах. Длитель
н о е ^ течение 5 суток) измерение величины активности газа, ото
бранного в ионизационную камеру из одного из этих пакетов, по
казало примерное постоянство величины активности со временем.
Измерение активности газа из восьми плутониевых пакетов, подвер
гавшихся паровой отмывке, показали, что величина активности газа
из этих пакетов лежит в интервале от 10 до 90 мкр/сек, причем
активность газа, отобранного в ионизационную камеру, спадает со
временем.
По результатам исследования герметичности оболочек тепловыделяющих элементов всех рабочих пакетов были отобраны два па
кета для проведения тщательных исследований состояния ТВЭЛ в го
рячей лаборатории: один из отмытых паром пакетов, давший наиболь
шую а-, (3-, -y-активность газа при исследовании герметичности,и в
то же время этот пакет был одним из четырех пакетов,давших значи
тельное повышение -y-активности в системе паровой отмывки при па
ровой обработке; и один из пакетов, не подвергавшихся паровой
очистке и давший наибольшую (3-, -y-активность газа при исследова
нии герметичности.
Максимальное выгорание плутония в обоих пакетах составляло
4,9$;интегральная доза облучения пакетов составляла 2 ,1 -102гн/ем2В результате исследования этих пакетов в горячей лаборато
рии было установлено, что часть элементов в обоих пакетах ока
залась с разрушенной оболочкой. На их поверхности просматривались
продольные трещины. Характер трещин указывает на то, что они свя
заны с распуханием топливного материала при глубоком выгорании.
Трещины появились в небольшой части элементов; по-видимому, где
были минимальные зазоры между брикетами Ри0.Р и оболочкой.
В пакете, прошедшем предварительную обработку паром, нару
шения более выражены, чем в пакете без такой обработки.
Также было проведено исследование одного из центральных
пакетов, показавшего незначительную активность газа при иссле
довании. Выгорание в центре пакета достигло 5 ,0 % , интегральная
доза облучения 2,2- 1022 н/см2 .
В результате исследования тепловыделяющих элементов в го
рячей лаборатории установлено, что все элементы пакета герме
ОПЫТ ЭКСПЛУАТАЦИИ РЕАКТОРА БР-5 201
тичны, оболочка элементов имеет хорошее состояние. Поверхность
элементов светлая, блестящая; отсутствуют какие-либо видимые де
фекты или следы взаимодействия материаля оболочки с теплоноси
телем.
Проведенные исследования в горячей лаборатории трех топлив
ных пакетов с элементами, имеющими максимальное выгорание, и ис
следование герметичности оболочек рабочих пакетов тепловыделяющих
элементов, проведенное на установке БР-5, позволили сделать за
ключение об удовлетворительном состоянии основной части рабочих
пакетов. v
Достигнутое высокое выгорание в тепловыделяющих элементах
установки БР-5 при напряженной трехлетней эксплуатации уста
новки с параметрами, близкими к параметрам энергетических уста
новок на быстрых нейтронах, свидетельствует о хорошей стойкости
окисных элементов, целесообразности применения их в подобных ап
паратах и реальной возможности достижения в РиОг 5% выгорания.
ДЕЗАКТИВАЦИЯ I КОНТУРА
После разгрузки активной зоны для проверки целостности те
пловыделяющих элементов натрий из I контура был сдренирован в
сливной бак.
Дренирование натрия из I контура в сливной бак практически
не снизило мощности дозы -y-излучения в боксах размещения•обору
дования. Этот факт объяснялся тем, что долгоживущие радиоактив
нее элементы, попавшие в контур вследствие разуплотнения тепло
выделяющих элементов, в основном высадились на внутренних по
верхностях оборудования и трубопроводов.
Анализ пробы натрия, взятого из сливного бака после дре
нирования теплоносителя из контура, показал наличие в нем це-
зия-137 и натрия-22.
Перед проведением дезактивационных работ контур обрабаты
вался паром для очистки внутренних поверхностей оборудования и
трубопроводов от остатков натрия, оставшихся после дренирования.
Пар подводился к верхним точкам контура: в газовые линии
баков циркуляционных насосов и трубы активной зоны. В нижней точ
ке контур подсоединялся к конденсатору для конденсации пара пе
ред сбросом в сборники промывочных вод.
В целях избежания конденсации пара на холодных поверхностях
оборудования и трубопроводов контур прогревался до температуры
t = 150°С газовым и электрическим обогревом.Для того, чтобы поток .пара проходил по всем коммуникациям
-контура, обработка его осуществлялась раздельно по ниткам. Пар
(давление Р = 1,3 * 1 ,5 ати, температура ~130°С) проходил по ком
муникациям контура, взаимодействуя с остатками натрия, конден
сировался и сбрасывался в сборники промывочных вод. Для избежа
ния повреждения обмоток электродвигателей циркуляционных насосов
пар подавался непосредственно в баки насосов, а в кожухах элек
тродвигателей поддерживалось давление азота на 0,1 + 0,2 ати выше
давления пара.

202 А.И. ЛЕЙПУНСКИЙ и др.
Несмотря на большую разветвленность коммуникаций контуре,
наличие байпасных линий и тупиковых участков, никаких хлопков
или ударов при подаче пара в контур не наблюдалось. В общей слож
ности через обе нитки I контура и трубу активной зоны было про
пущено ~10 т пара.
В результате паровой обработки I контура мощность дозы
•у-излучения в боксах размещения оборудования снизилась примерно
вдвое, а в помещении расположения дренажного коллектора увеличи
лась более чем в 10 раз.
При выяснении причин повышения активности в помещении дре
нажного коллектора в одном из тупиковых участков была обнаружена
"пробка" из тестообразной массы, образовавшаяся из продуктов вза
имодействия пара с остатками натрия.
Радиометрический анализ пробы, взятой из этой "пробки", по
казал наличие в ней цезия-13 7 и циркония-95, причем 90% актив
ности пробы определялось цирконием-95 и 10% цезием-137. Таким
образом,паровая обработка I контура позволила удалить с внутрен
них поверхностей оборудования и трубопроводов вместе с остатками
натрия часть цезия-137 и циркония-95.
Для определения полноты реакции остатков Na с паром I кон
тур перед дезактивацией был заполнен холодным дистиллятом. Ника
кой бурной реакции, хлопков или разогрева участков контура не
отмечено. После выдержки в течение одних суток дистиллят из кон
тура был сдренирован. В дистилляте были найдены следующие ра
диоактивные примеси: цезий-137, цирконий-95, железо-59,кобальт-58
и кобальт-60. Какого-либо заметного снижения активность в боксах
I контура не наблюдалось. К сожалению, создать циркуляции дистил
лята на контуре было невозможно из-за неисправности циркуляцион
ных насосов. Вторичное заполнение контура дистиллятом и выдержка
его в течение ~6 суток также не дали заметного снижения актив
ности. Это говорило о том, что основная активность контура опре
делялась .радиоактивными изотопами, хорошо удерживающимися на
стенках трубопроводов I контура и слабо реагирующими с водой и
паром.
Поэтому было принято решение о проведении промывки I кон
тура азотной кислотой. Однако в связи с наличием в центральной
трубе реактора никелевой корзинки пакетов ТВЭЛ, промывке кисло
той были подвергнуты только отдельные нитки I контура. Централь
ная труба при последующей промывке была отсечена от контура ар
матурой и дезактивации не подвергалась.
Одна из ниток I контура была заполнена азотной кислотой
5%-ной концентрации, нагретой до t = 70°С.
Сброс кислоты после 6 часовой выдержки дал снижение актив
ности в боксах в 1,5 раза. Последующие еще две кислотные промыв
ки той же нитки I контура с выдержками соответственно 12 и 16
часов раствора в контуре позволили снизить активность еще в два
раза.
В дальнейшем дезактивация производилась в следующей после
довательности:
ОПЫТ ЭКСПЛУАТАЦИИ РЕАКТОРА БР-5 203
1. Заполнение нитки контура 0,5%-ным раствором КМп04 , вы
держка в течение 24 часов при t = 70°С.
2. Заполнение нитки контура смесью 5%-го раствора азотной и
lfo-го раствора щавелевой кислоты. Выдержка в течение 3 + 4 часов
при t = 70°С.
3 . Заполнение контура дистиллятом. Выдержка в течение 1 часа
при t = 60 + 80°С .
Обе нитки I контура в отдельности были подвергнуты пятью
таким циклам промывки. В результате произошло существенное сни
жение активности в боксах I контура (до ~10 мкр/сек), позволившее
начать проведение ремонтных работ. Радиохимический анализ сдрени-
рованных из I контура растворов показал, что активность раство
ров обязана в основном цирконию-95 и цезию-137.
Таким образом,было выяснено, что остаточная активность обо
рудования и трубопроводов I контура после слива натрия опреде
ляется твердыми осколками деления Pu, Zr и Cs. Это впоследствии
потвердили и радиохимические анализы внутренней поверхности
участков труб, вырезанных из I контура, как не отмывавшихся,
так и подвергнутых отмывке. Причем в последних содержание цезия
было уже незначительным.
Заключительным этапом дезактивации контура была дистиллят-
ная промывка для удаления остатков кислоты.
Сливной бак I контура после передавливания из него Na в спе
циальную герметичную емкость (бак-могильник) был подвергнут дез
активации в том же режиме, как и контур.
Сушка I контура после промывки производилась вакуумированием
с одновременным разогревом оборудования и трубопроводов до
t » 150°С, штатным электро- и газовым обогревом.
Сушка контура продолжалась до прекращения выделения влаги
в холодной ловушке паров, установленной на всасе вакуумного на
соса. После этого I контур был вновь заполнен свежим продистилли- рованным натрием.
Поскольку высаживание значительной долгоживущей радиоактив
ности на стенках оборудования и трубопроводов I контура сильно
затрудняет доступ к оборудованию контура, а следовательно и экс
плуатацию реактора, необходима более тщательное изучение этого
явления.
В настоящее время на I контуре реактора устроена специаль
ная петля для изучения с помощью •у-спектрометра механизма акти
вации контура, уточнения радиоактивных изотопов, высаживающихся
на стенках оборудования и трубопроводов, а также способов очистки
I контура от радиоактивности.
Как указывалось выше, проведенная кислотная дезактивация
контура позволила провести необходимые ремонтные работы и подго
товить I контур к пуску реактора. Массовая проверка герметичности
ТВЭЛ рабочих пакетов и исследование состояния выборочных пакетов
ТВЭЛ в горячей лаборатории позволили сделать заключение об удо
влетворительном состоянии основной части плутониевых пакетов.
Это послужило основанием для использования 80% работавших в те
чение трех лет плутониевых пакетов ТВЭЛ для дальнейшей работы
204 A .И. ЛЕЙПУНСКИЙ и др.
в реакторе. 29 марта 1962 года реактор БР-5 вновь был выведен
на мощность.
ЛИТЕРАТУРА
[l] ЛЕЙПУНСКИЙ А.И. и др ., Экспериментальные быстрые реакторы
в СССР. Доклад № 2129 на второй международной конференции по
мирному использованию атомной энергии. Женева, 1958.
[2J ПИНХАСИК М .С . , АРИСТАРХОВ Н .Н . , КАРПОВ А .В . , Некоторые
вопросы опыта эксплуатации реактора на быстрых нейтронах
БР-5. Доклад SM - 21/29 на семинаре по физике реакторов на
быстрых и промежуточных нейтронах, Вена, 1961.
D I S C U S S I O N
W .H . JENS: Can you describe the fuel-element failures in more detail?
In particular, I should like to know whether the clad was ductile, and whether
you are now confident that the 80% of fuel put back in the reactor will not
be subject to further failures.
N .N . ARISTARKHOV (on behalf of A.I. Leipunsky et al.): In the paper
it is pointed out that studies performed in a hot laboratory revealed the
presence of longitudinal cracks in a number of fuel elements; in the bundles
that were subjected to steam treatment these defects were clearly apparent.
An analysis of the results of these tests suggests that the most likely cause
of damage to the cladding was internal stress due to swelling of the fuel.
The clearance between fuel and cladding was gradually reduced during burn-
up, and our investigations showed that the failed elements were those which
had had the smallest clearances.
Preliminary investigations have shown that the ductility of the stainless-
steel cladding was not badly affected. In fact, bending tests gave results
very similar to those obtained before the material was irradiated. The fuel
remained in the solid state, and no effects such as internal melting or fusing
were observed.
The methods used in these studies on BR-5 did not enable us to de
termine whether the elements loaded back into the reactor were absolutely
tight. In fact, there appear to be some leaks: we have observed the presence
of certain gaseous fission products (krypton and xenon) in the gas cavity of
the reactor vessel, which suggests that some of the elements are not tight.
However, the leaks have not led to any noticeable build-up of solid fission-
fragment activity in the coolant circuit.
S. YIFTAH: In view of the operating experience acquired with the BR-5
reactor and the BN-50 and BN-250 50- and 250-MW(e) design studies re
ported at the Second Geneva Conference*, is the Soviet Union now contem
plating the actual construction of a fast prototype power reactor fuelled with
plutonium?
N .N . ARISTAR KHOV : Various fast reactor designs are being con
sidered in the Soviet Union, including a plant with an output of 1000 MW(e).
* Proc. 2nd. UN Int. Conf. PUAEJJ1948) 580.
ОПЫТ ЭКСПЛУАТАЦИИ РЕАКТОРА БР-5 205
As to the BN-50 design which was reported at the Geneva Conference, so
far as I know it is not now planned to carry out this project.
C .A . PURSEL: I have two questions. Firstly, do the figures which
you quoted for burn-up refer to peak or average burn-ups? Secondly, I
understand that your pumps ran some 8000 hours without maintenance, which
seems rather good. Are .you doing any work on improved pumps, such as
high-speed pumps or electromagnetic pumps?
N.N . ARISTARKHOV: The figures I quoted refer to the maximum burn-
up attained in the reactor; the figure of 5.4% reflects the burn-up attained
in the 80% of fuel elements that were subsequently loaded back into the
reactor.
The operation of the pump in BR-5 has been limited, generally speaking,
by the lifetime of the bearings, which so far has averaged about 8000 h. The
bearings must then be replaced. The pump has undergone a number of struc
tural changes designed to improve its operation in BR-5, such as elimination
of gas transfer, improvements in the cooling of the upper bearing, and so
forth. Electromagnetic pumps have been installed for use in the central
experimental loop assembly, but their capacity is not particularly large.
J. LEDUC: You say that the РиОг fuel was studied in a hot laboratory.
Were the same characteristics observed in the Pu09 fuel after irradiation
as have been noticed in the UO2, i. e. the formation of a central hole, a zone
of grain enlargement, etc.? Was there any change in the clearance between
fuel and cladding? Lastly, since a combination of uranium oxide and plu
tonium oxide is one of the possible fuels for the large reactors of the future,
have you irradiated this type of mixture in BR-5?
N .N . ARISTARKHOV: In addition to the Pu 02 fuel elements, U 0 2 ele
ments of different enrichments (up to 90%) are being tested in the BR-5 re
actor. These have not attained a sufficient burn-up, however, and for that
reason we have not yet tested them. Not being a metallurgist, I am un
fortunately not able to answer your question about alterations of grain
structure.
W . H . JENS: In earlier papers on BR-5 you mentioned tests designed
to determine the stability of the reactor and the possibility of a positive
temperature coefficient. You stated that there was no prompt positive coef
ficient. Could you please say how the coefficient was measured — whether
an oscillator rod was used — and what the shortest time constant of the coef
ficient was that could be measured in these tests?
N .N . ARISTARKHOV: The power characteristics of BR-5 were tested
early in the reactor's history by means of transient power changes worked
by an automatic regulator which governs the reactor's power level. These
measurements were sufficiently accurate to allow the conclusion that there
are no appreciable changes in the reactivity of the system associated with
abrupt changes of power. A second series of power studies was begun early
in 1963. Using essentially the same method, these investigations are de
signed to test the characteristics of the reactor at different power levels
and different rates of coolant flow through the core. We hope then to be able
to distinguish effects associated with the coolant from those associated with
the fuel. The results are now being processed and will be published.


Ill
EXPERIENCE WITH SPECIFIC NUCLEAR
POWER PLANTS (continued)


SHIPP IN GP OR T ATOMIC POWER STATION OPERATING EXPERIENCE, DEVELOPMENTS
AND FUTURE PLANS
H. FEINROTH
DIVISION OF REACTOR DEVELOPMENT,
UNITED STATES ATOMIC ENERGY COMMISSION, WASHINGTON, D.C. ,
G.M. OLDHAM
SHIPPINGPORT ATOMIC POWER STATION, DUQUESNE LIGHT COMPANY,
PITTSBURGH, PA. ,
AND
J.T. STIEFEL
BETTIS ATOMIC POWER.LABORA TORY, WESTINGHOUSE ELECTRIC CORPORATION,
PITTSBURGH, PA.
Abstract — Resumé — Аннотация — Resumen
SHIPPINGPORT ATOMIC POWER STATION, OPERATING EXPERIENCE, DEVELOPMENTS AND FUTURE
PLANS. This paper describes and evaluates five years of operation and test of the Shippingport Atomic Power
Station and discusses the current technical developments and future plans of the Shippingport programme This
programme is directed towards development of the basic technology of light-water reactors to provide the
basis for potential reduction in the costs of nuclear power.
The Shippingport reactor plant has operated for over five yeárs and has been found to integrate readily
into a utility system either as a base load or peak load unit. Plant component performance has been reliable.
There have been no problems in contamination or waste disposal. Access to primary coolant components for
maintenance has been good, demonstrating the integrity of fuel elements. Each of the three refuelling oper
ations performed since start-up of Shippingport has required successively less time to accomplish. Recently,
the third seed was refuelled in 32 working days, about one quarter the time required for the first refuelling.
The formal requirements of personnel training, written administrative procedures, power plant manuals, etc.,
which have been a vital factor in the successful implementation of the Shippingport programme, are described.
The results obtained from the comprehensive test programme carried out at Shippingport are compared
with calculations, and good agreement has been obtained. Reactor core performance, plant stability, and
response to load changes, fuel element and control rod performance, long-term effects such as corrosion and
radiation level build-up, component performance, etc., are discussed in this paper.
The principal objective of the current and future programmes of the Shippingport Project in advancing
the basic technology of water-cooled reactors is discussed. This programme includes the continued operation of
the Shippingport plant, and the development, design, manufacture and test operation of a long-life, high-
power density second core - Core 2. At its design rating of 150 MW(e) gross and a first seed life of
10.000 effective full power hours (EFPH), Core 2 will have five and a half times the design energy output and
twice the power density of Core 1. The Core 2 design is described and associated major developments in
reactor physics, metallurgy, heat transfer and fluid flow, and fuel element manufacture, are summarized.
Plans for decontamination of the reactor plant and for performing modifications to the plant in connection with
the installation of the higher rated Core 2 are described.
LA CENTRALE NUCLÉAIRE DE SHIPPINGPORT, EXPÉRIENCE DE SON FONCTIONNEMENT ET PLANS
POUR L*AVENIR. Les auteurs font le bilan des cinq années de fonctionnement et d'essai de la centrale nucléaire
de Shippingport; ils examinent les progrès techniques actuels et l'avenir du programme de Shippingport. Ce
programme vise à mettre au point la technologie fondamentale des réacteurs à eau légère pour permettre une
réduction du prix de revient de l'énergie d'origine nucléaire.
La centrale nucléaire de Shippingport fonctionne depuis plus de 5 ans et s'est intégrée facilement dans un
réseau d'interconnexion comme centrale de base ou comme centrale d'appoint. Les divers éléments de la
20914
210 H. FEINROTH é t a l -
centrale se sont révélés d'un fonctionnement sûr. Il n'y a pas eu de problème de contamination ni d'élimination
des déchets. On peut accéder facilement aux éléments du circuit primaire de refroidissement pour l'entretien
et, ce faisant, on a constaté que les cartouches de combustible étaient intactes. Chacune des trois opérations
de rechargement effectuées depuis le démarrage de la centrale a pris moins de temps que la précédente. Ré
cemment, la troisième charge de combustible enrichi a été mise en place en 32 journées de travail, soit
environ le quart du temps nécessaire pour le premier rechargement. Les auteurs exposent les conditions aux
quelles doit satisfaire la formation du personnel et donnent un aperçu des instructions écrites en matière d'ad
ministration, d'exploitation, etc., qui sont autant de facteurs essentiels du succès du programme de Shippingport.
Les résultats fournis par la série complète des essais réalisés à Shippingport sont comparés avec les calculs;
la concordance est satisfaisante. Les auteurs examinent aussi les performances du cceur du réacteur, la stabi
lité de l'installation et sa réponse aux variations de charge, les performances des cartouches de combustible et
des barres de contrôle, les effets à long terme tels que la corrosion et la radioexposition, le fonctionnement
des divers éléments constitutifs, etc.
Les auteurs examinent le principal objectif des programmes actuel et futur de Shippingport pour le dé
veloppement de la technique fondamentale des réacteurs refroidis à l'eau. On prévoit notamment de con
tinuer l'exploitation de la centrale et d'étudier, de fabriquer et d'essayer un deuxième cœur de réacteur à
longue durée de Vie et de grande puissance spécifique. Avec une puissance nominale brute de 150 MWe et
une durée de vie équivalant à 10 000 h de marche à pleine puissance pour la première charge de combustible
enrichi, le cœur N* 2 aura cinq fois et demie la production d'énergie prévue pour le cceur Ne 1 et deux fois
sa puissance spécifique. Les auteurs décrivent le cœur N® 2 et indiquent brièvement les principaux progrès
qui ont été réalisés à cet égard dans les domaines de la physique des réacteurs, de la métallurgie, du transfert
de chaleur, de la circulation du fluide caloporteur et de la fabrication des cartouches de combustible. Ils
exposent les plans de décontamination de la centrale nucléaire et les modifications qu'entrafnera l'installation
du cœur N* 2 plus puissant.
ШИППИНГПОРТСКАЯ АТОМНАЯ ЭЛЕКТРОСТАНЦИЙ, ОПЫТ ЭКСПЛУАТАЦИИ, УСОВЕРШЕНСТВОВАНИЯ И ПЛАНЫ НА
БУДУЩЕЕ. Дается оценка пяти годам эксплуатации и испытание Шиппингпортской электростанции, а
также рассматриваются последние технические усовершенствования и программа на будущее. Эта про
грамма направлена на усовершенствование основной технологии реакторов на обычной воде с тем;
чтобы создать основу для уменьшения в будущем стоимости ядерной электроэнергии.
Шиппингпортская реакторная установка, эксплуатировавшаяся пять лет, признана годной для
легкого подключения к системе энергоснабжения в качестве установки для базовой или пиковой на
грузок. Работа компонентов установки была надежной. Не возникало проблем, связанных с загряз
нением или удалением отходов. Доступ к компонентам первичной системы охлаждения для их обслу
живания 'был хорошим, что показывает целостность топливных элементов. Каждая из трех операций
по замене топлива в реакторе с момента его пуска требовала все меньше и меньше времени. Недавно . ч
была установлена третья запальная сборка, на что потребовалось 32 рабочих дня, т .е . около одной
четверти времени, потраченного на первую замену топлива. Описаны официальные требования в от
ношении подготовки персонала, письменных административных инструкций, руководств по энергети
ческой установке и т .д . , что явилось очень важным фактором в успешном осуществлении программы
испытаний Шиппингпортской электростанции.
Результаты испытаний хорошо совпадают с расчетными данными. Рассматриваются работа ак
тивной зоны реактора, стабильность установки, чувствительность к изменениям нагрузки, работа
топливных элементов и регулирующих стержней, повышение таких длительных эффектов, как коррозия
и интенсивность излучения, работа компонентов и т .д .
Рассматривается основная цель текущей и будущей программ Шиппингпортского проекта в отно
шении усовершенствования основной технологии реакторов с водяным охлаждением. Эта программа
включает продолжение эксплуатации Шиппингпортской установки, разработку, конструирование, из
готовление и опытную эксплуатацию второй активной зоны (активная зона 2 ) , имеющей длительный срок
службы и высокую плотность энерговыделения. Имея проектную электрическую мощность брутто 150 ыгвт
и продолжительность службы первой запальной сборки 10 тыс. часов работы на полной мощности, ак
тивная зона 2 будет в пять с половиной раз мощнее активной зоны 1 и обладать в два раза большей
плотностью энерговыделения, чем последняя. Дается описание конструкции активной зоны 2 и свя
занных с ней основных усовершенствований в физике реактора, металлургии, теплопередаче, подаче
теплоносителя и изготовлении топливных элементов. Изложены планы в отношении дезактивации ре
акторной установки и осуществления ее модификации в связи с 7 установкой более мощной активной
зоны 2.
Н*

SHIPPINGPORT POWER STATION 211
CENTRAL NUCLEOELÉCTRICA DE SHIPPINGPORT: EXPERIENCIA ADQUIRIDA CON SU EXPLOTACtóN Y
PROGRAMA DE DESARROLLO. Los autores exponen y analizan los resultados obtenidos en cinco aflos de ensayo
y explotación de la central nucleoeléctrica de Shippingport y examinan el programa de actividades en curso y
los planes para el futuro. Con ese programa se proyecta perfeccionar la tecnología básica de los reactores de
agua ligera, a fin de contribuir a la reducción de los costos de la energía nuclear.
La central nuclear de Shippingport viene funcionando desde hace más de 5 aflos y se ha comprobado
que su incorporación a una red de distribución, sea como central para carga básica o como central para carga
de cresta no plantea mayores dificultades. Los distintos componentes de la central se han comportado en
forma satisfactoria. No ha habido problemas de contaminación ni de evacuación de desechos. Ha sido fácil
el acceso a las partes del circuito primario de refrigeración, y se verificó el buen estado de los elementos
combustibles. Cada una de las tres operaciones de reabastecimiento efectuadas desde la iniciación de la
marcha exigió menos tiempo que la precedente. La tercera carga de material fértil se realizó recientemente
en 32 días de trabajo, o sea menos de un cuarto del tiempo que exigió la primera. Detallan los autores las
normas impuestas para la formación de personal, las instrucciones escritas en materia de procedimientos
administrativos, los manuales de trabajo de la central, etc. que han contribuido decisivamente al éxito de la
ejecución del programa de Shippingport.
Se comparan en la memoria los resultadas del extenso programa de ensayos aplicado en Shippingport
con los cálculos teóricos y se comprueba que concuerdan satisfactoriamente. Se examinan también el com
portamiento del cuerpo del reactor, la estabilidad de la central y su respuesta a las fluctuaciones de la carga,
el comportamiento de los elementos combustibles y de las barras de control, los efectos a largo plazo (cor
rosión, aumento de la intensidad de radiación), el comportamiento de las diversas partes de la central, etc.
Se examina en la memoria el objetivo principal del programa actual y futuro de Shippingport, para el
desarrollo de la tecnología básica de los reactores refrigerados con agua. Dicho programa comprende la ex
plotación de la central de Shippingport en forma continua, y el proyecto, diseflo, fabricación y explotación
experimental de un nuevo cuerpo de reactor de prolongada duración y elevada densidad de potencia, el de
nominado cuerpo № 2. Con una potencia nominal bruta de 150 MW(e) y una duración equivalente a 10 000 h
de funcionamiento a plena potencia, el cuerpo № 2 dará una producción de energía 5,5 mayor que la del
cuerpo N81 y su potencia especifica será el doble de la de este último. Se describen las características de
diseflo del cuerpo NB2 y se resumen los principales adelantos en materia de física de reactores, metalurgia,
transmisión de calor, circulación de fluidos, y elaboración de elementos combustibles. Por último, se des
criben los planes para la descontaminación de la central nuclear y para introducir en la misma las modifi
caciones exigidas por la instalación del cuerpo N“ 2, de mayor potencia.
1. INTRODUCTION AND SUMMARY
The purpose of this paper is to describe and evaluate the experience
obtained during five years of operation and testing of the Shippingport
Atomic Power Station and to discuss some of the more important current
technical developments and future plans of the United States Atomic Energy
Commission’s (USAEC) Shippingport programme.
The Shippingport Project was authorized in July 1953 and actual plant
construction started in March 1955 (Table I). The plant achieved initial
criticality on 2 December 1957; the generator was synchronized on the
Duquesne Light Company transmission system on 18 December 1957 and
was operating at a full power of 60 MW(e) on 23 December 1957, accumu
lating 100 effective full power hours (EFPH) by the end of the year. The
reactor portion of the Shippingport Plant was designed and developed
by the Bettis Atomic Power Laboratory under the direction of, and in
technical co-operation with, the Naval Reactors Group of the Commission’s
Division of Reactor Development. The Bettis Laboratory is operated for
the Commission by the Westinghouse Electric Corporation. The Duquesne
Light Company, which owns and operates the turbine-generator facilities
of the plant, assumed $5 million of the cost of the reactor portion of the

SH
IPP
ING
PO
RT
H
IGH
LIG
HT
S
212 H. FEINROTH et al.
* E
stim
ated
*
* As
of
31
Mar
ch
1963
.

SHIPPINGPORT POWER STATION 213
plant and is under contract to the Commission to supervise, operate, and
maintain the entire plant and to purchase the steam produced by operation
of the reactor. The Shippingport Project therefore represents in the United
States a joint endeavour of the Government, a public utility company and
an industrial concern.
From the very outset the Shippingport Project has been directed towards
advancing the basic technology of light-water-cooled reactors through the
design, development, building, testing and operation of a large power reactor
as part of a public utility system. The mission of the project has been,
and continues to be, to develop and advance the underlying technology so as
to provide a sound base for potential reductions in nuclear power costs,
rather than to reduce costs by merely optimizing existing technology. To
achieve this most important purpose, the reactor plant and its cores were
designed for flexibility of operation and extra instrumentation was incorpo
rated to provide information of an experimental and developmental nature.
Details of the design and construction of the plant can be found in papers
presented at the Geneva Conferences of 1955 and 1958 and in the book
entitled "Shippingport Pressurized Water Reactor" [1] .
Information on the Shippingport Project is broadly disseminated to the
nuclear industry as quickly as possible by means of unclassified periodic
and topical reports and special technical interim reports. To date more
than 1650 such reports have been issued [la] .
During its five years of operation the Shippingport Station has been
readily integrated into a large utility company’s electrical power system.
The reactor has performed well and has been proved capable of continuous
operation at rated power for extended periods. It has responded to load
transients with complete safety and without any operating problems. This
operating experience clearly shows that the plant is suitable for operation
either as a base-load or a peak-load station.
The major plant components have performed well during this period,
which has included three refuellings of the seed portion of the core. How
ever, three main coolant pumps were replaced, modifications, including
the plugging of some tubes, were made to the steam generators, and feed-
water heaters werfe retubed. The turbine-generator governor valves and the
moisture separator were redesigned. There were no significant problems
in contamination or waste disposal. From a radioactivity standpoint, access to primary coolant components for maintenance work was good, indicating
the advantage of high fuel-element integrity and of the lithium hydroxide
water chemistry that has been used in the primary coolant from the very
start of plant operation. Much was learned from the refuelling of the first
seed [2] of this highly instrumented core, with the result that the refuelling
of the second seed was performed in 44 working days - one-third the time
that was required for the first refuelling; 32 working days were required
for the third refuelling. These and other operations at Shippingport have
emphasized the importance and necessity of thoroughly trained station
personnel and the preparation of detailed operating and maintenance pro
cedures. For example, 94 individual refuelling procedures, approved by
the Commission, were used by Duquesne for the refuelling of Seed 3
with Seed 4.
214 H. FEINROTH et al.
Duquesne operating personnel are given classroom and on-the-job
training by the company. These personnel must pass comprehensive written
and oral examinations given by the Commission before they can be assigned
supervisory or operating responsibilities at Shippingport. The detailed
written procedures for operating the station are contained in the Shippingport
Atomic Power Station Manual, which consists of four volumes containing
over 100 chapters. This manual was prepared by Duquesne and the Bettis
Laboratory and was approved by the Commission before station start-up.
The manual is kept up to date, and all changes affecting the reactor plant
or radioactive-waste-disposal system must be approved by the Commission.
Further, in order to assure that station personnel will also perform
effectively under emergency conditions, various emergency situations are
periodically simulated by means of practice drills in which all personnel
perform their prescribed duties.
The first seed of the Shippingport Core 1, containing 75 kg of 93%
enriched uranium, was depleted in October 1959 after 5806 EFPH of oper
ation, generating 338.5 million kWh gross. The second seed, containing
90 kg of 93% enriched uranium and 170 g of natural boron, was depleted
in August 1961 after 7900 EFPH , generating 514.3 million kWh gross. The
third seed, which had the same loading as the second, was depleted in
November 1962 after 7329 E FPH of operation, generating 475 million kWh
gross. Thus, at the start of operation with the fourth seed in January 1963,
the core had generated a total of about 1400 million kWh gross, and the burn-
up in the natural uranium, Zircaloy-2 clad blanket fuel elements had reached
an average of 8450 MWd/t of uranium and a peak of 28 600 MWd/t. The total
output at Shippingport since the start of operation would be sufficient to
supply electric service to about 450 000 homes in Pittsburgh for one year.
Inspection of representative natural-uranium blanket elements after
operation with two seeds showed them to be in excellent condition, i.e.there
was no measurable distortion or swelling, very little crud build-up (average
of 0.1 mil), and less than 80 ppm of hydrogen pick-up by the Zircaloy
cladding. The examination of blanket elements removed after operation
with three seeds is not yet finished; however, no distortion or swelling has
been observed. A new core, which is discussed later in this paper, will be
installed upon the depletion of the fourth seed in the early part of 1964. It is
of interest to note that the first (Core 1) Shippingport core design specifi
cations called for a total blanket life of 8000 E F P H and so far the blanket
has operated successfully for over 21 000 E F P H .
The seed and blanket core concept used at Shippingport demonstrates:
(1) That it is feasible in a light-water system to obtain about 50% of total
core power from a blanket of natural uranium by using a seed, i. e. a small,
highly-enriched core, as the driving element; (2) That the inventory of
enriched fuel required can be significantly reduced; (3) That it is possible
to control the entire reactor core by using few control rods located in the
relatively small seed volume ; and (4) That a seed and blanket core pos
sesses a suitable negative temperature coefficient and a favourable dynamic
response. In this latter connection, the presence of extensive instrumen
tation in the core enables detection and correction of any xenon-induced
instabilities. These oscillations were easily controlled by the reactor oper-
SHIPPINGPORT POWER STATION 215
ator by slight adjustment of the control rods, but it was most important that
the operator be made aware of the oscillations so that the thermal capa
bilities were not exceeded in any local region of the core.
An extensive and comprehensive test programme has been followed as
part of plant operations from the very start. Even though the plant operates
most of the time as part of a utility company network, operations are de
termined largely by the needs of the test programme. For example, during
Seed-2 and Seed-3 operation, over 270 tests were performed. This test
programme has produced, and is producing, a wealth of data which can be
used in future designs of nuclear power plants employing light-water-cooled
reactors. Reactor physics calculational models and heat transfer and hy
draulic calculations are verified ; plant stability and response to load
changes are demonstrated; fuel element and control-rod performance are
observed; component reliability is checked; and long-term effects, such as
corrosion build-up and radiation-level build-up, are measured and reported.
The operation of Shippingport with its first core is continuing with three
main objectives:
(1) Continuing the large-scale irradiation of natural U 02 fuel elements
with Zircaloy-2 cladding to determine the maximum MWd/t of uranium
burn-up that these fuel elements can withstand;
(2) Obtaining information on the physics characteristics and thermal per
formance of seed and blanket cores as a function of fuel depletion and
demonstrating the continued generation of a high fraction of the power
from natural uranium in such cores;
(3) Obtaining data on the long-term behaviour of major plant components
and thus acquiring a realistic basis for judging the adequacy of com
ponent design specifications. Further, this operational experience
should pilot the long-term performance to be expected from similar
components in plants now under construction or in early stages of
operation.
The operation and testing of the Shippingport reactor, together with
developments undertaken in connection with Core 1, have shown ways to
develop a higher-power, longer-life core for the Shippingport Station. The
manufacture of such a core is now in progress, with completion scheduled
for the latter part of 1963. The principal objective of this advanced core
programme is the development of a very high performance core in terms
of both power density and lifetime. This core, designated as Coré 2, will
also be a seed and blanket core. It will have a rating of 150 MW(e) gross
in the Shippingport plant, about five and one-half times the design energy
output and about twice the power density of Core 1. Such performance
should lead to reductions in both fuel-cycle costs and plant-capital costs.
The fuel elements for Core 2 will consist of compartmented, flat plates
containing enriched UOa - ZrOa wafers in the seed elements and natural
U 02 wafers in the blanket elements. Such plates have been extensively
tested in-pile and out-of-pile and appear suitable for operation at high heat
fluxes and to large burn-ups. The fuel-element cladding material wül con
sist of an improved zirconium alloy, Zircaloy-4, which has less suscepti
bility to hydrogen pick-up than Zircaloy-2 and is, therefore, expected to
be more suitable for long-life cores. The seed fuel elements also will in
216 H. FEINROTH et al.
corporate self-shielded burnable poisons and zones of different uranium
concentration to reduce power peaking.
In addition to its higher power rating, Core 2 incorporates many sig
nificant changes from Core 1, such as change in geometry of the seed, in
creased size but reduced number of control rods, increase in length from
6 to 8 ft, a closure head of new design which incorporates a single central
refuelling port, addition of a support flange to the pressure vessel which
permits side exit of instrumentation leads rather than through the closure,
and modification of the coolant flow pattern to include two passes through
the natural uranium blanket. Major development efforts have been under
taken for this advanced core in the areas of reactor physics, computer codes, fuel poison and cladding materials, thermal and mechanical design (including
core instrumentation), power distribution, and heat transfer. An example
of the advances being made is the successful test irradiation of U 0 2 plate-
type elements to burn-ups of 75 000 MWd/t of uranium at Core-2 operating
conditions.
The accommodation of Core 2 in the Shippingport plant will require
certain plant modifications, specifically in the steam drums, main coolant
pumps, and reactor control equipment. Since the core is rated at 150 MW(e),
whereas the station turbine-generator is rated at 100 MW(e), additional heat
removal capacity in the form of a heat-dissipation system is being installed
to handle the power produced in the core in excess of the generator rating.
This combination of turbine-generator and heat dissipation system will meet
all the requirements for testing the 150-MW(e) reactor plant and its core.
To sum up, the Shippingport Station has proved well suited to integrated
operation on an electric utility system and is providing a large amount of
operational data and experience on the reactor and plant systems and components. In keeping with its primary goal of developing and advancing the
basic technology of water reactors, the Shippingport programme is now
concentrating on core development to provide the basis for significant po-.
tential reductions in nuclear power costs.
2. STATION OPERATING EXPERIENCE
Fig. 1 shows a view of the Shippingport Atomic Power Station. A sche
matic diagram indicating the basic components of the reactor and steam
plant is shown in Fig.2. The principal elements of the reactor plant are
the reactor vessel, which contains the nuclear core, and the four main
coolant loops which circulate the reactor coolant water between the core and
steam generators. Each of the four main coolant loops contains a single-
stage, centrifugal, canned motor pump, a steam generator, four isolation
valves, a check valve, and interconnecting 18-in piping. The heat absorbed
by the reactor coolant in passing through the core is given up to the steam
plant water on the secondary side of the steam generator. The 600-lb/in2
abs. steam which is produced is delivered to an 1800-rpm turbine-generator
with rated capability of 100 M W . The core is a seed and blanket design con
sisting of two types of fuel elements assembled into a right circular cylinder.
The active core is about 6-ft high and 6 ft 9^ in in diameter. The highly-
enriched uranium which forms the seed is contained in 1914 plates clad with
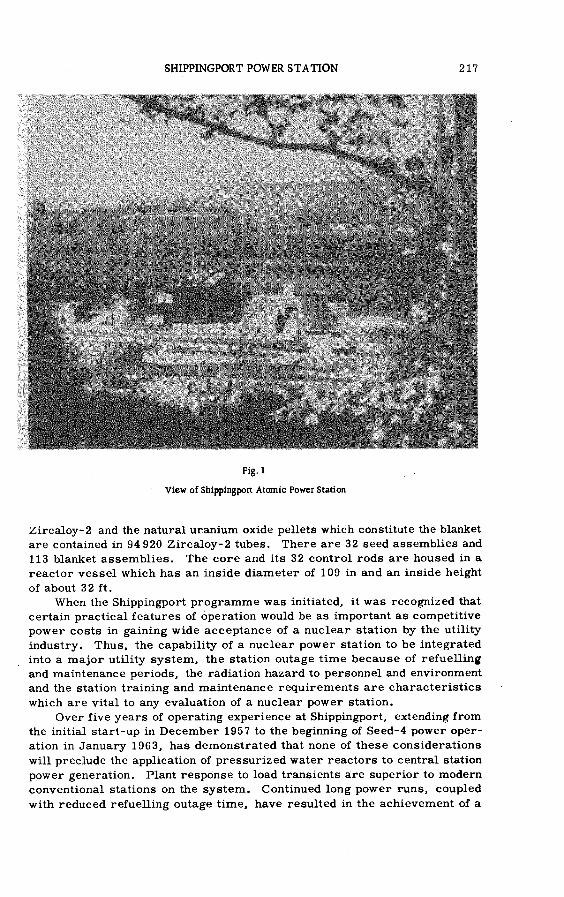
SHIPPINGPORT POWER STATION 217
Fig.i
View of Shippingport Atomic Power Station
Zircaloy-2 and the natural uranium oxide pellets which constitute the blanket
are contained in 94 920 Zircaloy-2 tubes. There are 32 seed assemblies and
113 blanket assemblies. The core and its 32 control rods are housed in a
reactor vessel which has an inside diameter of 109 in and an inside height
of about 32 ft.
When the Shippingport programme was initiated, it was recognized that
certain practical features of operation would be as important as competitive
power costs in gaining wide acceptance of a nuclear station by the utility
industry. Thus, the capability of a nuclear power station to be integrated
into a major utility system, the station outage time because of refuelling
and maintenance periods, the radiation hazard to personnel and environment
and the station training and maintenance requirements are characteristics
which are vital to any evaluation of a nuclear power station.
Over five years of operating experience at Shippingport, extending from
the initial start-up in December 1957 to the beginning of Seed-4 power oper
ation in January 1963, has demonstrated that none of these considerations
will preclude the application of pressurized water reactors to central station
power generation. Plant response to load transients are superior to modern
conventional stations on the system. Continued long power runs, coupled
with reduced refuelling outage time, have resulted in the achievement of a
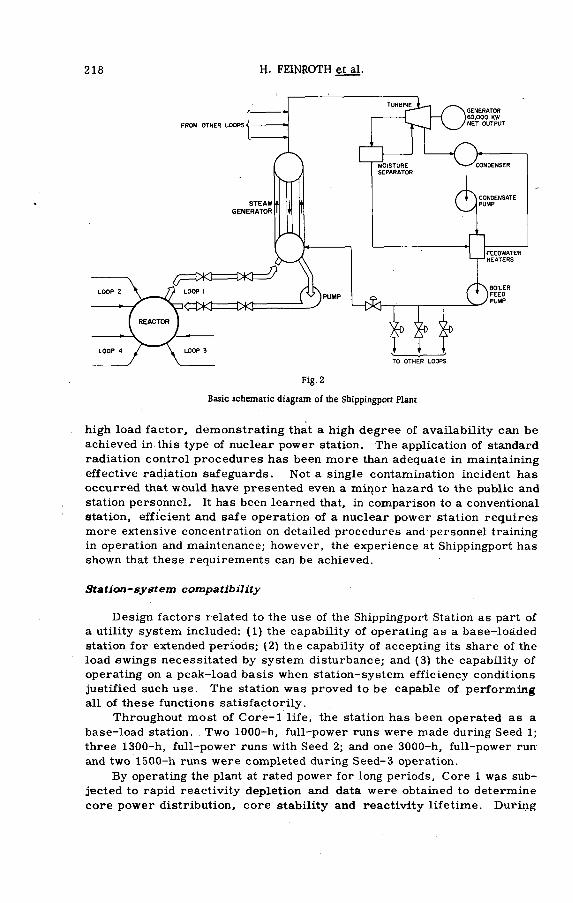
218 H. FEINROTH et al.
Basic schematic diagram of the Shippingport Plant
high load factor, demonstrating that a high degree of availability can be
achieved in this type of nuclear power station. The application of standard
radiation control procedures has been more than adequate in maintaining
effective radiation safeguards. Not a single contamination incident has
occurred that would have presented even a mirror hazard to the public and
station personnel. It has been learned that, in comparison to a conventional
station, efficient and safe operation of a nuclear power station requires
more extensive concentration on detailed procedures and personnel training
in operation and maintenance; however, the experience at Shippingport has
shown that these requirements can be achieved.
Statioa-system compatibility
Design factors r elated to the use of the Shippingport Station as part of
a utility system included: (1) the capability of operating as a base-loaded
station for extended periods; (2) the capability of accepting its share of the
load swings necessitated by system disturbance; and (3) the capability of
operating on a peak-load basis when station-system efficiency conditions
justified such use. The station was proved to be capable of performing
all of these functions satisfactorily.
Throughout most of Core-1 life, the station has been operated as a
base-load station. Two 1000-h, full-power runs were made during Seed 1;
three 1300-h, full-power runs with Seed 2; and one 3000-h, full-power run
and two 1500-h runs were completed during Seed-3 operation.
By operating the plant at rated power for long periods. Core 1 w^s sub
jected to rapid reactivity depletion and data were obtained to determine
core power distribution, core stability and reactivity lifetime. During
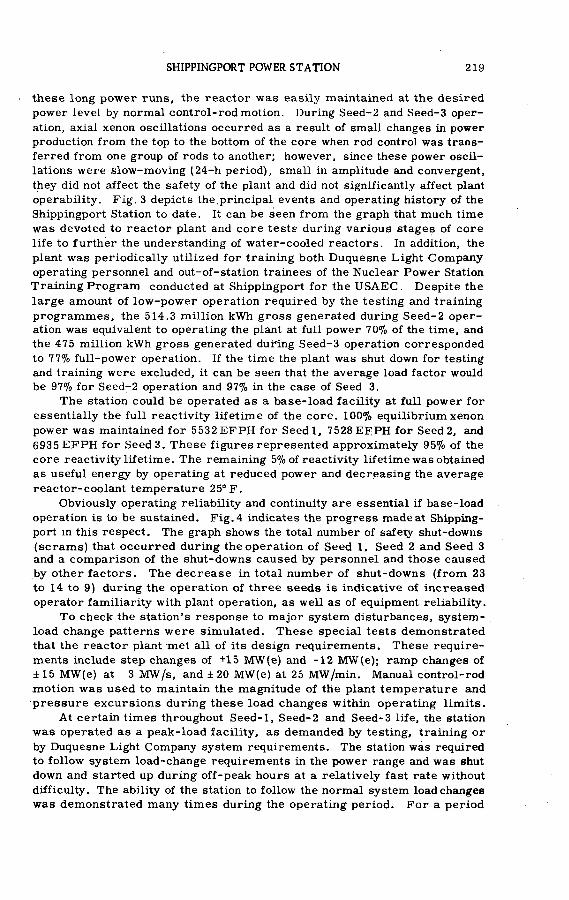
SHIPPINGPORT POWER STATION 219
these long power runs, the reactor was easily maintained at the desired
power level by normal control-rod motion. During Seed-2 and Seed-3 oper
ation, axial xenon oscillations occurred as a result of small changes in power
production from the top to the bottom of the core when rod control was trans
ferred from one group of rods to another; however, since these power oscil
lations were slow-moving (24-h period), small in amplitude and convergent,
they did not affect the safety of the plant and did not significantly affect plant
operability. Fig. 3 depicts the.principal events and operating history of the
Shippingport Station to date. It can be seen from the graph that much time
was devoted to reactor plant and core tests during various stages of core
life to further the understanding of water-cooled reactors. In addition, the
plant was periodically utilized for training both Duquesne Light Company
operating personnel and out-of-station trainees of the Nuclear Power Station
Training Program conducted at Shippingport for the USAEC . Despite the
large amount of low-power operation required by the testing and training
programmes, the 514.3 million kWh gross generated during Seed-2 operation was equivalent to operating the plant at full power 70% of the time, and
the 475 million kWh gross generated duMng Seed-3 operation corresponded
to 77% full-power operation. If the time the plant was shut down for testing
and training were excluded, it can be seen that the average load factor would
be 97% for Seed-2 operation and 97% in the case of Seed 3.
The station could be operated as a base-load facility at full power for
essentially the full reactivity lifetime of the core. 100% equilibrium xenon
power was maintained for 5532 E FPH for Seedl, 7528 E FPH for Seed 2, and
6935 EFPH for Seed3. These figures represented approximately 95% of the
core reactivity lifetime. The remaining 5% of reactivity lifetime was obtained
as useful energy by operating at reduced power and decreasing the average
reactor-coolant temperature 25° F .
Obviously operating reliability and continuity are essential if base-load
operation is to be sustained. Fig. 4 indicates the progress made at Shipping-
port in this respect. The graph shows the total number of safety shut-downs
(scrams) that occurred during the operation of Seed 1, Seed 2 and Seed 3 and a comparison of the shut-downs caused by personnel and those caused
by other factors. The decrease in total number of shut-downs (from 23
to 14 to 9) during the operation of three seeds is indicative of increased
operator familiarity with plant operation, as well as of equipment reliability.
To check the station’s response to major system disturbances, system
load change patterns were simulated. These special tests demonstrated
that the reactor plant met all of its design requirements. These require
ments include step changes of +15 MW(e) and -12 MW(e); ramp changes of
±15 MW(e) at 3 MW/s, and ±20 MW(e) at 25 MW/min. Manual control-rod
motion was used to maintain the magnitude of the plant temperature and
pressure excursions during these load changes within operating limits.
At certain times throughout Seed-1, Seed-2 and Seed-3 life, the station
was operated as a peak-load facility, as demanded by testing, training or
by Duquesne Light Company system requirements. The station was required
to follow system load-change requirements in the power range and was shut
down and started up during off-peak hours at a relatively fast rate without
difficulty. The ability of the station to follow the normal system load changes
was demonstrated many times during the operating period. For a period

220 H. FEINROTH et al.
Fig
.3
Oper
atin
g
hist
ory
of
Ship
pin
gport
Sta
tion
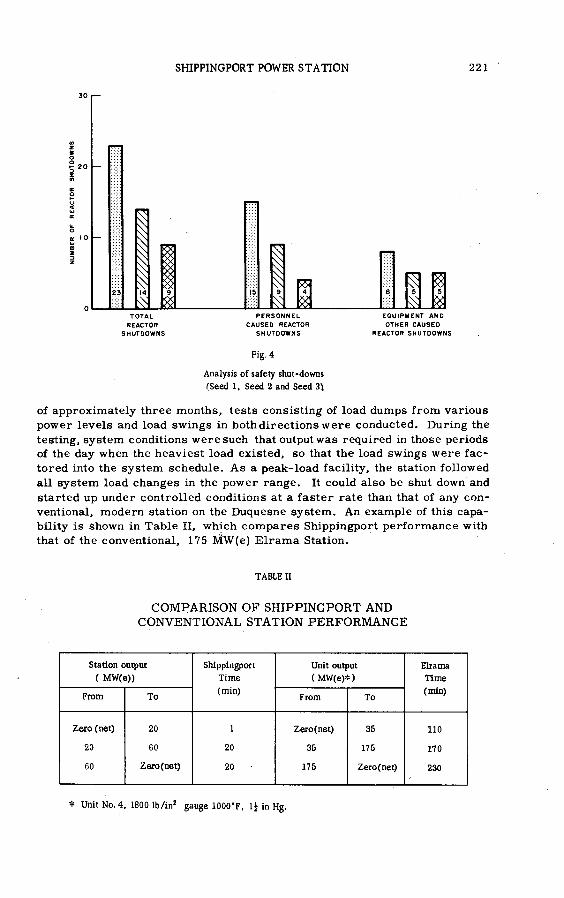
SHIPPINGPORT POWER STATION 221
REACTOR C AUS ED REACTOR O T H E R CA USE OS HU T D O W N S S H U T D O W N S RE ACT OR S HU T D O W N S
Fíg. 4
Analysis of safety shut-downs
(Seed 1, Seed 2 and Seed 3\
of approximately three months, tests consisting of load dumps from various
power levels and load swings in both directions were conducted. During the
testing, system conditions were such that output was required in those periods
of the day when the heaviest load existed, so that the load swings were fac
tored into the system schedule. As a peak-load facility, the station followed
all system load changes in the power range. It could also be shut down and
started up under controlled conditions at a faster rate than that of any con
ventional, modern station on the Duquesne system. An example of this capa
bility is shown in Table II, which compares Shippingport performance with
that of the conventional, 175 MW(e) Elrama Station.
TABLE II
COM PARISON OF SHIPPINCPORT AND
CONVENTIONAL STATION PERFORM ANCE
Station output
( MW(e))
Shippingport
Time
(min)
Unit output
(M W (e)*)
Eliama
Time
(min)From To From To
Zero (net) 20 1 Zero (net) 35 110
20 60 20 35 175 170
60 Zero (net) 20 175 Zero (net) 230
* Unit No.4, 1800 lb/in2 gauge 1000'F, 1^ in Hg.
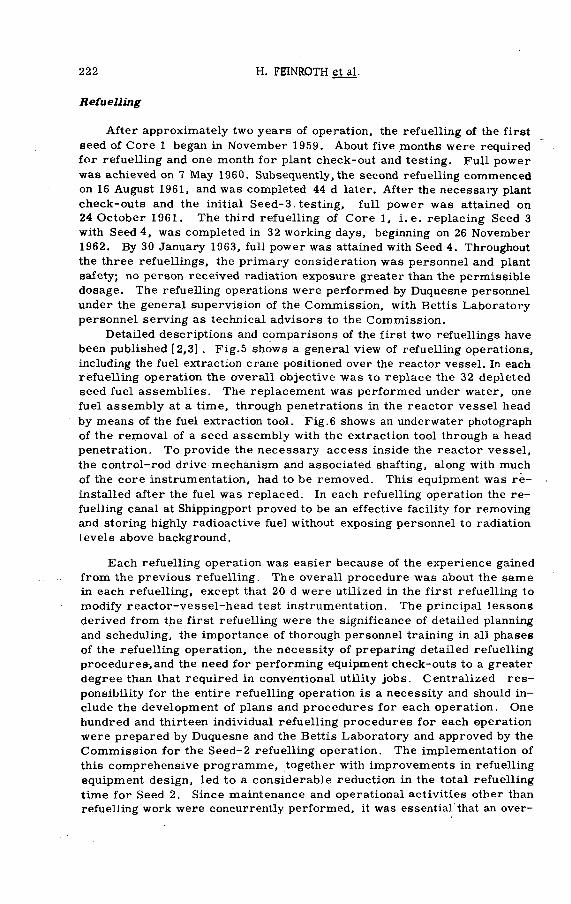
222 H. FEINROTH et al.
Refuelling
After approximately two years of operation, the refuelling of the first
seed of Core 1 began in November 1959. About five months were required
for refuelling and one month for plant check-out and testing. Full power
was achieved on 7 May 1960. Subsequently, the second refuelling commenced
on 16 August 1961, and was completed 44 d later. After the necessary plant
check-outs and the initial Seed-3 . testing, full power was attained on
24 October 1961. The third refuelling of Core 1, i.e. replacing Seed 3
with Seed 4, was completed in 32 working days, beginning on 26 November
1962. By 30 January 1963, full power was attained with Seed 4. Throughout
the three refuellings, the primary consideration was personnel and plant
safety; no person received radiation exposure greater than the permissible
dosage. The refuelling operations were performed by Duquesne personnel
under the general supervision of the Commission, with Bettis Laboratory
personnel serving as technical advisors to the Commission.
Detailed descriptions and comparisons of the first two refuellings have
been published [2,3] . Fig.5 shows a general view of refuelling operations,
including the fuel extraction crane positioned over the reactor vessel. In each refuelling operation the overall objective was to replace the 32 depleted
seed fuel assemblies. The replacement was performed under water, one
fuel assembly at a time, through penetrations in the reactor vessel head
by means of the fuel extraction tool. Fig.6 shows an underwater photograph
of the removal of a seed assembly with the extraction tool through a head
penetration. To provide the necessary access inside the reactor vessel,
the control-rod drive mechanism and associated shafting, along with much
of the core instrumentation, had to be removed. This equipment was re
installed after the fuel was replaced. In each refuelling operation the re
fuelling canal at Shippingport proved to be an effective facility for removing
and storing highly radioactive fuel without exposing personnel to radiation
levels above background.
Each refuelling operation was easier because of the experience gained
from the previous refuelling. The overall procedure was about the same
in each refuelling, except that 20 d were utilized in the first refuelling to
modify reactor-vessel-head test instrumentation. The principal lessong
derived from the first refuelling were the significance of detailed planning
and scheduling, the importance of thorough personnel training in all phases
of the refuelling operation, the necessity of preparing detailed refuelling
procedures; and the need for performing equipment check-outs to a greater
degree than that required in conventional utility jobs. Centralized res
ponsibility for the entire refuelling operation is a necessity and should in
clude the development of plans and procedures for each operation. One
hundred and thirteen individual refuelling procedures for each operation
were prepared by Duquesne and the Bettis Laboratory and approved by the
Commission for the Seed-2 refuelling operation. The implementation of
this comprehensive programme, together with improvements in refuelling
equipment design, led to a considerable reduction in the total refuelling
time for Seed 2. Since maintenance and operational activities other than
refuelling work were concurrently performed, it was essential that an over-

SHIPPINGPORT POWER STATION 223
Fig. 5
Operations in fuel canal room during Shippingport refuelling
all supervisor co-ordinate these efforts with the refuelling programme, in
order to avoid a conflict of operations and thereby minimize the time re
quired to return the plant to full power. This co-ordination is particularly
important in the latter stages of refuelling where non-refuelling work can
impede progress. The effect of familiarity with refuelling operations and
improved planning and training is reflected in the reduction of refuelling
time from the second to the third refuelling - two practically identical oper
ations. Table III shows a break-down of the refuelling operations and com
pares the actual time and the percentage of the total actual time for the
three refuelling periods. The 32 work days required for the third refuelling
are comparable to the down time for a normal overhaul of a modern, central
station, high-temperature, high-pressure boiler.
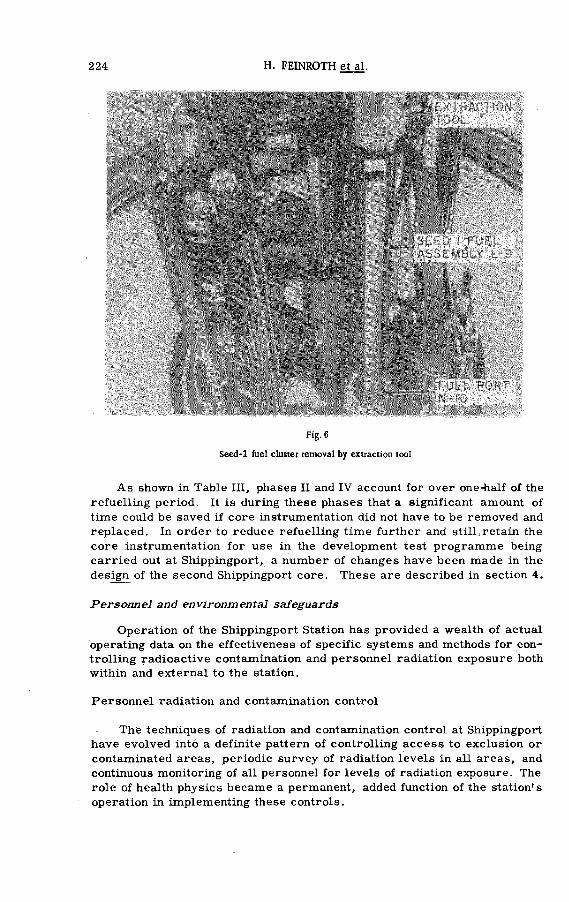
224 H. FEINROTH et al.
Fig. 6
Seed-1 fuel cluster removal by extraction tool
As shown in Table III, phases II and IV account for over one-half of the
refuelling period. It is during these phases that a significant amount of
time could be saved if core instrumentation did not have to be removed and
replaced. In order to reduce refuelling time further and still;retain the
core instrumentation for use in the development test programme being
carried out at Shippingport, a number of changes have been made in the
design of the second Shippingport core. These are described in section 4.
Personnel and environmental safeguards
Operation of the Shippingport Station has provided a wealth of actual
operating data on the effectiveness of specific systems and methods for con
trolling radioactive contamination and personnel radiation exposure both
within and external to the station.
Personnel radiation and contamination control
The techniques of radiation and contamination control at Shippingport
have evolved into a definite pattern of controlling access to exclusion or
contaminated areas, periodic survey of radiation levels in all areas, and
continuous monitoring of all personnel for levels of radiation exposure. The
role of health physics became a permanent, added function of the station's
operation in implementing these controls.
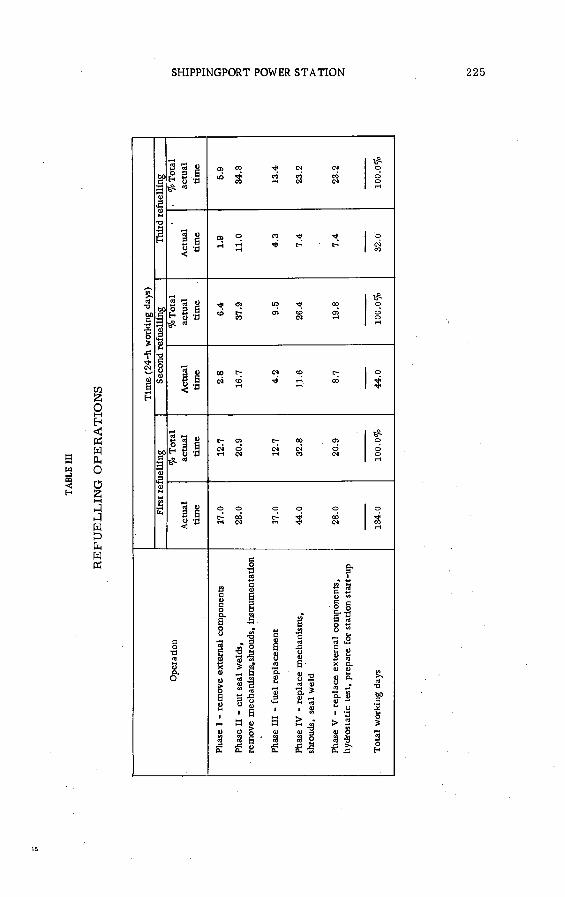
RE
FU
EL
LIN
G
OP
ER
AT
IO
NS
SHIPPINGPORT POWER STATION
» S *■* ..i o d03 со
i
I g
вd
Sн
S 4)
e J < 0
o•d
0)O
• BЯ g а) oS s
,2 S
s *a« 3 ri Q. ^0) Г-4
и îhV sc3 g£ I
O o
r s 8 «■
c /» S gx eu o o o) a,8 j* ’S. 20 *-*•- y1 *H> 2CL) S3 3X >. CL. J 3
oH
2 2 5

226 H. FEINROTH et al.
Since an essential part of dosage control is the measurement of the
radiation received by each individual, all personnel at Shippingport are
continuously monitored, and the dosage measurements are tffen used both
as a final control on personnel dosage rates and as a record of dosages
actually received.
The bar graph in Fig.7 shows the total dosage received by the personnel
in different work groups. Since the radiation exposure per man may be
reduced by having more men on a job, a graph totalizing the dosage is con
sidered to be more meaningful in evaluating the requirements of overall
radiation control than the conventional "per man hour" unit used in accident
records. The comparatively high total dosage received by those under the
classification "Others" during some quarters should be deemphasized in
light of the very large number of persons involved and the inaccuracy of
film badge determinations at low dosages. The graph shows that mainte
nance personnel received the most radiation doságe; a majority of this
dosage was the result of many man-hours spent in moderate (10-20 mr/h)
radiation fields. This radiation emanates almost entirely from radioactive
corrosion products deposited in the primary coolant system.
As indicated on Fig.7, radiation dosages received by Shippingport
personnel were very low during Seed-1, Seed-2 and Seed-3 operations. Office
spaces and other normally occupied areas of the plant have shown only back
ground radiation levels. Shut-down radiation levels in the access areas of
the reactor plant have been essentially constant throughout core life. A radi
ation survey taken in August 1961 is shown in Fig.8. The numbers that are
circled represent readings in mr/h 2 d after shut-down from power oper
ation. Late in Seed-3 life the survey was repeated, and no significant
changes in radiation levels were noted.
Radiation surveys of reactor plant components were made periodically
throughout core life. Near the end of Seed-1 operation the radiation levels
on the primary coolant piping were measured 2 h after a prolonged 100%
power operation. Values of the magnitude of 60-70 m r/h were recorded.
Repeat surveys at comparable times in Seed-2 and Seed-3 life indicated
values on the order of 70-80 m r/h and 75-85 mr/h, respectively. These
measurements indicate that corrosion product contamination does build up
in the coolant system with time, but at a slow rate. Average radiation
measurements on the reactor vessel head in the vicinity of the control-rod
mechanisms were found to be about 800 mr/h during Seed-1 operation. This
of course, was an important source of radiation during refuelling operations.
However, periodic control rod exercises to flush out crud build-up in the
mechanism region during Seed-2 and Seed-3 operations resulted in a re
duction,of the average radiation level to 400-500 mr/h and contributed sig
nificantly to reducing the general reactor-vessel-head radiation levels during
refuelling.One of the more important phases of radiation control is the prevention
of accidental high exposures in the reactor plant while the station is at power.
An effective control procedure was evolved. Areas in the primary plant
container where high radiation levels exist, e. g. reactor chamber, pressur-
izer cubicle, and flash tank cubicle, were designated exclusion areas. Special
warning signs and locked chains were placed across the entrances to these

SHIPPINGPORT POWER STATION 227
O P E R A TIO N S : O P E R A T O R S , T E S T P E R S O N N E L -, C H E M IS T S M A IN T E N A N C E : M A IN TE N A N C E P E R S O N N E L , H E A L T H P H Y S IC S P E R S O N N E L C O N T R A C TO R S : C O N T R A C T O R P E R S O N N E LO T H E R S : O F F IC E P E R S O N N E L , S T U D E N T S , M A N A G E M E N T , V IS IT O R S
A N O O T H E R S N O T N O R M A L L Y E X P O S E D T O R A O IA T O N N U M B E R S A D J A C E N T T O C O LU M N S ARE T H E T O T A L IN E A C H G R O U P (A V E R A G E Q U A R T E R L Y )
135
3 9 6 6
125
I 1 I I I Г
O P E R A T IO N S : AV G - P E R PE R S O N 11.6 MREM
I I I
M A IN T E N A N C E : AVG . P E R PE R S O N 4 0 .0 M R E M
j C O N T R A C T O R S : A V G . P E R P E R S O N Ю .З M R EM
O T H E R S : A V G . P E R P E R S O N 1 .5 MREM ( L A S T 3 Q U A R T E R S )
O P E R A T IO N S : AV G . P E R P E R S O N 9 2 .5 M R EM
M A IN T E N A N C E : AVG. P E R PE R S O N 3 2 4 .2 MREM:-:-
I C O N T R A C T O R S : AVG . PER PER S O N 16.5 M REM
O T H E R S : AVG . P E R P E R S O N 1,6 M R E M
lO P E R A TlO N S : AVG. PER PERSON 139.0 MREM
:■ M A IN TE N A N C E : AVG . PER P E R S O N 4 8 1 .6 M R EM :-:
:*C O N T R A C T O R S : AV G . PER PER S O N 2 8 8 .0 MREM
1 O T H E R S : AV G . P E R P E R S O N 4 . 0 M REM
I O P E R A T IO N S : AVG. PER PERSON 163.0 MREM
126
196
2 4 2 3
:: M A IN T E N A N C E : AV G . P E R PERSON 3 1 4 .0 M R E M Ï
X C O N T R A C T O R S : AVG . PER P E R S O N 9 7 .2 M R E M :
O T H E R S : AV G . P E R P E R S O N 6 .3 MREM
M A IN T E N A N C E : AVG . P E R P ER S O N 3 3 4 . 0 MREM Х х Х х Х х Х х Х х Х х Х х Х х Х ^ г .г -
I C O N T R A C T O R S : AV G . P E R P E R S O N 7 6 .2 M REM
O T H E R S : AV G . PER P E R S O N 1.4 M REM
A V E R A G E Q U A R T E R L Y O O S A G E , REM
Fig. 7
Shippingport Atomic Power Station radiation dosage summary
areas. Before any of these chains could be removed, except in an emergency,
a "radiation clearance form" had to be issued by the operations supervisor.
The form prescribed the required radiation control measures and was posted
at the area entrance. Before removing the radiation clearance, the areas
had to be evacuated and the barriers had to be replaced.
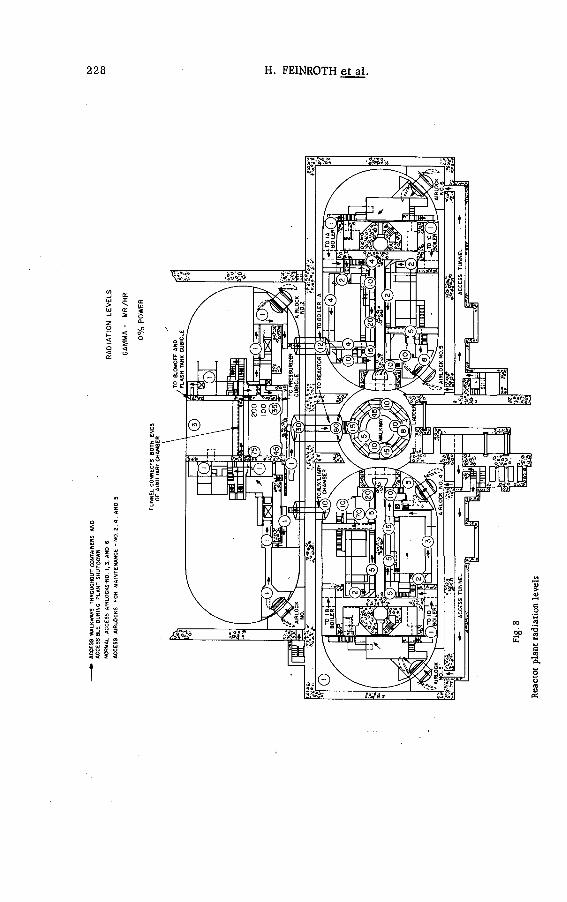
228 H. FEINROTH et al.
Fig
.8
Rea
ctor
plan
t ra
diat
ion
levels

SHIPPINGPORT POWER STATION 229
Because of the presence of tritium and radioactive corrosion products
in the reactor coolant, it is important to minimize coolant leakage from the
primary system. (During Seed-1 and Seed-2 operations the reactor plant
leakage was of the order of 35 to 50 gal/h. ) This leakage is from primary
coolant component discharge lines with most of the leakage coming from
the four relief valves on the reactor vessel and the two relief valves on the
pressurizer. The reactor coolant leakage is coHected into the blow-off tank
and then discharged to the waste disposal system, where it is processed.
This coolant leakage has readily been made up by the high-pressure charging
pumps, which have a total capacity of 3000 gal/h.
During the second refuelling four relief valves which were the principal
source of primary coolant leakage were disassembled, inspected and their
seats honed. Tests indicate that this maintenance on the relief valves has
significantly reduced the plant leak rate. During Seed-3 operation, reactor
plant leakage was of the order of 5 to 10 gal/h.
In conclusion, no health or operating hazards have been experienced
during the four years of Shippingport operation.
Environmental monitoring
A continuous environmental monitoring programme has been conducted
at Shippingport. The results obtained to date from this programme indicate
there has been no measurable increase in activity due to Shippingport oper
ations. These results confirm earlier expectations based on evaluations
of the minimal amounts of activity discharged from the plant. In addition,
it is concluded that, since they are less affected by environmental factors
not connected with the plant, monitors at sampling locations closer tb the
site will provide information which is satisfactory and accurate. Accord
ingly, some distant monitoring locations were recently eliminated. Concomitant with this elimination, arrangements were made to provide to the
Pennsylvania Department of Health some of the resulting excess monitoring equipment to be used in the vicinity of Shippingport in the state’s radiation
surveillance network.
Waste-disposal system
In the first four years of operation at Shippingport, the waste-disposal system has performed adequately over a wide range of conditions [4]. The
criteria for the discharge of radioactive wastes are contained in a permit
granted to Duquesne Light Company by the Commonwealth of Pennsylvania.
Under the terms of the permit, a maximum of 6200/jc/d and a yearly average of 1590|ic/d of radioactivity may be discharged to the Ohio River.
Tritium has an individual discharge limit of 10 c/d averaged over 365 con
secutive days and a maximum of 50 c/d. In all cases the concentration of
radioactivity in the final effluent discharged to the river or atmosphere must
not be more than one-tenth the maximum permissible concentration, as
given in National Bureau of Standards Handbook No.69. Concurrent with
the revision of the Pennsylvania Radiation Safety Code in 1962, an increase
of the daily permissible maximum and average discharge rates by a factor
of 10 to 62 000 fj.c and 15 900 /лс,respectively, was granted. The increase

230 H. FEINROTH et al.
was requested upon invitation by state authorities and not because of any
operational need. Although an increase in discharge rate is permitted,
Shippingport operations continue to use the former limitations as an oper
ational policy and have consistently maintained the radioactive release well
within those limits.
As shown in Fig.9, the waste-disposal system functions quite adequately
to keep discharges to an acceptable minimum. The chart shows the total
monthly discharge of radioactivity into the Ohio River. There are three
periods of peak loads that occurred as a result of decontamination processing
of clothing and equipment during the three refuellings. All of these quan
tities are considerably less than the maximum average allowable under the
terms of the waste-disposal permit;
Although tritium is not shown in Fig.9, the average discharge over a
four-year period was only one-sixtieth of the average allowable tolerance
level under the terms of the waste-disposal permit. At the present time,
tritium activity in the coolant has been reduced to an insignificant level.
The recent two-months' average of tritium discharged was 0.02 c/d.
In December 1960 isotopically pure lithium (99.99% Li-7) was made
available as lithium hydroxide for pH control of the reactor coolant. Since
the primary source of tritium in the reactor coolant is Li-6, the concentration
has been greatly reduced. A maximum concentration of tritium of 280 /исД
was reached during Seed-1 operations; at the present time the concentration
in the coolant is only 2 цс/1.
The operation of the Shippingport reactor has thus far been character
ized by coolant fission-product activity levels considerably lower than those
the waste-disposal system was designed to handle. The primary coolant -
purification system and the waste-disposal system were designed to operate
with as manyas 1000 defected blanket fuel elements in the core. During"
Seed-1 and Seed-2 operations the fuel-element detection and location (FEDAL)
system indicated that there probably were several slightly defected fuel rods
in the blanket, and these were removed during the second refuelling for
examination. The distribution level of fission products in the primary coolant
has been so low that it could be accounted for entirely on the basis of the
fission products produced by the 2^ ppm of natural uranium which exists
as an impurity in the Zircaloy cladding. Based on the performance of the
waste disposal system to date, it is concluded that an adequate margin exists
in the waste-disposal system to meet any processing requirements at
Shippingport.
E m er g en c y plans in the event of a radioactive release
Although it is highly improbable that a release of hazardous quantities
of fission products to the environment or beyond the site boundaries will take place, it is considered prudent to be prepared for handling such an
emergency. For this reason an emergency plan has been prepared to assure
a rapid and orderly implementation of those steps which would be required
to minimize any hazard to the surrounding population. The emergency plan
covers both radioactive discharge into the atmosphere and radioactive dis
charge into the Ohio River. It includes the immediate and follow-up actions
to be taken by Duquesne and Commission personnel in determining the
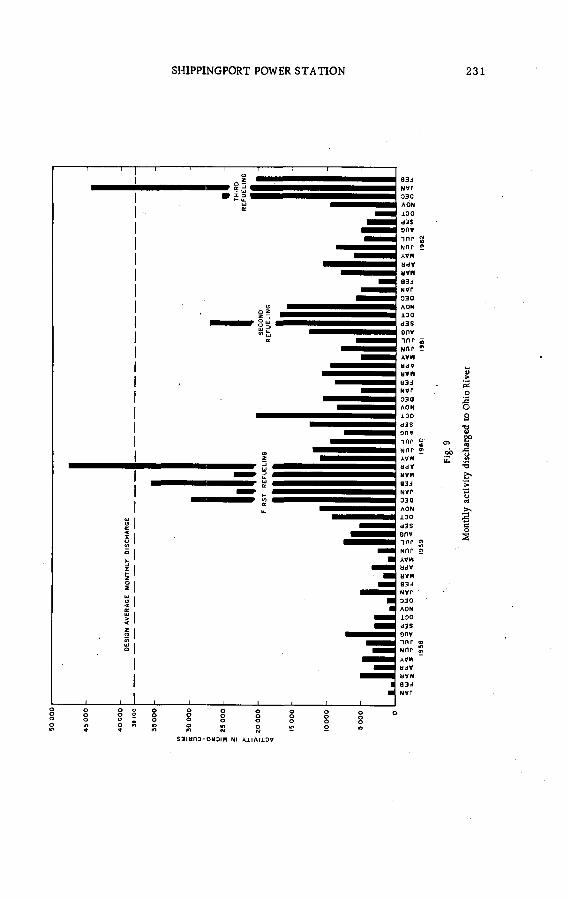
50
ОО
О
SHIPPINGPORT POWER STATION 231
83dNVP030AON100d 3 SonvППГ 2 Nfir 2 AVW d d V dVHaid NVr 0 3 0
AON 100 d a s
onv ЛПГ ¡¿ NOT * AVN
d d V tí» И 9 3 J NVT 0 3 0 AON 100 d 3 S OflV W O' NflC » AV*
d d V d V W
8 3 d NVP 0 3 0
AON 1 0 0
d 3 S onv i n r 2 Nfin 2AV Hd d V
d V M83d NVT 030 AON 100 d3S 9nv ЛПГ ®Nfir £AVMb d V
d*W83dNVr
S 3 lb n O -O d D I W NI A 1 IA 1 1 Q V
Fig
. 9
Month
ly
acti
vity
dis
char
ged
to
Ohi
o Riv
er

232 H. FEINROTH et al.
amount of radioactivity released, in limiting its effects as much as possible
and in securing any outside help required.
To assure that station personnel understand emergency procedures and
will perform effectively under emergency conditions, various emergency
situations are simulated by means of practice drills. These drills are con
ducted to reveal weaknesses in the procedures and to familiarize personnel
with the actions they are expected to take during an emergency. As a result,
many detailed changes have been made to further improve the effectiveness
of these procedures.
Training, procedures and m anuals
Formal personnel training and certification, written administrative
procedures, power plant manuals, and other documents are considered
necéssary for the safe and effective operation of a nuclear power station.
They have proved to be essential to the successful implementation of the
Shippingport programme.
Shippingport Atomic Power Station Manual
A manual consisting of four volumes with over 100 chapters contains
detailed procedures for operating and maintaining the station. It was
prepared by Duquesne and Bettis Laboratory personnel and was approved
by the Commission before station start-up. The manual is kept up-to-date
to reflect any changes in procedures or plant modifications and any changes
affecting the reactor plant or radioactive waste-disposal system are approved
by the Commission.
Training and certification of Duquesne Station operating personnel
To comply with the requirement that operating personnel be certified
by the Commission, personnel selected as candidates for station operation
are given approximately six weeks of classes and eight to twelve weeks on- the-job training by Duquesne. When a trainee has satisfactorily demonstrated
•his ability as an operator or operating supervisor, an application is sub
mitted to the Commission for the trainee’s certification. The application
contains a certificate of medical examination together with data which indi
cate that the applicant has completed the required training and is considered
by Duquesne to have the proper qualifications. Upon acceptance of the appli
cation, the applicant must pass a comprehensive written and oral examination
given by the Commission. After successful completion of both examinations
the applicant is certified for two years, after which time he must be recerti
fied. To date, seventeen supervisors and twelve operators are certified.
Station test programme
The Shippingport test programme was designed to extract and process
technical data from the operation of the station and to make these available
to the nuclear industry. The initial function of the test programme, that of
proving out the installation and design of equipment and systems before and

SHIPPINGPORT POWER STATION 233
after the initial operation of the station, was completed in 1958. The test
programme since then has been conducted to obtain detailed information on
the performance of the station, systems and equipment. Detailed written
procedures for conducting tests and subsequent test evaluation reports are
prepared by the Bettis Laboratory and Duquesne and are approved by the
Commission. During Seed-2 and Seed-3 operation over 270 tests were
performed;
Station administrative manuals
Manuals have been prepared by Duquesne to specify the organization
and responsibilities of Duquesne personnel for operating the station, refuelling
the reactor and performing maintenance operations on the reactor plant.
In addition, these manuals prescribe the administrative procedures to exe
cute these responsibilities. The responsibilities and duties of the various
personnel involved in these activities are defined so as to provide complete
instructions to station personnel for the safe conduct of station operations.
The manuals have been approved by the Commission and complement the
approved operating, refuelling and maintenance procedures.
3. CORE A N D P L A N T P E R F O R M A N C E
The performance and high integrity of the reactor core, the reliability
demonstrated by primary coolant components and the ease with which the
reactor plant has been operated and maintained are, highlights of the
Shippingport Station operation to date. These results are attributed princi-
paHy to design care, close manufacturing control, extensive proof testing of components and prototypes and detailed, carefully prepared installation
procedures. This statement should not be construed to imply that no
equipment malfunctions were encountered ; there were a few primary plant
components which had to be repaired or replaced. However, these equipment
difficulties affected the station availability only to a minor degree.
Reactor instrumentation
In order to provide data for analysis and design verification of core
performance, Core 1 has been extensively instrumented. Fig. 10 shows the
various types and locations of the core instrumentation installed in Core 1,
Seed 1. This instrumentation consists of seed instrumented fuel plates for
measuring central fuel temperature [5] , coj-e thermocouples for measuring
seed and blanket cluster inlet and exit coolant temperatures, flow meters
for measuring flow distribution to individual clusters, a failed-fuel-element
detection and location (FEDAL) system, and nuclear instrumentation located
in the neutron shield tank at four corners outside the core.
The seed fuel thermocouples provided a means for measuring and veri
fying the axial power distribution in the core. For this purpose, each instru
mented fuel plate contained six thermocouples, evenly spaced over the length
in Seed 1, and four thermocouples in Seed 2. These instrumented plates

234 H. FEINROTH et al.
N
"I ï I ? 1 3 I 4 1 5 1 6 1 7 ( 8 1 9 ( Го í V I 12 I 13 1 Ü Г7П
LEGEND
(T)-C LU STER S U B A S S E M B L Y C O N T A IN IN G SE E D FUEL PLATE T H E R M O C O U P L E S (6)
( T ) - P O S IT I O N O F SE E D EXIT W A T E R T H E R M O C O U P L E (22)
( T ) - B L A N K E T A S SE M B L IE S IN S T R U M E N T E D FO R EXIT W A T E R TEM P ERAT U RE (27)
( T V INLET W A T E R T H E R M O C O U P L E , B O T T O M PLATE (5)
(Jy INLET W A T E R T H E R M O C O U P L E . SE E D C LU STER (61
Г б ) - F L O W N O Z Z L E . B LA N K E T R E G IO N 1 (3)^ F L O W N O Z Z L E . B L A N K E T R E G IO N 4 (2)
Core- i instrumentation (Seed 1)
( T V M O D IF IE D V E N T U R I, B LA N K E T R E G IO N 1 (2) M O D IF IE D V E N T U R I. B LA N KET R E G IO N 2 (4) M O O IF IE D V E N T U R U BLA N KET R E G IO N 3 (91 M O D IF IE D V E N T U R I. SE E D R E G IO N (16)
( F ) - S E E D CLUSTER C O N T A IN IN G SO U R C E (41
NOTES:
A l l B L A N K E T S H A V E S A M P L IN G R A K E S FO R FUEL ELEM EN T FA ILU RE D E T E C T IO N SYSTEM .
were contained in six clusters which were located in symmetric regions of
the core where high fuel temperatures were calculated to occur for Core-1
operation. In addition to measuring axial power distribution they were also
used for monitoring the central fuel temperature to assure that core design
limits were not exceeded.
The inlet and exit seed-coolant thermocouples provided a means for
measuring and verifying the power generation in selected clusters by the

SHIPPINGPORT POWER STATION 235
product of codant temperature rise and measured flow rate (with known
specific heat).
Flow measurements for individual seed and blanket clusters were
obtained by measuring the pressure drop across a Venturi section located
in the cluster inlet. The total reactor pressure drop was measured by a
differential-pressure cell responding to pressure signals obtained from the
hot and cold legs of two of the four main coolant loops.
The FED A L system samples coolant from each blanket cluster by means
of rakes located at the exit of each cluster. These samples are piped through
a multi-port valve on the reactor vessel closure to a delayed neutron monitor
located outside the reactor vessel. The multi-port valve operates continu
ously, successively sampling coolant from each cluster five times per day.
(The frequency is adjustable. )
The nuclear instrumentation located at the four corners outside the
core monitors the neutron leakage which is proportional to reactor power.
It consists of four independent channels, each of which has a boron trifluoride (BF3 ) detector for the source range and a compensated ion
chamber (CIC) for the intermediate and power ranges up to 150% of full power.
Seed reactivity lifetime
The equilibrium xenon and samarium reactivity lifetime of Seed 1, which
contained 75 kg of 93% enriched uranium, was 5532 E F P H as against a
minimum design requirement of 3000 EFPH. The equilibrium xenon lifetime
of Seed 2 which contained 90 kg of 93% enriched uranium and 170 g of boron
was 7528 E F P H as against a minimum design requirement of 5000 EFPH .
EQUIVALENT FULL-POWER HOURS
Fig. 11
Critical control-rod configurations versus Core-1 Seed-1
lifetime (equilibrium xenon condition)
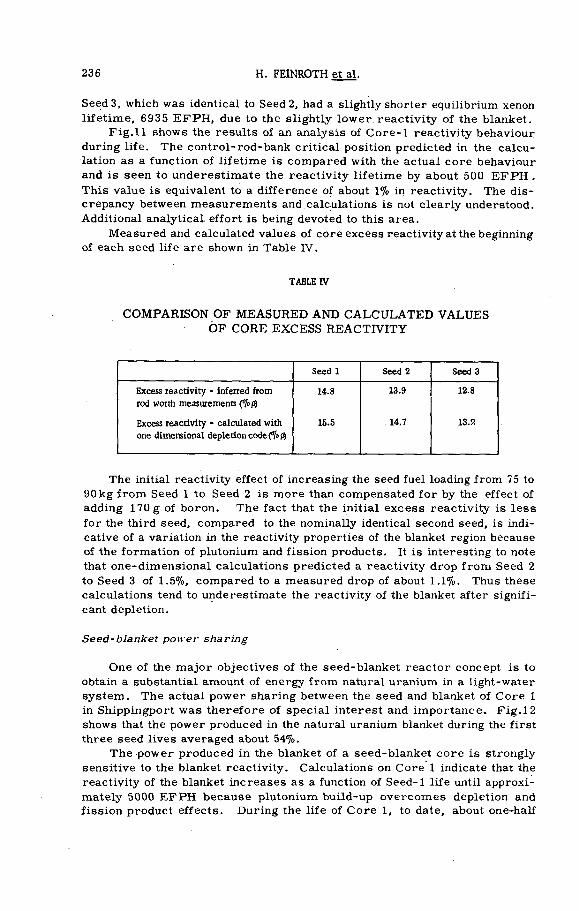
236 H. FEINROTH et al.
Seed3, which was identical to Seed 2, had a slightly shorter equilibrium xenon
lifetime, 6935 E F P H , due to the slightly lower reactivity of the blanket.
Fig.11 shows the results of an analysis of Core-1 reactivity behaviour
during life. The control-rod-bank critical position predicted in the calcu
lation as a function of lifetime is compared with the actual core behaviour
and is seen to underestimate the reactivity lifetime by about 500 E F P H .
This value is equivalent to a difference of about 1% in reactivity. The dis
crepancy between measurements and calculations is not clearly understood.
Additional analytical effort is being devoted to this area.
Measured and calculated values of core excess reactivity at the beginning
of each seed life are shown in Table IV.
TABLE IV
COMPARISON OF M EASURED AND C A LC U LA TED VALUES
OF CORE EXCESS REACTIVITY
Seed 1 Seed 2 Seed 3
Excess reactivity - inferred from
rod worth measurements (‘¡¡bp)
14.8 13.9 12.8
Excess reactivity - calculated with
one dimensional depletion code (‘fr#
15.5 . 14.7 13.Я
The initial reactivity effect of increasing the seed fuel loading from 75 to
90 kg from Seed 1 to Seed 2 is more than compensated for by the effect of
adding 170 g of boron. The fact that the initial excess reactivity is less
for the third seed, compared to the nominally identical second seed, is indi
cative of a variation in the reactivity properties of the blanket region because
of the formation of plutonium and fission products. It is interesting to note
that one-dimensional calculations predicted a reactivity drop from Seed 2
to Seed 3 of 1.5%, compared to a measured drop of about 1.1%. Thus these
calculations tend to underestimate the reactivity of the blanket after signifi
cant depletion.
Seed-blanket power sharing
One of the major objectives of the seed-blanket reactor concept is to
obtain a substantial amount of energy from natural uranium in a light-water
system. The actual power sharing between the seed and blanket of Core 1
in Shippingport was therefore of special interest and importance. Fig.12
shows that the power produced in the natural uranium blanket during the first
three seed lives averaged about 54%.
The power produced in the blanket of a seed-blanket core is strongly
sensitive to the blanket reactivity. Calculations on Core 1 indicate that the
reactivity of the blanket increases as a function of Seed-1 life until approxi
mately 5000 E F P H because plutonium build-up overcomes depletion and
fission product effects. During the life of Core 1, to date, about one-half

SHIPPINGPORT POWER STATION 237
C O R E L I F E , E F P H X I O ' 3
Fig. 12
Percentage of core energy from natural uranium blanket
during Core-1 life
of the blanket energy has been generated by burning plutonium in place and
an additional 8% from direct fissioning of U238 . The balance of the blanket
energy is from U 23 , whose content is now only about one-third of the original.
These calculated figures are consistent with measurements (Fig.13) of
plutonium build-up in blanket fuel rods removed after the first and second
seed lives.
Temperature coefficients of reactivity
An important feature of seed-blanket cores is that they afford an
especially effective means of obtaining a suitable negative temperature

238 H. FEINROTH et al.
O 2 0 0 0 4 0 0 0 5 8 0 6 6 0 0 0 8 0 0 0 100 0 0 12000 14000
E F F E C T IV E F U L L P O W E R HO URS
Fig. 13
Plutonium isotope content of rod irradiated for
two seed lives
coefficient in large power cores. The temperature coefficients for Core 1
with Seed 1 and Seed 2 were measured both at zero power and while oper
ating at full power under equilibrium xenon conditions. Fig. 14 compares
the measured temperature coefficient under operating conditions (500°F)
as a function of core life with the calculated values for Seed-1 operation 16].
It is seen that the coefficient remained at a suitable negative value, thus
providing ease of control and stability under load transients. The same
basic characteristics of the temperature coefficient have been found during
Seed-2 operation. The trend that the temperature coefficient becomes less
negative with lifetime exists in both seeds. More precise analytical treat
ment is being sought to reduce the noted discrepancy between the measured
and predicted values.
P o w e r oscillations
Spatial power asymmetry (tilt) was first observed in Core 1 by the four
channels of nuclear detectors during a rapid xenon depletion test [ 5]. The
power tilt oscillated on a period of about 24 h, as shown in Fig.15, and the

CO
NTR
OL
ROO
BAN
K
HE
IGH
T,
INC
HE
S
20
40
60
SHIPPINGPORT POWER STATION 239
Fig
. 14
Core
-1
tem
per
ature
coeff
icie
nt
for
Seed
s 1,
2 an
d 3

240 H. FEINROTH et al.
( UBMOd n nj iO 1N3MM>
Fig
. 15
Core-
1 power
osc
illa
tions
(See
d 1)

SHIPPINGPORT POWER STATION 241
amplitude of the oscillations increased with time. The measured coolant -
temperature rise in seed clusters also showed an oscillation of the same
frequency which was in phase with the oscillation indicated by the neutron
detectors. This power oscillation was eliminated by repositioning of the
controlling rods. Subsequently, a special test was conducted in which a
power tilt was purposely introduced by asymmetric positioning of the con
trolling rods. When the rods were returned to their previous position,
spatial oscillations resulted.
In addition to the above two tests, a tendency to develop spatial power
oscillations was also observed in the course of a long full-power run. The
oscillations were observed to converge at approximately 2900 EFPH and to
disappear when the controlling group (Group II) of rods was fully withdrawn.
In order to cope with such power oscillations and protect any region
of the core from exceeding design temperatures, a procedure was established
which provided that, when the nuclear detectors indicated 5% above average
power in any core quadrant, the controlling group of rods in the high-power
quadrant was to be inserted until the power level in that quadrant was de
pressed to the average value.
During Seed-2 operation no spontaneous spatial power oscillations were
observed. A deliberate attempt was made to induce oscillations by mis
aligning the rods during a test near the end of life of the seed. It was
significant that at this time in core life, the power oscillations generated
(Fig.16) were convergent, in contrast to the divergent behaviour found in
oscillations purposely generated during tests with Seed 1. This result indi
cated that, with Seed 2 and the more highly irradiated blanket, the core
quadrants behaved in a more closely coupled fashion than with Seed 1.
Although no radial power oscillations occurred during Seed-3 life, they have
begun again during early Seed-4 operation. Although these oscillations can be readily controlled, their behaviour is not well understood. Considerable
analytical effort is currently being devoted to this area.
Centre-line seed fuel temperature
The axial power generation patterns can be inferred from centre-line
fuel temperature measurements. Figs. 17 and 18 show such patterns for
two control-rod conditions and compare the predicted power distributions
with those obtained from temperature measurements in the Core-1 seed
fuel [6] . As these figures indicate, the axial power distribution is sensi
tive to the position of the controlling rod group and, particularly, to the
rod position in the individual cluster. The relationship of the measured
and the predicted values is considered a reasonably good verification of the
core's calculated gross heat-generation pattern and heat-removal design.
Core hydraulics
Special tests were conducted to determine the amount of mixing in the
reactor-vessel inlet plenum of the coolant flow from the operating loops.
This knowledge is especially important to cold water accident studies. In
the tests, with the reactor shut down, three reactor coolant loops were
operated at бООТ? and a fourth loop having a 10 to 40°F lower temperature

242 H. FEINROTH et al.
SiNSNfttfiSW «ГЗЛЭГМ» ЙОСЫ П Г JO OHK3V3H ЗОГЫЗЛГ 3HX 01 9NiaV3ü INannuiSNI «»310flN H0T3 dO OliVë
SSTdDOOOHdSHJ. 3ИОО n otíj aXÜOJNI SINTUQVnO ЛВ n i l d3M0d
Fig
. 16
Cor
e-1
power
osc
illa
tions
(See
d 2)
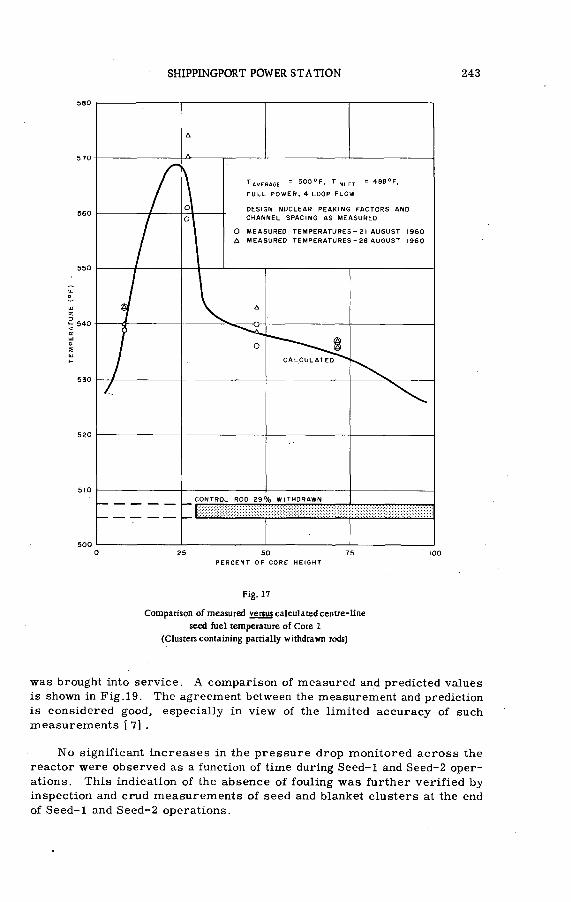
SHIPPINGPORT POWER STATION 243
P E R C E N T O F C O R E H E I G H T
Fig. 17
Comparison of measured versus calculated centre-line
seed fuel temperature of Core 1
(Clusters containing partially withdrawn rods)
was brought into service. A comparison of measured and predicted values
is shown in Fig.19. The agreement between the measurement and prediction
is considered good, especially in view of the limited accuracy of such
measurements [ 7] .
No significant increases in the pressure drop monitored across the
reactor were observed as a function of time during Seed-1 and Seed-2 oper
ations. This indication of the absence of fouling was further verified by
inspection and crud measurements of seed and blanket clusters at the end
of Seed-1 and Seed-2 operations.
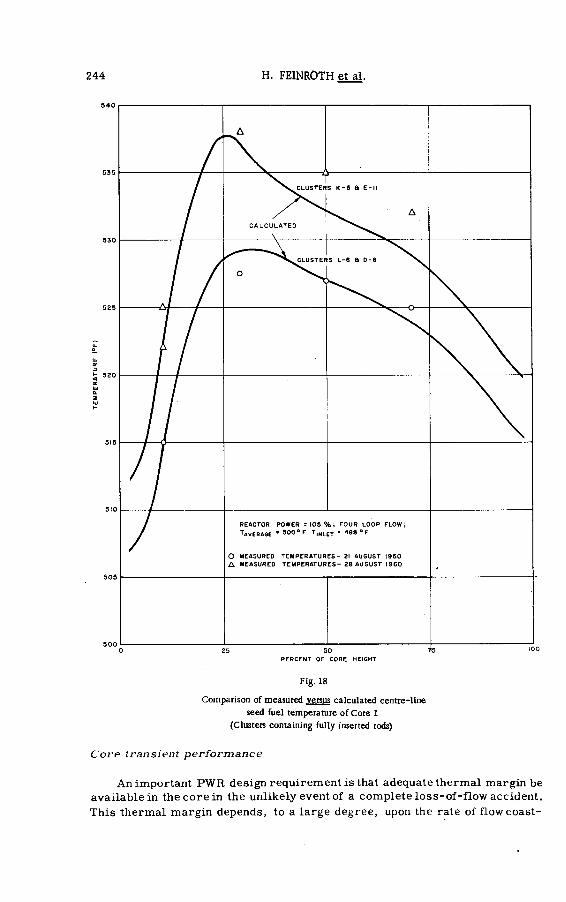
TEM
PE
RA
TUR
E
(°F
)
244 H. FEINROTH et al.
Fig. 18
Comparison of measured versus calculated centre-line
seed fuel temperature of Core 1
(Clusters containing fully inserted rods)
C o r e transient p e r fo r m a n c e
An important PW R design requirement is that adequate thermal margin be
available in the core in the unlikely event of a complete loss-of-flow accident.
This thermal margin depends, to a large degree, upon the rate of flow coast-
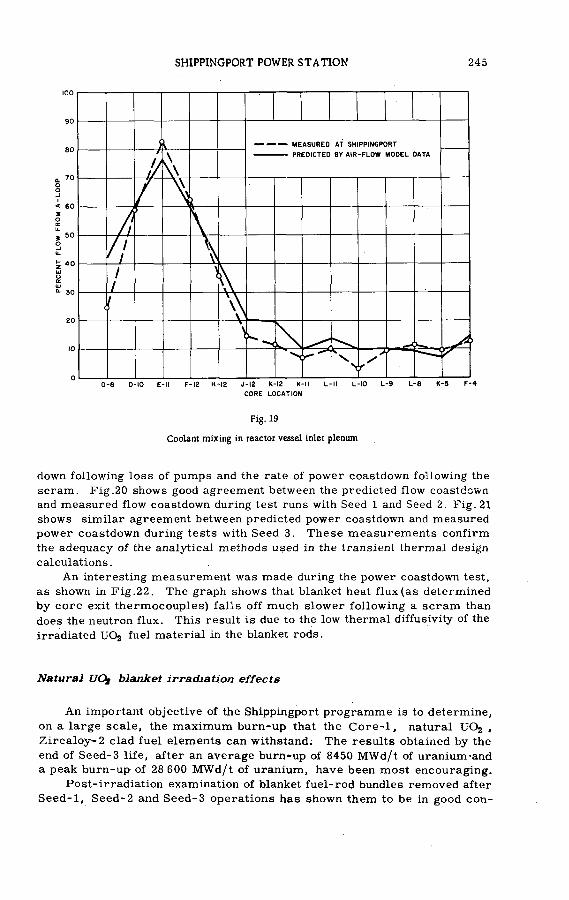
SHIPPINGPORT POWER STATION 245
Fig. 19
Coolant mixing in reactor vessel inlet plenum
down following loss of pumps and the rate of power coastdown following the
scram. Fig.20 shows good agreement between the predicted flow coastdown
and measured flow coastdown during test runs with Seed 1 and Seed 2. Fig. 21
shows similar agreement between predicted power coastdown and measured
power coastdown during tests with Seed 3. These measurements confirm
the adequacy of the analytical methods used in the transient thermal design
calculations.
An interesting measurement was made during the power coastdown test,
as shown in Fig.22. The graph shows that blanket heat flux(as determined
by core exit thermocouples) falls off much slower following a scram than
does the neutron flux. This result is due to the low thermal diffusivity of the
irradiated UO2 fuel material in the blanket rods.
Natural U Q ¡ blanket irradiation effects
An important objective of the Shippingport programme is to determine,
on a large scale, the maximum burn-up that the Core-1, natural UOz ,
Zircaloy-2 clad fuel elements can withstand; The results obtained by the
end of Seed-3 life, after an average burn -up of 8450 MWd/t of uranium-and
a peak burn-up of 28 600 MWd/t of uranium, have been most encouraging.
Post-irradiation examination of blanket fuel-rod bundles removed after
Seed-1, Seed-2 and Seed-3 operations has shown them to be in good con-
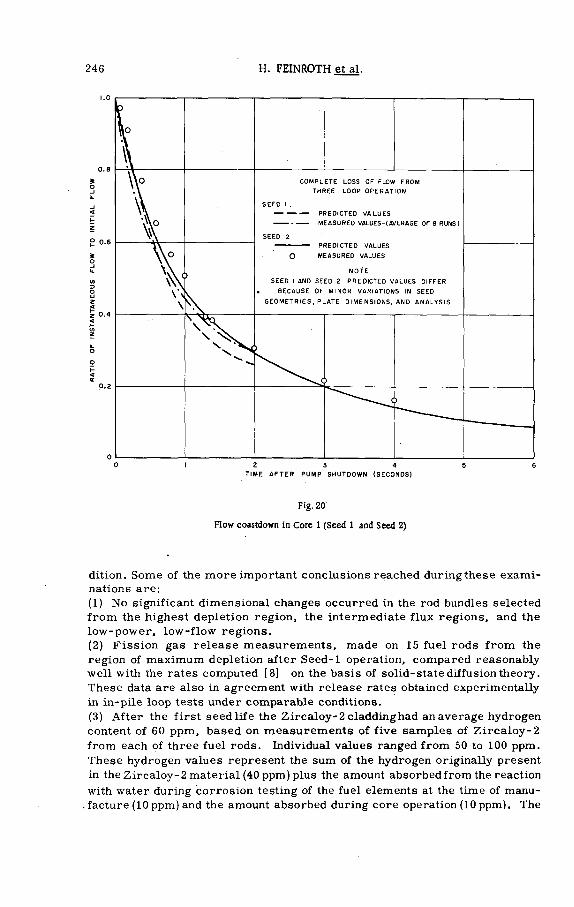
246 H. FEINROTH et al.
T I M E A F T E R P UM P S H U T D O W N (S E C O N D S )
Fig. 20
Flow coastdown in Core 1 (Seed 1 and Seed 2)
dition. Some of the more important conclusions reached duringthese examinations are:
(1) No significant dimensional changes occurred in the rod bundles selected
from the highest depletion region, the intermediate flux regions, and the
low-power, low-flow regions.
(2) Fission gas release measurements, made on 15 fuel rods from the
region of maximum depletion after Seed-1 operation, compared reasonably
well with the rates computed [8] on the basis of solid-state diffusion theory.
These data are also in agreement with release rates obtained experimentally
in in-pile loop tests under comparable conditions.
(3) After the first seed life the Zircaloy-2 cladding had an average hydrogen
content of 60 ppm, based on measurements of five samples of Zircaloy-2
from each of three fuel rods. Individual values ranged from 50 to 100 ppm.
These hydrogen values represent the sum of the hydrogen originally present
in the Zircaloy-2 material (40 ppm) plus the amount absorbed from the reaction
with water during corrosion testing of the fuel elements at the time of manu
facture (10 ppm) and the amount absorbed during core operation (10 ppm). The
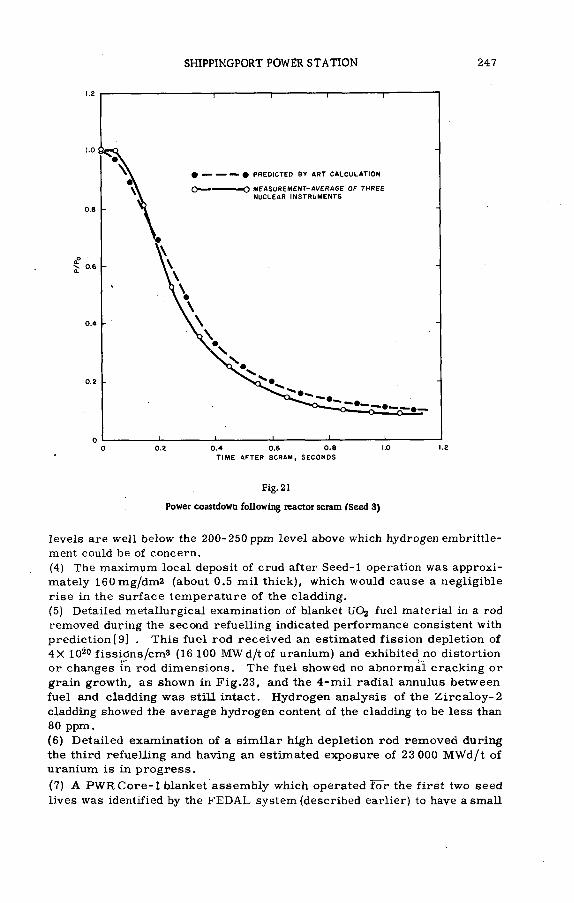
SHIPPINGPORT POWER STATION 247
Fig. 21
Power coastdown following reactor scram (Seed 3)
levels are well below the 200-250 ppm level above which hydrogen embrittle
ment could be of concern.
(4) The maximum local deposit of crud after Seed-1 operation was approxi
mately 160mg/dm2 (about 0.5 mil thick), which would cause a negligible
rise in the surface temperature of the cladding.
(5) Detailed metallurgical examination of blanket UO2 fuel material in a rod
removed during the second refuelling indicated performance consistent with
prediction [9] . This fuel rod received an estimated fission depletion of
4X 10²⁰ fissidns/стЗ (16 100 MWd/t of uranium) and exhibited no distortion
or changes in rod dimensions. The fuel showed no abnormal cracking or
grain growth, as shown in Fig.23, and the 4-mil radial annulus between
fuel and cladding was still intact. Hydrogen analysis of the Zircaloy-2
cladding showed the average hydrogen content of the cladding to be less than
80 ppm.
(6) Detailed examination of a similar high depletion rod removed during
the third refuelling and having an estimated exposure of 23 000 M W d/t of
uranium is in progress.
(7) A PWRCore-1 blanket assembly which operated for the first two seed
lives was identified by the FEDAL system (described earlier) to have a small

248 H. FEINROTH et al.
T IM E Û F T E R S C R A M ,S E C O N D S
Fig.22
Temperature coastdown in blanket following reactor scram (Seed 3)
cladding defect. The assembly was removed, even though it did not cause any plant activity problems, to determine the nature of the defect. A cladding
penetration was found on one of the 840 fuel rods in the fuel assembly [10] .
This defect was traced to a transverse tubing crack originating at the inside
cladding surface which occurred during fabrication. The fact that the defect
was present since start-up as determined by an examination of oxide film build-up, plus the fact that no significant fuel was lost from the rod,confirms
the validity of the high corrosion resistance requirement which was established when selecting U02 as the fuel material for the PW R blanket.
Control-rod performance
Examinations have been carried out on samples of the hafnium control
rods removed after each seed life. Fig.24 shows the change in mechanical
properties of hafnium as a result of exposure to a neutron flux during the
life of the first two seeds [11] . The results indicate that the strength increase
of hafnium with irradiation follows a two-step process, with an apparent
saturation between 3.8 and 5.6X10²¹ n/cm2 and an additional increase in
strength at higher exposure, whereas the useful ductility decreases slightly.

SHIPPINGPORT POWER STATION 249
C O R E I B L A N K E T F U E L R O D C R O S S
S E C T I O N A F T E R T W O S E E D L I V E S
Fig. 23
Core-1 blanket microstracture after Seed-2 operation
Top
Transverse view of ground and etched UOj fuel pellet
from a highly depleted rod in PWR blanket after two seed lives
(4xlD20 fissions/cms; 16100 MWd/t of uranium)
Bottom
Typical microstructure of U 02
from a highly depleted rod in PWR blanket after two seed lives
(4 X 10²» fissions/cm3; 16 100 MWd/t of uranium)

250 H. FEINROTH et al.
n v t X I O - 2 l ( > 0 . 6 2 5 eV
Fig.24
Effect of neutron exposure on the 600°F tensile properties
of PWR hafnium control-rod after two seed lives
Also, isotopic examination of one of the control rods removed after Seed-1
operation revealed: (1) that only a minor alteration of the isotopic content
(as compared to that of natural hafnium) had occurred; and (2) that the rod
had lost less than 9% of its absorptive capacity. These results are consistent
with measurements át Shippingport which indicate that the hafnium control
rods used for three seed lives have retained their original réactivity worth.
Examination of the control-rod weld joint between the hafnium blades
and their Zircaloy-2 extensions during Seed-1 refuelling indicated excessive
corrosion. During the manufacture of these rods, repairs had been made
to the weld joint because of difficulties encountered in welding hafnium to
Zircaloy-2. In these repairs the weld metal became contaminated, which
accounts for the observed deficiency in corrosion resistance.
As a result of this experience, improved Zircaloy-hafnium welding pro
cedures were developed and used in the manufacture of a new set of control

SHIPPINGPORT POWER STATION 251
rods which were installed with Seed 3. However, two of the original rods
showing low corrosion at the joint were retained for operation during Seed 3
because of the interest in determining property changes in hafnium after
extended in-pile exposure.
Reactox■ m echanical and structural com ponents
The operation of the core structure, reactor vessel closure, control
drive mechanisms, and the fuel assembly extraction tool has been very satis
factory. There have been no malfunctions of these components, except for
the replacement of two mechanism stators because of low-resistance electrical
insulation. Mating parts have exhibited no significant distortion, galling,or crevice corrosion. Examination of control-rod drive mechanisms com
ponents and scram shafts has revealed no evidence of excessive wear or
other symptoms of adverse effects caused by service to date. The integrity
of the numerous seal welds on the reactor vessel closure during operation
was very satisfactory.
Because of a special concern with 17-4 pH stainless steel in reactor
applications, a general review of this material was conducted by , the Com
mission. Accordingly, a detailed investigation of the 17-4 pH stainless steel
used in the Shippingport reactor for two seed lifetimes was undertaken. This
material was chos'en because of its high strength and excellent wear characteristics, with due regard to its susceptibility to stress-corrosion
cracking. Two types of heat treatments were given to the 17-4 pH material:
4h at 1100°F for scram shafts and 2^h at 8753F for lead screws. New tests
were instituted on scram shaft components made of 17-4pH stainless steel
which had been in service in Core 1 throughout Seed-1 lifetime.
As a result of these reviews, it was concluded that the 17-4 pH com
ponents were suitable for continued operation at Shippingport.This conclusion
was based on the carefully controlled procedures used in the manufacture
of these components and on the following considerations:
(1) At operating temperature, the minimum safety factor on the maximum
working tensile stress in the assembly is 2, after application of a conservative
stress concentration factor.
(2) The residual tensile stresses measured in the irradiated components
were less than 30 000 lb/in2 . Samples of the material removed from the
reactor were subjected to stress corrosion tests for 1000 h at stress levels
up to 60 000 lb/in2 and indicated no tendency toward stress-corrosion cracking.
(3) Irradiated tie rods, lead screws and spline shafts were impact-tested
to produce nominal stresses of twice the value developed in operational full-
height scrams without inducing defects detectable by liquid penetrant or
magnetic particle inspections.
(4) Destructive metallurgical evaluation of material from the lead screws
that were in the reactor indicated no change in the tensile properties com
pared to materials that had not been in the reactor. The hardness had in
creased from R c 43 to about R c 47. However, this had no adverse effect
on the performance of the material as indicated by the engineering test
results.
(5) A complete inspection of all lead screws was made during the Seed 2-
Seed 3 refuelling. Dye check inspection disclosed a small defect in only one

252 H. FEINROTH et al.
lead screw, which was replaced and examined. It was determined that it
was not a service-induced consequence. This inspection was repeated during
the third refuelling and no defects were noted.
(6) No permanent damage to the core would result from failure of a scram shaft
assembly.
Pressure-vessel steels have been found to suffer a loss in ductility, re
flected in _an increase in the ductile-brittle transition temperature asa function
of the integrated fast neutron flux dosage. It is concluded, on the basis of
present materials data, that the magnitude of this increase in transition
temperature for the Shippingport reactor vessel does not limit operation at normal operating temperatures and will not do so throughout Core-2 life.
However, at temperatures below 250=^, the increase in transition temperature as a result of fast-neutron dosage does place a limit on the permissible
stress levels in the reactor vessel. Accordingly, to ensure vessel integri
ty, operating procedures have been established and are rigorously followed
to control the pressure-temperature relationships during all plant start-ups
and periodic hydrostatic testing. These relationships are so specified that
the resultant stresses are well below the allowable values, if the irradiation-
induced effects on the transition temperature of the material are taken into
account.
Reactor protection system
The operational history of the reactor protection system indicates that
the system has provided dependable protection without excessive maintenance
or component failures. Component problems were largely confined to the
bistable magnetic amplifiers, which have had a tendency to drift and required
frequent adjustment and alignment. Modifications to the alignment pro
cedures have been developed to reduce this problem during Seed-3 operation.
Two valid safety shut-downs occurred during Seed-2 operation. One
was due to a low system pressure brought on by an operator error and the
second was due to high coolant temperature during a test requiring rapid
station shut-down. A number of other rod insertions and shut-downs oc
curred, but they were the result of component problems and operator errors.
The safety shut-down set points of 114-118% of rated power have not proved
to be restrictive.
Steam generators
Early in the operation of Shippingport, caustic stress corrosion caused
failure of a few tubes and a leak rate of 35 gal/h in one of the steam
generators. This defect was caused by a steam pocket forming on the
secondary side as a result of insufficient circulation. The installation of
two additional risers corrected the condition, and, to ensure a complete
absence of "free" alkalinity in the boiler water, mono-, di- and tri-sodium
phosphate were used for pH phosphate control. The phosphate concentrations
have been 100 to 300 ppm and pH values between 10.6 and 11.0 have been
maintained.
Improved control of boiler water chemistry was found to be necessary
during periods of hot stand-by and cold lay-up conditions. This control was

SHIPPINGPORT POWER STATION 253
accomplished by using an auxiliary heat exchanger, instead of the secondary
steam system, as a heat sink for cooling down the plant.
Higher radiation levels have been experiencéd in the heat exchanger
area than in the area around the main coolant piping. Tests on the inlet end
of the heat exchanger having the highest level (600 mr/h) showed that the
tube sheet, rather than the tubes, is the major contributor. During mainte
nance in the vicinity of the inlet to the heat exchanger, sheets of lead have
been used to reduce exposure to maintenance personnel.
M ain coolant p um ps
The performance and reliability of the main coolant pumps during four
years of Shippingport operation have been generally good. There have been
two incidents of failures on the same pump design and one incident of start
up failure on a different design. All of these, by coincidence, occurred in
the same loop but there is no apparent relation between them. In contrast,
no failures or difficulties have been experienced with the other three pumps
in the remaining three loops.
The first incident involved collapse of the can separating the stator
coils from the reactor coolant, apparently as a result of operation at low
primary-system pressure or a pinhole in the can, either of which could have
produced ahigh differential pressure across the can. Since the time that this
incident occurred,the minimum system pressure during pump operation has
been increased from 100 to 3001b/in2 gauge to reduce the possibility of such
failures in the event of low-pressure operations. Because of their satis
factory operation, no modifications were made to the original pumps in the
other three loops.
The second incident involved a failure of the upper and lower radial
bearings due to overheating of journal wear surfaces because of restrictions
occurring in the internal cooling system of the pump. These restrictions
are believed to have been caused by a mixture of free hydrogen and steam
entering the pump cooling system via a common vent header to which the
pressurizer was the major contributor. By rerouting the pressurizer vent
line to the blowdown tank, this condition was corrected.
The third incident involved start-upfailure of a pump of different design
which was installed after failure of the second pump. The incident occurred
after a period of hot stand-by service. It was believed to be the result of
inadequate heat removal around the pump shaft during stand-by. Thus, a
sufficient temperature differential developed to cause distortion and binding
of the shaft and impeller. Attempts to correct the condition were unsuccess
ful. Accordingly, this pump was replaced by another pump, similar in design
to that in the other three operating loops during the Seed 2 - Seed 3 refuelling.
Reactor coolant chemistry control
The reactor coolant contains demineralized water adjusted to a pH of
9.5 to 10.5 with lithium hydroxide. Hydrogen concentrations are specified
as 15 to 60 cm3/kg H20 and oxygen at less than 0.14 ppm. With these coolant
conditions, corrosion of the reactor plant piping and components has been

254 H. FEINROTH et al.
minimized. The crud concentrations have been consistently low (about
5 pp 109). The control of the pH by the ion exchanger has been excellent with
infrequent additions of lithium hydroxide of less than 0.5 lb every 4to5weeks. Hydrogen additions of approximately 100 ft3 per week have been necessary
because of pressurizer relief valve leakage. This addition rate has recently
been reduced as a result of repairs to the relief valves. No excursions of
oxygen concentrations above 0.14 ppm have occurred during power operation.
Main turbine generator
The governor valve and the interstage moisture separator of the main
turbine generator were replaced after successive repairs failed to eliminate
deficiencies.Failure of the No.3 governor-valve stems prompted the replacement
of all the governor valves by redesigned valves at an appropriate station
outage during Seed-1 operation. These new valves have performed satis
factorily to date.
The turbine interstage moisture separator installed is a cyclone-type
unit. The internals of this separator were found to have completely disinte
grated when inspected early during Seed-1 operation. The cause and time
of this failure could not be determined. Repairs to this separator resulted
in a station outage of approximately two months, during which time an in
spection of the turbine was also made. The turbine was found to be in a
satisfactory condition. After the repairs, further difficulties with the sepa
rator were experienced, and it was concluded that the internals should be
completely redesigned. The new design separator was instálled during Seed 1 - Seed 2 refuelling and its performance to date has been satisfactory.
It was inspected during Seed 2 - Seed 3 refuelling and no deficiencies were
found.
Feedwater heaters
The turbine plant has been plagued with feedwater heater-tube leakage
since October 1959. During the Seed 1 - Seed 2 refuelling shut-down, defec
tive tubes were plugged in one of the three units and it was returned
to service. After two and a half months of operation, severe leakage again
developed and the unit was removed for retubing. The second feedwater
heater continued to require tube plugging, necessitating frequent shut-downs.
Finally, in July 1961 when the leakage became excessive, this unit was also
removed. It was retubed and returned to service with Seed 3.
Lack of stress relieving at the tube bends and inadequate venting were
identified as the principal causes of the feedwater heater-tube failures.
These deficiencies have been corrected and stress-relieved Arsenic -
Admiralty tubes in lieu of the original Admiralty tubes have been installed.
4. CURRENT D EV ELO PM EN TS AND FUTURE PLANS
The principal objective of the current and future programme of the
Shippingport Project is to advance the basic technology of water-cooled re

SHIPPINGPORT POWER STATION 255
actors to achieve significant reductions in both capital costs and fuel costs.
Advances in core technology in terms of lifetime capability, power capa
bility and fuel-element fabrication techniques will have the most telling effect
on reducing costs, for they will influence directly not only the fuel cost but
also the plant capital cost per unit of heat removed. The latter derives from
the fact that cores with high specific power capability will impose a lower
burden on the plant per unit of heat removed from the core. The reduction
in fuel cost derivable from increases in core lifetime or energy output, es
pecially when combined with lower core manufacturing cost, is obvious.
Accordingly, the Shippingport programme is now primarily concentrated
on core development and consists of two parts: (1) continued operation of
the Shippingport Plant with the fourth seed in Core 1; and (2) the development,
design, manufacture, and test operation of a long-life, high-power density,
second seed and blanket core - PW R Core 2.
The continued operation of Core 1 with its first four seeds has been
directed towards:
(1) The large scale irradiation of natural UOz fuel elements with Zircaloy-2
cladding to determine the maximum depletion that these fuel elements can
withstand.
(2) The determination of the nuclear and thermal performance of seed and
blanket cores'as a function of fuel depletion, and the demonstration of the
continued generation of a high fraction of power from natural uranium in
such cores.
(3) The accumulation of further operating data and experience on major
plant systems and components including especially the reactor core, thus
providing information on the long-term performance characteristics needed
to evaluate the adequacy of current component designs for service in water-
cooled reactor plants now under construction or in early stages of operation.
The development of Core 2 represents an important step towards re
ducing the cost of nuclear power because at its design rating of 150 MW(e)
gross and a first seed life of 10 000 h, Core 2 will have five and one-half
times the energy output and twice the power density of Core 1.
High total energy, high-power density cores such as Core 2 require
fuel elements which can withstand long irradiation exposure and operate
at high heat fluxes. One of the major features of the Core-2 development
programme is the effort directed toward producing a compartmented plate
fuel element containing bulk UOa coupled with the development of Zircaloy-4
as a long-life cladding material. As a result of the Core-1 and Core-2 pro
grammes, bulk UO2 has been shown to have the greatest potential for sta
bility and corrosion resistance under irradiation of any presently known
fuel material for water-cooled reactor application. Application of this ma
terial in plate form to take advantage of greater heat-transfer area and lower
fuel temperatures at high heatflux is the next logical step in U 0 2fuel element development.
Seed 4 program m e
Full power operation at Shippingport with the fourth seed, which is ex
pected to have a lifetime of about 6900 E F P H , began on 30 January 1963.
It is, therefore, anticipated that this seed will be depleted early in 1964.
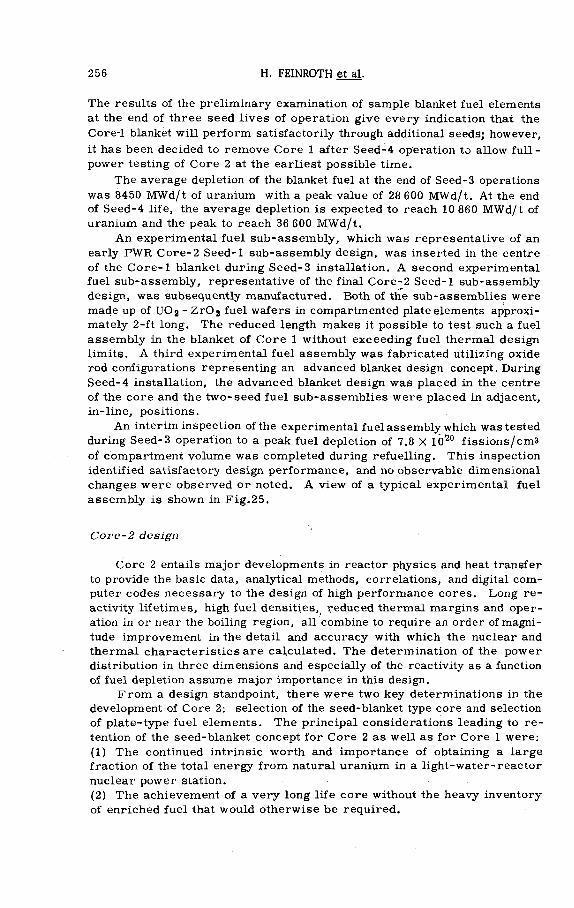
256 H. FEINROTH et al.
The results of the preliminary examination of sample blanket fuel elements
at the end of three seed lives of operation give every indication that the
Core-1 blanket will perform satisfactorily through additional seeds; however,
it has been decided to remove Core 1 after Seed-4 operation to allow full-
power testing of Core 2 at the earliest possible time.
The average depletion of the blanket fuel at the end of Seed-3 operations
was 8450 MWd/t of uranium with a peak value of 28 600 MWd/t. At the end of Seed-4 life, the average depletion is expected to reach 10 860 MWd/t of
uranium and the peak to reach 36 600 MWd/t.
An experimental fuel sub-assembly, which was representative of an
early PW R Core-2 Seed-1 sub-assembly design, was inserted in the centre
of the Core-1 blanket during Seed-3 installation. A second experimental
fuel sub-assembly, representative of the final Core-2 Seed-1 sub-assembly
design, was subsequently manufactured. Both of the sub-assemblies were
made up of U 0 2 - Z r 0 2 fuel wafers in compartmented plate elements approxi
mately 2-ft long. The reduced length makes it possible to test such a fuel
assembly in the blanket of Core 1 without exceeding fuel thermal design
limits. A third experimental fuel assembly was fabricated utilizing oxide
rod configurations representing an advanced blanket design concept. During
Seed-4 installation, the advanced blanket design was placed in the centre
of the core and the two-seed fuel sub-assemblies were placed in adjacent,
in-line, positions.
An interim inspection of the experimental fuel assembly which was tested
during Seed-3 operation to a peak fuel depletion of 7.8 X 10²⁰ fissions/стз
of compartment volume was completed during refuelling. This inspection
identified satisfactory design performance, and no observable dimensional
changes were observed or noted. A view of a typical experimental fuel
assembly is shown in Fig.25.
Core- 2 design
Core 2 entails major developments in reactor physics and heat transfer
to provide the basic data, analytical methods, correlations, and digital com
puter codes necessary to the design of high performance cores. Long re
activity lifetimes, high fuel densities, reduced thermal margins and oper
ation in or near the boiling region, all combine to require an order of magni
tude improvement in the detail and accuracy with which the nuclear and
thermal characteristics are calculated. The determination of the power
distribution in three dimensions and especially of the reactivity as a function
of fuel depletion assume major importance in this design.
From a design standpoint, there were two key determinations in the
development of Core 2: selection of the seed-blanket type core and selection
of plate-type fuel elements. The principal considerations leading to re
tention of the seed-blanket concept for Core 2 as well as for Core 1 were:
(1) The continued intrinsic worth and importance of obtaining a large
fraction of the total energy from natural uranium in a light-water-reactor
nuclear power station.
(2) The achievement of a very long life core without the heavy inventory
of enriched fuel that would otherwise be required.

SHIPPINGPORT POWER STATION 257
Fig. 25
Experimental fuel assembly tested during Seed-3 operation
(3) The demonstration during five years of operation in the Shippingport
Station that the seed-blanket core concept possesses the performance
characteristics with respect to dynamic load response, operating stability
and simplicity of control that make the plant well suited to integration with
an electric utility system.
(4) The reduction in the number of movable control elements required in
a large, high'-power, long-life core inherently afforded by using a relatively
small.highly enriched seed as the driving element.
(5) The absence of any clear-cut technical or economic reasons for changing
to a different core type.
In selecting the plate-type fuel element geometry for Core 2, special
attention was given to the excellent performance of the rod-type UO2 fuel
elements in the Core-1 blanket, to the fact that rod elements are better able
to withstand the internal pressures generated by fission gases and to the
probability that rod elements are more suited to low-cost fabrication.
Nevertheless, it was necessary to recognize that U02 rod elements of prac-
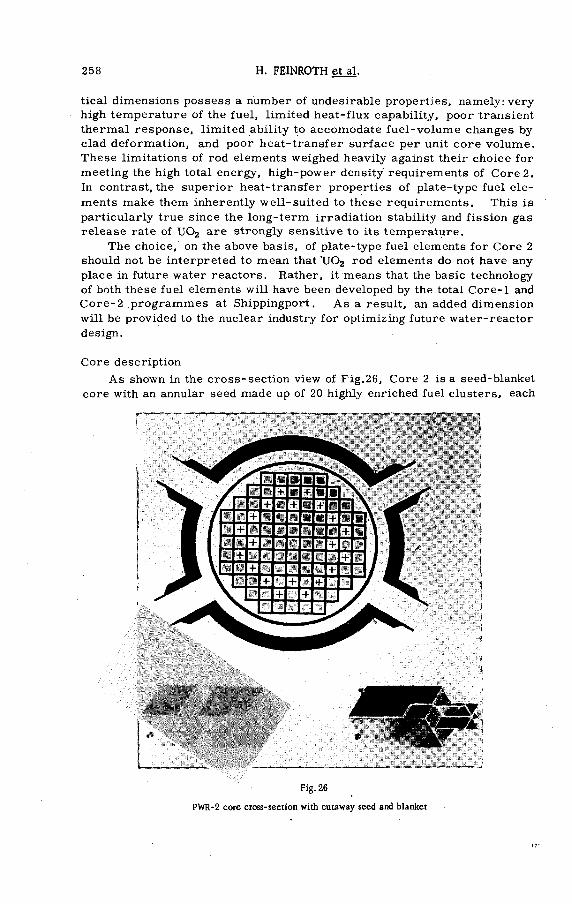
258 H. FEINROTH et al.
tical dimensions possess a number of undesirable properties, namely: very
high temperature of the fuel, limited heat-flux capability, poor transient
thermal response, limited ability to accomodate fuel-volume changes by
clad deformation, and poor heat-transfer surface per unit core volume.
These limitations of rod elements weighed heavily against their choice for
meeting the high total energy, high-power density requirements of Core 2.
In contrast, the superior heat-transfer properties of plate-type fuel ele
ments make them inherently well-suited to these requirements. This is
particularly true since the long-term irradiation stability and fission gas
release rate of U 0 2 are strongly sensitive to its temperature.
The choice, on the above basis, of plate-type fuel elements for Core 2
should not be interpreted to mean that TJ02 rod elements do not have any
place in future water reactors. Rather, it means that the basic technology
of both these fuel elements will have been developed by the total Core-1 and
Core-2 programmes at Shippingport. As a result, an added dimension
will be provided to the nuclear industry for optimizing future water-reactor
design.
Core description
As shown in the cross-section view of Fig.26, Core 2 is a seed-blanket
core with an annular seed made up of 20 highly enriched fuel clusters, each
Fig. 26
PWR-2 core cross-section with cutaway seed and blanket

SHIPPINGPORT POWER STATION 259
of which also contains a cruciform-shaped hafnium control-rod. A blanket
of natural uranium consisting of a total of 77 natural-uranium fuel clusters
surrounds the seed on both sides. The fuel clusters are arranged to form
an approximate right-circular cylinder with an active fuel length of 8 ft and
a mean core diameter of about 7 ft. This is illustrated in Fig. 27 which also
shows a longitudinal section of the core and the principal structural com
ponents. The fuel clusters are positioned and supported within the core cage
as shown in Fig.28. They are held down against the bottom support plate
by the twenty control-rod shrouds and a c entre-support tube. In contrast to
the Core-1 design, no top grid or fuel assembly latches are required. Indi
vidual fuel clusters can be removed without disturbing the remaining clusters
Fig. 27
Reactor component parts (Core 2)
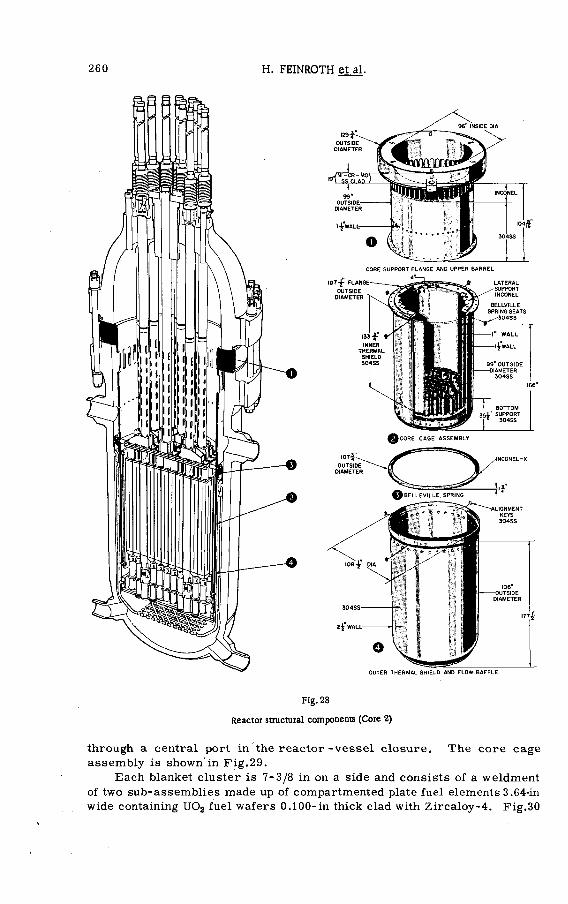
260 H. FEINROTH et al.
Fig.28
Reactor structural components (Core 2)
through a central port in the reactor-vessel closure. The core cage
assembly is shown'in Fig.29.
Each blanket cluster is 7-3/8 in on a side and consists of a weldment
of two sub-assemblies made up of compartmented plate fuel elements 3.64-in
wide containing U02 fuel wafers 0.100-in thick clad with Zircaloy-4. Fig.30

SHIPPINGPORT POWER STATION 261
Fig.29
PWR-2 Core-2 cage assembly
shows a section of the cluster and Fig.31 is a cutaway view of a blanket fuel
plate.
Each seed cluster is 7-3/8 in on a side and consists of a weldment of
four sub-assemblies arranged as shown in Fig. 32 to form a cruciform
shaped control-rod channel. The seed fuel elements are compartmented
plates similar to those in the blanket except that they ate 3.44-in wide and
contain enriched UO¡¡ - Zr02 wafers 0.036-in thick. Three different wafers
with respect to weight percent of uranium are used in the seed plates, and
these are arranged to provide three zones of fuel as shown in Fig.33. Lumped
burnable poison wafers, B-10 in stainless-steel matrix, are located in
each corner of the seed sub-assemblies to reduce the reactivity swing with
fuel depletion and thereby the control-rod requirement; they also reduce
the seed power peaking adjacent to the control-rod channel.
Both the seed and blanket oxide fuel plates are compartmented by internal
ribs transversely and longitudinally to strengthen the cladding structure.

TOP
262 H. FEINROTH et al.
Fig
. 30
Fig
. 31
Cor
e-2
bla
nket
fu
el
clus
ter
Cor
e-2
bla
nket
ox
ide
fuel
pla
tes

SHIPPINGPORT POWER STATION 263
» i
104.5
SEED CLUSTER
Core-2 seed fuel cluster
Core-2 Seed-1 sub-assembly cross-section
264 H. FEINROTH et al.
To prevent waterlogging and bulging of the cladding sufficient to touch the
adjacent plate, the longitudinal ribs are spaced 0.25 in apart. To limit the
amount of fuel which can be leached into the coolant in case of fuel com
partment failure and to assure rigidity and resistance of the plates to hy
draulic forces, the spacing of the transverse ribs and/or shims has been
set at about 1 in. The clad thickness of 0.020 in has been established based
on plate strength, degree of fabrication control and corrosion requirements.
The location and type of instrumentation planned for Core 2 are shown
in Fig.34. This instrumentation is provided to obtain data and is not re
quired for operation. It consists of 62 thermocouples for measuring coolant
temperature at cluster inlet and exit, 31 fuel-clusterflow-measuring devices,
six flux wells, and a system for sampling coolant from the exit of each of
the 97 seed and blanket clusters to detect andlocate any fuel-element failures.
To minimize interference with refuelling operations, more than 80% of the
instrument leads are routed through the core support flange below the region
from which refuelling operations will be conducted. The remainder of the
instrumentation leads exit from the reactor vessel through the control-rod
shroud and the closure head.
Most of the refuelling facilities provided for Core 1 will also be used
for Core 2. The chief exception is a fuel-cluster installation and extraction
tool of new design suitable for use through the central port in the reactor-
vessel closure. As in the case of Core 1, the refuelling equipment for Core
2 will permit removal or installation of seed and blanket fuel assemblies,
individually, under water through the closure head or with the closure head
removed.
Except for the seed-blanket core concept, the design features of Core 2
represent a considerable departure from Core 1. Some of the more signifi
cant differences between the two core designs may be noted in Fig.35 and
from the comparison given in Table V.
Nuclear design
Because of the long lifetime and high-power density requirements of
Core 2, the core reactivity behaviour, power distribution and control character
istics must be determined with a very high degree of precision and geo
metrical detail. This has required an extensive computational effort
and experimental physics programme and the development of new analytic
models and digital computer programmes [12] . For example, adequate
treatment of the detailed fuel and poison distribution as a function of depletion
has required as many as 15 million calculational mesh points of the core.
Each increment of core depletion originates from the condition before
that increment. As a result, the beginning-of-life condition of Core 2 needed
,to be accurately determined and verified by experiment to provide a basis
for depletion studies as well as for setting the core loading. To this end,
critical mock-ups were tested at room temperature, operating temperature
and intermediate temperatures. The elevated temperature tests were con
ducted in a pressurized hot critical facility. Part of the mock-up fuel dupli
cated the nuclear properties of Core-2 design with high precision. The flex
ibility of the mock-up affordet} a wide variety of critical-assembly configur-

SHIPPINGPORT POWER STATION 265
N
t2 3 4 5 6 7 8 9 10 И 12
97 SQUARE MODULES SPACED 7-1/2 INCHES ON SQUARE ARRAY
EB SEED A SSEM BLY (20)
С И FIRST PASS BLANKET ASSEMBLY (40)
П SECOND PASS BLANKET ASSEMBLY (37)
SYMBOL AND TYPE OF INSTRUMENTATION
L O C A T I O NTOTAL TOTAL
SPARESSEEDBLAN KET
FIRST PASS SECOND FASS
W-FLUX W ELL 5 0 1 6
1 - INLET WATER THERMOCOUPLE il (D 10 © 10 (5) 31 ©0-OUTLET WATER THERMOCOUPLE и 10 10 31
F-COO LANT FLOW ( FM I) и (D 10 © 10 (D 31 ©P-REGIONAL PRESSURE DROP' i 1 ’ i 3
- FAILED ELEMENT DETECTION AND LOCATION (FEDAL)-
A LL ASSEM BL IES20 40 37 97
NOTE- CIRCLED CHARACTERS DENOTE SPARE INSTRUMENTATION LOCATIONS AND QUANTITIES.
Fig. 34
Core-2 instrumentation

СОИ
I
266 H. FEINROTH et al.
¡e3If
r s s *«s« OI
g p
Fig
.35
Com
pari
son
of
Core
1
with
Co
re
2
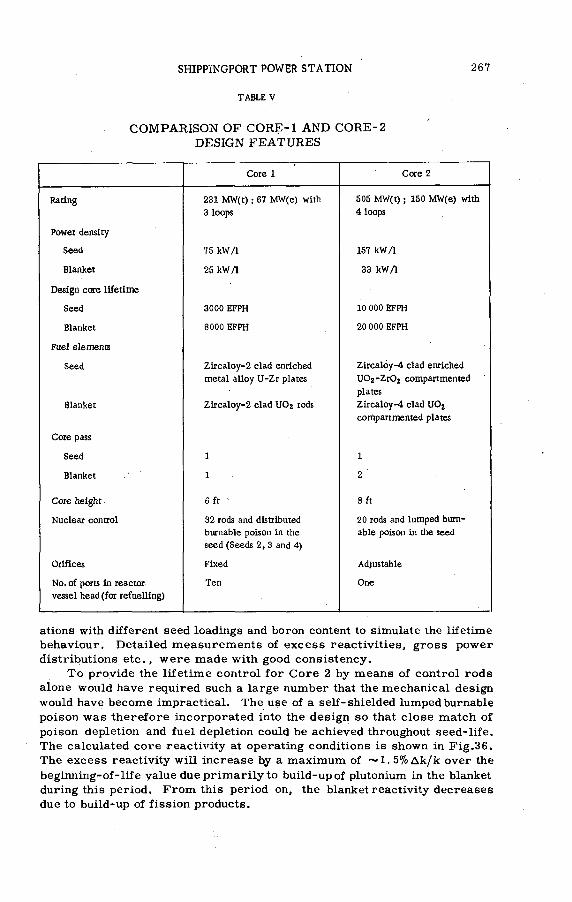
SHIPPINGPORT POWER STATION 267
TABLE V
C OM PA R ISON O F CORE-1 A N D CORE-2
DESIGN FE A TU R E S
Core 1 Core 2
Rating 231 MW(t) ; 67 MW(e) with
3 loops
505 MW(t) ; 150 MW(e) with
4 loops
Power density
Seed 75 k W A 157 kW/1
Blanket 25 k W A 33 kW A
Design соte lifetime
Seed 3000 EFPH 10 000 EFPH
Blanket 8000 EFPH 20 000 EFPH
Fuel elements
Seed
Blanket
Zircaloy-2 clad enriched
metal alloy U-Zr plates
Zircaloy-2 clad U O 2 rods
Zircalóy-4 clad enriched
UÛ2-Zr0 2 compartmented
plates
Zircaloy-4 clad U 0 2
compartmented plates
Core pass
Seed 1 1
Blanket 1 2
Core height 6 ft • 8 ft
Nuclear control 32 rods and distributed
burnable poison in the
seed (Seeds 2, 3 and 4)
20 rods and lumped bum-
able poison in the seed
Orifices Fixed Adjustable
No. of ports in reactor
vessel head (for refuelling)
Ten One
ations with different seed loadings and boron content to simulate the lifetime
behaviour. Detailed measurements of excess reactivities, gross power
distributions etc., were made with good consistency.
To provide the lifetime control for Core 2 by means of control rods
alone would have required such a large number that the mechanical design
would have become impractical. The use of a self-shielded lumped burnable
poison was therefore incorporated into the design so that close match of
poison depletion and fuel depletion could be achieved throughout seed-life.
The calculated core reactivity at operating conditions is shown in Fig.36.
The excess reactivity will increase by a maximum of ~1. 5% Дк/к over the
beginning-of-life value due primarily to build-up of plutonium in the blanket
during this period. From this period on, the blanket reactivity decreases
due to build-up of fission products.
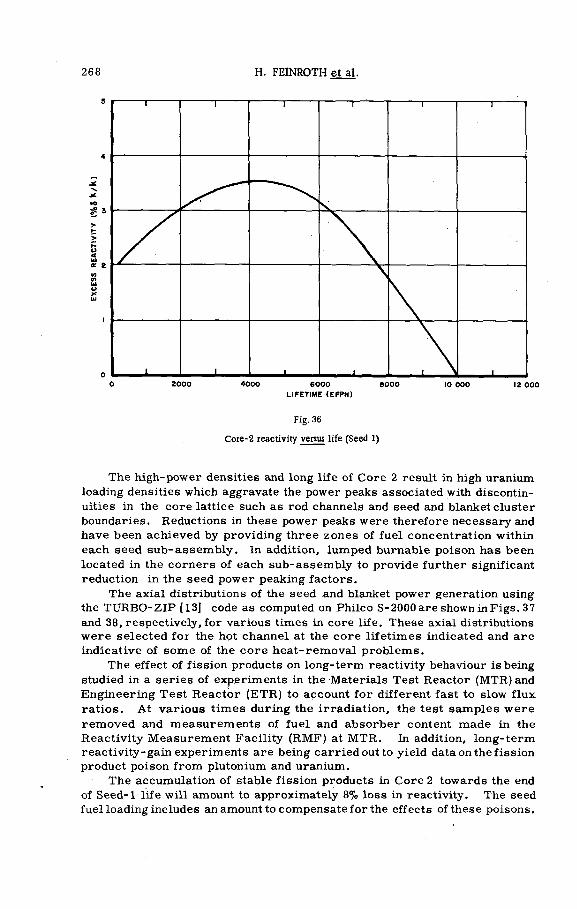
268 H. FEINROTH et al.
LIFETIME (EFPH)
Fig. 36
Core-2 reactivity versus life (Seed 1)
The high-power densities and long life of Core 2 result in high uranium
loading densities which aggravate the power peaks associated with discontin
uities in the core lattice such as rod channels and seed and blanket cluster
boundaries. Reductions in these power peaks were therefore necessary and
have been achieved by providing three zones of fuel concentration within
each seed sub-assembly. In addition, lumped burnable poison has been
located in the corners of each sub-assembly to provide further significant
reduction in the seed power peaking factors.
The axial distributions of the seed and blanket power generation using
the TURBO-ZIP [13] code as computed on Philco S-2000 are shown in Figs. 37
and 38, respectively, for various times in core life. These axial distributions
were selected for the hot channel at the core lifetimes indicated and are
indicative of some of the core heat-removal problems.
The effect of fission products on long-term reactivity behaviour is being
studied in a series of experiments in the Materials Test Reactor (MTR)and
Engineering Test Reactor (ETR) to account for different fast to slow flux
ratios. At various times during the irradiation, the test samples were
removed and measurements of fuel and absorber content made in the
Reactivity Measurement Facility (RMF) at M T R . In addition, long-term
reactivity-gain experiments are being carried out to yield data on the fission
product poison from plutonium and uranium.
The accumulation of stable fission products in Core 2 towards the end
of Seed-1 life will amount to approximately 8% loss in reactivity. The seed
fuel loading includes an amount to compensate for the effects of these poisons.

SHIPPINGPORT POWER STATION 269
C O R E H E IG H T (IN C H E S )
Fig. 37
Core-2 Seed-1 power distribution
In the blanket, the effects of the fission-product poison are not only balanced,
but actually overcome by the plutonium production. During the life of the
first seed, 45% of the blanket energy will be generated by plutonium produced
and burned and 10% will be generated by fissioning of natural uranium. The
balance of the blanket energy will be generated by fissioning of U235 of which
only about one-half of the original content will remain atthe end of Seed-1 life.
Thermal and mechanical design
The thermal design of Core 2 was developed on the basis that:
(1) No departure from fuel element surface temperature associated with
nucleate boiling should take place during normal or accidental transient
conditions.
(2) No flow oscillations should take place in the core under steady-state
operating conditions. This restriction is necessary to prevent the occurrence
of high-temperature cycling of the fuel, since the irradiation behaviour of
uranium-oxide plate fuel elements at high depletions is sensitive to central
fuel temperatures.
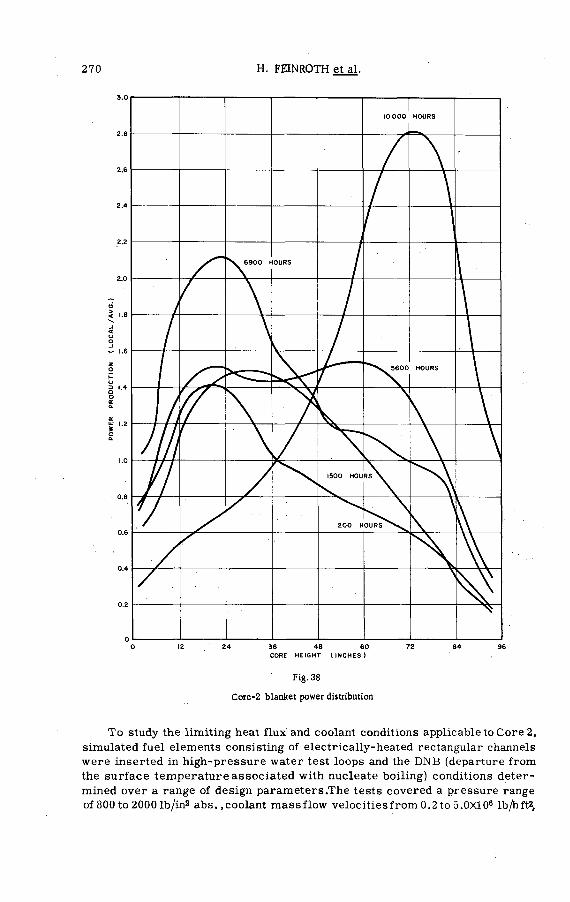
270 H. FEINROTH et al.
C O R E H E I G H T ( I N C H E S )
Fig. 38
Core-2 blanket power distribution
To study the limiting heat flux and coolant conditions applicable to Core 2,
simulated fuel elements consisting of electrically-heated rectangular channels
were inserted in high-pressure water test loops and the DNB (departure from
the surface temperature associated with nucleate boiling) conditions deter
mined over a range of design parameter s.The tests covered a pressure range
of 800 to 2000 lb/in2 abs.,coolant massflow velocities from 0.2 to 5.0X10⁶ lb/hft2.

SHIPPINGPORT POWER STATION 271
fluid enthalpies from about 500 BTU/lb to 1200 BTU/lb, channel lengths up to
96 in, and various axial heat-flux distributions. As a result of this work
a new DN B correlation has been developed [14] in which mass flow plays
a more important part than previously.
Similarly, an extensive test programme to measure pressure drops and
quality in uniformly heated rectangular channels at 800 to 20001b/in2 abs.in
the local and bulk boiling regions was conducted which resulted in new methods
for studying flow redistribution, flow oscillations and fast transients [15, 16, 17 ].
In the process of confirming the mechanical design, extensive reactor
tests identified several unanticipated problems which are peculiar to the
compartmented plate design. Each problem required analysis and in the '
final stages required minor redesigning to correct existing problems. This
effort produced significant contributions to the basic engineering sciences.
A good example is the phenomenon of fuel growth and the consequential
weakening of the seed fuel plate which produces a tendency for the plates to
bow when subjected to the hydraulic forces in the core.
In-pile irradiation tests showed that as the fuel material in Zircaloy
compartments grew as a result of high depletion, the cladding became
strained, causing a decrease in plate rigidity. Techniques were developed
for analysing this loss in plate stiffness, including an experimental pro
gramme which showed the need for additional transverse ribs which would
add sufficient rigidity to the plate to restrict plate bow at high fuel deDletions.
This change was incorporated in the design.
Photoelastic tests verified the calculated stress levels in both seed and
blanket clusters when subjected to Core-2 mechanical loading conditions.
A full-size fully instrumented carbon steel model of the core bottom support
plate was also built and tested to ensure that the structure would meet design
requirements on stress and deflection.
Tests of dummy fuel clusters with their associated control rods and
support structures under conditions of flow, temperature and pressure, duplicating those expected in Core 2, have been satisfactorily completed .
Additional tests on lead production components are planned.
C o r e m aterials development
iCladding
Experience with Zircaloy-2 cladding for Core-1 fuel elements has indi
cated that it is capable of extended service in high-temperature water with
excellent corrosion resistance and mechanical stability. However, zirconium-
base claddings are known to be capable of absorbing sqme hydrogen dissolved
in the coolant or generated during the corrosion reaction between zirconium
and water. Further, hydrogen in zirconium will migrate towards and con
centrate in the relatively colder regions of the material. Fig.39 illustrates
the effect of hydrogen migration towards the colder region of a sample plate
fuel cladding where the dark etching rim denotes the precipitated hydride
platelets. Experiments with Zircaloy-clad fuel elements have shown that
the segregation and precipitation of zirconium hydrides can lead to sufficient
embrittlement to cause clad cracking at average hydrogen content. To ensure
that this does not occur, a limit of about 200 to 250 ppm in the cladding is

272 H. FEINROTH et al.
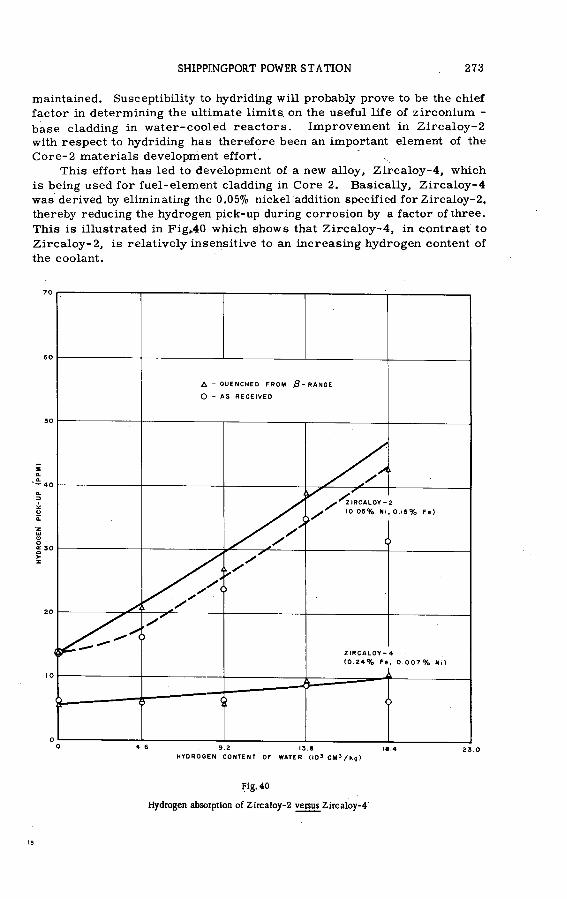
SHIPPINGPORT POWER STATION 273
maintained. Susceptibility to hydriding will probably prove to be the chief
factor in determining the ultimate limits on the useful life of zirconium -
base cladding in water-cooled reactors. Improvement in Zircaloy-2
with respect to hydriding has therefore been an important element of the
Core-2 materials development effort.
This effort has led to development of a new alloy, Zircaloy-4, which
is being used for fuel-element cladding in Core 2. Basically, Zircaloy-4
was derived by eliminating the 0.05% nickel addition specified for Zircaloy-2,
thereby reducing the hydrogen pick-up during corrosion by a factor of three.
This is illustrated in Fig,40 which shows that Zircaloy-4, in contrast to
Zircaloy-2, is relatively insensitive to an increasing hydrogen content of
the coolant.
Fig. 40
Hydrogen absorption of Zircaloy-2 versus Zircaloy-4'

274 H. FEINROTH et al.
Blanket fuel
As a result of the Shippingport programme, sintered UO2 of high density
has been demonstrated to possess high irradiation stability and corrosion
resistance. The irradiation exposure of UO2 on a large scale, as achieved
by Core-1 operations to date, has produced no structural and property
changes other than those induced by the operating temperature alone.
However, the levels of irradiation reached in this way are still relatively
low. Data from in-pile loop tests, on the other hand, do show that marked
structural and dimensional changes can occur in U02 when exposed to high
burn-ups. These tests were made on UO2 wafers encased in plate cladding
and exposed to fissioning depletions beyond 75 000 MWd/t of uranium. The
tests covered a wide range of operating temperature, external pressure,
cladding restraint, fuel density, void volume, and U 0 2 composition [18] .
Fig.41 shows the change in fuel structure in a U02 plate exposed to approxi
mately 75 000 M Wd/t of uranium at over 2000°F; the numerous voids
generated are attributed to the internal precipitation of fission gases (more
than 10% release as compared to less than 1% release at low burn-ups),
whereas the white inclusions are tentatively ascribed to the agglomeration
and precipitation of non-volatile fission product. X-ray crystallographic
examination, on the other hand, has revealed that the crystalline structure
of U 0 2 is retained even at burn-ups of 75 000 M W d/t of uranium.
Fig. 41
Photograph of UOj irradiated to 75 000 MWd/t of
uranium at a temperature greater than 2000°F (400X)

SHIPPINGPORT POWER STATION 275
In addition, the thermal conductivity of U 02 continuously deteriorates
as burn-up progresses, as shown in Fig.42, resulting in a continuous in
crease in fuel temperature.
The most striking result of this irradiation programme is the identifi
cation of the strong dependence of the irradiation stability of high-density
U 02 fuel elements on the fuel operating temperature and restraint. For the
case of Core-2 plate elements, this relationship is shown in Fig.43 which
also indicates the margin of the most highly depleted Core-2 blanket fuel
to clad rupture. This'margin is considered adequate in meeting Core-2
design and material objectives.
Seed fuel
A requirement of the Core-2 seed design is the development of a fuel
material capable of 2 5 X 10²⁰ fissions/cm3 burn-up with adequate irradiation
stability, and corrosion resistance. After extensive in-pile and out-of-pile
testing of various diluents of low thermal-neutron cross-section, the choice
was narrowed to Zr02 because of its adequate corrosion resistance and re
latively superior mechanical and dimensional stability under Core-2 irradi
ation exposure conditions.
The limitations of Zr02 -U02 fuel material as a function of burn-up and
operating temperature [19] are shown in Fig.44, which is similar to Fig.43
for natural U 0 2. The behaviour of Zr02- U02 differs from U 0 2 in three
major respects; (1) The initial porosity in Zr02-U02 wafers has been ob-
observed to disappear completely at irradiation exposures less than
6X 10²⁰ fissions/cm3, as demonstrated in Fig.45, in contrast to porosity
retention in UOj wafers even at 34X 1020 fissions/cm3,(2) defected Zr02 -UOj
fuel elements show no evidence of corrosion attack in either in- or out-
of-pile tests in high-temperature water or steam and for very high fission
ing rates including rates which have induced corrosion attack on U 0 2 ;
and (3) the thermal conductivity of Zr02 -иОг remains relatively unchanged with irradiation as shown in Fig.42.
The development programme on the Core-2 seed fuel material has, thus,
culminated in obtaining a Zr02 -U02 fuel material which shows good promise
of meeting the extremely high depletion requirements specified.
Poison materials
The nuclear design of Core 2 required, as discussed previously, that
an appreciable fraction of the excess reactivity be controlled by the addition
of lumped burnable poison. To obtain adequate matching of poison depletion
to reactivity changes of the core, poison materials of high specific boron
loading were required. It was further desirable that the lumped burnable
poison be capable of being incorporated in the same fuel-element configur
ation as that utilized for the oxide plate seed. The austenitic stainless-steel
alloy containing 0.8% B-10 additions has been selected because of its superior
dimensional stability under irradiation and adequate corrosion resistance
in high-temperature water.

276 H. FEINROTH et al.
J; ±d-UH/n±8
т о ю о ю o
(O o 'W O /S X IV M ) ‘A llA llO n a N O O HVW d3HX 3 A IX 03 d J 3
Fig
.42
Effe
ctiv
e th
erm
al
conduct
ivit
y
of
cer
am
ic
fuel
s du
ring
ir
radia
tion
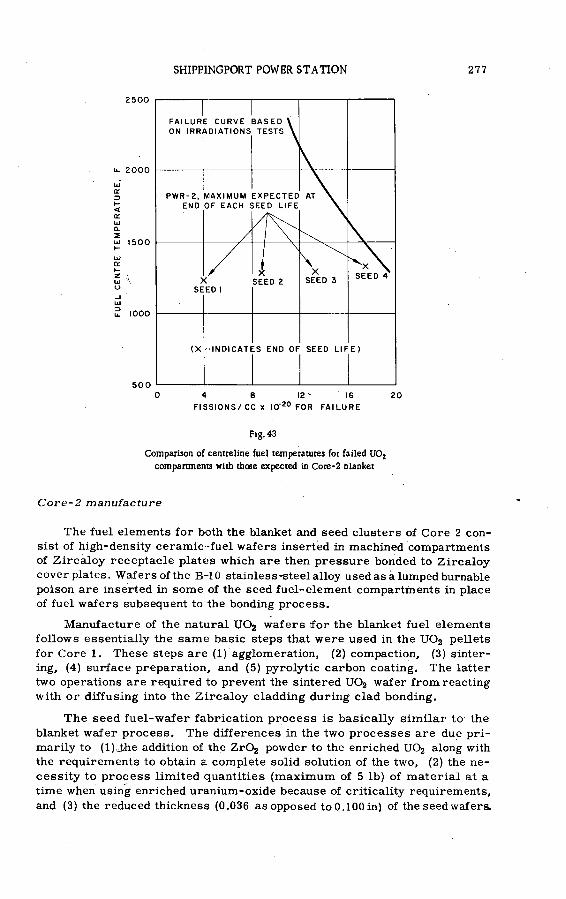
SHIPPINGPORT POWER STATION 277
О 4 в 12' 16 20
FISSIONS/СС X Iff20 FOR FAILURE
Fig. 43
Comparison of centreline fuel temperatures for failed U 02
compartments with those expected in Core-2 Blanket
Core-2 manufacture
The fuel elements for both the blanket and seed clusters of Core 2 con
sist of high-density ceramic-fuel wafers inserted in machined compartments
of Zircaloy receptacle plates which are then pressure bonded to Zircaloy
cover plates. Wafers of the B-10 stainless-steel alloy used as à lumped burnable poison are inserted in some of the seed fuel-element compartments in place
of fuel wafers subsequent to the bonding process.
Manufacture of the natural UO2 wafers [for the blanket fuel elements
follows essentially the same basic steps that were used in the U 0 2 pellets
for Core 1. These steps are (1) agglomeration, (2) compaction, (3) sinter
ing, (4) surface preparation, and (5) pyrolytic carbon coating. The latter
two operations are required to prevent the sintered U02 wafer from reacting
with or diffusing into the Zircaloy cladding during clad bonding.
The seed fuel-wafer fabrication process is basically similar to the
blanket wafer process. The differences in the two processes are due pri
marily to (l)alhe addition of the Zr02 powder to the enriched U02 along with
the requirements to obtain a complete solid solution of the two, (2) the ne
cessity to process limited quantities (maximum of 5 lb) of material at a
time when using enriched uranium-oxide because of criticality requirements,
and (3) the reduced thickness (0.036 as opposed toO.lOOin) of the seed wafers.

278 H. FEINROTH et al.
D E P L E T IO N F IS S IO N S , CC * IO _2 °
Fig.44
Comparison of centreline fuel temperature in seed fuel elements
test with that expected for Core 2
The manufacture of the 0.8 wt.% boron stainless-steel alloy wafers
follows standard alloy practices for stainless steel. The alloy actually con
sists of a uniform dispersion of very fine (5 ц т or less) particles of a com
plex iron-chromium-nickel boride in the stainless-steel matrix. Chromium
coating was deposited on the alloy wafer surfaces to prevent the formation
of low melting zirconium-base eutectics during the sub-assembly welding
process.A method of bonding which does not require extensive plastic deformation
of the fuel components had to be developed for the Core-2 elements. A gas
pressure-bonding process was chosen which effected a bond through the
simultaneous application of 6500 (seed) and 10 000 lb/in2 (blanket) gas pressure and 1580°F temperature. The combination of temperature and
pressure forces the mating Zircaloy surfaces into intimate contact and allows
solid-state bonding to occur by diffusion and subsequent grain growth across
the Zircaloy interfaces.
The bonding temperature for optimum bond quality has been found to be
1580°F. However, extensive corrosion testing of samples and coupons selec
ted from pressure-bonded development fuel elements indicated that bonding
at 1580°F or higher with subsequent slow cooling from this temperature re
sulted in increased hydrogen pick-up and weight gains sifter corrosion testing.
To restore the optimum corrosion resistance requires the adoption of a post
bonding heat treatment into the beta region (1875°F), holding for five minutes
and rapidly cooling the fuel elements at a rate in excess of 200°F/min.
A hydrogen removal treatment (vacuum annealing at 1450°F) and a hot flatten
ing operation are necessary to complete the post-bonding thermal treatments
The manufacturing status of Core 2 at this time may be summarized
as follows: All fuel elements for both the seed and blanket have been com-

Fife. 45
In-pile densification of Zr02 + 34 wt. % U 02 after short exposure (60X)
pleted and all of the blanket sub-assemblies have been welded and are in
various stages of inspection. The first seed sub-assemblies have also been
280 H. FEINROTH et al.
satisfactorily welded. The structural components are about 75% complete;
the reactor closure head has been shipped to the Station. Control drive
mechanisms are approximately 95% complete and shipments have started.
The core is expected to be completed in the latter part of 1963.
During the production of Core 2, new manufacturing problems arose
which required development and, in some instances, core redesign. This
type of problem is usually expected in the design and manufacture of a
development core. The seed poison plates were redesigned to eliminate
the adverse effects of irradiation-induced poison element swelling and to
minimize the reaction of the poison material with the cladding during sub-
assembly welding. In the development of electron-beam welding, considerable
process development was required in order to obtain acceptable corrosion
characteristics of the finished product. Development of fibre optic techniques
for inspection of corrosion products and defects on fuel-element surfaces
required considerably more effort than had been predicted, but the resulting
inspection technique permits a very satisfactory inspection of the oxide plate
characteristic of PW R Core 2. These are typical examples of the require
ments usually experienced in the manufacture of a developmental core.
Plant modifications
The Shippingport Plant has an electric generating capacity of 100MW(e).
In order to demonstrate the 150 MW(e) gross capability of Core 2, a heat
dissipation system consisting of water-cooled condensers and associated
equipment will be added to the steam plant to dissipate the reactor power
produced in excess of 100 MW(e) gross. Based on an economic study, the
heat-dissipation system approach was selected over the alternative of in
creasing the generating capacity to 150 MW(e).
The demonstration of a 150 MW(e) gross capability of Core 2 also re
quires the modification of several components of the reactor plant, most
notably the main coolant pumps, the steam generators, the primary and
secondary relief valves, and modifications to the Safety Injection System.
The Core-2 flow requirements are approximately the same as those
for Core 1 but, due to the higher pressure drop of Core 2, the pumping
head and horsepower will have to be increased about 45%. New main coolant
pumps are therefore being procured retaining the vertical single stage
centrifugal design. The Core-1 pump volutes which were welded into the
primary coolant system will also be retained, but are being machined in
place to fit the new impellers.
Simulator studies of plant operating transients have demonstrated that
the present pressurizer will be adequate for Core-2 operation. However,
the analysis of an operating emergency case (step loss of the 150 MW(e)
station load demand with no rod motion) has indicated a need for additional
relief capacity. Hence, another pilot-operated relief valve of the same
design as the existing valve and having the same control circuitry will be
installed on the pressurizer so that both valves will operate in unison. Four
additional self-actuated relief-valves will be installed on the secondary side
of the steam generators and new springs will be installed in the existing
secondary relief-valves to raise their set point.

SHIPPINGPORT POWER STATION 281
To remove reactor decay heat during a loss of pumping power, a self-
actuated secondary steam relief-valve has been utilized for Core 1. Natural
convection flow through the main coolant loops transfers the decay heat from
the reactor vessel to the steam generators. Operation of the secondary steam
relief-valve dissipates the heat to the atmosphere. The higher decay-heat
level of Core 2 requires the installation of a larger capacity relief-valve.
The Safety Injection System will supply cooling water to the core from
the steam-plant feed pumps for protection against meltdown from decay heat
generation in the unlikely event of a reactor plant boundary rupture resulting
in a loss-of-coolant accident. Improvements in the Core-1 system will be
provided by system modifications (including addition of a pump and valves
and some piping changes) which permit utilization of the core-failed element
detection and location piping to charge cooling water directly into each seed
and blanket cluster.
It is expected that the plant modifications and installation of Core 2 at
Shippingport will be completed during the last half of 1964. The Catalytic
Construction Company will do the actual modification work and the proce
dures for refuelling are being developed by the Duquesne Light Company
and Bettis Atomic Power Laboratory. Present planning calls for the de
contamination of the primary plant before carrying out the modification.
A decontamination solution of dilute potassium permanganate is expected
to be circulated to oxidize the deposited radioactive corrosion product. This
will be followed by an ammonium citrate solution rinse to remove the oxid
ized corrosion products. Developmental programmes are under way to de
termine the optimum conditions for the decontamination process. This will
be the first time that a central station nuclear power plant will have been
decontaminated after years of operation.
Reports on the overall modification programme, including the effective
ness of the decontamination, will be prepared and distributed to the nuclear
power industry.
. R E F E R E N C E S
[1] UNITED STATES ATOMIC ENERGY COMMISSION, Shippingport Pressurized Water Reactor, Addison-
Wesley Publ. Corp., Mass (1958).
[la] The Shippingport Pressurized Water Reactor Project Catalog ot Document Abstracts, USAEC Rpt. WAPD-
PWR- 1606 (Sep. 1958, revised Jan. 1960, Dec. 1961 and Jan.'1963) Add 1(1 May 1963).
[2] The First Refueling of the Shippingport Atomic PowerStation, USAEC Rpt. AfAPlJ-233,(July 1960).
[3] TheSecond Refueling of Corel oftheShippingportAtomicPowerStation.uSAECRpt. WAPD-260(Aug.J962).
[4] ABRAMS, C .S . , HAHN, W.J. , and LaPOINTE, J R ., Evaluation of the Performance of the Radioactive
Waste Disposal System at the Shippingport Station, Nat. Meeting Amer. Inst. Cheni.Engnrs, USAEC Rpt.
WAPD-T-1280 (Sep. 1961).
[5] HARDIGG, G .W . and SWARTZ, L. M. , Fuel Temperature Measurement, USAEC Rpt. WAPD-T-1367
(July 1961).
[6] CHRISTMAN. R. P. and JONES. D. H . , Summary of Calculational and Experimental Physics Results,
for Shippingport PWR-1 Seed 1, USAEC Rpt. WAPD-234 (Jan. 1961).
[7] BICKEL, P. A. and GALLAGHER, W .J ., Thermal and Hydraulic Operating Performance of the Shipping
port Pressurized Water Reactor Predictions Versus Measurements, USAEC Rpt. WAPD-T-1318
(Oct. 1961) ANS Meeting (Nov. 1961)
[8] RUBIN, B ., Fission Gas Release in PWRCorel Blanket Fuel Rods uponConclusion of Seed-1 Life, USAEC Rpt
WAPD-TM-263(Feb. 1961).

282 H. FEINROTH et al.
[9] LYNAM, L. R ., Metallurgical Examination of Fuel Rod Removed from PWR-1 Blanket at the End of the
Second Seed Life, USAEC Rpt. WAPD-TM-308 (Dec. 1961).
[10] LYNAM, L.R , LOSCO, E.F., SALVAGGIO, G.J. and GOODWIN, J .O ., Fabrication Defects Observed
in PWR Core-1 Blanket Fuel Rods, USAEC Rpt. WAPD-TM-321 (Sep. 1962).
[11] SALVAGGIO, G. I. » NICHOLS, F. A. and BACCA, J. P. . Jt- , Properties of a riafnium Control Rod after
Exposure during Two Seed Lives in PWR Core 1, USAEC Rpt. WAPD4TM-337 (Nov. 1962).
[12] CADWELL, W .R . et al, Nuclear Reactor Depletion Programs, USAEC Rpt. WAPD-221 (Jan. 1961).
[13] PFEIFER, C-J. and URBANUS, E. R. , ZIP-2- A One Dimensional Pew Group Synthesis Nuclear Depletion
Program for Philco-2000, USAEC Rpt. WAPD-228,(JuIy 1961).
[14] GREEN, S. J. and LeTOURNEAU, B. W. , Investigations of Departure from Nucleate Boiling Conditions
for PWR, USAEC Rpt. WAPD-TM-289 (July .961).
[15] GREEN S.J. and SHER, N .C . .Boiling Pressure Drop in Thin Rectangular Channels, USAEC Rpt.
WAPD-T-477, in Nucí. Engng. Pt. VI, Chem. Eng. Progr. Symp. Series j>5 23 (1959).
[16] MENDLER, O.J. , RATHBUN, A. f Van HUFF, N. and WEISS, A . , Natural Circulation Tests with
Water at 800 to 2000 Psia under Non-Boiling, Local Boiling, and Bulk Boiling Conditions, Trans. Amer.
Soc. mech. Engrs 83 3 (Aug. 1961) 261-273.
[17] QUANDT, E. R., Analysis and Measurements of Flow Oscillations, Hea»-Transfer Conference, Buffalo,
New York (Aug. i960) Symposium Series 32-S 111-126.
[18] DANIEL, R.C. , BLEIBERG, M. L. , MEIERAN, H.B. , and YENISCAVICH, W. , Effects of High Burnup
on Zircaloy-Clad, Bulk U 0 2 , Plate Fuel Element Samples, USAEC Rpt. WAPD-263 (Sep. 1962).
[19] RUBIN,. B .F ., BERMAN, R. M. , and BLEIBERG, M. L T h e Irradiation Behaviour of Zr02-U02 Fuels,
USAEC Rpt. WAPD-264 (Oc. 1962).
INITIAL OPERATIONAL RESULTS OF THE FIRST BELGIAN NUCLEAR POWER STATION BR3
M. GUÉBEN BUREAU D'ÉTUDES NUCLEAIRES, BRUSSELS
AND M. POTEMANS
SOCIETES REUNIES D'ENERGIE DU BASSIN DE L’ESCAUT MOL, BELGIUM
Abstract — Résumé — Аннотация — Resumen
INITIAL OPERATIONAL RESULTS OF THE FIRST BELGIAN NUCLEAR POVTR STATION BR3. The BR3
Nuclear Power Plant, property of the Centre d'étude de l'énergie nucléaire (CEN), is located at Mol-Donk on
the site of the latter, and at a distance of 40 miles as the crow flies from Brussels. The operation of the
plant is done by an Industrial Group. The reactor went critical, for the first time, on 29 August 1962. The
paper gives the results of the preliminary tests and of the first months of operation. The reactor BR3 is of
the pressurized, light-water moderated and cooled type, with a nominal thermal power of 40. 9 MW. The
core is heterogeneous, using UOz fuel, clad with stainless steel and has two regions. The outer region is
enriched to 4.43% by weight, the inner one to 3 .1%. Main coolant pressure is 140 kg/cm?. Different "primary"
circuits are in connection with the reactor.
The steam generator has a nominal capacity of 70 t/h. The turbine has two stages and three extraction
lines and a nominal power of 11700 kW. The personnel was selected from the experienced personnel of the
conventional power plants and received a thorough training in both the nuclear and the classical field.
The paper gives the results of the practical determination of the plant characteristics: control-rod worth
and boron worth determination, calibration of the control rods, temperature and pressure coefficients deter
mination, determination of the dropping time of the control rods, etc.
The excess reactivity was calculated for the clean core. These tests were done at zero power and after
441 effective full power hours (EFPH) burn-up: 750 MWJ). A résumé is given of the load transient tests and
the power coefficient determination.
Different problems encountered during operation are treated:
(a) Radiation activity in the plant: we may conclude from the results that the habitual work in the normal
areas is not affected by the radiation intensities present.
(b) Activity in the air of the building: the only problem which appeared until now is the presence of radon
in the reactor building and in certain auxiliary buildings. This radon comes from the concrete.
(c) Leak-rate of primary water: about 100 1/h.
(d) Mechanical difficulties, e.g. with the charging pumps, untightness of valves, etc.
RÉSULTATS INITIAUX DU FONCTIONNEMENT DE LA PREMIÈRE CENTRALE NUCLÉAIRE BELGE BR3. U
centrale nucléaire BR3, qui appartient au Centre d'études de l'énergie nucléaire (CEN) est située, comme le
Centre, à Mol Donk, à une soixantaine de kilomètres de Bruxelles à vol d’oiseau. La centrale est exploitée par
un groupe industriel. Le réacteur a divergé pour la première fois le 29 août 1962. Le mémoire donne les
résultats des essais préliminaires et des premiers mois de fonctionnement du réacteur. BR3 est un réacteur
refroidi et ralenti à l'eau légère sous pression, d'une puissance thermique nominale de 40,9 MW. Son cœur,
hétérogène, est composé d'éléments en oxyde d'uranium gainés d'acier inoxydable et comprend deux zones:
la zone périphérique enrichie à 4 ,43% en poids et la zone centrale enrichie à 3 ,7% . La pression dans la
partie principale du circuit de refroidissement est de 140 kg/cm2. Divers circuits «primaires» sont reliés
au réacteur.
Le générateur dè vapeur a une puissance nominale de 70 t/h. La turbine, à deux étages, fournit du
courant triphasé et a une puissance nominale de 11700 kW.
Le personnel, choisi parmi des spécialistes ayant l'expérience de centrales classiques, a reçu une for
mation poussée dans le domaine nucléaire.
283

284 M. GUHBEN and M. POTEMANS
Les auteurs présentent les résultats de la détermination pratique des caractéristiques de la centrale: anti
réactivité des barres de contrôle et du bore, étalonnage des barres de contrôle, coefficients de température et
de pression, temps de chute des barres, etc.
L*excédent de réactivité a été calculé pour le cœur non empoisonné. Ces essais ont été réalisés à la
puissance nulle et après l'équivalent de 441 heures de marche à pleine puissance (combustion massique:
750 MW/j).
Les auteurs décrivent brièvement les essais en charge variable et la détermination du coefficient de
puissance. Ils signalent divers problèmes qui se sont posés au cours de expériences:
a) Activité des rayonnements dans la centrale: les résultats des expériences ont permis de conclure que dans -
les zones normales l’intensité des rayonnements n'affecte pas les travaux habituels.
b) Radioactivité de l'air dans le bâtiment: le seul problème quise soit posé jusqu'à présent a trait à la
présence de radon dans l'enceinte du réacteur et dans certains locaux auxiliaires. Ce radon provient du
béton.
c) Fuite de l'eau du circuit primaire: environ 100 l/h.
d) Difficultés mécaniques avec les pompes d'alimentation, défaut d'étanchéité des vannes, etc.
ПРЕДВАРИТЕЛЬНЫЕ РЕЗУЛЬТАТЫ ЭКСПЛУАТАЦИИ ПЕРВОЙ БЕЛЬГИЙСКОЙ АТОМНОЙ ЭЛЕКТРОСТАНЦИИ BR 3 .
Ядерная энергетическая установка BR 3 , собственность Исследовательского ядерного центра (ÇEN),
располохена в Моль-Донке, на площадке последнего, на расстоянии 40 миль по прямой от Брюсселя.
Эксплуатация установки осуществляется промышленной группой. Реактор достиг критического состояния
впервые 29 августа 1962 года. В данном докладе мы приводим результаты предварительных испытаний
и первых месяцев эксплуатации. Реактор ВВ 3 является реактором с водным замедлителем и тепло
носителем, номинальная тепловая мощность его 4 0 ,9 мгвт. Активная зона - гетерогенного типа,
с использованием в качестве топлива U02 , покрытие - из нержавеющей стали. В активной зоне имеют
ся две зоны: Степень обогащения внешней зоны составляет 4 ,4 3 вес%, внутренней - до 3 , 7 вес%.
Давление основного охладителя составляет 140 кг/см2 . Различные "первичные" контуры связаны
с реактором.
Номинальная мощность парогенератора составляет 70 т /час . Турбина имеет две ступени и три
линии пароотбора; номинальная мощность турбины 11 700 квт.
Персонал набран из числа опытных сотрудников обычных энергетических установок. Все полу
чили тщательную подготовку в области атомной энергии» равно как и в области обычной энергетики.
Приводятся результаты практического определения характеристик установки: определение ком
пенсирующей способности регулирующего стержня и поглощательной способности бора, калибровка ре
гулирующих стержней, определение температурных коэффициентов и коэффициентов давления, опреде
ление времени падения регулирующих стержней и т .д .
Избыточная реактивность рассчитывалась для чистой активной зоны. Испытания проводилиоь
на уровне нулевой мощности и после испытания 441 эквивалентных часов работы на полной мощности
(глубина выгорания 750 мгвт-дн/т).
Приводятся выводы, полученные в результате испытания переходных колебаний нагрузки и опре
деления коэффициентов мощности.
Рассматриваются различные проблемы, возникшие в ходе эксплуатации:
а) активность излучения на установке: по результатам мы можем сделать вывод, что сотрудники
в нормальных зонах не подвергаются воздействию имеющегося излучения;
б) активность в воздухе помещения: единственная проблема, которая возникла до настоящего вре-
мени, заключается в наличии радона в помещении реактора и некоторых вспомогательны: помеще
ниях; радон попадает в атмосферу помещения из бетона;
в) величина утечки воды из первичного контура около 100 л/час;
г) трудности, связанные с отдельными механизмами, например с нагнетательными насосами, с кла
панами и т .д .
RESULTADOS INICIALES DEL FUNCIONAMIENTO DE LA PRIMERA CENTRAL NUCLEOELÉCTRICA BELGA
BR3. La central nucleoeléctrica BR3, que pertenece al Centre d'étude de l'énergie nucléaire (CEN), está
situada en Mol-Donk, en los terrenos de este Centro, a unadistancia de 40 millas a vuelo de pájaro de Bruselas.
De la explotación de la central se encarga una empresa industrial. El reactor alcanzó la criticidad inicial
el 29 de agosto de 1962. Los autores exponen los resultados de las pruebas preliminares y de los primeros
meses de funcionamiento. El reactor BR3 es del tipo moderado y refrigerado por agua ligera a presión y su
FIRST BELGIAN POWER STATION 285
potencia térmica nominal asciende a 40,9 MW . El núcleo es heterogéneo, su combustible es de UOz con
revestimiento de acero inoxidable y tiene dos regiones. El enriquecimiento de la región externa es de 4,43 por
ciento en peso, y el de la interna, de 3, 7 7c también en peso.
La presión del refrigerante alcanza a 140 kg/cm *. El reactor está conectado con varios circuitos primarios.
■ La capacidad nominal del generador de vapor es de 70 t/h. La turbina es de dos etapas con tres lineas de
extracción y una potencia nominal de 11700 kW. El personal se ha seleccionado entre los efectivos que poseen
una vasta experiencia en materia de centrales de tipo tradicional y ha recibido formación completa tanto en
la esfera nuclear como en la clásica.
En la memoria se exponen los resultados de la evaluación experimental de las características de la
central: determinación del valor de las barras de control y del boro, calibración de las barras de control,
determinación de los coeficientes de temperatura y de presión, determinación del tiempo de introducción de
las barras de control, etc.
Se ha calculado el exceso de reactividad del núcleo limpio.
E stas pruebas se han efectuado tanto a potencia cero como después de un tiempo de funcionamiento
equivalente a 441 1 a plena potencia (grado de combustión: 750 MWd).
Se describen brevemente las pruebas de carga transitoria y la determinación del coeficiente de potencia.
Se exponen diversos problemas planteados durante el fincionamiento:
a) Radiactividad de la central: los resultados permiten concluir que la intensidad de las radiaciones no
afecta al desarrollo de las operaciones habituales en las zonas de trabajo.
b) Radiactividad del aire en el edificio: el único problema que ha surgido hasta ahora es la presencia de
radón en el edificio del reactor y en algunos edificios auxiliares. El radón proviene del hormigón.
c) Indice de escape del agua del circuito primario: unos 100 1/h.
d) Dificultades de tipo mecánico, por ejemplo, las planteadas por las bombas de carga, la falta de estan-
queidad de las válvulas, etc.
1. INTRODUCTION
The BR3 nuclear power plant, property of the Centre d'Etude Nucléaire
(CEN) is located at Mol-Donk on the site of the latter, and at a distance of
40 miles as the crow flies from Brussels. The operation of the plant is
carried out by an Industrial Group (Fohdation Nucléaire). The interested
companies have assigned qualified members of their personnel to form the
operating crew. Some members of the CEN personnel have also been in
cluded in this group.
Criticality of the reactor was first achieved on 29 August. 1962. The
station was brought in parallel for the first time on 10 October 1962. Since
that time until the end of February 1963 the station's output to the Belgian
grid amounted to 10 126 000 kWh(e).
This paper gives the results of the preliminary tests and of operation
during the first months.
2. SU M M A R Y OF THE PR IN C IPA L CHARACTERISTICS O F T H E BR3
The BR3 reactor is of the pressurized type, light-water moderated
and cooled. The principal characteristics of the plant are as follows.
2. 1. Reactor and m ain loop
The core of the reactor (Fig. 1) consists of 32 fuel assemblies of UO 2
of which 16 are enriched to 3.7% by weight (inner region) and 16 are en
riched to 4.43% by weight (outer region). There are 12 control rods com-

286 M. GUÉBEN and M. POTEMANS
Cross -section of the BR3 core
posed of 80% Ag+ 15% In+ 5% Cd. The total heat output is 40.9 M W and the
estimated life-time of the core is 7 000 E F P H (effective full power hours).
The average coolant temperature of the main loop is 262°C and the
coolant flow rate is 2 250 t/h. The temperature difference between inlet
and outlet of the reactor at full power is 14°C. The nominal systempressure
is 140 kg/cm 2 maintained by a pressurizer (maximum heating capacity
153 kW).
2. 2. Associated "p r im a r y " loops
A purification loop with a variable flow rate from 1 to 7 m 3/h and pro
vided with two demineralizers (anionic for H 3B 0 3 and Mixed-Bed) functions
at low pressure (7 kg/cm2) and in by-pass on the main loop, thus neces
sitating decompression stations andpumps. A surge tank is provided through
which make-up water and hydrogen are added to the primary loop.
Demineralized water for’the make-up water loop comes from the BR2/
BR3 common water treatment station and is stored in a primary water
storage tank. The make-up water is degasified in a vacuum de-aerator and
transferred by two pumps to the charging system.
The shut-down cooling loop consists of two pumps and a heat exchanger
to evacuate the calories of a sub-critical core (fission products), brought
to low temperature and pressure.
There is also an .emergency shut-down loop to evacuate the calories
of a sub-critical core at normal operating temperature and pressure (fission
products) and in the event of an emergency. In addition, there is a safety
injection loop to compensate important losses of water due to a leak and
to avoid the core being uncovered at any time.

FIRST BELGIAN POWER STATION 287
The storage well loop consists of pump, heat exchanger and deminera
lizer to evacuate the heat produced by a depleted core stored in the storage
well.
The component cooling loop consists of two pumps and two heat ex
changers in a closed loop to evacuate the calories of the other heat exchangers and main coolant pumps. The two heat exchangers of this loop are cooled
by water coming from a lagoon.
Finally, there are also the vents and drains loop, the liquid wastes
loop (activity, contamination), and the ventilation and gaseous wastes loops
(activity, contamination).
2. 3. M easuring and control systems
Measurement of temperatures, pressures, flows, levels is by classical
methods. There is also a nuclear instumentation system which follows the
evolution of the neutron flux and thus of the power of the reactor.
The control system of the reactor can be either manual or automatic
and there is a radioactivity control system to protect personnel and plant.
2. 4. Steam generator and turbine
The vertical steam generator contains 1400 hairpin tubes. At full load
operating conditions, the generator steam flow amounts to 70 t/h and the
steam pressure is 36.9 atm abs. ; at no-load the pressure increases to
50 atm abs. The main steam line is provided with a turbine by-pass. The steam,
supplied to a two- stage turbine with three extraction lines, provides a gross
electrical generating capability of 11.7 M W at the turbine shaft. A moisture
separator, placed between the two stages of the turbine, lowers the humidity of
steam from 10% to less than 1% before entering the low-pressure part of the
turbine. The condensation an4pre-heating part is of a classical type. (Fig. 2)
2. 5. Alternators
The principal alternator has a rated power output of 11.2 M W under
10.5 kV. An auxiliary generator is driven by the turbine generator by means
of a reduction gear. This auxiliary generator feeds one of the primary
pumps. In the event of a turbine trip, the auxiliary generator will continue
for a while to supply this pump (7 min) as a result of the group inertia. This
allows for the starting of the diesel engine and the emergency shut-down
process (2 min maximum).
3. O PE R A TIN G P R O B L E M S
3. 1. Personnel and training
The pérsonnel was selected from experienced people from classical
power stations with a solid background in that field. Their experience was
completed and oriented to the BR3 during the end of construction of the plant
and during the many performance and functional tests of the different loops.
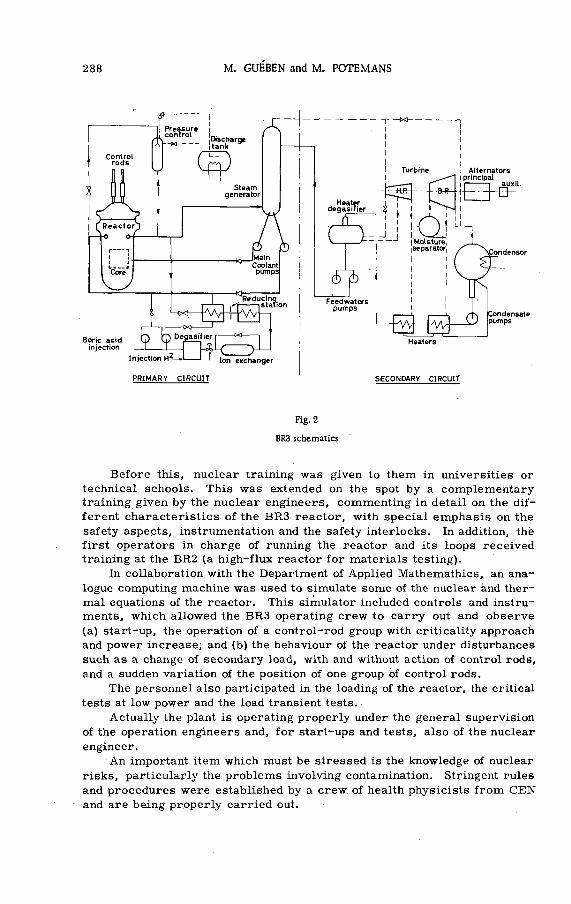
288 M. GUHBEN and M. POTEMANS
Fig. 2
BR3 schematics
Before this, nuclear training was given to them in universities or
technical schools. This was extended on the spot by a complementary training given by the nuclear engineers, commenting in detail on the dif
ferent characteristics of the BR3 reactor, with special emphasis on the
safety aspects, instrumentation and the safety interlocks. In addition, thfe
first operators in charge of running the reactor and its loops received
training at the BR2 (a high-flux reactor for materials testing).
In collaboration with the Department of Applied Mathemathics, an ana
logue computing machine was used to simulate some of the nuclear and ther
mal equations of the reactor. This simulator included controls and instruments, which allowed the BR3 operating crew to carry out and observe
(a) start-up, the operation of a control-rod group with criticality approach
and power increase; and (b) the behaviour of the reactor under disturbances
such as a change of secondary load, with and without action of control rods,
and a sudden variation of the position of one group of control rods.
The personnel also participated in the loading of the reactor, the critical
tests at low power and the load transient tests.
Actually the plant is operating properly under the general supervision
of the operation engineers and, for start-ups and tests, also of the nuclear
engineer.
An important item which must be stressed is the knowledge of nuclear
risks, particularly the problems involving contamination. Stringent rules
and procedures were established by a crew of health physicists from CEN
and are being properly carried out.

FIRST BELGIAN POWER STATION 289
3. 2. Practical determination of plant characteristics
3.2 .1 . Reactor
The operational safety of our heat source depends on its kinetic behaviour
and on the knowledge of its kinetic characteristics, this knowledge allowing
the establishment of safe procedures for plant operation. A list of the vari
ous parameters, giving.reactivity modification, is given below. Obviously,
a positive reactivity means an increase in the reactor power output, a neg
ative reactivity a decrease of this power. The way in which the parameters work applies, of course, to the BR3 core only.
(a) Water temperature, with a negative effect; if the temperature increases,
p decreases;
(b) Fuel temperature, with a negative effect; if the temperature increases,
p decreases;
(c) Pressure, with a positive effect; if the pressure increases, p increases
too;
(d) Control rods, with a positive effect when going up and a negative one
when going down;
(e) Neutron poisons such as fission products (or a chemical poison volun
tarily added), with a negative effect; and
(f) Fuel burn-up, with a negative effect.
It is very important to know the quantitative effect of these parameters
on core reactivity. The following operations were performed.
(a) With the new core (burn-up = 0). 9-10 August 1962: loading of fuel as
semblies into the pressure vessel, all control rods being inserted and
poisoning of primary water assured by boric acid (boron concentration:
1000 ppm).
Besides the normal core instrumentation (with too low a sensitivity
during loading because it is located, outside the core, in the neutron shield
tank), three complementary neutron detector channels (BF3 counters) were
installed inside the vessel during loading in order to follow the thermal neu
tron flux.
11-21 August 1962: closure of the pressure vessel and replacement of the
whole equipment in the reactor compartment (ventilation ducts, shielding
slabs, etc)
29 August, 1962: Initial criticality in cold condition (70°C), low pressure
(21 kg/cm2) with poisoning by 960 ppm boron. The reactor was just critical
with all rods banked at a height of 83 cm.
31 August - 1 September 1962: Determination of control rods and boron
reactivity worth (same conditions as above). The results of these measure
ments are given in Table I for boron and in Fig. 3, curve a, for the control-
rods-worth.
The determination of reactivity worth of control rods for different cri
tical heights was possible because of the modification of boron concentration,
the reactivity worth not being affected by this concentration.
2-6 Septëmber. 1962: Determination of pressure and water temperature
reactivity coefficients with a boron concentration of 465 ppm (pressure and
temperature varying from the values given above to the normal working
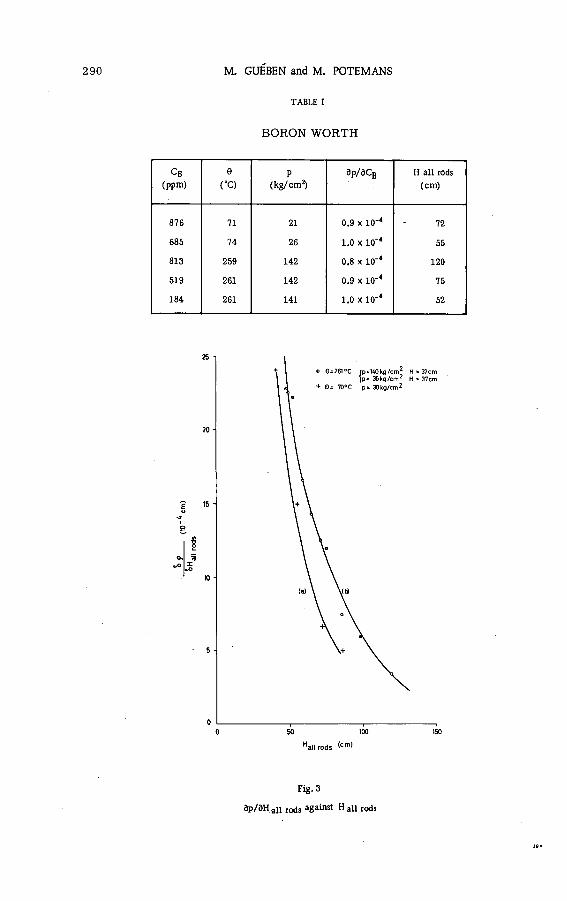
290 M. GUÉBEN and M. POTEMANS
TABLE I
BORON W O R TH
CB
(ppm)
0
C O
P
(kg/cm2)
ap/acB H all rods
(cm)
876 71 21 0.9 X 10~* 72
685 74 26 1.0 x 10"* 55
813 259 142 0.8 X 10’4 120
519 261 142 0.9 X 10⁻⁴ 75
184 261 141 1.0 X 10'4 52
0 SO too 150
Hall rods (cm)
Fig.3
Зр/дН aii r0(is against H ац rods

FIRST BELGIAN POWER STATION 291
conditions, i.e. 140 kg/cm2 and 262°C). The results are given in Table II
for the pressure coefficient and in Fig. 4, curve a, for the temperature
coefficient.
10-13 September 1962: Determination of control rods and boron reactivity
worth at normal working pressure and temperature and of the critical height
of control rods for various boron concentrations. The measurements re
lating to the control rods were made for different configurations (all rods
banked, all rods out but one central group of two rods, etc. ). The results
are given in Table I (bpron), in Fig. 3, curve b, and Figs. 5 and 6 (control
rods).
TABLE II
PRESSURE COEFFICIENT
CB
(ppm)
e(”C)
P
(kg/cm2)
dp/dp
(kg/cm*)"1
465 70 40 1.0 x IO-5
214 45-138 2.0 x 10'5
263 . 140- 95 3.1 x 10⁻⁵
140-168 3.1 x 10"5
8.6 - 5.2 260 140-168 4.6 x IO-5
140-115 4.4 xlO-5
.115- 90 4.5 X IO"5
1.7 213 140-115 3.0 X io-s
91-65 3.3 X io-5
70-40 3.0 X io-5
0 40 42-120 1.6 X 10-s
209 38-140 2.6 X lO*5
14-15 September 1962: Measurement of pressure and water temperature
reactivity coefficients, without boron. See Table II for the pressure co
efficient and Fig. 4, curve b, for the temperature coefficient.
22 September 1962: Measurement of control-rod drop time. Five tests
were performed on each rod in normal working conditions for pressure,
temperature, flow through the core, etc. The results varied between
840 ±5 msec and 895 ±5 msec, with an average of 870 ± msec.
(b) At 441 E FPH (burn-up = 750 MWd). 11-15 January 1963: Measurement
of pressure and water-temperature reactivity coefficients around normal
working temperature with a boron concentration of 475 ppm. Measurement

292 M. GUËBEN and M. POTEMANS
MC TEMP CC)
Fig. 4
ap/d в against 0
& All rods banked Св = 465 ppm ->
Я Programmed rods Св = 0 ppm >■ 441 EFPH
X AH rods banked Св = 475 ppm J
• All rods banked Св = 0 ppm "t 0 EFPH
♦ Programmed rods Св= 0 ppm J
TABLE III
PRESSURE COEFFICIENT
Св(ppm)
0
ГС)
P
(kg/cm!)
Эр/Зр
(kg/cm2)'1
0 260 136-110 4.54 X 10'5
0 260 110-136 4.7 x 10‘5
485 260 100-132 2.7 X 10'5
485 260 132-105 3.04 X 10’5
of critical height and reactivity worth of a central group of control rods,
for various boron concentrations.
The results appear in Table III (pressure coefficient), in Fig. 4, curves a
and b (temperature coefficient) and in Figs. 5 and 6 (control rods).
(c) At 1135 E FPH (burn-up= 1935 MWd). 11-13 March 1963: Measurement
of water temperature and pressure reactivity coefficients around normal

FIRST BELGIAN POWER STATION 293
Fig. 5
Hall rods aRd Hprogramme against 0 (Cg= 0) and against Cg (0-261*C)
0 ,+ : 0 EFPH
® : 441 EFPH
working temperature with different boron concentrations (400, 200 and
100 ppm). Measurement of boron reactivity coefficient at normal working
temperature and at 100 ppm of boron. The result was 1.3 X 10⁻⁴Дк/к ppm.
(d) Conclusions. The tests described under (a) allowed the determination
of the excess reactivity without control rods of the new clean core at zero
power and at normal working temperature and pressure. This excess re
activity is 8.5% Дк/к. This value was obtained in two different ways. First,
from the boron reactivity worth which was around 1% Дк/к per 100 ppm.
For low boron concentration the boron reactivity coefficient is higher, as
shown by the test performed at 1135 EFPH . The reactor was just critical
in the desired conditions with all control rods completely withdrawn from
the core with a boron concentration of 850 ppm, i. e. 8.5% Дк/к.
Secondly from the integral
I 9H dH = 8,5% ТГH,
(where Hi = 45 cm and H 2 = 132 cm) obtained with the curve В in Fig. 4
(45 cm is the critical height of aH rods banked under these conditions, with-

294
10
M. GUÉBEN and M. POTEMANS
a
6 -
25 50 75 100—I—
125
H q ( c m )
Fig. 6
dp/dH D against H D
(D = central rod group (2 rods))
О 0 EFPH
*441 EFPH
out boron, 132 cm is the maximum height of the rods when they are com
pletely out of the core). The two methods gave identical results.
We also determined the reactivity decrease due to the heating up of the
core water; this variation was about 6% Ak/k. To obtain this number, we
measured the variation in boron concentration to keep the reactor critical
when going from cold to hot condition, without moving control rods or modi
fying any other parameter. The result was Св = 600 ppm= 6% Дк/к.
The transient tests described below allowed the determination, from
the average core water-temperature variations and the water-temperature
reactivity coefficient, of the "power coefficient" introduced by the heating
of the fuel. It was found to be equal to 1 X 10"4Дк/к per percent of full load,
which gives a reactivity variation of 1% Дк/к when going from zero to full
power.
The reactivity taken by xenon poisoning at 85% of full power (we have
not yet operated for a long period at full power because of a problem re
lating to turbine overspeed trip during a complete loss of load) is 2.35%Ak/k.
The reactivity balance is given in Table IV.
The measurements at 441 EFPH and at 1135 EFPH showed that the pres
sure and water-temperature reactivity coefficients have not varied with the
burn-up. They also allowed us to obtain a value for the reactivity taken by

TABLE IV
FIRST BELGIAN POWER STATION 295
REACTIVITY BALANCE
Cold, clean reactor, at zero power: 14.5% Дк/к
Hot, clean reactor, at zero power: 8.5% Дк/к
Hot, clean reactor, at 85% of full power: 1.65% Дк/к
Hot reactor, eq. Xe, at 85% of full power: 5.3% Дк/к
burn-up and samarium poisoning around 0.95% Дк/к at 441 E F P H and
1.55% Дк/к at 1135 E F P H .
Based on the numbers obtained at 441 E F P H (750 MWd) we obtain, by
subtracting the theoretical value corresponding to samarium poisoning
(0.55% Дк/к), the reactivity taken by the fuel burn-up, i.e. 0.4% Дк/к. This
result is corroborated by the test at 1135 EFPH.
The excess core reactivity when going over to power (hot reactor, equi
librium xenon, 85% of full power and samarium corresponding to 1135 EFPH
at 85% power) is thus 3.75% Дк/к.
Taking into account a slight increase of samarium effect with irradiation
time and increasing effects of xenon (0.15% Дк/к) and power coefficient
(0.15% Дк/к) for working at full power, the excess core reactivity left at
1135 E F P H corresponds approximately to 3600 E FPH . Adding this to the
value of 1135 EFPH, we obtain an expected core life of 4735 EFPH as against
the 7000 EFPH calculated theoretically.
The difference may be gained by modification of the two-region-core
configuration.
Evaluation of the reactivity subtracted by burn-up and samarium poi
soning is given in Fig. 7 (0.441; 1135 EFPH). The values of water tempera
ture reactivity coefficients against ppm of boron are given in Fig. 8 .
(e) Notes. Some measurement results are not very accurate. This can
be seen particularly in Fig. 4, which shows for water temperature coefficient
against water temperature a rather large scattering of numbers. This lack
of accuracy is chiefly caused by:
(i) Inaccuracy in control-rod position measurement and slipping effects
of the rods due to the actuating mechanism (a modification of the con
trol circuits has in the meantime eliminated this slipping);
(ii) Inaccuracy in period measurements because of lack of a special channel
for those measurements; and
(iii) Difficulty in obtaining a constant rate of warm-up or cool-down for de
termination of water temperature coefficients.
3. 2. 2. Turbine and reactor
After the determination of the nuclear characteristics of the reactor,
the dynamic response of the latter was studied by modifying the secondary
load. At the same time the extent of automatic control necessary has been
checked. Information had also to be collected on the behaviour of the second
ary plant, especially the turbine, during.those transients.
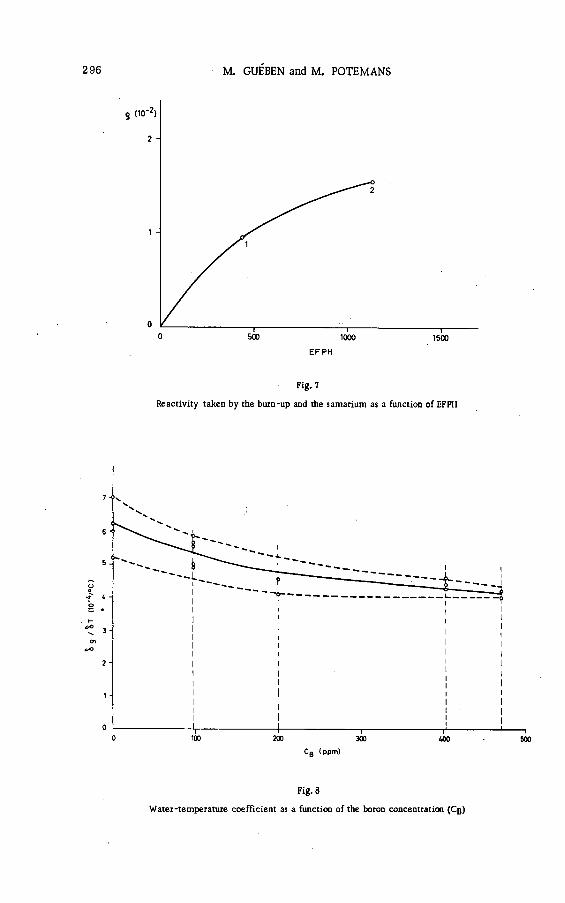
/S
t (
to
'Vo
296 M. GUHBEN and M. POTEMANS
Fig. 7
Reactivity taken by the burn-up and the samarium as a function of EFPH
Fig. 8
Water-temperature coefficient as a function of the boron concentration (Сц)
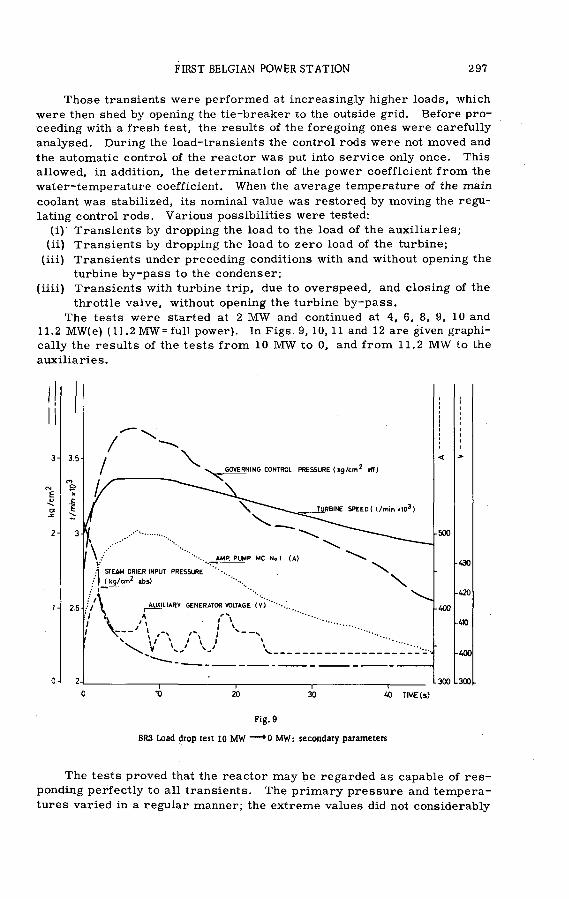
FIRST BELGIAN POWER STATION 297
Those transients were performed at increasingly higher loads, which
were then shed by opening the tie-breaker to the outside grid. Before proceeding with a fresh test, the results of the foregoing ones were carefully
analysed. During the load-transients the control rods were not moved and
the automatic control of the reactor was put into service only once. This
allowed, in addition, the determination of the power coefficient from the
water-temperature coefficient. When the average temperature of the main
coolant was stabilized, its nominal value was restored by moving the regu
lating control rods. Various possibilities were tested:
(i)' Transients by dropping the load to the load of the auxiliaries;
(ii) Transients by dropping the load to zero load of the turbine;
(iii) Transients under preceding conditions with and without opening the
turbine by-pass to the condenser;
(iiii) Transients with turbine trip, due to overspeed, and closing of the
throttle valve, without opening the turbine by-pass.
The tests were started at 2 M W and continued at 4, 6, 8, 9, 10 and11.2 MW(e) (11.2MW=full power). In Figs. 9, 10, 11 and 12 are given graphi
cally the results of the tests from 10 M W to 0, and from 11.2 M W to the
auxiliaries.
Fig. 9
BR3 Load drop test 10 MW — * 0 MW : secondary parameters
The tests proved that the reactor may be regarded as capable of res
ponding perfectly to all transients. The primary pressure and tempera
tures varied in a regular manner; the extreme values did not considerably

298 M. GUÉBEN and M. POTHMANS
Fig. Ю
BR3 Load drop test 11,2 MW — *0,38 MW : secondary parameters
overshoot the equilibrium values. The new equilibrium was attained be
tween 8 to 15 min after opening of the circuit-breaker.
During the most severe transient for the reactor (load-drop from full
power to 0, without opening the turbine by-pass) the hot-leg temperature
increased from 269 to 279°C in 2 min. At that moment the temperature,
although still rising, was almost stabilized. To avoid an automatic "scram"
(set point at 279.5°C) an "all rods in" was initiated and the temperature de
creased immediately. This indicates that automatic control of the reactor,
which starts an insertion of all rods when nuclear power is 15% above steam
power, is not absolutely necessary because the operator has time to
intervene.
Other tests (increasing and decreasing load, normal operation etc. )
showed that the automatic control of the reactor based on the change of the
average temperature is not necessary.
Insofar as the influence of the load-drop tests on the secondary plant
is concerned, an automatic load-drop anticipator is put into service following
an important load drop. This device operates in the following simultaneous
ranges: electrical output of the generator below 20%; and steam-drier pres
sure corresponding to mechanical turbine power above 60%. It temporarily
closes the governing valves of the turbine to avoid a turbine trip due to over
speed. Practice has shown that certain modifications were necessary. The
load-drop anticipator can be put on "automatic" or "manual" by a switch.

FIRST BELGIAN POWER STATION 299
lpr
200
c m
lSG
175
•150
125 25
272
270
260 ~ o
266 4
264
262
260
258
ELEC TR IC AL POWER
10
TIM E (m in )
Fig. 11
BR3 Load drop test Ю MW — >0 M W : primary parameters
Automatic control; turbine trip by overspeed; turbine by-pass open
In the automatic position (in normal operation) the above-mentioned con
ditions are still valid, butin addition the device works immediately for 15 s
when the tie-breaker opens. The manual position allows for intervention
by the operator at any time!.
Different parameters, such as turbine speed, regulation oil pressure,
functioning of the load drop anticipator, pressure in the moisture separator
and current of the primary pump on the auxiliary generator, were measured
by means of a fast recorder. The following conclusions can be drawn:
(i) For the load-drops from different loads to the load of the auxiliaries
there was no tripping of the turbine by overspeed;
(ii) For the load-drops from 10 M W and 11.2 M W to zero the turbine tripped
by overspeed. For the test from 10 M W to 0, tripping occurred at
3350 rpm after 4 s, (overspeed trip device: 3350 rpm) for the test from
11.2 M W to 0 at 3380 rpm after 6 s.
Before the modification of the load drop anticipator we also had a turbine
trip for the drop from 6 M W to 0 (3360 rpm after 6 s). During this increase

300 M. GUÉBEN and M. POTEMANS
TIME (min)
Fig. 12
8R3 Load drop test 11,2 MW — • 0,38 MW: primary parameters
Turbine trip bypverspeed-, turbine by-pass open
of speed the voltage of the auxiliary alternator feeding a primary pump de
creased to 200 V (normal voltage 380 V) in spite of the total short-circuiting
of the excitation rheostat; 26 s after opening of the tie-breaker, the primary
pump tripped through direct protection and caused a scram of the reactor,
since above 20% of full power the loSs of one pump provokes a scram. An
analysis is in progress to study the means of decreasing the possibility of
this tripping by overspeed.
During a first test from 11.2 M W to 0, a tripping of the turbine occurred
by overspeed after 4.5 s and, the turbine by-pass failing to open, submitted
the reactor to a severe transient, mentioned above.
3. 3. Som e facts about the power operation of the plant
3. 3.1. Radiation levels in the plant
In normal operation at 7 MW(e) (60% of nominal thermal power) radi
ation intensities (survey meters) or doses (film-badges, dosimeters) have
been determined.

FIRST BELGIAN POWER STATION 301
(a) Normal working areas
Auxiliary building:
Basement: around the surge tank of the purification loop: 2-100 m r/h
Pipes-penetration into plant container: 1-8 m r/h
First floor: 0.4 m r/h
Second floor: 0.4 m r/h
Third floor: 0.4 m r/h (in the sampling room: about 2.5 mr/h when taking
samples).
Ventilation building:
Suction fans chamber: 0.4 mr/h
Pulsion fans chamber: 0.4 mr/h
Dilution fans chamber: 0.4 mr/h
Plant container:
Operating deck: 0.75 mr/h (except around the reducing stations of the purifi
cation and in the neighbourhood of the access to the reactor-pit between
the shielding blocks)
(b) Non-accessible areas during operation
All the integration detectors below the operating deck (steam generator
compartment under radiation during approximately 110 h at an average load
of 60% of nominal load were at full scale; this means 25 r for the gamma
film-badges, 50 r for the gamma dosimeters and 120 mrem for the thermal
neutrons dosimeters. For the same exposure time (llOh) the following levels
were recorded:
On the shielding blocks of the operating deck in the container: 21 mr
gammas, 20 mrem thermal neutrons^
Between the shielding blocks: 8 r gammas, 120 mrem thermal neutrons;
At the reducing stations of the purification: 90 mr gammas, 3 mrem
thermal neutrons;
At the safety injection penetration: 110 mr gammas j
In the charging and circulating pumps room: 17 mr gammas ¡
In front of the demineralizers: 17 mr gammas.
These results indicate that the habitual work in the normal areas is not af
fected by the radiation intensities present.
The hottest spot is located around the surge tank of the purification, with about 100 mr/h, in contact, at the upper part of the purification surge tank
due to accumulated radioactive gas, and quickly reduced with distance.
Therefore, operating times in this area are strictly controlled.
3. 3. 2. Air activity in the buildings
The presence of radon was detected in the reactor building and in cer
tain auxiliary buildings, probably due to the concrete. The same problem
appeared at the BR2 reactor where the same materials were used at the
same time as at BR3.
When the ventilation of the reactor building is stopped, the activity
shows a twofold increase. The measured concentrations (ventilation in
operation} are: beta gamma: 8 X 10"10 /uc/cm3
alpha : 3 X 10"10 ¿ic/cm3

302 M. GUÉBEN and M. POTEMANS
In some'buildings where air contamination was observed, measures were
tanken to avoid it: better separation between rooms, leaktightness of venti
lation ducts and of water drain pipes, etc. Air contamination also occurred
due to sampling of the primary water. Tight quick disconnects would do
a good job in the sample trains.
3. 3. 3. Water chemistry
Primary loops. The principal chemical prescriptions for the primary water
are the following:
pH : 9.5 to 10.5 (LiOH)
Impurity content: 1- 2 ppm
Chlorides : 100 7/1
Silica : 500 y/1
Oxygen: 140 у/l (by adding N2H4 when cold;H2 when hot).
The demineralized make-up water is furnished by a central épuration
station for BR2 and BR3. It then passes through a vacuum degasifier be
fore being sent to the primary circuits. Various difficulties have arisen
with this degasifier. However, after several interventions, e. g. modifi
cation of the top of the degasifier and of the aspiration of the incondensable
gasses by the ejectors, and correcting and improving the control circuits,
satisfactory operation was obtained.
During the tests with boric acid, we operated at pH= 7 to avoid an exag
gerated increase of the LiOH concentration.
The use of hydrogen to remove oxygen by radiolytic combination ne
cessitates precautions to avoid accidents, among others the regular ana
lysis of the hydrogen concentration in the different accumulation tanks of
the loops. We also noticed a N H 3 formation by radiolytic combination of
nitrogen and hydrogen.
We obtained for the activity of the primary water, since the start-up
of the station at power, a value of 0.2 /uc/cm3 at full power. The spectro-
metric analysis of the water sampled has shown that besides the presence
of activated corrosion products there were also fission products. These
probably result from a surface contamination of the fuel elements.
W e noticed that the mixed-bed demineralizer retained practically all.
non-gaseous products and that the gaseous ones were taken out of the water
by a degasifying action in the purification system surge tank, from whence
they are sent to the stack after dilution. This evacuation, done only under
adequate meteorological conditions, is controlled by detection. The oper
ation is closely followed and samples are analysed to determine the exact
quantity of I131 released to the atmosphere.
The following example will give an idea of this type of evacuation. On
26 December, 1962 we evacuated 220 me the greatest amount of which was
Rb88 (half-life: 17 min). The 1131 concentration was 1.5X 10⁻⁷/uc/cm3, which
is below the concentration for the permissible 13 weeks dose to the
population.
Secondary loops. The principal chemical components of the secondary water
are given in Table V. The demineralized water is provided by the same
centrai station as the primary water. Some difficulties have arisen because

FIRST BELGIAN POWER STATION 303
TABLE V
PRINCIPAL CHEM ICAL COM PONENTS
OF THE SECONDARY W A TER
Low- and medium-
pressure loops
High- pressure
loops
Steam
pH 9.2 10 - 11 9.2
02 Or/1 0 y/1 .0 y/1 .
Cl 2 50 y/1 500 y/1 0 y/1
SÍO2 50 y/1 15 mg/1 -■
Fex and Cu>j 10 y/1 500 y/1 10 y/1
Free OH - 0°F
1•w0CL - 100-300 mg/1
H 2 - - 10 y/1
Total solubles - 300-500 mg/1 - ' ■ -
the different circuits were insufficiently clean when starting up the plant.
Important quantities of iron oxide were collected on the filters of the con
densate pumps. The iron and silicon concentrations in the steam generator
water were decreased to permissible values by energic blow-down. Some
priming of the steam generator was noticed once or twice. Lowering of
the steam generator level and decreasing the phosphate concentration in
the feedwater restored normal conditions.
3. 3. 4. Primary water leaks
The various primary water leaks result primarily from (a) "leak-offs"
of valves; (b) the safety valves; and (c) the circulating and charging pumps.
Leak-tests were performed with and without the purification loop in oper
ation. The addition of water and its loss were measured by following the
level changes in the pressurizer and in the purification surge tank. A first
series of tests gave (a) leaks with purification loop in operation: 110 1/h;
(b) leaks with purification loop isolated: 65 1/h. A part of these leaks were
collected in the discharge tank. This tank collects the leak-offs of thé valves
and the leaks of the primary plant safety valves and of the steam generator.
The most important leaks originated at the plunger packings of the pumps
in the purification loop. After replacing the packings of the pumps and after
careful inspection of valves and safety valves the leak-rate dropped to301/h.
These leaks, when important, represent serious disadvantages by re
quiring the frequent addition of make-up water and frequent control of the
primary water quality and the addition of chemicals.

304 M. GUÉBEN and M. POTEMANS
3.3. 5. Performance of different components and major difficulties
Before criticality hot-run tests were run, many other tests were performed on components and loops. An important source of trouble was
leaking valves and safety valves. After a few months of operation the plant
had to be shut-down to cold condition to repair leaking safety valves on the
pressurizer and in the purification loop.
A high level of noise in the nuclear instrumentation made it necessary
to move the pulse integrator of the latter from the control room to a location
close to the container of the reactor.
The two canned-motor main coolant pumps have operated over 4000 h
with no special difficulties. The magnetic jack type control-rod mechanisms
have been working satisfactorily. For same time we noticed that the control
rods were slipping. We built in a device that energized the stationary coil
before de-energizing the movable gripper and since then we have not ob
served any further slipping.
The reducing stations in the purification loop have been and still are
an almost permanent source of trouble. Unwanted changes in outlet pres
sure open the safety valves and in that way create primary water losses.
As mentioned above, many interventions were necessary on leaking valves.
The circulating and charging pumps, which re-inject the purification
water into the main coolant loop, also present many imperfections. The
piston packings have to be replaced regularly (±700 h) to reduce primary
water leaks. The pistons were seriously damaged after 610 h (charging
pump) and 1200 h (circulating pump) of operation. The breakdown of the
speedchanger belts caused a shut-down. The charging pumps speedchanger
shaft ruptured after 17 20 h of operation.
There was some trouble with damaged bearings due to dirt in the turbine
oil circuits.
3. 3. 6,. Scram analysis
Since initial criticality and up to 15 March. 1963 a total of 20 scrams
has been recorded. Seven of these were initiated voluntarily for test pur
poses (e. g. checking of the interlocks and the automatic actions following
a scram). Four of them were due to failure of the instrumentation (e. g.
periodmeter, flowmeter in the main coolant loop, protection relay of the
primary pump No. 1, etc. ), three to an operator error, one by injecting too
large a quantity of relatively cold water into the steam generator, one by
tripping a primary pump during a load drop test, one by short period during
a test, one by testing the nuclear instrumentation, one at the end of an "all
rods in" by low-pressure signal and one by a loss of direct current to the
control rods. It is worth noting that the frequency of scrams has now been
seriously reduced.
CONCLUSIONS
Up to now the BR3 plant has been working in a satisfactory manner. The
difficulties we have had were primarily with the "classical" equipment.
FIRST BELGIAN POWER STATION 305
Furthermore BR3 is an outstanding installation for training people for larger
nuclear stations.
A broad test programme has also been elaborated: operation without
demineralizers, lowering of the pH, testing new types of fuel elements, etc.
Also incidents will be simulated: loss of compressed air, loss of direct or
alternative current, etc.
Apart from this, a lot of useful data will be obtained from the BR3 plant,
in that way emphasizing the efforts which have been accomplished b> the CEN
and Belgian Industry.
D I S C U S S I O N
A. W EC K ESSER : Can you tell me the response time of the by-pass
valves? And what is the high-power "scram " setting?
M . PO TE M A N S : The turbine by-pass valve opens on a "High steam
pressure" signal. When, for example, the turbine is tripped from full power
(11.2 MW) to zero, the pressure increases from the normal operating value
(36 kg/cm¿) to the value at which the turbine by-pass valve opens (50 kg/cm2)
in about one minute. The by-pass valve itself (pneumatically operated) takes
about one second to open. The high-power "scram" setting is 120%.
Z. P E L L E D : It seems that you have been using boron concentration
as a sort of independent variable. How accurately can you measure the
boron concentration, and how do you remove specified amounts of boron
from the circuit when necessary?
M. POTEM ANS: The boron was removed by a "feed-and-bleed" oper
ation. The accuracy of the measurement of boron concentration is of the
order of 1 to 2 ppm.
20

20*

OPERATING EX PER IEN C E WITH INDIAN POINT N UCLEAR E L E C T R IC GENERATING STATION
W .C . BEATTIE AND R. H. FREYBERG CONSOLIDATED EDISON COMPANY OF NEW YORK, INC.
NEW YORK, N .Y .
Abstract — Résumé — Аннотация — Resumen
OPERATING EXPERIENCE WITH INDIAN POINT NUCLEAR ELECTRIC GENERATING STATION. Indian
Point Station Unit No. 1 consists of a 585 MW(t) pressurized-water reactor, four primary coolant loops with
horizontal heat exchanger boilers, two 1.1 million lb/h oil-fired superheaters and a 275 000 kW turbine generator.
The reactor fuel is a mixture of fully enriched U235 oxide and Th232 oxide.
The station is located on the Hudson River about 24 miles north of New York City. Because of this
proximity to New York, exceptional safeguards against the occurrence of a reactivity excursion as well as
against the radiation effects of such an excursion were incorporated into the station design.
Construction was completed in May 1962. Fuel loading was accomplished in June and the reactor was
taken critical for the first time on 2 August 1962. Low power testing up to 5 MW(t) at ambient and at elevated
temperatures was done during August, and the turbine generator was first phased into the Consolidated Edison
system on 16 September 1962.
Testing at reactor power levels up to 50% extended into November and was marked by frequent automatic
shut-downs, alarge number of which were initiated inthe conventional plant. Control-rod-drive control system
difficulties were the heaviest contributor from the nuclear plant to automatic rod insertion operations and to
delays in recovery from automatic trips.
On 14 November 1962 the station was shut down for scheduled piping changes in the conventional plant
and for modifications and additions to the control-rod-drive system. The latter included the installation of
a dry nitrogen purging system for the control-rod-drive housings designed to minimize the effects of seal water
leakage into the rod-drive housings. This appears to have been the major cause of the false indications en
countered with the reactor control system.
The unit was returned to service on 1 January 1963. Testing at reactor power levels up to 100% under
steady load conditions was completed on 27 January 1963. Test results have followed closely the predicted
performance for the reactor. Further testing of response to load transients is to continue into the Spring of 1963.
The Indian Point Station has proved to the satisfaction of our Company the feasibility of a combination
nuclear and oil-fired plant to produce competitive power. The United States Atomic Energy Commission has
been requested to issue a construction permit for the Company to build another nuclear plant, similar in design,
but of 1000 M W capacity, to be located at Ravenswood which is within the corporate limits of the City of
New York. Our Company is prepared to finance the venture with its own funds without subsidy of any kind
as was the case with our Indian Point Station.
EXPERIENCE D'EXPLOITATION DE LA CENTRALE NUCLÉAIRE D'INDIAN POINT. La centrale Ne 1
d'Indian Point se compose d'un réacteur à eau sous pression de 585 MWt, quatre circuits de refroidissement
primaires avec des échangeurs de chaleur horizontaux, deux surchauffeurs au mazout de 500 000 kg/h et un
turbogénérateur de 275000 kW. Le combustible du réacteur est un mélange d'oxyde d'uranium complètement
enrichi en 235U et d'oxyde de 232Th.
L'installation se trouve au bord de l'Hudson à une quarantaine de kilomètres au nord de New York. En
raison de la proximité de cette ville, on a prévu des dispositifs de sécurité intrinsèques exceptionnels contre le
risque d'un emballement du réacteur et contre les rayonnements qui pourraient en résulter.
La construction a été terminée en mai 1962. Le combustible a été chargé en juin et le réacteur est
entré en divergence pour la première fois le 2 août 1962. On a ensuite procédé, dans le courant du mois d'août,
à des essais à faible puissance (jusqu'à 5 MWt), à la température ambiante et à .des températures élevées. Le
turbogénérateur aétéintégré pour la première fois au réseau de la «Consolidated Edison»,le 16 septembre 1962.
Les essais aux puissances allant jusqu'à 50% de la puissance théorique se sont prolongés jusqu'en novembre
et ont été marqués par de fréquents arrêts automatiques dont un grand nombre avaient leur origine dans le
307

308 W .C . BEATTIE and R. H. FREYBERG
secteur «classique» de la centrale. Ce sont surtout des défectuosités du système de commande des barres de
contrôle qui, dans le secteur nucléaire, ont contribué à la chute automatique des barres et aux retards dans
la remise en marche après arrêt.
Le 14 novembre 1962, on a arrêté la centrale pour procéder aux changements prévus dans les tuyauteries
de la partie classique et pour apporter des modifications ou additions aux organes de commande des barres de
réglage (installation d’un purgeur à azote sec pour les logements des organes de commande, afin de réduire
les effets des fuites d’eau à travers les joints), n semble que c’était là la cause principale du mauvais fonction
nement du système.
La centrale a été remise en service le 1er janvier 1963. Les essais, jusqu’à 100% de la puissance théorique
à charge constante, étaient terminés le 27 janvier 1963. Les résultats concordent parfaitement avec les pré
visions. De nouveaux essais pour étudier la manière dont le réacteur répond à des variations subites de la
demande se poursuivront au printemps 1963.
ОПЫТ ЭКСПЛУАТАЦИИ ИНДИАН-ПОЙНТСКОЙ ЯДЕРНОЙ ЭЛЕКТРОСТАНЦИИ. Блок S 1 Индиан-пойнтской ядер-
ной электростанции состоит из реактора с водой под давлением мощностью 585 мгвт, четырех пер
вичных контуров охлаждения с горизонтальными теплообменниками, двух работающих ка нефти паро
перегревателей производительностью 1 100 тыс. фунтов/час и турбогенератора мощностью 275 тыс. квт.
Топливом в реакторе служит смесь полностью обогащенной окиси и235 и окиси Th2 3 2 .
Станция расположена на реке Гудзон, примерно в 24 милях севернее Нью-Йорка. В связи с такой
близостью от Нью-Йорка в проекте станции были предусмотрены дополнительные предохранительные
устройства для предотвращения отклонения реактивности и радиационных эффектов такого отклонения.
Строительство закончено в мае 1962 года. Загрузка топлива осуществлена в июне, а 2 августа
1962 года реактор впервые достиг критичности. В течение августа приводились испытания ка малой
мощности до 5 мгвт при температуре окрухаицей среды и повышенной температуре. 16 сентября 1962
года турбогенератор был впервые фазирован с системой Консолидейтид Эдисон.
Испытание реактора на мощностях до 50% проводилось до ноября и прерывалось частыми автома
тическими- остановками, большая часть которых была вызвана неполадками в неядерной части станции.
Неполадки в системе управления приводов регулирующих стержней были самыми серьезными помехами
со стороны ядерной части станции для работы с автоматическим введением регулирующих стержней
и причиной задержек с пуском реактора после автоматических остановок.
14 ноября 1962 года станция была остановлена для плановой замены трубопроводов в неядерной
части станции и модификаций и дополнения системы проводов регулирующих стержней. Последнее вклю
чало установку системы очистки сухого азота для кожухов приводов регулирующих стержней, пред
назначенных для сведения к минимуму эффектов воды, просачивающейся через уплотнения в кожухи
регулирующих стержней. Оказалось, чтё это является основной причиной неправильных показаний
системы управления реактором.
Блок был вновь пущен 1 января 1963 года. Испытание реактора на мощностях до 100% в условиях
стабильной нагрузки было закончено 27 января 1963 года. Результаты испытаний очень хорошо со
гласуются с расчетными характеристиками работы реактора. Следующие испытания чувствительности
реактора к переходным колебаниям нагрузки должны быть продолжены весной 1963 года.
EXPERIENCIA ADQUIRIDA CON LA EXPLOTACIÓN DE LA CENTRAL NUCLEOELÉCTRICA DE INDIAN
POINT. El grupo N* 1 de la central de Indian Point consta de un reactor de 585 MW(t), de agua a presión
cuatro circuitos refrigerantes primarios con intercambiadores de calor horizontales, dos sobrecalentadores
a petróleo de 500 000 kg/h y un turbogenerador de 275 000 kW. El combustible del reactor consiste en una
mezcla de óxido de ^ U totalmente enriquecido y de óxido de M2T.
La central sé encuentra a orillas del rio Hudson, a uno 40 km al norte de Nueva York. Debido a la
proximidad de esa ciudad se adoptaron dispositivos especiales de seguridad intrínseca para evitar saltos bruscos
de reactividad y- prevenir sus efectos radiológicos.
La construcción quedó terminada en mayo de 1962. Se cargó el combustible en junio y el reactor
alcanzó la criticidad inicial el 2 de agosto de 1962. En el curso del mismo mes, se efectuaron los ensayos de
baja potencia, hasta 5 MW(t), a la temperatura ambiente y a temperaturas elevadas, y el 16 de septiembre
de ese año el turbogenerador se conectó por primera vez a la red de la Consolidated Edison.
Hasta entrado el mes de noviembre, prosiguieron los ensayos a potencias de hasta 50% del valor teórico,
con frecuentes detenciones automáticas, originadas en gran parte por perturbaciones en la sección «clásica»
de la central. En cuanto a la sección nuclear, fueron sobre todo las fallas del mecanismo de mando de las

INDIAN POINT STATION 30,9
barras de control que contribuyeron a la caída automática de las barras y a las demoras en la reiniciación de
la marcha después del paro.
El 14 de noviembre de 1962 se detuvo la marcha de la central para proceder a los cambios previstos en
las tuberías de la sección «clásica» y para modificar y perfeccionar el mecanismo de mando de las barras
de control. Esta última operación comprendía la instalación de un dispositivo de purga a base de nitrógeno
seco para las cajas de los mecanismos de las barras de control, a fin de reducir al mínimo los efectos de los
escapes de agua, a través de las juntas. Al parecer, dichas pérdidas eran la causa principal de las indicaciones
erróneas registradas en el sistema de control del reactor.
La central se volvió a poner en servicio el lç de enero de 1963. El 27 de enero de 1963, se dio fin a los
ensayos del reactor, con potencias hasta el ЮО'Уо, en condiciones de carga constante. Los resultados de los
ensayos concordaron satisfactoriamente con las previsiones. En la primavera de 1963 se continuarán las pruebas,
para estudiar la manera en que el reactor responde a fluctuaciones rápidas de la demanda.
1. STATION DESCRIPTION
Indian Point is a 275 000 kW electric generating station located on a
250-acre site on the East bank of the Hudson River approximately 24 miles
upstream from the northern limits of the City of New York. It employs
nuclear fuel for production of saturated steam and takes advantage of the
increased capacity and added economy derived from superheated steam by
using oil-fired superheaters. The station output is delivered to the 138 kV
transmission lines of the Consolidated Edison Çompany system which serves
a 600 mile2 franchise area having a load density rated among the highest in
the world. The electric operating territory and principal facilities of this
system are shown in Fig. 1.
2. EN VIR ONM ENTAL CONSIDERATIONS
While the station is in a relatively sparsely settled section of the area
served by the Company, there are approximately 62 000 inhabitants within
a five-mile radius of the site. Accordingly, the station is designed to mini
mize the effects of any credible radiation incident.
The containment vessel is a steel sphere, 160ftin diam., designed
as a 25 lb/in2 gauge pressure vessel in accordance with Section VIII of the
Boiler and Pressure Vessel Code of The American Society of Mechanical
Engineers. It is set approximately to its equator in a solid rock foundation.
A cylindrical wall of ordinary concrete 5^-ft thick with a dome 2 3/4-ft
thick surrounds the upper half of the containment vessel and serves as an
outer biological shield. It is so designed that even in the event of a maxi
mum credible incident, radiation exposure at the site boundary would not
exceed 0.057 mr/h during the first week following the incident. Thus, evacu
ation of the local area would be unnecessary, and station equipment on
the site could continue normal operations with plant personnel in attendance.
The top of the superheater stack is 470ftabove the Hudson River. The
containment ventilation and waste-gas discharge duct enters the side of the
stack about 70ft below its top and extends upward on the stack centre-line
approximately 10 ft above the top of the stack. The combustion gas resulting
from the oil-fired superheaters discharges to an annulus around the venti
lation duct thereby aiding in the acceleration and dispersion of the waste
gases. No gaseous waste is released until it has been in storage in holdup
tanks for about three months to assure the decay of iodine isotopes.
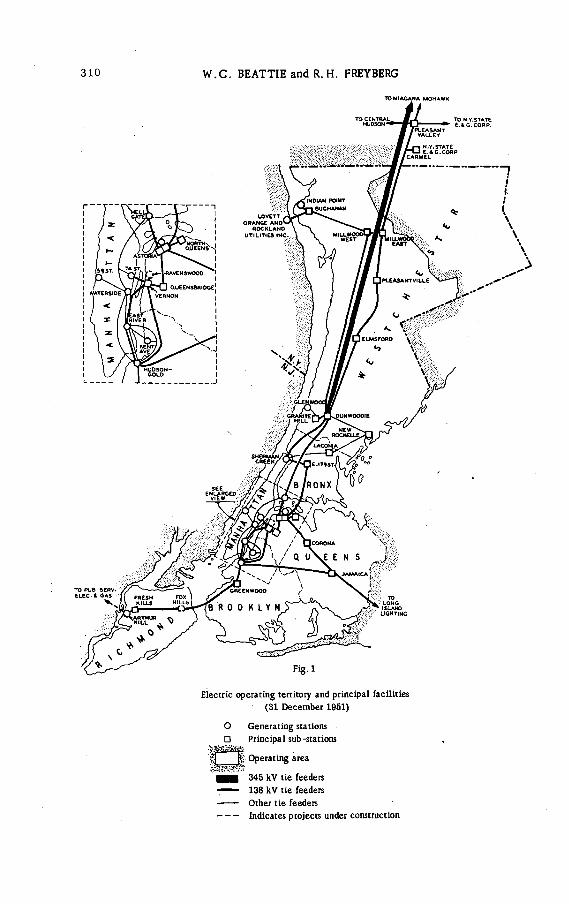
310 W .C . BEATTIE and R. H. FREYBERG
TO N IA G A R A MOHAW K
TO PUB.4ERV. tLE C .iÛ A S
X . LONGISLAND
LIGHTING
Electric operating territory and principal facilities
(31 December 1951)
О Generating stations
□ Principal sub-stations
Щ Operating area
■ ■ i-345 kV tie feeders
.--- 138 kV tie feeders
— -Other tie feeders
--- Indicates projects under construction

INDIAN POINT STATION 311
Liquid wastes containing radioactivity too high in concentration for
direct discharge to the river are evaporated in a system designed for the
treatment of chemical wastes. The condensed distillate is checked for its
level of radioactivity and pumped to the plant discharge canal where it is
diluted by the main condenser circulating water and discharge water from
other station uses. The evaporator sludges are removed to storage tanks
from which they are periodically pumped to a concrete mixing plant. This
concrete mixture is placed in drums for off-site burial. Other solid waste
is either baled or drummed for off-site disposal.
All equipment in the chemical treatment systems is conservatively de
signed to assure adequate capability under peak load conditions to meet the
requirements of the United States Code of Federal Regulations Title 10,
Part 20 for the release of waste to the contiguous environment.
3. N U C L E A R P L A N T
The nuclear facility includes a 585 M W pressurized light-water reactor
with four primary-coolant loops having horizontal U- tube heat exchangers
as steam generators. The major components of the primary system were
designed and fabricated by The Babcock and Wilcox Company. The reactor
vessel is of SA 212 Grade В carbon steel, clad on its internal surface with
304 stainless steel. It is designed for 1800 lb/in2 gauge, 650°F in accordance
with Section I of the Boiler and Pressure Vessel Code of The American
Society of Mechanical Engineers. The reactor vessel is about 38-ft high
with an inside diameter of 9 ft 9 in.
The core is an approximate right cylinder 7-l/2ftin diam., consisting
of 120 fuel elements, with associated shim rods and flux depressors. Each
fuel element is made up of 195 fuel rods in a Zircaloy container. Each fuel
rod is a stainless-steel tube 0. 304 in in diam., containing sintered pellets
of a mixture of fully enriched uranium oxide and thorium oxide to give an
active fuel length of approximately 98. 5 in. The elements are furnished with
three different fuel loadings to provide for a three-zone core.
21 movable control rods of 95.4% hafnium are provided. Each control
rod is positioned by a drive méchanism, through a drive line assembly,
consisting of the control rod, a Zircaloy-2 follower rod, a snubber shaft
and housing,, a seal shaft and buffer seal housing and the drive mechanism.
Each drive line assembly is mounted to a flanged nozzle on the bottom of the
reactor vessel.
An electric drive motor in the drive mechanism turns two parallel lead
screws on which a carriage runs up or down depending upon the direction of
motor rotation. A coupling spacer attached to the seal shaft is held up
against the carriage by hydraulic oil pressure applied to a piston at the lower
end of the shaft. Thus, the assembly moves the control rod up out of the
core, or down into the core, in response to signals to the drive motor from
the control system. The control rod moves rapidly downward into the core
under the combined forces of gravity and reactor pressure when the hydrau-'
lie pressure is released by a solenoid operated scram valve in response 5
to a signal from the reactor safety system.

312 W .C . BEATTIE and R. H. FREYBERG
Each control-rod drive mechanism is enclosed in a housing designed
as an 1800 lb/in2 gauge pressure vessel. This arrangement is to ensure re
tention of primary coolant in the event of a failure of the seal water pressure
which might be followed by excessive leakage of primary coolant water along
the shaft.
Mechanical levers, cams, and shafts within this housing actuate small
switches in electric circuits of the drive control system. The engagement
of the coupling spacer with the carriage, and the upper and lower limits of
rod travel are thus monitored to provide signals for the rod control system.
Four or five rods symmetrically distributed among the elements con
stitute a rod group. There are five rod groups which are withdrawn se
quentially for power operation. Symmetrical power distribution is expected
at all flux levels throughout core life.
Nuclear instrumentation includes 25 channels whose detecting elements
are external to the reactor vessel. There are no in-core monitors. The
detectors are mounted in tubes immersed near the inner cylindrical surface
of the neutron shield tank.
Two low level channels use B F 3 proportional counters. Two channels
have U30 8 fission counters and provide response overlap of about two
decades of power with the proportional counters. Three channels have com
pensated ion chambers for power level indication up to 100% and overlap the
fission counters by about two decades. These seven detectors are located
at the midplane elevation of the core.
The remaining 18 channels have uncompensated ion chambers as de
tectors. These chambers are arranged in three planes of six detectors each,
one at the top, one at the middle and one at the bottom of the core. In each
plane, the detectors are spaced 60° apart. They provide neutron Яих infor
mation up to 150% power.
There are two 16 000 gal (US)/min canned motor pumps in each primary
coolant loop to circulate the primary coolant through the stainless-steel
tubes of the heat exchanger designed to transfer 500 million BTU/h. Each
boiler is rated to deliver 550 000 lb/h saturated steam at 405 lb/inz gauge.
All four loops are wholly within the containment vessel.
There are approximately 150 piping penetrations of the containment
vessel. Each pipe penetration has two valves installed as containment iso
lation valves located a short distance outside the containment vessel. Every
welded pipe joint within the containment vessel and to the isolation valves
outside the containment vessel was X-rayed to ensure acceptable welds.
A plant controller is provided to maintain 405 lb/in2 gauge steam
pressure at the boiler outlet by automatic operation of the control-rod drive
controls. Parameters fed into this controller include the steam pressure
at each boiler outlet, the main steam flow and the average of the neutron flux
seen by three of the uncompensated ion chambers at the midplane.
Holding steam pressure constant for all loading conditions results in
a rising characteristic in both reactor inlet and reactor outlet temperatures
as the power level increases. The 450°F zero-power-level temperature is
designed to increase to 486. 5°F inlet temperature and 519°F outlet tempera
ture when the reactor reaches 100% power.
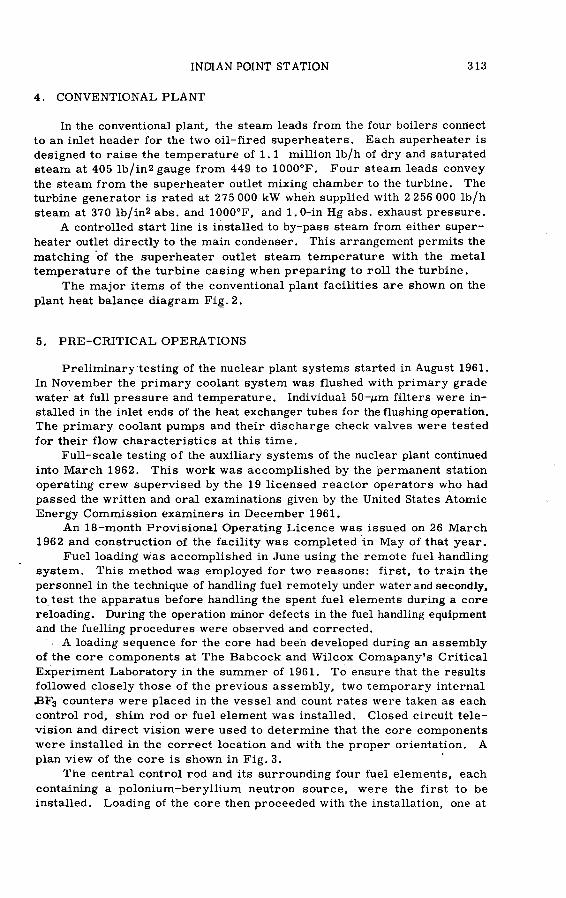
INDIAN POINT STATION 313
4. CONVENTIONAL PLANT
In the conventional plant, the steam leads from the four boilers connect
to an inlet header for the two oil-fired superheaters. Each superheater is
designed to raise the temperature of 1.1 million lb/h of dry and saturated
steam at 405 lb/in2 gauge from 449 to 1000°F. Four steam leads convey
the steam from the superheater outlet mixing chamber to the turbine. The
turbine generator is rated at 275 000 kW when supplied with 2 256 000 lb/h
steam at 370 lb/in2 abs. and 1000°F, and 1.0-in Hg abs. exhaust pressure.
A controlled start line is installed to by-pass steam from either super
heater outlet directly to the main condenser. This arrangement permits the
matching of the superheater outlet steam temperature with the metal
temperature of the turbine casing when preparing to roll the turbine.
The major items of the conventional plant facilities are shown on the
plant heat balance diagram Fig. 2.
5. PRE-CRITICAL OPERATIONS
Preliminary testing of the nuclear plant systems started in August 1961.
In November the primary coolant system was flushed with primary grade
water at full pressure and temperature. Individual 50-дт filters were in
stalled in the inlet ends of the heat exchanger tubes for the flushing operation.
The primary coolant pumps and their discharge check valves were tested
for their flow characteristics at this time.
Full-scale testing of the auxiliary systems of the nuclear plant continued
into March 1962. This work was accomplished by the permanent station
operating crew supervised by the 19 licensed reactor operators who had
passed the written and oral examinations given by the United States Atomic
Energy Commission examiners in December 1961.
An 18-month Provisional Operating Licence was issued on 26 March
1962 and construction of the facility was completed in May of that year.
Fuel loading w;as accomplished in June using the remote fuel handling
system. This method was employed for two reasons: first, to train the
personnel in the technique of handling fuel remotely under water and secondly,
to test the apparatus before handling the spent fuel elements during a core
reloading. During the operation minor defects in the fuel handling equipment
and the fuelling procedures were observed and corrected.
A loading sequence for the core had been developed during an assembly
of the core components at The Babcock and Wilcox Comapany's Critical
Experiment Laboratory in the summer of 1961. To ensure that the results
followed closely those of the previous assembly, two temporary internal
B F 3 counters were placed in the vessel and count rates were taken as each
control rod, shim rod or fuel element was installed. Closed circuit tele
vision and direct vision were used to determine that the core components
were installed in the correct location and with the proper orientation. A
plan view of the core is shown in Fig. 3.
The central control rod and its surrounding four fuel elements, each
containing a polonium-beryllium neutron source, were the first to be
installed. Loading of the core then proceeded with the installation, one at
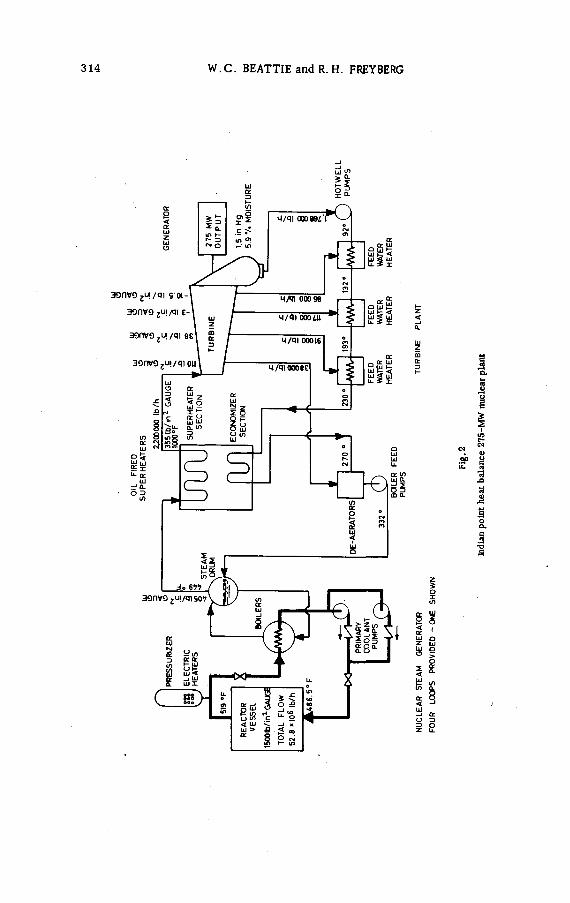
314 W .C . BEATTIE and R.H. FREYBERG
UJaэ
UJ 1Л
•3£>
FOUR
LOOPS
PR
OV
IDE
D*
ONE
SH
OW
N
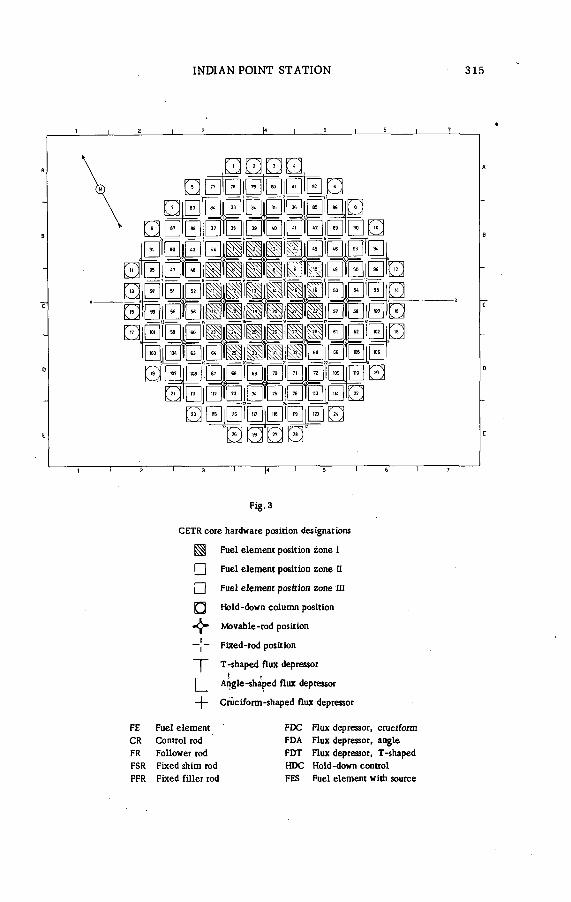
INDIAN POINT STATION 315
0 Н Е И В Н Ё Н И R T R iR Í R iR IR j R IR h
□ H lR lË E lH B lR T R iH h □ E ' í g H i M í e i a R í g p a
□iSjflBiâSjSSifleiflBiHiHS RÍ R lR ÎÜ l p l i l l i l i^ l i l iR lR lR H□ HlHTBI H lR IR lR il
Й Ы ] И В | 0 Е | Н Щ 0 | Н H B l H E l B B l H H
Fig.3
CETR core hardware position designations
^ Fuel element position zone I
I I Fuel element position zone II
I I Fuel element position zone III
П Hold-down column position
Movable-rod position
—[- Fixed-rod position
j T-shaped flux depressor
j___ Angle-shàped flux depressor
-f- Crüciform-shaped flux depressor
FE Fuel element
CR Control rod
FR Follower rod
FSR Fixed shim rod
FFR Fixed filler rod
FDC Flux depressor, cruciform
FDA Flux depressor, angle
FDT Flux depressor, T-shaped
HDC Hold-down control
FES Fuel element with source

316 W .C . BEATTIE and R. H. FREYBERG
a time, of a control rod or fixed shim with its adjacent four elements to
complete a series of concentric rings. No attempt was made at any inter
mediate step to make the reactor critical.
The water treatment plant and storage system had been unable to provide
water of sufficient clarity to give the required visibility in the fuel handling
pools. The temporary installation of a portable wood cellulose filter which
removed particles down to 2-/um size solved this problem. Despite these
excellent final conditions, however, complete indexing of the core internals
was recorded for future reference.
The design of the reactor head joint employs two gaskets plus welding
for tightness if required. Tests at the time of flushing indicated that these
gaskets were adequate for leak-tight closure. Therefore, when the head
joint was bolted after fuelling, the seal ring inside the bolt circle was welded
to the head only and not to the body of the vessel. No leakage has been
detected through all of the temperature cycles which have followed.
Provision had also been made in the design for seal-welding other bolted
joints on equipment in the primary system. One pressurizer vent valve
bonnet has been seal-welded, and the hinge pin covers on all eight discharge
check valves for the primary coolant pumps have been seal welded after two
leaked at the hinge pin packing during heating and cooling cycles. In each
case the leakage had stopped without any required maintenance operations,
but since coolant leakage could be expected to contaminate a large area if
permitted to continue for a long period, it was decided that all covers should
be seal welded.
6. LABORATORY TESTS
The assembly of the core components at The Babcock and Wilcox
Company's Critical Experiment Laboratory in 1961 had been followed by a series
of experiments undertaken to minimize the extent of the testing necessary
at the Indian Point Station. The major determinations were:
(1) The mechanical compatibility of the core components. This was
confirmed by the ease of assembly at Indian Point.
(2) The reactivity in the core and the shut-down margins of various
control-rod configurations. Methods used for this included partial water
height, variation of boric acid concentration, and a pulsed neutron technique.
The average value of the various methods indicated a core reactivity of 0.113
at 68°F.
(3) The boric acid concentration required to ensure a shut-down margin
of 0.056 when in the cold, clean condition with all control rods fully inserted.
This concentration was 930 ppm as boric acid.
(4) The number and final design of the fixed shim rods needed to hold
down excess reactivity during the first half of core life. Twelve shim rods
have been instaHed. All are expected to be removed in Autumn 1963.
(5) The flux distributions for various rod patterns. Since there is no
in-core monitoring equipment, symmetrical power distribution is important.
Measurements and extrapolations of data to power conditions indicated con
formance with calculations to a high degree. About one-sixth of the core
is scheduled for examination by a gamma-scanning technique during the
Autumn 1963 outage to study the power distribution further.
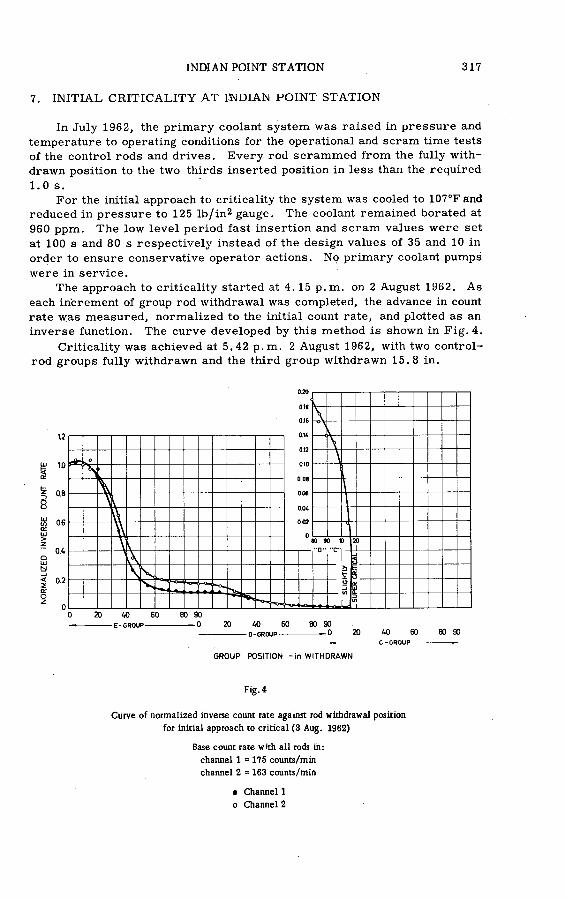
INDIAN POINT STATION 317
In July 1962, the primary coolant system was raised in pressure and
temperature to operating conditions for the operational and scram time tests
of the control rods and drives. Every rod scrammed from the fully with
drawn position to the two-thirds inserted position in less than the required
1.0 s.
For the initial approach to criticality the system was cooled to 107°Fand
reduced in pressure to 125 lb/in2 gauge. The coolant remained borated at
960 ppm. The low level period fast insertion and scram values were set
at 100 s and 80 s respectively instead of the design values of 35 and 10 in
order to ensure conservative operator actions. No primary coolant pumps
were in service.
The approach to criticality started at 4.15 p .m . on 2 August 1962. As
each increment of group rod withdrawal was completed, the advance in count
rate was measured, normalized to the initial count rate, and plotted as an
inverse function. The curve developed by this method is shown in Fig. 4.
Criticality was achieved at 5.42 p .m . 2 August 1962, with two control-
rod groups fully withdrawn and the third group withdrawn 15.8 in.
7. INITIAL CRITICALITY A T INDIAN POINT STATION
e - g r o u p ------ -0 20 40 60 80 90— ------------------------- D - G R 0 U P ------ ~-0 20 40 60 80 90
------------------------------С - GROUP
G R O U P P O SITIO N - i n W ITH D R A W N
Fig-4
Curve of normalized inverse count rate against rod withdrawal position
for initial approach to critical (3 Aug. 1962)
Base count rate with all rods in:
channel 1 = 175 counts/m in
channel 2 = 163 counts/min
• Channel 1
о Channel 2

318 W .C . BEATTIE and R. H. FREYBERG
Further testing with the same coolant conditions demonstrated the nega
tive reactivity effect of a 2°F rise in coolant temperature as the first sensible
heat was developed.
8. LOW-POWER TESTING
For the remainder of August 1962, testing at power levels up to 5 MW(t)
was continued. The moderator temperature coefficient was measured with
and without boric acid at various temperatures and pressures up to 450°F
and 1485 lb/in2 gauge. This coefficient was found to be negative under
all measured conditions, becoming increasingly negative for the higher
temperatures. Reduction of boric acid concentration caused it to become
still more negative. The measured coefficient at 450°F with no boric
acid was - 1. 73X 10*4 Дк/к • °F whereas the calculated value at 500°F
was -1. 73X10-4 Ak/k- °F.
The pressure coefficient.was measured by doubling time tests at 1450
and 1650 lb/in2 gauge. The measured value was + 1. 31 X 10-6 (Ak/k)/(lb/in2)
as opposed +2. 0X10-6 (Дк/к)(1Ь/т2) as calculated.
The boric acid coefficient of reactivity measured at 450°F was - 2.16 ± 0.1
cent/10 ppm, which was in close agreement with the value of -2. 25 ±0. 1
cent/10 ppm established at the Laboratory at 68°F in 1961.
Since a design criterion required that the clean core be sub-critical at
425°F with the two most worthy rods jammed in the fully withdrawn position,
measurements were made with no boric acid in the primary coolant system
at temperatures down to 375°F and extrapolations indicated that the core
would just be critical at 275°F.
9. P O W ER - LE V EL TESTING
The reactor power level was carried at 4% for about two weeks in August
and September 1962 to produce sufficient steam from the nuclear boilers
to flush the main steam and condensate systems.
De-aerated,water was then available to the nuclear boilers through the
main boiler feed piping. While the steam and condensate lines had been
cleaned with citric-formic acid and phosphoric acid with subsequent passi
vation, there were sporadic indications of phosphate and chlorides during the
flushing. As the condensate system became cleaner, the reactor power
level was increased to about 15% for the initial trials of the superheaters
and the controlled start line.
The turbine generator was synchronized to the Consolidated Edison
System for the first time at 7. 37 p. m. on 16 September 1962. The machine
was loaded to about 40 M W .
Power level tests under steady load and equilibrium xenon conditions
were made at 25 and 50% by 5 October. Deficiencies in conventional plant
piping prevented operation at reactor power levels over 50% until after a
six-week outage starting 14.November. Upon return to service 1 January
1963 the tests at 75, 90 and 100% rated reactor power were run. The maxi
mum generator load developed at 100% power was 277 MW with 2 223 000 lb/h
of steam at 365 lb/in2 gauge, 998°F, and 0.5 in Hg abs. exhaust pressure.
INDIAN POINT STATION 319
Steady-state power testing was completed in February. Transient tests
including ramp changes up to 25 M W /m in and step changes of 50 M W are
Scheduled for completion in Spring 1963.
As the testing progressed the reactor core responded as predicted.
There were, however, 187 automatic shut-downs in the first six months of
operationô due to malfunctions of associated equipment and to the conserva
tive settings of the nuclear instrumentation during the testing period. At
no time has it been necessary to initiate a manual fast insertion or scram
for reasons of reactor safety.
•Of the automatic shut-downs, about 20% were from the nuclear instru
mentation system for the reason noted above, about 25% were due to mal
functions of the control-rod drive control system and about 30% occurred
as fast insertions as the result of malfunctions in the conventional plant
equipment and were often followed by scram action in the nuclear plant. The
remainder were due to miscellaneous causes, generally of a non-repetitive
nature such as isolated component failures.
10. M AJOR MAINTENANCE AND DESIGN CHANGES
Control-rod drives
During the early testing it became evident that some of the minor items
in the control system for the control-rod drives would require redesign. The
totally enclosed housings were subjecting the electrical circuits and small
shaft bearings in the drive mechanism to a highly humid atmosphere. As
a result, small switches dependent upon slight meclianical movements were
not providing proper information as to rod position, or were falsely trans
mitting signals of unsafe conditions with consequent operation of the reactor
safety system.
Fabrication and procurement of the necessary replacements were com
pleted in time for the work to be done during the outage arranged for re
quired changes in the conventional plant. The following replacements were
made for the twenty-one mechanisms:
(a) An angle bar in the system which monitors the engagement between
the carriage and coupling spacer was replaced with a heavier section;
(b) Small shaft bearings were replaced with sealed bearings lubricated
by a grease which is less susceptible to deterioration in a humid
atmosphere;
(c) Switches in the engagement and lower limit circuits were replaced
by switches of a slightly different design; and
(d) The mounting brackets for these switches were replaced by brackets
permitting better adjustment.
These minor changes became the controlling item of the maintenance
outage because the two sections of each drive mechanism had to be completely disassembled to provide access to the areas of work.
As an additional precaution to guard against a recurrence of the high
humidity condition, a purge system was installed to provide a supply of dry
nitrogen to the drive housings to carry off the moisture.
The sum total of the correction measures indicated above has been
virtual elimination of troubles with the rod-drive system.
320 W .C . BEATTIE and R.H. FREYBERG
11. C O N V EN TION A L P L A N T PIPING
Two piping changes in the conventional plant were necessary to permit
operation at power levels over 50%. The controlled start line had been de
signed with its cold end terminating in a small flash tank instead of a large
manifold so that sufficient steam could not be passed through the line to
place both superheaters in service. Also, the condensate inlet piping to
the twin de-aerators was such that the second de-aerator could not be put
in service because of excessive steam and water hammer. Both of these
deficiencies were corrected during the outage in November and December.
There have been other components of the station which have required
corrective measures, but none of these has had the long-lasting limiting
effects on the plant operations which were contributed by the above two con
siderations. An oil whip developed in the sleeve bearings of two of the three
22-stage vertical centrifugal pumps supplying the control-rod-drive buffer
seal water and primary make-up water. Motors with anti-friction bearings
have been installed and there has been no recurrence of this trouble.
Canned motor-pump units in the chemical systems have required con
tinued maintenance. Some of this trouble appears to have been caused by
hydraulic unbalance, which has been corrected. A few pumps are still
undergoing tests to determine what changes in design are required.
12. RADIO CHEM ISTRY
During the testing up to 50% reactor power the gross gamma activity
in the primary coolant averaged 0. 2 /uc/ml. During operations between
75 and 100% power the gamma activity ranges between 0. 2 and 0. 3 дс/ml.
Activation products such as Mn56 account for a large portion of this gamma
activity. Because of the short half-life of Mn56, the activity varies rapidly
with power level and reduces to approximately 3X 10_3/uc/ml shortly after
shut-down.
The primary blowdown and purification system has operated satis
factorily. The delay time in the blowdown storage tanks accounts for a reduction
to approximately 10-2 ^c/m l in the average activity in the water going to
the purification system. At the outlet of the cation exchangers the activity
is approximately 3X 10'3/uc/ml in the undegassed sample. This is all anion
activity. At the outlet of the mixed bed exchangers the activity is about
2X10⁻³ Mc/mlduetoXeWS^Xelss, Kr87 and Kr88 passing through the mixed
bed plus Xe133 and X e135 from the decay of I 133 and 1135 on the anion resin.
Degassed mixed bed effluent is about 10-5 дс/ml.
Effluents from the waste treatment systems range in the order of 10 -7
to 10-6 |uc/ml.
There is no measurable leakage of primary coolant into the secondary
side of the steam generators. Similarly, there has been no measurable
leakage into the fresh-water cooling system serving equipment such as the
primary-coolant-pump cooling-water jackets.
The chemical performance of all systems in general has been in
accordance with expectations.

INDIAN POINT STATION 321
13. H E A L T H PHYSICS
While there has been an occasional exposure of personnel to fields as high as 25 - 30 mr/h,no one has been subjected to such fields long enough
to absorb dosages even approaching allowable limits as shown by pocket
dosimeters or routine development of film badges at monthly intervals.
Measurements of air and water samples on and off site have not shown
any increase in activity due to the plant operations. No gaseous waste from
the chemical systems has been discharged to date, and ventilation of the con
tainment vessel to purge it before access has required no exceptional
precautions.
Gross gamma measurements at four locations in and around the Indian
Point Station from August 1962 through January 1963 averaged 0. 02 mr/h.
The background measurements for the previous five years ranged from
0.015 to 0.023 m r/h.
14. O PE R A TIN G ORGAN IZATION
The basic plant organization is shown in Fig. 5. Because of the unusual
nature of the station, during start-up there have been modifications which
are expected to be of relatively short duration.
The General Superintendent presently has an Assistant General Super
intendent, and the Superintendent title is presently held by two men, a Re
actor Engineer and a Conventional Plant Superintendent. Each of the men
in these titles holds an United States Atomic Energy Commission operator's
licence.
The function of shift Watch Foreman is being performed by two men,
one of whom is a licensed reactor operator. The other is a qualified
conventional-plant foreman training for his licence. Similarly, the function
of the shift Operator A is being performed by two men, one of whom is a
licensed operator. The other is a conventional-plant operator training for
his licence. In each case the job will be covered by one man when the
trainee becomes licensed.
15. COSTS AND PER FOR M ANCE
The actual construction costs came to $ 126 million. In addition
$ 10.8 million was spent on research and development.
The first core production costs are estimated on the basis of an 80%
load factor at 6.0 mill/kWh excluding fixed charges on the construction costs.
Of this, fuel costs are 5.1 mill and operation and maintenance are 0.9 mill.
The station has not yet achieved the 80% load factor for a normal re
porting period. For the early operations summarized as of the end of De
cember 1962, the production cost was 2.039 cent/kWh. For the month of
January 1963, when the load factor was 43.7%, the cost was 8.19 mill,
broken down as 5.95 mill for fuel, 1.12 mill for operations, 0.86 mill for
maintenance and 0.26 mill for other supplies.
As of 31 March 1963 the station had produced 291 million net kWh and
had operated for 58. 5 equivalent full power days.

GE
NE
RA
LSU
PER
INTE
ND
ENT
322 W .C . BEATTIE and R. H. FREYBERG
21*
Fig
. 5
Indi
an
Poin
t St
atio
n org
aniz
ati
on
chart

INDIAN POINT STATION 323
16. THE SECOND AND THIRD CORES
Our Company has entered into contractual agreement with The Westing-
house Electric Corporation for delivery of the second and third cores. The
fuel will be slightly enriched uranium and elements will be arranged in three
concentric regions of forty elements each. Fuel costs are expected to be
reduced to 5 mill/kWh for the second core and to less than 3 mill/kWh for
the third core.
17. CONCLUSION
The Indian Point Station has proved to the satisfaction of our Company
the feasibility of a combination nuclear and oil-fired plant to produce com
petitive power. The United States Atomic Energy Commission has been
requested to issue a construction permit for the Company to build another
nuclear plant, similar in design, but of 1000 M W capacity, to be located
at Ravenswood which is within the corporate limits of the City of New York.
Our Company is prepared to finance the venture with its own funds without
subsidy of any kind as was the case with our Indian Point Station.
D I S C U S S I O N
I. PAULICKA: How was the commissioning programme of the Indian
Point power station worked out? I am mainly interested in knowing how many
staff members worked on the preparation of the programme, and for how
long. By commissioning programme I mean all experiments which take
place after the completion of construction work, and I include the actual
start-up and the programme for the gradual rise to power.
W . BEATTIE : I cannot give a definite answer to this question because
the programme was conducted in two phases - The Babcock and Wilcox Com
pany, who designed the reactor, did a lot of the preliminary work on a proto
type reactor at Lynchburg so that there were months of work involved there
mainly because of the use of thorium oxide in some of the elements. The
work at Lynchburjg allowed us to install the elements in the reactor, in the"
specified manner, within a month. The maximum number of personnel in
volved in getting the Indian Point plant ready, once the parts were assembled,
was in the neighbourhood of 185. At the present time the number of
personnel is 140.
U. ZELBSTEIN: I would like to put four questions to Mr. Beattie: First,
could you give me more precise information about the economic advantage
of linking a fossil-fuelled superheater to a nuclear reactor? Secondly, does
this combination entail special technical difficulties? If so, what are the
problems you have encountered? Thirdly, could the information derived
from a fossil-fuelled superheater be used in forming conclusions about
nuclear superheat? And, finally, what is the cost per supplementary kilowatt
hour produced by fossil-fueUed superheat compared to the cost per kilowatt
hour produced in a conventional plant using an equal quantity of fuel?

324 W .C . BEATTIE and R. H. FREYBERG
W . BEATTIE : The economic study at the time of designing the Indian
Point Station definitely favoured the installation of fossil-fuelled super
heaters in series with the nuclear reactor steam and the'combination did not entail any special technical difficulties. The answer to your third question
is. Yes. We need superheated steam from reactor operation in order to
have a more efficient turbine plant cycle. As regards comparative costs
I am- afraid I have no figures with me.
G .B . SCURICINI: Can you tell me why you changed your plant over
from a thorium to a uranium cycle? Is the reason purely economical or
did you expect trouble from the use of thorium? Have you considered the
cost penalities involved in changing the type of fuel?
W . BEATTIE: The reason is purely economical and we did not expect
to have any trouble with the thorium cycle. There is, of course, a change
over cost involved. Westinghouse, the new contractors, are at present
building a second and third core. It is hoped that by the time the third core
is installed, and taking into account the change-over cost, we will be down
to a 4 mill cost figure for fuel, which is going to be comparable to some
of our other plants. The cost of production, at Indian Point, for the month
of April was 0. 735 cents per kWh - this figure is just for operation and does
not include any capital depreciation. The average for the Consolidated
Edison System was 0. 632 cents per kWh, so you can see that Indian Point
is getting into a competitive range with the other conventional plants.
You may be interested in an estimated comparison of capital costs for
a nuclear plant and a conventional plant. At the Ravenswood site, which
I referred to in my paper, we are installing a 1000-MW conventional unit
and it is going to be oil-fired. We estimate that it will cost $ 112 per kW
installed. We are trying to get permission to install a 1000-MW nuclear
plant at the same location in 1970 and here we estimate that the cost will
be $ 175 per kW installed.
As the two stations are for installation at the same location, the same
wage rates and the same overheads will apply. If nuclear superheat comes
into the picture, then I would hope that, by 1970, the $ 175 will be down to
$ 130 - but this of course is just an estimate.
S. YIFTAH: The intention of the Consolidated Edison Company to build,
following the experience in the design and operation of the Indian Point
station, a 1000-MW power reactor in Ravenswood, New York City, has
raised questions in the minds of many people about the safety of locating
such a big reactor in such a big city. Can you say something about the
special means to be taken to minimize the effects of any credible radiation
accident at this reactor?
W . BE A TTIE : The basic concept of the shielding at Ravenswood will
be the same as that described in my paper on the Indian Point plant.
The proposed reactor container will be cylinder 150 ft in (inside) diameter with a domed end giving an inside height of 167 ft. The inner steel
shell is l/4-in thick with 2 ft of pervious concrete enclosing it. The outer
steel shell is also l/4-in thick and enclosed by a 5j-ft thick outer reinforced-
concrete wall.
I see nothing in the operation of the Indian Point plant that would lead
me to believe that it is unsafe to build such a reactor in a city.

OPERATING EXPERIENCE AT THE YANKEE ATOMIC ELECTRIC COMPANY NUCLEAR POWER STATION
L.E . MINNICK YANKEE ATOMIC ELECTRIC COMPANY, BOSTON, MASS.
Abstract — Résumé — Аннотация — Resumen
OPERATING EXPERIENCE AT YANKEE ATOMIC ELECTRIC COMPANY. Operation of the Yankee plant
began in November 1960 and since that time the station has generated over 2 X Ю 9 kWh gross. The overall
use factor from first generation of power in 1960 is just over 67%. The economic picture has also been very
encouraging. The Yankee plant is not only continuing to demonstrate its ability to supply base-load power
for the New England area but is also providing new information of benefit to the economics of all closed-cycle
reactors. Problems have been encountered, some of a fairly significant nature, but every indication to date is
that these are correctable and that plant operation will become even more dependable with continually
improving economics as time goes on.
EXPÉRIENCE PRATIQUE DU FONCTIONNEMENT DE LA CENTRALE NUCLÉAIRE YANKEE. La centrale
Yankee a commencé à fonctionner en novembre I960; depuis, elle a fourni plus de deux milliards de kWh bruts.
Son facteur d'utilisation depuis sa mise en service est légèrement supérieur à 67%. Au point de vue de la
rentabilité, les résultats obtenus sont très encourageants. Non seulement la centrale s’est révélée capable
de fournir la charge de base pour la région de la Nouvelle-Angleterre, mais elle permet aussi de recueillir des
données nouvelles très utiles touchant la rentabilité de tous les réacteurs à cycle fermé. Des problèmes parfois
assez importants se sont posés, mais tout semble indiquer à ce jour qu’il est possible de les résoudre et qu'avec
le temps la centrale fonctionnera toujours mieux et dans des conditions de rentabilité toujours meilleures.
ЭКСПЛУАТАЦИОННЫЙ ОПЫТ КОМПАНИИ "ЯНКИ ЭТОМИК ЭЛЕКТРИК'.’ Эксплуатация электростанции"Янки"на-
чалась в ноябре 1960 года,*и с тех пор станция выработала более двух миллиардов киловатт-часов
брутто. Общий коэффициент использования, начиная с момента производстве первой энергии в 1960
году, составляет более 67% . Экономическая картина также является очень обнадеживапцей. Электро
станция "Янки" не только продолжает показывать свою способность снабжать энергией основной нагрузки
район Новой Англии,г но и позволяет получить новые данные об экономической пользе всех реакторов
с замкнутыми циклами. В процессе эксплуатации возникали проблемы, некоторые из которых носили
довольно серьезный характер, но в настоящее время все говорит за то, что они разрешимы и что со
временем работа станции станет даже более надежной и ее экономичность будет непрерывно повышаться.
EXPERIENCIA PRÁCTICA EN LA YANKEE ATOMIC ELECTRIC COMPANY. La central Yankee comenzó
a funcionar en noviembre de 1960 y desde entonces ha generado más de dos mil millones de kilowatios-hora
brutos. Desde que se inició la producción en 1960 el factor de utilización medio es algo superior al 67%. Los
aspectos económicos son asimismo muy alentadores. La central Yankee no sólo sigue demostrando que es capaz
de cubrir la carga fundamental en la zona de Nueva Inglaterra, sino también está proporcionando nuevos datos
sobre los factores económicos de todos los reactores de ciclo cerrado. Se han presentado problemas, algunos de
ellos grave», pero hasta el presente todo indica que son subsanables y que el funcionamiento de la central se
guirá mejorando tanto técnica como económicamente.
The Yankee Atomic Electric Company reactor is of the pressurized-
water or closed-cycle type, presently rated at 170 MW(e) gross. The plant
was designed and constructed by Westinghouse Electric Corporation and
Stone & Webster Engineering Corporation for a group of ten of New England's
major utility companies.
The YANKEE reactor has four primary coolant recirculating loops oper
ating at a nominal pressure of 2000 lb/in2gauge and an average temperature
325
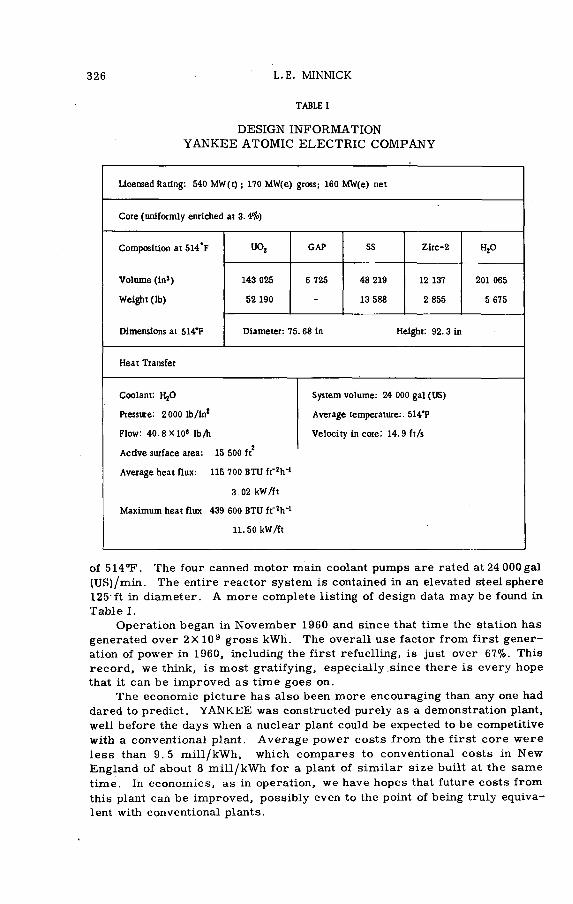
326 L. E. MINNICK
TABLE I
DESIGN INFORMATION
YAN KEE ATOM IC ELECTRIC COM PANY
Licensed Rating: 540 MW(t) ; 170 MW(e) gross; 160 MW(e) net
Core (uniformly enriched at 3.4%)
Composition at 514°F UOj GAP SS Zirc-2 HjO
Volume (in3) 143 025 6 725 48 219 12 137 201 065
Weight (lb) 52 190 - 13 588 2 855 5 675
Dimensions at 514°F Diameter: 75.68 in Height: 92.3 in
Heat Transfer
Coolant: H20
Pressure: 2000 lb/in2
Flow: 40 .8X 10 ' lb/h
2Active surface area: 15 500 ft
Average heat flux: 115 700 BTU ft"!h'1
3.02 kW/ft
Maximum heat flux 439 600 BTU ft'2h_1
11.50 kW/ft
of 514°F. The four canned motor main coolant pumps are rated at 24 000gal
(US)/min. The entire reactor system is contained in an elevated steel sphere
125 ft in diameter. A more complete listing of design data may be found in
Table I.
Operation began in November 1960 and since that time the station has
generated over 2X10⁹ gross kWh. The overall use factor from first gener
ation of power in 1960, including the first refuelling, is just over 67%. This
record, we think, is most gratifying, especially since there is every hope
that it can be improved as time goes on.
The economic picture has also been more encouraging than any one had
dared to predict. YANKEE was constructed purely as a demonstration plant,
well before the days when a nuclear plant could be expected to be competitive
with a conventional plant. Average power costs from the first core were
less than 9.5 mill/kWh, which compares to conventional costs in New
England of about 8 mill/kWh for a plant of similar size built at the same
time. Iii economics, as in operation, we have hopes that future costs from
this plant can be improved, possibly even to the point of being truly equiva
lent with conventional plants.
System volume: 24 000 gal (US)
Average temperature:. 514’F
Velocity in core: 14.9 ft/s
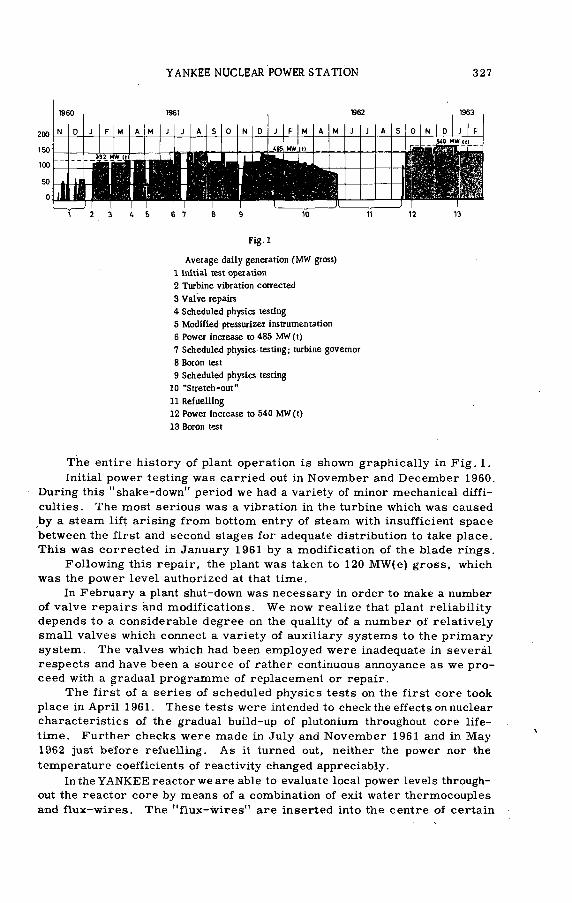
YANKEE NUCLEAR POWER STATION 327
200
150
100
50
0
J F M A M A S 0 N D
И И Р ^ Р Р Ч I PIM I V' Il1 4 ! I 1 ^ I
f p ï "f'
I I 6 7
Fig.l
Average daily generation (MW gross)
1 Initial test operation
2 Turbine vibration corrected
3 Valve repairs
4 Scheduled physics testing
5 Modified pressurizer instrumentation
6 Power increase to 485 MW (t)
7 Scheduled physics testing ; turbine governor
8 Boron test
9 Scheduled physics testing
10 "Stretch-out"
11 Refuelling
12 Power increase to 540 MW(t)
13 Boron test
The entire history of plant operation is shown graphically in Fig. 1.
Initial power testing was carried out in November and December 1960.
During this "shake-down" period we had a variety of minor mechanical diffi
culties. The most serious was a vibration in the turbine which was caused
by a steam lift arising from bottom entry of steam with insufficient space
between the first and second stages for adequate distribution to take place.
This was corrected in January 1961 by a modification of the blade rings.
Following this repair, the plant was taken to 120 MW(e) gross, which
was the power level authorized at that time.
In February a plant shut-down was necessary in order to make a number
of valve repairs ànd modifications. W e now realize that plant reliability
depends to a considerable degree on the quality of a number of relatively
small valves which connect a variety of auxiliary systems to the primary
system. The valves which had been employed were inadequate in several
respects and have been a source of rather continuous annoyance as we pro
ceed with a gradual programme of replacement or repair.
The first of a series of scheduled physics tests on the first core took
place in April 1961. These tests were intended to check the effects on nuclear
characteristics of the gradual build-up of plutonium throughout core life
time. Further checks were made in July and November 1961 and in May
1962 just before refuelling. As it turned out, neither the power nor the
temperature coefficients of reactivity changed appreciably.
In the YANKEE reactor we are able to evaluate local power levels through
out the reactor core by means of a combination of exit water thermocouples
and flux-wires. The "flux-wires" are inserted into the centre of certain
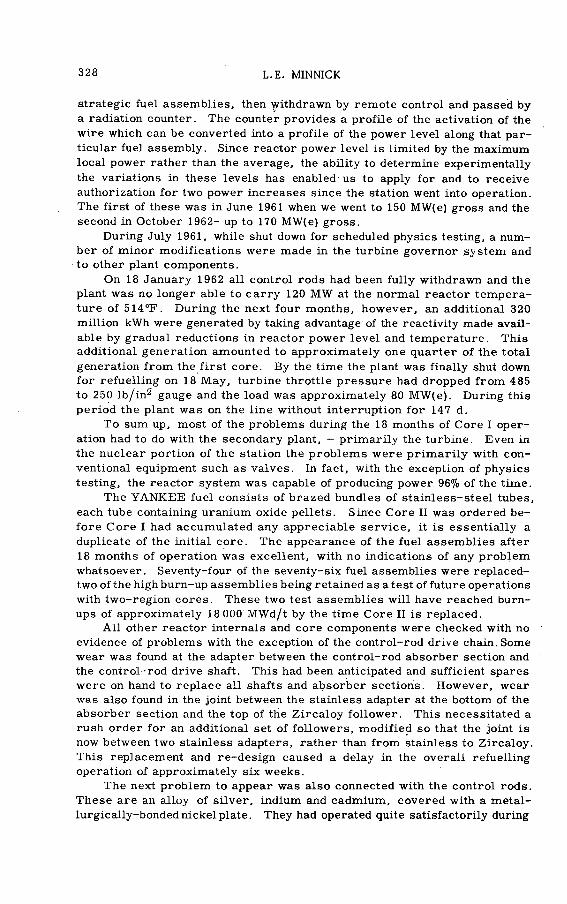
328 L. E. MINNICK
strategic fuel assemblies, then withdrawn by remote control and passed by
a radiation counter. The counter provides a profile of the activation of the
wire which can be converted into a profile of the power level along that par
ticular fuel assembly. Since reactor power level is limited by the maximum
local power rather than the average, the ability to determine experimentally
the variations in these levels has enabled us to apply for and to receive
authorization for two power increases since the station went into operation.
The first of these was in June 1961 when we went to 150 MW(e) gross and the
second in October 1962- up to 170 MW(e) gross.
During July 1961, while shut down for scheduled physics testing, a num
ber of minor modifications were made in the turbine governor system and
to other plant components.
On 18 January 1962 all control rods had been fully withdrawn and the
plant was no longer able to carry 120 M W at the normal reactor tempera
ture of 514°F. During the next four months, however, an additional 320
million kWh were generated by taking advantage of the reactivity made avail
able by gradual reductions in reactor power level and temperature. This
additional generation amounted to approximately one quarter of the total
generation from the first core. By the time the plant was finally shut down
for refuelling on 18 May, turbine throttle pressure had dropped from 485
to 250 lb/in2 gauge and the load was approximately 80 MW(e). During this
period the plant was on the line without interruption for 147 d.
To sum up, most of the problems during the 18 months of Core I oper
ation had to do with the secondary plant, — primarily the turbine. Even in
the nuclear portion of the station the problems were primarily with con
ventional equipment such as valves. In fact, with the exception of physics
testing, the reactor system was capable of producing power 96% of the time.
The YA N K E E fuel consists of brazed bundles of stainless-steel tubes,
each tube containing uranium oxide pellets. Since Core II was ordered be
fore Core I had accumulated any appreciable service, it is essentially a
duplicate of the initial core. The appearance of the fuel assemblies after
18 months of operation was excellent, with no indications of any problem
whatsoever. Seventy-four of the seventy-six fuel assemblies were replaced-
two of the high burn-up assemblies being retained as a test of future operations
with two-region cores. These two test assemblies will have reached burn-
ups of approximately 18 000 MWd/t by the time Core II is replaced.
All other reactor internals and core components were checked with no
evidence of problems with the exception of the control-rod drive chain. Some
wear was found at the adapter between the control-rod absorber section and
the control-rod drive shaft. This had been anticipated and sufficient spares
were on hand to replace all shafts and absorber sections. However, wear
was also found in the joint between the stainless adapter at the bottom of the
absorber section and the top of the Zircaloy follower. This necessitated a
rush order for an additional set of followers, modified so that the joint is
now between two stainless adapters, rather than from stainless to Zircaloy.
This replacement and re-design caused a delay in the overall refuelling
operation of approximately six weeks.
The next problem to appear was also connected with the control rods.
These are an alloy of silver, indium and cadmium, covered with a metal-
lurgically-bonded nickelplate^ They had operated quite satisfactorily during

YANKEE NUCLEAR POWER STATION 329
the life of Core I with only negligible levels of silver in the main coolant.
During refuelling, however, under the combination of cold, borated, oxygen-
saturated water, the nickel plate deteriorated rather rapidly. This, in turn,
exposed large areas of the silver alloy. Unfortunately, a few grams of this
material, dissolved in the refuelling water and subsequently plated out on
all submerged metal surfaces, is all that is necessary to create a severe
radiation problem. This condition caused an additional delay of about ten
days while various decontamination agents were tried out and while tempo
rary shielding was being devised and put to use during the replacement of
the reactor head.
Since that time, an intensive search has been made for a more satis
factory control-rod material. There seems to be no ideal solution, con
sidering the requirements for structural strength, neutron absorbing ef
fectiveness, corrosion resistance, availability, proven technology and cost.
The most suitable answer to YANKEE'S particular requirements seems to
be either hafnium or the same alloy of silver — clad this time in a much
thicker layer of Inconel.
One of the encouraging aspects of refuelling was the turbine. After a
complete check it was found to be in excellent condition — at least as good
as units operating with more conventional steam conditions.
On 20 September 1962 the plant was returned to operation. After re
solving some minor turbine governor problems, base-load operation was
resumed.
During the final three months of 1962 the plant generated 370 951000 kWh,
at a use factor for this period of over 97%.
Presently the Yankee plant employs boron in the form of boric acid as
a supplemental control for cold shut-down of the plant. During normal oper
ation at power, the only water additive present is an overpressure of hydro
gen so as to reduce oxygen levels to a minimum.
Core III will be a two-region core made up of a half-loading of new, more
highly enriched (4. 1%) fuel, surrounding a central portion made up of the
least burned assemblies from Core II. Such a core will have a somewhat
higher initial reactivity than the earlier, single region, 3.4% enriched, corea
This will be compensated for by using boric acid during the first few days
of operation while xenon poisoning is taking effect. We feel this is a logical
approach to the eventual use of boric acid as a continuous operating shim
control, with its attendant benefits of longer-lived and higher-powered cores.
As contributing steps in demonstrating the feasibility of operation at
power with boric acid present, YANKEE has twice operated for periods of
several days with up to 400 ppm of boron in the primary system. The most
recent of these tests took place this past February.
From a nuclear standpoint these tests were inconclusive in that during
the first test we noted a slight loss of reactivity and during the second we
found a slight gain. From an operational standpoint, however, the tests
demonstrated that boric acid causes no difficulty. We were able to add the
poison and, later, to remove it without incident. All reactivity changes were
slow — on the order of hours or even days — and well within the capability
of the control systems.
On 1 March 1963, plant load was returned to 170 MW(e). It is expected
that all control rods will be withdrawn and another period of core stretch-
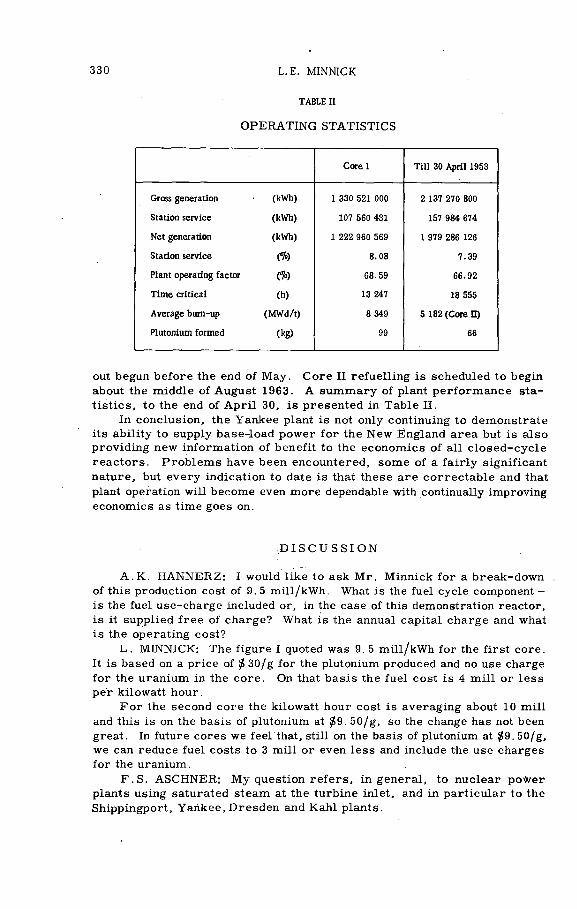
330 L. E. MINNICK
TABLE il
OPERATING STATISTICS
Core I Till 30 April 1953
Gross generation (kWh) 1 330 521 000 2 137 270 800
Station service (kWh) 107 560 431 157 984 674
Net generation (kWh) 1 222 960 569 1 979 286 126
Station service C*>) 8.08 7.39
Plant operating factor Л 68.59 66.92
Time critical (h) 13 247 18 555
Average bum-up (M W d/t) 8 349 5 182 (Core П)
Plutonium formed (kg) 99 66
out begun before the end of May. Core II refuelling is scheduled to begin
about the middle of August 1963. A summary of plant performance sta
tistics, to the end of April 30, is presented in Table II.
In conclusion, the Yankee plant is not only continuing to demonstrate
its ability to supply base-load power for the New Ëngland area but is also
providing new information of benefit to the economics of all closed-cycle
reactors. Problems have been encountered, some of a fairly significant
nature, but every indication to date is that these are correctable and that
plant operation will become even more dependable with continually improving
economics as time goes on.
D I S C U S S I O N
A .K . H AN N ER Z: I would like to ask Mr. Minnick for a break-down
of this production cost of 9. 5 mill/kWh. What is the fuel cycle component —
is the fuel use-charge included or, in the case of this demonstration reactor,
is it supplied free of charge? What is the annual capital charge and what
is the operating cost?
L . MINNICK: The figure I quoted was 9. 5 mill/kWh for the first core.
It is based on a price of $ 30/g for the plutonium produced and no use charge
for the uranium in the core. On that basis the fuel cost is 4 mill or less
per kilowatt hour.
For the second core the kilowatt hour cost is averaging about 10 mill
and this is on the basis of plutonium at $9. 50/g, so the change has not been
great. In future cores we feel that, still on the basis of plutonium at $9. 50/g,
we can reduce fuel costs to 3 mill or even less and include the use charges
for the uranium.
F .S . ASCHNER: My question refers, in general, to nuclear power
plants using saturated steam at the turbine inlet, and in particular to the
Shippingport, Yankee, Dresden and Kahl plants.
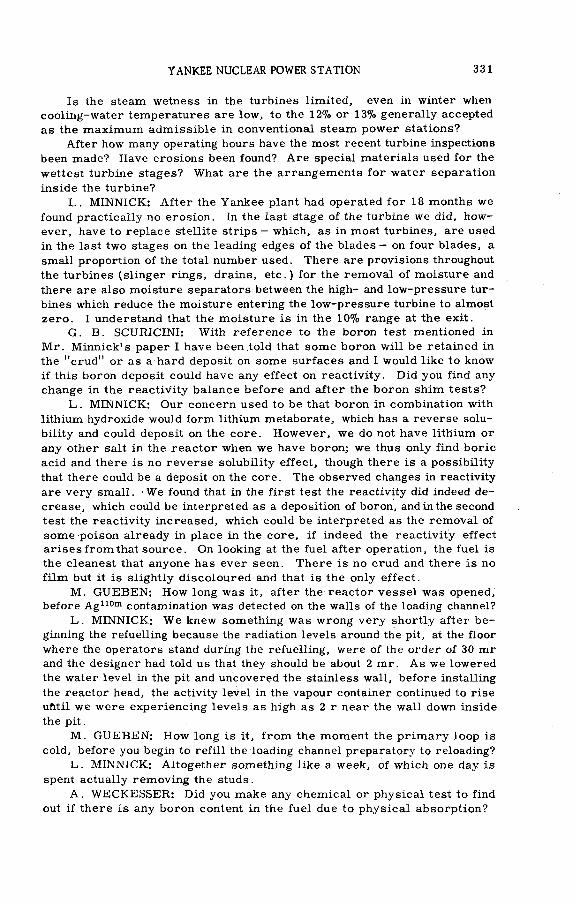
YANKEE NUCLEAR POWER STATION 331
Is the steam wetness in the turbines limited, even in winter when
cooling-water temperatures are low, to the 12% or 13% generally accepted
as the maximum admissible in conventional steam power stations?
After how many operating hours have the most recent turbine inspections
been made? Have erosions been found? Are special materials used for the
wettest turbine stages? What are the arrangements for water separation
inside the turbine?
L . MINNICK: After the Yankee plant had operated for 18 months we
found practically no erosion. In the last átage of the turbine we did, how
ever, have to replace stellite strips — which, as in most turbines, are used
in the last two stages on the leading edges of the blades — on four blades, a
small proportion of the total number used. There are provisions throughout
the turbines (slinger rings, drains, etc.) for the removal of moisture and
there are also moisture separators between the high- and low-pressure tur
bines which reduce the moisture entering the low-pressure turbine to almost
zero. I understand that the moisture is in the 10% range at the exit.
G . B. SCURICINI: With reference to the boron test mentioned in
M r. Minnick's paper I have been told that some boron will be retained in
the "crud" or as a hard deposit on some surfaces and I would like to know
if this boron deposit could have any effect on reactivity. Did you find any
change in the reactivity balance before and after the boron shim tests?
L . MINNICK: Our concern used to be that boron in combination with
lithium hydroxide would form lithium metaborate, which has a reverse solu
bility and could deposit on the core. However, we do not have lithium or
any other salt in the reactor when we have boron; we thus only find boric
acid and there is no reverse solubility effect, though there is a possibility
that there could be a deposit on the core. The observed changes in reactivity
are very small. -We found that in the first test the reactivity did indeed de
crease, which could be interpreted as a deposition of boron, and in the second
test the reactivity increased, which could be interpreted as the removal of
some poison already in place in the core, if indeed the reactivity effect
arises from that source. On looking at the fuel after operation, the fuel is
the cleanest that anyone has ever seen. There is no crud and there is no
film but it is slightly discoloured and that is the only effect.
M . GUEBEN : How long was it, after the reactor vessel was opened,
before Ag110m contamination was detected on the walls of the loading channel?
L . MINNICK: W e knew something was wrong very shortly after be
ginning the refuelling because the radiation levels around the pit, at the floor
where the operators stand during the refuelling, were of the order of 30 mr
and the designer had told us that they should be about 2 mr. As we lowered
the water level in the pit and uncovered the stainless wall, before installing
the reactor head, the activity level in the vapour container continued to rise
ufttil we were experiencing levels as high as 2 r near the wall down inside
the pit.
M . G U EB EN : How long is it, from the moment the primary loop is
cold, before you begin to refill the loading channel preparatory to reloading?
L . MINNICK: Altogether something like a week, of which one day is
spent actually removing the studs.
A . W ECKESSER : Did you make any chemical or physical test to find
out if there is any boron content in the fuel due to physical absorption?
332 L.E. MINNICK
L. MINNICK: This will be one of the aspects of the Westinghouse exami
nation. I personally do not hold much hope for it because of the lapse of
time and the large number of environments through which the fuel has passed
and will pass before it is examined.
A . W ECKESSER : How often can you use the О -rings which seal the
reactor flange?
L . MINNICK: We think we could use them almost indefinitely and, al
though we did replace them this last refuelling, we have had no trouble with
them at all.
A . WECKESSER: How many spurious scrams occurred during the whole
period of operation?
L . MINNICK: A total of only 33 scrams have occurred to date. I am
not sure of the percentage of spurious scrams.
J. STORRER: Did you detect any undue activity in the primary water
which might be attributed to uranium contamination on the surface of the
fuel assemblies or to fuel failure? Did you make any contact measurements
of the activity of the vessel's internal components during the first refuelling?
And what was the water pH value when you operated with 400 ppm boron?
L . MINNICK: We did experience some fission product activity in both
the first and the second core. The levels were such (< 1% of design values)
that we've had a running argument within the organization as to whether this
is external contamination or whether this actually represents one or two
very small fuel leaks. My own opinion is that we have one or two small
leaks.
No contact measurements were made since the items concerned were
stored under water and their activity was not a matter of importance.
The pH of the water during the boron tests is unadjusted and therefore
runs slightly on the acid side with 400 ppm of boron.
F .R . BELOT: My question refers to the instrumentation of the YANKEE
reactor, and especially to the placing of flux wires to determine the distri
bution of flux in the core. This device is likely to be of interest to the oper
ators, but it involves both a technical complication and an extra expense.
Could you give us some idea of the effect of this complication on operation
as well as the magnitude of the expense involved? Could you also tell us if
authorization to increase power could have been obtained as quickly in the
absence of flux wires?
L,. MINNICK: The core instrumentation unfortunately cost much more
than we felt that it should have done. We did not decide to install it until
approximately a year and a half before plant operation and this necessitated
excessive engineering and fabrication costs in order to fit it in. The cost
was something like $500,000. There are two schools of thought as to the
desirability of the core instrumentation: the pure operator says it is quite
unnecessary — the scientists and management.of the company say it has been
very valuable. It alone has allowed us to go up in power as we have been
able to do, and going up in power is the best and quickest single way to re
duce the cost per kWh from an existing plant — the capital costs being spread
over more kWh. As for the day-to-day problems that we have had with
instrumentation: as far as I know it has never caused a shut-down or delayed
the operation fo the reactor; it is, however, a major problem during
refuelling.

YANKEE NUCLEAR POWER STATION 333
B. SAITCEVSKY: Is the cost of materials replaced during operation,
such as valves and control rods, included in the cost per kWh? What is the
total amount of such replacements? And what is the cost of a control rod?
L . MINNICK: The answer to the first question is, Yes, the figures I
quoted do include all the replacement part s used; in particular the 10 mill/kWh
figure for Core II includes the cost of the pieces that were added between
Cores I and II. The total cost was rather over $500 000, of which the 24
Zircaloy followers accounted for $200 000. The control rods cost something
like $20 000 each.
A . N OVIKOV (Chairman): Are there burnable poisons in the first
YANKEE core? And what is the reactivity balance in regard to temperature
effect, power effect, burn-up and finally poisoning?
L . MINNICK: There are no burnable poisons or other means of reac
tivity control except the control rods and boric acid in solution. The boric
acid was used on the first core only, for supplementary control during a
cold shut-down of the plant.
The total excess reactivity on the first core was measured as 15.5±1.5%
and is divided up approximately as follows:
Temperature effect (hot to cold) = 5%
Power effect (zero to full power) = 3%
Burn-up effect
Poisoning (Xe & Sm)
= 5%
= 2.5%


THE FIRST TWO YEARS OF OPERATING E X P E R IE N C E OF THE KAHL NUCLEAR POWER STATION
H J. BRÜCHNER
AEG-KERNENERGIEANLAGEN, FRANKFURT/MAIN
AND
A. WECKESSER
VERSUCHS-ATOMKRAFTWERK KAHL GMBH, KAHL
FEDERAL REPUBLIC OF GERMANY
Abstract — Résumé — Аннотация — Resumen
THE FIRST TWO YEARS OF OPERATING EXPERIENCE OF KAHL NUCLEAR POWER STATION. Kahl, being
the first European private atomic power station, has been operating at load since June 1961. Kahl is equipped with a
boiling-water reactor, operating in an indirect cycle and with natural circulation. Its electrical net capacity
is 15 MW, and the power produced until February 1963 amounts to 140 million kWh. In the paper the operating
experience, particularly the extensive testing programme such as concerning transient behaviour and gamma-
scanning, will be reviewed. Results about the operating performance of certain plant components such as
control-rod-drive system, off-gas system and turbine will be presented. After this testing programme the
plant has been operated at base load for some time in order to obtain realistic experience on fuel performance.
After completion of the base-load phase of operation a nuclear superheating test loop will be installed and run
in the Kahl reactor.
EXPÉRIENCE ACQUISE PENDANT LES DEUX PREMIÈRES ANNÉES DE FONCTIONNEMEN T DE LA CENTRALE
NUCLÉAIRE DE KAHL. La centrale de Kahl, la première en Europe dont l'exploitation soit assurée par une
entreprise privée, alimente le secteur depuis juin 1961. Elle est équipée d'un réacteur à eau bouillante, en
cycle indirect, à circulation naturelle. Avec une puissance électrique nette de 15 M W , elle avait produit,
jusqu'à février 1963, 140 millions de kWh. Le mémoire rend compte de l'expérience acquise concernant le
fonctionnement de la centrale, notamment du programme étendu des essais effectués sur son comportement
en régime transitoire et sur la détection gamma. Il donne, en particulier, des renseignements sur le fonction*
nement de certains éléments de la centrale tels que le mécanisme de commande des barres de contrôle, le
dispositif d'échappement des gaz et la turbine. A la suite de ce programme d'essais, on fait fonctionner
depuis quelque temps la centrale comme centrale de base afin de rassembler des données pratiques sur les
performances du combustible. A l'expiration de la période prévue pour le fonctionnement comme centrale de
base, on aménagera, dans le réacteur, une boucle expérimentale destinée à l'étude de la surchauffe nucléaire.
ОПЫТ ПЕРВЫХ ДВУХ ЛЕТ ЭКСПЛУАТАЦИИ АТОМНОЙ ЭЛЕКТРОСТАНЦИИ В КАЛЕ. Атомная электростанция
в Кале, первая в Европе частная атомная электростанция, эксплуатируется под нагрузкой с июня
1961 года. На электростанции установлен реактор с кипящей водой, косвенным циклом и естествен*
ной циркуляцией. Чистая электрическая мощность реактора составляет 15 мгвт. До февраля 1963
года количество полученной энергии составило 140 млн. к в т .ч . Рассмотрен опыт эксплуатации, в
частности расширенная программа испытаний: например,поведение реактора при переходном процессе
и контроль гамма-излучения. Будут представлены результаты изучения эксплуатационной характе
ристики некоторых компонентов установки, например системы привода регулирупцих стержней, системы
удаления газа и турбины. После осуществления этой программы испытаний установка в течение не
которого времени эксплуатируется с базовой нагрузкой с целью приобретения соответствутацего опыта
о работе топливных элементов. По завершении стадии эксплуатации с базовой нагрузкой на реакторе
будет установлена испытательная петля для изучения ядерного перегрева.
EXPERIENCIA ADQUIRIDA EN LOS PRIMEROS CUATRO AÑOS DE FUNCIONAMIENTO DE LA CENTRAL
NUCLEOELÉCTRICA DE KAHL. La central de Kahl constituye la primera central nucleoeléctrica europea
de propiedad privada, y funciona en carga desde junio de 1961. Está equipada con un reactor de agua hirviente
335
336 H.J. BRÜCHNER and A. WECKESSER
que trabaja en ciclo indirecto por circulación natural. Su capacidad eléctrica neta asciende a 15 MW y hasta
febrero de 1963 había producido 140 millones de kWh. La memoria revisará la experiencia adquirida durante
su funcionamiento, ante todo con el extenso programa de ensayos sobre el comportamiento transitorio y la
exploración gamma. Presentará datos acerca del resultado que han dado en funcionamiento ciertas partes de
la central, tales como el dispositivo de accionamiento de las barras de control, el sistema de purificación
de los gases de escape y la turbina. Una vez terminado el programa de ensayos, la planta se explotó en carga
básica durante algún tiempo a fin de reunir datos sobre el rendimiento del combustible en la ptáctica. Una
vez completada esta fase, se instalará en el reactor de Kahl un circuito experimental de sobrecalentamiento
nuclear.
1. INTRODUCTION
In 1958 the Rheinisch-Westfálische Elektrizitátswerk A G (RWE) and
Bayernwerk AG , two large utility companies in the Federal Republic of
Germany, ordered a 15 000 kW(e) nuclear power station. It consists of an
indirect-cycle boiling-water reactor with a conventional secondary steam-
turbine generator system (Fig.l). Other than the Elk River Reactor Plant,
it is the only one of this type in operation today. The steam for the turbine
comes from an intermediate heat-exchanger rather than from the reactor.
Since-this was the first nuclear power plant in Germany, it was decided
that the licensing procedures should be expedited by not taking the radio
active steam outside the reactor containment building. This decision was
partly based on the fact that there is a high population density in Germany,
making exclusion areas as a safety measure hardly feasible.
The indirect-cycle plant - appropriate for the experimental predecessor
of larger nuclear power stations — was to demonstrate the safety and feasi
bility of the direct-cycle BWR.
The order to build the Kahl Plant on a turn-key basis was placed with
the Allgemeine Elektrizitâts-Gesellschaft (AEG) as prime contractor. AEG
let sub-contracts to the International General Electric Company (IGE) of
the United States, the German civil engineering firm Hochtief and many
other companies. IGE provided the conceptual design of the nuclear steam
supply system, rendered engineering services during plant construction
and start-up and supplied the fuel elements, control rods and drives and
parts of the reactor safety system. All other components were manufactured
in Germany.
The power plant produces 60.4 MW(t) and 16 MW(e) gross. The reactor
steam system operates at 71.3 atm gauge constant, and the turbine steam
system operates at 45.6 atm gauge at rated power. The initial U235 enrich
ment of the Zircaloy-clad U02-fuel elements is half 2.3% and half 2.6%. The
layout of the plant has been described several times before [1-7] .
The average fuel burn-up hitherto attained is 4500 MWd/t of uranium.
To date 150 million kWh of electric power have been produced by the Kahl
station.
2. EXPER IEN CE OF PLA N T OPERATION
The Kahl Nuclear Power Station is now operated as a base-load plant
to collect information on fuel performance as much and as soon as possible.

KAHL NUCLEAR TOWER STATION 337
Fig
.l
Sim
pli
fied
flow
dia
gram

338 H.J. BRÜCHNER and A. WECKESSER
Before this, the plant performance under various operating conditions, e.g.
subject to load changes, has been extensively studied, as they are of sig
nificance from the point of view of power-plant operation in a compound
electric net-work. This programme of testing of plant performance has
included tests of start-up, transient behaviour, shut-down and low power
operation.
2. 1. Reactor start-up experience
The time required to run the plant from ambient temperature and
pressure up to the full operating condition is only determined by the per
missible temperature difference between the wall and the head flange of the
reactor pressure vessel. This means that the temperature rise in the walls
of the pressure vessel is limited to about 35°C/h (Fig.2). Consequently it
takes 10 h to reach the full operating temperature and pressure. Compared
to that, the time required for reactor criticality and for supply of the nuclear heat production is insignificant.
Fig. 2
Heating-up curve of reactor vessel
Fig.3 shows a plot of time against thermal reactor power during startup. 18 min after withdrawing the first control rod the reactor becomes criti
cal at about 6 kW(t). The transition from the sub-critical state to the super
critical one occurs so smoothly that it cannot be observed on the power plot
at all. After about 40 min the reactor output is attained which corresponds
to the permissible heat-up rate. Initially the reactor output is about
600 kW(t); it rises to 2 MW(t) by small steam production at higher tempera
ture. The reactor operating pressure is reached seven to eight hours later
so that the reactor can then be rapidly brought up to full power.
Fig.4 demonstrates this operation both without and with the turbine con
nected. If in the first case steam is directly transmitted to the condenser
via the by-pass, the reactor power can be raised from 5 to 75% within 10min.

KAHL NUCLEAR POWER STATION 339
Fig* 3
Plot of reactor output at start-up
Fig. 4
Change of reactor power
with and without connected turbine
If the turbine is also connected, this will determine the rate of power in
crease so that it takes twice this time for the same operation. Consequently,
the reactor assumes any power level between zero and full load within a few
minutes. It is important to note that the problem of low-load operation,
which is quite crucial for conventional boilers, does not exist.
2 .2 . Plant availability attained
Fig.5 shows the electric power production and the availability of both
the entire power plant and the reactor for the period from June 1961, when
power operation commenced, until February 1963, when this paper was
written. In 1961 the power production was limited to 50 - 75% of the total
power of the plant because of licence requirements. After a period of half
a year, during which the performance tests required by the licence were
carried out, full power operation was authorized at the beginning of 1962.
It should be emphasized that the availability of the reactor exceeds that of
the entire power plant. On an average,plant availability has amounted to 75%.
The balance to 100% results from both scheduled and unscheduled plant shut
downs which are discussed in the following sections.

1961
340 H.J. BRÜCHNER and A. WECKESSER
Г>- N (A IC
g
indjno 1оииэч1%! ÿ # ° “»
indino |01Ш Э1Ц% ■* indino iDUjjaiu%
? > <l~ë
■ fil? x ^ o« 5 ,U1 —*
OU ó gE 0L ÛT
4nK => -g €
Outp
ut
dia
gram

KAHL NUCLEAR POWER STATION 341
2. 3 . Scheduled plant shut-downs
There were two scheduled plant shut-downs: (a) June - August 1961;
and (b) July - August 1962. During period (a), the plant was shut down several
times in order to measure the flow and neutron-flux distribution throughout the reactor. The reactor vessel had to be opened for this purpose. This
programme also included measurements such as that of the recirculation
flow, which were demanded only by the licensing authorities. The results
have clearly shown that there is good agreement between the calculated and
measured values for the Kahl core so that the authorities should now be
able to facilitate the licensing procedure for future boiling-water reactors.
In order to compensate the initial excess reactivity of the reactor, 60 of
the total of 88 fuel elements carry shrouds of borated steel. In the course
of reactor operation the steel channels will be replaced by Zircaloy channels •
Consequently the plant had to be shutdown for period (b) to replace 30 borated
steel channels by Zircaloy channels. This interruption of plant operation
was also used to replace the scram valves of the reactor safety system and
to check the metallurgical condition of the control rods.
2. 4 . U nscheduled plant shut-downs
Unscheduled plant shut-downs occurred for several weeks in November
and December 1961, and in February, May and November 1962. These plant
Turbine layout with extraction lines
342 H.J- BRÜCHNER and A. WECKESSER
interruptions were essentially caused by difficulties in turbine operation and
in the mechanical parts of the control-rod drive system.
2.4 .1 . Difficulties in turbine operation
The difficulties experienced in the operation of the turbine are evidently
due to the fact that the turbine is operated with saturated steam. The
moisture content of the live steam is below 1%. At a steam flow rate of
100 t/h about 10 t/h of water are entrained from the turbine at eight ex
traction points (Fig.6). During operation the turbine casing is covered in
ternally by a water layer which evaporates upon shut-down. This evaporation
obviously gives rise to an unfavourable temperature distribution in the
casing which may have been the reason for leakage in the turbine flange.
In addition to the normal flash tanks in the extraction system, tanks
were installed to measure the amount of water extracted. When the gener
ator is tripped, the pressure in the turbine decreases, causing the water
to flash to steam which continues to drive the turbine. Fig.7 shows the con
dition when the main valve of the turbine is closed and the generator is still
on the line. It can be seen that 12 s are required before the generator
reaches zero power. Fig.8 shows the situation when the generator is tripped
from the grid and the main turbine valve is also closed. In this case, the
turbine overspeeds to 3380 rpm, which is about 12% overspeed, and exceeds
the set point for turbine trip. These difficulties were overcome by using
electrically operated relief valves in the lines to the extraction tanks. These
valves operate automatically when a generator trip occurs.
2 .4 .2 . Difficulties in the reactor scram system
Frequent functional maloperations of the mechanical parts of the reactor
scram-system caused several short unscheduled reactor shut-downs. The
air control and sealing system for the control rods is shown in Fig.9. During
normal operations the control rods are driven by electrical motors. At
scram the control rods are operated by pressurized air. The control
blades are connected to the air cylinder by a seal shaft and connecting shaft.
Through the opening of two electro-pneumatic valves mounted in series,
air is allowed to enter the control-rod air-cylinder causing the rapid scram
insertion of the poison blade into the core. The valve response, calculated
to meet safety system performance, on the average should not be greater
than 100 ms. With the original valves, it was difficult to keep the time re
sponse constant. One of the reasons was the breaking friction between the
dynamic О -rings and the seal surface in the valve. For this reason, the
valves were replaced. In this connection, it is interesting to note that the
operational reliability of a nuclear power plant may be limited to a large
extent by conventional equipment and engineering problems.
Also several spurious scrams occurred by induction in the extremely
sensitive reactor safety system due to external electrical sources. Such
disturbances are highly undesirable from the standpoint of reliable power
supply to the grid. It is therefore of the utmost importance to exercise ex
treme care in the installation of the wiring and to pay meticulous attention
to the sparkless functioning of electrical components like relays.
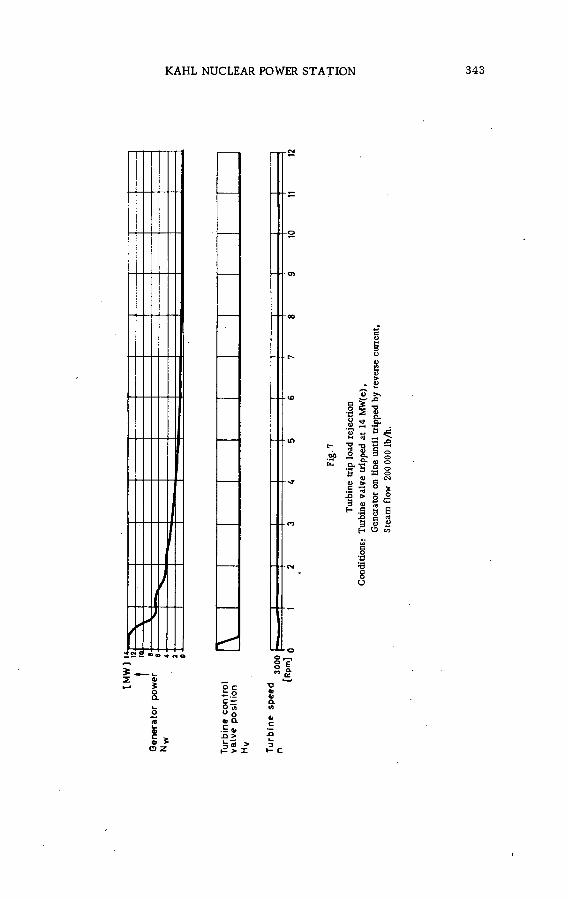
*i [M
N1
KAHL NUCLEAR TOWER STATION 343
о z
о _О e« с
и
8g & Q.
J3 > <я >
►= > X
■О&4)О.«Л
Кс

344 H.J. BRÜCHNER and A. WECKESSER
Gen
erato
r an
d tu
rbin
e tr
ip
The
load
was
re
ject
ed
by
trip
ping
bo
th
the
generato
r
from
th
e gr
id
and
the
turb
ine
stop
va
lve
at
14 M
W(e
)
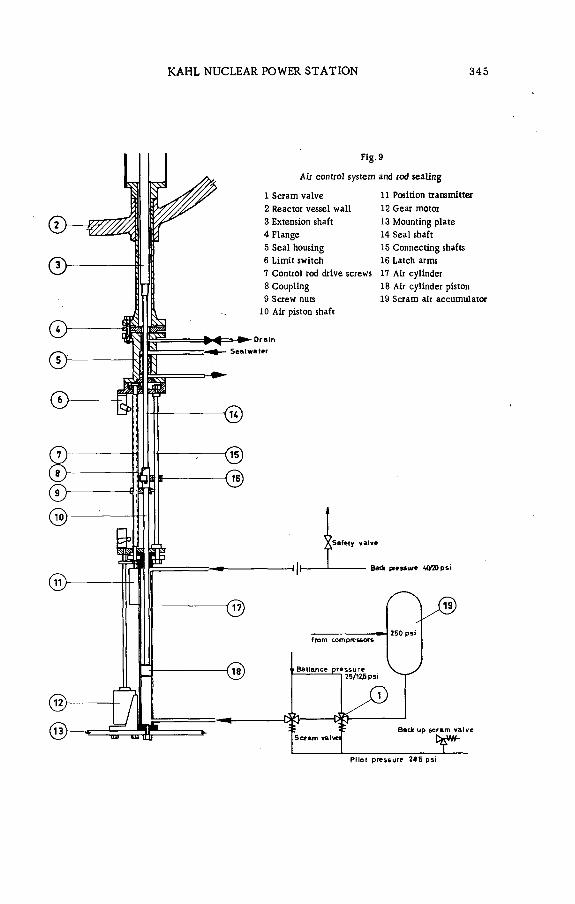
KAHL NUCLEAR POWER STATION 345
Air control system
1 Scram valve
2 Reactor vessel wall
3 Extension shaft
4 Flange
5 Seal housing
i Limit switch
7 Control rod drive screws
8 Coupling
9 Screw nuts
10 Air piston shaft
and rod sealing
11 Position transmitter
12 Gear motor
13 Mounting plate
14 Seal shaft
15 Connecting shafts
16 Latch arms
17 Air cylinder
18 Air cylinder piston
19 Scram air accumulator
P ilot p ressu re 20b p si

346 H.J- BRÜCHNER and A. WECKESSER
On the other hand, there is always the possibility of a grid problem
that could cause a generator trip, which in turn may initiate a reactor scram
for safety reasons. With the plant at full power, this would, of course, be
the most severe transient that the system could experience under normal
operating conditions. In case of a generator trip, the secondary steam to
the turbine is automatically by-passed to the main condenser. Fig.l shows
the principal steam and water circuits. It was of special interest to know
the relationship between the by-pass valve response, which requires about
8 s to actuate, and the entire plant response. Tests were conducted to show
this effect and also the effect on reactor stability. Fig.10 shows the result
of the load rejection test at 80% of full power. At time 0, the turbine control
valves are closing to avoid a turbine overspeed. The by-pass valves are
still closed. The secondary steam flow decreases very rapidly. The results
of this can be seen by the increase in secondary and primary steam pressure.
The increase in reactor pressure causes a decrease in void content in
the core and corresponding increase in flux which is a typical response for
a boiling-water reactor. In our case the flux increase was about 10%. Since
this flux increase was below the scram point, no scram resulted. The by
pass valves opened after about 8 s and the reactor stabilized itself without
control-rod adjustment.
Fig.l 1 shows the response of the system after a full power load rejection
with control-rod adjustment. In this particular test, the automatic reactor
pressure regulator operated two control rods to control the reactor pressure.
It should be noted that there was no flux increase, but that an immediate
flux decrease resulted. The system again attained equilibrium inaboutlOOs.
2. 5. Experience with the off-gas system
Fig.l2 shows the off-gas system. This is essentially the first experi
ence with this type of off-gas system in connection with boiling-water
reactors. The off-gas is collected through a baffle system on the primary
side of the steam generator. The off-gas contains steam, hydrogen, oxygen
and a small amount of nitrogen. If a fuel-element failure occurs, krypton
and. xenon appear as non-condensible gases. In the recombiner, H2 and 0 2
are recombined and condensed in the gas cooler and then returned to the
primary system. This condensate will take with it a certain amount of ac
tivity to the feed-water storage tank. The non-condensible gases flow from
the gas cooler through the vacuum pumps to the stack. The entire off-gas
system including the feed-water storage tank and feed-water pumps is under
vacuum. It has proved to be very difficult to completely seal such a large
system with so many possibilities for leakage. All leaks in the system
would yield an apparent increase in the off-gas flow. At this time the
leakage rate is between 100 and 200 1/h which is in excess of the designed
storage capacity. Unfortunately, the inleaking air is mixed with the non-
condensible activated off-gas from the primary circuit. However, the ac
tivity of the off-gas is so extremely low that the radiation level at the stack
is far below the upper licence limit. Because of this low level we are per
mitted a temporary exception to the licence requirement of two days' storage
time for all off-gas before discharge.
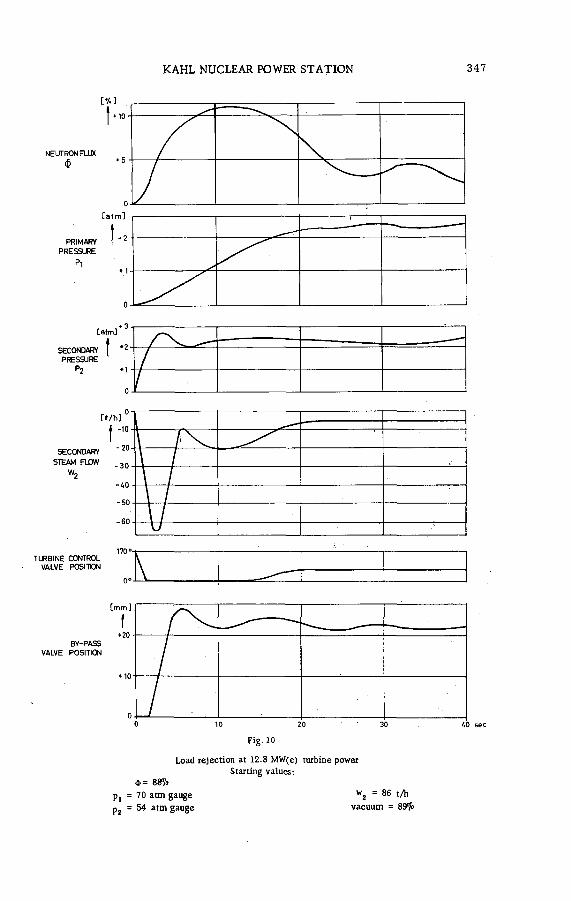
KAHL NUCLEAR POWER STATION 347
tatm]
SECONDARY I *2 PRESSURE
P2 *]
SECONDARY STHAM FLOW
Wo
TURBINE CONTROL VALVE POSITION
BY-PASS VALVE POSITION
Load rejection at 12.8 MW(e) turbine power
Starting values:
Ф = 88
Pj = 70 atm gauge
p2 = 54 atm gauge vacuum =
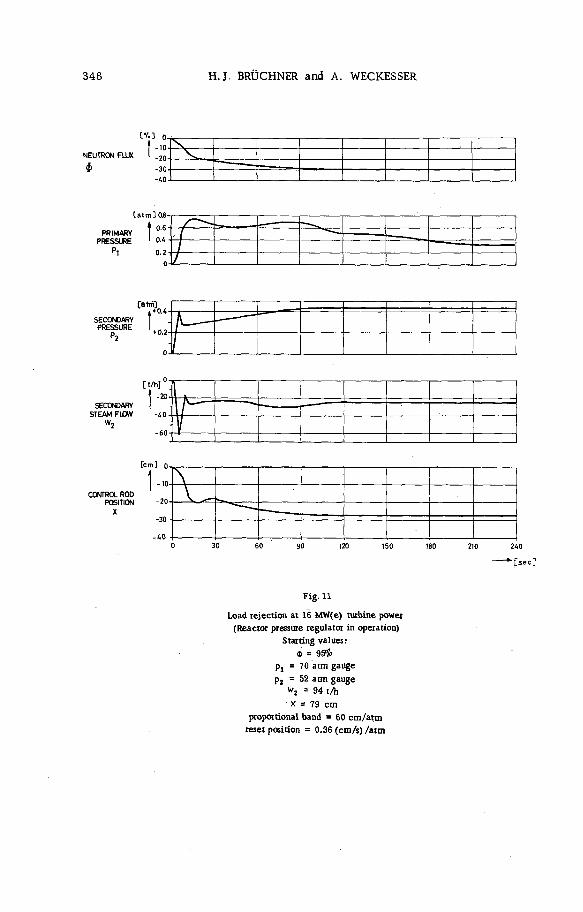
348 H.J. BRÜCHNER and A. WECKESSER
CONTROL ROO POSITION
X
" [ s e c ]
Fig.11
Load rejection at 16 MW(e) turbine power
(Reactor pressure regulator in operation)
Starting values:
Ф =
Pj = 70 atm gauge
p2 = 52 atm gauge
= 94 t/h
x = 79 cm
proportional band = 60 cm/atm
reset position = 0.36 (cm/s) /atm

KAHL NUCLEAR POWER STATION 349
Off - gas cooler
15-MW(e) Kahl Nuclear Power Station
Off-gas system
2. 6. Environmental release of activity
The licensing authorities have postulated narrow limits for the environ
mental release of activity from the plant. So, an amount of air activity of
8 c/h at normal weather conditions and 400 m c/h at inversion conditions
may be discharged from the stack after a delay time of two days. The off-
gas activity at the outlet of the stack presently amounts to 3 to 8 mc/h, i.e.
l%o of the upper permissible limit. Hence, it is almost impractical to prove
an influence of the discharged air on the environment. Fig.13 shows the
environmental airborne activity measured for 1961 and 1962. It can be seen
that certain atom-bomb tests in fall 1961 caused an increase of theactivity
of the environmental air by a factor of about 400. Under these circumstances
it happened for several times that the activity of the outlet air, after passing
through filters, was much lower than that of the intake air.
The same situation holds for the environmental activity release to the
Main River. The accumulated amount of water activity can be deduced from
Fig.14. The licence permits an activity release of 0.6 me/week. It can
be seen that activity release has kept well below this upper limit.
2. 7. Radiation survey
Fig.15 shows the radiation levels as measured at the different floors
in the reactor building. Two numbers are given: the first giving the total
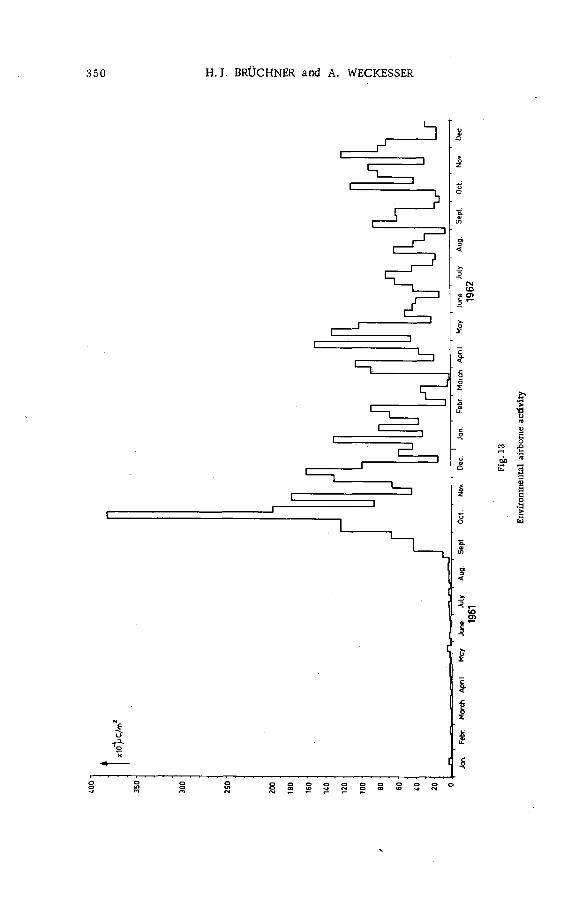
x10
C/m
350 H.J- BRÜCHNER and A. WECKESSER
Fig
.13
Envir
onm
enta
l ai
rbor
ne
acti
vit
y

KAHL NUCLEAR POWER STATION 351
1962
Fig. 14
Accumulated release of activity
to Main River in 1962
radiation, the second in parentheses the gamma fraction. As can be seen,
the neutron radiation, consisting of fast neutrons to 90%, predominates.
At normal operation no personnel is in the reactor building because the entire
plant is controlled from the main control room. For occasional inspections
the staircases outside the biological shielding are used. Along this path,
the radiation level is below 10 mrem/h.
2. 8. Conclusions from the perform ance of the plant
The following conclusions can be drawn from the first two years of
operating experience at the Kahl Nuclear Power Station. At no time was
the safety of both the plant and the environment at stake. No instabilities
were observed in the course of the various operating conditions tested. The
plant can be operated satisfactorily by normally trained personnel. This
very favourable operating experience has contributed considerably to the
positive decision recently taken by R W E and Bayernwerk to order a
250-MW(e) dual-cycle boiling-water reactor from the same group of com
panies that built the Kahl Plant. This first full-size nuclear power
station in Germany is already under construction.
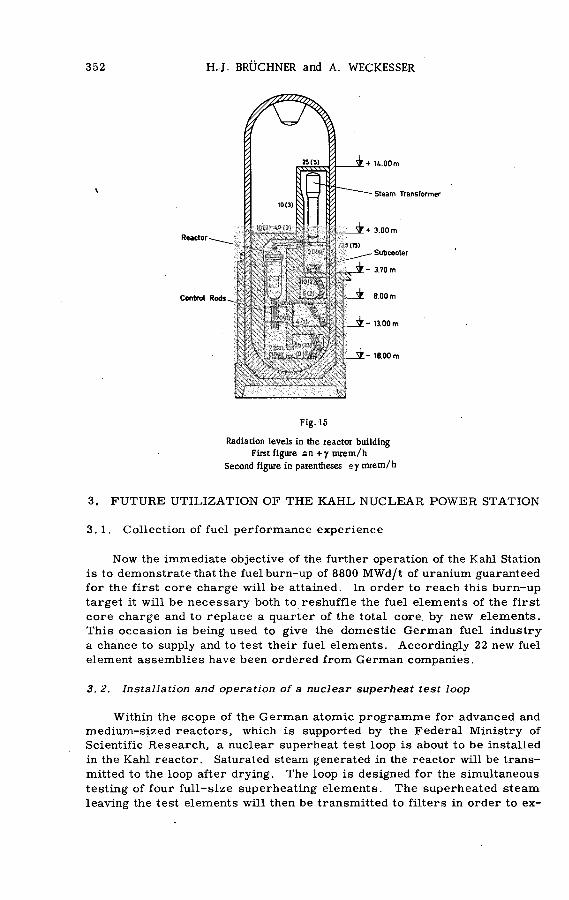
352 H. J. BRÜCHNER and A. WECKESSER
>
Reactor
Control Rods
_ _ Í - 13.00 m
__ Í - 18.00 m
Ы____________
Fig.15
Radiation levels in the reactor building
First figure an +y mrem/h
Second figure in parentheses mretn/h
3. FU TU R E UTILIZATION OF TH E K A H L N U C L E A R P O W E R STATION
3.1. Collection of fuel performance experience
Now the immediate objective of the further operation of the Kahl Station
is to demonstrate that the fuel burn-up of 8800 MWd/t of uranium guaranteed
for the first core charge will be attained. In order to reach this burn-up
target it will be necessary both to reshuffle the fuel elements of the first
core charge and to replace a quarter of the total core, by new elements.
This occasion is being used to give the domestic German fuel industry
a chance to supply and to test their fuel elements. Accordingly 22 new fuel
element assemblies have been ordered from German companies.
3. 2. Installation and operation of a nuclear superheat test loop
Within the scope of the German atomic programme for advanced and
medium-sized reactors, which is supported by the Federal Ministry of
Scientific Research, a nuclear superheat test loop is about to be installed
in the Kahl reactor. Saturated steam generated in the reactor will be trans
mitted to the loop after drying. The loop is designed for the simultaneous
testing of four full-size superheating elements. The superheated steam
leaving the test elements will then be transmitted to filters in order to ex
. Subcooler
3.70 m
_ ± 8.00 m

KAHL NUCLEAR TOWER STATION 353
tract possible solid impurities present. Thereafter the superheated steam
will pass a ’measuring section and a throttle valve before entering a heat
exchanger where it will be condensed. The condensate will finally be re
turned to the reactor pressure vessel by a booster pump.
The power extracted from the loop amounts to less than 10% of the total
rated thermal reactor output. This means that the reactor will continue to
operate at full power, while the loop tests will be run. The steam flow rate is expected to be 2 t/h each for two test elements and 9 t/h each for the
other two elements. Successful results of the preceeding series of tests
with single rods and tubes provided, eventually steam temperatures of about
500°C at about 70 atm should be attained.
The operation of the nuclear superheating loop is to commence towards
the end of this year. The results will form a substantial asset for the con
struction of an integral nuclear superheating prototype reactor. From this
it becomes manifest that the Kahl Nuclear Power Station has not only pro
vided valuable experience in the construction and operation of a boiling-
water reactor, but that it'is now rendering an important contribution to the
further development of this reactor type.
R E F E R E N C E S
[1] BRÜCHNER, H.J., Small and Medium Power Reactors IAEA, Vienna (1961) 37.
[2] Series of articles about Kahl, Atomwirtschaft VI 1 (1961) 25.
[3] BRÜCHNER, H J. , Nucl. Pwr 6 59 (1961) 67.
[‘4] KÜHNEL, R , Nucl.Engng 6 57 (1961) 56.
[5] WECKESSER, A ., Nuclear Congress, New York (1962) Paper No. 6.
[6] WECKESSER, A. , Z. Ver, dtsch Ing. 104 25 (1962) 1265.
[7]. KÜHNEL, R. and MISENTA, R. , Nucl. Engng 7 77 (1962) 407.
D I S C U S S I O N
J. ST O LZ : Figure 5 in your paper shows the net utilization as being
often higher than the availability coefficient, for example during December
1962. What is the explanation of this apparent contradiction?
H .J . BRUCHNER: This is not a contradiction but a matter of definition.
In December 1962, for instance, where we have shown a net utilization of
100% and a plant availability of 98.8%, the plant was operated at full power
for the whole time that it was available and it was available for 98.8% of the
month. In other words, the product of net utilization and plant availability
is the "plant load factor".
G. ZORZOLI: Which techniques did you use for measuring the flow and
neutron flux distribution? And when you speak of good agreement between
calculated and experimental values what exactly do you mean?
H .J . BRÜ CHNER : The techniques used for flow and neutron flux
measurements at Kahl are described in detail in an article by Kiihnel and
Misenta.* This article also gives some indication of the agreement be
tween measurements and calculations.
* Reference [7] to H.J. Briichner and A. Weckesser: "The first two years of operating experience of the
Kahl Nuclear Power Station", these Proceedings.
354 H.J- BRÜCHNER and A. WECKESSER
M . POTEMANS: You said that electrically-operated valves are placed
in the extraction lines to prevent the turbine overspeeding. What is the re
sponse time of these valves and at what turbine speed does tripping occur?
A. W ECKESSER : The response times of the valves are less than one
second, and the trip speed of the turbine is 3250 rpm.
G .B . SCURICINI: What are the differences between the Kahl and KRB
plants? Will the control rod driving system at KRB be the same as at Kahl,
or do you plan to use a hydraulic drive as at Dresden and SENN?
H .J . BRÜCHNER: Concerning the differences between the KRB plant
at present under construction at Grundremmingen and the Kahl station, the
following information may be of interest: The Kahl station has an indirect-
cycle boiling-water reactor and the Grundremmingen plant has a dual-cycle
boiling-water reactor. Whereas, in the Kahl station, the steam-water separ
ation devices are in the steam transformer, at Grundremmingen they will
be in the reactor. There are further differences in the design of the core.
The KRB core will consist of 368 fuel elements containing a total of 51 t
of uranium with an average U235 enrichment of 2.5%. The specific re
actor rating therefore amounts to 15.7 kW/kg of uranium compared to only
10.9 kW/kg of uranium at Kahl. Since we have eliminated the separate steam
drum as used in the Dresden and SENN plants and since we have devised a
more compact component arrangement in the reactor containment, the volume
of this containment can now be reduced from 110 m3/MW(t) at Kahl to
44m 3/M W (t) at Grundremmingen.
H. KLEIJN: What is the minimum reactor period allowed at Kahl during
changes from low to high power?
A . WECKESSER: During theload-drop tests, no period readings were
taken. Normally the period "scram" point is set at 10 s.
PERFORMANCE CHARACTERISTICS OF THE EXPERIMENTAL BOILING WATER REACTOR FROM
0 TO 100 MW(t)A. ISKENDERIAN, W .C . LIPINSKI, M. PETRICK AND E. A. WIMUNC,
ARGONNE NATIONAL LABORATORY, ARGONNE, ILL
Abstract — Résumé — Аннотация — Resumen
PERFORMANCE CHARACTERISTICS OF EBWR FROM 0-100 MW. On 25 May 1962 the Argonne National
Laboratory received approval from the USAEC to operate EBWR to a power level of 100 MW. Administrative
approval to proceed was granted by the International Atomic Energy Agency safeguards system on 11 July 1962.
On 15 November 1962 an operating power level of 100 MW was reached.
The EBWR 100 M W Reactor Experimental Program was completed on 6 December 1962. One of the
major goals of this project was to instrument the reactor extensively in order to obtain data and information
on the performance characteristics of this reactor type. The programme was the first of its kind to be under
taken and the first to be completed. Many new instrumentation techniques had to be developed for obtaining
the desired data. The goal was successfully achieved, and many new data were obtained on the performance
characteristics of a natural circulation boiling-water reactor.
The data derived from this programme provided information on recirculation flow rates, vapour liquid
separation limits (steam carryunder in the downcomer and liquid carryover in the effluent steam), subcooling,
location oi the true interface in the reactor and its relation to the water column level, steam collapse rates
in the downcomer, void coefficients, H 3B O 3 worth, temperature coefficients, use of boron strips for control
purposes, use of spike elements, transfer functions, noise analysis, some flux measurements, stability, etc.
In addition, data were obtained on the behaviour and integrity of certain reactor components and systems such
as boric acid control, radiation levels, corrosion product distribution, equipment malfunctions, fuel and
control rods, etc.
EBWR*s performance characteristics were governed almost exclusively by steam carryunder in the down
comer, liquid carryover in the effluent steam, and indirectly by the location of the true interface in the vessel.
Carryunder was the dominating factor in the lower power range. Above 65 M W the reactor’s performance
characteristics changed radically. The steam disengaging velocity reached 1 ft/s and the steam dome height
decreased to 3 ft. Under these conditions liquid carryover occurred and increased rapidly with increasing
power. The reactor no longer behaved as a direct-cycle boiling-water reactor; in a sense it functioned as a
natnral-circulation dual-cycle reactor.
PERFORMANCES DE L*EBWR DE 0 A 100 MW. Le 25 mai 1962, le Laboratoire national d'Argonne a
reçu l'autorisation de la Commission de l'énergie atomique des Etats-Unis (CEA-EU) d'exploiter le réacteur
expérimental à eau bouillante (EBWR) jusqu'à une puissance de 100 MW. Dans le cadre de l'administration
du système de garanties, l'Agence internationale de l'énergie atomique a autorisé à aller de l'avant le
11 juillet 1962. Le 5 novembre 1962, on a atteint la puissance de 100 MW.
Le programme expérimental, réalisé avec le réacteur EBWR de 100 MW, a été achevé le 6décembre 1962.
L'un des principaux objectifs du projet était de pourvoir le réacteur de tous les instruments de mesures néces
saires pour obtenir des données et des renseignements sur les performances de cette filière. C'est le premier
programme de ce genre qui ait été entrepris. On a mis au point plusieurs techniques d'instrumentation nouvelles
pour obtenir les données voulues. Cet objectif a été atteint avec le plus grand succès, et on a pu recueillir
beaucoup de données nouvelles sur les performances d'un réacteur à eau bouillante à circulation naturelle.
Ce programme a permis d'obtenir des indications sur les points suivants: débit de recirculation; limite de
séparation de la vapeur et du liquide (entraînement de vapeur dans le tube d'eau et de liquide par la vapeur);
sous-refroidissement; localisation de l'interface vraie dans le réacteur et son influence sur le niveau de la
colonne d'eau; taux de condensation de la vapeur dans le tube d'eau; coefficients cavitaires; antiréactivité de
l'acide borique; coefficients de température; emploi de bandes de bore à des fins de contrôle; emploi d'éléments
enrichis; fonctions de transfert; analyse des bruits; certaines mesures de flux; stabilité, etc. En outre, on a pu
savoir comment se comportaient certaines pièces et parties constitutives du réacteur et si elles restaient intactes,
355
356 A. ISKENDERIAN et al.
notamment le système de contrôle de l'acide borique, le niveau des rayonnements, la distribution des produits
de la corrosion, les vices de fonctionnement du matériel; les barreaux de combustible et les barres de
commande, etc.
Les performances de l'EBWR dépendent presque exclusivement de l'entraînement de la vapeur dans le
tube d’eau, de Tentraftiement du liquide par la vapeur qui se dégage, et, indirectement, de remplacement
de l'interface vraie dans le caisson. C'est l'entrafhement de la vapeur dans le tube d'eau qui domine pour
les puissances inférieures. Au-dessus de 65 MW les performances du réacteur sont radicalement modifiées. La
vitesse de dégagement de la vapeur atteint 33 cm/s et la hauteur du dôme de vapeur descend à 1 m. Dans
ces conditions, il se produit un entraînement de liquide par la vapeur qui augmente rapidement lorsqu'on
augmente la puissance. Le réacteur cesse alors de se comporter comme un réacteur à eau bouillante à cycle
direct; en un sens, il fonctionne comme un réacteur à deux cycles, en circulation naturelle.
РАБОЧАЯ ХАРАКТЕРИСТИКА ЭКСПЕРИМЕНТАЛЬНОГО КИПЯЩЕГО РЕАКТОРА EBWR ПРИ МОЩНОСТИ 0 - 100 МГВТ.
25 мая 1962 года Аргоннская национальная лаборатория получила разрешение КАЭ США на эксплуатацию
реактора EBWR на мощности 100 мгвт. Административное разрешение на эксплуатацию реактора было
предоставлено системой гарантий .Международного агентства по атомной энергии 11 июля 1961 года.
15 ноября 1962 года был достигнут уровень мощности в 100 мгвт.
6 декабря 1962 года экспериментальная программа была закончена. Одной из основных целей
ее была тщательная проверка реактора для получения данных и информации рабочей характеристики
этого типа реактора. Эта программа была первой программой такого рода и первой выполненной про
граммой. Для получения нужных данных необходимо было разработать многие новые приборы. Цель
была достигнута, получено много новых данных о рабочей характеристике кипящего реактора с есте
ственной циркуляцией.
Так,например, получена информация относительно скорости потока циркуляции в замкнутом цикле,
пределов сепарации жидкого пара (выделение пара в осадок в спускной трубе и унос жидкости эфлу-
ентом пара), недогрева, локализации действительной поверхности раздела в реакторе и ее связи
с уровнем водной колонки, скорости разрушения пара в спускной трубе, пустотных коэффициентов,
реактивной способности Н9В0Э, температурных коэффициентов, использования стержней из бора для
.«целей контроля, использования свежих топливных элементов, передаточных функций,анализа шума, не
которых измерений потока, стабильности и т .д . Кроме того, были получены данные о поведении и
целостности некоторых реакторных компонентов и систем, таких, как борнокислая контрольная реак
ция, уровни радиации, распределение продуктов коррозии, выход из строя оборудования, топливо и
регулирующие стержни и т .д .
Рабочая характеристика реактора EBWR определялась почти исключительно по выделению пара
в осадок в спускной трубе, по уносу жидкости эфлуентом пара и косвенно, путем локализации дей
ствительной поверхности раздела в корпусе реактора. Выделение пара в осадок было доминирующим
фактором в диапазоне более низких энергий. При мощности свыше 65 мгвт рабочая характеристика
реактора резко менялась. Скорость отделения пара достигла 33 см/сек и высота парового простран
ства уменьшилась до 1 м. При таких условиях происходил унос жидкости, который быстро увеличи
вался с увеличением мощности. Реактор больше не вел себя как кипящий реактор с прямым циклом;
в некотором роде он вел себя как реактор с двойным циклом естественной циркуляции.
RENDIMIENTO DEL REACTOR EXPERIMENTAL DE AGUA HIRVIENTE (EBWR) ENTRE 0 Y 100 MW. El
25 de mayo de 1962, el Laboratorio Nacional de Argonne fue autorizado por la USAEC a poner en funciona
miento el EBWR con una potencia de 100 MW. En el marco de la administración de su sistema de salvaguardias
el Organismo Internacional de Energía Atómica dio su aprobación el 11 de julio de 1962. El 15 de noviembre
del mismo año, el reactor alcanzó la potencia de 100 MW.
. El programa experimental ejecutado con el reactor EBWR de 100 MW quedó completado el 6 de diciembre
de 1962. Uno de los principales propósitos del mismo consistía en dotar al reactor de los instrumentos necesarios
para obtener datos e informaciones sobre el rendimiento de este tipo de reactor. Constituye el primer programa
de este género que se haya llevado a la práctica. Para reunir los datos buscados, fue preciso idear muchas
técnicas de instrumentación nuevas. Se logró el propósito perseguido y se obtuvieron copiosos datos nuevos
acerca del rendimiento de un reactor de agua hirviente con circulación natural.
Este programa permitió obtener indicaciones sobre los siguientes puntos: caudales de recirculación, límites
de separación entre vapor y líquido (arrastre de vapor en el tubo de descenso y arrastre de líquido por el vapor
efluente), subenfriamiento, posición de la interfase real en el reactor y su relación con el nivel de la columna
EXPERIMENTAL BOILING WATER REACTOR 357
de agua, coeficientes de condensación del vapor en el tubo de descenso, coeficientes de cavitación, antirreac-
tividad del H3BO3, coeficientes de temperatura, utilización de cintas de boro para la regulación, empleo de
elementos combustibles enriquecidos, funciones de transferencia, análisis de los ruidos, algunas mediciones
de flujos, estabilidad, etc. Además se obtuvieron datos sobre el comportamiento y el estado de ciertas
partes y circuitos del reactor, tales como el sistema de control de ácido bórico, los niveles de radiación,
la distribución de los productos de corrosión, los defectos funcionales de ciertos equipos, las barras de com
bustible y de control, etc.
Se comprobó que el rendimiento del EBWR depende casi exclusivamente del arrastre de vapor en el
tubo de descenso, del arrastre de liquido por el vapor efluente e, indirectamente, de la posición de la interfase
real en el recipiente. En el intervalo de bajas potencias, el factor preponderante es el arrastre de vapor en
el tubo de descenso. Al superar los 65 M W , el rendimiento del reactor cambió radicalmente. La velocidad
de desprendimiento del vapor alcanzó a 33 cm/s, y la altura de la cúpula de vapor se redujo a i m . En
estas condiciones se registró un arrastre de liquido que se intensificó rápidamente al aumentar la potencia
desarrollada. El reactor deja entonces de comportarse como reactor de agua hirviente de ciclo directo; en
cierto modo, funciona como reactor de ciclo doble y circulación natural.
1. INTRODUCTION
The Experimental Boiling Water Reactor (EBWR) was originally con
structed to demonstrate the feasibility of a direct-cycle, natural circulation,
boiling-water reactor integrated power plant. The reactor was designed
to produce 20 000 kW of heat in the form of 600-lb/in2 gauge saturated steam
which was fed directly to a turbo-generator, generating about 5000 kW of
electricity. This power level was considered as a minimum value for pro
ducing useful information which could be extrapolated and used in the design
of large, central-station power plants. The reactor achieved criticality
in December 1956 and began full-power operation at 20 MW(t) on 29 December 1956.
Subsequent experiments at power levels ranging from 20 to 40 MW(t)
indicated that stable operation at powers as high as 66 MW(t) was possible
with the initial 4-ft diam. core. This was affirmed in 1958 by the short
term operation of the plant a:t 61.7 MW(t). Further power increase at this
time was precluded by the feed-Water pumps which were operating at maxi
mum capacity.
A detailed study of EBW R stability was made by taking a series of trans
fer function measurements, relating flux or power level to reactivity input.
Data at various power levels, steam pressures and control-rod positions
were accumulated, analysed, and extrapolated to predict reactor perfor
mance at higher power levels. The results of this study were the subject
of a paper presented at the 1958 Geneva Conference [1] .
Subsequent analyses and projection of these data to a 5-ft diam. core
indicated that with some modification of the core structure and pressure
vessel internals, and with additional heat-removal equipment, EBW R could
operate at or near 100 MW(t). In July 1959 the reactor plant was shut down
preparatory to the onset of proposed modifications.
The modification of E B W R represented another successful pioneering
endeavour at the birthplace of nuclear reactors. In addition to the system
changes and additions that were effected, the core was extensively instru
mented. This entailed development of unique instrumentation techniques
to ensure qualitative data on the performance characteristics of the reactor
at elevated power levels.
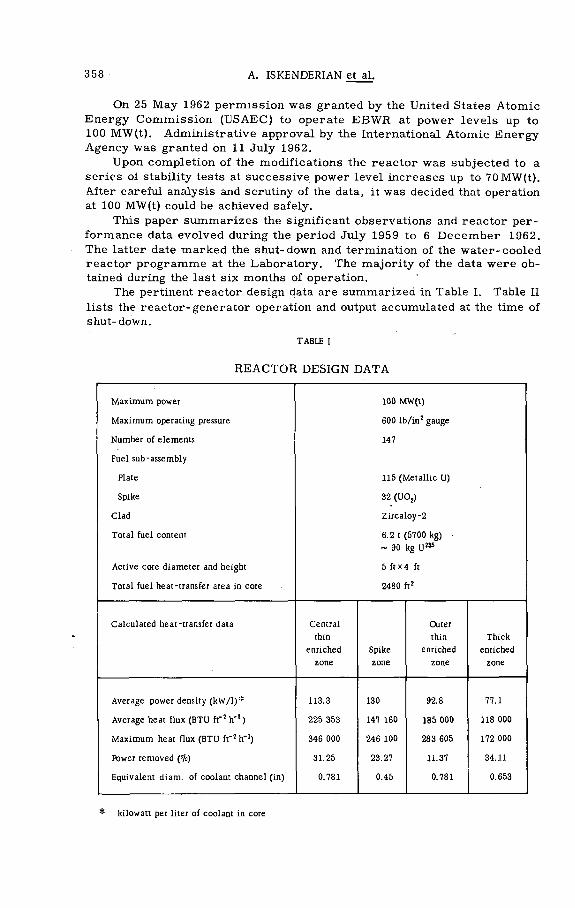
358 A. ISKENDERIAN et al.
On 25 May 1962 permission was granted by the United States Atomic
Energy Commission (USAEC) to operate E B W R at power levels up to
100 MW(t). Administrative approval by the International Atomic Energy
Agency was granted on 11 July 1962.
Upon completion of the modifications the reactor was subjected to a
series oi stability tests at successive power level increases up to 70MW(t).
After careful analysis and scrutiny of the data, it was decided that operation
at 100 MW(t) could be achieved safely.
This paper summarizes the significant observations and reactor per
formance data evolved during the period July 1959 to 6 December 1962.
The latter date marked the shut-down and termination of the water-cooled
reactor programme at the Laboratory. The majority of the data were ob
tained during the last six months of operation.
The pertinent reactor design data are summarized in Table I. Table II
lists the reactor-generator operation and output accumulated at the time of
shut-down.
TABLE I
R EACTOR DESIGN DATA
Maximum power
Maximum operating pressure
Number of elements
Fuel sub-assembly
Plate
Spike
Clad
Total fuel content
Active core diameter and height
Total fuel heat-transfer area in core
100 MW(t)
600 lb/in2 gauge
147
115 (Metallic U)
32 (U02)
Zircaloy -2
6.2 t (5700 kg)
~ 90 kg U235
5 ftx4 ft
2480 ft2
Calculated heat-transfer data Central Outer
thin thin Thick
enriched Spike enriched enriched
zone zone zone zone
Average power density (kW/1)* 113.3 130 92.8 77.1
Average heat flux (BTU ft"*h'1) 225 353 147 160 185 000 118 000
Maximum heat flux (BTU ft"2 h-1) 346 000 246 100 28 3 605 172 000
Power removed (%) 31.25 23.27 11.37 34.11
Equivalent diam. of coolant channel (in) 0.781 0.45 0.781 0.653
* kilowatt per liter of coolant in core
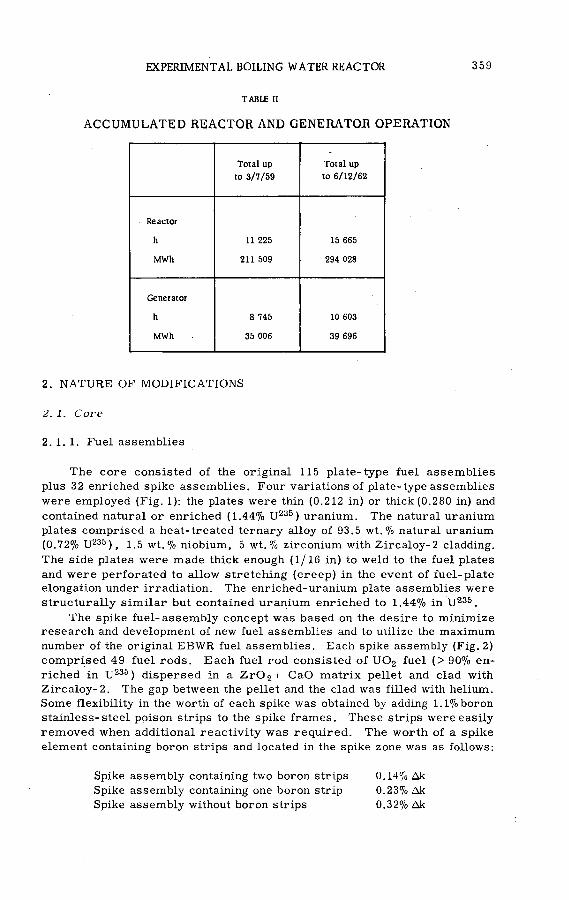
TABLE II
ACCUMULATED REACTOR AND GENERATOR OPERATION
EXPERIMENTAL BOILING WATER REACTOR 359
Total up
to 3/7/59
Total up
to 6/12/62
Reactor
h 11 225 15 665
MWh 211 509 294 028
Generator
h 8 745 10 603
MWh 35 006 39 696
2. NATURE OF MODIFICATIONS
2. 1. Core
2. 1. 1. Fuel assemblies
The core consisted of the original 115 plate-type fuel assemblies
plus 32 enriched spike assemblies. Four variations of plate-type assemblies
were employed (Fig. 1): the plates were thin (0.212 in) or thick (0.280 in) and
contained natural or enriched (1.44% U235) uranium. The natural uranium
plates comprised a heat-treated ternary alloy of 93.5 wt.% natural uranium
(0.72% U235), 1.5 wt.% niobium, 5 wt.% zirconium with Zircaloy-2 cladding.
The side plates were made thick enough (1/16 in) to weld to the fuel plates
and were perforated to allow stretching (creep) in the event of fuel-plate
elongation under irradiation. The enriched-uranium plate assemblies were
structurally similar but contained uranium enriched to 1.44% in U 23S.
The spike fuel-assembly concept was based on the desire to minimize research and development of new fuel assemblies and to utilize the maximum
number of the original EBW R fuel assemblies. Each spike assembly (Fig. 2)
comprised 49 fuel rods. Each fuel rod consisted of U 0 2 fuel (> 90% en
riched in U235) dispersed in a Z r 0 2+ CaO matrix pellet and clad with
Zircaloy-2. The gap between the pellet and the clad was filled with helium.
Some flexibility in the worth of each spike was obtained by adding 1.1% boron
stainless-steel poison strips to the spike frames. These strips were easily
removed when additional reactivity was required. The worth of a spike
element containing boron strips and located in the spike zone was as follows:
Spike assembly containing two boron strips 0.14% Дк
Spike assembly containing one boron strip 0.23% Дк
Spike assembly without boron strips 0.32% Дк

360 A. ISKENDERIAN et al.
Fig. i
EBWR plate-type fuel assembly
A stepwise approach in loading the reactor to the final configuration re
quired a number of core changes. These included fuel rearrangement, fuel
additions and the removal of some burnable poison strips from the spike
assemblies, consistent with the established loading criteria. These criteria
were:
(1) The system must always have the capacity to be made subcritical at
any time by use of only eight of the nine control rods and boric acid;
and

' GO
’Д*£дгT4 l В°ШЫС
Wa t Er
% 4 cТоц
= ВC*i u.
о «а 3
с °*> « J
-{=*■
г
á"
г*£
Í?¿5
Ж L_3 t

362 A. ISKENDERIAN et al.
NH
NK
EH
EH
EH
EH
EH
EH
EH
EH
NH
EH
EH
EH
EH
EH
ET
ET
ET
ET
ET
EH
EH EH
EH
EH
ET
ET
ET
ET
ET
ET
ET
EH
EH
S T A IN L E S S -S T E E L - BORON ST R IP
EH
EH
ET
ET
EH
ET
ET
ET
ET
ET
EH
NH
EH
ET
ET
ET
ET
ET
ET
ET
ET
EH
NH
NT
EH
ET
ET
ET
ET
ET
ET
ET
ET
EH
NH
EH
ET
ET
ET
ET
ET
EH
ET
ET
EH
EH
EH
EH
ET
ET
ET
ET
ET
ET
ET
EH
EH
EH EH
EH
ET
ET
ET
ET
ET
EH
EH
EH
EH
EH
EH
EH
EH
EH
EH
EH
EH
EH
NH
N*
NH
Fig.3
Final EBWR lOO-MW(t) core loading
52-EH = Enriched heavy
54-ET = Enriched thin
8 -NH = Natural heavy
1-NT = Natural thin
32-S = Spike
1-N* = Source
(2) No loading was to be installed which would be critical with all nine rods
fully inserted and with no boric acid in the reactor core.
Fig. 3 shows the final arrangement of fuel assemblies in the core for
operation at 100 M W .
2 .1 .2 . Control
(a) Control rods. Primary reactor control was effected by nine cross
shaped rods. Each rod was 60-in long, 10-in wide, 0.25-in thick and fabri
cated from Type 304 stainless steel containing 2 wt.% boron. The 10-in
wide portion of the control-rod follower was made of Zircaloy-2. These
rods were identical to the original set of rods placed in the EB W R in 1956.
The central control rod was replaced by a 4-ft long hafnium rod. This rod
was used in conjunction with an oscillator mechanism to obtain transfer
function data.

EXPERIMENTAL BOILING WATER REACTOR 363
(b) Soluble poison (boric acid). In addition to the nine control rods,
boric acid solution was used with the final core loading. This was done
to provide a sufficient range of reactivity control to ensure a clean, cold
shut-down margin and yet permit reaching a power level of 100 MW(t). The
final core loading required 1060 ppm of boric acid in the reactor water in
order to meet the 8-rod shut-down criteria. The reactor was also sub-
critical without boric acid and with all nine rods fully inserted. The void
со-efficient remained negative at all concentrations up to 2640 ppm, which
was the maximum range of interest. Each gram of boric acid per gal* of
reactor water (264 ppm) was sufficient to hold down about 1% p.
Boric acid having a concentration of 182 g/gal was stored in a 200-gal
tank. The solution could be pumped into the reactor feed-water line under
pressure, pumped into the condenser hotwell, or into the low-pressure boric-
acid spray ring located within the reactor vessel. Positive displacement
pumps were utilized and could be energized from the control room. The
maximum pumping rate was 2.8 gal/min of 182 g/gal solution. The reactor
vessel has a normal water inventory of about 4000 gal.
2. 2 . C o r e structure a n d p r e s s u r e v e s s e l internals
The following modifications were designed primarily to increase re
actor recirculation flow rates by approximately a factor of two in order
to minimize the steam volume fractions in the core and, hence, loss of
reactivity.
2.2. 1. Core riser
The new riser arrangement (see Fig. 4) basically consists of an addition
to the original system, which was essentially the control-rod guide super
structure. The total height is approximately 7.5 ft above the shroud. This
height was chosen as the maximum feasible for maintaining the steam-water
interface within a desired level range and for minimizing the liquid carry
over. The upper portion of the riser was necked down so that the increased down
comer area and resultant reduced water velocity would aid de-entrainment
of steam in the downcomer.In addition, a cylindrical shell was installed around the core to provide
a tight closure between the riser and1 the core shroud. These modifications
were intended to prevent any short circuiting of the fluid from the down
comer to peripheral riser sections and core due to static pressure differ
ences inherent in such systems.
2. 2. 2. Feed-water injection ring
The effectiveness of the riser was enhanced by installing a new feed-
Water injection ring just below the top of the riser. With this arrangement,
steam carried under in the downcomer would be mixed with the influent cold
feed water and quenching would be initiated rapidly.
US gallons throughout

364 A. ISKENDERIAN et al.
Fig.4
Modified reactor vessel and internals
2.2 .3 . Steam discharge system
The original steam discharge ring and 6-in outlet nozzle were removed
from the pressure vessel and the vessel penetration was enlarged to ac
commodate a 10-in discharge nozzle. The larger size outlet was necessary
because of the increased steam loads at the higher powers. At 100 M W , the
steam load is approximately 300 000 lb/h. The steam is collected from
the very top of the reactor vessel by a duct arrangement. The duct arrange-
EXPERIMENTAL BOILING WATER REACTOR 365
ment was installed to accommodate the high liquid levels brought about by
the addition of the taller riser.
2. 3. Auxiliary equipment
Additional equipment installed within the containment shell included
two feed-water filters, a de-aerator, sub-cooler, two feed-water pumps
and an instrument air compressor. A 16-ft long gauge board was installed
in the control room. A major portion of the equipment was located external
to the containment building (see Fig. 5).
2. 4. System H ow cycle
Fig. 5 is a simplified flow diagram of the 100 MW(t) reactor plant design.
The reactor was operated as a direct-cycle, boiling-water reactor cooled
and moderated by natural circulation of light water. Except for minor modi
fications, the 5 MW(t) turbo-generator plant and associated equipment was
operated in essentially the same manner as originally designed. The Re
boiler Plant was operated in parallel to handle the increased heat output.
Distribution of the thermal power output at 100 M W was as follows: 20 MW(t)
was utilized by the Turbine Plant, and the balance (up to 80 MW(t)) was ab
sorbed by the Reboiler Plant.
The Reboiler Plant is divided into primary, intermediate, and secondary
systems. The primary system is operated at a pressure of 560 lb/in2 gauge
saturated, the intermediate system at 350 lb/in2 gauge saturated and the
secondary system at 200 lb/in2 gauge. The secondary system operates
at the same pressure as the Laboratory steam system. An intermediate system was incorporated to preclude radioactive steam from entering the
Laboratory heating system. The Reboiler Plant can supply steam to the
Laboratory or dissipate the energy through air-cooled heat exchangers.
Details of the system and components are described by M A T O U S E K [2] .
A number of problems were encountered with new equipment during
start-up of the plant. The most predominant was maloperation of valves
of all types. For the most part, the difficulties experienced were attribu
table to poor quality-control inspection by the makers, or to improper in
stallation by the contractor.
Pumps and controls also presented some operational problems. For
example, the contractor had installed a pump cut-off switch at the same
level as the flash tank low-level alarm. This condition could have damaged
the large, intermediate feed-water pumps but fortunately was discovered
in time and rectified. All four sleeve bearings on both intermediate pumps
required reworking. Insufficient lubrication caused the bearings to exceed
normal operating temperatures. This situation was corrected by cutting
grooves in the Babbitt metal bearings to enhance oil lubrication of the pump
shafts. Pipe lines to the level controller, sight gauge and level alarm on
both primary reboilers were revised to prevent particulate matter from
plugging the lines and giving false indications.
After these and other equipment problems were corrected, plant per
formance was satisfactory. The modified plant was never subjected to shake-
down operation in advance of the experimental programme. As a result,

366 A. ISKENDERIAN et al.
EBWR
100-
MW
(t)
flow
dia
gram
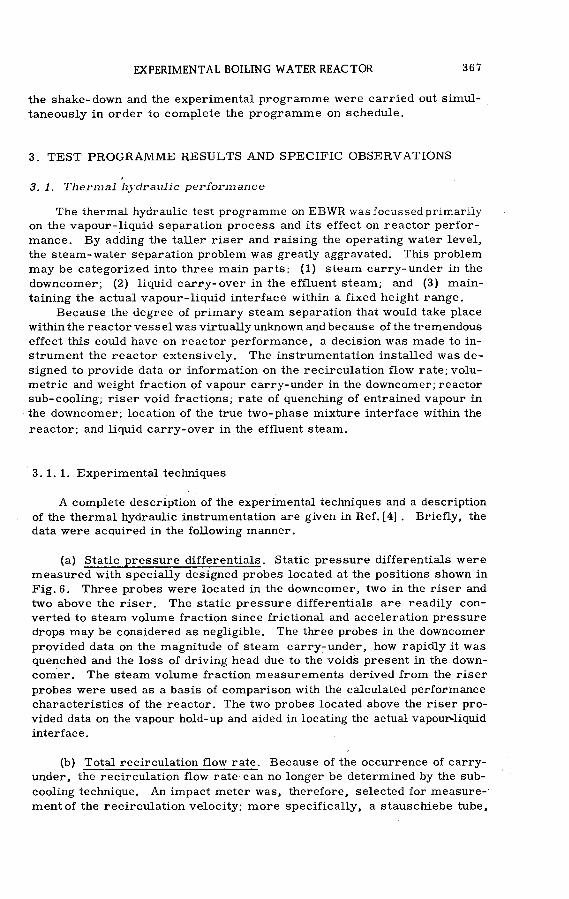
EXPERIMENTAL BOILING WATER REACTOR 367
the shake-down and the experimental programme were carried out simul
taneously in order to complete the programme on schedule.
3. TEST P R O G R A M M E RESU LTS AND SPECIFIC OBSER VATIONS
3. 1. Therm al hydraulic perform ance
The thermal hydraulic test programme on EBW R was focussed primarily
on the vapour-liquid separation process and its effect on reactor perfor
mance. By adding the taller riser and raising the operating water level,
the steam-water separation problem was greatly aggravated. This problem
may be categorized into three main parts: (1) steam carry-under in the
downcomer; (2) liquid carry-over in the effluent steam; and (3) main
taining the actual vapour-liquid interface within a fixed height range.
Because the degree of primary steam separation that would take place
within the reactor vessel was virtually unknown and because of the tremendous
effect this could have on reactor performance, a decision was made to in
strument the reactor extensively. The instrumentation installed was de
signed to provide data or information on the recirculation flow rate; volu
metric and weight fraction of vapour carry-under in the downcomer; reactor
sub-cooling; riser void fractions; rate of quenching of entrained vapour in
the downcomer; location of the true two-phase mixture interface within the
reactor; and liquid carry-over in the effluent steam.
3. 1. 1. Experimental techniques
A complete description of the experimental techniques and a description
of the thermal hydraulic instrumentation are given in Ref. [4] . Briefly, the
data were acquired in the following manner.
(a) Static pressure differentials. Static pressure differentials were
measured with specially designed probes located at the positions shown in
Fig. 6. Three probes were located in the downcomer, two in the riser and
two above the riser. The static pressure differentials are readily con
verted to steam volume fraction since frictional and acceleration pressure
drops may be considered as negligible. The three probes in the downcomer
provided data on the magnitude of steam carry-under, how rapidly it was
quenched and the loss of driving head due to the voids present in the down
comer. The steam volume fraction measurements derived from the riser
probes were used as a basis of comparison with the calculated performance
characteristics of the reactor. The two probes located above the riser pro
vided data on the vapour hold-up and aided in locating the actual vapour4iquid
interface.
(b) Total recirculation flow rate. Because of the occurrence of carry
under, the recirculation flow rate can no longer be determined by the sub
cooling technique. An impact meter was, therefore, selected for measure
ment of the recirculation velocity; more specifically, a stauschiebe tube,
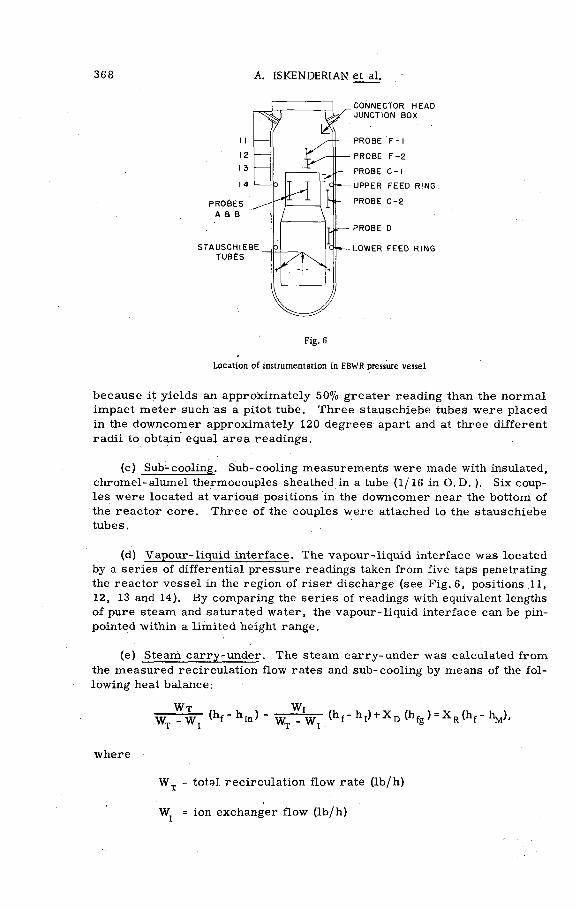
368 A. ISKENDERIAN et al.
Fig. 6 .
Location of instrumentation in EBWR pressure vessel
because it yields an approximately 50% greater reading than the normal
impact meter such as a pitot tube. Three stauschiebe tubes were placed
in the downcomer approximately 120 degrees apart and at three different
radii to obtain equal area readings.
(c) Sub-cooling. Sub-cooling measurements were made with insulated,
chromel-alumel thermocouples sheathed in a tube (1/ 16 in O. D. ). Six coup
les were located at various positions in the downcomer near the bottom of
the reactor core. Three of the couples were attached to the stauschiebe
tubes.
(d) Vapour-liquid interface. The vapour-liquid interface was located
by a series of differential pressure readings taken from five taps penetrating
the reactor vessel in the region of riser discharge (see Fig. 6, positions 11,
12, 13 and 14). By comparing the series of readings with equivalent lengths
of pure steam and saturated water, the vapour-liquid interface can be pin
pointed within a limited height range.
(e) Steam carry-under. The steam carry-under was calculated from
the measured recirculation flow rates and sub-cooling by means of the fol
lowing heat balance:
WT _ W j " ^in) ” Wj. - Wj ~ + (hfg ) = -R (kf “ I’m)»
where
W T = total recirculation flow rate (lb/h)
W ; = ion exchanger flow (lb/h)

EXPERIMENTAL BOILING WATER REACTOR 369
hf = enthalpy of saturated liquid (BTU/lb)
hin = enthalpy of inlet core coolant (BTU/lb)
h[ = enthalpy of ion exchanger effluent (BTU/lb)
X D = steam quality in downcomer
hfg = heat of vaporization
X R = steam quality in riser
hM = enthalpy of feed water (BTU/lb).
In the event that liquid carry-over occurs in the effluent steam, the
heat balance must be modified and the following equation results:
X d _ (WM/ W T)(hf-hM)- (hf-hin)
X R " (Q /W T) - (hf- h in)_
where:
Q = reactor power (BTU/h)
W M = feed water flow rate (lb/h)
W T = total recirculation flow rate (lb/h)
_ pounds steam in downcomer D' R pounds steam in riser
(f) Liquid carry-over. Data on the magnitude of the liquid carry-over
were obtained from-three sources. The principal and most accurate source
was a series of heal balances on the secondary and primary heat dissipation
systems. A heat balance on the secondary system establishes the true re
actor power. Knowing the true reactor power, the liquid carry-over can
then be computed by making a heat balance on the primary reactor system.
In the case of E B W R , the heat balance was made on the primary reboiler
which has as its heat source the reactor steam:
x = Wffi hfg .IE
W hPR fg.PR
where
W = intermediate heat exchanger flow rate (lb/h)IE
h = heat of vaporization, intermediate heat exchanger fg.IE
W = primary reboiler flow rate (lb/h)
h^ pR= heat of vaporization, primary reboiler.
24
370 A. ISKENDERIAN el al.
Liquid carry-over data were also obtained from the discrepancy between
the measured feed water and steam discharge flow rates. When liquid carry
over occurs, more feed water is injected, into the reactor than steam is
withdrawn. This discrepancy is actually a measure of the liquid carry
over rate. The major uncertainty in this data is the steam flow rate. With
large amounts of water in the steam, the measured steam rate is undoubtedly
in error. The magnitude of the error is unknown. However, the carry-over
data obtained in this manner check well with values obtained by the heat
balance method.
The third method consisted of taking steam samples from sampling
probes located 6 in, 14^ in and 22} in below the steam discharge duct.
The samples were analysed for the sodium-24 content. The results were
compared with a sample of reactor water obtained from a sampling point
in the downcomer. These data were used to establish carry-over gradients
as a function of steam dome height. Extrapolation to the height of the steam
duct yields the actual liquid carry-over.
3. 1. 2. Discussion of results
A broad generalization of the results is as follows:
The reactor performance characteristics are governed directly by steam
carry-under in the downcomer, liquid carry-over in the effluent steam and,
indirectly, by the location of the true water-steam interface in the vessel.
The effect of steam carry-under and liquid carry-over on reactor per
formance is reflected in the core inlet sub-cooling, and hence, mean core
moderator density. As the magnitude of the steam carry-under increases,
the sub-cooling and moderator density decreases, since the mean steam
volume fraction increases. The effects are reversed in the case of liquid
carry-over. In order to maintain a constant liquid inventory, an excess of
cold feed water is injected into the reactor. This increases the reactor
sub-cooling and, hence, the reactivity. The excess water is expelled in
the effluent steam. The carry-over phenomenon radically alters the per
formance characteristics of the reactor. Under these conditions, it is not
a normal direct-cycle boiling-water reactor; in a sense, it becomes a na
tural circulation, dual-cycle reactor. The steam carry-under and liquid carry-over is very sensitive to the true two-phase mixture interface level
within the reactor vessel. As the interface is lowered, the carry-under
rises rapidly and the carry-over decreases. As the interface level is raised,
the effects are opposite: carry-under decreases and carry-over increases.
(a) Total reactor recirculation flow rates. Fig. 7 is a plot of the re
circulation flow rate as a function of power. The magnitude of the flow rate
in the lower power range is in agreement with earlier core analyses and
extrapolation from E B W R data. Analyses indicated a two-fold increase in
flow rate could be expected with the additional riser height. However, the
rate of increase of the recirculation velocity with power was not as large
as predicted. The lower rate of increase of flow is attributed to loss of
sub-cooling and, hence, increased frictional resistance in the core resulting
from steam carry-under in the downcomer. At power levels above 40 M W ,
the flow rates tend to level off and are affected slightly by the true water-
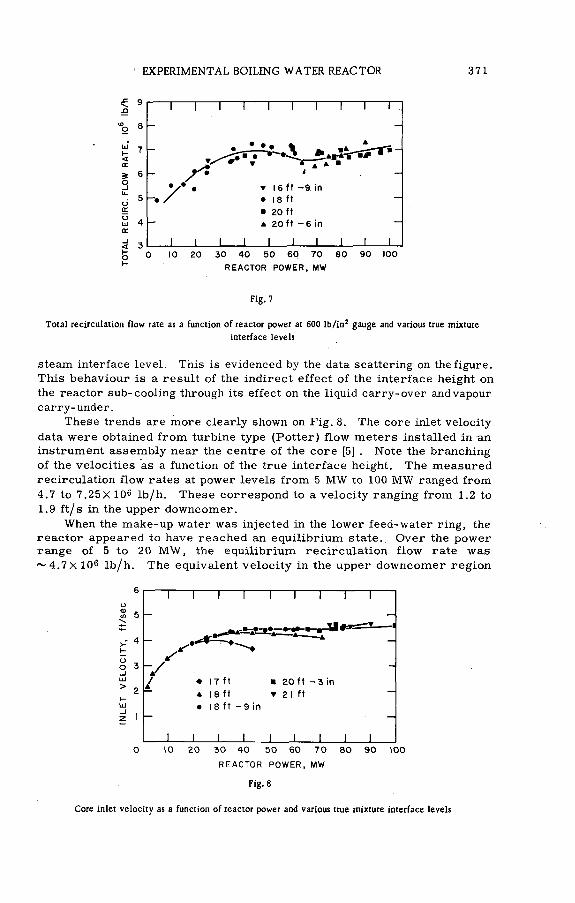
EXPERIMENTAL BOILING WATER REACTOR 371
Fig. 7
Total recirculation flow rate as a function of reactor power at 600 lb/in2 gauge and various true mixture
interface levels
steam interface level. This is evidenced by the data scattering on the figure.
This behaviour is a result of the indirect effect of the interface height on
the reactor sub-cooling through its effect on the liquid carry-over and vapour
carry-under.
These trends are more clearly shown on Fig. 8. The core inlet velocity
data were obtained from turbine type (Potter) flow meters installed in an
instrument assembly near the centre of the core [5] . Note the branching
of the velocities as a function of the true interface height. The measured
recirculation flow rates at power levels from 5 M W to 100 M W ranged from
4.7 to 7.25X 10⁶ lb/h. These correspond to a velocity ranging from 1.2 to
1.9 ft/s in the upper downcomer.
When the make-up water was injected in the lower feed-water ring, the
reactor appeared to have reached an equilibrium state. Over the power range of 5 to 20 M W , the equilibrium recirculation flow rate was
~ 4 .7 X 106 lb/h. The equivalent velocity in the upper downcomer region
оо
REACTOR POWER, MW
Fig. 8
Core inlet velocity as a function of reactor power and various true mixture interface levels

372 A. ISKENDERIAN et al.
is 1.2 ft/s. Under this mode of operation, the steam voids carried under
are not collapsed until they reach the lower feed-water ring located below
the riser. Therefore, the reactor stabilizes at a total flow just above the
critical value for the initiation of steam carry-under. When the critical
value is exceeded and steam carry-under commences, small amounts of
steam produce large steam volume fractions, since the relative velocity
of the two phases is essentially zero. This, in turn, immediately tends
to reduce the net driving head by decreasing the density in the downcomer
and equilibrium conditions are rapidly achieved. The measured equilibrium
downcomer velocity of 1.2 ft/s agrees very well with laboratory loop data
which shows the threshold velocity for the initiation of steam carry-under
at 600 lb/in2 to be 1.3 ft/s.
(b) Sub-cooling. Súb-cooling is, perhaps, the most important measur
able reactor parameter since it reflects the effects of carry-over and carry
under, and the variation of other parameters such as recirculation flow,
interface height, etc. The effect? of the vapour carry-under, liquid carry
over and true interface height are clearly evident in the sub-cooling "map"
R EA C TO R POWER, MW
Fig. 9
"Map" of reactor sub-cooling as a function of reactor power and various true mixture interface levels
of E B W R (Fig. 9). The inception of liquid carry-over can virtually be pin
pointed. The seriousness and magnitude of the vapour carry-under j.s readily
apparent. The magnitude of the liquid carry-over can also be easily de
duced. с
As evidenced by Fig. 9, reactor sub-cooling is extremely sensitive to
the true mixture interface height. The family of curves obtained as a func
tion of interface height merge at the low reactor powers. At an average
interface height of 16 ft 9 in, the sub-cooling increases slightly with power,
peaks at about 20 M W , and then diminishes rapidly toward zero at about
50 M W . This pattern of sub-cooling is a result of the steam carry-under
in the downcomer. For normal reactor operation, if no steam carry-under
is present, the sub-cooling increases continuously with power. At zero
sub-cooling, the carry-under is 34.6 wt.%.

EXPERIMENTAL BOILING WATER REACTOR 373
As the interface height is increased, the sub-cooling increases slightly
and the peak occurs at a higher power level. This behaviour is due to the
fact that the carry-under is a function of the interface height. For the same
power and flow, the carry-under decreases as the interface height increases,
therefore the sub-cooling is greater. The sub-cooling becomes, zero at
about 70 M W .
At an interface height of 20 ft, the trend with power is the same in the
lower range. However, at a power level of approximately 70 M W , the sub
cooling increases sharply. The height of the steam dome has decreased
to a point where, coupled with a superficial vapour velocity of 1.25 ft/s in
the steam dome, liquid carry-over occurs. As the power is increased be
yond this point, the vapour velocity also increases and the quantity of liquid
carried over rises rapidly. The identical trend is seen in the data taken
at an interface height of 20 ft 6 in. The differènce is that the sub-cooling
is again slightly higher and the point of carry-over is reached at a lower
power level. This is due to the fact that the steam dome height is smaller.
(c) Steam carry-under. The steam carry-under in the reactor was
calculated from a heat balance utilizing the measured sub-coolings and flow
rates, as discussed previously. The steam carry-under as a function of
power and interface height is plotted in Fig. 10. For these runs, the make-
REACTOR POWER, MW
Fig. 10
Steam carry-under as a function of reactor power and true mixture interface levels
up water was injected in the upper feed-water ring. The quantity X n/X R on
the ordinate is equivalent to the fraction weight per cent of carry-under.
The carry-under is substantial, ~20%, at the lower powers. This is due to
the fact that the recirculation flow rates are of such magnitude that the thres
hold velocity for initiation of carry-under is exceeded even at the very low
powers. As mentioned previously, the data indicated that the threshold
water velocity for the initiation of carry-under is 1.2 ft/s. As the power
is increased, the carry-under increases gradually to avalué of ~ 40% at
100 M W for an intermediate mixture interface height. That is, 40 wt.%
of all steam generated in the core is being entrained in the downcomer. The
average water velocity in the downcomer at 100 M W was 1.9 ft/s.
374 A. ISKENDERIAN et al.
It is interesting to note that the carry-under has exceeded the theoretical
value of 34.6% (which corresponds to the, point where all sub-cooling is elimi
nated and recirculation of steam commences). This is due to the occur
rence of liquid carry-over.The magnitude of vapour carry-under in the downcomer is somewhat
startling, but corroborating evidence is gained from an analysis of the phy
sics data as described in a later section.
Laboratory loop studies [6] showed that as power is increased for a
fixed recirculation velocity, the percentage of carry-under decreases,
reaches a minimum and then begins to increase. This sequence did not
occur in the reactor, since the recirculation velocity continued to increase
slightly with power. Once the threshold velocity for carry-under is passed,
substantial increases in carry-under occur with small increases in velocity.
In E B W R , the expected decrease of carry-under with increasing power ap
parently was nullified by the increase in the recirculation velocity. The
over-all effect was that the percentage of carry-under continued to increase
with power.
REACTOR POWER. MW
Fig. 11
Steam volume fraction at periphery of riser as a function of reactor power at 600 lb/in* gauge and
various true mixture interface levels
(d) Steam volume fractions in riser and downcomer. The steam volume
fractions in the riser and the downcomer are shown in Figs. 11 to 13. The
variation of the riser steam volume fraction with power can also be scruti
nized for the effects of liquid carry-over and steam carry-under. In the
lower power region (10-40 MW) where the steam carry-under is predominant
and the loss of the sub-cooling is rapid, the riser steam volume fraction
rises rapidly. In the middle power range (60-80 M W ) where the threshold
of liquid carry-over is reached, the void fraction tends to level off. In the
very high power range (> 80 M W ), the steam volume fraction tends to de
crease. This behaviour in the high-power region is expected, since the
sub-cooling is increased rapidly with power due to carry-over.
EXPERIMENTAL BOILING WATER REACTOR 375
REACTOR POWER, MW
Fig. 12
Steam volume fraction in upper region of downcomer as a function of reactor power and various true
mixture interface levels
REACTOR POWER, MW
Fig. 13
Steam volume fraction in lower region of downcomer as a function of reactor power and various true
mixture interface levels
An indication of the change in the void content can be gained from a
simple heat balance on the core:
Q = W T (Ah + X h fg)
or
y (Q /W T) - Ah
h fg
where X is the average mixture quality at the core exit. The average core
376 A. ISKENDERIAN et al.
and riser void fractions are roughly proportional to the average exit core
mixture quality X. Therefore, the change in quality and, hence, change in
voids was computed over the power intervals 70- 100 MW .
The results of this analysis indicate that the rate of void fraction in
crease decreases as the power is increased. Between 80 and 90 M W , there
is virtually no change in exit quality, hence, the core and riser void frac
tions tend to remain nearly constant. Between 90 and 95 M W , it appears
that the void content actually decreases, hence, the reactivity increases.
This behaviour is shown in Fig. 11 and Was corroborated by the control rod
movements made over this power interval, as is discussed in the Physics
Section.
Data on the rate of quenching of the steam carried under were obtained
in the lower downcomer, and the upper downcomer where the riser was
necked down (see Figs. 12 and 13).
An insight into the collapse-rate pattern of the steam bubbles can be
gained from a rough theoretical analysis of the problem. Assuming that
the collapse of a vapour bubble in a sub-cooled liquid is governed primarily
by the rate of heat transfer at its surface during the major fraction of its
lifetime and that the bubble is moving in a quiescent fiuid, a theoretical
collapse rate can be computed. Undoubtedly, in a highly turbulent region
the collapse rate of a bubble would be much higher than predicted. However,
the qualitative effect of sub-cooling on the collapse rate is considered fairly accurate.
BUBBLE DIAMETER, mm
Fig. 14
Effect of sub-cooling on bubble collapse time
Fig. 14 shows the results of some rough calculations which illustrate
the strong effect of sub-cooling on the collapse rate of bubbles of various
diameters. As the sub-cooling increases, the time required to collapse
the vapour bubble decreases. Thus at the top of the downcomer where the
cold feed water is injected, the sub-cooling is maximum, the collapse rate
is likewise at a maximum and one would expect a sudden large drop in the
void content.
EXPERIMENTAL BOILING WATER REACTOR 377
In an EBWR- type reactor where cold feed water is injected into the
downcomer, the sub-cooling at core entry would vary from one degree at
~10 M W to ~ 12° at 100 M W , assuming no carry-under. At low powers, the
collapse rate is at a minimum, thus a large quantity of steam carry-under
would reflect a high steam volume fraction. As power is increased, the
theoretical sub-cooling increases and thus the bubble collapse rate increases.
Hence, for the same amount of steam carry-under, the steam volume frac
tion would be lower. In the very high power range (> 7-5 M W) where excess
cold water is injected due to the liquid carry-over, the collapse rate is even
greater and, despite maximum carry-under, a low steam volume fraction
would be expected. Moreover, because of liquid carry-over, the steam
volume fraction would decrease with power. Fig. 15 illustrates the type
of void pattern that was expected in the upper region of the downcomer. In
the lower downcomer region virtually all the steam voids would be condensed
because of the relatively long transient time involved. This is especially
true in the very high power range where an excess of feed water is injected.
Fig. 15
Steam volume fraction as a function of reactor power
(Showing void pattern expected in upper region of downcomer)
The steam volume fraction data obtained from the upper and lower down
comer are shown in Figs. 12 and 13, respectively. At first glance, the data
appear to be erratic with excessive scatter. However, upon closer scrutiny
trends similar to those just described can be deduced which apparently sub
stantiate the foregoing analysis. The major deterent to establishing con
clusive patterns is that the data were not taken over the entire power range
at a fixed interface height. However, as shown in Fig. 12 at the lowest
powers and lowest interface heights, the steam volume fraction in the upper
section of the downcomer is maximum. As the interface height is raised
and the power is increased, the steam volume fraction decreases in a manner
similar to that predicted. In the lower region of the downcomer, the steam
volume fraction is virtually zero under all conditions. (See Fig. 13)
(e) True liquid level. The difference between the level as indicated
by the water column and the actual vapour-liquid interface level in the re
actor is shown in Fig. 16. The height differential is a result of the steam
voids present in the core, riser and downcomer and the "bubble bed" above

378 A. ISKENDERIAN et al.
REACTOR POWER, MW
Fig. 16
Height differential between actual interface level and water column level as a function of reactor power
and various true mixture interface levels
the riser. The voids that are formed in the reactor core, flow through the
riser and are entrained in the downcomer, displace an equal volume of water.
This causes an increase in the mixture height. The water level above the
riser is, in turn, further expanded by the vapour flowing through it, which
creates a two-phase mixture or "bed". As can be seen in Fig. 16, the dis
crepancy between the two levels can be quite large. The height differential
is primarily a function of the reactor power and increases as the power is
increased. In the very high power range where liquid carry-over occurs,
the height differential levels off and begins to decrease. This is a result
of the sudden increase in sub-cooling and, hence, decrease in core and
riser void content. The scatter of the data increases with power. This
is probably due to the fact that the interface becomes more turbulent and
less defined. The maximum error in establishing the average interface
level was estimated to be 9 in.
(f) Liquid carry-over. The three methods employed to determine the
liquid carry-over were described earlier. The results are compared in
Fig. 17. They represent the first set of carry-over measurements taken.
Accordingly, these data are preliminary since the true mixture interface
levels were not determined at this time. The data do, however, serve to
point up the agreement among the three techniques.
Only limited data were obtained from the sampling probes because of
time considerations and termination of the project. However, some inter
esting trends are illustrated in Fig. 18 where the percentage of liquid carry
over is plotted as a function of the distance above the true interface. A
family of curves is obtained for varying superficial vapour velocities; hence,
it is readily apparent that carry-over rates cannot be expressed in terms
of superficial vapour velocities alone. The height of the steam dome must
also be specified. As the actual steam dome height decreases the carry
over increases rapidly.
The liquid carry-over data derived by the heat balance technique are
the most accurate and probably of greatest interest since they represent the
actual amount of water carried over into the turbine by-pass line and the

EXPERIMENTAL BOILING WATER REACTOR 379
s<
30
25
“1---1---1---1---1---1--SOURCE OF DATA
HEAT BALANCE ON SECONDARY SYSTEM . SAMPLING PROBES IN REACTOR DISCREPANCY BETWEEN FEED WATER AND STEAM DISCHARGE RATES
70 75 80 85
REACTOR POWER, MW
Fig. 17
Percentage of liquid carry-over as a function of reactor power
(Showing comparison of data obtained from three sources)
DISTANCE ABOVE INTERFACE, in
Fig. 18
Percentage of liquid carry-over as a function of distance above vapour interface for various superficial
vapour velocities
primary reboilers. As illustrated in Fig. 19, the initiation of carry-over
occurs at different power levels for different interface heights. At 60 M W ,
the carry-over starts at a superficial velocity of 1.1 ft/s and with a steam
dome height of 30 in. As the steam dome height is increased, the superficial
vapour velocity required to initiate large amounts of carry-over also
increases.
A comparison of the data derived from the reactor, with loop data obtained under static conditions (no fluid recirculation), shows that the magni-

380 A. ISKbNDERIAN et al.
REACTOR POWER, MW
Fig. 19
Liquid carry-over as a function of reactor power and various water column levels
(Data from heat balance on primary reboiler)
tude of the carry-over is larger for the reactor under the same conditions
of vapour velocity and dome height. The amount of liquid carry-over meas
ured in the reactor was much larger than had been expected.
3 .2 . Physics
The results of the detailed physics studies that were made on E B W R
are given in Refs. [7 and 10] . However, some pertinent physics data and
parameters are presented below which corroborate the effect of the vapour-
liquid separation process on reactor performance.
3 .2 . 1. Functions of spike fuel assemblies
The merits of and the reasons for the selection of the 100-MW(t) core
loading shown in Fig. 3 are described in detail in Ref. [10] . One of the prime
considerations which govern the arrangement of the spike fuel assemblies
was to achieve as flat a power distribution as was possible. Other con
siderations included the use of boron stainless-steel strips to provide excess
reactivity through the use of a burnable poison. However, owing to termin
ation of the water reactor programme, this latter objective was no longer
of importance. Consequently, the primary functions of the strips attached
to the spike fuel assemblies were: (1) to control the reactivity of the core;
and (2) to provide the desired flexibility in effecting increases in reactivity
as required.
In planning the power operation of the reactor, the number of boron
strips per.spike was initially reduced to an average of 1.57. With this con
figuration ~ 5% reactivity was available for steam void formation within
the core.
3 .2 .2 . Core parameters
Before making power runs, the control-rod system (with Zircaloy-2
followers) was calibrated. The results are plotted in Fig. 20. In addition,

EXPERIMENTAL BOILING WATER REACTOR 381
CONTROL RODS BANK POSITION (INCHES ABOVE BOTTOM OF CORE)
Fig. 20
Bank c o n tro l- ro d c a lib ra t io n
some void coefficient measurements were made with the aid of four void
simulators installed in the fuá! assemblies. Owing to dimensional limi
tations, the void simulators were confined to the thin enriched plate as
semblies. The measurements made with H 3B 0 3 in the reactor were of
particular interest. Extrapolation of these data indicated a negative void
coefficient for concentrations as high as 10 g H 3B 0 3/gal H 20 in the core (2640 ppm).
(a) Reactivity distribution. A series of runs were then made over a
power range from 0 to 60 M W . Control of reactivity was achieved primarily
by control-rod movements for the operating range of 0-40 M W ; at 40 M W
and with equilibrium xenon, the rods were all out. Above 40 M W , control
was achieved by reducing the H 3B 0 3 concentration in the core water. At
the 60-M W power level, ~ 0.5% p was available to effect further increase
in reactor power.
In order to obtain powers greater than 65 M W , it was necessary to re
move additional strips from the spike elements. The core reactivity was
increased ~2% by reducing the number of boron strips to one strip per spike
in the central ring of 28 spikes. This gave a total of ~ 10.5% core reactivity
after deducting 0.6% for burn-up during these power runs. This allowed

382 A. ISKENDERIAN et al.
~ 1.5% p to increase the power above 65 M W . The maximum reactivity that
could be added was governed by the established shut-down criteria.
A summary of reactivity distribution in the core is given below:
Reactivity required from cold to hot, zero voids ~ 1% p
Reactivity tied in steam voids for 60-MW operation~ 5% p
Additional reactivity for operation beyond 60 M W ~ 1.5% p
Xenon poisoning at 80 M W ~ 2.8%p
Total reactivity ~ 10.5% p
Control-rod worth (cold reactor) 11% p
Reactivity worth of H 3B O 3 for 1 g of
H 3B 0 3/gal H 20 (264 ppm) ~ 1.0% p
(b) Power coefficient. The effect of steam carry-under and liquid carry
over can readily be deduced from power coefficient measurements made over
the power range of 0 to 80 M W for a fixed water column level. Power coef
ficients were obtained by determining the change in reactivity effected by
control-rod movements and by removal of boric acid. These data are shown
in Fig. 21. In the lower power range, the power coefficient increases with
POWER, MW
Fig. 21
Power coefficient against reactor power
increasing reactor power. It peaks at about 55 M W , begins to decrease and
tends toward zero., The peak at about 55 M W corresponds roughly to the
power level where liquid carry-over commences and reactor sub-cooling
begins to increase. Below 60 M W , the carry-under phenomenon is pre
dominant; this is reflected in the increasing power coefficient. Above 60 MW,
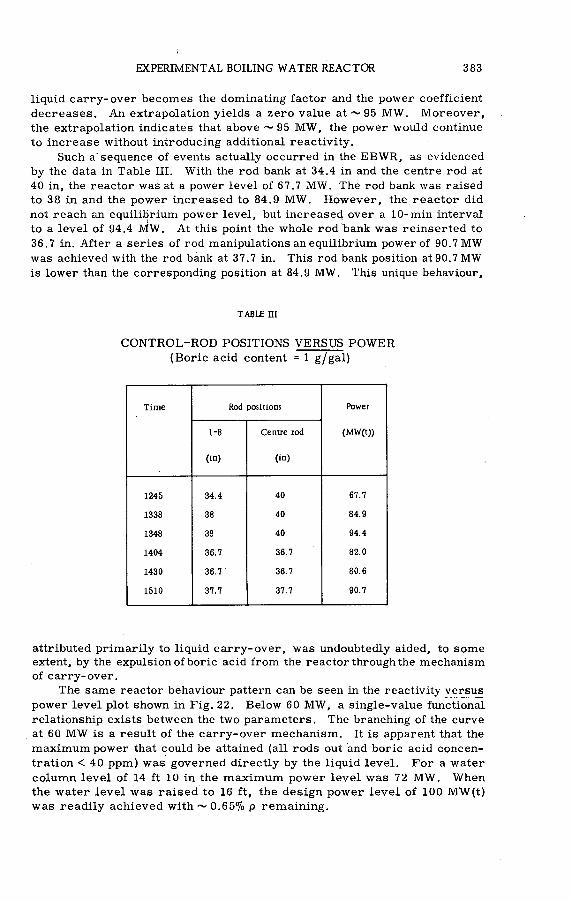
EXPERIMENTAL BOILING WATER REACTOR 383
liquid carry-over becomes the dominating factor and the power coefficient
decreases. An extrapolation yields a zero value at ~ 95 M W . Moreover,
the extrapolation indicates that above ~ 95 M W , the power would continue
to increase without introducing additional reactivity.
Such a’sequence of events actually occurred in the EBW R , as evidenced
by the data in Table III. With the rod bank at 34.4 in and the centre rod at
40 in, the reactor was at a power level of 67.7 M W . The rod bank was raised
to 38 in and the power increased to 84.9 M W . However, the reactor did
not reach an equilibrium power level, but increased over a 10-min interval
to a level of 94.4 M W . At this point the whole rod bank was reinserted to
36.7 in. After a series of rod manipulations an equilibrium power of 90.7 M W
was achieved with the rod bank at 37.7 in. This rod bank position at 90.7 MW
is lower than the corresponding position at 84.9 MW. This unique behaviour,
TABLE III
CONTROL-ROD POSITIONS VERSUS P O W ER
(Boric acid content = 1 g/gal)
Time Rod positions Power
(MW(t))1-8
(in)
Centre rod
(in)
1245 34.4 40 67.7
1338 38 40 84.9
1348 38 40 94.4
1404 36.7 36.7 82.0
1430 36.7 36.7 80.6
1510 37.7 37.7 90.7
attributed primarily to liquid carry-over, was undoubtedly aided, to some
extent, by the expulsion of boric acid from the reactor through the mechanism
of carry-over.
The same reactor behaviour pattern can be seen in the reactivity versus
power level plot shown in Fig. 22. Below 60 M W , a single-value functional
relationship exists between the two parameters. The branching of the curve
at 60 M W is a result of the carry-over mechanism. It is apparent that the
maximum power that could be attained (all rods out and boric acid concen
tration < 40 ppm) was governed directly by the liquid level. For a water
column level of 14 ft 10 in the maximum power level was 72 M W . When
the water level was raised to 16 ft, the design power level of 100 MW(t)
was readily achieved with ~ 0.65% p remaining.
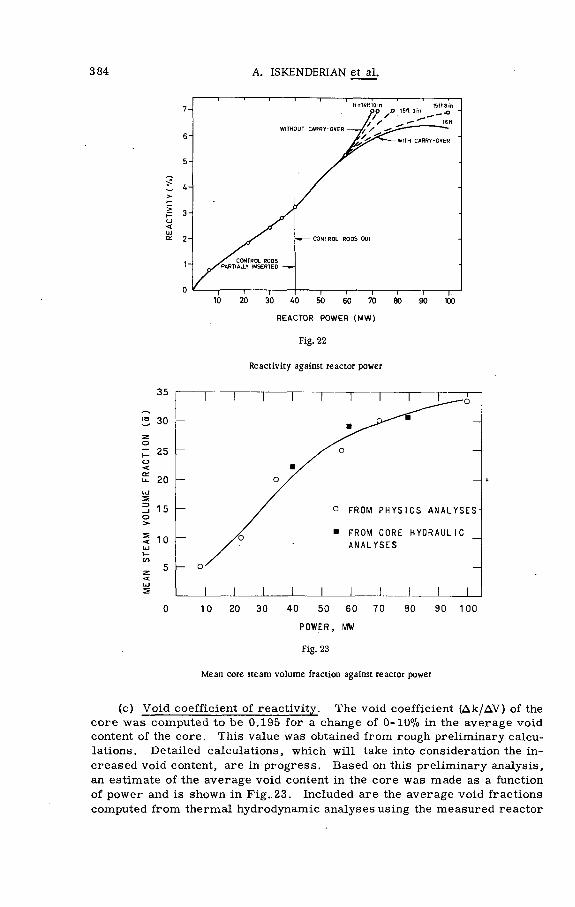
384 A. ISKENDERIAN et al.
Fig. 22
Reactivity against reactor power
POWER, MW
Fig. 23
Mean core steam volume fraction against reactor power
(c) Void coefficient of reactivity. The void coefficient (Дк/ДУ) of the
core was computed to be 0.195 for a change of 0-10% in the average void
content of the core. This value was obtained from rough preliminary calcu
lations. Detailed calculations, which will take into consideration the in
creased void content, are in progress. Based on this preliminary analysis,
an estimate of the average void content in the core was made as a function
of power and is shown in Fig., 23. Included are the average void fractions
computed from thermal hydrodynamic analyses using the measured reactor
EXPERIMENTAL BOILING WATER REACTOR 385
sub-coolings. As can be seen, the average core coolant void fraction de
rived from physics and thermal hydraulic considerations are in fair
agreement.
(d) Neutron flux distributions. A method was developed for, and used
in, the E B W R for characterization of the neutron flux as a function of lo
cation in the core, reactor power and reactor control parameters. Bare and
cadmium-covered cobalt foils were introduced and accurately positioned
for irradiation in selected locations in the core. After irradiation, they
were removed without affecting reactor operation.
The activation detector foils were prepared as small spheres ground
to precision tolerances. This shape and close dimensional control elimi
nated individual weighings and obliquity effects in the isotropic flux, and
greatly simplified automatic analysis. The activated foils were analysed
with conventional instrumentation and the thermal and resonance neutron
flux components were calculated. Figs. 24 and 25 show typical thermal
neutron flux distribution isogram plots constructed from several axial plots
to show both axial and radial distribution in one quadrant of the core. The
left margin of each plot represents the centre-line of the core.
The power level for both isogram plots was 40 M W . The boric acid
concentrations were 25 ppm and 1200 ppm for Figs. 24 and 25, respectively.
It will be noted that the peak power in the presence of soluble poison control
is considerably lower (highest isogram is 2.6X 10¹³ n cm'2 s'1 ) than the peak
power in the absence of a significant concentration of soluble poison (highest
isogram is 3.75X 10¹³ n cm"2 s'1 ). The effective core size is much larger
and better distributed in the presence of soluble-poison shim control and
should result in a more uniform burn-up of the fuel throughout the core.
Isogram plots were also prepared to show the effect of reactor power
level on thermal and resonance neutron flux distribution, and to show the
effect of operation with the control rods in an unusual non-banked configura
tion. (See Ref. [8] ).
3. 3. Specific observations
3.3 .1 . Fuel assemblies
The original E B W R core contained 114 fuel assemblies surrounded by
32 aluminium dummy fuel assemblies to fill the grid plate. This core re
mained essentially undisturbed for about three years in the reactor vessel.
During this time, deposits varying in thickness (up to 0.008 in) had built
up on the fuel plate surfaces. Attempts to remove the deposit proved not
practical. Analysis of sample scrapings revealed a composition of 67wt.%
boehmite (A120 3 • H 20), 25 wt.% nickel and 8 wt. % iron. Consequently,
the aluminium dummy fuel assemblies were judged tobe the principal source
of the scale. The exact mechanism of deposition has not been resolved.
However, it is fairly well established that the mass transfer is from the
dummy fuel boxes, to the coolant and then to the active fuel plates, primarily
on the boiling areas of the plate surfaces. All aluminium dummy fuel as
semblies were removed from the core in order to provide space for the
additional spike fuel assemblies of the high-power runs.
25

386 A. ISKENDERIAN et al.
Fig. 24
Thermal neutron flux isogram plot for reactor power of 40 MW(t) and soluble poison concentration
of 25 ppm boric acid

EXPERIMENTAL BOILING WATER REACTOR
712 f t в in TOP OF PLATES
712 ft 5 in TOP OF MEAT AND TOP OF RODS
712ft 3fn TOP OF PELLETS
712ft
711ft
710ft
709 ft
708ft 7in BOTTOM OF CROO POISON706ft 5 in BOTTOM OF MEAT 708ft 3V2in BOTTOM OF PELLETS 708ft 2 in ВОЛОМ OF PLATE ANO «OOS
707ft 7 in TOP OF GRID PLATE
W W W w w w wFig. 25
Thermal neutron flux isogram plot for reactor power of 40 MW(t) and soluble poison concentration of
1200 ppm boric acid
388 A. ISKENDERIAN et al.
This scale was a matter of deep concern during operation at elevated
powers. The existing scale on the fuel plates represented a barrier to ef
fective heat transfer. The thermal conductivity of the scale had been esti
mated to be less than 1 (BTU f f 2h '1)(°F/ft). At elevated powers, the scale
could promote a central fuel temperature of ~ 1125°F. At this temperature,
the creep strength of the uranium alloy would be reduced and the fission
gas trapped in the fuel plates could cause considerable swelling. It was
feared that some fuel plates would eventually rupture.
Initial evidence of fuel growth was observed upon completion of the
85 MW(t) power level phase of the programme. Cursory examination of
the plate assemblies (under the core water) revealed the side plates were
slightly distorted, with some loss of the scale. There were no detectable
physical defects in the fuel plates.
After shut-down from 100 M W , some plate and spike fuel assemblies
were removed for visual examination. There were no perceptible changes
in the spike assemblies; however, definite changes were observed in the
plate-type assemblies. The perforated side plates had buckled about 1/ 16 in
between spot welds (in the horizontal position and not between fuel plates)
Maximum deformation occurred in the region of highest flux and diminished
toward the ends of the fuel plates.
The following comments are subject to confirmation by current des
tructive and non-destructive tests on these assemblies. The buckling may
be attributed to the difference in expansion coefficients of the Zircaloy-clad
metallic fuel and the Zircaloy side plates. However, the fuel plates did
not buckle because the clad was bonded to the fuel. During the high-power
runs, the side plates may have exceeded their elastic limit and, as a con
sequence, buckled as the metallic fuel plate contracted after reactor shut
down. With respect to the loss of some scale: evidently at some power
above 60 MW(t) the scale was subjected to a shearing stress induced by ex
pansion of the fuel plates. Undoubtedly, the descaling process improved
heat transfer between fuel plates and the primary coolant. At this time,
it can only be speculated that a redistributed deposition of the spallings would
have occurred with continued operation.
3 .3 .2 . Radiation levels
During reactor operation and/or subsequent shut-down, authorized per
sonnel were permitted to enter the containment shell and the reboiler building
for purposes of performing experiments or maintenance on system com
ponents The following sections describe briefly the radiation levels that
were encountered, the contributing factors and the corrective measures
that were taken.
(a) Transport of corrosion products. Scale spalling from the fuel
plates presented some radiation problems, particularly in the sub-reactor
room. The settling and accumulation of this scale in control-rod rack hous
ings and flanged appendages for the original forced circulation nozzles cre
ated radiation levels up to 20 r/h at contact. Blow-down of these nozzles
(to a dump tank) effected a reduction in surface radiation to 3-5 r/h.

EXPERIMENTAL BOILING WATER REACTOR 389
At power levels above 65 M W , where water carry-over with the steam
was encountered, fine particles of scale were entrained with the water. These
particles did not plate out on any surfaces external to the reactor vessel,
but were eventually collected in the full-flow condensate filters. Radiation
levels external to the filter vessels normally are 10-15 mr/h, but with
carry-over the levels increased to 20 r/h. Irradiated particles of scale
were also collected in the reactor water purification filters and resin beds.
These vessels are shielded with lead (4-in thick); therefore, no significant
radiation levels were encountered. 4
A fine coating of iron oxide (rust coloured) was deposited on all the
surfaces that were contacted by the primary fluid. It is believed that the
bulk of the iron came from the carbon-steel condenser shell and some of
the carbon-steel piping.
(b) Plant activities. Radiation levels in the containment shell and in
the reboiler building can be attributed primarily to N*6 (half-life = 7.4 s)
except for liquid carry-over of irradiated corrosion products. The xmount of liquid carry-over is a function of the reactor power and is especially sensitive to interface level in the reactor vessel. With no carry-over, radi
ation levels in the containment shell were essentially the same as was re
ported for 20-M W operation [1] . This was true whether the reactor was
operated at 20 M W or at 80 M W . The original 20-M W plant and the re
boiler plant were operated in parallel; steam in excess of 20 M W was shunted
to the reboilers. Since N16 is the primary contributor of activity and de
cays through several half-lives before it re-enters the containment shell,
it retains only very minute amounts of activity. Table IV lists typical radi
ation levels registered in the containment shell.
One unexpected source of radiation was detected in the sub-reactor
room. An intense neutron beam was emitted from each of the two, large,
forced-circulation piping nozzles that extend through the shielding beneath
the reactor. Neutron streaming which occurred in the annuli between the
12-in pipes and their respective 20-in sleçves was attributed to enlargement
of the initial 4-ft-diam. core to a 5-ft-diam. core. As a consequence: (l)the
core was in closer proximity to the nozzles; and (2) the shielding afforded
by the water in the core downcomer was diminished. Further neutron streaming was precluded by filling the annuli with water to a height that
extended ~ 1 ft into the biological shield.
Fig. 26 shows the radiation levels registered at various locations in
the reboiler building. The primary system components are enclosed by
a concrete wall ( 1-ft thick). The maximum radiation level at the outer sur
face was 15 mr/h.
Upon termination of the experimental programme, the turbine was dis
mantled for routine inspection. The maximum radiation level on any surface
was 1 m r/h at contact. The inside surfaces of the turbine had been plated
with 0.005 in of nickel by the Kanigen process. Most of this plating had
eroded, especially in areas where steam velocity was highest. Otherwise
the turbine appeared to be in good condition.
(c) Fission gas release. As a point of interest, fission gas release
due to fuel-element failure has not been experienced throughout the history
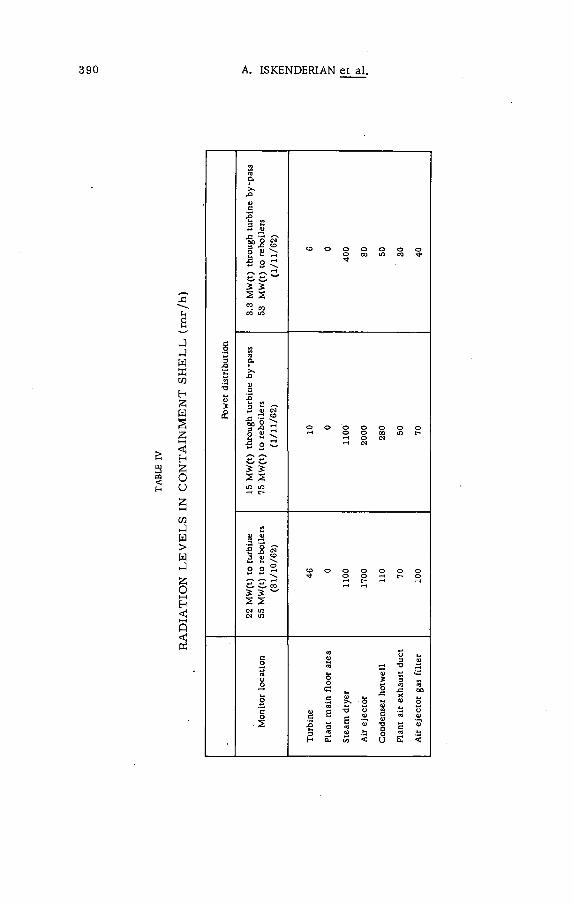
390 A. ISKENDERIAN et al.

EXPERIMENTAL BOILING WATER REACTOR 391
Location of radiation measurement points in reboiler building
Legend * r/h
1. No. 1 primary reboiler head end 1.1
2. No. 1 primary reboiler centre bottom 1.5
3. No. 1 primary reboiler back end 0. 45
4. No. 2 primary reboiler head end 1.1
5. No. 2 primary reboiler centre bottom 3. 1
6. No. 2 primary reboiler back end 0.45
7. No. 1 reboiler drain tank line 2.7
8. No. 1 reboiler drain tank bottom 1.0
9. No. 2 reboiler drain tank line 4.5
10. No. 2 reboiler drain tank bottom 1.6
11. No. 1 primary drain cooler back end 0.6
12. No. 1 primary drain cooler centre 0.3
13. No. 1 primary drain cooler head end 0. 43
14. No. 2 primary drain cooler back end 0.6
15. No. 2 primary drain cooler centre 0. 38
16. No. 2 primary drain cooler head end 0.5
17. Primary steam line 0.9
18. Intermediate steam line 0
19. West doorway to cell 0.2
20. East doorway to cell 0. 25
*Maximum readings obtained when reactor was operating at 90 MW(t) with 70 MW(t) being sent to the
reboilers.
Readings were 2 in from surfaces except in doorways where a general background level is given.

392 A. ISKENDERIAN et al.
Fig. 27
HBWR fission-gas release against reactor power
of E B W R operation. The fission gases that were detected (Fig. 27) are at
tributed to fission of tramp uranium that adhered to the plate surfaces during
fabrication. Minute amounts of Xei33 were also detected but are not shown
in the figure.
Gas samples from the exhaust stack and, also, downstream of the air
ejector were filtered and drawn into evacuated collectors.
Two methods of gas analysis were employed. Briefly, a chemical
method was used for gases decaying into a radioactive particulate daughter.
The activity of the daughter is determined and the activity of the gaseous
parent can be calculated from equilibrium information. This method is
satisfactory for Xe138 and K r 88. The second method involved the use of
a single-channel, pulse-height analyser. This method is satisfactory for
determining the longer half-life products such as Xei35 andXei33. A detailed
description of both methods is given in Ref.[3] .
3.3.3. On the use of soluble poisons (boric acid)
From time to time, questions are raised about the use of boric acid
for augmentive control in an operating reactor. The term "hideout" is used
occasionally. Other questions pertain to improper or incomplete mixing,
or to operational difficulties such as crystallization, reliability of moni
toring the boric acid concentration etc.
(a) Hideout. The EBW R has had many months of operation using boric
acid in the reactor with concentration in general not exceeding 5 g/gal. Hide
out has not been experienced. If it does exist, the quantities must be very

EXPERIMENTAL BOILING WATER REACTOR 393
minute and do not present a problem. Saturated steam leaving the reactor
(assuming no water carry-over) carries a boric acid concentration of one
part in seventeen of that present in the reactor water. This is due to volati
lization and not carry-over. This means that the concentration in the con
denser hotwell is approximately 6% of the concentration in the reactor vessel.
This presents no problem since equilibrium is established within a few mi
nutes during reactor operation. However, where large amounts of water
are carried over with the steam, entrained boric acid is carried over with
the water. For example, during a power run at 91.¿ M W , the boric acid
concentration in the hotwell was 186 ppm, whereas it was 422 ppm in the
reactor vessel: Without carry-over and with a concentration of 422 ppm
in the reactor, the normal concentration in the hotwell would be about 25 ppm.
(b) Dilution. During cold critical experiments, the boric-acid con
centration in the reactor vessel was easily varied by dilution. This simply
involved adding clean water, mixing and then draining the vessel to a pre
determined level.
Dilution of the poison by the addition of clean water is relatively slow.
As far as reactivity hold-down is concerned, boric acid presents no real
hazard with one possible exception. Mixture of boric-acid solution with
the reactor water may be a problem when there is no natural convection.
This will not prevail during operation or if sufficient core decay heat is
available to induce natural circulation.
To obtain good mixing in the EBWR, air was bubbled through the reactor
water for 15 min after the addition of boric acid (with the vessel pressure
at atmospheric conditions). There was no indication of crystallization or
settling out of the crystals once a homogeneous solution was obtained, even
with concentrations up to 2640 ppm.
(c) Removal. During reactor operation, removal of the soluble poison
was accomplished with the reactor water purification system in conjunction
with an anion-resin-bed ion exchanger. Water was pumped from the reactor
at about 8 gal/min, cooled and passed through the anion resin bed (9 ft3).
Subsequently, the water was circulated through a standard mixed-bed ion
exchanger (1.2 fts resin) to ensure neutral water, reheated and pumped back
to the reactor. In this manner, the boric-acid concentration in the reactor
was reduced by a factor of two in about five to six hours.
(d) Monitoring. Two primary monitoring methods were used to de
termine the boric acid concentration: (1) continuous monitoring of water
flowing through a sample cell in the purification system; and (2) bi-hourly
determinations in an apparatus designed for individual samples. Both
methods are based on neutron absorption by the poison. A chemical ti
tration method was used periodically as a check on the monitors.
The neutron absorption method is used on the ВЮ isotope which has a
high cross-section for thermal neutron capture. The apparatus consists
of a plutonium-beryllium source (IQ? n/s) and a detector arranged in a
cell of suitable geometry. Reactor water circulates continuously through
the cell. The concentration of boron determines the thermal neutron flux
attenuation between the source and the detector.
394 A. ISKENDERIAN et al.
In E B W R , a signal from the neutron ionization detector chamber was
measured with a vibrating-reed electrometer in a circuit incorporating feed
back stabilization and control. A continuous recorder in the control room
indicated the boric-acid concentration.
3. 4 . R e ac to r transfer function m e a s u r e m e n t s
3.4.1. Methods
E B W R stability was determined by experimentally measuring the re
actor transfer function at selected power levels and extrapolating the results
of these measurements to obtain an upper limit for stable operation.
Measurements were made at 10, 20,40, 60 and 71 M W . The data indicated
a maximum stable power of 120 M W .
(a) Sinusoidal reactivity input. The power transfer function was ob
tained by exciting the reactor with a sinusoidal reactivity input and
measuring the amplitude and phase shift of the neutron flux output with re
spect to the control-rod input at selected frequencies. The inherent noise
of the boiling process tended to reduce the accuracy of the measurements,
and therefore, noise rejection techniques based on cross-correlation were used. v
Cross-correlation of the control-rod position (input) and neutron flux
(output) allowed the reactor transfer function to be calculated with the de
sired degree of accuracy. Two methods were employed to compute the
cross-correlation. One method used an analogue computer to multiply the
output signal by the sine ut and cosine wt, and to integrate the resulting
products. The resulting vector is the magnitude and phase angle of the
output signal. The other method employed a digital-recording system which
converted the analogue input and output signals to digital data and stored
these data on a magnetic tape. The magnetic tape was then used to enter
the experimental data into an IBM-704 computer. The digital-computer programme was written to compute the cross-correlation of the input- output
signals and the amplitude and phase shift of the reactor transfer function.
The measured power transfer functions are shown in Fig. 28. The gain
is given by
20 log io [ (Дп/п0 ) /(Дк/^)] ,
where An = peak value of sinusoidal component of neutron flux; n0 = average
neutron flux; Дк = reactivity; and 3 = delayed neutron fraction.The absolute gain of the power transfer function was not measured di
rectly because of the uncertainty in control-rod worth in the presence of
voids. Therefore, the data of Fig. 28 have been normalized to the zero-
power transfer function by providing a best fit to the three highest frequency
points. This type of normalization is valid provided the feedback is negli
gible at these frequencies.
Reactor stability was examined by calculating the closed loop gain and
phase margin. The block diagram of the reactor with feedback is shown

EXPERIMENTAL BOILING WATER REACTOR 395
CU, rad /sec
Fig. 28
Reactor transfer functions
Ю
|
INPUT
6ZERO POWER
TRANSFER FUNCTION
POWERREACTIVITY
EFFECTS
FEEDBACK TRANSFER FUNCTION
___ _FLUX OR
POWER OUTPUT
Fig. 29
Block diagram of reactor with feedback
in Fig. 29. The power transfer function is given by
p G _ Flux output1 + G H Reactivity input '
where P , G and H are complex quantities and functions of frequency. In
stability exists when GH = -1, or when |GH| = 1 with the simultaneous con-
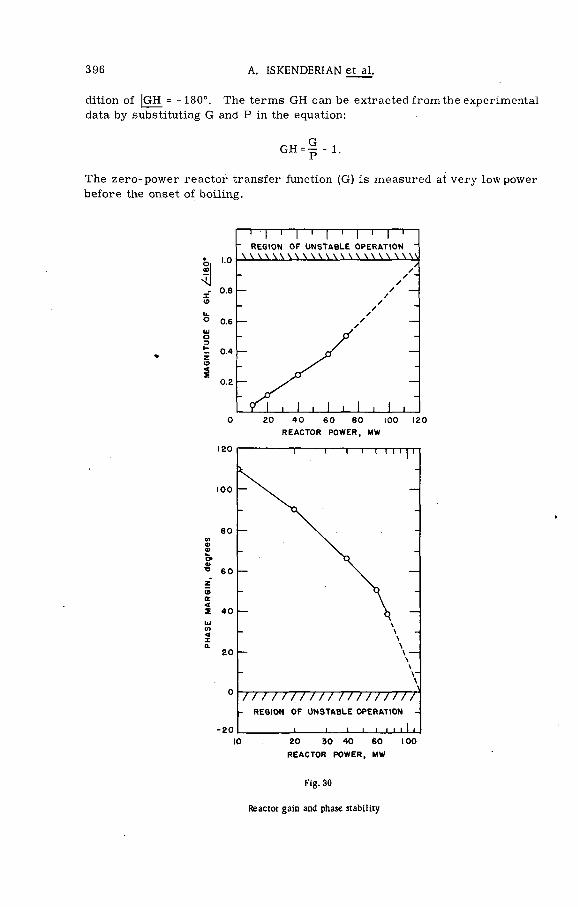
396 A. ISKENDERIAN et al.
dition of |GH = -180°. The terms GH can be extracted from the experimental
data by substituting G and P in the equation:
GH = | - 1.
The zero-power reactor transfer function (G) is measured at very low power
before the onset of boiling.
REACTOR POWER, MW
REACTOR POWER, MW
Fig. 30
Reactor gain and phase stability
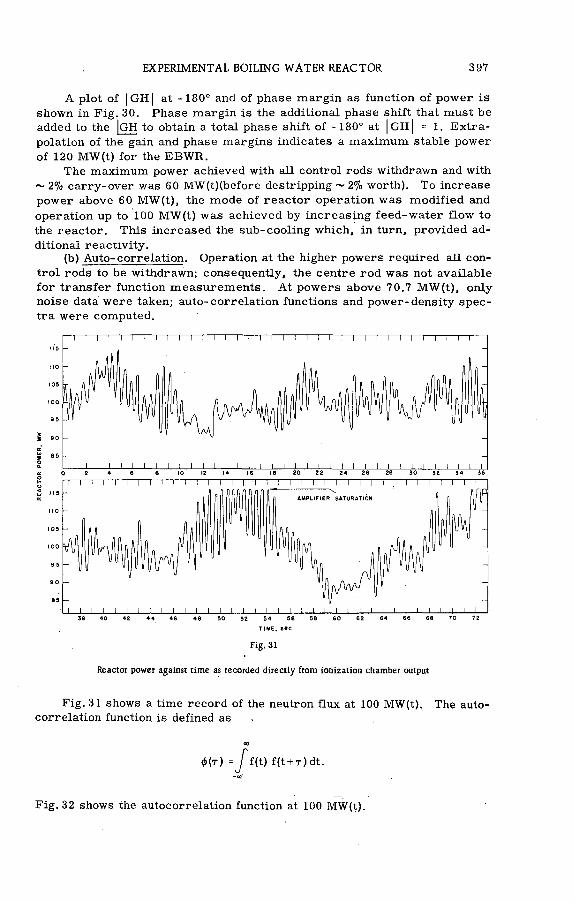
EXPERIMENTAL BOILING WATER REACTOR 397
A plot of |GH| at - 180° and of phase margin as function of power is
shown in Fig. 30. Phase margin is the additional phase shift that must be
added to the |GH to obtain a total phase shift of - 180° at |g h | = 1. Extra
polation of the gain and phase margins indicates a maximum stable power
of 120 MW(t) for the E B W R .
The maximum power achieved with all control rods withdrawn and with
~ 2% carry-over was 60 MW(t)(before destripping ~ 2% worth). To increase
power above 60 MW(t), the mode of reactor operation was modified and
operation up to 100 MW(t) was achieved by increasing feed-water flow to
the reactor. This increased the sub-cooling which, in turn, provided ad
ditional reactivity.(b) Auto-correlation. Operation at the higher powers required all con
trol rods to be withdrawn; consequently, the centre rod was not available
for transfer function measurements. At powers above 70.7 MW(t), only
noise data were taken; auto-correlation functions and power-density spec
tra were computed.
i i i i i i i i i i i i i i i i— i i i i i i i i i i i i i i i— i— i— i— i— г
« 0 2 4 6 8 10 12 14 16 le 20 22 24 26 26 30 32 34 36
t i m e , sec
Fig. 31
Reactor power against time as recorded directly from ionization chamber output
Fig. 31 shows a time record of the neutron flux at 100 MW(t). The auto
correlation function is defined as
00
ф[т) = J f(t) f(t + T)dt .
Fig. 32 shows the autocorrelation function at 100 MW(t).
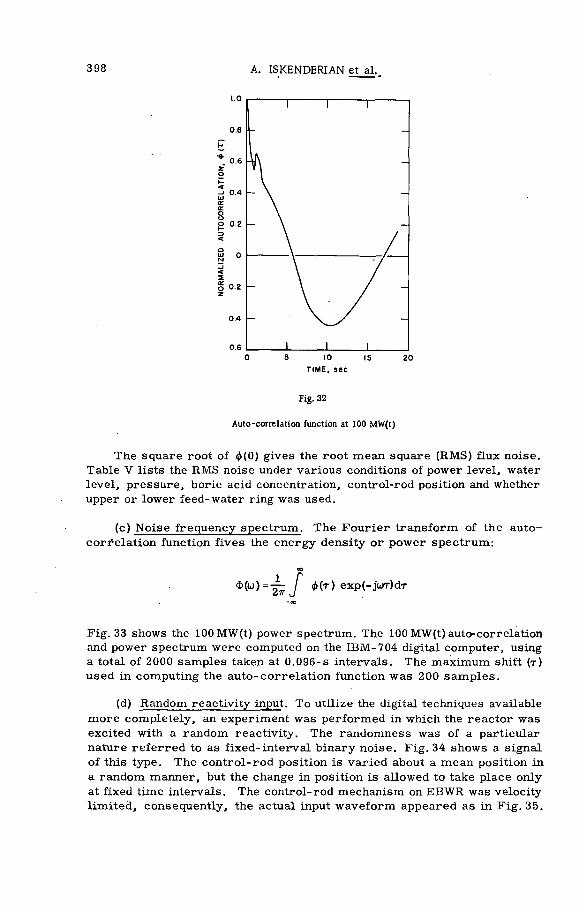
398 A. ISKENDERIAN et al.
0.6о 5 10
T IM E , se c
IS 20
Fig. 32
Auto-correlation function at 100 MW(t)
The square root of ф(0) gives the root mean square (RMS) flux noise.
Table V lists the RMS noise under various conditions of power level, water
level, pressure, boric acid concentration, control-rod position and whether
upper or lower feed-water ring was used.
(c) Noise frequency spectrum. The Fourier transform of the auto-
corielation function fives the energy density or power spectrum:
Fig. 33 shows the 100MW(t) power spectrum. The 100 MW(t) auto-correlation
and power spectrum were computed on the IBM-704 digital computer, using
a total of 2000 samples taken at 0.096-s intervals. The maximum shift (r)
used in computing the auto-correlation function was 200 samples.
(d) Random reactivity input. To utilize the digital techniques available
more completely, an experiment was performed in which the reactor was
excited with a random reactivity. The randomness was of a particular
nature referred to as fixed-interval binary noise. Fig. 34 shows a signal
of this type. The control-rod position is varied about a mean position in
a random manner, but the change in position is allowed to take place only
at fixed time intervals. The control-rod mechanism on EBW R was velocity
limited, consequently, the actual input waveform appeared as in Fig. 35.

EXPERIMENTAL BOILING WATER REACTOR 399
00 1
FREQUENCY, r a d / s e c
Fig. 33
Noise frequency spectrum at 100 MW(t)
MEANPOSITION
О T 2 T 3T 4 T 5T 6T
T IM E —
Fig. 34
Discrete-interval binary noise
MEANPOSITION
2 T 3 T 4 T 5 T 6 T
T IM E - »
Fig. 35
Velocity-limited, discrete-interval, binary noise
The frequency spectrum for the E B W R velocity-limited, discrete-
interval, binary noise signal is shown in Fig. 36. The frequency response
of the reactor is obtained from the cross-correlation function and power
spectrum calculations. Fig. 37 shows the frequency response of the reactor
obtained by using a binary noise input. The high-frequency portion of the
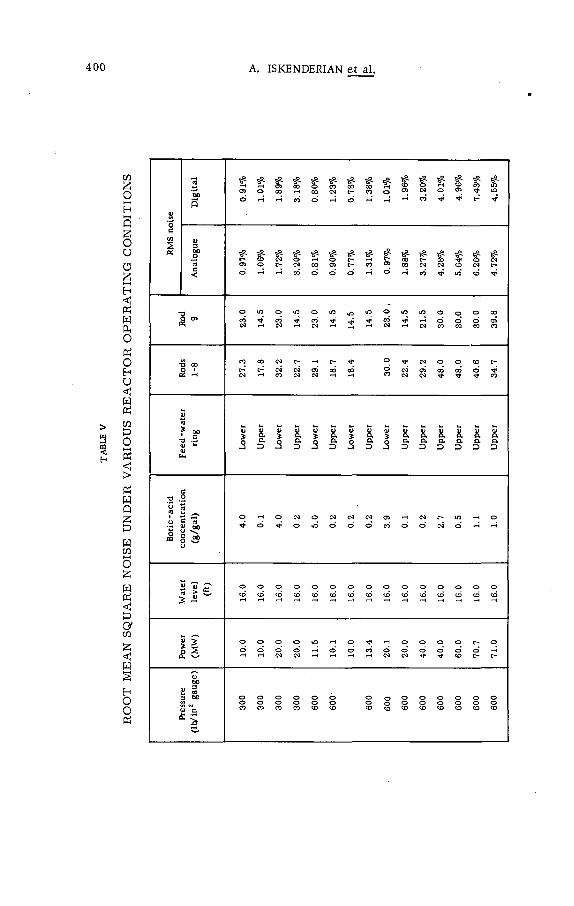
RO
OT
MEA
N
SQ
UA
RE
NOIS
E
UN
DE
R
VA
RIO
US
R
EA
CT
OR
O
PE
RA
TIN
G
CO
ND
IT
IO
NS
400 A. ISKENDERIAN et al.

TABLE
V (c
ont.
EXPERIMENTAL BOILING WATER REACTOR 401
S
&fH-*
СО СО СО СО
со со со со
&а"Э
о, a Э Э
to (О со со
2 ^ Ï 5 ° è-
*
26
Autom
atic

402 A. ISKENDERIAN et al.
FREQUENCY , r a d / s e c
Fig. 30
Velocity-limited, discrete-interval, binary noise frequency spectrum
ÜJ, rad/sec
Fig. 37
Transfer function at 40 MW(t) obtained by cross-correlation of neutron flux output with binary noise
reactivity input
figure was obtained with a binary time interval of 0.25 s and 9000 digital samples taken at 0.096 s per sample. The low-frequency portion of th^
record was obtained with a binary time interval of 2.0 s and 9000 digital
samples taken at 0.768 s per sample.
The amplitude and phase shift of Fig. 37 is in close agreement with the
40-MW(t) measurement shown in Fig.28, except for frequencies above 20 racVs.
The velocity limitation imposed by mechanical considerations on the control-,
rod mechanism resulted in the upper usable frequency limit of 20 rad/s. This
frequency limit does not allow the data of Fig. 37 to be normalized to the
EXPERIMENTAL BOILING WATER REACTOR 403
zero-power transfer function, consequently, the binary noise technique was
not used at higher powers. It should be noted that the high-frequency res
ponse portion of Fig. 37 was obtained in 15 min of reactor experimentation
time, as compared to 15 min for a single frequency point when using a sinu
soidal excitation.
3.4.2. Summary
Reactor transfer functions are useful tools in studying reactor per
formance. Through extrapolation they allow predictions of stability at higher
powers so that increases in power can be made with confidence. The power
at which instability will develop also can be predicted. These data can be
used to develop a dynamic model which combines all the design parameters —
reactor physics, heat transfer and hydraulics — for the specific reactor
type under investigation. The dynamic model is more descriptive of reactor
performance than are static measurements, e.g. reactivity per unit power
or unit void per unit power. The development of a correct model then assures
success in optimizing the performance on the next generation of similar
reactors.
A C K N O W L E D G E M E N T S
The authors gratefully acknowledge the assistance during the programme
by the following staff members of the Reactor Engineering Division,
Argonne National Laboratory. A. Hirsch, Control and Instrumentation;
W . Knapp, Flux Measurements and Water Control; E . Martinec, Design
and Operation; J. Matousek, Design and Operation; G. Popper, Transfer
Function Instrumentation; E . Spleha, Experimental Hydraulic Instrumen
tation; and H. Till*, Radiation Survey Data.
R E F E R E N C E S
[1] HARRER, J. M, et al. , Performance Evaluation of Direct-Cycle Boiling Water Nuclear Power Plants
Based on Recent EBWR-Borax Data, Proc. 2nd UN Int. Conf. PUAE 9 (1958) 264.
[2] MATOUSEK, J. F. , Modification of the Experimental Boiling Water Reactor (EBWR) for Higher Power
Operation, USAEC Rpt. ANL-6552 Suppl. to ANL-5607 (April 1962).
[3] ROBERTSON, R. F. S . , Tests of Defected Thoria-Urania Fuel Specimens in EBWR, USAEC Rpt. ANL-6022
(June 1960).
[4] PETRICK, M. and SPLEHA, E. A. , Thermal Hydraulic Performance Characteristics of EBWR, 0-100 MW,
USAEC Rpt. ANL-6693, to be published.
[5] EBWR Test Reports Associated with the 100 M W Facility, USAEC Rpt. ANL-6703, to be published.
[6] PETRICK, М., A Study of Vapor Carryunder and Associated Problems, USAECRpt. ANL-6581 (July 1962).
[7] ISKENDERIAN, H. P. , Physics of EBWR Core Loading [A, to be published.
[8] KNAPP, W. G . , Neutron Flux Studies in the EBWR During Power Operation, to be published.
[9] LIPINSKI, W .C . et al. . EBWR Dynamic Behavior up to 100 MW, to be published.
[10] AVERY, R. et al. , EBWR Core IA Physics Analysis, USAEC Rpt. ANL-6305 (Feb. 1961).
Industrial Hygiene and Safety Division.3¡C

404 A. ISKENDERIAN et al.
B I B L I O G R A P H Y
The EBWR (Experimental Boiling Water Reactor), USAEC Rpt. ANL-5607 (May 1957).
ТНШ, J. A. , EBWR Physics Experiments, USAEC Rpt. ANL-5711 (July 1957),
DeSHONG, J. A. , Jr. and BECKJORD, E. S. , Frequency Response Measurements of the EBWR Automatic Steam
Bypass Valve Control System, USAEC Rpt. ANL-5726 (June 1957).
WEST, J. M. et al., Hazard Summary Report on the Experimental Boiling Water Reactor (EBWR), USAEC
Rpt. ANL-5781 (undated).
WIMUNC, E. A. and HARRER, J. M. , Hazards Evaluation Report Associated with the Operation of EBWR at
100 M W , USAEC Rpt. ANL-5781 Add. Rev. 1 (Oct. 1960).
DeSHONG, J. A. , Jr., Power Transfer Functions of the EBWR Obtained Using a Sinusoidal Reactivity Driving
Function, USAEC Rpt. ANL-5798 (Jan. 1958).
BECKJORD, E. S. , Dynamic Analysis of Natural Circulation Boiling Water Power Reactors, USAEC Rpt.1 ANL-5799
(March 1958).
ТНШ, J. A . , Dynamic Behavior of Boiling Reactors, USAEC Rpt. ANL-5849 (May 1959).
DeSHONG, J. A.,, Jr. and LIPINSKI, W .C ., Analyses of Experimental Power-Reactivity Feedback Transfer
Functions for a Natural Circulation Boiling Water Reactor, USAEC Rpt. ANL-5850 (July 1958).
Proc. Conf. on Transfer Function Measurement and Reactor Stability Analysis, Argonne National Laboratory,
Argonne, Illinois, USAEC Rpt. ANL-6205 (2-3 May 1960).
AKCASU, A .Z ., Theoretical Feedback Analysis in Boiling Water Reactors, USAEC Rpt. ANL-6221 (Oct. 1960).
KOLBA, V. M . , EBWR Test Reports, USAEC Rpt. ANL-6229 (Nov. 1960).
CHRISTENSEN, H . , Power-to-Void Transfer Functions, USAEC Rpt. ANL-6385 (July 1961).
SUDA, N. and REHBACH, F ., Dynamic Analysis of the Operation of EBWR at 100 MW, USAEC Rpt. ANL-6478
(Dec. 1961).
Papers Presented at the Technical Briefing Session Held at Argonne National Laboratory, May 27 and 28, 1957,
USAEC Rpt. TID-7535 (Oct. 1957).

EXPERIENCE WITH SPECIFIC NUCLEAR
POWER PLANTS (continued)

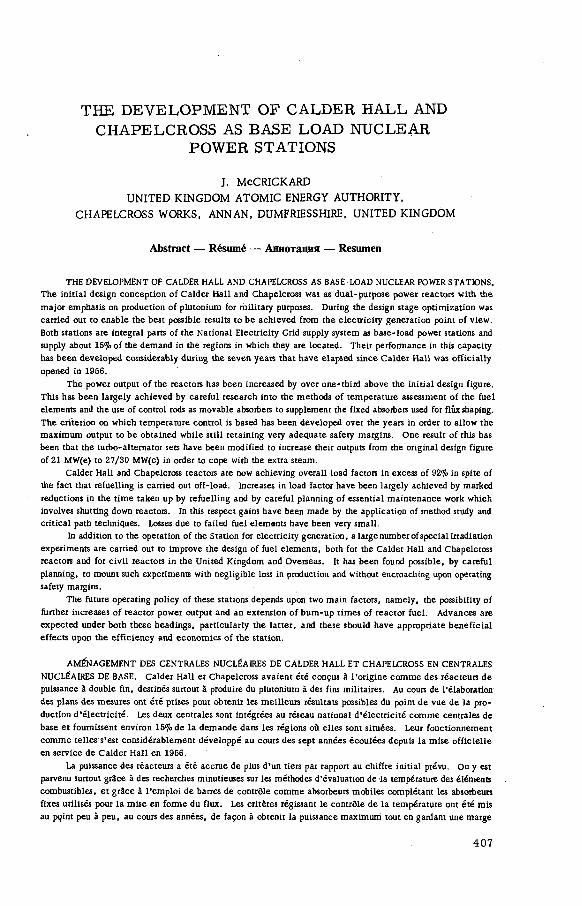
THE DEVELOPMENT OF CALDER HALL AND
CHAPELCROSS AS BASE LOAD NUCLEAR
POWER STATIONS
J. McCRICKARD
UNITED KINGDOM ATOMIC ENERGY AUTHORITY,
CHAPELCROSS WORKS, ANNAN, DUMFRIESSHIRE, UNITED KINGDOM
Abstract — Résumé — Аннотация — Resumen
THE DEVELOPMENT OF CALDER HALL AND CHAPELCROSS AS BASE LOAD NUCLEAR POWER STATIONS,
The initial design conception of Caldee Hall and Chapelcross was as dual-purpose power reactors with the
major emphasis on production of plutonium for military purposes. During the design stage optimization was
carried out to enable the best possible results to be achieved from the electricity generation point of view.
Both stations are integral parts of the National Electricity Grid supply system as base-load power stations and
supply about 15% of the demand in the regions in which they are located. Their performance in this capacity
has been developed considerably during the seven years that have elapsed since Calder Hall was officially
opened in 1956.
The power output of the reactors has been increased by over one-third above the initial design figure.
This has been largely achieved by careful research into the methods of temperature assessment of the fuel
elements and the use of control rods as movable absorbers to supplement the fixed absorbers used for flux shaping.
The criterion on which temperature control is based has been developed over the years in order to allow the
maximum output to be obtained while still retaining very adequate safety margins. One result of this has
been that the turbo*alternator sets have been modified to increase their outputs from the original design figure
of 21 MW(e) to 27/30 MW(e) in order to cope with the extra steam.
Calder Hall and Chapelcross reactors are now achieving overall load factors in excess of 92% in spite of
the fact that refuelling is carried out off-load. Increases in load factor have been largely achieved by marked
reductions in the time taken up by refuelling and by careful planning of essential maintenance work which
involves shutting down reactors. In this respect gains have been made by the application of method study and
critical path techniques. Losses due to failed fuel elements have been very small.
In addition to the operation of the Station for electricity generation, a large number of special irradiation
experiments are carried out to improve the design of fuel elements, both for the Calder Hall and Chapelcross
reactors and for civil reactors in the United Kingdom and Overseas. It has been found possible, by careful
planning, to mount such experiments with negligible loss in production and without encroaching upon operating
safety margins.
The future operating policy of these stations depends upon two main factors, namely, the possibility of
further increases of reactor power output and an extension of bum-up times of reactor fuel. Advances are
expected under both these headings, particularly the latter, and these should have appropriate beneficial
effects upon the efficiency and economics of the station.
AMÉNAGEMENT DES CENTRALES NUCLÉAIRES DE CALDER HALL ET CHAPELCROSS EN CENTRALES
NUCLÉAIRES DE BASE. Calder Hall et Chapelcross avaient été conçus à l'origine comme des réacteurs de
puissance à double fin, destinés surtout à produire du plutonium à des fins militaires. Au cours de l'élaboration
des plans des mesures ont été prises pour obtenir les meilleurs résultats possibles du point de vue de la pro
duction d'électricité. Les deux centrales sont intégrées au réseau national d'électricité comme centrales de
base et fournissent environ 15% de la demande dans les régions où elles sont situées. Leur fonctionnement
comme telles s’est considérablement développé au cours des sept années écoulées depuis la mise officielle
en service de Calder Hall en 1956.
La puissance des réacteurs a été accrue de plus d'un tiers par rapport au chiffre initial prévu. On y est
parvenu surtout grâce à des recherches minutieuses sur les méthodes d'évaluation de la température des éléments
combustibles, et grâce à l'emploi de barres de contrôle comme absorbeurs mobiles complétant les absorbeurs
fixes utilisés pour la mise en forme du flux. Les critères régissant le contrôle de la température ont été mis
au pçint peu à peu, au cours des années, de façon à obtenir la puissance maximum tout en gardant une marge
407

408 J. McCRICKARD
de sécurité très suffisante. Il a fallu en conséquence, modifier les groupes turbo-alternateurs pour porter
leur production du chiffre de 21 MWe, prévu originellement, à 27/30 MWe, afin d'utiliser la valeur
supplémentaire.
Les réacteurs de Calder Hall et de Chapelcross atteignent maintenant des facteurs de charge globaux de
plus de 92^0, malgré les arrêts nécessaires pour le chargement du combustible. Les accroissements du facteur
de charge ont été obtenus en grande partie grâce à des réductions considérables du temps consacré au recharge*
ment et à une programmation minutieuse des travaux d’entretien essentiels qui nécessitent l'arrêt des réacteurs.
A cet égard, on a obtenu des gains de temps par l'emploi de méthodes judicieuses et rationnelles. Les pertes
dues au fonctionnement défectueux d'éléments combustibles ont été très faibles.
Oùtre la production d'électricité, de nombreuses expériences spéciales d'irradiation ont été effectuées
afin d'améliorer la conception des éléments combustibles, à la fois pour les deux réacteurs de Calder Hall et
de Chapelcross et pour des réacteurs «civils» tant au Royaume-Uni qu'à l'étranger. On a réussi, grâce à
une programmation soignée, à faire ces expériences sans perte appréciable pour la production et sans dépasser
les marges de sécurité du fonctionnement.
L'exploitation future de ces centrales dépend de deux facteurs principaux: la possibilité d'augmenter
encore la puissance des réacteurs et celle de prolonger la durée d'utilisation du combustible. On s'attend,
dans ces deux domaines, en particulier dans le deuxième, à des progrès qui devraient entraîner une amélio
ration correspondante de l'efficacité et de la rentabilité des centrales.
РАЗВИТИЕ АТОМНЫХ ЭЛЕКТРОСТАНЦИЙ В КОЛДЕР-ХОЛЛЕ И ЧЕПЕЛКРОССЕ КАК АТОМНЫХ ЭЛЕКТРОСТАНЦИЙ
С ОСНОВНОЙ НАГРУЗКОЙ. Первоначальная концепция при проектировании атомных электростанций в
Колдер-Холле и Чепелкроссе состояла в строительстве энергетических реакторов двойного значения
с основным упором на производство плутония для военных целей. Однако на стадии проектирования
возникли предположения о возможности достижения наилучших результатов в случае использования ре
актора для производства электричества. Обе станции являются составной частью национальной си
стемы снабжения электричеством в качестве электростанций с базовой нагрузкой, они производят
около 15% всего необходимого электричества в тех районах, где они расположены. В течение семи
лет, прошедших с начала работы станции в Колдер-Холле в 1956 году, значительно улучшена их ра
бота в этом направлении.
Выход мощности реакторов увеличился по сравнению с первоначальной проектной цифрой более
чем на одну треть. Это в значительной степени достигнуто в результате тщательного исследования
методов температурной оценки топливных элементов и использования управляющих стержней в качестве
подвижных поглотителей в дополнение к неподвижным поглотителям, используемым для формирования
потоков. Критерий, на котором основывается контроль температуры, разрабатывается в течение ряда
лет с целью получения максимального выхода мощности при одновременном обеспечении вполне надле
жащего коэффициента безопасности. Одним из результатов этого является изменение систем турбо
альтернаторов с целью повышения их мощности с 21 до 27 - 30 мгвт (э л .) для обработки дополни
тельного пара.
На реакторах в Колдер-Холле и в Чепелкроссе в настоящее время величина общего коэффициента
загрузки превышена на 92% , несмотря на то , что перегрузка' осуществляется без дополнительного
увеличения количества топлива. Увеличение коэффициента эагруэки достигнуто в основном в резуль
тате значительного сокращения времени при перегрузке топлива и тщательного планирования основной-
работы по ремонту, которая связана с остановкой реактора. В этом отношении увеличение коэффи
циента загрузки достигнуто в результате проведения методического изучения и применения методики
критической траектории. Потери в результате разрушения топливных элементов очень невелики.
Помимо эксплуатации станции для производства электричества, проводится большое число спе
циальных опытов по облучению с целью улучшения конструкции топливных элементов как для реакторов
в Колдер-Холле и Чепелкроссе, так и для гражданских реакторов в СК и за океаном. Признано воз
можным при тщательном планировании увеличить число таких опытов с незначительной потерей в произ
водстве и без превышения экплуатационного коэффициента безопасности.
Направление эксплуатации этих станций в будущем зависит от двух основных факторов, а именно:
возможности дальнейшего увеличения мощности реактора на выходе и увеличения периодов выгорания
реакторного топлива. Ожядаются.успехи в работе в обоих направлениях, особенно в последнем, и
это окажет положительное влияние на эффективность й экономические показатели станции.
EL DESARROLLO DE CALDER HALL Y CHAPELCROSS COMO CENTRALES NUCLEOELÉCTRICAS PARA
LA CARGA BASICA. Calder Hall y Chapelcross fueron concebidos en un principio como reactores de potencia

CALDER HALL AND CHAPELCROSS 409
de doble finalidad, principalmente destinados a producir plutonio con fines militares. Al diseñarlos, se adop
taron medidas con miras a obtener resultados óptimos desde ei punto de vista de la producción de electricidad.
Ambas centrales forman parte de la red nacional de distribución en calidad de centrales para la carga básica,
y suministran aproximadamente el 15 por ciento de la demanda en las regiones en que están situadas. Su
rendimiento para este tipo de producción se ha mejorado considerablemente en les siete años transcurridos
desde que Calder Hall entró oficialmente en servicio en 1956.
La potencia de los reactores ha sido incrementada más de un 33% con respecto a la cifra inicialmente
prevista. Esto se ha logrado principalmente merced a numerosos estudios de los métodos para determinar la
temperatura de los elementos combustibles, y empleando las barras de control como absorbedores móviles
para complementar a los absorbedores fijos con que se configura el flujo. £1 criterio en que se basa el control
de las temperaturas se perfeccionó paulatinamente para alcanzar una potencia máxima manteniendo al mismo
tiempo un margen de seguridad suficiente. Los turboalternadores se han modificado para aprovechar el exceso
de vapor producido incrementando su capacidad desde 21 MW(e) que daba el diseflo original hasta 27/30 MW(e).
Actualmente, los reactores de Calder Hall y Chapelcross alcanzan factores de carga globales superiores
a 92% a pesar de las interrupciones necesarias para cargar el combustible. Los incrementos del factor de carga
se deben en gran parte a las considerables reducciones del tiempo necesario para renovar el combustible y al
planeamiento cuidadoso de todos los trabajos de conservación esenciales que exigen la detención de los reac
tores. A este respecto, se ha ganado tiempo aplicando métodos más eficaces y racionales. Las pérdidas
debidas a elementos combustibles defectuosos han sido muy pequeñas.
Además de explotar la central para la producción de electricidad, se realizan en ella numerosos experi
mentos especiales de irradiación para mejorar el diseño de elementos combustibles, tanto de los reactores de
Calder Hall y de Chapelcross como de otros reactores del Reino Unido y de ultramar destinados a fines civiles.
Gracias a un planeamiento meticuloso, se ha logrado efectuar estos experimentos sin pérdidas apreciables para
la producción y sin reducir excesivamente los márgenes de seguridad.
La futura explotación de las centrales depende de dos factores principales: posibilidad de aumentar
nuevamente la potencia de los reactores y de prolongar el periodo de utilización del combustible. En estos
dos campos, y especialmente en el segundo, cabe esperar progresos que se traduzcan en un aumento de la
eficacia y rentabilidad de las centrales.
INTRODUCTION
Calder Hall and Chapelcross Works together comprise eight gas-cooled,
graphite-moderated, natural-uranium fuelled reactors, the last three re
actors constructed (at Chapelcross) being fitted with graphite sleeves. The
first reactor at Calder was made critical in May 1956 and the whole station
was completed early in 1959. At Chapelcross the first reactor achieved
criticality in November 1958 and the station was operating at full power
early in 1960 [1]. The initial design figure for reactor power was 180 MW(t)
but development of operating techniques has enabled considerable power
increases to be achieved. Present reactor powers vary from over 230 M W
to 250 M W , the highest powers being achieved on the graphite sleeved re
actors. In addition, refuelling and maintenance times have been consider
ably reduced since 1956 and overall load factors of 94% are now being
achieved. Between refuelling shut-downs load factors of well over 98% are
being regularly achieved.
Each station has eight turbo-alternator sets, the initial ratings of which
were 21 MW(e). In order to cope with the excess steam made available by
the increased reactor powers, six of the Calder turbines have been rebladed
to allow generation of 27 MW(e) per set. In addition, large quantities of
process steam are being provided for the Windscale plant. The saving of
coal thereby achieved amounts to about 50 000 t/yr. At Chapelcross four

410 J. McCRICKARD
TABLE I
C A LD ER H A L L AND CHAPELCROSS REACTORS
Improvements over design conditions
Design
conditions
Present
performance
Reactor circuits
Maximum fuel-element can temperature 408" С 430" С
Gas temperature at heat-exchanger inlet 336'C 345° С
Gas temperature at heat-exchanger outlet 135'C 138-С
Coolant flow per heat exchanger 490 lb/s 635 lb/s
Steam circuits
High -pressure steam flow per heat exchanger 99 000 lb/h 126 000 lb/h
High-pressure steam pressure 195 lb/in*gauge 235 lb/in*gauge
High-pressure steam temperature 315*C 325'C
Low -pressure steam flow per heat exchanger 29 650 lb/h 46 000 lb/h
Low -pressure steam pressure 48 lb/in2gauge 60 Ib/in!gauge
Low -pressure steam temperature 180"C 185*C
Reactor power 180 MW 240 MW
Gross electrical generation 42 MW (e) 55 MW (e)
Net electrical generation 34.5 MW (e) 45 MW (e)
of the turbines have been rebladed to permit generation of 27 MW(e) per
set and four to permit generation of 30 MW(e) per set.
Some details of the means by which these power increases have been
achieved, while still operating within the safety limitations of the plant, will
be given later. However, the facts show that both Calder Hall and Chapel
cross have functioned as highly efficient production units on a normal oper
ating basis from start-up, and have not been used simply as prototypes.
This type of reactor has been used in the United Kingdom as a basis for the
first phase of the civil programme for the generation of electricity using
nuclear reactors. Present operating conditions at Calder Hall and Chapel
cross compared with design values are shown in Table I.
The reactors are operated to provide electrical base load, one of the
aims being to achieve maximum availability and to demonstrate that reactors
have a high standard of reliability. In order to do this, every effort has
been made to reduce planned shut-downs such as refuelling and maintenance
periods. The overall load factor has been increased from 67% in the very
early days of operation to 94% in 1962, the most striking improvement arising

CALDER HALL AND CHAPELCROSS 411
from a cut in the refuelling times from 22.5% to 4%. The extent of the im
provement has been such that refuelling is no longer the controlling factor
in so far as outage times are concerned. Maintenance requirements are now predominating and special attention is being given to the planning of
such work — this will be referred to later in the paper. The reliability of
the operating performance can be illustrated by the fact that during the winter
periods of I960, 1961 and 1962 the maximum generated load during peak
load periods was maintained by both stations.
As base-load stations, both Calder and Chapelcross are integral parts
of the National Grid system and each supplies about Í5% of the load in the
areas in which they are situated. Fig. 1 shows their positions in the grid
system and it can be seen that Calder is connected to the National Grid by
much longer transmission lines than Chapelcross. The effects of this on
operating experience are evidenced by an incident in 1960 when both stations
were subjected to very severe electrical storms when lightning struck the
overhead transmission lines from Calder to Hârker [2]. The transmission
line protection operated and isolated the section, but the voltage transient
which occurred was sufficiently severe to stop the main blower drive motors.
The reactor protection was not affected by the voltage variation and cor
rectly tripped the reactors as coolant mass flow fell. Action has been taken
to improve the stability of essential electrical equipment during such faults
so that all important auxiliary plant has a stability under electrical voltage
variations equal to or better than the stability of the coolant circulator
driving motors, which are linked to the safety circuits. .
At Chapelcross, however, the effect of such storms is much less
marked. Chapelcross has four transmission lines which approach the Works
from different directions and, except for a section of approximately 14 miles
long, are geographically separated. The lines carried on the double circuit
section emanate from different sub-stations. It is possible that a lightning
strike on the Chapelcross system, unless directed at the 132-kV busbars,
would leave the Works still connected to two other sub-stations and retaining
at least 50% of its grid connecting capacity. In fact, of the six recorded
occasions of lightning storms affecting Chapelcross, five have resulted in
the tripping of single lines and one has resùlted in three lines tripping due
to the incorrect operation of the protection circuits on two of them. In the
case of Calder, the two transmission lines to the North, which represent
two-thirds of its grid connecting capacity, are carried on double circuit
towers. They are, therefore, simultaneously vulnerable to lightning dis
turbances along their path. As nuclear power stations at present normally
have to export their power via long transmission lines, an important feature
to prevent shut-downs must be the matching of reactor protection and coolant
circuits to the transients which may occur during fault clearance by trans
mission line protection.
The power developed by the stations and the electrical load factors
achieved since start-up are shown in Fig. 2. The excellent progress shown
in these diagrams is in part due to an improvement in skill and knowledge
of the personnel operating and maintaining the plant. This is further evi
denced in Table II which shows how the numbers of automatic shut-downs
at Chapelcross have decreased each year since start-up. Similar progress
has been achieved at Calder.
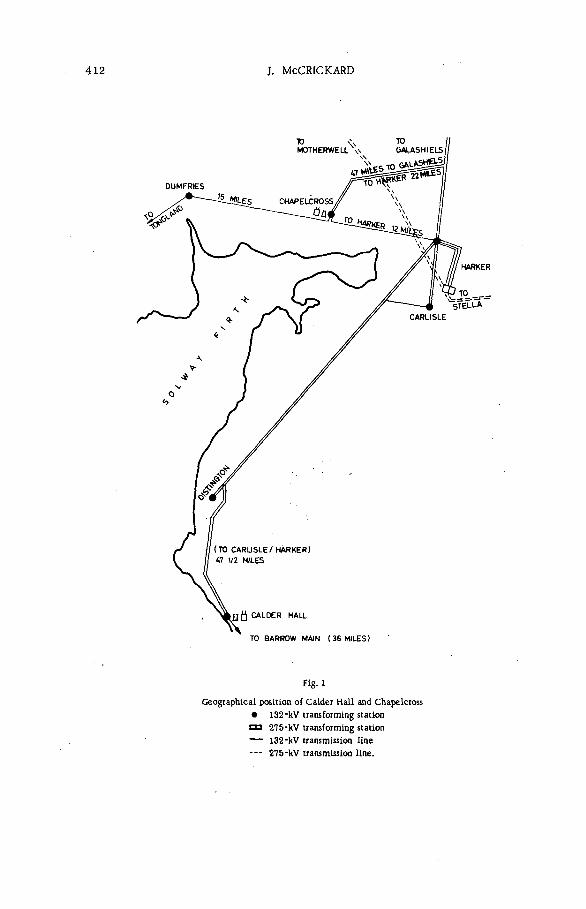
412 J. McCRICKARD
Fig-l
Geographical position of Calder Hall and Chapelcross
• 132-kV transforming station
ВЭ 275-kV transforming station
— 132-kV transmission line
--- 275-kV transmission line.

CALDER HALL AND CHAPELCROSS 413
AUG 1956CHAPELCROSS FIRST SET COMMISSIONED LAST SET COMMISSIONED MAY I960 MARCH 1959
Fig. 2
Electrical generator and load factor
TABLE II
CHAPELCROSS REACTORS
Automatic shut-downs
Year Equipment *
faults
Operational
errors
No. of reactors
at power
Trips/reactors/
year
1959 5(10) 3 2 9
1960 4(14) 11 4 7
1961 2(2) 4 4 2
1962 2(1) 1 4 1
* Figures in brackets indicate the number of "flashovers" on the main gas blowers -
a special type of fault which has now been virtually cured.
414 J. McCRICKARD
Reactor output is limited by various factors, the most important being
the assessed safety margins concerned with the reactor core and the "design"
limitations of the various items of plant. These in turn lead to a list of
operating limitations which the reactor operator is bound to observe at all
times. However, this does not prevent the margins left for uncertainty
in a design from being examined and plant operating conditions adjusted to effect improvement [3] .
Improvements in performance of the Calder and Chapelcross reactors
have followed from practical experience of the effects of different absorber
patterns and configurations of partially-inserted control rods under dif
ferent operating conditions. The practical aspects of the optimization of
power distribution in these reactors, which have no facilities for on-load
fuel changing, can be considered under two major headings: variables which
must be fixed before the reactor is taken to power, such as absorber pat
terning and fuel-element loading; and other factors, such as control-rod
insertion, which can be altered while the reactor is at power. Since the
power losses arising from errors in absorber patterning may be heavy, there
is a strong incentive to develop a method of predicting the temperature dis
tribution associated with a particular reactor charge [4]. In order to achieve
accurate results, a computer programme has been produced [5], the object
of the programme being to predict fluxes and temperatures for all channels
in the reactor. In addition, it is required to assess the effects of replacing
fuel channels with channels of absorber as core irradiation prpceeds. As
information on the differences between predicted and measured tempera
tures has accumulated, corrections have been applied to the programme.
The net result of this work has been to allow optimization of power by the
choice of an initial absorber pattern when the reactor is loaded. During
the irradiation of the fuel, further adjustments to the absorber pattern are
made by using selected control rods as movable absorbers — this is par
ticularly important in these reactors, where changes infixed absorber loading
can only be made after shutting down the reactor. As control-rod insertion
into the core increases (with increasing irradiation) flux and temperature
distributions are adversely affected and reactor power is reduced. An op
timized temperature distribution can be achieved, and maintained for con
siderable periods, by inserting some of the control rods further into the
core. Increases in reactor power of up to 20 M W have been achieved by
this method.
In the Calder-type reactors the coolant flow is matched to the flux shape by gagging of fuel channels to give the desired maximum fuel-element can
temperature. In practice only twenty-one different gag sizes are used, so
that many of the channels in the reactor may be as much as 40°C low. In
the operating reactor the temperature distribution is inferred from a limited
number of thermocouple readings, e. g. in the Calder and Chapelcross reactors
there are 104 thermocouples loaded, two in each of four channels on 13 se
parate radii. The channels into which thermocouples can be loaded are
limited and it is, therefore, difficult to obtain a really good estimate of the
maximum can temperature in the reactor. In fact, the reactor is controlled
by taking the mean maximum indicated can temperature on each of the
INCREASING REACTOR POW ER

CALDER HALL AND CHAPELCROSS 415
instrumented radii and increasing reactor power until one of these tempera
tures attains the limit.
The use of smaller diameter thermocouples has enabled more tempera
ture measurements to be made and thus more information obtained about the
random and systematic variations in fuel-element temperatures. A new
method of temperature assessment has been defined based on the statistical
probability of any fuel-element temperature exceeding the melting point
of Magnox during the temperature transient which would arise following a
fracture of one of the main gas circuits with complete loss of coolant, but
with control-rod insertion. This new system of fuel-element temperature
assessment has now transferred control of reactor power to the operating
limit on the temperature of the steel of the top dome of the pressure vessel.
Further research and development work is now in progress to re-assess
the safety margins involved in the setting of this limit.
An interesting, and unexpected, limit on reactor power arose from the
observation that temperatures in diagonally opposed quadrants of the reactor
were higher than those in the other two quadrants after one of the heat ex
changers had been returned to circuit. The effect was observed on one of
the Calder reactors in 1959 and it was possible to carry out tests during
the commissioning of Chapelcross Reactor 4 to demonstrate that with four
blowers in circuit two flow patterns are possible. The solution was also
found: raising power should be carried out with two diagonally opposed
blowers running 100 rpm in advance of the other pair. Changes of up.to
10 M W in reactor power have been achieved by this means.
INCREASING L O A D FA C TOR S
Overall load factors at Calder Hall and Chapelcross are now over 94%;
even in its first full year of operation, the thermal load factor at Chapelcross
was 79%. Table III shows the improvements at Chapelcross since 1959.
A summary of outages during 1962 is given in Table IV.
It can be seen that the largest single item is refuelling and it is in this
field that the greatest gains have been made. At Chapelcross the first re
fuelling of a whole reactor core took 35 d; recently a two-thirds reactor
refuelling was carried out in 9 d. This improvement has been achieved by
careful attention to:
(a) Plant;
(b) Procedures;»
(c) Planning.
(a) The refuelling equipment, of course, suffered from teething troubles;
these were dealt with as matters of urgency and all components with a re
latively short life have been redesigned to improve reliability and also to
permit rapid replacement [6] .
The use of television cameras has proved invaluable, both for inspection
purposes and as a means of assessing the action to be taken when fuel ele
ments have suffered damage which prevented their being discharged by the
standard methods. Much development work has been done to improve the

416 J. McCRICKARD
TABLE III
CHAPELCROSS REACTORS
Overall load factors
Year Thermal
load
factor
<%)
Electricity
exported
(Units x 106)
Electrical
load
factor
0o)
1959 79.3 258.759 *66.0
1960 86.8 995.524 82.5
1961 85.3 • 1202.262 83.8
1962 94.3 1403.660 93.6
* Six generating sets were commissioned during this period.
MWd producedThermal load factor = — —-- --- ; ,—
MWd produced + MWd lost
......................... Units exportedElectrical load factor = -------
Hours x (target generation
capacity - target own usage)
TABLE IV
CHAPELCROSS REACTORS
Summary of outages - 1962
Blower maintenance 0.53°o
Other maintenance . .. 0.21%
Automatic shut-downs . . . . 0.09%
Physics experiments . . . . 0 20%
Failed fuel discharges . . . . 0.58%
Irradiation experiments . . . .4
0.67%
Refuelling ___ 3.43%
Total -- 5.71%
robustness and versatility of the television equipment. By making use of
annular hoses for carrying coolant to the camera, it is now possible to use
the equipment in the core at temperatures of about 150°C for several hours.
Several types of grab have been designed which operate directly from the
nose of the camera to remove small loose articles. The importance of this
equipment cannot be overstressed [7].
CALDER HALL AND CHAPELCROSS 417
As far as possible, plant maintenance is carried out between refuelling
shut-downs. In certain cases, plant modifications have been carried out
to enable this to be done, for example, extra isolating valves have been
fitted to the humidriers to provide double isolation so that they can be worked
on safely with the reactor at power.
(b) Fuel-handling procedures and techniques have also received careful
attention. Specialist teams have been formed to carry out the tasks of fuel
handling and also the dfetailed planning of fuel movements. This planning
is carefully integrated with the maintenance work to be carried out on the
reactor. After each refuelling operation a careful analysis is carried out
with the object pf identifying areas where further improvements can be made
Method study techniques have been applied which have resulted in an increase
in discharge machine utilization from 50 to 70%.
Considerable advantage was also gained from a simple modification to
the fuel-element thermocouple leads. Originally these elements had to be
discharged-separately into a special container and then handled separately
at the cartridge cooling pond where the thermocouple cable was cut by a
remotely operated mechanical device. The modification consists of a small
length of reduced diameter on the cable near the element, a sharp pull severs
the cable at this point, the cable is wound onto a shielded drum and the fuel
element discharged in the normal way. These "weak link" thermocouple
cables have now replaced the original type.
(c) The improvements in refuelling techniques have reached the point where
the outage time due to refuelling shut-downs depends on the speed with whicn
essential maintenance and inspection work can be carried out. Method
study techniques are being employed here also, in conjunction with Critical
Path Planning to identify the jobs where attention is most urgently required.
In all project or outage planning, the jobs required to accomplish the pro
ject must be determined. This is usually easy to do, but finding how they
interrelate and constrain each other is not so easy. The critical path
method does this graphically by denoting each job or activity by an arrow,
and constructing a network of these on the basis that any job cannot start
until its necessary predecessors are complete. Once the network diagram
is complete and time estimates given to each job, by previous experience,
time study or estimation, the longest sequence of jobs from beginning to end
of the network — the critical path — can be found [8]. The jobs lying on this
path control the total duration of the projects. From the network, jobs can
be found which can be done concurrently, thus saving time. In addition,
effort can be diverted from jobs not on the critical path further along the
network to earlier jobs which are on the critical path. In simple networks,
earliest and latest possible starting times and latest .possible finishing fîmes
for any job can be easily calculated by manual methods, but where the num
ber of jobs runs into some hundreds, a digital computer may be used to
calculate minimum costs, optimum manning, etc. Fig. 3 shows a sample
network: this is an actual example and indicates how this method of appraisal
can direct attention where it is needed. Before carrying out this analysis
it was thought that the more complicated task of electrical overhaul was
the "holding” item, rather than bellows inspection.
27

418 J. McCRICKARD
INSPECT BELLOWS
Fig.3
Critical path method — gas circulator overhaul
“ ■* Critical path
Numbers indicate time taken in hours to complete each job.
F U E L- E LE M E N T P E R F O R M A N C E
The excellent performance of the fuel in the Calder and Chapelcross
reactors has also helped considerably in maintaining high load factors. Of
the several hundred thousand standard fuel elements loaded into the Calder
and Chapelcross reactors, only seven sudden failures have occurred. These
were detected by a sharp rise in the gaseous activity of the bulk coolant,
and in each instance the reactor was shut down immediately. The failures
occurred in newly loaded elements after a short period of irradiation. Sub
sequent examination showed in all instances a leak in the end cap weld at
one end of the element, and a crack or split in the can wall below which was
a mound of oxide. The end cap leaks were undetected manufacturing defects
or the results of damage during loading. Oxidation began when the element
was loaded, the coolant leaking in through the hole, some distance from
the fuel itself, until the mound of oxide on the fuel caused rupture of the
can itself.
The mechanism of failure suggested that the rate of fission-product
emission might be increased by creating a pressure differential across the
leak, which can be done by steady reduction of circuit pressure with the
reactor at low power. This method has proved very successful and since
its use to prove all new fuel immediately after loading, there has not been
an unscheduled shut-down on any reactor caused by such faulty fuel. Sub
sequent investigations have shown that enhanced emission of fission products
can also be obtained by power and temperature oscillations; the resulting
differential expansion between canning and uranium is thought to have the
same effect as a pressure step.
The only systematic mode of failure experienced has resulted from
a tendency for cavitation and porosity to develop in the Magnox cladding of
the cooler fuel elements in a channel; at this temperature the ductility is
sometimes inadequate to accommodate the small dimensional changes of the
CALDER HALL AND CHAPELCROSS 419
uranium under irradiation. With the original type of Magnox cladding in
tended only for low irradiation, cavitation developed in some cartridges
after about a year, but others have satisfactorily withstood four years in
a reactor [6] .
C A L D E R AN D CHAPELCROSS AS E X P E R IM E N T A L REACTOR S
In addition to operating the eight Calder and Chapelcross reactors as
electricity production units, a major activity of the Production Group of the
Atomic Energy Authority is the manufacture and marketing of reactor fuel.
It is anticipated that more than 100 000 fuel elements per year will be sup
plied over the next few years to the first generation of civil nuclear power
stations [9].
The uranium fuel rods for civil reactor fuel elements are almost identi
cal with those employed in Calder reactors but the fuel-element can designs
vary considerably. Various forms of helical finning with longitudinal
"splitter" blades replace the simple circumferential fins and short support
braces of the Calder fuel elements. New metallurgical treatment has im
proved the low-temperature ductility of the cans, which have been designed
to withstand on-load charging, and the effects of higher irradiation levels.
These design changes depended initially on extensive out-of-pile tests. To
support these a comprehensive testing programme was mounted in the Calder
and Chapelcross reactors to test design details before bulk manufacture.
In this respect the Chapelcross sleeved reactors have provided con
siderable versatility in accepting sleeved elements and other elements of
greater than normal diameter.The Calder and Chapelcross production reactors are particularly
suitable for these tests since they can permit the irradiation of relatively
large numbers of fuel elements, thus providing the necessary statistical
accuracy. Minor modifications to fuel handling equipment were necessary,
but considerable effort has been necessary to increase in-pile instrumen
tation. An essential part of the irradiation testing programme has been
the detailed metallurgical examination of the irradiated fuel by the A. E. A.
Reactor Group's Windscale Laboratories [10].,
In practice, the capacity of a reactor for experimental work is limited
by the conflicting requirements of different experiments. There is, there
fore, considerable advantage in having a number of reactors for large scale
fuel testing under differing environments. Substantial numbers of fuel ele
ments with different forms of heat transfer surface and having different
metallurgical treatments have now received irradiations up to channel aver
ages of over 3000 MWd/t (metric). The Berkeley fuel, loaded into a Chapel
cross reactor in 1959, is at present leading the fuel operating in the Berkeley
Civil Station by nearly 3000 MWd/t [9] .
In service, the civil reactor fuel elements will experience rapid thermal
changes on being loaded and the sector control rods will make frequent sig
nificant movements to counter the reactivity effects of the insertion of the
refuelling machine grab. On loading a fuel element may suffer changes of
about 100°C/min and channels near the sector rods will experience some
2000 thermal cycles of over 10°C during their irradiation life.

420 J. McCRICKARD
To test the effect of on-load charging, an element was inserted into
a fuel channel at power and irradiated at normal temperature before being
withdrawn. Examination showed that the element had suffered no damage
as a result of this full-power charge and discharge procedure. In addition,
a reactor has been operated for many months with two diagonally opposite control rods at the outer edge of the reactor oscillating with similar ampli
tudes but out of phase. Reactor power was hardly effected and no major
significant thermal changes were observed. However, fuel near the oscil
lating rods suffered cycling of about 30°C. Fuel operating at a mean tempera
ture of about 350°C has experienced 30 000 cycles and other cartridges at
a mean temperature of 450°C have received 15 000 cycles without failure.
Such irradiation experience under actual operating conditions is unioue,
and represents a convincing demonstration of the expected performance
and long term endurance of uranium metal, magnesium-alloy clad fuel ele
ments. It seems likely that operators of British Magnox designated reactors
will eventually be expecting fuel irradiation lifetimes of 4000to 5000 MWd/t,
with a consequent reduction in fuelling costs [9].
Many experiments have been performed to measure the main parameters
affecting the safe and efficient operation of the plant. Most of the experi
mental techniques have a direct application in the civil nuclear stations,
and in certain cases the results obtained have reduced the need for similar
measurements on the civil reactors. Experiments of particular value to
the civil programme were performed during long irradiation runs at both
Calder and Chapelcross.
From the standpoint of nuclear safety the most important reactor para
meters are those which determine the net reactivity of the system. This
is the algebraic sum of positive and negative reactivity contributions and
must be assessed for all operational conditions. Nuclear safety requires
a similar assessment under possible fault conditions, which involves
temperatures outside the range of normal reactor operation. In the initial
stages of fuel irradiation the overall temperature poisoning is negative so
that cold conditions are the most reactive and hence, for shut-down capacity
requirements, the most stringent. As irradiation proceeds the moderator
temperature coefficient becomes progressively more positive, until at about
650 MWd/t and normal operating temperature, the hot conditions become
the most hazardous. Since it is not possible to measure reactor parameters
at temperatures considerably in excess of operating values, the semi-
theoretical expression for moderator temperature coefficient has been extra
polated to reactor temperatures close to the melting point of uranium,
showing that the Calder-type reactors would remain shut down even in this
extreme physical state. Experiments performed on power reactors must
be less precise than those performed under laboratory conditions. Such
full-scale plant experiments are costly and there is, therefore, an economic
limit to the accuracy to which parameters should be measured. Beyond
this limit further experiments cannot normally be justified, but at Calder
and at Chapelcross some attempt has been made to achieve greater pre
cision of measurement than is justified by plant requirements.
Due to significant differences in size and mode of operation between
the civil and the Calder-type reactors, some measurements of the main
CALDER HALL AND CHAPELCROSS 421
reactivity parameters will be required on the civil reactors.. The extent
to which experimental work of this kind can be fitted into the operational
routine will inevitably be restricted by base-load generation requirements [11].
CONCLUSIONS
Thirty-seven reactor years of base-load operation at Calder and Chapel
cross have been accompanied by marked increases in power output, ex
ceedingly high load factors and steady improvements in fuel element per
formance. This record, in conjunction with the almost complete absence
of faults, has established great confidence in the operators of these stations;
more important, it firmly establishes this type of reactor plant as capable
of routine operation in a National Grid system.
Further improvements will be achieved at Calder and Chapelcross. To
some extent increases in power output must be controlled by the tempera
ture limit imposed on the pressure vessel steel; a research programme
is under way to establish this limit with more accuracy. However, there
are other ways of extracting more heat from the core and several are under
consideration, e.g. improvements in fuel-element design, improvemerts in
the heat-transfer properties of the coolant gas and the possibility of modifi
cations to the heat-exchanger system. All such proposals must Ъе approved
on ecomonic grounds in order that capital spent and generation time lost
should be recovered with a suitable margin of profit. Nevertheless, the
prospects for further increases in output are considered to be good.
Increases in load factors will be difficult to obtain and it is of the great
est significance that, even with off-load charging of fuel, outage times are
governed by plant maintenance requirements — not by the need to remove
fuel elements.
Off-load fuel handling is by no means as uneconomic as it seemed when
Calder Hall was first constructed. As the Calder and Chapelcross stations
move to higher fuel "burn-ups" a batch discharge programme is being de
veloped which will minimize electricity production costs and which will also
enable reactivity requirements to be met without reducing the present load
factors [12] .
R E F E R E N C E S
[]] McCRlCKARD, J. , "The Safety Implications of Commissioning and Operating Experience at Calder Hall
and Chapelcross Power Reactors” , paper presented at the Vllth Nucl. Congress, Rome, (June 1962).
[2] GOODWIN, V. R. and MARSHAM, T. N. , "Safety Aspects of Operational Experience with the Calder
Hall Nuclear Power Plant” , Reactor Safety and Hazards Evaluation Techniques, _I IAEA, Vienna (1962)207.
[31 MARSHAM, T. N. and GOODWIN, V. R ., "Key Problems in the Operation of Gas-Cooled Reactors",
paper presented at the European Atomic Energy Society Symp., Cannes,. (October 1962).
[4] BRIGGS, D- S. , ENDERBY, J. A. and HORSLEY, R. M. , "Practical Aspects of Optimisation of Power
Distribution in Reactors”, paper presented at Symp. on "The Physics of Graphite-Moderated Reactors",
Bournemouth (April 1962).
[5] ENDERBY, J. A. , F. T. D. 2 - A two- dimensional programme for Thermal Reactors, TRG. 46 (R), Her
Majesty's Stationery Office, United Kingdom.
[6] GOODWIN, V. R. and MARSHAM, T. N. , "Increasing Plant Availability", Nucleonics (April 1962)..
П MacFARLANE, C. J. and DIXON, F ., "The Application of Industrial Television to Gas-Cooled Nuclear
Reactors of the Calder Hall type", paper presented at Int. Television Conference, London. (May/June
1962)..
422 J. McCRICKARD
[8] MacFARLANE, C.J. . "The Application of Critical Path Planning Techniques to the Maintenance of
Nuclear Power Reactors" (Not yet published).
[9] McKEAGUE, R. , "Operational Experience and Improvements in the Performance of the Calder Hall
and Chápelcross Reactors and their use as an Irradiation Testing Facility for Prototype Fuel Elements",
paper presented at Symp. at Tokai Mura (March 1963).
[10] FAIR, D. R. R. and MARSHAM, T. N. , "The Contribution of Calder Hall and Chapelcross to the Civil
Programme", Nucl. Power -(November 1961).
[11] HOTCHEN, E. P. , JENKINSON, P. , LEACH, R. and STURMAN, H. G. , "The Measurement of Reactivity
Parameters on Operational Reactors", paper presented at Symp. on The Physics of Graphite-Moderated
Reactors, Bournemouth (April 1962).
[12] JOHNSON, A. , Fuel Cycles in Magnox Reactors, these Proceedings.
D I S C U S S I O N
S. YIFTAH: The development of Calder Hall and Chapelcross as base
load power stations has been strongly emphasized, and one cannot but be
impressed by the excellent performance of these reactors. The question
of economics naturally comes to mind, however, and I wonder how seriously
the dual nature of Calder Hall and Chapelcross affects the economics of
power production. Can one quote any meaningful cost per kWh for reactors
such as these or does every consideration of economics have to be discarded
as irrelevant?
J. McCRICKARD: The first consequence of this dual purpose is a lower
overall efficiency than could be attained in nuclear stations désigned only
for electrical power production. Your surmise that considerations of eco
nomics must be put aside is therefore quite correct; because of the special
commitments which these two stations have, I can quote no figures that would
allow a meaningful comparison with the cost of other stations. Needless to
say, Calder Hall and Chapelcross are operated as economically as possible
under the circumstances.
O. CERNY: How do you determine the location of CO2 leaks into the
environment, and of water leaks into the CO2 ?
J. M cCRICKARD: The loss of C O 2 is measured during each shift by
noting the amount of CO2 supplied to maintain vessel pressure at a constant
level. This quantity — no more than 1 t/d — is not measurable in the local
environment and the contamination hazard is negligible; nor is the loss ex
pensive, since the coolant gas costs only £ll/t.
Water leaks into the coolant gas are first detected by the infra-red gas
analysers installed in each circuit and afterwards are confirmed by chemical analysis of the coolant gas. The actual point of leakage is then found by
draining the steam side and testing for CO2 through the header caps, again
with an infra-red gas analyser.
O. CERNY: How is the CO2 that leaks into the plant's rooms removed,
and its activity reduced?
J. McCRICKARD: I have already pointed out that the amount of C02 lost
is very small and of negligible activity. Nevertheless, all parts of the plant
are equipped with a plenum ventilation system; fresh-air blowers are available
and, for emergencies, breathing sets are located in various parts of the
plant.
O. CERNY: How much moisture do the humidriers allow in the CO 2?
CALDER HALL AND CHAPELCROSS 423
J. McCRICKARD: The moisture content of the circuit gas is normally
maintained at about 10 ppm by the operation of the humidriers. However,
the purity of the gas supplied for the system is so high that it has been found
possible to dispense with the use of the humidriers except during the first
few weeks of normal operation after fuel charging. Similarly, the activity
of the coolant gas is kept at such a low level that the bypass filters and
cyclones can be taken out of service, thus allowing a higher rate of gas flow
through the core for a given blower power.
1. PA.ULICKA: Have operations at Calder Hall had any measurable
effect on the surrounding region? I should also like to know how much radio
active waste is discharged from Calder Hall in the course of 24 h. and what
its specific activity is.
J. McCRICKARD: The effect on the surrounding countryside of oper
ations at these two plants is so small as to be scarcely measurable; in fact,
it is rather obscured by the far more significant effect of fall-out from
atomic weapons tests. The second part of your question is best answered
by considering the effluent discharged from the Chapelcross plant. We are
officially authorized to discharge a certain amount of liquid waste — about
20 c/month — from the pond where irradiated fuel is stored. This is not
a large amount, but in point of fact we have never exceeded 10% of it. That
the discharge of waste can be kept at this low level is largely due to the good
integrity of the Magnox fuel-element cladding; there is very little wear and
corrosion when the elements are immersed in reasonably clean water.

THE PERFORMANCE OF MAJOR PLANT ITEMS AT CALDER HALL
E. L. DESBRUSLAIS
UNITED KINGDOM ATOMIC ENERGY AUTHORITY, SEASCALE,
CUMBERLAND, UNITED KINGDOM
Abstract — Résumé — Аннотация — Resumen
THE PERFORMANCE OF MAJOR PLANT ITEMS AT CALDER HALL. For over six years Calder Hall has
been operated as a base-load power station and has sustained faults similar to those experienced by conventional
power plants. All the faults have occurred in the conventional plant and none in the nuclear reactors them
selves. Experience has demonstrated that from a reactor safety viewpoint, reactors and major plant items,
together with the Grid connections, must be treated as a whole.
No significant changes have been detected which suggest that the reactor pressure vessel or the graphite
moderator will limit plant life. Asymmetric temperature distribution exists round the outlet gas ducts and now
limits reactor power. The initial fitting of more thermocouples, strain gauges and provision for visual exami
nation at high stress and temperature areas is recommended. The humidriers are no longer used during normal
operation and consequently a small increase in reactor power has resulted.
Recommendations are made for the frequency of surveys of heat exchangers, main gas ducts and bellow
units. A small increase in steam generation has resulted from reducing gas bypassing.
Only minor difficulties have been experienced with the centrifugal type of gas circulators. A small
loss in production occurred initially because of commutator flash overs on the highly stressed blower drive
motors and generators.
The provision of duplicate stand-by auxiliaries, together with the interconnection of steam and water
systems, has been amply justified.
The BCDG equipment has proved extremely satisfactory. Because the channel group sensitivity is higher
than necessary, modifications to achieve shorter cycle times at the expense of some sensitivity are being
contemplated.
The, re-arrangement made to the power supplies for reactor instrumentation and safety circuits is discussed.
The grading of alarms and sequence of importance and a "first up" feature are recommended. The two-
guard-line system has proved adequate and the need for three or more is questioned. Statistics have shown
that the data-logging equipment is extremely reliable.
More standardization of fuel handling equipment is advocated. The use of special flasks and special
discharge equipment are time-wasting and should be discouraged. Modifications made to the charge/discharge
machines and auxiliary plant are described. Careful handling of fuel during loading is emphasized. Fuel
channel television cameras and special grabs have enabled discharge times to be reduced.
Only minor faults have been experienced with the compled control-rod mechanisms and associated control
equipment.
As far as possible plant controls should be centralized and important control centres and items of plant
should be protected from accidental damage from external sources. Automatic start-up and parallelling features
for the emergency diesel plant are considered unnecessary but the plant could, with advantage, be centralized.
FONCTIONNEMENT DES ÉLÉMENTS PRINCIPAUX DE LA CENTRALE DE CALDER HALL. Depuis plus de
six ans, Calder Hall fonctionne comme centrale de base et a subi des défaillances semblables à celles qu'on
peut constater dans les centrales électriques classiques. Toutes ces défaillances se sont produites dans la partie
classique de la centrale; aucune n'a été relevée dans les réacteurs proprements dits. L'expérience a montré
que du point de vue de la sécurité du réacteur, il faut traiter comme un tout les réacteurs et les principaux
éléments de la centrale ainsi que les connections avec le réseau.
On n'a constaté aucune altération importante donnant à penser que le caisson du réacteur ou le ralentisseur
de graphite limiteront la durée de vie de la centrale. La distribution de la température autour des conduites
de sortie du gaz est asymétrique, ce qui limite actuellement la puissance du réacteur, û y aurait eu intérêt à
aménager au début un plus grand nombre de thermocouples.d'instruments de mesure des efforts et de dispositifs
permettant un examen visuel des zones soumises à des contraintes et des températures élevées. Les dessicateurs
425

426 E. L. DESBRUSLAIS
ne sont plus employés au cours du fonctionnement normal et il en résulte une légère augmentation de la puis
sance du réacteur.
Ia mémoire formule des recommandations pour la fréquence des inspections des échangeurs de chaleur,
des conduites de gaz principal et des soufflets. On a obtenu une légère augmentation de la production de vapeur
en réduisant le débit du gaz dans les circuits de dérivation.
Les appareils centrifuges pour la circulation du gaz n'ont causé que des difficultés minimes. Il y a eu,
au début, une perte légère de production due à des courts-circuits dans les commutateurs des générateurs et des
moteurs de ventilateurs soumis à un effort excessif.
On s'est aperçu que l'on avait eu raison de prévoir des auxiliaires de secours en double et d'interconnecter
les circuits de vapeur et d'eau.
L'appareillage de détection de rupture de gaine s'est révélé extrêmement satisfaisant. Comme la sensi
bilité pai groupe de canaux est plus élevée qu’il n'est nécessaire, on envisage des modifications qui raccour
ciront la durée du cycle au prix d'une certaine perte de sensibilité.
L'auteur examine les mesures que l'on a prises pour aménager l'alimentation électrique de l'appareillage
du réacteur et des circuits de sécurité. П formule des recommandations concernant le système d'alarme. Le
système à deux lignes s'est révélé satisfaisant et la nécessité d*en avoir trois ou davantage ne semble guère
s'imposer. Les statistiques montrent que les appareils d'enregistrement des données sont d'un fonctionnement
très sûr.
L'auteur recommande une standardisation plus poussée des appareils de manutention du combustible.
L'emploi de récipients et d'appareils de déchargement spéciaux fait perdre du temps et est déconseillé. L'auteur
décrit les modifications apportées aux machines de chargement et de déchargement et aux installations auxi
liaires. Il souligne l'importance du soin à apporter à la manipulation du combustible au cours du chargement.
L'emploi d'appareils de télévision dans les canaux à combustible, et de pinces spéciales, a permis de réduire
les temps de déchargement.
On n'a enregistré que des défaillances mineures dans les mécanismes complexes de commande des barres
de réglage et le matériel de contrôle connexe.
Dans toute la mesure du possible le contrôle de l'usine doit être centralisé et les principaux centres de
contrôle ainsi que les éléments importants de l'usine doivent être protégés de tout dommage accidentel pouvant
provenir de l'extérieur. Pour la génératrice diesel de secours, il ne semble pas nécessaire de prévoir le dé
marrage automatique et des circuits doubles, mais une centralisation ne serait pas inutile.
ХАРАКТЕРИСТИКА ОСНОВНЫХ УЗЛОВ УСТАНОВКИ В КОЛДЕР-ХОЛЛЕ. В течение свыше шести лет большая
установка в Колдер-Холле эксплуатируется как энергетическая установка с базовой нагрузкой. На
ней возникали такие хе повреждения, как и на обычных энергетических установках. Все поврежде-
ния имели место в обычной установке и ни одного - в самих ядерных реакторах. Опыт показал, что
с точки зрения безопасности реакторы и основные узлы установки вместе с приводами системы необ
ходимо рассматривать в целом.
Не обнаружено никаких существенных изменений, которые бы давали повод думать о том, что
корпус высокого давления реактора или графтоэыЗ замедлитель ограничат срок эксплуатации установки.
Асимметричное распределение температуры имеет место вокруг выходных газовых трубопроводов, и в
настоящее время это ограничивает мощность реактора. Рекомендуется установить вначале дополни
тельное количество термопар, контрольно-измерительные приборы для определения напряжения и обес
печить визуальное наблюдение за областями высокого напряжения и температуры.
В ходе нормальной эксплуатации осушители больше не применяются, и соответственно в резуль
тате этого достигнуто небольшое увеличение мощности реактора.
Дастся рекомендации относительно периодичности обследований теплообменников, основных газовых
трубопроводов и нижних узлов. Небольшое увеличение в производстве пара достигнуто в результате
уменьшения перепуска газа.
Небольшие трудности возникли лишь при эксплуатации циркуляторов газа центробежного типа.
Отмечено небольшое снижение производства вначале в результате кругового искрения коммутаторов
при высоком напряжении на моторах вентиляторов и на генераторах.
Оправданной является установка сдвоенного вспомогательного оборудования вместе с объединением
паровой и водной систем.
Оборудование B .C .D .G . оказалось в высшей степени удовлетворительным. Ввиду того, что чув
ствительность группы каналов выше чем необходимо, в настоящее время планиругтся изменения с цель»
укорочения циклов за счет некоторой чувствительности.

MAJOR PLANT ITEMS 427
Обсуждаются мероприятия по переоборудованию системы подачи энергии для приборов реактора
и контуров безопасности. Рекомендуются классификация степени опасности и важности и устройство
по первому выключению реактора. Выясняется необходимость иметь систему с двумя защитными ли
ниями и устанавливать три или более таких линий. Статистика- показала полную надежность обору
дования регистрации данных.
Оправдывается необходимость большой стандартизации оборудования по перегрузке топлива. Ис
пользование специальных баллонов и специального оборудования по разгрузке требует много времени,
и от этого следует отказаться.
Описываются изменения/ внесенные в механизмы по загрузке/разгрузке и во вспомогательную
установку. Подчеркивается необходимость тщательной обработки топлива во время загрузки. При
менение телевизионных камер в топливных каналах и специальных захватов позволило сократить время
разгрузки.
Небольшие неисправности отмечены лишь при эксплуатации сложных механизмов управляющих стерж
ней и соответствующего оборудования по контролю.
Насколько это возможно, основные системы управления установки должны быть централизованы,
и основные центры управления и узлы управления установки должны быть защищены от случайного по
вреждения при облучении внешними источниками. Признаются необходимыми автоматические пусковое
и параллельное устройства для аварийной дизельной установки, однако установка могла бы быть цен
трализована с пользой для дела.
RENDIMIENTO DE LOS PRINCIPALES ELEMENTOS DE LA CENTRAL DE CALDER HALL. Desde hace más
de seis afios, Calder Hall viene funcionando como central para la carga básica, habiendo sufrido avenas
similares a las que se registran en las centrales clásicas de electricidad. Todas las fallas se han producido en
la parte clásica de la central y ninguna en los reactores propiamente dichos. La experiencia ha demostrado
que, desde el punto de vista de la seguridad de los reactores, estos mismos y los principales elementos de la
central, asi como las conexiones con la red, se han de considerar en conjunto.
No se ha observado ningún cambio importante que sugiera que el recipiente de presión del reactor o el
moderador de grafito limitarán la vida útil de la central. La distribución de temperatura alrededor de los
conductos de salida de gas es asimétrica, lo cual limita actualmente la potencia del reactor. Se ha recomen
dado montar más pares termoeléctricos, asi" como instrumentos para medir deformaciones y dispositivos que
permitan observar visualmente zonas de tensión y temperaturas elevadas. Durante el funcionamiento normal,
no se emplean ya los desecadores Humidrier y gracias a ello se ha logrado un ligero aumento de la potencia del
reactor.
Se formulan algunas recomendaciones respecto de la frecuencia de las inspecciones de los intercambia
dores de calor, de los principales conductos de gas y de las juntas de fuelle. Se alcanzó un ligero aumento
en la producción de vapor reduciendo el caudal gaseoso en los circuitos de derivación.
Los aparatos centrífugos para la circulación del gas no han ocasionado más que dificultades de poca
importancia. Al principio se produjo una ligera pérdida de producción debida a cortocircuitos en los con
mutadores de los motores de las bombas y de los generadores, sometidos a esfuerzos excesivos.
Ha quedado plenamente justificada la instalación de motores auxiliares por duplicado y la interconexión
de los circuitos de vapor y agua.
Los aparatos para detección de defectos en las vainas han dado resultados altamente satisfactorios. Como
la sensibilidad por cada grupo de canales es mayor de la necesaria, se está estudiando la conveniencia de
acortar los ciclos a expensas de la sensibilidad.
El autor examina las medidas adoptadas para reordenar el sistema de alimentación eléctrica de los in
strumentos del reactor y de los circuitos de seguridad. Formula recomendaciones sobre el sistema de alarma;
el de dos lfneas demostró ser satisfactorio y no parece imponerse la necesidad de disponer de tres o más lineas.
Las estadísticas muestran que el equipo de registro de datos funciona perfectamente.
Aconseja normalizar más el equipo de manipulación del combustible y evitar el empleo de recipientes y
de aparatos de descarga especiales que suponen pérdidas de tiempo. El autor describe asimismo las modifica
ciones introducidas en las máquinas de carga y descarga y en las instalaciones auxiliares. Subraya la importancia
de manipular cuidadosamente el combustible durante la carga. La instalación de cámaras de televisión en los
canales para el combustible, asi como de pinzas especiales, han permitido reducir el tiempo de descarga.
Los complejos mecanismos de las barras de control y el equipo auxiliar sólo han sufrido averias menores.
En lo posible, habría que centralizar los controles de la planta y proteger los centros de control y los
elementos más importantes de la central contra daños accidentales que puedan provenir de fuentes externas.
428 E. L. DESBRUSLAIS
Para el generador diesel de emergencia, no parece necesario prever un arranque automático o circuitos parale
los, si bien una centralización no seria superflua.
1. G E N E R A L P E R F O R M A N C E
Because this paper highlights faults, difficulties and unusual experiences,
it is only right to state at the outset that the performance of Calder Hall
has been really outstanding. Although the Station was designed as an off
load discharge, dual-purpose nuclear plant producing plutonium as its primary product, it has been operated virtually as a base-load power station
at maximum load day and night, throughout the six-and-a-half years that it
has been in operation. During this period the thermal output of the reactors
has been increased by a third, and in order to make use of the excess steam
produced, five of the eight 21/24 M W turbo-alternators were rebladed to
produce 27 M W by November last year and the remaining three machines
will be rebladed during the next few months, thus increasing the total electri
cal generating capacity to 216 MW . Steam is also now supplied to the process
plants at Windscale where all the coal-fired boiler plants have been shut
down. The generation plant annual load factor based on the enhanced
electrical outputs has also progressively risen from 78 to 91% (in 1962, in
addition to maintaining an annual load factor of 91. 2%, steam equivalent to
the burning of 31 000 t of coal was supplied to the Windscale Works).
2. PRINCIPAL LESSONS FR OM FAULT INCIDENTS
2. 1. Fault incidents
The plant has sustained a number of faults such as could be experienced
by any conventional power station connected to a national grid system. All
the faults have occurred in the conventional plant or grid system, none in
the nuclear reactors themselves. Five of these incidents have demonstrated
that, because the reactors, heat exchangers, electrical blower drives,
turbo-alternators and grid connections are interconnected, the system must
be considered as a whole from a reactor safety viewpoint. Further, ex
perience has shown that all potentially hazardous occurrences, even those
which do not cause a fault, should be thoroughly investigated for it is sur
prising how such investigations can bring to light weakness in operating
procedures or protective systems.
These incidents, which have already been described by the author [1]
and also by M A R SH A M and G O O D W IN [2] , are summarized as follows:
2.1.1. Feed-water failure to the heat exchangers, as a result of the tripping
out of a transformer supplying the feed pumps and the condenser cooling
water pumps during testing, caused the temperature of the return coolant
gas to the reactor, and hence the temperature at the bottom of the reactor,
to rise 10% before appropriate corrective action was taken by the operators.
2.1. 2. The disintegration of a turbo-alternator due to overspeeding because
of the presence of fine cast-iron shot, inadvertently left in the steam system

MAJOR PLANT ITEMS 429
after construction, prevented the high-power governor valve and high-power
emergency stop-valve from closing, when the alternator was tripped on
load.2.1.3. An internal electrical system voltage disturbance occurred due to the
build-up and probably intermittent breakdown of a high resistance film on
the contact surfaces of the carbon brushes of the pilot exciter of one of the
alternators. This caused the main gas circulators to stop and the operation
of the control-rod tripping circuits to be delayed for a short time. A short
transient of 20°C was experienced by the fuel elements before the reactor
was tripped.
2. 1.4. An external grid voltage disturbance caused by lightning strikes on
the grid lines about fifty miles from Calder Hall led to a severe and pro
longed voltage disturbance. This caused all the induction motors associated
with the main Ward Leonard motor drives to slow down past the point of no
return and trip. Consequently a short shut-down of all reactors and turbo-
generating plant occurred. A somewhat similar incident occurred a year
later, but Calder Hall continued operating, although the Station became com
pletely isolated from the main grid system through transmission line faults.
2.1.5. Whilst a reactor was shut down a drop in feed-water pressure occurred
as a result of the faulty isolation of feed-water supply in Calder "B " through
a human error. This caused the standby feed pumps to start automatically,
run without water and eventually seize. Water was then supplied by other
pumps in the station through the installed cross-connectors.
2. 2. Principal lessons learned
The principal lessons learned from these incidents, and which have
now been applied as modifications to the plant, are briefly described below,
and should be read vis-à-vis the appropriate foregoing paragraphs.
2.2.1. Although the emergency pumps were started and corrective action
taken promptly, subsequent investigations showed the desirability for pro
viding interconnections between the feed-water suction and discharge ranges
of the two reactors feeding each turbine house. This modification sub
sequently proved to be of great value when incident 2.1.5 occurred. Arrange
ments have also been made whereby feed-water can be made available from
other external sources in an emergency for the removal of reactor decay
heat in the event of complete failure of all electrical supplies to the feed
pumps, or the complete loss of feed-water supply following a serious fracture
in the normal feed mains.
2. 2. 2. Additional steam-circuit cleaning was carried out during the com
missioning of the remaining reactors, namely acid cleaning of the heat ex-
, changers and prolonged blowing out of the steam pipework to atmosphere at
full pressure and flow and checking for the presence of cast-iron shot -by
means of etching plates.
The turbine governor and runaway stop valves have also been fitted with
hardened nitro-alloy guides. Larger clearances were provided between the
spindles and the guides to make them more resistant to hard particles and
back seating provided to seal off the gland when the valve was fully open.
The electrical protection system installed for the automatic tripping of
the alternator main circuit breaker as a consequence of the tripping out of

430 E. L. DESBRUSLAIS
a reactor has been disconnected. Experience has shown that there is ample time in which to off-load the alternators associated with the tripped reactor
because as the steam pressure falls, the turbines automatically unload
themselves.
As damage to pipework in the turbine house or damage to the cooling
tower ponds by flying fragments from a disintegrating machine could cause
flooding, which could affect essential electrical equipment or the air-cooling system for the main gas circulators, ramps and cuttings have been provided
to divert the flow of water from critical plant. For similar reasons duplicate carbon-dioxide supply mains have been installed to each reactor. In order
to safeguard personnel and equipment in the reactor control-rooms and
carbon-dioxide plant, suitable protection has also been provided at these
areas.
2.2.3. The reason for the formation of a high resistance film on the carbon
brushes has never been satisfactorily explained, but it is known that a simi
lar phenomenon has occurred elsewhere. To prevent recurrence of this
type of fault the frequency of examination of the brushgear of the alternators
and exciters was increased.
The protection system for the electrical drive motors for the gas circu
lators was modified, so that the opening of either circulator motor or gener
ator field breaker of the associated Ward Leonard set would open the 11-kV
О. С. B. to the induction drive motor, and also trip the reactor and start the
pony motor. Provision has now also been made in the reactor control-room
for the emergency starting of the pony motors. This supplements the auto
matic starting facilities which come into operation on loss of the main drive
motor and also the manual starting arrangements installed in the blower
houses.
2. 2. 4. The large grid voltage drop which occurred at Calder Hall was due
to the slowness of opening of some grid circuit breakers under fault conditions.
Following this incident the speed of operation of these breakers was increased.
No deficiencies in the safety circuitry or emergency arrangements were
revealed and the modifications referred to in paragraph 2.2. 3 worked as
intended. The complete shut-down of all four reactors and associated gener
ating plant, together with the severance of all main grid supplies to the
Station on account of the transmission line faults, did, however, show up
a number of minor deficiencies and the desirability of introducing modifica
tions which are briefly described later.
A somewhat similar incident occurred the following year, which de
monstrated that the stability of the induction motor drives for the Ward
Leonard generators for the blower drives could be significantly increased
by reducing the load on them. On this occacion faults on the grid trans
mission lines caused Calder to be completely isolated from the Cumberland
ring, but the Station continued to supply nearby towns until the 132-kV grid
ring connections were restored. As a result of this experience, whenever
the Station is informed that there is a very high probability of lightning in
the Cumberland area, the speed of the blower motors on one reactor is re
duced by about 10% and on the other three by about 4%. The loss in pro
duction as a consequence of such blower speed reductions is extremely small
and on several occasions this method of increasing stability has proved
worthwhile, e.g. during one weekend this last winter the Station success

MAJOR PLANT ITEMS 431
fully sustained more than forty grid surges, some of which were quite severe,
as a result of flashovers which occurred on the grid insulators dùe to salt spray deposits left by storm-force winds with gusts up to 90 mph.
A further precaution which is taken to ensure continuity of supplies to important plant at Windscale during extreme weather conditions or in the
event of severe overloading of the national grid system, is to disconnect two
turbo-alternators from the grid system and to use them as "house sets",
supplying essential local loads and Station auxiliaries.
The complete shut-down of all four reactors and associated generating
plant, together with the complete severance of all grid supplies to the Station
on account of the transmission line faults prompted a number of safety studies
and also showed up a number of minor faults, such as:
(a) Although the availability of important reactor and turbine house aux
iliaries had been ensured by the provision of standby plant supplied from
lead acid storage batteries in the reactors and turbine houses, the complete
cessation of power supplies highlighted certain omissions which, in this
instance, did not cause any embarrassment, for example, important aux
iliaries in the C O 2 storage house and Health Physics air sampling and counting
equipment were without electricity supplies. Additional emergency lighting
in certain areas was also necessary.
(b) A safety study showed that because very large and prolonged voltage
depressions on the AC supply mains will cause the speed of the gas circu
lators to fall below the point of no return and consequently shut down the
reactprs, the operation of safety circuits from the AC mains at Calder en
hances the overall reactor safety. A proposal that safety circuits should be
supplied from a self-contained constant voltage supply to eliminate the risk
of spurious reactor trips as a result of mains-borne surges was therefore
rejected. The ability of individual safety instruments to withstand short line
voltage surges was, however, checked by tests and showed that most safety
instruments will withstand a short voltage depression of 30% without tripping.
(c) The method for supplying certain control-room recorders was also
considered and it was concluded that they should be fed from battery-driven
motor alternators so that in the event of a loss in mains supply, a record
would be available of the ensuing temperature and power transients.,
(d) A sequence operations recorder with "first-up" indicator for the pro
tective relays would have speeded up post-fault analysis by removing the
uncertainty which existed in determining the order in which events occurred.
(e) Whenever new reactors are being commissioned, a test should be carried out to determine the effects on the reactor-blower-turbo-alternator system
of a complete loss of electrical power because, in spite of the very careful
consideration given during the design of the plant to the provision of emergency
power supplies to essential services, or the installation of battery-fed stand
by plant, important services can be easily overlooked.
(f) There are eight emergency diesel sets at Calder Hall, two on each re
actor. It is considered that they could have been, with advantage, central
ized away from the reactors. By this arrangement the total numbers could
have been reduced, but duplicate feeders to each of the reactors following alternative routes would have been necessary.
Experience has shown that the automatic start-up facilities provided
with the emergency diesel sets and auto-paralleling features for working

432 E. L. DESBRUSLAIS
with the emergency battery are not absolutely necessary, although desirable,
for even under fault incidents there should be ample time for one of the plant
operators to start one or other of the diesel sets. The emergency battery
provided in each reactor has sufficient capacity to supply the reactor
emergency auxiliaries for about an hour.
2.2. 5. There are six boiler feed-pumps in Calder "A " and also in Calder "B"
turbine houses arranged in groups of three at each end of each turbine house.
The two groups are interconnected by common suction and discharge pipes,
vide incident 2.2.1.
Normally four or five feed pumps are in use in each turbine house de
pending upon the load, leaving the remaining pump or pumps as standby.
In the event of failure of a feed pump, the standby pump or pumps start-up
automatically to prevent loss of reactor cooling. The start-up is initiated
automatically by a relay which works by the reduction in feed-water pressure.A total failure in feed-water supply will, however, cause all the running
feed pumps to seize, and subsequently the standby pumps also, since they
will start-up automatically. Although the reactor decay heat under these
circumstances can be removed by using water from the site fire mains (by
means of pipework installed following incident 2.2. 1), the reactors cannot
be restarted until either the feed pumps are repaired or replaced. A con
siderable loss in revenue would, therefore, result.
In order to prevent such an incident occurring of which incident 2. 1. 5 is
a variant, a pressure switch is fitted on each pump suction immediately
after the isolating valve and connected to trip the pump motor in the event
of loss of suction to that pump. A pressure switch is also fitted to each
common suction manifold and connected so that an alarm will be given at
the turbine operating floor on the loss of pressure in the feed-pump suction
range. The pressure switches connected to the "alarm units" operate at a
higher pressure than those connected to the "trip units", so that an early
warning of water-supply failure will be given.
3. PRESSURE CIRCUIT WITHIN TH E BIOLOGICAL SHIELD
3. 1. P ressure vessel
Internal and external direct visual examination of the mild steel pressure
vessel has not been possible even when the reactors have been shut down
and charged with new fuel because of the high radiations which come from
the steel parts.
The impossibility of carrying out such examinations was appreciated
when the pressure vessel was being designed and therefore considerable
care was taken during fabrication and subsequent stress relief. Material
test specimens including welded sections were also loaded into the reactor
core to serve as monitoring specimens, and some of these were given ac
celerated neutron dosages. Tensile and bend tests on the irradiated speci
mens have not shown any changes in either the plate or weld metal. Impact
tests have, however, not shown any significant increase in the brittle/ductile
transition temperature. This is not surprising because other specimens
which have been subjected to accelerated neutron dosages have only shown a

MAJOR PLANT ITEMS 433
very small increase in the transition temperature and indicate that a shift
of perhaps not more than 20°C is to be expected during twenty years.
In the early days of the plant the temperature of the pressure vessel was
kept above 110°C when the reactor was shut down for refuelling because
there were no insurmountable difficulties in doing this, even though it was
appreciated at the time that this limiting temperature was very much higher
than necessary, even making generous allowances for aging and irradiation
embrittlement. The minimum pressure-vessel temperature has now been
reduced to 80°C for operational convenience but even this is still higher than
necessary to safeguard a shut-down reactor pressure-vessel against brittle fracture.
Other material tests have shown that creep is unlikely to cause a failure.
Excessive creep will, however, cause movements of the standpipes which
are attached to the top dome of the vessel and this could possibly limit the
operational life. The distances of all standpipes and main gas ducts are
therefore measured regularly from the concrete biological shield. So far
no significant evidence of creep has been observed.
To monitor the circuit for any defect the leak rate is measured con
tinuously in operation and any large increase is promptly investigated. If
the reason is not readily determined a carbon dioxide balance* is carried
out using infra-red gas analysers to check that the increased leakage must
be taking place outside the biological shield. Tests have demonstrated that
a small leak from the pressure vessel direct into the void would be detected
by this method. So far tests of this kind have not revealed any signs of
leakages from the pressure vessel and the parts of the pressure circuit
which lie within the concrete biological shield, thus confirming the continued
integrity of these parts of the pressure circuit.
The upper limit at present placed on the temperature of the top dome
and around the cooling ducts for metallurgical reasons, also places a limit
to the reactor output with the present design of fuel-element heat-transfer
surfaces. Recently the outlet gas temperature was used as a measure of
these steel temperatures. Investigations have now shown that variations in
temperature distributions can exist around the metal forming the main gas
ducts and that the metal temperature can be as much as 10°C above the gas
outlet temperature as measured by a centrally located thermocouple in the
gas duct.
It has been shown that these variations are related to the distribution
of gas outlet temperatures from the reactor core channels and hence to flux
distribution. Some reduction in spread of duct skin temperatures can thus
be effected by suitable flux shaping. Investigation of this problem is con
tinuing. At present the skin temperature of the outlet gas is being limited
to 345°C.
There is no evidence of any damage or deterioration to'the pressure
vessel, which would suggest that this item will limit the life of the plant.
However, methods for inspecting the high-temperature and stress areas are
being developed to supplement the information obtained from irradiated
* The total volume of carbon dioxide in the air sucked into the void by the thermal shield ventilation
fans is compared with the total volume in the air passing up the shield ventilation chimneys.
28

434 E.L. DESBRUSLA1S
material specimens. The application of non-destructive tests such as ultra
sonic inspection and X-ray radiography is also being studied.
Some photographs have also been taken of the internal surface of a re
actor pressure-vessel directly, Fig. 1, and also by means of a television
Fig. l
Photograph taken through a top duct on Reactor 4 during a refuelling shut-down in Mardi 1963,
showing top of reactor charge pans; burst-cartridge detection pipes and trailing lead thermocouples
camera. The pictures obtained are sufficiently clear to have shown up a
gross defect if one had existed. This technique, however, is of limited
value at Calder Hall because the design of the pressure vessel allows only
very limited visual examination.
There is a considerable monetary incentive to increase outlet gas
temperature even a few degrees, and therefore the installation of additional
thermocouples and strain gauges during construction at regions of high
temperature and stress with viewing facilities would give the designers and
operators a better knowledge of the conditions of the pressure vessel and
their cost could be very easily justified.
3. 2. Graphite core
The surfaces of the channel walls in the graphite core have been ex
amined yearly by means of a television camera, but there have not been
any signs of cracking or spalling. Due to the irradiation growth of the
graphite core bricks normal to the wall of the channel, some closure of the
Wigner gaps between the core bricks is to be expected. Regular measure
ments of these gaps by means of a television camera unit with a rotating
MAJOR PLANT ITEMS 435
head fitted with a suitable measuring device has shown that the biggest
closure which has occurred is only 0.03 in ± 0.010 in in a gap size 0.25in, and
consequently no serious difficulties are expected to arise. Measurements
of Wigner gaps are, however, being continued.
Measurements have also been made once a month of the clearances
between the graphite core and the reactor pressure vessel by means of eight
probes which can be moved up to the graphite structure and then against a
stop on the vessel, but no significant changes in these clearances have been
observed.
At each of the major reactor shut-downs, graphite specimens have been
trepanned from the reactor core bricks and have been used to determine
changes in the physical properties and stored energy. Extrapolation of the
results from these specimens will give sufficient advance warning for the
need of a thermal anneal should this become necessary.
4. PR ESSURE CIRCUIT E X T E R N A L T O T H E B IO LO G IC A L SHIELD
4. 1, Heat exchangers
The heat exchangers, pressure-circuit main gas ducts and the bellows
units on the first reactor were designed on the assumption that after com
missioning it would not be possible to enter them, and therefore only the
very minimum of manholes required for construction purposes was provided. After the first reactor had been operated for about six months, personnel
wearing dust respirators and protective clothing and surgeons' boots showed
that it was possible to enter these parts of the pressure circuit under Health
Physics' surveillance, and also to work inside them safely, carrying out
such operations as welding and grinding. The surface contamination on the
steel was of the order of 600-1000 counts/s beta gamma by probe and
300-600 counts/s gamma by swab, but the airborne activity depended on the
type of work carried out and could reach 30 000 disintegrations/m3 of air per
minute. Since then additional manholes for inspection purposes have been
provided and modifications carried out in all sixteen of the heat exchangers,
and over 50 internal surveys have been made. Health Physics' control has
proved adequate and no person has been seriously contaminated.
After over six years of operation there is no evidence in the gas side
of corrosion and the internal surfaces are virtually in the same condition
now as when the reactors were commissioned, except for some slight dis
colouration. Further, there had been no increase in the contamination level
and experience indicates that a simpler form of protective clothing would
be adequate. The only defects which have been found have been a small
blister in the bottom dome which was due to surface laminations in the steel
plate, some minor cracking in the welds supporting the fairings and some
slight distortion of the tube-element support plates.
Only one defect has occurred in the 32 separate steam circuits. Shortly
after the last reactor was commissioned a pin hole appeared at a tube bend
external to the heat-exchanger vessel. There has not been any satisfactory
explanation for this failure in spite of metallurgical examinations and non
destructive tests which have been carried out on similar bends. A number

436 E. L. DESBRUSLAIS
of tubes have also been examined internally with the aid of an introscope but
no deterioration of any kind has been seen in them. The defect is attributed
to faulty material.
There has not been any fall-off in the thermal performance of the heat
exchangers. About a year ago it was suspected that some of the carbon
dioxide gas might be bypassing the tube banks through larger-than-necessary
clearances around the various platforms and baffle segments, which are
fitted in the stagnant gas spaces. By blanking off these clearances the
thermal output of the reactors has been increased by a small amount.
Because the reactor pressure vessel must be kept filled with carbon
dioxide at a pressure slightly above atmospheric, about 2-in W.G. , whenever
it is opened up for refuelling (to keep moisture out of the vessel as it could
cause rusting to occur in the mechanisms of the control-rod operating motors),
complete or double isolation is provided in all pipe connections which could
feed carbon dioxide into’ the heat exchangers and/or the main gas ducts
opened up for examination, in order to ensure safety of personnel. Double
isolation is obtained in the main gas ducts by closing the 54-in duct valve
and by inflating a special balloçn inside the main duct, but some distance
away from the valve. The interspace is then vented and kept purged with
fresh air. This ensures that air alone can pass into those parts of the
pressure circuit where men are employed. Where only single isolation is
possible, maintenance personnel are required to wear air-line masks.Very considerable painting effort is necessary to maintain the outdoor
heat exchangers and surrounding structural steelwork in a satisfactory
condition. Deterioration of paint and corrosion of exposed steelwork is
aggravated at Calder Hall by the fine droplets of water which rain down from
the cooling-tower plumes, scrubbing salt from the atmosphere and depositing it on plant near the towers. It would have been more economic and easier
for maintenance if the heat exchangers had been initially housed in weather
proof structures.
4. 2. M a in g a s ducting and bellows units
The additional access manholes which have been provided in the main
gas ducts and the new design of removable fairing which has been fitted over
the convolutions of the bellows units enable internal surveys to be carried
out far more easily than has hitherto been possible. Inspections, which
have been made so far, have not revealed any defect, corrosion or deterio
ration. A few convolutions in three bellows units were found to have closed
slightly when compared with other convolutions in the same unit. When they
were re-examined two years later and found not to have altered, it was con
sidered that this small closure was present when the units were installed.
4. 3. M ain gas circulators
The centrifugal-type gas circulators have regularly been dismantled in
order to inspect the impellers which are manufactured of forged steel plates
riveted together, Fig. 2. Of the 30 impellers inspected so far, loose rivets
and some distortion and rubbing of the inlet labyrinth seal have been found
on only one, and are attributed to a bent impeller shaft possibly damaged
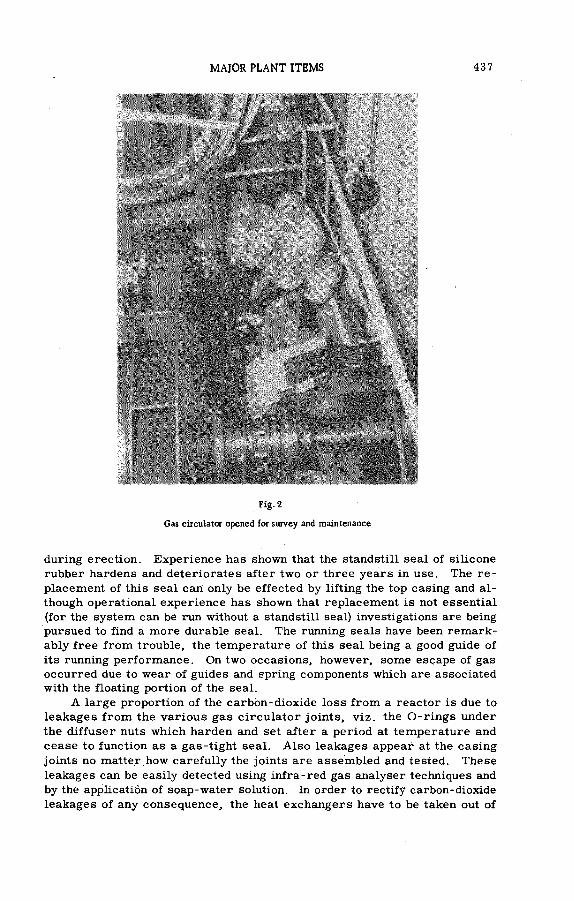
MAJOR PLANT ITEMS 437
ЯШШШЁшШШШшFig. 2
Gas circulator opened for survey and maintenance
during erection. Experience has shown that the standstill seal of silicone
rubber hardens and deteriorates after two or three years in use. The re
placement of this seal can only be effected by lifting the top casing and al
though operational experience has shown that replacement is not essential
(for the system can be run without a standstill seal) investigations are being
pursued to find a more durable seal. The running seals have been remark
ably free from trouble, the temperature of this seal being a good guide of
its running performance. On two occasions, however, some escape of gas
occurred due to wear of guides and spring components which are associated
with the floating portion of the seal.
A large proportion of the carbon-dioxide loss from a reactor is due to
leakages from the various gas circulator joints, viz. the О -rings under
the diffuser nuts which harden and set after a period at temperature and
cease to function as a gas-tight seal. Also leakages appear at the casing
joints no matter how carefully the joints are assembled and tested. These
leakages can be easily detected using infra-red gas analyser techniques and
by the application of soap-water solution. In order to rectify carbon-dioxide
leakages of any consequence, the heat exchangers have to be taken out of

438 E. L. DESBRUSLAIS
service and as this causes a loss in production there is no financial incentive
to remake the joints. On some occasions, however, gas leaks have virtually
healed themselves during operation, possibly through flexing of the flanges.
The blowers are checked regularly for vibrations and concentricity of
the impeller with the inlet eye is checked yearly.
4. 4. Frequency of inspections
To date the gas and steam side of all the heat exchangers have been
surveyed every two years and the steam side in addition has been hydrauli-
cally tested every four years. The main gas ducts and bellows units have
been surveyed at least once every five years.
■ The continuation of these survey frequencies, especially those for the
gas side of heat exchangers and bellows units is under review, for after
nearly seven years of operation, no deterioration has been observed, but
this is to be expected for the carbon-dioxide coolant is extremely pure and
the moisture content is only 10-100 ppm. Further, unlike furnace-fired
boilers the tubes are not subjected to erosion by fly ash or corrosive gases.
The moisture in the coolant gas is monitored continuously by installed
moisture-in-СОг instruments and if any rusting did occur on the internal
surfaces of the heat exchanger, evidence would be seen in the bypass filters
installed in the main gas circuit and also in the filters associated with the
burst-cartridge detection gear.
It is considered that the present frequency of gas-side surveys is not
justified and that it should be sufficient to enter and examine annually the
gas side of only one of the sixteen heat exchangers at Calder Hall.
Entry into the pressure circuit even when free from carbon dioxide
involves some hazards to personnel who, wearing dust respirators and pro
tective clothing, are required to descend some 80 ft down each heat exchanger
four times and to pass through more than 50 access doors which are fitted
in the platforms and the tube bank supports in the dead gas spaces.
On the steam side no deterioration has been observed on the visible
water surfaces of the boilers and in the tube banks of the heat exchangers.
Consideration has been given to altering the present survey frequency be
cause of the purity of the treated feed water which is continuously sampled
and is common to all four heat exchangers, but as steam-side surveys can
Ъе carried out without hazard, there is not the same motive to reduce the
frequency.
5. INSTRUM ENTATION
5. I Safety and alarm circuitry
Nuclear measuring and recording instruments and also electronic,
electrical and physical instruments associated with the reactor safety circuits
have proved extremely reliable. Examination of records for over six years
since the reactors were commissioned show that on an average four reactor
trips occurred each year per reactor from all causes, and that during this
period the number of trips due to faults in instruments amounted to only

MAJOR PLANT ITEMS 439
0.4 trip per reactor per year. Since the teething troubles were overcome,
the reliability of these instruments has improved. For instance, only two
trips have occurred in the past four years due to instrumentation. This
number is far fewer thàn the number arising from faults in power supplies,
auxiliary circuits associated with electrical switchgear, blower drives and
human errors.
The reactor emergency shut-down circuit consists of several relay
contacts in series with the two tripping relay coils and are connected across
a 110-V AC supply derived from the site mains. This circuit is duplicated
and so arranged that any of the nine monitored parameters* can cause the
emergency shut-down instruments to open the appropriate series relay
contacts in both circuits and shut down the reactor. Most of the shut-down
instruments are duplicated and for maintenance purposes are provided with
a shorting device, the plug for which is designed to prevent the simultaneous
isolation of two identical instruments. During normal operation these shut
down instruments can be checked or replaced by jacking out their respective
relay contacts in the appropriate emergency tripping circuit. Excess power
and fuel-element temperature tripping instruments are triplicated and work
ón the "two-out-of-three" principle, i. e. operation of any one unit gives an
alarm but if two operate they cause an emergency shut-down. In view of
this circuit arrangement these instruments have not been provided with
shorting-out facilities but maintenance and replacement of faulty units can
be carried out with the reactor at power with only a very small risk of a
trip. In fact only one such trip has occurred since commissioning and this
was due to a defect in one temperature tripping instrument whilst maintenance
work was in progress on another.
The emergency shut-down circuits and their associated tripping relays
can only be tested when a reactor is shut down for maintenance because an
open circuit on either of these circuits will cause the reactor to trip. During
all shut-downs, however, it is an operational safety requirement to keep
two control rods out of the core and connected to the safety instrumentation
so that they can be inserted in the event of any accidental divergence, e. g.
arising from the inadvertent movement of absorbers. To cope with this
safety requirement during shut-downs when the main protection circuits are
being maintained, a portable safety circuit is used to hold the two safety
rods out of the core.
This practice of using only two guard lines and a portable safety circuit system for maintenance during major shut-downs for refuelling has proved
entirely satisfactory at Calder Hall where the reactors have been shut down
once a year for statutory surveys of heat exchangers etc. and for refuelling.
* The nine parameters which will саше immediate shut-down if unsafe levels are reached are:
(1) High neutron flux at power;
(2) High neutron flux during start-up;
(3) Excessive rate of change of neutron flux at low power;
(4) High neutron flux in the sub-critical condition;
(5) High fuel-element temperature;
(6) Loss of coolant pressure;
(7) Excessive coolant pressure;
(8) Coolant flow unbalanced between circuits (for circulator protection);
(9) Loss of power supplies to coolant circulator motors.
440 E. L. DESBRUSLAIS
The use of three guard lines arranged in the two-out-of-three principle which
enables maintenance to be carried out on one of the guard lines whilst the
reactor is at power was considered and rejected as an unnecessary elabo
ration contributing little to reactor safety. This system may, however, be
justified where reactors are required to run continuously for over a year
and where spurious trips are to be avoided at all cost. The use of the two-
out-of-three principle for electronic shut-down instruments has, however,
avoided a number of spurious trips and has been justified. This require
ment may, however, not be necessary with the introduction of reliable, fully
transistorized, instruments.
The original guard-line circuits had both trip relay coils connected at
the earthed end of each series chain. This now has been modified by putting
one of the two trip relay coils at each end of the series chain because such
an arrangement eliminates the possibility of a "live-line" fault within the
series chain holding in the safety trip circuit, even though series contacts
within the guard line have been opened by one or other of the shut-down
devices. The possibility of such a fault is, however, extremely remote
and has never been experienced at Calder Hall.
The alarm system consisting of a number of flag relays with a single
audible bell alarm proved tobe unsuitable, primarily because it was difficult
to pick out a new alarm when a number of other alarms were showing, and
also because the system was subjected to spurious operations and difficult
to maintain. This system of flag relays has now been replaced by a winking
light system which has proved to be reliable. The new system could, how
ever, be improved still further, e.g. alarms both visual and audible could
be graded in degree of importance and a device could be incorporated to
indicate the sequence of operation of the more important alarms.
5. 2. Ion ch am bers and battery supplies
The 600-V dry batteries used to polarize the ion chambers have proved
reliable and the ion chambers themselves have given continuous service
without fault or deterioration. In the very early days it was found that random
changes in the internal impedance of individual cells in the high-tension batteries
during aging caused sudden and short random changes in the voltage applied
to the ion chambers. This caused the sensitive period meters to behave
erratically but did not affect other nuclear instrumentation, namely shut-down
amplifiers, to the same degree. Since then the dry batteries are given a
short soak test and measurements are made of their internal resistance.
Batteries with higher internal resistances are not used for period meters
but experience has shown that they can be used satisfactorily with other
ion-chamber instruments. This procedure has completely eliminated the
erratic behaviour of period meters from this cause. All the batteries are
therefore checked every six months and the batteries supplying the period
meters in particular are checked before major refuelling.
5. 3. Tem perature scanning and on-line data reduction equipment
Data loggers, or more precisely temperature scanning and alarm moni
toring equipments, have been installed on all reactors to handle the large

MAJOR PLANT ITEMS 441
number of temperature measurements required, namely coolant gas, fuel,
graphite, concrete, pressure-vessel steel etc. Some form of data reduction
is obviously desirable to reduce the volume of information presented to the
operators. In the past this information has had to be collected on to log
sheets from multipoint recorders and indicators. Experience with the data
logging equipment has been good and suggests that the use of this type of
equipment could, with advantage, be extended to monitor other limited con
ditions such as burst-cartridge detection-gear signals, coolant pressure
etc. and also to provide automatic trip facilities.
The basic specification for three of these equipments is as follows: (The
equipment on the fourth reactor, in addition to data logging, is also pro
vided with limited facilities which can be used for reactor operational com
putations such as heat balances, flux plotting, temperature survey analyses
etc. )
(a) 450 thermocouple inputs are scanned sequentially at 1.2 s per point, i.e.
it requires approximately 10 min for a complete scan;
(b) The measuring range is 0-600°C with an accuracy of ± of the full
scale range, namely ± 3°C;
(c) 13 high-level and one low-level alarm references are provided with
setting range of 0-600°C in 5° steps;
(d) As each point is scanned the thermocouple is first checked for continuity
and then the machine compares the temperature measurement made
with the alarm level (set point). If the temperature is above the alarm
level, visual and audible alarms are given and the point number, tempera
ture and time are printed by the excess alarm strip printer. The
machine with its electrical typewriter can also provide a complete log
of temperatures at each input point either on demand or automatically
at pre-set times.
Important units in the equipments such as measuring channels, output
typewriters etc. are duplicated and this has enabled high availabilities to
be achieved following initial commissioning. Except for the measuring ampli
fiers the equipments are fully transistorized.
Most of the faults experienced have been mechanical in nature (breaks
in wires, connectors, bad contacts) rather than electrical or electronic.
A summary of breakdowns on the three identical units is shown in Table I.
The proven reliability of these installed data loggers makes the use of solid state devices look most attractive for nuclear instrumentation and
reactor safety circuitry.
5. 4. Burst-cartridge detection gear
The burst-cartridge detection gear which is based on the short-lived,
double-beta decay fission-product precipitation system has proved to be
extremely reliable. It has detected signals which have risen very slowly
("cavitation"-type fuel failures giving doubling times varying between 10 and
100 d) and the few that have risen extremely rapidly ("fast" failures giving
doubling times varying between minutes and an hour). Experience, however,
has shown that this detection system is insensitive to fuel failures which
have a long leak path, but operational procedures known as "pressure steps"
and "blower cycling" have been developed which enable the burst-cartridge

442 E. L. DESBRUSLAIS
TABLE 1
BREAKDOWN SUMMARY
Reactor No. 1 2 3
Availability 0a) 98.7 99. 6 99.8
Breakdown cause expressed as
percentage of total numbers
1. Wiring, plugs, connectors etc. 24.0 14.8 6 .3
2. Typewriters 16.7 29.6 23.4
3. Line printers 7 .4 3 .3 4 .3
4. Logic circuits 18.5 19.6 16.0
5. Relays and uniselectors 11.5 16.4 20.2
6. Measuring circuits 18.5 12.2 12.8
7. Miscellaneous 3 .4 4 .1 17.0
detection gear to detect such incipient failures by squeezing fission products
out through any minute hole which might exist in the can wall or end cap
weld.
The equipment is complex and a number of operations are required to
take place in sequence within the 27-s cycle-time of a scan. These oper
ations, namely wire movement, valve movement, ratemeter counting, reset
and recorder print have to be repeated continuously and reliably. A com
plicated cam relay and switching system is fitted for controlling and timing
the sequence and interlocking of these operations. Most of the day-to-day
faults occur in these switches and relays, but are easily rectified by cleaning
and/or physical adjustment of the contact surfaces. Because there are
44 separate units which are required to work day and night continuously at
the Station, an almost continuous maintenance effort is required.
Experience has shown that certain changes and additions can be made
to the existing equipment. Some comments on the existing equipment are as
follows:
(a) At present groups of four fuel cha'nnels are scanned at 27-min intervals.
This, however, provides too large a signal at too low a scan frequency. The
gas from each of the main ducts is examined every 4? min but as the sample
represents approximately one-quarter of the total number of fuel channels,
it provides too small a signal at a high scanning frequency. The system is
too insensitive to give early warning of individual channel failures.
It would therefore seem reasonable to sacrifice some sensitivity by
increasing the channel groupings to say twelve, to achieve a shorter cycle
time of 10 min. Any modification designed to achieve this should still enable
the gas from any single suspect channel to be examined continuously. Designs
to achieve these requirements have been prepared but are costly.
(b) Provision of te sting facilities which will permit overall tests to be carried

MAJOR PLANT ITEMS 443
out on each of the precipitator systems using the same source of fission
products preferably from the reactor. This will allow comparative tests
to be made on the precipitators with their associated pipework, precipitation
and counting systems. Experience has shown that due to the layout and
design of the pipework from the reactor to the precipitators, variations do
occur in the signals as measured on different precipitators.
(c) It is desirable that the burst-cartridge detection gear should be incorpo
rated into the reactor protection circuits so that in the event of a severe fuel-element failure the reactor will be shut down automatically. The pre
cipitators and counting equipment have not proved sufficiently stable for this
modification.
(d) The 54-point graphical form of signal-presentation requires considerable
attention and maintenance.
(e) In the present state of the art, there is value in designing the system to
give flexibility in channel grouping and in scanning frequency.
6. FUEL-HANDLING EQUIPMENT
6. 1. General comments
During the first fuel discharges difficulties were encountered with the
fuel-handling equipment and consequently the loading and unloading of a fuel
charge of 10 000 fuel elements in a reactor became excessively long, namely
ten weeks.
Not long after the first reactors were raised to power it was found that
the burst-cartridge detection gear did not give early indication of failures
in fuel elements which were characterized by long leak paths and that such
failures gave rise to sudden and rapid increase in the burst-cartridge
detection-gear signal. Post-irradiation examination of the first few failures
of this type revealed that they were due to leak paths through the end welds
and that they had been the result of either a manufacturing defect or damage
during handling or loading into the reactor.
Consequently, in the early days pf the plant much attention was directed
to:
(a) Improving the reliability of the fuel-handling equipment and devising
additional ancillary equipment in order to reduce the discharge and charge
times.
(b) Handling methods and equipment with a view to eliminating the possi
bility of damage to the fuel-element tops and welds during loading operations.
Some of these modifications and improvements are mentioned below.
6. 2. Charge m achine
(a) It was realized at a very early stage that direct viewing of fuel elements
whilst they were being removed from the basket in the charge machine would
assist in preventing damage to the elements during the grabbing and lowering
operations, and would also allow the fuel elements to be checked immediately
before loading into the reactor. An armour plate-glass was therefore fitted
into the machine door.

444 E. L. DESBRUSLAIS
(b) The holes in the machine through which the fuel elements are lowered
were radiused to prevent damage occurring to the tops and end welds.
(c) The grabs and grab connections were modified to enable the grabs to be
quickly changed when damaged and also to give higher grab availability.
(d) Because it was discovered that certain obscure faults could allow fuel
elements to be released from a grab during loading or unloading without the
knowledge or intervention of the operator, the design of the grab and as
sociated electrical equipment was modified.
(e) The grab cable was sometimes damaged due to piling up of the cable on
the reeling drum. Modified layering and tensioning devices were fitted to
overcome this defect on both charge and discharge machines.
6. 3. Discharge m achine
(a) It was found desirable to have a viewing facility to examine the positioning
of discharged fuel elements in the holding basket. An introscope was there
fore fitted on each discharge machine and incidentally has proved of some
use in viewing and photographing suspected faulty fuel. It was found that
the lenses discoloured very quickly and therefore they are now made from
cerium stabilized glass.
(b) The hydraulic system used for deflecting the fuel elements into their
respective positions in the discharge basket gave considerable trouble but
these teething troubles were gradually eliminated.
(c) It was soon evident that not enough attention had been given to the siting
of the fuel-handling instruments and alarm signals, e.g. it was necessary
to reposition the "grab-open" and "fuel-element-in-grab" indicators so that
both were within the field of view of the machine operator, because it was
found that some fuel elements had been mal-handled. Greater study should
therefore be directed to the grouping of important instruments.
(d) On occasions the discharge machine has not been able to remove a fuel
element from the reactor either because the lifting top had been damaged
during loading or because the top had unscrewed itself by the aerodynamic
forces of the coolant gas and had become detached. Under such circum
stances the television camera provided for viewing fuel channels has proved
extremely useful in determining the reasons for failure to lift. It was soon
realized that the usefulness of the camera would be greatly extended by the
addition of different forms of remotely controlled grabs and a whole series
of these was therefore devised, Fig. 3. The dwell time of the television
camera inside the reactor was, however, restricted to about 15 min because
the picture quality deteriorated due to heating up of the camera which was
in an ambient temperature of about 140°C. Although the camera was cooled
by an external supply of carbon-dioxide gas, the latter, on its way through
the reactor charge tubes to the camera, got warm. A new design of television
camera cable has now been introduced which permits more effective cooling
of the camera.
6. 4. Ancillary equipment
Generally the ancillary equipment associated with fuel handling, namely
hydraulic jack for the discharge machine door, the discharge machine well-

MAJOR PLANT ITEMS 445
Fig.3
Channel television camera with an assortment of grab fittings
hoist and coffin bogie, have worked satisfactorily after the initial teething
troubles were overcome and minor modifications introduced, e.g. the in
dicators provided for the operator of the discharge-machine shield-door
jack were inadequate and consequently on a couple of occasions the hydraulic
cylinder for the jack was fractured. A new foolproof interlocking system
had therefore to be devised. Also a radiation control interlock had to be
fitted to the doors giving entry into the well-hoist chamber to ensure that
operators could not enter the phamber if, for any reason, irradiated fuel
elements were exposed.
The practice of using a number of special flasks for removing and transporting certain irradiated fuel elements wasted valuable reactor
refuelling time. Normally the irradiated fuel elements are despatched to
the cooling ponds in standard water-filled flasks - if, however, a suspect
or experimental fuel element was required to be examined in the "caves",
it has had to be loaded into a special dry handling flask which, incidentally,
was also required for handling thermocoupled fuel elements. With the de
velopment of a thermocouple with a breakable weak link, it now appears that
a minimum of two types of flasks will suffice - namely standard fuel-element
flask and a special flask for handling graphite specimens.
The provision of a number of special motorized vehicles for coffin trans
portation is not necessary. Universal trailers which could be towed by
general purpose tractors would have been adequate.
The foregoing describes only some of the modifications that were made
to the fuel-handling equipment. The effect of these improvements has been
to reduce shut-down time required for discharging and charging a reactor
with a full charge of 10 000 fuel elements from ten weeks to a little under
three weeks, and the latter allows time for loading experimental fuels with

446 E. L. DESBRUSLAIS
additional thermocouples, steel and graphite specimens and television in
spection of channel walls and Wigner gaps between the core bricks.
7. AUXILIARY P LA N T ITEMS
7. 1. Control-rod system
The control-rod system has performed satisfactorily under normal and
fault conditions. Although this equipment is designed to fail safe and hence
can easily be inadvertently tripped, there have been only a few spurious
trips. Under operating conditions no control rod has ever failed to drop
into the reactor when it tripped either automatically or manually. The com
plex frequency convertor system has presented some difficulties to plant
operators whô, for maintenance requirements, are required on a routine
basis to change over the low-frequency supplies to the control rods from
one frequency convertor set to the other without tripping the reactor. A
simpler system of control is desirable.
In the very early days of the plant two control rods failed to drop into
the reactor core on a shut-down reactor whilst it was undergoing pre-start-up
trials. One of these failures was due to corrosion which had occurred in
the ball bearings in the control-rod actuating mechanism whilst the shut-down
reactor was full of air, consequent upon the refuelling operations which had
been in progress. The other was due to rubbing between an eddy-current
braking disc and the pole pieces of the magnet because a holding screw had
worked loose.
Even though subsequent tests showed that the control rod suspended
from these two mechanisms could have been lowered into the reactor core
using the sine potentiometers to drive the control-rod motors, the following
operational procedures were introduced:
(a) During refuelling operations when the reactor is at times opened to the
atmosphere, it is kept filled with C O 2 at a positive head of 2-in W.G , and
the moisture content measured at the top dome is kept below 1000 ppm.
(b) During maintenance of the mechanisms a check is made to ensure that
the bearing races are not fitted too tightly on to the shaft for tests have
shown that even if the ball bearings have seized due to corrosion build-up,
the rods will still fall under gravity alone with the shaft rotating relative
to the roller bearing inner race.
(c) The frequency for maintaining control-rod mechanisms in the work
shops was reviewed and it was decided that at least 50% of the mechanisms
in a reactor should be overhauled each year.
(d) The friction resistance is measured and a velocity diagram recorded
of the fall of the control rod for all mechanisms both in the workshops after
maintenance overhaul and also in the reactor building before their instal
lation in the reactor itself.
Further, before a reactor is started up the control-rod mechanisms
are again carefully tested in the reactor by checking the time for insertion.
Since these procedures were introduced no further troubles have been
experienced.

MAJOR PLANT ITEMS 447
The control-rod mechanisms operate in an extremely dry COz' atmos
phere and are subjected to some radiations from the reactor core from
which they are shielded by a concrete plug. Experience has shown that the
molybdenum disulphide dry lubricant used in the ball bearings and gear
trains tends to harden and slow down the fall of the control rods. Experi
ments with a high-temperature grease, 701 A P L , have proved successful
in and out of the reactor and consequently the use of this type of grease is
now being extended to all control-rod mechanisms.
7 .2 . Feed-water regulators
The single-element, float-operated, automatic feed-water level regu
lators (direct and also servo-acting) installed in the high-power and low-
power steam systems have proved to be quite satisfactory when the boilers
are steaming above minimum load. They tend, however, to be slightly
sluggish in following load changes and do not maintain a precise level. Their
dead band width of a few inches is acceptable and with only occasional ad
justment and little maintenance they work extremely well under the steady
load conditions which prevail. At very low loads their performance is not
so good.
These regulators cannot cope with large load changes such as occur
when heat exchangers are being taken out and brought back into circuit, but
trials have shown that no other regulator is able to cope with this situation
satisfactorily except a three-element type (water level, steam and water
flow).
When large load reductions of 50% or more are anticipated, manual
control isfoundto be adequate, i. e. the feed-water flow is adjusted manually
so that the regulator is nearly fully open and then the operator controls the
flow to maintain the water level slightly below half glass.
Unexpected large load reductions cannot be satisfactorily handled by
simple automatic regulators and are handled only inadequately by manual
operation. Until the new steam-flow conditions are established, the operator
controls by "overshoot methods". This involves heavy blowdowns because
steam-flow and feed-flow metering has not been installed at the feed-control
station.
Trials have been carried out using three different types of two-element
feed regulators and also one type of three-element regulator. The two-
element regulators behaved adequately except at low loads. The three-
element type behaved very much better at low load conditions, but the ad
ditional expense was not considered to be justified at Calder Hall where
32 regulators would be needed, and because the reactors are normally oper
ated under base load conditions.
One advantage of the servo-acting type of feed regulator is that the
mechanism need not be at drum level where higher radiation fields exist.
This is an important consideration when maintenance has to be carried out
on a reactor at load.
7. 3. Gas-circulator drives
Each of the four centrifugal-type gas circulators installed on each re^
actor circulates coolant gas at about a quarter of one ton per second and is
448 E. L. DESBRUSLAIS
driven by a variable speed 2200-HP, 600-V, 940-rpm D C motor which is
supplied from an associated 1730-kW, 600-V, 740-rpm Ward Leonard DC
variable-voltage generator. The Ward Leonard generator is driven by an
11-kV direct on-line start squirrel-cage induction motor. The main drive
motors and Ward Leonard generators are fitted with commutating poles and
pole-face compensating windings.
The speed of the gas-circulator main-drive motors can be controlled
individually or alternatively collectively from the reactor control room.
An overcurrent DC relay is fitted between the Ward Leonard generator
armature and main-drive motor armature which, in the event of severe
overcurrent between the motor and generator, trips out the 11-kV circuit
breaker for the induction motor. Intertripping is provided between the four
■ gas-circulator main-drive motors to eliminate the possibility of backdriving,
and protection is so arranged that the failure of any one of the main gas-
circulator drive motors will trip the reactor and automatically start the
auxiliary pony motors. A single flashover on any machine can therefore
trip a reactor, and cause approximately one day's loss of production.
Although the machines met the usual guarantees, troubles were initially
experienced due to flashovers, burn marks on commutators, random and
sometimes rapid wear of the carbon brushes, copper picking* and commutator glazing.
The frequent flashovers which used to occur in the early days on these
"limit motors and generators" (maximum power speed product kW X rpm =
1.6 X 10s) are ascribed to copper drag** and now have been virtually elimi
nated by the selection of a carbon brush grade which produces little or no
copper drag and by careful maintenance. Experience has shown that these
powerful "limit" DC machines can now be operated continuously at 600 V
(20 V per segment average) with outages determined primarily by the need
to replace worn brushes, provided that they are carefully maintained at
periodic intervals and copper drag is removed when seen. The total loss in
production on account of these DC motors and generators has now been re
duced to about 0.5%. The early difficulties experienced with this form of
blower drive have been fully described by the author [3].
8. M ISCELLANEOUS TOPICS
8. 1. Oil in reactors
The first of the four occasions on which oil entered the reactors occurred shortly after Reactor 1 was loaded with fuel but before it went on power for
the first time. On this occasion, because of a human error during a pre
liminary test on the oil system for the gas-circulator running seal, the by
pass valve across the oil-pressure regulator in one of the circuits was in
advertently opened and consequently the increased oil/gas-pressure differential
at the running seal forced about 140 gal of oil into the gas circuit. The oil
* Copper picking - plating of parts of the brush contact surface with fine copper particles.
* * Copper drag - the formation of globules of copper on commutator segment edges or the pulling
over of the surface of the commutator segments sometimes with the formation of
easily detachable whiskers of copper.

MAJOR PLANT ITEMS 449
was then distributed throughout the reactor core and the gas ducting con
nected to the affected gas circulator. The incident was first noticed by the
large reduction in oil tank level and later when the reactor was opened up,
oil could be seen lying on the charge pans in large quantities. Considerable
amounts of oil were removed by the filters in the affected gas circuit and
by mopping up oil lying on the charge pans, bottom gas fairings and deflectors
and also in the gas ducts. After this incident a flow restrictor waá fitted
into the oil-pressure circulator bypass circuit. The reactor was then put
on load and operated, ánd no deleterious effects have since been obsërved;
this has given more confidence in the use of oils and greases as lubricânts
for reactor components.
On the other three occasions oil entered the gas circuit only in very
small quantities and occurred during shut-downs as a result of the vácüum
which was created in a gas circuit whilst the gas circulator was-running at
low speed in order to clear a heat-exhanger circuit of C O 2 preparatory to
the entry of maintenance personnel. Under these conditions the bil-prëssure
regulating valve on the running-seal oil-supply circuit was no L able to-main
tain the necessary oil/gas-pressure differential and consequently oil was
sucked into the gas side of the main circulators, the drainage system from
which became overloaded and choked. In all these incidents, which were
not noticed until after the reactor had been started up, the blower speeds
were not increased at full gas pressure until the temperature of the fuel had
been raised to 350°C, but only small quantities of oil entered the reactor
core. The presence of oil in the gas circuit was found by chemical tests
which are referred to later. Following these incidents the use of the ex
hauster for purging the gas ducts and heat-exchanger circuits for main
tenance purposes is allowed only when the circulator is on standstill seal
and the oil pumps are stopped.The following tests were instituted after the first incident to deter
mine if oil has inadvertently been introduced into the reactor.
(a) A sample of the coolant gas is bubbled through carbon tetrachloride
which is then examined for the presence of oil by infra-red spectrometry.
This test is carried out shortly after a reactor start-up following main
tenance, and also weekly. This method will detect oil contamination in the
test sample as low as 5 ppm, but as this test sample may not be truly re
presentative of the bulk gas due to sampling difficulties, the values obtained
can only be used quantatively, i. e. any abnormal risé above thé background
figure is indicative of oil ingress.
(b) Infra-red gas analyses are carried out continuously using the installed
CO-in-CO2 meters - any sharp increase in carbon monoxide will indicate
the presence of oil breakdown products or CO from other sources.
(c) A daily check is made to determine the residual gas content in the coolant by passing a 'measured quantity through a potassium hydroxide solution and
measuring the unabsorbed portion. The value of residual gas normally
follows a set pattern on each reactor, being dependent upon the amount of
C O 2 leakage from it. Any abnormal increases are indications of oil break
down. Experience may, however, show that the reliability of the instruments
referred to in paragraph (b) will permita relaxation in the frèquency of
carrying out this daily check. '* . 1
(d) At infrequent intervals,' and also.if any unusual results are obtained

450 E. L. DESBRUSLAIS
from the foregoing tests, the coolant gas is examined by a mass spectro
meter to determine the methane and ethane constituents. A build-up of
methane above background, viz. 15-20 ppm and the appearance of ethane
greater than about 5 ppm would indicate the presence of oil-breakdown
products.
8. 2. Moisture in reactors
No sign of corrosion has been observed in the heat exchangers and gas
circuits which could be assigned to water leaks.
Following the discharge of fuel during which the reactor is opened up
to atmosphere, the subsequent moisture levels at the start-up of the reactor
range from 100-200 ppm w/w, but within a few weeks, fall to 10 ppm w /w
as determined by chemical tests - the only exception is Reactor 1 where the
moisture level has not fallen below 2 5 ppm from the time when large quantities of oil entered the reactor.
Two humidriers are provided on a reactor, each of which is connected
by pipework to the inlet and outlet of a blower so that at full gas pressure and
maximum blower speed, approximately 2% of the mass flow through .the
blower passes through the humidrier.
In the first four years the humidriers were kept working continuously
but as they are only designed to remove moisture efficiently down to 100 ppm
(and this has been confirmed by tests) they are now taken out of circuit after
a reactor has been in operation for a few days. It has been found that al
though the humidriers are not in use, the moisture level continues to fall
to 10 ppm.
The moisture content in the coolant gas in the reactor is monitored by
infra-red gas analysers which will respond to large increases in moisture
in C O 2 but are insensitive to small changes, viz. below 50 ppm. Daily
analytical checks of moisture content are made by a gravimetric procedure
which is also used to check the infra-red gas analyser instrumentation.
Improvements which have been made in the moisture-in-C02 instrumentation
in the last two years have shown that it is safe to operate with the humidriers
out of service as any large increases would immediately be recorded. Thus
2% of the total mass flow which previously was passed through the humi
driers is now passed through the reactor and consequently the thermal power
has been slightly increased.
Maintenance of the humidriers has to be carried out under Health Physics' surveillance as the alumina concentrates tritiated water.
9. CONCLUSION
All the early problems and faults occurred in conventional plant or were,
of an engineering nature, primarily because the plant was either the first
of its kind or because it was designed to run at maximum load day and night
continuously for month after month without a shut-down. Except for teething
troubles experienced with the heat-exchanger recirculating pump systems
and some minor plant faults, the reliability and performance of the turbo
alternators, turbine house auxiliaries, electrical switchgear etc. have been

MAJOR PLANT ITEMS 451
excellent. The reactor itself has proved an extremely reliable heat source
and annual electrical load factors of 90.0% have been maintained.
Although the Station contains many more engineering plant items than
in a conventional steam power station, it has not proved any more difficult
to run, but plant operators need additional training and technical assistance.
The radiation shielding provided has proved both effective and adequate.
Special precautions are, however, necessary when maintaining plant in
direct contact with tha coolant gas, but these have not proved restrictive.
The average radiation exposure of Calder Hall staff has only been 1.5 rem/yr,
and no one has received more than 5 rem/yr.
Up to recently the Station has been operated primarily as a plutonium
producer; in consequence almost complete charges of fuel have had to be
discharged annually. In spite of this, extremely high electrical load factors
have been achieved. The Station in future will be operated primarily as an
electrical power station and therefore only comparatively small quantities
of fuel will have to be discharged annually. This means that the shut-down
times of the reactors will be less than a fortnight each year and will be
dictated by the time required for statutory examination of the heat exchangers
and maintenance of conventional plant items, and not by refuelling.
Electrical plant annual utilization factors of the order of 94% based on
the enhanced electrical output are anticipated.
A C K N O W L E D G E M E N T
The high availability and increased output obtained from this prototype
nuclear power station has been due to the application of technical knowledge
and skill of the design, construction, operation and maintenance staffs
associated with Calder Hall over many years, and the author wishes to
acknowledge their work which has produced such a successful power station.
R E F E R E N C E S
[1] DESBRUSLAIS, E. L ., Nucl. Power 6 , No. 67(1961).
[2] GOODWIN, V.R. and MARSHAM, T . N. , Reactor Safety and Hazards Evaluation Techniques, 1, IAEA,
Vienna (1962) 207.
[3] DESBRUSLAIS, E. L. , Proceedings I. E. E ., 109, Part A, No. 46, Paper No. 3863U(1962).
D I S C U S S I O N
W. D. J. GESTEL: I gather that some material test specimens have been
put into the reactors in connection with pressure-vessel inspection. Are
these test specimens subject to the same stresses as the reactor vessel
plates themselves, because if they are not, surely they cannot be taken as
representative of the condition of the pressure-vessel plates?
E. L. DESBRUSLAIS: Thus far, no stressed steel specimens have been
tested in the Calder Hall reactors, although this is to be done very soon.
452 E. L. DESBRUSLAIS
Stressed specimens have been loaded into Chapelcross reactors, however.
They will be analysed in due course.
B. SAÏTCEVSKY: Have the filters in the C O 2 circuit been replaced?
How high is the content of dust in the CO2, and what is its composition?
E. L. DESBRUSLAIS: The filters in the main C O 2 circuit have not been
changed. In the early days we used to take samples from the filters and
analyse them; the quantity of dust was so small, however, and its compo
sition so consistent that I recently decided not to keep the filters in the cir
cuit during normal operation but bring them into use only if abnormal con
ditions were suspected. So far we have not had occasion to put them back
in the circuit. I cannot tell you exactly what the composition of the dust is
but it consists mainly of graphite and iron.
M.'R.-SRINIVASAN: Mr, Desbruslais has given us a very lucid account
of the experience gained with various plant components at Calder Hall. I
should like to know what improvements of design could be made in the light
of this experience - particularly in the safety systems and instrumentation -
with a view to further simplifying this type of plant and reducing both ca
pital costs and the cost of power production per kilowatt hour.
E . L. DESBRUSLAIS: This matter has already been informally con
sidered. One of the reasons for the success of Caiaer Hall is that the plant
is already simple in design and can be operated with no greater difficulty
than conventional power plants. It has no complicated servo loops, no on
load charge and discharge machinery, and the maintenance procedures are
essentially simple. There are a few changes which I would advocate, how
ever, if Calder Hall were to be redesigned: replacement of the existing DC
blower-drive system, which is very expensive; a new design for the reactor
core which would allow higher output with a higher inlet-gas temperature;
a redesigned burst-cartridge detection system, as mentioned in my paper;
the use of solid-state devices instead of the relays and contactors now em
ployed in the safety circuitry (this is in itself really quite simple and would
not admit of much further rationalization); and the centralization of plant
controls in order to reduce the number of operators required.
I do not know what the cost per kilowatt installed of a redesigned Calder
Hall would be, but I can refer your query to the consortium of manufacturers.
QUATRE ANS DE FONCTIONNEMENT DES
RÉACTEURS G2 ET G3.
F. CONTE
CENTRE D'ÉTUDES NUCLÉAIRES DE MARCOULE, FRANCE
Abstract — Résumé — Аннотация — Resumen
THE G2 AND G3 REACTORS AFTER FOUR YEARS OF OPERATION. The G2 and G3 gas-graphite reactors
at Marcoule have been in operation for four and three years respectively. This paper reviews the main problems
raised by the operation of the reactors from the standpoint of technology, safety, performance and organization.
The solutions adopted and the results obtained are presented here as a contribution to the study of future power
reactor programmes.
QUATRE ANS DE FONCTIONNEMENT DES RÉACTEURS G2 ET G3. Les réacteurs graphite-gaz G2 et G3
de Marcoule fonctionnent respectivement depuis 4 et 3 ans. La communication présentée passe en revue les
principaux problèmes soulevés par l'exploitation de ces réacteurs au point de vue technologie, sécurité, per
formances et organisation. L'auteur expose les solutions adoptées et les résultats obtenus afin de contribuer à
l'étude de programmes futurs de réacteurs de puissance.
ЧЕТЫРЕ ГОДА РАБОТЫ РЕАКТОРОВ G2 И G 3 . -Реакторы с графитовым замедлителем и газовым тепло
носителем G2 и G3 в Маркуле работают соответственно 4 и 3 года. В предлагаемом сообщении дается
обзор основных проблем, вызванных эксплуатацией этих реакторов, с точки зрения технологии, без
опасности, эксплуатации и организации. Принятые решения и полученные результаты используются
для более глубокой разработки будущих программ энергетических реакторов.
CUATRO AÑOS DE FUNCIONAMIENTO DE LOS REACTORES G2 Y G3. Los reactores de grafito y anhí
drido carbónico G2 y G3 de Marcoule funcionan desde hace cuatro y tres aflos respectivamente. La memoria
revisa los principales problemas planteados por su explotación desde los puntos de vista tecnológico, de la
seguridad, del rendimiento y de la organización. Informa sobre las soluciones adoptadas y sobre los resultados
obtenidos para contribuir al estudio de programas futuros de reactores de potencia.
I. INTRODUCTION
Les réacteurs G 2 /G 3 du Centre de Marcoule sont du type uranium
naturel — graphite — gaz. Ces piles sont horizontales, possèdent 1200 canaux
chargés de 120t d'uranium. La pression de service est de 15 kg/cm2, le
gaz caloporteur est l'anhydrique carbonique. Le soufflage est assuré par
des turbosoufflantes. Une description très complète de ce réacteur a fait
l'objet d'une publication [1] .
La puissance nominale du projet était de 200 M W . Une centrale de
récupération d'énergie est associée à ces réacteurs et débite sur le réseau
général d'Electricité de France,
Certaines options audacieuses ont été adoptées pour leur réalisation:
a) le caisson est en béton précontraint et b) le chargement du combustible
s'effectue en marche.
La montée en puissance de G 2 a eu lieu en avril 1959, celle de G 3
en mars 1960. Ces réacteurs constituent la première réalisation française
de la filière graphite — gaz pour les réacteurs de puissance. Leur desti
nation est avant tout plutonigène, mais devant l'intérêt, que cette filière re
453

454 F. CONTE
présente au point de vue énergétique, le développement de cet aspect est
poursuivi par l'Electricité de France, sur le site de Chinon.
La somme d'expérience acquise à Marcoule en 4 années est consi
dérable et il paraît intéressant de publier les résultats obtenus, surtout
en ce qui concerne les réalisations originales de nos réacteurs.
La présente communication mettra l'accent sur les performances ob
tenues au cours de ces 4 années de fonctionnement, entre autres sur les
augmentations successives de la puissance de ces réacteurs.
Le chargement et déchargement en marche de G 2 et G 3 sera parti
culièrement détaillé en mettant en relief les principales modifications qui
ont permis de réaliser le tonnage actuel de 3 t/j.
Il sera fait mention de quelques incidents sur les installations dites
«classiques» et on essaiera d'en tirer un enseignement.
Trois compléments importants sont joints à ce rapport. Ils traitent
de la détection de rupture de gaines de G 3, de la surveillance automatique
des températures, de l'organisation et de l'instruction du personnel 12] .
Le caisson en béton précontraint des piles G 2 et G 3, précurseur heu
reux en ce domaine, est traité à part dans une autre communication [3] .
L'aspect neutronique et les enseignements qu'il est possible d'en tirer
ont été exposés au Colloque de Bornemouth en avril 1962, [4] et à la con
férence actuelle dans. une communication traitant de l'ensemble de ces pro
blèmes pour la filière graphite — gaz dans le programme français [5] .
II. P E R F O R M A N C E S DU R E A C T E U R
Lors de l'établissement de l'avant-projet, la puissance de 150 MW avait
été fixée comme puissance nominale. Au fur et à mesure de l'avancement
des études, on pouvait envisager une puissance de 200 M W en utilisant le
même cœur, grâce à une répartition du flux correspondant à un aplatisse
ment de la zone centrale et à un relèvement de ce flux dans la zone péri
phérique par le chargement d'un combustible de plus grand diamètre.
La divergence de G 2 a eu lieu le 21 juillet 1958 (fig. 1)
Après les expériences neutroniques habituelles et les dernières mises
au point, la montée en puissance débutait le 5 avril 1959. Dix-huit jours
après, la puissance de 150 M W était atteinte et la puissance nominale de
200 M W était obtenue le 27 mai de la même année. La centrale de ré
cupération mise en route entre-temps, débitait sur le réseau français le
22 avril 1959.
Le réacteur G 3, mis en route 11 mois après G 2, suivait sensiblement
la même progression dans la montée en puissance. Les dates correspo-
dantes sont:- montée en puissance: 7 mars 1960,
- puissance nominale de 200 M W : 22 avril 1960,
- couplage de l'alternateur: 4 avril 1960.
Pendant la première période de fonctionnement des deux réacteurs,
la limite dé pilotage a été la température de la gaine la plus chaude. Une
série d'une cinquantaine de thermocouples de gaine avait été répartie dans
toutes les zones des réacteurs afin de dresser une carte des températures
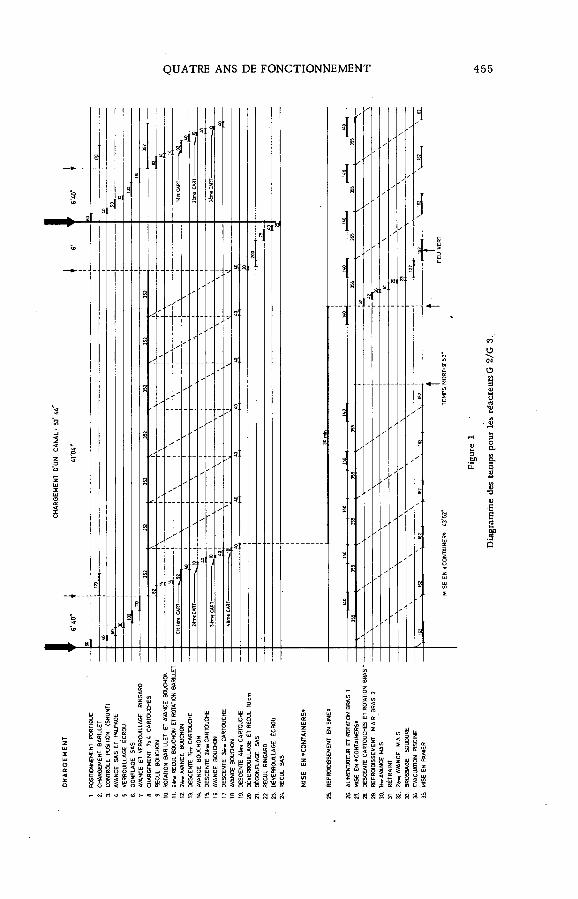
CH
ARG
EMEN
T O'
UN
CANAL
:
53' U.
QUATRE ANS DE FONCTIONNEMENT 455
Figu
re
1
Dia
gram
me
des
tem
ps
pour
les
réac
teurs
G
2/G
3.
456 F. CONTE
permettant, par la suite, de s'abstraire de ces mesures de températures
incompatibles avec un chargement en marche. Ces séries de mesures furent
suffisantes pour déterminer les relations entre les températures des gaz,
celles des gaines et le flux neutronique. La température de gaine était
fixée à 415°C.
Lors du premier arrêt de chacun des réacteurs, les thermocouples
de gaines furent enlevés et ne furent pas remplacés. Depuis cette époque,
par conséquent, la température de pilotage est la température du gaz de
sorties des canaux. Rappelons que tous les canaux sont équipés de thermo
couples CO2. Les relations établies pendant la première période ont permis
de conserver la validité de la température de la gaine la plus chaude à415°C
même pendant des fonctionnements avec des températures d'entrée de gaz
modifiées.
Les températures d'entrée de gaz ont subi, en effet, plusieurs change
ments depuis le démarrage des réacteurs. Rappelons que nos réacteurs
possèdent 2 zones d'entrée de gaz. En premier lieu, les points chauds dé
couverts dans le béton de G 2 ainsi qu'il est relaté plus loin, ont imposé une
période de marche anormale, la température de la zone périphérique in
téressant environ 400 canaux a été baissée au maximum (110°C). Dès la
remise en ordre des circuits internes, cette température a été ramenée
à une valeur plus correcte (130°C).
Ces températures d'entrée ont été, à nouveau, modifiées par la suite
de fa^on à mesurer l'influence exacte sur l'énergie Wigner dans les 2 zones
d'entrée à températures différentes. Par la suite et en raison des résultats obtenus, ces températures ont été uniformisées et les deux réacteurs fonc
tionnent avec une température d'entrée en toutes zones de 140°C.
A la suite de ces modifications de températures d'entrée et au prix d'un
léger changement dans le réseau d'absorbants (possible en marche), l'on
a pu envisager un chargement de combustible différent. Jusqu'alors, la
zone centrale (800 canaux) était chargée avec des barreaux d'un diamètre
de 28 m m , la zone périphérique (400 canaux), étant chargée en diamètre
31 mm. Pendant l'année 1961, ces diamètres furent uniformisés à 31 mm.
La puissance atteignit alors 220 M W .
La fonction avant tout plutonigène de nos réacteurs, n'imposant pas
nécessairement une économie de combustible, nous a amenés à repenser
les températures limites initialement fixées pour ce combustible et le gai
nage. Il a paru possible d'augmenter ces valeurs assez sensiblement, sans
risques, le combustible et les gaines ayant une tenue parfaite.
Au début de l'année 1962, la température de gaine maximum fut fixée
à 455CC, la puissance atteignait alors 240 M W .
Cette température de gaines ne tient pas uniquement compte de la tenue
du combustible en pile. Sa valeur est donnée par le calcul de l'échauffe-
ment possible en cas d'accident de dépressurisation rapide par rupture de
grosse tuyauterie à l'entrée du réacteur, échauffement ne devant pas dé
passer la température de fusion et de combustion du magnésium. Il semble
que les hypothèses de calcul laissent encore une marge de sécurité.
Par ailleurs, la tenue du gainage depuis cette augmentation de tem
pérature est toujous aussi bonne et aucune tendance néfaste n'a été décelée.
Des.essais se poursuivent avec des températures encore plus élevées et
nous permettent d'espèrer pour l'avenir.
QUATRE ANS DE FONCTIONNEMENT 457
Une autre possibilité d'augmentation de puissance est donnée par l'aug
mentation des températures dans les zones relativement froides. L'apla
tissement du flux dans le sens radial est obtenu par un réseau de canaux
d'absorbants conservant sensiblement une forme de flux en cosinus dans
le sens longitudinal. Par un chargement hétérogène de ces canaux d'ab
sorbants, il a été possible de déplacer le maximum du flux vers la zone
d'entrée de gaz. Ceci s'est traduit par un aplatissement de la courbe des
températures le long des canaux, rendant possible un relèvement général
sans que le maximum dépasse la valeur précédemment admise.
L'augmentation de puissance corrélative a été supérieure à 10 M W ,
la puissance dépassant ainsi 250 M W dès la fin de l'année 1962.
On verrra dans le chapitre traitant du chargement en marche les pos
sibilités offertes par cette technique. Si l'augmentation des performances
maxima est agréable en soi, il paraît encore plus rentable d'augmenter la
puissance moyenne en la maintenant le plus près possible de ce maximum.
C'est ici qu'intervient l'agrément d'un changement possible, en marche,
du combustible et des éléments absorbants. La dispersion des puissances
unitaires des canaux peut être réduite par un ajustement permanent du
chargement. Dans nos réacteurs, ce réajustement est habituellement ap
pliqué. Une telle facilité permet donc d'obtenir une puissance-moyenne proche
de la puissance maximum. L'on peut dire que 250 MW est dans l'état actuel
la puissance minimum que nous obtenons sur les réacteurs G 2 /G 3.
La puissance récupérée par la centrale bénéficiait parallèlement des
performances du réacteur et augmentait dans le même temps pour atteindre
à ce jour une puissance proche de 40 M W , c'est-à-dire la saturation
du turbo-alternateur.
Rappelons que la puissance nécessaire au soufflage est prélevée au
niveau des échangeurs par emploi de la vapeur MP sur des turbosoufflantes.
La puissance récupérée est donc nette et peut être distribuée sur le réseau
d'Electricité de France en quasi totalité.
III. MODIFICATIONS INTERNES
La mise en route du premier réacteur (G 2) menée à la fois avec pru
dence et rapidité, permettait d'atteindre 150 M W le 23 avril 1959, soit 18
jours après le «top» de départ. Les petits incidents habituels en un tel
cas furent vite surmontés mais il restait quelques grosses anomalies dans
les températures à l'intérieur du caisson, anomalies auxquelles il était
impossible de remédier sur l'heure.
En trois points, en effet, le béton dépassait très sensiblement la tem
pérature de 50°C prévue prudemment par le projeteur. Des perturbations
dans les courants du gaz de refroidissement amenaient hors des circuits
normaux un gaz très chaud et provoquaient des échauffements néfastes.
1. Echauffements dus aux circuits «primaire» et «secondaire»
Il est expliqué dans une autre communication [3] les raisons pour les
quelles, dans cette première réalisation en béton, le refroidissement du
caisson est assuré par un circuit spécial appelé «circuit secondaire». Le

458 F. CONTE
bloc actif proprement dit est balayé par le « circuit primaire » . La co
existence à l'intérieur du caisson étanche de 2 circuits à destinations dif
férentes et à température et débits également différents, posait des pro
blèmes de fuites entre circuits. Afin de contrôler ces fuites, elles furent
rendues volontaires et dans un sens tel, que les gaz «primaires» chauds
ne pouvaient se mélanger au gaz «secondaire» froid. La compensation
de ces fuites est faite dans les circuits extérieurs au réacteur. En fait,
la section de fuite volontaire s'est avérée trop importante et la hauteur de
l'empilement créait un effet de cheminée dans les capacités de répartition
des gaz. La fuite volontaire s'est révélée inversée dans le sommet du bloc
graphite, le gaz chaud venant se mélanger au circuit secondaire provoquait
un réchauffement dans la partie haute du caisson.
Par ailleurs, le circuit secondaire intéresse à l'intérieur du caisson,
un volume considérable et le débit devenait par endroits trop faible pour
évacuer les calories supplémentaires amenées par la fuite inversée.
Une poche de gaz chaud s'est ainsi formée le long de la génératrice
haute du cylindre de béton, réchauffant la peau d'étanchéité et par suite
le béton lui-même. Les températures atteignirent et dépassèrent 80°C sur
la tôle intérieure. Les contraintes dans le béton, mesurées avec le soin
qu'on imagine, donnèrent également des valeurs relativement élevées mais
n'atteignirent jamais un seuil inquiétant. Le réacteur fonctionna à pleine
puissance dans ces conditions pendant plus de 3 mois.
Un premier remède provisoire fut apporté en abaissant les températures
d'entrée de gaz de la zone périphérique, mais cette méthode ne pouvait
s'appliquer indéfiniment en raison de l'accumulation de l'énergie Wigner
malgré le flux relativement faible de cette zone.
Le réacteur G 3 n'ayant pas encore fonctionné à cette époque, des essais
en température furent entrepris afin de trouver un remède efficace à ces
anomalies. En fin de compte, plusieurs modifications furent décidées et
appliquées:
a) la section de la fuite volontaire entre circuits fut considérablement di
minuée par la mise en place de tôles de fermeture jouant un rôle de
diaphragme.
b) le balayage de la partie haute du cylindre fut amélioré par la pose de
tuyauteries amenant directement du gaz frais dans cette zone.
c) la circulation générale du circuit secondaire à l'intérieur du caisson
fut rendue plus cohérente et plus efficace en tous points par la pose d'un
«déversoir» imposant un cheminement plus homogène au gaz.
Il convient de rappeler ici que le réacteur G 2 avait fonctionné à pleine
puissance pendant 3 mois. Le travail à l'intérieur du caisson pouvait pa
raître impossible. Il n'en fut heureusement rien et malgré la gêne apportée
par les précautions draconiennes imposées au personnel, ces travaux furent
effectués dans de parfaites conditions de sécurité et de rapidité.
Le réacteur G 3 ne posa pas de problème semblables et il fut possible
d'apporter quelques modifications supplémentaires ce qui constitue une des
rares différences existant entre les 2 réacteurs.

QUATRE ANS DE FONCTIONNEMENT 459
2. Echauffements dus au déchargement
Le déchargement du combustible irradié s'effectue par gravité grâce
à des tubes collectant les canaux à la sortie du graphite et conduisant les
cartouches dans des tours de ralentissement extérieures au caisson en bé
ton. Une extrémité de ces tubes est donc en communication avec les ca
pacités d'entrée des gaz chauds et l'autre extrémité avec les tours appelées
«toboggans» contenant du gaz froid.
Un thermosiphon s'établit entre ces deux capacités par l'intermédiaire
des tubes. Ces tubes traversent le béton du caisson. Les gaz chauds ap
portèrent donc des calories à ce béton et sa température dans la zone in
téressée atteignit et dépassa 100°C.
Le remède fut ici relativement simple puisque intéressant une partie
de circuit extérieur au caisson proprement dit. Il a consisté en la pose
sur les tubes de déchargement de clapets interrompant la circulation para
site du gaz. Ces clapets doublés par des vannes d'isolement sont évidemment
ouverts à l'occasion des déchargements.
3. Echauffements dus aux prélèvements de gaz
Les prélèvements de gaz pour la détection de rupture de gaine s'effectuent
à la sortie de chaque canal, à l'intérieur du caisson. Les tubes correspo-
dants traversent la coupole de béton constituant la face pile et se regroupent
dans les salles de détection.
En raison des différences de pression existant entre les canaux, un
courant s'établissait entre ces différents tubes réchauffant ainsi le béton
de la face pile. Ce phémomène était accéléré en particulier sur le ré
acteur G 2 en raison de la technique de la détection de rupture de gaine.
Le gaz est ici à haute température puisque prélevé à la sorties des canaux.
Le béton atteignit des températures encore plus élevées que précédemment.
Le remède fut de deux sortes: les vannes rotatives de la détection de
rupture de gaine de G 2 furent modifiées de façon à supprimer toute com
munication entre les arrivées de tubes de prélèvement. Sur les deux ré
acteurs, des clapets antiretour furent posés sur ces mêmes tubes de façon
à ne laisser subsister qu'un sens d'écoulement des gaz chauds et uniquement
pendant les périodes de prélèvement.Les anomalies citées ci-dessus furent donc supprimées dans la pre
mière année de vie du réacteur G 2. Ces phénomènes n'atteignirent jamais
des valeurs inquiétantes. En dehors des leçons à tirer concernant l'étude
et la conception des circuits de gaz dans un réacteur à caisson en béton,
il convient de souligner l'illustration que constituent ces phénomènes en
ce qui concerne la sécurité de ces caissons. Malgré les hautes tempé
ratures atteintes (plus de 100°C), le matériau constitutif n'a pas souffert
et le caisson de G 2 a montré ainsi la marge considérable que laisse un
tel ouvrage dans les valeurs habituelles d'une exploitation normale.
IV. A M É LIO R A T IO N DES INSTALLATIONS DE C H A R G E M E N T
Le chargement des réacteurs de Marcoule se fait en marche, c'est-
à-dire que ces opérations effectuées en service continu n'affectent pas le

460 F. CONTE
fonctionnement de la pile elle-même. Rappelons-en brièvement les prin
cipes généraux: G 2 et G 3 sont des piles horizontales, l'introduction du
combustible neuf a lieu par la face extérieure où débouchent les 1 200 canaux
sur lesquels vient se fixer l'appareil de chargement. Le combustible intro
duit pousse les cartouches du canal et provoque à l'autre extrémité la chute
du combustible irradié. Celui-ci descend de lui-même par gravité jusqu'
aux installations de mise en «container» et est ensuite dirigé vers la pis
cine de stockage. L'ensemble de ces opérations est automatique ou télé
commandé.
Le chargement proprement dit s'effectue par l'intermédiaire de 2 sas
de chargement. Un sas étant accouplé au canal à charger, les pressions
sont égalisées, le bouchon est déverrouillé et retiré du réacteur. On dis
pose alors le combustible neuf devant ce même bouchon qui est remis en
place dans le canal, entraînant les cartouches dans son mouvement.
L'appareillage des sas comporte sept mouvements pour assurer
l'ensemble des opérations. Ces mouvements sont automatiques et les re
ports visibles, mécaniques ou électriques, permettent de contrôler à tout
instant les positions et l'avancement du combustible en cours d'enfournement.
Nous relaterons ci-dessous les principaux incidents survenus dans la mise
au point et les modifications apportées.
1. Défauts d’étanchéité au sas de chargement
Des ruptures d'étanchéité se sont produites sur le sas de chargement.
La sanction était en général toujours la même: le sas étant ramené brusque
ment à la pression atmosphérique par la fuite, le bouchon en cours de mouve
ment était repoussé violemment par la pression intérieure du réacteur et
projeté au fond du sas. Il provoquait des dégâts importants à l'appareillage.
Une première parade a consisté à rendre le mouvement de commande du
bouchon irréversible et capable de contenir des poussées importantes. De
cette façon, une rupture d'étanchéité dans l'état actuel provoquerait une perte
momentanée de C O 2 mais l'appareillage ne souffrant pas et étant toujours
disponible, il deviendrait possible de refermer le canal immédiatement.
Les bouchons fermant les canaux ont une longueur de 8 m environ; ils
sont articulés mais, afin de constituer une protection biologique suffisante,
ils sont introduits dans les boisseaux avec un jeu très faible. On conçoit
dans ces conditions, que certains bouchons aient pu difficilement reprendre
leur place normale. Précisons que ces incidents ont surtout eu lieu au dé
but. Au bout de plusieurs manoeuvres l’opération se reproduit sans dif
ficulté, sauf cas exceptionnel de grippage. A plusieurs reprises, il a été
impossible de verrouiller le bouchon. Nous avons été dans l'obligation,
lors d'un de ces incidents, de découper au chalumeau l'avant du sas de chargement pour l'abandonner sur la pile. Cette opération nous a montré
la modification à apporter à l'appareil. Actuellement, le sas possède une
partie avant démontable qu'il est possible d'abandonner sans ennui sur un
canal rétif. Quelques opérations simples permettent ensuite de le récupérer
puisqu'il devient accessible, la partie gênante de l'appareil étant reculée.
Une autre possibilité de refermer un canal malgré tout nous est aussi
donnée grâce à un bouchon spécial qui est en permanence dans le sas de
chargement. Ce bouchon à verrouillage automatique a la longueur de deux
QUATRE ANS DE FONCTIONNEMENT 461
cartouches et occupe un alvéole réservé au combustible. En cas d'ennuis,
il suffit de pousser ce bouchon comme une cartouche ordinaire et il vient
se verrouiller de lui-même sur le canal, en assurant la fermeture.
Les incidents relatés ci-dessus ont eu, en général, des conséquences
semblables pendant la période de mise au point, avant modification: le dé
gagement du sas de chargement étant impossible puisque les canaux ne pou
vaient être fermés, il a fallu décomprimer complètement le réacteur pour
désaccoupler la machine.
Ces incidents ont rapidement ouvert les yeux sijr les remèdes urgents
à apporter, dont certains ont été décrits ci-dessus. Un principe primordial
peut être dégagé: pouvoir, en toute circonstance, étancher un canal, l'aban
donner et dégager l'appareil de chargement.
2. Positionnement défectueux des pièces à l'intérieur de l'appareil
Certains incidents ont eu pour cause une connaissance imparfaite des
positionnements des pièces à l'intérieur de l'appareil. Cette mauvaise
connaissance provenait autant de la précision mécanique insuffisante des
pièces elles-même que de la mauvaise fidélité des organes reproduisant
ces mouvements à l'extérieur.
Les principales modifications ont porté sur le maintien des pièces en
mouvement. On a cherché à guider positivement, à tout instant, chaque
pièce dans n'importe quelle position, chaque arrêt par contre étant con
firmé par un verrrouillage mécanique positif et précis.
On devient ainsi sûr à 100% qu'un organe arrive bien à l'endroit qui
lui est assigné, s'y arrête et ne bouge plus. Ceci paraît très simpliste
mais ne paraissait pas évident lors de l'établissement du projet. Notre
expérience nous a ainsi dicté cet autre principe: mécanique simple mais
précise, toujours guidée ou verrouillée positivement.
3. Défauts dus à des transpositions Hâtives du réacteur G 1
La rapidité de la conception et de la construction de nos réacteurs, a
amené certaines transpositions du réacteur G 1. Toutes n'ont pas donné
de bons résultats; par exemple la serrure des bouchons des canaux, quel
ques ennuis, mais surtout quelques craintes nous ont fait décider leur rem
placement. Les fonctions de cet organe ont été séparées, les pièces de
verrouillage ne subissant plus d'effort pendant les avances ou recul du bou
chon. Certains principes ont été adoptés, en particulier un auto-verrouillage
provoqué par la poussée de la pression intérieure. La résistance méca
nique de l'ensemble a été considérablement augmentée.
Avant de généraliser le changement des serrures sur les 2 400 canaux
des 2 réacteurs, des essais très sévères ont été effectués. Notre satis
faction n'a été complète qu'après un nombre de manoeuvres représentatives
des serrures prototypes correspondant à un service continu de 4 000 ans
sans un seul incident. ,
Nous avons été amenés d'ailleurs en d'autres occasions, à appliquer
systématiquement la règle suivante: un organe essentiel n'est mis en pile
qu'après avoir subi, sans le moindre incident, sous forme de prototype,
des essais représentant 2 000 ans de service au minimum.

462 F. CONTE
4. Hall d'essai pour les pièces importantes
L'entretien systématique et le réglage des appareils ont été étudiés
très minutieusement. Un hall d'essai faisant, en quelque sorte, fonction
de «station service» a été aménagé- Tous les appareils importants sont
révisés à intervalles fixes et essayés dans des conditions représentant
exactement celles de leur travail normal. Ceci s'applique aussi bien aux
petites pièces qu'aux grands ensembles tels que les sas de chargement. En
effet, ceux-ci peuvent être remplacés facilement et transportés d'une seule
pièce dans le hall d'essai, où un canal expérimental en pression permet
tous les essais et mises au point possibles.
La mise en oeuvre de cette «station service» a été immédiatement
bénéfique. Actuellement, un appareil, quel qu'il soit, réglé dans cette
station peut être employé directement sur le réacteur sans réglage ulté
rieur. Le cas des machines à souder les «containers» est ici typique,
puisque ces machines complexes sont changées à distance sans intervention
manuelle.
Un fonctionnement régulier et sûr est assuré par un entretien et un
réglage systématique dans des conditions intégralement représentatives.
5. Nouveaux moyens de mise en œuvre pour le déchargement et le
chargement
Signalons par ailleurs, et à titre d'information, de nouveaux moyens
mis en œuvre, à titre d'essai, pour le déchargement et le chargement de
ces réacteurs par la face avant. Un ringard souple et enroulable consti
tué de feuillard de tôle s'agrafant automatiquement, pénètre dans le cœur.
Ce ringard muni d'une pince électrique à son extrémité peut ainsi retirer
les cartouches une à une, les transférer dans d'autres canaux où les évacuer
ou les évacuer par cercueils spéciaux. Il y a aussi possibilité, par simple
poussée de ce ringard, de déchargement par la voie normale sans être tenu
de remplacer le combustible comme dans le cas habituel et ainsi d'obtenir
aisément des canaux vides. Le système complet est contenu dans une petite
enceinte sous pression de faible encombrement. La longueur totale de rin
gard qui peut être déployée atteint 30m.
V. A M É LIO R A T IO N DES IN STALLATION S DE D É C H A R G E M E N T
Le combustible irradié tombe par gravité hors du réacteur et est ré
cupéré, toujours sous pression, dans des couloirs vibrants horizontaux qui
permettent de le stocker et de le refroidir pendant quelques instants avant
la mise à l'air libre. Le passage du CO2 à 15 kg/cm2 à l'air à pression
atmosphérique s'opère dans un sas équipé d'un couloir vibrant qui évacue
les cartouches par groupe de 4. C,es 4 cartouches sont disposées dans un
tube d'aluminium (container) qui est rétreint à ses extrémités et soudé. Le
«container» est ensuite déposé dans une conduite hydraulique qui l'achemine
en sous-sol jusqu'à la piscine de désactivation où le combustible est em
magasiné.

QUATRE ANS DE FONCTIONNEMENT 463
L'ensemble de ces opérations est automatique et cet automatisme ne
nous a jamais créé d'ennuis. Les quelques incidents que nous ayons eu à
déplorer proviennent de coincements mécaniques des «containers» dans
les machines. Un remodelage des pièces de guidage est venu à bout de la
majorité des cas.
Comme dans le cas du chargement, une chaîne d'essai extérieure a
été réalisée. Les machines de mise en «containers» sont périodiquement
évacuées, entretenues et réglées. Leur interchangeabilité est complète.
Un entretien systématique a ainsi remplacé le dépannage qui est le propre
de toute installation prototype.
Les systèmes à vibrations enfermés dans des enceintes étanches et sous
pression nous ont occasionné quelques déboires. La seule parade efficace
a été, à nouveau, une précision accrue et un contrôle strict et systématique
de l'installation.
Tous les autres incidents ont été surmontés facilement en accroissant
les moyens de contrôle visuel et les moyens d'intervention à distance. Les
machines et le combustible étant ici à l'air libre, il a suffi de disposer des
hublots à grande visibilité et de mettre en oeuvre des télémanipulateurs de
grande capacité.
Il semble utile de mentionner quelques considérations d'ordre général
en ce qui concerne la mise en «containers» et l'évacuation du combustible
irradié.
Cette installation était une de celles qui nous inquiétait le plus à l'époque
du projet. Trier un combustible sortant de pile, le mettre en boîtes étanches
et l'expédier à la piscine de désactivation, ceci à cadence industrielle, sem
blait à l'époque d'une inquiétante complexité.
Grâce à une mise au point assez poussée, en inactif, la mise en service
en actif a été relativement facile malgré les petits ennuis inévitables men
tionnés ci-dessus. L'exploitation industrielle de cette installation qui fonc
tionne depuis 4 ans permet des cadences doubles de celles du chargement
détaillées plus loin.
Par ailleurs, beaucoup de précautions prévues à l'époque du projet
sont inutiles et une mise en «containers» moderne serait plus simple. Cer
taines opérations seraient supprimées, par exemple le refroidissement
intermédiaire du combustible avant soudage.
Actuellement, le déroulement des opérations est le suivant:
- déchargement du canal,
- refroidissement durant une demi heure dans du C 0 2 en pression
(ce temps peut être fortement réduit sans inconvénient),
- mise à l'air libre du combustible,
- mise en boîte,
- rétreint des «containers»,
- soudage,
- transport hydraulique à la piscine.
Depuis la mise à l'air libre des cartouches jusqu'à l'arrivée en piscine,
il s'écoule moins de 6 min. Le transport par conduit hydraulique souterrain
supprime toute manutention, il est sans aléas et d'une parfaite régularité.
Trente secondes sont suffisantes pour le transport d'un «container» jusqu'
aux installations de pesage, triage et stockage sous l'eau de la piscine.
464 F. CONTE
Là aussi, tout se passe par télécommande, sans heurts.
Le côté spectaculaire de ces opérations provient surtout de cette fa
cilité et de cette sûreté déconcertantes qu'il n'est pas habituel de voir pour
une telle manutention.
Nous avons longtemps considéré la mise en «containers» comme étant
un impératif embarrassant. Il nous semble actuellement que les avan
tages considérables qu'en tire le stockage en piscine compensent très large
ment les investissements de cette installation.
Il convient de remarquer également l'agrément supplémentaire que
procure une eau de piscine non contaminée, où le temps de séjour du com
bustible importe peu puisqu'il est à l'abri de toute attaque extérieure.
VI. IN F LU E N C E D U C H A R G E M E N T E N M A R C H E
Le chargement en marche de nos réacteurs a deux conséquences au
point de vue puissance:
a) la première, d'effet immédiat, provenant du mouvement du combustible
ou des absorbants.
Le gaz de refroidissement tend à repousser les cartouches vers la face
de chargement quand le bouchon, étant reculé, ne les maintient plus
en place. Ceci provoque peu d'effet quand il s'agit de combustible, mais
provoque des fluctuations de puissance plus importantes quand on charge
ou décharge des absorbants. Dans ce cas, les variations peuvent at
teindre si l'on n'y remédie par les barres de contrôle, ± 10 M W autour
de la puissance normale. En fait, le contrôle suit aisément ces fluctuations et, dans le cas d'absorbants, les manoeuvres sont faites assez
lentement pour ne pas créer de cyclages du combustible.
b) la deuxième conséquence, d'intérêt considérable, est la possibilité
d'adapter les zones d'irradiations différentes aux zones de températures
ou de flux différentes et ainsi de profiter d'un gain de puissance sup
plémentaire au prix d'une progammation des chargements très étudiée.
De plus, l'irradiation générale de la pile peut ne pas influer sensible
ment sur le contrôle du réacteur, l'introduction ou l'enlèvement d'ab
sorbants étant possible à tout instant.
Il convient de mentionner un autre aspect des avantages du chargement
en marche de ces réacteurs, il s'agit de l'homogénéité de l'irradiation. La
circulation du combustible dans les canaux permet, suivant le nombre de
cartouches chargées et déchargées, une économie certaine de combustible.
Ceci peut provenir d'une plus grande homogénéité dans l'irradiation im
posée, ou de la possibilité d'irradier au maximum un plus grand nombre
de cartouches. Cet avantage supplémentaire, d'un grand intérêt, découle
en partie de la position horizontale des canaux des réacteurs G 2 /G 3.
VII. P E R F O R M A N C E S DU C H A R G E M E N T
Les sections précédentes font état de modifications dans la mécanique
et la géométrie des installations de chargement avec un accroissement de

QUATRE ANS DE FONCTIONNEMENT 465
la sécurité comme but principal. Un deuxième but était atteint par la même
occasion, il s'agit de la rapidité des opérations.
Par ailleurs, des améliorations supplémentaires ont été apportées afin
de concourir cette fois au seul impératif des performances.
Les sas de chargement sont mis en pression ou en dépression à chaque
opération. U avait été prévu un circuit complexe de mise en pression et de
mise sous vide de l'appareil. Ces opérations étaient fort longues. Le cir
cuit a été modifié, la compression est faite à partir de gaz neuf, la mise
sous vide (pour éviter des entrées d'air en pile) est remplacée par un bala
yage. Le gain de temps a été considérable. De plus, l'ancien circuit était
à commande automatique. Ces opérations ne faisant prendre aucun risque
particulier et restant très simples sont maintenant manuelles et ont permis
de simplifier l'installation.
L'appareil de chargement positionnne à chaque manoeuvre du bouchon
2 cartouches. Après quelques mois d'exploitation, il a paru possible
d'introduire un nombre supérieur de cartouches sans inconvénient pour les
températures ou les débits à l'intérieur du canal. Le fonctionnement actuel
normal admet 4 cartouches à chaque manoeuvre de bouchon, permettant
une meilleure cadence.
Un diagramme des temps pour une opération type est donné à la figure 1.
Il ressort de ce diagramme la possibilité de décharger près de 27 ca
naux complets en 24 h, soit 750 cartouches, soit 3 t de combustible. Ceci
pour chaque réacteur.
U s'agit là de performances correspondant à un fonctionnement normal,
et non à des cadences de pointe. Les entretiens et remplacements systé
matiques cités aux sections précédentes, trouvent facilement leur place
pendant les creux du programme, la cadence ci-dessus peut être en effet
tenue en permanence mais dépasse bien sûr la demande.
On pourra objecter que ces performances sont bien inutiles pour des
réacteurs de puissance à forte irradiation tels qu'ils sont envisagés pour
les centrales futures. Mais trop de bien n'a jamais nui.
De plus, les r'éacteurs en .construction, ayant un nombre de canaux
important, demandent des performances de chargement élevées afin de
profiter au maximum des avantages d'une telle installation.
Rappelons rapidement ici les principaux de ces avantages:
- économie de combustible,
- homogénéité de l'irradiation permettant la permanence du réseau d' absorbants,
- ou, au contraire, constance de la réactivité par modification du réseau,
- homogénéité des températures,
- possibilité de l'aplatissement longitudinal du flux, commode,
- gain énorme de temps,
- accroissement du facteur de charge, surtout si les arrêts pour entretien
d'autres installations sont réduits.
VIII. L 'A U T O M A T IS M E E T L A C E N TR A LISA TION D U C O N T R O L E
U est frappant de constater l'étonnement des visiteurs entrant dans la
salle de commande de nos réacteurs, devant l'importance des installations de
30

466 F. CONTE
contrôle. Ces salles de commande ont été conçues comme le cerveau unique
de l'installation où aboutissent toutes les mesures et d'où partent tous les
ordres. Les opérateurs ont sous les yeux, en permanence tous les éléments
d'appréciation dans tous les domaines: réacteur proprement dit, refroi
dissement et soufflage, centrale électrique, alimentation électrique, dé
tection de rupture de gaine, épuration des gaz, alimentation en eau et en
air comprimé, etc. Seul le chargement, qui possède sa propre salle de
commande, n'est connu que par ses valeurs principales.
En ce qui concerne la détection de rupture de gaine de G 3 et la sur
veillance des températures, le contrôle n'est pas seul centralisé. L'auto
matisation est ici complète et les opérateurs n'ont qu'un rôle de supervision.
On pourra lire dans les compléments 1 et 2 à cette communication, le détail
de ces deux installations et les résultats obtenus dans ces domaines.
Des réalisations antérieures, mettant l'accent sur la simplification,
avaient réduit le rôle de la salle de contrôle centrale, laissant à des con
trôles locaux le soin d'assurer la bonne marche des sous — ensembles.
Des réalisations en cours de construction, au contraire, centralisent
la totalité du contrôle et tendent à automatiser au maximum l'ensemble des
manœuvres simplifiant par contre-coup l'aspect de la salle de commande, par
par suppression d'un grand nombre d'indicateurs et d'enregistreurs inuti
les, ou remplacés par des télescripteurs.
Il apparaît donc que les réalisations de G 2 et G 3 sont une étape inter
médiaire entre les deux conceptions. Les résultats obtenus ne sont pas
étrangers à la décision de passer à l'étape suivante, celle de l'automatisme
intégral. En effet, la souplesse permise par la centralisation s'est rapide
ment avérée un élément essentiel dans la sécurité de l'exploitation. Toute
modification des paramètres de pilotage a des effets dans tous les domaines
et les automatismes partiels existants sont rapidement modifiés puisque tous
les organes sont géographiquement rassemblés. De plus, toute action d'un
opérateur étant connue des autres agents à l'instant même où elle a lieu,
certaines conséquences néfastes peuvent être annulées immédiatement, les
liaisons étant instantanées.
Chaque fois qu'il a été possible, et jugé raisonnable, l'automatisation
a été poussée sur des organes existants permettant ainsi de contrôler la
validité des arguments avancés. Ceci est particulièrement mis en valeur
par l'exemple déjà cité de la détection de rupture de gaine de G 3 et de la
surveillance des températures.
Ainsi, la conception des salles de commande des réacteurs G 2 /G 3 a
permis à la centralisation complète d'assurer les rôles qui lui étaient im
partis. Souplesse et sécurité de l'exploitation.
De plus, cette conception a ouvert la voie à l'automatisme intégral,
base d'une sécurité et d'un rendement accrus.
IX. INCIDENTS SUR LES IN STALLATION S CLASSIQUES
Le nombre et l'importance des problèmes nouveaux posés par la con
struction des réacteurs nucléaires a pu faire oublier trop souvent que les
installation dites classiques pouvaient à l'occasion créer des difficultés
QUATRE ANS DE FONCTIONNEMENT 467
imprévues. Les réalisations de Marcoule n'ont pas entièrement échappé
à ce défaut.
Il serait fastidieux de passer? en revue les ennuis mineurs tels que
chacun en a connu dans des conditions semblables. Ce propos se limitera
à un exemple caractéristique concernant les réfrigérants à eau. Les ré
acteurs G 2 et G 3 comportent chacun 6 réfrigérants principaux:
- 2 réfrigérants du circuit secondaire, circuit nécessaire au refroidisse
ment du caisson en béton ainsi qu'il est expliqué plus haut.
- 2 réfrigérants du cii-cuit primaire destinés au circuit principal jusqu'à
une puissance de 40 M W et dont le rôle est primordial en cas d'arrêt du
réacteur et en période de démarrage.
- 2 réfrigérants du circuit de compensation rétablissant les débits entre
les 2 circuits précédents à la suite des fuites volontaires à l'intérieur du
caisson comme il est exposé à la section III.Ces appareils sont constitués par quelques milliers de tubes véhiculant
le gaz de refroidissement, l'eau circulant autour de ces tubes. Disposant
à profusion de l'eau du Rhône il n'a pas paru utile de faire une circulation
en circuit fermé avec aéroréfrigérants. L'eau circule en circuit ouvert par
pompage et restitution directes dans le Rhône. Il a toujours semblé acquis
que ces appareils bien connus par ailleurs, ne poseraient pas de problèmes
particuliers et rien n'avait été prévu pour leur emplacement éventuel. Leur
emplacement en a découlé de telle sorte qu'ils sont en partie inaccessibles
pour de grosses réparations.
Au bout de 4 ans de fonctionnement, des fuites se sont déclarées dans
les faisceaux de tubes. Après contrôle, la situation a paru très sérieuse
car les faisceaux étaient complètement encrassés et les tubes eux-mêmes
corrodés de telle façon que des centaines d'entre eux n'avaient plus qu'une
épaisseur réduite de 80% par endroits. Le pire était à craindre en cas de
lâchage général d'un grand nombre de ces tubes.
Le remède paraissait simple: changer les tubes et conditionner l'eau.
Si la deuxième partie de ce programme ne nécessitait qu'une mise de fonds
et un délai raisonnable de quelques mois, le changement des tubes avariés
était autrement délicat. Surtout si l'on tenait à conserver les réacteurs
en marche avec une sécurité suffisante. Un planning détaillé fut établi et
finalement l'opération fut entrpprise dans des conditions assez acrobatiques
pour concilier tous les impératifs de la production. Cette réparation, simple
en elle-même, s'étage sur 1 an et demi et est actuellement en bonne voie
de réalisation.
Il est inutile d'insister sur les difficultés de l'opération pour qui con
naît la complexité des tuyauteries de nos réacteurs. Quand tout sera ter
miné, une grande partie de ces tuyauteries aura été déposée et reposée pour
permettre la réparation. Il convient ici de dire que cette complexité a eu
un côté relativement agréable, car sans les possibilités de souplesse qu'elle
offrait en contrepartie, l'opération n'aurait peut-être été possible qu'au prix
d'un arrêt complet de longue durée des réacteurs.
Les incidents sur de telles installations àont particulièrement irritants.
Le projeteur considère de telles techniques sans aléas et les inclut dans
'l'ensemble, sans y apporter une attention particulière, retenu par ailleurs
par des problèmes bien plus vastes et plus graves. Mais il est décevant,
468 F. CONTE
après 4 ans de fonctionnement, de constater que les principaux ennuis pro
viennent d'appareillages connus et utilisés par l'industrie depuis toujours,
alors que les ensembles ressortant des techniques nouvelles fonctionnent
sans à-coups à la satisfaction de tous.
Il semble bien que rien n'est entièrement classique dans nos réalisa
tions et que chaque détail doit être étudié et essayé longuement toujours
comme une nouveauté, avant de prendre place dans un ensemble qui se veut
parfait et toujours à l'avant-garde de toutes les techniques.
X. CAISSON EN BETON PRECONTRAINT
On ne traitera pas ici en détail de ce problème capital. En effet:
- l'aspect sécurité de ces ouvrages a été exposé lors d'une précédente con
férence [6] et les caissons de G 2 et G 3 ont fait l'objet d'une communi
cation spéciale:
- l'étude, la construction, l'exploitation sont traités dans une communi
cation à la présente conférence 13J .
Il convient néanmoins de rappeler ici les principaux avantages de telles
enceintes, avantages mis en lumière pour la première fois, et avec un plein
succès, par la réalisation encore unique au monde des réacteurs G 2/G 3 de
Mar coule:
- possibilité d'atteindre des volumes importants,
- pressions de service très supérieures à toute autre méthode,
- sécurité quasi absolue en raison de l'impossibilité pratique d'explosion
ou même de fuite importante,
- facilité de mise en oeuvre,
- possibilité d'essais sur maquettes représentatives,
- commodité du contrôle des déformations, contraintes, températures,
- exploitation sans aléas et, en particulier, suppression du risque de rup
ture fragile.*
XI. CONCLUSION
D'un point de vue très général, deux solutions peuvent etre envisagées
pour l'étude et la mise en œuvre d'ouvrages aussi révolutionnaires à leur
époque que les réacteurs G 2/G 3 de Marcoule. Le projet peut être poussé
dans les détails, retardant la construction, elle-même encore retardée
par des améliorations incessantes en cours àe travaux. L'espoir dans ce
cas est que la mise en route sera sans aléas, rapide et concluante. Ou bien,
et c'est la solution adoptée ici, l'avant — projet étant définitivement figé
quant à ses grandes options, commencer à traiter des sous — ensembles
sans coup férir et mettre en œuvre immédiatement. Ceci sous-entend que
des marges assez considérables ont été prises dans les techniques nou
velles ou audacieuses de façon à ne pas brider inconsidérément les amélio
rations ultérieures. La construction suit alors à quelques jours près (et
quelquefois précède) la mise au point des détails.
Cette façon de faire promet quelque souci lors de la mise en route et
l'on considère à priori que la première année de fonctionnement est hypo-

QUATRE ANS DE FONCTIONNEMENT 469
théquéedela moitié du temps. En fin de compte cette demi année est gagnée
sur la solution exposée en premier et bien souvent le gain est encore su
périeur. Par ailleurs, la formation morale et intellectuelle et l'ambiance
créée sont à mettre complètement au crédit de la deuxième solution. De
plus, les modifications apportées avant la mise en forme définitive sont
plus près de la perfection parce que raisonnées et s'appuyant sur un début
d'expérience.
Il y a donc tout lieu de se féliciter des options prises pour nos réacteurs,
tant au point de vue technique que moral. Il est évident que la réussite en
registrée ici en découle en grande partie.
Dans les circonstances présentes, la conclusion ne saurait, malgré les
précédentes considération, qu'être technique. En ce qui concerne l'ex
périence de l'exploitation des réacteurs de Marcoule depuis 4 ans:
La technique des réacteurs nucléaires est à son début, ce qui explique
les augmentations de performances assez spectaculaires acquises sur de
telles installations, ceci en raison des précautions prises à l'étude, par
honnêteté intellectuelle.
Le béton précontraint a tenu ses promesses et il parait vain de répéter
les avantages de cette solution puisque la conviction est unanime, démontrée
par les réalisations en cours.
Le chargement en marche, après une période d'adaptation et de mise
au point, présente peu de difficultés supplémentaires par rapport au charge
ment à l'arrêt et les avantages sont trop considérables par ailleurs pour
prêter à discussion.
L'automatisme complet est la voie à suivre à l'avenir et assurera sé
curité et rendement.
Les installation «classiques» sont à surveiller de près.
RÉFÉRENCES
[1] Bulletin d’informations scientifiques et techniques 20 (1958) .
[2] PLISSON, J ., « La détection de rupture de gaines* MEIFFREN, J., « Surveillance automatique des
températures» et CONTE, F., « Organisation et instruction du personnel » , voir ces Comptes rendus.
[3] CONTE, F., DAMBR1NE, C. etGAUSSOT, D . , « Les caissons en béton précontraint dans le programme
français des réacteurs de puissance » , voir ces Comptes rendus.
[4] TESTE du BAILLER, A . , «Mesures physiques sur les réacteurs de Marcoule», Communication au Sym
posium de Bournemouth, (1962).
[5] BACHER, P., SAGOT, M . , TANGUY, P. et TESTE du BAILLER, A ., « Intérêt de l'expérience neutro -
nique acquise à Marcoule et à Chinon pour le programme de centrales à graphite», ■ voircesComptesrendui
[6] BOURGEOIS, J., COSTES, D . , HENRI, C ., LAMIRAL, G. et SEGOT, C ., « Problèmes de sécurité des
réacteurs de puissance a ceranium naturel modérés au graphite et refroidis au gaz » . Reactor Safety
and Hazards Evaluation Techniques, Vol. Ill, AIEA, Vienne (1962) 151.


LA DÉTECTION DE RUPTURE DE GAINE AU RÉACTEUR G3
J. PLISSONCENTRE D’ÉTUDES NUCLÉAIRES DE MARCOULE, FRANCE
Abstract — Résumé — Аннотация — Resumen
SLUG-BURST DETECTION IN THE G3 REACTOR. The author explains the principles underlying slug-
buist detection and describes the construction of the apparatus concerned. The main features are a) fully
automatic operation, b) centralization of data in the control room and c) measurement by electrostatic col
lection on a turntable.
LA DÉTECTION DE RUPTURE DE GAINE AU RÉACTEUR G3. Dans ce mémoire, l'auteur expose les
principes sur lesquels est fondée la détection de rupture de gainés et il décrit la réalisation des installations.
Les caractéristiques principales sont a) l’automatisme intégral, b) la centralisation des informations dans la
salle de commande et c) mesure par collection électrostatique sur plaque tournante.
ОБНАРУЖЕНИЕ РАЗРЫВА ОБОЛОЧКИ В РЕАКТОРЕ 03 . Излагаются принципы, на которых основано об
наружение разрыва оболочки, описывается конструирование установок. Основные характеристики та
ковы: а) интегральный автоматизм, б) централизация информации в командном зале и в) измерение
путем электростатического собирания на поворачивающейся пластинке.
DETECCIÓN DE FALLAS DEL REVESTIMIENTO EN EL REACTOR G3. El autor expone los principios en
que se basa la detección de las fallas en los revestimientos de los elementos combustibles y describe las carac
terísticas principales de la instalación, que son: a) automatización integral, b) centralización de las informa
ciones en la sala de mandos, y c) medición por recolección electrostática sobre una placa giratoria.
I. INTRODUCTION
Le but de la détection de rupture de gaine (DRG) est de vérifier, en
permanence, l'intégrité de la gaine des éléments combustibles du réacteur.
Une rupture d'étanchéité de cette gaine entraînerait, d'une part la pollution
du fluide de refroidissement par les produits gazeux libérés au cours de
la fission de l'uranium et, d'autre part, risquerait de créer un «point
chaud» sur la cartouche par formation d'oxyde au contact uranium-gaz car
bonique. Là condition, pour que ces risques de pollution et d'élévation de
température soient réduits au minimum et restent en tout état de cause dans
des normes admissibles, est évidemment d'éliminer l'élément combustible
incriminé, le plus rapidement possible. Cela est rendu possible par le
chargement en marche et grâce à l'installation de détection de rupture de
gaines.
Cet examen du rôle de la DRG permet de définir les deux critères es
sentiels auxquels devra répondre cette installation:
a) Sensibilité très poussée afin de déceler une fuite de gaine dès son début.
b) Rapidité de localisation de 1 'élément défectueux ou, tout au moins, du canal
contenant cet élément.
Nous allons voir comment 1' installation réalisée à G3 répond à ces prin
cipes, par la mise en application de solutions originales dont 1' efficacité
471

472 J. PLISSON
a été continuellement améliorée au cours de ces quatre années d1 exploi
tation.
II. PRINCIPE DE LA DÉ TECTION
La détection d'une rupture de gaine se fait par la mesure de l'activité
du gaz de refroidissement.
Les gaz de fission émis au cours d'une rupture de gaine, sont entre
autres, du xénon (Xe) et du krypton (Kr) ayant une période de décroissance
de 16 et 2,4 s. Ces gaz prélevés avec le CO2 de refroidissement sont', après
filtrage, envoyés dans une capacité appelée «volume de reconstitution» où,
par émission j3 et y, ils se transforment en atomes de césium et de rubi
dium, ionisés positivement, que l'on précipite sur une électrode à l'aide
d'un champ électrostatique. Ces ions solides de césium et de rubidium
sont eux-mêmes radioactifs - émission /3 - et permettent par l'intermé
diaire d'un scintillateur et d'un photomultiplicateur, d'obtenir un signal
électrique proportionnel à 1' activité du gaz (fig. 1).
Figure 1
Schéma illustrant le principe de la détection de rupture de gaine.
De façon à mettre en évidence l'évolution du signal en ionction du temps,
un dispositif appelé «évolumètre» permet de donner la différence entre la
valeur du signal au moment de la mesure et une valeur antérieure, prise
pour origine. Cette valeur origine est très simplement mise en mémoire,
au moment voulu, par injection d'une tension sur des potentiomètres de
tarage.
Le signal recueilli est, par définition, proportionnel au nombre de
fission de l'uranium et, donc, au flux de neutrons, c'est-à-dire à la puis
sance de la pile. Il est donc nécessaire de corriger la valeur du signal au
cours d'une évolution de puissance de la pile, par exemple, pendant la pé
riode de démarrage. Ceci peut se faire manuellement, par recalage volon
RUPTURE DE GAINE 473
taire, ou automatiquement de façon continue par l'intermédiaire d'un «pi
lote» délivrant une tension proportionnelle à la puissance.
Ce pilote est constitué par un détecteur mesurant 1' activité de 1' azote 16
contenue dans le C02 de refroidissement.
III. DESCRIPTION DE L'INSTALLATION
L'installation de détection de rupture de gaine de G3 se compose essen
tiellement de trois parties:
a) Circuits pneumatiques comportant tous les circuits de prélèvement de
gaz.
b) Installation électromécanique regroupant tout le relayage nécessaire au
fonctionnement automatique de l'installation.
c) Chaîne électronique avec la chaîne de mesure et de traitement analogique des informations.
1. Circuits pneumatiques
Les 1200 canaux sont répartis à égalité entre 12 groupes de détection
identiques, indépendants les uns des autres, sauf en ce qui concerne les
séquences à réaliser qui sont asservies à un cadenceur général.
Les canaux d'un même groupe sont groupés par 5 pour former 20 fais
ceaux par groupe. Au total la répartition est la suivante: 12 groupes de
20 faisceaux de 5 canaux (fig. 2).
Chaque groupe de détection comprend 2 étages de mesures:
En marche normale, l'étage «prospecteur» seul en service, permet
d'analyser successivement les 20 faisceaux du groupe à la cadence d'un
faisceau par minute. Le temps total de balayage est donc de 20 min.
En cas de besoin particulier: signal en évolution, déchargement de
canal, etc. on peut au moyen d'un jeu d'électrovannes passer sur l'étage
«suiveur» qui permet, soit d'explorer successivement les 5 canaux d'un
faisceau donné (1' intervalle entre deux mesures sur un même canal est alors
réduit à 5 min), soit d'analyser de façon continue un canal donné (une m e
sure par minute).
Deux compresseurs centrifuges - l'un en service, l'autre en réserve -
placés en fin de circuit, renvoient les prélèvements de CO2 dans la pile
(fig. 3).
2. Installation électromécanique
La sélection des canaux est purement électromécanique et se fait au
moyen d'électrovannes à 2 ou 3 voies commandées par des relais et con-
tacteurs classiques.
L'appareillage comprend des organes généraux communs aux 1200 ca
naux et des organes particuliers identiques pour tous les groupes.
O rganes généraux
- Alimentation haute tension des détecteurs et armoire générale d'alimen
tation.
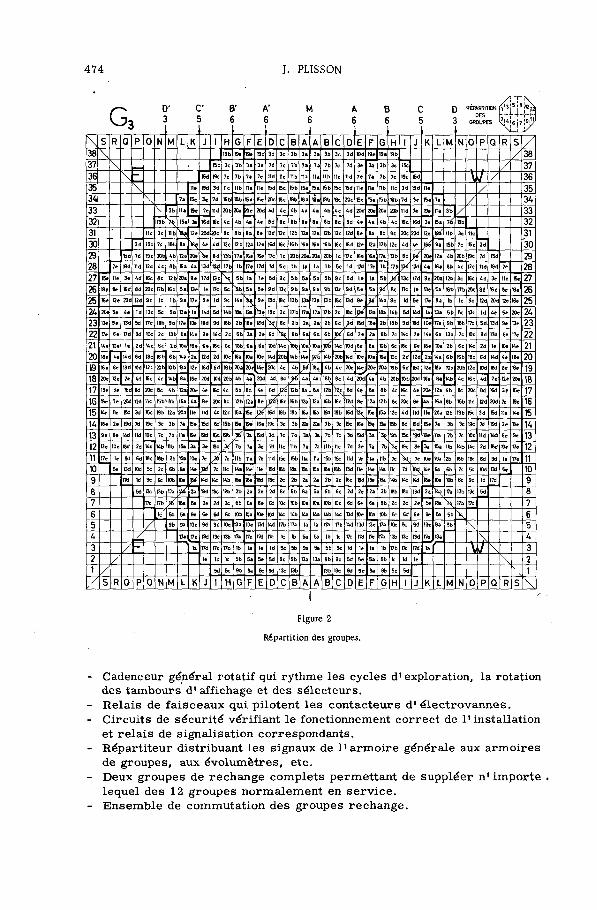
474 J. PLISSON
С-
— 3 X i 1 ! /
\ S R Q P 0 N M L K J 1 H G F E D C B A A B c 0 E F G H ! J K L M N 0 p Q R S /
3 8 \ 19 b 19» 19e 19d 3d 3c 3b За За 3b 3c 3d 19 d 8e 19a 8b/ 3 8
3 7 \ r iSc 3c 3b 3a 3e ?d 7c 7b 7a 7a 7b 7c 7d 3e 3a 3b 3c 15c/ 3 7
3 6 \ " !5d 19c 7c 7b 7a 7e lld Пс 11 b tu 11a 11b 11c ltd 7e 7a 7b 7c 19c !5d\ y / 3 6
3 5 \ lie t9d 3d 11c 11b 11a lie 15d 15c 15b 15a Ба 15b 15c 6d 11e 11a ПЬ tic 3d 19 d 11e/ 3 5
ЗА \7a T5e 3* 7d «b tSb «a fee Як. 19c Sb 8a 8a 8b 8c 20c Se Ба БЬ «t> 7d 3e Be 7a
/ ЗА
3 3 \ 3b 11» Be 7e 11 d 20b 20a !0e 20d 4d 4c 4b 4a 4a 4b 4c 4d 20d 20e 20a 20b lld 7e 8e lia 3b / 3 3
3 2 19b >15a За 16d Ce 4c 4b 4a 4e bd 8c 8b 8a 8a 8b 8c 6d 4e 4a 4b 4c 16e 16d 3a 6a t4> 8b 3 2
31 11c 3c 11bV
12* 20d 20c 8c 8b 6a 8e 12d 12c 12b 12a 12a t2b 12c 12d 8e 8a 6b 8c 20e 20d I2e * 11b 3c 11c 31
3 0 3d 15c 7c 15b 8a 4e 4d 12c 12b 12a 12e 16d 16c 16 b t6a 16a t6b 16c 16 d 12e 12a 12b 12c 4d 4e * 8a 15b 7e 6c 3d 3 0
2 9 Bd 7d 13c 20b 4b 12a 20e V 6d 13b 17a 16* 16e 17c 1c 20b 20a 20a 20b 1c 17c 16e 16a 17a Qb 6d ** 20e 12a 4b 20b 8c 7d 15d 29
2 8 7e Bd 11 d 12c 4c 8b 16a 4a 13d 17b 1b 17e 17d 1d 5c 1b 1a la 1b 5c 1d 17U 17e 1b 17b Jïrf 13d 4a 16a 8b 4c 12c lld 19d 7e 2 8
2 7 15e 11e 3e 4d Kc 8c 12 b 20a 9e 17d 13cV
Sb la le 5d 9c 5b 5a 5a 5b 9c 5d le la 5b X 13c 17d 9e 20a 12b 8c 16c 4d 3e Ite 15e 27
26 19* «e 16d 6d 20c 17b 16 b 5a 13e le 17c Se > 5a 5e 9d 13c 9b 9a 9a 9b (3c 9d 5* 5a K 5c Пс le Be Sa Bb 17b 20c 8d 16 d 8e 8e 2 6
2 5 16e 12e 20d t2d 9c 1c 1b 9a 17e 5e 1d 9c 14a\
9e Od De 13b 13a t3a 13b 18c 13d 9eУ Ka 9e Id 5e 17e 9a 1b 1c 9c 12d 20c 12e t6e 2 5
2A 20e 5e ¿e 1d 13c 5c 5b 13 a la 14d 5d 14b » . 13. 16c 2c 17b 17a 17a 17b 2c Sc*
13a 18a 14b 5d Kd ta 13a 5b 5c 13c 1d 4e 5e 20e 2A
2 3 13* 9e 13d 5d T7c 18b 9b 17a 10e 18d 9d 18b 2b 16e 18 d > 6e 2b 2a 2a 2b 6c > t6d 18* 2b 16 b 9d Bd 10e 17a 9b 18b TTC Sd 13d 9e 13e 2 3
2 2 17e 6e I7d 9d Юс 2c 13 b 6a 14e 2e 14 c 2c 6b U 2e 6d 4 6b 6a 6a 6b * 6d 2e 2a 6b 2c 14c 2e 14e 6a 13b 2c Юс 9d 17d 6e t7e 2 2
21 14e Ю* te 2d Ke €c 2b Wa 18 e 6e «c 6c 10b 6a 6e 10d 14c 4 Юа Юа 14c lOd 6e 6a ЮЬ 6c I8c 6e 18e 10a 2b 6c Kc 2d 1e Юе Ke 21
2 0 16e 4e 14 d 6d 18c Bb 6b Ka 2a 12 d
Bd
2d
6d
Юс
16b
16a
20a
Юа
20<
Юе
14e
14 d 20b Ub 14a Jfiá 14b 20b 14d Юе Юа 16a Юс 2d 12d 2a Ka 6b 16b 16c 6d Kd 4e 18e 2 0
19 16e 6e 18d (Od 12 c 20b ЮЬ Sa 12e 20c 4c 4b 'M tea 4b 4c 20c Ke 20e 20a 16b 6d T6d 12e 8a ЮЬ 20b 12c I0d №d 8* Be 19
18 20e 12e 2e 4d Bc 4e 14b 8a 16e 20d I0d 20b 4b 4a 20d 4d 6c 4a 4a '8b 6c 4d 20d 4a 4b 20b (0d 20d 16e 8a t4b 4c 16c 4d 2e 12e го 18
17 15e 3e ffid 8d 20c 6c 4b 12a 20» 4e Bc 4c 6b 8a 4e 8d*
12 b 8a 8a 12b \c 8d 4e 8a 8b 4c 16c 4e 20e 12a 4b 8c 20c 6d 16d 3e Be 17
16 «e 7* 20d «d Пс 15b 8b 16a 4a 8e 20c 8c 12b 12a 6e ■¡A 16c 16b 12a 12a 16b 16c ted 8e 12a 12 b 6c 20c 6e 4a 16a 6b 15b 11c 12d 20d 7e 8e 16
15 Ke 1te 6d 3d 15c 19b 12b 20a 11e 11d 4d 12 c 15a 15e p é 16d 8b 19a 16a 16a 19a 19b 16d4
Se 15a 12c 4d 11d 11e 20a 12b 19b 15c 3d Bd lie 14e 15
1A 16e 2e fâd K 19c 3C 3b 7a F5e 15d ftd 15b Sa P*' 16e 19c 3c 3b 20b 2fe 3b 3c 8c 16e teç Sa 15b 8d 6d Se 7a 3b 3c »c 7d 19d 2e Be 1A
13 9e 6e Kd 1W 10c 7c 7b Ita 19e Bd Бс 8b X Эа 8d 3d 7c 7b 3a 3a tb 7c 3d 8d 3a>
8b Bc Bd 8e 11a 7b 7c Юс lld Kd 6e 9e 13
12 13e 10e 18d 2d Kc 14b 11b 15a За 3e 5c X 7b 7a 3e 7d 11c 11b 7a 7a 11b 11c 7d 3* 7a 7bX
19c 3e 3a 15a 11b Kb 14c 2d 18d Ю* 13e 12
11 17e 1e 9d 6d 18c 16b 2b 19a 10e fcM 7c 11 b lia e lld 15c 15b 1b 11a 15b 15c lld Te 11a 11b 7c V 7e Юе 19a 2b 18b 10e 6d 9d le 17e 11
10 5e 13d KM 5c 2c 6b 6a 14e * 7d 11c 14a 14e Ile Bd 18b 13a 6a Sa Ba 18b Bd n* 14e Ka tk 7d ted Ke 6a 6b 2c 5c lOd Ш 5* 10
9 Ш Id 9c 6c ЮЬ tat P 14d 14c 14b Ba t6e «d 18c 2c 2b 2a 2a 2b 2c 18c Bd t8e 6a 14b Kc Kd '18e Юа ЮЬ 6c 9c 1d 17d 9
8 5d 13c 13b Па 2a «d iac 18b 2b 2a 2e 2d 6e 6b 6a 6a 6b 6c 2d 2* 2a 2b «b 18c 16d 2a 4 T7a 13b 13c 5d 8
7 17e 17b У 18a 5e 2e 2d 2c 6b 6a 6e 6d Юс ЮЬ Юа Юа ЮЬ Юс 6d 6e 6a 6b 2c 2d 2e 5e 18a 4 17b !7c 7
6 W 5b 5a 9e 6e 6d 6c ЮЬ Юа Юе КЙ 14C 14b 14a 14a Ub Kc Dd Юе Юа ЮЬ 6c 6d 6e 9e 5a 5b 4 6
5 /9b 9a 13e 9d 9e Юс t3a 13e I3d 14d 17b 17a la ta T7a 17b Kd 13d t3e 13a Юс 9c 9d 13e 9a 9b \ 5
A / 13a 17e 13d 13e 13b 1% 17e 1W I7t k tb 5a 5э 1b 1c Tk 17d 1% Пa 13b 13c 13d 17e 13a>
A
3 /- la 17d 17e 17b 1b la le 1d 5c 5b 9a 9a 5b 5c Id 1e la 1b 17b T7c 17d la 1 VJ \ 3
2 / te 1d le 5b 5a 5e 5d 9c 9b 13a 13a 9b 9c 5d 5e 5a 6b 1c 1d 1* \ 2
1 / 5d 5c 9b 9a 9e 9d 13e 13b 13 b 13e 9d 9e 9a 9b 5c 5d \ 1
/ S R Q P 0 N M L K J H G F E D C B A A B C D E F G H J K L M N 0 p Q R S \
Figure 2
Répartition des groupes.
- Cadenceur général rotatif qui rythme les cycles d'exploration, la rotation
des tambours d1 affichage et des sélecteurs.
- Relais de faisceaux qui pilotent les contacteurs d1 électrovannes.
- Circuits de sécurité vérifiant le fonctionnement correct de l'installation
et relais de signalisation correspondants.
- Répartiteur distribuant les signaux de l'armoire générale aux armoires
de groupes, aux évolumètres, etc.
- Deux groupes de rechange complets permettant de suppléer n' importe
lequel des 12 groupes normalement en service.
- Ensemble de commutation des groupes rechange.

FAIS
CEA
U1
(5C
AN
AU
X)
FAIS
CEAU
2
(5CA
HAU
X)
FAIS
CEAU
3
(SC
AN
AU
X)
RUPTURE DE GAINE 475
Schém
a
des
cir
cuit
s pneum
atiq
ues.

476 J. PLISSON
O rganes particuliers
Ces organes relatifs à chaque groupe comportent essentiellement:
- Les relais et contacteurs de commande des électrovannes (les relais mé
moires correspondant aux préalerte et alerte).
- Les circuits de sécurité et la signalisation correspondants.
- Les tableaux d'affichage et de signalisation.
3. Chaîne électronique
Elle comprend, par groupe et par étage, prospecteur ou suiveur:
- Un ensemble scintillateur - photomultiplicateur - préampli.
- Un ensemble ampli-discriminateur-octade-intégrateur.
- Un élément annexe constitué par les évolumètres.
- Un voltmètre à lampe et un enregistreur de type miniature.
IV. F O N C T IO N N E M E N T PR ATIQ U E
1. Détection
Qu'il s'agisse de la chaîne prospecteur ou de la chaîne suiveur.la me
sure se fait en trois temps (fig. 4 et 5):
COUPE A-A*
é erronne np
CO.
-HT
ELECTRODE DE REPULSION
-TAMBOUR DE COILECTION
Figure 4
Schéma de principe du détecteur.

RUPTURE DE GAINE 477
1 Figure 5
Photo du détecteur.
Prem ier temps
Le scintillateur mesure la pollution résiduelle AN du tambour en un
point. La durée de la mesure est de 7 s. L' électronique enregistre un signal
qui est la somme de la pollution du tambour, de l1 activité des gaz restant
sous le scintillateur, et du bruit de fond du scintillateur. Ces deux dernieres
valeurs sont sensiblement constantes.
Deuxième temps
La collection des ions positifs se produit au cours de ce temps. Le tam
bour tourne de 18° (1 /20© de tour) et la plage considérée ci-dessus reste
environ 35 s dans la chambre de précipitation. L 1 électrode de collection
est portée à + 5000 V. Le champ électrique ainsi créé repousse sur le tam
bour les ions de rubidium et de césium.
478 J . PLISSON
Troisième temps
Le scintillateur mesure la nouvelle collection N + AN du tambour. La
plage considérée du tambour revient se placer sous le scintillateur.
Pendant 7 s environ 1' électronique mesure, en plus du signal mesuré
au 1er temps,l1 activité des produits de fission collectés sur le tambour pen
dant le 2e temps. Un montage électronique fait la différence des mesures
du 3e et du 1er temps, soit (N + AN) - AN. Cette différence N constitue le
signal utile correspondant à l1 activité du C02 du faisceau ou du canal obser
vé. Le tambour comportant 20 plages de mesures chaque plage repasse
en mesure toutes les 20 min. Grâce à la vie courte des éléments considérés
la pollution résiduelle du tambour a fortement décru pendant ce laps de temps.
/2. Etage prospecteur
t
A . M a r c h e norm ale
Seuls les étages «prospecteurs» des 12 groupes sont en service continu,
en régime normal.
En cas de défaillance de l'un d'entre eux les étages «prospecteurs»
des groupes de rechange XIII ou XIV doivent être mis en service de façon
à ne pas interrompre la surveillance DRG.
Rappelons que la limite admise pour une interruption totale ou par
tielle de cette surveillance est de 30 min.
B . P a s s a g e s u r évo lum è tre
Nous avons vu que le dispositif de lecture des signaux peut, soit fournir
ceux-ci en valeur absolue, soit en indiquer 1' évolution par rapport à un sig
nal de référence mis en mémoire au moyen du dispositif «évolumètre»(fig. 6).
Cette opération de mise en mémoire s'appelle le tarage. Elle se fait
à volonté sur un groupe quelconque et dure 20 min.
/3. Etage suiveur
A . P a s s a g e volontaire \
Au moyen d'un clavier d'appel groupe faisceau et d'une touche «Passage
sur suiveur» 1' opérateur peut, à partir de la salle de commande, appeler
en surveillance sur l'étage «suiveur» un faisceau quelconque de 5 canaux.
La carte de prospection des canaux DRG permet de trouver rapidement
l'adresse d'un canal quelconque.
B . P a s s a g e autom atique
Il se produit en cas de «dépassement» au niveau de l'étage «pros
pecteur». Il ÿ a* dépassement lorsque le signal (ou son écart par rapport au
signal de référence si l'évolumètre est en service) atteint un seuil d'alerte

RUPTURE DE GAINE 479
1
A
Figure 6
( Type d'énregistrement avec évolumètre.
préalablement fixé. Cela correspond à un accroissement de l'activité du
faisceau qui vient d'etre observé.
Ce faisceau est repris automatiquement par l'étage «suiveur» . La
signalation « faisceau en observation » apparaît.
Si l'étage « suiveur » est déjà utilisé pour l'observation d'un autre fais
ceau la signalisation « faisceau actif non suivi» s'affiche.
C. Faisceau en suiveur cyclé
Grâce aux électrovannes canal à 3 voies les 5 canaux constituant le
faisceau repris par l'étage suiveur sont analysés successivement, le cycle
d'observation d'un canal étant de 60 s comme celui d'un faisceau.
Cette analyse séparée des 5 canaux d'un faisceau permet de déterminer
le canal dont le signal a évolué, provoquant le dépassement initial.

480 J. PLISSON
D . C a n a l en s u iv e u r continu
Ce canal en évolution étant repéré, il est intéressant de le suivre d'une
façon continue. A cet effet une touche « canal sur suiveur » permet de
bloquer en position excitée l'électrovanne à 3 voies du canal en cours d'ana
lyse.
L'analyse cyclée des 4 autres canaux est abandonnée et le faisceau cor
respondant, privé du canal conservé en observation continue, est remis en
prospection normale. On peut suivre de la même façon un canal en cours
de déchargement normal, ou en cours de réglage de boisseau.
Une touche « remise en identification » permet de reprendre l'obser
vation du faisceau dont on avait extrait un canal. Enfin une touche « suiveur
disponible » permet de remettre en prospection normale le canal ou le fais
ceau en observation.
E . Suiveur en dépassement
Le faisceau dont le signal dépasse le seuil d'alerte fixé pour l’étage
«prospecteur» est repris automatiquement par l'étage «suiveur».
En marche normale les gammes en service sur les étages prospecteur
et suiveur sont les mêmes (à titre indicatif gamme 250 chocs/s, pile à puis
sance normale).
Tandis que la gamme «prospecteur» ne peut être modifiée que sur in
tervention manuelle à partir de la salle de commande la gamme «suiveur»
monte automatiquement si le signal du canal suivi atteint le seuil d'alerte
de l'enregistreur « suiveur» . En même temps apparaît la signalisation
« rupture de gaine» .
V. E X PÉ R IEN C E D 'E X P LO IT A TIO N DE LA DRG
1. Essais préalables
La mise en service effectif de la DRG a été précédée d'un certain nom
bre d'essais et de vérifications. En particulier le détecteur a été mis au
point sur une installation pilote mise en place sur le réacteur G2 [1, 2, 3, 4] .
Le prototype du détecteur, essayé au préalable sur EL2 à Saclay, a été
monté en dérivation sur un circuit de rechange de la DRG de G2. Le cir
cuit pneumatique et l'ensemble de détection reproduisaient, à peu de choses
près, les conditions d'utilisation de l'installation définitive. Ces essais ont
permis, d'une part:
a) de déterminer la valeur de la tension donnant les résultats optimum de
collection des ions,b) de déterminer la pollution rémanente du tambour,
c) d'étudier la décroissance des produits collectés et d'établir ainsi de
façon précise la répartition des temps du cycle élémentaire de mesure.
d) de connaître approximativement la valeur des signaux en fonction de la
position de la rupture de gaine dans le canal.
D'autre part, des défauts minimes ont été mis en évidence et ont pu
être éliminés grâce à des modifications de détails sur les appareils définitifs
devant équiper la DRG de G3.

RUPTURE DE GAINE 4SI
2. Modifications avant mise en service
En plus des modifications mineures et des mises au point de l'ap
pareillage électronique, d'importants aménagements des circuits pneuma
tiques ont été réalisés avant la mise en service de l'installation. Ces mo
difications dont la nécessité est apparue au cours du fonctionnement de la
pile G2 ont eu pour role essentiel de réduire l'échauffement du béton de la
face Nord de la pile, traversée par les 1200 tubes de prélèvement. Plu
sieurs dispositifs ont été retenus et réalisés:
a) Adjonction aux boisseaux, à la surface desquels est ménagée la rainure
servant à canaliser le CO2 prélevé dans le canal, d'anneaux flottants,
permettant d'augmenter la surface de contact entre le gaz prélevé et le
boisseau, au niveau de la zone secondaire.
b) Pose d'un clapet anti-retour sur chaque tube de prélèvement. Ce clapet
permet la supression d'une circulation continue de CO2 entre les tubes
de prélèvement des différentes zones, circulation provoquée par les
différences de pression existant entre différents canaux.
c) Diminution du débit de prélèvement par canal, 12 g/s en moyenne au
lieu de 30 g/s.
d) Réinjection de C 0 2 froid lorsqu'un canal est en suiveur permanent, à
contre courant dans le tube de prélèvement. Dans ce cas, le prélève
ment de mesure donne 1 min et la réinjection 1 min également.
3. Mise en service
La mise en service, au démarrage du réacteur G3 a permis dans 1' en
semble de confirmer les résultats préalables obtenus sur l'installation pi
lote provisoire à G2. Après un mois de fonctionnement, le réacteur étant
à sa puissance nominale, les constatations suivantes pouvaient être faites:
a) Sensibilité: La valeur des signaux donnés par les différents groupes
est parfaitement cohérente et du même ordre de grandeur pour tous les
canaux. La sensibilité du prospecteur - pour la puissance nominale -
est d'environ 2 chocs/s par m m 2 d'uranium nu (utilisation de cartouches
témoins avec jauge DRG). Cette sensibilité est évidemment variable avec
la puissance:
Qdébit COj
Modifications apportées pendant la période de mise au point:
b) Modification des cadences de détection,
c) Pilotage des évolumètres par le détecteur d'azote 16.
Ce détecteur donnant un signal proportionnel à la puissance du réacteur
injecte une tension proportionnelle au comptage sur les potentiomètres mé
moire des évolumètres.
4. Exploitation normale actuelle
L ' exploitation normale de la DRG est assurée par un seul agent tech
nique dont le poste normal de travail est en salle de commande. C'est là,
en effet, que sont regroupées:
31

482 J. PLISSON
5
o
Ë£
g<5* CA
RTOU
CHE
FUYA
RDE
1
&i U K _3 , Л
a K* ^ 1/1 3 <->
U) O
5 g
3 '<5 S
i4
w
'SG
NA
L N
OR
MA
L"
i 29
À 60
C
HO
CS/
c A n a Ж
1 IIPEENREG6TREME
D'UNE RUPTURI DE GAINE 1 j g
<iT ГУ
■|||
5
(EVOLÜMETRE .SERVICE) i I i
1 j ! 1 I I 1
HORS
i i iM 1 I I 1 I I N
Figure 7
Enregistrement type d'une rupture de gaine.
a) Les informations: les signaux correspondant à chaque faisceau (pros
pecteur) ou â chaque canal (suiveur), sont reportés sur des enregistreurs
miniatures.
b) Les signalisations de défaut de l1 installation ou de préalerte et d'alerte
dus à une augmentation importante d'un signal quelconque.
c) Les commandes de commutation des groupes normaux sur les groupes
de secours.
d) Les commandes permettant la sélection en manuel d'un faisceau ou d'un
canal.
e) La commande des changements de gamme de mesure.
D'ailleurs, l'automatisme très poussé de l'installation réduit con
sidérablement l1 action de 1' agent de quart qui n' assure pratiquement plus
qu'un rôle de surveillance.
A titre d'exemple du fonctionnement de la DRG nous donnons (fig. 7),
un enregistrement type de rupture de gaine permettant de voir 1' évolution
du signal et son atténuation brutale après déchargement de la cartouche fuy
arde.
RUPTURE DE GAINE
5. Modifications réalisées en cours d'exploitation
Elles sont essentiellement de deux sortes: a) amélioration de l'exploi
tation par un automatisme plus poussé, b) modifications techniques pour
une meilleure sensibilité.
Am élioration de l'exploitation
a) Changement automatique de gamme sur les suiveurs.
b) Report du changement de gamme en salle de commande pour les pros
pecteurs.
c) Mise en place d'une gamme de mesure allant jusqu'à 32 000 chocs/s sur les groupes normaux.
d) Mise en place d'une gamme de mesure allant jusqu'à 64 000 chocs/s sur
les suiveurs de secours.e) Montage d'un clavier d'appel de faisceau du suiveur, directement à par
tir de la salle de commande.
Modifications techniques
a) Réduction de 1' épaisseur du scintillateur pour diminuer le bruit de fond.
En passant de 15 mm à 5 mm le bruit de fond diminuera de moitié. Des
essais sont actuellement en cours sur les scintillateurs qui, après deux
à trois mois de fonctionnement, présentent un clivage. Ces essais de
vraient permettre de déterminer 1' épaisseur optimum, vraisemblable
ment encore plus faible que l'épaisseur actuelle, compatible avec la
tenue du scintillateur et d'obtenir une mesure non altérée.
b) Modification du cycle de mesure: la stabilité du signal a été augmentée
en réalisant la mesure du bruit de fond sur le même secteur de tambour
que la mesure du canal ou du faisceau.
c) Montage de contacts rotatifs en lieu et place de microrupteurs.
d) Adaptation des photomultiplicateurs P M 150 A V P au préamplificateur
initialement prévu pour des 51 AVP.
e) Modifications du montage des électrovannes (fig. 8): celles-ci étaient
. à 1' origine toutes soudées sur les tuyaux, dans le souci de garantir la
meilleure étanchéité. En cours d'utilisation, le fonctionnement de ces
électrovannes s'est trouvé altéré par la présence de vapeur d'huile dans
le C 0 2 prélevé et la nécessité de leur nettoyage est apparue. Pour le
réaliser, toutes les électrovannes ont été rendues démontables, réacteur
en pression, par une fixation à bride à joint.
VI. RÉSULTATS OBTENUS
Les quatre années d'exploitation de la DRG constituent un test parti
culièrement probant de la qualité de cette installation. Elle a permis de
déceler dans d'excellentes conditions de sécurité, les 12 ruptures de gaines
qui se sont manifestées depuis le démarrage du réacteur.
Quatre ruptures de gaines ont été particulièrement rapides et violentes."
Les taux de comptage maximum enregistrés ont été, dans ces cas, de 1000,

484 J. PLISSON
Figure 8
Baie d'ëlectrovannes. Au premier plan, châssis supportant les détecteurs,
les débitmètres et les indicateurs de pression.
Figure 9
Cartouche avec rupture de gaine. Le gonflement de la gaine est dû à la présence d’oxyde d'uranium.
1540, 5550 et 10 000 chocs/s, pour des évolutions allant de quelques se
condes à 10 min. Dans chaque cas, la détection et l'identification du canal
ont été suffisamment rapides, pour qu1 après déchargement, aucune pollution
RUPTURE DE GAINE 485
résiduelle du réacteur ne soit constatée. La figure 9 représente la cartouche
ayant donné un comptage de 5550 chocs/s.Les huit autres ruptures de gaines enregistrées ont eu des évolutions
beaucoup plus lentes - de 1 h à 4 j - et les signaux obtenus sont toujours
restés inférieurs à 750 chocs/s.
VII. E N TR ETIEN
Circuits pneum atiques
L'ensemble des circuits pneumatiques nécessite une fréquence d'entre
tien extrêmement réduite. Les électrovannes sont, en moyenne, démontées
et nettoyées une fois tous les deux ans.
Les cartouches filtrantes placées sur le circuit C 02, n'ont jamais ac
cusé d'augmentation d'activité mesurable et n'ont été remplacées qu'une
fois depuis la mise en service de l'installation.
Les groupes hélico-compresseurs sont soumis à des révisions méca
niques au cours des arrêts normaux d'entretien du réacteur.
A titre de «maintenance» un ensemble complet de rotors avec ses gar
nitures, est disponible.
Installation électrom écanique
L' entretien systématique des armoires de relayage est réalisé semes
triellement et n' appelle aucune observation particulière.
Chaîne électronique
L ' installation électronique, présentée sous forme d'éléments débro-
chabies - tiroirs amplificateurs, alimentation, etc. - permet un entretien
systématique préventif particulièrement simple et efficace.
Les ensembles scintillateurs-photomultiplicateurs ont donné un certain
nombre de difficultés, qui ont pu être levées, en partie, par la réduction
d'épaisseur des scintillateur s.
A ce jour, la statistique des pannes relevées sur 1' installation de DRG
donne environ:
- 80% d'incidents d'une durée inférieure à 5 min,
- 20% d'incidents d'une durée comprise entre 5 et 15 min.
Ces incidents n'entraînent, en général, qu'une indisponibilité partielle
de la DRG (un groupe intéressé sur 12).
Depuis la mise en service de 1' installation un seul cas de panne, su
périeure à 30 min, a nécessité l'arrêt volontaire du réacteur, conformément
aux consignes de sécurité en vigueur.
VIII. CONCLUSION
Réalisée à l'état de prototype en 1958, la DRG de G3 a démontré, depuis,
que les principes fondamentaux qui avaient guidé ses réalisateurs, sont par-

486 J. PLISSON
a Q
' а «даям t*
□ D O P D u *-> u __o a o o c u c p EZ3
« • • * * -„ü,—E D E D EZ3 C D CD C D C D
0 0 0 0 0 0 0 Id! PIPTmL/ T T f T - U w % Z .J \*vxiJ шъ— J a ш ш т л шDDOOBDD ê-o--8-êrê-
i.
o a ‘ **** **»* *•* H«
; *<N1 **¡3
Q*•**
•«9
a ***ê • »» **0
o
•Я»»o
0 0 0 D cf o* o* ~ « ¡ i ta * « y » « i . . . .• *e ш.1 *** • • • m
**8 *#e **и «»9 , . e
P■o e*.
O BaQ 0 o*«u it n aaoe
C (*-Uî ( ■ f i
Figure 10
Vue d'ensemble de la DRG en salle de commande.
faitement adaptés aux besoins de sécurité et de rapidité des réacteurs mo
dernes.
Ses caractéristiques principales: a) automatisme intégral, b) cen
tralisation des informations en salle de commande (fig. 10) et c) principe de mesure par collection électrostatique sur électrode tournante, restent
encore à la base des réalisations en cours pour les prochains réacteurs
et seul le traitement analogique des informations qu1 elle réalise pourrait -
être abandonné au bénéfice de la technique plus récente et aux possibilités
beaucoup plus grandes du traitement des informations par des ensembles
digitaux.
R É F É R E N C E S
[1] PLISSON, J ., Rapport CEA, DI-CP.R 184 JM/JA (non publié).
[2] MEGY, J. et ROGUIN, A . , « La détection des ruptures de gaines dans les réacteurs de puissance français^
Communication au Symposium de Londres sur la Détection des ruptures de gaines (1961).
[3] MEGY, J. et PUPPONI, J. «Mesures et automatismes dans les systèmes de détection de ruptures de gaiaes>>
Congrès de la Soc. Fr. des électriciens (1961).
[4] ROGUIN, A ., «Détection des ruptures de gaines>> Chap. XXIV, GÉNIE ATOMIQUE, P. U. F ., Paris(1960).

SU RV EILLAN CE AUTOMATIQUE DES TEM PÉR A TU R ES AUX RÉACTEU RS G2 E T G3
J . MEIFFREN CENTRE D 'ÉTU D ES NUCLÉAIRES DE MARCOULE,
FRANCE
Abstract — Résumé — Аннотация — Resumen
AUTOMATIC TEMPERATURE CONTROL IN THE G2 AND G3 REACTORS. The G2 and G3 reactors are
equipped with electronic computers which process the data received from 1200 thermocouples at the channel
exits. The author describes the various parts of the thermometric and data-processing systems.
SURVEILLANCE AUTOMATIQUE DE TEMPÉRATURES AUX RÉACTEURS G2 ET G3. Les réacteurs G2/G3
sont équipés de machines à calculer électroniques traitant les informations reçues de 1200 thermocouples
disposés à la sortie des canaux. L'auteur décrit les différentes parties de l*appareillage de prise de température
et de traitement des données.
АВТОМАТИЧЕСКОЕ НАБЛЮДЕНИЕ ЗА ТЕМПЕРАТУРОЙ РЕАКТОРОВ 02 И G 3 . Реакторы G2/G3 оборудованы
электронными счетными машинами для обработки информации, получаемой с 1200 термопар, расположен
ных на выходе каналов. Дается описание различных частей аппаратуры по определению температуры
и обработке данных.
VIGILANCIA AUTOMÁTICA DE LAS TEMPERATURAS EN LOS REACTORES G2 Y G3. Los reactores G2 y
G3 están equipados con calculadoras electrónicas que elaboran las informaciones recibidas de 1200 termopares
dispuestos a la salida de los canales. El autor describe las diferentes partes del sistema de registro de tempe
ratura y de elaboración de los datos obtenidos.
I. INTRODUCTION
Les réacteurs G2/G3 sont équipés de machines à calculer électroniques
pour le traitement des informations reçues des 1200 thermocouples disposés à la sortie des canaux.
Ces appareils sont de 2 types:
a) un équipement de surveillance: installation de la Compagnie industrielle
des téléphones (CIT)
b) un équipement de traitement des informations: installation de la Société
d'études et de recherches électroniques (SEREL).
L'équipement de surveillance assure le contrôle des températures de
C O 2 à la sortie des 1200 canaux et ceci à une cadence qu'il est pratiquement
impossible d'atteindre manuellement (65/s). La surveillance est donc pra
tiquement continue et cette fonction de la machine est liée à une alarme
lumineuse et sonore à 2 seuils réglables; le contrôle de la valeur se fait sur
machine à écrire automatique.
L'équipement de traitement des informations est un véritable calculateur
électronique qui permet le traitement et la présentation des températures
des 1200 canaux d'une façon séquentielle déterminée par l'exploitation.
D'autres paramètres liés au fonctionnement du réacteur sont traités de la
même façon.
487

488 J. MEIFFREN
Les liaisons du calculateur avec «le monde extérieur» sont beaucoup
plus étendues que celles de l'appareil de surveillance, mais elles ne sont
pas automatiques. Ce sont essentiellement des présentations de cartes
reproduisant la topologie de la face de chargement du réacteur et comportant
des températures brutes données par l'appareil de surveillance, des résul
tats de calculs sur ces températures ou sur d'autres paramètres (activité et
irradiation des canaux). Toutes ces valeurs sont pr/sentées par l'intermé
diaire d'une machine à écrire automatique.
Les 2 équipements sont techniquement assez semblables. Leur principe
de fonctionnement est basé sur la technique des impulsions et l'organisation
logique des circuits électroniques transistorisés qui transforment et traitent
les informations en "code binaire (pur ou décimal).
II. DESCRIPTION DES PRISES DE T E M P É R A T U R E DU C 0 2
On a placé un thermocouple cuivre-constantan dans le C 0 2 à la sortie
de chaque canal. Ces 1200 thermocouples sont reliés à une armoire de
répartition reproduisant la topologie de la face Nord du réacteur et placée
sur la plate-forme de chargement. A chaque thermocouple correspond une
douille dans laquelle on peut brancher un enregistreur à une voie permettant
de procéder à un contrôle sur place d'une température et éventuellement
de suivre les opérations faites sur un canal.
Correction des températures brutes
Il est apparu que les valeurs des températures brutes étaient entachées
d'une légère erreur due à une perturbation du débit pendant les prélèvements
de la Détection de rupture de gaine. Une correction systématique est alors
introduite dans la mesure qui, sans elle, serait erronée par défaut. Cette
correction est déterminée canal par canal et conservée en mémoire dans
le calculateur. Ces corrections sont très variables d 'un canal à l'autre,
mais toujours positives, elles sont donc nécessaires et d'ailleurs vérifiées
par des thermocouples de contrôle que l'on dispose provisoirement de façon
différente à la sortie du canal.
III. ÉQUIPEMENT DE SURVEILLANCE
1. But de l'appareil
Cet appareil est prévu pour 2 fonctions distinctes:
a) surveillance aveugle des températures et impression automatique des mesures sur téléscriptrice en cas de dépassement et
b) appel de certaines voies de mesure sur demande de l'opérateur jusqu'à
concurrence de 16 résultats.
2. Disposition pratique générale.
1200 paires Cu-К sont raccordées sur l'armoire de répartition décrite
ci-dessus et ramenées dans une salle dans laquelle sont disposés dans
l'ordre de la chaîne (fig. 1):

SURVEILLANCE DES TEMPÉRATURES 489
SALLE C.I.T I SALLE DE COMMANOE
Figure 1
Synoptique de l'a p p a re il de surveillance.
- une boite de soudure froide (BSF) (fig. 2),
- une armoire de régulation de température de la BSF,
- un commutateur mécanique rotatif (fig. 2),
- 8 préamplificateurs de signaux température,
- un codificateur de zones.
La boite de soudures froides est une enceinte thermostatée où sont
groupées toutes les soudures froides des thermocouples. La température
y est maintenue à 120 ±0, 2°C.
La commutation des forces électromotrices de couples s'effectue en
2 stades:
- une commutation mécanique à bas niveau des voies de mesure par groupe
de 8 (fig. 3),
- une commutation électronique à niveau élevé de chacune des 8 voies de
mesures.
Le temps de commutation total est 65, 6 s. Les 8 signaux sont amplifiés
une première fois (gain 100).
Le codificateur de zone effectue la répartition des 8 canaux d'une posi
tion quelconque du commutateur entre les 3 zones du réacteur.
Les signaux ainsi amplifiés et répartis sont envoyés dans la salle de
commande principale du réacteur où l'on trouve:
- 8 filtres d'entrée,
- 8 amplificateurs,
- un commutateur codeur adresse,
un codeur température,
- un circuit «logique»,

490 T. MEIFFREN
Figure 2
Appareil de surveillance,
(au premier plan: boîte de soudure froide, à droite: commutateur rotatif).
- un circuit de sortie téléscriptrice,
- des circuits annexes.
A l'entrée des armoires de la salle de commande, les tensions de me
sures sont filtrées et amplifiées à nouveau (gain 100) avant d'être dirigées
vers les circuits de commutation électronique et de codage (pour les tempé
ratures normales de fonctionnement, la tension de sortie est alors de l'ordre
de 100 V).
Le commutateur codeur électronique remplit 2 fonctions principales:
- l'élaboration du code d'adresse des canaux auxquels est affectée la re
présentation alphanumérique de l'adresse de ces canaux,
- la fourniture des signaux de commutation rapide des 8 voies en niveau
élevé et le codage de celles-ci.
Le codeur température transforme la tension analogique donnée par
les amplificateurs et proportionnelle à la température en une information
binaire-décimale. Ce codeur est donc une combinaison de machine analo-

SURVEILLANCE DES TEMPÉRATURES 491
Figure 3
Commutateur rotatif.
On distingue en haut le raccordement des thermocouples par groupes de 8 et,
dans le socle, les préamplificateurs et les organes de codificateursde zone.
gique et de machine numérique ; il traduit électriquement la fonction
«tension-degré» d'un thermocouple Cu-К laquelle est la somme d'une droite
et d'une parabole à partir de 120°.
Le circuit logique est le circuit «pensant» de l'explorateur. C'est
lui qui prend la décision de la suite des opérations suivant le type d'in
formation qui se présente à lui: passage ou disparition d'un canal en alarme,
appel ou effacement d'un canal au clavier. Le circuit logique reçoit toutes
les informations et tous les codes (adresse et température) qu'il garde en
mémoire dans des tores à ferrite et se tient à la disposition des circuits
de la téléscriptrice lorsque cette dernière devra communiquer avec le
«monde extérieur», c'est-à-dire inscrire en clair les grandeurs codées
et stockées dans les mémoires adresses et températures.

492 J. MEIFFREN
3. Exploitation de l'appareil
L'appareil de surveillance comporte un clavier de zone sur lequel on
peut inscrire par zone du réacteur (centrale, intermédiaire et périphérique)
une température de référence qui peut être, par exemple, la température
limite de sortie du C O 2 dans un canal de la zone considérée.
Lorsqu'un canal dont la température de sortie est supérieure à la ré
férence, est détecté par le commutateur, un voyant vert « A L A R M E » s'al
lume. Si ce canal dépasse de 20°C la température de référence, un voyant
rouge « A L E R T E » s'allume. Ces allumages sont doublés d'un coup de
klaxon.
L'adresse et la température du canal ainsi détecté s'inscrivent auto
matiquement en rouge sur la télescriptrice. Si le canal reste en alarme
ou en alerte, sa température réapparaît en rouge toutes les minutes sur la
téléscriptrice.
C'est la fonction «surveillance» de la machine.
L'appareil comporte un 2 ème clavier, appelé clavier d'adresse sur
lequel l'opérateur peut inscrire l'adresse d'un canal dont il désire connaître
la température. Dès sa détection par le commutateur, l'adresse et la tem
pérature de ce canal s'inscrivent en noir sur la téléscriptrice.
La température réapparaît en noir toutes les minutes jusqu'à efface
ment de l'adresse du canal.
C'est la fonction «contrôle» de la machine.
Le nombre total de canaux pouvant être pris en charge par la machine
par dépassement ou appel manuel, est de 16. L'appareil reçoit les tops
horaires d'une pendule électrique extérieure. L'inscription d'une adresse
ou d'une température sur la téléscriptrice est toujours précédée de l'in
scription de l'heure (heures et minutes). L'erreur absolue sur les températures mesurées est inférieure au degré, mais la machine ne donne la
valeur qu'à 1°C près sans tenir compte des décimales. Un spécimen des
résultats obtenus sur la téléscriptrice est donné ci-après (fig. 4).
IV. É Q U IP E M E N T DE T R A IT E M E N T DES IN FORM ATIONS
1. But de l'appareil
L'appareil de traitement des informations (type 1001) est un calculateur
numérique qui, suivant un programme bien défini, est chargé:
a) de stocker un certain nombre d'informations données par l’appareil pré
cédent et de paramètres introduits manuellement par l'opérateur;
b) d'effectuer des opérations sur ces données et communiquer ensuite les
résultats suivant des présentations définies par l'opérateur (fig. 5 et 6).
2. Programme actuellement en service
a) Param ètres d'entrée
- 1200 températures en code binaire données par l'appareil de surveillance;
- code horaire, heures et minutes en binaire données par l'appareil de
surveillance,

Inst
ant
de
com
muta
tion
Fonc
tion
«S
UR
VE
IL
LA
NC
E,
ALA
RM
E,
ALER
TE»
Fonct
ion
«C
ON
TR
OL
E,
APPEL
CL
AV
IE
R»
SURVEILLANCE DES TEMPÉRATURES 493
<<
nS <j vu (u
«1 cG G fl} 0) U H
o o o c - < o c - c o c - o > r - ic o тр ю ^ <n o c-( f t M W N N N l N C J r t O Î A « A n СО Oîi- Ч С О С О С О С О С О С О С О С О С О со I со I со I со со соы
Н $
Л) «-vu§ Е«з си
и Ен
е fe3 а «в <
<н4<
о и н нa l l 1
|с о | ю с о | о 1 л | о | < о | со со со оэ к * г - ш со I со I со I со I со I со ! со I
< со с - со со к о Uo Uo (N eo I со I со I
><
<IDО
<J<
I CO Ю CO t* СО 05 1 ^ ^ ^ ^
0 1 0 ) 0 ) 0 5 0 5 0 ) 0 5 0 ) 0 ) 0 5 0 5 0 1 ( ^ 0 ) 0 ) 0 5 0 ) 0 5 0 3 0 3 ОООООООООООООООООООО
Figu
re
4
Spécim
en
des
résu
ltat
s obt
enus
sur
la té
lésc
riptr
ice
de
l'appare
il
de
surveil
lance.

Figure 5
Appareil de traitement des informations.
- 1200 corrections introduites manuellement (valeur positive de 0 à 30°);
- 1200 numéros de zones introduits manuellement et assurant la répartition
des 1200 canaux en zones (5 maxim. ) suivant la configuration adoptée
sur le réacteur;
- 5 températures de références de zones introduites manuellement et fixant
un seuil pour chaque zone;
- 2 températures d'entrée du CO2 en pile (0e) introduites manuellement
et correspondant aux 2 zones d'entrée du réacteur;
- 1 origine de calcul statistique des écarts; début du tracé des histo
grammes, introduit manuellement;
- 2 échelles de calcul statistique des écarts: élongations des histogrammes
introduites manuellement;
- 1 coefficient d'échauffement relatif (r); paramètre liant la température
de sortie à la température de gaine et introduit manuellement;
- 3 débits moyens de gaz (q), (zones centrale, intermédiaire et périphé
rique) introduits manuellement;
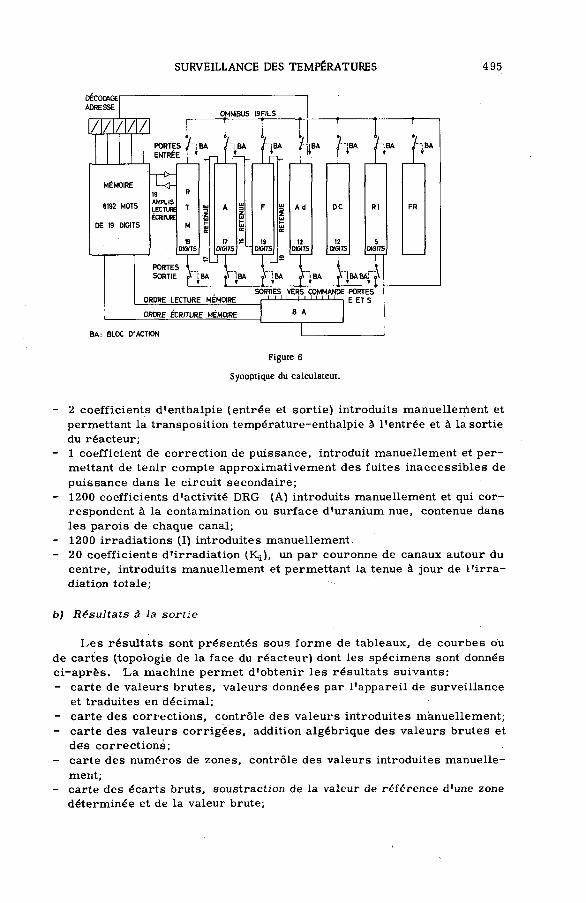
SURVEILLANCE DES TEMPÉRATURES 495
DECODAGEADRESSE
OMNIBUS 19FILS
ШЩ i. I. I. 1,PORTESENTRÉE
MEMOIRE
8192 MOTS
DE 19 DIGITS
S /"¡B A
l±L-\
U ]19AMPLiSLECTUREÉCRITURE
PORTESSORTIE
17DIGITST 19
DIGITSIn 12DIGITS
f i8* T' i6* f lBA
I t I
12nais
"lBA
5DIGITS
IBA BAI
SORTIES VERS COMMANDE PORTES ORDRE LECTURE MEMOIRE 1 I 1 U I I I I I 1.1 - , E ET s
ORDRE ECRITURE MEMOIRE B A
BA: BLOC D'ACTION
Figure 6
Synoptique du calculateur.
2 coefficients d'enthalpie (entrée et sortie) introduits manuellement et
permettant la transposition température-enthalpie à l'entrée et à la sortie
du réacteur;
1 coefficient de correction de puissance, introduit manuellement et per
mettant de tenir compte approximativement des fuites inaccessibles de
puissance dans le circuit secondaire;
1200 coefficients d'activité DRG (A) introduits manuellement et qui cor
respondent à la contamination ou surface d'uranium nue, contenue dans
les parois de chaque canal;
1200 irradiations (I) introduites manuellement.
20 coefficients d'irradiation (Kj), un par couronne de canaux autour du
centre, introduits manuellement et permettant la tenue à jour de l'irra
diation totale;
b) Résultats à la sortie
Les résultats sont présentés sous forme de tableaux, de courbes ou
de cartes (topologie de la face du réacteur) dont les spécimens sont donnés
ci-après. La machine permet d'obtenir les résultats suivants;
- carte de valeurs brutes, valeurs données par l'appareil de surveillance
et traduites en décimal;
- carte des corrections, contrôle des valeurs introduites manuellement;
- carte des valeurs corrigées, addition algébrique des valeurs brutes et
des corrections;
- carte des numéros de zones, contrôle des valeurs introduites manuelle
ment;- carte des écarts bruts, soustraction de la valeur de référence d'une zone
déterminée et de la valeur brute;

496 J. MEIFFREN
- carte des écarts corrigés, soustraction de la valeur de référence d'une
zone déterminée et de la valeur corrigée (fig. 7);
- carte des températures de gaine, calcul de la température de gaine fictive
suivant la formule: 0g = r(0s - 0e) + 6e dans laquelle 0S est la température
de sortie en valeur corrigée;
- carte des dérivées de températures, soustraction algébrique des tempé
ratures en valeurs corrigées entre 2 dates déterminées.
R E A C T E U R
G______T » C02 SORTE CANAUX
QUART б C02 ENTRÉE 8 C02 SORTIE
z p * a ____ |zc______ z p _______|zc+a______
PRESSION PILE
____ КдЛсг?PUISSANCE
№ «ed
FCH- ■ FCH
08 00 Г Г Т Т П H G F E D С B A A В C D E F G H m i nCe5 1 -KW -59 -93 -86 -83 -90 -77 -83 -71 -73 •81 -101 -91 -96 -99 -no СО
j -69 -86 -85 -64 -36 -66 -69 -45 -39 -57 49 -63 ■73 -38 -53 -51 -80 -96 j
K -88 -80 -68 -74 -59 -57 -47 -49 -42 -42 -42 -41 -44 •57 -56 -57 -68 42 -73 -88 KL -79 -67 -37 -55 -51 -43 -66 -71 -57 -53 -56 -54 -50 -53 -64 -63 -33 -50 -57 -21 4 2 -46 L (D)
M -60 -в4 -59 -51 -43 -59 -54 -51 -53 -40 -38 -60 -a -41 -40 -46 •46 47 -58 -39 -31 -55 -50 *€0 MN -69 -51 -56 -46 •59 -51 -45 -3B -40 -36 -30 -45 -47 -51 -39 •28 -31 -32 -36 -51 -48 -52 42 -55 40 -55 N
0 -77 -63 -53 -55 -48 •36 -a •38 -25 -24 -25 -37 -42 -39 -43 -36 -37 -25 -22 -21 -32 -45 •60 -52 -30 -52 -52 -63 0P -51 -62 -55 -3B -35 -27 -24 142 -1? -22 -42 • 34 -31 -32 -39 -26 -35 -39 •13 -17 -22 -28 -30 -38 -57 -42 49 -58 •69 P
Q -78 -64 -59 -47 -50 -48 -32 -20 -12 -20 -6 -41 -38 -31 -32 -33 -33 -27 -29 -42 •34 -8 -14 -14 -20 -33 -48 -51 -33 •43 48 -88 QR -68 -61 -57 -52 -48 -54 •34 -20 - 7 -7 -12 -31 241 -36 -23 -29 24! •30 -24 -28 241 -38 -23 -11 -9 -6 •20 -35 44 -54 40 -59 -53 -79 R
S -90 •66 -48 •49 -52 -49 -36 -25 -6 -13 -7 -25 -32 -38 -27 -25 -27 -29 -25 -25 •24 -36 -38 -28 -33 -Ю -11 -24 -13 -37 48 -64 -48 4 5 -72 -96 S-вэ -83 -43 «51 -39 -57 -50 -Я -25 -15 -12 -33 -29 -27 -29 -31 -22 -25 -29 -25 -19 •16 -26 -32 -26 -36 -40 -16 -22 -21 -36 45 -55 43 -51 •B -20 -80
-87 -«6 -59 -46 -57 •38 -39 -28 -26 -23 245 -30 -30 -19 -33 245 -22 -23 -57 -26 -21 -22 -33 246 -25 -30 -34 244 -20 -25 -32 -40 •55 -60 44 -59 -50 •86
-7$ -72 -53 -49 -39 -44 254 -17 -Ю -38 -26 -33 -17 -16 -23 -23 -22 -22 -21 242 -19 -11 -27 -28 -13 -31 -25 -38 -47 -26 -34 256 -52 -58 •44 -58 -75 -87
-71 -68 -51 -65 -46 -44 -34 -30 -42 -35 -24 -30 -25 -23 -27 -28 -24 -41 -19 -20 -22 -23 -26 -20 -14 -28 -33 -30 -37 -47 -31 43 4 4 -56 -70 -50 -63 •28
-57 -54 -49 -53 - 52 -40 -21 -* -28 -41 -22 -22 -19 -B -21 -24 -25 -25 -23 -15 •13 -20 -23 -22 -16 -27 -28 -27 -31 -41 -29 -34 -42 -53 -60 -37 -55 -64
-60 *49 -41 -57 -43 -48 -27 -25 238 -36 -25 -28 249 -21 -24 -30 253 -24 -26 -B -19 257 -21 -B -17 232 -26 -31 -39 245 -26 -29 -32 -52 •53 40 -62 -45
-47 -55 • 46 •56 •44 -38 -28 -17 -38 -29 -26 -27 -46 -22 -19 -29 -26 -21 -14 -8 -14 -25 -19 -21 -15 -51 -19 -35 -35 -44 -35 -30 -29 •48 -51 -33 -56 44
-57 -49 -39 -55 -44 -33 -28 -20 -33 -42 -28 -25 -24 '2D -25 -23 -21 -Ю -V. -14 -5 -30 -27 -23 -в -27 -47 -K -43 -29 -31 -39 42 -52 -26 ■51 •49
-57 -50 -35 -57 -51 256 -26 -17 •28 241 -31 -24 -20 -22 220 -27 -9 -6 -9 248 -» •46 •26 226 -19 •23 -21 -29 238 -42 -25 -Z3 257 ■47 -59 -36 ■52 -49
-52 -51 -35 -58 -44 -36 -27 -T5 -41 -37 -24 -26 -24 -21 -30 -20 -8 -8 -» • 21 -Ю -23 -B -77 -23 -26 -49 -26 -33 -46 -23 -28 •35 -43 -52 -31 49 -40
-» -45 -y . -53 - y . -23 -20 -* -39 -38 -20 ^6 -23 -20 -V -20 -D -3 -18 •36 -37 -16 -22 -20 -72 -25 -27 -31 -34 -43 -24 -30 -30 40 -51 -38 -62 -57
-54 -50 -37 •57 -41 -34 -B -26 -38 -38 -25 -34 250 -22 -24 -22 252 -Ю -Ю -37 -11 255 -26 -19 -34 250 -26 -30 -38 -39 -22 -X -36 -36 •54 -32 •56 -64
-45 -56 ■ a -49 -53 - a -B • 20 236 -39 -28 -27 -24 -23 • 22 -2D -9 -2 -14 -18 1 -15 -25 -B -22 -25 -32 -32 -32 240 -21 -X -31 -36 -54 -37 45 •61
-52 -59 •40 -И -35 -29 -28 -21 -23 -34 -37 -28 -18 - » •19 -22 -Î1 -12 -16 -9 -4 -Ю -19 -12 -13 •32 •24 -51 -40 -34 -17 •42 -39 -48 -22 -32 -9 -«2
-62 -58 -55 -23 -43 -33 -29 -24 -22 -17 -26 •22 -26 '20 -Il -22 -B -11 241 -15 -5 -20 -17 -15 -29 -18 -25 -32 -18 -23 -29 -37 -39 -34 -36 -45 -58 ■67
•64 -60 -44 148 -12 -46 -36 -30 •28 -15 -14 249 -23 • 14 -29 M -23 -15 -18 -9 -20 -15 251 -19 -20 -28 254 •25 -23 -27 -28 -39 -44 -23 -44 -52 -50 •63
•90 -57 -56 -36 -19 -48 •39 253 -23 -23 -7 -18 -33 -20 -21 -25 -20 •18 •24 -12 -14 -B -24 -23 -13 -34 -20 -11 -30 -35 252 -44 -54 -11 -24 -79 •76
S -62 -53 -47 -30 -S -47 -36 -34 -18 • 8 -12 -12 -18 -W -24 -16 -22 •22 -11 -18 -23 -23 -31 -28 -23 -23 -17 •B -45 41 -51 -17 •28 -50 -51 -58 SR .43 -37 -42 -32 36 .33 -19 -20 -24 -44 -Ю -26 -23 258 -25 -28 •29 • 14 249 -31 -28 -19 -27 -24 -36 -26 -37 '33 -30 -% -44 -30 -33 R
FC 3| 0 -40 -B -29 -17 -23 -34 -33 -22 -17 -6 -S -t3 -M -9 -Ю -9 147 -6 -11 -18 -25 -13 •26 -30 -26 -36 -45 -2 -25 -27 -38 -23 û ÎPP -Il -3) -30 -24 -14 -37 -32 -37 -Î7 -19 -20 -9 -13 -11 -4 -4 -7 -12 -B -22 -27 -34 -37 -38 -47 -Ю -31 -36 -31 •24 P
0 - a -22 -34 -18 -12 -39 -30 -46 -28 -24 -26 -17 -12 47 -7 -26 -16 -25 -28 -29 •36 -44 -48 -B -B -38 -30 -45 0N -32 •28 -37 -B -6 -7 -40 -34 -39 -34 -25 -24 -31 -28 -27 -29 -38 -40 40 -49 -B •25 -34 -34 -36 41 N
M -48 -33 -44 -32 -24 - B -Ю -45 -41 -41 •38 •44 -38 -44 41 -5Î -54 -20 •27 -40 -39 44 -38 -56 ME il L -44 -33 -54 -50 -40 -35 -30 -27 -16 -O -t? -20 -14 -17 -24 -30 -an -43 -48 -60 -51 -25 L W£ :s i
K J -56 •53 -62 • 56 •46 -48 -42 -38 -35 -34 -30 -39 4 8 -55 -60 -68 -29 -41 J K-68 -73 -58 -57 •62 -56 -37 -40 •39 -37 -61 -66 •84 -81
38
37
36
35
ЗА
33
32
31
30
29
28
27
26
25
2423
2221
2019
18
17
16
15
\U
13
1211109
87
6543
21
P r é f é r e n c e s
P I C|378|378|378|
H G F E D C B A A B C D E F 6 H
PROGRAMME PILOTAGE
ECARTS CORRIGES LOT: H: _____
LOT:____ H : _____
Figure 7
Spécimen d'une carte des «écarts corrigés» obtenue par l’appareil de traitement des informations.
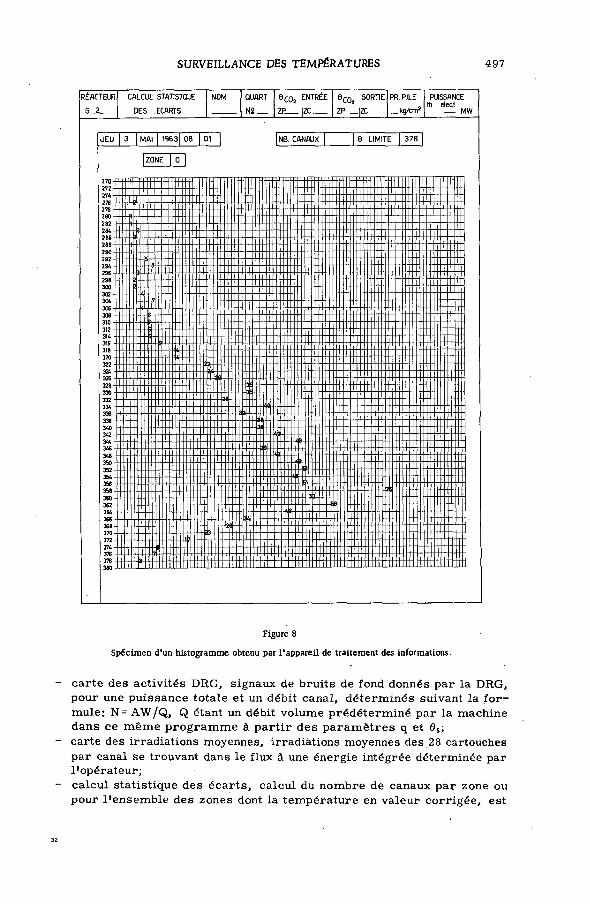
SURVEILLANCE DES TEMPÉRATURES 497
CALCUL STATJSTQUE NOM QUART е С0г ENTRÉE e COj SORTIE PR. PILE
DES ECARTS N g ___ ZP___ | Z C _ ZP___ jZC____ __kg/cm2
UEU j 3 j MAI j 1963| 08 | 01 | |NB. CANAUX [ | 9 LIMITE | 378 ]
[zo n e I 0 I
Figure 8
Spécimen d'un histogramme obtenu par l'appareil de traitement des informations.
carte des activités DRG, signaux de bruits de fond donnés par la DRG,
pour une puissance totale et un débit canal, déterminés suivant la for
mule: N= A W /Q , Q étant un débit volume prédéterminé par la machine
dans ce même programme à partir des paramètres q et 0S;
carte des irradiations moyennes, irradiations moyennes des 28 cartouches
par canal se trouvant dans le flux à une énergie intégrée déterminée par
l'opérateur;
calcul statistique des écarts, calcul du nombre de canaux par zone ou
pour l'ensemble des zones dont la température en valeur corrigée, est
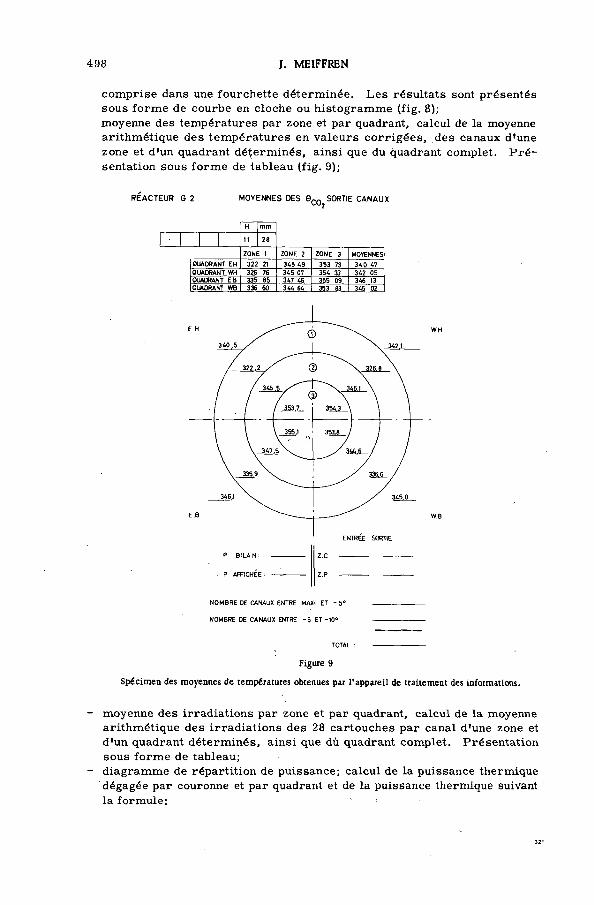
498 J. MEIFFREN
comprise dans une fourchette déterminée. Les résultats sont présentés
sous forme de courbe en cloche ou histogramme (fig. 8);
moyenne des températures par zone et par quadrant, calcul de la moyenne
arithmétique des températures en valeurs corrigées, des canaux d'une
zone et d'un quadrant déterminés, ainsi que du quadrant complet. Pré
sentation sous forme de tableau (fig. 9);
RÉACTEUR G 2 MOYENNES OES 0 ^ SORTIE CANAUX
H mm
■ 1 11 26
ZONE 1 ZONE 2 ZONE 3 MOYENNESQUADRANT EH 322 21 345 49 353 73 340 47OUADRANT WH 326 76 345 07 354 33 342 05OUADRANT EB 335 85 347 46 355 09 346 13QUADRANT WB 336 60 344 64 353 RI 345 02
NOMBRE DE CANAUX ENTRE MAXI ET - 5°
NOMBRE DE CANAUX ENTRE - 5 E T -1 0»
TOTAL : ---------------------------------
Figure 9
Spécimen des moyennes de températures obtenues par l'appareil de traitement des informations.
- moyenne des irradiations par zone et par quadrant, calcul de la moyenne
arithmétique des irradiations des 28 cartouches par canal d'une zone et
d'un quadrant déterminés, ainsi que dû quadrant complet. Présentation
sous forme de tableau;
- diagramme de répartition de puissance; calcul de la puissance thermique
dégagée par couronne et par quadrant et de la puissance thermique suivant
la formule: '
SURVEILLANCE DES TEMPÉRATURES 499
WR = ^ ( Ь Ц -Hee )
dans laquelle W R est la puissance dégagée dans un canal situé au rayon R et
HesetHee les enthalphies de sortie et d'entrée correspondant aux tempéra
tures 6 et 6e de sortie et d'entrée et précalculée par la machine dans ce même programme. Ces résultats sont présentés sous forme de courbes
déterminant l'allure du flux thermique radial dans les diamètres verticaux
et horizontaux de la face du réacteur (fig. 10);
- démarrage automatique, calcul sur le code horaire pour démarrer l'en
registrement «valeurs brutes» et établir la carte «écarts corrigés»
automatiquement à des heures prédéterminées sans risque d'oubli de la
part de l'opérateur.
On peut à volonté changer le programme principal de fonctionnement
et un programme de contrôle secondaire permet de le vérifier en permanence
sur téléscriptrice.
3. Disposition pratique générale
Le calculateur se présente sous la forme d'une baie électronique qui
reçoit les informations codées en provenance de l'appareil de surveillance
(fig. 5): les adresses, les températures, l'heure, le signal de début de cycle
de commutation, le signal de référence du codeur de l'appareil de surveillance.
Ces informations sont reçues en parallèle sur 39 fils de liaison. Le
calculateur est à programme enregistré avec exécution des opérations sur
tous les chiffres en parallèle.
Il se compose d'un certain nombre de sous-ensembles fonctionnels clas
siques d'un calculateur industriel (fig. 6); un bloc mémoire et ses circuits
annexes, les organes de calcul et de manipulation de l'information, le bloc
de commande avec son clavier d'exploitation associé à la disposition de
l'opérateur et les organes périphériques.
Un dispositif d'entrée à bande perforée est associé au calculateur aug
mentant considérablement la capacité de la mémoire électronique et per
mettant le stockage de programmes de calcul utilisés peu fréquemment.
a) Bloc m ém oire
La mémoire est à tores de ferrite et d'une capacité de 8192 mots de
19 digits. Elle peut contenir aussi bien des données d'adresse que des ré
sultats de mesures.
Les opérations sont exécutées en binaire sur ces mots de 19 digits (plus
1 digit de sécurité); 13 digits représentent l'adresse et 7 digits repré
sentent l'instruction d'opération (dont 1 digit de sécurité).
b) Organes de calcul
Us comprennent 8 registres spécialisés chacun pour des opérations
élémentaires déterminées;
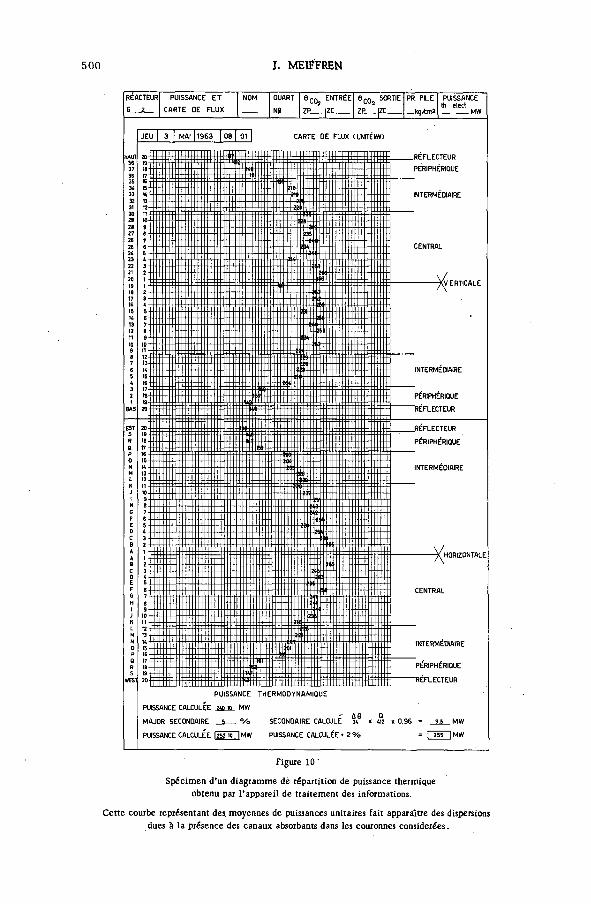
500 J. MEIFFREN
Spécimen d'un diagramme de répartition de puissance thermique
obtenu par l'appareil de traitement des informations.
Cette courbe représentant des moyennes de puissances unitaires fait apparaître des dispersions
dues à la présence des canaux absorbants dans les couronnes considérées.

SURVEILLANCE DES TEMPÉRATURES 501
Registre : additions
Registre F : filtrages
Registre DC : décalages
Registre I : instructions de calculs
Registres PetN : (faux registres) compléments
Registre R T M : tampon mémoire
Registre Ad : adresses
Ces 2 derniers registres sont en liaison directe avec la mémôire, les
autres y sont branchés suivant le calcul à effectuer par le bloc d'action ou le
bloc de commande. Les calculs sont effectués en virgule fixe, les facteurs
varient de 0 à 64 000 en valeur absolue.
c) Bloc de com m ande
Il ouvre et ferme les portes d'entrée et de sortie des 6 premiers re
gistres et envoie les ordres d'écritures et de lecture à la mémoire.
Le clavier d'exploitation contient l'électronique de périphérie corres
pondant aux touches de composition d'adresses, de valeurs, de numéros de
zone-et de choix de programme. Cette électronique effectue la transposition
de ces compositions manuelles en code binaire assimilable par le calculateur.
d) Organes périphériques
Il contiennent l'électronique chargée de l'adaptation des entrées et des
sorties du calculateur: adaptation de l'appareil de surveillance et commande
téléscriptrice et sont destinés à l'entrée des programmes et à la sortie des
résultats.
e) Adaptation « bande perforée »
Une machine FLEXOW RITER, type SDP 12 pouces, équipée d'un lecteur
de bande 8 trous, peut s'adapter sur l'un ou l'autre des calculateurs de
chaque réacteur afin de leur introduire les informations programmées sur
les bandes. Ces programmes sont composés par l'opérateur sur une machine
à écrire électrique et transposés immédiatement sur bande par un perfora
teur 8 trous intégré à la FLEXOW RITER .
La fréquence du générateur de rythme est de 100 kHz ce qui donne une
idée de la rapidité d'exécution des opérations élémentaires:
Addition : 60 /us
Soustraction: 80 /us
Division : 500 цз
V. FONCTIONNEM ENT E T ENTRETIEN
L'appareil de surveillance n'a donné lieu à aucune panne importante
sauf des déréglages des circuits d'étalonnage dus aux variations importantes
de température extérieure. Les transistors utilisés sont en effet très sen-
502 J, MEIFFREN
sibles à ces variations et supportent difficilement des températures élevées
(supérieures à 25°C).
Au premier mois de fonctionnement, plusieurs pannes ont été relevées
sur l'appareil de traitement des informations: quelques-unes sur l'électro
nique même, défaut de montage ou faiblesse des éléments de circuits, la
plupart sur la téléscriptrice qui suit difficilement la cadence imposée par
le calculateur. Ces défauts ont été â peu près repris et l'exploitation de
l'appareil est devenue normale et satisfaisant vers le 1er avril 1962.
Après un an d'utilisation pratiquement continue, on note:
a) des petites pannes provoquant une indisponibilité de l'ordre de la journée
(défaut de fonctionnement des bascules des registres provoqué par le déséquilibre dû au vieillissement d'un des deux transistors, électromécanisme de la télescriptrice); et
b) des grosses pannes provoquant une indisponibilité de plusieurs jours de
l'appareil (déréglage des courants mémoires, chauffage excessif et sé
chage des condensateurs dans les alimentations, chauffages excessif
des transistors provoquant leur détérioration en série).
De fortes perturbations sont apparues dans les mémoires de calculs
lors des variations importantes de température ambiante (janvier - février
1963) avec détérioration d'un grand nombre d'éléments de circuits (tran
sistors). Une étude de thermostatage intégral est actuellement en cours; la température idéale est comprise entre 18 et 22°C.
On peut estimer à 99% le facteur de disponibilité de l'appareil et a 95%
celui de l'appareil de traitement des informations.
Ce facteur de disponibilité ne peut être atteint qu'avec une équipe de
techniciens (2 à 3 personnes) connaissant parfaitement les circuits électo-
niques miniaturisés, et la technique des impulsions.
VI. PERSPECTIVES D 'AVENIR
Il est évident que disposant d'un calculateur ayant d'immenses possi
bilités de calculs, les différents modes d'exploitation définis ne sont pas
limitatifs et nous pouvons déterminer des analyses complémentaires et des
calculs statistiques qui peuvent, s'avérer nécessaires pour la conduite des
réacteurs.
On peut, d'autre part, envisager l'amélioration de la présentation des
résultats sur carte. Les cartes de température à la sortie des canaux sont
actuellement colorées à la main de façon à faire apparaître la dispersion
de ces températures. A l'heure actuelle l'existence de tubes cathodiques
«trichromes» permet d'envisager la sortie de cartes de températures, di
recte en couleur. L'obtention de ce résultat est réalisée au moyen d'un
balayage spécial du tube qui superposera à un balayage «ligne» du type
Télévision/ un balayage sinusoïdal à haute fréquence qui couvre un «carré»
représentant un canal. Les informations de «couleur» proviennent de la
combinaison de tension de 3 wehnelt conformément à un code choisi. Les
écarts de température sont lus directement dans une mémoire à tores auxi
liaires, à une cadence d'un mot toutes les 15 ¡us permettant la présentation
d'une carte en un-temps approximatif de 1/50 ème de seconde, évitant ainsi
le scintillement.

SURVEILLANCE DES TEMPÉRATURES 503
VII . CONCLUSION
Les deux appareils non prévus dans le projet des réacteurs G2/G3, sont
devenus rapidement indispensables pour l'exploitation rationnelle de ces
réacteurs.
En effet, bien que les températures de sortie des canaux ne représentent
pas la totalité des informations nécessaires à la conduite d'un réacteur, elles
constituent en régime stable, l'accès facile à un grand nombre de paramètres
importants du cœur de la pile, paramètres pratiquement inaccessibles di
rectement.
D'autre part, les temps de réponse de ces appareils étant relativement
courts, ils sont encore très utiles en régimes transitoires du réacteur où
les déplacements des zones de températures sont fonction du mouvement
des barres de contrôle.


ORGANISATION ET INSTRUCTION DU PERSONNEL AUX RÉACTEURS G2 ET G3
F. CONTE
CENTRE D'ÉTUDES NUCLÉAIRES DE MARCOULE, FRANCE
Abstract — Résumé — Аннотация — Resumen
ORGANIZATION AND TRAINING OF THE G2 AND G3 REACTOR PERSONNEL. This paper contains a
detailed description of the organizational system associated with the G2 and G3 reactors (Operations Section,
Maintenance and Works Service), toghether with a review of personnel training.
ORGANISATION ET INSTRUCTION DU PERSONNEL AUX RÉACTEURS G2 ET G3. On trouvera dans ce
mémoire une description détaillée de l'organigramme des réacteurs G2 et G3 (Section d'exploitation, Service
de l'entretien et des travaux etc.) ainsi qu'un aperçu concernant l'instruction du personnel
ОРГАНИЗАЦИЯ И ИНСТРУКТАЖ ПЕРСОНАЛА, ЗАНЯТОГО НА РЕАКТОРАХ G2 И G 3 . В докладе дается под
робное описание организационной структуры реакторов G2 и G3 (Отдел эксплуатации, Служба содер
жания и работ и т . д . ) , а также обзор инструктажа персонала.
ORGANIZACIÓN Y FORMACIÓN DEL PERSONAL EN LOS REACTORES G2 Y G3. La memoria describe
detalladamente la organización de las operaciones en los reactores G2 y G3 (sección de explotación, sección de
conservación y trabajos, etc. ), asi como una resefla del programa de adiestramiento del personal.
I. ORGANISATION DU PERSONNEL
Une remarque préliminaire s'impose avant de détailler l'organisation
du personnel des réacteurs G2/G3.
Ces réacteurs sont implantés sur un site contenant des services aussi
différents que le réacteur Gl, les réacteurs G2/G3, l'usine d'extraction du
plutonium, la station de traitement des effluents, l'atelier de taillage du
graphite, l'empilement critique Marius, etc.
A ces services, groupés sous l'autorité d'une seule Direction, sont
adjoints des services communs, à l'échelon du centre lui-même. Il s'agit
des services généraux, administratifs, des programmes, immobiliers, de
protection, de sécurité, médicaux, etc.
La présente communication ne traitant que de l'organisation des réacteurs G2/G3, il ne sera pas fait mention des services communs dont l'existence
ne doit toutefois pas être perdue de vue, si l'on veut que l'exposé suivant
reste compréhensible.
1.1. Service G2/G3
La totalité du personnel atteint 400 personnes, dont 18 ingénieurs (voir
l'annexe I) .
Trois sections principales se répartissent ce personnel ainsi qu'un groupe
administratif. Deux sections semblables correspondent à l'exploitation
proprement dite,assurant la marche des deux réacteurs. Une section d'en
tretien et de travaux répartit ses activités sur l'ensemble des deux réacteurs.
505

506 F. CONTE
Groupe de travail
L'ensemble des ingénieurs, en plus de leurs travaux routiniers, forme
un groupe de travail sous la direction du Chef de Service. Ce groupe de
travail effectue toutes les études théoriques ressortant de la physique, de la
neutronique, de la thermodynamique, nécessités par les besoins de l'ex
ploitation. La plupart du temps, ces travaux sont menés par l'ingénieur dont
la spécialité se rapproche le plus de la question traitée sous la forme «d'in
génieur chargé» .
1.2. Section exploitation G2 et G3 des réacteurs
Chaque réacteur est dirigé par un chef d'ensemble assisté de 4 ingénieurs
et a sous ses ordres 105 personnes dont 50 techniciens.
En plus du secrétariat et de quelques agents en service de jour, la
section est avant tout constituée par du personnel en service continu, chargé
du fonctionnement du réacteur et des opérations de chargement.
A . Service continu au réacteur
Ce service comprend 5 équipes composées de la façon suivante:
- 1 chef de quart,
- 1 adjoint au chef de quart,- 1 conducteur de pile,
- 1 conducteur des machines,
- 1 technicien électricien,
- 1 technicien électronicien,
- 1 spécialiste de la détection de rupture des gaines (DRG)
- 2 mécaniciens rondiers,
- 1 électricien rondier,
soit en tout 10 agents par équipe.
B . Service continu du chargement
Ce service comprend 5 équipes composées de la façon suivante:
- 1 chef d'équipe,
- 1 technicien du chargement,
- 1 technicien électricien,
- 1 ouvrier électricien,
- 2 ouvriers mécaniciens,
- 1 magasinier,
- 1 aide,
soit en tout 8 agents par équipe.
C. Roulement des équipes
Les changements de quart ont lieu pour les deux services ci-dessus aux
heures suivantes: 5h 30, 13h 30, 2Oh 30.
Il suffit de 4 équipes pour assurer ce service, la quatrième étant au
ORGANISATION DU PERSONNEL 507
repos quand les 3 autres travaillent. On peut donc poser la question de
l'utilité de la 5ème équipe.
Il est nécessaire de disposer en plus des équipes de service continu du
personnel de jour chargé de travaux de petit entretien, de réglages, mises
au point, étalonnages, etc. ainsi que de travaux périodiques ressortant
directement de l'exploitation, par exemple’.cartes de flux, essais périodiques
de sous-ensembles, permutation de certains organes. Il a paru intéressant
de remplacer en partie cette équipe de jour importante .par du personnel des
services continus par roulement d'une semaine. Il en découle plusieurs
avantages;
- toutes les 5 semaines, le personnel à poste fixe est «changé d'air»
et peut quitter son pupitre ou son tableau,
- les agents circulant dans l'installation se mettent mieux au courant
des événements passés ou des modifications en cours,
- les conducteurs de pupitres visitent ainsi obligatoirement les machines
qu'ils commandent habituellement à distance.
De plus, la spécialisation trop poussée qui serait la leur, est atténuée
et l'on peut disposer ainsi d'agents polyvalents.
Gomme l'on verra plus loin, il est de plus, possible de distraire
quelques heures dans la «semaine de jour» pour des réunions d'instruction
et de formation professionnelle.
1.3. Section entretien et travaux
Cette section regroupe tout ce qui n'est pas directement la surveillance
et l'exploitation des réacteurs.
Le chef de cette section est assisté de 5 ingénieurs, et a sous ses ordres
160 agents environ, dont 60 techniciens, contremaîtres ou chefs d'équipes.
A . Etudes
Le bureau d'études comprend 15 techniciens, il est assisté d'un bureau
de dessin avec 10 dessinateurs.
Ce bureau d'études entreprend toutes les modifications ou les travaux
d'aménagements en mécanique, électricité et électronique.
Il contrôle les fabrications, les essais, et les mises en route avant la
livraison à l'exploitation.
B . Mécanique
Ce.groupe très important comprend 70 personnes dont 10 contreiñaftres
ou chefs d'équipes.
Il comprend: un atelier et le personnel correspondant, des équipes d'en
tretien volantes et des équipes de services généraux.
C . Electricité et électronique
Ces groupes sont constitués de la même façon que le précédent, avec
respectivement 35 et 25 personnes.

508 F. CONTE
1. 4. Groupe administratif
Un cadré administratif groupe sous ses ordres 10 employés chargés de
la gestion du personnel, des achats, du contrôle des travaux et des facturations, de l'établissement des prévisions.
II. INSTRUCTION DU PERSONNEL
2.1. Connaissance des installations
La presque totalité des ingénieurs et techniciens employés actuellement
sur nos réacteurs a suivi et souvent dirigé la construction, les essais et la
mise en route. Par conséquent, la question capitale de la connaissance des
installations n'a pas jusqu'ici posé de problèmes, l'encadrement du personnel
étant parfaitement au courant de l'ensemble des appareillages.
Il convient de signaler malgré tout que des cours théoriques et pratiques
ont été dispensés à ce personnel pendant toute la période de construction,
cours très complets et circonstanciés." Mais ces cours s'adressant à des
agents ayant sous les yeux les installations en cours de montage ne pouvaient
pas être pris comme base d'un cours d'information destiné à du personnel
«neuf». Nous n'en ferons donc pas état plus longuement.
2.2. Instruction permanente
Il a été expliqué au chapitre précédent comment le roulement des équipes
d'exploitation permet toutes les 5 semaines de disposer d'un certain temps
pour l'instruction de l'équipe en «semaine de jour».
Trois matinées sont, à cette occasion, consacrées à l'instruction
théorique. Les équipes d'exploitation en service continu bénéficient donc
d'une moyenne de 10 h de cours par mois.
Ces cours donnés en général par les ingénieurs eux-mêmes traitent de
la physique nucléaire, de thermodynamique et des spécialités intéressant
ces agents.
L'annexe II donne à titre d'exemple le programme des cours de printemps 1962.
2.3. Simulateur
Des cours d'instruction plus spécialisés que les précédents peuvent
être institués chaque fois que l'occasion s'en fait sentir et en particulier
avant ou après des expériences ou des manoeuvres spéciales.
De plus, des séances pratiques de manipulations sont effectuées par les
agents chargés de pupitres ou de tableaux sur un simulateur de pile. Ce
simulateur reproduit le pupitre principal de la salle de commande avec la totalité des instruments réels. Il est évident qu'il serait impensable de
simuler intégralement tous les appareils en raison de leur nombre con -
sidérable. Seuls les principaux organes de commande (barres de contrôle,
puissance, températures; débits, rotation des soufflantes, etc.) sont simulés
ORGANISATION DU PERSONNEL 509
par un appareillage électrique et électronique programmé. Les multiples
indicateurs ou organes auxiliaires sont simplement animés manuellement.
Il s'est avéré, à l'usage, que le personnel conserve à l'esprit la philo
sophie des manoeuvres nécessitées par l'exploitation correcte des réacteurs.
Mais, après la période de mise en route de 1959 et 1960, les manipulateurs
se trouvèrent devant des pupitres à regarder, sans manœuvres à effectuer,
en raison de la stabilité déconcertante de ce type de pile.. Il peut se passer
des semaines entières sans qu'aucune manœuvre manuelle soit nécéssaire.
On pouvait se demander si, à la longue, ces agents conserveraient le
«doigté»1 du bon manipulateur.
C'est surtout pour cette raison, pour faire manœuvrer les agents des
pupitres, que ce simulateur a paru nécessaire.
Les séances de simulation sont donc surtout des séances de «manipula
tion» . Le grand nombre d'organes en cause rend ces séances du plus haut
intérêt et le volume du pupitre permet, de surcroît, l'admission d'un nombre
assez grand de «spectateurs» accroissant ainsi le rendement de l'instruction.
2.4. Cours de conducteur de pile
L'Institut national des sciences et techniques nucléaires à Saclay, a institué
2 sessions annuelles de cours spéciaux à l'usage des conducteurs de pile.
Ces cours s'adressent aussi bien aux conducteurs de'piles à graphite, qu'aux
conducteurs de réacteurs à eau légère ou lourde.
Ces cours, malgré leur nom, sont en fait destinés à des chefs de quart
en raison de leur niveau assez élevé. Ils s'adressent à du personnel déjà
formé sur place et connaissant parfaitement les installations.
Précédés de 2 semaines d'«entraînement de l'esprit» sur place à Marcoule, ces cours durent 4 semaines. Le programme détaillé est donné en annexeIII.
Ces cours, uniquement théoriques avec quelques manipulations sur des
piles école, sont suivis d'un stage pratique de 4 autres semaines sur les
réacteurs de Saclay ou de Grenoble. L'étudiant prend alors place aux com
mandes de ces réacteurs, différents des réacteurs de puissance de Marcoule,
et peut ainsi illustrer la théorie des semaines précédentes.
En résumé, ces cours de conducteurs de piles, après 4 semaines
d'études théoriques et 4 semaines de stage pratique, forment des agents aptes
à piloter des piles à eau lourde, des piles piscines et des piles de puissance
au graphite.
ANNEXE I
Dans cette annexe on trouvera une descriptions de l’organigramme du service G2/G3 (fig.l).
ANNEXE II
Dans cette annexe on trouvera un aperçu de l’horaire réservé à l'instruction du personnel des réacteurs
G2/G3 (Tableau I)

510 F. CONTE
Org
an
ig
ra
mm
e
.diL
Servic
e
G2
/G
3
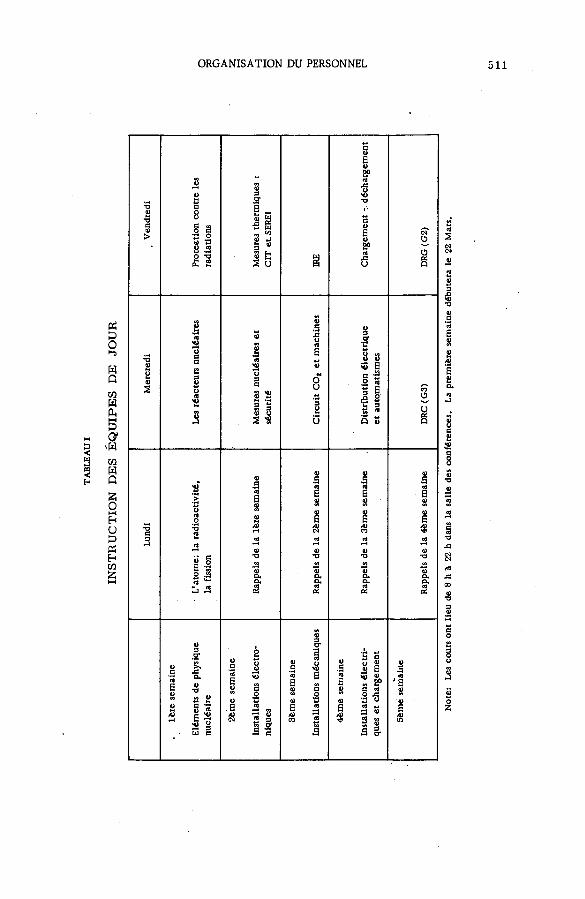
IN
ST
RU
CT
IO
N
DES
ÉQ
UIP
ES
DE
J
OU
R
ORGANISATION DU PERSONNEL 511
Note:
Les
cour
s on
t lieu
de
8 h
â 22
h da
ns
la sa
lle
des
confé
rences.
La
pre
miè
re
sem
ain
e
débute
ra
le 22
Mars.

512 F. CONTE
ANNEXE III
COURS DE CONDUCTEURS DE PILE A L'INSTN DE SACLAY
I. Notions fondamentales de physique nucléaire (3 séances)
1. Constitution de l'atome et du noyau.
Particules et rayonnement.
2. Réactions nucléaires - fission (généralités).
3. Transmutations en pile
(plutonium et formation de radioéléments.
Activation (sources naturelles ou artificielles).
П. Neutronique - généralités - Sections efficaces (6 séances)
1. La vie des neutrons dans la pile (2 séances)
Classification des neutrons d'après l'énergie.
Ralentissement - Absorption - Multiplication - Réaction en chaîne - Réflecteur.
Bilan neutronique sommaire - Réactivité.
Taille et masse critiques.
2. Description technologique d'une pile (1 séance)
3. Flux neutronique dans une pile (1 Séance)
Carte de flux - Mesures - Aplatissement - Déformations locales (barres).
4. Cinétique de la pile (1 séance).
Prompte criticalité.
Neutrons retardés - Période - Courbe de Nordheim.
Principe du contrôle : barres de contrôle et niveau d'eau, matériaux absorbants et poisons
consommables.
5. Bilan de réactivité et évolution de la réactivité(1 séance).
Xénon - Samarium - Température - Vide - Pression.
Pureté des matériaux - Introduction des matériaux étrangers.
Evolution du combustible.
III. Les problèmes technologiques dans les réacteurs (7 séances)
1. Eléments combustibles - Gaines - Température du combustible (2 séances).
2. Transfert de chaleur aux divers fluides caloporteurs utilisés (2 séances).
Répartition des températures - Points chauds en relation avec la courbe de flux.
Ebullition dans les piles a eau.
3. Echauffements locaux: protection, radioéléments, dispositifs en pile, échauffement y (1 séance).
4. Problèmes chimiques dans les réacteurs. (2 séances)
Corrosion - Résistivité de l'eau.
Recombinaison - Epuration.
IV. Mesures (4 séances)
1. Etude générale des détecteurs de rayonnements (1 séance).
2. Les chaînes de mesure neutronique (2 séances).
Principe des chaînes à impulsion.
Sensibilité - Gammes de mesure - Recouvrement - Intégrateurs et différentiateurs.
Principe des chaînes à courant continu: chaînes linéaires - chaîne log.
Précisions comparée des chaînes.
Périodemètre - Fluctuations - Temps de réponse.
Enregistreurs.
Chaînes de santé.
3. Mesures de température et de débit (1 séance).
Puissance d'une pile - Relation flux-puissance - Etalonnage thermodynamique.

ORGANISATION DU PERSONNEL 513
V. Dispositifs assurant la sécurité du réacteur (6 séances)
1. Dispositifs d'alerte.
Boucle de sécurité - Verrouillages.
Maintenance électrique.
2. Barres de sécurité.
3. Protection contre la libération de réactivité - Retrait d’absorbeur.
4. Protection contre les accidents thermiques.
5. Détection de rupture de gaine dans les divers réacteurs.
6. Sécurité des expériences - Les auxiliaires.
VI. Pilotage d'un réacteur (6 séances)
1. Démarrage (2 séances).
Niveau de source.
Réacteur sous-critique.
Divergence.
Montée en puissance.
Stabilisation (problèmes qui s’y rattachent).
Pilotage automatique.
Dans les exposés de ce paragraphe, il parait souhaitable d'attirer l'attention sur les points suivants :
- incertitude sur l'état initial du réacteur,
- degré de confiance à accorder aux appareils de mesure (périodemètre, pseudo-période),
- influence de la vitesse de remontée des barres sur le niveau atteint à la criticalité,
- dangers de cette phase â cause de l'absence de contreréaction de température.
2. Marche en puissance (2 séances).
Stabilité intrinsèque du réacteur,
Evolution dans le temps du coefficient de température,
Evolution de la réactivité dans le temps.
Arrêt du réacteur - redémarrage après un court arrêt.
3. Evolutions accidentelles ( 1 séance).
Causes possibles provoquant l'accident de réactivité.
Réponse d'un réacteur â un saut de réactivité.
Accident, froids - vidange accidentelles du modérateur et du fluide réfrigérant.
4. Conférence sur les accidents «historiques» (1 séance).
Vn. PROTECTION AUTOUR D'UN RÉACTEUR (4 séances)
1. Diffusion et fluctuation des rayonnements (2 séances)
Arrêt des rayonnements.
Matériaux de protection et écrans de pile.
Activation des fluides de refroidissement.
2. Dangers biologiques des rayonnements (1 séance).
Normes et doses - Détecteurs portatifs.
3. Protection lors des déchargements et des travaux sur les piles (1 séance).
Contamination atmosphérique.
D I S C U S S I O N
U. ZELBSTEIN: I should like to take advantage of M. Conte's presen
tation to put a rather general question. It appears that one can use remote-
handling equipment in combination with television in order to deal with
certain more or less predictable defects in a reactor. Has this in fact been
done at Marcoule?
F. CONTE: Yes. Several months ago a very small television camera -
35 m m in diam. - was described in a memorandum by the Commissariat
à l'énergie atomique (CEA). This instrument can be used in combination
514 F. CONTE
with all sorts of remote-handling equipment, including grippers, mirrors
and so forth, for operations many metres within the reactor. The work
is performed under the guidance of the operator and can be carried out at
distances of up to 60 m, so that practically speaking every nook and corner
of the reactor is accessible.
O. CERNŸ : How are the fuel elements cooled after being withdrawn
from the core?
F . CONTE: The film you saw a few minutes ago showed the vibrating
conveyors which carry the fuel to the pond for storage. The elements re
main in these ducts for 30 min and are cooled by circulation of cold C 0 2 at
a pressure of 15 kg/cm2. However, this period of 30 min could be con
siderably reduced, since the time actually required to transport the ele
ments to the pond is only 6 min. Not infrequently we have put the elements
in containers and sent them straight to the pond immediately after their
extraction from the reactor.
J. TERPSTRA: I should like to know, firstly, what special consider
ations led you to adopt the type of structure employed in the G 2 and G3
reactors.
F . CONTE: The principal advantage of the horizontal channels lies in
the greater ease of charging and discharging fuel, for the two operations
can be carried out simultaneously. Nevertheless, I ought perhaps to make
it clear that our choice would not necessarily be the same if we were to
build these reactors again today.
J. T E R PSTR A : Thank you. If I may turn to another question, how
much gas leaks out during loading and unloading?
F. CONTE : At the normal rate of fuel discharge we lose about 3 t/d,
whereas the loss of gas due to loading varies from 500 to 800 kg/d.
J. TERPSTR A : Lastly, is there any leakage of gas from one channel
to another during the operation of these reactors?
F. CONTE: No. The horizontal structure of the graphite beds leaves
no play between the bricks, and consequently gives no leakage of gas between
the channels. !

IN TÉR ÊT DE L 'E X P É R IE N C E NEUTRONIQUE ACQUISE A MARCOULE E T A CHINON
POUR L E PROGRAMME DE CEN TRALE A GRAPHITE
P. BACHER, M . SAGOT, P. TANGUY ET A. TESTE DU BAILLER CENTRE D ’ÉTUDES NUCLÉAIRES DE SACLAY, FRANCE
Abstract — Résumé — Аннотация — Resumen
EXPERIENCE IN NEUTRON PHYSICS ACQUIRED AT MARCOULE AND CHINON: ITS VALUE FOR THE
GRAPHITE-REACTOR PROGRAMME. The entry into service of the first French power reactor - Gl, G2 and
G3 at Marcoule and EDF1 at Chinon - has provided fundamental experience for the further development of
this reactor type. This experience has accrued both from start-up tests and from power operation.
The most important start-up tests consisted of : (a) Progressive replacement experiments, which made
it possible to perfect the methods of calculation for G2 and EDF1; and (b) Fixed absorber and control rod-tests.
Through the operation of G2 and G3, a better adjustment of the reactivity balance under power has been
achieved, taking into account effects of temperature and xenon poisoning. Similarly, experiments carried
out with the reactors during operation under power have made it possible to check the validity of the kinetic
models used to study transient phenomena in this type of reactor.
The experience acquired with the first French graphite reactors - though it still has to be completed by
measurements of a more basic and systematic kind on assemblies specially designed for the purpose, such
as MARIUS and CESAR - has thus proved to be of extreme value both for future projects and for studies on the
operation of large power stations, where problems of control and kinetics are especially important.
INTÉRÊT DE L'EXPÉRIENCE NEUTRONIQUE ACQUISE A MARCOULE ET A CHINON POUR LE PROGRAMME
DES CENTRALES A GRAPHITE. La mise en service des premières piles de puissance françaises (G1,G2,G3 à
Marcoule, EDF1 à Chinon) a permis d’acquérir une expérience fondamentale pour la poursuite de la filière,
tant par les essais de démarrage proprement dits que par le fonctionnement en puissance.
P armi les essais de démarrage, les plus importants ont été a) les expériences de remplacement progressif,
qui ont permis de mettre au point les méthodes de calcul pour G2 et EDF1; b) lés essais d'absorbants fixes et
de barres de contrôle.
Le fonctionnement de G2 et G3 a permis un recalage du bilan de réactivité en puissance (effets de
température et de xénon). Des expériences effectuées sur les piles en puissance ont également permis de
vérifier les modèles cinétiques utilisés pour l'étude des phénomènes transitoires dans ce type de pile.
L'expérience acquise dans les premières piles à graphite françaises, bien qu'elle doive être complétée
par des mesures plus fondamentales et plus systématiques dans des ensembles spécialement conçus à cet effet
(MARIUS, CÉSAR), s'est donc avérée fondamentale aussi bien dans l'élaboration des projets ultérieurs que
pour l'étude du fonctionnement de centrales de grande puissance où les problèmes de contrôle et de cinétique
jouent un rôle primordial.
ЗНАЧЕНИЕ НАКОПЛЕННОГО В МАРКУЛЕ И ШИНОНЕ ОПЫТА РАБОТЫ С НЕЙТРОНАМИ ДЛЯ ПРОГРАММЫ ЭЛЕКТРО
СТАНЦИЙ С ГРАФИТОВЫМИ РЕАКТОРАМИ. Эксплуатация первых французских энергетических реакторов (0 1 ,
G2, G3 в Маркуле, EDF1 в Шиноне) позволила приобрести основной опыт для дальнейшей разработки
реакторов этого типа как в процессе пусковых испытаний, так и в процессе работы реакторов на
полной мощности.
Среди опытов с пуском наиболее важными оказались а) опыты по прогрессивной замене тепло
выделяющих элементов, которые дали возможность разработать методы расчета для 02 и EDP1, и
б) опыты с неподвижными поглотителями и управляющими стержнями.
Работа реакторов G2 и G3 позволила составить баланс потенциальной реактивности (воздействие
температуры и ксенона). Проведенные на энергетических реакторах опыты позволили также выверить
кинетические модели, использованные для исследования переходных явлений в этом типе реактора.
Опыт, приобретенный на первых французских графитовых реакторах, хотя его и следует дополнить
путем более фундаментальных и систематических измерений на специально созданных для этого уста
515

516 P. BACHER et al.
новках (MARIUS, CESAR), оказался, тем не менее, существенным как в разработке последующих проектов,
так и для изучения работы электростанций большой мощности, где проблемы контроля и кинетики игра
ют первостепенную роль.
INTERÉS DE LA EXPERIENCIA NEUTRÓNICA ADQUIRIDA EN MARCOULE Y EN CHINON PARA EL PRO
GRAMA DE CENTRALES DE GRAFITO. La puesta en marcha de los primeros reactores de potencia franceses
(Gl, G2 y G3 de Marcoule, EDF1 de Chinon) permitió adquirir una experiencia fundamental para la pro
secución del desarrollo de este concepto, tanto por los ensayos de puesta en marcha propiamente dichos como
por el funcionamiento en régimen normal.
Los principales ensayos de puesta en marcha fueron: a) los experimentos de sustitución progresiva, que
han permitido poner a punto los métodos de cálculo para los reactores G2 y EDF1 ; b) los ensayos de absorbedores
fijos y de barras de control.
El funcionamiento de los reactores G2 y G3 ha permitido establecer con más precisión el balance de
reactividad en régimen normal (efectos de la temperatura y del xenón). Además, experimentos realizados con
los reactores en marcha han permitido verificar los modelos cinéticos empleados para el estudio de los fenó
menos transitorios en los reactores de ese tipo.
La experiencia adquirida con los primeros reactores de grafito franceses, aunque falte todavía com
pletarla con mediciones más fundamentales y sistemáticas en conjuntos especialmento concebidos a este efecto
(MARIUS, CESAR), ha demostrado su importancia capital tanto para la elaboración de los proyectos ulteriores
como para estudiar el funcionamiento de centrales de gran potencia en las que los problemas de control y de
cinética desempeñan un papel primordial.
INTRODUCTION
Les expériences de neutronique effectuées soit au démarrage, soit au
cours du fonctionnement d'une pile de puissance ont comme objectif premier
d'améliorer la connaissance de l'installation proprement dite: réserve de
réactivité, distribution des sources de chaleur dans différentes configurations
du fonctionnement, anti-réactivité des barres de contrôle, comportement
cinétique, etc.
U serait cependant très long, dispendieux, et au demeurant aléatoire,
de prétendre étudier expérimentalement tous les aspects neutroniques du
fonctionnement d'une telle installation. On cherchera donc au cours de ces
essais à vérifier, parfois à corriger, les méthodes de calcul couramment
utilisées. Il sera ainsi possible, à partir d'un nombre limité d'essais, de
prévoir d'une façon très générale le comportement de l'installation.
Les connaissances ainsi acquises peuvent, dans une certaine mesure,
être utiles pour les études générales sur l'ensemble de la filière: nous en
verrons des exemples avec les mesures de pression critique dans G2 ou G3,
d'aplatissement radial du flux dans les piles de Marcoule et dans ED F1 ,
d'efficacité de barres de contrôle et de déformations du flux dans EDF1, et
également dans un autre ordre d'idées avec les expériences, liées à la sûre
té, de baisse ou d'arrêt de débit.
Il est cependant possible d'effectuer, à l'occasion de la mise en service
de grandes installations, des expériences dans le but spécifique d'améliorer
les connaissances générales. On peut citer en particulier: les expériences
de remplacement progressif effectuées pour la première fois dans Gl en
1956, et reprises en 1958 dans G2; les mesures d'indice de spectre ( 239pu,
235U, Lu, Mn) effectuées à 40 et 160°C dans EDF1 en avril de cette année;
les expériences de perturbation de la puissance effectuées dans G2 et G3 à
divers niveaux d'irradiation pour vérifier les modèles cinétiques utilisés
dans les études d'instabilité spatiales des grandes centrales.

CENTRALE A GRAPHITE 517
Enfin, le fonctionnement proprement dit de l'installation apporte des
renseignements très importants pour les études de projet, en particulier
en ce qui concerne l'évolution de la réactivité. C'est ainsi qu'on a pu véri
fier, sur G3,les méthodes de calcul utilisées grace à l'évolution globale de
la réactivité de la pile. D'autre part, il est possible d'étudier l'évolution
des propriétés neutroniques du combustible en combinant l'oscillation et
l'analyse chimique d'échantillons irradiés.
Nous nous proposons de rappeler, dans cette communication, les prin
cipaux résultats qui ont été obtenus d'une manière ou d'une autre, grâce
aux piles de Marcoule et aux premiers essais dans EDFl, et qui présentent
un intérêt significatif pour les études générales sur la filière graphite-
uranium naturel. La plupart de ces résultats figurent déjà dans des publi
cations diverses: nous ne citons en bibliographie que les principales. Ils
sont l'aboutissement d'un effort collectif des différents départements et
services du Commissariat à l'énergie atomique, et en ce qui concerne EDFl,
d'Electricité de France. ^
I. PR OPR IÉ TÉ S N EU TR ON IQ U ES DE RÉ SEA U X A FR OID
Les premières informations recueillies sur une nouvelle installation sont
en général: a) le chargement critique, b) la pression d'air critique pour
le chargement complet. Dans G2 et G3, il a été possible de compléter ces
données par la mesure de la pression critique pour plusieurs chargements intermédiaires, et par la mesure du laplacien par carte de flux pour plu
sieurs chargements.
Les réseaux de G2 et G3 étant uniformes, on a pu déduire de cet en
semble d'expériences,à la fois,k«, et l'aire de migration radiale. Les ré
sultats obtenus, comparés aux valeurs calculées, sont rassemblés dans le
tableau I.
TABLEAU I
COM PARAISON DES RÉSULTATS OBTENUS AVEC LES
VALEURS CALCULÉES
PasDiamètre
du canal
(mm)
BarreauMT (cm2)
(mm) (e : mm) Exp. Calcule - &cp. Calculé
G2 200 70 28 1. 0868
± 0.001
1,0860 757
± 30
744,5
G3 200 70 28 1. 0886
i 0,001
1.0860 696
■t 30
744.5
L'accord est excellent sur k œ, et il semble que les valeurs calculées
de Mf soient à l'intérieur des incertitudes expérimentales. Ce dernier point
est particulièrement important, car l'ensemble du programme expérimentai

518 P. BACHER et al.
sur lequel reposent nos méthodes de calcul est basé sur les mesures de laplacien et de remplacement progressif effectuées sur de petites piles
(MARIUS). Il est nécessaire de connaître Mj2 pour passer des»laplaciens
mesurés aux k„, qui sont les quantités intéressantes pour l'établissement
d'un formulaire et pour les calculs de pile.
C'est dans Gl qu'ont été effectuées les premières expériences de rem
placement progressif. Le réseau de Gl est constitué d'un pas carré de
200 mm, un canal de 70 m m de diamètre et un combustible de 26 m m de
diamètre. Les expériences de remplacement ont porté sur des combustibles
de 28 et 32 m m de diamètre, et ont mis en évidence que le maximum de
laplacien se situait pour un barreau de diamètre voisin de 30 mm, et non
de 26 m m comme on le croyait jusqu'alors. Ce résultat devait être immé
diatement exploité dans le projet en cours de G2, dans lequel on a utilisé
successivement des éléments de 28 puis de 31 m m de diamètre.
Deux ans plus tard, en 1958, les expériences de remplacement furent
reprises dans G2. En un mois d'essais, une dizaine de combustibles furent
testés, en particulier des tubes dont le plus grand (20X 40) devait être pra
tiquement adopté pour EDF2. Ainsi, près de deux ans avant de disposer de
l'empilement critique MARIUS, les neutroniciens avaient pu confirmer que
l'emploi dé tubes ne serait pas trop défavorable dans les projets de piles
de puissance, et mettre au point une méthode de calcul pour ces projets
étayée par des expériences. De plus, l'expérience acquise confirmait l'inté
rêt de la méthode de remplacement progressif, permettant ainsi de décider
la construction d'un empilement critique dont l'emploi reposait sur cette
méthode.
II. PR OPR IÉ TÉ S N EU TRON IQU ES DES R É SEAU X A C H A U D E T A U
COURS DE L 'É V O L U T IO N
¡Le moyen le plus direct d'obtenir des informations sur l'évolution de
la réactivité est de la mesurer dans une pile de puissance. En pratique,
au fur et à mesure que la réactivité croît pendant les premiers mois d'ir
radiation d'une charge neuve, on est amené à compenser cette réactivité
à l'aide soit d'absorbants, soit de barres de compensation. On peut en dé
duire la variation de réactivité si on a pu mesurer au préalable l'efficacité
des absorbants ou des barres de compensation, ou si on estime pouvoir se
fier au calcul..
Un bon exemple est fourni par le début de l'évolution d'une charge de
G3, pendant laquelle aucun déchargement de combustible ne s'est produit.
La réactivité était compensée dans une limite de 400 pcm environ par des
barres de contrôle, puis on chargeait, sans arrêter la pile, suffisamment de canaux de fer pour sortir les barres de contrôle du cœur. On peut alors
reconstituer (fig. 1) la courbe d'évolution de la réactivité. On a également
porté sur la figure 1, àtitre indicatif, la courbe calculée.
L'excellent accord trouvé entre le fonctionnement réel de G3 et les
prévisions n'est cependant pas suffisant pour confirmer la validité des hypo
thèses de calcul; d'une part, parce que l'incertitude sur la courbe expéri
mentale est très grande et, d'autre part, parce que la courbe calculée dé
pend de nombreux facteurs et qu’il peut très bien y avoir compensation entre
plusieurs erreurs. Il est donc indispensable d'analyser plus en détails les

CENTRALE A GRAPHITE 519
Figure 1
Evolution de la réactivité dans G3.
phénomènes. Les piles de puissance peuvent là encore nous fournir des
éléments utiles.
On sait que l'évolution de la réactivité dépend essentiellement: a) des
sections efficaces effectives des différents isotopes du plutonium, et au
premier chef du 239 Pu, b) du facteur de conversion initiale.
D'une façon générale, on cherche à calculer les premières à l'aide
d'un modèle de thermalisation qui représente convenablement le spectre
de neutrons dans la zone proche épithermique (0, 1 à 1 eV), zone très im
portante tant pour le 239Pu que pour le 240 Pu. On cherche alors des mé
thodes expérimentales fournissant les sections efficaces effectives des iso
topes du plutonium dans quelques cas (avec des spectres et des températures
différentes) afin de contrôler la validité du modèle utilisé.
Une première méthode consiste à irradier des détecteurs de nature
diverse, sensibles plus particulièrement à telle ou telle région du spectre,
Pu, U, Lu, Mn, etc. De telles mesures nécessitent pour la plupart des
flux intégrés élevés (~ 1012n/cm2). Si elles sont faites depuis plus d'un an de
façon systématique à froid dans l'empilement critique MARIUS, elles ont
pu être faites à chaud (40 et 160° C) pour la première fois lors des essais
à l'air d 'EDFl au mois d'avril dernier. Signalons également que des me
sures de facteur de conversion ont été faites dans E D F 1.
Une deuxième méthode consiste à étudier en détail les propriétés d'échan
tillons de combustibles irradiés dans les piles: a) par oscillation dans des
conditions bien déterminées. L'échantillon est comparé à un étalon de même
géométrie et le tout se fait au sein d'un réseau dont le spectre est voisin du
spectre dans lequel a été irradié l'échantillon; b) par analyse de la compo
sition chimique et isotopique.

520 P. BACHER et al.
L'oscillation se fait suivant une technique qui commence à être classique
et qui consiste à mesurer simultanément deux signaux: un signal global
pratiquement proportionnel à la différence des facteurs r) entre l'échantillon
et l'étalon et un signal local proportionnel à la différence des absorptions
entre les deux écnantillons. On peut donc en déduire l'effet de l'irradiation
sur E a et iÆf.
L'analyse chimique des mêmes échantillons permet alors une corré
lation détaillée et un contrôle des mesures ainsi effectuées. Mais elle peut
déjà, seule, apporter des renseignements précieux. On sait que, tant que
l'irradiation est assez faible, on peut exprimer la formation des isotopes
successifs du plutonium de façon simple en fonction de l'appauvrissement
en uranium 235. Si on pose:
La mesure directe de la composition isotopique permet donc (moyennant, en pratique, le calcul de quelques corrections d'ordre supérieur) de déduire
les rapport &8 /d5 (c'est-à-dire le facteur de conversion initial au facteur
l + a 5 près), &c9/& 5 et d0 /d5.
De telles analyses sont en cours à Saclay depuis bientôt deux ans sur
des combustibles provenant de G2 et G3. Les premiers échantillons oscillés
l'ont été dans MARIUS pendant l'été 1962. D'autres suivront dans quelques
semaines. D'autre part, une quarantaine d'échantillons ont été placés dans
EDF1 où ils seront irradiés dans les conditions de spectre et de température
bien définies. Ils ont été oscillés dans MARIUS avant d'être mis en pile,
et seront oscillés après irradiation dans MARIUS, puis à chaud dans l'em
pilement critique CÉSAR qui sera mis en service en 1964.
On sait que le bilan neutronique de ce type de pile est assez tendu, mais
que l'évolution d'abord positive de la réactivité améliore sensiblement les
choses. Suivant la forme précise de la courbe dans sa branche descendante,
et suivant l'irradiation que l'on peut espérer du fait des propriétés métal
lurgiques du combustible, on devra prévoir une réserve de réactivité plus
ou moins grande dans l'état initial. Par exemple, si on vise une irradiation
moyenne de rejet de 5000 MWj/t au lieu de 4000 MWj/t, on sera conduit
à prévoir un cœur plus grand d'environ 10% et une charge d'uranium supé
rieure de 5 à 7%. Les mêmes précautions seront nécessaires si on vise
239pu _ СТя 238 U " ff- X
D
on a:
240Pu _ ôg_ Ôç9 x2
238 u = &5 &5 2
241 Pu &8 &c9 ÔQ x3 238 u &5 CT5 Ô5 6

CENTRALE A GRAPHITE 521
une irradiation donnée, par exemple 4000 MWj/t, mais que l'incertitude
sur la réactivité à cette irradiation est de l'ordre de 500 pcm.
La connaissance précise des propriétés neutroniques des piles à
graphite-uranium naturel apparaît donc comme fondamentale pour les études
de projet. Les quelques exemples que nous avons donnés ici montrent claire
ment qu'il est possible, voire indispensable, d'utiliser les piles de puissance
elles-mêmes pour acquérir cette connaissance.
III. É T U D E DES F L U X . ABSOR BAN TS E T BAR RES DE C O N T R O L E
Deux modes d'aplatissement radial du flux sont actuellement utilisés
dans les piles de puissance à graphite en fonctionnement ou en projet: l'apla
tissement obtenu à l'aide d'absorbants (cartouches de fer ou cartouches
destinées à la production de radio-éléments) et l'aplatissement obtenu en
faisant varier le pas du réseau.
ÎT ■I UNITES ARBITRAIRES
Figure 2
Distribution radiale du flux dam G3 (17.3.61 - 198 MW)
La première méthode est a priori plus simple car elle ne modifie que
très peu le spectre et il est relativement aisé d'adapter l'efficacité ou la
répartition des absorbants pour obtenir et conserver un aplatissement satis
faisant. Cette-méthode est utilisée dans les trois piles de Marcoule avec
succès. On constate sur la figure 2 que le flux radial de G3 est constant
à quelques pour cent près dans une zone de rayon 220 cm, alors que le rayon
du cœur est de 391 cm.
Les neutroniciens ont cependant attiré depuis longtemps l'attention sur
le fait qu'il serait plus rentable, du point de vue bilan neutronique, d'absor
ber les neutrons excédentaires de la zone centrale d'une pile dans les ré
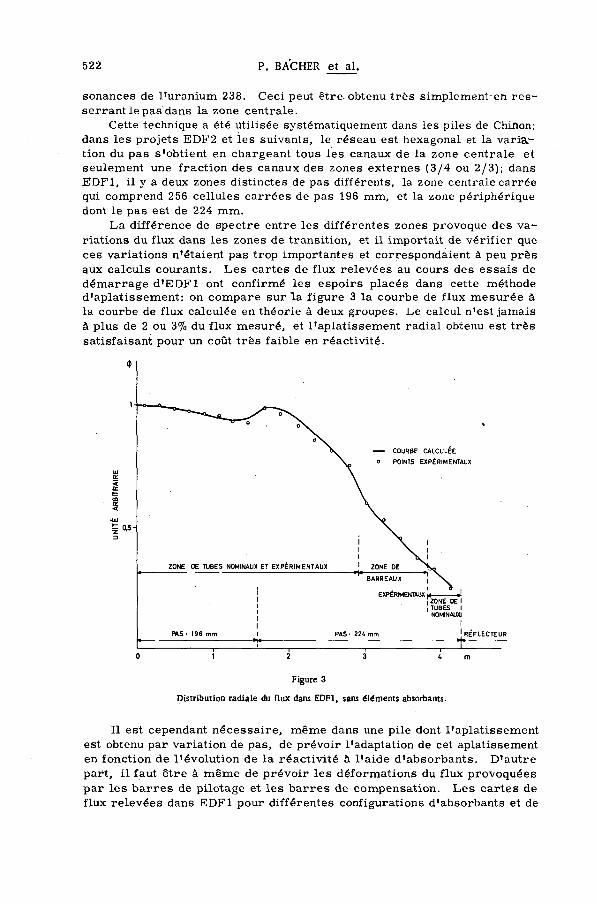
522 P. BACHER et al.
sonances de l'uranium 238. Ceci peut être-obtenu très simplement en res
serrant le pas dans la zone centrale.
Cette technique a été Utilisée systématiquement dans les piles de Chinon;
dans les projets EDF2 et les suivants, le réseau est hexagonal et la variai
tion du pas s'obtient en chargeant tous les canaux de la zone centrale et
seulement une fraction des canaux des zones externes (3/4 ou 2/3); dans
EDFl, il y a deux zones distinctes de pas différents, la zone centrale carrée
qui comprend 256 cellules carrées de pas 196 mm, et la zone périphérique
dont le pas est de 224 mm.
La différence de spectre entre les différentes zones provoque des va
riations du flux dans les zones de transition, et il importait de vérifier que
ces variations n'étaient pas trop importantes et correspondaient à peu près
aux calculs courants. Les cartes de flux relevées au cours des essais de
démarrage d 'EDFl ont confirmé les espoirs placés dans cette méthode d'aplatissement: on compare sur la figure 3 la courbe de flux mesurée à
la courbe de flux calculée en théorie à deux groupes. Le calcul n'est jamais
à plus de 2 ou 3% du flux mesuré, et l'aplatissement radial obtenu est très
satisfaisant pour un coût très faible en réactivité.
Figure 3
Distribution radiale du flux dans EDFl, sans éléments absorbants.
Il est cependant nécessaire, même dans une pile dont l'aplatissement
est obtenu par variation de pas, de prévoir l'adaptation de cet aplatissement
en fonction de l’évolution de la réactivité à l'aide d'absorbants. D'autre
part, il faut être à même de prévoir les déformations du flux provoquées
par les barres de pilotage et les barres de compensation. Les cartes de
flux relevées dans EDFl pour différentes configurations d'absorbants et de
CENTRALE A GRAPHITE 523
barres de contrôle ont également permis de vérifier les méthodes de calcul
utilisées à Saclay: calcul à deux dimensions (X-Y) DAIXY, les canaux d'ab
sorbants étant remplacés par des longueurs d'extrapolation sur des fron
tières convenablement choisies. Il est donc possible de prévoir, par le
calcul, les emplacements satisfaisants pour le pilotage et la compensation
dans les projets futurs.
Enfin, on a intérêt dans un projet de pile de puissance à adapter
le mieux possible aux besoins le système de contrôle et de sécurité.
Les mesures précises d'efficacité de barres de contrôle isolées, et
de l'ensemble des barres de contrôle, en fonction de leur enfoncement
dans le cœur d 'EDFl * permettront soit de confirmer, soit d'adapter les
méthodes de calcul mises au point grâce aux expériences effectuées dans
l'empilement critique MARIUS.
IV. C O M P O R T E M E N T CINÉTIQUE DES PILES A U R ANIUM N A T U R E L
E T GRAPH ITE
Les piles à graphite et uranium naturel sont caractérisées par leur
stabilité envers des perturbations de courte durée, en raison de leur coef
ficient de température d'uranium négatif, et leur instabilité envers des per
turbations prolongées, en raison du coefficient de température du modéra
teur qui devient très rapidement positif dès qu'un peu de plutonium s'est
formé.
La stabilité «prompte» de ces piles peut jouer un rôle primordial en
cas d'accident brutal, soit d'arrêt de soufflage, soit de dépressurisation,
et il importe de vérifier dans la mesure du possible les modèles cinétiques
utilisés pour l'étude de ces accidents. Des expériences d'arrêt de soufflage
ont été effectuées dans les piles G2 et G3, avec ou sans chute de barre de
sécurité.
L'instabilité à long terme de ces piles n'a guère d'importance dans les
piles de petites dimensions, telles que G2 ou EDF1. Par contre, elle peut
se traduire dans les piles dont les dimensions et la puissance spécifique
sont élevées par des oscillations spatiales du flux, et même dans certains
cas par des instabilités divergentes. Il importe alors de prévoir un système
de pilotage particulier pour combattre ce phénomène. C'est ainsi que dans
EDF2, la pile est divisée en sept régions (une centrale et six périphériques),
et que dans chacune de ces régions on dispose de deux ou trois barres de
pilotage spatial dont les mouvements sont commandés par les variations
de la température moyenne du gaz de refroidissement.
L'étude de ce système de pilotage assez complexe nécessite une con
naissance approfondie du comportement cinétique de la pile et, en particulier,
des coefficients d'échange moyens entre le modérateur et le gaz, des va
riations de température du modérateur et des conséquences de ces variations
sur la réactivité de la pile.
* Les étalonnages de barres de contrôle effectués dans les piles de Marcoule n'ont guère permis de vé
rifier les méthodes de calculs, car les barres sont perpendiculaires aux canaux, et que l'ensemble nepeutêtre
calculé que par des méthodes très grossières.
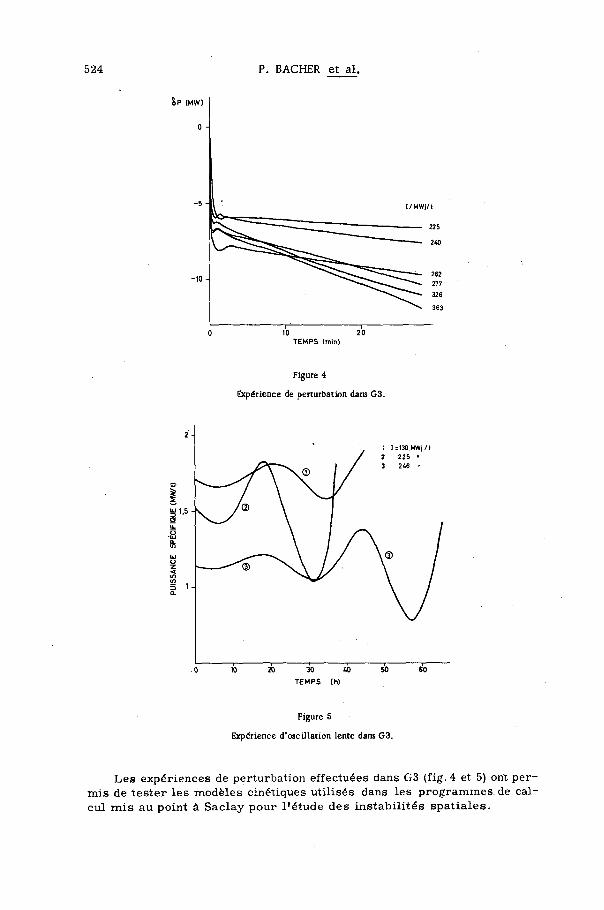
PUIS
SANC
E SP
ÉCIF
IQUE
(M
W/t
)
524 P. BACHER et al.
Figure 4
Expérience de perturbation dans G3.
Figure 5
Expérience d'oscillation lente dans G3.
Les expériences de perturbation effectuées dans G3 (fig. 4 et 5) ont per
mis de tester les modèles cinétiques utilisés dans les programmes.de cal
cul mis au point à Saclay pour l'étude des instabilités spatiales.

CENTRALE A GRAPHITE 525
L'expérience acquise au cours des essais de démarrage et au cours
du fonctionnement des premières piles de puissance françaises a joué un
rôle très important pour les études de projet de la filière uranium-graphite.
Elle a permis en particulier d'orienter la filière vers l'emploi de tubes
de dimensions importantes, de tenir compte de l'évolution de la réactivité
sans risquer d'erreurs catastrophiques, d'adapter au mieux les systèmes de
contrôle et de pilotage, y compris le pilotage spatial.
On attend encore beaucoup dans l'avenir de l'expérience que pourront
fournir les piles de Marcoule et les piles de Chinon, grâce en particulier
aux irradiations d'éléments combustibles qui serviront aux analyses isoto
piques et aux oscillations.
Cette expérience est cependant acquise dans un domaine assez étroit,
et dans des conditions qui ne sont pas toujours parfaitement définies. Il
est donc essentiel de Да compléter par des expériences systématiques: études
de réseaux avec et sans plutonium, mesures d'indices de spectre, oscillations
de combustibles contenant du plutonium, le tout à diverses températures.
C'est le but assigné précisément aux empilements critiques MARIUS (pour
les expériences à froid) et CÉSAR (pour les expériences jusqu'à 500°C).
CONCLUSION
R É F É R E N C E S
[1] .Rapport collectif. Réacteur Gl, Rapport CEA 670 (1957).
[2] BACHER, P. et al. , Actes 2ème Conf. int. util. EAFP (ONU) 12 (1958) 666.
[3] BACHER, P. et COGNE, F ., Physics Experiments in Graphite Lattices, Rapport CEA 2157 (1962).
[4] TESTE DU BAI LLER, A ., Mesures physiques sur les réacteurs de Marcoule, Rapport CEA 2158 (1962).
[5] JANIN, R .,et TESTE DU BAILLER, A ., «Essais nucléaires au démarrage du réacteur EDFl», voir ces
Comptes rendus.
D I S C U S S I O N
C. A. PU R SEL : As you mentioned burn-ups of 4000-5000 MWd/t, I
should like to know exactly what form of fuel is to be used in the EDF
reactors.
P. TANGUY: The EDF fuel elements consist of natural uranium in the
form of a metal alloy containing a small amount of molybdenum (about 1 wt. %).
The tubes, clad in an alloy of magnesium and a small quantity of zirconium,
are cooled solely from without.
K. EFFA T : I should like to know whether your experiments were per
formed under normal operating conditions or whether they required special
adjustments of the reactor parameters. To what extent did the experiments
interfere with normal operation of the reactors at power?
P. TANGUY: The nuclear tests carried out at the start-up of G2, G3
and EDF 1 did not delay the entry into service of these reactors. The phy
sicists' experiments were conducted during the time available between the
mechanical and dynamic tests, and while work on the non-nuclear plant com
ponents was being completed.

5 2 6 P. BACHER et al.
After start-up, the time allotted to the physicists for nuclear experi
ments was far more strictly limited. In the case of G2 and G3 certain definite
periods were set aside for what were essentially kinetic experiments, during
which time it was possible to vary parameters such as power, gas flow,
control-rod position, inlet gas temperature and so forth; but always on con
dition that the total loss of power should not exceed a specific predetermined
limit.
Finally, we have taken advantage of a number of shutdown periods to
perform control-rod calibrations, requesting the operators to keep the
graphite temperature as nearly as possible at a constant level.

I A E A S A L E S A G E N T S
ARGENTINA
Editorial Sudamericana, S.A.
Alsina 500
Buenos Aires
AUSTRALIA
R .W . Barclay
90, Queen Street
Melbourne
AUSTRIA
Georg Fromme & Co.
Spengergasse 39
Vienna V
BELGIUM
Office International de Librairie
30, avenue Marnix
Brussels 5
BRAZIL
Livraria Kosmos Editora
Rua do Rosario, 135-137
Rio de Janeiro
Agencia Expoente Oscar M . Silva
Rua Xavier de Toledo, 140-1° Andar
(Caixa Postal № 5.614)
S3o Paulo
BURMA
See under India
BYELORUSSIAN SOVIET SOCIALIST REPUBLIC
See under USSR
CANADA
The Queen's Printer
Ottawa
CEYLON
See under India
CHINA (Taiwan)
Books and Scientific Supplies
Service, Ltd.,
P .O . Box 83
Taipei
DENMARK
Ejnar Munksgaard Ltd.
6 Norregade
Copenhagen К
ETHIOPIA
G.P. Giannopoulos
International Press Agency
P.O. Box 120
Addis Ababa
FINLAND
Akateeminen Kirjakauppa
Keskuskatu 2
Helsinki
FRANCE and FRENCH UNION
Office International de
Documentation et Librairie
48, Rue Gay-Lussac
Paris, 5e
GERMANY, Federal Republic of
R. Oldenbourg
Rosenheimer Strasse 145
Munich 8
ICELAND
Halldór Jónsson
Mjóstraeti 2
Reykjavik
INDIA
Orient Longmans Ltd.
17, Chittaranjan Ave.
Calcutta 13
ISRAEL
Heiliger and Co.
3 Nathan Strauss Street
Jerusalem
ITALY
Agenzia Editoriale Intemazionale
Organizzazioni Universali
(A .E .I .O .U .)
Via Meravigli 16
Milan
JAPAN
Maruzen Company Ltd.
6, Tori Nichome
Nihonbashi
P.O. Box 605
Tokyo Central
KOREA, Republic of
The Eul-Yoo Publishing Co.
5,2-ka Chong-ro
Seoul
MEXICO
Librería Internacional
Av. Sonora 206
Mexico 11, D.F.
MONACO
The British Library
30, bd des Moulins
Monte Carlo
MOROCCO
Centre de diffusion documentaire
du B .E .P .I.
8, rue Michaux-Bellaire
(B.P. N” 211)
Rabat
NEPAL
See under India
NETHERLANDS
N .V . Martinus Nijhoff
Lange Voorhout 9
The Hague
NEW ZEALAND
Whitcombe & Tombs, Ltd.
G .P .O . Box 1894
Wellington, C .l
NORWAY
Johan Grundt Tanum
Karl Johans gate 43
Oslo
PAKISTAN
Karachi Education Society
Haroon Chambers
South Napier Road
P. O. Box No. 4866
Karachi, 2
PARAGUAY
Agencia de Librerías
de Salvador Nizza
Calle Pte. Franco No. 39-43
Assunciân
PERU
Livrerfa Internacional de Perd S. A.
Boza 879
(Casilla 1417)
Lima
PHILIPPINES
The Modem Book Company
508 Rizal Avenue
Manila
POLAND
Oírodek Rozpowszechniana
Wydawnistw Naùkowych
Polska Akademia Nauk
Palac Kultury i Nauki
Warsaw
PORTUGAL
Livraria Rodrigues
186, Rua do Ouro, 188
Lisbon 2
SOUTH AFRICA
Van Schaik's Bookstore (Pty) Ltd.
Libri Building
Church St.
(P.O. Box 724)
Pretoria
SPAIN
Librerfa Bosch
Ronda Universidad, 11
Barcelona
SWEDEN
C.E. Fritzes Kungl. Hovbokhandel
Fredsgatan 2
Stockholm 16
SWITZERLAND
Librairie Payot
40, rue du Marché
Geneva
SYRIA
Georges N. Coussa
Imm. Chanan
rue Khan el- Harir
(B.P. 779)
Aleppo
TURKEY
Librairie Hachette
469, Istiklal Caddesi
Beyoglu, Istanbul
UKRAINIAN SOVIET SOCIALIST REPUBLIC
See under USSR
UNION OF SOVIET SOCIALIST REPUBLICS
Mezhdunarodnaya Kniga
Smolenskaya-Sennaya 32-34
Moscow G- 200
UNITED KINGDOM OF GREAT BRITAIN
AND NORTHERN IRELAND
Her Majesty's Stationery Office
P.O. Box 569
London, S.E.l
UNITED STATES OF AMERICA
National Agency for
International Publications. Inc.
317-23 East 34th St
New York 16, N .Y .
VENEZUELA
Sr. Braulio Gabriel Chacares
Gobernador a Candilito 37
Santa Rosalia
Apartado Postal 8092
Caracas D.F .
YUGOSLAVIA
Jugoslovenska Knjiga
Terazije 27
Belgrade
IAEA publications can also be purchased retail at the United Nations Bookshop at United Nations
Headquarters, New York, at the news-stand at the Agency’s Headquarters, Vienna, and at most
conferences, symposia and seminars organized by the Agency.
Orders and inquiries from countries where sales agents have not yet been appointed may be sent to:
Distribution and Sales Unit, International Atomic Energy Agency,
Kámtner Ring, Vienna I, Austria


IN T E R N A T IO N A L A T O M IC EN ER G Y A G E N C Y V IE N N A , 1963
PRICE: N o rth A m e rica : US $10.00 Elsew here: Sch 210,- (óOs.stfi; F .fr.40,-; DM 35 ,-)
Copyright © 2022 FDOKUMEN