Microwave Initiated Atomic Spectra from Select Atomic Species
10
Microwave Initiated Atomic Spectra from Select Atomic Species Amand Anand, James Roberts Department of Physics, University of North Texas, Denton, TX 76203 Richard Croley Office of Research and Technical Transfer, University of North Texas, Denton, TX 76203, Jai N. Dahiya Southeast Missouri State University, Cape Girardeau, MO Received: March 6, 2009 Accepted: December 5, 2009 ABSTRACT Isotopes of gaseous Helium ( 3 He and 4 He) were admitted into the vacuum system at various pressures and allowed to stabilize. Quantum states were then energized using a 2.45 GHz magnetron coupled to the gases by loose coupling. A residual gas analyzer Model 100 series manufactured by Stanford Research Systems was used to determine the mass of each species. An Ocean Optics Optical Spectrometer model collecting the light via an optic probe was used to obtain the spectra and to characterize the spectroscopic peaks. The data collected from these isotopes represent characteristic spectral emission lines generated due to the transitions among discrete quantum energy levels. The data analysis, especially for atomic spectroscopy, becomes an extremely important tool in developing an understanding of the quantum levels active within each atom. In this paper is presented a summary of the analysis of work that was done on two isotopes of helium. Data using both computational as well as theoretical techniques are presented. Traditional high voltage arc discharge data were taken for the gas species and these are compared with microwave stimulated atomic emissions. KEYWORDS: Microwaves, Spectra, Spectral line shapes, Atomic Structure INTRODUCTION The application of microwaves in studying the molecular spectra of various elements is a powerful tool. [Townes and Schawlow, 1955; Kroto, 1992; Brown and Carrington, 2003]. The utility of microwave probing the molecular excitations in atmospheric gases has been studied with precise novelty. [Woskov et al.,1999] The techniques described in [Woskov et al., 1999; Woskov et al., 1990; Woskov et al., 1996] are very interesting methods for developing high resolution monitoring devices to detect metal toxin clusters dispersed in atmospheric pollution. Microwave enhanced plasma techniques for heating have been used to detect metals like lead, arsenic, mercury and chromium emissions from manufacturing and waste processing. [Woskov et al., 1990] This technique has become an important tool in the field of environmental science, as well. The application of this technique has been explained in detail by Woskov [Woskov et al., 1990] Microwave induced plasma instruments have been used very effectively by Siemens, Journal of Microwave Power and Electromagnetic Energy, 44 (3), 2010, pp. 153-162 A Publication of the International Microwave Power Institute International Microwave Power Institute 153
-
Upload
independent -
Category
Documents
-
view
1 -
download
0
Transcript of Microwave Initiated Atomic Spectra from Select Atomic Species

Microwave Initiated Atomic Spectra from Select Atomic SpeciesAmand Anand, James RobertsDepartment of Physics, University of North Texas, Denton, TX 76203
Richard CroleyOffice of Research and Technical Transfer, University of North Texas, Denton, TX 76203,
Jai N. DahiyaSoutheast Missouri State University, Cape Girardeau, MO
Received: March 6, 2009Accepted: December 5, 2009
ABSTRACT Isotopes of gaseous Helium (3He and 4He) were admitted into the vacuum system at various pressures and allowed to stabilize. Quantum states were then energized using a 2.45 GHz magnetron coupled to the gases by loose coupling. A residual gas analyzer Model 100 series manufactured by Stanford Research Systems was used to determine the mass of each species. An Ocean Optics Optical Spectrometer model collecting the light via an optic probe was used to obtain the spectra and to characterize the spectroscopic peaks. The data collected from these isotopes represent characteristic spectral emission lines generated due to the transitions among discrete quantum energy levels. The data analysis, especially for atomic spectroscopy, becomes an extremely important tool in developing an understanding of the quantum levels active within each atom. In this paper is presented a summary of the analysis of work that was done on two isotopes of helium. Data using both computational as well as theoretical techniques are presented. Traditional high voltage arc discharge data were taken for the gas species and these are compared with microwave stimulated atomic emissions.
KEYWORDS: Microwaves, Spectra, Spectral line shapes, Atomic Structure
INTRODUCTION The application of microwaves in studying the molecular spectra of various elements is a powerful tool. [Townes and Schawlow, 1955; Kroto, 1992; Brown and Carrington, 2003]. The utility of microwave probing the molecular excitations in atmospheric gases has been studied with precise novelty. [Woskov et al.,1999] The techniques described in [Woskov et al., 1999; Woskov et al., 1990; Woskov et al., 1996] are very interesting methods for developing high resolution monitoring devices to detect metal toxin clusters dispersed in atmospheric pollution. Microwave enhanced plasma techniques for heating have been used to detect metals like lead, arsenic, mercury and chromium emissions from manufacturing and waste processing. [Woskov et al., 1990] This technique has become an important tool in the field of environmental science, as well. The application of this technique has been explained in detail by Woskov [Woskov et al., 1990] Microwave induced plasma instruments have been used very effectively by Siemens,
Journal of Microwave Power and Electromagnetic Energy, 44 (3), 2010, pp. 153-162A Publication of the International Microwave Power Institute
International Microwave Power Institute 153
Aguillar [Siemens et al., 1995; Camuna-Aguilar et al., 1994]. Such instruments operate very effectively in a controlled environment in terms of plasma parameters using an argon or helium discharge gas. The instruments used in this experiment are also very sensitive and of high degree of accuracy for atomic analysis. The microwave enhanced rapid heating methodologies have been explored extensively by chemists as well as pharmacists for rapid synthesis of reactions using chemical intercalation techniques. Numerous industries have incorporated such techniques in developing applications for academia as well as organic chemists. [Microwave Synthesis http://www.milestonesrl.com/analytical/products/synthesis_main.html] The Helium atom was first identified as a component of the Sun by Jansen et al. [The Elements name and origin, www.bbc.co.uk/dna/h2g2/A3768816] through its spectral profile, and the name Helium was given to it as it was thought to be unique to the Sun’s spectrum. Helium is the simplest inert gas in the periodic table and offers some unusual spectra in that para- and ortho-helium can be identified with unique characteristics for each. The different isotopes of helium also show some different physical properties when the analysis of their spectra is made. In this work we have shown that two species of helium 3He and 4He show slightly different spectral content when the spectra are produced by high voltage arc discharge or microwave stimulated emission. The use of microwaves to stimulate the transitions appears to produce more efficient coupling to the atomic species with a highly robust spectral output. This is evidenced by the robust glow that comes from the gases when they are stimulated using a microwave source.
THEORETICAL ANALYSIS Several studies have been done in the past on analyzing the line shapes and width profiles to measure the effect of collision
broadening on the shapes of the spectral profiles. [Van Vleck et al., 1945; Netterfield et al., 1972; Zellner, 2008; Woskov et al., 1996]. Authors in [Van Vleck et al., 1945] have made an interesting comparison between the Debye and Lorentz theory to study the three common causes of the spectral line broadenings. Based upon the recipe of [Netterfield et al., 1972] which considers the Lorentz model of line broadening for a harmonic oscillator, we have employed a similar mathematical approach to analyze our experimental data for microwave excitations induced plasma in isotopic Helium to model its shape factors. It has not been possible in this work to determine the population level distribution of the excited gas molecules, as the experiments were performed only in a single dimensional plane along the line-of sight. In order to determine such radial distributions as well as the gas temperatures in the pre-plasma conditions experiments need to be performed along three major principle axis of the plasma column with respect to the plane of the collector optics. Ivanova [Ivanova et al., 1994] have established a better recipe for plasma diagnostics in a Helium Surface Wave sustained discharge. In our work which is a particular case as described before, we have experimentally collected data to measure the central frequency distribution between the two isotopes of Helium. Essentially in our work the ratios of average mean work done per energy flow in the incident radiation is given by:
(1)
This result remains the same for the two isotopes under investigation. Through this experimental study the possible information that can be extracted is the unique nature of absorption coefficients due to different relaxation times in the transient molecular species. These can be obtained through curve
154 Journal of Microwave Power and Electromagnetic Energy, 44 (3), 2010International Microwave Power Institute
Amand Anand et al., Microwave Initiated Atomic Spectra from Select Atomic Species

fitting of the peak intensities and widths using the expression:
(2)
Theoretical calculations were performed for the two isotopes of Helium using the modified Balmer formula that has been developed for the spectral lines of the Hydrogen atom. [http://scienceworld.wolfram.com/physics/RydbergConstant.html] In 3He and 4He isotopes there is a small change in the atomic mass of their nuclei, which has a direct effect on the spectral lines due to the mass change. The mass dependence for the Rydberg constant is given by [http://scienceworld.wolfram.com/physics/RydbergConstant.html] (3)
Where R is the Rydberg constant for any heavy hydrogen like atoms, ε0 is the permittivity of free space in vacuum, c is the speed of light in vacuum, ħ is the Planck’s constant in SI units, m is the mass of the electron in kilograms, M is the mass of the Nucleus in Kilograms, and e is the electron charge in coulombs. Eq. (3) was used to calculate the new values of the Rydberg constant due to the difference in the reduced mass of the two nuclei of 3He and 4He. The wavelengths of the spectral lines produced when the species makes a transition for m → n quantum levels is given by:
(4)
Where λvac is the wavelength of the emitted spectrum observed, R is the Rydberg constant as calculated by Eq. (3), Z is the atomic
Figure 1. Depiction of the transition states between various energy levels. In this study the initial energy states were obtained for transitions for 2 →1, 3 →2, 3 →1…14 →1… 14 →13 transitions.
number of the Nuclei, n1 and n2 are the n and m respective quantum energy states for transitions as shown in Figure 1. A series of transitions was generated using Eqs. 3 and 4 to calculate for both 3He and 4He. The results are shown in Tables I and II for 3He and 4He, respectively.
DATA COLLECTION AND ANALYSIS Optical spectra were obtained using an Ocean Optics Model USB 4000 spectrometer to gather the data over a range of wavelengths 381.9607 nm through 728.135 nm. These signatures were analyzed using the standard Lorentian shape for spectral lines, and these experimentally produced results were then examined to determine the standard deviation from the theoretical calculations. The experimental data consists of the scans performed over the range of wavelengths for different emission lines produced. The details of the theory behind the emission lines are provided. The system originally under a high vacuum ~ 10-8 Torr was flushed with small amounts of 3He at a controlled rate. When the gas samples were excited with a magnetron operating at 600 Watts and a frequency of 2450 MHz, peaks at different wavelengths, which correspond to different quantized energies, appeared. (See Table III.) The scan was taken over the range 381.9607 nm through 728.135 nm. The data were plotted in a continuous series to display the peaks of each species to show how each wavelength fits within the continuous scan.
155Journal of Microwave Power and Electromagnetic Energy, 44 (3), 2010International Microwave Power Institute
Amand Anand et al., Microwave Initiated Atomic Spectra from Select Atomic Species
The data were then expanded electronically to look at each peak shape individually. The spectral profiles were assumed to be Lorenzian in shape for transitions between unperturbed, isolated energy levels. Any departures from this shape were assumed to be due to multiple overlapping lines for the number of lines for n =1 to a number n = k with k determined by the “best fit” derived from the minimum number of spectral lines to produce a good fit between the assumed profile and the experimental profile generated by the spectrometer. The experimental results of this investigation are summarized in Table III.
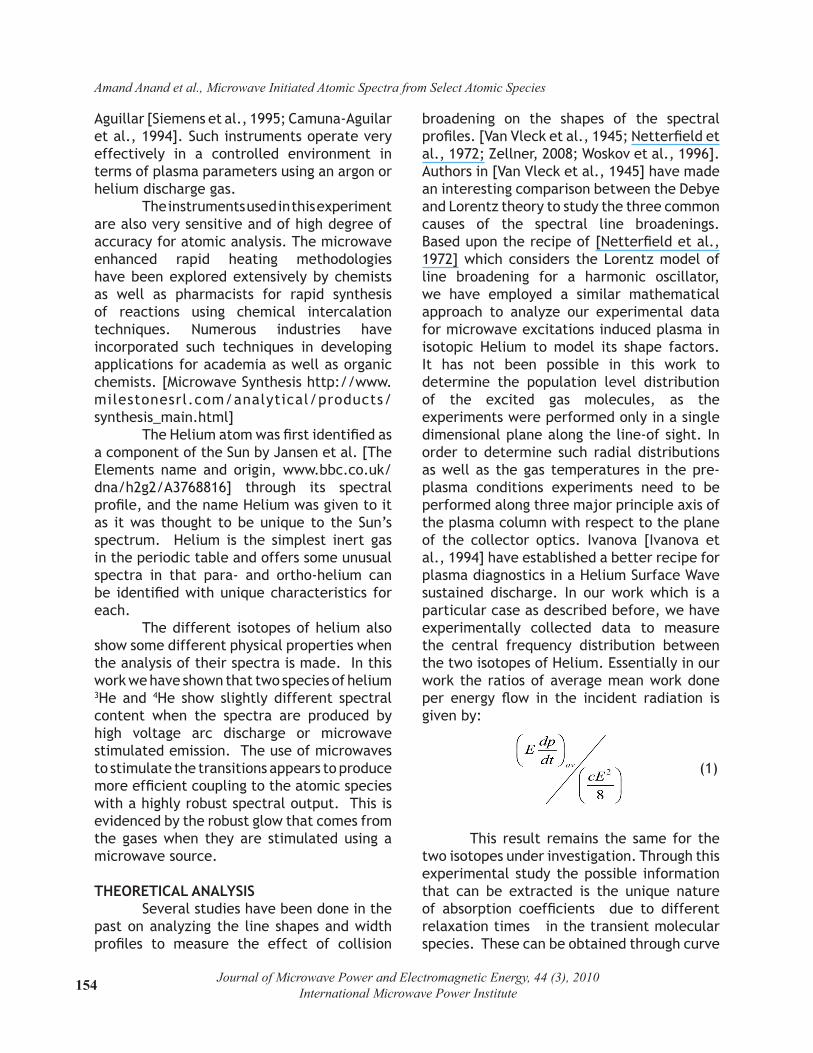
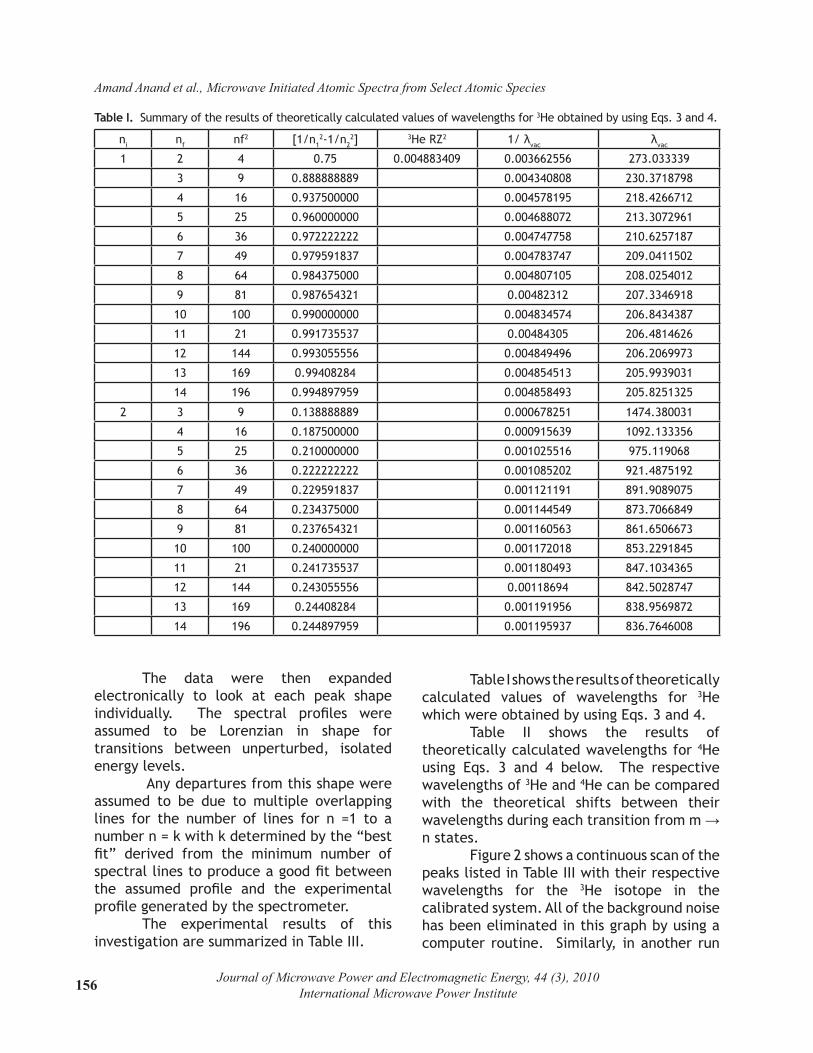
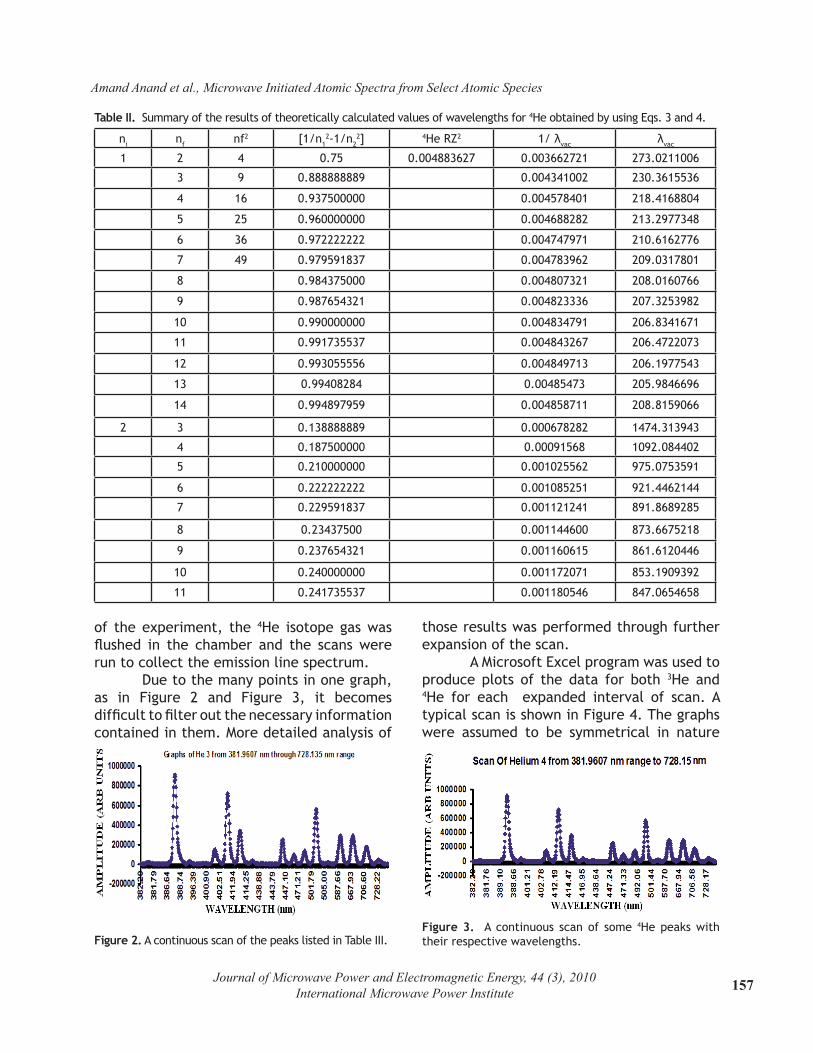
Table I shows the results of theoretically calculated values of wavelengths for 3He which were obtained by using Eqs. 3 and 4. Table II shows the results of theoretically calculated wavelengths for 4He using Eqs. 3 and 4 below. The respective wavelengths of 3He and 4He can be compared with the theoretical shifts between their wavelengths during each transition from m →n states. Figure 2 shows a continuous scan of the peaks listed in Table III with their respective wavelengths for the 3He isotope in the calibrated system. All of the background noise has been eliminated in this graph by using a computer routine. Similarly, in another run
Table I. Summary of the results of theoretically calculated values of wavelengths for 3He obtained by using Eqs. 3 and 4.
ni nf nf2 [1/n12-1/n2
2] 3He RZ2 1/ λvac λvac
1 2 4 0.75 0.004883409 0.003662556 273.033339
3 9 0.888888889 0.004340808 230.3718798
4 16 0.937500000 0.004578195 218.4266712
5 25 0.960000000 0.004688072 213.3072961
6 36 0.972222222 0.004747758 210.6257187
7 49 0.979591837 0.004783747 209.0411502
8 64 0.984375000 0.004807105 208.0254012
9 81 0.987654321 0.00482312 207.3346918
10 100 0.990000000 0.004834574 206.8434387
11 21 0.991735537 0.00484305 206.4814626
12 144 0.993055556 0.004849496 206.2069973
13 169 0.99408284 0.004854513 205.9939031
14 196 0.994897959 0.004858493 205.8251325
2 3 9 0.138888889 0.000678251 1474.380031
4 16 0.187500000 0.000915639 1092.133356
5 25 0.210000000 0.001025516 975.119068
6 36 0.222222222 0.001085202 921.4875192
7 49 0.229591837 0.001121191 891.9089075
8 64 0.234375000 0.001144549 873.7066849
9 81 0.237654321 0.001160563 861.6506673
10 100 0.240000000 0.001172018 853.2291845
11 21 0.241735537 0.001180493 847.1034365
12 144 0.243055556 0.00118694 842.5028747
13 169 0.24408284 0.001191956 838.9569872
14 196 0.244897959 0.001195937 836.7646008
156 Journal of Microwave Power and Electromagnetic Energy, 44 (3), 2010International Microwave Power Institute
Amand Anand et al., Microwave Initiated Atomic Spectra from Select Atomic Species
ni nf nf2 [1/n12-1/n2
2] 4He RZ2 1/ λvac λvac
1 2 4 0.75 0.004883627 0.003662721 273.0211006
3 9 0.888888889 0.004341002 230.3615536
4 16 0.937500000 0.004578401 218.4168804
5 25 0.960000000 0.004688282 213.2977348
6 36 0.972222222 0.004747971 210.6162776
7 49 0.979591837 0.004783962 209.0317801
8 0.984375000 0.004807321 208.0160766
9 0.987654321 0.004823336 207.3253982
10 0.990000000 0.004834791 206.8341671
11 0.991735537 0.004843267 206.4722073
12 0.993055556 0.004849713 206.1977543
13 0.99408284 0.00485473 205.9846696
14 0.994897959 0.004858711 208.8159066
2 3 0.138888889 0.000678282 1474.313943
4 0.187500000 0.00091568 1092.084402
5 0.210000000 0.001025562 975.0753591
6 0.222222222 0.001085251 921.4462144
7 0.229591837 0.001121241 891.8689285
8 0.23437500 0.001144600 873.6675218
9 0.237654321 0.001160615 861.6120446
10 0.240000000 0.001172071 853.1909392
11 0.241735537 0.001180546 847.0654658
Figure 2. A continuous scan of the peaks listed in Table III.
Table II. Summary of the results of theoretically calculated values of wavelengths for 4He obtained by using Eqs. 3 and 4.
Figure 3. A continuous scan of some 4He peaks with their respective wavelengths.
of the experiment, the 4He isotope gas was flushed in the chamber and the scans were run to collect the emission line spectrum. Due to the many points in one graph, as in Figure 2 and Figure 3, it becomes difficult to filter out the necessary information contained in them. More detailed analysis of
those results was performed through further expansion of the scan. A Microsoft Excel program was used to produce plots of the data for both 3He and 4He for each expanded interval of scan. A typical scan is shown in Figure 4. The graphs were assumed to be symmetrical in nature
157Journal of Microwave Power and Electromagnetic Energy, 44 (3), 2010International Microwave Power Institute
Amand Anand et al., Microwave Initiated Atomic Spectra from Select Atomic Species
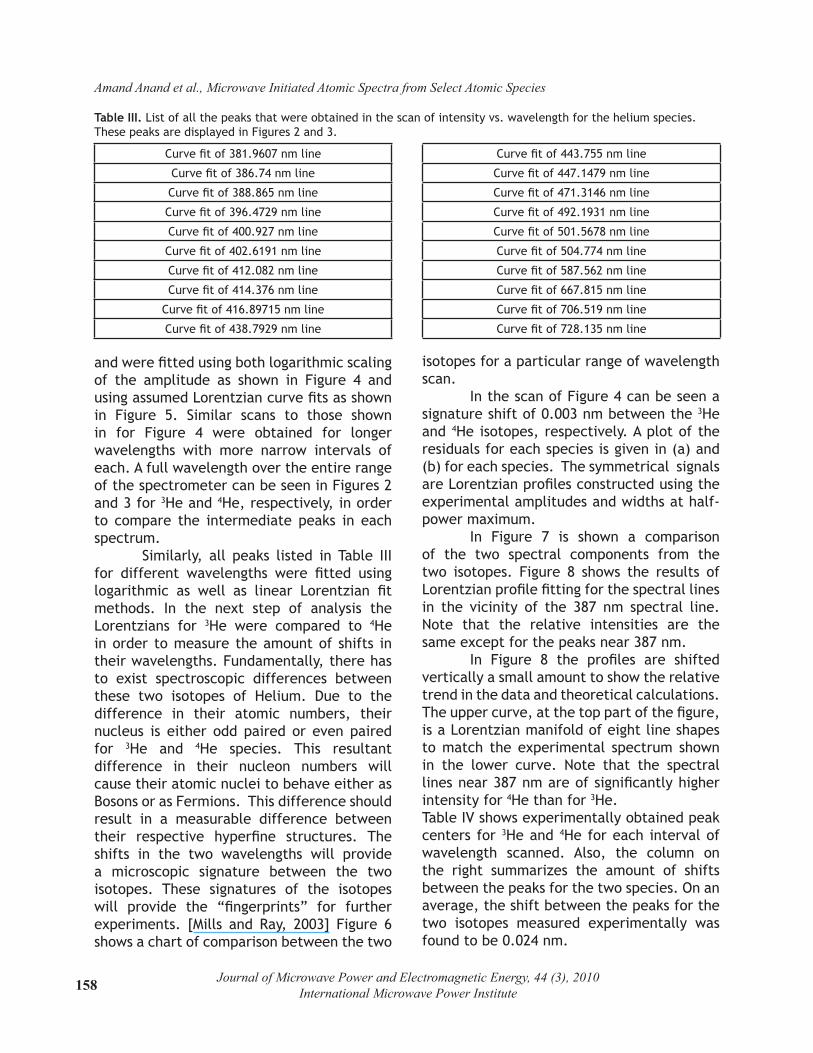
Curve fit of 381.9607 nm line
Curve fit of 386.74 nm line
Curve fit of 388.865 nm line
Curve fit of 396.4729 nm line
Curve fit of 400.927 nm line
Curve fit of 402.6191 nm line
Curve fit of 412.082 nm line
Curve fit of 414.376 nm line
Curve fit of 416.89715 nm line
Curve fit of 438.7929 nm line
Curve fit of 443.755 nm line
Curve fit of 447.1479 nm line
Curve fit of 471.3146 nm line
Curve fit of 492.1931 nm line
Curve fit of 501.5678 nm line
Curve fit of 504.774 nm line
Curve fit of 587.562 nm line
Curve fit of 667.815 nm line
Curve fit of 706.519 nm line
Curve fit of 728.135 nm line
Table III. List of all the peaks that were obtained in the scan of intensity vs. wavelength for the helium species. These peaks are displayed in Figures 2 and 3.
and were fitted using both logarithmic scaling of the amplitude as shown in Figure 4 and using assumed Lorentzian curve fits as shown in Figure 5. Similar scans to those shown in for Figure 4 were obtained for longer wavelengths with more narrow intervals of each. A full wavelength over the entire range of the spectrometer can be seen in Figures 2 and 3 for 3He and 4He, respectively, in order to compare the intermediate peaks in each spectrum. Similarly, all peaks listed in Table III for different wavelengths were fitted using logarithmic as well as linear Lorentzian fit methods. In the next step of analysis the Lorentzians for 3He were compared to 4He in order to measure the amount of shifts in their wavelengths. Fundamentally, there has to exist spectroscopic differences between these two isotopes of Helium. Due to the difference in their atomic numbers, their nucleus is either odd paired or even paired for 3He and 4He species. This resultant difference in their nucleon numbers will cause their atomic nuclei to behave either as Bosons or as Fermions. This difference should result in a measurable difference between their respective hyperfine structures. The shifts in the two wavelengths will provide a microscopic signature between the two isotopes. These signatures of the isotopes will provide the “fingerprints” for further experiments. [Mills and Ray, 2003] Figure 6 shows a chart of comparison between the two
isotopes for a particular range of wavelength scan. In the scan of Figure 4 can be seen a signature shift of 0.003 nm between the 3He and 4He isotopes, respectively. A plot of the residuals for each species is given in (a) and (b) for each species. The symmetrical signals are Lorentzian profiles constructed using the experimental amplitudes and widths at half-power maximum. In Figure 7 is shown a comparison of the two spectral components from the two isotopes. Figure 8 shows the results of Lorentzian profile fitting for the spectral lines in the vicinity of the 387 nm spectral line. Note that the relative intensities are the same except for the peaks near 387 nm. In Figure 8 the profiles are shifted vertically a small amount to show the relative trend in the data and theoretical calculations. The upper curve, at the top part of the figure, is a Lorentzian manifold of eight line shapes to match the experimental spectrum shown in the lower curve. Note that the spectral lines near 387 nm are of significantly higher intensity for 4He than for 3He.Table IV shows experimentally obtained peak centers for 3He and 4He for each interval of wavelength scanned. Also, the column on the right summarizes the amount of shifts between the peaks for the two species. On an average, the shift between the peaks for the two isotopes measured experimentally was found to be 0.024 nm.
158 Journal of Microwave Power and Electromagnetic Energy, 44 (3), 2010International Microwave Power Institute
Amand Anand et al., Microwave Initiated Atomic Spectra from Select Atomic Species

Figure 4. At the right of the figure is a typical scan of the spectral peak of 3He obtained in an interval of 381.708 nm to 382.2 nm and at the left of the figure is a typical scan of 4He obtained in an interval of 381.753 nm to 382.2 nm from the calibrated spectrometer.
Figure 5. A typical plot of the logarithmic amplitude of the 3He peak centered around 381.9607nm at the right and at the left is a plot of 4He. It is interesting to see that in these plots of 4He centered on the 381.9607 nm show that “bumps” appear in the line wings. These indicate the presence of quantum structure in the species that has not been reported previously. 3He does not show the wing structure. The nuclear structures of the two species differ in Boson and Fermions statistics and these differences are assumed to account for different spectral shapes.
Figure 6. At the left of the figure is a typical Lorentzian plot of the 3He Peak centered at 381.959 nm and (right) is a typical peak of the 4He line centered at 381.956 nm.
159Journal of Microwave Power and Electromagnetic Energy, 44 (3), 2010International Microwave Power Institute
Amand Anand et al., Microwave Initiated Atomic Spectra from Select Atomic Species

Figure 8. Top. A spectral scan of transitions in 3He. The upper curve is a Lorentzian manifold of eight line shapes to match the experimental spectrum shown in the lower curve. Bottom. A spectral scan of transitions in 4He.
Figure 7. The scan above is the mapped peak of the two species. The ■ curve is of 4He and the smooth curve is of 3He. Several lines in the 3He and 4He were used as “tags” to test the relative intensity of the spectral components of interest in the two spectra.
Table IV. Experimental data for spectral lines in 3He and 4He gas.
Wavelengths of the Lorentzian Shaped Spectral lines produced with 3He and 4He isotopes, (curve fit of xxx.xx nm line)
Peak Center for 3He (nm)
Peak Center for 4He (nm)
Amount of Shift (nm) λ(3He) – λ( 4He)
381.9607 381.959 381.956 0.003
386.74 386.77 386.762 0.008
388.865 388.897 388.88 0.017
396.4729 396.514 396.511 0.003
400.927 400.965 400.93 0.035
402.6191 402.650 402.634 0.016
412.082 412.097 412.088 0.009
414.376 414.422 414.394 0.028
416.897 416.953 416.925 0.028
438.7929 438.774 438.740 0.034
443.755 443.779 443.752 0.027
447.1479 447.172 447.160 0.012
471.3146 471.340 471.340 0.000
492.1931 492.180 492.144 0.036
501.5678 501.637 501.614 0.023
504.774 504.890 504.850 0.040
587.562 587.574 587.569 0.005
667.815 667.870 667.810 0.060
728.135 728.168 728.103 0.065
Average Shift Produced: 0.024 nm
These slight differences in the values may be partly attributed to the calibration of the equipment and to its resolution. Also other factors such as the temperature and pressure of the system for the two runs cannot be ruled out to produce this marginal difference. From these results it appears that one can explore in detail the coupling reactions taking place between the isotopes and the microwaves. It may also be possible to recalculate the fine structure constant, which will then broaden the scope for exploring in more detail nuclear effects when the different spectra are carefully analyzed. Two types of spectra were obtained from the atoms, arc discharge stimulated
RESULTS It can be seen from Tables IV and V that the experimental values in the wavelength shifts of 3He and 4He were 0.02 nm (experimental) and 0.016041 nm (theoretical).
160 Journal of Microwave Power and Electromagnetic Energy, 44 (3), 2010International Microwave Power Institute
Amand Anand et al., Microwave Initiated Atomic Spectra from Select Atomic Species
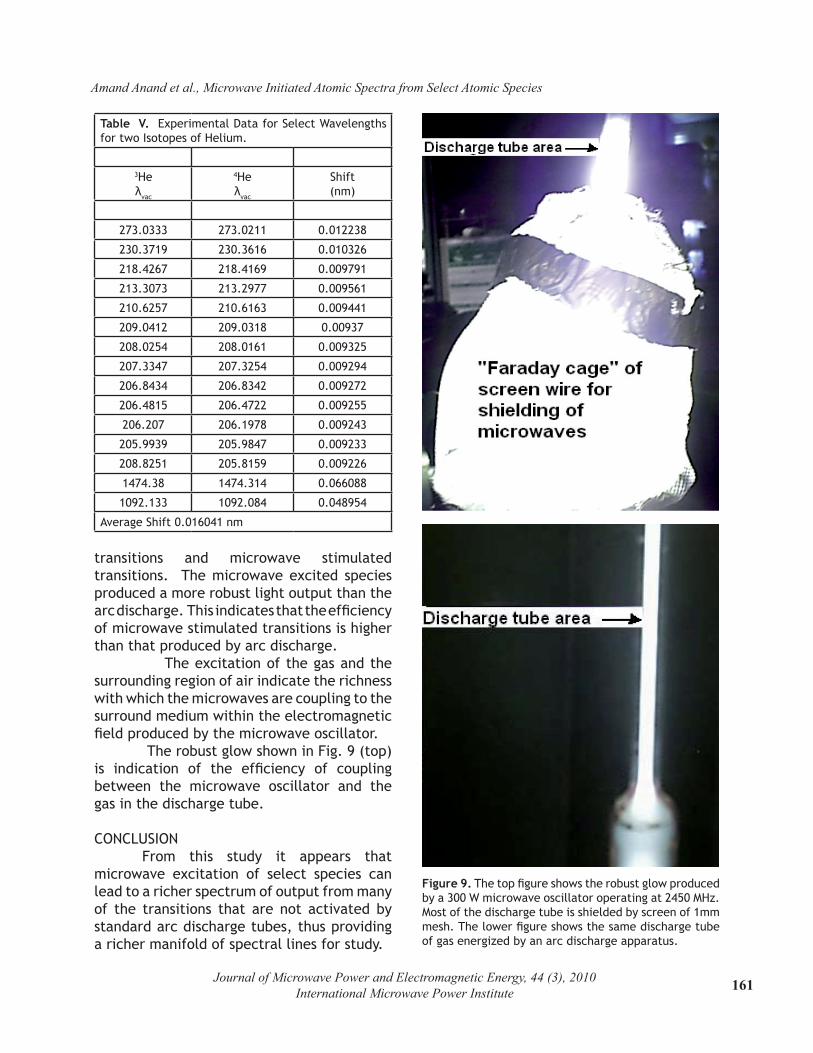
Table V. Experimental Data for Select Wavelengths for two Isotopes of Helium.
3Heλvac
4Heλvac
Shift(nm)
273.0333 273.0211 0.012238
230.3719 230.3616 0.010326
218.4267 218.4169 0.009791
213.3073 213.2977 0.009561
210.6257 210.6163 0.009441
209.0412 209.0318 0.00937
208.0254 208.0161 0.009325
207.3347 207.3254 0.009294
206.8434 206.8342 0.009272
206.4815 206.4722 0.009255
206.207 206.1978 0.009243
205.9939 205.9847 0.009233
208.8251 205.8159 0.009226
1474.38 1474.314 0.066088
1092.133 1092.084 0.048954
Average Shift 0.016041 nm
Figure 9. The top figure shows the robust glow produced by a 300 W microwave oscillator operating at 2450 MHz. Most of the discharge tube is shielded by screen of 1mm mesh. The lower figure shows the same discharge tube of gas energized by an arc discharge apparatus.
transitions and microwave stimulated transitions. The microwave excited species produced a more robust light output than the arc discharge. This indicates that the efficiency of microwave stimulated transitions is higher than that produced by arc discharge. The excitation of the gas and the surrounding region of air indicate the richness with which the microwaves are coupling to the surround medium within the electromagnetic field produced by the microwave oscillator. The robust glow shown in Fig. 9 (top) is indication of the efficiency of coupling between the microwave oscillator and the gas in the discharge tube.
CONCLUSION From this study it appears that microwave excitation of select species can lead to a richer spectrum of output from many of the transitions that are not activated by standard arc discharge tubes, thus providing a richer manifold of spectral lines for study.
161Journal of Microwave Power and Electromagnetic Energy, 44 (3), 2010International Microwave Power Institute
Amand Anand et al., Microwave Initiated Atomic Spectra from Select Atomic Species

ACKNOWLEDGEMENTS This work was supported in part by the Office of the Provost and Vice-President for Academic Affairs, Office of Research and Technology Transfer and Center for Technology Development, The University of North Texas.
REFERENCES Brown J. M., Carrington A., (Ed. 2003). Rotational Spectra of Diatomic Molecules, Cambridge University Press. Camuna-Aguilar J. F., Pereiro-Garcia R., Sanchez-Uria J. E., Sanz-Medel A., (1994). A comparative study of three microwave induced plasma sources for atomic emission spectrometry. Excitation of mercury and its determination after on-line continuous cold vapor generation Spectrochimica Acta, 49B, pp. 475-484. http://scienceworld.wolfram.com/physics/RydbergConstant.html Ivanova K., Koleva I., Shivarova A., (July 1994). Optical Spectroscopy diagnostics of a helium surface wave sustained discharge. I: experiment, Plasma Sources Sci. Technol. Vol. 4, pp. 444-449. Kroto H., (Ed. 1992). Molecular Rotation Spectra, Dover Publication. Microwave Synthesis http://www.milestonesrl.com/analytical/products/synthesis_main.html, Accessed May 10th, 2008 Mills R., Ray P., Extreme Ultraviolet Spectroscopy, (2003). J:Phys. D: Appl. Phys. 36 1535-1542. Netterfield R.P., Parsons R.W., Roberts J.A., (Jan 1972). An Experimental study of the
shapes of microwave spectral lines in gases at low pressures,” J.Phys.B: Atom. Molec. Phys. Vol 5. Siemens V., Harju T., Laitinen T., Larajava K., J Brokaert. A. C., (1995). Applicability of microwave induced plasma optical emission spectrometry, for continuous monitoring of mercury in flue gases, Fresenius J. Analytical Chemistry, 351, pp. 11-18. The Elements name and origin, www.bbc.co.uk/dna/h2g2/A3768816 Accessed : August, 12th, 2008 Townes C. H., Schawlow A. L., (Ed. 1955). Microwave Spectroscopy, Dover Phoenix Publication Van Vleck J.H., Weisskopf V.F., July (1945 ). On the Shape of Collision-Broadened Lines, Rev. Mod. Phys. Vol. 17 (2). Woskov P. P, Haddidi K., Thomas P., Green K., Flores G., Lamar D. A., (1990). Field Test of a Real-Time Calibrated Microwave Plasma Continuous Emissions Monitor for Stack Exhaust Metals, MIT Plasma – PSFC/RR-98-1. Woskov P. P., Hadidi K., Borr M. C. Thomas P., Green K., Flores, G. J. (1999). Spectroscopic Diagnostics of Atmospheric Microwave Plasma for Monitoring Metals Pollution, Rev. Sci. Instrum, 70. Woskov P. P., Rhee D. Y., Thomas P., Cohn D. R., Surma J. E., Titus C. H.,(1996) Microwave plasma continuous emissions monitor for trace-metals in furnace exhaust, Rev. Sci. Instrum., 67, pp. 3700-3707. Zellner M., Comparison of Stark Broadening and Doppler Broadening of Spectral Lines in Dense Hot Plasmas, Report: http://www.physics.ufl.edu/reu/2000/reports/zellner.pdf >, Accessed July 20th, 2008.
162 Journal of Microwave Power and Electromagnetic Energy, 44 (3), 2010International Microwave Power Institute
Amand Anand et al., Microwave Initiated Atomic Spectra from Select Atomic Species