
Fuel failure in normal operation of water reactors
279
IAEA-TECDOC-709 Fuel failure in normal operation of water reactors: experience, mechanisms and management Proceedings of a Technical Committee Meeting held in Dimitrovgrad, Russian Federation, 26-29 May 1992 INTERNATIONAL ATOMIC ENERGY AGENCY June 1993
-
Upload
khangminh22 -
Category
Documents
-
view
1 -
download
0
Transcript of Fuel failure in normal operation of water reactors

IAEA-TECDOC-709
Fuel failurein normal operation of water reactors:
experience, mechanismsand management
Proceedings of a Technical Committee Meetingheld in Dimitrovgrad, Russian Federation, 26-29 May 1992
INTERNATIONAL ATOMIC ENERGY AGENCY
June 1993

The IAEA does not normally maintain stocks of reports in this series.However, microfiche copies of these reports can be obtained from
INIS ClearinghouseInternational Atomic Energy AgencyWagramerstrasse 5P.O. Box 100A-1400 Vienna, Austria
Orders should be accompanied by prepayment of Austrian Schillings 100,in the form of a cheque or in the form of IAEA microfiche service couponswhich may be ordered separately from the INIS Clearinghouse.

FUEL FAILURE IN NORMAL OPERATION OF WATER REACTORS:EXPERIENCE, MECHANISMS AND MANAGEMENT
IAEA, VIENNA, 1993IAEA-TECDOC-709
ISSN 1011-4289Printed by the IAEA in Austria
June 1993

FOREWORD
The Technical Committee Meeting on Fuel Failure in Normal Operation of Water Reactors:Experience, Mechanisms and Management was convened by the International Atomic EnergyAgency upon a proposal of the International Working Group on Water Reactor FuelPerformance and Technology (IWGFPT).
The meeting focused on reviewing the present knowledge of the causes and mechanismsof fuel failure and discussed the methods for detecting failure and management of failed fuelduring and after operation. A previous IAEA meeting on this topic was held in Chalk River,Canada, in 1979.
At the invitation of the Government of Russia, the meeting was held in Dimitrovgrad andorganized by the IAEA and the Research Institute of Atomic Reactors in Dimitrovgrad.
About 50 specialists from 13 countries attended the meeting and 25 papers were presentedin five sessions. A poster session was organized where 12 Russian papers were presentedand discussed. Working Groups composed of the session chairmen and authors of papersprepared the summary of each session with conclusions and recommendations for futurework.
The fuel for water cooled reactors has become a highly standardized and reliable industrialproduct over the past years. Nevertheless, requirements for the fuel are still increasing withrespect to burnup, neutron economy, thermohydraulics and thermal efficiency of the nuclearpower plant. Advanced and improved fuel utilization in commercial LWRs, such as higherburnup, load following operating mode, MOX fuel and extended fuel cycle periods, requiresspecial attention on reliable designs and higher quality fuel fabrication, as well as largerthermal margins for flexible operating capability.
The knowledge about fuel failure today is spread over many countries and to some extentdiffers for the various types of water reactors, such as BWRs, PWRs, WWERs. RBMKs andHWRs.
The meeting has been useful in reviewing and discussing the status of fuel failure problemsfor water reactors and in identifying directions where further work would be valuable.

EDITORIAL NOTE
In preparing this material for the press, staff of the International Atomic Energy Agency havemounted and paginated the original manuscripts as submitted by the authors and given some attentionto the presentation.
The views expressed in the papers, the statements made and the general style adopted are theresponsibility of the named authors. The views do not necessarily reflect those of the governments ofthe Member States or organizations under whose auspices the manuscripts were produced.
The use in this book of particular designations of countries or territories does not imply anyjudgement by the publisher, the IAEA, as to the legal status of such countries or territories, of theirauthorities and institutions or of the delimitation of their boundaries.
The mention of specific companies or of their products or brand names does not imply anyendorsement or recommendation on the pan of the IAEA.
Authors are themselves responsible for obtaining the necessary permission to reproduce copyrightmaterial from other sources.
Throughout the text names of Member States are retained as they were when the text wascompiled.

CONTENTS
Summary of the Technical Committee Meeting . . . . . . . . . . . . . . . . . . . . . . . . . . . . . . . . . . . 7
GENERAL OVERVIEW OF PRESENT STATUS OF EXPERIENCE (Session 1)
A review of recent LWR fuel failures . . . . . . . . . . . . . . . . . . . . . . . . . . . . . . . . . . . . . . . . . . . 17A. Strasser, D. Sunder/and
WER fuel operation under normal conditions and analysis of damage causes . . . . . . . . . . . . 26Yu.K. Bibilashvili, A.I. Belosokhov, V.P. Velyukhanov, A.G. ioltukhovskij, A.I. Kushmanov,G.L Lunin, V.D. Onufriev, Yu.V. Pimenov, V.N. Proselkov, D.A. Chirov
Operating experience of RBMK fuel under normal conditions and analysis of itsdamage causes . . . . . . . . . . . . . . . . . . . . . . . . . . . . . . . . . . . . . . . . . . . . . . . . . . . . . . . 39V.G. Aden, B.A. Vorontsov, V.V. Kalinin, O.S. Krivoshein, V.A. Nikolaev, V.V. Noskov,A.V. Robot'ko, A.N. Ryabov
FRAGEMA fuel reliability: From detection of fuel failures to the feedback on designand fabrication . . . . . . . . . . . . . . . . . . . . . . . . . . . . . . . . . . . . . . . . . . . . . . . . . . . . . . . . 46A. Dumont
SIEMENS KWU experience with LWR fuel: Failure evaluation, mechanisms and remedies ... 50R. von Jan
ABB Atom fuel failure — An overview . . . . . . . . . . . . . . . . . . . . . . . . . . . . . . . . . . . . . . . . . . 57L. Lundholm, B. Grapengiesser, D. Schrire, L Hallstadius
DETECTION AND MONITORING OF FUEL FAILURES (Session II)
Correlation between fission product activity in PWR primary water and characteristics ofdefects in fuel cladding . . . . . . . . . . . . . . . . . . . . . . . . . . . . . . . . . . . . . . . . . . . . . . . . . . 67C. Leuthrot, A. Brissaud, A. Harrer
Experience with the Fission Products Monitoring System in Japanese reactors . . . . . . . . . . . . 72K. Ono
A review of fuel performance and fission product release studies for defected fuel elements . . 79BJ. Lewis, R.D. MacDonaid, N.V. Ivanoff, F.C. Inglesias
Application of the PES-PEPA expert system at the Dukovany nuclear power plant . . . . . . . . 100F. Pazdera, M. Valach, O. Bârta, L Novâk, V. Stech
Data on leaking fuel assemblies in LWRs operated in the former USSR . . . . . . . . . . . . . . . . . 106K.P. Dubrovin, N.L Fatieva, V.P. Smirnov
Failed fuel monitoring at nuclear power plants with RBMK reactors: Operating parameters,requirements and decision making criteria . . . . . . . . . . . . . . . . . . . . . . . . . . . . . . . . . . . . 113I.V. Zhukov
CAUSES AND MECHANISMS FOR FUEL FAILURE AND DAMAGE (Session III)
Overview of defect mechanisms in CANDU fuel . . . . . . . . . . . . . . . . . . . . . . . . . . . . . . . . . . 121T.J. Carter, A.M. Manzer
Fuel failure at Hamaoka Unit 1 . . . . . . . . . . . . . . . . . . . . . . . . . . . . . . . . . . . . . . . . . . . . . . 128Y. Hayashi, T. Matsumoto, M. Kuzushima, T. Muramoto, T. Okubo
Westinghouse fuel performance experience . . . . . . . . . . . . . . . . . . . . . . . . . . . . . . . . . . . . . 133H.W. Wilson, R.S. Miller, H. Kunishi
Evaluation of debris fretting failures and preventive methods . . . . . . . . . . . . . . . . . . . . . . . . . 138A. Strasser, J. Gingold
MANAGEMENT OF FAILED FUEL (Session IV)
Management of failed fuel during operation: French policy and experience . . . . . . . . . . . . . . . 147P. Bournay
Features of operating a WER reactor core containing leaking fuel rods . . . . . . . . . . . . . . . . . 152V.P. Velyukhanov, LM. Voronin, A.G. Ioltukhovskij, A.I. Kanatov, V.K. Chistyakova
Experience with defect fuel at the Kernkraftwerk Leibstadt; detection, inspection, handlingand management . . . . . . . . . . . . . . . . . . . . . . . . . . . . . . . . . . . . . . . . . . . . . . . . . . . . . . 156S. Lundberg

Debris induced fuel failures on uranium and MOX fuel in Beznau I . . . . . . . . . . . . . . . . . . . . . 168H. Bay, D. Boulanger, P. Deramaix, H. Bairiot
SPECIFIC EXPERIMENTAL APPROACHES (Session V)
Mixed oxide fuel in defective experimental rod Edithmox 1: Irradiation results andmetallographic PIE . . . . . . . . . . . . . . . . . . . . . . . . . . . . . . . . . . . . . . . . . . . . . . . . . . . . . 179D. Parrat, Y. Musante, A. Brissaud
Studies in the R2 test reactor of secondary damage formation in LWR fuel rods withsimulated defects . . . . . . . . . . . . . . . . . . . . . . . . . . . . . . . . . . . . . . . . . . . . . . . . . . . . . . 184H. Mogard, M. Grounes, H. Tomani, G. Lysell
Experimental study on the WWER fuel behavior in research reactors and shielded hot cells . . 192A.F. Grachev, V.B. Ivanov, V.V. Konyashov, V.P. Srnimov
Search for ways of reducing WER fuel damage by optimizing design andoperating conditions . . . . . . . . . . . . . . . . . . . . . . . . . . . . . . . . . . . . . . . . . . . . . . . . . . . . 205Yu.K. Bibilashvili, A.V. Medvedev, V.V. Novikov, V.D. Onufriev, l.N. Vasilchenko,E.D. Demin, G.L Lunin, V.N. Proselkov, A.F. Grachev, V.A. Kuprienko, A.G. loltukhovskij
Study on stress corrosion cracking of fuel cladding tube . . . . . . . . . . . . . . . . . . . . . . . . . . . . 211Y.H. Kang, W.S. Ryu, K.S. Rheem, S.H. Kirn
POSTER SESSION
Experimental investigation of out-reactor methods of failed fuel detection . . . . . . . . . . . . . . . . 217V.P. Elizarov, V.V. Konyashov, A.M. Krasnov
Geometry variety of WER fuel rods . . . . . . . . . . . . . . . . . . . . . . . . . . . . . . . . . . . . . . . . . . . 219B.A. Kanashov, V.l. Kuzmin, G.D. Lyadov, V.S. Polenok, A.V. Smirnov, V.P. Smirnov,A.V. Sukhikh
Measurement methods of gas fission products quantity under fuel element claddingsby means of deep cooling . . . . . . . . . . . . . . . . . . . . . . . . . . . . . . . . . . . . . . . . . . . . . . . . 225A.V. Sukhikh, E.P. Klochkov
Investigations of radioactive fission product release from fuel elements withinitial cladding defects during operation of the VK-50 reactor . . . . . . . . . . . . . . . . . . . . . . . 228V.P. Elizarov, V.V. Konyashov, A.M. Krasnov
Method for calculating fission product release from the fuel cladding gap of a failedfuel element to the coolant . . . . . . . . . . . . . . . . . . . . . . . . . . . . . . . . . . . . . . . . . . . . . . . 233V.V. Konyashov, A.M Krasnov
Some results of post-irradiation investigations of WER-1000 unsealed fuel assembly . . . . . . . 238K.P. Dubrovin, A.V. Sukhikh, V.l. Kuzmin, A.V. Mestnikov, A.V. Smirnov, V.P. Smirnov
Results of post-reactor investigations of WER-1000 untight fuel assembly . . . . . . . . . . . . . . . 240K.P. Dubrovin, A.V. Sukhikh, V.l. Kuzmin, A.V. Smirnov, V.P. Smirnov
Effect of inner surface preliminary oxidation on stress corrosion cracking susceptibility of, Zr-1%Nb tubing . . . . . . . . . . . . . . . . . . . . . . . . . . . . . . . . . . . . . . . . . . . . . . . . . . . . . . . 246
Yu.K. Bibilashvili, Yu.N. Dolgov, V.V. Novikov, A.P. GryazevMechanism of fuel cladding failure in PCI . . . . . . . . . . . . . . . . . . . . . . . . . . . . . . . . . . . . . . . 255
V.V. NovikovAnalysis of trends in fuel rod depressurization and determination of 'gas leak1 and
'pellet-water interaction' type failures using radiation monitoring techniques offuel rod leak tightness . . . . . . . . . . . . . . . . . . . . . . . . . . . . . . . . . . . . . . . . . . . . . . . . . . . 263E.A. Panov, Yu.M. Shestakov, V.N. Miglo
Operation and radiation monitoring of water cooled reactors with faulty fuel rods . . . . . . . . . . . 272Yu.M. Shestakov, E.A. Panov
Influence of water chemistry regimes on fuel cladding failure in LWRs . . . . . . . . . . . . . . . . . . 282V.G. Kritskij
List of Participants . . . . . . . . . . . . . . . . . . . . . . . . . . . . . . . . . . . . . . . . . . . . . . . . . . . . . . . 286

SUMMARY OF THE TECHNICAL COMMITTEE MEETING
This meeting was organized within the IAEA programme on Reactor Fuel Technologyand Performance and was hosted by the Research Institute of Atomic Reactors inDimitrovgrad, Russia. This institute comprises a number of research and prototype reactors,hot and radiochemistry laboratories, fuel fabrication facilities, and is one of the largest nuclearresearch and experimental nuclear centers in Russia and Europe, Scientific visits wereorganized during the meeting which provided the opportunity of getting to know the facilitiesand approaches to the studies.
The papers were presented in five sessions:
- General Overview of Present Status of Experience- Detection and Monitoring of Fuel Failures- Causes and Mechanisms for Fuel Failure and Damage
Management of Failed FuelSpecific Experimental Approaches.
A significant number of the presentations gave overviews of fuel failure over asubstantial period of time (5 to 7 years). Data presented in these overviews showed that inspite of the increasing demands placed upon fuels in LWRs during recent years, such ashigher burnups, load-following, increased cycle periods and more extensive use of MOX fuels,the rate of fuel failures continued to fall. The reduction in failure rates underlines theeffectiveness of the countermeasures that have been taken so far. Nevertheless, furtherprogress towards the ideal aim of zero defects will not be reached easily. Even though failurerates have been reduced significantly, the failure modes characteristic of the different reactorsystems persist. To overcome the remaining barriers in the approach towards a zero fuelfailure rate in power reactors, the cross-fertilization of ideas promoted by the IAEA through itsongoing programmes in international collaboration and information exchange will be of benefitto all concerned.
Session I. General Overview of Present Status of Experience
Summary
In the first paper a review of USA defect fuel experience was presented. It pointed outthat the margin to economic performance was smaller in most cases than the margin to alicensed safety limit. It gave typical cost comparisons for two degrees of leakers - large andsmall. The failure causes were divided into 3 groups, those releasing activity to the coolant,those likely to release activity and those not releasing activity (but still regarded as failuressuch as excessive rod growth).
Earlier large scale defects for pellet-cladding interaction (PCI) had been effectivelyremedied by imposing operating restrictions, the introduction of Zr-liner cladding, theintroduction of 9 x 9 and 10x10 fuel array or a combination of these.
In spite of a reduction in failure rates over the last decade, those residual failures thatstijl occur in BWRs can be divided into two categories those due to unknown causes (includingunspecified manufacturing defects) and some debris failures. CILC (crud induced localizedcorrosion) failures have been brought under control. In the USA, as in Europe, debris inducedfretting has now been recognized as the major cause of failure in PWRs, which is beingcountered by the introduction of debris filters on the inlet nozzles. All in all, the aim is still to

achieve a zero defect rate and continued investigation of failure causes will help to come asclose as possible to this goal.
The next paper dealt with failures in Russian type reactors WWER-440 and WWER-1000. The nuclear safety regulations aim to limit defective rods to 0.2% for release of fissiongases and to <0.02% for defects with 'fuel-coolant contact'. This is a factor of 5 below anysafety concerns. For WWER reactors fuel have operated successfully to 4-5 cycles(48 MW-d/kg U) with integrity better than 0.007%.
In WWER-1000 reactors, higher numbers of leaking defects occurred; 3.7% of alldischarged fuel elements had as a rule one or more leaking rods. After introduction of a new3 cycle rod design, these rates were reduced. Causes of failures were analysed as being dueto inadvertent departure from operating limits and debris induced failures which included thepresence of organic impurities in the coolant. Measures which led to improved reliabilityincluded better control of the manufacturing process by automation, higher control of operatinglimits and (unspecified) design changes. Post-irradiation examination (PIE) is being carriedout on some defective rods in order to better determine failure causes.
The second Russian paper dealt with the reliability of RBMK fuel under normal operation.Here, the failure rates are significantly higher than in the WWER plants and an extensiveprogramme of analysis, PIE and instrumented tests is under way, which is leading toimprovements in design, fabrication and operation. Increased automation of the fabricationprocess - reducing human error, changes in rod designs (chamfered pellets, annular pellets,closer tolerances, He pressurization) as well as more control over the operating requirements(restriction of the on-line refuelling mode to prevent local overpower transients) are beingintroduced resulting in failure rates of 0.02% (the ratio of defective fuel rods to all rodsdischarged) for the RBMK 1500. In future, the introduction of liner cladding and getters in thefuel rod will further reduce the likelihood of failure.
In the French paper techniques for coolant activity analysis (MORGANE model) and on-site facilities for detection of leaking fuel assemblies and rods (on-line and in-cell sipping test,ultrasonic test) and for determination of fuel failure causes were described. As in the USA,70% of the PWR defects are debris related, 10% grid fretting and only some 7% arefabrication defects. For the latter, more automated fabrication processes and filters againstdebris-related failures are also being introduced. With these remedies a leaking fuel rate nearto 5 x 10~6 rods per cycle is expected. FRAGEMA intends to intensify leaking fuel rodinvestigations in order to continuously improve the fuel reliability. In France, severe secondaryhydriding has been seen in defective rods with high powers (hydride blisters and largelongitudinal cracks).
In the German paper experience with PWRs and BWRs was described. Unlike in theUSA, fuel failures in BWRs were still dominated by PCI for the 50% of currently operating fuelwithout barrier claddings. This could be attributed to a special phenomenon of pellet chippingand was mitigated by changes in pellet shape and fabrication procedures. The US CILCexperience was not repeated in Germany thanks to early measures to control copper ingressvia the feedwater, after the effect had been documented in the USA. In PWRs, debris-frettingwas the principal cause of failure. Overall the failure rates had been reduced to low levelsthanks to the well known remedy measures. An important feature was a five point plan toevaluate and control fuel failures beginning with coolant activity monitoring, comprehensiveand extensive poolside evaluations, failure analyses, experience feedback and follow-upmonitoring.
Failure rate (failed/total inserted) for ABB-Atom(Sweden) fuel rods since 1979 is 6 x 10~5
from all causes and <2 x 10~5 neglecting known debris and other non-fuel related causes. As
8

in Germany, the Swedish policy is to identify all fuel failure mechanisms and determine failurerate improvements. The Xe-133 leakage rate is the preferred monitoring indicator althoughother isotopes give additional information. Anticipated leakers are determined beforeshutdown by flux tilting methods but inspection and repair is done off the critical path after thereactor returns to operation. Hot cell examinations are also performed where necessary.
Swedish experience with large secondary failures has been mixed one large releasefollowed a major secondary failure of a Zr-line/sponge cladding but a second failure of a Sn-alloy liner rod was more benign. In both cases debris fretting was the primary cause.
High debris-fretting failure rates in BWRs in Sweden can be attributed to specific plants.
Conclusions
- Rates of defective fuel continue to reduce thanks to various remedy measures and areapproaching values below 10~5 per cycle.
Defective fuel mitigation, control and management meets an economic need of the plantoperators, and contributes to dose reduction but is not a safety issue.
- There is general agreement on the main causes of defective fuel remaining in LWRs -apart from some specific individual plant or fabrication related causes. These are debris-fretting and unknown, possibly fabrication related, failures. CILC (BWRs) and PCI nowseem generally under control, although not completely eliminated.
There remains a low percentage of LWR failures due to fabrication defects which arebeing reduced by increased automation and control of the fabrication and inspectionprocedures.
- In WWER reactors and more particularly in the RBMK, the defect rates are beingreduced by more restrictive operating controls, tighter control over fabrication and designchanges.
All programmes seeking a zero defect rate need to have the support of a comprehensiveand complete monitoring, inspection and failure analysis regime. Examples of these arethe German, Swedish and French programmes and the measures being undertaken forthe RBMK and WWER fuel.
Recommendations
- Continued monitoring, analysis and inspection of failed fuel is needed to approach a zerodefect rate.
- With the solution of the debris-related defects by the addition of filters, fabrication defectsmay become the principle cause of failure and this should be matched by appropriatecontrol of fabrication processes and materials. Automatic measures in fabrication maybecome increasingly important, reducing human error.
Session II. Detection and Monitoring of Fuel Failures
Summary
The papers presented in this session describe a number of different station specificinstallations. The following experience described in this session vary each reactor, dependingon the reactor design:
- A comprehensive review of fuel performance in CANDU reactors and of the mechanismsof defective fuel rod deterioration.
- The corrections used in the French PWRs in order to predict the characteristics ofcladding failures from fission product activities in the primary coolant and also tocalculate the fission product activities when defected assemblies are refuelled.
- Fission Product Monitoring System, FPMS, installed in several Japanese PWRs and itsability to provide real-time analyses for continuous primary coolant activity estimates.
The PES-PEPA Expert System used at the Dukovany reactor (CSFR) to predict theprobability of fuel damage and data showing a comparison between calculated andmeasured data. The method offers a possibility to decrease the released gaseousactivity.
- A statistical compilation of data on the quantity of leaking fuel assemblies in all operatingNPP units in the former USSR, indicating that modern WWER reactor fuel has asatisfactory reliability, while the RMBK fuel failure rate needs to be decreased.
- A procedure for estimating the number of failed fuel rods and prediction of theirradioactivity discharge during NPP with RBMK reactor operation. The procedure isbased on the FFM data base and 1-131 and Xe-133 activities in the coolant.
Session 111. Causes and Mechanisms for Fuel Failure and Damage
Summary
In the Canadian paper it was stated that fuel fabrication performance has been excellentin CANDU with over 99.9% of loaded bundles performing well. Of the small number ofdefected bundles, the defect mechanisms are: fabrication defects constituting incomplete endclosure results and porous end-plug bar-stock material. Smaller numbers of defects havebeen attributed to fretting and vibration damage which is a reactor operating problem.Theexistence of occasional excursion in fabrication quality along with the decreased tolerance foriodine in the primary coolant from licensing requirements emphasize the need for continuedsurveillance of fuel performance.
In the second paper, the Japanese experience was presented. Fuel failure at HamaokaUnit-1 in 1990 originated from corrosion whose cause was inferred to be the combined effector irregular water chemistry and use of more corrosion susceptible cladding material.
In the next cycle, the reactor was operated using new and irradiated sound fuel understrong control of coolant chemistry. The cycle was successfully completed without any fuelfailure or accelerated corrosion. The use of important methods of condensate demineralizerresin treatment and modified clad fabrication methods for improved corrosion resistance arerecommended.
10
The first USA paper indicated that field examinations of leaking fuel rods have shownthat debris induced fretting is the dominant leakage cause in Westinghouse fuel, accountingfor approximately 70% of observed leakers. Corrective actions have taken the form of controlmeasures taken by the utilities to keep debris out of the system and a design change to thefuel assembly. These steps have significantly reduced debris related defects. To reach zerodefects, additional changes are needed.
In the second USA paper specific items discussed included the source of debris, thetypes of debris and the interaction of debris with fuel assemblies. Differences in failurehistories between BWRs and PWRs were discussed. Preventive measures include improvedmaintenance procedures to preclude introduction of debris into the primary system and fuelassembly design features that make the fuel cladding less likely to be exposed to through-wallfretting. The improved maintenance procedure guidelines and the fuel design modificationswere discussed as well. Continued improvements in operating and maintenance programmesare recommended to preclude debris, and the effectiveness of debris resistant fuel designsshould be monitored.
Session IV. Management of Failed Fuel
Summary
The first paper of this session gave information on the French policy and experience inthe management of failed fuel during operation. Fore more than ten years and with theagreement of the French safety authorities, Electricité de France (EOF) has been applying apolicy of reinserting the leaking assemblies which fulfill the following criteria:
- equivalent diameter of the defects less than 35 urn, measured by 'quantitative sippingtest';no solid fission products in liquid samples during sipping test;limited impact of reloaded leaking assemblies, at the beginning of cycle activity level:D.E. 1-131 less than 1.1 GBq/t.
Under these conditions the feedback from EDF experience is the following:
- no significant release of UO2 and no important enhancement of activity in the coolantwith up to three times reinsertion of a leaker;
- acceptable stability of equivalent diameter for reloaded defects.
This policy induces significant savings in time and money, does not impact the unitsavailability, and is compatible with safety requirements.
The operational experience of WWER fuel is considered in a Russian paper and highreliability of this fuel has been confirmed. In particular, the number of leaking fuel rods doesnot exceed 0.01% for both WWER-400 and WWER-1000. The main failure causes are:deviation from design operational conditions, debris, and deposition of organic compounds onfuel rod and assembly surfaces.
Emphasis is given to justify the possibility of reinsertion of fuel with microleaks for onemore fuel cycle. The successful experience with 20 reinserted leakers has been accumulatedat three WWER-1000 units.
The paper on the Leibstadt NPP experience (Switzerland) gave an overview of allfailures having occurred in the reactor (BWR). In addition to the failed fuel operating history,
11

the methods for detection and identification of defective rods as well as the operation withfailures and post-irradiation handling were described. Results of non-destructive examinationsof the failed rods were presented. Special emphasis was given to the two severe barrierfailures in the reactor. These failures resulted in large activity release and severe claddingdeterioration, probably caused by delayed hydrogen cracking. The main conclusion of thepaper is the need to understand the mechanism for these types of failures. Suchunderstanding can then lead to means to avoid or mitigate the effects and consequences.These consequences can be severe, especially in reactors with high power densities.
The Belgian paper dealt with details of debris induced failures in U and MOX fuel in theBeznau-1 plant. During operation of Beznau-1 from July 1989 to May 1990, primary circuitactivity indicated that several fuel assemblies developed leaks. The core was constitutedduring that cycle of 24 MOX fuel assemblies and 97 U assemblies. Sipping identified fiveleaking fuel assemblies: one U fuel assembly in its first irradiation cycle, two U assemblies inthe second irradiation cycle, one U fuel assembly in its third irradiation cycle and one MOXfuel assembly (with two failed rods) in its second irradiation cycle. On-site examination duringrepair indicated that the failures were caused by debris induced fretting resulting subsequentlyin secondary hydriding failures. Coolant activity measurements were analysed to correlateprimary and secondary failures for U fuel and MOX fuel.
The following can be concluded:
- the failure is not affected by the type of fuel;- the lag time between primary defect detection and secondary defect occurrence ranges
between 200 and 300 days, similar for both UO2 and MOX fuel;- the activity releases were not worse for the MOX failures than for U failures.
Conclusions
- The French experience with controlled reinsertion of leaking fuel up to three timesshowed that this policy did not result in severe fuel rod degradation and is acceptablein PWRs from a radiological point of view. A similar conclusion can be drawn from theWWER experience.
- A second failure of a barrier fuel rod in Leibstadt showed similarly severe degradation(60 cm split) as the first one, reported earlier, and provided additional evidence that theprobability of such degradation is higher for pure Zr barrier cladding than for non-barriercladding. The resulting uranium washout can cause significant problems in plantmaintenance during operation and with higher than desired exposure during outages.
From the Beznau-1 experience it can be concluded that the behaviour of leaking MOXfuel is very similar to that of leaking U fuel with respect to both, development ofsecondary damage of the fuel rod and the overall activity release to the coolant.However, it is possible to distinguish U and MOX failures by some differences in releasebehaviour by careful analysis of the activities.
Recommendations
- The mechanisms of degradation for different types of claddings (standard, sponge, Zr-barrier and other remedies) in BWRs and the influence of parameters (power, burnup,gap, etc.) should be further investigated.
12

The increasing experience with reinserted leakers in PWRs should be further analysedwith respect to the validity of the well known Locke curve for secondary damage as afunction of heat flux and time of operation.
The sources of organic contamination of primary circuit in WWERs should be analysedwith the purpose of preventing contamination of the fuel.
Session V. Specific Experimental Approaches
Summary
The aim of the paper from France was to study the behaviour of a defective MOX rodunder irradiation and especially the release rate of fission products. An experimental fresh rodhas been irradiated in a research loop between 8 and 27 kW/m. Fission product release wasmeasured by on-line gamma spectrometry and sampling.The results of this experiment showa release rate of fission product comparable to that obtained with uranium oxide.Metallographie analyses performed after irradiation show an appreciable evolution ofmicrostructure, with fission gas precipitation bubbles, due to fuel oxidation under water vapourconditions. This evolution is not usually observable on UO2.To cover the entire range of MOXfuel operating conditions in PWRs, these results should be validated for higher burnup levelsand long irradiation time.
The Swedish paper discusses a new test method for comparative investigations of thedefected fuel degradation process under simulated primary defect conditions, describes thefirst explorations tests performed and a proposed international fuel R&D project, the DefectFuel Degradation Experiment (DEFEX).
The first Russian paper starts with a review of the requirements for an experimentalprogramme on failed fuel. The paper covers the methodology which should be adopted forboth the experimental tests and the post test examinations, including the full range ofmeasurements to be carried out for the detection and characterization of defects. The restof the paper is a description of the test facilities at the Research Institute of Atomic Reactors, Dimitrovgrad. These consist of the MIR reactor with several pressurized loop facilities, theSM-2 reactor, also with loop facilities, and both with the capability for transient experiments,the VK-50 reactor and loop, and hot cells.
The second Russian paper recognizes the important goal of achieving high reliability ofpower reactor fuel. It identifies a number of failure mechanisms and describes areas of thedesign of WWER-440 and 1000 fuel assemblies to improve performance and reliability, andemphasizes the need to optimize operating conditions. The paper includes a detaileddiscussion of the need to optimize operating conditions for a daily load follow schedule inorder to minimize clad stress. The paper then considers the importance of controllingcladding defects during manufacture in order to improve the resistance of the cladding to SCO.A maximum defect depth of 35 jim is recommended.
In the final paper in this session from the Republic of Korea, iodine induced stresscorrosion cracking (ISCC) tests on Zircaloy-4 tubes were undertaken using an internalpressurization method to elucidate the mechanisms and to find out remedies of pellet-claddinginteraction failure. Fel2, AII3 and CsOH acted as active corrosive agents for SCC of Zircaloy-4,showing almost the same critical concentration as that of I2. Csl and CsC1, however, werefound to be not active for SCC. The fabrication process of each company brought out certaincharacteristics of mechanical and metallurgical properties of Zircaloy-4 tubes, resulting in adifferent ISCC behaviour. Tubes with high toughness in burst tests and with textures in a
13

radial direction showed a good behaviour of ISCC. In addition, the welding process madeISCC resistance decrease up to 40% as compared with that of tubes as-received. Anannealing treatment and/or a modified welding process showed some effects to recover theISCC resistance, but welded parts still had a potential risk of ISCC. Graphite or siloxane wasfound to be so effective to improve the ISCC resistance which seemed to be acting as a getterof iodine and/or a lubricant, or a protective barrier, respectively.
Conclusions
- Experimental measurements of gaseous and airborne fission product release from amixed oxide fresh fuel stack under steady state conditions show them to be similar tothose for UO2 fuel at least at low burnup. Significant evolution of the MOXmicrostructure was observed, which was not visible in early UO2 life.
- An experimental technique has been developed and tested to simulate a primary defectand to allow the development of secondary defects under irradiation to be studied.
- Significant work is being carried out to improve the SCC behaviour of cladding materials.The Russians are proposing a maximum initial defect size of 35 urn for WWER-440 and1000 cladding.
A programme of the Republic of Korea on iodine induced SCC for CANDU type Zircaloy-4 tubes investigates at the effect of several variables including welding, and graphite andsiloxane coatings.
- Programmes to reduce or eliminate failures from debris or fretting are already welladvanced within the commercial arena.
Recommendations
Post-irradiation investigations aimed at finding an explanation of defective fueloccurrences in power reactors should be pursued with the aim of reducing 'unknowncauses'.
- Special irradiation experiments, aimed at a most complete understanding of themechanisms of degradation of defective fuel , are desirable. It is recommended toinitiate a special task aimed at reviewing the state of the art and recommending whetherfurther experimental activities are needed in this area.
- The interest in understanding the basic mechanisms of stress corrosion cracking shouldcontinue.
- More experimental data are needed to study the behaviour of a defective MOX rodunder irradiation, especially at higher burnup and for a larger irradiation time.
Next page(s) left blank

GENERAL OVERVIEW OFPRESENT STATUS OF EXPERIENCE
(Session I)
Chairmen
F. PAZDERACzechoslovakia
R.W. STRATTONSwitzerland

A REVIEW OF RECENT LWR FUEL FAILURES
A STRASSER, D SUNDERLANDThe S M Stoller Corporation,Pieasantville, N Y,United States of America
Abstract
Increasing attention to improved fuel reliability has reduced the failure rates significantly Areview of the failure rates and failure causes in the past approximately four years, are givenin this paper, including those resulting from
• design• manufacturing• corrosion• pellet-clad interactions• hydraulic vibration• debns fretting
and combinations of these effects Corrective actions instituted to minimize or eliminate theseproblems are described The discussion of the failure causes addresses those observed in allnuclear nations, but the failure statistics are limited to U S plants
1 0 INTRODUCTION
The reliability of nuclear fuel is not only of importance to the health and safety of the publicbut has a substantial impact on protecting the large financial investment in the fuel and plantFuel reliability has a significant effect on the economics of the nuclear fuel cycle, and in fact,fuel failures have a greater impact on plant economics than on the licensed margin to safeoperation
A large spectrum of cost parameters is impacted by fuel failures, and these are listed below
Cost components associated with identification and discharge or repair of failedfuel
Direct inspection costsIncremental exposure cost-inspectionEnergy loss costs inspection (if on the critical path)Direct reconstitution costsIncremental exposure costs - reconstitutionEnergy loss costs reconstitution (if on the critical path)Spent fuel storage expansion costs - premature discharge
Cost of energy loss - premature dischargeCost of calculation of new fuel loading schemeOft optimum fuel loading costCause of failure determination
• Cost components associated with continued operation of failed fuel
Energy Losses
• Derate• Ramp rate limitations
Increased deminerahzer flow• Containment entry delay• Premature shutdown
Increased operating costs due to higher coolant activity levels andgreater contamination of plant systems and components
• Incremental O&M costs - radwaste systems• Incremental O&M costs - plants• Incremental non-specific exposure costs• Loss of personnel efficiency
The sensitivity of plant operating costs to these parameters vanes greatly, but the largest effecton cost is due to events that result in loss of energy production, such as derates or shutdownsrequired due to high coolant activity Examples of such cost evaluations are shown in Figures1 and 2
These analyses made by a US utility show the comparison of costs for continued operationwith failed fuel versus inspection and repair following the cycle m which the failures occurred,as a function of the number of failed rods These analyses are very sensitive to the inputassumptions and are utility specific
The analysis m Figure 1 for small leakers indicates that reconstitution is the more economicroute at greater than 10 failed rods For large leakers, resulting in power losses due to deratesor shutdowns, the economics favor reconstitution at 1 or 2 failed rods as shown m Figure 2
A computer model COFFEC, has been developed by the Stoller Corporation for the ElectricPower Research Institute to evaluate the cost of failures [1]
The term failure is generally used to indicate a clad breach that releases radioactive fissionproducts into the coolant However, failure" should be considered in the broader concept ofany event that results in the need to repair or remove a fuel assembly from the core By thatdefinition, one can have failures that are unlikely to release activity and failures that do notleak yet, but are likely to do !>o with continued service Failure types are shown by thesecategories m Table I and discussed subsequently

CD
(2'Slou
20 40
No. of Failed Fuel Rods
D Inspection/Repair+ Operate With Failures
Figure 1: FUEL FAILURE COST ANALYSIS(SMALL LEAKERS)
&
PU
oO
180-170-1W-180-140-130-120 -110-100-
70-«0-80-40-30 -20-10 -n -i
S/
=*-£-}
/S
/S
//
r
— -S
//
—a ——— H ——— 1
//
//
1 ————————— i
20 40
No. of Faüed Fuel Rods
D Inspection/Repair+ Operate With Failures
Figure 2: FUEL FAILURE COST ANALYSES(LARGE LEAKERS)

15S.
3*kelv to Release Activi!
Broken screws and bBroken holddown seiGuide tube wearLim
its of differentalgrowth
N S o. KO (nE.o
X XX
X XX
X
T1s.3
nJv to Release Activity
Fuel rod vibrationDam
aged spacersCollapsed clad
X X
X
X
X X
T]
1u>Ö
f f § - ° f ~ g - f 1tin*- b<K> M S S °-
_ (TQ "^ OQ '
F ^ "y°- 2. O
CX J^J
X
X X X X X
X X X X
XX X
X X
2.tra
11K-cr3.op?
1
OB.w3
S(T
E§sB.1sn0
Ti
m
rfe2j
t»Kooctn
CO
oW
3Ha
gCOm
CD
2.0 FAILURES THAT RELEASE ACTIVITY
2.1 CLAD FRETTING BY DEBRIS
One of the largest failure causes has been the fretting of fuel clad by debris in the coolant.This type of failure occurred in some early nuclear plants but then did not recur again untilabout 10 years ago, when plant maintenance operations increased. A detailed discussion ofdebris failures is given in another paper at this conference [2],
2.2 SPACER-CLAD FRETTING
Fuel failures can result from vibration of the fuel rod against the spacer tabs and springs, ifthe rod is improperly supported. The fretting can result from flow induced vibrations duringoperation or, less frequently, during shipping of poorly supported fuel rods. The resultingfretting is easy to identify visually.
Clad failures due to this mechanism have occurred almost entirely in PWRs and have beenincreasing recently. They have been traced primarily to inadequate control of spacerfabrication and the assembly of fuel rods into the spacers. Some of the remedies for theproblem have been increasingly automated fabrication, inspection and assembly procedures.The pulling, instead of pushing, the fuel rods into the assembly, is one example of improvedfabrication techniques.
2.3 PELLET-CLAD INTERACTIONS (PCI)
Primary FailuresFailures due to PCI have occurred almost exclusively in BWRs. The cause of a large numberof failures about 15-20 years ago, the frequency of these failures has decreased significantlydue to a series of increasingly effective remedies, including:
• Operating recommendations that required clad pre-conditioning and limited therate of rise to power
• Zirconium liner, or barrier, on the clad inner diameter to increase the marginto failure
« Subdivision of 8x8 fuel array to 9x9 and 10x10 to reduce the linear heatgeneration rate (LHGR)
• • Combination of the barrier with the 9x9 and 10x10 fuel.
Recent primary PCI failures were limited to non-barrier fuel rods in BWRs and with theoverwhelming use of the PCI remedies listed above, this failure cause should diminish further.

Secondary FailuresNearly 100 barrier clad rods have failed due to CILC corrosion manufacturing defects in theclad, and debns in the coolant Several of these, however, had long PCI type cracks in thecladding and their failure was associated with unusually high off gas activity [3] [4]
Most of these types of failures are believed to be due to secondary PCI The primary failurecause is non-PCI, such as debns fretting, and this permits coolant inside the fuel rod Thefailure can then propagate in the following steps
• Fuel oxidizes and expands• Lower thermal conductivity uranium oxide increases fuel temperatures• Steam blanketing increases fuel temperatures further and the fuel expands
further• The clad is stressed sufficiently for a secondary PCI failure• High off-gas results from the high fuel temperatures• Secondary hydndmg under certain fuel rod internal chemistry conditions can
propagate the crack
In the event an undetected defect exists in the clad, a primary PCI defect could occur ifstresses exceed the failure threshold at the defect location This is true of any type of cladof course
Key questions at this time are whether any differences exist between the barrier and non-bamer rod behavior, and what failure mechanism causes the extensive fuel oxidation andcrack propagation in a few instances and not in most of the others A current project isevaluating these failure mechanisms at the authors' organization
2 4 CLAD CORROSION
BWRThe recent corrosion failures in BWRs have been due to crud induced localized corrosion(CILC) The CILC mechanism is very complex in detail, but generally is a function of thewater chemistry, the characteristics of the clad, and the power history of the fuel rod Eachone of these factors is subject to a very large number of variables and most importantlychanges in variables as a function of time
The development of CILC requires three items at a minimum Cu in the coolant, corrosionsusceptible cladding and heat flux Dense, high Cu crud deposits with circumferential cracksand steam blanketing raise the clad temperature to a level at which oxidation through the cladoccurs relatively rapidly
The condensers are the principal source of Cu, but plants with deep bed demmeralizers removethe Cu adequately prior to the feedwater system Powder demmeralizers do not have as goodi Cu removal efficiency and the CILC failures have been restricted to plants with this typeof equipment Chemical intrusions other than Cu can also induce CILC corrosion Claddingwith poor nodular corrosion resistance appears to be most susceptible to CILC
The CILC failures from the condenser Cu source were first observed in 1978 in GeneralElectric plants using General Electric fuel Significant efforts on the pan of the utilities toimprove coolant chemistry control and on the pan of General Electric to improve clad qualitygradually reduced this problem Several utilities with CILC susceptible plants have replacedtheir Cu alloy condenser tubes with titanium alloys which, in combination with the above, isexpected to eliminate the CILC problem
PWRThe corrosion failures in PWRs are in two categones
• Corrosion by high temperature coolant m high efficiency PWRs
• Corrosion susceptible, fabrication related Zircaloy metallurgical structure
High coolant exit temperature plants in the range of 320°C to 330°C have been coming intoservice over the past decade, and the performance of Zircaloy 4 under these demandingconditions is not as good as at lower temperatures
Standard Zircaloy 4 operates satisfactorily at the high temperatures up to the former, standardburnup goals of 33-36 GWD/MT batch average burnups The first plant to operate at hightemperature conditions, KKGosgen in Switzerland, found that above about 40 GWD/MT andheat flux of 68 w/cm* the oxidation rate was sufficiently high to fail the clad before thescheduled discharge of the fuel
Remedies are under intensive development by the fuel vendors and utility organizationsImproved corrosion resistant materials include modified Zircaloy 4 compositions, newzirconium base alloys and "duplex" clad consisting of a Zircaloy 4 base with a thin corrosionresistant zirconium alloy outside liner
In a few isolated instances, Zircaloy 4 has suffered severe corrosion at normal coolanttemperatures and heat fluxes These were traced to fabrication methods, specifically thermaltreatments that decreased the annealing parameter below about 10IS hrs (Q/R = 40,000°K),a point of steep transition to increased uniform corrosion susceptibility in PWRs
The remedy for this situation is increased attention to process control during thermal treatmentso that the desired annealing parameter range is maintained The search for a good qualitycontrol test to identify corrosion susceptible material is still in progress
2 5 CORROSION OF END PLUG WELDS
The tungsten inert gas welding process for Zircaloy end plugs is conducted either in a vacuumor inert atmosphere Poor control of the gas punty, or leaky vacuum chambers, have led tonitrogen contamination of the welds and the resulting corrosion was sufficient in some casesto breach the weld integrity
The remedy is clearly better atmosphere control and monitoring by impurity sensors

ro
2 6 LEAKING END PLUGS
The fabrication of zirconium alloy end plugs can result in detects that provide a leakage pathtoi gases through the end plug
Chloride stringers present in some zirconium products are one such defect that could bealigned longitudinally along the axis of the bar stock by the fabncation process Cold swagingof barstock has also resulted in internal voids at the ends of the bars, by deforming the outersurfaces more than the center and eventually leaving central voids
Failures of this type have been rare The remedies are clearly careful fabncation processcontrol and inspection Ultrasonic inspection of finished barstock is necessary
2 7 PRIMARY HYDRIDING OF CLAD
Hydnding of zirconium alloy clad by residual moisture in the pellets, once the cause ofextensive fuel failures, is all but eliminated today Occasional failures due to lapses in qualitycontrol sull occur, but rarely
The tendency to ever higher UO2 pellet densities, up to 96% of theoretical, have decreasedpellet open porosity and increased pellet resistance to moisture absorption significantly This,combined with good degassing procedures, hydrogen analysis methods and even a hydrogengetter in the plenum of General Electric BWR fuel rods, have been an effective remedy
2 8 BAFFLE JETTING
Cross flow Getting) from inadequately sealed core baffle joints has caused vibration, fretting,and some fuel rod failures m the peripheral row of the assemblies This condition has existedin Siemens, Westinghouse and Westinghouse licensee PWRs The phenomenon was firstobserved in the Zonta plant in Spain some years ago and has since affected many assembliesthat resided in core peripheral positions near baffle joints with crossflow Failures occurredregardless of the design or origin of the fuel
Sealing the baffle joints by peenmg did not prove to be entirely satisfactory An interim, butsuccessful remedy was applied by Siemens Nuclear Power, and consisted of a steel clipapplied to the outside of the fuel rod at the point of jet impingement to restrain the rods fromvibration The ultimate remedy is to reduce the pressure drop across the baffle, by reroutingflow in the baffle region Several plants have made this rather extensive change
3 0 FAILURES LIKELY TO RELEASE ACTTVITY
3 1 FUEL ROD VIBRATION
Extensive ex-reactor hydraulic loop testing of fuel assemblies by the vendors generallyprecludes in-reactor failures Shortcomings in process control or quality control can result invibration and fuel rod-spacer fretting Similarly, minor design changes or changes in hydraulic
conditions can also result in fuel rod vibration These are significantly less frequent and havenot normally resulted in clad breach because they were discovered in time
However, the Oskarshamn 1 BWR [5] experienced fretting of the lower end cap of the spacercapture rod due to hydraulic vibrations The cause was traced to excessive pressurefluctuations caused by lateral oscillations of a water jet at the inlet onfice directly below thelower tie plate The changes that induced the vibration included increased core flow foruprated plant operation, re onficmg of the flow, and the extension of the end cap length
The remedies included modifying the onfice and the end plug shape, but the plant upratingwas maintained
3 2 DAMAGED SPACERS
Handling of fuel assemblies during receipt, inspection core loading and unloading can resultin interference, or "hang-up" between spacers m PWRs Interference between adjacent PWRfuel assemblies dunng fuel shuffling has occurred with essentially every PWR fuel vendor'sfuel, resulting in damaged gnd spacers The tight clearances between PWR assemblies,combined with potential changes in assembly straightness dunng irradiation, require carefulhandling
To minimize "hang-up" between assemblies, PWR vendors have chamfered the corners of theirspacers, and minimized protrusions that could cause interference Improved fuel shufflingtechniques and better momtonng of handling tools have all contributed to minimize thisproblem Nevertheless, even though less frequent, the problem is a reoccumng one
3 3 COLLAPSED CLAD
Fuel densrfication combined with no fuel rod prepressurization resulted in clad collapse ofPWR fuel rods in the early 1970s Occasional instances of clad collapse soil occur, but theseare due to quality control lapses which result in the omission of one or more pellets in the fuelcolumn The remedy is clearly good surveillance at the gamma scanning step for completedfuel rods
4 0 FAILURES UNLIKELY TO RELEASE ACnVITY
4 1 STRESS CORROSION CRACKING OF HIGH STRENGTH COMPONENTS
The performance of the variety of high strength nickel alloys, such as Inconel 718, 800 andX-750, which are used as nuts, bolts, and springs in the fuel assembly has been less thanperfect Some failures have occurred in almost every application, pnmanly m PWRs but inBWRs as well In contrast, nickel alloy spacers and springs have performed without knownstress corrosion failures
Stress corrosion cracking or fatigue has been the cause of essentially all the failures Typicalexamples are Inconel X-750 BWR channel spnngs and bolts [6], PWR holddown spnngs[7],and, most recently, the bolts that clamp the PWR holddown leaf spnngs

ION>
The detailed causes are a combination of excessive stress, component vibration, inadequatemetallurgical structure or heat treatment, and perhaps the choice of an alloy with inadequatestress corrosion resistance The vendors have changed alloys m several cases, but moreimportantly modified their designs to reduce localized stress concentrations as well asimproving the metallurgical treatment This author's review of nickel alloy failures indicatesthat each type of component has its own combination of failure causes, but that excessivestress has been an ovemdmg failure cause, and its reduction is the most effective way toincrease reliabilityThe cracked components have stayed in place most of the time and only occasionally havepieces of these components become debris To the authors' knowledge, there is no directevidence that any of these have resulted in clad breach
4 2 GUIDE TUBE WEAR
Vibration of the PWR control rods has resulted in the wear of Zircaloy guide tubes at thelocation of the rodlet tips. The vibration is induced by hydraulic conditions to which thecontrol rods are exposed in the upper core and upper intervals These are most severe in theCombustion Engineering and Babcock and Wilcox 17x17 type (Mark C) plants Chromiumplated steel sleeves have been inserted in the upper end of the guide tubes as a successfulremedy to prevent wear.Similar vibration exists in other plants, notably Westmghouse-type NSSS, however, m these,the wear is relatively slight on the guide tube but greater on the control rodlet, requiringremedies for the control rod but not the guide tube
4 3 LIMITS OF DIFFERENTIAL ZIRCALOY GROWTH
The differential growth between Zircaloy components has limited the life of fuel assembliesin the past Redesign of the assemblies has always provided additional margin for suchgrowth The margins decrease, however, with extended burnups, and could change as a resultof changes to the assembly design or the Zircaloy fabrication procedures
The limiting conditions for the differential growth between the following components are asfollows
Component
Fuel rod - assembly(upper tie plate)
Water rod assembly(upper or lower tie plate)
Channel - assembly
Condition
Holddown spring completelycompressed
Upper end plug disengagement
Water rod disengagement
Uncover finger spnng seal
Potential Failure
Rod bow - rods in contact
Rod vibration cladfretting
Rod vibration - clad fretting
Bypass flow - decreased CPRmargin
The first two events have occurred infrequently and required repair or reconstitution of theassembly The third item has been noted but has not reached a limiting condition
The remedy is clearly a good irradiation growth data base related to the exact process usedfor the fabrication of the component, combined with statistical design procedures that take intoaccount the full range of the available data
5 0 FUEL FAILURE STATISTICS
The failures discussed in this secüon relate only to those that breached the clad and releasedactivity to the coolant Further, they are limited to LWRs in the USA
Developing fuel failure statistics fairly, and on a basis which makes comparison meaningful,is not an easy task The bases of the statistics developed by the authors and the assumptionswhich had to be made in the process, are
• The time period considered for each review is two years A snapshot in time,or a period of only one year, is potentially misleading, and tends to be undulyinfluenced by those cases where a fairly large number of failures occur in onlya few plants Periods longer than a few years are unduly influenced by fuel ofolder designs fabricated by non-current methods A two year periodencompasses at least one shutdown considering most plants in the US are on18 month cycles
• The number of rods which operated during this penod is not easy to determineBest estimates, rather than exact values have been used
• In PWRs, most inspections have been with UT, yielding the number of bothrods and assemblies failed When no inspections were made, the number offailed rods has generally been estimated by the utility or the authors
• In BWR investigations, the number of failed bundles is often known but thenumber of failed rods is not The number of failed rods has been estimatedbased on similar occurrences
• Failed rods are often earned over from one cycle to the next An attempt hasbeen made not to double count such incidents
The uncertainty in the fuel statistics should be recognized, based on the need for the abovelisted estimates
The failure rates represent the total of the US vendors' experience The BWR vendors areGeneral Electric and Siemens Nuclear Power The PWR vendors are ABB-CombustionEngineering, B&W Fuel Company, Siemens Nuclear Power and Westmghouse
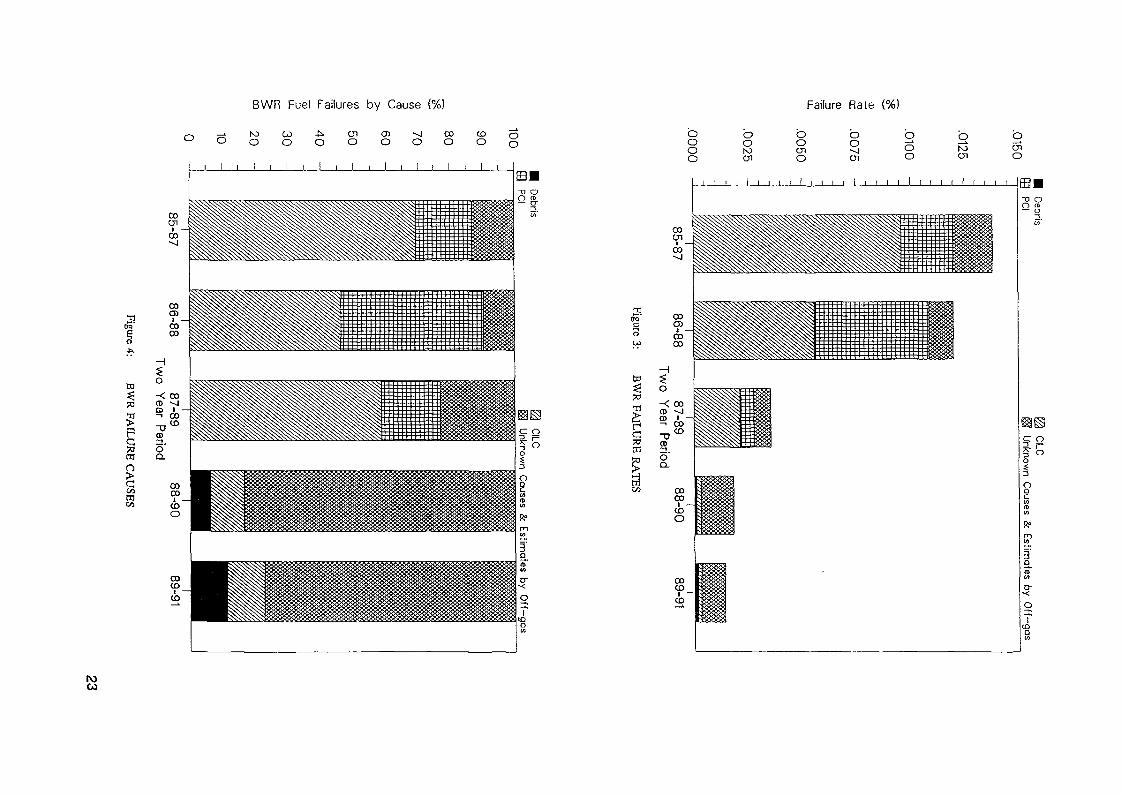
The BWR failure rate trend is shown in Figure 3 and percent failures by cause in Figure 4The PWR data are shown similarly in Figures 5 and 6
BWR Fuel Failures by Cause (%)
3 g toO
01O
O)O
COO
toO
OO
2!oo'
CD
5
IO
I
Failure Rate (%)
oooo
ootoenooeno
ooen
oo
Mai aio
•n05"
5»•B
£
00ai
ooa>i -cooo
o-< 00CD --J
OCL
ooooi -
CD
l l l l l l~o oO a>— a"
I
oa
(tV)
o-

03DC
012 -
010 -
008 -
<u 006 -
004 -
.002 -
DebrisGrid FretInspected/Unknown
Baffle-JetManufacturingEstimated from Coolant Activity
85-87 86-88 87-89Two Year Period
88-90 89-91
Figure 5: PWR FAILURE RATES
00O
.0
o>L.D
ce
100
90 -
_ 80S?
60 -
40 -
30
20 -
10
0
DebrisGrid FretInspected/Unknown
Baffle-JetManufacturingEstimated from Coolant Activity
85-87 86-88 87-89 88-90 89-91Two Year Period
Figure 6: PWR FAILURE CAUSES
24

Failure causes are noted where they are sufficiently large in number to appear on the barcharts The failure causes are unknown for several inspected failures and for failuresestimated from coolant or off gas activity they are clearly unknown The two categories arenoted separately for the PWRs and are combined for the BWRs
The observations that can be made from the BWR Figures 3 and 4 are
• Failure rates have decreased significantly due to the elimination of PCI failuresand virtual elimination of CILC failures
• A small but increasing number of debris failures have occurred recently
• The failure rates are less than in PWRs
• The number of unidentified failure causes has stayed essentially constant overthe years
The observations that can be made from the PWR Figures 4 and 5 are
• Failure rates decreased significantly until about 1989 and then leveled off
• Debris failure rates have been consistently high over the period surveyed
• Gnd fretting failures are increasing
• % Failures estimated from coolant activity are decreasing, indicating increasedfuel inspection
The increased trend to remove all failed fuel from the core pnor to startup and to stnve forzero failure levels, has led to increased inspection and determination of failure causesContinued efforts in this direction will eventually eliminate many of the failure causes andreduce failures to the lowest practical level
[41 A JONSSON.L HALLSTADIUS, B GRAPPENGIESSER, "Failure of A Earner Rodin Oskarshamn 3' International Topical Meeting on LWR Fuel Performance Vol1 Avignon France April 1991
[5] A REPARAZ, S NORDLOF, An Innovative Solution to an End Cap FrettingProblem in Oskarshamn Unit 1 ' International Topical Meeting on LWR FuelPerformance Vol 1 Avignon, France Apnl 1991
[6] O BERN ANDER, G VESTERLUND, 'Performance Expenence of the ASEA-ATOMBWR Fuel ANS Topical meeting on Light Water Reactor Fuel Performance Apnl1985, Orlando, Flonda DOE/NE/34/30-1
[7] D L BATY, et al, "Metallurgical Factors Affecting the Failure of Alloy X-750Holddown Spnngs" International Symposium on Environmental Degradation ofMatenals in Nuclear Power Plants Myrtle Beach, South Carolina, August 1983
roen
REFERENCES
[1] R. EPSTEIN, K. SHEPPARD and A STRASSER, "COFFEC Cost of Fuel FailureEvaluation Code", EPRI NP-5458-CCML, Volume 1, (August 1988)
[2] A STRASSER, J GINGOLD, "An Evaluation of Debns Fretting Failures andPreventive Methods' This conference
[3] J DAVIES, G POTTS, "Post-Detect Behavior of Barrier Fuel" International TopicalMeeting on LWR Fuel Performance Vol 1 Avignon, France Apnl 1991
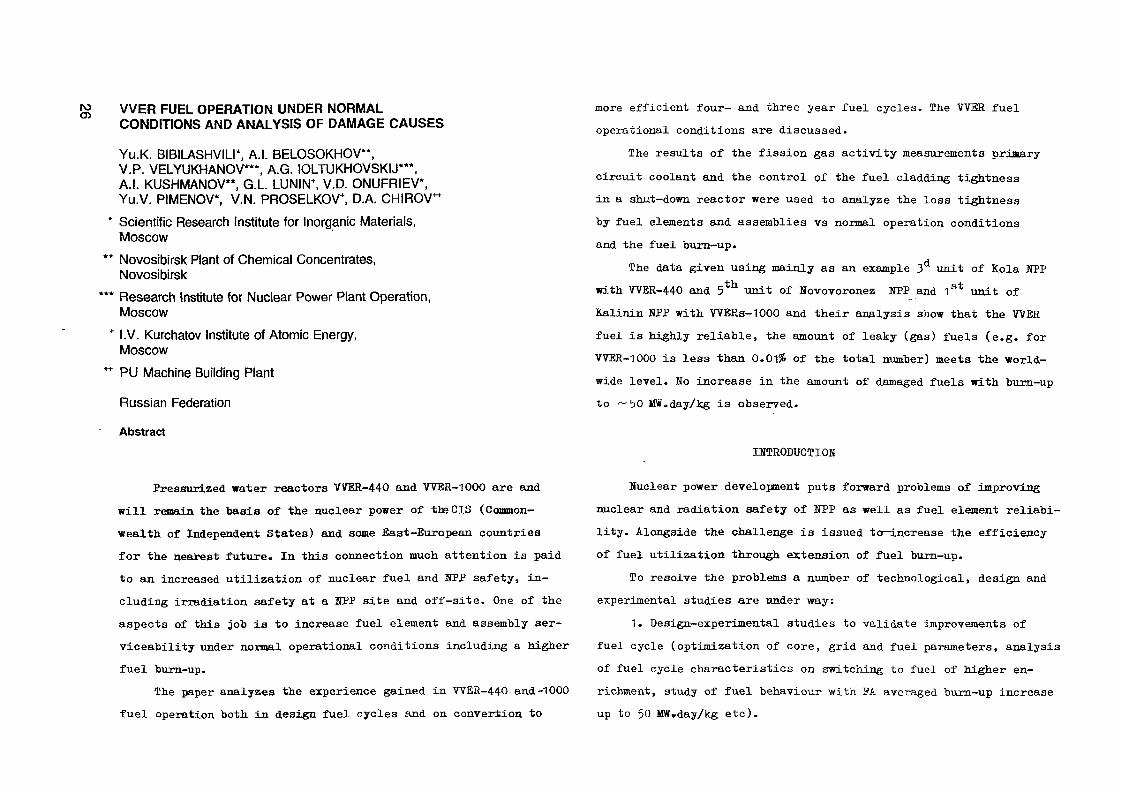
roO) WER FUEL OPERATION UNDER NORMAL
CONDITIONS AND ANALYSIS OF DAMAGE CAUSES
Yu.K. BIBILASHVILI*, A.I. BELOSOKHOV",V.P. VELYUKHANOV***, A.G. 1OLTUKHOVSKIJ*",A.I. KUSHMANOV", G.L LUNIN*. V.D. ONUFRIEV*,Yu.V. PIMENOV*. V.N. PROSELKOV+, D.A. CHIROV^
* Scientific Research Institute for Inorganic Materials,Moscow
** Novosibirsk Plant of Chemical Concentrates,Novosibirsk
** Research Institute for Nuclear Power Plant Operation,Moscow
+ I.V. Kurchatov Institute of Atomic Energy,Moscow
~ PU Machine Building Plant
Russian Federation
Abstract
Pressurized water reactors WER-440 and VYER-1000 are andwill remain the basis of the nuclear power of tie CIS (Common-wealth of Independent States) and some Bast-European countriesfor the nearest future. In this connection much attention ia paidto an increased utilization of nuclear fuel and HPP safety, in-cluding irradiation safety at a HPP site and off-site. One of theaspects of this job ia to increase fuel element and assembly ser-viceability under normal operational conditions including a higherfuel burn-up.
The paper analyses the experience gained in TVER-440 and-1000fuel operation both in design fuel cycles and on convertion to
more efficient four- and three year fuel cycles. The WEE fueloperational conditions are discussed.
The results of the fission gas activity measurements primarycircuit coolant and the control pf the fuel cladding tightnessin a shut-down reactor were used to analyze the loss tightnessby fuel elements and assemblies vs normal operation conditionsand the fuel burn-up.
The data given using mainly as an example 3 unit of Kola TOPwith WER-440 and 5t]l unit of Novovoronez HPP and 1st unit ofKalinin HPP with WERs-1000 and their analysis show that the WERfuel is highly reliable, the amount of leaky (gas) fuels (e.g. forVVER-1000 is less than 0.01/6 of the total number) meets the world-wide level. Ho increase in the amount of damaged fuels with burn-upto ~ 50 MW.day/kg is observed.
IHTRODUCTIOH
Nuclear power development puts forward problems of improvingnuclear and radiation safety of NPP as well as fuel element reliabi-lity. Alongside the challenge is issued to—increase the efficiencyof fuel utilization through extension of fuel burn-up.
To resolve the problems a number of technological, design andexperimental studies are under way:
1. Design-experimental studies to validate improvements offuel cycle (optimization of core, grid and fuel parameters, analysisof fuel cycle characteristics on switching to fuel of higher en-richment, study of fuel behaviour with PA averaged burn-up increaseup to 50 MW»day/kg etc).

K)-4
2. Design-methodical work to validate improvements of fuelcycle (development of computer programmes, check-up of design andoperation data, improved accuracy of preparation of. data on burn-upand isotope composition of discharged FAa etc),
3« Optimization of methods and algorithms of reactor powercontrol.
4« Up-date of fuel manufacture processes (fuel parameter opti-mization) .
5. Analysis of WER reactor and fuel operation experience,including fuel operation conditions, burn-up, distribution of burn-up,coolant activity, results of full leak tightness control in a shut-down reactor.
6. Post-irradiation studies of spent FAs.This paper deals with one of the important aspects - analyses
of WER-440 and -1000 fuel operation experience.
1. CHARACTERISTICS OF WER FUEL
1a. Fuel Assemblies (FAs)WBR-440 core has 312 (276) standard assemblies (SA) and
37 (73) 'FAs SUZ(the values for the design of the 3d and 4thunits at the Hovovoronezh NPP are given in the brackets). The PAwrappers are fabricated from Zr-XS Mb.
Hexagonal SAs with a perforated wrapper and FAs SUZ have 126fuel rods. The mass of U in SA is ~ 120 kg and that of FAs SUZis ~115 kg. The fuel column height of SA is 2420 mm, and that ofthe fuel element of FA SUZ is 2320 mm. Hexagonal FAs of WER-1000are of two types, viz., with a perforated wrapper (the Hovovoronezh
NPP Unit 5) and without wrapper (for all the other units of WER-1000). Wrapped FAs contain 317 fuel elements, the number of PAsper a core is 151, those without wrappers have 312 and 163, respec-tively. For FAs the "key turn" dimension is 234 mm, the FA lengthis 4570 mm, the fuel bundle length is 3840 mm, that of the fuelcolumn is 3530 mm, the fuel mass of an F fl is 430 kg.
The fuels in FAs are separated with stainless steel X18H10Tspacer grids of a honeycomb type. Presently introduction ofZr- L % Hb spacer grids is under consideration.
1b. Fuel Rods (PRs)WER-440 and -1000 fuel claddings are fabricated from Zr+1/S Hb.
The outer cladding diameter is 9.1 mm, the inner one is ~7.7 mm.WER type FRs consist of cladding, enriched uranium dioxide
fuel pellets, end pieces (plugs) and a hold-down device. Prior tosealing fuel elements are filled with He, the pressure of which ispresently -0.5 MPa and ~2.5 MPa in WBR-440 and -1000, respecti-vely. As a result of experimental-design work and generalization ofoperation experience the fuel design and fuel and its constituentpart fabrication processes were improved and meet the up-to-daterequirements.
2. FABRICATION OF FUEL
At the plants of CIS fuel is produced having different enrich-ments with U-235, % mass, including that for WER-440: 1.6, 2.4,3.6, 4.4 and for WER-1000: 1.6, 2.0, 3.0, 3.3, 3-6 and 4-4. PA cancontain FRs of the same enrichment only, or two groups of FRs oftwo different enrichments (profiled). In this case, e.g., PRs in

ro03
VVER-1000 600Fuel Rod
Consumption X10
100
1980 1981 1983 1984 1985 1986 1988 1989Year
Fig. 1. Fuel Rod Consumption by NPPs with WER-1000Units.
3. MAJOR PERFORMANCE PARAMETERS AMD STEADY-STATEKIEL CÏCLES OP WER-440 AHD -1000
All HPPs with WER-1000 operate under base-load conditionsat load factor (LF) ~ 70-7556, those with WER-440 also operate forthe most part under base load conditions at the LF ~ 70-8056, althoughsome experiments are under way for load follow conditions.
Initially, the fuel cycles of serial WER-440 and -1000 wereoriented to annual reloading, respectively, 1/3 and 1/2 part of acore. Presently they operate under or being transferred to condit-ions of reloading 1/4 and 1/3 portions of cores of VYER-440 and-1000, respectively.
The major design parameters of operation and steady-state fuelcycles of WER-440 and -1000 are listed in table 1.
Table 1Major Design Parameters of Operation and Steady-StatePuel Cycles of WER-440 and -10OO
the circumf erential row and PRs at the angles of the subsequent roware of lower enrichment (3.6* mass U-235) and the reat in WER-1000fuel assembly are more enriched (4.4/6 mass U-235).
The industry fully meets the demands of NPP with WER-440 and-1000. In the period from 1969 to 1989 ~49 thousand FAs or ~6.2mlnfuels were fabricated and loaded into WER-440 in CIS and BastEuropean countries. In the period from 1980 to 1989 —8000 FAs or~2.5 ™i» fuels were fabricated and loaded into in 17 units ofWER-1000 (16 units - in GIS and one - in Bulgaria). Fig. 1 showsgraphically the consumption of WER-1000 fuel elements during1980-89.
~~~~~— —^ReactorParameter ~"~~"~ — -~__ ^Heating power, HWElectric power, IWU load, tFuel fraction removed onreloadingEnrichment of make up fuel,% mass U-235Average fuel burn-up, HW. day/kgMean heat generation rate, W/gLife-time, eff.hHean linear heating, W/omMmrijiunu linear heating, W/cmMaximum temperature of claddingouter surface, °CCoolant pressure in core, MPa
V7BR-44O
131544042
0.33/0.252.4-3.6/4-431/40-4228.5/28.521000/28000
12932533512.5
TÏEH-10OO
3000100070
0.5/0.33
3.3/4.428.6/40-4345-0/52.01400O/21OOO
16744S
35015-8

to(D
As it was mentioned above, initially the serial WER-440 wasoriented to a three year fuel cycle at the enrichment of 2.4 and3.656 with 1/3 portion of core removed on each reloading. At theaverage enrichment of make-up fuel ~3«3^ and with the scheme offuel motion in the direction from circumference to centre (Out-In)all parameters of a three-year'fuel cycle are realized.
Enrichment of make-up fuel of WER-440 increased to 3-6S6 madeit possible to reduce the number of annually reloaded PAs to 1/4 ofa core without any alterations in the scheme of in-reactor fuelmotion Out-In, and to attain the average burn-up of discharged fuelof 36.5 HW.day/kg. However, the efficient time of PC (between re-loads) was decreased to ~6500 h.
Enrichment increased to 4.456 with four reloads of fuel percycle allows an aibnost 25% increase of burn-up and an increase offuel cycle time to ~8000 h«
The commercial operation of the first WBR-1000 (the 5th unitat the Hovovoronez . HPP) started in Bay 1980. The decision was takento use initially fuel intended for a two-year operation, The charac-teristics of this fuel cycle are listed in table 1. The compositionand characteristics of typical fuel loads of the first (2N-S-1, i.e.,the first year of unit operation under conditions of non-stationarytwo-year PC), the second year (2H-S-2, i.e, the second year of aunit operation under non-stationary two-year PC) and the subsequentyears (2S-usually beginning with the third year of operation thesteady-state conditions of a two-year PC were reached) are tabulatedin table 2. It also indicates the number of PAs after particularPC and their batch averaged discharge burn-up.
Table 2
Composition and Characteristics of Spent
Fuel Loads (PL)
Numberof PA
Enrich-ment, %mass U-235
Type of Mi, liait, number of PC, end of PC, year2H-S-1 2N-S-2 2S 3T 3N-S 33Bal.3-1 Kai.2-2 S-U.2-3 Kai.1-5 Zap.5-1 Novovor.1989 1989 1989 1989 1990 5-91990
2.0 79(79) 6(6) 1(1) 54(54)3.0 423.3 36
3.3+3-0(3.26) 64.4
4.4+3.6(4.23)Batch averageddischarge burn-up after par-ticular PC 12.76Number of dis-charged PAsafter parti-cular PC 79
42(42) 1(1) 7(1) 5591(25) 149(65) 48(48)24 12 0
48 2460(1) 30
26.1 28.8 ^33.0 ~11.5
72 67 50 54
12
139(50)
42.8
50
Notes: The following abbreviations are used:•th5 unit of Novovoronezh 1JPP: HV5; Zaporozhie HPP - Zap.
South Ukranian NPP: S-U; Balakovo HPP - Bal.Kalinin HPP: Kal.; Kbme-I»nitaJc HPP - Khm.
TVER-1000 make-up fuel enrichment increased to 4-23*-4-4# re-
sulted in reduction of annually discharged PAs to 1/3 of a core and
an increase of the batch averaged discharge burnvup to 42-44 HW.day/lg
(in steady-state 3 year PC - 33 in table 2). Certainly, to convert
a unit that early operated in a two year mode two transient cycles
*PA averaged profiled enrichment.

WO (index 3T in table 2) are needed. An exception was the 5 unit atthe Zaporozhie NPP, where the first and second fuel loads were con-stituted partially with 4-4/6 enriched fuel (3N, i.e,, unit operatedin non-stationary 3 year mode •- table 2).
4. ASSESSMENT OP PA CONDITION IN OPERATING AMDSHUT-DOWN REACTORS
"Nuclear Safety Regulations for NPP Reactor Units" f1J estab-lish the following operation limits for fuel damage in WER cores:number of defective fuels (gas leakage) must not exceed 0.2% fuelelements while that having a defect of a "fuel-coolant contact"type must be 0.0256 of the whole number of fuels in a core. The KPPsafe operation limit is reached when the above numbers are 5 timesexceeded, i.e., 1 and 0.1/6 fuels, respectively, which corresponds to
—othe coolant specific activity of 1.5x10 Ci/1 iodine radionuclides£l,2j. This activity level of the primary circuit coolant has neverbeen reached while the normal operation of units is paralleled bythe activity several orders of magnitude less.
After the reactor is shut down the fuel elements are subjectto inspection of fuel integrity (IPI). The need in IKE and numberof PAs to be checked are determined by the activity level of theprimary circuit. The control is based on measuring the leakage offission products from leakers by analyzing 1-131, Ca-134 and -137activities in water samples of IPI facility. The measured resultsare used for the analysis of the statistical radionuclide distribut-ion in all discharged PAs. All PAs are considered to be leaky ifthe 1-131 activity in them exceeds the average value by not less thantripled squared deviation("three sigma" criterion).
5. OPERATION EXPERIENCE AND INCREASEOP WER-440 FUEL BURN-UP
In December 1971 the commercial operation of the 3 unit ofthe Novovoronez NPP - the first serial WER-440 unit - started.Presently the total number of the units in operation with WER-440is 26 (8 in CIS and 18 in East European countries). The WER-440units in operation in CIS, including the 1s and 2nd units of theArmenian NPP that are not in operation now, had operated about 130fuel cycles by 01.01.92, i.e., about 15000 PAs had been discharged.In the main they operated in a steady-state three year mode. Thefraction of leaky PAs did not exceed 1.5-1*6$, that of fuels was0.00756
Noof
laoo
Descharged isoo -FAs
i+oo -
1200 -
10 12 14 16 18 20 22 24 26 28 30 32 34 36 38
Burnup, MWd/kgU
Fig. 2. Burnup Distribution of Discharged (IncludingDefective) WER-440 FAs.

Fig.2 is histogramme of distribution of discharged, leakersincluded, FAs vs fuel burn-up . It generalizes the operation expe-rience of the 1st and 2nd units at the Rovno HPP, ist-4th units atthe Kola HPP and 3d-4th units at the Novovoronez HPP during 1980-90.The total number of discharged FAs was 5429, including 35 leakers;the number of fuel cycles (years of operation) was 48. For the samegroup of FAs fig. 3 shows distribution of leaky FAs in years per1 GW(e) of installed capacity.
It can be seen from figs. 1-2 that with an increase of fuelburn-up the fraction FAs that loat their tightness during operationis not increased. In 1986 the maximum relative number of leaky FAsper installed capacity was 3.4 1/y per 1 GW(e) at the mean valueof 1.1.
Noof DefectiveFAs/Gw<e> 3-5 -
1979 1980 1981 1982 1983 1984 1985 1986 1987 1988 1989 1990Year
Fig. 3. Number of DefectiveFAs per GW(e) InstalledCapacity for WER-440.
The causes of WBR-440 FA leakage especially if a group of leakyFAs appears in a core are subject to careful study. Some of thecauses are discussed in [3]- At the early stages loss of tightnessby fuels was related to an increase of fuel pellet moisture contentand this disadvantage was eliminated. As is shown by figs.2-3 thereliability of WBR-440 fuel elements and assemblies is assessedto be high.
As the analysis of the primary coolant activity and hot cellinvestigations of fuel condition show the recently found out in-stances of fuel leakage are likely to be due to departure from designoperation conditions or other causes that are difficult to genera-lize because of the low extent of loss of tightness.
The high reliability of "the three year mode" fuel of WER-440,experience in its operation in a 4 year mode T2j, experimental anddesign work to improve fuel elements and assemblies as well as awhole complex of neutron-physics calculations of the core allowedvalidation of the conversion of the 3 unit at the Kola HPP to a4 year mode of operation at the 4.456 enrichment of the make-up fuelin standard FA (SA) and 3.656 mass U-235 enrichment of fuel in FA SUZ.In 1990 the work was completed, i.e., the whole core was fully madeup of higher enrichment fuel assemblies. The average discharge fuelassembly burn-up was 42 1W.day/kg, the maximum one was 48 NW.day/kg.
Table 3 presentjthe characteristics of the FAs of the K<ola HPP3d unit that were discharged during 1986-90, i.e., from the 5 to8 fuel cycle, some parameters of the unit operation (the number ofscrams and transients with a power change by more than 50/& of Pnoffl )the specific activity of iodine radionuclides in the coolant andIFI results in the shut-down reactor.

CO Table 3Performance of Kola NPP 3d Unit during 5-8 PCand Results of IFI
N Beginn- PC Average Hum- Mean en- Hum- Hum- I ac- Resultsof ing/End time, dis- ber riohment ber ber tivity, of IPI- _ . _ . - - - . - —————PC eff.
dayschargeburn-uftMW.day/
kg
of PAdis- <char-ged
.ofliseged
PAhar-, *
of of__„ total,•"^ sîSE «g
U-235
Hum-
of
num«nf
PA in-laakjvesti- PA
5
6
7
8
beginningend
beginningend
beginningend
beginningend
246
336
300
370
28.1
30.1
34.7
42.0
90
91
88
79
3.
3.
3.
4.
30
19
50
27
3 4
2 8
1 7
0 6
1.42.5
0.71.8
1.21.2
0.840.84
gated
12
12
12
12
0
0
0
0
During the reactor unit operation special attention was paidto the analysis of the fuel cladding condition. Table 3 tabulatesthe results of measurements of the primary coolant activity due tofission products (5-8 PC). The total activity of iodine isotopesvaried within 0.7x10~5 and 2.5x10~5 Ci/l;as a rule, the variationswere related to reactor transients (decrease and increase of power,start-up after maintenance etc). After the reactor had operated atthe constant power for 4-5 days the specific fragment activity be-came stabilized and remained constant. Even during transients when
the process of fission products release to coolant is significantlyintensified there was a two order margin as compared to the estab-lished value of the specific fragment activity.
The results of the fuel tightness control in some FAs enrichedto 4.4/6 attested their integrity.
Thus, the longer time of the PA operation and extended burn-upreached at the end of the four year cycle did not result in lossof tightness by fuel claddings.
Introduction of the four year fuel cycle improves the fuelutilization by ~1256 of the design one.
To validate the switching of WEE-440 to a five year mode ofoperation 12 PAs of the 3d unit at the Kola TOP were left in thecore to operate for the fifth year (the 9 fuel cycle). This expe-riment pre-checked by thermal physics and neutron physics calculat-ions was successful. The burn-up ~ 50 MW.day/kg was reached. Toreceive additional data on the 10 fuel cycle (5 year of operat-ion) 12 more PAs were left in the core.
To-date there is positive experience in the long-term steady-state operation of the 4*11 unit at the Kola TOP and the 2nd unit atthe Rovno NPP at the power of 10755 of nominal. The core performanceat the power of 107% of nominal meets the main design requirements.The specific activity of the primary circuit coolant did not signi-ficantly change which attests the high serviceability and reliabi-lity of the WER-440 fuels £2j.
The following conclusions can be drawn based on experience inthe WER-440 fuel operation:
1. Fuel elements and assemblies remain serviceable for 4-5years of operation to reach the PA averaged burn-up -~48 MW.day/kg.

CuCO
2. Maximum loss of tightness by fuels (gas leakage), does notexceed 0.007$.
3. Ho fuel assembly having enrichment of 4--4$ mass U-235 thatoperated for 4-5 years did not lose its tightness.
4. Ko interrelation between fuel leakage and burn-up has beenrevealed.
5. Relatively low number of leaky WER-440 fuel elements makesit difficult to generalize the causes of their loss of tightness,among them there is a departure from design operation conditionsand others.
6. OPERATION EXPERIENCE AND ETTEHSIOH OFWER-1000 KIEL BURN-UP
Table 4 lists the fuel cycle characteristics of 16 WER-1000units, in operation in CIS during the period up to 03.01.92. Itfollows from the table that at the beginning of 1992 the WER-1000units have operated 72 fuel cycles (fuel charges) including theschedule of the first year of the non-stationary 2 year cycle -15 FC, the 2nd year of the non-stationary 2 year cycle.- 14 PC, thesteady 2 year cycle - 18 PC, under transient conditions from 2 and 3year cycle - 17 FC, in non-stationary 3 year cycle - 2 FC and steady3 year cycle 6 FC.
Until 01.01.92 altogether 4210 FAs have been discharged fromÏVER-1000 reactors; 156 FAs were acknowledged leaky based on theresults of IFI, 154 of them have operated their life time and onlytwo FAs were discharged based on the "ahead of time" criterion. Someof the reloads did not contain leaky FAs at all. The realive number
E w ' ' pœ p £.!-• 0 1 1 f
S *v? w-* vi ro -^
_ » _ , _ » _ ! . - *ro ro ro o NCD CO CO CO CO-3 CT. CD — 3 VJ\
M w r* M »
Cn ij^3 _i i \J ^? -J>-A, "s. ~s *••- ""*"
Ni M Ki Ist
^ X» V» t\*
W ~*CQ « fri
VM
"°fä °rt ""*
_* ro -> ro wCD -_] ro -P- — 3
ro ro -» — 4 ro
r f ? r1 o° o 2 2 -o
1 t 1 1 N | g! W
= 5 = = - Ö 3 H I ( Co r - r fi l l i H i a - - yO P- W M -» 1« 3 1 1 Cfr (TP- M -* = 3 H
, , 1\Ti 4». \>J ro — » r*"
P3
8 _ i - » O - ' - * O O O - 1
r o w c r \ r o r o v / i v o - * wC O C D C D C O C D C O C O C D C O C D
M CD
» ? ? ? - « g g «
D i ' O ' - ^ - i . O ' — '-L ' * ' ' 'o a ~ * - •*«. -^ -*• ^*. -^ ^. -^
3^ O "r* -* 1C ^ cU O £i ~-3 tîi ^**U fvl^" W^\ O A
< A ^ ï i ^ > î i > a ^ ^ l i > î i ,
ov>» MW -i ro wro -* M v*>ro oro \JM1-3 Cû CQ Cû VI CO CO CO CO
v*>v*> vivJ -*VP rov>> Ov*J -P-VJ ro Ot UJM^ ^ t ^ ^ r t r t « c o
l-a « h3 CO
^W OfOCA CO
row o toCO CO
Orou
ro to ro ro ro v*> — » r o - ^ .VO O V*J — J VD V» (D — ' < ^ O ^
-* ro ro -*O v j V D c r * v n \ j j O r o v o O
0 - V P r o v i v D v n - ^ v . wO - t * 1 C D - i O O r O - o ^ » - C D
!zj
S0
o
s
oVI
COo
o
1"*"•»iz^»
^toCO
ro-•to
VIW
0^
CQ
4-Wu
COU!CO
-»CO
VJ1
ro~-3
VJl
CO
Cg
WffiH-
!Of» »3-»mo• rt-
8 S— • tu
gftrt
Saot-v
-p. o hd3.°Mpa Ëu, |
oH
** AMa
^ g.^4
Co >a•0a
\u *-t
H-0 0
O
MfS H-HCMO.cn g
s»!"st
P a o fefP3Hi
Ho-O P Ö *
a/>-c H-4p a 0 < tu oM c'a n« H-H rt-» !-•p. GD O H*i o a P** i K-

CO-fi No 4
of DefectiveFAs/GW(e) 3 5
-aT >u u.
')"" f1979 1980 1981 1982 1983 1984 1985 1986 1987 1988 1989 1990 1991
YearFig. 4. Number of Defective FAs per GW(e) Installed
Capacity for WER-1000.
of leaky FAs in relation to the total number discharged was ~3-l%,and to the number of the loaded FAs was ~ 2.656.
Pig. 4 shows a histogram of year distribution of leaky (1) FAsper 1 6V (e) of the installed capacity. The maximum (3.6") wasobserved only in the fuel discharged in 1983; the average value is~1.6, i.e., it is within the operation experience gained in WestEuropean countries and USA.
Fig. 5 shows a histogram of fuel burn-up distribution of thenumber of the discharged (leakers included) WER-1000 FAs. Of thetotal number (4210) of the FAs discharged before 01.01.92 a groupof 2842 FAs with a large extent of leakage was taken (1,35 leaky FAs)in relation to the whole massive of leaky bundles (156). It can beseen that the absolute number of leaky FAs is lowered with anincrease of burn-up.

No 120of Discharged
FAs
80 -
20 -
non-stationary2 years cycle
stationary2 years cycle
I l M M I I I5 10 15 20 I 25 30 35 40
I I I I ! I I I 145 50
Burnup, MWd/tUxlO3
No 100of Discharged
FAs
80
60 -
i i i i i i i i n i i i i i i r5 10 15 20 25
U1
Burnup, MWd/tUxlO3
ln
lines and numbers indicate quantity of Defective FAs)
Fig. 6. Burnup Distribution of FAs Discharged fromNovovoronez NPP Unit5mtil 01.01.1991 (thin
No 12°of Discharged
FAs
80 -
60 -
Burnup, MWd/tUxl53
No 60of Discharged
FAs
Burnup, M W d / t U x l O
Fig. 7. Burnup Distribution of FAs Discharged fromKalinin NPP Uni/until 01.01.1991 (thin lines andnumbers indicate quantity of Defective FAs)

COO)The analysis of the coolant activity variations during the
fuel cycle (the relations are given for all units in £3j) the résultaof IFI after the end of the fuel cycle and of post.-irradiationstudies allowed a conclusion to be drawn of leakage of an essen-tially single fuel element in each FA acknowledged to be leaky byIFI. Then the number of leaky fuels in relation to all dischargedwill be ~0.01# and that in relation to all loaded will be ~ 0.00856.
The analysis of the data on the coolant radio-chemistry showsthat on the whole the radiation conditions in the primary circuitsof the stations are normal. In the recent cycles the stable condit-ions were observed for the 5 unit at the Novovoronezh HPP, the1st and 2nd units at the South-Ukranian HPP, the 2nd unit at theKalinin HPP, the 1st and 2nd units at the Zaporozhye HPP, the 1st,2nd and 3d units at the Balakovo HPP, where the iodine radio-nuclide activity of the primary coolant did not exceed(1.5-2.0)X10~5 Ci/1.
In the other units the coolant activity as dependent on thenumber of leaky FAs varies within 1x10 -2.8x10~4 Ci/1 and tendsto decrease with the time of operation.
The conversion to a three year mode of operation was firstaccomplished for the 5 unit at the Hovovoronez HPP and the 1aunit at the Kalinin HPP and then for other units (table 4). Theunit operation under the particular conditions pointed to the highreliability of the fuel (fig.4). The acknowledgement of eight FAsof the 5tn unit at the Hovovoronez NPP to be leaky after the 9fuel cycle can be assessed ambiguously, since the primary coolantactivity did not exceed 2x10 Ci/1 (iodine radionuclides) duringthis cycle.
The average fuel discharge burn-up after the 3 year steady-state cycle is 42-44 MW.day/kg for the 5th unit at the HovovoronezHPP and ~ 40 MW.day/kg for the 1at unit at the Kalinin HPP (figs.6,7).The maximum FA burn-up in the 5 unit at the Hovovoronez HPP was-50 MW.day/kg.
The three-year mode operation of the TVER-1000 cores showedthat the improved so-called "three year" fuel was more serviceableand reliable as compared to the previously used "two-year" fuel(table 5).
Table 5Humber of WER-1000 FAs with "Two" and "Three" YearFuel that Losttheir Tightness during Three Year Operation
Humber of leaky FA^operated for year
Fuel quality
"Two-year""Three-year"
493
567
219
The work is under way now to validate the four year cycle ofWER-1000 fuel.
It is interesting to discuss the dependence of the averageburn-up and initial enrichment of discharged fuel on the year offuel discharge from the WER-1000 units (fig.8). It can be seenthat within 80-90 a higher burn-up was accompanied by an increaseof the initial fuel enrichment. However, the calculation shows thatbeyond 1990 it ia feasible to reach at least 55 MW.day/kg burn-upin fuel enriched to 4.4% /~4J- This is due to a partial or complete

o
S.DuS
m33.oerIoO
m
q|f g,3= 8» ?$"!to ^
D D>
o M3 S-* g1<3 a.« rio- a--n 3
introduction of the scheine of the in-reactor motion of fuels thatreduces neutron leakage (In-In-Out). The use of Zr-alloy spacergrids and substitution of steel guide tubes by zirconium ones willincrease the fuel burn-up.
The statistical analysis of the radiation conditions in theprimary circuits of the plants, the results of IPI and post-irra-diation hot cell studies show that the main causes of loss of tight-ness by WER-1000 fuels are:
1. No-optimized (accelerated) rate of reactor going to power,especially after loops are switched on [5], and departures fromdesign operation conditions (e.g., increased number of scrams).
2. Debris getting into the primary circuit coolant; they areorganic compounds (possibly,ion—exchange resin particles from awater clean-up system, residues of dissolvents employed to cleanpipinfl and ateam generators from activated corrosion products andoth) and foreign particles (different dispersity steel turningsfrom friction parta, carbon dust from pump bearings etc).
In some cases these impurity particles, can give rise to ahigher hydraulic resistance of PA and to fuel rod superheat, scoreof their surfaces, formation of heat insulation cruds at the surfaceand their local superheat. Similar phenomena took place in the 1sunit at the South Ukranian ÏTPP and in the 4 unit at the Zaporo-zhie SÎP.
The analysis of the results of the operation of 72 fuel loadsin WER-1000 and a series of experimental design and research anddevelopment work to validate the technology of fuel element andassembly fabrication and their characteristics shows that;

00 1 ) Fuel elements and assemblies retain the high serviceabilitylevel during a three year cycle and reach the batch averaged dis*charge burn-up of ~42-44 MW. day/kg and the maximum. PA one of~50 MW. day/kg.
2) As of 01.01.92 WER-1000 reactora have operated for 72fuel cycles (years), 4210 spent FAs were discharged, only 156 ofthem were supposed to contain a single leaker and only 2 from themrevealed PR's defect of type "fuel-coolant contact". The number ofsuch fuel elements does not exceed 0.008/6.
3) A considerably higher reliability has been demonstrated bythe "three year" fuel as compared to the "two year" one.
4) Higher burn-up does not lead to an increased frequency ofevents of losa of tightness by fuel elements and the tendency forits reduction is noted in FAs with the "three year" fuel.
5) It is established that in some cases loss of tightness (gasleakage) is due to departures from the design operation conditions,indegmately optimized methods and algorithms of power control andorganic substances and solid particles getting into coolant.
6) ïo further find out and generalize the causes of loss oftightness by standard WER-1000 FAs an analysis was performed ofthe irradiation history and operation conditions of leaky FAs; themost representative ones were taken for post-irradiation fill-scaleinvestigations.
References
1. Huclear Safety Regulations for HPP Units (NSR RU NPP-89)PN-AE-G-1-024/90, Goapromatomnadzor SSSR. M., Energoatomizdat,1991.
2. Proselkov V.U. et al. "Increase of Power at WER-440 NPP",Atomnaya Energiya, t.69, vyp.2, 1990, s.78-81.
3. Dubrovin K.P., Pâtieva N.L., Smirnov V.P. "Data on Loss ofTightness by Fuel of Water Cooled Reactor NPP in USSR", Paperpresented at TC of IAEA, Dimitrovgrad, 26-29 May, 1992.
4. Bibilashvili Yu.X., Onufriev V.D., Proselkov V.U., Pazdera P.et al. "Incentives for Extended Burnup for WER Reactors", TCMon Fuel Performance at High Burnup for Water Reactors,IWGFPT/36, pp.24-32., 1S31
5. Reshetnikov P.O. et al, "Problems in Pressurized Water Reactor(WER-1000) Puel Pabrication for Operation under Load FollowConditions and at Extended Burn-up", IAEA Conference on HuclearPower and Safety, IAEA-CH-48/244, 1988, s.537-547.
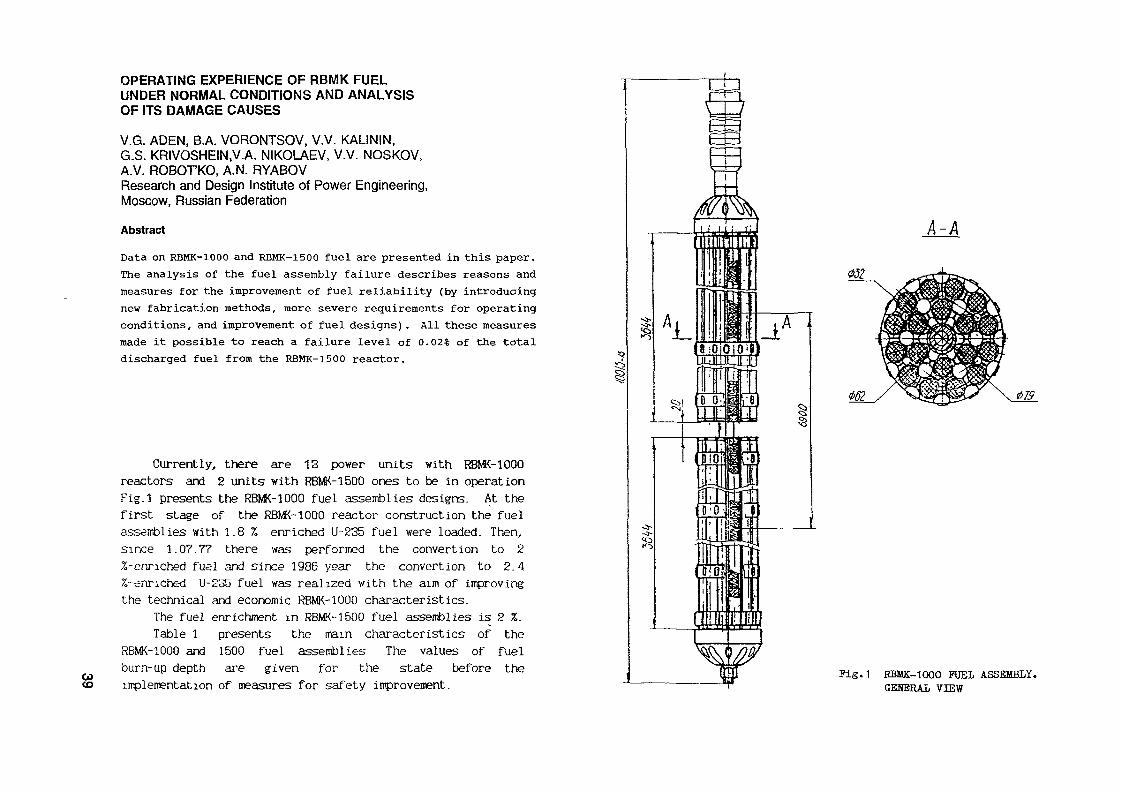
OPERATING EXPERIENCE OF RBMK FUELUNDER NORMAL CONDITIONS AND ANALYSISOF ITS DAMAGE CAUSES
V.G. ADEN, B.A. VORONTSOV, V.V. KALININ,G.S. KRIVOSHEIN.V.A. NIKOLAEV, V.V. NOSKOV,A.V. ROBOTKO, A.N. RYABOVResearch and Design Institute of Power Engineering,Moscow, Russian Federation
Abstract
Data on RBMK-1000 and RBMK-1500 fuel are presented in this paper.The analysis of the fuel assembly failure describes reasons andmeasures for the improvement of fuel reliability (by introducingnew fabrication methods, more severe requirements for operatingconditions, and improvement of fuel designs) . All these measuresmade it possible to reach a failure level of 0.02% of the totaldischarged fuel from the RBMK-1500 reactor.
COCO
Currently, there are 13 power units with RBMK-1000reactors and 2 units with RBMK-1500 ones to be in operationFig.l presents the RBMK-1000 fuel assemblies designs. At thefirst stage of the RBMK-1000 reactor construction the fuelassemblies with 1.8 % enriched U-235 fuel were loaded. Then,since 1.07.77 there was performed the convertion to 2^-enriched fuel and since 1986 year the convertion to 2.4%-enriched U-235 fuel was realized with the aim of improvingthe technical and economic RBMK-1000 characteristics.
The fuel enrichment in RBMK-1500 fuel assemblies is 2 %.Table 1 presents the main characteristics of the
RBMK-1000 and 1500 fuel assemblies The values of fuelburn-up depth are given for the state before theimplementation of measures for safety improvement.
A-A
Fig.1 RBMK-1000 FUEL ASSEMBLY.GEUERAL VIEW

As a result of measures implemented in 1986 forRBMK-1000 safety improvement, there were installed theadditional absorbers in amount of 80-100 absorbers and thereactivity margin was increased by 15 manual control rods(from 30 to 45 manual control rods). It resulted in decreaseof 2 % enriched U-235 fuel depth up to 15 MW days/kg U.
TABLE 1. MAIN FA CHARACTERISTICS
Parameter RBMK-1000 IRBMK-1500FA I FA
Maximum rated power of FA, kW 2850 4140Nonuniform power density distributionfactor: ". - " '
- in core height - 1.4 1.4- along the FA section 1.07 1.06
Maximum linear power of fuel element,W/cm , - 328 ' 485Fuel enrichment, % 2.0 2.0The fuel burn-up depth in fuel assemblybeing unloaded, MW days/kg U:
- average in reactor 22.4 21.6- in plato zone 24.6 23.0-' maximum in fuel 'element 26.4 • 25.0- maximum in the point 34.3 32.0
Fuel cycle duration of FA, days eff 1290 860Neutron fluence with energy of 21> 1 'MeV, n/cm2 1,3.10 l,3-lo'
There were about 55 additional absorbers to be installedin the RBMK-1500 reactor and the reactivity margin wasincreased by - 55 manual control rods. It resulted indecrease of burn-up depth up to ~ 17 MW days/kg U.Simultaneously with the implementation o£.' .measures theRBMK-1000 was converted to 2.4 X-enriched fuel in 1986. In
this case, the planned fuel burn-up was increased up to 22.4MW days/kg U Since July 1988 the RBMK-1500 power wasdecreased down to 4200 MW(th) (by ~ 13 %).
By the present t irre about 57000 fuel assemblies havebeen unloaded from the RBMK-1000, units including ~ 2770failed fuel assemblies and about 6000 and 267 fuel assembliesfrom RBMK-1500 power units, respectively. The total loss offuel burn-up, the value of which is lower than the predictedone and is resulted from the FA failure was equal to 360fresh fuel assemblies.
Figs. 2 and 3 present data on loss of FA tightness forIgnalina NPP Units 1 and 2, respectively during the wholeperiod of their lifetime. Besides, Figs. 2 and 3 show thefailure rate \ , which is the ratio between the number offailed FAs within the chosen range of burn-ups and the totalnumber of the exposed fuel assemblies, i.e.
X ~i
-N-&& doyS/FÄ)c - the number of failed FAs within the chosen burn-up
range -of & B, N - the total number of the exposed FAs.Fig. 2 presents the data on the failure rate of the fuel
assemblies for four units of the Leningrad NPP during thewhole period of operation- The comparison shows that on theaverage the characters of FE failure rate-for the RBMK-1000and 1500 are practically in agreement
To go into greater detail the operation time of theIgnalina NPP unit 1 should be devided into 4 stages:
- stage N 1 (12.83-0 485) - the period of bringing powerto the design figure from 0 to 4400 MW(th);
- stage N 2 (4 85-10.86) - the period of rated poweroperation of 4800 MW(th) ;
- stage N 3 (10 86-12 88) - the transient period duringwhich a number of organizing and technical measures forincreasing the reactor safety and reliability, wasimplemented;

5000
4000
3000
2000
1000
0 500 1000 1500 2000 2500Power Density, MW daya/PA
Pig. 2. WITHDRAWAL OP FAILED FUEL ASSEMBLES AT IHPP UHIT I1 - Total number of the exposed fuel assemblies2 - Humber of failed fuel assemblies, B-10""2, qnt3 - Failure rate, \ -S-IO^UIW days/FA)'14 - Failure rate LHPP, \.5-10-8 (m, daya/PA)
5000
4000
3000
2000
1000
0 t400 800 1200 1600 2000
Power Density, MW days/FA
Fig. 3 WITHDRAWAL OP FAILED FUEL ASSEMBLIES AT INPP UHIT 21 - Total number of the exposed fuel assemblies2 - Number of failed fuel assemblxes, N-10~-^, qnt3 - Failure rate, X -lu"8 I/(MW days /FA)

i i i im a o to P
co o ex»
c+ rt-rt-cto o o o
l tuCOW
and teohnolöglöalmonta on raliability impro-
vement
CalouUtion ooa «xp«rim«:talValidation
sS)

TABLES
In-pil« studlea at operating channel-trp« HFPa by Beans of measuringfuel assemblies (PA)
tinuou» temperature«ittitoria« of the fwelesttnts cladding« inseries unit« ofreactors
an th« stage of put* in ;into production the•«in unit of rf??
xmg-tersi tespermtur*•onitorlng of fu4l ei«-tents during the whole•A* iif« tiawO-4 rear«)mder various operation>des.Signal output for scnu*.tratest trip under lossaf «at«r" f roa th» cot«.
16 cbrooel-olur«! therao-couples «alToimly loca-ted sJUms tha zrhole helgtof the con in four ther-aoswtrlo f»el «lejsmts.Power sensor la th« cent-ral 91* cerity.
reae&rch tasksacagunag rxs foi'-ahurt'term testa
Ii
Verification of tb« oaiitealgn parameters offuel eleaents and *MJ»I-cladding teaperatur«;-fuel temperature;-local thersnl flux;-eloogatiaa of fuel «I«-««at claddings;-CPKgaseOUS fi*3ioti?roduot}pr«e?wr* iu fuel»Itawnts;-coolant parameter* ofth» inlet and outlet ofFA* ( ««vqrtrature .voidtzKctioptflo» rate os-ïiU&Uon ?Aa Tibi»tion.
2esre«
ÜIM Limited tests (.vf•*> 6 »oath in duration}uscordiag to speoifio lar*«ti£ation procruui•oarsfcL «vtlaatioa totopartrare fro« nucleate»llins•tijdroccoustical diacao*;ica;•ru*l éléments alone»-;ion under T»riou« ope-ration nodes.
?uel loading »odeainr*sti£atlaa undernominal power with, theuse of oharglnjE-v.
'-disottarglngiDncti^atlon of fueleleaenta of varioustypes i«dar pow«r ramiawith, their regular sub-stitution in PA«.
iof ?~M ma truaantationt «
} t-ieraoaetrlc 'ueltlearata wltii 4-4 chro-•el-«lunel thersoccnipleiMr «laoent 2-3 fuel•laatnt* with, neat fluxMuor1-2 fuel eleaent* Tilth»-to tiMraocoupl« latat fu»i centre 2 cen-ters of fuel el«B«atl'?ffi'H<«g «lon^tlon1.-2 £u*l eoltoi «hi; tMavors Z chzxMMl-«luad.thermocouple* fox cools*t««p«r«tur« aoaîtorin«1 Told fraction sensorJf floating t?7e(ia ainnrer).
)50-W chrooel-eJLuwlter*»cotïpl»« in 3-10ael «lestant* in the«o«t prohablA region of.epartur« naoreate bol-inx occux«nce. Up to 4uel «Ie4ants vita loo«!teat f Uot sensors.t)2 precaure oscillation«nsors and 2 plecoacoe-«rosaater in the upper«rt of PA hanger.)lnduottoa tjpe «ensora
if fu«l eleaenta clad-line elongation.
1)14-16 thermocouples3f 13« tjp« for fuelteaqMratur« attajntrosentla edge region offuel elements - 1-2shroKMl-alwMl therao-:oupl«* for ooolantteamerature »aacure-wnt«-Indépendant «lectroa,ntit with, sttaory to•tore *ig**lM fro»tluxmwoaplea Coutsid«the cora)2)at«ady fuel «leoantsrith chrooel-aluiMithermocouples and heatClux aensonitreplaoea-
no Instruaentation.
CO
«litt perform*«« characteristics
U ^ocinal coolant paxaaeters is' channel with n***ut!ng FA: water and «team-water mixture (x up to
o,4)- taoperatura up to 29<3 C;
•^ - pressure 7 jlPa.2) Cperating neaurcaent range of
«... ....*.... _. ( _ j^^ «l«^«it ol»d41ai« tenp«ra.t\ire— 25—.J&Q C^uc800 C - BKXMntarj-};
- fuel te«v«rature - up to 1800 C (2OOÛ C);- fuel «Zaaeuit oladdlng «longatlan - 0-6 m,- fuel eolvm shift - o-25 nu;- prescur« lacide fual «leaent cladding -
0,t-1.5(2.0) «Ta;- local beat flux - 200-5OO I/o» (TOO I/en);- MSS sta«« fzwctioa - 0,1-O»°ï- or*«ure oscllUttoa- - 40-8OO Pa-
- stage N 4 (12.88-12. aO) - operation at 4000 MW(th)power level under steady-state reloading conditions.
The failure" rate was calculated for each stage. Fig. 4presents the results of the calculations.
It is seen from Fig. 4 that the failure rate at thefirst and forth stage increased gradually with the powerdensity field growth. At second stage there was observed thedrastic increase in failure rate over the power densitydistribution range from 850 to 950 Mw* days/FA. In this casethe failure rate reached its maximum value which is equal toabout (23-24).It? i/(MW days/FA). The above character of thevariation in the failure rate permits to conclude that therewere significant disturbing factors in FA operation at thisperiod of time which promoted the increase in failure rate ofthe fuel elements.
As it is known, the operating reliability of fuelassemblies is determined by the design and quality of FA andFE manufacture, as well as by the operating factors. Theworks on improvement -of the RBNK FA reliability were carriedout in this directions (Table 2). The investigations ofeffect of the operating factors were carried out in threedirections. They are as follows:
a) statistic analysis of FA operation at the NPP;b) study of modes of operation with the aid of FAs
instrurrented by different sensors (Table 3);c) post-reactor investigations.The design and technological developments concerning the
reliability improvements were performed in the followingdirections:
a) upgrading the FA and FE designs;b) upgrading the manufacturing methods including the
mechanization and automatic production, as well as theadvanced technologies.
A complex of design and experimental studies permittedto define the boundaries of the safe operation of fuelassemblies, to determine the operating factors affectingtheir serviceability

From the considered 120 failed fuel assemblies there are.- 5 % of FAs with the detached plug, as a rule it is the
plug of the upper beam;- 20 % of FAs with flaws in the form of longitudinal and
annular cracks. And the crack can be observed not only in thecladding part contacting with the fuel column, but also inthe pressurizer;
-75 % of FAs without flaws.'The post-reactor investigations of the fuel assemblies
(in general, there were tested about 30 fuel assemblies inthe material science laboratories at the different fuelburrrup levels under normal and emergency conditions) werecarried out in the following directions:
- investigation of fuel elements and FA structuralcomponents behaviour at power cycling under emergencyconditions related with the dryout effect;
- substantiation of limiting serviceable lifetime of the.RBMK fuel assemblies;
- investigation of failed fuel assemblies with the aimof revealing the failure causes and mechanisms of throughcracks developments.
The material science investigations of fuel assemblieswhich have already achieved maximum burn-up of ~ 40 l^'days/kg U give quite favourable results with reference toresidual strength characteristics of "fuel elements, fuelstatus and FA structural components.
So, the mechanical properties of the specimens tested at25 C were within the range:
Initial values: End of lifetime:6c = 280-300 MPa 6 = 500-570 MPa6L= 220-250 MPa = 450-510 MPa
5 - 28-33 % 8 - no less than 12 %The hydrogénation of FE pipe metal was no more than
0.01 % (mass) with the favourable (annular) orientation ofhvdnde plates At the same time the emphasis was placed on
the significant corrosion growth in the form of localincreased thickness of oxyde on the outer surface of the fuelelement cladding under spacer grids.
The depth of the corrosion damage was equal to 36 % (mmaximum) of the initial thickness of the "actual"cross-section of the cladding. As the experience ofpost-reactor material science investigations . of the fuelelements and FA structural components shows, the main factorsresponsible for the premature failure of fuel assembliesunder normal operating conditions are the local volumetrichydrogénation and the stress corrosion cracking of FEcladdings in the presence of the aggressive fission products(J, Cs). The effect of the first factor is usually in theRBMK fuel elements with fuel burn-up of - 200-600 MW days/tU. The cracks in plugs arranged in the core centre, presentan example of the corrosion process mentioned above. Theformation of zirconium hydride penetrating through the wholethickness of the cladding was observed in the crack zone atthe concentration of_hydrogen dissolved in -the FE cladding of-no more than (2-4). 10 % (mass). In this case the content ofhydrogen dissolved in the FE cladding is similar, as a rule,to that of the leak-tight fuel elements even at the distanceof ~ 25-50 mm of the crack.
The secood factor - stress corrosion cracking (SCO) ofcladdings occurs at higher burn-up fraction.
In the RBMK reactor where the refuel 1-ing takes place atpower operation the stress corrosion cracking can be causedby:
- the flash-up of linear power of the fuel elements onfuel and additional absorbers reloading;
- the fluctuations of linear power of fuel elements due tothe skewness of axial power density distribution.
Fig 5 presents the axial power density distributionsobtained from 'the calculations for the reactor statescorresponding to the onset of unloading the additionalabsorbers, to the most skewness of power density distribution

0,5
7 8 z,mcore bottom
Pig. 5. AXIAL POiSSR DENSITY DISTRIBUTION DURING UNLOADING THEADDITIONAL ABSORBERS
1 - Additional absorber is inserted by 7.0 m, manual control rod isinserted by 0,58 m
2. - Additional absorber is inserted by 3.59 a, manual control rod -by 3.39 m3 - Additional absorber is inserted by 1.45 m, manual control rod -
by 4.43 M4 - Additional absorber is inserted by 0.51 m, manual control rod -by 4.43 m
A variety of the works has been carried out to increasethe quality of fuel elements manufacturing and theirstability in thermomechanical interaction of the fuel withcladding:
a) autcmized modular line for manufacturing the fuelelements was introduced in 1988. This made it possible toeliminate the potentially dangerous operations resulting inthe pellet failures and fuel column locking. At the same timeeddy-current monitoring of the claddings was additionallyintroduced to ultrasonic one. Moisture content in fuel wasreduced up to 2 ppm;
b) in a part of fuel element design, the facets wereintroduced to the fuel pellet, central opening of 2 + 0.3 mmin dia. was made in the RBMK-1500 fuel element pellet, thegeometrical fuel pellet dimension and density tolerancesbecame tougher, initial helium pressure under cladding wasincreased up to 0.5 MPa.
In 1989 the new regulations of refuelling that eliminateincrease in linear fuel element power due to axial powerdensity distribution skewnesses, were introduced at NPPs withthe RBMK-type reactors.
All the above-mentioned measures made it possible toreduce the fuel element failures up to 0.02 % for RB&K-1500and up to 0.05 Z of the number of fuei" elements that areannually unloaded from the reactors, for RSMK-1000. Thesubsequent improvement of the fuel ' element designs(introduction of cladding with pure zirconium sublayer,getters, absorbers in plug£) will make it possible to increaseadditionally the fuel element reliability.
01
by the time when the unloading of the additional absorbers iscompleted.
The experiments performed with fuel assemblies which areequipped with sensors for cladding alongation, fuel columndisplacement, as well as the calculations have shown the riskof such a condition from the viewpoint of FE serviceability.

O)FRAGEMA FUEL RELIABILITY: FROM DETECTIONOF FUEL FAILURES TO THE FEEDBACK ONDESIGN AND FABRICATION
A. DUMONTFragéma/Framatome Division Combustible,Lyon, France
Abstract
FRAGEMA fuel reliability is excellent and we are constantly working to improve it and bnng itto an as high as achievable level. This objective concerns all the aspects related to leaking fuel inPWR. The detection and the evaluation of the leaking fuel during reactor operation through coolantactivity analysis are carried out by using the MORGANE model. On-site facilities allow to detectthe leaking fuel assemblies (sipping test devices) and the leaking fuel rods (ultrasonic test device).The determination of the fuel rod failure causes is carried out by on-site examinations (EddyCurrent examination and macroscopic visual examination of the leaking fuel rods) and for someselected leaking rods by hot cell examinations. The main fuel failure origin is the presence of debrisin the primary coolant (70 % of the examined rods are damaged by debris). As a feedback on thefuel design, the new FRAGEMA fuel assembly (AFA 2G) is equipped with an anti-debris filter andis expected to have a leaking fuel rate near 5x10* rods per cycle compared to 1.5 x 10"5 presently.Concerning fabrication related defects, the quality control and the efficiency of non destructiveexamination methods are being continuously improved.
; : PWR - FUEL FAILURES - FUEL RELIABILITY - SIPPING TEST.
1. COOLANT ACTIVITY ANALYSIS
The coolant activity analysis is based on the MORGANE model which is a semi-empiricalmodel using simplifying hypotheses and benchmarked to FRAGEMA experience. The analyticalform of the model was determined from theoretical equations and the unknown coefficients weredetermined from PWR experimental data. One of the main simplifying hypotheses is that all thefuel rods operate at nominal power.
MORGANE uses 1131,1133,1134, Xel33 and Kr85m coolant activities to evaluate the numberand the severity of the defects. For each isotope, the measured coolant activities are corrected fortramp uranium contribution by using 1134 activity.
The coolant activity analysis in PWR shows that two types of defect can be distinguished :
defects releasing only gaseous fission products ("G-Defects")defects releasing both iodine and gaseous fission products ("I-Defects").
NUMBER OF LEAKING FUEL ASSEMBLIES DETECTED BY SIPPING TEST
Ol
31CD
c0>o
3Q.
Wl
OUG)

MORGANE calculates the number of the "I-Defects" from 1131 and 1133 activities, the ratio113I/I 133 giving an estimation of the seventy of these defects Then, MORGANE calculates thenumber of the "G Defects" from the difference between the measured Xel33 and Kr85m activitiesand the calculated Xel33 and Kr85m released by the "I-Defects"For most cases, the MORGANE results allow to assess satisfactorily the fuel rod condition (seeFigure 1)
2. ON-SITE FACILITIES FOR DETECTION AND EVALUATION OF THE LEAKINGFUEL RODS
2.1 Leaking fuel assembly detection
The leaking fuel assemblies can be detected by an on-line sipping test device inside therefuelling machine mast ôTby conventional sipping test cells in the spent fuel pool
The on-line sipping test device (DRMC), the process of which was developed by CEA,detects leaking fuel assemblies during core unloading operation in the reactor building, andthus provides a significant refuelling outage time saving [1] When the core is unloaded orshuffled, each assembly is raised from the core inside the fuel manipulator crane mast if onerod is leaking, the differential pressure caused by raising the assembly from the core cavityentails the release of the fission products through the cladding The device collects gaseousfission products (mainly Xenon 133) by means of an air stream which routes them to a gammaactivity measurement unit The top gripper position of the assembly inside the mastcorresponds to the optimum detection configuration the air stream covers the entire assemblyand the internal-external pressure difference is at its maximum Two minutes in this positionare needed before moving the mast
The advantages of the on-line sipping test system are as follows
only two days are needed for the initial installation,
the mast equipment is installed on the machine without modifications to the mastmechanical structure,
no additional operator is required for driving the system which is a self-operatedequipment,
only one modification to the unloading sequence is needed two additional minuteswith the assembly in the top gnpper position,
in case of leaking fuel assembly, a sound alarm informs the manipulator craneoperator
Figure 2 presents the main characteristics of the on-line sipping test system The gammaactivity detection limit is 1 2 x lO"6 Ci/m3, measured in CEA laboratory with calibrated source
Ol\3
B)3
0)O
o3
-sÏ2.5T3

COXe 133
ACTIVITY RELEASED
TEMPERATURE OF WATERIN SIPPING CELL (°)
I,
Equivalentdiameter of leaks - -
Experimental kinectlcs15 um
FIG. 3. Quantitative sipping test: Example of result.
TIME
A total of 55 on-line sipping test systems were installed by FRAGEMA (France,Belgium, Sweden, China). In France, all EOF plants are equipped with this on-line sipping testsystem, which is used routinely to detect the leaking fuel assemblies. The conventional sippingtest cells in the spent fuel pool are only used by EOF to perform quantitative sipping test inthe framework of the French policy of reloading selected leaking fuel assemblies [2].
Sipping test cells can be used for qualitative inspection (detection of Xel33 or Kr85during 10 to 20 minutes per assembly) or for quantitative inspection : determination of thestabilization kinetics of the Xel33 release during two constant levels of temperature (total timeper assembly : 2 to 3 hours) in order to evaluate fuel assembly equivalent leak size (see Figure3). A total of 31 sipping test cells were installed by FRAGEMA (France, South Africa,China).
In addition, a removable sipping test cell (AXCELL) has been developed byFRAGEMA.
2.2 Leaking fuel rod detection and examination
On-site ultrasonic tests are performed with the ECHO 330 device (developed by BWFC)in order to identify the leaking fuel rods inside the leaking fuel assemblies. The ECHO 330device is a system of 17 blades equipped with ultrasonic probes and allowing to scan thebottom or any wanted level of 17 rods at once. When a fuel rod is leaking, the water insidethe fuel rod induces the absorption of the ultrasonic signal and no echo of the signal is detectedfor this rod.
After removing the leaking fuel rods out of the leaking fuel assemblies, single rodexaminations are performed to characterize the fuel defects and to determine the causes of thedefects. Eddy Current examinations allow to identify the axial position of the defects.Macroscopic visual examinations with a high definition camera allow to characterize the shapeand the aspect of the defects and in most cases to identify their cause.
In case of need a single rod sipping test can be performed to check if the rod is leaking.
When no evidence of the fuel defect cause is obtained during on-site examinations, theleaking fuel rods may be sent to an hot cell laboratory for further non destructive examination,and destructive examination if necessary [3].
3. CAUSES OF DEFECTS
FRAGEMA, with the cooperation of the utilities (EOF, TRACTEBEL, VATTENFALL), hasundertaken investigations to identify the causes of leaking fuel since 1986. The first leakingrod examinations were carried out for fuel assemblies which released high fission productactivities in the primary coolant. Afterwards, leaking fuel rod examinations were performedduring repair campaigns. Up to now, most of the repaired fuel assemblies concern Inconel GridAssemblies. For these previous design fuel assemblies, repair campaigns are carried out inFrance only when several of them are in one pool [4]. In addition, the French policy ofreloading some leaking fuel assemblies [2] induces very few assemblies to be repaired.
As a consequence, baffle jetting failures being excepted, only about 10 % of the FRAGEMA17x17 leaking fuel assemblies were examined for fuel defect investigation. The baffle jettingfailure mode will not be detailed since it is well-known and appropriate actions were taken tominimize the baffle jetting incidence on the reactor operation (stainless steel rods,supplementary partial grids, up-flow conversion).
At the present time, the investigations performed on twenty three 17x17 assemblies containingthirty leaking fuel rods have allowed to identify the following causes :
Debris induced failuresGrid-cladding frettingFabrication related failuresUnknown cause
15 assemblies containing 21 leaking rods = 702 assemblies containing 3 leaking rods = 102 assemblies containing 2 leaking rods = 74 assemblies containing 4 leaking rods = 13

3.1 Debris induced failures 4. FUEL RELIABILITY AND FEEDBACK TO FUEL DESIGN AND FABRICATION
Seventy percent of the examined leaking rods were related to the cladding wear bydebris such as little springs or wires, metallic chips. The debris induced defects present typicalwear patterns on the cladding surface : comma shape wears are typically related to metallicchips, springs induce cladding wear corresponding to each spring coil and metallic wires caninduce large breaches in the cladding [3].
Most of the debris-induced defects are observed under the bottom grid. They generallyoccur early in the cycle and concern indiscriminately one, two or three cycle assemblies.
In most cases, secondary hydriding defects are observed : severe secondary hydridingis observed especially for rods operating at high power (hydride blisters and longitudinalcracks).
3.2 Fretting induced bv grid/cladding interaction
Fretting was observed on two fuel rods in one fuel assembly and on one fuel rod inanother fuel assembly. In both cases, the phenomenon occurred at the bottom spacer grid level.A very extensive programme of investigations was performed on the fuel assembly containingthe two affected fuel rods, yielding detailed grid cell dimensional information. The results ofdimensional measurements on the bottom grid cells (distance between dimple and spring in 2orthogonal directions) show very little difference between the cells where the fuel rods weresecurely held and the two cells where fretting wear took place.
In both fuel assemblies, the defect occurrence is estimated to take place either at theend of the second irradiation cycle or during the third one.The conditions for such a defect occurrence might plausibly be the conjunction of :- specific transverse flow condition located at the bottom end grid,- initial grid cell characteristics in excess of their specification values, inducing an excessive
relaxation of the restraining force.
FRAGEMA fuel, all designs included, is or has been in operation in 68 commercial PWRs.Irradiation experience is nearly 6.5 millions of fuel rods in about 25 000 fuel assemblies, the mainexperience being related to the 17x17 fuel design.
The fuel failure rate has been stable for 4 years at about 1.5 x 10"5 rods per cycle [5]. Morethan two thirds of the examined leaking fuel rods are related to debris-induced defects. So the fuelfailure rate attributable to fabrication is likely around 5 x 10^ rods per cycle.
As a remedy for debris-induced defects, FRAGEMA is now proposing for the 2nd generationof Advanced Fuel Assembly (AFA 2G) a bottom nozzle equipped with an anti-debris filter. Thisanti-debris filter is designed to trap the debris below the bottom nozzle with the same efficiencyas a fuel assembly spacer grid : debris larger than approximately 3 mm are retained. It is a verythin plate made of Inconel 718 with a final aging treatment providing the hardness needed towithstand the debris impact effect. Flow holes are made by punching.
Concerning fretting corrosion defects induced by grid/cladding interaction, so far a few casesof occurrence were observed and are related to Inconel grid design fuel assemblies manufacturedbefore 1986. No design problem was related to these few observations. Significant frettingproblems may exist only if the fuel rods are not well supported by the grids. Special care ismaintained throughout the fabrication process to provide fuel rods with sound support conditions.Up to now, no such defect was observed on Advanced Fuel Assemblies (AFA).
For the fabrication related defects, the defective fuel rods were inadvertently not scrapped. Toavoid such human errors, more and more automatic controls are implemented. In this way, anautomatic visual control of the claddings has been recently added to the automatic ultrasonic andEddy Current control. Also, all the AFA 2G rod welds are controlled by an automatic X-Raydevice (EIDOMATIX), in order to avoid human errors during weld controls.
CD
3.3 Fabrication - induced defects
Two rods presented fabrication related defects. The first one exhibited a longitudinalsinusoïdal crack and at the back of this first defect a radial crack. Such defect is typical of acladding pilgering problem. The second one was concerned by a defective weld at bottom endplug. In both cases, the defective products were inadvertently not rejected during fabrication.
3.4 Other investigation results
For four rods, the failure cause is still unknown after investigations. This is mainly dueto the difficulty of identifying the primary defect once the rod has been irradiated for a longtime after primary defect occurrence.
Waterside corrosion as a failure mode was not identified, nor an excessive rod bow orpellet-cladding interaction or internal hydriding.
5. CONCLUSION
FRAGEMA, with the cooperation of the utilities (EOF, TRACTEBEL, VATTENFALL),carries out investigation on fuel defects in order to :
- determine the fuel defect causes- implement changes in fuel design and fabrication- improve fuel reliability
The main fuel failure origin is the presence of debris in the primary coolant. The newFRAGEMA fuel assembly (AFA 2G) equipped with an anti-debris filter is expected to have aleaking fuel rate near 5 x 10"6 rods per cycle.For the few other remaining causes, intensifying leaking fuel rod investigations, with the relatedfeedback to design and fabrication, should lead to an as high as achievable fuel reliability target.

Ulo REFERENCES
[1] BORD Y, M , PARRAT, D , "On-line sipping test", IAEA Technical Commuée Meeting onPoolside Inspection, Repair and Reconstitution of LWR Fuel Elements, LYON (October 21-23,1991)
[2] BOURNAY, P , "Management of failed fuel during operation, french policy and experience",to be presented at this meeting
[3] BOURGOUIN, J et al "Enseignement tiré des résultats d'expertises de crayons decombustible non étanches", International Symposium Contribution of Materials Investigationto the Resolution of Problems Encountered in PWR plants, FONTEVRAUD H (September 10-14, 1990) - Volume 1, 131-141
[4] BOURNAY, P , "Inspection and restoration, EOF experience, policy and needs" IAEATechnical Committee Meeting on Poolside Inspection, Repair and Reconstitution of LWR FuelElements, LYON (October 21-23, 1991)
[5] BLANC, C., DUMONT, A , BOURNAY, P , DANGOULEME, D , "FRAGEMA fuelreliability", ANS-ENS International Topical Meeting on LWR Fuel Performance Fuel for the90's, AVIGNON (April 21-24, 1991)
SIEMENS KWU EXPERIENCE WITH LWR FUEL:FAILURE EVALUATION, MECHANISMS AND REMEDIES
R VON JANSiemens AG,Unternehmensbereich Kraftwerk Union,Erlangen, Germany
Abstract
After a brief survey of available operating experience with Siemens KWU LWR fuel, the causesand mechanisms of recent fuel failure and damage including the respective remedies arediscussed The results are based on asystematic fuel failure evaluation, which is divided into fivestages, (i) monitonng coolant activity, (u) pool-site examinations, (in) failure analysis, (iv)experience feedback, and (v) monitonng the success of remedies Details and expenence foreach of these topics are presented The continuous efforts of Siemens and the support of plantoperators in all stages have been essential to achieve and maintain high fuel reliability, and toimplement measures for further improvements
1 SURVEY OF OPERATING EXPERIENCE
The discussion and understanding of fuel failures requires some background information on fueldesigns and development including the available operating experience Since the mid GOiesSiemens has accumulated operating experience with commercial Zircaloy clad UO2 and MOXfuel in LWRs, covering 33 000 fuel assemblies with 4 million fuel rods inserted in 45 plants ofdifferent types and generations (30 PWRs, 15 BWRs) in Germany and other countries About60% of this experience has been gained with fuel m Siemens built plants, 40% with Siemens fuelsupplied to plants from other vendors As a consequence the variety of different Siemens fueldesigns is unusually large as shown in table I
In the last decade the average discharge bumups for many plants have been increased from theearlier standard values, i e 28 MWd/kgU in BWRs and 33 MWd/kgU in PWRs, to about 40 MWd/kgU in both types of plants, and currently inserted fuel batches will operate to even higherexposures A peak assembly bumup of 52 MWd/kgU has been successfully reached with PWRand with BWR fuel During the same time penod advanced fuel assembly types with enhancedfuel utilization and optimized spacer types, cladding and structural material with improvedcorrosion resistance, and more economic core loading and operating strategies have beendeveloped and introduced /1-3/ Some important features and the approximate time of theirintroduction are summanzed in figs 1 and 2
Parallel to these developments which were accompanied with increasing fuel duties, a very highoperating reliability has been achieved with average fuel rod failure rates near 10"5 per reactorcycle i e 1-2 failed rods per 100 000 rods in operation /4/ During the last three years higherfailure rates were exclusively caused by a particular type of PCI failure in some non-barrier BWRfuel to be described below

Table I: Overview on the Cumulative Operating Experiencewith Siemens/KWU LWR Fuel (Status 02/92)
Reactor AMwnblyType Typ«
SIEMENS- 14x14-16PWR 15x15-20(first cores,reloads) 16x16-20
16x16-20-4
18x18-24
Third-Party- 1 4x14-0 6+i)-PWR 15x15-(20+1)(reloads) ^
16x16-(20+1)
17x17-(20+1)
SIEMENS-BWR 6x6(first cores, 7x7reloads)
8x8-1
8x8-29x9-1
9x9-5
9x9-9Q
9X9-9QA
Third-Party- 6x6-1
8x8—2(reloads)
9x9-1
9x9-6
9x9-9Q
Total
Furt RodDlanwur
[mm]
10.75
10.75
10.75
10.75
9.50
10.75
J0.75
9.50
9.50
14.30
14.30
12.50
12.30
10.75
11.00
11.00
11.00
13.45
12.30
10.75
11.00
11.00
Numbw of Furt AMMnMlM / Rods
In Operation •ccumulaled
109 19.620 883 158.940
628 128.740 3.700 758.500
995 234.820 3.927 926.772
100 23.200 136 31.552
579 173.700 1.039 311.700
212 37.948 936 167.544
157 32.028 493 100.572
80 18.800 120 28.200
235 62.040 1.402 370.128
0 0 1.200 43.133
0 0 1.742 85.358
17 1.071 3.497 220.311
1.441 89.342 4.022 249.364
788 63.040 1.728 138.240
342 25.992 376 28.576
638 45.936 644 46.368
152 10.944 152 10.944
81 2.835 82 2.870
4 248 128 7.936
500 40.000 755 60.400
470 35.720 673 51.148
16 1.152 16 1.152
7.556 1.048.504 27.642 3.799.384
MaximumFA-Bumup[MWd/kgU]
41
50
45
41
43
43
51
35
52
28
38
38
41
52
44
42
24
20
40
40
41
38
52
Ol
FOCUS• Extended Burnup• Increased DNB-Margin• Improved Handling• Separation of Debris
DUPLEX Cladding (>50MWd/kgU)
PCA Cladding (45MWd/kgU)
Gd2O3, Full Low LeakageI Zry-Spacer Grid
2nd Phase MOX-Fuel Assemblies
Burnup Increase (38MWd/kgU)
Easy Removable Top End PieceIZry-Gulde Tube
Part Low Leakage
___T MOX-Fuel Assemblies (First Insertion)I Easy Removable Bottom End Piece
I75
i80
n '8570 75 80 85 90 Year of Introduction
Fig. 1. Development of Siemens Fuel Technology for Pressurized Water Reactors.
A ATRIUM 10-9Q: decreased liner heat generation rate,j increased critical power, extended burnup potential
ATRIUM 9-9QA: improvement of critical power andstability characteristics, extended burnup (45 MWd/kgU)
ATRIUM 9-9Q: improved fuel utilization,extended burnup (40 MWd/kgU)
I First reload with barrier cladding tubes
9-5: improved fuel utilization,extended burnup (35 MWd/kgU)
Introduction of 9-1 in complete fuel batches8x8 with increased critical power
Transition from 7x7 to 8x8 fuel design
Introduction of Gd203 as burnable absorberZircaloy spacer grids
I ' ' ' ' I ' ' ' '70 Year of Introduction65 70 75 80 85 90
Fig. 2. Development of Siemens Fuel Technology for Boiling Water Reactors

Ölro 2. CAUSES AND REMEDIES OF FUEL FAILURE AND DAMAGE
2.1. Introductory Remarks
Since the last international reviews on fuel failures, e.g. in Ref. /5,6/, the obvious world-widechange has been a drastic reduction of failure rates by successful countermeasures against allfailure categories, although many of them still persist even at todays low failure level. In somecases, as e.g. with the phenomenon of crud induced localized corrosion (CILC) in the field ofcladding corrosion, a larger variability in acting mechanisms as well as in contributing factorshave been recognized.
In Siemens fuel no new generic type of failure was found and not all types of failures reported inthe literature were encountered. In particular, there were neverfailures by dad collapse, CILC ordryout Although in several PWRs with high coolant temperature the design limits for cladcorrosion are fully exploited to reach high burnup goals, corrosion failures did not occur incommercial fuel due to permanent surveillance programs and optimized refueling schemes. (Inexperimental high power assemblies some corrosion failures were observed above 140 u.mcircumferentially averaged oxide thickness.)
2.2 Recent Experience with Siemens KWU Fuel
2.2.1 General
In the following we shall discuss the mechanisms and remedies of failure and damage ofSiemens KWU fuel in recent years. An overview on the causes of fuel rod failures and theirrelative importance is given in fig. 3.
fretting bydamaged spacers
(jelling inthe spacer
(with Inc spaceronly)
external causes(debns fretting,until 1988 alsocore baffle letting)
PCI(non barner fuel only)
PWR BWR
Fig. 3: Causes of Fuel Rod Failures and Their Relative Importancein SIEMENS/KWU Fuel (1985-91)
In both, PWRs and BWRs, only for a small fraction of rod failures the exact cause remainedunknown inspite of detailed rod examination and other analyses. In the case of BWR this fractionhas been somewhat larger and may contain unidentified PCI failures which typically occur m the2nd or 3rd irradiation cycle. The percentages of early failures with unknown cause are equallylow in BWRs and PWRs and are attributed to undetected deficiencies during manufacturing.Repeated checks and improvements in manufacturing procedures and quality control toeliminate all potential sources of impurities or other deficiencies led to a continuous decrease ofthose failures.
Further discussion has to be separated between PWR and BWR fuel, since all other features aredifferent in the two types of plants.
2.2.2 PWR fuel
Up to 2/3 of the rod failures in PWRs had external causes, i.e. core baffle jetting and debrisfretting. The former mechanism could be eliminated by repairing baffle joints and temporarilyplacing solid dummy rods on endangered positions; since 1989 only debris fretting wasobserved in this category. In future designs a debris separation grid at the lower end piece willprovide significant improvements.
Rod failures due to fretting by vibration within spacer cells occurred sporadically in 15x15 and16x16 fuel with Inconel spacers, preferentially in the bottom grid. So far the effect was notobserved in assemblies with Zircaloy spacers. Nevertheless, the effect needs further attention,particularly at extended burnup.
With the exception of an early event (Obrigheim 1974), which had initiated the introduction of PCIlimits in PWRs, not a single PCI failure has been observed in PWR operation, although the linearheat generation rates and burnups have been increased, and most plants are performing loadfollow operation. For this reason, and because of the fact that the PCI criteria for PWRspractically do not restrict load follow operation, there was never an incentive to use ZMiner(barrier) cladding in PWR fuel.
Occasional spacer damage was observed in connection with assembly bow. The mam effect isdamage of spacer corners during loading or unloading fuel assemblies, but fuel rod failures bysuch damage have been extremely rare (see fig. 3). As initial modifications of spacer cornerdesigns could not fully eliminate the problem, recommendations for loading and unloadingprocedures are still maintained and were successful in preventing this type of damage. Futurefuel designs will be further optimized to reduce the potential of both, assembly bow and spacercorner interaction.
A remark should be made to the mechanism of assembly bow in PWRs, which predominantlyhad been attributed to cross flow in the core. A cross flow model, however, could not explainfretting effects by spacer corner interaction (fig. 4) recently seen in mixed cores of 18x18 fuel(more specificly in assemblies with Zry spacers having diagonal neighbours with Inconelspacers). The interaction must have occurred during operation and was more pronounced inassemblies with strong radial power gradients near the core periphery. It was concluded and issupported by a theoretical model that such gradients may contribute to in-pile bow under certainconditions and had been responsible for the observations in this fuel type.

ença
Fig.4. Fretting Mark on a Zry Spacer ofa PWR 18x18 Fuel Assembly byDiagonal Spacer Corner Interaction
An isolated event of bow of some Zircaloy guide thimbles in a foreign plant (which in two casesled to damage during handling in the fuel pool) was found to be caused by unusual earlyhydrogen take-up from the coolant Since the effect is not generic, it will not be further discussedat this place. A brief description is given in Réf. ni.
2.2.3 BWR fuel
A majority of fuel rod failures in BWRs was caused by PCMnduced stress corrosion cracking in8x8 and 9x9-1 fuel not using the recommended remedy of a Zr-liner cladding. According todetailed analyses of power histories of affected 9x9-1 assemblies (from LPRM signals as wellas recalculations), and of the correlation to increases in activity release into the coolant, thefailures occurred under local ramping conditions which had not been experienced to a largerextent before but still maintained the given PCI operating recommendations. Since the failurescould not be explained by relevant tests and earlier experience, several rods were examined inthe hot cells under a joint program of the German utility group RWE and Siemens. The result wasthat an especially unfavourable type of pellet chipping and gap geometry had caused thesefailures, obviously by reducing the failure threshold compared to gap geometries with the usualpatterns of pellet fracture. Out-of-pile pressure tests on pellet columns could reproduce thisparticular chipping effect and were also able to prove that a modified shape of the pellet end faceand other measures to improve the fracture resistance of the pellets could prevent it. Theintroduction of these improved pellets is expected to solve the problem.
Rod failures by debris fretting occurred in BWRs with a much lower frequency than in PWRs.Smaller flow holes in the lower tieplate will be used in future designs and will further reduce theprobability of such failures. Significant damage of structural parts was not observed in BWR fuel.
Channel deformation is monitored by measurements and calculations with theoretical models,and an optimized "channel management" is applied for each refueling to avoid undue localpower peaking and control rod/channel interference.
3. MANAGEMENT OF FUEL FAILURES
From the beginning of nuclear energy production in Germany in the mid 60ies, the general policyof Siemens and of plant operators was not to reinsert intentionally leaking fuel nor damaged fuelwith the potential of developing a leak in the subsequent cycle. Therefore, Siemens was leadingin providing all necessary fuel services to identify leakers, failure causes and remedies, as wellas in designing repairable fuel assemblies and performing fuel repairs and reconstitutions.Nearly all fuel assemblies which failed before having reached their design bumup, have beenrepaired and successfully reused, which is an important contribution to optimum fuel utilization.This policy has been of great help to identify failure causes due to the possibility of closerexamination of fuel rods and structural parts during repair.
Of course, inadvertent reinsertion of a leaking fuel assembly did occur occasionally, when a leakwas not detected by sipping. There is no evidence for more severe damage of the fuel rods due tosecondary hydriding in these cases when compared to fuel rods operating only up to one cycle ina defective condition.
All finally discharged fuel assemblies with leaking rods are repaired before shipment for finaldisposal, as reprocessing plants would require encapsulation of such assemblies. Thiscircumstance provides for a very high percentage of fully examined fuel failures.
A major goal derived from the Siemens Quality Policy for the nuclear fuel is a systematic andcontinuous evaluation of the failure mechanism with immediate countermeasures to eliminate orat least to minimize the risk of failure in future operation. The corresponding procedures can besubdivided into five stages which will be described in more detail in the following chapter. Fig. 5shows the typical sequence for these partly overlapping activities.
4. STAGES OF FUEL FAILURE EVALUATION
4.1. Monitoring coolant activity
The 1st stage is monitoring fuel performance during operation by evaluating coolant acticivities(and off-gas activities in BWRs). The relevant nuclides for this purpose are Xe-133,135,Kr-85m,87,1-131,133, Cs-134,137, and Np-239. Fairly continuous (e.g. daily) measurementsover extended periods of steady-state operation are required to obtain reliable interpretations.
Today with over 90% of reactor cycles with Siemens fuel having zero or just one leaking fuel rod,one of the most important tasks is the unequivocal determination of a zero leaker condition. Thistask is easy to solve for clean reactor cores, but can be difficult in the presence of tramp uraniumfrom failures in earlier cycles. The best way we found is an empirical one. Firstly one has to

(Ji
ertucn
o
COT)'•g.(O0>Q.
cnTl CD
1» §_, CO
TO N>
S erCO «gs 2.C 0n detailed ex
ence for Fuel
-n n>». 3c 3'3 S.m §Co nC 1=SB 2.
CD
fO-1
»So§SI-£q(0 3.
3to
"° 3»0
0 0•O 3.IIo c
!"
1
If rem
edies inoved reload ft
i i
_ CD
.
""
C
5~r"|ico 5*
*i
~--
feedback intplant opérâtif appl.
o °
III^L^~3 oa
fgf
remedies intc
lufacturing,tevelopm
ent
^cCD
C
£
» T]3 to
^5cn $
ja — —Q rt ÛÏ
*< <D — --j Q
C W— r-t-
0) o> p)
CO
O fl>"O"*" ~^ "^
0»i:
18
c3'» -n•ilgft)v^ ^—QCOO CO3 =
^ro
(furtherinvestigationas required)
cn
l-
AV
V
i
1?tooI-»aso
sipping andinspections
CD
&
(further fuelexam
inationas required)
1
-\-/
i
to o 2
Hiv< 3 o3
CO
S'ccT1 --t CD
CL CDCD cni.3O ÎO
3 w3•"••
refinedleakerestim
ate 1'
L
c
p5 <•' r--
"(4- 3--T} :
^f
5~ jjjf»*
ITIl-
' TO--'Î30-mu,e'BEFSEU
~
»z- C3--"•!•— '-,•:?. --. .^^
LrJI^C*«* -.
•1-rrtnöSe*com. JJ,O
monitor the activity levels over the full cycle lengths including periods where the zero-leakercondition has been confirmed. Secondly one can take credit of the experience that most of thetramp uranium is deposited on fuel surfaces, which means that after refueling the activity fromtramp uranium is diminished by a factor approximately corresponding to the fraction of fresh fuelassemblies loaded into the core. Practically a 100% successful prediction of zero leakercondition is feasible on the basis of this information.
If the activity levels indicate a leaker in the core, an estimate of the number of leaking fuel rods isroutinely done by Siemens. Table II shows typical activities per leaker for several nuclides forcurrent 1300 MW Siemens type plants /8/. However, one has to be careful in application, sincethe activity releases of different nuclides are dependend on the type, size, and axial location of afailure as well as on the linear heat generation rate. Very often a simple application of such valuesproduces contradictory results for different nuclides, and special expertise with the evaluation ofadditional nuclides and nudide ratios respectively are required for a good leaker estimate, whichis generally more reliable with noble gas nuclides than with iodine nuclides.
Table II. Typical Activity Concentrations inthe Coolant and Release Rates (roundedvalues) for one Leaking Fuel rod /8/
Kr-85m Xe-133 M 31
PWR* 4-6 E8 Bq/m3 1-2 E10 Bq/m3 1-2 E8 Bq/m3
BWR* 2-6 E6 Bq/s 2-6 E6 Bq/s 2-4 E6 Bq/m3
•1300 MWe plants with typical purification ratesLower values (or smaller fuel rod diameters(18x18 and 9x9 fuel respectively),higher values for larger rod diameters( 16x 16 and 8x8 fuel respectively)
Without knowledge of the core position and power of the leaking assemblies, the accuracy ofleaker estimates is limited to about a factor of 2. But if (e.g. by flux tilting or after sipping) thisinformation is available, an accurate prediction of the number of leaking rods is usually obtained.
Continuous activity measurements allow the determination of the time when a failure occurs andthe assessment of the further operational behaviour of the leaking fuel rod. It can also provideearly hints on the failure mechanism (e.g. PCI and fretting type failures are often distinguishableat this stage). The details, however, are fairly complicated and have been summarized in Ref. /9/.
Flux tilting methods by evaluating the effect of moving control rods on the coolant activity areapplied in several German BWRs to localize the region of leaking fuel in the core, which can savesubstantial time in sipping.

Fig. 6
Methods and Equipment Used
Wet sipping techniquePool-site and In-core sipping equipmentUltrasonic detection of leaking fuel rodsULTRATEST equipment
Visual InspectionUnderwater TV camera (monochrome andcolor) with manipulator
Removal of defective rods transfer offuel rods to another skeleton reconditloning of structural componentsFuel assembly reconstitution equipmentautomatic positioning system tor fuel rodexchange device, EDM-cuttlng equipmentMeasurement of dimensions and forces,eddy current methodsAccessory equipment to the Inspectionequipment tor eg
measuring length bow, rod position(axial and radial)
- measuring oxide layer thickness ontuet rods and spacerscollection and analysis of CRUD
Accessory equipment to the reconstitutionequipment tor e g
measuring fuel rod length and diametermeasuring fuel rod oxide layer thicknessclrcumferentlallydetermination of spacer spring force
Individual equipment tor e glength and Integrity of guide tubesassembly hold-down spring force
SIEMENS/KWU Nuclear Fuel Service Tasks and Methodsfor Examination of Fuel Assemblies
Task
Checking for leaking fuel rods
Evaluation of general appearance(surface condition, deposits, wearintegrity of connections)
Reconstitution of defectivefuel assemblies
Examination on fuel assemblies,Individuel fuel rods and structuralcomponents lor evaluation ofoperational performance
Ol
4 2 Pool-site examinations /10/
Extensive pool-site examinations as outlined in fig 6 define the 2nd stage, starting with sipping ifthe coolant activity indicates a leaker Fuel inspections are performed routinely dunng refuelingto check fuel performance and include visual inspection as well as specific measurements e gfor length growth, bow, and corrosion as desired The scope of inspection includes leaking fuelassemblies and can provide preliminary information on the extent and mechanism of thedamage
With respect to fuel failure evaluation, the most valuable information is coming from the fuelrepair which is usually performed dunng the subsequent operating cycle of the plant It includes arod-t>y-rod examination fay eddy current measurements and detained visual inspection of thedefective rods with a high-resolution underwater TV camera, allowing videotape and
photographic documentation Also ultrasonic tests are used to identify the leaking rods in theassembly The repair campaign also provides an opportunity of closer inspection of innerstructural parts and other examinations e g of the residual spacer spnng forces
Based on the results of inspections and repair (sometimes supplemented by additionalinvestigations as discussed in section 4 3), the failures can normally be uniquely attributed toone of the categories shown m fig 3 The sections "not yet examined" in fig 3 refer to fuelassemblies, where the fuel inspection has been insufficient to clarify the cause, and repair is stillpending Nevertheless todays high percentage (nearly 100 %) of full examinations makes surethat there are no undetected failure mechanisms
4 3 Failure analysis
The 3rd stage is further failure analysis in order to fully understand the root cause andcontributing factors This task starts with a detailed evaluation of the documentation frominspection and repair, since it requires expertise to interprète the visual observations andmeasunng results ( e g to distinguish between primary and secondary failure or partial andthrough-wall damage in the case of a damaged fuel rod) In such cases a group of Siemensexperts from different disciplines meet to find the correct interpretations with a reconstruction ofthe most likely sequence of events which had led to the damage
Depending on the individual case, further analysis has to be done by evaluating and/orrecalculating fuel duties, power histones and bumup characteristics dunng earlier operation, bychecking the detailed procedures of core operation or fuel handling, by analysing the influence ofthermalhydraulic and water chemistry data, and of course by looking for correlations to specificfuel design and manufactunng features In some cases additional laboratory tests and analyticalwork, or even hot cell examinations are required for final clanfication
A full description of these activities is not feasible in this paper, as the detailed procedure variesfrom case to case The analyses of recent PCI failures in BWRs and of assembly bow in PWRs asdiscussed in chapter 2 provide good examples for more complex situations
44 Expenence feedback
As a result of the stages 2 and 3, adequate remedies can be defined to prevent reoccurrance offailures, and to mitigate the effects on affected assemblies dunng further oiperatjon Theexperience feedback by introducing such remedies is the task of stage 4 It compnses (i)immediate countermeasures in plant operation if required (eg modified operatingrecommendations or fuel handling procedures), (11) the implementation of identifiedimprovements in fuel design and manufactunng, and (in) the long^erm feedback into futuredevelopment of fuel designs and matenals Important is that this feedback is done as anmdispensible part of quality assurance and of the efforts to improve fuel performance
Beyond the examples given in chapter 2, the following story can illustrate the importance offeedback In the mid 70ies fretting in spacer cells had been the mam contributing factor to PWRfuel rod failures The root cause was found to be the low frequency event of inadvertentdeformation of spacer springs dunng manufactunng Tighter quality control in spacer fabricationand improved assembling procedures were able to reduce the failure rate of new assemblies by

ÖlO)
Average Fuel Rod Failure Rate by Fretting in the Spacer '
r~Average 73-76"
- Identification of calculated for the fraction ol fuelfailure cause " lnc- spacerfailure cause (no failure m fuel with Zry space«)
" not including the exceptional caseof Btolis B first core
Stepwise introduction of improvementsm spacer labncation and FA assembling
1 __ l Average 79-90
73 74 75 76 77 78 79 80
Year of Fabrication
90
Fig. 7: PWR Fuel Rod Defect Rate by Fretting within the SpacerCell for Assemblies with Inconel Grids
more than one order of magnitude (fig 7) Further reduction of the failure rate was achieved byoptimizing the spring charactensbcs, which has been particularly successful in Zry spacers withno failure in overS 300 fuel assemblies (corresponding to about 750 000 fuel rods) supplied up tonow.
The experience feedback also includes the evaluation of the world-wide fuel performance totake preventive actions if necessary An excellent example is available. When General Electrichad reported CILC failures in several plants and had identified Cu impurities in the water as amajor contributing factor, Siemens contacted the German BWR operators with "CILCsusceptible" plants and recommended stnngent control and limitation of Cu ingress by thefeedwater In this way the CILC phenomenon was not observed in German BWRs
4 5 Monitonng the success of remedies
The 5th and final stage is monitoring the success of the remedies This is mainly a repetition ofthe procedures of the stages 1 through 3 with the specific aim to quantify the improvements infuel behaviour and reliability after the introduction of a remedy However, this aim has theconsequence, that not only fuel failures have to be evaluated In addition to this a quantitativefollow-up of operating experience with all fuel assemblies is necessary in order to obtain thestatistical data base for evaluating the long-term development of failure rates from differentcauses and of other performance features
For Siemens KWU fuel this task is solved by storing the relevant information on designoperation and performance for each individual fuel assembly in a common data base Thisapproach provides quick access to the data and facilitates the necessary evaluations Anotheradvantage of this data base is of course, that summanes on relevant aspects of operatingexperience (as e g table!, fig 3, fig 7) can easily be made and updated
5 CONCLUSIONS
Inspite of the very low fuel failure rates the systematic and permanent evaluation of operatingexperience and fuel failures plays an important role today The continuous efforts of Siemensand the full support of the plant operators in all stages of fuel failure evaluation, with permanentlyaccumulating expertise and improving the methods of investigations, have been essential tokeep fuel performance fully under control, and to achieve and maintain high fuel reliability Theresulting detailed knowledge of the failure mechanisms and their relative importance are alsothe basis to implement effective measures for further improvements
REFERENCES
IM KREBS, W -D , HOLZER, R , WINNIK, S , Activities of a fuel supplier for Europeannuclear power plants, Kerntechnik 55 (1990, No 2) 87
121 LILL, G , KNAAB, H , URBAN, P, Advanced BWR fuel designs incentives,umplementation, performance verification, Proc ANS/ENS International TopicalMeeting on LWR Fuel Performance, April 21-24,1991, Avignon France "Fuel for the90s , Vol 1,p 74,see also SIEMENS Nuclear Fuel Report No 2 (March 1992) 11
/3/ HÖLZER, R , GARZAROLLI, F, ZIMMERMANN, R , Fuel design advancements byapplication of Siemens FOCUS technology, presented at the 7th KAIF/KNS AnnualConference, Apnl 21-22,1992, Seoul Korea,see also SIEMENS Nuclear Fuel Report No 2 (March 1992) 16
/4/ SIEMENS Nuclear Fuel Report No 2 (March 1992) 19
151 ROBERTSON, J A L , Nuclear fuel failure, their causes and remedies, (Proc ANS/CNA Topical Meeting of Commercial Nuclear Fuel Technology Today,April 28-30,1975, Toronto Canada), p 2-1
/6/ GARZAROLLI, F, von JAN R STEHLE, H , The mam causes of fuel elementfailure in water cooled power reactors, ATOMIC ENERGY REVIEW (IAEA Vienna)17(1979)31
n I SIEMENS Nuclear Fuel Report No 2 (March 1992) 42
/8/ BLEIER, A , FISCHER, G , SIEMENS AG KWU, Department Radiochemistry,personal communication

/9/ SCHUSTER, E., von JAN, R., FISCHER, G., Evaluation of fuel performance fromcoolant activity data, Proc. ANS/ENS International Topical Meeting on LWR FuelPerformance, April 21-24,1991, Avignon France, "Fuel for the 90 s" Vol.1, p. 285.
/10/KNAAB, H., KNECHT, K., JUNG, W., Pool-site inspection and repair techniques,Atomwirtschaft-Atomtechnik 37 (April 1992) 194;see also SIEMENS Nuclear Fuel Report No.2 (March 1992) 33.
cn
ABB ATOM FUEL FAILURE - AN OVERVIEW
L. LUNDHOLM, B. GRAPENGIESSER,D. SCHRIRE, L HALLSTADIUSABB Atom AB,Västeras, Sweden
Abstract
This paper presents the recent experience of ABB Atom fuel failures,inspection results and failure remedies. The failure frequency for fuel rodssupplied since 1979 is 6x10⁻⁵ (all causes), and <2xlO"5 when proven debrisfretting and other non fuel-related causes are excluded. ABB Atom aims toidentify the cause of every failed rod, to help achieve a zero failure goal. Reactorcores are assured free from failures at start up after refuelling.
ABB Atom carefully follows the monitored leakage. Up to 1986 the number ofleaking rods could usually be estimated from leakage levels of radio-isotopes ofxenon, cesium, iodine and neptunium. However, these correlations are notalways accurate, since the power rating has been upgraded. Xe-133 leakagerate is still as the best measure of the number of fuel failures in the core. TheCs-137/Cs-134 ratio is useful for assessing the burn-up of the leaker. Np-239 isused to determine the amount of fuel in direct contact with the coolant, and isused together with different iodine isotopes to follow the development ofsecondary defects. Anticipated leakers as determined from flux tilting and in-core or out of core sipping are subjected to pool-side inspection. This includesvisual inspection, eddy current testing and sometimes gamma-scanning, inorder to determine the location and primary cause of failure. If the causecannot be determined with certainty in the poolside inspection, or in otherexceptional cases, hot cell examination is performed.
Fretting by foreign debris has been determined as the predominant cause offailure (at least 39 of 58 failed rods since 1979). Debris fretting occurs close to orwithin a spacer, and can be positively identified by the appearance and exactlocation of the fretting hole. Severe secondary degradation may hide theprimary failure, and it is believed that most of all of the 14 unidentified casesare also caused by fretting. Only one rod is known to have failed as a result of afabrication fault: this was a PWR rod of early design which is thought to havefailed due to low spring force. In 1988 in Oskarshamn 2 four rods failed due todry-out.
Remedies are being implemented to minimize the risk of fuel failure, as wellas to ameliorate the effect of failure. Debris filters have been designed andverified out of pile for both BWR and PWR fuel, and will be tested in powerreactors from 1992. A new corrosion-resistant liner cladding has been proveneffective in reducing the extent of secondary hydriding failure in BWR linerfuel.

ülCD
1. INTRODUCTION
ABB Atom defines fuel failure as penetration of the cladding, although inpractice fuel failure is only identified by activity release. This paper presents abrief overview of our recent experience with fuel failure causes, detection,behaviour, management and remedies, covering fuel loaded after 1979, or fueldelivered since 1978.
2. DETECTION AND CHARACTERIZATION OF FUEL FAILURES
2.1 Monitoring of fission product releaseThe utilities carefully follow the activity in the coolant and offgas. Noble gasesare measured "on-line" in the offgas system. The offgas measurements areperformed at the turbine condenser ejectors (system 552) or at the plant mainstack (553), as shown in Figure 1.
The "£6" (sum of the six most important noble gas radionuclides) is frequentlyquoted as a measure of release rates. However, these six krypton and xenonisotopes have very different production ("birth") rates and half-lives (Table I).
Table I. Sum-of-six
fromSeal steamcondenser
from Turbinecondenserejectors
Recombiners
Isotope
SSmKi-8?Kr88Kr133xe135xe138xe
Half-life
4,5 h76 min2,8 h5,3 d9,1 h14 min
Production raterelative to Xe- 133Bq/s42516110359
332
312 Fe<xJwater lines321 Stxrtöcwn cooTmg system331 Reactor water cleanup system332 Coodensate cleanup system
with precoat filters
FIG. 1. The ABB Atom offgas system.
FIG. 2. Primary water cleanup system.
Due to their different half-lives, these isotopes also have very differentdetection-to-birth ratios, depending on the overall transport time from birth todetection. This transport time includes diffusion and transport within the fueland fuel rod, excepting when the fuel is in direct contact with the coolant.
The 133xe leak rate is probably the best measure of the number of fuel failuresin the core. !33Xe has a comparatively long half-life (5,3 days), which meansthat it is relatively unaffected by the transport time within the fuel rod prior torelease to the system. Activity levels of short-lived isotopes are on the other

hand strongly affected by the time for diffusion out of the rods. These isotopesthus dominate the measured noble gas activity when there is extensiveexposure of fuel to the coolant, as is the case with tramp uranium, or severelydegraded secondary defects leading to fuel exposure, since they dominate theproduction (Table I), and recoil release from fuel surfaces is essentiallyinstantaneous. In addition, the recoil release from tramp uranium has arelease/birth ratio of about 0,5 (50% release), with the rest firmly embedded inthe cladding. The ratio of a short-lived isotope (ABB Atom uses 138xe with ahalf-life of 14 minutes), to a long-lived isotope (133xe) indicates the degree ofdegradation. This ratio is especially sensitive to the increase in the diffusionalrelease stimulated by the oxidation of the UO2- It should be noted, however, thattransportation delays within the primary circuit before detection can still makea large difference to the detection-to-birth ratios of the different isotopes andmust be corrected for when comparing failures in different reactors.
Non-volatile isotopes are "Measured in the reactor water cleanup system (321)as shown in Figure 2. 239>jp (with a 2,4 d half-life), daughter activity to anactivation product of 23§u, indicates the amount of fuel in direct contact withthe coolant. It is released by dissolution together with uranium, as well as by ß-recoil when essentially only the decaying nuclide (239u) itself is transferred tothe coolant. Together with different iodine isotopes, it can be used to follow thedevelopment of secondary defects, and is also used to assess fuel erosion.
Ü1(O
(g d) is of interest from a radiological standpoint: refuelling outages mayoccasionally be delayed by high levels of 13 lj jn connection with coredepressurisation, resulting in large additional costs . However, iodine is aquantitatively poor indicator of fuel failures. It is distributed in a complicatedmanner between both water and steam, and it's volatility ratio depends onreactor design. Iodine also shows a different behaviour in water compared tosteam.
A correlation has been found between secondary failures with claddingdeposits of fissile material and the activity level of S^Co. ft js believed thatfission recoils from the thin layer of fissile material, which plates out on thecladding, ejects S^Co from the crud layer. This effect is thought to be largeenough to increase the 60 Co release to the degree observed, and is thus anexample of an indirect radiological consequence of severe secondary fuel roddefects.
Since 137cs js proportional to burnup and 134QS is proportional to the square ofthe fluence, the l"4Cs/137çs ratio is useful for assessing the burn-up of theleaker. Many BWR utilities use flux-tilting at reduced power prior to shutdownat the end of a cycle, in order to locate the leaking assembly by correlatingleakage response to control rod movement. This technique is usuallysuccessful in localising the leak at the "supercell" level (i. e. the fourassemblies adjacent to the same cruciform control blade). Additionalinformation on the burnup level of the leaking rod can sometimes then be usedto identify the individual leaking assembly, when the four assemblies in the
supercell have different average burnups. This practice leads to efficient use ofthe short Nordic BWR annual refuelling outages, since a limited number ofassemblies have to be checked by sipping in order to assure a failure free coreat the start of the next cycle.
2.2 Poolside InspectionAnticipated leaking assemblies, as determined from flux tilting duringoperation, undergo in-core or out of core sipping after reactor shut-down. ABBAtom has developed advanced sipping techniques, which provide enhancedsensitivity and speed of operation. After the leaking assembly has beenidentified, the individual rods are subjected to pool-side inspection. Thisincludes visual inspection and eddy current testing. Gamma-scanning hasbeen used to determine the amount of uranium lost by erosion in a severely'degraded defect rod. Gamma-scanning has also been used to locate regionswith extensive Cs-137 release, and thereby determine the axial location ofpenetrations.
23 Hot-cell examinationsIf the failure cause cannot be determined with reasonable certainty in thepoolside inspection, or when additional valuable information on failure anddegradation mechanisms is desirable, hot cell examinations are performed. Arelatively large number of the failed rods have been shipped to the Studsvik hotcells for PIE; this work has largely been financed by the Swedish utilities.
Visual inspection, neutron radiography, profilometry, eddy current testingand axial gammascanning have been used to locate and identify the cause offailure, as well as the extent of cladding damage and fuel and fission productloss. In addition to these techniques, metallography, ceramography,microgarnmascanning, scanning electron microscopy of the fuel and cladding,pellet-clad gap and fuel density measurements, and cladding hot extractionhydrogen measurements, are some of the methods which have been employedat Studsvik to clarify the mechanisms of failed fuel behaviour.
3. EXPERIENCE
3,1 Failure causesFretting by foreign objects (debris fretting) has been identified as the primarycause for at least 39 of the 58 failed rods since 1979, and is thus thepredominant failure mechanism (Figure 3). Debris fretting occurs close to orwithin a spacer grid, and can often be positively identified by the appearanceand exact location of the fretting hole. It is likely that most of the 14 remainingunidentified cases are also caused by debris fretting.
Four rods failed in Oskarshamn 2 in 1988. Pool-side inspections includinggamma measurements quite clearly indicated that the cause was dry-out,which was later confirmed by hot-cell examinations in Studsvik. The axialdistribution of 137(]s revealed a loss of cesium in the "dry-out zone" indicatingexcessive temperatures in that region. This technique was also valuable for

O3O Fuel Failure Cause 1000 -3
H Not inspected
[3 Non-identified0 Gnd springE3 Single event&£3 Debris fretting
FIG. 3."ABB Atom fuel rod failure experience.
G Debns fretting
E3 Other causesor unidentified
81 82 83 84 85 86 87 88 89 90 91
Failure Indications at outage year
FIG. 4. Debris fretting and other fuel failure causes versus outage year.
experimental power characterization in the dry-out region, which showed thatnon-failed neighbouring rods had operated at excessive power ratings due tochannel bow.
Only one ABB Atom rod is known to have failed since 1979 as a result of afabrication error; this was a PWR rod of an early design and it is believed tohave failed due to an insufficient spacer spring force.
100 -
10 -.
Sponge liner
Sn-alloy Liner
1 0 2 0
Average HOL LHGR (kW/m)
FIG. 5. Average 133Xe leak rate (MBq/s).
3 0
1000
crm
100-
10 -
a na
1 0 2 0 3 0
Burn-up (MWd/kgU)
FIG. 6. Leak rate of 133Xe versus burnup
4 o

Table II.
Failures on fuel loaded after 1979
Unit
BWR 1BWR 2BWR 3BWR 4BWR 5BWR 6BWR 7BWR 8BWR 9PWR 1PWR 2
BWR 10BWR 11BWR 12BWR 13BWR 14PWR 3
BWR 15PWR 4
BWR 16PWR 5PWR 6
I
Failure indications
Z
1453
2504-45.2102000200000
58
81
0
0
1--0
• o-0
--0
0
--
------
1
82 83
0 0
0 0
1 0
0 0
-0 0
0 0
-0 0
(2)
0
0 0
0 0
---------
1 0
84
0
0
0
1-0
0
-0
(2)
0
0
0
---------
1
at
85
0
0
10
0
0
0
0
10
0
0
0
---------
2
outage
86
0
10
0
30
0
32
(3)
0
0
1
-
0
--
-
--
1 0
year
87
0
0
0
0
0
0
0
0
0
(1)10
0
-0
--0
--0
0
1
88
0
0
0
0
30
4120
(2)
0
0
0
0
0
-0
--0
0
1 0
89
0
2û1
1 00
0
0
0
(1)(1)0
0
0
0
0
10
--0
0
1 4
90
10
1150
0
0
0
20
0
0
00
0
10
0
0
0
0
1 1
91
0
110
40
0
0
0
(1)0
0
10
0
0
0
0
0
0
0
0
7
Bold faceNumbers in brackets
0
Final dataABB AtomNo outage
rods in W skeleton.
&2 LeakageABB Atom has performed several studies of activity leakage rates. These haveshown that the number of leakers and leakage levels of radio-isotopes of xenon,cesium, iodine and neptunium are not always well correlated, due to poweruprating and non-homogeneous axial power distributions. However, certaintrends are evident.
The leakage rate increases with the linear heat generation rate (LHGR), sincevital mechanisms such as diffusion and chemical reactions accelerate withtemperature. The effect of power on activity release rates is seen in Figure 5,where the release rate is plotted against the rod average LHGR for different rodfailures.
When the primary cause, normally fretting from foreign debris, results in apenetration of the rod cladding, steam enters the rod and the internal pressureequilibrates with the system pressure. It is easier for the fission gas (both thepreviously released gas in the rod free volume, as well as ongoing gas release),to leave the rod after pressure equilibration. Earlier released fission gases leavethe rod by diffusion and pumping ("breathing") due to small power-inducedtemperature and pressure changes. Leakage from a single minor hole must bepulsed, since fission gas (normally) cannot escape from the rod unless anoverpressure is generated all the time.
An open pellet cladding gap is a prerequisite for efficient dispersion of waterand fission products along the rod. Hence, low burnup would be expected tofavour large leak rates. This effect can be clearly seen in Figure 6; although thedecrease in release with increasing burnup is mainly due to the lower powerlevels at higher burnups, correction for the LHGR reveals a residual burnupeffect which is independent of the power. PCI failures should therefore onlyslowly lead to extensive secondary damage and leak rates, since the gap isclosed (by definition) when the penetration occurs. On the other hand, a largeprimary hole, such as those caused by fretting, with a large gap (early in life)may be expected to lead to rapid detoriation of large axial parts of the rod andconsiderable leakage.
Local oxidation of the fuel from U02.00 to more hypererstoichiometric statesleads to an increase in the self-diffusion and fission product diffusion rates, aswell as a decrease in the thermal conductivity. These effects lead to a markedincrease in the local fission gas swelling and release, as well as grain growth.
3.3 Secondary failuresThere is no certain way, other than experience, to predict precisely if and whena secondary defect will form.
Due to oxidation of the fuel, and radiolysis of the steam entering the rod, theH2/H2Û ratio is changed, eventually leading to rapid local hydrogen pick-up bythe cladding at some location (some distance away from the primary leak) witha favourable H2 and H2Ü partial pressure. Areas of the cladding with littleprotective oxide, as well as Zircaloy with locally reduced resistance (such asheat affected zones near welds), are particularly susceptible to hydriding.Having established a secondary hydride defect, a steamflow ("chimney effect")can be created through the rod, which in turn exposes much more of the fuelstack to steam, and causes even more fission product release as well as directfuel erosion in severe cases.
The steamflow can limit any further hydriding between the two leak sites, butthe conditions required for hydriding may again be established at a new site. Asecondary hydride defect may also propagate by a delayed hydrogen cracking

O> mechanism, if sufficient cladding hoop stresses are built up by fuel swelling orcladding oxidation and hydriding.
3.4 Liner rodsOnly two ABB Atom liner-cladding rods have failed, both due to debris fretting.In recent years, ABB Atom has been supplying Sn-alloyed liner with improvedcorrosion resistance. Ramping tests in the R2 reactor at Studsvik verified thatthe PCI advantages were the same as for zirconium liner. A sponge liner rodfailed in Oskarshamn 3 with severe degradation leading to a very large release,while a rod which failed in Barsebäck 2, with the optimized liner proved itseffectiveness in reducing the extent of secondary hydriding propagation inBWR liner fuel (Figure 5).
4. MANAGEMENTSince the leakage rate increases with LHR, reducing the local power in anassembly with a leaking rod is helpful in reducing the activity leak rate, as wellas the onset of secondary defects.
When a severe fuel failure is present, avoiding power cycling (such as daily orweekly load following) can alleviate secondary degradation.
The Nordic utilities avoid reinserting defected fuel (i. e. assemblies known orstrongly suspected of containing one or more defected fuel rods), a practicewhich ABB Atom strongly recommends. Rapid location of the leakingassembly, and efficient ICFM routines, have enabled the Nordic utilities toimplement this policy without impacting on their short annual refuellingoutages, and thus maintain their high plant capacity factors. The failed fuelrod can then be identified in the poolside inspection, removed and replaced, sothat the assembly can be reinserted at a later stage.
ABB Atom and the utilities share the common goal of identification of theprimary failure cause. Only by identifying the cause of failure is it possible totake steps to prevent its reoccurrence. A deliberate policy of failure causeidentification is implemented by the utilities in Sweden, and is facilitated byrelatively easy access to hot cell facilities at Studsvik.
5. REMEDIES
Remedies are being implemented to minimize the risk of fuel failure, as wellas to minimize the effect of a failure if it still appears. Changing from 8x8 fuelto the SVEA concept is, in itself, efficient in reducing fuel failure due to debrisfretting, since the bottom tie plate stops wires better than the old 8x8 bundle.
5.1 Debris filterDebris filters have been designed and verified out of pile for both BWR and PWRfuel, and will be tested in power reactors from 1992. For BWRs the design ismade up of four separate debris filters mounted in the bottom tie plate of thebundle (Figure 7). In laboratory tests the debris filter has been shown to trap 65-100 % depending on the type of debris, and together with the bottom plate,
FIG. 7. Debris filter SVEA-96.
catches 85-100%. It traps all the swarf, and almost all of the wires, which aretypical fretting debris.
ABB statistics show that about 70% of PWR fuel failures are caused by debris.ABB Atom supplies the ABB CE Guardian™ grid for PWR fuel (Figure 8). Thedebris tend to be trapped between the lower end fitting and the grid. If trappeddebris vibrates here, it will harmlessly contact only the solid end cap whichgoes into the Guardian™ grid. The debris stays within the fuel assembly and iseventually discharged with the spent fuel.

BOTTOM NOZZLEFLOW HOLE
ROD SUPPORTFEATURES
BOTTOM NOZZLE
DEBRIS STRAININGFEATURES
FUEL ROD
DEBRIS STRAININGFEATURES
CD
T3S)(QCD
CTS)
O)CO
FIG. 8. The Guardian ™ design.
5.2 SVEA 10x10SVEA 10x10 is a more favourable design as regards of leakage due to its lowerlinear heat rate and the fact that there is a smaller amount of fuel in each rod.No ABB Atom 10 x 10 rod has failed to date.
ACKNOWLEDGEMENTS
We are grateful to the utilities without whose efforts the data and information,on which our understanding of fuel failures is based, would not have beenpossible. In particular, we would like to mention OKG, SSPB, Sydkraft andTVO, who financed most of the in-pool and hot cell examinations.

DETECTION AND MONITORING OF FUEL FAILURES
(Session II)
Chairmen
M.GROUNESSweden
TJ. CARTERQpnarla

O>
CORRELATION BETWEEN FISSION PRODUCTACTIVITY IN PWR PRIMARY WATER ANDCHARACTERISTICS OF DEFECTS IN FUEL CLADDING
C. LEUTHROTDirection des réacteurs nucléaires,Commissariat à l'énergie atomique,Saint-Paul-Iez-DuranceA. BRISSAUD, A. HARRERService Etudes et projets thermiques et nucléaires,Electricité de France,VilleurbanneFrance
Abstract
Modeling of the behavior in the primary circuit of fission products released by fuels with claddingfailures, carried out at the CEA in connection with EdF feedback on the subject, has made it possible todevelop and validate correlations between the spectrum of volatile fission products (rare gases, iodines andcesiums) in the primary coolant of PWRs under stable operating conditions and the characteristics of fuelcladding failures ; these correlations are presently used in France for monitoring the state of PWR fuelcladding. New developments, which take into account various operating modes of the reactors (stableoperating conditions, shutdown transients, network monitoring transients) produce new correlationsallowing a more precise and more complete characterization of cladding failures. Formalization of thesedevelopments has led to the writing of failure characterization software concerning fission product activityin the primary coolant ; optimal use of this software will be obtained by coupling it to an on-line gammaspectrometry device measuring primary activity.
INTRODUCTION
The design of pressurized water reactors does not allow the use of selective equipment fordetecting failures in fuel cladding. Attempts have always made been to overcome this drawback by devisingmethods for characterizing the state of reactor cladding using the spectrum of fission products emitted bydefected fuels. These attemps have particularly concentrated on those chemical species whose behavior inthe primary circuit is easiest to model and whose activity is relatively easy to measure using gammaspectrometry of the primary water. The chemical species that meet these criteria are fission gases, iodinesand cesiums.
Until the 1970s, the reliability and accuracy of the gamma measuring systems installed in reactorsas well as understanding of fission product release mechanisms were inadequate for accuratecharacterization of cladding failures. Only correlations involving a few easily measured istopes ( 1, *^3land 133xe) could he used to obtain qualitative characterizations of the state of deterioration of the cladding(failure free, presence of micro-failures, major failures). Improvements in equipment, measuring methodsand theoretical understanding, together with the considerable number of measurements taken by the EDF
on clcctronuclear reactors, both under stable operating conditions and during operational transients, haveallowed considerably more accurate correlations to be developed between the spectrum of fission productsand the characteristics of cladding failures. In many cases, selective characterization of the various defectedrods present in the core at a given time has been possible. These correlations can also be used in reverse,i.e. to predict primary circuit activity for given cladding states and reactor operating conditions. Thisapplication of the correlations is of particular interest in decision-making concerning the refuelling ofdefected reactor assemblies as part of the EDPs fuel management policy.
1. PRINCIPLE OF CALCULATION METHODS
Activity in primary coolant due to fission products released by defected fuels are the result of anequilibrium between the release rates of the uranium oxide where they originate and their disappearancedue to radioactive decay, neutron capture and reactor purification. Activity levels of nudides with differentradioactive periods arc therefore dependent on these release rates. The release rates arc in turn dependenton migration speeds within the oxide and inside the clearance between the fuel and the cladding in thedefected rods, and consequently on the characteristics of the rods :
- Oxide temperature- Dimensions of the defect- Physico-chemical characteristics of the fuel/cladding clearance- Quantity of fissile material disseminated in the primary circuit
Theoretical modeling of release mechanisms performed using the CEA PROFIT IV code [1] showsthat some nuclides are more sensitive to one or other of these characteristics and that the variouscharacteristics of the defects can usually be selectively determined from the activity of carefully selectednudides.
To break away from the reactor operating parameters that are independent of the failurecharacteristics but have an influence on the activity levels of fission products in the primary coolant (such asthe CVC rate or water make-up), all the correlations described in this presentation concern instantaneouslyreleased fractions of nuclides in the water and not their activity levels. These released fractions arecalculated using the activity balance of each nuclide in the primary water and the operating parameters ofthe reactor. Among other notions used is the mean instantaneously released fraction for a nuclidc, i, defined
(Fi)m = Ri
where:
R; is the instantaneous release (at/s) of the nuclide into the primary water from all the defectedrods
(B j)m is the instantaneous production of the nuclide i (at/s) in one rod subject to the mean linearpower density of the reactor.
1.1. Chemical families of fusion products used for diagnosis:
Quantitative characterization of the state of the fuel cladding of PWRs and the resultingcontamination of the primary circuit is based on studies of 3 chemical families that do not present

CDsignificant deposit mechanisms on the circuit walls and for wtiich correlations between defected rod releaseand activity in the water are consequently easily implemented
rare gasesiodines
The radionuclides from these different families that arc easy to measure by gamma spectromctryand can be used in diagnosis are as follows
gases 133Xe 133mXe 135Xe 138Xc SSm«, 87^ 88^
iodines tfll 133,f 134, 135,
cesiums 134Cs, B7Cs
1 2 Correlations with fission gases Number of defects
Gaseous nuchdes are easily diffused by uranium onde and are not trapped during their migrationfrom the onde to the primary coolant. Gases are the chemical family for which released fractions into theprimary coolant arc the most significant Moreover, at least as concerns French PWRs, their migration islittle affected by the size of the defect As first approximation, released fractions of these nuclides are onlydependent on the temperature of the defected fuel It follows that if the power of the defected rods can beestablished, models can be used to calculate real released fractions for each rod into the water from fissiongases A comparison of this calculation with the measured values of mean released fractions will yield dienumber of cladding defects present in the core
Theoretical models of gas migration (2), including gram boundary diffusion, and athermalmechanisms such as knock-out and recoil, show that, within the utilization limits of PWR fuel and for theradionuchdes under consideration, the instantaneous released fraction of a fission gas, i, with radioactivityconstant, ,, can be expressed as follows
A, (1)
where k and n are only dependent on the fuel temperature (n is usually dose to 05, which is consistent witha diffusion mechanism) If ^Xc is taken as a reference, equation (1) can be written
(2)
1 2.1 Correlations under stable operating conditions
Calculations for a particular type of fuel, performed using the PROFÏP code can be usedtheoretically to establish the relations
F133Xe - f(Tfucl)
n - f(Tfuel)
The relation FjjjXe = f(n) can be deduced in which the implicit parameter Tfue] no longerappears (see figure 1)
F 13;0 90.80,70 6060403020,1
00
IX«
••••••Ml ^ ^H
3 0
133 Xe Released Fraction 1versus gas slopa 1
— -
4
—— ———
-^^^^^
^
— i-///^ —
0,5 0,8 0.7 0,
gat slop* In
FIG 1
Experimental determination of n enables the number of defects to be calculated using the relation,
number of defects = [(Fœxe),,, / fmx J . (Pm / P) (3)
where P is the linear power density of the defected rodsPm is the mean linear power density of the core
The power P of the defected rods is obtained from the same study carried out using the PROFIPcode to link Fi33Xe to the fuel power as a function of the opening penod of the defects (see figure 2)
f 133)
1 33Xe Released Fraction 1versus fuel linear power and opening period of the 1
defects |
20,00 ———————————————————————————————————————————
16,00
10,00
6,OO
— —— - 1_^-rr<~-
/
^^•^^^"^
bCX^y^'' J4n C2X*^X
o.oo • ——————————————— . ———— —— • — ——O.60 0,8O 1,OO 1,20 1,4
Bnear pow«r (% Pn
FIG 2

122 Correlations using power plateaux at different levels
It will be seen from figure 1 that a slight variation in slope n produces significant deviations invalues for Fi33\e Moreover, the size of the defect, even though only operating in the second order, canalso disturb relation (1) The method of establishing the number of defects described in 12 1 is thus notvery accurate Wherever possible, the method described below in 1 2.3 is used instead
The ratio (Fi33xe)pi / (Fl33Xe)p2> expressing released fractions of "^Xe during 2 powerplateaux at different levels, PI and P2, is a function of the radial power factor of the defected rod This ratiocan be measured either directly or by extrapolating F, for gases with shorter radioactive periods and then
deducing the real released fracuon, F 133x0 of a defected rod The value of the higher plateau PI, is usually
the nominal power, Pn Figure 3 shows «he theoretical development of the real fraction of '-"Xe releasedper rod as a function of the ratio of mean fractions released in the primary coolant for different powerlevels compared with the nominal power The values in figure 3 can be reduced to a single curve as foUosvs(see figure 4)
F133Xe = 1(Fl33Xe) mPl / (Fl33Xe) mPn * (P°/P1) ** 0 4] (4)
The number of defects is then determined using the method described in 1 2 1 (relation (3))
O>CD
F 133 X»
133Xe Released Fractioncalculated from the "two plateaux* correlation
0,1
0,01
• WKI»— u,*-
P/Pn-0.0
0,01 0,1
IF 133X«)m P / IF 133X.)m Pn
FIG. 3
133Xe Released Fractioncalculated from the "two plateaux" correlation
f 133 X*0,5
0.4
0,3
0,2
0,1
0,2 0,4 O.« 0,8IF 133X«)m P / (F 133X«)m Pn • (Pn/P)"0.4
FIG 4
Gas and Iodinessteady power Released Fractions
1.00E-02
1.00E-031,OOE-O« 1.00E-O6 1,0«-04
Dtcay constant It-1
FIG 5
Gas and Iodinetransient Released Fractions
0,01
0,0011,OOE-M 1,006-06 1.0OE-O4
D«c«y contUnt (t-1
FIG 6
1.00E-03
1.00E-03

-4O
l 3 Correlation using iodines Number and size of defects Uranium contamination of cladding
(a) Number of defects
Fission iodines migrate inside the onde in exactly the same way as gases They can, however, betrapped during migration in the cold cccuons of the fuel and the fuel/cladding clearance The fractionsreleased into the primary coolant are therefore usually lower than those of gases (figure 5) However,during long power transients, particularly shutdown transients, these trapped fractions are redissolvcd in theprimary coolant following penetration of water into the clearance Experience shows that detrapping isusually total and that overall released iodine fractions, including release under stable operating conditionsand during transients, are equal to those of gases with the same radioactive periods (figure 6) All the valuesfor released gas and iodine fractions enable the parameters of equation (1) to be established withconsiderably greater accuracy than that obtained using gases under stable operating conditions This isbecause this estimation
concerns a larger number of nuchdcs- is independent of the size of the defect
(b) Size of defects
It is very difficult to produce theoretical modeling of iodine trapping and detrapping in relation tothe tbermohydraulic conditions of the clearance At the present tune, we only use an experimental,empirical approach in our models. The numerous radiocbemical measurements taken by the EdF, inconjunction with quantitative measurements of defect size during quantitive sipping tests on fuels at the endof cycle, have been used to demonstrate a relation between defect size and the ratio of fractions released ofiodine and fission gases under stable operating conditions at nominal power Figure 7 shows thedevelopment of the ratio of released fractions of ^I and ^Xe in terms of the equivalent size of thedefect measured during quantitive sipping tests. This relation has been used to establish an empiricalcorrelation between this ratio and the size of the defects
R
DCFEC t tw TH<
131 1 / 133 X« ||STEADY STATE RELEASE FRACTION RATIof
UT u ;
^
1 ! -EACt ^
- *•
t S^
^iS^
^^m
J
-»
If,r
*^
» k 1 ECT« WI1 4 UO l t EU ME
2 3 4 5 6 8 10 203040
FIG 7
It should, however, be noted that this correlation between the ratio of released fractions of *^I and ^Xeand the size of cladding defects also depends on the physical state of the water in the clearance andtherefore on the surface temperature of the fuel This dependence is currently being studied at CEA but hasnot yet been taken into account in our modeling
(c) Uranium contamination of the cladding
There are two sources of fission products in the primary circuit of a PWR
migration from the oxide in defected rods as described above
discharge by direct recoil into the primary water of fission products created in the uranium anddeposited on the outer surface of the cladding. This results in erosion of fuel rods with major defects eitherduring the current cycle or m previous cycles.
The released fractions of fission gases can be expressed as follows.
Fi = F133Xe ' (Ai/ Al33Xe) " + Fcontamination (5)
where ^contamination B the released fraction of the nuchde due to contamination It is independent of theradioactive period of the nuchde under consideration Similarly for iodine, the following equation can be
"contamination (6)
The value of n' (of the order of 1) is greater than the slope of the gases, leading to a negligiblevalue for the first term of equation (6) for iodines with low radioactive periods
For 1 *1 in particular, the following approximation can be written
= Pcontamination (7)
Modeling of phenomena realised using the PROFIP code enables ^contaminationto ^ "" cd <o the massof uranium deposited on the cladding.
Mass U - kj » contamination * '(combustion rate) (")wherek] is a constant determined by the calculationf is a function of the combustion rate outside the cladding of the contamination that takes the individualcontaminations of Cssue isotopes (particularly 'Pu) into account
1 4 Correlations using cesiums
The 134 and 137 isotopes of cesium arc usually only measurable during major power transientssuch as shutdown transients when, like the todines,they are detrappcd by water penetrating into thefuel/cladding clearance During these periods, Cs/^Cs activity ratios in the water are equal to that ofthe oxide of the defected rod. This ratio in the fuel is a function of the combustion rate of oxygen, which wecan calculate using our models We use this property to establish the combustion rate and to give theapproximate location of the leaking rod.

Z VALIDATING CHARACTERIZATION METHODS
Wherever possible, »11 the correlations described in chapter 1 arc used to characterize PWRcladding defects. U will be understood that the accuracy of this characterization is greater the morecalculation data is available, even to the point of redundancy, to offset the uncertainties of radiocbemicalmeasurements This is why optimum use of these correlations is obtained when the development of theseactivities is monitored closely using, for example, a gamma spectrometry device in the primary coolant lineSince this type of monitoring is only in current use oo a few reactors, we have usually validated our modelsusing radiochemical measurements taken on samples from nuclear plants and measuring campaigns earnedout by the CEA on primary circuit activity We give some examples of validation of our methods below Inparticular, we cite cases where simplified diagnosis methods gave highly erroneous forecasts
Reactor
ABCDE
Defect« number
- Measured
22625
DUgnos»CEA
method1*21*28*10
16
simplifiedmethod
230172018
There is a considerable improvement in diagnosis rcbability compared with the simplified methodsthat have been used m the past
»HA
*
• '
« ^'*
•
10 100 10OO 1OOOO
• TM« fM I • I.MI *
FIG 8 Forecast of F P activities in French PWFts
3 FORECASTING PRIMARY ACTIVITY WHEN REFUELLING DEFECTED ASSEMBLIES
During refuelling of defected assemblies with known characteristics, the models for release offission products included in the PROFIPIV code can be used to forecast the activities in gas and fissioniodines to the primary water when the reactor is restarted Figure 8 below shows examples of this type offorecast carried out for the EdF over 6 reactor cycles
Deviations between predictive calculations and measurements taken after reactor restart were lessthan 50% for all nucudes The only exceptions were for forecasts made for very low power defectedasscmbbcs where gas releases were underestimated and iodine releases were overestimated Thesedeviations arc due to gaps in the modeling for the behavior of fission products in the fuel/claddingclearance during the liquid phase
4 CONCLUSION
All the correlations established by the CEA using its models for the release of fission products intodefected PWR fuels enable realistic forecasts to be made of the state of the fuel cladding throughoutreactor operating cycles. They also give estimates of activity in the primary water at the start of a cycle forreactors containing refuelled defected assemblies with known characteristics. Improvements continue to bemade to these models and correlations in order to give greater reliability and accuracy of diagnosis
REFERENCES
[1] OLANDER, DR, Fundamental Aspects of Nudear Reactor Fuel Elements. TechnicalInformation Center Energy Research and Development Administration (1976)
[2] BESLU, P, LEUTHROT, C, FREJAVILLE, G, The PROFIP Code A Model to Evaluate theRelease of Fission Products from a Defected Fuel in PWR IAEA specialists' meeting on thebehavior of defected Zirconium alloy clad ceramic fuel m water-cooled reactors, Chalk River,Canada, 1979
ro EXPERIENCE WITH THE RSSION PRODUCTSMONITORING SYSTEM IN JAPANESE REACTORS
K ONONuclear Fuel Industries, Ltd,Osaka, Japan
Abstract
In the event of increased levels of iodine fission products (an indicationof failed fuel) frequency of radiochemical analysis of radioactivity forprimary coolant is increased to monitor radioactivity in detail In order towatch change of radioactivity in the primary coolant continuously we havedeveloped the Fission Product Monitoring System (FPMS) in cooperationwith Japanese PWR utilities The FPMS was developed ongmaly by theUS company of Babcock & Wilcox Company Japanese PWR utilities andNuclear Fuel Industries Ltd (NFI) improved the system to apply it to theJapanese reactors form 1980 to 1981 and performed validation testcompaign in the Japanese commercial reactor A in the event of increasedlevels of iodine fission products in 1983 In 1985 trial operation of theFPMS in Japanese reactor B was performed to prove equivalency withradiochemical analysis and ability of compensation for itSince 1985 the system has been installed to some Japanese reactorstemporarily in order to monitor radioactivity m detail Characteristics ofFPMS are as follows
1) Prompt real-time analyses for radioativity continuously2) Automatic operation (unmaned measurement)3) There is no need to improve any equipment of a plant4) Radiation exposure for workers during measurement and analyses can
be reduced because the system works automaticallyFPMS was installed to monitor radioactivity of coolant at some Japanesecommercial reactors form 1986 to 1992 at 7 times The lowest level ofradioactivity for 1—131 to be able to detect by the FPMS in our experiencewas about 15 Bq/cm3 but it depends on the conditions of circumstancesfor measurement location Of course the FPMS can detect other fissionproducts such as cesium krypton xenon and other radionuchdes
1 IntroductionThe fission products monitoring concept was conceived and designed by
Bobcock and Wilcox (B & W) in 1976 Nuclear Fuel Industries LTD(NFI) and B & W had performed research and development to apply it tothe Japanese commercial reactors with Japanese PWR utilities in 1980 and1981
In the event of increased level of iodine fission products at the reactorA in 1983 validation test of the fission products monitoring system(FPMS) was performed by NFI and utilitiesAccording to these operative experiences at the commercial reactors FPMSwas improved and was recognized to be able to fulfill the followingrequirements
1) Perform a gamma isotopic analysis on reactor coolant continuouslypassing through a pipe in the letdown system upstream of thepurification demmeralizers
2) Have sufficient sensitivity so that activity level changes occurmgduring fuel failures can be monitored and quantified
3) Produce a coutmuous reliable record of specific parameters ofinterest so that incidents occurring while the equipment isunmanned can be recorded and easily retrievable for later analysis
2 Description of The FPMS
2 1 Description of EquipmentThe Fission Products Monitoring System (FPMS) hardware can be
subdivided into two groups radioactivity measuring equipment and dataprocessing equipment
2 1 1 Radioactivity Measuring EquipmentThe radioactivity measuring equipment is the portion of the FPMS
that measures the radioactivity and produces a hgih - voltage powerThe compornents are
• A high — purity germanium (Ge) detector with factory mountedpreamplifier
• A bin power supply which provide high — voltage bias topreamplifier
• Lead shieding for detector as bricks• A frame which supports shielding and detector in order to keep
appropriate position for a detector• A weighing machine to measure quantity of liquid nitrogen
Figure 1 shows rough sketch of measuring equipmentPhotograph 1 shows assembling process of measuring equipment neara pipe in the letedown system at a commercial reactorLead shieding is subdivided into many bricks because of easytransportation assembling disassembling and protection fromstreaming of gamma — ray

1 1 0 0
Lead Shielding
15Liter Dewar
WeighingMachine
oa
a>B>O.
2!9,to
O<D
§Œao
Figure. 1 Measuring Equipment
Oi

Lead Shielding
High VoltagePower Supply
Measurement Equipment
Power CVCF
ADCMultichannelAmplifier
ComputerPrinterCRTDisc Unit
Data Processing Equipment
Figure. 3 Block Diagram of FPMS
ip
L_ Üfl) C> j=O <0 cC «Jm 2
/Mult
chan
nel
/ A
naly
zer
0Q
^~J1~\
_
•M
'cDOv>'0
\
feÜV
\/un :
•
•
Pers
onal
Com
pute
r
X
\
0 V
roO
Où
1v\
/in:
!
•l
'
-
-
."
3
5
»LS,
t
\\
*•1
i
0r-
Y
c0)EQ.DCT
LU
O)c'inCO0)oO
03Q
Ü
0 S 9
ao a
aa a
o
tu1_
G)
74

Photo 2. Data processing equipment.
2.1.2 Data Processing EquipmentThe data processing equipment is mounted in a rack because of easy
handling and transportation. The compornents are :• Main amplifier•ADC
• • Multichannel analyser with 4096 channels• Persona! computer with CRT display, key board and disc unit• Printer for reports•CVCF. -
Figure 2 shows rough sketch of data processing equipment and Figure3 shows a block diagram of the FPMS which shows relationship ofthese compornents.Photograph 2 is data processing equipment in a centeral control roomat a reactor.
2,2 System SoftwareImportant functions of the FPMS are acquisiton and analyses of data.
The system software was developed and improved by NFI. The mainapplication programs are as follows ;
• Data aquisition• Storage of data• Analysis of data• Report generation• Automatic peak search• Energy calibration• Automatic self diagnosis
Figure 4 to 6 show sample outputs of the FPMS.
2.3 Features of The FPMSFeatures of the FPMS are as follows :
1 ) Prompt real — time analyses for radioactivity are provided.2) The system is operated automatically,3) There is no improvement for the existing plant equipment.4) Operator can get trend graph of radioactivity and another type of
reports easily.5) Germanium detector can detect various isotopes such as,
iodine (I -131. 1-132, 1-133. 1-134, 1-135),rare gas (Xe - 133, Xe - 135. Kr - 85m, Kr - 87, Kr - 88) andothers (Co - 58, Co - 60. Fe - 59 etc.).
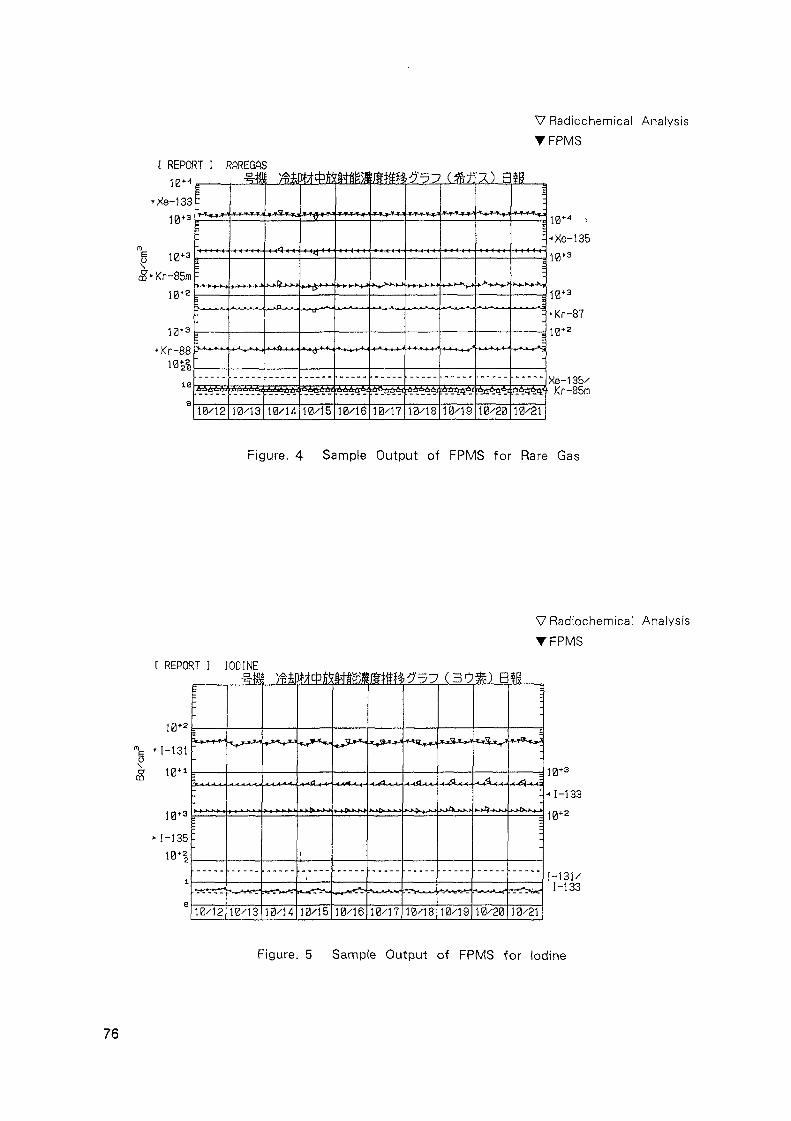
VRadiochemical AnalysisTFPMS
t REPORT ] RAREGAS
'Xe-133
•Kr-8
• fai rpiMvWSi
i-x*c_*jr->i
*_JUJU-*0
t~* V*-~*>-4
10/12
-1tJ|>Jf »J
10/13
*-l*Mj
-1-«»-*- .
10/14
^ *tj
10/15
Jügawrt^^^ (*«%^) Q
10/16 10/17
_» -Jl**-VJ
10/18
-T-f jJi
-k- s JU-»^
-K4-+^V
10/19
( »-K^
JU- JkJk-
-t-*-t~* -l
[AgAu t
10/20
$1?
• TT TT^
>~>-»-*-> I
E * i i • 1
_
.'Ä'Ä
10/21
10*" i
"Xe-135
10+a
• Kr-87
Xe-135/Kr-85m
Figure. 4 Sample Output of FPMS for Rare Gas
VRadiochemical AnalysisTFPMS
( REPORT ] IODINE
"k M-131
10+3
1-13510*|
i
810/12 10/13 10/14
4-4Ü-4-4-
10/15 10/16
U<
10/17 10/18 10/19
BJL
10/20 10/21
10+3
-i 1-133
I-131/1-133
Figure. 5 Sample Output of FPMS for Iodine
76

-------------- ;H - >r - P»! . ^ -fU-CL-L- >\O ^> JZ.i"l JZ>J — I J7VJC.JT *-^jrV. J. - ---- - - _ _ _ _ ——
DATE [ 91/01/25 - 91/05/04 )
Xe-135/ Xe-133Xe-133 Xe-135 Kr-85ro Kr-87 Kr-88 Kr-85m ERROR COUNT-TIME
DATE TIME Bq/cm3 (/-) (H)
91/03/15 03 00 1 28E+03 1 26E*03 1 73E-»02 3 72E+02 2 84E*0207 00 1 15E+03 1 25E*03 1 65E+02 3 96E+02 3 43E+0211 00 1 16E-»03 1 26E-*03 1 72E+02 3 85E+02 2 98E+02IS 00 1 17E*03 1 27E*03 1 66E+02 3 80Ef02 2 91E*0219 00 1 25E+03 1 27E+D3 1 69E*02 3 94E->02 3 12E+0223 00 1 22E+03 1 27E+03 1 75E+02 4 04E+02 3 07E+02
91/03/16 03 00 1 29E+03 1 26E+03 1 64E+02 3 81E+02 3 17E+0207.00 1 23E+03 1 26E+03 1 73E+02 3 97E+02 2 99E+0211:00 1 20E+03 1 26E»03 1 89Ë+02 4 06E+02 3 40E+0215-00 1.30E+03 1 2£E-*03 1 72E+02 3 90E+02 3 20E+0219:00 1.2SE+03 1 26E-»03 1 76E-*02 4 03E+02 3 12E+0223.00 1 33E+03 1 27E+03 1 73E+02 3 98E+02 3 12E+02
91/03/17 03.00 1.26E+03 1 26E+03 1 58E+02 3 89E+02 3 38E+0207.00 1.22E+03 T 27E+03 1 7SE+02 3 98E+02 3 16E+0211:00 1.26E+03 1.26E+03 1.54E-»02 3 81E-f02 3 26E-»0215-00 1.16E*03 1.27E-f03 1.65E+02 3 95E+02 2 93E+0219-00 1 29E»03 1 26E<03 1 67E+02 3 9SE+02 3 32E+0223-00 1 25E+03 1 27E+03 1 68E-»02 3 95E+02 2 97E+02
91/03/18 03.00 1.30E+03 1.28E+03 1.68E+02 3 97E+02 3 09E+0207.00 1.12E*03 1 26E+03 1.64E+02 3.87E+02 2 85E+0211:00 1.16E-»03 1.25E+03 1 60E+02 3.80E+02 2.98E+0215:00 1.31E+03 1 27E+03 1 62E+02 3 83E+02 3 28E+0219-00 1.20E+03 1 27E+03 1.64E+02 3 95E+02 3 09E+0223.00 1.14E+03 1.20E+03 1.58E+02 3.83E+02 2.86E+02
91/03/19 03:00 1.13E*03 1 17E*03 1.43E+02 3 B5E+02 2.S2E-*0207:00 1 13E+03 1 17E+03 1 55E+02 3 93E+02 3 01E+0211:00 1 17E+03 1 18E+03 1.58E+02 3 76E+02 2 97E+0215:00 1.14E+03 1.21E+03 1 65E+02 3 88E+02 2 98E+0219:00 1.19E+03 1.20E+03 1.58E+02 3 88E+02 3.12E+0223:00 1.16E+03 1.22E+03 1.S8E+02 3.93E+02 2.93E-»02
91/03/20 03:00 1.28E+03 1.21E+03 1.58E+02 3.80E+02 3.14E+0207-00 1.08E+03 1.22E+03 1.66E+02 3.67E+02 3.22E+0211:00 1.26E+03 1.23E-t03 1.67E-»02 3.86E+02 3.06E+0215:00 1.20E+03 1.22E+03 1.65E+02 3 90E+02 3.12E+0219:00 1.19E+03 1.23E+03 1.54E+02 3.89E+02 2.90E+0223:00 1.16E+03 1.24E+03 1.63E+02 3.82E+02 2.86E+02
91/03/21 03:00 1.20E+03 1.23E+03 1.63E+02 3.97E+02 3.10E+0207:00 1.20E+03 1.24E+03 1.65E+02 3.94E+02 3 02E+0211:00 1.34E+03 1.24E+03 1.71E*02 3.71E+02 3.23E+0215:00 1.17E+03 1 25E+03 1.86E+02 3.91E+02 2.88E+0219:00 1.27E+03 1.25E+03 1.75E+02 3.75E+02 3.13E+0223:00 1.27E+03 1 26E+03 1.75E+02 3.96E+02 3.15E+02
91/03/22 03-00 1.28E+03 1 25E+03 1.81E+02 3.89E+02 2.85E+0207:00 1.21E+03 1.27E+03 1.69E+02 3.90E+02 3 01E+0211:00 1.19E+03 1.28E+03 1.75E1-02 3.86E+02 2 86E+0215.00 1.27E+03 1.27E+03 1.83E+02 4 OOE*02 2.82E+0219 00 1.25E+03 1.28E+03 1.88E+02 3 82E+02 3 12E+0223 00 1.18E+03 1.28E+03 1.95E+02 3 92E+02 3.21E+02
7 2717 5867 3527 6777 4827 2607 6777 3316 6757 3137 1547 3257 9947 2268 2077 7107 5647 5327 6347 7147 9097 7917 7477 6078 1857 5497 4817 2957 6137.6787 6867 3257 3767.3687.9437.6007.5727 4857.2306 7367.1437.1796 8897 4897 2716 9816 7896 560
4 7165 2385 2235 1674 8S24 9614 6724 9195 0234 6654 8254 5654 8084 9534 7985 2184 6914 8334 6665 3905 2274 6115 0365 3305 3455 3645 1615 3085 0765.2404 7345 6204 8055.0425 0845.2285.0565 0734.522S 2144.7874 7714 7375 0125 0914 7944 8815 175
444444444444444444444444444444444444444444444444
3 1
Gneneral Criteria for The FPMS Compornents Installation
Criteria for Ge Detector LocationCriteria can be classified into four groups
1) Piping
2) Space
3) Environnent
4) Working
Constant flow of primary coolantUpstream of demmeralizer beacause of samecomposition of coolant
• Diameter is less than 1 Ocm because of avoidingself absorption and scattering of gamma — ray
• Perpendicular arrangement of piping is desirablebecause of avoiding CRUD accumulation
• Sufficient space for equipment and workingabout 1m X 1 2m X 1 5m
• Sufficient floor strength is required becauseweight of lead shieding is very heavy ,> 1 ton/m2
• Low background radiation because of reductionof radiation exposure during installation andmaintenance
• Temperature and humidity are limited forelectronics temperature is less than 35 °C andhumidity is less than 35 %
• Easily accessible location for installationcalibration, maintenance and liquid nitrogenfilling
Figure 6 Sample Output of FPMS for Rare Gas
3.2 Criteria for Data Processing EquipmentCriteria can be classified into three groups
1) Space -Sufficient space for equipment and working ,about 2m X 2m X 1 8m
2) Enviroment • Temperature and humidity are limited forelectronics temperature is less than 25°C andhumidity is less than 35 %
3) Working • Easily access• Power supply of AC 110V is required
3.3 Example of Installation LocationMeasuring equipment is always installed near a piping m the room
of letdown heat exchanger m CVCS line and data processing equipmentis installed at central control room because of daily access to getanalyses

CD
(QC
3OJ
'3
OOQ)t-+5'U
CDÜ)COC
3(Û
mJQc6'CD3
SCO
Q.
DCOÜ
1PflND
•vü OTHERSCRSL CH 0 CLOCK TlhE 3500 DflTE 91'12/10
COJMTS 3500 LIUE TlhE 2676 TIME 10:0050000
40000 -
30000 -
20000 -
10000 -
0
T.
l'\l >-y ^i
S •^v-, ..NHfci«lv..
r ————— i ——— --- i "-""" '0 1000 2080 3000 4000
2 3 4 5 6 Ohannpl 1 0SIZE JUrP DIRECT PRINT OFFSET ^ridnnei MBgLJ
4096 1
Gamma — ray Energy Spectrum of Primary'9Ure' Coolant in PWR at Fuel Failure
4. Experience of The FPMS in Japanese Reactors
The FPMS has been installed to monitor radioactivity of primary coolantat some Japanese commercial reactors from 1985 to 1992 at seven timestemporarily. Table 1 shows a list of installation experience of the FPMSin Japanese reactors from 1985 to 1992.Iodine—131 is the most remarkable nuclide from the viewpoint of humanhealth in monitoring of radioactivity. But energy of gamma — ray from1-131 is relatively low (364.48KeV) and there is disturbed energy peak
from Krypton — 88 near it So it is relatively difficult to measureradioactivity of 1 -131 Sensitivity for radioactivity of 1 — 1 3 1 by theFPMS in our experience is about 15 Bq/cm3 in the lowest case, but itdepends upon the conditions of circumstances for germanium detectorThe effective factor for sensitivity of 1 — 1 3 1 is radioactivity quantity ofCRUD nuchdes such as Cobalt —58 and Cobalt —60. which are accumulatedon the inside wail of the piping and solved or flowed in coolantThe worst case in our experience is the case of reactor D which is shownin Table 1. In that case the lowest level of 1 — 1 3 1 is about 60 Bq/cm3
with 24 -hours accumulation of data Accumulation time of other casesm Table 1 is less than four hours.Selection of location for measuring equipment installation is the mostimportant for keeping sensitivity of 1 — 1 3 1 radioactivity

Table 1 Experience of The FPMS in Japanese Reactors
Plant Year Period Radioactivity ofI -131
(Months) (Bq/cm1)
1985-19861988-1989
810
40-28015-800
1988 30-60
1988-19891989-1990
1991
111311
30-5030-6030-55
1991-1992 -60
* It was difficult to measure Iodine — 1 3 1 underthe level of 60 Bq/cm3 in case of D, becausethere was high backgrounds by CRUD nuclides.
5. Conclusion
In general, the FPMS can be installed at any nuclear power plant.The principal problem which must be solved for specific installations isfinding suitable locations for the detector, electronics modulus, andcomputer.Through our experience the FPMS has proved to be able to have thefollowing functions ;
1 ) Prompt real — time analyses of radioactivity.2) Continuous analyses for various nuclides.3) Reduction of radiation exposure for plant radiochemists at
^j measurement during fuel failure.<O without any inprovement or change of the existence plant equipment.
A REVIEW OF FUEL PERFORMANCE ANDFISSION PRODUCT RELEASE STUDIESFOR DEFECTED FUEL ELEMENTS
B.J. LEWISRoyal Military College of Canada,Kingston, OntarioR.D. MACDONALDChalk River Laboratories,Atomic Energy of Canada Limited,Chalk River, OntarioN.V. IVANOFFOntario Hydro,Pickering, OntarioF.C. IGLESIASOntario Hydro,Toronto, OntarioCanada
Presented by TJ. Carter
AbstractResults from numerous in-reactor experiments with uranium-dioxide fuel elements that
contain defects in the Zircaloy cladding are reviewed. The various factors which influence therate of physical deterioration of a defected element are examined. Experimental and theoreticalinvestigations into the release behaviour of radioactive noble gases and iodine are considered forboth the steady-state and transient situation, focusing on the relationship between the releasebehaviour and the state of deterioration of a fuel element Application of this work to powerreactor operation is discussed.
1. INTRODUCTION
Fuel performance in Canada Deuterium Uranium (CANDU) reactors has been excellentwith an overall fuel-bundle defect rate of typically less than 0.1 percent1"3 Fuel failures havegenerally been attributed to four distinct causes: stress-corrosion-cracking (SCQ in associationwith pellet/clad interaction (PCI) during power ramping manoeuvres; delayed-hydrogen-crackingnear end cap "welds due to hydrogen diffusion to areas of high stress and low temperature in thecladding; fuel fabrication flaws (e.g. end-cap porosity and faulty end-cap welds); and fretting ofthe fuel cladding from small pieces of debris in the heat transport circuit Similar defect statisticshave been observed in light-water reactors (LWRs) with defect rates typically less than 0.04

Table 1: Summary of Experiments With Defective Fuel at Chalk River
A NATURALLY DEFECTIVE FUEL
Experiment
FFO 102 1
FFO 102 2
FFO 102 3
FFO-104
FFO 105
FFO-109(Phases 1 & 3)
FFO-110FFO- 109 (Phase 2)
Description ofExpenmenl
Irradiation ofelements with porouiend capi
Re irradiation of anelement with throughwall hydnding at highpower
Re irradiation ot anelement with incipienthydnding at lowpower
Power ramp failureby stress-corrosioncracking
Irradiation ofelements with faultyend weldl
Power upratmg of anelement with incipienthydnding
Power-cycling of anelement with throughwall hydndmg
ElementIdentity
A7A.A7B A7CA7D A7P
A7EA7H.A7J A7K.
A7X
A7E
A7A
A2F
A8F.A8J.A8NA8H ASM
A8KA8L
A7C
A7A
PrimaryDefect Size
(Jim)
0 4 0 9 0 31 6 1 4
14111215
15
14
04
0 9 0 4 1 10407
0906
03
04
AverageLinearPower
(kW/m)
1662645661
67
23
26(soak)
58(ramp)
44626562
3140
142622 38
AccumulatedBumup
(MWhAgU)
Initial
00000
37
68
255
0000
6882
130140
Final
6865373330
67
130
278
10114223121
82133
140155
Accumulated Dayi ofIrradiation
(Full Power Dayi)
Omet ofDamage
3214148
155
In Core
15343242419
43
263
16
92921478
171246
281300
Fuel Element Degradation
Fuel LOH(8)
No lossN/A
No lossNo loss
35
N/A
S10
N/A<01
Description of SheathDeterioration
Incipient sheath hydndingCracksOpen hydnde blisterOpen hydnde blister/cracksPin hole defect (nohydnding)
Sheath hydnding anddetenoration increased t
No significant detenorationfollowing the occurence ofthrough wall hydnding at aburnup of 70 MWh/kgU t
Sheath hydnding Sheathdetenoration continuallyprogressed (inferred fromrelease behaviour) t
No sheath hydnding ordetenoration
No through wall hydndingin either phase
Utile or no increase insheath hydnding and/ordelenoration t
ARTIFICIALLY DEFECTIVE FUEL
Experiment
FDO-681(Phâit 1)(Phate 2)(Phase 3)
FDO-687(Pha*e 1)(Phaie 2)(Phaje 3)
FFO- 103
Description ofExperiment
Irradiation ofelements with drilledhole(0
Irradiation ofelementi with drilledhole (O/i mg le iht
Irradiation of anelement with 23 »lilt
ElementIdentity
RPLLFZRPP
RPRNSZRPR
A3rt
Pnmary Defect Size
1 3 mm hole*1 2 mm hole*1 3 & 0 4 mm holet*
2 0 mm hole*10 mm x 0 6 mm tlit2 addition»! 1 6 mmholet (one at each endof the element)
36 mm x 0 3 mm(etch tlit)
AverageLinearPower
(kWAn)
484848
555555
48
AccumulatedBurnup
(MWh/kgU)
Initial
140«*0
140«
43«085
0
Final
15820173
852890
18
AccumulatedDays of
Irradiation(Full Power
Days)
152435
402644
15
Fuel Element Degradation
Fuel Lossto
<01<01017
N/ASOISOI
-60
Descnption of SheathDetenoration
No (missive) iheathhydnding ordelenoration
No (massive) sheathhydnding ordetenoration
No (massive) sheathhydnding Shu at thetop of the elementenlarged t
N/A
The UOj expoiure for the (ingle rod experiment* u tununinzed in Fig 16Holes drilled at mid lengthIrradiated intact to thii bum upNot available (no metallography wai perfoimed following Ihit ttage of irradiation)
80
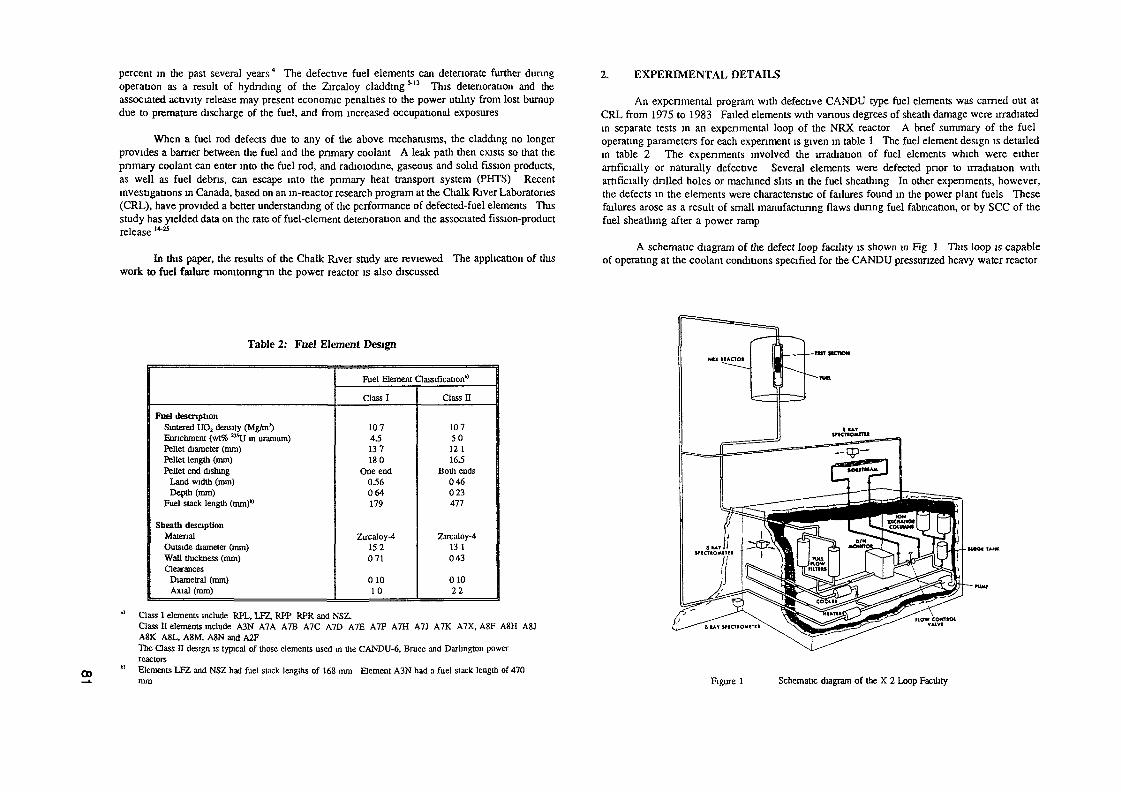
percent m the past several years * The defective fuel elements can deteriorate further dunngoperation as a result of hydndmg of the Zircaloy cladding M3 This deterioration and theassociated activity release may present economic penalties to the power utility from lost burnupdue to premature discharge of the fuel, and from increased occupational exposures
When a fuel rod defects due to any of the above mechanisms, the cladding no longerprovides a barrier between the fuel and the primary coolant A leak path then exists so that theprimary coolant can enter into the fuel rod, and radioiodine, gaseous and solid fission products,as well as fuel debns, can escape into the primary heat transport system (PHTS) Recentinvestigations in Canada, based on an m-reactor research program at the Chalk River Laboratories(CRL), have provided a better understanding of the performance of defected-fuel elements Thisstudy has yielded data on the rate of fuel-element deterioration and the associated fission-productrelease14-25
In this paper, the results of the Chalk River study are reviewed The application of thiswork to fuel failure momtonng-in the power reactor is also discussed
2. EXPERIMENTAL DETAILS
An experimental program with defective CANDU type fuel elements was earned out atCRL from 1975 to 1983 Failed elements with various degrees of sheath damage were irradiatedin separate tests in an experimental loop of the NRX reactor A brief summary of the fueloperating parameters for each experiment is given in table 1 The fuel element design is detailedin table 2 The experiments involved the irradiation of fuel elements which were eitherartificially or naturally defective Several elements were defected pnor to irradiation withartificially drilled holes or machined slits in the fuel sheathing In other experiments, however,the defects in the elements were characteristic of failures found in the power plant fuels Thesefailures arose as a result of small manufactunng flaws dunng fuel fabncanon, or by SCC of thefuel sheathing after a power ramp
A schematic diagram of the defect loop facility is shown m Rg l This loop is capableof operating at the coolant conditions specified for the CANDU pressurized heavy water reactor
Table 2: Fuel Element Design
Fuel descriptionSintered TJO2 density (Mg/m*)Enrichment (wt% ^U in uranium)Pellet diameter (mm)Pellet length (mm)Pellet end dishing
Land width (mm)Depth (mm)
Fuel stack length (mm)"
Sheath desciptionMaterialOutside diameter (mm)Wall thickness (mm)Clearances
Diametral (mm)Axial (mm)
Fuel Element Classification"
Class I
1074.5137180
One end0.56064179
Zircaloy-4152071
01010
Class H
1075012116.5
Both ends046023477
Zircaloy-4131043
01022
00
Class I elements include RPL, LFZ, RPP RPR and NSZ.Class H elements include A3N A7A A7B A7C A7D A7E A7F A7H A7J A7K A7X, A8F A8H A8.JA8K A8L, ASM, A8N and A2FThe Class n design is typical of those elements used in the CANDU-6, Bruce and Darlington powerreactorsElements LFZ and NSZ had fuel stack lengths of 168 mm Element A3N had a fuel stack length of 470mm Figure 1 Schematic diagram of the X 2 Loop Facility

00N>
Table 3: Loop Operational Parameters
Thermal flux (axially-averaged) (n/cm2s)Temperature (°C)Pressunzed water (MPa)Row rate (kg/s)Recirculation urne (s)Coolant pH (LiOH controlled)Hydrogen content (mL/kg)Graphite filters (urn)Coolant volume (m3)
5.5 x 10"240-2607.7 - 10.50.6 - 1.1
10510-115 - 2 0
60.15
Details of the operational parameters are given in table 3. This facility is designed to cope withhigh activity levels as a result of fission product release and fuel loss through large defects. Thefull flow graphite filters prevent significant UO2 fuel recirculation. Separate sidestream circuitsfor the ion-exchange mixed-bed resin columns, and degassing system, provide an optionalcoolant-cleanup capability for both radioiodine and noble gases.
3. FUEL-ELEMENT DETERIORATION
A comprehensive study to correlate the deterioration of a defective fuel rod with the fueloperating parameters was performed by the United Kingdom Atomic Energy Authority(UKAEA).6-7 As shown in Fig. 2(a), data was collected for fuel fabrication defects and those rodswith severe hydriding damage were differentiated from pins with minor damage. One notablefeature of this boundary is that it is almost independent of surface heat flux above 1750 kW/m2,indicating that sheath hydriding takes place very quickly above this value. The CRL experimentsthat involved fabrication defects (table 1) are plotted on Locke's performance curve in Fig. 2(b).These experiments are in general agreement with the UKAEA work.
As depicted in Fig. 3(a), the UKAEA study indicated that most defects go through aninitial period with low fission-product leakage (Stage I), followed by the development ofsecondary damage (as a result of sheath hydriding), and a slowly increasing release rate (StageII).8 Defects eventually deteriorate to the point (Stage IE) where the fission-product release hasincreased significantly as a consequence of sheath breakage and/or multiple-failure sites. It hasalso been shown that PCI and fretting defects can deteriorate more rapidly (in weeks or days)than elements operating under the same conditions with fabrication defects.8
Secondary deterioration to the zirconium alloy sheath of a defected fuel element (see Fig.4) is usually caused by a combination of massive localized hydriding and stresses in the sheath.In this process, available hydrogen enters the sheath at preferred locations and forms local areasof high concentrations of hydride or sunbursts [see Fig. 3(b)]. These locations may become sinksfor further hydrogen pick-up, leading to more massive localized hydriding. Hydride blisters,which form in areas of solid zirconium hydride, result from a 16 percent expansion in volumeof the S-hydride phase. Since the hydrided sheath is very brittle, failures eventually occur fromfurther sheath stress.
gaa
UJcr
g
IOOO
loo-;
10
0.1
HYORIOEFAILURE
KEY• GROSS FAILURE • HYORIOEO9 GROSS FAILURE-HYORIDCD
(RATING INDETERMINATE WPVIBUSHCO MfO.)
-FAHJURE HVDHIDCD-LOW"OPERATtMC TEMP.A OPERATED SATISFACTORILY.OPERATED SATISFACTORILY -
HYORIOEO
400 800 I2OO 1600 2000 24OO 280OHEAT FLUX (kW/m2)
(a)
1000 -
o
wt
Ot-
100 -
500 1000 1500 2000 2500 3000SURFACE HEAT FLUX (kW/m2)
(b)Figure 2: (a) Locke's defect performance curve for Zircaloy-sheathed fuel.
(b) Hydnding experience in CRL experiments FFO-102-1, FFO-102-3, and FFO-109 forfuel elements (as labelled) with fabrication defects.

STAGE i INITIATION OF PftWARY DEFECT PLENUM
STAGE I DETECTION AND PfitHARY OEFIC T DEVELOPMENT- 30° C
ID'3 TO tO-?ww
STAGE E SECONDARY DEFECT DEVELOPMENT -1mm
STAGE m ACCELERATION OF SECONDARY DAMAGE -Urn
»-v_*
UO
E6 ^
»- u. U^
g S s" [ " E Ç
i l / (RELEASE OF - l n /"2 , ,R,CONTAINED FP , ' / J m/
\r^J^---^''"' ' ' "..-—•' ^~~
FUELSTACK
mm DINGzo
Iou.utUJ0
hJ
«MO
7^/X/y
•'y
xxxxxxx'^L
SL JFUEL
DAYS WEEKS MONTHS YEAR VTIME ————— «- \_
•— HYDRIOING ———
-OE FECT
~V\K.\.
m~*
40À
COOLANTr>^!UAQ ' , J
lljt/u-rFISSION iPRODUCT |
____J
(a) (b)
ooCO
Figure 3: Stages of defective fuel rod operation. (Taken from Ref. 8).(a) Curves relating stages of fuel rod deterioration to the activity release as a function of
time and fuel rod rating R, < R2.(b) Conditions in a defective rod.
3.1 Hydriding Mechanism
Hydriding is a complex phenomenon with a number of variables controlling the rate, thelocation, and the amount of hydrogen pick-up by the sheath:
(a) Element Power
As indicated in Fig. 2, the number of days to failure through gross hydriding of the sheathdecreases with increasing surface heat flux. The surface heat flux, in turn, determines the radialthermal gradient and the inside temperature of the sheath for a given geometry and coolanttemperature.12 Although the pick-up of hydrogen by the sheath is clearly dependent on elementpower (i.e. the hydrogen liberating reactions are both flux and temperature dependent), the degreeof damage is also affected by localized stresses on the sheath for elements operating at highspecific powers. In the present study (see table 1), hydriding progressed during further irradiationof an element at high power (FFÖ-102-2) even after sections of the sheath had broken away [see
Zirconium hydriding and sheath degradation for(a) Defective fuel element ATE after irradiation in experiment FFO-102-1. The upper and
lower blisters have broken open exposing the underlying fuel; the centre blister hascracked.
(b) Defective fuel element A7A after irradiation in experiment FFO-109 (Phase 2).
Fig. 4(a)]. The increased damage to the sheath had resulted from localized sheath stresses duringa reactor trip, as inferred from a stepped increase in the coolant activity levels. On the otherhand, neither hydriding nor sheath degradation significantly progressed for an element irradiatedat low power (FFO-102-3), following the onset of through-wall hydriding at a burnup of 70MWh/kgU. Power-cycling of this hydrided element at low and intermediate powers on a dailybasis at a ramp rate of 14 percent of full power per hour (FFO-109 and FFO-110), did notsignificantly increase the amount of sheath cracking [see Fig. 4(b)]. In an axial power gradient,more hydriding occurred in the maximum power region of the higher-powered elementsirrespective of the primary defect location (FFO-102-1). The hydriding was generally confinedto the heat affected zones around the brazed spacer pads of the fuel elements.
(b) Primary Defect Size
The initial source of the internal hydrogen is the water or steam that enters the defectiveelement through.the primary defect As discussed in Section 3.2, hydrogen is generated in thefuel-to-sheath gap of a fuel element by the four possible mechanisms of: (i) radiolyticdecomposition of the water, (ii) internal clad corrosion that provides a "protective oxide film"of ZrO2 on the inside surface of the cladding (see, for example, table 4); (iii) water vapour

00-t» Table 4 Zirconium Oxide Thicknesses for CRL Defect Experiments
Element
LFZ
A7E
A3N
Distance from HighPowered Bottom End (mm)
92125 Primary Defect174
8 to 38 Secondary Defect
63 to 88 Secondary Defect235390
0 to 485
Zirconium Oxide Thickness (urn)
Inside Sheath Surface
6 to 564 to 304 to 64
up to 30 (remote from defect)100 (at defect site)same as above1 to 4 (oxide pockets up to 70)1
5 to 12 (remote from slits)2 to 8 (at slits maximum near
bottom, downstream end)
Outside Sheath Surface
0.5 to 205 to 205 to 2
up to 36
up to 761 to 4 (oxide pockets up to 26)1
2 to 4
oxidation of the fuel, and (iv) dissolved coolant hydrogen The liberated hydrogen from thesevarious processes is then free to enter the sheath where there is a local breakdown of theprotective oxide film
Davies has demonstrated that the ratio of hydrogen to oxidant in the fuel-to-sheath gapis critical to the hydnding process 10 In a review article, Cox has reported critical ratios ofhydrogen/oxidant ranging between 102 to 106 " These ratios are consistent with the theory thata critical hole size exists above which hydnding is inhibited In elements with small defects,water ingress is limited not only by the small hole size, but also because the hole may plug upwith zirconium oxide or with fission products Consequently, as hydrogen is produced from thevarious reactions, the hydrogen partial pressure will increase so that if there is a local breakdownin the protective oxide film, localized hydnding may result The film may be broken by eitherfission-product attack or by mechanical stresses that are introduced during power transients
In the present study (see table 1), experiments with porous end caps (FFO-102-1) indicatedthat a cntical hole size of about 1 urn was necessary to promote sheath hydnding, however, ma similar experiment with faulty end welds (FFO-105), the nature of the defect was such that itplugged up before hydnding could be initiated In contrast, for elements with large defectsproduced by mechanical dnlhng or machining (e g hole diameters > 1 mm) (FDO-681, FDO 687and FFO-103), no massive hydnding or detenoration of the sheath was observed Thisobservation is in agreement with in reactor tests with Light Water Breeder Reactor (LWBR) fuelwhere rods containing intennonally-dnlled holes of diameters 0 13 mm were too large toduplicate the slow ingress rate of coolant through an operational defectI2 With larger defects,the protective oxide film may be in a state of continuous repair Thus, a hole size of about 1 urnis necessary for the initiation of massive sheath hydnding resulting from a cntical hydrogen tooxidant ratio, whereas a large defect (> 0 13 mm) will not promote sheath hydnding
The primary defect sizes in experiments FFO-102 1 and FPO 105 were estimated by highpressure, helium leak testing of the empty fuel sheaths containing a single (suspect) end cap Anequivalent" hole size was determined for each element with the use of a Hagen-Poiseuille flow
law Each element required a differential pressure (AP) before a leak was detectable, e gdifferential pressures of between 0 2 to 8 MPa were required for the porous end cap rods Thefuel elements were then back-filled with helium at atmosphenc pressure in the final fabncationprocess Standard helium leak-testing techniques (as employed by the commercial fuelfabricators) could not pick up this size of leaker However, dunng the FFO 102 1 loop test, thecoolant pressure was sufficiently high (10 MPa) to permit a cntical AP for coolant leakageleading to massive hydnding
(c) Fission Product Attack
It has been suggested that fission products in the fuel-to-sheath gap can accelerate thehydnding process,7 '1012 and perhaps account for the faster rate of hydnding of elements defectedby power ramp than comparable elements with manufacturing defects For instance, in an out-of-pde experiment, the hydnding process was enhanced in a vapour environment containingiodine ** It is believed that the protective zirconium oxide film can be damaged by bombardmentby highly energetic and massive fission products, allowing for hydrogen penetration In additioncorrosive fission products such as iodine can react with the Zircaloy cladding Furthermore, theamount of fission products in the gap is also related to element power since the mechanisms offission product release from the fuel depend on both the fission rate and temperature The defectsize may also play an important role, since the flushing of water into the gap may reduce thecntical" inventory of fission products (see Section 4)
3 2 Sources of Hydrogen
Hydrogen can be introduced into, or generated in, a defected fuel rod by the followingmechanisms radiolysis of water, fuel oxidation, Zircaloy corrosion, and dissolved coolanthydrogen For illustrative purposes in the following calculations, it has been assumed that atypical defective fuel rod (with the dimensions of a class II element in table 2) is operating ata linear power of 50 kW/m in a pressunzed coolant of 10 MPa, the temperature charactensocsof the fuel rod are listed in table 5 (see Ref 22)
Table 5 Fuel-Element Temperature Calculation*
LinearPower(kW/m)
50
Temperature (K)
Fuel CentrelineT,«
2231
Fuel SurfaceT,.
867
Sheath Inside, T,
591
Fuel to-Sheath Gap T,
729
RadialGap (um)
13
Estimated with the ELESIM fuel performance code for a fuel burnup of 16 MWh/kgU (see Ref 22)

00en
(a) Radiolysis of Water
Fission-product radiolysis can be a direct source of hydrogen as a result of the reaction'512
2 H20 — H2O2 + H2. (1)
Since the rate of formation of hydrogen peroxide and hydrogen greatly exceeds their radical-induced recombination rate, the above reaction does not reach equilibrium. However, the highly-reactive hydrogen peroxide molecule can equilibrate with the fuel (in the presence of a largeexcess of hydrogen) with the liberation of still more hydrogen:5'12
H2O2 + (2/x) UO2 = H2 + (2/x) UO2+X. (2)
The rate of production of molecular hydrogen from fission-product recoil can be estimatedas follows. The molecular hydrogen yield (YHj) from the highly energetic fission fragment hasbeen experimentally determined to be about 18 gas moIecules/keV of dissipated kinetic energy.5In addition, for fission product recoils with an average kinetic energy of 80 MeV, the stoppingpower (dE/dx) in a steam medium (at a density of 0.035 g/cm3) is about 220 keV/pm.27 Hence,the rate of hydrogen production (SvQ (in molecules per second) is given by5
SH, = R™ YH, (dE/dx) (3)
where R™° is the rate of release of fission fragments (atoms/s) from the solid fuel body, and 1is the average path length (in microns) of the fission fragment in the fuel-to-sheath gap. Therecoil release rate R™ is given by the well-known relation:"'28'29
R™ = '/4p(S/V)FY„ (4)
where u = average range of the fission fragment in the UO2 fuel (density of 10.7g/cm3) (see table 6) = 7.6 pm
(S/V) = surface-to-volume ratio of the uranium dioxide fuel (= 331 m"1)F = fission rate (= 6.28 x 10" fissions/s)Y,, = fission-fragment yield = 2 particles/fission.
Table 6: Range of Br-88 and 1-135 Fission Fragments in Different Media
Medium
HeArH.OUO2
Range* (mg cnr!)
Br-88
2.3854.6772.5459.330
1-135
1.73533691.8416.831
Calculated with the TRIM Code (see Ref. 27). It is assumed that the Br and Ifragments carry 100 and 67 MeV of the available fission energy."
•<o:
o
10'
to1
10'
10'
10" -
AHO, OXIDATIONZr OXIDATION
- RAD10LYSIS
4 6
TIME, t (x 105 s)
10
Figure 5: Hydrogen production rate as a function of time for a Class II fuel element (see table 2)irradiated at 50 kW/m in a pressured coolant of 10 MPa,
The calculation of the fission rate assumes that each fission event liberates 200 MeV of energy.Since the average range of the 80 MeV particles in the steam-filled gap is about 620 pm (seetable o),27 most of these particles can traverse through the small gap (thickness of 13 pm in table5), and embed themselves in the adjacent sheath. Therefore, T can be reasonably approximatedby the mean chord length in the gap. In general, for any concave cavity of volume Vc andsurface area Sc, the mean chord length (Q can be given by:"'29-30
ç = 4 vysc.Hence, for the geometry of a cylindrical fuel rod with a radial gap of thickness t,
(5)
(6)
Finally, using Eqs. (3), (4) and (6), the hydrogen production rate is estimated as 9.6 x 10'6molecules/s (see Fig. 5).
(b) Fuel Oxidation
Although no data exist on the kinetics of oxidation of UO2 by gas-phase hydrogenperoxide, the oxidation of uranium dioxide in steam has been studied by a number ofinvestigators in experiments performed out-of-pile.31"35 In the early work of Bittel et al.,31 it wassuggested that the oxidation process was controlled by oxygen diffusion through the fuel matrix.

00CD
However, Carter and Lay32 subsequently showed that this process was controlled by a reactionat the solid/gas interface. Based on these results, an expression for the oxidation rate wasproposed:
dx/dt = ouX - x(t)](S/V) (7)
where a = surface exchange coefficient of oxygen (m/s)xt = equilibrium deviation from stoichiometryx(t) = deviation from stoichiometry in UO2+I at time t(S/V) = surface-to-volume ratio of the solid (m"').
The surface exchange coefficient, a (in metres per second), has been determined experimentallyby Cox et al.,54-35 in the temperature range 1073 to 1873 K:
a = 36.5 x 10'2 exp (-23500/T), (8)
where T is the temperature in K. The analytic solution of Eq. (7) can be readily obtained if thetemperature is constant:
x(t) = xe [1 - exp{-o(S/V)t}],
where it has been assumed that the fuel is initially stoichiometric (i.e. x(0)=0).
(9)
The equilibrium deviation from stoichiometry (xj is defined by the oxygen potential ofthe gas phase.22 At a total system pressure of p, (atm), the oxygen partial pressure pO2 (atm) canbe obtained from equilibrium thermodynamics where (see Ref. 36)
= X p,, (10)
and X is the mole fraction of oxygen in the gas. The mole fraction X is given by the solutionof the transcendental equation
K(p, X)"2 [(Q/2 - .1) + (Q/2 + 1)X] = 1 - (Q + 1)X. (ID
The parameter K is derived from the law of mass action that can be evaluated as a function oftemperature
K = PH20/[pH2(p02)"2] = exp(-AG°/RT)
AG° = -250.8 + 57.8(T/103) kJ/mol, (12)
where R is the ideal gas constant (= 8.314 x 10~3 kJ/molK). The parameter Q in Eq. (11) isdefined as the hydrogen-to-oxygen (H/O) atom ratio of the gas environment such that
Q = (pH, + pH20)/(p02 + Vt pH20). (13)
For example, Q = 2 for a pure steam environment, Q = 2.02 if the steam contains 1% excesshydrogen, and Q = 1.98 if the mixture is oxygen-enriched by 0.5%. In general X « 1, and Eq.(11) can be reasonably approximated as:
X = [K(p^in (Q/2 - I)]'2,
X = (4K2Pl)-1/3,
X = (1 - Q/2)/(l + Q/2),
Q > 2.001,
Q = 2,
Q < 1.996. (14)
fromWith the calculation of X, the oxygen potential of the gas mixture can then be evaluated
AG02 = RT = RT In (Xp,). (15)
The oxygen potential, or equivalently the partial molal free energy of oxygen in the solid permole of 02, can also be expressed in terms of the partial molar enthalpy AHOz (in kJ/mol) andentropy ASO; (in J/mol'K) of oxygen in the solid such that:
AGÖ2 = AHÖ2 - ASÖ2 (T/103) (16)
where the thermodynamic parameters are given in Figure 6 as a function of x (see Ref. 37).
550
500 -
300
- 150
- 100
Figure 6:
2000.00 0.05 0.10 0.15 0.20 0.25
STOICHIOMETRY DEVIATION x
Partial molar entropy and enthalpy of oxygen in U0;„ (see Ref. 37). The solid fitted curvesare given by the polynomial expressions in Eq. (17).

0 30 r
025
2 0.15 -
oao;œ
0 10
Ot)0
10 UP»
PURE STEAK (Q=2)
J
EXCESS HZ <Q=2 02)
Given that the atomic number density of oxygen in the fuel before and after oxidation is:
1200 1400 leOO 1800 2000TEMPERATURE, T (K)
2200
Figure 7: Equilibrium stoichiometry deviation (xj for UO2.X in pure steam and in steam containing 1%excess hydrogen as a function of temperature.
These parameters can also be described by a polynomial correlation in x based on a non-linearleast squares fit to the data (see Figure 6):
-AH02 = 501.9 - (7-392 x 10*)x + (5.779 x 106) x2,= 249.1 + 849.5 x - (2.779 x 103)x2,= 695.8 - (4.737 x 10³) x + (1.402 x 104) x2,
-ASÖ, = 118.1 - (3.715 x 10⁴)x + (3.224 x 106)x2,= 3.698 x 10'2 + (1.270 x 10³)x - (3.568 x 103)x2,= 333.4 - (3.066 x 10³) x + (1.016 x 104) x2,
0 < x < 0.007,0.007 < x < 0.1625,x > 0.1625,
0 < x < 0.005,0.005 < x <: 0.1625,x > 0.1625.
(17)
The equilibrium stoichiometry deviation (x^) is therefore obtained as the solution of the quadraticequation for x on equating Eqs. (15) and (16), where the thermodynamic parameters are givenby the correlations in Eq. (17). For example, the results of this calculation are shown in Figure7 where x. is given as a function of temperature (at a system pressure of p, = 10 MPa) for puresteam (Q = 2), and for 1% excess hydrogen in the gas mixture (Q = 2.02).
The hydrogen production rate can now be calculated as follows. The overall oxidationreaction is
00
= 2pUO,N0/MUO,
Noafttr = (2+x)pü02„N0/MU02„,
the number of oxygen atoms consumed by the fuel during oxidation is
([(2 + x) pUO,„Vuo2./Muo,J - [2 puOiVuOj/MUOjJN,,, (19)
where p = density of the fuel (kg/m3)M = molecular weight of the fuel (kg/mol)V = volume of the fuel (m3)N0 = Avogadro's constant (= 6.022 x 10²³ atoms/mol).
If the number of moles of the hyperstoichiometric fuel is equal to that of the uranium dioxidefuel, i.e (pV/M)UOj„ = (pV/KfJuo,, Eq. (19) reduces to
number of oxygen atoms consumed during fuel oxidation = x(puo2VUO!/Muo2)N(,,(20)
Thus, using Eqs. (18) and (20), the production rate of molecular hydrogen is
SH, = (dx/dt)(puo!Vuo2/Muo2)N0.
Finally, differentiating Eq. (9) and using this expression in Eq. (21) yields
SH, = xe
(21)
(22)
Equation (22) has been plotted in Fig. 5, assuming the fabrication values for the surface andvolume of the solid fuel in table 2, and an average fuel temperature of 1549 K (see table 5).These calculations are shown for both pure steam (x^ = 0.667) and for a 1% hydrogen excess inthe gas mixture (xe = 0.046). In the case of pure steam, it has been conservatively assumed thatthe equilibrium phase is U3O8 (see Ref. 36).
(c) Zircaloy Corrosion
The water corrosion of Zircaloy proceeds through the reaction
Zr + 2H2O = ZrO2 + 2H2. (23)
x H2O + UO2 = UO2+X + x H,. (18)
Part of the hydrogen generated in this reaction diffuses into the metal. At the start of theoxidation process, all of the hydrogen may be absorbed. However, the rate of absorption steadilydecreases from a maximum during the first 10 mg/dm2 oxidation to a typical plateau.1138 Thepick-up fraction- (defined as the amount of hydrogen in the metal to the total amount producedduring the corrosion reaction) for Zircaloy-4 is usually between 5 and 25 percent. The hydrogenthat is not absorbed by the sheath is released into the fuel-to-sheath gap of the defected rod,thereby enriching the steam atmosphere in hydrogen.

00CD The kinetics of this reaction have been extensively studied (see, for example, Refs 39-42)
In the temperature range 523 to 673 K, the corrosion process of Zircaloy starts with the formanonof a thin protective oxide that grows with an approximate cubic rate law After a certainthickness is reached, a transition occurs where cracks develop in the oxide film structure Thesecracks provide easier access of the oxygen to the oxide-metal interface, resulting in a breakawayregime that is characterized by linear kinetics
The kinetics of the weight gain for the pre-transition penod is given by
w3 = kp„Ft ( w < w j (24)
where ww,kpFt
weight gain per unit area of Zircaloy reacting with steam (mg/dm2)weight gain per unit area of Zircaloy at transition (mg/dm2)pre-transiüon reaction rate constant (mgVdm'd)fitting factor for m-reactor corrosion enhancementexposure tone (d)
At a weight gain of -30-40 mg/dm2, the post-transition kinetics follow a linear rate law
+ w, (w > w,), (25)
where k,,, is the post-transition reaction rate constant (mg/dnvM) For an exposure of thecladding at a temperature T (in Kelvins), the time to transition, t,, (in days) is given by39
t, = 6 50 x 10" exp(-0 035T)/F
The reaction rate constants are given by an Arrhemus form39
k^ = 5 07 x 1013 exp(-32,289/RT)
k^ = 2 21 x 10" exp(-28,200/RT),
(26)
(27)
where R is the universal gas constant (=1 987 cal/mol K) The oxide layer thickness is alsorelated to the weight gain by
SOI=156(AZr/Mo2)(w/pZr) (28)
where Ar
Pz,
atomic weight of zirconium (= 91 22 x 103 kg/mol)molecular weight of oxygen (= 32 00 x 103 kg/mol)Zircaloy-4 density (= 6 49 g/cm3)
The constant of 1 56 is the Pillmg-Bedworth ratio (i e the volume of oxide formed per unitvolume of metal) Using Eqs (24) to (28), a fitting factor of F equal to 49 is obtained for theinternal corrosion of defected fuel elements irradiated at about 50 kW/m in the CRL loopexperiments (see Table 4) This value is larger than that observed for water-side corrosion inpressurized water reactors (F = 1 to 3), and m boiling water reactors (F = 10) (see Ref 39),because of bombardment by energetic fission fragments on the inside cladding surface
Finally, using Eqs (24) and (25), the corrosion rate for the pre- and post-transitionregimes are given by
= (kp„F)"3t2/3/3
dw/dt = kpMF (29)
Since a weight gain of 32 x 103 kg (corresponding to 1 mole of oxygen) produces 2 moles ofhydrogen, the production rate of molecular hydrogen (in molecules/s) is
SH, = 2(N0/M02)SC, (dw/dt) C, (30)
where SC1C
inside cladding surface area (m2)1 16 x 10' (kg/m1s)/(mg/dm2-d)
Equation (30) has also been plotted in Figure 5 at the temperature of the inside claddingsurface (table 5) This calculation assumes an unlimited supply of steam (i e no steamstarvation)
(c) Dissolved Coolant Hydrogen
The amount of dissolved hydrogen in the coolant of pressurized water reactors is typically10 to 60 cm3/kg n The dissolved hydrogen in the defect loop experiments is 5 to 20 crrrYkg (seeTable 3) As shown in Ref 5, this amount of hydrogen would provide a much smallercontribution to internal hydnding of the cladding than that produced by radiolytic decompositionThis process can therefore be ignored
321 Discussion of Results
The results of the above calculations for the production of hydrogen by coolant radiolysis,fuel oxidation, and Zircaloy oxidation in the defective fuel rod are summarized in Fig 5 Therate of hydrogen production by oxidation of the uranium dioxide fuel and Zircaloy cladding areonly important at the beginning of the irradiation penod. After about 3 days, coolant radiolysisin the gap becomes the major component.
3.3 Fuel Loss
As the integrity of the sheath deteriorates with secondary hydnding, fuel is released fromthe defective element into the coolant Loss of UO2 is probably caused by erosion from thethermalhydrauhc effects of the coolant after individual grains are loosened by oxidation alongtheir boundaries Figure 8 shows individual grains separating along boundaries from the bulk ofthe UO2 at the surface of a pellet underneath a defect This phenomenon has been observed inCRL steam oxidation tests at low-temperature (773 to 1073 K) where a U3O8 layer is initiallyformed along the grain boundaries of the lower oxide material (such as U4O9)35
Fuel loss for defective fuel in the CRL loop irradiations is given in table 1 The fuellosses for the various expenments are estimated by visual and metallographic examination at the

00to
Figure 8: Oxidation of UO, under a defect hole in the Zircalpy sheath. Oxidation is progressing alongthe grain boundaries causing the grains to separate from the bulk of the pellet
end of the irradiation. These values are upper-bound estimates as inevitably some fuel loss wasincurred during the post-discharge handling of the elements. As a consequence of the grain-boundary oxidation process, the fuel loss depends on the amount of time that the fuel is exposedto the coolant Other factors which are believed to influence the amount of fuel loss include:
(i) The size and shape of the defect and its orientation to the coolant flow. A larger size ofdefect generally results in greater fuel loss. Defects oriented with their long axis parallelto the coolant flow also lose more UO2.
(ii) The operating power of the fuel since the oxidation rate is dependent on the UO2temperature (see Section 3.2, item b). For example, the greatest amount of fuel loss (andoxidation) occurred in the lower-powered region of the multi-slit element (FFO-103), inaccord with Eq. (9) and Rg. 7 for a pure steam environment
(iii) The amount of restructured fuel (which is also power dependent). Oxidation is slowerin restructured fuel possibly because there are fewer and longer grain boundaries, orbecause of the higher temperature in this region of the fuel (see item ii). This observationcan be seen in Figure 9; here, the UO2 loss follows the as-sintered portion of the pelletwhile the area that has experienced grain growth is relatively untouched.

COoFRACTIONAL RELEASE (R/B)
•g ßEL3 *<
§ gB S
SI
4 FISSION PRODUCT RELEASE
4 1 Experimental Results
The dependence of the release-to-birth rate ratio, R/B, on the decay constant, X, for boththe iodine and noble gas species, has been obtained for the vanous defect experiments, as shownin Fig 10 Inspection of this figure reveals release dependencies between X"2 and X3/2 Earlytheoretical considerations by Booth predicted an R/B proportional to X10 for purely diffusiverelease from the bulk UO2
4346 This latter dependence has been confirmed in recent sweep gasexperiments with intact fuel at CRL at high linear powers (40 to 62 kW/m),47"49 and Halden atlow linear power (23 kW/m)w A similar dependence was also found in experiment FFO-103where the element had been machined with many slits along its sheath to minimize the holdupof fission products in the fuel-to-sheath gap (see table 1) Therefore any delay in release fromelements with defects of a smaller size (i e a steeper release curve in Fig 10) can be attributedto additional trapping in the gap as the fission products migrate toward the defect site Therelatively steeper slope for iodine also indicates a chemical retention of this species in the gap
4.2 Steady-State Fission Product Release Model
Historically, a number of models have been proposed to describe the transport behaviourof fission products m the fuel-to-sheath gap of a defective fuel element during steady-state reactorconditions The early work of Helstrom suggested that the rate-determining process of transportin the gap was atomic diffusion of fission gases within a bulk steam environment.31132 Theempirical model of Allison and Rae estimated the effect of the axial path length on the holdupof the radioactive noble gases53 In other treatments, a first-order rate process was assumed,where the coolant release was proportional to the total inventory in the gap (the proportionalityconstant was defined as an "escape-rate" coefficient) 34~36 In addition, the chemical holdup ofiodine, presumably on the internal sheath surface, was modelled with an adsorption isothermThis latter approach provided the basis of the PROFTP code for determining the number of failedfuel rods in Pressurized Water Reactors (PWRs) based on coolant activity analyses55"37 Thetreatment of Kalfsbeek also considered competing diffusive and bulk-convecttve transportprocesses in Boiling Water Reactor (BWR) fuel pins ** A number of multi-step models haveattempted to account for the release of fission products from both the fuel and the gap usingseparate escape-rate coefficients39 ™ More recently, a kinetic model6162 was used in the CHIRONcode for estimating the number of defective fuel pins in Pressurized and Boiling WaterReactors064 Based on the experimental program at CRL, models have been developed forCANDU fuel to describe the source of release into the gap, and the subsequent transport into theprimary coolant by diffusion and first-order kinetics "2W2
A generalized treatment has also been used to describe the transport of volatile fissionproducts in the gap, leading to a unification of the previous diffusive and first-order kineticapproaches ** This treatment considers axial diffusion along the gap in which release into thecoolant is modelled as a surface-exchange process This model is shown to contain (as specialcases) all previously reported results In particular, the R/B ratio for release into the primarycoolant for an element containing n symmetrical defects along the sheath is

-B t J
(31) Table 7: Oxygen-to-Uranium Ratios for CRL Experiments
where a = surface exchange coefficient between the gap and the coolant (m/s)L = diffusion length = (DA)"2
D = diffusion coefficient in the fuel-to-sheath gap (m2/s){ = fuel element length (m)(R/B)( = fission-product source term in the gap.
Here it is assumed that the defects are located at a distance (/n from each other, and t/2n fromthe ends of the element. Equation (31) is also applicable for the following special cases: n = 1for a mid-rod defect, n = '/$ for an end rod defect, and n = {/b for a longitudinal slit where b isthe inner circumference of the fuel sheath.
When the cladding-defect offers little holdup compared to the axial path length along thegap, a » (D/L) tanh({/2nL), and Eq. (31) becomes (see also Ref. 20):
R/B = (2nU«) tanh(|/2nL) (R/B),. (32)
If the diffusion length of the fission product is much shorter than the fuel element length, L ««/2n, Eq. (32) reduces further to (see also Ref. 17):
R/B = (2nL/{) (R/B)f.
For the case of a single longitudinal slit (i.e. n = {/b), Eq. (32) becomes
R/B = (217b) tanh(b/2L) (R/B),,
(33)
(34)
as previously developed by Helstrom.31 On the other hand, if the diffusion length is much greaterthan the fuel element length, L » {/2n, Eq. (31) yields
R/B = e + X (R/B), (35)
where e = 2no/l. Equation (35) has been proposed by a number of investigators as a first-orderkinetic model where e is termed an escape-rate coefficient "•20'54"56'i!Mi4 If diffusion is thedominant mechanism of release from the fuel matrix:43'46
(R/B)r = 3(D7X)"2, (36)
where D ' = empirical diffusion coefficient of fission products in the fuel matrix (s"1).
In this case, the diffusion model in Eq. (32) yields a release dependence on the decay constantof X-"2 to X:1; the kinetic model in Eq. (35) yields a behaviour of X'"2 to X'30. Thesedependencies are in excellent agreement with the observed results in Fig. 10.
Metallographie SampleLocation
Lower-Plane Section**Mid-Plane SectionUpper-Plane Section
Distance From Bottom (High-Powered) End
43-63195 - 215365 - 275
Oxygen-to-Uranium (O/U) Ratio*
FFO-102-2 FFO-103(A7E) (A3N)
2.152.112.16
N/A***2.28
N/A***
* O/U ratios were determined by gravimetric analysis.** This sample was located between two large secondary defects.*** N/A = Not Available
Figure 11: Comparison of the metallographic cross section and predicted O/U ratio distribution forexperiment FFO-104. (Taken from Ref. 22.)

COIN3
4 2 1 Fission Product Release and Fuel Oxidation
With defected fuel, a transport path exists in which the coolant can enter into the internalelement atmosphere As discussed in Section 3 2 (b), steam is capable of oxidizing the UO2 fuelresulting in an increased oxygen to uranium (O/U) ratio (see table 7) The oxidation model inEq (7) has been applied to a defective fuel element to provide an estimate of the O/U radialdistribution22 This calculation suggests that a characteristic band structure observed in themetallographic examination is due to the presence of a higher oxide phase (see fig 11)
In oxidized fuel the fuel thermal conductivity is reduced,65 leading to an averagetemperature increase in the fuel pellet, which, in turn enhances the fission product release Moreimportantly, an increase in the O/U ratio results in a direct enhancement of the diffusional releaseof fission products from the fuel matrix "•67 These effects have been incorporated into theELESIM fuel performance code (Ref 68) to predict the release of radioactive noble gases fromdefective fuel elements a This, treatment employs the fuel oxidation model of Eq (7), and adiffusion coefficient that depends on both the stoichiometry deviation and the température profilein the fuel pellet The diffusion coefficient itself is based on the assumption that diffusion takesplace on vacant cation lattice'sites in which Frenkel and Schottky equilibria govern the isolatedpoint defects w"71 In contrast, more recent work suggests that xenon diffusion occurs as a neutraltnvacancy (Schottky tno) in UO2 " 7W3 However, the present model of the diffusion coefficientis in agreement with annealing test results in CO/CO2, and with the experimental work of Lindnerand Matzke for xenon diffusion in hyper-stoichiometnc UO2tl
w The defective fuel model inELESIM also accounts for the diffusional transport of fission products in the gap in accord withEq (32), where the gap diffusivity is calculated with the Chapman Enskog kinetic theory "
Figure 12 shows a typical comparison of the measured versus predicted R/B ratios for CRLexperiment FFO-104 as function of decay constant at steady state conditions When fueloxidation effects are ignored, the noble gas releases are under-predicted by at least an order ofmagnitude, however, excellent agreement is generally obtained for all experiments when fueloxidation effects are considered.22 Similar enhancement factors have been experimentallyobserved by Schuster et al74 based on studies of defective and intact fuel pins in LWRs
4 3 Transient Fission Product Release
Transient operation includes such manoeuvres as reactor startup and shutdown, as wellas the cycling of the reactor power An understanding of the release behaviour for the transientsituation is important because there is generally a greater burden of fission products in thecoolant Figure 13 shows the release from a defective fuel element power-cycled between 22 and38 kW/m in experiment FFO-109 (Phase 2)21 The short-lived isotopes display a greatersensitivity to changes in the fuel element power The increase in the noble gas concentrationsoccur during the power-uprating portion of the cycle For experiment FDO-681, the concentrationof iodine steadily increased during the shutdown penod in Figs 14(a) and (b) (see discussionbelow), in contrast, the noble gas concentrations decreased as a result of radioactive decay in thecoolant43 On start-up, the activity levels increased for both iodine and noble gases with theshorter-lived isotopes exhibiting the greater increase
Inspection of Fig 10 shows that only a small fraction of the fission-product iodine m adefective pin is released into the coolant while the reactor is operating at constant power Mostof the iodine available for release is present as a liquid-water soluble deposit (such as cesiumiodide) on the UO2 fuel surface or inner surface of the Zircaloy sheath If the temperature in thefuel to sheath gap drops below that of coolant saturation, as during reactor shutdown, the water
Experiment FFO-104R/B (%)
1 OE+01
1 OE*00
10E-01
I OE-02
1 OE-03IDE 06
Xel35 ~\^ Xel38:x»133Xel33m KrSSm Ir88 Kr87
10E-05 IOE 04 10E 03LAMBDA (1/s)
Figure 12 Comparison of measured versus predicted release for CRL defect experiment FFO-104 Theasterisks indicate the measured data, the solid line corresponds to the model prediction withoutfuel oxidation, and the dark solid line indicates the use of the model with fuel oxidation(Taken from Ref 22 )
cc2:
101'
10'
-i——i—i——i——i——i——rXe133
;"\' "»' \'\'VV\''\''*\'' Kr85m
-SHUTDOWN
STARTUP
r 40
POWER CYCLINGI i i i i l i i l
234 5 6 7 8 9 10 11 12 13
TIME (DAYS)
LINEAR' 30 POWER- 20 (kW/ml- 10
0 _____MAY 1983
Figure 13 Concentration of fission products in the coolant versus time for a reactor cycling mode ofoperation in experiment FFO-109 (Phase 2) (Taken from Ref 21 )

(a)
o
zo T'I
(055REACTOR POWER
soREACTOR
"*° POWERIMW)
K>
1000 IIOO
TIME (hi
4O
(b)«.,
REACTOR TOWER, REACTOR•» POWER
IMWl10
8OO »OO IOOOTIME (h)
1100
Figure 14.<oCO
Concentrations of fission products in the coolant versus time in experiment FDO-681 for(a) a reactor trip and subsequent startup (Ref. 43)(b) a scheduled reactor shutdown (Ref. 43).
which has entered the element remains in the liquid phase (see Ref. 75), and leaches thesedeposits. The dissolved iodine then migrates along the water-filled gap to the defect site,resulting in an increased release to the primary coolant. This "iodine-spiking" phenomenon hasbeen widely discussed in the literature.18'20-21-76"83 The behaviour of the iodine release on shutdownin Fig. 13 has been modelled by both diffusion and first-order kinetics according to theexpression (see Fig. 15):18-20-21
Nc(t) = (NM + Ngo{ 1 - exp[-(e- L) t]}e/(e - L)) x exp[-(X + L) t], (37)
where Nc(t) = inventory of iodine in the coolant at time t (atoms)Nco = initial inventory of iodine in the coolant (atoms)Ngo = initial inventory of iodine in the gap (atoms)e = gap escape-rate coefficient (s"')
= n^n^D/f, where D is the effective diffusion coefficient for iodine in thegap, and n is the number of defect sites (see Section 4.2)
L = loss-rate constant for coolant leakage and ion-exchange purification (s"1).
On reactor shutdown, only the water-soluble species (e.g. iodine and cesium) are released intothe coolant83 The liquid water present in the gap blocks the release of noble gas by eithertrapping the gas at the top of the element or by surface tension effects in the fuel cracks.21 Asthe reactor returns to full power, the iodine-rich water is expelled from the element (at lowpower), giving a second distinctive spike as the fuel thermally expands and the size of the gapis reduced. The noble gases are expelled from the element after the water in the gap hasvapourized.
4.4 Fission Product Release From Uranium Contamination
In a reactor, traces of uranium compounds may be found on the surfaces of the heattransport system. This contamination is the result of a previous loss from defective fuel (see
MAY 01 20 -21,
Figure 15:
10 20 30 40 SO 60
SHUTDOWN TIME (hours)
Fitting of iodine-spiking model [Eq. (37)] to data for reactor shutdown in experiment FFO-109(Phase 2) (Ret. 21).

<O Section 3 3), and from the onginal uranium traces deposited on fuel pin external surfaces duringfuel fabrication As a consequence of grain boundary oxidation, the uranium contamination isgenerally m the form of very fine particles (see Figs 8 and 9), except in the circumstance of asevere failure where a portion of the fuel pellet may be released Hence, for small particles offuel at low temperature, fission product release will occur by direct recoil where the range of thefission fragment (p. ~ 8 pm) is comparable to the size of the UO2 fuel particle IMO For instance,experimental ratios of release rates of œKr to l3SXe were between 0 4 and 0 7 in a pressunzed-water loop containing fuel debns on the piping surface " This range is in excellent agreementwith the theory of recoil where the ratio of the release rates (R^/R138) is equal to that of thefission-product yields (/"/y138 = 0 55) In particular, the release expression for a small particleof fuel of diameter d, deposited onto a solid surface, is"20
(38)
where a = 1 or d/p whichever is greater Thus, R « y since the right hand side (RHS) of Eq(38) is a constant and B is proportional to y Furthermore, if d - p (see Fig 8), Eq (38) reducestoR/B = Vi
5. POWER REACTOR APPLICATIONS
The present understanding of defective fuel performance and fission-product release haveled to a number of analytical tools for the monitoring of failed fuel in commercial power reactorsof the LWR5"7""4-83-87 and CANDU3 ww-'1 design Based on a gamma-ray spectrometryanalysis of the primary coolant, such tools can provide an estimate of the core condition (e g thenumber of defective fuel rods, the average defect size, and the amount of tramp uraniumdeposited on the in-core surfaces) In some CANDU reactors, defective fuel bundles can alsobe detected and located by exploiting the on-power refuelling capability of the reactor with theuse of delayed-neutron monitoring techniques3'2'93
Many of the analysis programs for fuel-failure monitoring are based on the methodologypresented in Section 425-ss-"-64 For example, the release-to-birth rate ratio (R/B) of fissionproducts released into the primary coolant is given by the model "
R"S e + >
(39)
where Ae.XDcF,F
x 3 (D )'",escape rate constant in the fuel-to-sheath gap (s '),radioactive decay constant (s '),empirical diffusion coefficient in the UO2 fuel (s '),Vi F./F,fission rate in the tramp uranium,average fission rate per defective fuel rod
The first term on the RHS of Eq (39) pertains to the fission-product release from x failed fuelrods [see Eqs (35) and (36)], while the second term describes the recoil release from the trampuranium deposited on m reactor surfaces of the PHTS [Eq (38)] The measured coolant activityconcentration C„ (Bq/L) is converted into an R/B ratio given the average fuel-element power
"" L exp(X7) (40)Fy
where ß is the purification rate constant (s '), VL is the PHTS loop volume, T is the transporttime from the core to the data sampling location, and y is the fission product yield Equation(39) is fit using a non-linear least squares analysis to the measured R/B ratios for a given fissionproduct species
The condition of the core can now be determined from the fitting parameters of the model(e, A and c) M These parameters can be compared to the well-characterized data of the CRLexperiments (table 1) By fitting Eqs (35) and (36) to the release data in Fig 10, the diffusioncoefficient can be expressed as a function of the fuel element linear power, P (in kW/m),according to the correlations D',^ = 10'*57k«p M1314 and D',«* = lO"3*'"81' 234°" Thus, thenumber of fuel failures in the power-reactor core can be determined by
A(41)
where D is evaluated at the average fuel-rod power The average size of defect for thesefailures can also be estimated with the previous relation (see Secüon 4 2)
= (2na)/«, (42)
where the escape rate constant e depends on both the fission-product chemistry, and the defectgeometry (i e transport path length) in the fuel rod As shown in the CRL experiments (see Fig16), the surface exchange coefficient, a, can be expressed as a function of the defect size E insquare millimetres O,^ = IQ07"*10^ ">73 and a^^ = 7 14 x 10* m/s In fact, a is stronglydependent on the defect size for iodine due to the chemical effects of water/steam m the fuel-tosheath gap, whereas, it is relatively constant for the inert noble gases Thus, the average defectsize for the power-reactor failures can be estimated in which the geometry (n) is determined fromEq (42) given the experimental value of 0, ^ and the fitted value of e from the power-reactordata Using this information, the size of the sheath defect, E, can in turn be calculated from thecorrelation for 0^^ and the fitted value of e for the iodine species Finally, the amount oftramp uranium irij, in the power reactor core can be determined from the fitted value of c suchthat "-20-25
cF (43)
where N0 is Avogadro's constant, xp is a function that depends on the isotopic fissile content ofthe fuel, and <$r> is the volumetncally-averaged thermal neutron flux

SURFACE EXCHANGE COEFFICIENT « (m/s)
Figure 16
FFO-W2-2 (3ttÂ*t)FFO-W2-2<3Apr)
FFO-104 FFO-103
1 10 100 10OO 10000
DEFECT SIZE (mm2)° IODINE * HOBLE OA5
Surface exchange coefficient a for »dine and noble gases versus defect size for CRLexperiments- The surface exchange coefficient was evaluated assuming (a) a mid-rod defect (n= 1) for elements A7A and A2F, (b) an end-rod defect (n = 14) for element ATE, and (c) alongitudinal slit (n = l/b) for element A3N (see table 1)
The present analysis package has been validated against fuel failure data obtained fromCANDU power-reactor expenence For instance, the package is able to predict the number offailures within a factor of two for the iodine analysis, with a much better agreement (i e within25 per cent) for that of the noble gases "
6. SUMMARY
The release-to-birth rate (R/B) ratio, at steady-state reactor operation, increases with thepower and burnup of the fuel element, as well as with the size of defect (see Fig 10)For defective fuel elements operating above 20 kW/m, the R/B dependence on the decayconstant is directly related to the defect state, with a dependence between X l /2 to X3ß
This behaviour is consistent with theoretical models based on simple diffusion in the fuelmatrix, and diffusion or first order kinetics in the fuel-to-sheath gap Transport of iodinein the gap is more restricted than that of noble gas
Physically-based models have been developed to predict the activity release of radioactivenoble gases from defected fuel elements during steady-state reactor conditions Inparticular, a model implemented in the ELESIM fuel-performance code accounts for thevarious interrelated phenomena that can affect the prediction of fuel temperature andfission-product release including the kinetics of fuel oxidation, and the diffusion of fissionproducts in the fuel matrix and along the gap
The transient release is dependent on the half-life of the isotope (shorter-lived isotopesare more sensitive to changes in the fuel power), and the chemical nature of the fissionproduct Iodine is released on both reactor startup and shutdown, whereas noble gas isonly released in quantity on reactor startup On prolonged reactor shutdown, iodinedeposits are leached by the liquid water resulting in an enhanced release to the primarycoolant In this "iodine-spiking" process, the transport of iodine in the gap can bedescribed by diffusion or first-order kinetics
Recoil is the dominant mechanism of fission-product release from fuel debns found onin-core reactor surfaces This source of activity release in the primary heat-transportsystem can be distinguished from that of fuel pin failure, allowing for a more accurateassessment of the core condition Analytical tools, based on a number of defective-fuelstudies, have been developed for fuel-failure monitoring in power reactors
<O01
Studies based on m-reactor loop experiments and nuclear power plant expenence haveprovided a better understanding of the performance of defective nuclear fuel rods Forexample, an m-reactor research program at the Chalk River Laboratories (CRL) hasinvolved the irradiation of fuel elements containing various sizes and types of sheathfailure, operating at linear powers ranging from 14 to 67 kW/m up to a maximum bumupof 278 MWh/kgU
For the initiation of sheath hydnding, a primary hole size of about 1 pm will provide acritical hydrogen/oxidant ratio, whereas hydnding will not occur for defect sizes greaterthan about 130 pm The rate of internal hydrogen production by the oxidation of theuranium dioxide fuel and Zircaloy cladding are only important at the beginning of theirradiation period, after which coolant radiolysis becomes the predominant source Bothhydnding and degradation of the sheath progress faster at higher power in accord witha previous UKAEA study Increased element damage can result from mechanical stressesdunng transient reactor operation An average fuel loss rate of up to 4 g of UOj/day hasbeen observed
ACKNOWLEDGEMENTS
The authors would like to acknowledge the contributions of J J Lipsett, R D Delaney,R L da Silva, M R Floyd, J J Judah, A M Manzer, D D Sememuk, D F Shields, and NRXReactor Branch personnel, to the defect program The assistance provided by J C Wood, H ESills, D G Hardy, D S Cox, M J Notley, P J Fehrenbach, J M. Bunge, and E P Penswick ofCRL is greatfully acknowledged The authors would also like to thank C R Phühps (U of T),P T Truant (OH), C E Beyer (BPNL), Y H Kang (KAERI), E Gheorghiu (INPR), R J Green(RMC), and D R Olander (UQ for many helpful discussions
The experimental program was funded by a cooperative program between Atomic Energyof Canada Limited (AECL) and Ontario Hydro The current work was funded by the AcademicResearch Program of the Department of National Defence of Canada under allocations 3705-882and 3705 4, and AECL

(Oo> REFERENCES
1. P.T. Truant and I.J. Hastings, "CANDU Reactor Experience: Fuel Performance", AtomicEnergy of Canada Limited report AECL-8774, July 1985.
2. A.J. Hains, R.L. da Suva and P.T. Truant, "Ontario Hydro Fuel Performance Experienceand Development", Proceedings of the International Conference on CANDU Fuel (ISBN0-919784-13-5), Chalk River, Canada, October 6-8, 1986, p. 79.
3. R.D. MacDonald, M.R. Floyd, B.J. Lewis, A.M. Manzer and P.T. Truant, "Detecting,Locating and Identifying Failed Fuel in Canadian Power Reactors", Atomic Energy ofCanada Limited report AECL-9714, IAEA Coordinated Research Program on theExamination and Documentation Methodology for Water Reactor Fuel (ED-WARF),February 1990.
4. R.L. Yang, O. Ozer and H.H. Klepfer, "Fuel Performance Evaluation for EPRI ProgramPlanning", Proceedings of the International Topical Meeting on LWR Fuel Performance,Avignon, France, April 21-24, 1991, p. 258.
5. J.M. Markowitz, "Internal Zirconium Hydride Formation in Zircaloy Fuel ElementCladding Under Irradiation", Bettis Atomic Power Laboratory report WAPD-TM-351,May 1963.
6. D.H. Locke, "Defected Zircaloy Fuel", Nucl. Eng. Inter., August 1969, p. 648.
7. D.H. Locke, "The Behaviour of Defective Reactor Fuel", Nucl. Eng. Design 21 (1972)318.
8. D.H. Locke, "Mechanisms of Deterioration of Defected LWR Fuel", Proc. Specialists'Mtg. Defected Zirconium Alloy Clad Ceramic Fuel in Water Cooled Reactors, ChalkRiver, Canada, September 17-21,1979, IWGFPT/6, p. 101, International Atomic EnergyAgency (1980).
9. R.A. Proebstle, J.H. Davies, T.C. Rowland, D.R. Rutkin and J.S. Armijo, "TheMechanism of Defection of Zircaloy-Clad Fuel Rods by Internal Hydriding", Proc. Of theJoint ANS-CNS Topical Mtg. on Commercial Nuclear Fuel Technology Today, Toronto,Canada, April 1975.
10. J.H. Davies, "Secondary Damage in LWR Fuel Following PCI Defection - Characteristicsand Mechanisms", Proc. Specialists' Mtg. Defected Zirconium Alloy Clad Ceramic Fuelin Water Cooled Reactors, Chalk River, Canada, September 17-21, 1979, IWGFPT/6, p.135, International Atomic Energy Agency (1980).
11. B. Cox, Mechanism of Hydrogen Absorption by Zirconium Alloys", Atomic Energy ofCanada Limited report AECL-8702, November 1984.
12. J.C. Clayton, "Internal Hydriding in Irradiated Defected Zircaloy Fuel Rods", Zirconiumin the Nuclear Industry: Eighth International Symposium, STP 1023, American Societyfor Testing and Materials, Philadelphia, 1989, p. 266.
13. J.H. Davies and G.A. Potts, "Post-Defect Behaviour of Barrier Fuel", Proceedings of theInternational Topical Meeting on LWR Fuel Performance, Avignon, France, April 21-24,1991, p. 272.
14. R.L. da Suva, "Irradiation of a CANDU UO2 Fuel Element with Twenty-three MachinedSlits Cut Through the Zircaloy Sheath", Atomic Energy of Canada Limited report AECL-8260, September 1984.
15. M.R. Floyd, "Characterisation of Defective CANDU Fuel Using Gaseous and DissolvedFission Product Data", Ontario Hydro report CNS-IR-37351-2, October 1985.
16. R.L. da Suva, D.R. McCracken and K.J. Monserrat, "Behaviour of Depositing FissionProducts Released from Defective Fuel", Advances in Ceramics, Vol. 17, Fission ProductBehaviour in Ceramic Oxide Fuel, American Ceramic Society (1986), p. 107.
17. B.J. Lewis, C.R. Phillips and M.J. Notley, "A Model for the Release of RadioactiveKrypton, Xenon, and Iodine from Defective UO2 Fuel Elements", Nucl. Technol. 73(1986) 72.
18. B.J. Lewis, D.B. Duncan and C.R. Phillips, "Release of Iodine from Defective FuelElements Following Reactor Shutdown", Nucl. Technol. 77 (1987) 303.
19. B.J. Lewis, "Fission Product Release from Nuclear Fuel by Recoil and Knockout", J.Nucl. Mater. 148 (1987) 28.
20. B.J. Lewis, "Fundamental Aspects of Defective Nuclear Fuel Behaviour and FissionProduct Release", J. Nucl. Mater. 160 (1988) 201.
21. B.J. Lewis, R.D. MacDonald and H.W. Bonin, "Release of Iodine and Noble Gas FissionProducts from Defected Fuel Elements During Reactor Shutdown and Start-Up", Nucl.Technol. 92 (1990) 315.
22. B.J. Lewis, F.C. Iglesias, D.S. Cox and E. Gheorghiu, "A Model for Fission Gas Releaseand Fuel Oxidation Behaviour for Defected UO2 Fuel Elements", Nucl. Technol. 92(1990) 353.
23. B.J. Lewis, "A Generalized Model for Fission-Product Transport in the Fuel-to-SheathGap of Defective Fuel Elements", J. Nucl. Mater. 175 (1990) 218.
24. M.J.F. Nötley and J.H.K. Lau, "A Model for Estimating the Pre- and Post- Shutdown I-131 Coolant Inventories in CANDU Reactors", Proceedings of the International TopicalMeeting on LWR Fuel Performance, Avignon, France, April 21-24, 1991, p. 419.

25. BJ. Lewis, R.J. Green and C.W.T. Che, "A Prototype Expert System for the Monitoring 38.of Defected Nuclear Fuel Elements in CANDU Reactors", Nucl. Technol., in press.
26. J.C. Wood, "Interactions Between Stressed Zirconium Alloys and Iodine at 300°C", J. 39.Nucl. Mater. 23 (1974) 63.
27. J.F. Ziegler, IP. Biersack and U. Littmark, "The Stopping and Range of Ions in Solids", 40.Vol. 1, Pergamon Press, New York, 1985. (See also the computer code: "TRIM-89: TheTransport of Ions in Matter - Version 5.1", International Business Machines, RadiationScience Group, User's Manual, November 1988.)
28. D.R. Olander, "Fundamental Aspects of Nuclear Reactor Fuel Elements", US Department 41.of Energy, TID-26711-pl, 1976, p. 303.
29. C. Wise, "Recoil Release of Fission Products from Nuclear Fuel", J. Nucl. Mater. 136 42.(1985) 30.
30. G.I. Bell and S. Glasstone, "Nuclear Reactor Theory", Robert E. Krieger, Huntington, 43.New York, 1979, p. 120.
31. J.T. Bittel, L.H.Sjohdal and J.F. White, "Steam Oxidation Kinetics and Oxygen Diffusionin UO2 at High Temperatures", J. Amer. Ceram. Soc. Vol. 52, No. 8, 446 (1968). 44.
32. R.E. Carter and K.W. Lay, "Surface-Controlled Oxidation-Reduction of UO2", J. Nucl.Mater. 36 (1970) 77.
45.33. J.A. Meachen, "Oxygen Diffusion in Uranium Dioxide: A Review", Nucl. Energy, 28
(1989) 221.
34. D.S. Cox, F.C. Iglesias, C.E.L. Hunt, N.A. Keller, R.D. Barrand, J.R. Mitchell and R.F.O'Connor, "Oxidation of UOj in Air and Steam with Relevance to Fission Product 46.Releases", Proc. Symp. Chemical Phenomenon Associated with Radioactivity DuringSevere Nuclear Plant Accidents, Anaheim, California, 9-12 September 1986, NUREG/CP-0078, pp. 2-35, U.S. Nuclear Regulatory Commission. 47.
35. D.S. Cox, F.C. Iglesias, C.E.L. Hunt, R.F. O'Connoi and R.D. Banand, "High-Temperature Oxidation Behaviour of UO2 in Air and Steam", Proc. Int Symp. High- 48.Temperature Oxidation and Sulphidation Processes, Hamilton, Ontario, Canada, August26-30, 1990.
36. D.R. Olander, "Oxidation of UO2 by High Pressure Steam", Nucl. Technol. 74 (1986) 49.215.
37. P.O. Perron, "Thermodynamics of Non-Stoichiometric Uranium Dioxide", Atomic Energyof Canada Limited report AECL-3072, May 1968.
B. Cox, "Some Factors Which Affect the Rate of Oxidation and Hydrogen Absorption ofZircaloy-2 in Steam", AERE-R4348, 7 November 1963.
G.W. Parry and P.O. Smerd, "Review of PWR Fuel Rod Waterside Corrosion Behaviour",NP-1472, Electric Power Research Institute", August 1980.
H. Stehle, F. Garzaolli, A.M. Garde and P. Smerd, "Characterization of ZrO2 FilmsFormed In-Reactor and Ex-Reactor to Study the Factors Contributing to the In-ReactorWaterside Corrosion of Zircaloy", Proc. 6th Int. Symp. on Zirconium in the NuclearIndustry, ASTM-STP 824 (1984) 483.
H.R. Peters, "Improved Characterization of Aqueous Corrosion Kinetics of Zircaloy-4",Proc. 6th Int. Symp. on Zirconium in the Nuclear Industry, ASTM-STP 824 (1984) 507.
A.I.A. Almarshad and A.C. Klein, "A Model for Waterside Oxidation of Zircaloy FuelCladding in Pressurized Water Reactors", J. Nucl. Mater. 183 (1991) 186.
R.D. MacDonald and JJ. Lipsett, "The Behaviour of Defected Zircaloy-Clad-UO2 FuelElements with Graphite Coatings Between Fuel and Sheath Irradiated at Linear Powersof 48 kW/m", Atomic Energy of Canada Limited report AECL-6787, May 1980.
R.D. MacDonald, JJ. Lipsett, E.E. Perez and P.K. Kos, "Purposely Defected UO2 ZircaloyFuel Elements Irradiated in Pressurized Light Water at Linear Powers of 55 kW/m",Atomic Energy of Canada Limited report AECL-7751, May 1983.
A.H. Booth, "A Suggested Method for Calculating the Diffusion of Radioactive Rare GasFission Products from UO2 Fuel Elements and a Discussion of Proposed In-ReactorExperiments that may be used to Test its Validity", Atomic Energy of Canada Limitedreport AECL-700, September 1957.
B.J. Lewis and H.E. Sills, "Fission-Product Transport and the Diffusion Approximation",J. Nucl. Mater. 184 (1991) 107.
I.J. Hastings, C.E.L. Hunt and J.J. Lipsett, "Release of Short-Lived Fission Products fromUO2 Fuel: Effects of Operating Conditions", J. Nucl. Mater. 130 (1982) 407.
BJ. Lewis, C.E.L. Hunt and F.C. Iglesias, "Source Term of Iodine and Noble Gas FissionProducts in the Fuel-to-Sheath Gap of Intact Operating Nuclear Fuel Elements", J. Nucl.Mater. 172 (1990) 197.
BJ. Lewis, D.B. Knight and F.C. Iglesias, "Comparison of the ANS 5.4 Fission ProductRelease Model with Sweep Gas Experiments", Proceedings of the International TopicalMeeting on LWR Fuel Performance, Avignon, France, April 21-24, 1991, p. 605-619.
<o

(O00
50. A.D. Appelhans and J.A. Tumbull, "Measured Release of Radioactive Xenon, Kryptonand Iodine from UO2 during Nuclear Operation and a Comparison with Release Models",Proc. 8th Water Reactor Safety Research Information Meeting, Gaithersburg, Maryland,October 27-31, 1980, US Nuclear Regulatory Commission.
51. C. Helstrom, "Emission Rate of Fission Products from a Hole in the Cladding of aReactor Fuel Element", AECU 3220, July 1956.
52. B. Lustman, "Irradiation Effects in Uranium Dioxide", Chapter 9, in: J. Belle, "UraniumDioxide: Properties and Nuclear Applications" U.S. Government Printing Office,Washington D.C. (1961), pp. 431-666.
53. G.M. Allison and H.K. Rae, "The Release of Fission Gases and Iodine from DefectedUO2 Fuel Elements of Different Lengths", Atomic Energy of Canada Limited reportAECL-2206, June 1965.
54. P. Bourgeois and J.P. Stora, "Behaviour of Fission Products in PWR Primary Circuits andDefected Fuel Rod Evaluation", presented at the 5th Int Conf. Structural Mechanics inReactor Technology, Berlin, FRG, March 20, 1979.
55. P. Beslu, C. Leuthrot, and G. Frejaville, "PROFTP Code: A Model to Evaluate the Releaseof Fission Products from Defected Fuel in PWRs", Proc. Specialists' Mtg. DefectedZirconium Alloy Clad Ceramic Fuel in Water Cooled Reactors, Chalk River, Canada,September 17-21, 1979, IWGFPT/6, p. 23, International Atomic Energy Agency (1980).
56. R. Beraha, G. Beuken, G. Frejaville, C. Leuthrot, and Y. Musante, "Fuel Survey in theLight Water Reactors Based on the Activity of the Fission Products", Nucl. Technol. 49(1980) 426.
57. C. Leuthrot, A. Brissaud and J.P. Missud, "Relationships Between the Characteristics ofCladding Defects and the Activity of the Primary Coolant Circuit and Aid for theManagement of Leaking Fuel Assemblies in PWR", Proceedings of the InternationalTopical Meeting on LWR Fuel Performance, Avignon, France, April 21-24,1991, p. 324.
58. H.W. Kalfsbeek, "The Abundance of Fission Gases in the Off Gas of a Boiling WaterReactor", Nucl. Technol. 62 (1983) 7.
59. J.T. Mayer, E.T. Chulick, and V. Subrahmanyam, "B&W Radiochemical Analyses forDefective Fuel", Proc. Specialists' Mtg. Defected Zirconium Alloy Clad Ceramic Fuel inWater Cooled Reactors, Chalk River, Canada, September 17-21,1979, IWGFPT/6, p. 221,International Atomic Energy Agency (1980).
60. H. Zänker, "Defective Fuel Rod Detection in Operating Pressurized Water Reactors duringPeriods of Continuously Decreasing Fuel Rod Integrity Levels", Nucl. Technol. 86 (1989)239.
61. D.L. Burman, "Methods for Estimating Numbers of Failed Rods from Coolant ActivityAnalysis", presented at the EPRI Workshop on Fuel Integrity Monitoring by CoolantActivity Analysis, Charlotte, North Carolina, May 21, 1986.
62. D.L. Burman, O.A. Correal, H.W. Wilson, H. Kunishi, L.H. Boman, "Development of aCoolant Activity Evaluation Model and Related Application Experience", Proceedings ofthe International Topical Meeting on LWR Fuel Performance, Avignon, France, April 21-24, 1991, p. 363.
63. C.E. Beyer, "Methodology Estimating Number of Failed Fuel Rods and Defect Size",Electric Power Research Institute, EPRI NP-6554, September 1989.
64. C.E. Beyer, "An Analytical Model for Estimating the Number and Size of Defected FuelRods in an Operating Reactor", Proceedings of the International Topical Meeting on LWRFuel Performance, Avignon, France, April 21-24, 1991, p. 437.
65. "MATPRO-Version 11 (Revision 1)-A Handbook of Materials Properties for Use in theAnalysis of Light Water Reactor Fuel Rod Behaviour", NUREG/CR-0497, Rev. 1 [TREE1280 (Rev. 1)], U.S. Nuclear Regulatory Commission 1980.
66. H. Matzke, "Gas Release Mechanisms in UO2-A Critical Review", Radiation Effects 53(1980) 219.
67. G.T. Lawrence, "A Review of the Diffusion Coefficient of Fission-Product Rare Gasesin Uranium Dioxide", J. Nucl. Mater. 71 (1978) 195.
68. M.J.F. Notley, "ELESIM: A Computer Code for Predicting the Performance of NuclearFuel Elements", Nucl. Technol. 44 (1979) 445.
69. J.C. Killeen and J.A. Tumbull, "An Experimental and Theoretical Treatment of theRelease of 83Kr from Hyperstoichiometric Uranium Dioxide", Proc. Workshop ChemicalReactivity of Oxide Fuel and Fission Product Release, Gloucestershire, England, April 7-9, 1987, p. 387, Central Electricity Generating Board.
70. J.V. Sharp, "Radiation Enhanced Diffusion", Report 6267, Atomic Energy ResearchEstablishment (1969).
71. A.B. Lidiard, "Self-Diffusion of Uranium in UO2", J. Nucl. Mater. 19 (1966) 106.
72. H. Matzke, "Diffusion in Ceramic Oxide Systems", Advances in Ceramics, Vol. 17,1986,p. 1, American Ceramic Society.
73. R.A. Jackson and C.R.A. Catlow, "Trapping and Solution of Fission Xenon in UO2; Part1: Single Gas Atoms and Solution from Underpressurized Bubbles; and Part 2: Solutionfrom Small Overpressurized Bubbles", J. Nucl. Mater. 127 (1985) 161-169.

74. E. Schuster, F. Gaizarolli, A. Kersting, K.H. Neeb and H. Stehle, "Escape of FissionProducts from Defective Fuel Rods of Light Water Reactors", Nucl. Eng. Des. 64 (1981)81.
75. G. Kurka, A. Harrer and P. Chenebault, "Fission Product Release from a PressurizedWater Reactor Defective Fuel Rod, Effect of Thermal Cycling", Nucl. Technol. 46 (1979)571.
76. R.J. Lutz, Jr., "Iodine Behaviour Under Transient Conditions in the Pressurized WaterReactor", WCAP-8637, Westinghouse Electric Corporation (1975).
77. N. Eickelpasch and R. Hock, "Fission Product Release After Reactor Shutdown", Proc.Symp. Experience from Operating and Fueling Nuclear Power Plants, Vienna, October8-12,1973, CONF-731083, IAEA-SM-178/19, STT/Pub-351, International Atomic EnergyAgency.
78. RJ. Lutz and W. Chubb, "Iodine Spiking - Cause and Effect", Trans. Am. Nucl. Soc. 28(1978) 649.
79. K.H. Neeb and E. Schuster, "Iodine Spiking in PWRs: Origin and General Behaviour",Trans. Am. Nucl. Soc. 28 (1978) 650.
80. N. Eickelpasch, R. Seepolt and R. Hock, "Iodine Release Mechanism and its Verificationin Plant Operation", Trans. Am. Nucl. Soc. 28 (1978) 652.
81. R.R. Bellamy, "A Regulatory Viewpoint of Iodine Spiking During Reactor Transients",Trans. Am. Nucl. Soc. 28 (1978) 651.
82. W.N. Bishop, "Iodine Spiking", EPRINP-4595, Electric Power Research Institute (1986).
83. W. Chubb, "On-Line Assessment of LWR Core Integrity", Trans. Am. Nucl. Soc. 56(1988) 508.
84. P.G. Voillequé, "Measurement of Radioiodine Species in Samples of Pressurized WaterReactor Coolant", Nucl. Technol. 90 (1990) 23.
85. J.P. Adams and C.L. Atwood, "The Iodine Release Rate During a Steam Generator TubeRupture", Nucl. Technol. 94 (1991) 361.
86. G.M. Allison and R.F.J. Robertson, "The Behaviour of Fission Products in Pressurized-Water Systems (A Review of Defect Tests on UO2 Fuel Elements at Chalk River)",Atomic Energy of Canada Limited report AECL-1338, September 1961.
87. W. Hüttig, H. Zänker and M. Forberg, "In-Core Surveillance of Defective PWR FuelElements in the Case of Fuel-to-Water Contact", J. Nucl. Mater. 175 (1990) 147.
88. A.M. Manzer, "In-Core Assessment of Defective Fuel in CANDU-600 Reactors", IAEASpecialists' Meeting on Post-Irradiation Examination and Experience, Tokyo, Japan,November 26-30, 1984.
89. A.M. Manzer and N. Macici, "Fuel Defect Detection by Radioiodine Monitoring", 8thAnnual Conference of the Canadian Nuclear Society, Saint John, New Brunswick, June14-17, 1987.
90. A.M. Manzer, R.W. Sancton and N. Macici, "Canadian CANDU-600 Perspective on FuelIntegrity Performance Indicators", (AECL-9602), International Meeting on Nuclear PowerPlant Operation, Chicago, Illinois, August 30 - September 3, 1987.
91. B.J. Lewis, "A Model for Calculating the 1-131 Release from Defective Fuel for Steady-State and Reactor Shutdown Conditions", to be presented at the Third InternationalConference on CANDU Fuel, Pembroke, Canada, October 4-8, 1992.
92. A.M. Manzer, "Transport Mechanisms of Uranium Released to the Coolant from FuelDefects", International Conference on CANDU Fuel, Chalk River, Canada, October 6-8,1986.
93. A.M. Manzer, J.W.D. Anderson and C.W. So, "Defect Detective: An Expert System forthe Detection and Evaluation of Fuel Defects in CANDU 600 Nuclear Power Reactors",9th Annual Conference of the Canadian Nuclear Society, Winnipeg, Manitoba, June 12-15, 1988.
<OCD

ooAPPLICATION OF THE PES-PEPA EXPERT SYSTEMAT THE DUKOVANY NUCLEAR POWER PLANT
F. PAZDERA, M. VALACHNuclear Research Institute,RezO. BÄRTA, L. NOVÂKChemcomex Limited,PragueV. STECHNuclear Power Plant Dukovany,DukovanyCzechoslovakia
Abstract
The report summarizes practical experience obtained by theapplication of the expert system PES-PEPA developed forWWER 440, type V230/V213 nuclear power plants. As an example,it shows its ability to identify, independently on the per-sonnel activity, the presence of a damaged FE in the core, tooptimize transients with the aim to limit radioactivity re-leases and to assess burnup of the damaged fuel assembly.
1. IntroductionSince 1990, a. simple Fuel Expert System has been in ope-
ration at all units of Dukovany NPP which enables to:- optimize transients with the aim to minimize theprobability of damage to fuel elements as a result ofpellet-cladding interaction;
- identify, independently on personnel activity, thebeginning of deherraetization of the FE cladding;
- quantify the number of damaged FE's and the degree oftheir damage by evaluating the measured values fromon-line gamma spectrometer monitoring primary coolant;
- optimize transients with regard to total releasedradioactivity from the damaged fuel element;
- estimate probable burnup of damaged fuel elements.The developed expert system is implemented directly to
existing Dukovany NPP information system.A similar expert system is at present being implemented
also in the information system of the Bohunice NPP.
S•ncW
nnrt
BrtItmrtMCort

2. The Fuel Expert System featuresThe expert system structure as well as its
implementation in existing information systems of V230/V213units is presented in Fig.l.
The description of the algorithm of individual modulesused to build the system can be found in reports [1-4]. Itshould be emphasized that the Fuel Expert System comprisestwo independent subsystems ( PES-Bu and PEPA) .
The subsystem PES-Bu is installed in the so-called 3rdcalculation set of the V213 unit which, besides other, per-forms calculation of instantaneous spatial distribution ofcore power during operation. These results serve as an inputfor real-time calculations of so-called "conditioned power"in 10 horizontal planes of the core with 365 points to eachplane. At the same time PES-Bu subsystem calculates maximumallowable power jump for all these points.
The operator receives current information on:- maximum permissible increase of the unit power;- exceeding of permissible local power jump,if any, with its exact position within the core andsome other information
On request the operator obtains:- complete list of individual core assemblies along with.the instantaneous value of the conditioned power andmaximum allowable local power increase for each assem-bly;
- at the end of the fuel cycle: a map of fuel damageprobability distribution caused by the pellet-claddinginteraction ( PCI ) .
The other subsystem, PEPA, has been installed into theChemistry Department information system as a softwaresupplement to the on-line gamma spectrometry of each unit'sprimary coolant. It provides:
- reports on- the state of fuel cladding, including thenumber of damaged fuel elements;
- distribution of the damaged fuel elements into threegroups according to the rate of fission productsrelease (small, medium, large defects);
- the level of contamination of the primary circuitsurface by fission products.
The operator can interactively enter the parameters of aplanned transient, i.e. change of the unit output, coolanttemperature and pressure, water parameters, as flow rate atthe SVO-1 (coolant purification system). He will also receivethe prediction of coolant radioactivity increase (i.e. up to27 chosen radionuclides ) . Thus, system provides simpleprocedure for off-line optimization of the plannedtransients, the objective being to minimize the amount offission product release from a damaged FE.
H-<a
(O
IOte& o.o H-< o
hO O.m ntaa t*H- nrt rt
H-M <
(Dl-l P-H-DOQ. V
i-!to M-O B• (uu) n• X!voM n
ol oH"
s> tuui B• rt-
o—l—
•«L.
01 -•• -••O O O>o o

X»135
[MW]
1400 --
1200 -•
1000 -•
800 --
600 -•
400 --
200 --
•4-
70
-- 60
1131
- - 40
-- SO
-- 20
-- 10
161291000 181291000 201291000 221291000 241291000 261291000 281291000 301291000
• X6133 •POWER * 1131
Fig. 3 - Radionuclîdes activity in primary coolantDukovany NPP unit 1, period 1.12.91 - 31.12.91
] 1000080006000
X.133 400°2000
200015001000500
X.135
2 192000
71 92000
12 1 92 17 1 92 22 1 92 27 1 92000 000 000 000
1202000
6292000
11 292 16 2 62 21 292 26292000 000 000 000
2392000
7392000
12392 173920 00 0 00
———— X6133 ———— X»135
AKf\POWER oy
400[MWH 350
30025020015010050
II
. .. . - - . . . . . . - -icn
f
1
r - — . —— i*f40035030025020015010050nQ ———————— , ———————— , ———————— , ———————— , ———————— , ———— - —— r . . . . . - . • w
2 1 9 2 7 1 92 12 1 92 171 92 22 1 92 271 92 1 292 6 2 92 11 2 92 16 2 92 21 2 92 262 92 2 3 92 7392 12392 17392000 000 000 000 000 000 000 000 000 000 000 000 000 000 000 000
Fig. 4 - Radionuclides activity in primary coolantDukovany NPP unit 1, period 5.1.92 - 15.3.92
102

[kBq/l]
9 1 92 0 00 101 92000 11 192000 12 1 92000 13 1 92000 14 192000 15 1 92000
X8133 1131 • PREDICTION • POWER
Fig. 5 - Radionuclides activity prediction in primary coolantDukovany NPP unit 1, transient, period 8.1.92 - 10.1.92
3000 --
2500 -•
2000 -•
1500 --
1000 -•
500 --
28 1 92 0 00
[MW]
281 921200 29192000 291 921200 30 1 92 0 00 301 921200 31 1 92000
Xe133 1131 • PREDICTION • POWER
Fig. 6 - Radionuclides activity prediction in primary coolantDukovany NPP unit 1, transient, period 28.1.92 - 30.1 92
103

3. The results of the Fuel Expert System application at theDukovany NPPThe results for the first and second units for the
period Jan 5, 1992 - March 15, 1992 are in Figures 2-7.
M-"O
«sftH-»
N BP) naet M
OnnH-tri-1n>Hl»
S
grtH-§
o•O
l
So8
S ..ro810
Î8O
8
3.1 The damage identificationThe determination of leaking a fuel element is based on
two independent criteria:a) stationary state primary coolant radiation analysis -
obtained by the KGO (cladding tightness check) procedureresults (i.e. after more than three days of stabilizedunit performance characterized by zero output andpressure gradient)
b) identification of the spues of Xe-133, Xe-135, 1-131,1-132 at each transientThe KGO procedure is automatically activated at each
finished on-line radioactivity measurement of primary coolantor on request. The calculation is performed only under thestationary state conditions. If this is the case (thetransient is still in process) personnel receives a messageon screen. (The analysis results are written in a file thatserves as an input for possible optimization of the plannedtransient.)
A heuristic algorithm of spike identification isactivated automatically at each transient, i.e. with eachchange of power output. After the power change, the frequencyof on-line primary coolant activity measurement isautomatically changed. Whenever the excess of radioactivityis found, spike of either Xe-133 / Xe-135 or 1-131 / 1-132,personnel receives a pertinent information on the monitor.
A typical example of the heuristic module applicationcan be seen in Fig. 2. The coolant radiation during the wholefuel cycle of Dukovany NPP unit 2 has been very low,especially as to noble gases activity level. The KGOprocedure has not identified a damaged FE during the wholecycle. However, at a short-time unit shutdown, by HO-1(emergency protection), the heuristic module has identified anoble gases spike (Xe-133, Xe-135) and thus a defect present.After the transient, the noble gases activity levels havebeen stabilized at the previous level corresponding to theprimary circuit surface contamination only, the damaged FEhaving no significance. These conclusions have been laterconfirmed during the unit 2 shutdown. Based on the results ofof the spike evaluation it has been decided not to use thein-core sipping test to find the damaged assembly for thefollowing reasons:

- the noble gases spike has been identified only due tothe extreme gamma spectrometry monitor sensitivity atthe SVO-1 by-pass, and its maximum has not reachedthe activity levels typical for a damaged FE;
- the pressure pulse at the planned unit shutdown accom-panied by the pressurizer test has not cause the iodi-ne/cesium spike. Therefore the probability of findingthe damaged assembly by the in-core sipping test wasconsidered as nearing zero.
A typical example of the KGO module application can beseen in Fig. 3. Here, under the stationary state, the noblegases activity has risen gradually from the level near thedetection limit to values £ 102kBq/l and the automaticallyactivated KGO module has reported the presence of a damagedFE. During the next transient, the damaged assembly burnupwas estimated on the basis of primary coolant Cs-137 / Cs-134activity. The value of burnup was determined 12, 606 - 860MWd/tU. The obtained number of damaged FE and theirdistribution then served for the primary coolant radiationsituation development prediction.
3.2 Prediction of coolant's radioactivityPossibilities to influence the amount of radioactivity
released during operation transients can be seen in Fig. 4-7.The primary coolant radiation during first three months
of this year is pictured in Fig. 4. At this part of the fuelcycle, the regime of the unit shutdown and startup was mo-dified according to the prediction results with theaim to verify the predictive part of the Fuel Expert System.
3.3 The power regime optimizationThe influence of an optimization (during power changes)
on the radiation .situation is demonstrated in Fig. 5-6.The Fig. 5 shows the primary coolant and ventilation
system radioactivity changes after the standard procedure ofpower regulation, when the power was decreased and increasedwith the rate of 0. 5%/min. during 15 min. and then remainedunchanged for 10 minutes.
The Fig. 6 shows the same picture but after extremelyslow rate of power change, i.e. 0.25 % / min. during 15 min.and then unchanged for 20 minutes.
The results show:- relatively small radioactivity release from thedamaged FE to the coolant during power decrease. Inaccordance with the prediction, the influence of thechosen power rate change was negligible;
significant decrease of the radioactivity release as aresult of the proposed power rate change for thetransient. The actual decrease was estimated as anorder of magnitude, which was in compliance with thepredicted value.
4. SummaryThe Fuel Expert System which predicts the probability of
fuel damage and minimizes the radioactivity releases into theprimary coolant has been developed and verified in operationof the Dukovany unit.
The experience gained show that this expert systemprovides values which are reasonably close to the measureddata.
The most important results is the possibility to reducethe radioactivity of gaseous releases at least by 10% by re-gulating unit's power, and by at least 20% when employingprimary coolant treatment.
References
[1] F.Pazdera, L. Novak, O. Bârta: Fuel Rod Expert System,Report UJV-8734 M, 1989
[2] O. Bârta, J. Bena, V.Kapisovsky: Simple Checking Methodof the Fuel Rods at the Core of the Power Reactor du-ring the Irradiation, Report ÜJV-7382 M, 1985
[3] 0. Bârta, J.Bena, V.Kapisovsky, I.Smiesko: Evaluationof the Cladding Integrity on the basis of the RadiationSet-up in Primary Circuit of PWRs, Report ÛJV-7866 M,Oct. 1986
[4] O. Bârta, V.Kapisovsky, J.Bena, R.Berndt, U.Hageman:Gamma-spectrometry for the Evaluation of Fuel RodIntegrity and for the Minimization of Fission ProductsActivity during Transients, Co-ordination ResearchMeeting on Examination and Documentation Methodologyfor Water Reactor Fuel, '24-27 March, 1987, Rez,Cze chos lovakia

oO)
DATA ON LEAKING FUEL ASSEMBLIES INLWRs OPERATED IN THE FORMER USSR
K.P. DUBROVIN, N.L. FATIEVAI.V. Kurchatov Institute of Atomic Energy,MoscowV.P. SMIRNOVResearch Institute of Atomic Reactors,DimitrovgradRussian Federation
Abstract
The paper presents data on the quantity of leaking fuelassemblies discovered in all the operating NPP units in theUSSR with VVER-44Ö, VVER-1000, RBHK-1000 and RBHK-1500 reac-tors from the moment tif start-up and up to the scheduled refu-eling in 1991. The failure rate of fuel assemblies and fuelrods manufactured in different periods of time and operatedin different NPP units is considered. A brief discussion isalso given of post-irradiation examinations performed to in-vestigate the reasons for relatively poor reliability of fuelassemblies produced during period •of transition from the ext-rusion technology of VVER-440 pellet fabrication to a techno-logy of individual pressing. Some data on primary circuitcoolant activities at WER reactor NPP units is given.
The results presented in the paper indicate a satisfac-tory reliability achieved with modern VVER-440 and VVER-1000fuel.
1. Introduction
The researchers at Kurchatov Institute hot cell havebeen collecting and analyzing information on the performance
of fuel assemblies operated at all NPP units in the USSR withVVER-1000, VVER-440, RBMK-1500 and RBHK-1000 reactors. Thisinformation includes some data on the fabrication and opera-tion of charged, discharged and leaking assemblies (assemblyidentification number, assembly type, enrichment, core cellnumber in which the assembly was operated, fuel burnup etc.),data on radiological situation at the units and other para-metrs which affect the fuel performance.
The paper presents a brief review of results of post-irradiation examination aimed at elucidation of the reasonsfor poor performance of the fuel rods fabricated in 1972-76.The data on the relative number of leaking fuel assembliesproduced in different periods of time and operated in alltypes of reactors is discussed and some information aboutprimary circuit coolant activities at WER units is given.
The start-up dates for all NPP units with water cooledreactors, WER and RBMK, with electrical power from 440 to1500 HW are listed in Table 1. The performance data underconsideration date from the unit start-up and up to scheduledrefueling of 1991 for WER reactors and up to the end of 1991for RBMK reactors.
2. Reasons of poor performance of VVER-440 fuel rodsproduced in 1972-76
The data of Table 2 shows that reliability of VVER-440fuel assemblies manufactured in 1972-76 was poor. Failurerate of fuel assemblies produced in that period reached 6%.This was caused by a change in the pellet fabrication tech-nology.

Table 1Date of starting of the power units considered
ISer|No1 ——111 111 21 31 «11 51 611 71 81 91101111112113U«11151|161111171181119|20121|221t
NPP name————————— I
WER 1000
Novovoronezh
South Ukrainian
K a l i n i n
Zaporozhjp
Balakovo
„
Rovno
KhuelnttsMj
WER 440
Novovoronezh
Kola
Unit (Start |SerNo (date (No——— I ——— 1 —— 1
1 P31 P<
V |05 80 11 PS
I |12 82)26II |01 85|
III (09 89|1 1
I |05 84 p7II (12 86 |2B
| 1I |12 84 j
II |06 85 jIII |12 86p9
IV (12 87 pOV |08 89|31
1 (32I |12 85 |
II |10 87 p3III |12 88 p<
1 P5III |12 86J36
1 1I |12 87(37
1 P81 P91 HO
III |12 71 |IV (12 72(41
1 H2I |06 73)43
II |11 74)III |03 81 j
IV |10 84 11 I1 t
NPP na«
Rovno
\raernan *
RBMK 1500
ïgnaî ina
RBMK 1000
Leningrad
Kursk
Chernobyl *
Soolensk
i —————————
Unit |Start |No jdate |——— 1 ——— 1
I (12 80 1II |12 81|
1 1I |12 76 |
II |01 80 |1 11 1
1I |12 83|
II |OB 87 |1 11 11 1
I |12 73 1II |07 75 |
III |12 79|IV 102 61 |
1 1I |12 761
II |OI 79 |III |10 83|
IV |12 85)1 1
I |09 77 |II |12 78|
III (12 81 |IV |12 83|
1 1I |12 82 |
II (05 85 |III |01 90|
1 11 11 11 11 1
Table 2
Number of charged and leaking VVER-440 and VVER-1000fuel assemblies
WER 440 VVER 1000(Year
* Armenian NPP vas sloped in 1989 Data collection aboutChernobyl NPP was ceased in 1986
of as (Char (Leaking jPreraatu (Char (Leaking jPreaatusemblyjged \ —— \ ——produ {assent (Asse|
rely disfged | — — i —— ireïy discharged [assea jAsse
ction (blies (nbl | % (assenbl (blies |»bl
196919701971197219731974197519761977197819791980198119821983198419851986198719881989
j 1990
ITotal
(Total
177203331524273969536561650490869
1483756770
1204957892
10971262678823311
15816
——— 1 ——— 12 |1,13
1 —————— I
2 |0,99|2 (0,60 1 1
30 |5,73| 2410 13, 66 1 259 |5,33| 312 (2 2414 |2,50|6 |0,92|
10 |2,04|14 |1,61| I17 |1,14| 16 |0,79|9 |1,17
20 |1,66| 812 |1, 25| 20 |0,00|4 JO, 36| 28 (0,631 3
10 |1,48| 40 10,00 10 JO, 00|
1 ——— 1 ——— 1 ——————247 |1,56| 51
1 ——— 1 ——— ' ——————1
(fro» (12242 |116 |0,94| 21(1977 | 1
1 Fuel
1 0, 007*
———
151
208130313383504705
1053110271160458
(chargedX |asse«bl
7 |4,64||
7 (3,361 12 |1, 5«|
19 16, 0717 |1,83|
17 13, 37|23 |3,26| 135 13,321 527 |2,45|11 jl,55| 21 10,1710 (0,001
11 —— 1 ———————— 1
15922 (156 |2,63| 9
1
rod fa i lure rate
j 0,008%
o-J
Historically it so happened that up to 1972 fuel for WERreactors was produced in the USSR according to a unique proce-dure which differed from that applied all over the worldAccording to this procedure small amounts of oxides of metals(other than uranium) and plasticizer were added to uranium di-oxide powder and the resulting mixture was subjected to extru-
sion forming a long rod having central hole The rod was thencut into extruded pellets about 30 mm long Then pellets weresintered and cylindrical surface was polished so that pelletexternal and internal diameter were 7 7 mm and 1 5 mm, respectively The fuel prepared in this way had high density andoperated successfully in WER 440 reactors

oÖDThe high reliability of assemblies with extruded fuel
pellets is highlighted by the experience of operation of twounits of Loviisa NPP. Up until 1987 they used only extrudedfuel manufactured in USSR. To this day the Lo-1 unit has beenin operation for 14 complete fuel cycles, while Lo-2 unit -for 11 fuel cycles. The total number of leaking assembliesfor this period was 16, which corresponds to fuel rod failurerate of less then 0.004%.
In 1972 an technology was developed for producing pelletsabout 12 mm long by means of individual pressing (withoutother oxide additions). In 1973 in the course of the scheduledrefueling 69 and 100 experimental assemblies with pressedpellets and 75 and" 26 assemblies with extruded pellets wereloaded at Novovoronezh NPP (NVNPP), Units 2 and 3, respec-tively.
Twenty days into the fuel cycles at NVNPP-2 and 3 thecoolant activities increased by 10 times compared to those atthe end of the previous fuel cycles. During refueling in 197424 and 19 leaking assemblies with the pressed pellets weredischarged from NVNPP-2 and 3, respectively. All assemblieswith extruded pellets were found to be leak-tight. In 1975 and1976 13 and 11 leaking assemblies with pressed pellets weredischarged additionally from these units. Thus, after threeyears of operation about 40% of experimental assemblies withpressed pellets failed.
Two leaking assemblies discharged from NVNPP-2 and 3 in1974 were investigated at NVNPP and at the Kurchatov Insti-tute. In this assemblies were found 19 and 1 leaking fuel rodsrespectively. Leaks were primarily detected in the regions of
welded joints (13 fuel rods), although through holes andtransverse cracks were also found. In all cases claddings wereheavily hydrided in the areas of leaks.
Metallografic studies of welded joints of the 136 leak-tight fuel rods of these assemblies revealed 20 rods withregions of local internal hydriding of claddings and plugs ofvarious intensity. Fig.1 shows the area of heavy hydriding ofthe cladding and the plug of leak-tight fuel rod.
The fuel rods of assemblies analyzed differed in theweights of the fuel stacks and fluorine contents in fuelbatches. It was found that all failed fuel rods and leak-tightfuel rods where local hydriding of the claddings was observeddiffered from the remaining of the fuel rods in low weights ofthe fuel stacks (1050-1063 g) and relatively high fluorinecontents (up to 0.02 wt %). The mass of the fuel stack andthe maximum fluorine contents as stipulated by the specifi-cations in force at that time was 1050-1100 g and 0.02 wt %,respectively.
The density of all pressed pellets extracted from fourunirradiated fuel rods contained in the first experimentalbatches was determined by the method of hydrostatic weighing.Table 3 illustrates the measurement results. It is seen thatfuel stack weight correlates well with the average density ofthe pellets loaded in the rod. The average pellet density in"light" fuel rods (1054-1062 g) was about 10.3 g/cub.cm, whilethat in the relatively "heavy" ones (1093 g) was 10.5 g/cub. cm.From 33 to 46 % of pellets in light fuel rods had density lowerthan 10.2 g/cub.cm. Two rods were loaded with pellets of two orthree batches having high and low density. The density of some

Table 3Density distribution of pressed pellets extracted
from the fuel rods of different weights
1Density |range, |—g/cub.OB |
10.71 - 10.8010.61 - 10.70ilu.51 - 10.60110.41 - 10.50jlfl.31 - 10.40110.21 - 10.30110.11 - 10.20110.01 - 10.10
9.91 - 10. ÛO9.81 - 9.909.71 - 9.809.61 - 9.709.51 - 9.60
TotalAverige densi-ty, g/cub.ca
t _________
?eUet minber iof given weigh!
1093 |
14
501092?351
ZOO
10.50
Î062 i
nK57511242
200
10.30
n fuel stack, S
1056 1i
75126
4S
339
U1610
172
10.32
1054
3944191758
IB135rt
177
10.32*
OCO
Fig. l The area of heavy hydriding of cladding (right) and plug (left)in leak-tight fuel rod of the assembly discharged from Unit Hof Novovoronezh NPP
pellets in one of this rods was only 9.6 g/cub.cm, whi le
according to specifications it should not have been less than
10.2 g/cub.cm. Experiments on moisture absorption by pellets of
various densities showed that the amount of moisture sorbed
from even relatively dry air depends essentially on fuel pel-
let density and increases sharply with the decrease of densitybelow 10.2 g/cub.on.
From the whole body of results considered it was concluded
that intense failure of the first experimental batches of
assemblies with pressed pellets was caused by local internal
hydriding of the claddings under the action of moisture sorbed
by low-density (lower than 10.2 g/cub.cm) pellets from the
air in manufacturing of the fuel rods.

This conclusion resulted in a revision of the specifica-tions for pressed pellet and the manufacturing procedure. Therevision concerned, in particular, the requirements to density,weight of fuel stacks, moisture and fluorine contents in thefuel, methods of density control, pellet charging, defluorina-tion of uranium dioxide power and also requirements to manyother parameters and manufacturing processes affecting fuelrod performance.
3. Quantitative data on leaking VVER-440 andVVER-1000 fuel assemblies
The data on the quantity of leaking VVER-440 and VVER-1000 fuel assemblies is listed in Table 2. The reasons forthe increased VVER-440 fuel rod failure rate were discussedin the previous chapter.
Table 2 shows that VVER-440 fuel assemblies produced in1977 and later provided a satisfactory level of reliability.On the average, number of leaking assemblies was less than 1%and the number of assemblies that had to be discharged prema-turely - less than 0.2%.
Table 4 presents data on leaking fuel assemblies disco-vered at different VVER-440 units. The reliability is shownto be the lowest for Unit II Kola NPP as well as Units IIIand IV Novovoronezh NPP (the assembly failure rate of up to2%). At other units the reliability of fuel assemblies wasquite satisfactory. In 8 years of Unit IV Kola NPP operationonly two fuel assemblies leaked (a rod failure rate of lessthan 0.002%).
Table 4Number of leaking assemblies operated at different
VVER-440 units
Year ofassem-blyiproduc-tion1977
1978
1979
1980
1981
1982
1983
1984
1985
1986
1987
1988
1989
1990
Total
*
NPP naine and unit nunberNovovoro-nezh3
1
2
31
4
2
12
16
4
5
2
4
11 ———
1
3——
8
24
1,19)1,67
Kola
1
1
1
3
2
7
2
2
3
2
1
12
4
1e2
33
3
3
3
0,47|2,13|,25
4
——
2
Rovno
1
53
11
2 | 101 —— 1 —— 1,20|,75
2
1——
1
2,15
Armenian
12
2
3
J
8
1,03
2
2
3
5——— 1
1
n1,01
To-tal61014
17
6
9
20
12
4
8
10
116
Out of the 116 leaking assemblies 18 were SUZ assemblies(the assemblies of control and protection system). Consideringthat VVER-440 reactor cores contain 37 or 73 SUZ assemblies itis possible to conclude that SUZ assemblies have approximatelythe same reliability as working assemblies.
The employees of Loviisa NPP in Finland found that 6assemblies out of 10 assemblies developed leaks in core cells

located next to the cells of automatic control system. Withour fuel 19 assemblies out of 116 leaking assemblies wereoperated in such cells. There are 42 such core cells, there-for going on assumption of equal probability of leaks fromall assemblies only about 14 (not 19) out of 116 leakingassemblies should have been located next to the cells ofautomatic control system. Thus in our case we also see atendency of accelerated failure of fuel assemblies operatednext to the cells of automatic control system.
The data in Table 2 on leaking VVER-1000 fuel assembliesindicate a satisfactory reliability of VVER-1000 fuel. Theaverage fuel rod-failure rate is 0.008%. The worst assemblyreliability was observed at Unit V of Novovoronezh NPP, UnitsI and II of Kalinin NPP and Unit I Zaporozhje NPP (Table 5).The fuel rod failure rate reached up to 0.02 %. With the restof units it was substantially lower than 0.01%. In the 6 yearsof Unit I Balakovo NPP operation only two assemblies developedleaks (the fuel rod failure rate less than 0.002%).
4. Data on number of leaking R8MK-1000 andRBMK-1500 fuel assemblies
Table 6 lists data on the number of RBMK-1000 and RBMK-1500 assemblies charged and the number of leaking assembliesmanufactured in different periods of time. It is apparent thatthe failure rate of RBMK fuel rods is about an order of magni-tude higher than for WER fuel rods. More than 3000 leakingfuel assembly were discharged from all RBMK-1000 reactorsbefore reaching the project fuel burnup.
Table 5Number of leaking assemblies operated at different
VVER-1000 unitsI I1ISeriNo1 —— 11
—————————— l ——— l ——— l ————— iI IDate (Charged|Unit |of lassefl-
NPP name |No |startfcliest •
1 1 [Novovoronezh1| Z (South-Ukrainian! 31 411 5 ( K a l i n i n1 61I 7 [Zaporozhye1 81 9HO111||12 (Balakovo113|H!
——— t i i1 1
V |05.80| 6391 1
I 112.821 575II J01.85J 368
III I09.89J 224I 1
I 105.841 507II |12. 86 j 363
1 1I |12.84| 411
II |06.85| 381III 112.86) 333
IV |12.87| 320V |08.89| 217
1 1I 112.851 380
II (10.87 1 297IIII |12.88| 230
1 1|15 IRovno I I I I |12.86| 381I I I I I|16 iKhuelni tski j 1 |12.87| 296| —— i ————————————— .... ., ——————1 Total 1 5922i i
——— —————————— !
Leaking
assenbl.
27
1892
2023
156930
Z71
12
2
156—————
1.
4,22
3,132,440,89
3,946,34
3,651,572,700,930,00
0,522,360,43
3,15
0,67
2,63
The data in Table 7 shows that the failure rate dependsstrongly on the operating conditions. The worst performancewas shown by Chernobyl NPP assemblies. The number of leakingfuel assemblies at Unit I of Chernobyl NPP was in excess of10%. The assembly failure rate at Leningrad NPP was also highand was on average for the four units about 5%. The fuelassemblies of Unit I of Kursk NPP had a similar failure rate.The rest of the units of this NPP and at all units of SmolenskNPP the relative quantity of leaking assemblies was 2-5 timesless.

roTable 6
Number of charged and leaking RBHK-1000 and RBHK-1500fuel assemblies
Year ofassemblyproduc-tion
1973
1974
1975
1976
1977
1978
1979
1980
1981
1982
1983
1984
1985
1986
1987
1988
1989
1990
1991
Bcero
RBHX-1000
Chargedassen-bl les
1628
1678
3024
2617
2857
3706
4713
5419
5327
6324
4227
4355
4531
3462
5500
5471
4426
2949
1362—————
73576
Leaking
As$e.bl.
116
34
227
116
249
410
338
354
240
237
148
120
140
110
1 i*
————7,13
2,03
7,51
4,43
8,72
11,06
7,17
6,53
4,50
3,75
3,50
2,76
3,09
3,18
95 i 1,73
88 1,61
34 0, 77
3 0,10
0
3059
0,00—————
4,16
RBMK-1500
Chargedassea-51 les————
1636
1293
232
1999
366
973
1312
1204
306
9321
Leaking
Asseibl.
195
60
2
21
5
4
1
1
0
289
X
11,92
4,64
0,86
1,05
1,37
0,41
0,08
0,08
0,00
3,10
Fue) rod failure rate
0,11* O.Û9X
The assembly failure rate at Unit I of Ignalina NPP
operating a RBHK-1500 reactor was 4.84% as of the end of 1991.
A vary large number of assemblies failed during the start-up
period as the Unit was taken up to its nominal electrical
power of 1500 MW and operated at this power. After about 3
Table 7Number of charged and leaking assemblies operated at different
RBMK-1000 and RBMK-1500 unitsRBMK-1OOO units
Number ofassembl .Charge d
Leaking
•i
Date ofunitstarting
NPLeningrad
1BOB4
415
3,13
12."73
2Bill
333
4,10
07.73
36139
316
5,1512.79
43744
273
4,7302.81
Kursk1
7839
3B3
4,8912.76
26666
193
2,9001.79
34433
48
1,0810.S3
43709
34
1,4612.S3
Chernobyl*1
4343
468
10,809.77
23912
338
8,6412.7B
3
2338
106
4,4912.Bl
4
1387
11
0,69
12.83
Smolensk1
4768
71
1,4912.82
23990
46
1,13
03.83
31866
4
O,21
01.9O
RBMK-130O unit»
UnitIgnal ina-1:Bn«lin«-2
Ch»rged«•»••bile»
54333B86
Leakingassemblies26326
X4,B4
0,67
Date of unitstarting
12.83OB . 87
*Data on Chernobyl NPP are given as of the end of 1985 andon the other units - as of the end of 1991.
years of operation at nominal level the power of Unit I wasreduced and now each unit of Ignalina NPP is operated atpower not more than 1300 HW.
On the other hand 4 years of operating experience withUnit II of Ignalina NPP indicate that the performance of RBMKfuel rods may be practically the same as the performance ofWER fuel. The fuel rod failure rate at this unit is less than0.02%.
5. WER reactor coolant activity
The coolant activity is to be below the allowablelevel and for most of the units was in the range of 0.01-1.0 raCi/1.

The reasons for separate cases of a more adverse radiolo-gical situation at reactor units due to leaks from a relativelylarge number of fuel assemblies are probably treated in otherpresentations. Presently we should note only that the coolantactivity increase at Unit IV of Novovoronezh NPP during 13thfuel cycle (1985-86) by two order of magnitude wasdue to an experiment with "two-storey" assemblies when 33 fuelassemblies developed leaks.
6. Conclusions
The data presjsnted above indicate a satisfactory reliabi-lity of the modern VVER fuel and that the RBMK fuel rod fai-lure rate should be reduced, particularly through optimizationof the operating conditions.
FAILED FUEL MONITORING AT NUCLEARPOWER PLANTS WITH RBMK REACTORS:OPERATING PARAMETERS, REQUIREMENTSAND DECISION MAKING CRITERIA
I.V. ZHUKOVResearch and Design Institute of Power Engineering,Moscow, Russian Federation
AbstractThe procedure for estimating the number of failed fuel rods in the core and the prediction
of their discharge efficiency during operation is presented The procedure is based on the
FFM data base and the 1-131 and Xe-133 coolant activity
The observance of the principles and codes of radiationsafety is one of the mam requirements imposed on all NPPsdesign and operation. Introduction of the safe NPP operationcriteria results from this requirement. Among these criteriaare the operational limit of the fuel element failures undernormal operating conditions, dose limits for exposure of NPPpersonnel and population, maximum permissible release ofradionuclides into the atmosphere, annual permissible disposalof radionuclides with liquid wastes,etc.
The operational limit of the fuel elements damage equalsto 0,2% for gas-permeable elements and 0,02% for those withthe fuel-coolant interaction of the total fuel elements loadedinto the reactor, is specified for NPP with RBMK reactor.
The value of the above limit is determined by theefficiency of the system for the NPP process mediumdecontamination from radionuclides of fission products (FP)that released from the unsealed fuel elements to the coolant.
As a matter of fact, regulation of the number of unsealedfuel elements m the reactor results in regulated levels ofsome FP activity in the primary coolant using the differentmodels of FP release from the unsealed fuel elements and theirbuild-up in the primary circuit.

The reference operational level of 1-131 activity mwater of the primary circuit is prescribed proceeding from thefact that the operational limit of the unsealed fuel elementsshould not be exceeded, i.e. it should be no more than 2*10-6Ci/kg at the steady-state reactor power. In this caseradioactive noble gas (RNG) and iodine nuclide releases intothe atmosphere should be no more than 500 Ci/fday x 1000 MW(e))and 0,01 Ci/(day x 1000 M e)), respectively
The strategy of indentification and discharge of the fuelassemblies (FA) with the unsealed fuel elements takes intoaccount the design features of the PBMK reactor as unscheduleddischarge of the uns«altd fuel elettfciits at NPP rfith thechannel-type reactors can be implemented at opeiating reactorwithout reduction m its power.
In this connection under NPP operation there arises theproblem of identification and confining the FAs with theunsealed fuel elements in the RBMK reactor . The problemconcerning discharge of the identified FAs is solved dependingon radiation state of the reactor core that is determined as atotality of FAs with unfailed and unsealed fuel elements withthe different degree of seal failure. In this case the corestate can vary from highly good state when there are nounsealed fuel elements in the reactor, to unsatisfactory onefrom the viewpoint of radiation safety.
Monitoring of radiation state of the reactor core iscarried out as follows-
- continuous monitoring of gas-aerosol release rate intothe atmosphere;
- - continuous monitoring of RNG activity indrum-separator steam;
- periodic measurements of reference FP activities in theprimary coolant.
Qualitative classification of the unsealed and failedfuel elements according to the degree of cladding seal failureincludes four classes.
- fuel elements with direct fuel-coolant interaction;- fuel elements with developed gas-permeability;
- fuel elements with the initial phase ofgas-permeabi1ity;
- fuel elements with microflaws like a pin-hole.The probability of reliable identification of FAs with
the unsealed and failed fuel elements primarily depends on twoparameters, i.e. the sensitivity of the channel-by-channeslfailed fuel monitoring (FFM) system and degree of fuel elementcladding seal failure. As the sensitivity of any failed fuelmonitoring system has an own threshold beyond which the systemdoes not able to detect the unsealed fuel elements, there arealways several non-identified FAs with the unsealed fuelelements in the reactor. The sensitivity threshold of thefailed fuel monitoring system corresponds to minimum rate ofthe fission product release from the unsealed fuel elements tothe coolant that can be reliably fixed in the real conditionsand generally specified by the design and physical principlesof the system operation.
Diagnostics of FAs with the unsealed fuel elements iscarried out using the channel-by-channel failed fuelmonitoring system that provides periodic without-samplingmeasurement of collimated jf- radiation from the steam-waterpipelines in the section that is upstream of cutting-in intothe drum-separator.
In this case a valid signal of the failed fuel monitoringsystem, i.e.V~ radiation intensity, caused by the fissionproducts released from the unsealed fuel elements, should bedetected in highly large background caused by short-livedactivated isotope 16N with half-life period of about 7sand energy of Y-quanta of 6.13 MeV.
The mathematic model of FFM system signals generationwhich are actuated from the fuel channel steam-water linecontaining FAs with leak-tight fuel elements, was used tominimize the FFM system signal fluctuations. With such a modelthe FA with unsealed fuel elements is detected by thestatistically significant deviation of the measured signal ofthe FFM system from the calculated one according to the model.

As a result of the statistic analysis of the FFM systemsignals being actuated from the steam-water line of the sametechnological row, by applying the statistic criterion derivedon the basis of the concept of the most normalized selectivedeviation,
the FA was
0; — 2. O2.6"<: Si
(11
according to the pj 3iijl~ 3tat*_-
- FA with unfailed fuel elements- FA with fuel elements which aresuspected to be unsealed;
- FA with unsealed fuel elements;~ FA with fuel elements having thecladdings with large flaws.
The FE, FA and core failure concepts are the necessarycomponents to ensure the safe and cost-effective operation ofthe nuclear power plant The failure definitions are asfollows:
- FE failure - indelibility of fuel element operationdue to the risk of primary circuit contamination «nth fuel, asa result of direct interaction of the coolant with fuel;
- FA failure - impossibility of FA operation with failedfuel element;
- reactor core failure - impossibility of the reactorcore operation due~to:
a) the excess in allowed rate of gas and aerosol releasesand/or m values of the allowed activity of fission productsin the coolant at sfeadv- state power reactor operation, whenthe clean-up systems and facilities are operated under thedesign-basis condition-;
b) the presence of failed FAs in the core and theimpossibility of their timely unloading from the operatingreactor due to the technical reasons.
The main failure cause of the fuel element and fuelassembly, as well, is loss of tightness in its cladding, i.e.the formation of flaw. In the reactor engineering practice by"flaw" one usually understands the FE cladding break, when thefuel interacts directly with the coolant
Based on the above definition of failure the fuelelements with microfla*5 and gas permeable ones cannot beconsidered to be failed.
Note, that the leak-tight fuel elements are not failed inthe failed fuel assembly and can be reused. The mechanisms ofradioactive fission products releases from the failed fuelelements and of their accumulation in the coolant wereinvestigated with actual physical and process parameters offuel elements, core and primary circuit to predict the effectof operation and unscheduled unloading of FA with failed fuelelements on the radiation state of the RBMK NPP.
For this purpose, the sampling devices allowing tocontrol the fission products release into the coolant from thefailed and unsealed fuel elements specially loaded into thereactor, were installed at the Chernobyl NPP Unit 2.
The analysis of the results of the experimentalinvestigations has shown that:
- the process of ingress of the RNG and iodine nuclidesinto the coolant from the failed fuel elements was describedby the diffusion model irrespective of the absolute values ofthe release rates The parameters of the model include the FApower and the effective size of the flaw in the fuel elementcladding,
- for the gas permeable fuel elements and those with thedirect interaction between the fuel and coolant at averagelinear power over the range of 140-220 W/cm, the release rateparameter (R/B)jy for RNG nuclides does not depend on fuelelement power within the experiment error range and equals to2.8*10~°s~ and 2.0*10 s , respectively;
- the parameter of the iodine release rate (R/B)Jl is onthe average, by an order of magnitude lesser than for theradioactive noble gases and is proportional to the linearpower of the fuel element.

The comparative analysis between the FFM system data andï-.he results of the simulation of fission products release intothe coolant from the failed fuel elements shows that:
- the physical and design features of the system forchannel-by-channel monitoring of the failed fuel at the NPPwith the RBMK reactor permit to detect only those failed fuelelements from which the fission products with half-life periodof 10 s or less can release;
- the contibution of short-lived fission products intothe total rate of FP release into the coolant is predominantwhen the effective equivalent flaw area in the FE cladding "is0. 01 cm or more;
- the threshold of sensitivity of the channel-by-channelfailed fuel monitoring system at average linear power of160-240 W/cm is equal to 1.0 cm of the effective bare surfaceof the fuel.
The classification of quality assessments of fuelelements cladding loss-of-tightness degree has received thesupplementary quantitative characteristics:
- the FA, which FFM signal o ^ 4. OS", involves the sealfailure of the direct fuel-coolant interaction type,corresponding to the equivalent effective flaw area in thefuel element cladding of -10 cm. ; the contribution of a fuelelement having such a flaw to 1-131 activity in the coolantand to Xe-133 discharge through the stack (at delay time of 15hours) amounts to ~ 10 Ci/kg and - 20 Ci /day, respectively;
- the FA, which FFM signal 3.0&<S< 4. 0<Tinvolves theseal failure of- the developed gas-permeable type,corresponding to the equivalent effective flaw area in thefuel element cladding of - 1.0 cm . The contribution of a fuelelement having such a flaw to 1-137 activity .in the coolantand to Xe-133 discharge through the stack amounts to~ 10 Ci/kg and ~ & Ci/day, respectively;
- thç FA, which FFM signal can not be recorded due tohigh noise, may have:
a) the loss-of-tighness of the initial stage ofgas-permeable type, correspoding to the -ff-iotive equivalent
flaw area in the fuel element cladding of ~ 0,1 c» ; thecontribution of a fuel element having such a flaw to 1-131activity in the coolant and to Xe-133 discharge through thestack amounts to - Z.5 - 1C Ci/kg and - 2 Ci/day,or;
b) the pin-hole type loss-of-tighness, corresponding tothe effective equivalent flaw area in the fuel cladding of0,01. cm ; the contribution of a fuel element having such aflaw to 1-131 activity in the coolant is practically absent,and to Xe-133 discharge through the stack amounts to0.5-1.0 Ci/day.
The experimental data obtained under conditions ofapriori uncertainty of the failed fuel elements number in theFA and a flaw location along the core height have shown that:
- unloading the FAs with fuel elements having a directfuel-coolant interaction has resulted in decrease in 1-131activity in the coolant and Xe-133 discharge into theatmosphere by (0.4-4.0)10* Ci/kg and 20-25 Ci/day,respectively;
- unloading the FAs with developed unsealed gaspermeability of fuel elements claddings has resulted indecrease in 1-131 activity in the coolant and Xe-133 dischargeinto the atmosphere bv (0. 7-5. 0)*10 7 Ci/kg and 4-6 Ci/day,respectively;
- unloading the FAs with the initial stage offuel elements cladding gas permeability has resulted indecrease in 1-131 activity in the coolant and Xe-133 dischargeinto the atmosphere by (1.0-3.2)10~ff Ci/kg and 1 Ci/day,respectively.
A good agreement of experimental data and modelcalculations has given an objective possibility to develop analgorithm for the RBMK core radiation state control and itsimplementation in the form of the regulations.
The reactor core radiation state control is a procedurebased on:
- reactor core radiation state mon itor ing;- diagnostics of the FAs with failed fuel elements;

CD
T3SD(QCD
CDCT!D
- prediction and arranging the contribution values of theFAs with failed fuel elements to the reactor radiation state;
- discharging the FAs with maximum unsealed and failedfuel elements, i.e. those fuel elements which are oroducmgthe release of FPs and/or fuel into the coolant.
The FAs are subjected to the unscheduled discharge fromthe reactor according to following succession:
- failed fuel elements with direct fuel-coolantinteraction;
- failed fuel elements with developed gas-permeability;- failed fuel el^mehts with the initial stage of gas
oermeability.The duration of unloading for the FAs having a direct
fuel-coolant interaction does not exceed 5 days regardless thereactor core radiation state to prevent the pnnuary circuitcontamination with fuel. The necessity of unscheduleddischarge of FAs with gas-permeable fuel elements isdetermined in each specific case.
The leak-tightness of fuel elements claddings for eachdisharged FA is checked by the "sipping" method in the coolingpool case. The FAs ar» identified as the failed ones if in thecase water after three davs sipping the specific activities ofthe following nuclides are exceeded:
1-131 - Id"5 Ci/kgCs-137 - 10"* Ci/kgNp-239 - lO'^Ci/kgA repeated loading of failed FAs into the reactor is
prohibited.The performed investigations of iaws for the FPs release
out of the failed fuel elements claddings into the coolant,the study of efficiency of unloading for the FAs with failedfuel elements from the reactor core, the estimation of thequantitative interaction between tiie signals of the channel-by-channel FFM system and the rate of FPs release into thecoolant, have permitted to develop a method for quantitativeassessment of failed fuel elements number in the core duringreactor power operation.
The assessment algorithm consists in:- assessment of the number of fuel elements with direct
fuel-coolant interaction and fuel elements with developed gaspermeability by data of the channel-by-channel FFM system;
- assessment of the number of fuel elements with initialstage of gas permeability by the 1-131 value;
- assessment of the number of fuel elements withmicrodefects by the Xe-133 activity value in the•Irum-separator steam.

CAUSES AND MECHANISMS FORFUEL FAILURE AND DAMAGE
(Session III)
Chairmen
V.D. ONUFRIEVRussian FederationA.A. STRASSER
Unites States of America

IV)
OVERVIEW OF DEFECT MECHANISMSIN CANDU FUELT.J. CARTERChalk River Laboratories,AECL Research,Chalk River, OntarioA.M. MANZERAECL CANDU,Mississauga, OntarioCanada
AbstractThe CANDU -PHW reactor uses horizontal pressure tubes to contain the fueland primary coolant An 800 MW reactor contains more than 6 000 fuelbundles, and the low defect rate emphasizes the excellent fabrication qualitycontrol achieved with the 460 000 end-closure welds and end-plugs that arewithin the reactor at any one time. Although quality control is excellent, defectsthat do occur fall mainly into the two categories of incomplete end-closure weldsand the less-frequent end-plug barstock porosity. Incomplete end-closure weldsmay give early or later defect indications, depending upon the defect hole size,whereas the porous end-plugs are generally very small defects, which have adistinct incubation period before secondary damage allows fission-productrelease to the coolant. A third category of defect, which could be consideredfabrication-dependent, is primary hydriding failure. This mechanism had neverbeen indicated in CANDU fuel until a defective fuel incident occurred during1991/1992 at one of the 600 MW Generating Stations. There, post-irradiationexamination eliminated most other possible defect causes, and the fabricatordetermined that an undetected shift in raw material characteristics allowed fuelto be produced with up to 4 mg hydrogen per element, rather than the specified<1 mg hydrogen per element. Two further mechanisms of fuel damage arecaused, by reactor operating conditions rather than fabrication quality.Pellet/cladding interaction defects generally require a power ramp after a periodof lower power operation. This provides sufficient stress from the expandingfuel pellet and freshly released fission-product corrodents to crack the cladding.Fretting damage generally occurs from debris or foreign objects in the primarycoolant, which are caught up in the fuel. Fretting damage may also be causedby vibration, which may result from hydraulic instability of a fuel bundle orcolumn of bundles.
1. INTRODUCTIONThe CANDU* reactor uses pressurized heavy water (PHW) as both the primarycoolant in the pressure tubes, which contain the fuel, and as the moderator inthe calandria tank, which surrounds the pressure tubes. The pressure tube,
* CANDU: CANada Deuterium Uranium is a registered trademark.
surrounding calandria tube, and end-fittings comprise the fuel channel. Thereactor is fuelled with 500-mrn-long fuel bundles with elements clad in Zircaloy-4 and containing natural U02 pellets. The use of natural uranium with verylittle excess reactivity necessitates the use of on-power refuelling with remotelycontrolled fuelling machines, which add fresh bundles and remove spent bundlesfrom the channels. Two types of fuel bundles are currently used in CanadianCANDU-PHW reactors: 28-element bundles (used in the Pickering reactors) and37-element bundles (used in the Bruce, Darlington and 600 MW reactors). Theelement diameter is 15.2 mm for the 28-element bundle, and 13.1 mm for the37-element bundle. The Zircaloy-4 fuel cladding is thin (about 0.4 mm) and isdesigned to operate in intimate contact with the pellets at a coolant pressure ofabout 10 MPa. The inside surface of the cladding is coated with a thin layer ofCANLUB graphite to improve power ramping performance. The 37-elementbundle is shown, in Figure 1.
The on-power fuelling system of a CANDU reactor uses two fuelling machines,one at each end of the channel. During refuelling, the machines operate inpairs, locking onto opposite ends of the same channel. One machine inserts newfuel bundles into the channel, while the other accepts the same number ofdischarged bundles. Each of the fuel channels contains 12 fuel bundles in-core.
7 ELEMENT fuEL 1UNDLE
FIGURE 1. The CANDU 37-Element Fuel Bundle

turo
FIGUKE 2. A Metallographie Cross-section through an Incomplete Weld
The number of bundles replaced in a channel during refuelling depends on thefuel-management scheme used by the utility; commonly, 2, 4, 8, and 10 bundleshifts are in use.
Fuel performance in Canadian CANDU reactors has been excellent; 99.9% of theclose to 600 000 fuel bundles irradiated to date have operated as designed. Thefuel defects that have occurred in Canadian CANDU reactors fall into four maincategories, listed below in probable order of importance:
- fabrication defects,- pelle</cladding interaction (PCI) defects,- fretting and vibration defects, and- primary hydriding defects.
These four categories of defects are discussed in detail in the following sections,with comments on deterioration rate where possible.
2. FABRICATION DEFECTS
While Canadian fuel fabricators have achieved an excellent level of quality infuel production, faults occasionally elude normal surveillance procedures andcause a defective fuel element. Element end-closure resistance welding providesan example of the high quality standards achieved with a simple mass-
FIGURE 3. A Macroscopic View of a Polished Section of aa End-Plug With aPorosity Defect (Arrowed)
production product. Each 850 MW reactor core contains 6 240 bundles, eachwith 74 end-closure welds. Thus, there are 461760 welds in the reactor core atany one time. The very low frequency of leaking welds testifies to theconsistency of the technology. When incomplete welds do occur, they typicallyshow the metallographic appearance depicted in Figure 2. The residence timein-reactor before leakage and release of fission products can vary enormously,depending upon the size of the leak path and the operating power. In one ChalkRiver irradiation of a commercially produced Bruce-type bundle, the firstemission of fission products from an incomplete weld occurred after more than16 GW.d/Te U of burnup. Deterioration after leakage is critically dependentupon operating power.
A further type of fabrication defect that has occasionally been seen (hut rarely,compared to incomplete end-closure welding) is porosity in the harstock used tomachine end-plugs. This is a coring type of metallurgical defect, resulting fromthe original ingot used to produce the barstock. In a few cases, the porosity haseluded the ultrasonic detection method used by the fabricator. Because thesedefects are small, often only a few micro-metres in diameter, there is asignificant operational period before fission products in the coolant signal thepresence of a defect. Typical end-plug porosity is shown in Figures 3 and 4.

OUTER ELEMENT LINEAR POWER IkW/») BUNDLE POWER IkW)
60 ~
- - ttSZ
—— »97»
I I I I I I I I I I
»2«
MO
MO
too
760
720
0 Z O W W W W 1 W 1 W 1 4 0 1 K I 2 M 2 2 0BUNDLE BURMUP «Vrti/kgUJ
FIGURE 5. Threshold for Final Ramped Power for SCC Defectsin the CANDU 6 Reactor
LINEAR POWER INCREASE (kW/m) BUNDLE POWER «CREASE IkW)
ro
FIGURE 4. As for Figure 3, Porosity Defect at Higher Magnification
Primary hydriding defects, which can also be regarded as fabrication-relateddefects, are very rare in the CANDU system; a recent occurrence is discussedin Section 6.
3. PELLET/CLADDING INTERACTION (PCI) DEFECTS
Since the early 1970s, it has been recognized that the mechanical interaction ofthe Zircaloy cladding with the expanding fuel pellet could give rise to cracking.PCI defects are generally characterised by a power history showing a powerincrease after significant burnup at lower power. Corrosive fission products,such as iodine or cesium, have been indicated as the probable corrodents causingS_tress-C_orrosion gracking (SCC) of the Zircaloy, activated by the high claddingstress from PCI. CANDU reactor and Chalk River power-ramp defect statisticswere used by Penn, Lo and Wood [1] to pioneer the power-ramp defect thresholddiagram for CANDU fuel. This has since been modified, using the massivestatistics for fuel power-ramp performance available from operating CANDUreactors, for use with CANLUB-coated fuel in current reactor types. Figures 5and 6 show the recommended threshold diagrams for the CANDU 6 reactor [2].The curves labelled 1979 are initial curves recommended for use in CANDU 6reactors, where bundle powers peak at about 900 kW. In 1982, the curves were
20 *0 KX> 120 140 140
BUNDLE BURMUP tHWVkgu)
200 220
FIGURE 6. Threshold for SCO-Defects for Power Increase During Rampingin the CANDU 6 Reactor
adjusted upwards to reflect good fuel performance during 4 bundle shifts at theBruce "A" Generating Station. To use these diagrams, the final power of thefuel, after a power increase at a given burnup, is compared with Figure 5. If thepoint falls above the threshold line, it lies in a region of finite defect probability.Figure 6 must be used to compare the power increase in the ramp with the

N) threshold for power increase. Only if both thresholds are violated is the fuelindicated to fail. In the investigation of fuel defects, a fuel power historyshowing a power increase that violated the thresholds of the power-ramp defectdiagrams would strongly suggest PCI/SCC defects.
In CANDU fuel, the SCC cracks occur predominantly at pellet interfacepositions, and in rarer cases, due to high fuel expansion, they occur alongsidethe brazed bearing pads. Pellet interfaces are generally the highest stresspositions in the cladding. SCC cracks can often be located in hot-cellexamination by cutting the element, adding a gas-pressure fitting, andpressurizing with gas while holding the element under water. Bubbles cangenerally be seen at crack locations. Metallographie examination of SCC defectsin Zircaloy often reveals very characteristic branching (see Figure 7).
Fission-product release to the coolant from PCI defects is usually very rapid.In NRU loop power-ramp tests, the gamma defect signal from the coolant wasoften seen within minutes or seconds of achieving full power. However, hi onepower ramp in the NRU reactor, the coolant gamma signal was not seen until9 days after the ramp. In general, in CANDU reactors, PCI defects due topower ramping have deteriorated more rapidly with continued operation in thedefective condition than have fabrication defects.
FIGURE 7. A Metallographie Cross-Section through aTypical Branching SCC Crack
FIGURE 8. A Typical Crack through the Weld Heat-Affected-Zoneof a Defective Fuel Bundle
As well as cladding cracks at the pellet interface locations resulting from powerramps, a further type of PCI cracking has been experienced in Canadianreactors. The mechanism was first noted in the Brace Generating station, Unit3, around 1984 [3]. This cracking occurs at the closure weld heat-affected zoneand is thought to result from high stress caused by pellet expansion with eitherhydrogen or iodine as the crack initiator. Hydride/deutende flakes have beenseen at the crack tips in some of these cases, giving rise to the theory thatcracking originates and/or is propagated by Delayed Hydrogen Cracking (DHC).This is limited to high-powered bundles, where one might equally have expectedSCC from fission products. Thus it is difficult to separate DHC and SCC for theweld-region cracks. A typical weld-region crack is shown in Figure 8.
4. FRETTING AND VIBRATION DEFECTS
4.1. Fretting from Debris in the Coolant
Fretting from debris in the coolant is perhaps the most common cause of fueldefects in LWRs [4 to 6], and CANDU reactors can also be affected. Often theforeign objects or debris result from construction or maintenance work on the

reactor. In this situation, the debris become caught in the fuel and frequentlyresult in fretting of the cladding and fuel defects. Figures 9 and 10 show typicalfretting holes in the cladding of a CANDU element. Figure 11 shows a bunchof turnings caught in a fuel bundle.
4.2. Coolant-Induced Vibration and Fretting
Coolant-induced vibration of a fuel bundle or a column of fuel bundles can occureither by hydraulic flow instabilities in the fuel column or by pressurepulsations carried by the coolant from the pumps. Hydraulic instability or"flutter" at the upper end of 10 bundle vertical fuel assemblies caused damageto the Gentilly-1 reactor (now de-commissioned). In Gentilly-1, the top (number10) bundle of the vertical fuel assembly oscillated in the up-flowing coolant andcaused damage to both bundle and pressure tube. This effect was sensitive tooperating power, steam quality and flow rate. As a remedial measure, a sufferfuel-bundle design was-recommended, along with stiffening of the fuel carriageby using a staffer central support rod and increased retaining-spring force.
Another mechanism for fuel damage by fretting is the response of bundles toturbulence or other flow instabilities. This may cause both axial and transversemotion of the elements, leading to inter-element spacer wear and, eventually,to cladding contact between elements. Figure 12 shows inter-element spacerfretting wear, and wear of the cladding due to element-to-element frettingcontact.
FIGURE 10. A Metallographie Cross-Section of a Fretted HolePartly through the Cladding
ro01
FIGURE 9. A Macroscopic View of a Fuel Elementwith a Fretted Hole (Arrowed) FIGURE 11. Turnings Trapped in the End-Plate of a Fuel Bundle

FIGURE 12. Severe Fretting Wear of a Spacer-Pad (Centre) and aWorn Strip from Element-to-Element Contact
5. PRIMARY HYDRIDING DEFECTS
Even in the early 1970s, when the first CANDU reactors were commissioned,there were no problems with primary hydriding of CANDU fuel. The reason liesin the required high density for CANDU fuel pellets to support the collapsiblecladding. The fuel pellets are the main source of hydrogen in fuel elements [7].CANDU UOj fuel pellets have always had a specified density of about 10.6Mg/m3, or greater than 96% of theoretical density. The higher density fuel hasvery little inter-connected porosity to retain moisture for subsequent release in-reactor. Thus the problems experienced in light-water reactors in the 1970s [7]were not experienced in CANDU reactors. However, isolated incidents withenriched UO2 experimental fuel at Chalk River led to the imposition of a limitof 1 mg hydrogen per element for protection against potential primary hydridingdefects from hydrogen included in the fuel.
The first fuel defects attributed to primary hydriding in a Canadian CANDUreactor occurred at one of the 600 MW stations in 1991 and 1992. A quantityof 37-element fuel was fabricated with insufficient vacuum-baking of thegraphite CANLUB sheath coatings. This allowed an excessive amount ofhydrocarbon binder to remain in the elements. The fabricator's internal
investigation as a result of the fuel defects revealed a probable hydrogen levelof up to 4 mg per element in the affected fuel.
Primary hydriding failure is very difficult to prove from post-irradiationexamination of defective fuel, since a primary hydride "sunburst" in the claddingis masked by secondary hydriding or deuteriding damage. Theoretically, inheavy-water-cooled fuel, such as CANDU fuel, it should be possible todifferentiate isotopically between hydrogen-rich and deuterium-rich sunburstsin the cladding. In particular, neutron radiography shows a marked differencein attenuation of the neutron beam between zirconium hydride andzirconium deuteride. The investigation of the suspected hydriding defects is stillongoing (1992 May) and neutron radiography of selected elements is planned fora later date. Post-irradiation examination was able to eliminate otherpossibilities, such as incomplete closure welds, porous end-plugs and SCC. Abundle suspected of having failed from primary hydriding is shown in Figure 13and a metallographic section through a deuterided area is shown in Figure 14.
Detection of fuel defects in CANDU reactors depends on the kind of equipmentinstalled at the station. Some stations, including CANDU 6 stations, useDelayed Neutron (DN) monitors, which count the neutrons from short-lived
FIGURE 13. Fuel Bundle Showing Defects (Arrowed)Suspected of Primary Hydriding Defects
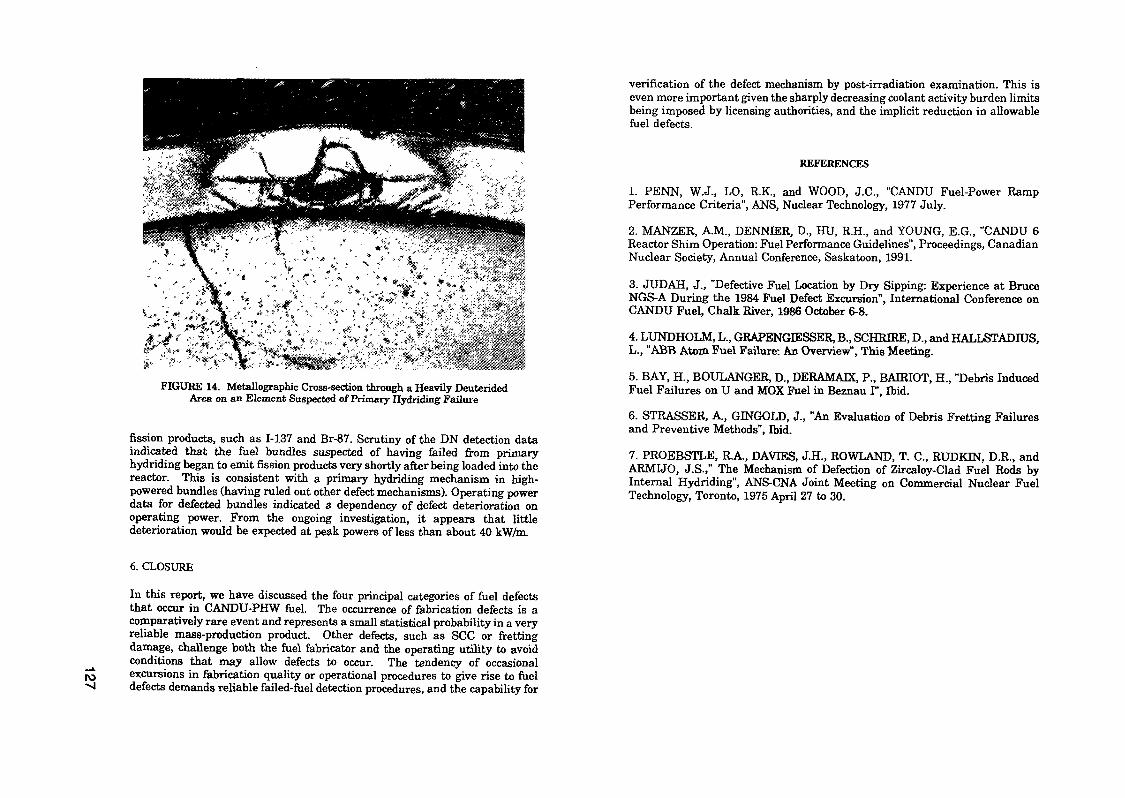
FIGURE 14. Metallographie Cross-section through a Heavily DeuteridedArea on an Element Suspected of Primary Hydriding Failure
fission products, such as 1-137 and Br-87. Scrutiny of the DN detection dataindicated that the fuel bundles suspected of having failed from primaryhydriding began to emit fission products very shortly after being loaded into thereactor. This is consistent with a primary hydriding mechanism in high-powered bundles (having ruled out other defect mechanisms). Operating powerdata for defected bundles indicated a. dependency of defect deterioration onoperating power. From the ongoing investigation, it appears that littledeterioration would be expected at peak powers of less than about 40 kW/m.
verification of the defect mechanism by post-irradiation examination. This iseven more important given the sharply decreasing coolant activity burden limitsbeing imposed by licensing authorities, and the implicit reduction in allowablefuel defects.
REFERENCES
1. PENN, W.J., LO, R.K, and WOOD, J.C., "CANDU Fuel-Power RampPerformance Criteria", ANS, Nuclear Technology, 1977 July.
2. MANZER, A.M., DENNIER, D., HU, R.H., and YOUNG, E.G., "CANDU 6Reactor Shim Operation: Fuel Performance Guidelines", Proceedings, CanadianNuclear Society, Annual Conference, Saskatoon, 1991.
3. JUDAH, J., "Defective Fuel Location by Dry Sipping: Experience at BruceNGS-A During the 1984 Fuel Defect Excursion", International Conference onCANDU Fuel, Chalk River, 1986 October 6-8.
4. LUNDHOLM, L., GRAPENGIESSER, B., SCHRIRE, D., and HALLSTADIUS,L., "ABB Atom Fuel Failure: An Overview", This Meeting.
5. BAY, H., BOULANGER, D., DERAMAJX, P., BAIRIOT, H., "Debris InducedFuel Failures on U and MOX Fuel in Beznau I", Ibid.
6. STRASSER, A., GINGOLD, J., "An Evaluation of Debris Fretting Failuresand Preventive Methods", Ibid.
7. PROEBSTLE, R.A., DAVTES, J.H., ROWLAND, T. C., RUDKIN, D.R., andARMIJO, J.S.," The Mechanism of Defection of Zircaloy-Clad Fuel Rods byInternal Hydriding", ANS-CNA Joint Meeting on Commercial Nuclear FuelTechnology, Toronto, 1975 April 27 to 30.
IV)
6. CLOSURE
In this report, we have discussed the four principal categories of fuel defectsthat occur in CANDU-PHW fuel. The occurrence of fabrication defects is acomparatively rare event and represents a small statistical probability in a veryreliable mass-production product. Other defects, such as SCC or frettingdamage, challenge both the fuel fabricator and the operating utility to avoidconditions that may allow defects to occur. The tendency of occasionalexcursions in fabrication quality or operational procedures to give rise to fueldefects demands reliable failed-fuel detection procedures, and the capability for

roœFUEL FAILURE AT HAMAOKA UNIT 1
Y. HAYASHINippon Nuclear Fuel Development Company Ltd,IbarakiT. MATSUMOTOToshiba Corporation,YokohamaM. KUZUSHIMA, T. MURAMOTOChubu Electric Power Company Inc.,NagoyaT. OKUBOSophia University,TokyoJapan
AbstractFive fuel assemblies failed during Cycle 11 at Hamaoka
Unit 1 of Chubu Electric Power Company in 1990. A thick zir-conium oxide layer formed on the fuel rods and was p a r t i a l l yspalled off in many of the assemblies, including the failedones. The failure was attributed to cladding corrosion, whichwas caused by a combination of cladding susceptible to corro-sion and irregular reactor coolant chemistry. In Cycle 12.Hamaoka Unit 1 operated under better water chemistry and withfuels which were confirmed to be sound. Neither failure noraccelerated corrosion was found in the subsequent annual in-spec t ion.
1. In troduct ionThe number of fuel failures in Japanese b o i l i n g water
ractors (BWRs) has been low. being 0-1 bundles during the 5years from 1985 to 1989. But five fuel assemblies were iden-t i f i e d as having leaked in Hamaoka Unit 1 in 1990. These werethe f i r s t f a i l u r e s in Unit 1. Soon a extensive i n s p e c t i o nprogram was started to reveal the cause of f a i l u r e . This paper
describes the progress of the program, its findings andmeasures a p p l i e d to prevent other f a i l u r e s .
the
2. Reactor operationHamaoka U n i t 1 is a BWR w i t h a capacity of 540 MWe. It
has been operated since 1976. Its Cycle 11 operation wasstarted in August 1989 after the 10th annual regular inspec-tion. The iodine-131 a c t i v i t y in the reactor coolant startedto increase in March 1990 under f u l l power operation. Thereactor operation was continued u n t i l June under more intenses u r v e i l l a n c e . The iodine-131 a c t i v i t y in the coolant and theoff-gas m o n i t o r indication are given in Figure 1. The iodine-131 a c t i v i t y reached a maximum of 20 Bq/g which was 1/400 ofthe operating l i m i t . The a c t i v i t y release to the environment
" 103-
_,_J^1 - ^ Ov . v ^ V- ————
Reactor shutdown10-9
10-10-
Reactor shutdown
7 8 9 10 11 12 1 2 3 4 5 6 7 8 9 10 111989 1990
Figure 1 Coolant activity and off-gas monitor indicationduring Cycle 11

ro(O
during operation was kept s a t i s f a c t o r i l y low through relevanttreatment in the radioactive waste disposal system.
A total of 368 f u e l assemblies were loaded. They werecomposed of two types of fuel a s s e m b l i e s , 8x8RJ and 8x8BJ.8x8BJ used zirconium l i n e r c l a d d i n g w i t h improved thermalprocessing. The reactor was shut down in June and all fue!assemblies were inspected by sipping test and 5 assemblies wereidentified as having leaked.
An extensive inspection program was subsequently plannedand implemented. The probable cause of f a i l u r e was i d e n t i f i e dand the countermeasures were d e t e r m i n e d .
The reactor operation was resumed in June 1991 after theappropriate measures were applied and Cycle 12 was completed inFebruary 1992. Neither fuel f a i l u r e nor accelerated corrosionwas found in the subsequent annual inspection.
Studies are s t i l l going on; post irradiation examinationof a failed bundle was started in October 1991.
3. Inspection
3.1 Fuel
a. Visual inspectionAll fuel assemblies were observed by under water TV and
fiber scope camera. Many assemblies had "spall ing" on thesurface of fuel rods. The s p a l l i n g was like that shown inFigure 2. Crud and the outer surface of the oxide layer werespalled off and white oxide layers were exposed. The size andshape of the spalling was varied and some were dented due tom u l t i p l e spallings. The number of assemblies w i t h s p a l l i n g sis summarized in Table 1. Seventy-eight out of 368 bundles hads p a l l i n g . The spalled rods belonged to fuels which were loadedfrom Cycle 8 or Cycle 9 and had experienced 3 or 4 i r r a d i a t i o ncycles respectively. The fuels loaded from Cycle 10 or Cycle11 did not have any s p a l l e d surfaces. The s p a l l i n g startedfrom the burnup of 19 GWd/t, as shown in Figure 3. Rods con-taining Gd did not show any s p a l l i n g .
Fuel assembly
Figure 2 The appearance of a failed assembly
b. Ultrasonic inspectionFive fuel rods were i d e n t i f i e d as water immersed rods
from 4 fuel assemblies. One leaked assembly was judged not tohave any water immersed rods. .
c. Vi s u a l inspection and oxide thickness measurements of rodsTwenty-seven asse m b l i e s were selected as typical in
consideration of i r r a d i a t i o n p e r i o d , cladding tube manufac-t u r e r , manufacturing p e r i o d and other factors. The v i s u a l

GO Table 1 Number of fuel assemblies with spalled oxide layer
Reloadbatch
Irradiationperiod (Cycle)
Cycle 8 8, 9. 10, 11Cycle 9 9, 10, 11Cycle 10 10, 11Cycle 11 11Cycle 11 11Total
Type offuel
8x8RJSxBRJBxSRJSxBRJ8x8BO
Number ofassemblies
1281162096368
Number of assembllewith spalling
870*00078
Averagebumup(GWd/t)29.824.216.39.58.8
*5 failed assemblies were included.
Burnup (GWd/t)|Spalled S Not spalled
Figure 3 Number of spalled assemblies vs. burnup
inspection and oxide thickness measurements were performed ontheir outermost rods after the crud was removed. The oxidethickness vs bundle averaged burnup is shown in Figure 4. Thefuel rods in the assemblies irradiated to 3 or 4 cycles werecovered with white zirconium oxide the thickness of which wasmore than double that t y p i c a l l y found on fuel rods irradiatedin Japanese BWRs. Rods w i t h 1 or 2 cycle irradiations werecovered with ordinary nodular corrosion and did not have thewhite oxide layer. Their oxide thickness was as much as ordi-nary sound fuel s .
Ti-i-
I r radia t ionperiod (cycle)C8,C9,C10,C11;(DC9,C10,C11 i ©C10,C11 ; (DCll ; ®
Oxide thickness(of sound fuel-I (réf. 1) IOxide thicknessof Hanaoka-1 fuel
@
10 20 30Assembly average burnup (GWd/t)
Figure 4 Oxide thickness measurements
3.2 Operation historyRod power was kept below the operational l i m i t (440W/cm)
and power increase was also below PCIOMR (the guide l i n e forpower increase: less than 0.1IkW/ft/h).
3.3 Manufacturing historyThe manufacturing record from ingot-tubeshe11-tub ing to
fuel assembly was surveyed. The manufacturing procedures andq u a l i t y control for every process were properly followed.
3.4 Coolant chemistryThe coolant water from the condenser is p u r i f i e d through
the condensate f i l t e r dem ineralizer (CFD) and condensatedem i n e r a l i z e r (CD). The coolant water chemistry records fromCycle 1 to Cycle 11 were surveyed. All control items forcoolant in the reactor and feed water were maintained wit h i nthe water chemistry control l i m i t during operation. Thee l e c t r i c a l conductivity of coolant at the startup of Cycles 9

Table 2 Coolant water chemistry and their causes
Under operation
At the shutdown
Cycle 9
electricalconductivity(1-1.2 uS/cm)High pH (7.8)Na* (18 ppb)
Cycle 10
High pH (7.7)Na* (12 ppb)
Increase ofelectricconductivity(0.86 pS/cra)
Cycle 11increase ofelectricalconductivity(1 pS/cm)High pH (7.7)Na* (17 ppb)
Increase ofelectricconductivity(0.89 pS/Cffl)
CausesDecomposition of organiccompounds which weredissolved from CD andflowed into the core.No* which was dissolvedfrom the cation exchangeresin in CD.Na* and SO/" which weredissolved from the fuelrod surface.
and 11 was higher than in the other cycles but low enough to bew i t h i n the regulation l i m i t . Though the coolant chemistry wasw e l l c o n t r o l l e d , records were surveyed in detail to find anyirregularity which -could possiblly affect rod corrosion. Thesurveyed results are summarized in Table 2.
a. Reactor startupThe e l e c t r i c a l conductivity of coolant was increased to
1-1.2 US/cm early in the startup of Cycles 9 and 11 and sulfate2 _ions (SO. ) were detected.
This increase of e l e c t r i c a l conductivity was thought tocome from the presence of chemical species which were formed bydecomposition of organic m a t e r i a l s due to heat and r a d i a t i o n .The organic m a t e r i a l s , which were usually monitored as TotalOrganic Carbon, dissolved from the ion exchange resin in thecondenser dem ineralizer and flowed into the core.
b. Reactor operationThe average sodium ion content in the core during the
most recent four cycles was 15 ppb under normal operation andpH was about 7.7. These values were slightly higher than inother Japanese BWRs.
The increase of Na ions could be explained by the fol-lowing process. In the chemical regeneration process of resinin the condenser demineral izer, a potion of cation resin wasmixed with anion resin. The mixed cation resin was converted
to the Na form, namely attached to Na . when anion resins wereregenerated by sodium hydride. These Naduring normal operation.
ions entered the core
c. Reactor shutdownThe e l e c t r i c a l c o n d u c t i v i t y of coolant was high at reac-
tor shutdown in Cycles 10 and 11. It had not increased at theprevious shutdowns. Na and SO. were detected at the reactorshutdown of Cycle 10. These ions were thought to be dissolvedfrom Na„SO, which had adhered to the oxide layer on the clad-2 4ding tube surface.
3.5 Cladding tube materialThe nodular corrosion s u s c e p t i b i l i t y of BWR cladding is
known to decrease with decreasing annealing parameter. Theparameter is defined as:
whereA=£t .exp(-Q/RT.)
t : time of i-th annealing step after ß quench, hiT. : temperature of i-th annealing step, KQ/R: 40,000 K
This s u s c e p t i b i l i t y was calculated for the tubes used inHamaoka Unit 1 and found to be r e l a t i v e l y large for the tubesused from Cycles 8 and 9 (Figure 5). A high temperature corro-sion test was performed on the archive tubing samples. Thecorrosion weight gain of the tubings used from Cycles 8 and 9was r e l a t i v e l y large and widely distributed.
4. Cause of failurePCI, fretting, burnout, defects caused on fuel handling,
hydriding and manufacturing defects were judged not to berelated to the fuel failure. Although the cladding surfaceappearance was si m i l a r to that of CILC failure, its possibilitywas s m a l l because coolant copper concentration, which was

COro
"
-
The fuels irradin Cycle 11
Iki
1 1 1
rated
C6 C7 C8 C9 CIO Cil C12
0-19-
Reload fuel batch
Figure 5 Cumulative annealing parameter of Hamaoka-1 reload fuel batch
comparable to other domestic BWRs, was 1-2 order of magnitudelower than foreign cases of CILC.
Finally it was decided that the fuel failure was causedby unique corrosion. The characteristics of the corrosion wereas foilows.
i. Extensive corrosion occurred only on the fuels loaded inCyc les 8 and 9.
ii. The oxide thickness was more than twice that of ordinarysound fue1 .
This corrosion behavior could not be explained as due touse of corrosion susceptible materials or irregular coolantchemistry independently. One reason is that s i m i l a r corrosionsusceptible cladding tubes have been used in other JapaneseBWRs but accelerated corrosion has not occurred. A secondreason is that fuel using less susceptible cladding loaded inCycles 10 and 11 experienced the irregular coolant chemistry,but their corrosion was normal. Therefore this corrosion wasinferred to occur through a combination of the i r r e g u l a rcoolant water chemistry and the r e l a t i v e l y high corrosions u s c e p t i b l e c l a d d i n g .
The f o l l o w i n g process leading to f a i l u r e was proposed.2 _Chemical species l i k e SO. and others anions are present inthe coolant at the start of operation, and Na and organiccompounds flow into the core during operation. These ions andorganic compounds accelerate the start of corrosion on corro-sion s u s c e p t i b l e c l a d d i n g s . When corrosion has started, Na SOand s i m i l a r compounds condense on the cladding surface andspeed up the corrosion even more. As the corrosion layerbecames thicker, the c l a d d i n g temperature rises and c o r r o s i o nis a ccelerated further to cause s p a l l i n g . F i n a l l y , m u l t i p l es p a l l i n g s produce holes in the c l a d d i n g w a l l .
5. Countermeasures
5.1 Fue1 asseobliesIt was decided that fuel assemblies in Cycle 12 should be
composed of fuels loaded from Cycles 10 and 11 and new fuels.Namely, fuel assemblies irradiated from Cycles 8 and 9 were notused in Cycle 12, even though they might have been found to besound. The fuel assemblies loaded in Cycle 12 are shown inTable 3.
Table 3 The fuel assemblies in Cycle 12
Used fuel
Used fuel
New fuel
Irradiated inCycles 10 and 11Irradiated in cycle
Sub-total
Total
Number of assemblies113
11 115228140368
5.2 Coolant chemistry and its co n t r o la. Prevention of sodium ion i n f l o w
Used resins were replaced with new resins in the conden-sate d é m i n e r a i i z e r . The resins w i l l not be regenerated afterCycle 12.

b. Suppression of e l e c t r i c c o n d u c t i v i t y increase at startupDischarge of organic compounds from CD, bypassing the
c o o l a n t water from the CD in the cleanup operation beforestartup and i m p r o v e m e n t of c l e a n u p capacity in the reactorc l e a n u p system were c a r r i e d o u t .
c. Stronger c o n t r o lStronger c o n t r o l s of organic confpounds (Total Organic
Carbon) before startup, of c o o l a n t e l e c t r i c a l c o n d u c t i v i t y atstartup and of Na d u r i n g o p e r a t i o n were set.
d. Other coolant q u a l i t y i m p r o v e m e n tThe water in the primary coolant system was p u r i f i e d more
by cleaning the system components before startup and the ex-changing the water
6. Cone 1 us ions
The fa i l u r e of rods and s p a l l i n g of oxide layeroriginated from corrosion whose cause was inferred to be thecombined effect of i r r e g u l a r water chemistry and use of morecorrosion susceptible c l a d d i n g m a t e r i a l .
In the next cycle, the reactor was operated using new andirradiated sound fuels under stronger control of coolantchemistry. The cycle was successfully completed w i t h o u t anyfuel f a i l u r e or accelerated corrosion.
Re fe rencesCl] Hishima, Y. et a l . . Proving Test on R e l i a b i l i t y for BWR
Fuel Assemblies, J. Atomic Energy Soc. Japan, 29, 90(1987) .
C2] G a r z a r o l l i , F. et a l . , Micr o s t r u c t u r e and CorrosionStudies for Optimized PWR and BWR Zircaloy, Zirconium inthe Nuclear Industry. ASTM STP 1023 (1988) pp. 202-212.
COCO
WESTINGHOUSE FUELPERFORMANCE EXPERIENCE
H.W. WILSON, R.S. MILLER, H. KUNISHICommercial Nuclear Fuel Division,Westinghouse Electric Corporation,Pittsburgh, Pennsylvania,United States of America
AbstractNuclear fuel reliability ia among the highest priority items in the nuclear
industry today. Despite having fuel reliability unsurpassed in the PWR industry,Westinghouse has an aggressive program to identify the efforts needed to achievedefect—free operation. This program consiste of monitoring fuel performance,detailed on-site examinations to identify leakage causes, and implementation ofcorrective actions. These efforts have identified debris-induced fretting as thedominant leakage mechanism, accounting for approximately 70% of observed leakingrods. Corrective actions, consisting of training of site personnel and fuelassembly design changes, have been implemented to minimize the impact that debriscan have on fuel integrity. Evaluations of data obtained from site examinationsshow several interesting trends. The size of debris wear scars has becomesmaller over the past several years, implying that debris in the system iabecoming smaller. Also, the majority of debris-induced fretting defects havebeen found to occur early in the fuel's operating life. This suggests that fuelrods have properties which make them more resistant to debris damage as burnupincreases. The corrective actions implemented have been shown to be successfulin reducing the occurrence of debris-related damage. Additional improvements arebeing developed to provide even further resistance to debris.
1. BACKGROUND
Maintaining excellent fuel reliability is among the highest priorities fornuclear power plant operators throughout the world. Despite the fact thatWestinghouse fuel reliability is unsurpassed in the PWH industry, an aggressiveprogram has been conducted since the early-1980s to identify and implementefforts needed to achieve defect-free operation in all reactors. Results of thiseffort are illustrated in Figure 1. Since the early 1980s when higher coolantactivity levels were being experienced, principally due to the effects ofbaffle-jetting and debris-induced fretting, the coolant activity in Westinghousefueled plants has decreased steadily. This paper will describe the structure ofthe Westinghouse program, the operative leakage mechanisms found through fuelexaminations, and corrective actions implemented to reduce the dominantmechanism, debris-induced fretting.
Fuel leakers are currently very rare. In order to identify the causes for thesmall number of leakers and to implement corrective actions needed to eliminatethem completely, a program incorporating coolant activity follow in operatingplants, detailed on-site examinations, and root cause and corrective actionevaluations has been pursued. Performing detailed fuel examinations at reactor
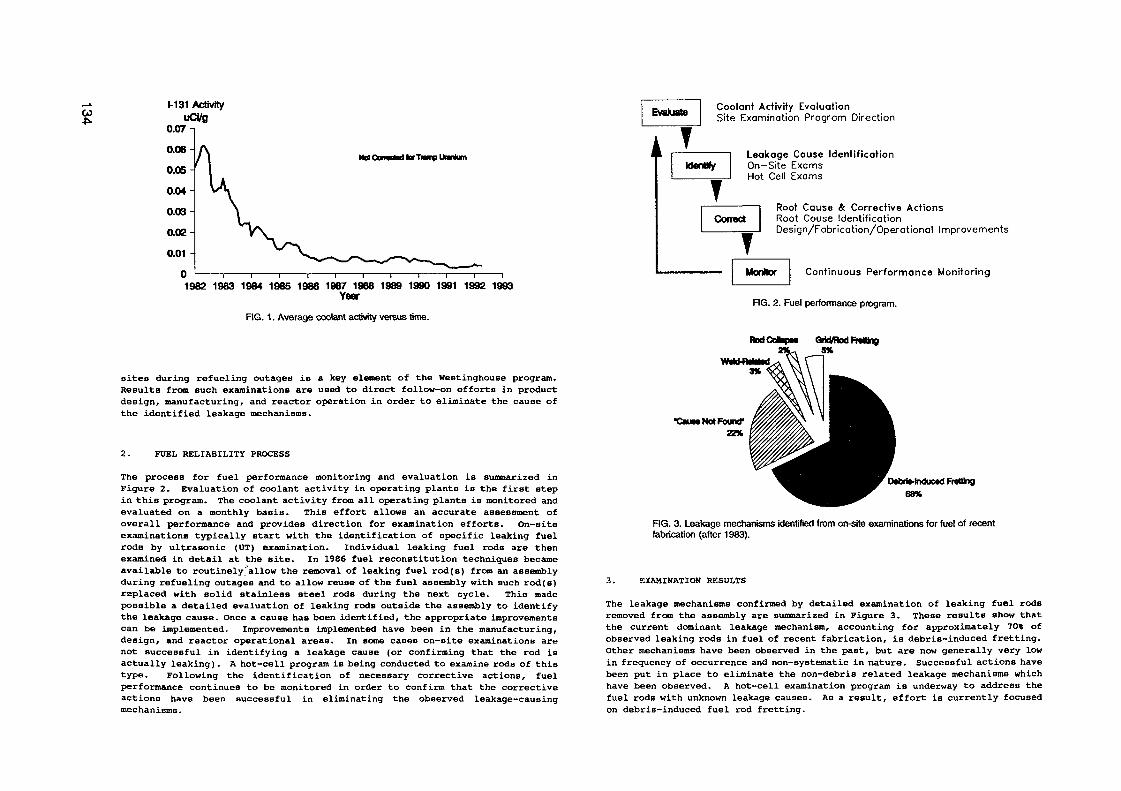
M31 ActivityuCi/g
0.07 n
0.06-
0.05-
0.04
0.03-
0.02
0.01 -
UK Cumted tor Tump Uranèum
1982 1983 1984 1985 1986 1967 1988 1989 1990 1991 1992 1993Year
RG. 1. Average coolant activity versus time.
sites during refueling outages is a key element of the Hestinghouse program.Results fron such examinations are used to direct follow-on efforts in productdesign, manufacturing, and reactor operation in order to eliminate the cause ofthe identified leakage mechanisms.
2. FUEL RELIABILITY PROCESS
The process for fuel performance monitoring and evaluation is summarized inFigure 2. Evaluation of coolant activity in operating plants is the first stepin this program. The coolant activity from all operating plants is monitored andevaluated on a monthly basis. This effort allows an accurate assessment ofoverall performance and provides direction for examination efforts. On-siteexaminations typically start with the identification of specific leaking fuelrods by ultrasonic (UT) examination. Individual leaking fuel rods are thenexamined in detail at the site. In 1986 fuel reconstitution techniques becameavailable to routinely "allow the removal of leaking fuel rod(s) from an assemblyduring refueling outages and to allow reuae of the fuel assembly with auch rod(s)replaced with solid stainless steel rods during the next cycle. This madepossible a detailed evaluation of leaking rods outside the assembly to identifythe leakage cause. Once a cause has been identified, the appropriate improvementscan be implemented. Improvements implemented have been in the manufacturing,design, and reactor operational areas. In some cases on-site examinations arenot successful in identifying a leakage cause (or confirming that the rod isactually leaking). A hot-cell program is being conducted to examine rods of thistype. Following the identification of necessary corrective actions, fuelperformance continues to be monitored in order to confirm that the correctiveactions have been successful in eliminating the observed leakage-causingmechanisms.
I
Coolant Activity EvaluationSite Examination Program Direction
Leakage Cause IdentificationOn—Site ExamsHot Cell Exams
Root Cause & Corrective ActionsRoot Cause IdentificationDesign/Fabrication/Operational Improvements
Continuous Performance Monitoring
FIG. 2. Fuel performance program.
RodCofcpn Grid/nod fnOngSU
•due« Not Found-22%
3.
D«briHnduc«d Fretting68%
FIG. 3. Leakage mechanisms identified from on-srte examinations for fuel of recentfabrication (after 1983).
EXAMINATION RESULTS
The leakage mechanisms confirmed by detailed examination of leaking fuel rodsremoved from the assembly are summarized in Figure 3. These results show thatthe current dominant leakage mechanism, accounting for approximately 70% ofobserved leaking rods in fuel of recent fabrication, is debris-induced fretting.Other mechanisms have been observed in the past, but are now generally very lowin frequency of occurrence and non-systematic in nature. Successful actions havebeen put in place to eliminate the non-debris related leakage mechanisms whichhave been observed. A hot-cell examination program is underway to address thefuel rods with unknown leakage causes. As a result, effort is currently focusedon debris-induced fuel rod fretting.

Debris-induced damage results from fretting wear on the outside of the fuel roddue to metallic material (debris) which has been introduced into the systemduring maintenance operations on the reactor system. Loose metallic debris cancirculate in the reactor coolant system and become trapped in the fuel assembly,where it vibrates against the fuel rods (due to flow effects) and frets throughthe cladding. Observed debris has typically included turnings and shavings suchas those which result from metal-working operations performed during primarysystem maintenance. In a few isolated cases, larger objects such as tools andscrews have even been found in damaged fuel assemblies. Pictures of typicaltypes of debris scars seen on fuel rods are shown in Figures 4-6.
4. CORRECTIVE ACTIONS FOR DEBRIS-INDUCED FRETTING
After the impact that loose debris in the system had on fuel reliability becamewell understood in the early—1980s, the industry took steps to control itsintroduction into the system. Utility and reactor service vendors helped assurethat plant maintenance operations did not introduce new debris into the systemand helped to rénove debris already in the system. Extensive efforts in trainingand worker-awareness were focused on eliminating the introduction of debris intothe system. These efforts were successful in significantly reducing theoccurrence of debris-related leakers.
At the same tine, Westinghouse introduced a new feature, the Debris Filter BottomNozzle (DFBN), to further prevent potentially damaging debris from entering theactive core. Compared to the previous bottom nozzle, the DFBN has reduced
FIG. 5. Debris wear scar.
COOl FIG. 4. Debris wear scar. FIG. 6. Debris wear scar.

GÎo
NON-DFBN DFBN
RG. 7.Debris filter bottom nozzle.
diameter flow hoIon through which the coolant enters the fuel assembly. Figure7 shows the DFBN compared to the previous bottom nozzle. The smaller flow holeslimit the size of debris which can enter the assembly and prevent large,aggressive debris froa coming into contact with the fuel rods. The selection ofthe size of the flow holes was a compromise between filter effectiveness,mechanical strength, and the hydraulic characteristics of the bottom nozzle. TheWestinghouse DFBN was designed to have the same pressure drop as the previousbottom nozzle, resulting in no flow mis-matches between the two types. Thisallows an orderly transition to a complete core of DFBNs in operating plants asmore DFBNs are brought in with each successive -cycle. Testing showed that the.nozzle was >90% effective in stopping debris that would pass through the previousbottom nozzle. The DFBN was introduced in 1988 and is now in operation in 44Westinghouse—fueled plants.
The above actions to control the introduction of debris into the system and theimplementation of DFBNs have significantly reduced the occurrence of debrisdefects. Figure 8 shows the number of debris-related leakers confirmed duringon-site examinations since the early-1980s for Westinghouse-fueled plants. Itis clear in Figure 8 that, although debris leakers are still present to a verysmall degree, the number seen at any particular plant after the initiation ofindustry efforts to eliminate debris (approximately 1986) has been greatlyreduced. The most observed were typically in the 4 to 5 per plant range,whereas, before these efforts, it was common to see larger numbers, in one caseas high as 83. The DFBNs have contributed to a further reduction indebris-induced leakers. As shown in Figure 8, over the last one to two years,the frequency of observed debris leakers has been even further reduced.
To date, four rods from DFBN assemblies have been confirmed to be leaking due todebris-induced fretting. Two of these rods were on the outside row of theassembly and were adjacent to non-DFBN assemblies. It is possible that thedebris which caused these rods to leak may have come from the adjacent assemblyand not through the DPBN. When this is taken into account, the leakage rate due
•S 40 -
2 30 -
1 "~
1 10-
n
D
i NON-
(83) H
O
D
Dn ^
D°a i D °D o °Cla rf D^ö
DFBN33N
DAA
1982 1983 1984 1965 1988 1987 1968 1989 1960 1991 1992 1993Date
FIG. 8. Debris-related leaking rods versus time.
to debris in examined assemblies is about 7 to 8 times lower in DFBN assembliesthan in non-DFBN assemblies.
5. DEBRIS CHARACTERISTICS
Evaluations of the debris wear scars show several interesting trends. When theimpact of debris was first observed in the early-1980s, it was common to see verylarge wear scars/ and occasionally multiple Bears, on a single rod (Figure 4).As awareness of the adverse impact of debris increased and control measures weretaken, not only has the frequency been reduced, but the size and nature of theobserved defects has also changed. Typical debris scars became smaller and thefrequency of multiple scars on the same rod decreased.
A large number of TV tapes showing debris-induced damage from the early- 1980s tolate-1989 were evaluated. The wear scars were categorized based on size (small,medium, large), shape (small hole, gouge, gross, and crescent), and whether therewere multiple or single scars. Three trends were seen:
(a) The "small-hole" wear scars were not seen in the early-1980s, but becameprevalent in the late-1980s.
(b) Single wear scars became dominant in the late-1980s. In the early-1980s,multiple scars were more prevalent.
(c) Greater than 95% of the debris-induced scars occurred below the bottomgrid.
These observations imply that the debris which caused these scars in the late1980s, after the efforts to minimize debris, were smaller in size than was thecase in the early 1980s.
As the debris became smaller, another trend was observed. The majority of thedebris-induced fretting defects were found to occur early in the fuel's operating

life. The frequencies of occurrence of debris-induced leakers found after one,two, and three cycles of operation were compared. This evaluation was performedby summarizing all cases where debris-induced fretting was found by detailedon-site examination. In order to address the specific issue of susceptibilityto debris-induced fretting as a function of the number of irradiation cycles, theleaking rod data was carefully reviewed. Cases were removed from the data basewhere UT was performed only on part of the core. In addition, results fromplants which had completed their first cycle of operation were deleted since theyprovide no information on the relative susceptibility of the number of cycles ofoperation. For the remaining cases, the number of cycles of irradiation of eachconfirmed leaker was tabulated, in many cases/ fuel rods were first examinedonly after their second or third cycle of irradiation. The coolant activityhistory was reviewed for each of these cases to determine if the fuel rod couldhave been leaking in a previous cycle, was not inspected at the end of theearlier cycle(s), was reloaded for continued operation, and was tested for thefirst time and found leaking after its second or third cycle of operation. Thespecific examination results were reviewed and the number of observed debrisleakers believed to be leaking in an earlier cycle and carried over into asubsequent cycle without examination (called "carryovers") was determined. Theresults of this evaluation is summarized in Table I. The number of rods leakingdue to debris listed in-Table I is the number after the "carryoverB" are removed.The number of "carryover" leakers found at each plant site is also shown inparenthèse» in Table I.
Of all the debris-related leaking rods observed, approximately 70% were found tobe in fuel that was in reactor for its first cycle of irradiation. This trendbecomes even more pronounced when those leaking rods caused by the larger moreaggressive debris seen in the early examinations (specifically Plant A-1 on TableI) are excluded from the evaluation. This cycle occurred in the early-1980s andinvolved debris that was very large and aggressive. It is reasonable toeliminate this data from the evaluation since it is not typical of what iscurrently observed and debris of this nature would be very effectively filteredout by the DFBN.
The above evaluation suggests that fuel rods have properties which make thembecome more resistant to debris damage as burnup increases. One possible reasonfor this is the oxide film which forms on the cladding surface as a result ofcorrosion during irradiation. This oxide layer is much harder than the basezircaloy and is also harder than typical debris. Therefore, it would be expectedthat the oxidized rods_would be more resistant to debris-fretting than fuel rodsearly in their first cycle of irradiation which are not oxided.
6. FUTURE IMPROVEMENTS
CO
Recent experience has shown actions taken by plant operators to minimize theintroduction of debris into the system and the implementation of DFBNs has hada significant impact on reducing debris-related leakers. These actions, however,would not be expected to completely eliminate debris-related defects. Thecurrent objective throughout the world is to achieve zero defect fuelperformance. In order to support this objective, Westinghouse is developingadditional debris mitigation features.
Table IDebr i s Obsevat i ons vs
Number of Cycles of Operation
Plant-cycle
A-1
A- 2
B
C
0-1
D-2
E
F
G
H
I
J
K
L
M
N
O
P
O
TOTAL
TOTAL W/ O
PLANT A- 1
Number of1 Cycle
39
8
18
21
51
2
1
1
•1
1
5
1
3
1
1
3
97
58
Debris Observations2 Cycle 3
27C1CO
DC 13OC 83
OC 13
2CCO
OC 231C O)
OC1D1C 032C03
OC 13
33C243
6C-K)
Cycle
<23
DC 53
OO3
OO3
2C13
EC 103
2CS3
7.
C 3 - Number of carryovers
SUMMARY
Corrective actions have been taken to minimize the adverse impact that debris canhave on fuel integrity. These actions have consisted of training personnel tominimize debris at the plant site and fuel assembly design changes. Theseefforts have been successful in substantially reducing the incidence ofdebris-related leaking rods. Additional changes are being developed to provideeven further resistance to debris, so that the objective of no leaking fuel rodscan be achieved at all operating plants.

CO00
EVALUATION OF DEBRIS FRETTING FAILURESAND PREVENTIVE METHODS
A. STRASSER, J. G1NGOLDThe S.M. Stoller Corporation,Pleasantville, N.Y.,United States of America
Abstract
Metallic debris in the primary coolant has caused a significant fraction of the failures inLWRs. A review and evaluation of the failures is presented. Specific items discussed includethe source of debris, the types of debris and the interaction of debris with fuel assemblies.Differences in failure histories between BWRs and PWRs are discussed. Preventive measuresinclude improved maintenance procedures to preclude introduction of debris into the primarysystem and fuel assembly design features that make the fuel cladding less likely to be exposedto through-wall fretting. Trie improved maintenance procedure guidelines and the fuel designmodifications are discussed.
1.0 INTRODUCTION
Of various mechanisms leading to failure of fuel rods in LWRs, debris is one of the mostsignificant Debris related failure seems to be primarily a PWR issue, although a modest, butgrowing, number of failed rods in several BWRs have been attributed to debris. In order tomitigate the debris problem, utilities have developed programs to identify and eliminate thesources of debris, and fuel vendors are now offering "debris-resistant" fuel designs.
This paper describes typical debris failures, the debris related failure rates, the source of thedebris and methods of debris failure prevention.
2.0 STATISTICS OF DEBRIS FAILURE AND SURVEY OF EXPERIENCE
The overwhelming majority of debris failures have occurred in PWRs. The number of BWRdebris failures has been limited, but appears to be increasing.
There is no single definitive reason for this, although the principal factor may be thedifference in the velocity of the coolant flow in the two types of reactors. In BWRs, thecoolant velocity at the single phase inlet to the core is on the order of about 2.1 m/sec at fullrated flow. In PWRs, on the other hand, the flow velocity can range between about 3.5 and5 m/sec depending upon the specific reactor design.
The higher flow velocity in the PWR is capable of supporting larger pieces of debris andcarrying them into the core. A piece of debris which might sink to the bottom of a BWRreactor vessel and remain there during operation might be carried along by the higher velocityof the PWR coolant, become lodged in the grid of a fuel assembly and cause a failure. The
size and weight of the debris which can be carried by the BWR coolant flow may be such thatmost of it is likely to pass through the core without doing any damage.
Other factors which may contribute to the lower debris failure rate in BWRs include thepresence of the control rod guides underneath the core which can act as a filter for debris.The annular downcomer region around some BWR cores may also provide an opportunityfor debris in the coolant to be deposited without entering the core.
Although a number of debris failures have been observed at the upper elevations of the PWRfuel rods, the vast majority of such failures, over 90%, occur at or below the bottom grid ofthe affected fuel assembly. This is due to the mechanisms by which most debris failuresoccur.
Based upon the experience to date, it appears that the great majority of the debris which entersa fuel assembly will either become lodged in the bottom grid spacer or it will pass throughthe fuel assembly without doing significant damage. Once the debris has been trapped by thegrid, it frets against the fuel rod (or, perhaps, more than one fuel rod) until the clad ispenetrated.
The elevation of fretting failures in BWR assemblies does not follow the PWR trend, and thefailures have been found at various elevations over the axial lengths of the fuel rods. Thiswould support the theory that only small pieces of debris will be carried into the BWR coresand these can pass through the larger flow areas available in a BWR assembly.
A higher incidence of debris failures has been found in the outer rows of PWR fuel rods thanin the center of the PWR fuel assembly. This may be due to the flow patterns as the coolantenters the assembly or to the cycling of the flow. As the core flow decreases, debris maysettle on the lower end fitting. As flow increases, there is a chance that the debris will workits way toward the outside of the assembly. As the flow cycles, the debris moves toward theintra-assembly gap. Thus, failures are found in the two peripheral rows of rods.
In some instances, the debris failures tended to be close to the corner of the assembly. Thishas been explained by an eddy in the flow pattern caused by the feet on the lower end fitting.
Debris failures can be identified visually with reasonable certainty, and as a result the debrisfailure statistics are quite reliable.
The number of identified debris failures in US and European LWRs during the past,approximately 10 years, is shown in Table I.
The largest debris failure incident in the past 10 years occurred with stainless steel clad fuelin the Connecticut Yankee reactor, where over 400 failed rods were identified in one cycledue to debris fretting. This is not included in the table since it would distort the Zircaloy cladfuel failure statistics significantly.
The figures indicate that debris is a significant contributor to the overall fuel failure rate andthat PWRs are more prone to debris failures.

TABLE I. DEBRIS FAILURES IN PAST - 10 YEARSNUMBER OF FAILED ZIRCALOY RODS (% OF IDENTIFIED FAILURES)
ABBCEFGAGE,
SNP(ANF)
wBWFC
BWR PWR30 (90%) 4 (80%)
41 (85%)13 (72%)
2(1%)
5 (42%) 49 (39%)
47 (58%)
32 (25%)
TOTAL 37 186
10-
9-
8-10 -7
I'co 6-LL_
ccLU
z 3-
2-
1 -
0-
^
^
y/A ÜlyiÉ|É|1 2 3 4
tffiff
my///.
ÉiLtjLIi.5 6 7 8 9 10 11 12 13 14
COCO
REACTOR CYCLE NUMBERFigure 1: NUMBER OF BWRs vs. THEIR CYCLE NUMBER IN WHICH DEBRIS
FAILURES OCCURRED
The number of debris failures as a function of the total failures has increased as a functionof time, as other failure causes are remedied and as the sources of some of the debris, primarysystem maintenance and equipment wear out, increase.
The time at which debris failures occur in the life of the plant is shown on Figure 1 for BWRsand Figure 2 for PWRs. In the case of the BWRs the distribution is clearly skewed to thefirst cycle of the plant, and the incidents were most likely related to the construction of theplant The data for PWRs do not show a specific trend. The decreased number of debrisfailures beyond Cycle 10 is more a function of the decreased number of reactors that havereached that age.
Figure 2:
"j'""|""|"'"f . . . . . . . .2 3 4 5 6 7 8 9 10 11 12 13 14 15 16 17 18
REACTOR CYCLE NUMBER
NUMBER OF PWRs vs. THEIR CYCLE NUMBER IN WHICHFAILURES OCCURRED
19 20
DEBRIS
The relationship between the fuel exposure, i.e. number of cycles in-core, versus the time ofdebris failure has been examined also. Westinghouse has reported that the preponderance ofthe debris failures occur in the first operating cycle of the fuel; however, the experience ofFragema and Siemens do not support this trend. The reason for the higher failure rate in firstcycle fuel is not known, but it has been suggested that the lack of a wear resistant ZrO2 filmon the cladding early in life, makes new fuel assemblies more susceptible to debris failures.
Perhaps the most consistent trend has been the location of the debris fretting failures at orbelow the first spacer on the bottom of PWR fuel assemblies. The small flow area spacerserves as a debris trap in PWRs. This has given clear directions to the designers of debrisresistant fuel assemblies which are discussed later.
3.0 VISUAL APPEARANCE OF DEBRIS FRETTING FAILURES
Visual failure characteristics identified during poolside examinations can be used todifferentiate debris failure from other types of fuel failure. The most striking feature is thepresence of wear scars (or wear holes) in the cladding, of the type shown in Figures 3 and 4.The specific characteristics of these scars are that they are usually clean and show evidenceof wear. The vibration of small, hard particles by flow-induced vibration, result in abrasionthrough the clad that is visibly detectable.
Secondary failure indications include secondary hydriding (blisters and failed end cap welds)or in the case of BWRs in secondary PCI splits.

Rgtirc 3: FRETTING FAILURES NEAR A BOTTOM END PLUG
The debris that caused the fretting is, in most cases, no longer present at the failure locationwhen the inspection is performed. Conversely, debris can be found in and around theassembly during poolside examination, which can not necessarily be associated with a specificfailure.
4.0 DEBRIS SOURCES
4.1 INTRODUCTION -
As noted before, observation of the actual piece of debris that caused clad fretting is theexception rather than the rule, since the debris can be moved from its position by the forceof the coolant flow or drop from its position on shutdown.
Some debris is observed at fretting locations however, and a significant amount of debris hasbeen collected during cleanup of the fuel assemblies and the reactor vessel. The debrisidentified away from fretting locations during core visual examinations or core cleanup maynot have caused any fuel rod fretting, but does have a potential to do so.
Most debris found in reactors and fuel was from one or more of the following sources:
Figure 4: SEVERE FRETTING FAILURE
• primary system components• fuel burnable absorber or control rod components• primary system maintenance• tools and equipment used within the containment
A review of these sources is most useful in implementing preventive actions.
4.2 PRIMARY SYSTEM COMPONENTS
Pieces of a variety of primary system components have been found in the primary system andin individual fuel assemblies. They have included:
• Wires from screens (new BWR components)• Shavings from reactor coolant pump wearing ring• Pieces from broken coolant pump shaft• Failed nuts and bolts from thermal shields• Stellite fragments (probably from valve seat)• Metal tags from new components installed in the system• Steam generator seal plugs• Pieces from steam generator flow dividers

4 3 CORE COMPONENTS
Debns from fuel assemblies can develop due ro handling, such as torn spacer straps or dueto failures of the components Examples are
• Fragments of spacer gnds broken during handling• Fuel assembly or control rod nuts, bolts, or clamps faded due to IASCC• Broken absorber rods• Fuel rod end plugs
4 4 PRIMARY SYSTEM MAINTENANCE
As the plant ages increase, the required amount and degree of primary system maintenanceincreases as well The maintenance operations create debns and this has been the cause ofthe majority of the debns failures to date
The maintenance operations that have resulted in the greatest damage have come frommachining operations that produce metal shavings during
• Replacement of-steam generators• Removal of thermal shields in PWRs• Repair and replacement of spray headers in BWRs• Repair and replacement of reactor coolant pumps
The actual debns identified, in addition to metal shavings, chips and filings has included
• Pieces of lock wire and other wires• Pieces of welding rods• Sawblades
Parts of gaskets• Pieces of nuts and bolts that were being removed
4 5 TOOLS AND EQUIPMENT USED WITHIN THE CONTAINMENT
The examples of debns found in this category represent the widest and most surprising arrayof items
Eddy current test coilsUltrasonic test sensorsDosimeterParts of pens and pencilsParts of toolsSteel woolKeysGlass fragments from containment light bulbsPaint chips from containment walls
5 0 DEBRIS PREVENTION
The best way to prevent debns related failures is, obviously, to keep debns out of the primarysystem during operation First, to prevent debns from entenng the system to begin with and,then, to remove whatever debns has unavoidably entered the system Over the past severalyears, utilities around the world have developed and refined their maintenance procedures toachieve these goals While each utility s program is unique in some of its aspects, there arecertain pnnciples which are common to almost all of them
There are three components to such a program,
1 Preventive maintenance on debns producing components2 Improved maintenance and operating procedures that do not produce debns or reduce
the quantity produced3 Debns cleanup programs
The preventive maintenance should include the following steps,
• Worn equipment and components should be evaluated for their potential toproduce debns, and preventive maintenance procedures instituted
• Fuel and control element handling procedures should be improved if theyproduce debns
• A debris identification program, visual and sampling for chemical analysis,should be established to identify debns sources directly and assist in theirelimination
The improved maintenance procedure program should include the following elements
• A debns awareness training program should be implemented among the plantstaff and workers responsible for maintenance work and other operationsaround the plant
• An attempt should be made to maintain a stable staff for maintenance so thatthe benefits of accumulated expenence can be taken advantage of
• Operating instructions should be developed for routine and special maintenanceprocedures that may cause debns, including,
Control and limit matenals and tools brought tothe work area.Identify and control activities in sensitive areas,such as the fuel pool, reactor cavity, primarypiping and system components, steam generatorsInstall covers, seals, etc over cavities andopenings to keep debns outImplement appropnate work and cleanupprocedures
• A maintenance debns inspection and cleanup program should be established

roSome primary system maintenance procedures result in debns which may enter the systemdespite the best efforts of the maintenance workers Some debns results from failures ofprimary system components during operation and cannot be avoided Consequently,techniques have been developed to remove debns from the system
There have ben significant improvements m recent years to the equipment available forcleaning primary systems In addition to vacuuming devices operated directly from outsidethe reactor vessel, small remotely controlled vehicles have been developed These devicescontain both television cameras and vacuuming or other debns removal devices and can gamaccess to portions of the reactors vessel which could not be reached with earlier equipment.Some such vehicles can also be used to inspect and clean primary system piping
The cleanup and debris prevention programs should consider all systems connected to theprimary piping, including the spent fuel pool, where debris could hide out or be generated, andeventually work itself into the primary coolant
usually employed, will raise the linear heat generation rate and the temperature of the rodsomewhat Some of the void volume has been regained by the use of low volume holddownspnngs, and hollow, thick walled end plugs
6 3 DEBRIS RESISTANT LOWER SPACER GRID
The debns resistant lower spacer gnd is designed to prevent debns from entering the activepart of the fuel assembly Assemblies containing these gnds may also employ longer endplugs and the gnds themselves are usually positioned closer to the lower end fitting than aconventional lower spacer gnd A typical design is shown m Figure 5
These gnds are designed so that the intersections of the gnd straps are strategically locatedover the flow holes in the lower end fittings Additional structural components are addedwhich project into the flow path The result is a component whose capability of acting as astrainer or filter of debns is significantly enhanced as compared to a standard gnd
6 0 DEBRIS RESISTANT FUEL DESIGN FEATURES
6 1 INTRODUCTION
The increasing concern over debns related failures over the past decade has led essentially allof the PWR fuel vendors to develop fuel assembly design features which either prevent debnsfrom entering the fuel assembly or prevent fuel rod failure if debns should find its way intothe assembly Some of me BWR vendors have just started to offer specially designed debnsresistant features as commercial products
There are three general approaches which have been used to prevent debns failures, including
• Longer solid lower end plugs• Debns resistant lower spacer gnds• Modified lower end fittings
6 2 LONG LOWER END PLUGS
The vast majonty of fuel failures due to debns have been located at the bottom of the fuelrod, between the end plug and the lower gnd To combat this type of failure, several vendorsoffer fuel assemblies with a longer lower end plug, one which extends up into the bottom gndIn this design, debns which becomes lodged in the bottom gnd will fret against the solid endplug and will not damage or penetrate the active portion of the fuel cladding
Using a longer end plug requires some compromises in the balance of the fuel rod designSince the overall length of the rod cannot normally be increased, the extra end plug lengthmust be accommodated by either reducing the volume of the fission gas plenum or reducingthe length of the fuel pellet stack
The former case affects the end of life internal rod pressure which is a licensing limit whenhigh exposures are desired Decreasing the length of the pellet stack, which is the method
Original
Onginal
Anti Debns
Anfc-Debns
Gnd
Courtesy Babcock and Wfcox Fuel Co USA
Figure 5 ANTI DEBRIS FUEL ASSEMBLY BOTTOM END GRID

CD
T3SD(QCD
CT!D
CO
Courtesy of Siemens Nuclear Power Co., USA
Rgure 6: DEBRIS FILTER BOTTOM END FITTING
Any debris which is trapped by the debris resistant grid will only fret against the end plug.The design is such that the probability of the debris passing through the grid into the activeportion of the assembly is quite low.
6.4 MODIFIED LOWER END FITTINGS
PWRThe lower end fittings have been modified to screen out debris. Each vendor's design issomewhat different Typical designs are:
• Decreased flow hole sizes in the lower plate (Westinghouse) (B&W FuelCompany)
• Screen added to lower plate (Fragema)• Curved plate traps (Siemens Nuclear Power)
Figure 6 and 7 show some of these designs.
The challenge which faced the designers of debris resistant end fittings was that the smallerflow holes, screens and narrow channels tend to result in a greater pressure drop thanconventional end fittings. However, the vendors offering each of these debris resistantfeatures claim that the new designs are such that their pressure drop is essentially the same
CURRENT DEBRIS RESISTANT
Courtesy Babcock and Wifcox Fuel Co, USA
Figure 7. DEBRIS FILTER BOTTOM NOZZLE
as in a conventional component A large number of fuel assemblies containing this featurehave been operated successfully.
BWRThe SNP curved plate design developed for PWRs and shown in Figure 6 has been adaptedand is being offered for BWRs.
The lower tie plates of General Electric and ABBA fuel assemblies have been modifiedrecently to increase their pressure drop for improved hydraulic stability. In the process, theflow hole size has been reduced improving the debris filtering capability as well.
6.5 DEBRIS RESISTANT DESIGN EFFECTIVENESS
To date, only partial core loadings of debris resistant design are in operation, and it issomewhat early to judge the effectiveness of the designs. Their performance will bemonitored with great interest to determine how well they fulfill their intended function.

MANAGEMENT OF FAILED FUEL
(Session IV)
Chairmen
P. BOURNAYFrance
R. VON JANGermany

MANAGEMENT OF FAILED FUEL DURING OPERATION:FRENCH POLICY AND EXPERIENCE
P. BOURNAYSen/ice de la production thermique,Electricité de France,Paris - La Défense, France
AbstractSince more than 10 years, with the French safety
Authorities agreement, EDF apply a policy consisting in re-insertion of the leaking assemblies which meet some convenientcriteria.
During the shutdown period :- leaky assemblies are identified on line with an in-mast sipping System,
- the equivalent diameter of defects is measured by"quantitative sipping test",
- the accepted assemblies according to our criteriaare immediately re-inserted. The rejected onesremain in spent fuel pool for futher repair orshipping for reprocessing.
Our criteria are the following :- equivalent diameter less than 35 M m,- no solid fission products in liquid sample duringsipping test,
- impact of reloaded leaky assemblies, on the comingBOG activity level in D.E. 1.131 less than1,1 GBq/t.
In that conditions, we succeed to reach our maingoal : no significant release of OO2 in the coolant due toleaking assemblies re-insertion.
Our experience feed back is the following :- acceptable stability of e<iuivalent diameter for thereloaded defects,- no important activity evolution attributable to there- inserted leaky assemblies,
- compatibility of this policy with the presentscenarios of defects occurence and evolution inoperation.
This policy induces significant time and moneysaving. It does not impact the units availability. It supposesconvenient on-line means. It is compatible with safetyrequirements .
1) INTRODUCTION
As most of the utilities in the world, EDF adopted manyyears ago, a "zero defect" policy, in order to reach theobjective of "no defect occurence in operation" . This
policy recommends conditions, actions, precautions to betaken in the different stages from design, manufacturingchecking, handling, to operational limits.At this point, EDF didn't choose a policy of "zero activitylevel in operation". Since 1981, with the French Safetyauthorities agreement, EDF re-insert leaking assemblieswhich meet some convenient criteria, trying to find thegood balance between safety requirements and economicalobjectives.In a safety point of view, as a result of our négociationswith our safety authorities, the French technicalspecifications on the coolant activities levels, werelowered compared with the previous WESTINGHOUSE ones, as acounterpart of the re-insertion agreement.In a technical and economical point of view, the benefitsare time and money saving (no extra cost on the fuel,limited modifications of the refueling pattern, no impacton the critical path of the outage). But the "cost" is theacceptance that a reasonable but significant level ofcoolant activity could be invested in the possibility ofre-insertion.Nevertheless, the technical key point of our policy is thevalidy of our criteria in order to avoid the re-insertionof leaking assemblies which could release significantamount of O02 through their defects, in the coming cycle.By another way, the rejected leaking assemblies arerepaired off shutdown periods.
2} CONDITIONS FOR RE-INSERTION
The first point to be determined is the capability of eachreloadable leaky assembly to meet our main goal : nosignificant release of D02 in the following cycle.The corresponding criterion is based on the value of theequivalent diameter of the defect measured in what we call"quantitative sipping test". Physicaly, the equivalentdiameter is the diameter of an hypothetic cylindrical holethrough the cladding, which would allow the same dynamicrelease of the fission gases out of the defective rod,after a temperature step in the sipping cell. The fuel poolof each of our units is equiped with an adequate sippingcell to perform this measurement during the outage.As a result of our experience, we don't identified anysignificant dissemination if the equivalent diameter of re-inserted defects is less than 35u m.

00More recently, we began to introduce a complementarycondition to this first criterion : the absence ofsignificant amount of solid fission products in the liquidsample taken during sipping test. The release of solidfission products in these conditions, could be anindication of the dissemination ability in operation.The second point is to limit the impact of the re-insertedassemblies on the coolant activity level at a reasonablevalue. The corresponding criterion is DE I 131 less than1,1 GBq/t (30 mCi/t), that is about- 15 % of the specifiedlimit for shutdown. The consequence is the possiblelimitation of the total number of leaking assemblies to bere-inserted. In that case, the re-insertion of some of themcould be delayed.
3) MORE DETAILS ABOUT ODR PROCEDURES FOR RE-INSERTION
The implementation of our policy for inspection and re-insertion required convenient means and methods(Diagram 1).
POLICY FOR INSPECTION AND RB-IKSKRTTOH
The leaky fuel assemblies identification was previouslyperformed in the sipping cells in the spent fuel pool. Thismethod was time consumming on the critical path. So, wedevelopped, in cooperation with CEA an on-line monitoringsystem for fuel assembly integrity testing inside thehandling machine mast (only two minutes per assembly on thecritical path). This test allows a quick and reliableclassification between the tight assemblies which followsthe forecast management and the leaky ones.In order to apply our criteria, the leaky assemblies aretransfered to the sipping cells for equivalent sizemeasurement of their defects. Those which are definitelyunloaded, and those rejected according to our criteriaremain available in spent fuel pool, for further failurecause investigation or repair. Those which meet ourcriteria are immediately re-inserted after a possiblereloading pattern adjustment.Besides, we have to mention the interest of a claddingintegrity evaluation from the activities analysis inoperation. It allows a prediction (number, severityposition of defects) of what could be found at the time ofinvestigations during the following outage. It allows apossible anticipation of necessary arrangements in case ofpredicted difficulties.
LEAKY Frrer. ASSEMBLIES IDENTIFICATIONIn-nast flipping system
tight current fuelmanagement
. DEFECTS EQOIVMiBNT SIZE MEASOREMENT
Sipping cells
repair
I
FAILURE CAUSES INVESTIGATIONS
Diagram 1. Management of leaky fuel assemblies.
4) RE-INSERTED DEFECTS BEHAVIOOR
*•! - Equivalent diameter evolutionOne way to investigate the re-inserted assembly behaviouris the analysis of the successive results of theequivalent diameter measurements at each outages.Our present experience concerns about 120 leaky re-inserted assemblies. Among them, 57 were re-inserted twotimes and 8 three times. Our conclusions are thefollowing :. no equivalent diameter change for 34 assemblies,. increase for 23 assemblies,, 11 among them reached the current criterion of 35u.m,. two of them caused a slight ÜO2 release and were theorigin of our recent criteria evolution.
4.2 - Activity evolution in operationA second way is the analysis of the activity evolutionalong the cycles following a re-insertion. As a result,we didn't identify any important activity evolutions dueto the re-inserted assemblies.

IR CAST 4 ""Cut. 0 F N D£ CAMPACNt Lr 30 09-8
-P»CO
Diagram 2
We can give and comment an exemple of successive re-insertions we performed in TRICASTIN unit 4, from cycle 7to cycle 9.One month after the beginning of cycle 7 (Novembre 1988)a significant increase of activity occured (diagram 2) .An other step on the iodines can be noticed on march1989. I 134 activity level slowly but continuouslyincreased all along the cycle, due to a slight release ofOO2. The E.O.C. activities were lowered by coastdownperiod of operation.During the outage, the on-line sipping test in thehandling machine mast identified 8 failed fuelassemblies. Diagram 3 gives their positions in the coreand the results of the quantitative sipping test.Assemblies A and B reached their nominal burnup.Assembly F was out of criteria. The five others werereinserted.All along cycle 8, the activities levels remains globalyconstant (diagram 4). The activity level in iodines atthe BOC 8 are lower than at KOC 7 due to the unloading of
N OF ASS
A
B
C
D
E
F
G
H
END OF CYCLE 7
e<z âi&m (pm)30
15/20
15/2015/2015
> 3515/2015/20
H RM R-R
R
R
0 C
R
R
END OF CYCLE 8
eq diam ( m)
20/25
15/20
20/2515/20
RH R
R
R
R
EHD OP CYCLE 9
N R
N R
N R
H R
N R Nornaly rejected R re-inserted O C out ot criteria
Diagram 3 Management of eight leaking assemblies identified at the end of cycle 7 (1989)
TRICASTIN 4 CYCLE 08 FIN DE CAMPAGNE LE 31-10-90
Mors Avr Mo Ju n Ju l Août Sep Oct
Diagram 4
the 3 leaky assemblies. Our second criterion DE I 131 <30 mci/t was respected. A slight increase of iodines canbe noticed as a result of the activity contribution ofUO2 deposit from the release of the previous cycle.

«71O
TRICASTIN 4 CYCLE 09 FIN DE CAMPAGNE LE 05-10-91
A•5 ao\ I I I ^1 —————~\\m i 1
^ r«4&rS h2
Diagram 5
by grid/cladding interaction) and an optional secondarydefects occurence (hydriding of the cladding) withpossible DO2 release in the coolant. The secondaryhydriding speed depends on two mains parameters :temperature of the cladding, related to the local linearpower of the rod, and gap closure at the moment of thefirst perforation, related to the rod burnup. As a resultof both activities evolutions analysis in operation andpoolside or Hot Laboratories investigations, we observeda quick evolution when the initial perforation occured inthe first cycle of the rod.In this context, our re-insertion policy always inducedthe rejection of the defects which could release asignificant amount of DO2. We never observed importantevolution in operation, in terms of activity evolution orUO2 release, with re-inserted assembly meeting ourcriteria.
5) STATUS AFTER 10 YEARS OF EXPERIENCE
5.1 - Statistical resultsDiagram 6 gives, at the end of 1991, the total number ofleaking assemblies versus the cycle number of defectsoccurence. It also gives the distribution of thoseassemblies as a result of decisions during the outagefollowing the defects occurence (reloaded - normalyrejected or delayed reloading).
At the following outage, D assembly reached his finalburnup. The Quantitative sipping test results showedstability or a slight increase of the equivalentdiameter. The four assemblies were re-inserted for thesecond time.During cycle 9 the activities remained globaly constantand far below our specified limits (Diagram 5).
4.3 - Compatibility between our policy and Physicalbehaviour of defects in operation
A third way to know the re-inserted defects behaviourcould be the leaky rods examination after each new cycle.But, for units availability reasons, it is impossible toplan the necessary investigations out of the criticalpath of the shutdown period.Nevertheless, the possible scenarios for cladding failureoccurence and evolution, are relatively well known. Theworldwide most frequent one in PWRs, is an initialperforation of the cladding (wear by debris generallylocated under the lower spacer grid - fretting corrosion
end ol 1931Nb ol assemblies
140-|
120-
100 -
80-
60-
40-
20 -
106
1st Cycle 2nd Cycle
& Reloaded
D Delayed Reloading
S Normaly Rejected
74
3rd Cycle 4th Cycle
Cycle of defects occurence
Diagram 6. Leaking assemblies management 900 MWe and 1300 MWe (314 assemblies)

1E+02
1E+01-
1 1E+00-
J
S IE-01
IJEtlB
UW1
Fuel ReliabilityMembers with More than 5 Units
1990 Median Values for PWRs
1E-02,»
|
IE-03.1
£•
1E-04S
r"'T——i—--r" "i -••--)'" T"~i '—rEDF JNO MNP USA VGB EBL KEP UNE
1/nHi RlforHne « 17 M « « 4 « 7UE-M UE-« 4JE-« ia-W SJE-M UE-M 12-W «HJ
U£«l
!WwMwWi
l>2
Diagram 7. WANO performance indicators
Among a total of 200 leaky assemblies to be reloaded, 120of them were immediately re-inserted (60 %). The fuelsaving corresponde to the available energy stored inabout 60 fresh fuel assemblies (more than a batch).
5.2 - Impact on the qct-.ivitv levels in opérationDiagram 8 gives the distribution of the end of cycleactivities for DE j 131 and sum of gases. In ßpite of ourleaking fuel reloading policy which induces a part of themeasured activity, the mean levels remained far from ourspecified limits.Diagram 7 gives the 1990 values of the fuel reliabilityWANO indicator for members with more than 5 units. Inspite of its re-insertion policy, the EDF level is lowerthan most of the others.
% of cycles
SUM OF GASES ACTIVITIES
0900 MWe D1300 MWe
Shutdown whithin48 hours 40 Ci/t
500 1000 2000 3000 4000 mCi/t
% ol cycles
IDE liai ACTIVITES]
0900MWC Ö1300MWC
IShutdown whithin
48 hoursiIiilii
V7~7~7\ V S /~l
10 50 100 500 mCi/t
Diagram 8. End of cycles activities distributions for the 320 completed cycles (end of 1991)(272 cycles 900 MWe and 48 cydes 1300 MWe).
Ol
6) CONCLUSION
After more than 10 years of operating experience with ourre-insertion policy, we can say that in all cases, wereached our main goal : no significant O02 release duringcycles with re-inserted leaking fuel assemblies.
up to now, the scenarios of defects occurence and evolutionwe experimented in operation, are compatible with ourpolicy.But we need more experience to completely confirm itsvalidity, essentially in the field of high burnup and longtimes of residence.

0110
FEATURES OF OPERATING A WER REACTORCORE CONTAINING LEAKING FUEL RODS
V.P. VELYUKHANOV, LM. VORONIN, A.G. IOLTUKHOVSKIJ,A.I. KANATOV, V.K. CHISTYAKOVAResearch Institute for Nuclear Power Plant Operation,Moscow, Russian Federation
AbstractThe paper addresses criteria of performing in-service
inspection of the leaking fuel rods ( FR) of WER-type reactorsincluding assessment of the l imit ing content of iodineradionuclides in the primary circuit.
Experience of operating fuel assemblies, assessment of fuelassembly (FA) reliability indicators and dinamics of the primarycoolant activity change during normal core charging have beensummarized in the paper.
During the whole .period of VVES reactors operation nounplanned reactor shutdown on exceeding the limiting coolantactivity level has been reported. However, there were casesinvolving unscheduled fuel assembly withdrawal on a failuredetected during reactor planned preventive maintenance outage.
Experience of operating reactor core containing leaking fuelassemblies as well as after-burning use of the leaking fuelassemblies is described in the paper.
The paper presents statistics on leaking fuel assemblies forWER-1000 reactors during the whole operation period and dynamicsof the primary coolant activity change during reactor campaign.
A number of examples involving operation of leaking fuelassemblies at the soviet NPPs are considered.
The authors discuss possible causes of cladding leakage,namely, violation of the technical specification ( for example,as to power increase rate ) inhomogeneity of power densitydistribution, overheating of fuel rods as a result of depositson the spacer grid etc.
1. Criteria of FA depressunzation estimate during thereactor operation.
In accordance with "Nuclear Safety Rules for NPPs" only< 0.2% of the fuel elements with the "gas leaks" and < 0.02% ofthe leaking rods with "pellet-water interaction" are permitted.
Here the primary coolant activity should not exceed 1.5 x E-2Ci/kg as to J isotopes. However, the first critical level(current level of the operational safety for VVER type reactors)is significantly lower, i.e. i.O x E-3 Ci/kg. Activity level isdetermined from the cleaning water flowrate of 30 t/h and 20t/h for YVER-1000 and WER-440 respectively. On exceeding the 2ndlevel a unit has to be shut down.
Inspections of fuel integrity ( IFI) for the WER typereactors are performed both in service and after reactorshutdown. In-service IFI are performed by measuring the totaliudine radionuclides activity. Measurement of the coolantisotopic composition is performed on a weekly basis. On reachingthe total iodine isotope activity of 1. E-3 Ci/kg analysis of theisotopic composition has to be performed on the dayly basis.
After reactor shutdown all the withdrawn FA, and on theprimary coolant reaching l.E-3 Ci/kg J activity level all the FAleft for after-burning use, undergo IFI.
For the WER-type reactors IFI are performed using containerwhich is placed into the cooling pond. This method involvesmeasurement of the fission products released from the leakingrods by analysing activity of J-131, Cs-134 and Cs-137 in watersamples, based on the results of activity measurements for all thewithdrawn assemblies analysis of the statistical distribution ofradionuclides. FA are considered leaking if J-131 activity duringIFI exceeds the mean square deviation three times. FA for which J-131 activity in the IFI container amounts to more than 1. E-4Ci/kg are considered failured and have to be withdrawn from thereactor. The rest leaking FA can be kept on operating.
Presently IFI have been performed for 4000 fuel assembliesat 16 VYER-lQOO power units. 119 FA were considered leaking, thatis 0.009% of FR unloaded from the reactor. Two FA were recognizedfailed. Kfost leaking FA were unloaded from WER-1000 reactorsaccording to the schedule.
Activity level m the primary circuit of WER-1000 reactorsis rather low (does not exceed safety operation limits), i.e. inthe range of IKE-6 -3 .x E-4 Ci/kg and is tending to decline.
From WER-440 reactors having oeen operated in theCommonwealth and Eastern Europe countries (32 units) 40000 spent

enu
fuel assemblies have been unloaded. About 0.005 - 0.010% of themare the leaking fuel rods.
Consider the mam causes of fuel leakage, seventy ofpossible leakage and its impact on reactor operation
2. Main causes of the WER reactor fuel leakage.
2.1. Design and process deficiencies of fuel rods andassemblies.
These causes mostly relate to VVER-440 FRs and FAs and tothe first stage of operating this reactor type (1970s). One ofthe mentioned causes of fuel rod cladding cracking duringoperation is zirconium alloy hydrogénation from inside as aresult of fuel pellets high humidity. Nowadays this cause iseliminated as a result of improved technology of fuel production.In some cases cracking cladding was the result offretting-corrosion, caused by defects in spacer grids. Defectswere observed as a result of the wrong mould of a fuel column(fuel pellet insertion with different fuel enrichment). All thesedeficiencies were eliminated and they had not been observedduring WEE-1000 FA operation.
2.2. Latent process defects.
Transition to flow-line automatized production of fuel rodsand assemblies of the type, m principle, has a potential foromnuttmg the latent defects in FR cladding (inclusions, cracks)or weldments. However, experience of WER fuel operation pointsto extremely limited number of FA with such defects.
2.3. Power bursts.
More severe regimes for FR are those, accompanied by powerbursts. Inspite of high plasticity of Zr-IZNb alloy after highfluence (S~xL5% after F=1.E22 N/cm2 ), fuel rods sensitivity totransients of operation is caused by zirconium alloys inclination
to brittle corrosion cracking in the presence of crackingstresses in corrosive medium (in this case it is the products ofuranium dioxide fission - iodine, cesium, tellurium etc.).Without taking special measures, cladding damage may occur incase of singal effect of transient. These may include loopconnection, power restoration after extended operation at reducedpower level.
The danger of such regimes can be illustrated by theexperience of operation of WER-1000 reactor at NovovoronezhNPP, 5 Unit. Thus, in 1985, the reactor power increase after theconnection of an out of service turbine, was done with high speed.As a result of that, cladding internal stresses reached corrosioncracking limit, and fuel rods of four fuel assemblies developedleaks. It can be judged by iodine-131 isotope activity build-upfrom 7.3 x E-8 Ci/kg up to E.3 x E-5 Ci/kg m the primary water.Inspection of one of the leaky FA in protective cells (hot cells)of NIIAR Institute revealed the depressurization of one of thefuel rods. Similar power burst may occur during a loop connectionto the three operatingtoops. As a result, in reactor portion werethe cooler water is supplied reactivity burst involvingshort-time ( 20 sec) increase of power density may occur; itleads to tensile stresses burst. This kind of situation occurredat Kozloduj NPP, Unit 5 (WER - 1000) in 1990, it was followed bythe depressurization of several FA and unplanned reactor shutdowndue to extremely high level of the primary water activity.Repeatable power reductions and increases as a result of thescram system actuation during the first stage of WER-1000reactor unit power raising up to nominal (due todeficiencies m the primary and secondary equipment) may have thesame effect (as well as power bursts) upon fuel roddepressurization. Statistics shows that such events had up to 307.of fuel leakage of reactors of this type in the period from 1980to 1987. Nowadays the situation- has slightly improved.
2. 4. Carbon-containing impurity ingress' into the core.In 1990 during the operation of the 16th fuel load of
VVER-440 reactor (60 effective days) at Kol NPP, Unit 2,

Öl-t».overheating of practically all the fuel assent)!les of the thirdyear of operation was detected. It was caused by coolant flowratedecrease (20-3QZ) in the FA. When this fact was revealed unitpower was reduced up to 90Z N nom. After 90 effective days ofoperation reactor was shut down for refueling. During the 17thcampaign the condition of the mentioned FA has not changed andafter operation during 142 effective days at 90X nominal power,reactor was shut down. IFI of 317 FA after 15-campaign revealed5 leaky fuel assemblies, after IT campaign - 3 leaky FA. During16-17 campaigns specific total primary coolant activity (by thesum of iodine isotopes) fluctuated within the limits of (17-59)E-5 Ci/kg, which is one order of magnitude higher than the coolantactivity level of the Kol NPP's other units. Post-reactorinspections of one of the mentioned fuel assemblies in theNovovoronezh NPP hot cell revealed deposits on the fuel rodsurfaces, having filled the gaps between fuel rods and spacergrids. Maximum amount of deposits with the thickness of up to 1mm, is on the penferal FRs in the zone of spacer grids 1 and 2(from the low part of the fuel bundle) with damages m grids 1, 2and 3. There are through-wall defects in some fuel rods. Chemicaland spectral analysis showed that the composition of depositsincludes carbon, as well as corrosion products of circuits andfuel rods (Fe, Cr, Ni, Co, Mh, Zr etc.), and also carbon and ironare the main elements (by mass). Inspection results allowed tosuggest that the cause"of the mentioned event is the depositionof organic compounds from the coolant into the zones with thehigh flow turbulence (spacer grids). These deposits are the basefor structural materials corrosion products precipitation fromthe coolant flow. The cause of the organic elements appearance inthe VVER-440 primary circuit coolant of the Kol NPP is not clearenough.
2.5. Foreign objects in the core.
During operation of Zaporozhye NPP, unit 4 (VVEFMOOO) inthe fourth fuel charge (.1991) the highest permissible value ofthe outlet water temperature was observed on several FA It wasconsidered to be the result of the flowrate decrease through the
1st loop. After that the reactor power was reduced up to 60% andit had been operated for another 48 effective days. RCPinspection of the loop during the planned preventive maintenanceshowed that thermal barrier damage, resulting in penetration offragments and particulates into the core, occurred ( according toestimate nearly 86 kg of metal was transfered). After powerreduction coolant activity of the primary circuit increased bythe sum of iodine isotopes from (2.0 - 4.7) x E-6 Ci/kg up to(4.8- 7.3)xE-5 Ci/kg. Therefore, depressunzation of severalfuel rods with the gas-leak type defects occurred. This wasconfirmed by further IFI of the 129 fuel assemblies, having ope-rated during the second and the third campaigns. This IFIrevealed 3 leaky FAs in the 1st loop sector. Among all the FA,subjected to IFI, these were not assemblies, having achieved theunload criterion. After flushing in a special test facility andvisual inspection 115 FA, were returned to reactor for furtheroperation. Comparison of water flowrate and pressuredifferential, measured at dummy fuel assembly with the samecharacteristics, served as a criterion of FA flushing. Thecondition of RPS rod cluster was also checked. Easy control rodmovement served as a criterion for of the guide tube cleanness.
Analogous situation ( with RCP vibration and thermal barrierdamage) took place in 1983, at South Ukraine NPP, unit 1 (firstcharge), but m that case there was not FA depressurizationbecause after RCP deficiencies detection the reactor wasoperating for no more than 3 days. After flushing in a specialtest facility FA were loaded into the core to achieve highburn-up. Experience of operating these flushed FA showed that thelevel of flushing was insufficient (or a lot of defects of FRcladdings before flushing), because during further operationneptunium was detected in the coolant (i.e. depressurization,followed by fuel-coolant interaction), and while performing IFI 6leaky FA were found after the first campaign, and 1 and 3 FA -after 2nd and 3rd campaigns respectively. Post-reactorinspections of one of the fuel assembly (1st campaign) in the hotcells at NIIAR Institute revealed deposits on a number of fuelrod surfaces, that contained a lot of carbon. Under the layer ofdeposits pittings were discovered ( as a result of nodular

NPP unit
S. UkraineNPP.i unitKal NPP1 unit
ZaporozhyeNPP.unit 1
FAenrichment
aoaoao
3.3 + 3 04.4 + asao
3.3 + aoas + aoaoao
FA operation prior to depressurization Operation results for a fuel assemblyloaded for the after-burnlnï use
Numberof fuelcycles
1122Z
11111
Burn- upMrtAeU
36 01
13 1623-923.4305
14.213.013.0IS 614.0
Activityin IFIcask.ci/kgE-e
3 0
3 41 33 018 3
0.720 520 540 467 8
Primary cir-cuit acti-vity for J. ICi/keE-B 1
I285
7814514538
9898989898
Numberorfuelcycles
22333
22222
Burn-upMvd/kgU
IB 123 929 930 138 9
25 925 725 727 727 7
Activityin IFIcask.
Ci/ksE-6
17 0*3 21 3*2 2*0 9
0 060 020 040 031 2
Primary cir-cuit acti-vity for J,ci/kgE-B
185
14530030052
5757575757
OlOl
corrosion). The pitting depth was 50Z of the FR claddingthickness. In this case fracture damage of the graphite insertsof one of the RCP bearings was considered to be the possiblecause of the appearance of such deposits.
3. After-burning use of the leaking fuel assemblies.
Significant experience of after-burning use of fuelassemblies with gas leaks has been gamed in the Commonwealth.Thus, at Zaporozhye NPP, South Ukraine NPP and Kal mm NPP withWER-1GGO reactors nearly 20 FA, developing insignificant levelof depressurization (total activity of iodine isotopes during IFIwas (0,5 - 7.0)xE-6 Ci/kg) were used after-burning. Some resultsof operating of FAs, having developed gas leaks, are shown in thetable.
According to the results, FA after gas leak was found, canoperate in a safe way during one more fuel cycle without defectpropagation. It is proved by the fact, that iodme-131 wateractivity m IFI system," measured after final withdrawal of leakyFAs, as a rule , is lower than the activity, measured initially.Besides, during the final withdrawal of FAs, IFI revealed only 3leaking FAs (marked * ) among 10 checked FAs. The cause of this
phenomenon is not clear enough, but it is possible to suggestthat immobolization of a microdefect in the fuel rod cladding isconnected with the deposition of products of uranium dioxidetransmutation or their combinations.
The possibility of FA operation with FR, developingmicrodefects, is also proved by the fact that the dynamics ofchanges of primary coolant activity by the sum of iodine isotopesduring campaigns, when leaky fuel assemblies were operated, has asmooth character and average coolant activity by the sum ofiodine isotopes does not exceed the level of safe unit operation.
4. Conclusions.
1. Fuel operates rather reliably. The cases of FRdepressurization make up for: VVER-440 - 0.005-0.010%
VVER-1000 - 0.005-0.0097..As a rule depressurization has the character of gas leak.2. The mam causes of FA depressurization involve
non-optimum conditions of operation, connected with multipledefects of the primary and secondary equipment and violation ofthe technical specification.
3. The possibility of after-burning use of fuel with microleaks in the fuel rod claddings with the primary circuit wateractivity limitation was revealed.

01O>
EXPERIENCE WITH DEFECT FUEL AT THEKERNKRAFTWERK LEIBSTADT; DETECTION,INSPECTION, HANDLING AND MANAGEMENT
S. LUNDBERGKernkraftwerk Leibstadt AG,Leibstadt, Switzerland
AbstractThe Leibstadt Nuclear Power Station, KKL, in Switzerland, isa General Electric Boiling Water reactor of the BWR/6 typewith an output of 1050 MWe/3138 MWth.The majority of the 648 bundles in the core are GE 8x8barrier bundles. A small number of non barrier 8x8 bundlesreside on the core periphery. Also one reload of ABB SVEA-9610x10 non-liner bundles was loaded in 1991.
KKL has experienced . fuel failures in 4 of the 8 cyclesoperated. These failures were detected by an increase inplant activity. The failures occurring in cycles 2 t 4 weretypical PCI failures caused by overpowers during manoeuvres.The failure were located with partial and full core fluxtilting methods.To minimize handling of leaking bundles these rods have allbeen put together in a so called 'superleaker bundle".
The cycle 5 & 7 barrier clad (GE sponge Zr) failures wereclassified as manufacturing defects due to presence ofincipient cladding flaws not detected by the manufacturingcontrol.The failures showed severe secondary deterioration and causedunusually high activity releases. They were detected by thenormal activity surveillance and finally located by In CoreSipping after shut-down.
All KKL failed fuel rods have been inspected both visuallyand with NOT directly after discharge.
The last two failures required special failed fuel managementduring operation, such as minimizing the number of powermanoeuvrers and avoiding the planned feedwater temperaturereduction. These actions were taken in order to minimize thepower cycling of the failed rods.
The large activity release and Uranium-washout has causedmajor plant maintenance problems during operation and higherthan desired exposures during outages.
Both the failed barrier rods have been put into a bundleskeleton for transport to PIE at The Paul Scherrer institutein Switzerland. Cladding samples will also be sent to the GEValecitos Nuclear Centre, USA, for additional examinations.
1. introduction
The Leibstadt Nuclear Power Station is located on the riverRhine on the German border. It is a General Electric (GE)BWR/6 1050 MWe type plant- The unit is currently operating inits 8th cycle.
A thermal output of 3138 MB is generated by 648 fuel bundles,mainly of the GE7B and GE8B (8x8 barrier) type. Howeverbundles of the types GE6 & GE7 (non barrier) as well as GE10(barrier) and one reload of ABB SVEA-96 10x10 bundles residein the core. These later bundles have no Zr liner while theyhave a thinner rod diameter. They were loaded in 1991. TheGE non barrier bundles are loaded on the core periphery, thusallowing the core to be operated as a barrier core withoutPCIOMRs (Preconditioning Interim Operating ManagementRecommendations).
The initial core loading and the first reload consisted ofGE6 non barrier bundles.KKL however early converted the reload contract to barrierelements with cladding having an inside thin pure sponge Zrlayer. The main reason for this decision was to minimize theproduction losses caused by the PCIOMRs. The PCIOMRrestrictions were not implemented on the barrier bundles.Together with the non barrier introduction the CGCoperational strategy was used.
The KKL plant is operated on an annual cycle basis withrefuelling and maintenance outages in August/September.The operating strategy include the control cell core (CCC)concept, using only predefined control cells for reactivityand power shape control.The cycles are always ended with feedwater temperaturereductions and power coast down.
2. KKL fuel failure power history.
KKL has experienced fuel failures in 4 of the 8 cycles so faroperated. This section will summarize the failed fueloperational histories. Table I summarize some key data forthe failed bundles.
2.1 Cycle 2
The first fuel failure in the KKL core occurred in cycle 2and involved an initial core bundle. It reached an exposureof 17 MWd/kgU.This failure was caused by PCI due to an overpower violatingthe PCIOMRs in connection to a control rod pattern change.

Table I: Failed Fuel Date 01 03 n 07 09 It 13 JS 17 I» Z\ 2] K 27 21 31 JJ 35 3? 39 «1 41 45 47 49 51 S3 55 57 59
Bundle Rod Type Bundle Rod I of E at E at Oper asEnr. Enr. Cycle Fail EOC failed
( w/o ) (MWd/kg) (Days)Cycle 2 :LJN925 Al GE6 2.19 1.30 2 15 17 -100Cycle 4:KL0103 B4 GE6 2.84 3.95 3 '25 22 -120KL0142 C4 GE6 2.84 3.95 3 25 22 -120KL0156 Bl GE6 2.84 2.40 3 25 22 -120Cycle 5:LYE798 D6 GE7B 2.84 3.95 3 26 15 >300Cycle 7:LYH200 El GE8B 3.02 3.00 4 32 28 -140
01
2.2 Cycle 4Towards the end on the full power operation of the fourthcycle presence of new fuel defects in the core wasidentified. During the outage three failed non barrier rods,belonging to the second reload, were found. The exposure ofall these bundles was 25 MWd/kgU.All three failures were probably caused by PCI although thecladding defect of one of the rods resembled a fretting hole.All three bundles containing the three failed rods werelocated in active control cells after having been shuffled tothese locations from peripheral corner locations. Theshuffling history of the failed bundles, shown in figure 1,can very well have contributed to the failures. Theoverpowers according to the GE process computer were very-moderate (0.6-1.0 kW/m). The real overpowers may however beenlarger due to the skewed radial exposure- and consequentradial power- shapes, resulting from their location in thelarge flux-gradients in the peripheral locations the previouscycle. The process computer is unable to track such powerchanges.
2.3 Cycle 5One failed fuel rod was found after cycle 5. This rod was aGE7B barrier rod being in its third cycle of irradiation. Thebundle average exposure at discharge was 25.9 MWD/kgU.The bundle containing the failed rod was located in a controlcell. The shuffling history of the bundle is shown in figure
01 03 « 07 OS 11 13 IS 17 IS 21 23 Î5 27 λ 31 J3 35 37 39 41 43 45 47 49 91 S3 55 57 59
FIG. 1. Cycles 2 and 4 failed bundle shuffling history.
2. It experienced a relatively high power (41 kW/m peak LHGR)during its first cycle, moderate power during the secondcycle (23-26 kw/m peak LHGR) and again higher powers ( 33-36kW/m peak LHGR) during its third cycle of operation. Thenodal power history of the failed rod over its life is shownin figure 3.The slowly increasing off-gas activity over the first part ofcycle 5 showed a dominant diffusion component, indicating theearly stage of a deteriorating of a defect. After a scramrecovery in January 1989 ' the off-gas activity howeverincreased rapidly.(see below) During this scram recovery thefailed rod experienced power increases in the order of 5kW/m. Other sound rods of this bundle however experiencedpower increases in the order of 21-22 kW/m. Also no otherramps experienced during cycle 5 have been large enough toresult in hoop stresses above the PCI limit.[4]

Ol0060585654
50484644424038363432
LYB798 SHUFFLING HISTORY
01 03 05 07 09 11 13 15 17 19 21 23 25 27 29QPQj
DOObdDQCft
DDODDqpoaiDDDIapa
DDTDl
DDl" 3D
ÖD QDDDDQ
ana
LYH200 SHUFFLING HISTORY
01 03 05 07 09 11 13 15 17 19 21 23 25 27 29605856545250484644424038363432
QPQDDdDOi
RG.2.
LHGR <kW/m) Control Rod Density (%)
CR out
100
5 10 15 20 25Rod Exposure (MWD/tU) (Thousands)
—— Rod Average —— Rod Maximum -e- CR Density (%)
FIG. 3. LYE798 power history.
2.4 Cycle 7After cycle 7, one failed barrier rod of the GE8B type waslocalized. The bundle containing this rod was in its fourthcycle and the EOC average exposure was 32 MWD/kgU. Thisbundle showed a similar shuffling history (figure 4) as thecycle 4 failure bundles; i.e. in-out-in shuffling.The increased off-gas activity, identifying presence of fuelfailures in the core, occurred after having pulled the lastfour control rods completely out of the core to an all-rods-out (ARO) state.The maximum power increase during this manoeuvre occurred inthe region of the cladding crack and was about 11 kW/m. Theend power level was however only 27 kw/m. This is the samelevel as the PCI threshold for GE non barrier fuel. ThereforePCI was ruled out as the failure cause.
3. Detection of defect fuel
3.1 Activity measurements and analysisAll defect fuel in the KKL core have been primarily detectedby the routine off-gas- and reactor water- activitysurveillance.

MOIL* aulOOÎtft KtJK*TtKM AlUat*»
lit 1*114
i! l
Total I Activity
01tO
FIG. 4.
The off-gas activity is monitored online in the steam airejection system and the reactor water samples are analysedonce a week (more often after identified presence of defectfuel).The activity data is analysed and plotted versus the decayconstant of some important isotopes in order to determine thetype of release, i.e. equilibrium, diffusion or recoil typeof release. An example of this type of plot is shown infigure 4 for the cycle 4 and the cycle 5 failures.This type of information can, together with plots of theratio I-131/I-133 activity versus the total Iodine activity,be used to determine (approximate) the stage of deteriorationand the size of the defect, figure 5.in addition to time behaviour if the Iodine isotopes thenoble gases, Xe-133, Xe-135, Xe-138, Kr-85m, Kr-87, Kr-88,forming the 'sum of six°, are monitored.
0.1 r
o.o t -
1.000E-03
1.OOOE-04
Port andCrack!
0.5 1 1.5
Activity ratio 1-131/1-133
• Cycle 7 * Cycle 4
RG. 5. Iodine relation.
The behaviour of the monthly average 1-131 activity, over thelife of the reactor, is shown in figure 6 and the behaviourof the noble gases over the cycles containing fuel defect isshown in figure 7a-d.Also other isotopes like for instance the Cs-134 and Cs-137as well as the Np-237 are routinely monitored at KKL. Theratio of the Cs isotopes (137/134) are used as indicators ofthe failed fuel exposures and the presence of Np-237 in thereactor water indicates defects that are in contact with thecooling (wash out of Uranium). The Np-237 activity behaviouris shown in figure 8.3.2 Flux TiltingThe control cells containing defect fuel in cycle 4 weresuccessfully located by a flux tilting exercise performedbefore the end of the cycle.The flux tilting was performed by single rod scrams at areduced reactor power.An example of an activity trace recorded and the resultingresponse map is shown in figures 9a & 9b, [5] .The flux tilting was never employed to locate the cycle 5defect. GE strongly recommended against a flux tilting

nCi/ml
O01
0001
CI C2 C3 C4
C5
-66 -G»
illlllllllBIIIIIIIIIIHItlllllllBllllllllltlllllllllllBIIIIIIIIIIBIIIII II Ijllllll I •Illllilllllllllllllllllllllllllllllllllllllllll
1985 1986 1987 1988 1989 1990 1991
FIG. 6. KKL 1-131 reactor water activity (monthly average 1985-1991).
utilizing single rod scrams due to the risk of furtherdeteriorate the already heavily hydrided cladding. Also thehigh activity background (recoil release) would make ituncertain to find the expected 2-5 defects.No flux tilting was perform after cycle 7 due to the highactivity background. The location of the defects, in the lastwithdrawn control cells, was also known.
(a) Noble gas activity cycle 2 1985/1986
tlCl/MC1.0E*f "
1.0E-01
(b) Noble gas activity cycle 4 1987/1988.nCI/aec
1 OE
1 OE-01
-»- 133Xe -I--a- "«Kr" -*-
(c) Noble gas activity cycle 5 1988/1989.
135XeB7Kr
1MXe
1.0E»06
1.0E»04
1.0E*03
1 OE»02
1 OE-01
1.0E-00
1 OE-01
pCl/eeo
Attg s»pl Okt Hov D*i Jtn F»b M»f Apr M*l ju
-«- 133Xe -I--a- «Kr™ -X-
(d) Noble gas activity cycle 7 1990/1991.MCI/*ec
1 OE*05
138XS17Kr
1 OE»04
1.0E«03
1 OE»02
1 OE*01
Kr FIG 7133Xe
87Kr

l OE-01
106-02
1 OE-03
1 OE-04
10E-05
10E-06
uCI/ml
198S 1886 1987 1988 1889 19BO 1991Detection Limit 2.06-6 uCI/ml
O)
FIG. 8. Activity of No-239 in the reactor water (monthly average 1985-1991).
3.3 Vacuum- and In Core- SippingAfter cycle 2 and 4 a limited vacuum sipping campaigns, basedon the results of the flux tilting were performed. Allexpected failures were found. No barrier bundles were sipped,following GE recommendations.After cycle 5 and 7 a new in core sipping (ICS) equipment,constructed by Siemens-KWO, was used to locate the leakingbundles. This equipment collects water samples from thebundles sipped. Both the cycle 5 as the cycle 7 failure werefound by this ICS technique.As, in cycle 5, more than one failure was expected allbundles that were reloaded for the cycle 6 core were alsovacuum sipped. However no additional leakers were found.After cycle 7 one failed bundle was identified by ICS.
4. Failed Fuel Inspection results
All failed fuel bundles, having been discharged from the KKLcore after each leaker cycle, have been inspected by thevendor.The purpose of these inspections has been to identify thefailed rod(s) in each leaking bundle and to try to find theprimary cause of the failure. This has so far been arequirement from the Swiss nuclear authorities, in order togive a release for startup of the next cycle.
s s
FIG. 9a. Example of cycle 4 flux biting activity traces.
aoDüDoo
-JDDEDDElD«DEEEDEDi"DDQDElDHi- BDD m . __19 D8DOHD]ED15 DDED DD
DDDDlSn[I]DElDD
DDDDDDD2 E 10 14 18 22 26 30 34 36 43 46 50 54 SB
RG. 9b. Cycle 4 flux tilting response map.

o> The inspections has utilized photographic visual inspectionsas well as non destructive (NOT) methods, such as EddyCurrent (EC) Technique and Ultra Sonic Technique (UT) .
Below follows a description of the findings of each KKLfailure. Table II summarizes the inspection observations.
Table II: Summary of Failed Rod Pool Side Examinations
Bundle Rod Failed Inspection ObservationIdentity Cycle
LJN925
KL0103
KL0142
KL0156
LYE798
Al 2 Visual & NOT - 1.27 cm longitudinalcrack at 177.8 cmelevation
- Small cracks at 46and 68.5 cm elevation
B4 4 Visual & NDT - Circumferential crackbelow upper end-plug
-NDT indicatepenetration at 127 cm
- Moderate corrosionVisual - Foreign debris under
first spacer
Visual - Circumferential crackjust above the lowerend-plug
Visual - 4cm longitudinal crackat 127 cm
- 8cm longitudinal crackat 56 cm elevation
- Small crack at 48 cm
Peri
C4
Bl
D6 Visual & NDT - -58cm longitudinalcrack between 38cmand 96 cm elevation
- Width ca 1.5 mm360° circumferentialcrack in heat treatedEnd-plug weld
- Moderate to heavycrud (fluffy)
- Nodular corrosionLYH200 El Visual -60cm longitudinal
crack between 36cmand 96cm elevationHydride Blister at318 cm elevationBoth End-plugsintact
A B C D E F G H
178cm
FIG. 10. Cycle 2 - LJN925/A1.
4.1 Cycle 2 (Reload 2, LJN925 rod Al)
The cycle 2 failure contained one failed rod in the Alposition (control rod corner), figure 10. A 1.5 cmlongitudinal crack, typical to PCI, was found at the 175 cmlevel (from the bottom) of the rod. Additional secondary
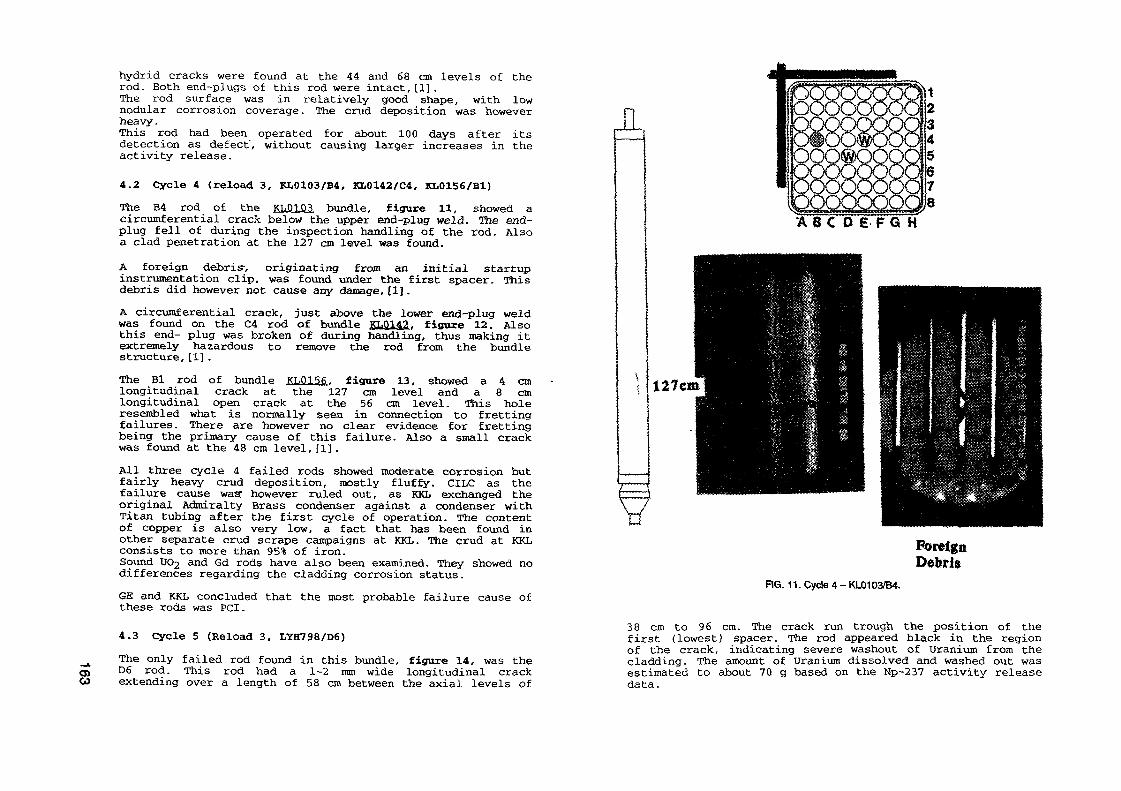
o>GÏ
hydrid cracks were found at the 44 and 68 cm levels of therod. Both end-plugs of this rod were intact,[1].The rod surface was in relatively good shape, with lownodular corrosion coverage. The crud deposition was howeverheavy.This rod had been operated for about 100 days after itsdetection as defect, without causing larger increases in theactivity release.
4.2 Cycle & (reload 3, KL0103/B4, KL0142/C4, KL0156/B1)The B4 rod of the KLQ1Q3. bundle, figure 11, showed acircumferential crack below the upper end-plug weld. The end-plug fell of during the inspection handling of the rod. Alsoa clad penetration at the 127 cm level was found.A foreign debrisy originating from an initial startupinstrumentation clip, was found under the first spacer. Thisdebris did however not cause any damage,[1].A circumferential crack, just above the lower end-plug weldwas found on the C4 rod of bundle KL0142. figure 12. Alsothis end- plug was broken of during handling, thus making itextremely hazardous to remove the rod from the bundlestructure,[1].The Bl rod of bundle KL0156. figure 13, showed a 4 cmlongitudinal crack at the 127 cm level and a 8 cmlongitudinal open crack at the 56 cm level. This holeresembled what is normally seen in connection to frettingfailures. There are however no clear evidence for frettingbeing the primary cause of this failure. Also a small crackwas found at the 48 cm level,[1].All three cycle 4 failed rods showed moderate corrosion butfairly heavy crud deposition, mostly fluffy. CILC as thefailure cause was: however ruled out, as KKL exchanged theoriginal Admiralty Brass condenser against a condenser withTitan tubing after the first cycle of operation. The contentof copper is also very low, a fact that has been found inother separate crud scrape campaigns at KKL. The crud at KKLconsists to more than 95% of iron.Sound UC>2 and Gd rods have also been examined. They showed nodifferences regarding the cladding corrosion status.GE and KKL concluded that the most probable failure cause ofthese rods was PCI.
4.3 Cycle 5 (Reload 3, LÏH798/D6)The only failed rod found in this bundle, figure 14, was theD6 rod. This rod had a 1-2 mm wide longitudinal crackextending over a length of 58 cm between the axial levels of
n
E F G H
ForeignDebris
RG. 11. Cyde 4 - KL0103/B4.
38 cm to 96 cm. The crack run trough the position of thefirst (lowest) spacer. The rod appeared black in the regionof the crack, indicating severe washout of Uranium from thecladding. The amount of Uranium dissolved and washed out wasestimated to about 70 g based on the Np-237 activity releasedata.

o>
11
FIG. 12. Cycle 4 - KL0142/C4. FIG. 13. Cycle 4 - KL0156/B1.

RG. 14. Cyde 5 - LYE798/D6.
' . br?*&» during operation, showed acrack in the heat treated zone of the weldinis zone was heavily hydrided.r°ds in bundle- except the tie rods werefound to sound. The tie rods were„.wlthvisually inspected, [2] .
All rods had a very thin nodular coverage and the cruddeposition was moderate to heavy. Most of. the crud is howeverfluffy. The failure cause was not related to CILCPCI was also ruled out as the failure cause. The reason forthis is that other rods in the bundle had seen much higherpower changes (22 kW/m) than the failed rod <5 kW/m) . Thishas also later been confirmed by an independent review of thefailure by the S.M. Stoller Corporation in New York [4]. TheirPCI analyses showed that the peak hoop stress was below thestress threshold for this type of rods .Instead the cause of the failure was attributed to aincipient manufacturing flaw, not detected by themanufacturing quality control .GE has found that their manufacturing quality control at thetime of the manufacturing of this lot was not optimum. Theyhave however imp roved their manufacturing quality controlsince then.4.4 Cycle 7 (Reload 4, LYH200/K1)The failed El rod of this bundle, figure 15, was found byvisual inspection. Both the upper and the lower end-plugswere intact .The rod showed a 1-2 mm wide and 60 cm longitudinal crack,starting just below the first spacer and extending to justbelow the second spacer. Traces of washed out uranium wasfound around the crack. A secondary hydride blister, probablytrough wall, was also found at the 318 cm elevation of therod, [3] .The longitudinal crack had a remarkable resemblance with thefailed D6 rod in the cycle 5 leaker.Also this failure was caused by an incipie»t manufacturingcladding flaw. The rod was manufactured at the time of thebad quality control at the GE Wilmington fuel manufacturingfacility.
5. Poet-irradiation hanoling 'of failed fuel
The cycle 4 leaker, having the defect lower end-plug, waschosen as a "super leaker" . The failed rods in the other twocycle 4 leakers and the failed cycle 2 rod were removed fromtheir respective mother bundles and placed in differentpositions of the "super leaker". The super leaker bundle thuscreated was then placed in a special closed flask in thespent fuel pool.The failed barrier rods (cycles 5 and 7) could not be movedto the super leaker, as the end plugs of barrier rods do notfit the old GE6 lower tie plate.

O)o>
IL
Blister
E Fô H
FIG. 15. Cyde 7 - LYH20Q/E1.
Instead all the sound rods of the cycle 5 leaker were movedto an empty unirradiated skeleton. The failed rod, that couldnot be removed, was left in the original bundle structure.The tie rods of the original bundle were replaced by inertrods. Additionally, the failed cycle 7 rod was also moved tothe skeleton, thus containing two failed barrier rods.The purpose of creating this "barrier super leaker" was toprepare the two rods for shipment to the Swiss Paul ScherrerInstitute Hot Cell laboratory for non destructive anddestructive examinations.The general policy of KKL is to minimize the handling offailed fuel bundles in the pool in order not to stress theembrittled cladding and risk further activity release. Alsofrom a reprocessing point of view, KKL wants to minimize thenumber of bundles containing failed rods.
6. KKL Failed Fuel Management6.1 Operation with defect fuelWhen the presence of defect fuel in the core during operationis identified the main objective is to mitigate furtherincrease of the activity release and further deterioration ofthe defect cladding.At KKL, attempts to achieve these goals were done by, incycle 5, reducing the number manoeuvres affecting the localpowers in the core. The necessary manoeuvres were performedat a slower rate in order to reduce the ramp rates as much aspossible.The cycle 7 failure was identified just after having pulledto an All Rods Out state (ARO) . The originally plannedfeedwater temperature reduction, increasing the local powerin the lower part of the core, was not performed. Instead thereactor entered the power coast down.During the coast down phase o£ an operating cycle the powerpeaking of the bundles is slowly moved towards the top of thecore, thus lowering the power in the region of the defects.This had a positive, reducing, effect on the activity releaseof both noble gases and 1-131. It most probably also sloweddown the rate of cladding deterioration. An indication ofthis was that both the end-plugs of the failed rod wereintact at EOC.If presence of defect fuel is identified in the core, no loadfollowing is performed. This is in order not to impose anytemperature gradients following a power change and thus to

O>
avoid the pumping of water/steam into the failed rod throughthe defect. Avoiding this water/steam ingress will reduce therate of secondary hydriding of the cladding from the inside.6.2 Administrative activity surveillance guide-linesThe KKL plant has been designed for the possibility ofoperation with failed fuel. The maximum allowable noble gasactivity has been set to 280,000 microCi/s (after 30 minutesdelay) and 700 microCi/s 1-131 activity in the reactor water.The 1-131 source term leads to an equilibrium concentrationin the reactor water of about 0.03 microCi/ml.Although the activity levels experienced at KKL, in primarilycycle 5 and 7, have been well below the allowable limits (10%of the 1-131 limit and 2% of the noble gas limit) , failedrods like those experienced however lead to severe problemswith maintenance of the secondary plant during operation aslarge parts of the condenser offgas system and the turbinesystems will get contaminated.Based on these problems KKL have defined new administrativealarm limits for the activity surveillance.Normally the I-13J. activity is primarily monitored anddifferent alarm limits have been defined based on theseactivities. If, however, Np-239 is found in the reactor watersample analyses the surveillance focus on this isotope. At aspecific Np-activity level a shut down of the plant in orderto localize and remove the defect bundle must be planned. Theperformanceof this outage, at the next alarm limit, also takes the timeto the next planned outage into account, in order to minimizethe total doses to the personal. This follows the ALARAprinciple.The new administrative alarm limits are shown in figure 16.
7. Conclusion and summaryOne of the main .objective when operating a nuclear powerplant is to avoid-fuel failures. One mechanism that have ledto failures is the PCI phenomena. The remedy against PCIfailures was the introduction of the Zircaloy cladding withan inner barrier of pure or alloy Zr. The liner claddingseems to have removed the PCI phenomena as a potentialfailure mechanism.It is however more difficult to prevent fuel failures causedby debris fretting or presence of incipient manufacturingflaws.This can, to some extent be done, by keeping good control ofmetal pieces and wires during the refuelling outage, when thereactor vessel is open.
ADMINISTRATIVE GUIDELINESOPERATION WITH FUEL DEFECTS
DEFECT
WITHOUT WATER CONTACT WITH VWER CONTACT
All-131) > 3.0E-3 A(Np-239 > 1.0E-3 fiCi/nr
All preparations for an outage to locate and remove thedefect fuel has to be done.
A(l-131) - 1.0E-2 A(Np-239) • S.OE-3 |iCi/mt
- Search for a suitable shut down time- Evaluate Cost/Benefit according to ALABA- Shut Down
AO-131) > 3.0E-2 -> Follow Tech.Spec.
FIG. 16.
The frequency of manufacturing induced defects can be kept toan absolute minimum by improving the manufacturing qualitycontrol process as far as possible.The Zr barrier is a remedy against PCI failures as long asthe cladding remains intact. The question wether the Zr linerhave a possible accelerating effect on fuel degradation andactivity release of already defect rods is intensivelydiscussed now days. Via PIE and attempts to analyticallymodel the failure mechanism and especially the mechanism ofthe delayed secondary hydriding and the uranium and lineroxidation processes, answers to this questions are sought. Itis very important, in light of the consequences foroperation, to find those answers.For high power density plants like KKL, operating with largefractions of liner fuel, it is very important to find meansto effectively mitigate the effects of failures in suchcladding, should they occur. One interim answer might beimplementation of "secondary PCIOMRs" for failed barrierfuel.Another area that need more attention is the localization offuel defects in the core during operation by means ofadvanced flux tilting methods and more sophisticatedactivity release analyses methods.When located, the power of a defect bundle can besuppressed by insertion of an adjacent control rod.

O>00All mitigating actions have to be seen in light of the trendsto increase the power densities of the cores, an action thatwill potentially increase the production of volatile fissionproducts and the activity release in case of fuel defects.
References
Unpublished reports
[1] S.Lundberg, KKL Internal Report BET/88/140"Untersuchung von beschädigten Brennelementen Revision88"
[2] S.Lundberg, KKL Internal Report BET/89/334 "Cycle 5 FuelFailure at KKL"
[3] S.Lundberg, KKL Internal Report BET/92/046 "KKL Cycle 7Fuel Failure"
[4] The S.M.Stollèr Corporation, Nwe York, U.S.A, personalcommunication.
Reports
[5] E.Obst, W.Blaser, "Einfluss von Brennelementdefekten aufden Betrieb", (Schweizerische Verienigung für AtomenergiVertiefungsskurs, 6-8 Mai 1991, Brugg-Windisch.
[7] Post Defect Behaviour of Barrier Fuel, J.H.Davis,G.A.Pots, ENS/ANS Meeting in Avignon, France April, 1991
DEBRIS INDUCED FUEL FAILURES ONURANIUM AND MOX FUEL IN BEZNAU I
H. BAYNordostschweizerische Kraftwerke AG,SwitzerlandD. BOULANGER, P. DERAMAIXBelgonucléaire SA,Brussels, BelgiumH. BAIRIOTFEX,Mol, Belgium
AbstractDuring operation of BE2NAU I fron July 1989 until Hay 1990. primary circuitactivity Indicated that several fuel assemblies developed leaks. The core wasconstituted during that cycle of 24 MOX fuel assemblies and 97 U asseablies.Sipping identified five leaking fuel assemblies : one U fuel assembly in itsfirst irradiation cycle, two U assemblies in there second irradiation cycle, oneU fuel assembly in its third irradiation cycle and one MOX fuel assembly in itssecond irradiation cycle.
On site examination during repairs indicated that the failures were caused bydebris Induced fretting resulting subsequently in secondary hydriding failures.
Coolant activity countings taken throughout the period have been compared withthose obtained during preceding cycles where similar types of fuel failures wereidentified on U fuel assemblies only and with the results obtained from cycleswhich did not contain failed fuel assemblies.
The data were analysed to correlate primary and secondary failure for U fuel andMOX fuel.
The fuel failures observed are used to assess the release of activity from afailed MOX fuel rod in comparison to a failed U fuel rod.
1. INTRODUCTION
At the BEZNAU site, located in the north-east of Switzerland,Nordostschweizerische Kraftwerke AG (NOK) operates two 350 MWe pressurizedwater reactors. BEZNAU 1 has been in operation since 1969. The corecontains 121 fuel assemblies of 14 x 14 low parasitic design. Plutoniumrecycling was first started in 1978 with the loading of 4 MOX assembliesdesigned and built by WESTINGHOUSE in the USA. Since 1988 mixed oxide fuelassemblies (MOX assemblies) are loaded on a regular basis [réf. 1) [ F i g . l J .Currently Uranium fuel assemblies are procured from WESTINGHOUSE incollaboration with ABB Atom and MOX fuel assemblies are procured fromCOMMOX in collaboration with UESTINGHOUSE. BEZNAU 1 is currently in its
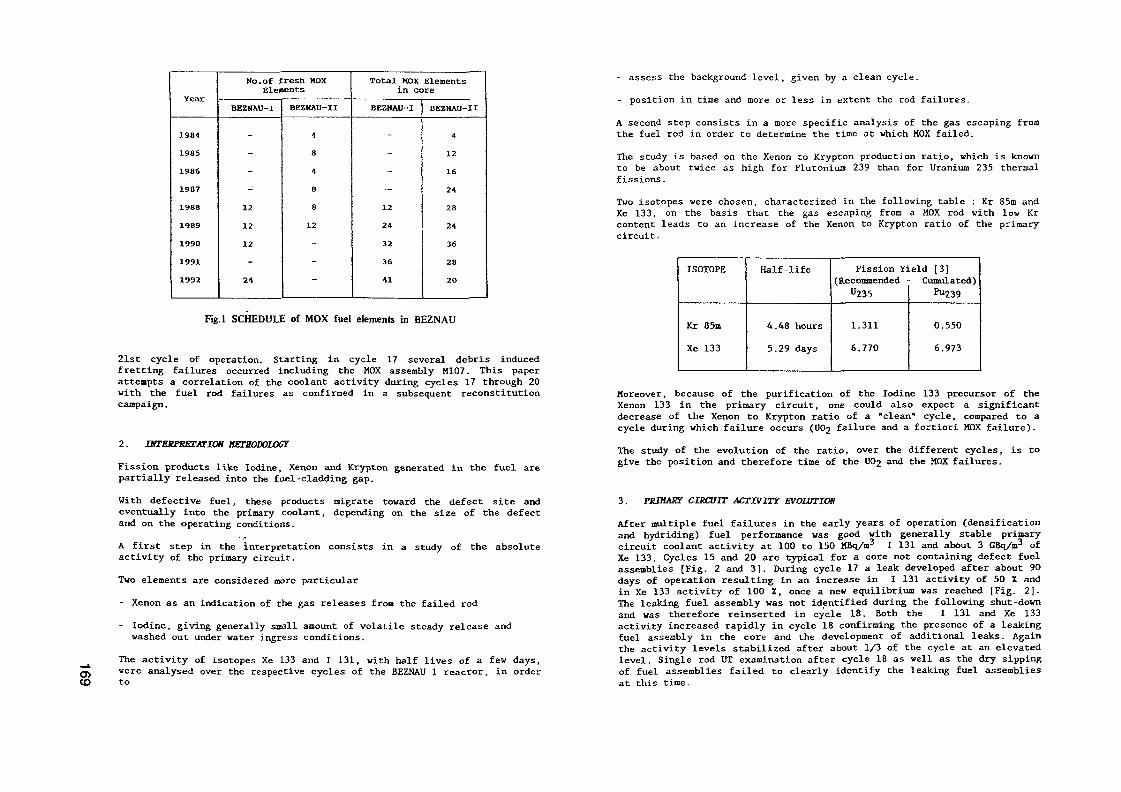
Year
1984198519861987198819891990
19911992
No. of fresh HOXElenents
BEZHAU-I
-
---•121212
-24
BEZHAU-II
1
848812
-
--
Total HOX Elenentsin core
BEZNAU-I
----12
24
32
3641
BEZNAU-II
412
1624282436282O
Fig.l SCHEDULE of MOX fuel elements in BEZNAU
21st cycle of operation. Starting in cycle 17 several debris inducedfretting failures occurred including the MOX assembly M107. This paperattempts a correlation of the coolant activity during cycles 17 through 20with the fuel rod failures as confirmed in a subsequent reconstitutioncampaign.
2. HETHODOLOGT
o>CO
Fission products like Iodine, Xenon and Krypton generated in the fuel arepartially released into the fuel -cladding gap.
With defective fuel, these products migrate toward the defect site andeventually into the primary coolant, depending on the size of the defectand on the operating conditions.
• .»A first step in the Interpretation consists in a study of the absoluteactivity of the primary circuit.
Two elements are considered more particular
- Xenon as an indication of the gas releases from the failed rod- Iodine, giving generally small amount of volatile steady release andwashed out Under water ingress conditions.
The activity of isotopes Xe 133 and I 131, with half lives of a few days,were analysed over the respective cycles of the BEZNAU 1 reactor, in orderto
- assess the background level, given by a clean cycle.
- position in time and more or less in extent the rod failures.A second step consists in a more specific analysis of the gas escaping fromthe fuel rod in order to determine the time at which MOX failed.
The study is based on the Xenon to Krypton production ratio, which is knownto be about twice as high for Plutonium 239 than for Uranium 235 thermalfissions.Two isotopes were chosen, characterized in the following table : Kr 85m andXe 133, on the basis that the gas escaping from a MOX rod with low Krcontent leads to an increase of the Xenon to Krypton ratio of the primarycircuit.
ISOTOPE
Kr 85nXe 133
Half -life
4.48 hours5.29 days
Fission Yi(Recommended -
, «235
1.3116.770
eld [3]Cumulated)Pu239
0.550
6.973
Moreover, because of the purification of the Iodine 133 precursor of theXenon 133 in the primary circuit, one could also expect a significantdecrease of the Xenon to Krypton ratio of a "clean" cycle, compared to acycle during which failure occurs (UC>2 failure and a fortiori HOX failure).The study of the evolution of the ratio, over the different cycles, is togive the position and therefore time of the UC>2 and the MOX failures.
3. PKJHAS3 CIRCUIT -ACTIVITY EVOLUTION
After multiple fuel failures in the early years of operation (densificationand hydriding) fuel performance was good with generally stable primarycircuit coolant activity at 100 to 150 MBq/n3 I 131 and about 3 GBq/m ofXe 133. Cycles 15 and 20 are typical for a core not containing defect fuelassemblies [Fig. 2 and 3]. During cycle 17 a leak developed after about 90days of operation resulting in an increase in I 131 activity of 50 X andin Xe 133 activity of 100 X, once a new equilibrium was reached [Fig. 2]-The leaking fuel assembly was not identified during the following shut-downand was therefore reinserted in cycle 18. Both the I 131 and Xe 133activity increased rapidly in cycle 18 confirming the presence of a leakingfuel assembly in the core and the development of additional leaks. Againthe activity levels stabilized after about 1/3 of the cycle at an elevatedlevel. Single rod UT examination after cycle 18 as well as the dry sippingof fuel assemblies failed to clearly identify the leaking fuel assembliesat this time.

BEZNAU reactor : Cycles 15 - 17 - 18 - 19I 131 isotope activity
20
s «»Ï?M
Time ( days ).15 -+-17 + 18 _«_19
Fig.2
.20
BEZNAU reactor : Cycles 1 5 - 1 7 - 1 8 - 1 9 - 2 0Xe 133 isotope activity
.15Xeroume » K« July
Time (days)17 _^_18 _
Fig.3
.20
The rapid increase of activity in cycle 19 confirmed the presence ofleaking fuel assemblies. Early in cycle 19 the plant was shut-down forsteam generator repair. At this occasion the fuel assemblies were againleak tested with sipping and single rod UT examination. Fuel assembly 2004was identified leaking and removed from the core. It was already suspectedleaking at the previous shut-down but had been reloaded, due to theambiguity of the test results obtained with the two detection methods.
Coolant activity data for cycle 20 confirmed that all leaking fuelassemblies had been removed from the core and I 131 as well as Xe 133activity levels were in line with those for cycle 15.
The start-up of subsequent cycle 19A confirmed, that not all of the leakingfuel assemblies had been removed from the core. The I 131 activitystabilized in that cycle at about 2-3 times the value for a tight corewith distinct bursts of Iodine releases while the Xe 133 activity steadilyincreased 20 times the background value, again with distinct bursts ofactivity at several times during the cycle.
Fuel sipping after the shut-down of cycle 19A identified 5 leaking fuelassemblies (assemblies 1704, 1915, 1926, 2019 and M107). Assembly M107 hadbeen suspected leaking at the previous two shut-down but was reloaded dueto the ambiguity of the test results obtained with the two detectionmethods.
4. POOLSIDE EXAMINATION
In 1990 the six defective fuel assemblies previously identified wererepaired by replacing the defective fuel rods with stainless steel rods[Ref. 2]. Poolside TV inspection of the failed fuel rods established debrisinduced fretting at the first grid as the primary failure mechanist» in fiveof the six cases. The following analysis is limited to these failures. Alsothere were one or more secondary failures visible on each failed fuel rod.Figure 4 shows the debris scars below grid 1 and the hydride blisterbetween grid 4 and 5 of rod A08 of assembly 2019. Figure 5 shows the debrisscars below grid 1 and the hydrided and cracked tubing at the top end plugof rod M12 of the MOX assembly H107. These pictures are representative ofthe failures due to debris fretting.

I
on
<a•*jen
in
Fig 4 FUEL ASSEMBLY 2019, ROD A08
o
.«I-
'O WO
4) g.•o 5
>>a ö
Fig S FUEL ASSEMBLY M107 ROD M12

-vlro5 . HISTOKÏ OF FUEL FAILURE
The following table sums up, for the successive cycles
CYCLE
15
17
18
19
PERIOD
July 1985toJune 1986
July 1987toMay 1988
July 1988toMay 1989
2 weeks inJuly 1989
COSECOHPOSITIOH
121 0 FAS
121 0 FAS
109 0 FAS+12 HOI FAS
97 U FAS124 «OX FAs
FAILED FUEL EVALUATION BYEND OF CYCLE
No leaking fuel rod
1 Xe/Kr burst but no failedfuel asseiblies identified *
0 FA 2004 after 1 irradiationcycle found leaking by rodDT eiamination but not con-fined by sipping :reloaded for cycle 19U FA 1904 after 2 irradiationcycles found suspected bysipping, but not by rod DTexamination :reloaded for cycle 19
HOX FA HO? : after 1 irrad.cycle found suspected bysipping but not by rod DTexamination :reloaded tor cycle 19
U FA 2004 : leaking bysipping and rod DT examin.:removed. Not yet repaired.
Ü FA 1904 : suspected bysipping not by rod UTexamination : reloadedfor cycle 19. A
HOX FA M107 : suspectedby sipping, not by rod OTexamination : reloaded forcycle 19 i
FUEL FAILOIES DEÏELOPHEIT HISTORÏDEDDCTZD FKDI PXIHAÏÏ ÏADIOCHEKISTRYAIALÏSIS FOÎ THE RESPECTIVE CYCLE
Ko leaking fuel rod
A primary failure 90 daysafter BOC
A secondary type failure110 days after BOC
Primary type failuresbetween 150 and 190 days
A secondary type failureafter 10 days
i
CÏŒE
19A
20
21
PERIOD
AttJUSt 1989toHay 1990
July 1990to»ay 1991
July 1991toJune 1992
CORECOIIPQSIÏION
97 B FAS+24 HOI FAS
89 D FASm »x FAS
85 OFAs+36 HOX FAs
FAILED FUEL EÏALUATIOH BYEKD OF CïaE
0 FA 2019 : after 1 cycleD FA 1926 : after 2 cyclesà FA 1915 : after 3 cycles0 FA 1704 : after 3 cyclesfailed by sipping androd OT examination :reeoved, repaired inDecember 1990.
NOX FA H107 : after 2 cyclesfailed by sipping and rodDT examination : reioved,repaired ia Deceiber 1990and reloaded in cycle 21
Ko leaking fuel rod
Cycle not yet finished
FUEL FAILURES DEVELOPMENT HISTORYDEDUCTED FRO» PRIHARÏ RADIOCHEHISTRÏAHALÏSIS FOR THE RESPECTIVE CïaE
3 secondary type failuresdeveloped 40 days, 200 daysand 250 days after BOCrespectively
Secondary type failuresdeveloped between 60 daysand 190 days after BOC
Ho leaking fuel rod
No leaking fuel rod up to UK dateof issue of present paper
• norsally only those fuel asseablies are leak tested which are unloaded definitively fro» the core
- the fuel failure development history as deduced from the primary waterradiochemistry analysis
- the evaluation and decisions made at the end of the respective cycles,based on the on site inspections performed using plant sipping equipmentand rod OT examination system.
The radiochemistry analysis of primary water has allowed to detect the timeof occurrence of the main defects (secondary type defects), and providedthe activity of the water is not too high, the time of occurrence of theprimary type defects.The analysis has also allowed to differentiate when the failure occurs in a.MOX rod versus a uranium rod.
The defects were confirmed at the end of the cycles when high wateractivity has resulted in performing poolside examination (sipping tests androd UT examination).

6 ACTIVITY RELEASES RESULTING FROH U and HOX FUEL HOD FAILURES
Figures 6 and 7 provide the beta and tritium activity evolution duringcycles 15, 17, 18, 19 and 20 For the gamma activities, the representativeexamples of Xe 133, I 131, Cs 137 and Cs 134 are plotted in Figures 238and 9 respectively since they are the main long life contributors to theactivity of the coolant The beta activity provides an illustration on thetotal amount of fission products activity released to the coolant Thetritium is incorporated also, since MOX fuel is known to generate moretritium by ternary fissions than U fuel
Superimposed on the graphs of Figures 10 and 11 are the primary andsecondary failures determined as explained in the previous sections of thispaper
The beta activity of the primary circuit increases slightly (up to a factor2) due to fuel failures, with no influence of the type of fuel that failedThe absence of a clear step increase at each failure is an indication thatthe coolant activity is predominantly affected by fuel released into thecoolant by earlier failures
BEZNAU reactor • Cycles 15 - 17 - 18 - 19 - 20Total Beta activity
o- sça ia* -
200Time (days)
.15 .17 .18 19 .20Zero m« - Irtl Juty
Fig 6
B E Z N A U reactor Cycles 15 - 17 - 18 - 19 - 20Tritium activity
c-i
cr s03 :
^ + •<_i O
100 200 300
Time ( days )_»_ 15 ,- 17 +18 __ 19 „ 20
*
Fig 7
B E Z N A U reactor Cycles 15 - 17 - 18 - 19 - 20Cs 137 isotope activity
Eo*
CO ; < <*i <
200
Time ( days )15
F,g8

BEZNAU reactor : Cycles 1 5 - 1 7 - 1 8 - 1 9 - 2 0Cs 134 isotope activity
erffl
0 100 200 300
Time ( days )- - 15 _»_ 17 -+- 18 _e_ 19 _6_ 20
oc- In* July
Fig.9
BEZNAU reactor : Cycle 18Evolution of Xel33 - 1131 absolute activities and Xel33/Kr85m ratio
SecondaryUO2 failure
step-
E00
20 X
Xel33; - l m July
Time (days),_I131
Fig. 10
Xel33/Kr85m
BEZNAU reactor : Cycles 19/19 AEvolution of Xel33 - 1131 absolute activities and Xel33/Kr85m ratio
Secondary MOXfailure
Xel33Zero time » 1m ]
Time ( days )Xel33/Kr85m
-1 J!
nmo
The typical increases of activity of the long life fission products for aprimary and a secondary failure of both types of fuels is summarized infollowing Table. It shows that the two MOX failures induced an increase ofcoolant activity within the range observed for U failures and even indicatethat, in this particular case, the effects were rather milder for MOXfailures.
Fission productHalf -lifeUnits
Primary failuresU fuelMOX fuel
Secondary failuresU fuelMOX fuel
Xe 1335.3 d
GBq/m3
105
20 (5-50)
15
I 1318 d
MBq/m3
50n d
300(200-500)100
Cs 13730 a
MRj/m3
n dn d
5(n d - 20)
1
Cs 1342.1 a
MBq/B3
n dn d
3(n d - 30)
n d
n d : not detectable(x - x) : range of values observed

The evolution of the tritium activity shows no influence of the failures ofeither U or MOX fuel. It confirms that the main source of tritium in thecoolant is the transmutation of B of the boric acid.
7. COHCVJSIOS
The occurrence of debris induced failures affecting 5 U fuel rods and 2 MOXfuel rods indicated that the failure mechanisms are not affected by thetype of fuel. This can be expected for the primary failures which areinitiated from the water-side, but not necassarily for the secondaryfailures. The latter could indeed be affected by the fuel characteristics(density, in-pile densification rate, gap size, ...) and its propensity tobe oxidized by water.Lag time between primary defect detection and secondary defect occurrenceranges between 200 and 300 days and appears to be similar for both UÛ2 andMOX fuel assemblies.Not only have the failure characteristics found to be the same, but theactivity releases were not worse for MOX failures than for U failures.
ACKNOWLEDGEMENT
The assistance of H.P. MEIER at the BEZNAU plant in collecting thechemistry data is greatly appreciated.
REFEKKHCES
[1] H. Bay, P. Deramaix, A. Charlier,MOX Fuel Reloads in BEZNAU 1IAEA TCM - Recycling of Pu and U in LWR Fuels,Cadarache, 13 to 16 November 1989
"Z. [2] H. Bairiot, H. Bay, P. Deramaix,2 Repair of MOX Fuel Assemblies -Ä A Practical Experience0) IAEA TCM - Poolside Inspection,<Q Repair and Reconstitution of LWR Fuel Elementss~- Lyon,"France - 21 to 24 October 1991
CD" [3] M.E. Meek and B.F. Rider^ Compilation of Fission Products Yields21 Vallecitos Nuclear Center, 1974
CJ1

SPECIFIC EXPERIMENTAL APPROACHES(Session V)
Chairmen
T. OKUBOJapan
J.R. STANBRIDGEUnited Kingdom

CO
MIXED OXIDE FUEL IN DEFECTIVE EXPERIMENTALROD EDITHMOX 1: IRRADIATION RESULTS ANDMETALLOGRAPHIC PIE
D. PARRATDirection des réacteurs nucléaires,Commissariat à l'énergie atomique,Centre d'études nucléaires de Grenoble,GrenobleY. MUSANTEFragéma/Framatome Division Combustible,LyonA. BRISSAUDService Etudes et projets thermiques et nucléaires,VilleurbanneFrance
Abstract
In connection with the normal refuelling ol French Pressurized Woter Reactors withmixed oxide (MOX) fuel assemblies, a comprehensive expérimenta/ programme bos been développée/ byCEA, FKAMATOME and EOF. The objective of the new experimental data yielded by this programme k mevalidation of genera/ design of MOX rod, leading to improve its performance.
An important point of this study is the behaviour of a defective MOX rod under irradiation, andespecially the release rate of feston products. In Fronce, a reactor cannot be in operation when primarycoofonf activity is beyond given thresholds, and necessitates on increase of surveillance when cladding defectsoccur. So it was necessary to verify that present odivify ferits, set up with UC>2 fuel, could be transposedwithout (or with minor) adjustments to MOX fuel.
In order to answer this question, on experimental defective MOX fuel rod, named EDITHMOX 01,has been recently irradiated in.-'me JET POMPE irrodiotion loop in the SHOE research reactor of the CEA'sNuclear Research Center in Grenoble.
The experiment hod two aims:
* determination of the expérimental release rate of fesion product from mixed oxide in a defective eorfy inlife rod. The dadding kalt, located in front ol the fuel pellets, hod a high hydraulic conductance. The rod wasirradiated at several steady-state power levels, similar to those found in normal operation of a PWR.
" Comparison ol these results with those obtained in the case of uranium oxide in the EDITH, CYFON andCRUSIFON programmes.
The power tevefe conducted were in the region of 8, 15, 20 and 27 kW/m. Fission product releasewas measured by on-line gamma spectrometry and water samp/ing.
After irradiation, examinations were conducted to know the behaviour ol the rod:
* Non destructive tests to appraise possible external changes and measure me internal fission productsdistribution.
* Destructive tests to know the mixed oxide fuel's evolution under water conditions, essentially by means ofmetofograpbic sections and microstructure study.
The results of this experiment show a release rote of fission products comparable to thoseobtained with uranium oxide. Metallographie analyses show on appreciable evolution of microstructure, withfission gas precipitation bubbles, due to luel oxidation under water vapor conditions.
However, to cover the entire range of MOX fuel operating conditions in PWR's, these resultsshould be validated lor higher bum-up levels.
1. INTRODUCTION:
Since 1987, several French Pressurised Water Reactors are partiallyloaded with MOX (mixed oxide (UPu)C>2) fuel assemblies. At the end of 1991 in France,216 MOX assemblies have been irradiated or were in irradiation.
The validation of general designs of MOX rod is made by means of acomprehensive experimental programme developped by CEA, FRAMATOME and EOF. Thisstudy includes post-irradiation examinations on irradiated rods in power reactors (during 1,2 or 3 cycles), and analytical experiments in research reactors on short instrumented rods.
An important point of this programme is the behaviour of a defective MOXrod under irradiation, especially the release rate of fission products out of the pellet stack,and the behaviour of mixed oxide under water and vapor conditions. These data controlthe activity level observed in the primary coolant and its future evolution during the cyde atsteady power levels and during transients.
Under normal operating conditions of a PWR the appearance of failures onfuel rod dads provoke the plant operator to realise a special surveillance of the primarycoolant activity by means of gamma spectrometry. As regards the French PWR park, thefrequency of such measurements is determined by operating technical specifications. Itranges from one measurement per week in the absence of failure to one or twomeasurements per day beyond a given activity threshold [1]. This strategy aims atcomplying with the primary activity limits provoking the reactor shutdown. So it wasnecessary to verify that present activity limits, set up with UÛ2 fuel, could be transposedwithout (or with minor) adjustments to MOX fuel.

rt 2. DESCRIPTION OF THE EDITHMOX 1 EXPERIMENT:ooOIn order to answer this question, an experimental defective MOX fuel rod ,
named EDITHMOX 1, has been recently irradiated in the JET POMPE irradiation loop inthe SILOE research reactor at the CEA's Nuclear Research Center of Grenoble
The aim of this experiment is to obtain tfie following informations
• determination of the fission product release rate from the oxide by means of amixed oxide fresh fuel rod exhibiting a defect wiifi high hydraulic conductance atthe fuel stack, and irradiated at different steady-state reactor power levels ,
• comparison of these results with those already obtained for uranium oxide in thecorresponding experiments of the EDITH, CYFON and CRUSIFON programmes atŒA/DRN/DTP [2] and with those published elsewhere [3].
3. DESCRIPTION OF THE EDITHMOX FUEL ROD (SEE FIGURE 1) :
The clad of the rod is of the Zircaloy-4, standard 17x17 design currentlyused in PWRs The fuel stack has a length dose to 340 mm and comprises 27 mixedoxide pellets whose plutonium content is 7 1% There are a further two 5,1% enricheduranium oxide pellets located at the bottom end of the rod, which are used as a referenceduring gamma scanning Finally, an alumina pellet at each end of the pellet stack allowsreproduction of the thermal effects normally observed at these locations in power reactor
The cladding defect is a cylindrical hole 0 3 mm in diameter The hole isdrilled before rod loading and is located close to the core mid-plane and approximately atthe mid-height of a mixed oxide pellet
4. EXPERIMENTAL IRRADIATION FACILITIES :
Irradiation took place in the JET POMPE test loop of the SILOE reactor (seefigure 2) The thermodydraulic conditions of the irradiated section are close to those in aPWR reactor (water flow rate around rod 3 5 m/s, pressure 130 bar, temperature280°C held steady irrespective of power level by a regulated electrical heater)
A bypass line routes the water from the test facility to the CEA/DRN FissionProduct Analysis Laboratory, where its activity is continuously measured by on-line gammaspectrometry and by sampling on a regular basis
Figure 1
Plenum with spring
AI2O3 pellet
27 (U Pu) 02 pellets withPu/(U+Pu) = 8 0%density = 94% d th
leak 0 0 3 mm
-"— R E P 17*17 standard clad
2UO2 5 1% pellet
AI2 03 pellet
END plug
The EDITHMOX 1 fuel rod
The analysed water is purified and gas-stnpped, then routed again to thetest loop The correct operation of the purification process is regularly checked bysampling
The absence of any change in fuel rod mechanical behaviour is alsoperiodically checked by alpha spectrometry on water samples taken on a regular basis
5. PERFORMANCE OF THE EXPERIMENT - MAIN FINDINGS :
The rod was irradiated during three cycles of the Siloe reactor from May toAugust 1989, at steady-state power levels between 8 and 27 kW m ' (see figure 3)
At the first power level (8 kW m '), fission gas and iodine release wasstudied with the fuel-cladding gap filled with water The power level was held at 25kW m ' at the beginning and end of irradiation to check release rates in the event of ma|or

REACTOR POOL REACTOR HALLFISSION PRODUCTS
1A
delayedne utronsdetection
_. —— — _
f ^\
®
DODT
Ul13LL
faY\Y1
'
/
r—
-
— I*~ i on-line
Pu purification
filters
ao
-4^_ ^_ _ .-,
OM
en0
1 ——
19n h
re
L
sin
,
s ?5<
I$
/
^*—
r
water supply tank
r u
spectromotry——— —————
! ,
cooler
iH —— il iepurallbn pp
stage», samples
LINEAR POWER DENSITY (kW/m)
30 — — ——
26.0
CYCLE 1 CYCLE 2 CYCLE 30 10 20 0 10 0 10 20
TIME (days)
T Texaminations I * longitudinal * neutron radiography
between cycles | gamma scanning * longlt. and transv.'— gamma scannings
Rgure 3 : Time History of irradiation
Figure 2 JET POMPE irradiation loop
00
fuel densification. The 17 kW.nr1 power level was chosen because it is close to theunstable two-phase regime in the gap.
Each power hold lasted about 10 days.
A longitudinal gamma scanning examination was conducted at the end ofthe first cycle : no abnormal pattern was observed in fission product distribution and thelinear power value supplied by neutron dosimetry was adjusted.
Since the excellent operation and the design of the test facility allowlaboratory sampling after routing of the water at loop pressure and temperature, it ispossible to dosely monitor the emission of airborne or gaseous fission products from the rodup to a radioactive half-life of about 30 seconds.
Based on the specific activities measured in the bypass line fluid, calculationis made for each radionuclide of the release rate R/B defined below :
Number of atoms emitted per second________ ________Number of atoms generated per second at radioactive equilibrium
The plot of release rates versus half-lives for each fission product is a straightline whose level and slope yield information on the mechanisms controlling release from theoxide and migration through the fuel/dadding gap.
An exemple of the EDiTHMOX 1 findings is shown in figure 4.
Given the considerable hydraulic conductance of the cladding defect, thetransit times through the gap are short and the R/B measurements are representative ofrelease rates from mixed oxide, at least for gaseous fission products. For iodine, an in-gappartial retention and trapping mechanism is visible on the plots : iodine is released duringthe rod depressurisation-cooling sequence at the end of the cycle.
The mixed oxide release rate values versus rod linear power given by theEDITHMOX 1 experiment are plotted for 133Xe, 85mKr, 131I and 133I in figures 5 and 6.They are clearly compatible with the "Recommended Values" established for uranium oxideon completion of the EDITH, CYFON and CRUSIFON programmes [2].

00IVD
1,OOE+00
1,OOE-01
1,OOE-02
R/B
1,OOE-03
1,OOE-0«
1,OOE-05
2
h*
Kr
4
***
July
4s
N
1989 -
. —— 1
• 13 h
M-
IK
48
IÛBI
I " *
- I.. —
/
?
--
*;L
-J 1 !
--,
S ~ "
' ——
1
i ——-II5 '
= 205 1
' ' i _
'/<
g• s
M
-
1,OOE-07 1,OOE-06 1,OOE-05 l.OOE-04 1,OOE-03 1, ODE-02 1, OOE-01
LAMBDA (5-1)
• on-line gamma spectrometryA manual sample
Rgure 4 Example of FP release rate obtained during irradiation
6. METALLOGRAPHIC POST IRRADIATION EXAMINATIONS :
After irradiation, several examinations have been performed on the rod.
* Non Destructive Examinations : visual and photographic inspection, Eddy Currentand Metrology, and longitudinal gamma scanning.
* Destructive Examinations : two sections in the MOX pellets stack have beenperformed :
- one at »he level of the defect (mid - height of pellet 22) : cut Number a,- one at the bottom of the stack (mid - height of pellet 4) : cut Number b,
with the following examinations : metallographic analysis, alpha and (beta-gamma)radiography, section gamma scanning.
1. OOE+00
1 OOE-01
R/B l OOE-02
1. OOE-03
1. OOE-04
rRECOHHENDED VALUES FOR U02
Xe 133
85»
0 5 10 15 20 25 30 35
• on-line gamma spectrometry LINEAR POWER DENSITY I KH/m)A. manual sample
Figure 5 : Release rate of gaseous FP versos linear power
STEADY STATE KITHOUT BURSTS1, OOEtOO
1. OOE-01
R/B 1. OOE-02
1. OOE-03
i OOE-04
0 5
• on-line gaira spectiwtry
A manual sample
Figure 6
recoiKnded value» for U02 (noble gases of sa»e Dtriod 1
10 15 20 25 30 35 40
LINEAR POHER DENSITY (KH/m)cfA/om/orp/SKC
Release rate of halogens versus linear power

figure 7 Metallographie section at the level of the defect Metallographie section at the bottom of the MOX stack
GO
The most interessant results or* issued of the metaliogrophic sections thesecuts (see figure 7 and 8), and especially ihe cut Number a, show non-uniformity ofmicrostructure, with gas bubbles precipitation of grain boundaries, and gram growth at thecenter of the pellet This evolution corresponds with a strong oxidation of the mixed oxidedue to water vapor conditions These remarks are not usually observable on an early-in-lifeUO2 pellet
7. CONCLUSIONS :
The successful performance of the EDfTHMOX 1 experiment yielded valuesrepresentative of gaseous and airborne fission product release rates from a mixed oxidefresh fuel stack under steady-state conditions, for power levels encountered m PWR

00operation. These values are comparable with the findings of the uranium oxide experimentsand fully compatible with the "Recommended Values" established for this type of fuel.
Metallographie examinations show an appreciable evolution ofmicrostrudure, with gas precipitation bubbles, due to fuel oxidation under water vaporconditions.
However, to cover the entire range of MOX fuel operating conditions inPWRs, these results should be validated for higher burn-up levels.
REFERENCES
[1] P. BOURNAYManagement of failed fuel during operation : French policy and experience.IAEA Technical Committee Meeting on Fuel Failure in Normal Operation of WaterReactors ;Dimitrovgrad, 26-29 May 92.
[2] H. SEVEON, C. LEUTHROT, P. CHENEBAULT, R. WARLOP, J.P. STORA.Release of Fission Products by Defective Pressurised Water Reactor Fuel -International Meeting on Nuclear Reactor Safety,Karlsruhe, 10-13 septembre 1984.
[3] E. SCHUSTER, F. GARZAROLLI, K.H. NEEB, H. STEHLE.Release of Fission Products from Defective Fuels Rods of Light Water Reactors.AIEA Specialist' Meeting, Chalk River, Septembre 1979.
STUDIES IN THE R2 TEST REACTOR OFSECONDARY DAMAGE FORMATION INLWR FUEL RODS WITH SIMULATED DEFECTS
H. MOGARD, M. GROUNES, H. TOMANI, G. LYSELLStudsvik Nuclear AB,Nyköping, Sweden
AbstractFretting type failures are pre-dominant causes of the very fewfuel failures that have occurred in recent years in LWRs. Theseprimary failures are sometimes followed by secondary failureswhich frequently cause considerably larger activity releases. Insuch cases the subsequent degradation of the defect fuel rods byinternal hydriding of the cladding and by oxidation of the fuelare the common destructive mechanisms.STUDSVIK NUCLEAR has introduceed an irradiation test scheme,adapted to the experimental conditions in the R2 test reactor,which offers the possibility of executing comparative investi-gations of the process of degradation of commercial types of LWRfuel under simulated primary defect conditions as well as of themechanisms involved. In the new type of test the primary defectis simulated by a special device on top of the fuel rodlet con-taining an enclosed small reservoir of liquid water in such amanner that only water in the form of steam will communicate withthe plenum volume and the interior of the rodlet.Data from the first exploratory test are presented and show thatthe test method gives relevant data. A second experiment, now inprogress, is described. A proposed third series of experimentswill constitute an International Fuel R&D Project, the DefectFuel Degradation Experiment (DEFEX). The objectives and extentof the proposed project are described.
1.
1.1.BACKGROUND INFORMATION
INTRODUCTION
The operational reliability of LWR Fuel is currently less thandesired [1]. Expressed in relative numbers the failure rate isvery small, of the order of 10 in a million fuel rods. However,considering the economical consequences of the failures encoun-tered the reliability is unsatisfactory [2].The causes of the fuel failures in LWRs vary. Fretting typefailures are predominant, in particular those caused by varioustypes of loose objects, debris, accidentally appearing in theprimary coolant system. However, irrespective of the causes ofthe primary failures, these are sometimes followed by a secondaryfailure which can cause considerably larger activity releases

than the original primary failure. In such cases the subsequentdegradation of the defect fuel rods by internal hydriding of thecladding seems to be a common destructive mechanism. The hydri-ding leads to the formation of secondary failure, which typicallygives rise to a steadily increasing release of radioactivity tothe coolant. Occasionally fuel pellets are eroded and fuel par-ticles which are spread in the primary water coolant system maypersist for years as radioactive sources.The secondary damage phenomenon is an important current fuelbehavior problem and appears to be strongly dependent on the fueldesign. Obviously, the ambitions of the nuclear industry are totake preventive measures against these failure occurrences. Abetter understanding of the mechanisms behind the fuel degrada-tion process is called for in view of the fact that a variety offuel designs are now being implemented. These designs might eachreact differently to the intrusion of water. Only a better know-ledge of the degradation mechanisms can help us find the miti-gating means required to minimize the consequences of a primaryfailure event.The secondary damage formation phenomena and the underlyingprocesses have been described in detail in a recent STUDSVIKNUCLEAR study, commissioned by the Swedish Nuclear Power In-spectorate (SKI) [3].1.2. SWEDISH FUEL FAILURE EXPERIENCE
00Ol
A number of fuel failures have occurred during the last fewyears in Swedish BWRs. Most of these fuel failures (60 %) havebeen identified as being caused by fretting debris [1]. Thesequence of the fuel rod degradation stages, as observed vi-sually, is schematically illustrated in Figure I and seems tofollow the classical route of degradation as summarized byPickman [3] .In some recent cases the fuel burnup level of the failed fuelrods was moderate, about 10 000 MWd/tU, which means that thepellet/cladding gap was still not fully closed. Three differentstages of degradation can be distinguished (Figure 1 ). At stage1 the fretting object penetrates the clad wall, coolant waterflows into the open fuel rod volume and a fission product spikefollows. After some time of continued power operation (stage 2)internal hydriding is initiated, and a secondary defect developsat some distance (0.3-0.4 m) away from the primary defect. How-ever, the new defect is not being associated with any noticeablespike release of fission products. On continued power operation(stage 3), the internal hydriding continues at various spots inthe lower section of the fuel rod, again at some distance awayfrom the latest formed defect, until another penetrating defectdevelops. In the meantime the first formed secondary clad defecttends to open up as a result of local fuel pellet swelling. Thiscauses the cladding to split up in the longitudinal direction,thereby exposing the U02 pellets to the eroding effect of thecoolant water.
FP »i
H,0 («
~TTT
;'• •
T
1
1
1
Œ3;
—-• H,O(g)
FP x_ Primary
defect
FP \
»,0 (9)
^
il
v/
*t
=
— SecoooaryI(H r«)ebt,:
FF
detect
>*•)
Stage 1 Stage 2Inllux ol water Sonant systemSmall FP leakage Secondary detect lormatron
I
J -i•j—— CU
L f ?CUdding l
Stage 3Stagnsm sysie-TiSeccxxiBry detect to
Urge FP ieaXaee Largw FP leakageUO. ef3so.i
Observed secondary defect development.
A spectacular exception to this slowly progressing fuel rod de-gradation was seen in the failure event at the Oskarshamn 3 BWRa couple of years ago, when a single zirconium liner fuel rodfailed under a large release of radioactivity and split upaxially along almost its entire length [4], A similar failureevent has later been reported from the BWR Leibstadt unit inSwitzerland [5]. In this case, an exceptionally large releaseof radioactivity was also noted. In both these cases it was sta-ted that the operational mode during the degradation process wasunfavorable to the defect fuel. In fact, other failure eventswith Zr liner fuel have resulted in only limited release ratesquite similar to non-liner fuel failures [5]. In the autumn of1991 extensive secondary defects were observed in the Wolf CreekPWR in the U.S. Such defects were found in 40 fuel rods in 3 fuelbundles [6].The repeated failure incidents in the Swedish BWRs prompted theSwedish nuclear industry to look for plausible failure mechanismsand remedial measures. Various means to minimize the consequencesof continued operation of defect fuel, especially in the case ofinternal hydriding, have in the meantime been introduced by ABBAtom e. g, 1) by lowering the linear heat rating through a shiftto significantly smaller diameter rods as in the 10x10 fuel rodconfiguration and 2) by making- the zirconium liner material morecorrosion resistant [4].1.3. THE MECHANISM OF CLAD INTERNAL HYDRIDING
The mechanism of clad internal hydriding in BWR type fuel hasbeen theoretically evaluated by Davies [7]. According to hiswork the hydride formation is initiated when the water vapor,

00o>
001
ÏUTAI
INITIAL O/U 2.000 »ROD LINEAR POWER 3$OW/cro \INITIAL STEAM ADMITTED. 2 GRAMS tHZ PICKUP FRACTION 0.25 l
2 < 6 8 1010 CORROSION FILM THICKNESS (pm)
Immediateconsequences
•AID
«GAP
Chemical reactions m a stagnant system
i H.O.Z'- H, . MiZfj .ZrOt
t »fi . uQf — M, . UO, ,
J ? Hp (Rid.OtyS.Sj -. MjQj . M,
* H,0, * UO, -> H, - UO, ,
Thjï oiYQ*" -i COfiiumrtcO'H.nuously wn u poouced M
no«.»noO(H»ia*-iaita)
^. [i/3K)i/iO) il
, Criterion for hydride formation, P„,c/P«. < 001 - 01
Figure 3
Secondary damage formation mechanism.
2. OUTLINE OF THE STUDSVIK FUEL TEST SCHEMEDevelopment of H,O and H_ pressures in a defectedfuel rod after navies [7J.
reacting with Zircaloy in a stagnant heated system, decreasesin partial pressure to such a low value that the ratio of thepartial pressures of water vapor and hydrogen produced by cor-rosion, PH9o/p decreases the range of about 0.01-0.10(Figure 277 The critical conditions thus defined represent a kindof "oxygen starvation" situation within the closed system. Also,another critical condition should be fulfilled, i. e. the partialpressure of hydrogen P „ should simultaneously exceed about 10-20mm Hg, Figure 3.Operational experience indicates that the rate of internal hy-driding in a Zircaloy clad fuel rod decreases at lower heatrating. This is in line with the expectation that the rate ofoxidation of the UO- ( to form UO2 ) as well as the radiolysisof the water decrease with lower fuel temperature. However,according to recent information, a long term exposure over threereactor cycles of a defect PWR fuel rod at such a low heat ratingas 10 kW/m resulted in fuel oxidation and internal hydriding [8],In that case Zrl%Nb cladding was used.
The outline of the new test technique differs on essential pointsfrom previous irradiation test schemes adopted for checking thepotential degradation of intentionally defected test fuel. Anappropriate revised test scheme, to be used at the R2 test reac-tor, has to fulfil certain experimental constraints i. e.1 the length of the test fuel rodlets should not exceed
the active core height (600 mm) of the R2 test reactor.2 the release of fission products and fuel material from
the defect fuel must be minimized in order that thecontamination of the in-pile water loop circuit betolerable.
Both these requirements can be met with the unique but simpletest technique adopted. Instead of an artificial primary defect(drilled hole etc) the primary defect is now simulated by aspecial device at the top end of the fuel rodlet [9]. This devicecontains an enclosed small reservoir of liquid water in the "ex-tension plenum", (Figure 4). This extra plenum is connected withthe normal plenum volume of the rodlet through a tiny tube (the"steam snorkel") in such a manner that only water in the form ofsteam will communicate with the plenum volume and the intercon-nected void space of the interior of the rodlet. Heat is trans-ferred to the enclosed water reservoir from the surrounding

"SUAf, SNORXEf
WATER RESERVOIR
Primary deled
p 31 «illui öl H O-°
p».P. o
"—Fuel length •
~~--, / < 0 0 1 - 0 1
____f\——————*• Hydnde formai*
IIKSULATION PELLLETI
Array Simulating Primary Defects in Fuel Rods.(Patent pending).
Primary deled
*' PCMI ' " x -'~~-*'
s ^\ '--"' " ^'/\ /"
f' \
_.,--"' x ,-' <oo i oi
uk,.— t\— — FueNeno;.i ——
it < AL '"" " !
00-g
pressurized loop water at the start of the operation until thepressure and temperature of the whole system are in balance,simulating either BWR or PWR operating conditions.An important experimental feature of this arrangement is thepossibility of post-irradiation puncture and subsequent collec-tion of released fission gases and hydrogen from the closedsystem of the individual rodlets being irradiation tested.A test fuel rodlet is subjected to a modestly peaked axial powerprofile and the linear heat generation rate (LHGR) is maintainedconstant during the test period (one reactor cycle of about 16days). The LHGR is kept sufficiently high to effectively closethe fuel pellet/clad gap over the power peaked length section ofthe fuel rodlet, see Figure 5. The simulated single defect islocated in the top plenum region where the steam is let in. Bythis arrangement the diffusional migration of R_0 and H_ in theaxial direction will be constrained to such an extent tKat axialconcentration gradients and partial pressure gradients can buildup and be maintained at a steady LHGR level until the termination
Partial pressures at flat power profile (top) andpeaked power profile (bottom).
of the test period. Hydriding is consequently expected to beinitiated and to progress in the lower part of the fuel rodlet.In addition to the two experimental constraints mentioned, it isconsidered desirable to reach hydriding conditions during one R2operational cycle (lasting 400 hrs) in the majority of tests,both from an economic point of view and in order to maintainwell-defined and undisturbed test conditions. Interrupted ex-posures or wider power variations downwards mean that waterrepeatedly enters all along thé fuel length and eliminates thedynamic gas equilibrium conditions established during the steadyoperating power period and also interferes with the on-goingchemical reactions in the system. However, in some cases, wherehydriding has not initiated or is slow, it has been proposed thata few 2-cycle, or even 3-cycle irradiations might provide addi-tional interesting data.

0000During the steady exposure the water tends to oxidize not onlythe inner surface of the cladding but also the U0_ fuel pellets,which, as a result, tend to attain higher temperatures and swell.The thermal conductivity of the filler gas will, of course, alsobe affected. The rate of the thermal expansion and swelling isrecorded by an on-line elongation extensometer, and the change inpellet-clad mechanical interaction can be followed by the use ofthe STUDSVIK power noise measuring technique during the exposuretime [10].
3. EXPLORATORY TESTING OF PROMOTED/SUPPRESSEDHYDRIDING
3.1. DEFECT FUEL EXPERIMENT NO. 1
The feasibility of creating internal hydriding conditions in thelower part of the fuel rodlet in the manner described was theprimary objective of the first part of the irradiation testdevelopment. Another aim was to check if the reversed conditionscould be created, i.e. to suppress hydriding, assuming that theprimary objective was fulfilled.For the first exploratory tests, financed by Swedish organiza-tions, two unirradiated fuel rodlets of the 8x8 BWR type wereavailable. However, they were not identical in details. One fuelrodlet was of the standard type and was originally manufacturedfor the past INTER-RAMP Project [11] (0.15 mm gap, L/D=1.1,dished pellets, no chamfer, density 10.17). The other rodlet(0.20 mm gap, L/D=1.1, dishing, slight chamfer, density 10.41)was provided with a "rifled" cladding [12] which is characterizedby a large number (e.g. 40) of axially extending grooves of 10-15microns peak depth in the interspace between the fuel pelletcolumn and the multifaceted prismatic bore of the cladding duringoperation.Both rodlets were subjected to a steady LHGR of 45 kW/m for thefull duration of an R2 operational cycle (16 days). The axial rodpower profile form factor (peak value to mean value) was close to1.2. The intention was to operate under mechanically closedpellet-to-clad conditions, at least over the mid part of the fuelrodlets. The rifled clad fuel rodlet, however, retains its cladgrooves open for axial gas migration even under mechanicallyclosed gap conditions. The aim was to check if the availabilityof some unrestrained migration ofsuppress the onset of hydriding.
and H2 would suffice to
The experimental results so far show that both aims were suc-cessfully reached. However, about midway during the first testcycle a reactor scram occurred which to some extent disturbed theinterpretation of the test results. Therefore, for the purpose ofcomparison, a simulated scram was imposed at about the same pointin time during the irradiation of the second rodlet.
II 1) 11
On-line elongation measurements, rod 1117(standard cladding).
The fuel rod elongation measurements indicated approximately thesame length change behavior for both rodlets during the constant -power stage of the irradiation cycle. As expected an initial cladcontraction was recorded in both cases, which was, however, ofmuch shorter duration for the rifled clad fuel rodlet. What wasnot expected was the temporary reversal of the contraction aftersome 3 hours holding of the standard rodlet; see Figure 6. It hasnot yet been established whether this reflects e.g. a pellethang-up or the onset of a major local hydriding.Subsequent to the clad contraction period an immediate and sub-stantial clad elongation commenced which then slowed down gra-dually during the constant power stage. Evidently an ongoingexpansion of the fuel pellet column is reflected, indicatingalso a persistent hard mechanical pellet/clad interaction inboth rodlets.The subsequent eddy current examination clearly indicated de-fects in the bottom part of the standard type rodlet, one signalbeing very strong. However, no'defects were recorded for the ri-fled clad rodlet. The definite proof of internal hydriding in thestandard type rodlet was provided by neutron radiographs whichshowed that heavy hydriding had occurred in the standard typerodlet at the 6th pellet level from the bottom and minor hydri-ding at the 4th and 2nd pellet levels, Figure 7. Both hydridesand water may appear around the non-enriched bottom pellet and at

Neutron radiographs of standard cladding rodlet (top)and rifled cladding rodlet (bottom). Bottom end plugs tothe right. White area at the sixth pellet shows hydrides.
Micrograph of the standard cladding rodlet at thesixth pellet.
00(O
the end plug weld. In contrast, no hydriding was seen anywhere inthe rifled clad rodlet, but there were possible indications ofwater at the bottom end plug.The hydride concentration seen on the neutron radiograph of therodlet with standard cladding (see Figure 7) was investigated bymetallography. Figure 8. The hydrides are concentrated at boththe inside and the outside of the cladding. The center region ofthe cladding is a zone where hydrogen is moving from the in-
side hydride rim to the outside rim. The hydrides in this regionare seen to be radially oriented. This is caused by the largevolumes of the inner and outer hydride rims thus stretching thezone between them in the tangential direction. The large cracksin the inside hydride rim are caused by shrinkage of the insiderim material compared to an earlier state when all the hydrogennow seen in the outside rim was still part of the inside rimforming one or more "sunbursts" at the inside.

CDo3.2. DEFECT FUEL EXPERIMENT NO. 2
In this experiment three unirradiated fuel rodlets of the 8x8 BWRtype were manufactured with the same type of pellets but withthree different types of cladding:
standard ("non-liner") Zircaloy-2Zircaloy-2 liner fuel, of the same type as used in thefailed Oskarshamn 3 fuel rod discussed earlier [4]Zircaloy-2, rifled cladding.
These experiments are also financed by Swedish organizations andthe actual irradiations are not part of the proposed interna-tional program outlined in Section 4 below. The experiments willbe performed during 1992, and data from the test on the rodletwith standard cladding will be published as soon as possible; theremaining data will be made available to the actual participantsin the international program.
3.3. CONCLUDING REMARKS ON THE EXPLORATORY TESTS
The irradiation test approach applied seems well suited for stu-dying the initial phase of the degradation of experimental typefuel rodlets. The degradation process can be followed by non-intrusive on-line measurements like elongation measurements andnoise measurements.The rate of fuel rod degradation depends on the actual LHGRduring operation. Preferably the LHGR should be kept constantduring the test period in order not to complicate behavior andinterpretation. Later studies of various non-steady operationalschemes might, however, be justified since some operational modesmight affect the mechanisms involved and accelerate the degra-dation process. The measured times until initiation of internalhydriding and through failures as a function of LHGR for a givenfuel design can preferably be plotted in the form of a "modifiedLocke's diagram" (Figure 9). This would provide a method for com-paring the propensity for secondary defect formation of differenttypes of fuel.
4 A PROPOSED INTERNATIONAL PROGRAM
4.1. BACKGROUND
STUDSVIK NUCLEAR has since many years organized a series of in-ternationally sponsored fuel R&D projects. During the last yearsan international program, the Defect Fuel Degradation Experiment(DEFEX), has been under discussion with interested parties (uti-lities, fuel suppliers, safety organizations and national re-search organizations in Europe, Japan and the U.S.).
4.2. OBJECTIVESThe objectives of the proposed DEFEX program would be:* Investigate the various phenomena and design parameters
which characterize and influence the degradation process andits time dependence during exposure of the test fuel at re-levant heat ratings as regards in particular1 initiation of clad internal hydriding2 clad failure by hydriding and the effect of pellet and
clad oxidizing* Investigate the degradation process at
1 near zero fuel burnup2 medium fuel burnup (10-20 MWd/kgU)
* Investigate under similar test conditions1 standard type fuel rodlets (BWR 8x8 and PWR 17x17)2 zirconium liner type fuel rodlets ( BWR 8x8 )3 potential remedy type fuel rodlets (BWR 8x8) (e.g.
rifled cladding)* Collect experimental data for defect failure modeling and
make use of STUDSVIK NUCLEAR's special defect fuel modelingcode
* Compare the experimental data, e.g. in a Locke's typefailure diagram, in order to facilitate comparisons betweendifferent fuel designs.
4.3 FUEL RODS
Two main groups of fuel rodlets are under discussion:Group A: Un-irradiated BWR and PWR fuel rodlets, specially madefor the project: The following rodlets have been proposed:BWR 8x8 type of rodlets with 0.15 mm gap, manufactured for theProject by ABB Atom and identical with the fuel rodlets tested inDefect Fuel Experiment No. 2.* 2 rodlets with standard ("non-liner") Zircaloy-2 cladding* 2 rodlets with zirconium liner fuel, of the same type as used
in the failed Oskarshamn 3- fuel rod [4].* l rodlet with rifled cladding.PWR 17x17 type of rodlets with 0.12 mm gap, manufactured for theproject* 3 rodlets with standard ("non-liner") Zircaloy-4 cladding

This part of the program can to a large part be regarded as ageneric water reactor program, of equal interest to BWR and PWRparticipants. However, it cannot be excluded that important dif-ferences in behavior may exist as regards the time of onsetand the rate of degradation by hydriding between the BWR and PWRdesigns as a result of the differences in clad temperaturesduring operation. The rifled BWR type fuel rodlet is included formechanistic reasons i.e. to investigate the effect of uncon-strained axial migration. Also, it offers potential as a remedydesign against degradation.Group B: Irradiated BWR and PWR fuel rodlets, refabricated by theSTUDFAB process from irradiated full-size LWR power reactor fuelrods with a burnup of about 10-20 MWd/kgU. It is assumed that twosets of BWR rods and one set of PWR rods will be selected, with 3rodlets per set and with gaps of about 0.20 mm and 0.16 mm, res-pectively.The selection of fuel rod parameters will be made in consultationwith the prospective project participants.4.4 IRRADIATION PROGRAMAll fuel rodlets will first be irradiated during one 400-hr cyclein an in-pile loop in the R2 test reactor (BWR rods in a loopoperating under BWR temperature and pressure conditions and PWRrod in a loop operating under PWR conditions). After non-de-structive examinations some selected rods will be irradiatedfurther during a second (and possibly third) 400-hr R2 reactorcycle. Non-destructive examinations will be performed betweencycles. The following program has been proposed:Group A; Near 0 burnup (unirradiated rodlets to be irradiatedduring 400 or 800 or possibly 1200 hrs).
RodNon
TypeLiner Rifled
LHRkW/m
linerBWRrods
PWRrods
NX111i1
LX11XXX
R1XX
XXX
454035454035
CO
Group B: Rodlets with 10-20 MWd/kgU burnup, refabricated by theSTUDFAB process from irradiated full-size LWR power reactor fuelrods. Each of the three rod types would be irradiated at threedifferent LHGR levels.It is foreseen that some of these 17 fuel rodlets will not exhibitany hydride initiation during first 400-hr cycle in the R2 reactor.
Some of them will then, after non-destructive examination, be ex-posed to a second (and possibly a third) 400-hr cycle.
ACKNOWLEDGEMENT
The experimental part of the work described was made possiblethrough the support of the Swedish Nuclear Power Inspectorate(SKI), Vattenfall AB, OKG AB and Sydsvenska Värmekraft AB, whichis hereby gratefully acknowledged.
REFERENCES
[1] Strasser A et al.. Fuel for the 90's - A Utility Perspective.ANS/ENS International Topical Meeting on LWR Fuel Performan-ce, Avignon, France 21-24 April 1991. Vol l, p 2-16.
[2] Yang R L, Ozer 0, Klepfer H H, Fuel Performance Evaluationfor EPRI Program Planning. ANS/ENS International TopicalMeeting on LWR Fuel Performance. Avignon, France, 21-24 April1991. Vol l, p 258-271.
[3] Pickman D 0, Failure Development in Leaking LWR Fuel Rods- A Literature Survey. STUDSVIK/NF(R)-89/83. Studsvik AB,Sweden. 1989.
[4] Jonsson A et al., Failure of a Barrier Rod in Oskarshamn 3. 'ANS/ENS International Topical Meeting on LWR Fuel Perfor-mance, Avignon, France, 21-24 April 1991. Vol l, p 371-377.
[5] Davies J H, Potts G A, Post-Defect Behavior of Barrier Fuel.ANS/ENS International Topical Meeting on LWR Fuel Perfor-mance, Avignon, France, 21-24 April 1991. Vol l, p 272-284.
[6] Reckley, W D, Summary of Meeting held on November 12, 1991 todiscuss the Fuel Rod Failures Discovered during the RefuelingOutage at Wolf Creek Generating Station. U.S. NRC Docket No.50-482, November 25, 1991.
[7] Davies J H, Secondary Damage in LWR Fuel Following PCIDefection - Characteristics and Mechanisms. IAEA Specialists'Meeting on Defected Zirconium Alloy Clad Ceramic Fuel inWater Cooled Reactors. Chalk River, Canada, 17-21 September1972. (IWGFPT/6, p 135-140).
[8] Hüttig W, Forberg M, Berndt R, Ergebnisse von Nachbestrah-lungsuntersuchungen über das Hüllen- und Brennstoffverhaltenin Brennstäben mit künstlichen Lecks. Jahrestagung Kern-technik '91, Bonn, Germany. Proceedings, p 311-318.
[9] Tomani H, STUDSVIK AB, Pat. Pending.

<O [10] Oguma R, Bergdahl B-G, Schrire D, Application of a RecursiveIdentification Technique to Noise Analysis for Fuel Perfor-mance Study. Specialists' Meeting on Reactor Noise (SMORN-V),München, Germany, 12-16 October 1987 Also Prog in NuclearEnergy 21(1988), p 357-360.
[11] Mogard H et al.. The Studsvik INTER-RAMP Project - An Inter-national Power Ramp Experimental Program. ANS Topical Meetingon LWR Fuel Performance. Portland, Oregon, USA, April 29-May3, 1979, p 284-294, (DOE/ET/34007-1).
[12] Mogard H, Kjaer-Pedersen N, Improved PCI and FOR Performanceof LWR Fuel Using Rifled Cladding. IAEA Technical CommitteeMeeting on Fuel Performance at High Burn-up for Water Reac-tors. Studsvik, Sweden, 5-8 June 1980. (IWGPFT/36, p 147-159).
EXPERIMENTAL STUDY ON THE WWERFUEL BEHAVIOR IN RESEARCH REACTORSAND SHIELDED HOT CELLS
A F GRACHEV, V B IVANOV,VV KONYASHOV.VP SMIRNOVResearch Institute of Atomic Reactors,Dimitrovgrad, Russian Federation
AbstractSome experimental results of post irradiation examination of WER 1000 fuel are given
A complex of technical means and methods, which are used for investigation of all stages
of fuel defect appearance and development, is presented This complex comprises the
SM 2, MIR and VK 50 reactors and the hot laboratory
The main source of the potential clanger for radioactivecontamination of the environment is burnt—up fuel of nuclearreactors and one of the radioactive debris propogationbarriers is a fuel element cladding. Inspite of the fact thatthe relative amount of the WWER fuel elements failure is smallfrom the point of view of the current safety concepts eachevent of the fuel element failure should be thoroughlyconsidered in order to reveal and eliminate its causes. Takinginto consideration a sufficiently wide range of the knowncauses and mechanisms of the defects appearance anddevelopment and asuming that there are also unknown ones,methods and equipment for investigation of the fuel elementfailure should meet various reqirements, i.e. they sould beuniversal. To cover all possible approaches of the failed fuelstudy the basis should involve as minimum:
— shielded hot cells (poolside test benches) with acomplete set of methods and equipment for detection of thefailure fact and location as well as for study of causes thatled to cladding failure;
— test reactors provided with means for simulation ofdifferent operating conditions to perform investigations onstandard fuel behavior and dynamics of the processes leadingto fuel failure or direct experiments with irradiated fuelhaving artificial cladding defects in order to study dynamicsof the defect development and primary sequences of suchfailure;
— shielded hot cells with a special rig forinvestigations performed on fuel behavior in the reactor underoperation after primary loss of intergrity (boundaryconditions of severe accedents);
Such choice of equipment allows for investigation of theLWR fuel.

toCO
1. Comprehensive failed fuel investigation program.
First ot all it should be noted that the programs underrealization involve the following types of fuel failure:changes of fuel element and assembly geometric dimensions andshape due to non—uni f ormity of irradiation strain, localthickness reduction of the fuel assembly wrapper or fuelelement cladding caused by fretting corrosion, spacer gridsgeometry changes (crumpling, damage), formation of thickdeposit layers on the fuel element cladding, local andextended corrosion areas, cracks and , finally, claddingperforation as a possible place for fission products release.
Primary investigations of standard fuel for commercialreactors performed in the hot cells are oriented to detectionof anomalies or, if a fuel assembly is untight, search ofdefects. These investigations involve: visual inspection ofthe fuel assemly and its fragments; leak checking of fuelelements in the assembly based on gas release; measurement ofthe cladding and fuel element elongations; study ofdeformation; eddy—current flaw detection of fuel elements;axial gamma-scanning of fuel elements; neutron or x—rayradiography; analysis of gas quantity and composition in thefuel element free volume. The above methods andinstrumentation allow, in most cases, for detection of alltypes of anomalies (by comparison with other fuel elements anddesigned characteristics) or verification of the perforationavailability in a certain place of the cladding. In case whenthe primary investigations cannot provide exact determinationof the causes of fuel failure or anomalies formation thefollowing distructive investigation methods are used: metallo-and ceramography; quantity and composition analysis ofinteraction and deposit layers on the cladding; fuel densitydetermination; gamma—scanning along the radius of polishedsamples; elementary microanalysis; x—ray structural analysis;measurement of the cladding strength properties.
Selection of standard fuel assemblies for investigationsis performed on the basis of mutual discussion held by therepresentatives of the NFS chief designer, chief fuelproduction engineer and hot laboratory experts.
The investigations of standard fuel assemblies revealfailure causes but-they do not always explain the machanism ofthe defect development under normal and what is more, undercomplicated operating conditions.
These tasks are being solved in the SM-2 and MIR researchreactors of the institute and involve for each fuel typeexperiments for study of the fuel element behavior in thefollowing operating conditions: transients; pulsed fuelnuclear heating; heat removal crisis; simultaneous reductionof the coolant flowrate and pressure; filling of thesuperheated fuel elements with cold coolant.
With these experiments it is possible to modelpractically all normal operating conditions and those of thedesigned accident. Both newly manufactured fuel elements(ortheir prototypes) and refabncated ones with irradiated fuel
and claddings including those with artificial defects. Theconcrete parameters and type of the experiments are defined bythe chief designer of the reactor and chief engineer of fuelproduction.
A number of experiments with failed fuel is performedwith some restrictions in the VK-5O NFS with the boilingvessel-type reactor. These investigations are aimed atthe determination of radiation sequences of the NPP operationwith failed fuel elements, gaining of experimental data forfurther validation and improvement of the calculation methodsfor prediction of radioactive fission product (RFP) releasefrom the fuel elements under water cooling conditions of thereactor. The investigation program comprises:
— study of the HFP background activity levels in thereactor circuit conditioned by the contamination of the fuelelement cladding surfaces with fuel in the course ofmanufacturing;
— study of the RFP release from the failed fuel elementsunder the NPP operation, performance of separate experimentsin transients;
— study of the RFP release from the fuel elements withartificial defects of different size under irradiation invarious parts of the reactor core with different intensity;
— study of the RFP release from the failed fuel elements(including those after long-term storage) during theirinspection in the out-of-pile stand for cladding leak testing,choice of the optimum inspection method and procedure;
— post—irradiation material science examinations of thefuel elements with artificial defects.
The comprehensive program involves investigationsof temperature dependence of the fission product release fromfuel. They are performed at special stands in the hot cells.
These investigations make it possible to understand inwhat quantities and what chemical forms the fission productsrelease from fuel and to determine the dynamics of theseprocesses. Such information is required in order to refine thephysical models of the processes and to up—date thecalculation program.
2. Methodical basis of the program and someinvestigation experience
data on the
2.1. Detection of defects and measurement of their sizeDetection of defects begins with visual inspection of
the fuel assembly wrapper (for instance, those ofWWER-44O),bundle and single fuel elements. Visual devices witha magnification of 3O are used for this purpose. They areconnected with photo-, videocameras and computers (Fig.l). Inmost cases surface anomalies and defects are successfullydetected already at the visual inspection stage. As a rulethey represent external cracks, corrosion spots, deposit, etc.(Fig.2).

CO Stationary turnablemirror
Movable lens for changeof magnification
Stationary ocular
Mirror turned along periscopeaxis
FIG 1 Periscope with vanable magnification (the photograph is made through the flangeat the top of the tumable periscope head)
THe investigation of the size of wrapper defects isperformed with a device provided with three pairs of contactsensors, each of them defining the wrapper surface relativecoordinate independent of the others C13. The investigationresults on deformation are presented in the form of vectors ofthe fuel assembly twisting and bending and also axialdistribution of its transverse size <Fig-3).
The device allows for detection of prominences on thefuel assembly wrapper. The prominences in the minimumhexagonal dimensions correspond with the spacer grid locationsand could be related to spacer grid striking against thewrapper walls in the process of the fuel assembly operation.The diameter of the spacer grid cells, providing horisontalfixation of fuel elements, is measured with gauges andpresented in the form of specialized tables (Fig.4).
An external damage of the fuel element claddings is oftenobserved in the places where the spacer grids are located orwhere the cladding comes in contact with other objects. Inthis case the anomalie and defects size can be defined bymeans of profilometry, visual inspection and metallography.Nowdays profilometry has found a wide application, themeasurement error being + 5 m (Fig. 5) C23. Metallography isthe most reliable method for size determination of smalldefects.
Cracks, cladding hydrogination, including thoseconnected with secondary defects, can be detected by theeddy-current flaw detection. Both pulse and harmonicexcitation methods are used in the flaw detection. The minimumsize of the defect recorded with certainty is O.3 of thecladding thickness. Fig.6 presents the eddy—current diagram ofthe fuel element with a technological defect of O.2 mm andsecondary fuel element failure.
Cladding defects that make fuel release fro« the fuelelement possible are detected by gamma—scanning. The samemethod is used for verification of the secondary defectaccompanied by the cladding hydrogiation, thermal conductivitydeterioration, increase of the fuel temperature and, as aresult, cesium—137 migration from the defect area (Fig.7)
In some cases for the final verification of the defectavailability the fuel element cladding is punctured with thelaser beam and the analysis of the gases volume, pressure andcomposition is performed with the mass—spectrometer.
2-2. Study on the fuel failure causes and sequences
After the defect is detected the program of furtherinvestigations is worked out in accordance with its type. Theinformation on the peculiarities of its production process andirradiation history are taken into consideration. Theinvestigations make it possible to determine deposit thicknessand composition by chemical, radiochemical and metallographicmethods, to perform fuel ceramography (Fig.8) and study fuelstructure and nuclide distribution along the radius bypolished samples scanning method (Fig. 9,a) and tomography(Fig,9,b). The results of these methods permit evaluation ofcladding thickness, level of its hydrotation and oxydation,fuel—cladding gap size, fuel—cladding interaction. The fueland cladding structure gives information on the temperaturedistribution over the fuel element volume.
The welds state is examined by the x—ray radiography andmatallography (Fig. 1O). The fuel structure is evaluated from
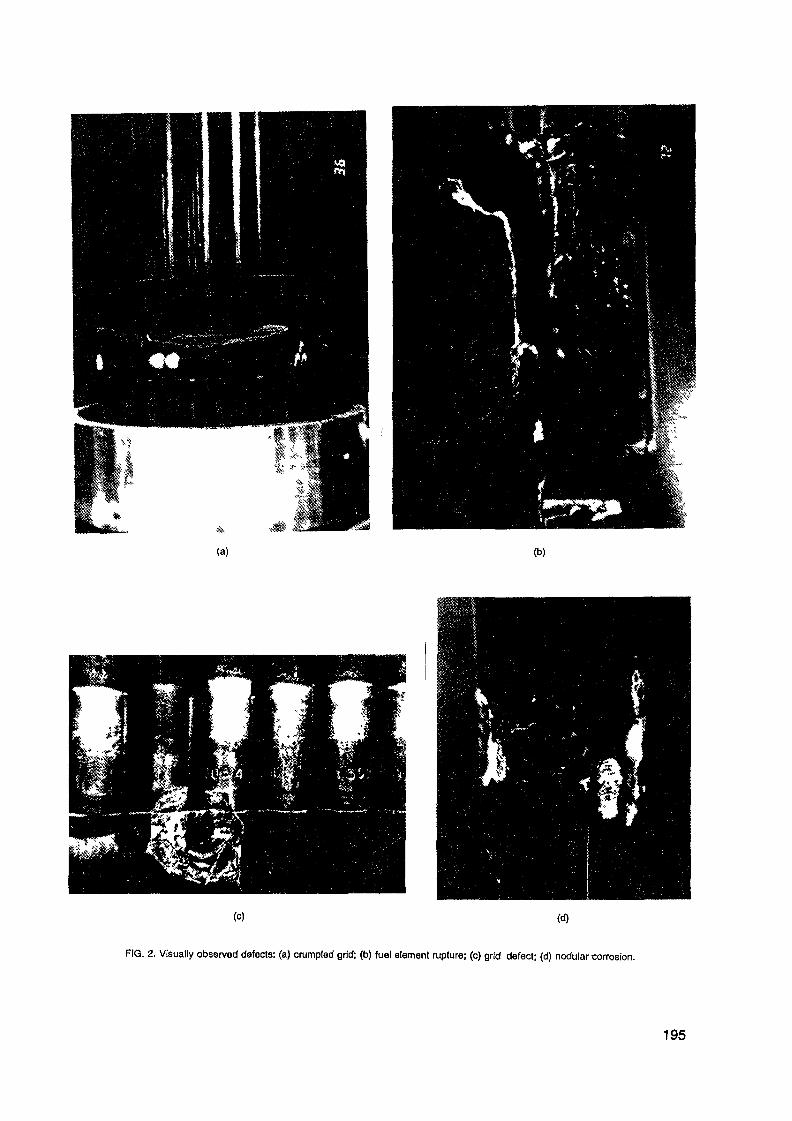
(a) (b)
(c) (d)
FIG. 2. Visually observed defects: (a) crumpled grid; (b) fuel element rupture; (c) grid defect; (d) nodular corrosion.
195

COO)
3 00
20G
I 00
ofo 4 500 100C 1500 2000 2500 5000 3500 4000 45f>0Length, mm
FIG 3a Arrow bowing of fuel assembly wrapper 0007
0 15 -
0 10 -.L. ;
1 005 \
-QQ5-.
-0 100 50C 10ÛO 1500 2000 2500 3000 3riOO 4000 4500
Leigth, nm
FIG 3c Twisting of fuel assembly wrapper 0007
3600
- °Û2400
» 1200
00500 1000 1500 2000 2500
Length, mm3000 3500
2395
4-500
FIG 3b Angle of bowing of fuel assembly wrapper 0007
239 0 -.
g 238 5 -.
-. 238 0 -.
237 5
23700 500 1000 1500 2000 2500 3000 3500 4000 4-500
Length, rm
FIG 3d Average hexagonal dimension for rairs of sides of fuel assembly wrapper 0007
the neutron and x-ray radiography results (Fig.11) and refinedform the ceramography results. The gap between pellets, pelletchops, size of the fuel column central channel are measured bythe same methods.
Study of the fission product release dependence on thefuel temperature (Figs. 12, 13) is performed at thespecialized rig. The results obtained permit evaluation of thefission products amount released in the coolant when claddingfailure takes place as well as fuel temperature values in theprocess of operation.There is a fuel element refabrication area in the hot cellintended for evaluation of the failed fuel behavior in thecourse of further operation. Fuel element models aremanufactured there from the spent standard ones prepared fortesting at the specialized rigs of the hot cells or in theresearch reactors.
2.3. Methodical basis of the in—pile experiments
The MIR reactor
The MIR reactor with the core of 1OOO mm height comprisesseveral loop facilities. Their type and parameters aredetermined by the experiment tasks. The loop channels arelocated in the second and third row of the core so, that eachof them is surrounded with six channels loaded with operatingfuel assemblies of the reactor (Fig. 14).
Each loop channel is surrounded with 3—5 regulating rodsthat allows operative power change of the fuel assembly understudy with the minimum effect on the characteristics in theother loop channels. At present 5 water cooled loop facilitiesand another one with gas as coolant are being operated in theMIR reactor (Table 1).

CO
9 15
9 10
905
FIG. 4. Cartogram of diameter values for cells of spacer grid No. 2.
500 1000 1500 2000 2?00 3000 3500 4000
4 UU -
000 -
-4-00-C
juL— IW
-)""""5o6' 1GOO 1500 2000 2500 3GOÖ 3500 4-0
Length, mm
FIG. 6. Eddy current diagram of fuel element 139 in fuel assembly 0068.
oX (a)
OQ
cr
T"
i
(b)
jljj^»^^
D b ib ib sb 2b ab ab
tk~-~.yir-~*
Axis, mm X10 tower part of fuel elementa - Cs-137 distribution,b - defectogram of fuel element
FIG 5. Average outer fuel element diameter of fuel assembly 0007.FIG 7. Distnbution of Cs-137 concentration and signals of eddy current defectoscope along
length of fuel element No. 139.

•uo||09S-ssoJO |BU|pni|Buoi (q) 6£L PUB (e) ZZ\ SON )U9Ui9|9|9nj jo 9jnpnj;soJOjUJ :ju9W9|e |9nj y3AA I/o Au,dBjßowBJ90 PUB Äu.dBjßo||Bi9w (B) "8 'SU
xg
86 L
(q)
Q
N>O
m3
B
Counting rate in per-unit
O O O0)O
SIO
COO
CDO
_J____I____I————1-

(a) (b)
100x
FIG. 10. Micro- and macrostructure of (a) lower welds and (b) upper welds of fuel element No. 139.
Fuel element K-11
Z = 1370 mm from the upper offuel element
= 430, £= 677 r
FIG 11.X ray and radiographie pictures of fuel element sections: (a) sections of fuel core in the region of local decrease of gamma activity;(b) shank, gas collector, locator and fragments of upper fuel pellets In fuel element No. 178.
199

roooIo-3 2600______2IQQ_____1800 T.C
2700 2000 1500 1200 lOOO 900 800 700 600 T?C
10"3 3,5 4 4,S 5,0
FIG. 12. Transformed factor of Cs diffusion for burnt up fuel of WER 1000(B = 44.7 MW-d/kg U).
5 .7 8 9 10 II 12
FIG. 13. Cs and Ru release in the atmosphere from the WER burnt up fuel.
TABLE 1. MAIN CHARACTERISTICS OF THE MIR REACTOR LOOPS
Parameter
Coolant
{leat power,kWCoolantpressure,MPa
Max. outlettemperature,•cNumber ofchannels
WaterloopWL-1HL-2
2000
20
300
4
Waterboilingloop8L-1BL-2
Water
2000
20
300
4
Vapour-waterloopVWI 2
Water,Vapour-watermixture2000
20
500
1
CasloopGI/-1
Helium,its mixtu-re withothergases200
20
500
1
OrganicloopOIr-1
Ditholylmethane
250
1.6
300
1
FIG, 14. Cartogram of the MIR reactor core: reactivity compensator;channels: with standard fuel assembly; loop channel with experimental fuelassembly; channels with TUE targets; shim safety rod; automatic control rod(digital designation of cell numbers).

Developed in the first years of the reactor operation thePV-1, PV-2, PVK-1 and PVK-2 loop facilities are used fortesting of fuel elements before their failure. In this caseone of the limiting factors of their operation is the coolantultimate specific activity of 3.7xlO Bq/m <1O Ci/1). Lifetesting of fuel assemblies is performed in the loop facilitiesboth under stationary and transient conditions.
Created in 1988 the PVP-2 loop facility is equipped withadditional systems including those for activity localizationand circuits decontamination that provides testing of not onlytight fuel elements there but failed ones too up to a coolantspecific activity of 3.7xlO Bq/m (1 Ci/1).
The PVP-2 flow-sheet allows fuel element testing bothunder stationary cooling conditions and also under thosesimulating accidental conditions with the pipe rupture follow-ed by overflow of superheated fuel elements with cold coolant-
The SM-2 reactor
The SM-2 reactor with the core height of 35O mm comprises3 water cooled loop facilities (Table 2"). The VP-2 and VP-3loop facilities are used for testing of power reactor fuelelements. Experimental channels are located in the berilliumreflector surrounding the core (Fig.15) and used for fuelelement testing. In accordance with the required conditionsdifferent channels can be connected to each loop. Thesechannels differ in the neutron flux density value. The channeldesign permits output of a great number of various transducersthat, in its turn, makes this reactor rather convinient forin-pile investigations. It was the SM-2 reactor wherenumerous experimental data have been obtained on fissionproduct release and fuel element thermal-physicalcharacteristics.
TABLE 2 MAIN PARAMETERS OF THE SM 2 REACTOR LOOPS
IV)o
ParameterMaximum heat power, kWCoolant pressure, MPaInlet coolant temperature, C*Total coolant volume ofthe first circuit, m3Total gas volume, nrWater flow-rate, ra3/h
main & stand-byemergency
Pump-induced pressure, HPa
WL-120004 920-60
5 00.5
2ÛO300.94
¥L-230019 6300
1 50 9
8 08 00 94
WL-3to 10019.6300
0 40 4
8 08 08 0
15
FIG 15 Sectional view of the SM 2 reactor 1, 2 - radial experimentalchannels, 3 - water trap, 4 - safety vessel, 5 - reactor vessel, 6 - shield,7 - separator, 8 - beryllium reflector, 9 - absorbing rods, 10 - central shim,11 - beryllium insert of water trap, 12 - automatic control rod, 13 - shim,14 - cells of experimental channels, 15 - fuel assembly of active core
Experiments performed in transients
The MIR reactor can provide a significant power increaseof the experimental fuel assembly at a sufficient rate andwithout use of special equipment by recompensation of theregulating rods.
For this purpose in the initial state the nearest to theloop channel regulating rods are located in the lower andintermediate positions but during ramping they are completelyremoved with the maximum velocity. Simultaneously in order tocompensate the introduced positive reactivity the regulatingrods in the other parts of the core are dropped. In this casethe constant reactor power is maintained. The experimentsperformed were aimed at establishment of ultimate thermalloadings depending on the fuel burnup in ramping. They showedthat this method allows for 2-2.5 times increase of the fuelassembly power in 8-1O minutes. It should be noted thatramping of the fuel element power with regulating rodsrequires prelimenary removal of several loop assemblies fromthe reactor. Therefore, not more than 3 experiments per yearare performed in the MIR reactor by this method. The special

MOto
FIG. 16. Irradiator TC-2M: 1 - indicator of fuel assembly location; 2 - head;3 - tumable mechanism; 4 - suspension rod; 5 - flow separator; 6 - hinge;7 - spacer sprocket; 8 - vessel; 9 - fuel element; 10 - shield.
TZ-2M (Fig.16) irradiation rig is used for the fuel elementtests with daily power cycling in MIR. The irradiation rigincorporates a method of the fuel assembly rotation in thenon-uniform neutron field forced with stationary absorbingshielding. During..operation of this rig 1OOO cycles of thefuel element power change have been performed in the range5O...1OOZ of nominal power value.
In the SM-2 reactor the TZ-SM irradiation rig and theRITM facility are used for power ramping and cycling. In theTZ-SM rig (Fig.17) fuel element power changes are realized byrotation of the neutron absorbing shield, in the form of asegment, round a fuel element and in the RITM facility theyare realized by pressure change of H gaseous absorber in theannular gap round the fuel element. It should be noted that inthe experiments performed with TZ-SM and HITM the fuelelements are equipped with pressure pick-ups for gas under thecladding, cladding and fuel column elongation sensors as wellas with a thermal couple in the fuel column center.
10
FIG. 17. Irradiation device TC-SM for fuel element testing under tnermocycling conditions:1 - electric motor; 2 - water lines; 3 - suspension rod; 4 - vessel; 5,8- upper and lowerhousings; 6 - rods of neutron absorber; 7 - fuel elements; 9 - direct charge detector;10 - tie rods; 11 - collector.
Experiments with pulse nuclear heating.
In these experiments the fuel and cladding behavior hasbeen studied depending on the accumulated heat value. They areperformed in SM-2 with the help of "Impulse" irradiation rigand the RITM facility. In "Impulse" (Fig.18) the requirednuclear heating change is achieved by the fuel element dropalong the core through the neutron absorbing shield having anannular split. In the experiments performed with 21X enrichedfuel elements the maximum amplitude was 3O — 4O. The pneumaticdrive of the rig provides a half—width of the pulse of O.I —O.6 s. The maximum of accumulated heat in the experimentsperformed was 12OO kj/kg.

coolant inlet
outlet
tooCO
FIG 18 Irradiation device'Impuls' 1 - transport unit, 2 - control and measuring block,3 - fuel element, 4, 5 - cadmium screens, 6 - flux separator, 7 - channel vessel
In the BITM facility it is possible to achieve the powerchange amplitude of 2O-3O s with a half-width of the pulse of0.4 s.
Experiments with heat removal crisis.
These experiments are planned to be performed in SM-2with single short <35O mm) fuel elements and assemblies«containing up to 7 fuel elements) as well as in MIR withassemblies containinf 18 fuel elements with a length of 1OOOmm. The experiments performed in SM—2 with single fuelelements indicate that the most preferable method of the fuelelement introduction in the heat removal crisis is not adecrease of the coolant flowrate at statinary power but, onthe contrary, it is a smooth increase of the fuel elementpower at the stationary coolant flowrate.
In the heat removal crisis experimnets the temperature ofthe cladding and fuel column center is measured. In theseexperiments the efect of the short—term temperature increaseis studied on the fuel element state on the whole.
Experiments with the primary circuit pipe rupture.Although these experiments exceed the limits of the
normal fuel operation they reveal possible sequences for fuelelements icluding those with defects-
The investigation on the fuel element behavior andcladding damage features under accidental conditions connectedwith the primary circuit pipe rupture are supposed to beperformed in the PVP—2 loop facility of the MIR reactor. Inthis case rupture simulation is achieved by discharge of theloop coolant into a special tank. Regulation of the coolantdischarge velocity allows simulations from small ruptures upto severe designed accident. The loop facility is eqipped withthe emergency cooling system that could be used for simulationof the final accident phase connected with the overflow ofsuperheated fuel elements with cold coolant.
2.4. Realization of the investigation program at theVK-5O NFS.
To realize the planned program at the VK-5O NFS therequired experimental basis has been developed comprising:sampling system, measurement center, out-of—pile leak teststands. The realization of the investigation program of NFSoperation with failed fuel elements would be impossiblewithout efficient adsorbtion facility for decontamination ofthe turbine ejector gas release.
The schematic diagram of the VK-5O NFS with samplinglocations and its operating parameters are given in Fig.19.
To obtain reliable and representative information on theRFP release from the fuel elements with the known defect sizeand location under long-term irradiation in the reactor coreas well as during leakage testing at the out-of-pile standexperimental fuel assemblies (D-l and D-2) have beenmanufactured and and loaded into the VK-5O core in succession.Each fuel assembly comprises 3 fuel elements having artificialcladding defects in the form of holes with the O.9-1.Odiameter bored during fuel assembly manufacturing. Fig.2Opresents the defect location and irradiation conditions of thefuel assemblies with artificial defects.
The long-term irradiation of the D-l fuel assembly(during 5 years) showed that there is no significant washingout of fuel into the circuit. The gaseous RFP release from thefuel elements with artificial defects <D-1 and D-2 fuelassemblies) is described by the current calculation methodsfairly well: the effect, of the fuel—cladding gap size on theyield value is strong.
The D—1 and D—2 fuel asemblies have been tested at theout—of pile leak—test stand with all current methods. Thiswork has led to the choice of the most reliable method and

10o
6FIG. 19. Schematic diagram of VK-50 APS: 1 - reactor; 2,4- high and low pressureseparators; 3 - throttle; 5 - turbine; 6 - turbine condenser, 7 - facility for hydrogenburning; 8 - facility for gas release decontamination; 9 - deaerator; 10 - facility for reactorwater purification; 11 - points of water and gas samplings, respectively.
Varying the artificial defect size is the next stage ofthe program. It is necessary for verification of the methodsfor determination of the defect size from the RFP activity inthe circuit and for improvement of the calculation methods ofthe RFP release from failed fuel elements. In this case higherfuel element loadings are planned. The development of theout—of—pile leak testing stand methods is aimed at theimprovement of the equipment and bringing of the methods fordefect size determination to the standard level.
CONCLUSIONS.
Thus, in the Research Institute of Atomic Reactors acomplex of technical means and methods have been developed andused that provides practically all kinds of investigationsallowing investigation of all stages of fuel defect appearanceand development under different operating conditions. Thiscomplex comprises the SM—2, MIR and VK—5O reactors and the hotlaboratory.
REFERENCES
Characteristics
Defect diameter, mm
Linear power of failedfuel elements, W/cmFuel burnup,MW a/kg U
1 .0Fuel elements arrange- innerment in fuel assemblies row
D-2
0.9
outerrow
50-70 90-120
18 11
1. Dvoretzki V.6.,Ivanov V.B., Glushak N.S., Slushak B.M.,Smirnov V.P. MBToanKa i/iaMepeHftsi reoHeTpunecKHx paanepoen *opMU nexfla TBCw Preprint, RIAR, 3(8O6), 1991.
2. Kanashov B.A., Alyoshechkin L-V. Anajins norpeuiHOCTeftM3nepeHMs HapyxHoro AfiaMe-rpa HH/ifiHflpHHecKfix Msae/inPinpn pas/inHHUx cnocoäax MX öaswpoeaHwsi. Moscow,CNIIATOMINFORM, Preprint, 1986.
3. Konyashov V.V. Shkokov E.I., Chechetkin Yu.V.,E.K.Yakshin BKcnepMMeHTa/ibmje Mcc/ieflOEaHMSi euxoflapaAHoaKTMBHUx npoayKTOB AeyieHM5i W3 AefeKTHux TBSSIOB HaA3C c peaKTOpoM BK—5O. Nuclear Power Stations, 5, —M.:Energoatomizdat, 1983, p. 185-189.
FIG. 20. Scheme of arrangement of defects in fuel elements and characteristics of D-1 andD-2 fuel assemblies.
procedure of the test that would provide reliable detection offailed fuel elements and assemblies even after their storagefor more than 1O years and determination of the defect sizefrom the RFP activity in the circuit of the leak test stand.

Öl
SEARCH FOR WAYS OF REDUCING WERFUEL DAMAGE BY OPTIMIZING DESIGNAND OPERATING CONDITIONS
Yu.K. BIBILASHVILI, A V MEDVEDEV,V.V. NOVIKOV, V.D. ONUFRIEVScientific Research Institute for Inorganic Materials,MoscowI N VASILCHENKO, E.D DEMINOKB 'Hydropress',Podol'skG.L. LUNIN, V.N. PROSELKOVI.V. Kurchatov Institute of Atomic Energy,MoscowA.F. GRACHEV, V.A. KUPRIENKOResearch Institute of Atomic Reactors,Dim'rtrovgradA.G. IOLTUKHOVSKIJResearch Institute for Nuclear Power Plant Operation,MoscowRussian Federation
AbstractThe paper discusses the main directions m improving WER
fuel through upgrading fuel element and assembly design,optimizing operation conditions m power reactor cores Theexistent designs of fuel elements and assemblies are shown tomeet the requirements of operation reliability. At the sametime they are prone to further backfitting to significantlyimprove serviceability, maintainability, neutron economy, toreduce limitations on operation conditions, and to increaseburn-up and safety.
1. UPGRADING FUEL ASSEHSLIY DESIGNS
Operational reliability of power reactor fuel iscontrolled by both the properties of fuels and their operation
conditions in FA. FAs can as a structural member of a corefail due to the following causes:
- frettmg-wear in fuel spacing locations;- fretting-wear due to debris getting into a fuel bundle;- deformation and damage of elements due to inadequate
accomodation of thermal and irradiation growth;-deformation of absorber elements of ASS (automatic
safety system) as a result of dynamic loads on scramming;- damages due to a joint action of irregular handling and
operation loads in a reactor.Experience m WER-440 and WER-1000 operation shows that
the chosen schemes of FA lay-out, the principle of fuelelement spacing ensure the high operational reliability of FAsand their further upgrading.
WER FAs are backfitted in the following mam directions:- reduction of parasitic neutron absorption through the
use of zirconium grids and guide tubes, the use of zirconiumof higher purity,
- use of integrated fuel burnable absorber- gadolinium;- increase of efficiency and life-time of control rods-,- maintainability of FAs (reconstitutable ones);- increase reliability of FAs for work under load follow
conditions.Besides, the base design of FA allows an increase the
length of a fuel column to decrease the linear heating of afuel element as well as introduction of a profiled fuelcolumn.
Both FA designs, viz., the base one having steel gridsand the backfitted one with zirconium grids are not subject tofretting wear. This is accounted for by adeguately rigidsupports of fuel elements, and the selected pitch of gridlocation offsets the influence of possible gaps in fuelfixture cells.
FA dismantling for bench tests and post-irradiâtioninvestigations points to adequate fuel extractability from abundle. All these qualities make this lay-out of a bundleoptimal, meeting the reliability requirements both in a

IV)oo>reactor and during transport-technological operations.Therefore, this spacing principle is also retained in thebackfitted FA, including the reconstitutable one.
It is expedient to increase the efficiency of controlrods, primarily for the serial WER-1000 reactor to lower thesecondary criticality temperature.
The base and backfittmg designs of FAs resolve thisproblem through using larger diameter of control rods.
The use of a combined absorbing element with hafniumnozzles increases the life-time of absorbing rods of ASS.Damping of the higher mass of ASS rods provided by a largernumber of springs.
The post-irradiât ion investigations, as a rule, do notreveal any events of fretting wear due to presence of debris.This is ensured by the adequate filtration properties of thebottom grid of FA and cylindrical supprorts of a reactor well.
2. MAJOR DIRECTIONS IN IfcPROVEKENT OF OPERATIONRELIABILITY OF FUELS
The operation reliability of fuel elements is determinedby their design and operation conditions.
Fuel failures are mainly due to the breach of thefollowing criteria:
- cladding strength;- cladding deformation including collapse under the
action of pressure from outside;- fuel melt-down;- hydrogen pick-up by cladding.Therefore, the design solutions and improvements are
aimed at provision of the absolute compliance with the abovecriteria under all design basis normal operation conditionsand on departure from normal operation conditions.
The presently employed VVER-1000 fuel elements have highoperation reliability. The failure level does not exceed 0,005-0,008%.
This is attained through the thorough analysis of actualoperation conditions, optimized design and technologicalsolutions.
To meet the above fuel reliability criteria in the bestway specific design parameters of a fuel element were selectedas optimized compromise solutions taking account of thecomplex mode of the effect of those parameters on thecharacteristics and processes taking place in a fuel element,see the table.
TableInterrelation between Design Parameters and Fuel Element
Characteristics and Processes
Designparameter
Average pelletdensity:
10 6 g/cno
Central hole ofpellet:d - 2.2-2.4 mm
Pellet chamfers
Fuel-claddinggap:0. 15-0. 25 mm
Length of ple-num
Pressure ofhelium fillerP-l.65-2 25 KPa
Parameter dependent characteristics andprocesses
Ko hydrogen pick-up by cladding, pelletsstrength, creep rate, extent of irradiationinduced densification
Margin to melt-down, swelling accomodation,volume for FG, reduced FPs getting tocladding
Prevention of chips, lower PCI, free volumefor FG
Lower temperature drop between pellet andcladding, reduced stored energy, fuelbehavior in LOCA, loadine of pellets intocladding
Gas pressure inside a cladding must notexceed coolant présure
Lower gas release, elimination of collapse offree-standing cladding

The important influence on the fuel reliability isexerted by the acceptable operation conditions. Within theburn-ups reached this problem is known to be related to thefuel behavior m transients accompanied by linear heatingramps.
In practice power ramps are realized both on powerchanges of a reactor as a whole, and locally through powerrating field variation. In the latter instance, the power rampmagnitude depends, as a rule, on methods and algorithms of acore control. Optimization of these methods is an importanttask in the total problem of power reactor core reliability.
The significance of the problem is illustrated by thefollowing results of design studies.
As applied to a 24 hour load follow schedule two methodsare considered: rigid and optimized one. As a rigid one analgorithm was spacifically selected that allows significantdistortion of power rating field.
Fig. 1-4 illustrate the calculated data on variation ofpower density fields, specific loads and stresses of fuelcladding under 24 hour load follow conditions with a rigid
Kv210
1 10
010
Axial distribution of power density ( Kv ) under24 hour load follow conditions-rigid control
000 020 040 060 080 100
I - initial distribution2.3 - extreme ultimate distributions
Fig 1
40-,
Maximum variation of linear heating ( W ) under24 hour load follow conditions-rigid control
Time,10**3 sec
Fig. 2
core control. It can be seen that with a coarse controlsignificant departure of power density fields from thesteady-state form are possible. As a result of suchnon-optimized control high tensile stresses above thecorrosion cracking threshold can be developed in a claddinggiving rise to its significant damage, including a throughdefect formation.
Similar data on a 24 hour control shedule but with moreoptimized control algorithm are given in Fig. 5-8. A clear-cutdependence of the stressed state of a fuel element on themethod of a core control is obvios. In this case, the stressesare significantly lower (115 MPa) and remain below theirthreshold value of the start of SCO process in Zrcladdmg.This allows any cladding damage in a single cycle and damageaccumulation in the process of multiply power cycling to beavoided.

tooCO
Maximum fuel cladding stresses under 24-hour load follow conditions-rigid control
370.00 -j
70.00 -
-30.00 ->1 - initial stresses2 - maximum stresses
Fig. 3
Axial distribution of power density ( Kv ) under24 hour load follow conditions-optimal control
Kv !
2.10 -
1.10 -
0.100.00 0.20 0.40 0.60 0.80
—— -initial distribution- - -extreme ultimate distributions
Fig. 5
1.00Z
Stress variations in fuel clodding under 24hour load follow conditions (section Z=0.15with maximum stress) - rigid control
Do.M»280.00
180.00 :
80.00 ;
-20.00 Time, 10**3 sec
Maximum variation of linear heating ( W ) under24 hour load follow conditions-optimal control
30 n
1
10-
20 40 60 80 100 120Time, 10**3 sec
Fig. 4 Fig. 6

Maximum fuel clodding stress under 24hour load follow conditions-optimalcontrol
-3000J
1 - initial stresses2 - maximum stresses
Fig 7
10oCO
I8000 -3
Ï13000 :
8000 :
3000 :
-2000
Stress variations in fuel clodding under 24hour load follow conditions ( section Z=0 15with maximum stress )-optimol control
50 100
Time, 10**3 sec
Fig 8
In Russia much experience has been gamed in influencingthe fuel serviceability by methods of control Optimizedalgorithms of core control have been worked out Their usagetogether with the improved design of fuel elements andassemlies will provide for the further improvement of fuelperformance
It follows from the world-wide experience and domesticinvestigations that the major factor that limit the fuelserviceability under transient operation conditions is thestrength of zirconium claddings under the action of aggressivefission products in presence of tensile stresses. Thedesign-experimental studies permitted kinetic dependences fora SCO defect evolution in Zr-l%Nb cladding to be found, theymake it possible to calculate the dinamics of a crackpropagation process during fuel operation.
It is established that the rate of a crack evolutiongrows with its depth, thus the crack becomes unstable and thecladding strength is sharply reduced. Therefore, to guaranteethe strength the designs establish the maximum permissibledepth of an accumulated crack that is less than critical depthof its stable growth (60/»m).
Under this conditions the factor most important forcladding strength is the permissible depth of an initialas fabricated defect at the inner cladding surface.
Presently regulations for fuels in our country and abroadestablished 50/m for an as fabricated defect. Thus, there isonly an insignificant margin to the critical depth of SQjum.
Fig. 9 presents the strength of Zr-IZNb claddings havinginitial defects of different depths. Fig. 10 shows the time tofracture of cladding as a function of an initial defect depth.
The data presented point to the expediency of adopting amore rigid requierment on the initial defect depth. At thesame time the extent of tube defectiveness limitations mustcorrespond to the process potentialities, quality control andeconomics.
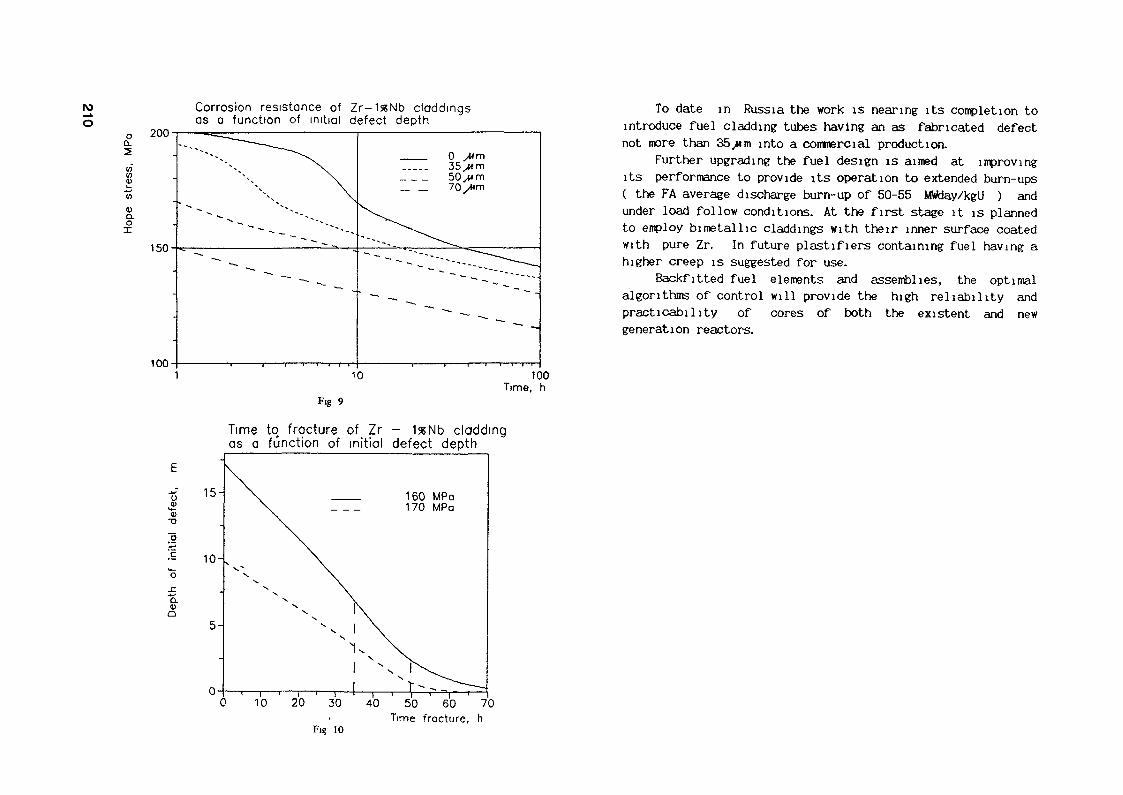
ro_A
oCorrosion resistance of Zr-1s?Nb claddingsas a function of initial defect depth
oQ_
<Da.oX
200-
150-
100-
To date in Russia the work is near ing its conpletion tointroduce fuel cladding tubes having an as fabricated defectnot more than 35jum into a commercial production.
Further upgrading the fuel design is aimed at improvingits performance to provide its operation to extended burn-ups( the FA average discharge burn-up of 50-55 MWday/kgU ) andunder load follow conditions. At the first stage it is plannedto employ bimetallic claddings with their inner surface coatedwith pure Zr. In future plastifiers containing fuel having ahigher creep is suggested for use.
Backfitted fuel elements and assemblies, the optimalalgorithms of control will provide the high reliability andpracticability of cores of both the existent and newgeneration reactors.
10 100Time, hFig 9
Time to fracture of Zr - 1s?Nb claddingas a function of initial defect depth
£Q>•o
15!w'c
Û.DO
15-
10-
10 20 30 40 50 60 70
Fig 10Time fracture, h

STUDY ON STRESSS CORROSION CRACKINGOF FUEL CLADDING TUBE
Y.H. KANG, W.S. RYU, K.S. RHEEM, S.H. KIMKorea Atomic Energy Research Institute,Daeduk, Republic of Korea
AbstractIodine-induced stress corrosion cracking (ISCC) tests on Zircalor-4 C4HDU- type
tubas were carried out using a modified internal pressurization method to study thepellet cladding interaction (PCI) failure aecbanisa and its remedy. In the presenttest, the effect of various corrosion species including CsCl, Csl, Pel,, CsOH andAll, as well as I, on the SCC of Zry-4 tube specimens vas investigated in terns oftime-to-failure versus the concentration of species and the hoop stress of Zry-4tubes. The results showed that the CsCl and Csl species were not active to SCCwhile the Pel,, CsOH and ill, species reduced the time-to-failure of SCC at thenearly saw critical concentration of species as that of I,. In order to study theeffects of Zircaloy-4 tobe fabrication processes on ISCC, two kinds of tubes fromdifferent commercial makers were also tested at the same condition for ISCC test.Two kinds of tabes showed a difference in threshold stresses of about 30 Ufa whichwas attributed to the difference in texture and toughness of tubes. To find outthe effects of brazing and welding process of CANDO-type fuel tubes, the time- to-failure of ISCC was measured in tens of hoop stresses. The threshold stress ofspacer-brazed tube and end cap- welded parts was found to be reduced to about 70 %and 50 % of the stress of normal tubes, respectively. Either the annealing'process after welding or a modified welding process reduced the susceptibility ofSCC, indicating that the shape as well as residual stress of welding parts acted asan important role for controlling ISCC. When the inside of the tubes was coated withgraphite, the tube didn't increase the ISCC threshold stress, although the criticalconcentration of iodine seemed to be shifted to a little higher concentration. Onthe other hand, siloxare-coating inside of tubes was found to increase thethreshold stress for SCC failures.
1. IHTRODÖCTIONThe stress corrosion cracking (SCC) of Zircaloy has been extensively studied in
order to elucidate the •erfianifm of pellet-cladding interaction (PCI) failure, and toinvestigate the reMdy [1-12]. It is known that the SCC of Zry-4 tubes is related tothe cabined effect of environment and mechanical stress. Iodine, which is producedas a fission product and which is present in various foras of compounds rather thanelementary iodine, acts as one of the corrosive agents[l-3], and the ISCC was oftenlyoccured during the creep deformation of fuel tubes in reactors [4-6]. The criticalconcentration of iodine (7-9] and the threshold stress [10-12] are known to be veryimportant to the ISCC of Zircaloy.In an attempt to understand the SCC failure mechanism of Zircaloy-4 tubes under the
various condition of variables including iodine concentration, manufacturingprocesses of tube, brazing and welding, and coating insides of tubes with graphite orsiloxane, four kinds of SCC tests on Zircaloy-4 tube specimens were conducted in thisstudy.
2. EXPERIMENTS
At first, the effect of various corrosive compounds of Csl, Pel,, All,, CsCl, andCsOH as well as I, on the SCC were examined as a function of their concentrationversus time-to-failure. Second, to study the effect of manufacturing process on theISCC, two kinds of tubes which were manufactured in different processes were examinedby measuring the metallurgical properties and threshold stresses of tube for ISCC.Third, because the end cap welding part of tubes would have a potential risk of PCIin CAHDO type fuels, the effects of welding process on the ISCC were measured on theZry-4 tube specimens of various welding processes and annealing treatment.Finally, toimprove the PCI failure resistance, the effect of graphite or siloxane coating in-side of claddings was surveyed in terms of threshold stress and/or critical iodineconcentration.
A tube-internal pressurization system [9] was used as the test apparatus in thisexperiment. A limited amount of iodine compound was loaded into the specimen using asmall glass ampule, and an air-driven gas booster was used to pressurize the highpurity argon gas into a tube specimen. The hoop stress of a specimen was calculatedfrom the normal equation for thin wall tube, and the iodine concentration vas definedas the amount of compound per surface area of a specimen. The fractograph of failuresection was observed using SEM.
3. RESULTS and DISCUSSION
1) ISCC Susceptibility in the Environment of Various Iodine Compounds.Figure 1 shows the ISCC susceptibility which is graphed in terms of time-to-
failure versus the concentration and the hoop stress of Zry-4 tubes in the corrosiveenvironments of Csl, Pel,, All,, CsCl, and CsOH as well as I,. The I, species showeda typical ISCC behavior at a critical concentration of about 0.3 mg/cm, while the Csland CsCl species were not so active to the SCC. Meanwhile, a ductile mode fracture
j 0.5 , i.oconcentroliommg/arnFigure I SCC Behavior with Various Corrosive Agents at 330 *C,467 HPa.

with microvoid coalescence vas observed in fractographs of the specimens. On theother hand, the CsOH species was found to be very corrosive like I, of which criticalconcentration was appeared at about 0.2 «g/c»2. The fractographs of CsOH-reactedspecimens shoved cleavage features. In case of FBI,, the value of ti»e-to-failure ofSCC gradually decreased with increase in iodine concentration, which was even lowerthan that for I, above 0.8 wjlczt. The fractographs related to Pel, did not alsodisplay any distinctive feature or any brittle-ductile transition »ode. The reactionof All, showed a trend similar to that of Pel,, but the value of ti«e- to-failure forAll, was higher. The All,-related fractographs showed a brittle fracture »odewithout microvoids.
Bven though identities of the corrosive sources to result in ISCC in fuel rods inreactors have not been clearly proven, All, or Pel, would be considered as apotential agent for SCC of Zircaloy-4 because Al and Fe can be present in pellets asan additive elenent or an iapurity. CsOH can also be foraed in operation by conbinigCs with Boisture in the failed fuel rods, in which the SCC of Zircaloy-4 occurs.2) Effects of Tube Fabrication ProcessesFignre 2 shows the ISCC behaviors of two types of Zry-4 tubes at 330 "C and 0.8 mgIj/c*. Curves of hoop stress versus ti»e-to-failure showed typical behaviors ofISCC of two types of Zry-4 tubes which were fabricated in different processes. Tubesof supplier A were »ore resistant to ISCC than those of supplier B, resulting inhigher threshold stress by about 30 MPa. Both types of coBKrcial tubes were stress-relieved, of which chencal compositions are nearly sa»e. The Kchanical properties,however, were a little different. Tubes of supplier A had lower Mchanicalproperties of ultimate tensile stress (UTS) and yield strength (YS) and elongation inlongitudinal tensile tests, hot had higher values of ultimate hoop strength (DBS) andtotal circumferential elongation (1X30 in burst tests than those of supplier B. Theoetallngical properties of both supplier's tubes were also a little different in
£400-
S50-T_ 5 ro
time to foikJrtlhr)
Figure Z ISCC Behavior of Zircaloy-4 fro» DifferentSuppliers at 330 -C. 0.8 D
5 10tin» to foilurtthr)
Figure 3 ISCC Behavior of Zircaloy-4 Tube withAppendices or End Plug at 330 "C.
texture. Hydride orientation in tubes of supplier A showed Fn nunbers of less than0.05 while the Fn = 0.1 in supplier B's tubes. This difference suggests that theISCC susceptibility of Zircaloy-4 cladding tube is dependent on the tube fabricationprocess, especially the terture and the toughness in a circumferential directionrather than in an axial direction.
3) Effects of Welding and Brazing Processes
In the fabrication of CANDU-type fuels, a resistant welding has recently been usedto seal the end caps, and a brazing process is employed to attach spacers and padssince it provides good mechanical properties as well as good metallurgical «dcro-structures. But welded parts of a cladding tube have a potential risk of PCI failureunder operation because they are located ia a high flux region without plena», andbecause welding-induced tensile stress or heat-affect zone aakes welded partssusceptible to SCC. In fact, Figure 3 shows the ISCC susceptibility of welded partsin CANDU-type fuels. End cap welding also appeared to be very weak to ISCC, as shownin an EP-ÄS curve in Figure 3, resulting in a threshold stress less than 150 NPa ofhoop stress which was 40% below of that of normal Zircaloy-4 cladding tubes. TheISCC was found to start at a notch foraed between the tube and the weld upset duringthe welding process. The welding process, in general, produces residual stressconçlexible wicrostructure and geoaetrical defects in a welded part. To rénove theeffects of residual stress, ISCC tests were carried out after annealing the weldingpart at 500 °C for 1 hour, fienoving the residual stress in welded parts «provedthe ISCC resistivity up to 230 MPa of threshold stress, as shown in the EP-HT curvein the figure. However, the ISCC occurred at a notch in the welding part, and the

threshold stress was also only 60% of that of Zircaloy-4 tubes. A modifiedresistance upset welding process!13] was developed to produce a smooth upset,resulting in alnost negligible notch effects. An EP-MD curve in the figure shows theISCC behavior of the part welded by the modified welding process. It showed quite agood ISCC behavior, above 230 MPa of threshold stress, but the ISCC occurred again inthe welded part.In burst tests without a corrosive agent, axial cracks were found along the tube,never in the welded part. However, a welded part of an end cap should have apotential risk of ISCC under iodine atmosphere, even though an annealing treatnentafter welding and/or a sodified welding process to reduce notch effects could resultin high inproveiient in the ISCC resistance.A brazing of spacers also had a potential risk of ISCC. ISCC occurred in thebrazing part along an axial direction, and the threshold stress of ISCC was about 270MPa, about 70% of that of Zircaloy-4 tubes, as shown in a BZ-SP curve in Figure 3.A main reason for this weakness would be metallurgical factors of coarse grains inthe brazed part.4) Effects of Graphite/Siloxane Coating
Graphite or siloxane is used as a coating Material inside the cladding tube toinprove the PCI failure resistance in CANDU-type fuels because coating naterials areknown to act as a lubricant, a getter of iodine and/or a protective barrier. InFigure 4, the ISCC behavior of graphite-coated tubes, which were baked at 300 °C for1 hours after coating at row temperature, were compared with bare tubes at 330 °C,0.8 «gli/cV. Graphite-coated tubes seened to be a little better than bare tubes toISCC resistance, but displayed al»ost the saae behavior. The threshold stress of thegraphite-coated tubes was about 360 MPa, comparable to the bare tubes. This resultsuggests that graphite coating nay not be so effective as a protective barrier. Onthe other hand, graphite coating appeared to influence the critical concentration ofiodine for SCC, even though the evidence was not so clear. As the iodine wassupplied in a constant anount using an ampule in this study, it was not easy to get
a2
test temp. " 330*ciodine con.- o 8mg/cn?
• bore tubeo graphite cooled tube
J_
N>W
time to foüure(hr)
Figure 4 Failure Tire of Graphited-coated and Bare Tubesas a Function of Hoop Stress.(Baking Condition : 300 -C, 1 hr)
3O 40 5O 6O TO BO SOholding lime for bokmglnranl
Figure 5 ISCC Resistivities of Siloiane Coated Zircaloy-4Tube Specioens at 330 "C.
an accurate value of a critical concentration. However, in the range of of 0.3-0.5Bglj/ofc concentration which was just about or above the critical iodine concentrationrequired in bare tubes, graphite-coated tubes displayed the sane or better ISCCbehaviors.Considering that the friction coefficient of a graphite-coated tube is less thanhalf of that of a bare tube, these results should lead to the conclusion thatgraphite-coating attributed to iaproving PCI/SCC failure by the roles of a iodinegetter and/or a lubricant rather than a protective barrier.Siloxane is known to be another candidate for a coating naterial to improve thePCI/SCC failure resistance. Since siloxane contains a large amunt of hydrogen, thecoating process is very important to keep the hydrogen concentration in Zry-4 tubesafter baking it below the specification. In this study, an ISCC behavior ofsiloxane- coated tubes was investigated according to the dilution ratio of diluent tosiloxane as well as baking tine. Figure 5 shows the ISCC behavior of siloxane-coatedtubes. ISCC resistance in the figure was represented using a relativeti e-to-failure which aeant the ratio of tine-to-failure of ISCC for asiloxane-coated tube, as compared with that for a graphite-coated tube. Both thedilution ratio and the baking tiie affected the ISCC resistance. In case of a lowdilution ratio such as 1, the ISCC resistance was not better as co ared withgraphite-coated tubes, resulting fron high concentration of hydrogen and froa poorbonding with »icrocracks on the coating. surface. For a high dilution ratio such as8, however, the tiae-to-failure of ISCC was alaost 3 tines that of graphite-coatedtubes. On the other hand, baking tine was related to forcing SiO> froa siloxane,which gave a weak bonding force, so that the ISCC resistance versus baking tine inthe figure showed a peak at a certain baking time.It is not known whether Siloxane plays a role as an iodine getter or a lubricant,thus, contrary to the case of graphite-coating, a protective barrier of siloxane-coating layer to ISCC should be of importance to iuprove the ISCC resistance.

M 4. SUMMARY—i.Iodine-induced stress corrosion cracking tests on Zircaloy-4 tabes were undertakenusing an internal pressurization method to elucidate the mechanism and to find outremedies of pellet-cladding interaction failure. Fel>, All, and CsOH acted as active
corrosive agents for SCC of Zircaloy-4, showing almost the same critical concentra-tion as that of I». Csl and CsCl, however, were found to be not active for SCC.The fabrication process of each coopany brought out certain characteristics of•echanical and metallurgical properties of Zircaloy-4 tubes, resulting in a differentISCC behavior. Tubes with high toughness in burst tests and with textures in aradial direction showed a good behavior of ISCC. In addition, the welding processmade ISCC resistance decrease up to 40% as compared with that of tubes as-received.An annealing treatment and/or a modified welding process showed some effect torecovery the ISCC resistance, but welded parts still had a potential risk of ISCC.Graphite or siloxane was found to be so effective to improve the ISCC resistancewhich seemed to be act as a getter of iodine and/or a lubricant, or a protectivebarrier, respectively.
[12] Ryu N.S., Lee J.Y., Rang Y.H. and Suk B.C., Strain rate dependence ofiodine-induced stress corrosion cracking of Zircaloy-4 under internalpressurization tests. J. Mat. Sei. 25 (1990) 3167.[13] Goh J.H. Lee J.H. and Jung S.H., Strain rate dependence of iodine-induced stress corrosion corrosion cracking of Zircaloy-4 under internalpressurisation tests. J. Korean Nuclear Society 23 (1991) 1.
T3Û)(QCD
REFERENCES[1] Peehs «., Stehle H. and Steinberg E., "Oot-of-pile testing of iodinestress corrosion cracking in Zircaloy tubing in relation to thepellet-cladding interaction phenomenon", Zirconin» in the Nuclear Industry
(Proc. 4th Int. Conf. Stratford-upon-Avon, 1978), ASTH STP 681, ASTM,Philadelphia (1979) Z44-260.[2] Cnbicciotti D., Syrett B.C. and Jones E.L., Stress Corrosion Cracking ofZircaloys, Rep. EPRI-NP-1329, Electric Power Research Institute (1979).[3] Ryu S.S., Hong S.I., Cnoi Y., Rang Y.fl. and Ria C.S., A study on theiodine-induced stress corrosion cracking of Zircaloy-4 cladding(I), J.Korean Nuclear Society 17 N3 (1985) 193.[4] Roberts J.T.A. et al., "A stress corrosion cracking model for pellet-cladding interaction failures in light-water reactor fuel rods", Zirconiumin the Nuclear Industry (Proc. 4th Int. Conf. Stratford-upon-Avon,1978), ASTH STP 681, ASM, Philadelphia (1979) 285-305.[5] Kreyns P.H., Spahr 6.L. and HcCanley J.E., An analysis of iodine stresscorrosion cracking of Zircaloy-4 tubing. J. Nucl. Mat. 61 (1976) 203.[6] Choi Y., Kang Y.N., Ryu U.S. and RIB C.S., The slow strain rate dependenceof Zircaloy-4 cladding tube in iodine atmosphere. J. Korean NuclearSociety 17 N3 (1985) 211.[7] Hermann P. and Spino J., Chemical aspects of iodine-induced stresscorrosion cracking failure of Zircaloy-4 tubing above 500°C. J. Nucl.Mat. 114 (1983) 50.[8] Une K., Deformation and fracture behavior of Zircaloy-2 deforced atconstant strain rate in iodine environment(I) (uniaiial). J. Nucl. Sei.Tech. 16 (1979) 577.[9] Ryu S.S., Kang Y.H. and Lee J.Y., Effects of iodine concentration oniodine-induced stress corrosion cracking of Zircaloy-4 tube. J. Nucl.Hat. 152 (1988) 194.
[10] Jones R.L., Yaggee F.L., Stoehr R.A. and Cubicciotti D., Thresholdconditions for iodine-induced stress corrosion cracking of unirradiatedZircaloy-4 tubing under internal pressurization. J. Nucl. Mat. 82(1979) 26.[11] Williford R.E., The iodine-induced strain rate sensitivity of Zircaloy
fuel rod cladding. Nucl. Eng. Des. 78 (1984) 23.

POSTER SESSION
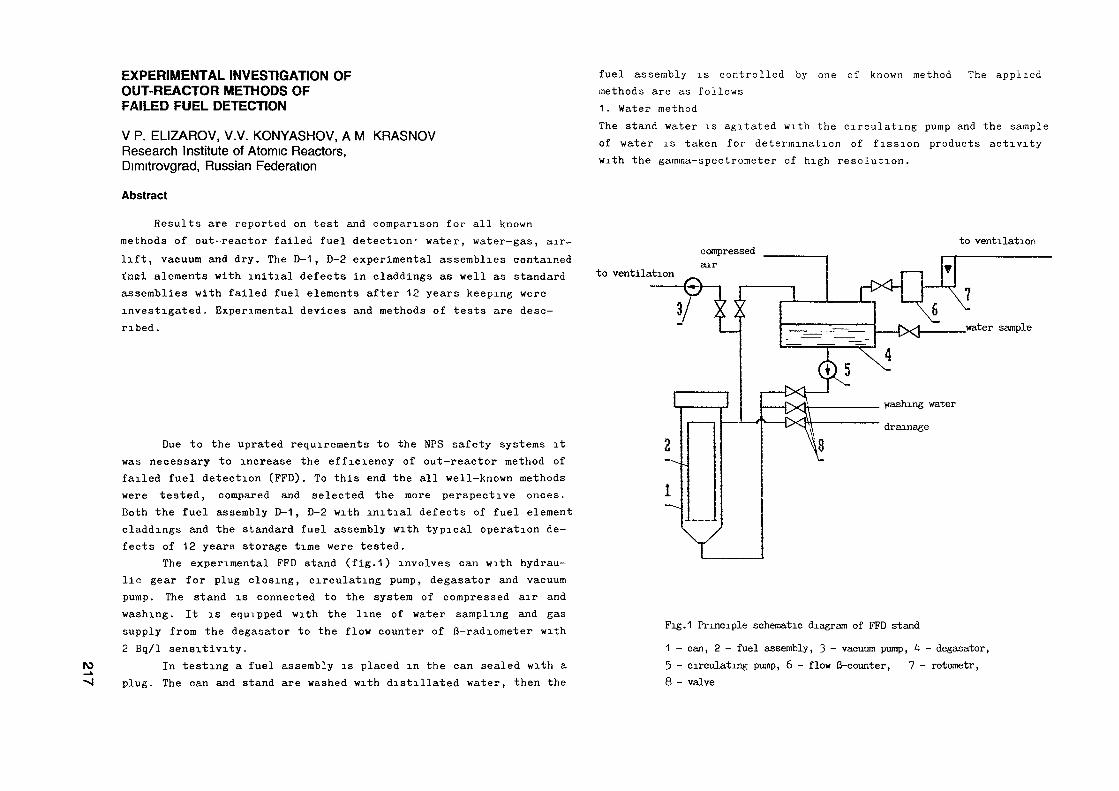
EXPERIMENTAL INVESTIGATION OFOUT-REACTOR METHODS OFFAILED FUEL DETECTION
V P. ELIZAROV, V.V. KONYASHOV, A M KRASNOVResearch Institute of Atomic Reactors,Dimitrovgrad, Russian Federation
Abstract
Results are reported on test and comparison for all knownmethods of out-reactor failed fuel detection- water, water-gas, air-lift, vacuum and dry. The D-1, D-2 experimental assemblies containedI'nai elements with initial defects in claddings as well as standardassemblies with failed fuel elements after 12 years keeping wereinvestigated. Experimental devices and methods of tests are desc-ribed.
M
Due to the uprated requirements to the NFS safety systems itwas necessary to increase the efficiency of out-reactor method offailed fuel detection (FPD). To this end the all well-known methodswere tested, compared and selected the more perspective onces.Both the fuel assembly D-1, D-2 with initial defects of fuel elementcladdings and the standard fuel assembly with typical operation de-fects of 12 years storage time were tested.
The experimental FFD stand (fig.1) involves can with hydrau-lic gear for plug closing, circulating pump, degasator and vacuumpump. The stand is connected to the system of compressed air andwashing. It is equipped with the line of water sampling and gassupply from the degasator to the flow counter of ß-radiometer with2 Bq/1 sensitivity.
In testing a fuel assembly is placed in the can sealed with aplug. The can and stand are washed with distillated water, then the
fuel assembly is controlled by one of known method The appliedmethods are as fo l lows1. Water methodThe stand water is agitated with the circulating pump and the sampleof water is taken for determination of fission products activitywith the gamma-spectrometer of high resolution.
to ventilation
to ventilation
.water sample
washing water
drainage
Fig.1 Principle schematic diagram of FFD stand
1 - can, 2 - fuel assembly, 3 - vacuum pump, ^ - degasator,5 - circulating pump, 6 - flow ß-counter, 7 - rotometr,8 - valve

N> To increase the rate of fission products release from the00 failed fuel elements into the circuit of FFD stand, the use is made
of pressure pulses generated by compressed air.2. Water-gas methodThe stand water is agitated with the circulating pump and the sampleof water is taken for determination of fission products activity.Also the fission products are degassed from water by a full-flowdegasator with continuous supply of the measured gas into the ß-radiometer.3. Airlifting methodWater is degassed by air entering into the lower sleeve of FFD can.Air is supplied through the upper sleeve into the flow counter tomeasure the fission gases activity.4. Vacuum methodVacuum generated in FFD can stimulates the fission products releasefrom the failed fuel elements. Then can water is sampled or/anddegassed with the following measurements of fission products acti-vity.5. Dry methodThe FFD can is dried and blown air which is dispensed to the flowß-radiometer.Process of fission gases release is intensified atthe expense of fuel element heat-up.
An objective of investigation is a choice of the FFD methodmeeting the current requirements but siufficiently simple for reali-zation. The current requirements are as follows: authentic informa-tion about existence and dimentions of defects in fuel elementcladding within the range of dimensions (including microdefects),the possibility for the inspected fuel assembly to be returned intothe reactor core. The more simple method was preffered.
As a result of numerous investigations the conclusions weremade.
The authentic method allowing to obtain the repeated results(existence and dimension of defect) is a method in which all deter-minant parameters are constant and do not dependent on an operator.The following methods are not concerned with the authentic once:the dry method due to non-controlled heat-up of fuel elements and
danger of their heat-up; the airlifting method due to nonuniformdistribution of air flow on the fuel assembly section with waterbubbling; the vacuum method due to data absence on water columnheight over defect determining the residual pressure within therange of defect. It is validated by the fact that results obtainedby these methods are impossible to repeat. Some times fissionproducts released from failed fuel elements change by severaltimes. In addition, the method mentioned above are complex forrealization.
Lg P, mFig.2. J-131 activity in stand water dependence on perimeter o£ defect
Time - 15 min.Fuel element linear power - 74 W/cm

The water method do not meet the current requirements due todata absence about gas activity needed to control the microdefectsin fuel element claddings.
The water-gas method is more suitable. For its realizationan operator must start up the circulating pump after washing ofthe can, recording of flow ß-radiometer and water sampling indefined time; in comparison with other methods the obtained resultsare less dependent on linear power of fuel element , location ofdefects against fuel element height and fuel assembly cross section.
The sensitivity of the water-gas method meets the currentrequirements. The estimation obtained from the results of the D-2fuel assembly control shows that cladding defects of 0.01 mm dia-meter will be recorded by increasing of gas-fission productsactivity with the flow ß-radiometer (control time - 15 min.,time after reactor shutdown - 15 days, linear power of fuelelement - about 100 Wt/cm). The high sensitivity of method wasshown with control of the three VK-50 standard fuel assemblieswith the failed fuel elements after 12 years storage. Excess ofgas-fission products activity (krypton-85) over phone level wasrecorded during 15 min. The rate of Cs-137 release from defec-tive fuel elements was controlled by measuring of water sampleactivity and reached 10 Bq/h.
The most important advantage of the water-gas method ispossibility for realization of diffusion mechanism of fission-products release from failed cladding that allows to determinethe defective size by fission products activity in the FFD stand.This method is based on calculation of diffusive fission productsrelease in the FFD stand for defects of different dimensions.The technique was validated by the VK-50 FFD stand with using ofthe D-2 fuel assembly with initial defects of known dimensions,(fig.2).
GEOMETRY VARIETY OF WER FUEL RODS
B.A. KANASHOV, V.l. KUZMIN, G.D. LYADOV,V.S. POLENOK, A.V. SMIRNOV, V.P. SMIRNOV, A.V. SUKHIKHResearch Institute of Atomic Reactors,Dimitrovgrad, Russian Federation
Abstract
The classified experimental data are presented for studyof dimensional stability of standard fuel rods for the WERtype reactors with Ü0„ fuel core in Zr-1%Nb claddings. Dyna-mics of the length change, diameter and the gap betweenfuel and claddings was investigated for three fuel assembliesof the VVER-440 reactor and four fuel assemblies of theVVER-1000 reactors in dependence of the fuel burn-up 22-45MWt day/kg of uranium.
10CO
IntroductionIn the process of operation the power reactor elements
are objected to the pronounced radiation, temperature and me-chanical effects leading to irreversible changes of dimensionsand shape. Having reached the definite values, these changesof construction parameters become the factor limiting theirfurther operation. Thus, for the search of the new design de-cisions, promising materials and nominal operation modes thepronounced volume of works is carried out now on investigati-ons of geometry of the spent fuel assemblies and their ele-ments. In the paper the results are presented on the changeof length, fuel element diameter and diametral gap between fu-el and cladding during their operation in the WER type reac-tors.

rorooCharacteristics of the tested fuel assembliesand elements
Three standard fuel assemblies of the VVER-440 reactorswere selected for investigations together with four fuel as-semblies of the VVER-1000 reactor. The main design parametersof the fuel rods are presented in Table 1 and the operationparameters are in Table 2.
Table 1Constructive parameters of fuel elements
P a r a m e t e r s Nominal valueVVER-440 VVER-1000
Fuel rod length, mmHelium pressure, MPaCladding materialExternal diameter of cladding,mmInternal diameter of cladding,mmFuel materialLength of fuel core, mmDiameter of fuel rod,mmDiameter of fuel rod hole,mmFuel rod diameter,mm
2557 38370.5-0.7 1.9-2.6
Zr-1% Nb alloy9.15 9-137.72 7.72
UO,""224207.601 .28-14
235307.531.49-14
Value meanings of fuel rods are known within tolerancefor production excluding fuel assembly N—0007 for fuel rodswith measured length and diameter in the state of the factorydelivery.
It should be noted that during the production of one as-sembly the cladding tubes and fuel rods were used as a ruleof several batches of delivery. This fact introduces the ad-ditionary variations into their geometrical values and ini-tial features.
Ilethodics and measuring resultsFor measurement a combined method was used comprising me-
asurement of various height of all the fuel rods directly inthe bundle and absolute length of several fuel rods. For thissampling a calibration straight line was plotted in the coordi-nates "height difference vs absolute length of fuel rods. Thisline served as a basis for the length calculation of the restfuel assembly rods
Table 2Main characteristics of fuel assembliesand rods operation
Reactor type
VVER-440
VVER-1000
NFS
*NVNV**RNVNV***SUNV
FAnumber
6878090660068000701061114
Operationdurationef fee. day657
1004811488820878882
AverageburnupMWt A//kgU
24.232.836.821.732.636.744.7
CoolantpressureMPa
12.5
16
Max.T°C> ofclad.
350
380
Novo-Voronezhskaya**Rovenskaya#**South-Ukrainian
Height difference was defined as the distance from the per-pendicular axis of the fuel rod bundle of calibration platformup to their upper ends. Absolute length of the fuel rod wasmeasured by comperison with the absolute length of the refe-rence sample with cathetometer KM-6 or indicator head of roundshape. Outer diameter of the fuel rod cladding in preset cross-section and in asinuthal orientation was measured by contactmethod using a converter of magnetic scale type

Diameter, mmto (D
o>(OCD
Q.m
O.o
m33ooo
roro
For calibration and sustaining of stable rnetrological cha-racteristics of technical means and methods as a whole, thecomplex of standard samples of outer diameters was used Thesummerized ultimate error of a single measurement was ;+ 0.01mm.
The measurements were carried out in two mutually perpen-dicular orientations with a 2mm pitch.
Diametral gap , between the fuel core and cladding wasmeasured on metallographic specimens perpendicular to the fuelrods axis The measurements were carried out with the remotemicroscope by comparison with the reference sample. The errorfor -, was 4^30um
In every fuel assembly a group of 30—60 rods was investi-gated in detail. The fuel rods were placed on three diagonalsconnecting the opposite ribs of a hexagonal tube. Metallogra-phic investigations were carried out for 3-5 rods and the lengthmeasurements were carried out on the most number of fuel as-semblies for all fuel rods.
Fig.1 presents the distribution of the average diameterand the cladding ovality along the VVER-1000 fuel rod length.Variety of the cladding diameter (absolute and relative) wasdetermined in dependence of the initial diameter.
The general view of diagramms is characterized by thefollowing :
- the greatest decrease of diameter is observed in cent-ral part of fuel rod
- in the process of operation practically all fuel rodsbecome oval and the period of ovality is differingfrom rod to rod
- on diagramms of the average diameter the periodicityis observed and it is multiple of the length of a fuelcore ( 11mm) for the fuel rod with burnup more than35 MWt day/kgU.
The summenzed results of fuel rods elongation ( 1)and diameter variety ( 1) investigations are presented inTables 3 and 4 .

rofO10
N^of FA
687809066006800070106III4
Table JElongation of WER-440 and VVER-1000 fuel rods
Quantityof
testedfuel rods
1261261263173174451
Absolute elongation, ran
minimum
3-05.06.52.23-66.38.7
max .
7.09.2II. 8II. 416.913-517-0
average
4.96.79-16.210. 010.313-2
RSS
0.80.91.21.21.71.62.0
Relative
Average
0.190.260.360.160.260.270.35
elong-n,?
RSS
0.0290.0330.0460.0300.0440.0420.052
««.
co•H-P8]tono
Table 4
Average variety of diameter in central pertof fuel rods of WER-440 and VVER-1000 reactors
NiofFA
687809066006800070106III4
Quantityof testedfuel rods
14243252614451
Absolutevalue , mm
-0-0-0-0-0-0-0
,07.09.10.05.07.09.10
RSS
0.0.0.0.0.0.0.
02090202010202
Relativevalue , %
00I00II
.81
.93
.05-53.79.02.07
RSS
0000000
.24
.22
.20
.21
.10
.23
.22
U.'+U
0.35 -_
0.30 -Ê
0 25 "
0.20 -E
0.15 -_
n m "
TB<
</T]
TBC?
/:péi J3C068
TBCO
\09A6
V
56 /
///
TBC 1CFBC007
-H=>-^B€/
6
44-4 ——
15.00 20.00 25.00 30.00 35.00 40.00 45.00 50.00
Burnup, MW d/kg Ü
FIG. 2.Dependence of relative elongation of fuel rods for WER-440 (o) and WER-1000 (D)
on average bumup.
On the stage of regressive analysis the elongation 1and diameter decrease d dependences f rom fuel burnup Bwere studied for all the investigated fuel assemblies. Theresults obtained show that the dependences between 1 andfuel burnup in WER-440 and VVER-1000 fuel rods have a linearcharacter and the inclination of the W"R-440 line is moretight (Fig .2) .

-p<a
U ^U -3I
0 60 -E
080 Î
1 \J u _
-1 20 -=
QÎBC068
TBC387 U
TBC8
QTBC007
09 O
TBCQ66 O
1 0 00 20.00 30 00 40
Burnup, MW d/kg U
QTBC114
00 50 00
FIG 3Dependence of diameter i Native vanety of fuel rods for VVER-440 (o) and
WER-1000 (D) on fuel bumup
0 15
0 10
005
000 I I I I I I I I I I I I I I I I I I I T I I I I I I I I I I I I I I I I
1000 20.00 30.00 4000 5000
Burnup, MW d/kg U
FIG 4Dependence of diameter gap between fuel and cladding on fuel bumup
toN>CO
For all measured fuel rods of every fuel assembly thestatistic connections between 1 and B, d and B werestudied on the stage of preliminary analysis. In this casefor one fuel assembly the correlation coefficient between theindicated parameters didn't exceed K=0.64. If the fuel rodsof assembly N-0007 belong to various technological batches ofcladding, the correlation coefficient between elongation andburnup increases critically in every batch as well as betweendiameter decrease and burnup
Fif.3 shows the dependence of the averaged decrease ofthe cladding diameter in a central part of rods for the inves-tigated assemblies. As seen from the figure, the points forVVER-440 and VVER-1000 are forming practically a common depen-dence, although there is a slightly greater effect of diameter
decrease for VVER-440 fuel rods. When burnup is 35 MWt day/kgU,the rate of diameter decrease is tended to be lower and whenburnup is about 40 MWt day/kg, the diameter decrease stops onthe level of —|— = I.Mi.
Measurements 01" a diameter gap under the normal conditions(Fig.4) between fuel and cladding in the zone of the maximumburnup showed that in the range from 20 to 30 MWt day/kgU itsvalues decrease monotonously from 0.11 - 0.17mm to 0.03-0.08mm.When burnup was more than 35 MWt day/kgU the diameter gap didn'texceed 0.02-0.04mm. Estimation of the difference between ther-mal expansions of the claddings and fuel values in radial di-rections under a nominal mode of operation showed that the va-lue was 0 07-0.10mm. It is 0.03-0.08mm more than the minimum"cold" gap at the burnup exceeding 35 MWt day/kgU

HO ihre, a part of pellets was pressed out by the cladding•^ tightly during operation beginning from 30 HWt day/kgU burnup.
Mechanical pressure of fuel on the cladding compensated insome degree the coolant pressure and correspondingly decreasedthe pressing strength in it. As a result of it the cladding di-ameter decrease stopped at the values of burnup exceeding35MWt day/kgU (Fig.3).
ConclusionsIt is known, that with the absence of a contact between
fuel and cladding the deformation may be a result of creep a ra-diation growth for the WER fuel claddings. When the contactoccures, the cladding is effected by the pressure of the swell-ing fuel and as a result of it the tensile quasistatic stressoccures. Besides, when the reactor capacity changes, a short-term stresses take place leading to the cladding deformation bya ratchet-and-pawl type.
Assesment of the fuel cladding deformation caused by radia-tion growth can be carried out in the following way. Length anddiameter of guiding tubes of assembly 0007 control rods weremeasured during post-reactor investigations. During in-pileoperation the walls of the tube are pressed from all sideswith the coolant pressure of about 16MPa. Under such conditi-ons the component of the stressed state is absent which couldcause a tube material creep. Consequently, the only mechanismof deformation is a radiation growth. Profilometry of theguiding tubes and the length measurement show that elongation inreference to niminal value was only 0 2mm and average diameteralong the tubes length is changing within the limits of 0.3mm.
Thus, the radiation growth at the initial stage when thefuel burnup is 32.6MWt day/kgU, produces a small effect on thedeformation of Zr-1%Nb tubes in the fuel assembly of VVER-1000.
The results obtained are not contrary to the literaturedata, according to which the radiation growth causes a pronounc-
22 _2ed rate of macrochanges beginning from fluence 2.2 10 cm(E O.IMeV) by linear dependence during the irradiation of thecladding samples in spectrum of the BOR-60 reactor.
Evidently, for assembly 0007 the critical level of damagehas not been yet reached in the tubes material, when the radia-tion growth rate increases sharply.
The fuel rod claddings are under another tensile state incomparison with the guiding tubes, as the gaseous pressure inthe fuel rods doesn't put the coolant pressure in equilibrium.Calculation estimations show that because of the pressure dif-ference the component of pressing stresses occures in tangen-tial direction = 60IlPa. Due to these stresses at the expenceof creep ,the fuel cladding diameter decrease takes place. On thesite of the fuel core the diameter decrease is observed untilthe cladding is in contact with fuel cores. Complex results onthe change of the cladding diameter and value of the diametergap with burnup (Figs. 3 and 4) show that the contact of fuelwith cladding for VVER-1000 and VVER-440 occures at the burnupof B = 30MWt day/kgU. This is an averaged value and it dependson the following factors: initial diameter gap, fuel densityand operation parameters. So for some fuel assemblies, fuelrods and even some parts of rods the burnup value can be dif-fered from the indicated one in the case of the mechanicalcontact of the fuel core and cladding.
At the burnup exceeding B , the swelling fuel cores candeform the cladding, that was observed in some fuel rods offuel assemblies 0662 and
Reference
1. G.P.Kobylyansky et al. Radiation form variety ofthe cladding and channel tubes of Zr alloys at high neutronfluences. Proceedings of International Conference on Radia-tion Material Science, Alushta, May 22-25, 1990, vol.4.

10MUl
MEASUREMENT METHODS OF GAS FISSIONPRODUCTS QUANTITY UNDER FUEL ELEMENTCLADDINGS BY MEANS OF DEEP COOLING
A.V. SUKHIKH, E.P. KLOCHKOVResearch Institute of Atomic Reactors,Dimitrovgrad, Russian Federation
Abstract
Quantitative non-destructive expressive techniques for fission gas release analysis are
described. The techniques use Xenon and Krypton low temperature condensation.
Barometry of fuel element gases is an integral componentof all programs of post-reactor fuel element investigations.Pressure of gas fission products (GFP) possesses informationabout the tightness degree and fuel element operation regimes.Development of non-destructive methods of determining this valueis one of the problems the priority of which seems obvious.
The investigations carried out in RIAR and aimed at solutionof this problem allow the methods based on GFP transport to acondensed state to be recommended for such purposes.
The essence of the proposed methods lies in obtainingthe GPP condensate and registering changes of the fuel elementparameters in the area of gas collector using an external indi-cator appliance.
Fig.1 presents a block-diagram of the facility for perform-ing the radioactive Kr-85 quantity determination in a hard GFPcondensate using a gamma-spectrometer. Fig.2 illustrates thedesign of the facility for generating a Xe and Kr condensatein a local region of the fuel element gas collector. Fig.3 showsthe spectrum region near the Kr-85 gamma-line with energy 514 keVprior to and after cooling of the fuel element. Hetrologicalinvestigations demonstrated that the method gives an acceptableaccuracy as early as at 0.01 MPa of the partial GFP pressureunder the WER fuel element cladding.
1 — Gamma—spectrometer detector2 - Collimator in the shielded chamber wall3 - fuel element under study4 - fuel element adjustment mechanism5 - cooling node
FIG. 1. Device for determining the quantity of radioactive Kr-85 in the GFP condensate.
1 - fuel element2 - dévide vessel3 - seal node4 — liquid nitrogen5 - Xe and Kr condensate
FIG. 2. Fuel elements cooling device.

toN)
-p•rtc
>,-P
3o1
VCO
O,
Energy, keV
a) prior to cooling;b) after cooling of fuel element
FIG. 3. Region of gamma spectrum within the fuel element gas collector.
Fuel elements
1 - fuel, 2 - gas collector, 3 - fuel element plug,4 - Xe and Kr condensate
FIG. 4. X ray pictures of fuel element gas collectors after cooling.
GFP quantity can be estimated with the help of geometricalsizes of the condensate. Fig.4 presents an X-ray photograph ofgas collectors of spent fuel elements after cooling. Absence ofliquefied gases in fuel element N5-? evidences of its untightness.Shape of the condensate meniscus observed in steel fuel elementsis connected with the measuring scheme, namely, with fuelelements location at an angle 45° to the X-ray flux. Height ofthe condensate column being an informative parameter of GFPquantity can be easily measured with change of the angle up to90° (Fig.5). The absorption method of determining the GFP quanti-ty is characterized by high productivity and visuality of theresults obtained. The sufficient measurement accuracy can berealized (using know-how) as early as at 1 n cm of GFP underthe fuel element cladding.

N»ro
a,b - horizontal and vertical variant of X-ray aparatus location1 - X-ray apparatus, 2 - fuel element, 3 - flask with coolingagent, 4 - X-ray film.
FIG 5 Scheme for realizing the method for GFP quantity determination according togeometrical sizes of its condensate
0
1 - 85% He + 15% air2 - 70% He + 30% air3 - 100% air, total mixture pressure
1-105 Pa.
AT.K
FIG 6 Temperature jump value on the gas collector cladding of fuel element mocK-up withdifferent composition of helium-air mixture
The third measurement method of GFP partial pressure isbased on fast cooling of a fuel element part and on registeringchange of cladding temperatures in the area of the gas collectorusing a special thermo-electrical converter. After cooling thepressure of gases in a fuel element falls abruptly due to ad-sorption and transport of some components of fuel elementatmosphere to a new phase state. Drop of the pressure leads tocooling of gas and fuel element cladding outside the thermalperturbation area.
Fig.6 presents the measurement results for the claddingT of fuel element mock-ups with different content of the helium
air atmosphere components. The value of a temperature jumpdepends on the fraction of air components in helium liquefyingduring cooling of the fuel element with liquid nitrogen.
All the enumerated methods can be used not only undershielded chamber conditions but also at posters of fuel elementinspection in water cooling pools in investigations or repairworks of demountable fuel assemblies. The cooling device in thiscase contains 2 sealing units and along with the channels forliquid nitrogen circulation via the chamber includes pipesfor compressed air supply and discharge of water let intothe system during recharging of the regular fuel element undercontrol.

MN)00
INVESTIGATIONS OF RADIOACTIVE FISSIONPRODUCT RELEASE FROM FUEL ELEMENTSWITH INITIAL CLADDING DEFECTS DURINGOPERATION OF THE VK-50 REACTOR
V P ELIZAROV, V.V. KONYASHOV, A.M. KRASNOVResearch Institute of Atomic Reactors,Dimitrovgrad, Russian Federation
Abstract
Results are reported on measurement of fission productactivity in reactor water and off-gas during D-1 and D-2 experi-mental assemblies irradiation. Every assembly contained threefuel elements with 01 mm cladding holes in zone of maximum localpower. Time of assembly D-1 is 5 years, that of D-2 - 2 years.Linear power of fuel elements in assembly D-1 reached 70 W/cm,in assembly D-2 - 100 W/cm. Fission products release from fuelelements with initial defects during irradiation was calculatedon experimental data of fission products activity in the reactorcircuit and compared with modelling calculations.
Experimental fuel assemblies with fuel elements possessinginitial cladding defects have been irradiated at the VK-50 reac-tor since 1984 for experimental substantiation of calculationtechniques of radioactive fission products (RFP) release fromfailed fuel elements in conditions of water-cooled reactor opera-tion and in those of controlling the fuel assemblies with failedfuel elements after shut-down of a reactor. Experimental fuelassemblies D—1 and D-2 are manufactured according to the stan-dard technology, but 3 fuel elements in each fuel assembly havethrough cladding defects in the form of holes, 0.9-1.0 mm indiameter, in the zone of maximum linear power (about 1/3 ofthe fuel element height) For D-1 the holes in fuel elementcladdings were drilled following the fuel element setting up,
and for D-2 - following drilling of claddings the first stepinvolved debumng inside the cladding and the second onefilling it with fuel pellets Fuel elements with initial defectsin D-1 were located in the inner row, and in D-2 - in the penul-timate outer one. The D-1 fuel assembly was irradiated in theVK-50 reactor with linear power of the fuel elements under study50-70 W/cm for 5 years, fuel burnup in them achieved 18,000MW d/t uranium. The D-2 fuel assembly is loaded into the reactorafter the removal of D-1 and is irradiated the second year withlinear power of the fuel elements under study 90-120 W/cm.
Prior to loading of the D-1 fuel assembly there were nofailed fuel elements in the VK-50 reactor core and backgroundRFP levels in the reactor circuit caused by surface contaminationwith fuel were carefully studied l\l. The equivalent core conta-mination with U-235, calculated due to the radionuclide activityof krypton, xenon and iodine, made up about 10 mg.
Control of the RFP activity in the NPP circuit was performedby means of the following method. Radioactive inert gases —krypton and xenon radionuclides were registered in fume-off ofthe turbine ejector at NPP, where more than 95% of their totalamount are released. Other radionuclides are accumulated in thereactor water, and a part of them is transferred to the distil-lation decontamination facility with the reactor water. Samplesof the ejector gas and reactor water were measured at the gamma-spectrometer with a semiconducting detector.
RFP release from fuel elements with initial defects (R/B)was calculated according to the measurements results of the RFPactivity. The leakage rate (R) was determined by the RFP activityin samples, the formation rate (B) - by calculation of the knownfuel element power.
Unfortunately, the condition did not allow the experimentwith D-1 fuel assembly as at least 2 more failed fuel elementswere formed in the reactor core in 1.5 years of irradiationwhich led to considerable growth of the gaseous radioactivefission products (GFP) activity (see Fig.1). In this case con-tribution of GFP, leaving the fuel elements with initial defects

-2T.-, O/DJ-'9 IV L<
-3 f
-4
80 '
40
N>WCD
0 SO 180 270 360 450 540 630iim, à
Fig-1. Change of Xe-133 release from fuel elements withinitial defects during the D-1 fuel assemblyirradiationq - linear power of a fuel element with initial
defect
of the D-1 fuel assembly, since that time made up, probably,no more than 20% of the total GFP activity. In fact, after theD-1 fuel assembly extraction from the core, the GFP activityin the reactor core did not practically change. GFP releasefrom the fuel elements with initial defects was practicallyconstant during the first 1.5 years of irradiation prior todefects formation in standard fuel elements. The data obtained
coincides within the measurement errors with the results of-lodel calculations (Tab.1, Fig.2).
The RFP activity levels in the reactor water during theD-1 fuel assembly irradiation for the first 1 .5 years did notexceed their background values measured while operating withoutfailed fuel elements. The estimations show that iodine radio-nuclides release from the fuel elements with initial defects
Table 1Comparison of Calculated and Experimental Dataabout GFP Release during D-1 Fuel Assembly (f/a)
Irradiation
Huclide
Xe-133Xe-135Kr-85mKr-88Kr-87Xe-138
GFP release, %calculation
fromrecoil
4.65E-24.65E-24.83E-24.83E-24.83E-24.65E-2
Notes:
fueldiffusion
1.83E-21.83E-21.79E-21 . 41 E-20.95E-20.41 E-2
1 . Pressure in the VK-50 reactor -
sumfrom f/e
14.1 E-26.48E-26.62E-26.24E-25.78E-25.06E-2
13.7E-23.96E-23.97E-23. 01 E-21.71 E-25.08E-3
experiment
from f/e
(11±3)E-2(5-3±1-3)E-2(4.9±1.2)E-2(2.4±0.8)E-2(2.0±0.8)E-2(6.0+2.7)E-3
6.2 MPa, average linear power ofthe fuel element with initial defect - 70 W/cm.
2. Calculations of GFP release include- ratio of the fuel surface area to its volume is equal to 300
I/cm,- diffusion coefficient is equal to the sum of radiation-
stimulated and thermal diffusion coefficients;- leakage coefficient of Xe-133 from under the cladding of
a fuel element with initial defect makes up 7-10- medium under the fuel element cladding — steam
1/s;

10v>oTable 2
50 100 150 200f/e bottom lj CMFig.2a. Distribution of temperature and linear power
along ~the fuel element with initial defect ofthe D-1 fuel assembly1 - temperature in the centre of a fuel pellet2 - temperature on the surface of a fuel pellet3 - linear power (average value 70 W/cm)
-2LgR/B
-3 v
-4 - :
i33-5
135 85« 88XeuKr "
-6 -5 -4 -3LgA.,1/.
Fig.2b. GFP release from fuel and fuel element withinitial defect of D-1 f/a versus the radioactivedecay constant1 - calculation of GFP release from fuel2 - calculation of GFP release from f/eÎ — experimental values
Comparison of Calculated and Experimental Dataabout GFP Release during D-2 Fuel Assembly (f/a)
Irradiation
Xe-133
Xe-135
Kr- 85m
Kr-88
Kr-87
Xe-138
Xe-133
Xe-135
Kr-85m
Kr-88
Kr-87
Xe-138
Xe-133
Xe-135
Kr-85m
Kr-88
Kr-87
Xe-138
GFP release, %
Calculation
h, g' H, from fueljim I/a ——————————————————————— from f/e
cm recoil diffusion sum
BO 954.E-5 2.78E-2 66.7E-2 69.5E-2 66.9E-2
2.78E-2 13.1E-2 15.9E-2 7.98E-2
2.85E-2 12.7E-2 15-5E-2 7.51E-2
2.85E-2 10.0E-2 12.9E-2 4.73E-2
2.85E-2 6.74E-2 9.58E-2 2.23E-2
2.78E-2 2.90E-2 5.69E-2 3.88E-2
60 953.7E-5 2.85E-2 25-9E-2 28.8E-2 27.6E-2
2.85E-2 5.11E-2 7.96E-2 3.83E-2
2.92E-2 4.93E-2 7.85E-2 3.64E-2
2.92E-2 3.89E-2 6.81E-2 2.38E-2
2.92E-2 2.62E-2 5-54E-2 1.21E-2
2.85E-2 1.13E-2 3.98E-2 2.53E-2
20 1191.E-5 3.04E-2 11.4E-2 14.6E-2 12.6E-2
3.0'tE-2 2.28E-2 5.31E-2 1.03E-2
3.1-E-2 2.20E-2 5-31E-2 1.00E-2
3.12E-2 1.74E-2 4.85E-2 6.42E-3
3.1-E-2 1.17E-2 4.29E-2 3.06E-3
3.04E-2 0.50E-2 3.54E-2 0-75E-3
Experiment
from f / e
(68+l6)E-2
(7.0+1.6)E-2
(8.3+2.0)E-2
(4.5+1.0)E-2
(3.1+0.7)E-2
(5-5+2.2)E-3
(28+8)E-2
(4.0+1.0)E-2
(2.5+0.8)E-2
(2.3+0.4)E-2
(1.3+0.3)E-2
(5-5+2.6)E-3
(10+3)E-2
(1.5+0.5)E-2
(1.0+0.3)E-2
(6.9+2.0)E-3
(2.4+0.8)E-3
(1.7+0.9)E-3
Notes: 1. Pressure in the VK-50 reactor - 4 HPa.2. Symbols in Table 2: h - gap; q - average linear power of
the fuel element with initial defect; M - leakage coeffi-cient Of GFP £rom under the failed f/e cladding.

k H/CM
0 50 100 150 200f/e bottom J ÇJQFig-3a. Distribution of temperature and linear power
along the fuel element with initial defect ofthe D-2 fuel assembly1 - temperature in the centre of a fuel pellet2 - temperature on the surface of a fuel pellet3 - linear power (average value 95 W/cm)
-2"
-3.,
Lg R/B
~5135 85x88 8?
Xe MKr "Kr
CO
-6 -5 -4 -3Fig.3b. GFP release from fuel and fuel element with Lg X, 1/s
initial defect of D-2 f/a versus the radioactivedecay constant1 - calculation of GFP release from fuel2 - calculation of GFP release from f/eJ - experimental values
-2Lg P/B
-3 -
-4
1208040
0-V\
90 180 270 360
8040
* 0450ine, àFig.4. Change of Xe-133 release from fuel elements
with initial defects during the D-2 fuelassembly irradiationq - linear power of a fuel element with initial
defecth - value of the fuel-cladding gap (calculation)
is equal to less than 1% of the GFP release in the stationaryoperation of the reactor. This result was, perhaps, caused byimperfect production technology of initial defects and requiredadditional investigations for the purpose of which the D-2 fuelassembly had been manufactured.
Fuel elements with initial defects of D-2 are irradiatedat the linear power nearly 2 times greater than that of the samefuel elements in D-1 fuel assembly, so GFP release at the initialirradiation stage was 4-6 times higher (Tab.2, Fig.3)- However,

N>CON>
0 50 100 150 200f/e bottom lj CNFig.5a. Distribution of temperature and linear power
along the fuel element with initial defect ofthe D-2 fuel assembly (gap 60 urn)1 — temperature in the centre of a fuel pellet2 - temperature on the surface of a fuel pellet3 - linear power (average value 95 W/cm)
-2
-5
100
0f/eFig
50 100 150 200bottom lf CH6a. Distribution of temperature and linear power
along the fuel element with initial defect ofthe D-2 fuel assembly1 — temperature in the centre of a fuel pellet2 - temperature on the surface of a fuel pellet3 - linear power (average value 119 W/cm)
-3-r
-4-t
-5 T
-6 -5 -4 -3Fig.5b. GFP release from fuel and fuel element with LÏ A» 1/s
initial defect of the D-2 f/a versus the radio-active decay constant1 - calculation of GFP release from fuel2 - calculation of GFP release from f/eJ - experimental values
-6
Lg R/B
133.Xei135 85t* 88Xe KP KP 87 138
J_ Xe.-6 -5 :4 -3Fig.6b. GFP release from fuel and fuel element with "9Aj l's
initial defect of D-2 f/a versus the radioactivedecay constant
1 - calculation of GFP release from fuel2 - calculation of GFP release from f/eÏ - experimental values

fOCOCO
in the process of irradiation it gradually decreased, for example,Xe-133 release in 430 days of irradiation made up only about 25»of the original value (see Fig.4)
These experimental data can be explained supposing thatat high fuel temperatures (more than 1700 iO the swelling fuelreduces the fuel-cladding gap which leads to decrease in the fueltemperature and, thus, to decrease in RFP release from the fuelmoreover, after reduction of the fuel-cladding gap to the criti-cal value (about 20 urn) the pulsation mechanism of GFP transportunder the failed fuel element cladding stops, and the diffusionmechanism presents considerably lower values of GFP release fromunder the galled fuel element cladding to the coolant /2/.Tab.2 and Figs.3,5,6 show that with such suppositions there canbe achieved good agreement of the experimental and calculateddata.
At the first stage of the D-2 fuel assembly irradiation,release of 1-131 with the value 5% of the corresponding valuefor Xe-133 was thoroughly registered from fuel elements withinitial defects. Approximately the same relationship of theseradionuclides release (about 1/10) was observed at the VK-50NPP during operation with natural failed fuel elements /3/.
REFERENCES
1. Bordachev V.G., Vasilischuk A.V., Konyashov V.V.,Yakshin E.K. Radioactive Fission Product Distribution withinVK—50 Atomic Power Plant Circuit under Non-Defected Fuel ElementOperation. Preprint RIAR-25(67O - M.: CNIIatominform, 1985.
2. Konyashov V.V., Krasnov A.M. Method for Calculationof Fission Product Release from Fuel-Cladding Gap of FailedFuel Element to Coolant. Paper of the IAEA Technical Committee,26-29 Hay, 1992, Dimitrovgrad.
3- Konyashov V.V., Shkokov E.I., Chechetkin Yu.V , YakshinE.K. Experimental Investigations of Radioactive Fission ProductRelease from VK-50 Failed Fuel Elements.Atomic Electric Stations,Is.5, M.. Energoatomizdat, 1983, P.185-189.
METHOD FOR CALCULATING FISSION PRODUCTRELEASE FROM THE FUEL CLADDING GAP OFA FAILED FUEL ELEMENT TO THE COOLANT
VV KONYASHOV, AM KRASNOVResearch Institute of Atomic Reactors,Dimitrovgrad, Russian Federation
Abstract
The model is presented for mathematical description ofinert gas fission products release from failed fuel elementcladding to coolant of a water cooled reactor. Results of cal-culations are reported on coefficient for different values ofdefect dimension and location, fuel-cladding gap, decay constant.
One of the most important problems of NPP safety is predic-tion of radioactive fission products (RFP) release from failedfuel elements to the primary circuit coolant. A lot of works aredevoted to RFP release from fuel, but RFP release from the fuel-cladding gap of the failed fuel element was just slightly consi-dered. An attempt was made in this paper to compensate thisdeficiency and to explain the available experimental data on RFPrelease from the failed fuel element fuel-cladding gap to thecoolant using a calculated model with allowance for real pro-cesses under the fuel element cladding.
Let us consider a container fuel element of the water-cooledreactor with the fuel column length L consisting of pellets withdiameter b and inner hole with diameter d, fuel element claddingr, the fuel-cladding gap thickness h, gas collector length a,with the fuel elemen* defect having area S,located at distance 1from the lower face of the fuel column.

totOJi.Transport of the i-th radionuclide in the failed fuel
element fuel-cladding gap is described by the equationÖC/ Bt = q - div (J + C 7) - A C IM
where C - local concentration of the i-th radionuclide,q - rate of the i-th radionuclide release fron fuel per a
medium volume unit of the fuel-cladding gap;3 - flux density of molecular diffusion for the i-th
radionuclide ;v - medium movement rate,À - decay constant of the i-th radionuclide;Molecular diffusion is determined by a gradient of the con-
centration, temperature and pressure. The ratio for calculatingthe flux density of molecular diffusion is as follows:
=-D o [kt V (In T) + k^ V(ln P)] } ,where P - medium density;
k. = D. / D, kb = D, / D - thermodiffusion and barodiffusionratio ;
D, D. , Dfc - coefficients of concentration, thermo- and baro-diffusion.
Equations IM and /2/ can be simplified- for fuel elementof water-cooled reactors the gradient of temperature and mediumpressures along the fuel element are small, i.e. contributionof thermodiffusion and barodiffusion can be ignored (k, •&• 1 ,k, •* 1). Since under real conditions L5>d, 1 *>d, the equationof GFP transport in the fuel element fuel-cladding gap willbe reduced to a one-dimensional one and the transport equationwill be as:
D
Let us consider first of all the case when there is noconvective transport < v = 0 > , and the processes of GFP trans-oort in the fuel element fuel-cladding gap a*-e determined bymolecular diffusion caused by their concentration gradient
in the medium filling the fuel element. Equation /3/ will be as
Ik/
Initial and boundary conditions are-
= 0, /6/
D S B/àx [Ci (l,t)] = D So Cx (l,t)/r /?/
where S - area of the fuel-cladding gap cross-section;S - area of the cladding defect.
Solution of equation A/ for stationary state (cX /Ot = 0)in case of uniform energy release distribution along the fuelelement is as follows:
m 2 Sin jn_ , j<,- . 5 " e I— , /8/
where ^ - root of equation ctg 0 =^> / BB = S l/ S r - Bio critérium.
Integrating equation /8/ along the fuel element takinginto account the given energy release distribution we shallfind the number of atoms of the i-th GFP in the fuel-cladding gap(N ) , and using the expression for calculating the GFP fluxthrough the defect from eq./7/ we shall define the GFP releaserate from the failed fuel element (R ). Then the leakagecoefficient (M ) determined as the R /N ratio can be calcu-lated by simple formulas for microdefects (B •* 1) and developedraacrodefects (Bi>>1):
D/ St r)
M = OT*D S/ 4 S.)i t
with B 1 , /9/
with Bl>>1 , /10/

roCO
where 1. , !„ — distance from fuel element ends to the claddingdefect,
S. - area of cross— section of the fuel-cladding gap andcentral fuel hole:
-4
= So D / S r
= .
It follows from ratios /9/ and /10/ that for microdefectsthe GFP leakage coefficient from the failed fuel element fuel-cladding gap is in proportion to the defect area, and fordeveloped macrodefects - it does not depend on it. Let usestimate the GFP leakage coefficient for the developed macro-defect. GFP diffusion coefficient in the fuel element fuel-cladding gap is equal to :
1'75D =
P (V/* + V2Vn]L + mg
where V V„ - volume of the GFP molecule and steam, repec-tively;
m., m„ — mass of the GFP molecule and steam, respectivelyT - steam temperature;P — steam pressure.
At P = 60 atm, T = 600 K the average diffusion coefficientof krypton and xenon in steam makes up: D = 1 10 cm /s.
For the developed macrodefect in the middle of VK-50fuel element (L=2m, h=1Uum): M (Xe-133) = 4 10~7S~1.
Under the VK-50 conditions there were also experimentallyobtained far higher values of the GFP leakage coefficient fromthe failed fuel element fuel-cladding gap - up to 1-10" s /1/which makes absence of GFP convective transport in the fuel-cladding gap doubtful. The reason of GFP convective transportunder the failed fuel element cladding can be pressure pulsa-tions of the coolant turbulent flux in the defect region.Periodical pressure pulsations in the coolant were observedby the authors of ref./2/ during tests of the WER reactor
-5 4
-6 ••
-7
Lg N, l/s
-i hole radiusiLgB, m
Fig.1. Leakage coefficient of Xe-133 from the VK-50 failedfuel element fuel-cladding gap (L=200 cm, h=30 urn,P=40 atm, 1=60 cm) versus the defect raduis.
2- diffusive transport;1 - convective transport
failed fuel elements in the water loop: amplitude of pulsationswas 0.04-0.06 atm, frequency - about 1 Hz.
Convective transport of GFP in the fuel-cladding gap isdescribed in eq./3/ by the term 3/ox (C-v). In all casesdetermination of the function v(x,t) is rather hard, however,if the amplitude of medium displacement under the fuel elementcladding is considerably less than the fuel element length,then the problem of GFP transport can be reduced to solutionof. the diffusion equation. In this event pulsations of steam

COCD
I 20 40 60 80 100 120 140 160 180 2001 CMdistance from the core bottom *
Fig.2. Leakage coefficient of GFP from the VK-50 failed fuelelement fuel-cladding gap (L=200 cm, h=30 urn, P=40 atm)versus the defect location: 1 — diffusive transport;2 - convective transport
- Xe-133; - Xe-138; O - Kr-88
-4
-5 v
-6
-7
LgH, i/
<X)1f«
-9' '
14)X
ËIT»COCOCO1 1h l*
' '
t-CO1f<X
'-8 -7 -6 -5 -4
<D1
LgA, -3Fig.3. Leakage coefficient ol GFP from the VK-50 failed fuel
element fuel-cladding gap (L=200 cm, 1=60 cm, h=30um,atm) versus the radioactive decay constant
2 - diffusive transport mechanism;1 - convective transport mechanism
P=40
under the fuel element cladding with amplitude A and frequencyf lead to mixing of the medium within the pulsations amplituderange which is equvivalent to increase of the diffusion coeffi-cient :
D = D + D, /12/
where D - total diffusion coefficient;D - molecular diffusion coefficient;D, - diffusion coefficient equivalent to steam pulsations.
Here: D = A2 f
Amplitude of steam pulsations under the failed fuel elementcladding is A = A P V / P S ,where V — free volume under the fuel element cladding;
AP - amplitude of pressure pulsations.For the defect located in the middle part of the VK—50
fuel element at f=1 Hz, P=0.06 atm, h=10 urn, P=60 atm, amplitu-de of steam pulsations under the fuel element cladding is 1.5 cm
* 2and the equivalent diffusion coefficient D =2 cm /s. In thiscase for the developed macrodefect we shall find due to formula/10/ that.
M (Xe-133) = 7 10~5s~1

0 10 20 30 40 50 60 70 80 90 100gap I
Fig. 4. Leakage coefficient of Xe-133 from the VK-50 failed fuelelement fuel-cladding gap versus the fuel-cladding gapthickness
2- diffusive transport;1 - convective transport
-9Pig.5. GFP release from the VK-50 failed fuel element fuel-
cladding gap (L=200 cm, 1=60 cm, h=30 urn, P=40 atm)versus the radioactive decay constant
2 — diffusive transport mechanism;1 - convective transport mechanism
N>CO
Therefore, the values for Xe-133 leakage coefficient fromthe failed fuel element fuel-cladding gap under the water-
—7 —4 —1cooled reactor conditions can be within 10 -10 s versusthe GFP transport conditions under the fuel element cladding.So the possibility of convection emergence due to the coolantpressure pulsations is, probably, limited to dimensions ofthe defect and fuel-cladding gap in presence of a microdefector pinch of the fuel-cladding gap the pressure pulsations donot propagate into the fuel element and there is no convection.
As an example Figs. 1-4 present dependencies of the GFPleakage coefficient from the VK-50 failed fuel-cladding gapon size and location of the defect, nuclide decay constantand the fuel-cladding gap thickness. Fig. 5 shows dependenceof GFP release from the failed fuel element fuel-cladding gapon the nuclide decay constant. GFP release from the failedfuel element fuel-cladding gap (K ) is defined from the ratio.
Ki =

IV)ÜJ00REFERENCES
1. Konyashov V.V., Shkokov E.I., Chechetkin Yu.V., YakshinE.K. Experimental Investigations of Radioactive Fission productRelease from VK-50 Failed Fuel Elements. Atomic ElectricStations, Is.5, M.: Energoatomizdat, 1983, P.185-189.
2. Aksenov N.A., Sameonov B.V., Sulaberidze V.Sh., FrejA.K. Some Irradiation Regimes Investigations of VVER-'t'tOFailed Fuel Elements. - In -book: Radiation Safety and Shieldingof NPP, Is.6, M., Bnergoizdat, 1981, P.50-58.
SOME RESULTS OF POST-IRRADIATIONINVESTIGATIONS OF WER-1000UNSEALED FUEL ASSEMBLY
K.P. DUBROVIN, A.V. SUKHIKH, V.l. KUZMIN,A.V. MESTNIKOV, A.V. SMIRNOV, V.P. SMIRNOVResearch Institute of Atomic Reactors,Dimitrovgrad, Russian Federation
Abstract
The results of post-irradiation tests of a fuel assembly are given The fuel assembly is
from Unit I of the South Ukrainian NPP. 300 /mi depth local corrosion of cladding was
identified
In the beginning of the South-Ukrainian NFS operation (1unit) a graphite bearing of the main circulating pump (MCP)failed. When MCP was repaired, the unit had been operating fora long time on the power close to nominal value. One of thefuel assemblies from the first charge after 3 cycles ofoperation (878 days with 36.7 MWt day/kg burnup) wastransported to RIAR for assesment of its serviceabilitylife-time and was investigated in the material sciencelaboratory. After eddy-current examination one-third fuel rodswere identified as those having the surfase defects of thecladding. Fig. 1 presents -scanogramm and eddy-current diagrammof one of the fuel rods from this assembly. Periodicalminimums of the total -activity on the fuel rod lengthcoincide with the position of the spacer grids (SG) ofstainless steel The surface defects of the cladding were nothigher than the fi^th SG. The defects wit-h the greater valueof signals were observed near the first SG

A, B N,I/sxI02if\3 W
"ui o "m——— 1 1 , .....-L-
-!»
1-n w^ f» "O 3Ij, 3
9>1- 18 S03 -A P>0 3^ 0o oq
M
8 g3 3 -3 3ü>o'3
S o-O
c 1a>y> o>o> p,O p.3 ^«o 7S oCD (2
C 2a S3 2.p. e+
P-H-P
OT1
3
"" '— :~J " '•
i\it\
-
^<is)»
' toH
Oq
->- 'i? ra
^ -< -s1 i
"**• ' '* JTt ^^S{ *~*
A. - J°1-.( --.J .
n?dP>p-v;1ocH•-JCO3d-
oO3<CD4s+(t>>-J
^
|
ro rf^ o> oo—— i —— 1 —— -t ——
—— i Txv•£• \ j^V>F-f_- iro --.
i iM y •K . ^.*~* "
.n - !O •-
'tn ~ÏS ^ . '
§ /o- rp <2401 >^ ->3 "' ;_^ ;
0» <oHj
CO 01 /(P •;
*- r.
co ,'.
-^ ^
.'
' - '•" ' '
CO<0
The visual inspection of the damaged fuel surfacerevealed:
- white contrast spots;- dark-grey graphite deposits of about 0.3 mm thicknesspartially covering the white nodular formations;
- graphite deposits 0.5 mm thick in the bottom of fuelrods.
White contrast spots were absent directly under SG butthey localized partially or along the whole perimeter of thenarrow belt 10-15 mm wide lower 1-5 SG.
FIG. 2. Nodular corrosion of fuel rod cladding.

After mechanical cleaning the corrosion nodules werediscovered under the white spots (Fig 2)
Measurements of gas composition and pressure didn treveal the elevated release of Xe and Kr from fuel in the fuelrods with graphite deposits. Under the cladding the portion ofgaseous fissile products didn'exceed 0. 4% from their quantityformed during the fuel rods operation.
Ceramographic investigations showed that the fuelmicrostructure wasn't changed. Metallographie researchrevealed the nodular corrosion of claddings 300 mkm depth fromthe side of coolant.
As it is known, the nodular oxidation of zirconiumcladdings is not typical for the fuel rods of the PWR and WERreactors. Corrosion of this type is more typical for fuel rodsof the BWR and RBMK reactors under conditions of theoxygen-containing coolant. Appearence of deposits on thesurlace of the fuel rods, local overheating and, as a resultof it, the elevated rate of the cladding oxidation are themain causes of the nodular corrosion of CILC type (CrudInitiated Local Corrosion). The remamings of graphite depositlayer point to the possibility of the nodular corrosionformation by this mechanism in the investigated fuel rods. Thelayers were discovered above the white corrosion spots on theexternal surface of the claddings. Localization of the greaternodular oxidation on the first SB, where the neutron flux andenergy release were lower than the maximum value, is explainedby the greater thickness of deposits in the bottom of the fuelrods.
RESULTS OF POST-REACTOR INVESTIGATIONSOF VVER-1000 UNTIGHT FUEL ASSEMBLY
K P. DUBROVIN, A V SUKHIKH, V.l. KUZMIN,A.V. SMIRNOV, V.P SMIRNOVResearch Institute of Atomic Reactors,Dimitrovgrad, Russian Federation
Abstract
Results of post-reactor investigations of the VVER-1000 untight fuel assembly are given
The research results of structure, composition and properties of cladding are presented
Growth of the iodine radionuclides activity in the coolantwas observed during commissioning to rated power of the reactorof the 5-th block at the New-Voronezh NPP after 3-weeks operationwith 50% power (Fig.1). The untight fuel assembly found by thefailed fuel detection (FFD) system was delivered to RIAR andinvestigated in a material science laboratory. The fuel assemblyhad been operated for 489 ef. days (4 and 5 fuel cycles) up toburnup 21.7 MW d/kg uranium. The maximum heat load on fuel rodsdid not exceed 240 W/cm.
In the process of fuel assembly dismantling at one of thecentral fuel rods bordering on the guiding tube of a controlbar there were detected white spots of friable releases at 2regions placed at marks 500 and 350 mm from the fuel rod top.While extracting the fuel rod out of fuel assembly spacer gridswithin the upper white spot, brittle break of the cladding tookplace (Fig.2). A through sickle-shaped defect of the claddingwas revealed after decontamination of the fuel rod surface inthe area of the lower white spot (Fig.3).
Figs.4 and 5 present the results of gamma-scanning and eddy-current flaw detection of the greater piece of the failed fuelrod. Fig.4 illustrates high-altitude distributions of energyrelease and residual fission products concentration. The energyrelease profile by the end of the 5-th fuel cycle was calculatedaccording to the BIPR-7 programme

ai -L'SOo •
a 5'8 a5-8
oo
"OO
(D
SB13Q.
OQ.D'(D
FIG. 2. Untight fuel element within the upper rupture of cladding.

ro4^ro
FIG. 3. Lower defect of cladding in the untight fuel element.
Analysis of the gamma-scanning results showed that about35% of Cs accumulated during operation released from the failedfuel rod to the coolant. The greatest local decrease of Cs con-centration (down to 50%) was observed in places of maximum energyrelease.
Amplitude-phase analysis of the eddy-current defect diagramsignals (Fig.5) demonstrated that they are mainly connected withinner cladding defects the size of which is maximum near the placeof the upper fuel rod destruction. Signals with the period divi-sible by the fuel bushing length were observed in the regionwith reduced Cs content (2800-3600 mm). A powerful signal fromthe through cladding defect (mark 3580 mm) did not disturb theperiodicity of this distribution.
Material science investigations showed that tight fuel rodsof a fuel assembly were in a satisfactory state. Maximum increaseof the length and decrease of the fuel rods diameter made up11.4 mm (0.3%) and 0.04 mm (0.41%), respectively. A fractionof inert gases (Xe and Kr) released from fuel did not exceed2.3% of their quantity accumulated in the course of operation.
A uniform oxide film, 5 um thick, was generated on theouter surface of all fuel rods. The oxide film thickness overthe height and perimeter changed from 0 to 7 urn on the innersurface of tight fuel rods claddings. Hydrogen content in clad-
_Qdings did not exceed 5 10 % mass. Hydrides had predominantlya tangential orientation.
Mechanical properties of tight fuel rod claddings were at0.2a sufficiently high level. The conventional yield strength
made up 300 MPa , and the ultimate strength - 330 MPa at thetesting temperature 380°C. Uniform relative elongation changedwithin the range 3.5-4.0%, and the total relative elongationequaled 16.0-25.0%.
The fuel structure of tight fuel rods did not essentiallychange as compared to the initial state. Maximum swelling ofUÛ2 was 1.2%. Absence of growth in U dioxide grains and negli-gible number of released gas fission products evidenced of thefact that the maximum temperature in the centre of fuel did notexceed 1500°C.
The diameter of the central hole of fuel bushings in thefailed fuel rod was close to the initial one. The diametric gapbetween fuel and cladding was not observed in an obvious form.

5,0
4,0
3,0
2,0
1,0
1,3
1,2
I.I
1,0
10 15 20Length , mm x 10'
25 30 35 40
FIG. 4. Distribution of energy release (at the end of the 5th fuel cycle) and concentration ofradioactive nuclides along the untight fuel element.
•|4j|||*Mr* ^ Mfr^frl^ttWV'^T-'- -Uu__.
a - Cs-137 distribution;b - fuel element defect diagram.
Coordinate, mm x 10 • fuel element bottom
FIG. 5. Distribution of Cs-137 concentration and eddy current flaw detector signals alongthe untight fuel element.
243

Region of column gramsafter additional etching
FIG 6 MtcrostrucSure of fuel m untight fuel element (lOOx)
244

(a) Sx
(b) 100x
FIG 7 Structure of fuel and cladding within the lower defect of untight fuel element
FIG 8 Microstructure of cladding within the upper failure of fuel element
245

FO-t«.O>It was, probably, filled with products of water interaction withfuel, cladding and fission fragments. Fine column grains of ura-nium dioxide were observed in some sections of the untight fuelrod. An interesting feature was location of the column grainsarea in the middle part of the fuel bushings wall (Fig.6).Gaseous pores were generated in the central part of fuel bushingsinside and on the surface of equiaxial grains, however, the grainsize did not increase. Maximum decrease of the uranium dioxidedensity in the untight fuel rod was thrice greater than in tightfuel rods with the same fuel burnup.
Slight hydrogénation and oxidation from the side of the innercladding surface occurred around the lower defect (mark 3580 mm)(Fig.7). Mechanical properties of the cladding in this regiondiffered from mechanical properties of tight fuel rods claddingsto a small extent.
Intensive local hydrogénation and oxidation of the claddingfrom the inner surface side took place in the area of upperdestruction at mark 500 mm. Hydrogen concentration in this regionrose up to 0.39%. The thickness of the continuous hydrides layerachieved 250-300 urn. "Sunburst" type hydrides were observed(Fig.8). Plate-shaped hydrides had predominantly a radial orien-tation. A great deal of through longitudinal cracks were noticedin claddings. Circular samples cut out of this area destroyedin a brittle manner at minor loads via mechanical tests.
The research results of structure, composition, propertiesof claddings indicate that the lower defect was primary, andcladding destruction in the upper fuel rod part was the resultof local hydrogénation affected by the coolant entering underthe cladding via the primary defect.
EFFECT OF INNER SURFACE PRELIMINARYOXIDATION ON STRESS CORROSION CRACKINGSUSCEPTIBILITY OF Zr-1%Nb TUBING
Yu.K. BIBILASHVILI, Yu.N. DOLGOV, V.V. NOVIKOVScientific Research Institute for Inorganic MaterialsA.P. GRYAZEVPhysics Engineering Institute
Moscow, Russian Federation
Abstract
Internally pressurized claddings of VVER-1000 fuels weretested under iodine SCC conditions at 653 K in a laboratory unitequipped with an automated acoustic-emission system. Zr-l%Nbcladdings were pre-coated with ZrU2 0.5-10 urn thick. Cladding timeto failure is given as a function of oxide layer thickness. Oxidefilm growth is shown to lead to a sharp reduction of time tofailure of claddings subject to iodine corrosion. Areas of failurewere studied fractographically and diagrams of recorded acousticemission (AE) signals that accompanied major stages in crackevolution are interpreted. Also discussed is the influence ofcladding inner surface oxidation on mechanism of SCC resistancedegradation with fuel burnup.
1. INTRODUCTIONPCI is one of the main factors that determines power reactor
fuel serviceability under transient conditions. Loss of tightnessby fuels results from SCC effected by chemically aggressivefission products, particularly .iodine. Aside from other factorsSCC process also depends on cladding inner surface condition. Fuelburnup process is known to result in both irradiation induceddamage of cladding inner surface with fission product fragmentsand its oxidation. The former takes account of possibleembrittlement of cladding surface and, hence, highersusceptibility of metal to iodine induced cracking. The influenceof the latter factor is related to fuel released oxygen forming anoxide film at cladding inner surface. The results of some studiesto estimate oxide layer thickness were tabulated (see the tablebelow) [1,2].

Table 1. Observedcladding
oxide thickness on the inner surface of fuel[1, 2]
Authors
F.H. Megerth, et al.
N. Fuhrmah, et al.
R.F.Hattas, et al.
F.Garzarolli, et al.
H.Lindroth andR.Terasvirta
Burnup(GWd/t)
23.9-26.6
27.3-37.4
13
27 - 30
10.6 - 14
8.5 - 11
7.2
8.4
24
< 20
42.9-^15.9
OxideThickness (urn)
1 - 6 -(avg. 3 - 4 )
4 - 9(avg. 8)
4 - 6
0.5 - 7
1 - 4
0.5 - 6
3 - 4
3 - 4
0.5 - 18
negligible
0 -13(avg. 8.2)
Remarks
uniform
some are uniformothers are nonuniform
nonuniform, only found inthe area of fuel bonding
nonuniform
nonuniform
nonunifonn
uniform (unbreached)
nonunifonn (breached)
nonuniform
at higher burnups, oxidationstarts locally and becomesa thin continuous film
cladding material - Zr-l%Nb
Data available on the influence of oxidation on SCC show thatan oxide film can both improve and degrade resistance to SCC [3].Therefore to determine the influence of cladding inner surfaceoxidation on SCC and mechanism of cladding damage during PCIexperiments were planned to study claddings having ZrOz films ofdifferent thickness.
2. EXPERIMENTAL MEANS AND METHODS2.1. Specimens under study
Internally pressurized tubular Zr-l%Nb specimens wereinvestigated. Their chemical composition and strength werepractically similar to those described [4]. At their inner surfacethe specimens had a pre-applied ZrOa film 0.5, 1, 2, 5 and 10 urnthick.
The sequence of specimen preparation was as follows.
1. Tubes 150 mm long, 9.15 mm outer dia and 0.7 wallthickness cut from unirradiated VVER-1000 fuel cladding weresubjected to air oxidation in a resistance furnace at 773 K. Thetubes were arranged horizontally in a specially designedcontainer. The container with the tubes was located into theheated furnace and unloaded out of the heated furnace. Followingoxidation for 2, 8, 100 h and subsequently after each 100 h thespecimens were weighed to determine weight gain. Throughcalculation of weight gain per unit area the thickness of ZrOzlayer was found.
2. Claddings as oxidized were grooved in the middle over 40mm length to produce a higher stress area. The average thicknessof the thinned cladding was 350115 u.m.
3. The end plugs were electron beam welded. To assure theneeded quality of the welds the oxide layer near the tube ends atthe inner and outer surfaces over 5-6 mm length was removed.
4. The specimens as pre-evacuated were filled with an inertgas (argon). Iodine as loose crystals was inserted in the amountof 0.2 mg/cm*. The specimens were sealed with resistance spotwelding. The argon pressure under the cladding was 6.5 MPa at roomtemperature and was controlled with a gauge as well as by weighingspecimens before and after filling.
2.2. Laboratory unitThe specimens were tested in a laboratory unit "KROT"
(Corrosion Cracking of Fuel Claddings) equipped with an automatedAE-system CAMAS (Computer Added to Multi-channel Acoustic System).The unit is shown schematically in fig.l. The unit allows asimultaneous performance of experiments in 4 heaters with anautonomous selection of temperature conditions in air or an inertgas environment. A tubular ampule type specimen 1 is placedvertically inside an electric resistance furnace 2. Thetemperature of the middle part of the working zone is measuredwith thermocouple the signal of which is controlled with digitalvoltmeter 7. The communication of the power circuits of the heateris accomplished with a block of thyristor amplifiers 4 switched inthe circuit of high precision temperature controller 5. Thediscrete AE-signals arising in a specimen subject to SCC aretransferred over rod waveguide 6 to primary converter 8 in thebody of which a piezoconverter and pre-amplifier are installed.The piezoconverter material is zirconate of lead titanate, that ofwaveguide is stainless steal of X18H9T type.
Conversion of AE and temperature transducer signals into adigital code and their subsequent processing were accomplishedwith CAMAS system consisting of functional CAMAC modules 9-18operating under the control of microcomputer 19. Under laboratoryconditions CAMAS system provides for the following:
separate recording by each measuring channel of timedependencies of specimen temperature as well as count rate andtotal count of AE-signal flow that accompanies nucleation ofcorrosion damages in a cladding;

M-P-00 -Kant
ChanrChainCharu
tel .101leinel
S
4321|8
1l'
rrM^r
•>•
1 24~ — r^ —— i ——
'ifinnumnÉ11
——— 1
3
/L_1
tt
»(^
4
5 1
i
1 — ;
Ü ^*V —— n-T-'i i. liaii
2MV
QT20
021
.1 Si• l B
.: =
JE
9q
y^10
-^
CO
^
/ D
ata-way
)
^
?"
v•0
s
ê
-
[2DL11ä»aE15[j717
10
^
k=5F-5
IcoF5
aCOt*->poCO
( D
ata-way
)
18
Ijk*
U i- Bus
0
22Ü
23i
Fig,!. Schematic of airtona-ttd AE-sys-tent
1 - sp«cin«n; Z - «l«ctrtcal furnac«} 3 - -thermocouple j 4 - -thyris-tor«.npllfter» S - -ttnptratur» controller/ 6 - rod waveguide) 7 - voltmeter i8 - rnnote probe) 9 - active fU-ttr wipllf 1er i 10 - crate CAMAC)
II - 4-chann*t amplitude discriminator a,nd analog multtplexeri12 - 4-channel quad sealer l 13 - puts« ADCj 14 - output register/
IS - relay multiplexer/ 16 - isolated A/0 converter/ 17 - serialinterface/ 19 - SM-3 CAMAC interface) 19 - processor MCiaOl .02)20 - RAM» 21 - floppy drive/ 22 - monitor/ 23 - printer/
Z4 - IBM PC/AT.
statistical analysis of AE-signal flow along one ofmeasuring channels selected according to the program or at willof a user, programmed setting of statistical processing conditionsand control of amplitude selection level
accumulation, preliminary processing and display ofexperimental information, recording of results on computerexternal memory devices,
- audible and visual signalling an excess threshold value ofcount rate recorded in any measuring channel,
flexible interaction with a user and control of systemfunctioning with the help of a menu
To improve the efficiency of the multi-channel AE-system apersonal computer IBM PC/AT 24 was incorporated, it is used forarchiving, processing and systematization of investigated resultsThe personal computer and the microcomputer of the CH type areconnected with a serial interface nodule 17, installed in crateCAHAC Software support of heterogeneous local network is providedby a complex of program products2.3 Experimental technique
Counting off the time to cladding failure was started fromthe moment the specimen reached the test temperature that was heldconstant at the accuracy ±3 K until fracture Under steady-stateconditions the axial temperature gradient over 150 mm did notexceed 12 K and in a 40 mm long area of higher tensile stresses itwas 4 K The specimen was heated for 1 hour, held at the constanttemperature for (7 12) h If the rupture did not take placeduring this time, the test were interrupted to measure the hoopstrain of the cladding at room temperature and then continued inthe same sequence
The hoop stresses of the cladding were calculated by theknown relation
ere = P (l + cVr") aV(cz - a1) (1)where P is a gas pressure under cladding at testing temperature, aand c are inner and outer radii of cladding, r = ( a + c ) / 2 i s acoordinate of a point where the stress is calculated
In the course of the experiment the time dependencies of thespecimen temperature, count rate and total count of AE wererecorded
3 EXPERIMENTAL RESULTS3 1 Tests of pre-oxidized claddings
The oxidation temperature of 773 K was chosen based on timeof specimen holding that is needed for the maximum oxide layer of10 urn to form Some specimens were oxidized at T=673 K Thedifference in the oxidation temperature did not affect the resultsof cladding testing under SCC conditions

BÜMl6
<a60
JSyS
i Temperature 773 KEnvironment air
200,
Fig.2
- 05-———I———J———L__L_
10 100 500
Time of holding (h)
Sample weight gam and calculated ZrOa layer thickness.
T, K Environ.653 Ar + la
OOOOO 653 Ar
2 0 2 4 6 8Oxide thickness
Fig.3 Influence of ZrO, at cladding inner surface on timeto failure m iodine (A) and inert gas (o).
IV)£>CO
Fig 2 shows the kinetic dependencies of specimen weight gainin air at 777 K and the oxide thickness for Zr-l%Nb calculatedassuming similar rates of outer and inner surface oxidationAccording to the appearance the resultant ZrOz can be divided intothree types
1) a black strongly adherent film up to 2-2 5 urn thick,2) a grey more loose film likely to contain a larger amountof defects from 2 to 10 urn thick,3) a spotted film more than 10 urn thick with light spots1-3 mm in size against the grey background of the oxideAlloy oxidation in each of the three indicated ranges can
proceed by different mechanisms He did not specially study thestructure of the oxide layer, however, the approximation of theexperimental data by the power dependence showed that theparabolic law describes the results at an adequate accuracy in thethickness range 0 25 - 10 urn
/\m = 0 0675 ft, T=773 K, 2 < t < 4500 = 0 457 ft
where Am is the amount of oxygen reacted, mg/cm*of ZrOa layer, um, t is holding time, h
(2)(3)
6 is thickness
Pressurised tube test was conducted at 673 K Theconcentration of iodine under the cladding was 0 2 mg/cm', controlspecimens without iodine were also used Hoop stresses calculatedfrom relation (1) were 165 MPa, i e , were close to the yieldstress ao 2 of Zr-l%Nb claddings at the test temperature
The oxidation conditions were selected in such a way that thewhole batch of tubes could be divided into groups of 6specimens that had an essentially equal oxide film thickness atthe inner surface of the cladding The testing conditions werecarefully controlled, however, the scatter in the time to failurewas significant within a single group of 6 specimens

too\oTable 2. Influence of oxide thickness on the inner surface on
WER cladding time to failure
Testconditions
T=653 KCI = 0. Zing/cm1
T=653 Kspecimens
without iodine
Oxide thickness( u r n )
initial0.51.02.55.6
10.1
initial1.0
10.6
Average timeto fai lure (h)
29.155.813.16.227.484.27
98.651.415.9
The experimental results are shown in fig.3 and tabulated intable 2. The claddings as supplied without an oxide film at theirinner surface tested at the iodine concentration 0.2 mg/cm1 hadthe mean time to failure tt = 29 h. The oxide layer 0.5 urn thickincreased the mean time to failure to 56 h under iodine corrosionconditions. With a further increase of ZrOz thickness fron l to 10urn a smooth decrease of the cladding life time was observed from13 to 4-5 h. For specimens without iodine the mode of the time tofailure vs ZrOa thickness dependence was approximately the same.The time to failure of the specimens containing iodine was on theaverage a factor of 3-4 less than that for the specimens withoutiodine both for the claddings with the initial inner surface andthe ones having ZrOa layer 10 urn thick.
Two types of fracture are characteristic of loss of tightnessby claddings: narrow axial splits at low hoop strains and claddingruptures at high plastic strains. The analysis of the fracturetypes shows that with an increase of the oxide layer thickness therupture fraction becomes prevailing.3.2. Acoustic emission and fractographic studies
Fig.4 illustrates the influence of oxide layer thickness onthe mean intensity of AE that was assumed to be a gain in thetotal countAN during exposure at constant temperature divided bythe testing time t. Each point on the graph corresponds to asingle specimen, therefore if the tests were conducted for severaldays additional averaging was performed for all day cycles. It canbe seen that the AE intensity increases with ZrOz growthessentially by the linear law; no significant differences in themean signal intensity for the specimens with and without iodinewere revealed. It is likely that the main factor that determinesthe extent of the specimen damage is the oxide layer thickness.
7 4m
O
O
.Ao
2 4 6 8 10Oxide thickness (/um)
12
Fig.4 Mean intensity of AE-signals in samples with ZrOa layerof different thickness at cladding inner surface.
The concentration of iodine, particularly in the amount of0.2 mg/cm1 is of secondary importance for recorded AE-signals,although the time to failure of specimen is certainly affected bythe availability of iodine under cladding.
Fig.5 shows a characteristic example of the time dependenceof cladding temperature T, total count N and count rate of AE ft inthe course of testing one of the specimens; fig.6 illustrates theresults of fractographic studies of the same specimen the fractureof which is described by an axial crack at the strain of 5.2%. Thejoint analysis of the fractographic and AE studies allows one toassume that SCC process can be divided into three stages.

66-
57-
39-
3O->
33-
28-
OJZ21-
7-
64 96Tine. SHUT3
rocn
Fig.5 Tine dependencies of specimen temperature'T, total countof AE N and count intensity N, recorded during testing claddingwith oxide layer at its inner surface under SCC conditions.
At first stage beginning from the moment the testingtemperature is reached to the first peak in the count rate of AE(see fig.5) there was a slow crack growth until a 90 urn depth wasattained. This stage is paralleled by area 1 in fig.6; it isdescribed by a mixed inter-and-transgranular type of fracture.The duration of the first stage varies in a wide range dependingon a specimen and is 60 to 90 % of the total time to failure. Themean rate of crack propagation is about 5 x 10~a um/s at thisstage.
At the second stage that is located between two intensitypeaks the crack surface had areas of ductile fracture (area 2 infig.6), and its propagation rate was higher and equal to=0.07 um/s for the specimen studied. The duration of this stage indifferent specimens varied from 1000 to 5500 s.
The third area of fracture is paralleled by a zone located atthe outer cladding surface. The fracture pattern at this stage isthat of a transgranular shear with characteristic ridgesproduced by a plastic rupture. The count rate of AE at the momentof loss of tightness by a specimen (the second peak) can be 2-3orders of magnitude higher than all the other ones recordedbefore.
The fracture surface at the inner cladding surface is shownin fig.7; the thickness of ZrOz layer well discernible in thephotograph coincides with the calculated value determined from theoxidized specimen weight gain.
4. DISCUSSIONThe tests indicated a sharp reduction in the cladding time to
failure from 56 to 4 h with an increase of oxide layer thicknessat the inner surface. To identify the cause of this claddingbehaviour in an iodine environment the use is made of the conceptof failure time as a sum of two items: ti is the time of cracknucleation and tz is time of its propagation. The results of somework [5,6] and our preliminary investigations show that underconditions of internally pressurized claddings the time of a cracknucleation is up to 90 % of the total time of fracture. It isapparent that oxide film formation effects significant changes inthe first stage of iodine induced corrosion. These changesinclude :
1) oxide film cracking givingmicrocracks at cladding surface;
rise to characteristic
2) growing permeability of oxide films for iodine related toincreased oxide thickness;
3) stresses appearing in cladding surface layer that areinduced by cladding tension under the action of resultant oxidedue to a difference in volumes of Zr and oxide;
4) changes in surface layer mechanical properties as a resultof oxygen diffusion.In our opinion of highest significance are the first and thirdfactors as they can-result in local stresses in a cladding surfacelayer and, hence, in a sharp reduction of time of a slow crackgrowth. The contribution of stresses by an oxide film to afracture process is evidenced also by a large fraction of atransgranular shear observed in fractographic studies.
With due account of the results of the study the knownreduction in SCC resistance of fuel claddings irradiated to30 MWd/kg is likely to be related to an oxide film formed at theinner cladding surface during burnup. Certainly one cannot neglectother phenomena affecting SCC, e.g., dislocation channelling.

Olro
«ESSultimate fracture
Fig.6b Area of transgranularzone 1.

Fig.7a Start of fracture at innersurface of cladding.
Fig.7b Appearance of inner surface areanear penetrating crack.
IV)s

K)en However, dislocation channelling in claddings irradiated withoutfuel and having no oxide film formed at the inner surface leads toa reduction in SCC resistance to ~ 350 MPa. At the same timecladdings irradiated to high fuel burnup show a sharper reduction(-200 MPa) £7-9]. The results of the study indicate that in thevalidation of fuel serviceability criteria under transientconditions one should take account of the physico-chemicalcondition of the inner cladding surface.
9.
Onchi T., Kayno H. and Higashiguchi J. Inhomogeneous PlasticDeformation and its Relevance to Iodine Stress CorrosionCracking Susceptibility in Irradiated Zircaloy-2 Tubing. J.Nucl. «ater. 116(1983), pp.211-218.Tomalin D.S. Localized Ductility ofCladding in Air and Iodine Environments,Nuclear Industry, ASTM STP 633, A.L. Lowe,Eds., Americanp.557-572.
Irradiated Z.ircaloy-2in: Zirconium in theJr. and G.H. Parry,
Society for Testing and Materials, 1977,
5. CONCLUSIONS1. Internally pressurized WER fuel simulators were tested
under iodine SCC conditions. Zr-lZBb claddings had a ZrOz layer ofdifferent thickness at their inner surfaces. Using AE-method andfractographic analysis it is shown that a crack has a three-stagepropagation in cladding thickness beginning with transgranularshear in iodine the tine of which constitutes the major fractionof the 'whole tine until loss of tightness by cladding.
2. An increase of oxide filn thickness at the inner claddingsurface from 0.5-1.0 un results in a sharp reduction of time tofailure both in iodine and inert gas conditions.
REFERENCES1. Nagai M., Shinada S., Nishimura S., Amano K. and Yagava G.
Elucidating the Iodine Stress Corrosion Cracking (SCC) ProcessFor Zircaloy Tubing, in: Pellet Cladding Interaction in WaterReactor. Fuel. Proc. of IAEA Specialist's Meeting, Seattle, USA,3-5 October 1983, pp.89-102.
2. Lindroth H., Terasvirta R. Post Irradiation Examinations ofHigh-Burnup Fuel and Leaking Fuel of Loviisa NPS, in: PoolsideInspection, Repair and Reconstitution of LWR Fuel Elements.Proc. of IAEA Technical Committee Meeting, Lyon, France, 21-24October, 1991.
3. Tsing-Tyan Yang and Chuen-Horng Tsai On the Susceptibility toStress Corrosion Cracking of Zircaloy In an Iodine ContainingEnvironment. J. of Nucl. Mater., 166(1989) N3, pp.252-264.
4. Reshetnicov F.G., Bibilashvili Yu.K., Golovnin I.S. et al.Probiens of VVER-1000 Fuel Design for Operation under LoadFollow Conditions and at Extended Burnup. Atomnaya Energiya64(1988) N3, pp.258-266 (in Russian)
5. Videm K. , Lunde L., Hollowell T. et al. Cracking of CladdingTubes Caused by Power Ranping and by Laboratory StressCorrosion Experiments. J. Nucl. Mater., 87(1979), pp.259 - 271.
6. Nagai M., Shinada S., Nishimura S. et al. Evaluation of SCCCrack Behavior in Zirconium and Zircaloy-2 Using NonlinearFracture Mechanics Parameters. Nucl. Eng. and Design,88(1985), pp.319-326.
7. Wood J.C. and Keim J.R. Effects of Irradiation on theIodine-induced Stress Corrosion Cracking of CANDU Zircaloy FuelCladding. Res Mechanica, 8(1983), pp.127-161.

roOt01
MECHANISMS OF FUEL CLADDING FAILURE IN PCI
V.V. NOVIKOVScientific Research Institute for Inorganic Materials,Moscow, Russian Federation
Abstract
The report suggests an iodine induced cracking model for LWR fuel.The kinetics of a crack growth is considered; conditions are shown under which the cladding fracture
mode is changed. The influence of irradiation and some other factors on the cladding resistance 10 SCCis discussed.
1. INTRODUCTION
SCC studies of Zr-aooy claddings were started in 60-ies in connection with fuel failures undertransient conditions. As it pointed out by Cox, barrier fuel, i.e., claddings having a Zr coat at their innersurfaces, decreased the interest for SCC, and hence, the number of published papers despite some gapsin comprehension of this phenomenon, including the validation of using Zr-barrier claddings I! ',.Amcug them is the mechanism of SCC in iodine. Wood and Cox were the first to discuss mechanisms ofSCC; they chije adsorption and diffusion models for the analysis [2,3 ].
The paper reviews the existent concepts of iodine induced cracking mechanism and the model of SCCfailure is suggested that takes account of the influence of stresses on intensity iodine inducesembrittlement of fuel claddings.
2. IOWNE-7R CLADDING INTERACTION IN SCC
In an iodine environment a crack can propagate as a result of the following processes (fig. 1 ) :1 — gas transport of iodine molecules (or I-containing molecules) in a crack volume;2 — physical adsorption and migration of iodine along a crack surface;3 — chemical adsorption;4 — conversion to a dissoved state in a metal volume;5 — diffusion to a fracture nucleation site and embrirtlement of an area beyond a crack tip.This scheme is likely to be the most general for the analysis of the embrittlement effect of :m
environment on a metal, although it is possible that not all of the indicated stages of "activeenvironment - metal" interaction will take place in the process of iodine induced cracking of Zr-cladding. (The scheme shows a mouth of a propagating crack, however, the stages of I-Zr interactionare also retained for a crack nucleation).
The embrittlement process starts at the stages of volume or surface diffusion of I molecules to a cr.-icknucleation site. These stages are followed by the physical adsorption of I with a metal induced by Vander Walls forces; during the adsorption gas molecules do not dissociate into atoms. It is possible that inour instance there can be no physical adsorption since it is usually characteristic for low températures.
When molecular I gets to a Zr surface then as a result of chemical adsorption that is, effected by theforces of the chemical affinity of gas molecules.to metal atoms, the lather exchange electrons to for thecovalent or ionic bond. With a temperature rise the amount of the adsorbed gas is always decreased taithe constant pressure), but in this case the temperature rise accelerates the chemical adsoi;»ionprocess.
û
Fig.1. Stages of J-Zr interaction (see the text).
The pressure dependence of the amount of the gas adsorbed at the constant temperature '.sgraphically presented as curves called adsorption isotherms. Theoretically the isotherms are describ,-^with equations according to which the extent of coverage is increased with a gas pressure.
Langmuir isotherm for I and Zr has the following form QrplJ(1+ps) »here /Vtogjo (PiPC. P-**pressure ZrJrfPa), PC — critical pressure of the start SCC equal to 10"1 Pa.
Cubicciotti has studied the I chemosorption on Zr. The enthalpy of chemosorbcd I formation provedequal to -146 kJ/g — atom [4 ]. It is also shown that on interaction with I iodides (not only those of Zrbut also of other metals, e.g., Fe and AT) can generally form Zr iodideïollowed by a chemosorbed layerformation according to [4,5 ]:
\ A//„ (£) + ZrJ(s) = ZrJ(s) + \M(s)
Therefore, it is not suprising that metal iodides induce a corrosion fracture of Zr.If desorption is not taken into account the rate of Zr coverage with I is
dria ™ _,_~fT — 2.363-
where —j— — coverage rate (molecule / cm2 s)P—pressure, PaM — molecular weight,T — absolute temperature,/ — sticking coefficient
According to Williford, the chemosorption time at a pressure Zr J4, equal to 2T Pa and the coverageextent Q « 0.75 is estimated to be 3.9x 10~3 s, i.e., the time of this process does not control the totaltimeof Zr cladding fracture [6).
In the end the chemical adsorption of I (or iodide) molecular results in their disintegration into atomsthat are absorbed by a metal.
I as adsorbed by Zr can be in different states:a) as dissolved in the metal;b) as segregated on defects of crystal structure, grain boundaries included;c) as adsorbed at the surface of microdiscontinuities and interphase boundaries;d) in interaction with alloying elements and secondary phases.

N)01O>
3 EMBRITTLEMENT MODELS OF I Zr INTERACTION
The bntlleness of a metal can be due to1) adsorption induced crack nucleanon due to a decrease of surface energy2) adsorption induced crack nucleatlon as a result of I dissolution and reduced cohesive strength of
area adjacent the metal surface,3) critical I concentration in the maximum tensile stress area asa result of pre — transport of I to this
areaSince the experimental data revealed the feasibility of a long slow stage of mtercrvstallme cracking
the investigations were focused to studying this stage of a crack nucleatlon This stage of a crackevolution takes the path of 2—3% to 10 % of a cladding thickness, according to Videm and Lunde itsduration can be 75—90% of the total time to fracture For the analysis of the nudeation mechanism theadsorption model was preferred
Th*e process of embnttlement was considered either in terms of the surface energy reduction(Wilhford) or decohesron (Cubicaotn) Wilhford divided the iodine corrosion induced fracture into fourstages [8 ).
1) microc ck nudeation,2) crack formation,3) crack growth,4) cladding fracture.
T lie first stage implied a nudeation of a small surface defect or defective area and defect growth into acrack, for which the use of fracture mechanics is possible. The second and third stage implied thecritical crack opening displacement and growth that then at the fourth stage transform to fractureAccording to Wllllford model the nudeation process results from the higher rate diffusion of vacanciesto form intergranular voids as a result of surface ene gy decrease through iodine chemosorption with ZrHowever, this model was not confirmed experimentally intergranular voids were not revealed Wilhfordmodel did not either explair a crack nucleatlon having essentially no incubation period and describedbv transgranular deavage (Cubicoohi, Peehs, Cox, Shann, Miller et al, [3—5, 9, 10 J) Crackingwithout the incubation period. Le , crack initiation during 10—20s and the subsequent approximatelyone minute period prior to the full fracture of cladding was also observed in some fuel tests under
nsient conditions [11 ]Cubicaotti assumed this mode of fracture without a long incubation phase to be related to adsorption
(chemosorption) leading to a metal surface strength degradation through decoheswn It is known thaton chemosorption the binding forces of surface atoms change, they are redistributed as a result latticeparameters grow and the fracture becomes easier In support of this viewpoint Cubicaotti presenteddata that indicated that crack nudeation was revealed in sites enriched in impurities such as ft, Si andTi Interaction between impurity segregations and I resulted in local decohesion and facilitated therupture of bonds between Zr atoms Since these segregations were concentrated along gram boundaries,according to Cubiccioto the intergranular microcraks appeared due to this fact
It should be noted that a decrease in cohesion force reduces the strength and improves the plasticityBut if the cohesion strength is reduced in local volumes, the localized plasnc flow can give nse to apremature fracture at a lower plasticity which is m fact observed
The decohesion mechanism is preferred m this case compared to the adsorption effected decrease ofthe surface energy Thus, the surface energy decrease cannot explain why I effects embnttlement whileoxygen does not, although it can be also actively chemosorbed by the Zr surface (According to the dataof Cubicaotti and Scott the kinetics of Zr reactions with iodine and oxjgen are very dose attemperatures below JOO°C) [12) The expérimental data on the influence of temperature are not infavour of the surface energy hypothesis The temperature nse above 100—200°C increases Zr
HcM
OTVW
ue^
t0
1
4k.H-O
Xo-
OvIttoXow
OH-
0
XO
158±009[36 4±2 0)
ooK>KJ
1 +00
S 08
o=3
H-o
Xou
K*
H-OexXo£
sttoXo
(7l
155±054C
356±I24)
.uOiOBI +A. —
*iS^x0
f.
H-O
X
O
c.
H-o^Xo5;
CJJ1+oX3
1 46±0 1 1(33 5±2 6)
o
f +o *—
Xo
o»CKX~
«A
KJK*
X^
ta*
Oi0%X
^
nato3
1tn
Ooto'ncS
2.3
0
1-V.c»
Oft-i
£W
Stf*
I
S«"
SaI
ac
fa
S13cS
S -
a
-?.
nSTiclents a
Q,
in5aK>Oi
E*
ta3&O•aln Boundary
0
§*3N
5^
5g" «r

susceptibility for iodine induced embnttlemeflt However il is known thai adsorption is reduced with atemperature nse therefore the increased susceptibility n-apparently due not to the surface interactionsbetween I and Zr
^ ssummg the hypothesis of the decohesion effect of I on Zr strength the the decohesioo area problemshould be discussed (fig 1) If the decohesion area is related to the subsurface material n is apparentihat-chemosorption will be the last stage for the I transport in Zr, In another version the critical areamust be at some distance from the surface that can be surmounted by iodine as a result of diffusion. Anattempt at attracting the diffusion mechanism «as made not only m connection with the discussion ofone more model of fracture The data of the iodine induced corrosion experimental studies cannot beexplained based on changes m-surface properties of Zr These results arc so include the delayed fractureof Zr cladding in an iodine environment at the constant load, the existence of a threshold (critical)factor of stress intensity and several stages of crack propagation tales in an iodine environment, theeffectiveners of a Zr layer Considerable experience gained in investigations of the influence ofenvironments on embnttlement and corrosion cracking of metab and alloys allows one to attract thediffusion model of Zr and its alloy fracture in iodine to Explain the above regularities The main obstacleto the development of the above mechanism was apparently the viewpoint that iodine cannot or canpenetrate Zr to a very knr depth that was also cwroborated by some experimental data (Cox, Haddadand Wood [2,3,J3J)
However, our experiments revealed the parameters of volume and grain boundary diffusion of I inZr-1 % Mb alloy (table 1) [14 ). The values of the parameters proved to be low therefoK. the model tookaccount ai the tact that I transport to a fractal« are» it controlled by the hydrostatic stress gradientThe analysis of the mechanism revealed some régulantes in the fracture of fuel claddings m an iodineenvironment, that will be discussed below
4. INFLUENCE OF STRESSES ON CRACK GROWTH IN IODINE ENVIRONMENT
To analyze the influence of stresses at a crack tip on iodine diffusion use a chemical potential that isspecifically related to a mechanical stresses gradient [15)-
H = fta + RTlnC -*- fia
where C is concentration,fte is a rtitmtml potential in absence of stresses,A,= - Vj(ai + 02 + o3)/3Vj is a partial molar iodine volume in a metal
Taking account of the fact that an iodine flow to a metal is defined by the expression
(1)
using (1) one btains
N>Ot-«J
= - DVC -
where D is a diffusion coefficient.Diffusion equation for a stress field will be the following
tlC* DVr~W~ ~ RT °
To solve these equations one needs to know the diffusion coefficient and stress distribution T i a t rtip. As iodine diffusion in zirconium is rather a slow process (the diffusion results are aiaihbU md *be published) it wiü basically concentrate only in the area of the hydrostatic stress gradient act i •>
Determination of stresses at a crack Up is one of the mam tasks of fracture mechanics and v. L ih , i sthe available solutions given, e.g , by Rice and McMeeking [15, 16) As is known there is a pi isuc rai & crack tip, the approximate size of the former can be estimated e g from an expression for pljpistrain
where JO is a stress intensity factor,of is yield strength
It is shown that
1) in this area stresses grow starting from the values not less than the yield strength at a crack tip toattain maximum at a din» nee from the tip approximately equal to the doubled crack opening
2) the higher is strain hardening coefficient the higher is the maximum stress and the nijximun isdisplaced to the left closer to the tip d e , the stress gradient is increased)
At the strain hardening factor n~0 the stress maximum is displaced to the right and the rate of astrc ts increment is lowered.
The above features of the stressed state in the tip area give an indication of the fact that the maximumiodine concentration may be reached not at a crack tip but uu de a plastic area at a distance appropriateto the mavimnm stress (fig. 2)
The iodine delivery to a potential fracture area rrsults in zirconium embnttlement According to thesuggested model the loading type and, hence, the stressed state scheme is the most important factorthat determines the intensity of iodine induced embnttlement As is known, for many metallic materials(iron, nickel etc base alloys) the conception of an embnttlement reaction as a chemical interactionresulting is new compounds is «ot considered to be an actual fact for a wide range of operationconditions, i e , embnttlement of metals of this kind is a result of a relatively quick physical interaction've mechanism of which is not yet clear The embnttlement is suggested to be almost instant if iodineenters a critical area. Thus, the iodine induced crack growth in zirconium or its alloys is controlled notonly by the material properties but also by the specific features of iodine transfer and localaccumulation processes.
This fact is responsible for a significant difference between the crack growth process underconsideration and the static loading effected bnttle fracture under conventional when the time depend-ence of the fracture process, i e , a progressive increment of a crack, is so weak that it may be neglectedwithout any large detriment to the adequate description of the phenomenon
Evidently <he iodine induced fracture sets in when stresses are in excess of zirconium strengthlowered by iodine, i e , when the concentration becomes critical
Co-(ff) 0>
where A is a coordinate in a microfracture area at a crack tipUnder the action of a stress gradient iodine diffuses to an area beyond the crack tip where tensile
stresses are at a maximum The structure of equation (4) suggests that the major portion of iodineshould concentrate in some neighbourhood of the stress maximum, the iodine accumulation beyond this

ro01oo
a)
b)
10 12 14 R/Ô
F1g;2. Stress distribution at tip of crack propagating (a)as a result of iodine induced embrittlement (b)
2 4 6 8 10 Ayo
Fig.3. Variation of iodine concentration in stress fieldat crack tip.
maximum is prevented by the negative stress gradient. This kind of a diffusion flow distribution makesit reasonable to assume the type of the concentration distribution shown in fig. 3. When the criticaliodine concentration is reached a microfracture takes place and the resultant microcrack merges to themain one to effect its growth. After an abrupt change in the crack the significant portion of iodinelocalized in the maximum will be found in a new area not related to the stress field near the tip. Hence,studying the crack growth process one can assume a crack to propagate in sequential jumps the length ofwhich is determined by a distance between the tip and the microarea inside a plastic zone within whichthe critical iodine concentration is reached during the time Af.
Since the components of stresses and strains nucleated at the crack tip are specific functions of thecoordinate of poinrthe stress intensity factor.equation (7) can.be presented as
C f If \ fO\tr I A 1 \ot
Equations (l)-(4) were used to analyze à crack propagation in iodine that brings about zirconiumalloy embritdemeat. However, those equations that des.ribe an iodine diffusion in a metal areapplicable to any stress fiel4 including the cladding surface where corrosion induced cracks nucleate. Itis apparent that it is the-lcvea of stresses and the mode of their distribution in thé cladding surface layerthat determine the kinetic^anflthe mode of the corrosion effected cracking onset
5. RATE OF IODINE INDUCED CRACK GROWTH
Structural studies of SCC propagation showed that depending on the stress intensity factor a crackcan be either inter-or transgramilar. Based on the above mechanism of an iodine effected fractureconsider the condition under which the mode of a crack propagation is altered.
It is apparent that for a fracture to be transgranular iodine should penetrate a depth not less than zgrain size. Otherwise, the fracture will -be intergramdar. For this change-over the critical stressintensity factor according to (6) is found as follows:
K a
where 2<5 = d is a grain size;£ is an elastic modulus;oy is yield strength.
By substituting the relevant values into this inequality (d-5^m, E-7.3X10⁴ MPa, ao.2= 170 MP;i>one obtains K a 8 MPa m1'2 for Zr-1 % Nb claddings at t-350°C. For zircalloy-2 (at 00.2 = 200 MPa>one has K Z 8_5 MPa m1'2. The found stress intensity factor above which à transgranular fracture is 1,1take place well agrees with the values found experimentally (K-8-8.5 MPa m'/2) for zircalloy-2 ]7, 17].
At K < 8 MPa m'/2 a crack will propagate along grain boundaries and iodine will be supplied to a prc-fracr re area from a crack tip. In this case the stress maximum will be within a grain and a crack jumpwill not be in excess of a grain size. Evaluate the crack propagation rate using the approach suggested in[18). If i> is an average rate of iodine atoms, M is a length of an iodine accumulation area apan fro.^i ;.crack tip, at is time after which a crack jump takes place, the critical concentration will be deiermineJas follows:
Co- = C0 +

According to relation (3)
—*£-£**or approximation.
D „ da
(since we deal with mtergranular cracking D-Dgt).From relations (9) and (11) one finds that
., Ccr-C.,2,5"' C0 »
To evaluate da/dx use the mean-value theorem and present the ascending branch of the stress de-pendence at a crack tip (fig. 2) as
(This relation does not lake account of the strain hardening of a metal).Then
or after transformation
(13)
(14 )
(15)
Ts -513
10 12K„ MPa m
Fig.4. Rate of crack growth in zircalloy-2 claddingsas a function of stress intensity factor [17 ].
1/2
toenCD
Using (11), (12), (151 one obtains for the time of a crack jump
Ar=^c?l£;|2<5or
A Co-Co RT I ,I2
(16)
(17)
Smce during this time the crack propagates to ~2d, the mean rate of its propagation is determinedwith the following expression.
da 2S Co £>y> crydi ~ Ar ~ Co—Co AT "3" (18)
Takmg mto consideration that the crack propagates within a>gram, i e , 2d = ad, d is a grain size onehas (a S 1)
da 2Cp~~di ~ Co— Co RT a/i (19)
It follows from the above analysis that the rate of a crack growth should increase with alloystrengthening (including irradiation induced strengthening) A larger grain sue and strength reductionwill favour a lower rate of corrosion effected Cracking Another not less important conclusion is thai
t
Fig.5. Crack growth in cladding thickness as a function of tune(according to the suggested model)1 — crack nucleation at the depth a^ dunng time fe2 — crack grouth at constant rate propagation,3 — acceleration of crack growth (with conversionto transgranular fracture (utr»
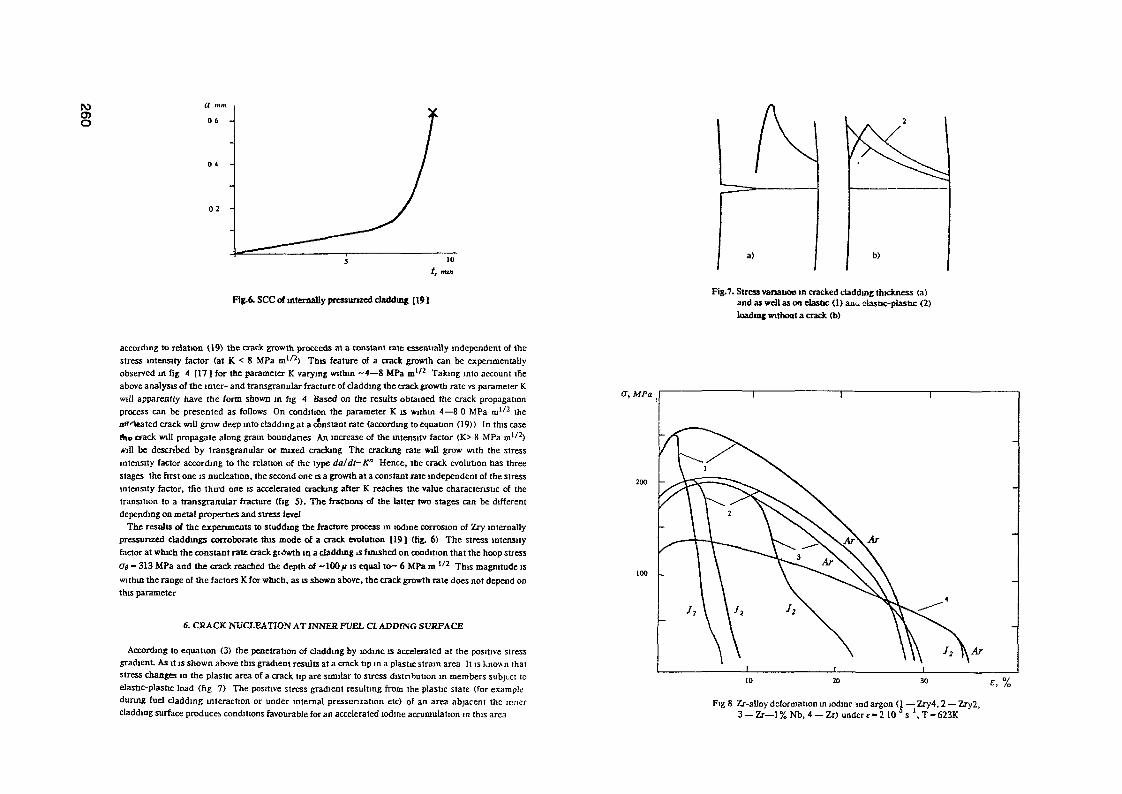
IV)CDO
Fig.6. SCC of internally pressurized cladding [19]Fig.7. Stress variation in cracked cladding thickness (a)
and as well as on elastic <1) ant. elastic-plastic (2)loading without a crack (b)
according to relation <19> the crack growth proceeds at a constant rate essentially independent of thestress intensity factor (at K < 8 MPa m1^) This feature of a crack growth can be experimentallyobserved m fig 4 [17 ] for the parameter K varying within —4—8 MPa m"2 Taking into account tfieabove analysis of the inter- and transgranular fracture of cladding the crack growth rate vs parameter Kwill apparently have the form shown in fig 4 Based on the results obtained the crack propagationprocess can be presented as follows On condition the parameter K is within 4—8 0 MPa m I /2 the««•Itated crack will grow deep into cladding at a constant rate (according to equation (19)) In this casethe crack will propagate along grain boundaries An increase of the intensity factor (K> 8 MPa m'/2)«11 be described by transgranular or mixed cracking The cracking rate will grow with the stressintensity factor according to the relation of the type da/dt~K" Hence, the crack evolution has threestages the first one is nudeation, the second one is a growth at a constant rate independent of the stressintensity factor, tfie third one is accelerated cracking after K reaches the value characteristic of thetransition to a transgranular fracture (fig 5). The fractions of the latter two stages can be differentdepending on metal properties and stress level
The results of the experiments to studding the fracture process in iodine corrosion of Zry internallypressurized claddings corroborate this mode of a crack evolution [19 ] (fig. 6) The stress intensityfactor at which the constant rate crack growth m a cladding is finished on condition that the hoop stressOB — 313 MPa and the crack reached the depth of —100 ft is equal to~ 6 MPa m "2 This magnitude iswithin the range of the factors K for which, as is shown above, the crack growth rate does not depend onthis parameter
6. CRACK NUCLEATION AT INNER FUEL CI ADDING SURFACE
According to equation (3) the penetration of cladding by iodine is accelerated at the positive stressgradient As it is shown above this gradient results at a crack tip m a plastic strain area It is known thatstress changes m the plastic area of a crack tip are similar to stress distribution in members subject toelastic-plastic load (fig 7) The positive stress gradient resulting from the plastic stale (for exampleduring fuel cladding interaction or under internal pressunzation etc) of an area abjacent the innercladding surface produces conditions favourable for an accelerated iodine accumulation m this area
a, MPa
Fig 8 Zr-alloy deformation in iodine 3nd argon (1 — Zry4,2 — Zry2,3 — Zr— l%Nb,4 — Zr> under£-2 10 s '.T-623K

IV)CT>
According to equation (7) a surface crack is nucleate ! when the critical concentration of iodine isreached. Hence, for a surface track to nndeate oo defects of inner cladding surface are needed. It isapparent that the nucleated crack can be trans- or intergranular.
Possibi'ity of a transgranular fracture is realized on condition if the stress level and iodineconcentration are adequate for a grain cleavage. In any case for a quick nudeation of a crack the iodineconcentration of a surface layer must reach the critical value in rather a short time. Apparently, it is ihnmechanism that can explain the quick nndeation of cracks observed in power ramp experiments as wellas in laboratory studies of iodine todoced cracking that model a fuel-cladding interaction 111, 20 !Thus, a transgranular crack ~20 fan long was nudeated [20] at the 5 sec load pulse. The crncl.initiation in 10—20 sec and Its full penetration in about a minute were attained in tests of fuels undertransient conditions [11 ],
Wh*.n analyzing the causes related to a surface crack nudeation one cannot neglect the influence or :ilocal surface segregation of impurities, indcnom as well as residual internal stresses or dcfe.-m !•).21—23 ]. The above factors can accelerate Oc diffusion flow of iodine; the rate of iodine accumulation ina metal can be significantly increased thus reducing the time of a crack nucleation. The influence ofinner surface accumulated impurities or alloying element» on corrosion induced cracking is indicated in[4, 21 J. It is shown that a removal of a surface layer 60 fan thick increased the time to fracture by ;ifactorof 20 [22).
Thus, the elastic plastic-condition of daddlng allows an acceleration of iodine induced cracking. Therate of the penetration of the surface KSU. by iodine wfll be controlled by the atresi gradient thai is in itsturn dependent on the metal strength and strain i««i*<>iiVg A higher strength will increase the rale ofiodine transport to the cladding material both at its surface and in the area of the lip of a propagatingcrack and, hence, accelerate the metal fracture as compared to that of low strength alloys. Thus, thetime to fracture and the strain of Zry-4 turned out to be less than those of either Zry-2 or Zr-1 % N b(fig. 8).
The highest resistance to SCC was demonstrated by zirconium that has a plasticity and the lowestamong Zr-aUoys strength (fig. 8>.
At the end of the analysis of t crack nndeation consider a loading version when cladding Is clastic.The typical hoop stress distribution in the dadding thickness is shown In fig. 7 (b).
In this case the iodine accumulation in the area abjacent the inner cladding surface will be inhibitedby the negative stress gradient Apparently, ft b the load level at which the cladding will still retain theelastidty will determine the threshold stresses below which as is shown experimentally, the corrosioninduced cracking does 'not take place for the actually forseable time. The suggested scheme docs notconsider the polycrystal material straining non-uniformity'related to the orientation of grains to oneanother and to the direction of the load applied. Durta« loading variations in deformation of adjacentgrains can effect the stress concentration at their boundaries which in its turn will govern the site ofboth the iatergrantuar nndeation of mkrccracks and the traasgrarralar cleavage.
7. INFLUENCE OF IRRADIATION ON CLADDING IODINE CORROSION RESISTANCE
An important but least studied is the problem of eluddaung the effect of irradiation on iodine SCC.Consider the passttde,factort capable of laflniwlng die dadding resistance in an iodine environment
They are1) Irradiation effected hardening «nd »Irin-lnr.1 rh.nfn 1^ 7r i11"yt;2) irradiation induced damage of inner dadding surface with fission product fragments;3) oxidation of cladding inner surface.If irradiation brings about hardening then according to the above armaments Iodine will accumulate at
a crack tip at higher rates and the crack growth wffl be accelerated. The experiments to assess the crack
600
100
HBWR(2)
1020 to21 1022
FAST NEUTRON DOSE n/cm2
low Iodine 5 mj ^^ high iodine 20 - 250 mg
Fig 9. Failure stress corresponding to 1—3 h failure limein tube pressurized SCC tests of irradiatedmaterial as function of neutron fluence [26 )
ICO
10
AAAAA
OOOOO
T,K Inert gas653 Ar + b653 Ar
I 2 3 4 5 i ) I 9 .0oxide layer thickness, ft
Fig 10. Influence of ZrOj at cladding inner surface onStress rupture in iodine (A) and inert gas (o) (33 ).

roo>rogrowth rate in irradiated and unirradiated Zr claddings depending on the stress intensity factorcorroborate this conclusion However, when assessing the full time to fracture one should not forget theprocess of a crack nudeanon. Irradiation induced increase of Zr alloy strength will lead to longer lime ofa crack nucleation as compared to uniradiated alloy at the same stress level, i e , irradiation shouldimprove the resistance to iodine corrusion [24,25] Nonetheless this tendency of improving the iodinecurraston resistance with fluence was not always reasized after the dose of —1020 n/cm2 [26,27 ] Thusthe results of irradiated (burn-up -30 MW day/kg UOz) cladding specimen testing pointed to areduction in iodine corrosion resistance at neutron fluence of 2—6 x 10²¹ n/cm2 to a level still lowerthan that observed for unirradiated claddings [27 ) (fig. 9)
To account for this effect an idea was suggested that dislocation "channeling" leads to an oxide filmfracture, thus, facilitating the onset of corrosion cracking [28 ) However dislocation channeling whileaccelerating iodine corrosion rate, leads to a resistance to SCC in irradiated claddlgs reduced to onlv-350 MPa, not to -200 MPa, as it was obtained for irradiated fuels [27, 29 ) In this connection, assessthe two remaining factors that possibly influence iodine SCC
The former cannot be apparently excluded taking account of cladding surface embnttlement withfission product fragments, and, hence, also an increase of metal susceptibility to cracking in iodine[30] However, no direct experimental proof was given that would corroborate the decisive role of adaddmg surrace damaged to a depth of—\0fim in iodine corrosion
The influence of the latter factor is related to oxygen released on fuei fission to form a Zr oxide him atthe inner cladding surface The ZrU2 thickness as measured in post-irradiation studies vanes in wideranges depending on burn-up and linear heating and reaches 18 ftm [31] Tests of Zry [32]andZr— 1%Nb claddings, showed that their SCC resistance is sharply decreased with the oxide thickness (fig 10)[331 The stimulating effect of an oxide film for SCC is likely to be induced by stresses that the oxidefilm creates in a metal due to differences in volume changes between Zr alloy and this oxide Thegrowth of a Zr oxide film in likely to lead to tensile stresses which when added to stresses effected bv anexternal load produce a fracture at a higher rate than in case of unoxidiged claddings
° je analysis showed that the irradiation effect on iodine embnttlement of fuel claddings shows up notonly as irradiation produced hardening but also as an influence of the cladding inner surface conditiondepending on fuel burn-up
8. CONCLUSION
The major element of the suggested theory of iodine — induced cracking of claddings m the action ofstress field on iodine diffusion to a pre-fracrure area of a metal. The model assumes that fracture takesplace as a result of a decrease of Zr cohesion strength depending on stress level and I concentration thusdefining the phenomenon under study as iodine induced embnttltmtnt. The analysis of the crackingprocess revealed the feasibility of predicting the influence of material strength as well as irradiation onfracture of fuel claddings in an iodine environment
Analysis of published data on claddings of water cooled reactor fuels showed that their behaviourunder aggressive conditions is quite adequately explained by the suggested mechanism.
REFERENCES
1 B Cox J Nud. Mater., 172(1990) p 2492 J C Wood J Nud. Mater, 45 (1972/1973) p 1053 B Cox and J C Wood, in Proc. Electrochemical Society Symp on Cjrrosion Problems in Entre\
Conversion and Generation. Ed CS Tedmonjr (ECS, New York, 1974), p 275
4 D Cubicaotti, R I_ Tones and B C Syrett Zirconium in the Nuclear Industry Fifth ConferenceASTM.STP754,Boston,4—7Ang.,1980 Ed-AmencanSooetyferTestingandMatenab 1982 p 146
5 S H Shannand D R Olander J Nud Mater, 113 (1983) p 2346 R E Williford Nucl Eng Design, 78 (1984) p 237 K Videm, LLunde Proc 4th Intern Symp on Zirconium m the Nuclear Indusin Stratford upon
Avon,UK,Junel978,ASTMSTP681,p 2298 R E Willrford J Nud Mater , 132 (1985), p 529 M Pechs, H Stehle and E Steinberg, in [7 ) p 24410 A K Miller H Ocken, A Tasooji J Nucl. Mater , 99 (1981) p 25411 H Mogard U Bergenlid S Djurle, G Lusell, G Ronhberg "Intern Trans Ramp I Fuü
Project" Proc of IAEA Technical Committee Meeting,Karlsruhe, 11—15 November 19S:>(IWGFPT/25),p 157
12 J Cnbicciotti and A.C Scott J of the Less-Common Metals, 77 (1981) p 24113 3 Cox and R Haddad Zirconium in the Nuclear Industry Seventh Intern. Symposium ASTM
STP939, P89, p 71314 GladkovVP , Smirnov E A , Petrov V J , Svetlov A B .TentshevVI, Bibilaslmh Yu K \o\ikc.
V V To be published in Atomnaya Energiya (in Russian)15 P SofronisandRM Moneeking J Mech-Phys Solids,37 (1989),p 31716 J.R Rice Corrosion, 32, January (1976) p 2217 K. Nomng, Y Haag and C Wikstroom J Nud Mater, 105 (1982) p 23118 GerbenchWW.ChenYT and John CSt Metallurgical Transactions 6A(1975),p 148519 M Nagai, S Shimada,S Nishimura.H Ueda.G Yagawa Nud. Engn. Design, 88 (1985) p 31920 R Haddad and B Cox J Nud Mater, 138 (1986), p 8121 D Cubicaotti, S M Howard and R L. Jones J Nud Mater, 78 (1978), p 222 Syrett B C , Cubicaotti D and Jones R L. J Nud Mater , 92 (1980) p 8923 T Kubo.Y Wakashrma.H ImahasliiandM Nagai J Nucl Mater , 132 (1985), p 12624 T Onchi.H Kayano M Narui J of Nuclear Science and Technology, v 19 N<>9 1982 p 7-1025 Stupina L.M , Sbamardin V K , Kobylyansky G P Novikov V V , Bibilashvih Yu K Soinikcn
A.S "Irradiation effect on corrosion cracking of WER fuel element claddings in iodine and c^immiodine medium" in Proc Intern Conf on Radiation Materials Science, Alushta USSR Ma\ 22—25,1990, v 8, p 41
26 Lande L., Videm K. J Nud. Mater , 95 (1980), p 210^27 JC Wood and J R Keim Res Mechamca,8 (1983), p 12728 OnchiT.KaynoH and Higashiguchi J J Nud-Mater 116 (1983),p 21129 Tomahn D S m Zirconium m the Nudear Industry, ASTM STP 633,1977, p 55730 I Schuster and C Lemaignan J Nud Mater, 151 (1988) p 10831 M Nagai, S Shimada, S Nishimura, K_ Amano and G Yagawa Proc of lAE'V Specialist:,
Meeting, Seattle, USA, 3—5 October, 1983, p 8932 Tsing-Tyan Yang and Chuen-Horng Tsai J Nud Mater , 166 (1989) p 25233 Bibilashvili Yu K., Dolgov Yu N , Novikov V V , Gryazev A P "Effect of inner iurrjct
preliminary oxidation on stress corrosion cracking susceptibility of Zr — 1 % Nb TubinD i! smeeting.

rv>o>03
ANALYSIS OF TRENDS IN FUEL RODDEPRESSURIZATION AND DETERMINATION OF'GAS LEAK1 AND 'PELLET-WATER INTERACTION'TYPE FAILURES USING RADIATION MONITORINGTECHNIQUES OF FUEL ROD LEAK TIGHTNESS
E.A. PANOV, Yu.M. SHESTAKOV, V.N. M1GLOResearch Institute for Nuclear Power Plant Operation,Moscow, Russian Federation
Abstract
Analysis of fuel rod failures in the Light Water Reactoroperation is presented. Analysis includes the meohanism offormation and development of fuel rod cladding failure untilthrough-wall defects appear (welding defects; inner hydridingdefects; pellet-cladding interaction; orud deposit - intensifiedcorrosion) as well as factors that determine defects propagationafter fuel rod depressurization (metal condition in the vicinityof defect determined by the meohanism of formation andpropagation defect; operational transients; degree of coreoooldown after depressurization during preventive maintenance).
Possibilities of in-service monitoring of fuel rodthrough-wall craok propagation using normal tools of claddingbak-tightness monitoring are addressed and used in the course ofanalysis. Characteristics and values are presented for radiationparameters for fuel assemblies during propagation of defectswith different degree of rod depressurization, including "gasleak", oladding craok and "open pellet-water interaction" withpotential partioulate fission product release from the damagedrods as well as after formation of recurring defects.
Based on experimental data on specific activity ofdifferent iodine isotopes in the primary coolant, a mathematicalmodel to analyse defect propagation trends has been developed.The model describes the rate of radionuclide release fromdepressurized rods and the rate of nuolear fuel fissionprocesses in the vicinity of defects. The model and results ofanalysis are illustrated by experimental and statistical data ondepressurization of WER (PWR) and RBMK (BWR) reactor fuel rods.
Possibility to solve the problem of predicting defectpropagation is considered.
1. Processes of Clad Failure and the Fission ProductLeakage Model
The present version "Nuclear Safety Rules for Nuclear PowerPlaints" [1] establish the operation limits for fuel rod failureand the safety operation limits for guantity and size of fuelrod damage. This limits established for failure "gas leak" and"open pellet-water interaction" (tabl.1). However, it's
Table 1Operation Limits of Fuel Element Failure and Limits of NuolearSafety Operation by Number and Size of Fuel Element Defects
(Appendix 1,2,3,4 H, P-56-60J)
Type ofReactor
WER(PWR)
KBMK(BWR)
BN(FBR)
AST
Type of FuelRod Defects
Gas leak
Pellet-waterinteraction
Gas leak
Pellet-waterinteraction
Gas leak
Pellet-waterinteraction
Gas leak
Pellet-waterinteraction
Operation Limitsof Failure
0,2 %fuel rods0,02 %
fuel rods
0,2 %fuel rods0,02 %
fuel rods
0,05 %fuel rods
0,005 %fuel rods
In technicalproject ofreactorconstruction
Limits of NuclearSafety Operation
1 %fuel rods0,1 %fuel rods
1 %fuel rods0,1 %
fuel rods0,1 %fuel rods0,01 %fuel rods
0,1 %fuel rods0,01 %fuel rods

toa> necessery following measure for safety operation fuel assemblies(PAs) with depressuriziation: in the first plase, to realize theinspection to nuclear fuel conditions; in the second plase, toprediction the development of failure and take out in time afuel assemblies with depressurization fuel rods (PRs).
Process of clad failures have many stage: 1. the rousing ofcladding failures; 2. the development of damage to throught-way;3. the gladding leakage; 4. the development of firstmicro-damage to macro-damage; 5. the rousing .the developmentand the appearance of second throught-way damage; 6. theaccelerated development of second damage to destroy of cladding.
The special any nuclear power plants - it is practicalimpossible during operation directly to Inspection to claddingfailure development. Only with inderect radiation methods offuel Integrity inspections (FIT) may to assess a degree offailed cladding with initial the cladding leakage include areleasing of current and a leakage monitoring of fission productfrom the PR failed.
Based on experimental data of iodine radionuclide specificactivity in primary coolant are chose matematical model.
It is allow to assess a development of PRs through-wallcrack propagation with first cladding leakage stage. The modeldefine the radionuclide relase rate from depressurized PRs andthe nuclear fuel fission process rate in the defect region.
The radionuclide relase rate from the failed PRs aredetermined from equations describing fission product generationand transport in the material system-the reactor primary coolant:
dA(t)/dt = S(i)'C2.\(t) / M - (Mi) + v(i)].A(l) (1)
where S(t) is the i-radionuclide release rate from failedcladding, atom/s; A(i) is the specifical activity oft-radionuclide in the primary coolant, Ci/kg; H is mass of waterin the reactor coolant system, kg; ?i(t) is decay constant oft-radionuclide, 1/s; v(i) = (G/M) • (E-1 )/E is the t-radionucliderelease rate from the primary coolant by clean on the cleaned
filter, 1/s; G is the water expenditure through of the cleaningfilter, kg/s ; E is the cleaning filter effectivning;C0 = 3.7-10"1"10 decay/(s*Ci) is constant.
The release rate on constant condition is it:
(2)
As a rule, it is better used by the releasing relativlyrate which are determined from parametr S(t) by difine on theradionuclide rousing rate B(t) in the PR:
= S(t) / B(t), (3)
where B(t) = (W /n. 7)-C.-ae(t), 1/s; W is the reactor power,tweti +10W; n. 7 is number of the PRs in reactor core; C = 3.1 -10T/W6 tr 'decay/(sW); ae(t) is the t-radionuclide summary releasing by
fission heavy nuclear, atom/decay.This matematical model was used for calculation of
releasing relatived rate from failed cladding in the reactorcore Nuclear Power Plant - 2 " Lovifea" (Pinland) [2]. Thedinamio development of PRs leakage is reflected in fig.1. It ishad meanings of the relasing relativly for different levels ofthe cladding leakage: 1 - pressurization FRs, when only sourseof the fission product appearance in primary coolant are turnedup the uranium fission processes on outside surfase of PRs; 2 -once leaking PR in the development stage of gas and iodineleak; 3 - once leaking PR with gas and iodine leak; 4 - twoleaking PR what's more once PR - with gas and iodine leak andother - with claddihg leakage and pellet-water Interaction.
•j OOUnder the circumstances for the short lived radionuclides Iand I the release rate was increased strong (curve 4).
The stowing regularity give confidence for saying that theexisting methods of cladding leakage degree assess by the shortlived and specific activity balance based on real the releasingprocess of fission products from cladding leakage. By furtherdevelopment this methods could be improved quality of the assess

99Z
W o
öI.
oCO o.
*""* W
o ^
ta,
P(6 <*P M
P*s,*«*
«O.
U
<£>
Relative release rateO o
io o
l
a o
g "< o
„ o aCLg-^
~~"° ao>—*
oi0)O]
COt-
>— ' 1fB ' ->£, H- °
g- p co o *
"le" iHrfiS'fii
(» i p0 0 P
Q,g4'
M .O5 i_k _j.
CO c~i ~
HJÎ 1 P ^=3 1 " w
^.^.oo uj j3 JL$9 f*n fc<&B »- _:
,ir w f j — * -*^S»*4 P jTL Q ~
»a o t* M i>-*
*£ «(go "^" (293 !? cî "*d _^ \ -» -
-
f=\/f-
Release rate, atom/sO 0
o ^
/
î7/
NJ,
/
/1 ——— f-
!
X
/1
^
2 ^ ~
/^
V
j/
X ^> y^
/- - —— — -
OJ
y///—4—/
,s t/
/
/s
/'/
/ . »
0M
:;X
7///
//'
oÖl
5T8?ff **2 ca
(î
0» *
" Is,men >_
-- 5 O
Be-ftDm >-!ttï M jX
" S-B «y p O**i t\2 M"*^ 0.
«.0
-- 0«*" öS,
M>

WO>05
and calculated quantity on reactor core the FRs with gas andpellet-water type failure.
It will be noted that researchs of the activity fissionproducts on primary coolant are contemporary for learning of FRfailure process in constant and change conditions of operation(by the reactor power changing).
In particular the such measurement was maked on NPP"Loviisa " [3] and showed two manner of PRs failure development:1 - quick increasing of activity and seting of activity levelsmaller of peak activity; 2 - quick increasing of activity in5/10 of magnitude and seting of activity level smaller of peakactivity for 15/45 o'clock. It will be noted that sometimes theiodine and the gas activitys were increase quick for time, inother case - the iodine activity was increase only later thedelay period.
The showing of regularity is characteristic of for reactorsRBMK that is showing in fig.2 [4]-
2. Stnictural-Dinamic Analysis ol Damage Reasons
2.1 The Damage Mechanisms and. Block Diagram ol AnalysisHowever, the knowledge of FRs failure process, of cladding
leakage degree and of FRs failure development is not enough forfailed cladding development prediction. It possible only in away establiching of mechanism and reasons which is defined offailure process.
Analysis of damage reasons of the water coolant FRs withzirconium alloy cladding was showed that is know nine damagemechanisms. The design reason of FRs are determined possibilityconstriction of cladding, denselyty of fuel pelletelongation andbuchling of fuel elements and fretting-corrosion. Thetechnological deficiencies are determined folloing a damagemechanisms - inner hydriding, different of pellet enrichment andwelding defects. The outward corrosion which is increased fromdeposit of corrosion products on the clad FRs and mechanical
Block Diagram of Information Processing under Fail-Safe Control ofFuel Assemblies
of solutionrealization
Core with fuel assemblies
non-influences formation:-initial properties;_-leaking;-operation conditions.
measurements and
-determination
Identificationof models
.3
interaction of fuel and clad which is intensity of fuel fissionproducts.
On fig.3 is showing block diagram of information processingunder analysis of FRs reasons. The using this block diagram aremake it possible to establich of reasons regularitys ofparameters values which is characteristic of FR- failure degree,whith similarity of parameters values of real quality and FRsoperation conditions.This method are have the systematicanalysis which are allowed to influence on FRs work include theaction of relatively constant factors and of dinamic factorswhich is changed in time. It is gived the FRs defectsdevelopment prediction possibility and to choose and to change aparameters, what are decreased the FRs failure number.

The Basic Mechanisms and Causes for Failure of Fuel Eleraenlfrom Zirconium Alloys in Water-Cooled ReactorsTable 2
Claddings Continuation of Table 2
Mechanismsfor Failure1Clad collapseunder effect olfission productgases (FPG) andpressure ofcoolant
(PWR)Pellêl aensïïîca-tion leading toreduction o? heat-rewoT and localpulses of powerIPWRjtBWR}Fuel rod/fuelassembly growthand bowingleading to locallünitaUon ofcoolant flow,reduction ol heat-transfer andraagnifing claddingcorrosion
iPWRlClad fretting
(B»R)
C a iconstructionz
-differentialpressurized;-relation of wallthickness todiameter;-firstling localcircularity;-gap with fuel pile-density of pellets-micros true ture ofpellets.
-mûïualîïy ôï luelrods and spacergrids;-distance betweenspaser grids;-moment of inertiafor cladding axialsection;-pressing (widening)force;-thickness ofcladding.-sizes of fuel ro3s-distance betweenspaser grids;-physical andelectrochemicalproperties olcontacting metals;-load at contactinterface .
j s e sFabrication3-size of grains;
-microstructure ofmetal and impurityelements';-head-end colddeformation;-annealing regime;-mechanical_grop.erties.
-creep andelongation ofcladdings .
Operation4
-temperature;-neutron current.
-temperature;-neutron current.
-gradients oftemperature andneutron current.
-turbulence andpulses of coolantpressure(frequency,amplitude,a general numberof vibrationcircuit ; ;
- corrosion environment.
ILocal hydrldlng
of ZR(PWR, BWR)
Enrichment errors|BWR)Welding defects(PWR, BWR)Outside corroBlonis intensiflngcrua/scaiedepositioncorrosion productson fuel rodcladding surfaces
(But)Mechanicalpellet/claddinginteraction (PCI)is intenslflngellect of fuelfission product
(PWR, BWR)
2-presence ofweldes and zonesof their heatinfluence.
-density ofpellets;-microstructureof pellets.
3-leaving of mois-ture and organicsubstance in fuel;-impurities ofchemical catalystsneutralizingprotection proper-ties of oxide film-lasR oï 7-scannIngof fuel pins.-ïaulîy welds aremisalnK to control-outside and insidedirty of metallfor nitrogen andoxidate deposits;-non-op t iraumthermal process.
-peculiarities ofpellet fabricationtechnology.
4-termodiffusion ofhydrogen to greatercold walls;-decontamination ofoxides under PSI;-lessen oxygenquantity lower ofcritical size.
-temperature; -timej-thickness of oxidefilm;-neutron current;-chemical propertiesof coolant;-heat current;-boiling regime;-deposits of Fe.Cu.Si-materials of circuit-cficRIng 5ï pelleïs;-creep of cladding;-lessen gup;-burnup of fuel;-level of linearpower under chugging;-speed of linearpower increase;-time of functioningunder big power:-air of transientregimes;-namber of cicuit;-stress corrosioncracking in effectol llssion product.
ro
2.2 The Fuel Failure Characteristics at RBMK. Analysisof Damage Reasons
The design of reactors RBMK are allow in every assemblieand unloaded them from reactor immediate in time of work. Onexemple of experience RBMK may have desided problems of claddingdefects development prediction.
Discovering of PAs with the FRs failure, sistematicobservation for them using methods of the cladding bak-tighnessmonitoring and comparing results of observation with results ofthe primäre coolant sample radio-chemical monitorings and withchanging of the gas fission products (GPPs) in steam of the
separator-drums are allowed to distinguish several stages of FRsfailure. It is haved the events with gradually development ofcladding defects and with quick development of defect sizeswhich is accompany sharp of the GEPs activity increasing in thesteam separator-drums. Based on this observation, of FAsoperation experience, of PRs failure degree definition byexperimental values of monitoring systems and of PAs inspectionresults are maked the classification of the cladding defectvalues in depending on failure degree [51-
The fuel failure characteristics of the RBMK-1000 PRs areintroduced in tabl-3. Analysis of PAs distribution with PRs

roO)CO
Table 3Descriptions and Values of Radiation Parameters for RBMK-1000 Fuel
Assemblyes (FAs) with Different Leaking Degree.
Title and Size upof Parameter
1 . Descriptionof defect
2. Sizes of probeaway designdetectorsAt, imp./s3. Specificactivity of radionuolides in primary coolant, Cu/kg
131j 132j 133j134j. 135j
- 239Kp
ieak-ProofPAs
Thereis notdefect
0-100
2-10~9
is not
L e a k i n g D e g r e e1 st DegreePOIHTDEFECT,
HICROCRACKGas andiodineleaking
200-1000
(1,1-1,3)«
4-10"7
is not
2nd DegreeCLOSED
MACROCRACKLeakage ofcladding
1000-2500
(1,2-2,0)«*io-64.5-10"7
is not
3rd Degree•OPENMACROCRACKPellet-waterinterac-tion
2500-5000
2.0-10"6
b-10~7
(3-4)-10"T
4th DegréDEVELOPEDDEFECTPellet-wa-ter inte-raction.Destructi-on of pel-lets in fu-el element2500-5000
(0,8-1,0)««io-5
(0,6-1,7)«
(3-4) -10"7
5 DegreeSECONDLEAKEGEDEFECTEithersecondin eitherfirst de-fect from•1st to 4Degree>50OO
Any from1stleakingDegreeto 4thDegree .
lailure by GFPs activity decreasing effect after theminloadeding from reactor core (fig.4) and comparing with resultsof classification are allowed to make folloing conclusion. Thedevelopment of failures from gas and iodine to macro-failures bythe GFPs activity increasing in the steam separator-drum to 2500imp/s are occured apparently without water geting under clad.Open pellet-water interaction and following dectruction of fuelare due to second distribution peak from 2500 to 5000 imp/s.
The PR failure with unloadeding effect over 5000 imp/s arecorresponded always sharp the GFP. activity sharp increasing.However, in this case the activity increasing are not occuredfrequently by the activity increasing another radionucleus thatis haved with the FR failure 4-degree (tabl.3). Therefore,the GFP activity increasing over 5000 imp/s are connected with
appearing the FR second through-wall failure at certain distancefrom first. Appearing second failure is leaded to increase ofthe GPP short half-life leacage from cladding because ofthe pressure differance along FR. It case,if first and secondfailures have level of gas leak only the steam phase is
Distribution of Discharging Leaking Fuel Assemblieswith 2,0& Concentration (n) by Decrease Activity Effectin Steam Separator-Drums (SSD) after Discharge (AA )
(Kursk NPP)
50
40
30
20
10
358
J2500
! charge;hout effect
5000
Fig.4
7500 10000MSSD' imp/s

contacted with fuel and it is contacted with fuel and it is notleaded to fuel destruction and leakage of hard fission productsin reactor system.
The probability curve of work without failure and ofassemblies RBMK-1000 failure intensity, which is determined inmoment of FRs failure discovering is showing in fig.5- Analysisthis curve by realibility theory and structural-dinamic analysisof failure course was allowed make the conditionalclassification of the FRs failures mechanisms.
Cladding leakage in burnhap interval to 300 MWd/FA isstipulate for initial manufactoring defects and in burnhapinterval from 300 to 900 MWd/FA-with inner hydriding process.Cladding leakage in burnhap over 900 MWd/FA is defined ofoperation factors and besides is taked please of failuremechanisms.
Probability of Functioning without Leaking (P' ) andleaking Intensity (X' ) of Fuel Assemblies (FAs) at
the 1st and 2nd Units of Kursk and Chernobyl0? P'
1/MWd
30
20
100,8 -
CO
°^)'7Ö '50Ö" 1000
Concentrât ion: 1 ,8% $ - -A- -; 2,Q% \ |
Pig-5
, MWd/FA
The first mechanism is determined of the corrosion productslarge-scale particle separation along the primary reactor systemhorizontal collectors for inlet to core canal. Particles isaccumulated in reactors under them interruption for repairingwork fulfiment. They is precipitated under liffing reactor poweron FRs, which is coolant from the collector final share. Theaccumulation of the corrosion product large-scale particle istook plase in presense the coolant raising mixing (on the spacerglids and on the FAs entrance). In this plase is realisedpossible the wick-effect of aggresive admixture concentration ofwater (chlorine - ione alcali) and the conception of claddinguncer corrosion local process. It may be leaded to the fuelleacage for two-three years.
The second operation mechanism of failed cladding isdetermined by mechanical interaction of fuel and clad, that isdue to the energy control deficiency, to transients expenditureoscillation through of technological canal with FA.
Cladding leakage over 1500 MWd/FA may be connected alsowith FR wear, that is determined of any mechanisms combinationof failed cladding.
2.3 Conditional Probability of Cladding Failure DevelopmentFrom the showing classification is calculated the
conditional probability of cladding failure development forworked interval, which is connect with fuel leakage suitablemechanisms (fig.6-9)-
The FA refusal probabilitys becouse of them failure andunload from core in burnhap intervals 0-300 and 300-900 MWd/FAis reached 7056 (fig.6,7).The fuel leakage in this work intervalsis connected with the FRs construction and origin in regions ofstrains concentration on FR cladding and of cover welding seams,which is plased at core centre. That is why of the PA intensiverefusal at once after them failure, when take plase theincreasing velositys of defects development in region of firstdefect (curves 2,3). When moisture penetreting into cladding andhydrogénation in region of welding seams is appeared grate

Failure Probability (F) and Failure Intensity (A) ofFuel Assemlies (FAs) on Condition of their Leaking underA x10?1/MWd
4
3
2
1
n
0,7
•0,6
0,5
0,4
0,3
0,2
0,1. n
+
X
« o o o ooo o o o o o o0 0o o is, ,
o . F
x x x x x x x x x x x x* XX i —— iX X X 1 — — 'n n , , i , , 1 , 1 , ,
o o o^1
7•f + -f
/3X X X
, IN
1-all failures (o); \<- <-v>2-with contribution to activity of fission product gases (FPG)in steam separator-drum (SSD) (0-2500) imp/s (+);3-with contribution to activity of FPG in SSD (2500-5000)imp/s (x);4-with contribution to activity of FPG in SSD > 5000 imp/s (*).
Fig. 6
Failure Probability (F) and Failure Intensity (A) ofFuel Assemlies (FAs) on Condition of their Leaking underBurnup Interval tp (300-900) MWd/FA
f\f A I \-t f
1/MWd4
3
2
1
n
0,70,6
0,50,40,30,2
0,1
- n
; —
•
-o
-
-
.
* o o o o o o o oO K
V iO X Tp
f+ + + + + + • + + * + + + +
+——— I 1
' — i *XLX-iX X X X X X X X X X X X X X X .x x * * * * * * * r*i*_* * * * * * * * < — — 4* * — | _ ——— i i it < i i 1 i i i 1 1 t 1 i i 1 i i i i 1 t0 500 1000 1500
1-all failures (o); (t-tp), MWd/FA2-with contribution to activity of fission product gases (FPG)in steam separator-drum (SSD) (0-2500) imp/s (+);3-with contribution to activity of FPG in SSD (2500-5000)imp/s (x):4-with contribution to activity of FPG in SSD ^ 5000 imp/s (*).
Fig.7
Failure Probability (P) and Failure Intensity (A.) ofFuel Assemlies (FAs) on Condition of their Leaking under
Burnup Interval tp (900-1500) MWd/FAA x1O1/MWd
? r F
4
3
2
1
n
0,7
O,6
0,5
0,4
0,3
0,2
0,1. n
K
-f 7
o
-
o o o o0 ° p/*
N, 7+ + + +
+ + ^
o
+
A+ I -f /"' —— | X X X X X XX
* * * * (-*-! * * * * * K*x i x i x hx-| h— i i — i i | iX
1-all failures (o); '" *v'2-with contribution to activity of fission product gases (FPG)
in steam separator-drum (SSD) (0-2500) imp/s (+);3-with contribution to activity of FPG in SSD (2500-5000)imp/s (x);4-with contribution to activity of FPG in SSD > 5000 imp/s (*).
Fig.8
Failure Probability (P) and Failure Intensity (A) ofFuel Assemlies (FAs) on Condition of their Leaking under
Burnup tp »1500 MWd/FAA. Tin3 ~°f\f A l U j
1/MWd4
3
2
1
n
0,7
•0,6
0,5
0,4
0,3
0,2
0,1
- / X
-o
-+
o o o oo ° "S.
/ F 2
+ + + + + + ,
I /x xlx x x.x x S"' l
1-all failures (o,; <*-**>• Mffd/FA2-with contribution to activity of fission product gases (FPG)
in steam separator-drum (SSD) (0-2500) imp/s (+);3-with contribution to activity of FPG in SSD (2500-5000)imp/s (x);4-with contribution to activity of FPG in SSD ^ 5000 imp/s (+).
Fig.9

probility of second defects on some distance from the firstdefect (curve 4).
The PA refusal probabilitys by burnhap intervals 900-1500MWd/FA and above 1500 MWd/FA (fig.8,9) is not increased 45%and 40% accordingly. The defect develcpment probability of gasleak (curve 2), of pellet-water interaction (curve 3) and ofsecond defects (curve 4) is being considerably smaller. The FRcladding leakage becouse of unser local corrosion is not had ofreasing strains and it is possible to propose, thet the velositydecreasing development of second defects is discovered exactlyfor this failure mechanism. On the contrary, under mechanicalinteraction fuel and clad is increase the strains concentrationin plases of failure and it is appeared the crack. Therefore,the second defects development on failed cladding under theburnhap over 900 MWd/FA is took plase under the first defectsbecouse of the mechanical interaction fuel and clad.
It must be borne in mind, that at least mechanisms andfactors of beginning and of the cladding defect development isconnected with the metal state in defect, region however it isnot defened them. The defect development after failure isdetermined also possibly of moisture penetrating under cladding,which is depend on the trancients operation number and thecooling degree of core under the reactor stop. It is being thepossibility to the second defects beginning and the seconddefects development in region of first defect becouse of innerhydrogenat ion.
In conclusion is added, that the FRs with gas leak defectsmay be quite opereting, that is provided of the them statemonitoring possibility and of the defect development predictionpossibility operation choosing. The FA operation with thegreater cladding defects is limited and them unloading is as arule regulated of standardized documents.
REFERENCES
[1] Nuclear safety rules for NPPs. ( Rules and standart atatomic power engineering) M.:EAP,1991- - 60p.
12] Moisio J.M. et.all. Experience of Operation withLeaking Fuel at Loviisa NPS an Examination of Leaking Assembly//International Topical Meeting "Fuel for the 1990's",0vinion,France, April 1991- - Proceeding, Vol.1, 465-477-
[3] Moisio J.M., Terasvirta R.P.WER-440 Fuel Performanceat Loviisa // Jornal of ENS. - Nuclear Europe Worldscan. -NO.1/2 January/February 1991,9-10.
[4] Panov E,A. Practical Gamma-Spectroscopy at NuclearPower Plants. -M.:EAP,1990. - 200p.(Library of MPPs woker;Vol.28). ISBN 5-283-03838-6
[53 Panov E.A. Fuel Rods Leakadge Degree Classification.Fission Products Exit Model from Fuel Rods Failled CladdingCharacteristics of Defects // NPPs Operation Level Perfection.-M., 1989. -p.207-219

•-JroOPERATION AND RADIATION MONITORINGOF WATER COOLED REACTORS WITHFAULTY FUEL RODS
Yu.M. SHESTAKOV, E.A. PANOVResearch Institute for Nuclear Power Plant Operation,Moscow, Russian Federation
Abstract
Typical operation peculiarities of fuel assemblies (FAs)with faulty fuel rods of Soviet pressurized water reactors(TVER) and one-circuit pressuretube boiling water reactors(RBMK) are addressed. Operation of FAs with faulty fuel rods isconsidered for steady state plant operation, for transients andshutdowns. The methods of radiation monitoring of rod claddingbak-tightness in the course of operation, radiationleak-tightness criteria and the creed for discharging failedfuel rods from reactor are considered. General reliabilityindicators describing fuel element cladding leak-tightness inthe core and criteria of current plant radiation safety arepresented. Possibility to solve the problem of choosing optimumoperation regime in the presence of failed fuel rods in the coreis considered.
1. WER Fuel
1.1. Burst Slyg DetectionBurst Blyg detection (BSD) of WER type FAs is made during
the preventive maintananoe. Water sumplings were being takenaway without defuelling fuel rods out of core in the initialperiod of WWER type reactor operation. Then FAs were become toload into canned casks with water being in fuel pool orrefueling machine with aim to enhanced of sensibility. WaterBumplings were being taken away after being of FAs in casks[1, P-190].
Presence of defects in fuel rod claddings is determinedresults of fuel rod cladding leak-tightness testing (LTT)during reactor operation and after their defuelling from core inLTT fluid-sampling apparatus at present (table 1).
1.2. Radiation Criteria oî Fuel Rod Leaking and the Creedfor Discharging Palled Fuel Rods (Table 1 )
Fluid-sampling apparatus and FAs are washed fromdepositions of fission and corrosion products with aim to findall FAs with leaking fuel rods including defects of "gas leak"type. After that water circulates in closed circuit offluid-sampling apparatus with five minute cycles underdifferential pressure in fuel cask and water samplings are takenaway (table 1). Activity values (A.) of choice nuolides insamplings for group of studied n-FAs are re-determined to themoment of reactor shutdown (A ).
Mean value of activity (A) and standard deviation (O) aredetermined:
(1)
,131-If specific activity of choice nuclide ( I) overbalancesmean value of activity for group of FAs greater than to 3O andactivity of corrosion products (through J Un) diffères from meanvalue less than to 3O, then this fuel assembly is been leakingfor TVER-1000 type reactors. If fuel assembly with leaking rodhas been found then count is repeated for remaining fuelassemblies with the exception of leaking FAß. Count is repeateduntil all FAs with leaking fuel rods have been found.
FAs with activity of corrosion products differing from meanvalue greater than to Jo are put to the revision test in LTTfluid-sampling apparatus. If through I finding of leaking FAsis difficulted, then values of 134Cs and 137Cs specificactivities are prooessed too.
Like criterion of fuel rod leaking is used for VTER-440type reactors including abroad of our country (table 1).

TableThe Methods ^f Rad-ation Mon.tonng of Fuel Rod Cladding Bait-TightnesE,
Radiation leak-lightness and Failure Criteria of Fuel Rods and the Creedf}r Discharging Failed Fuel Assemblies (FAs) from Reactor are Usea
for WSR-Type Reactors
Continuation of table 1
Conditionof
Reaotor1
Thereactoroperatestostationa-ry power
Changesof power,cum localchangesarecausedmovementof theabsorber-type con-trol rode
The Method of BSDThe Method ofBSD Testing
2Control ofthe fissionproducts inprimarycircuit water
Section loopmonitoring ofrod claddingbak-tightness
Regijn ofMeasuring
3Watersump lingsare takenawayContinu-ouscurrentofcoolantWatersamplingsare takenawayContinu-ouscurrentofcoolantContinu-ous
Continuous control ofthe fission products(FP) in water ofprunary circuit and/orpreheat section loopmonitoring of fuel rodcladding bak-tightness
Reao-torType4
TVER-440
TVER1000
VVKK-440WER1000WER-440
WER1000
Radiation Criteriaof Fuel Rod Leaking
5Specific activitiesof 131I and 133Xeexceed greater than4/10 times according3,1 '10"8Ci/Kg and3,0-1 0~6Ci/kgactivities throughuranium dirt on fuelrod claddingsSpecific activitiesof 131I and 134Iexceed greater than4/10 tunes according1,2'10"7Ci/kg and5,0'10~6CiAgactivities throughuranium dirt on fuelrod claddings
-Increase of activityequal to or greaterthan 5 tunes every30/60 minutes pastreactor-down.Increase of latentneutron flux nearprimary circuitpipes .
The Creed forDischarging FAs.Failure Criteria.
6Failure of reactorthrough radiationsafety function-activity of driedprecipitate
e10~2Ci/kgevery 2 hour pastsumpling waterFailure of reactorthrough radiation-safety function:activity of 131-131 iodines sum is21,5-10~2Ci/kg
in momentBumpling water
-
-
1 r— 0Tbereactorhad oeenchuteddown atpreven-tivemainte-tenance
•5 1 4Specific Until 40activities of1 31 T 34p1 , \/B ,137Ce FPand 54Mncorros 101productsare measuredin cask waterof CLTT fluid-sump lingapparatusafter washingof apparatusand FAs, andcirculatingof water by5 minutescycles underdifferentialpressure :
days pastshutdoun:1-0,3 MPa2-0,05MPa3-0,3 MPa-wateresump lingis takenaway.From 40days to7 month.twosump lingspast 1stoyole- A*past 3rdcycle- ArtTwosamplings1st past0,4 MPaoyole ,2nd past0,05 MPaoyole.
WER-440
WER1OCO
5Aj è i + Kq'O, whereA3 is onoioe nuolideactivity in sumplingof J - FAs, A ismean value ofactivity for groupof tested n-FAs,O isstandard deviation,Kq is Studentdistribution kvuntilFor13iCs and/or1 37CsA^ Ï 1 + Kq'O (1 )and Aj •» A'.If Aj~A' revisiontest; if relationsmaintain, then FAsleaking, in anotherway-conclusion by(1 )If for I:
for54Mn: A' +3-o2then count isrepeated forremaining FAs untilall leaking FAs havebeen found.If A.jg»<J2+3-o2, thenresults of 134Cs and1 37Cs are processedtoo.
bTo momert ofreaotor shutdownAj( ^I)210~ Ci/kg
-
To moment ofreaotor shutdown:Aj( I)?10~iCi/kg
GÎ
1.3. Fail-Sale Rates (Table 2)The fail-safe rates describing condition (leak-tight) of
reaotor 1st protective border had been introduced for assessingof NPPß safety standart in 1991 (Table 2). They are definedactivity values of fission products being in primary coolantcircuit. The fail-safe rates of fuel rods are determinedactivities of iodine nuolides are measuring claddingleak-tightness testing system (LTTS) in primary coolant for
stable state of reaotor and power equal to or greater than 85%of nominal power.
The fail-safe rates of fuel rods in month are determined asmean of measuring activity during month. Rate characteristicsfor a period greater than one month are determined as meanvalues of rates in every month.
1.4.Current Radiation Safety Criteria for WER Power PlantsMonth-m^an equilibrium specific activity for the iodine
nuolide sum PII(I) is radiation rate of fuel rod total leaking.

f^j This value describes halogen (iodine, bromine) release out of•^ faulty fuel rods and it determines leaking degree of fuel rods,
putting to dirtting of coolant. If it is reaching critical value4-3-10~4 Ci/kg, then it is necessary to wath on a weekly basismeasuring nuolide composition in primary coolant. On reachingthe total iodine nuclide specific activity of 1 .0-10" Ci/kg,i.e. the second critical level, analysis of the isotopiccomposition has to be performed on the dayly basis andpossibilities of the unit operation without changing of powerare studied with a view to decrease rate of specific activityincrease. In case of exceeding the limiting level of the totaliodine nuolide specific activity, which is equal to 1.5-10Ci/kg, a reactor has to be shut down and FAs with faulty rodshave to be discharged.
Continuation of table 2
-2
Pail-Safe Rates of Fuel Rods for Assessing of Safety Standard,of WER Units
Table 2
Title of Pail-Safe Rate1
1 . Mean equilibrium'"'I specificactivity of primarycoolant for stablestates of reactorthat is normalizedto design speed ofcoolant cleaning -A(131I), Ci/kg
2. Mean equilibriumactivity of primarycoolant for stablestates of reactorthat is normalizedto design speed ofcoolant cleaning -J4134I1. Ci/kg
Formulas for Count of Pail-Safe Rates2
1 n A.131 + VA(131I)= - - T ( AÎ131I.I) • —————— e52- ), where
n ifi *'31 + %A(131l,t) is 131! specific activity of primary coolantfor 1 stable states of reactor that is normalized todesign speed of coolant cleaning (Ci/kg); e X131 is131! decay constant, it is equal to 1.0-10 1/s;VOBO = -jj- is coolant real cleaning speed for water-cleanup filters (WCP) (1/s), VCBO = 0 if filteres areturned off; Q is ooolant flowrate in WCF (kg/s);M is primary ooolant mass with exception of water massin pressure compensator (kg), it is equal to 165 kkgfor WER-440 and it is equal to 214 kkg for WER-1OOO;V = — jp- is ooolant design cleaning speed for WCP,it is equal to 3-4-1 O"5 1/s for YVER-440 and it isequal to 3.9-ICT5 1/s for VTER-1000; Qnp is designooolant flowrate in WCP (kg/e), it ie equal to 20 t/hrfor YVER-440 and 3O t/hr for WER-1000.
1 n A.134 + VA(134D= - • T ( A(134l,O • ——————— S 2- ), where
n 1=1 M3i + vnpA(134l,O is 134! specific activity of primary coolantfor i stable states of reactor that is normalised todesign speed of coolant cleaning (Ci/kg); M34 is1341 decay constant, it is equal to 2.2-10 1/s;v , Q, M, v , Q, n are as well as division 1.
•j
4.
5.
6.
7.
IMean equilibriumiodine nuolide sumspecific activityof primary coolantfor stable states ofreaotor -PII(I), Ci/kg
Mean relativerelease rate of 13:Inuclide out ofleaker fuel rods toprimary coolant -P(131I),rel. units
Mean relativerelease rate of 134Inuclide out ofleaker fuel rods toprimary ooolant -Ï034I),rel. units
Campaign-meanfailure rate of fuelassemblies throughleaking fuel rods -H, 1 /effective dayCampaign-meanleaking rate offuel assemblies -Wnr, 1 /effective day
'j ——————n
HI(I)= - • y A(I,t), where11 *='A(Iyt) is total iodine equilibrium specific activity
of 1311,132-^133^134-^135.,. nuolide sum i^pr^arycoolant for stable states of reaotor (Ci/kg).
P(131I) = |i 1I) whereV ' X , , , +V-mS(131I)=A(131I)'C'K—- — is average during month
A131equilibrium release rate of1 1 I nuolide out of leakerfuel rods to primary ooolant (atom/s);X131, vnp, A(131l), M are as well as division 1;C = 3,7 -1010 dis/sCu is constant;
nB(131I)=D-ae(131I)-^ •£ Wt is average during month
1=1formation speed of I in reactor core (atom/s);D = 3,1'1010 div/sW is constant;3E(131I) = 2.Y74-10"2 atom/fis is cumulative bearingof I atoms during fission; Wt is heat power ofreaotor at t measuremet moment (W ) .
ÏC134I) = uf^TY- whereB(134I) X.-.+vS(134I)=A(134I)-C-M— !^^ — SE is average during month
A134equilibrium release rate of I nuolide out of leakerfuel rods to primary coolant (atom/s);Xi34, vnp, A(134l), M are as well as division '1 ;
nB(134l)=D'ae(134l)'5 -J Wi is average during month
1=1formation speed of 13l4I in reactor core (atom/s);£(1341) = 7.176-10"2 atom/fis is cumulative bearingof 134I atoms during fission;Cj. DA Wt are as well as division 4.
WOT = NOT / Ee®. , whereBe®, is fuel-residence live time of unit during itscampaign (effective day of heat power);NOT is the PAs number with leaking fuel rods ofa failure criterion leaking degree these are detectedat the end of campaign.
WHT = NHT / Eajrji. , whereNHT is the PAs number with leaking fuel rods ofa radiation criterion leak-tightness degree these aredetected firstly at the end of campaign;Es$di. is as well as division 6.

•siOl
If month-mean equilibrium specific activities of primarycoolant for stable states of WER-1000 reaotors are equal to1.2-1CT7 Ci/kg of 131I and 5.0-10"6 Ci/kg of 134I then all fuelrods in oore are oanned. For TVER-440 reaotors suoh specificactivities are equal to 3-1'10~8 Ci/kg of 131I and 2.7-10"5Ci/kg of I. These activity levels are determined onlymanufacturing uranium dirt on the fuel rod cladding surfaces.Activity of more longer lived 131I nuclide exceedes 4/10 timesmentioned levels on appearing in the oore the first fuel rodwith beginning "gas-leak" type failures. Increase of thespecific activity of more short-half life 34I nuolide arisesfrom next propagation of oladding defects.
Rates of month-mean relative release rate of iodinenuolides out of leaker fuel rods to primary coolant, i.e.P(131l) and F(134I), determine leaking degree of all fuel rodsinoore. They were introduced with aim comparing the fail-saferates of fuel rods in different units and reactor types.
1.5. Peculiarities of Operation of WER Type Reactors withFaulty Fuel Rods
Depressurization of fuel rods hardly ever takes not placeon high manufacturing quality of WER-440 and WER-1000 fuelrods as well as stable operation conditions of cores. Less thanone or two fuel rods with defects of "gas leak" type are foundduring one oompaign.
Such case appearing one "gas leak" fuel rod has beensubmited in figure 1. Activity value of more longer lived 13 Inuclide approximately equel 7-10~6 Ci/kg and exceedes greaterthan 4/10 times its specific activity from dirt on the fuel rodcladding surfaces. The specific activity of 13:il at 3 unit ofZaporozhye NPP grew also in April/May. This arose fromdeveloping of cladding defect in "gas leak" limits.
During the last years high depressurization WER fuel rodsthrough manufacturing defects was watched only at 4 unit ofNovovoronezh NÎP (figure 2). Eight FAB with leaking fuel rodswere discharged during three campaigns, four of theirs had
10
«afl
.TH 10>•FH
+JÜcoo
U<DCum
Month-Mean Equilibrium SpecificActivity of Primary Coolant(3 Unit of Zaporozhye,1991)
10
Frei eiiti'mai iten
0 1 2 3 4 5 6 7 8 9 1 0 1 1 1 2M t h.._ o n _ __
131 I, 2 - 134 I, 3 - iodine sum;80 per cent of nominal power.
Fig.l

oSp
ecif
ic
acti
vity
, C
i/kg
oo
o
I u§»•
2, n o n>
roCD CO
." O
oW
*»-«
)
O o §1
co HH
CD
03
h-
l
'i_
o
o (t
o ön
g:c
o00 Ö
*"S
«>,«
•
»!
p i :
\N
Jo
Z ^
?7
O
«.
CD
2>«
O
'
Spec
ific
ac
tivi
ty,
Ci/
kgo
oo
£
w S
o> *•*
o•^
0 c
O £7
*
P >i
CD
U5
O
g
& °
|3
P 2-
i n
£0
MP
- ö
^
o E
^r
3 et
0 0 tr -t-
M
5
O-J
S O
,crtr
o o
£2.^
.M 3 s
§o
§>
§3

N>
the"gae leak" type defects and four of theirs had more largedefects. All these PA s belong to one experience party withcontact welding cf fuel rod claddings and their lids. One FAs ifthis party was discharged with failure defect of fuel rod afterthe first campaign in 1989- In 1990 during the preventivemaintenance one more PAs of this party was discharged withfailure defect of fuel rod. As a result happeningdepressurization of this party fuel rods two more failure PAsand four FAs with "gas leak" type defects were discharged out ofreactor in July 1991.
Faulty of fuel rods by virtue of operation conditionviolations was observed in 2 unit of Cola NPP (figure 3). In1990/1991 eight PAs with failure defects of fuel rod claddingswere discharged out of the reactor on account ofdepressurization (5 FAs in April 1990 and 3 PAs in April 1991).
1^1At that considerable growth of I activity in comparison withI activity results from appearing a large quantity of "gas
leak" fuel rods. Their depressurization had been connected withdeposits of corrosion product orud particles and organicsubstance. This substance probably have appeared in primarycircuit as result destroing of organic filter. High thickness ofthese deposits is observed on claddings in the region of thelower spacer grids (into the zones with the high flowturbulence). These deposits can to put into nodular (pitting)corrosion and depressurization of fuel rods.
Increase of primary coolant activity was watched in bothoases for WER-440 however the equilibrium total activities ofprimary coolant were less than 4.3-10~'1 Ci/kg, i.e. the firstcritical level.
Fop the WWER-1000 reactors insignificant increase of fuelrod depressurization was noted only during the first threecampaigns of unit operation and it had been connected withnon-stationary regime of PAs refueling and enhanced intensitiesof unit power changes and emergency protection activations inthat period. However there were no difficulties with operationof leaking fuel rods because in the main only "gas leak" typedefects were noted.
For the WER-440 reactors difficulties with operation ofleaking fuel rods arise in two oases: 1 . if it was necessary todeactivate the water-cleanup filteres for supporting reactivityduring boron control at the end campaign of unit operation;2.during unit chutdown in the preventive maintenance and primaryoirouit depressurization leading to increase of fission productrelease.
Experimental data show that the fission product activity inprimary coolant every 30/60 minutes after power shutdown equalto or greater than 5 times activity size befor reactor shutdown.Continuous measurements of the coolant activity changes inprimary circuit of WER-440 units were carried outsystematically in Finland at Loviisa units [2]. Thesemeasurements also have shown that during reactor shutdownsdoubling times of iodine activity shanged of about 0,5 to 1,5hours compared to the literature data for the western reactorsof 10+3 minutes. The reason for this is reduction the gap frompellet fragments until fuel rod cladding as high as the valuesapproximately equal mean free path of iodine atoms. Itinorreases oonsidarably time of fission product escape out ofcladding, in particular it pûtes into disintegration ofshort-half life iodine nuolidee in oase of the first stadium of"gas leak" type defect propagation.
3. RBMK Fuel
2.1. Peculiarities ol Burst Slyg DetectionDesign of RBMK type reactor makes it possible to conduct
some kind of fuel rod leak-tightness testing (LTT). Fissionproduct escape out of faulty PAs is recorded through activityof: 1 . fission products earring coolant from each PAs throughthe correlative pipe of water-steam communications (WSC)(measurements can be carried out during: reactor operation understationary power and transient regimes; beginning of coolantcirculation after reactor shutdown and being present water incanal with PAs without circulation; refueling PAs out of

fO Table 3->J The Methods of Radiation Monitoring of Puel Rod Cladding Eak-Tightness,00 Radiation Leak-Tightness and Failure Criteria of Fuel Rods arid the Creed
for Discharging Failed Puel Assemblies (FAs) from Reaotor are Usedfor RBMK-Type Reaotors
Continuation of table 3
TheMonito-ringDesign1Any-CanalMonito-ringDesign
Method ofThe Me-thod ofTesting
2Movementof Halsointil-deteotorstube rows
Movementof Halsointil-
along WSCtube rowswithquickspeed andrecording
BSDRegim ofMeasuring
3"Negativ"1-1/3.1MeV0.3/1.5MeV0.5/1.5l£eV0.25/0.75MeVAutomaticwith"negativ"0.3/1 .5SeY andIO4.6MeVIntegral :0. 25/0.75MeVIntegral :0.25/0.75HeV
ConditionofReaotor
4Stationa-rypower
regimeAfterreactorshutdownand beingpresentwater incanalwith FAs
Radiation Criteriaof Puel Rod Leak-Tightness, (RadiationMonitoring Signal)
5
Z £ 21000 imp/sZ£ ? 700 irap/eZt ~î 600 imp/sZ£ » 500 imp/s
AY l» Za+2,85.fc;,where a is staftdartdeviation, tn and tare rated and realburnup of the fuelassembly(Yl-Y) Ï 1000 imp/s,where Y is mean forrow of 115 WSC tubes
n
AJ200imp/min, where '.time in canal with FJcount rates without scoolant circulation cdetector, it is time
The Creed forDischarging FailedFAs from Reactor
&'i.>1000unp/s duringrease greater than50O imp/s in 24 hr
---
E<120O MWd/PAs,
EM200 MWd/PAs,AY( £(3.0-3.5)0
'H is water exposureis, Yo and Yfc aremd after startwiring i-passing olof A-cassing.
1canalringdesign
Steamsump-lingout ofSSDAny-canalandS teamsump-lingdesignsWatersamp-lingout ofSPPcasks
2
of Nallationdetectorbesideindivi-dualWSC tube
analoguereoordingStop ofdetectorbesideWSC tute.AnaloguerecordingWatersampling
"Negativ"0.25/0.75
Integral:0.25/0.75tleV
"Negativ"0.25/0.75er1.1/3.1MeV
Until andafterdischar-gingPAS"Negativ"0.3/1.5UeV andanaloguesignal ofSSDchangesSpecificactivi-ties of
and 239NP
4Stationa-ry
Afterreactorshutdownand beingpresentwater in
DuringrefuelingFAs out01operationreactorDischar-ging PAsatstationa-ry powerLocalpowerdeclinein regionof cont-rol rodinsertionPAs isin casksof spentfuel pool
CLJPeriodical pulses
with Zk $; 700 imp/5tj K' L * OIIÖ K Prv/ + \
6-
_V„1jf^Tuttinaz to) f, ( ' *"."",B«:10~7Ci/E, where K is coefficient(Ci.e/imp.m ), 1 is WSC tube length fromcore to detector (m), SIIBK is area ofWSC tube (m ), TH is water exposure timewithout circulation(s), (tuai to) is timefrom start of coolant circulation untilmeasuring maximum signal, ti and' tz aretimes of start and finish measuring,Yo and Y(t) are count rates without andafter start circulation in WSC, imp/sContinuous pulse olgamma-radiat ionintensity is withAZ51000 imp/s abovebackground radiationintensity.
AIÎJÏ7OO injp/s
Correspondence ofFAs power declinefor 5/7 % and signalincreases of bothdesigns is deter-mined leaking of"gas leak" type.After dischargingFAs from power core:A(131I)>5-10"5Ci/kgA(137Cs)>5-10~6Ci/kg
Correspondence ofFAs power declinefor 5/7 % andsignal decrease ofboth designs isdetermined pellet-water interactionFailure criterion:A('3'l) > 10~3Ci/kgA(137Cs) >10-4Ci/kgA(239Np) >lQ-5Ci/kgfor any nuolides.
operating reaotor); 2. fission product gases (PPG) in steam offour steam separator-drums (SSD) joining trough, pipes of WSC inquarters oore canals with PAs (during reactor operation understationary power cum as until and after discharging the FAs fromcore as the local power changes in the time of control rodinsertion); 3. fission product nuolides in coolant of primarycircuit; 4. fission product nuolides in water of spent fuel pool(SKP) casks with PAs (table 3).
Low energy gamma-radiation of fission product in WSCcoolant is recorded against the radiation background ofactivation and orud activity of coolant and. radiative deposits
of fission and corrosion products on the WSC walls. Radiation ofshort-half life TJ niclide being activation product of ozigenin woter by fast neutron especially prevents throughconsiderable Corapton distribution in its apparatus spectrum. Forcanal design of fuel rod cladding leak-tightness testing systemsignal Z of P As leakijng characteristics forms as subtraction,i.e. "negative" counts in low energy range Y{ (main range equals1.1/3.1 MeV) and high energy range (with gamma-radiation energy

CD
greater than 3.1 MeV) in order to compensate this ^f radiationduring operation of reactor in stationary power:
where k=(Y./X.) . is minimal value of compensation coefficientschosen out of their values for row of 115 WSC tubes and ((t=1,2,...115) is number WSC tube in row.
2.2. Radiation Criteria of Fuel Rod Leaking and the Greedfor DIschargljng Failed Fuel Rods (Table 3)
Possibilities of leaking fuel rod detection and dischargingduring RBMK reactor operation conditioned to develop thecriteria for leak-tightness location and discharging PAs beforethey have deteriorated (table 3). Criteria of fuel rodleak-tightness are defined geheral to all RBMK-1000 reactors:1. for different operation situation and movement methods of LITdetectors along WSC tube rows; 2. for methods locatingleak-tightness fuel rods in the time of LTT detector stop besideindividual WSC tube; 3. for method locating leak-tightnessduring discharging PAs; 4. for method of fuel rod leak-tightnessfinal confirmation in spent fuel pool casks with PAs.
The creed for discharging leaking fuel rod out of core andits reasoned operation was determined situations of practicalnecessary discharging failed fuel rod: 1 . for preventing itsaccident destruction, 2. for limitation of radio-active fissionproduct release to environment in maximum permissible levellimits, 3. for preventing radio-active contamination of primarysystem and NPP facilities.
In the first plaoe criteria for discharging the faulty PAsare definitions for parameter values describing realization oneof the tree above-mentioned situations of necessary dischargingF As. In the second plaoe they are criteria for some moreeffective LTT methods describing location of fuel rods withcorrelative failure leaking degree. In the third plaoe theleaking criteria of different LTT methods were broken up intopreferable order of discharging PAs with maximum leaking degree.
Ad hoa in case of equal leaking degree for some PAs wasdetermined need discharging PAs with maximum burnup and earlierlocated fuel rod leak-tightness of the last PAs.
Failures of fuel assemblies as a result depressurizationtheir fuel rods were suggest to consider all leaking PAß withrefueling according to mentioned criteria for dischargingleaking fuel rods and their failures were confirmed fuel rodcladding bak-tightness tests in SPP casks (table 3).
2.3. Peculiarities ol Operation ol RBMK Type Reactors withFaulty Fuel Rods
Possibilities of location and discharging PAs with leakingfuel rods during operation of core are made it possible tooperate RBMK-1000 reactors with "gas leak" fuel rods almostwithout risk of their shutdown through radio-activecontamination of primary system or exceeding maximum permissiblelevels of fission product release to environment. Incident inthe initial period RBMK-1000 operation happened operating incore at the same time about 250 PAs with "gas leak" fuel rods.At the present time as a result improving the quality ofmanufacturing and operating fuel assemblies the numbers of "gasleak" fuel rods in RBMK cores are less than 25/50.
Steady-state regime of unit operation is necessarycondition for operating FAs with leaking fuel rods. Transientregimes and especially continual shut-downs lead to leakagedamps into cladding of leaking fuel rods. Soon after aspropagation of the primary defect as appearance of the recurringdefects are possible as results internal hydriding and pelletcracking.
2.4. Fail-Safe Rates (Table 4)For assessing of NPPs safety standart the fail-safe rates of
RBMK fuel rods are defined as activity values of fissionproducts in primary coolant as for WER fuel rods. RBMK reactoris one-circuit and pressuretube boiling water reactors. A fewrates are used because of this. They describe possibilities of

K)00O Fail-Sale Rates oî Fuel Rods for Assessing of Safety Standardof RBMK Units
Table 4
Title of Pail-Safe Rate Formulas for- Count of Pail-Safe Rates
11. Mean relativeactivity of fissionproduct gases (PPG) insteam oondensate offt-steam separator-drum(SSD) - II(A) and itsstandard deviation -
imp/s
{=1where H(k,i) is relative activity of PPG in steamcondensate of ft-SSD on a hourly basis measuring forstable states of reactor (imp/s);n is measurement namber at stable states of reactorduring month.
2. Unit-mean relativeactivity of PPG insteam oondensate of allSSD -PII(FPG), imp/s where II (fe) is as well as division 1.3. Mean equilibriumiodine nuclide sumspécifie activityin primary systemfor stable states ofreactor -PH(I), Ci/kg
12 A(fc,l)/2 + 2 A(Ä,î)/2-1 k=3
A(I,t) is total iodine equilibrium specific activity
water for stable states of reactor (Ci/kg).
4. Specific activityof 239Np nuclide insystem for stablestates of reactor -Pn(Np), Ci/kg
FII(Np) = -n
BU.J) / 2
where B(J,t) is Np specific activity in primarycoolant of both loop circuit for stable states ofreactor;n is measurement namber at stable states of reactorduring month.
5- Mean during reactoroperation periodthe failure rate offuel assemblies throughleaking fuel rods -WOT, 1/effective day
WOT = HOT / Es<J$.,$. is fuel-residence live time of unit during its
operation periods (month, three month, year)(effective day of heat power);NOT is the PAs number with leaking fuel rods of& failure criterion leaking degree are dischargedduring period.
6. Mean during reactoroperation periodthe leaking rate offuel assemblies -WHT, 1/effective day
WHT = KHT / Ee<KE>. ,Nur is the PAs number with leaking fuel rods ofa radiation criterion leak-tightness degree aredetected firstly during period;ES<IJÏ>. is as well as division 5.
different fission product fractions to release out of claddingversus types of fuel rod defects. The fail-safe rates of fuelrods for RBMK NPPs are presented in table 4-
The rates of month-mean relative activity of fissionproduct gases (PPG) in steam oondensate each of the four steamseparator-drums (SSD) - II(fe) and unit-mean relative activity ofFPG in steam oondensate of all SSD - HI(PPG) can are used onlyas relative characteristics of their trends in unit. With a viewto fulfil the IAEA requirements for oomparison between values offail-safe rates of different type NPPs it is necessary toorganize metrologioal normalization of the SSD sampling LITsystem and to establish absolute normalized coefficient formeasured activity of fission product gases. In this case theradiation rate will assume the form:
4HIA(FPG) = K HOS) / 4 , (3)
where K=[A(13SXe) + A(88Kr)]/ II(fe) is normalized connectioncoefficient for spesific activities - (A) of 138Xe and 88Krnuolides in primary oooiant (Ci/kg) with measured values of theSSD sampling LTT system (imp/s). It is approximately equal to
(3,3^^5).ICT9 sCi/imp.kg
2.5.Current Radiation Safety Criteria for KBMK Power PlantsCounting result analysis of mean relative FPG activities in
steam condensate each of fc=1,2,3,4 SSD (imp/s) - II(&), theirstandard deviations - o(&) and month diagrams of statisticaldistributions are fixed tasks of: 1 . fuel rod leak-tightnesscontrol FAs group with single SSD joining through pipes of WSGin quarters the core canals and 2. rapid assessing contributionof this PAs group in PPG release to environment.
If part of the II (ft) values overbalance mean of thestatistical distribution on month diagram greater than to 3o(ft),then leaking fuel rods appeared in the core canals of &-SSD. IfPAs with these leaking fuel rods were not discharged from

reactor and their operation iß lasted, then II(A)-raean next monthincreases greater than to 3O(ft).
If part of .the n(A) values overbalance mean of statisticaldistribution greater than to 3000 imp/s or II(A)-mean next monthincreases greater than to 3000 imp/s,.then depressurization offuel rod led to failure of "pellet-water interaction" type anddestruction of fuel pellets with possibility their release inprimary system. It is necessary in time to find PAs with suchdefects and to discharge their from reactor. Increase ofcorresponding II(ft) values to (20OO-30OO) imp/s correlates withappearance fuel rod defects with maoro-oraok and claddingleakege. Increase of n(fc) to (200-2000) irap/8 correlates withappearanse defects of fuel rod with mioro-oraok and "gas leak"or "iodine leak" type.
Unit-mean relative aotivity of PPG in steam oondensate ofall SSO, i.e. PII(PPG) is relative radiation rate of fuel rodtotal leaking. It characterizes release of PPG out of faultyfuel rods and determines their release to atmosphere. Criticalvalue of its is to (300O-4-OOO) inip/s. In this case it isnecessary to apply all MT methods for location PAs with maximumdefects of fuel rod claddings and theirs discharging fromreactor. That ie necessary with a view to prevent overbalance ofaotivity release into environment greater than permissiblelimits and under the necessity shutdown.
Month-mean equilibrium specific aotivity of the iodinenuolide sum in primary -coolant, i.e. PII(I) is radiation rate offuel rod total leaking. This rate can characterize halogenrelease out of faulty fuel rods and leaking degree of fuel rodsputting to dirtting of primary system. Specific aotivityincrease of iodine nuolides (espeoialy short-half life nuolides)with aotivity limits: for iodine sum to 1.0-10~5 Ci/kg, for 131Ito 1.0'10~6 Ci/kg and for 134I to 2.0'10~6 Ci/kg oharaoterizesaccident destruction of fuel rod and propagating defects on fuelrod cladding. This leades to pellet-water interaction. In thatoase it is necessary to discharge PAs with maximum leakingdegree of fuel rods.
Specific aotivity critical value for 23> nuclide inprimary system, i.e. HI(Np) is equal to 4.0-10" Ci/kg. Itcharacterizes appearance propagating defect of fuel rod claddingwith release of fissible material into primary coolant andaccident destruction of fuel rod.
NotationDescriptions of RBMK fuel rod defects, analysis results of
theirs depressurization causes and possibility to solve theproblem of predicting defects propagation are presented authorsin separate work.
References[1] OBIHHHHKOB O.a., Tojiyoes JI.M., Joopmnm B.fl. n flp.
3KCHJiyaTai(HOHHH8 peSHMH BOÄO-BOÄHHHX SHBpreTHTOGKKX HflepHHX
peaKTOpoB. M.: ATOMHSÄBT, I979.[2] J.M.Moisio and R.P.Terasvirta. WER-4OO Puel
Performance at Loviisa. Journal of ENS. Nuclear EuropeWorldsoan. NO.1-2 January/February 1991, p.10.

IV)00
INFLUENCE OF WATER CHEMISTRY REGIMESON FUEL CLADDING FAILURE IN LWRs
V.G. KRITSKIJResearch, Design and Process Association VNIPIET',Saint-Petersburg, Russian Federation
Abstract
Some statistical data on cladding failure in theRBMK-1OOO and VWER-1OOO fuel rods nave been collected andstudied. A model has been developed, based on the correlationbetween the quantity of clad defects and water chemistryparameters. The model shows the possibility of twofoldreduction in fuel failure rates for some NPPs.
and WWER) and boiling water (RBMK and BWR) regimes obeydifferent relationships; a generalized relationship is,however, possible.
Let,f(n)=f(AT) + f(A) < 1 > ,
where f(n) is the clad failure probability; f(AT) is the cladfailure probability due to overheating under the influence ofwater chemistry conditions; f(A) is the probability ofmanufacture defects.
Under normal nuclear reactor conditions some portion offuel rods develops cladding defects. The probability ofcladding failure depends among other factors also on the watercoolant quality. In the general case interactions at thecoolant-cladding interface result in deposition, corrosion(general and local) and hydriding processes.
Penetrating defects in fuel claddings (clad failure) maybe induced by any of the above processes, all of them havingone feature in common, however their intensity increasessharply with the clad temperature growth. In addition, thedeposition of itself induces the clad temperature growth.The formation of deposits is caused by precipitation ofconstruction material corrosion products ( mainly of ferrousorigin). Therefore, when analyzing the clad failureprobability one should consider complex effect of the depositsformed [11. The deposition processes in pressurized water (PWR
Pig.1, Change of fuel cladding tervperature atclacdmg-coolant interface \,Tthoxide thickness nrrowth.

Fig. i shows change in the fuel-clad-coolant interfacetemperature with the surface oxide thickness growth.
Changing in AT with the increment AS in the oxidethickness can be described as
AT= - (2)
GOCO
where q is heat flux and A is the thickness of thermalconductive layer.
All parameters in relationship (2) vary with time.We have shown [2], that the precipitation of corrosion
products (CPs) from the coolant environment onto the fuelsurface may result in the formation of a porous oxide filmdistinguished for great thermal resistance. The claddingtemperature is then defined by the rates ratio of colloidsfixation and dehydration as well as compact layer formationprocesses.
Normally these processes are under the influence of theCP transport rate towards the heat transfer surfaces.
Experimental measurments of the clad temperature growthrate show the period of the temperature stabilization inRBHK-1000 may achieve 10-20 days [23.
Corrosion products coming into the reactor core undergorandom distribution, which process results in nonumform CPdeposition over different core areas. The nonuniform CPdistribution along the fuel rod length is caused byfluctuations in the thermal physical and chemical propertiesof the cooling environment, surface and corrosion products.
The coefficient of nonuniformity in the CP distribution overthe core areas might be due to the combination of occasionalfactors and is equivalent in essence to a certain coefficientdescribing extra deposition of CPs on the fuel rod surfaces.
Letn= f<AT) N, (3)
where n is a number of fuel assemblies failed during the timeperiod T, N is the total number of fuel asemblies in areactor.
In the physical sense
f(AT)= <x AT, (4)
where a is the nonuniformity coefficient, AT is the cladtemperature growth due to the CP deposition (averaged over thereactor).
From eq.(2) it follows that
AT = -?-AS (5)
where AS f(Am) is a function of the tolal amount of CPsentering the core during the time T.
By combining ( 2) -( 5) we get
If a -5- N» Const, we have:(6)

1000 of failed rods f(n)
40
30
20
10*
/e
0 20 40 60 80 100 total netalsinput to reactorper year, kg(average data-)
Pig.2. Percentage of failed fuel rods as function of totalmetals input to Bl/R reactor /3/.
Hence, one would expect a correlation exists between thefailed fuel quantity and that of CPs entering the core (withthe feed water in BWRs or accumulated in the primary circuitin PWRs).
0,75
0,50
0,25
0,25 0,50 0,75max
Pig,3. Puel cladding failure probability f(n) as function oftotal netals input to R3HK reactor.
Fig. 2 shows percentage of failed assemblies dischargedfrom Indian BWRs as function of ferrous impurties transportedto the reactor core with the feed water during a fuel cycle[31.
Fig. 3 shows a number of fuel assemblies discharged fromfour RBMK-1000 units during 5 years, plotted as function ofthe CP quantity transported to the reactor. The data arenormilized on the maximum value in the data set.

1,0
0,75
0,50
0,25
00Ol
Pig.4. f(n) as function of pHT for primary circuitof VAVKR.
It is known [4] that the precipitation rates of CPs inFWRs depend on C<=i> and AFe( T).
$f = to CCP + K»-* [Fe<Ti)-Fe<T*> 3 - R* 8, (7)where 8 is the surface concentration of particles, K<* is thedeposition coefficient, K<»- <» is the dissolution-depositioncoefficient, Fe(T) - the iron solubility at T; nT* - the
coolant temperature; T* - the surface temperature; R=" - thedeposit release coefficient.
C and AFe<T) are functions of pHi. It follows, therefore,that S(T) is a complex nonlinear function of pHr. Fig. 4 showsa plot of f(n) against pHT, obtained from the data averagedover the 5-year operation of 7 WER-10QQ units.
It follows from Figs 3 and 4, that optimal waterchemistry control results in the decrease of f(At). At somepower units the intensity of fuel failure can be reduced atleast by a factor of two.
References1. V.I.Solyany, Vu.K.Bibilashvili, G.I.Sukhanov, Yu.V.Pi»enov"Some aspects of influence of coolant water chemistry onreliability of WER- and RBMK- type fuels"/IVGFPT/17.Influence of water chemistry on fuel element claddingbehaviour in water cooled power reactors", IAEA,Vienna,19832. B. r.KpnuKHa n 4P- K Bonpocv o oopMüpoBaman oTJio»eHH0 nanoeepxHocTH TB3JIOB PBMK-1000. A.3. T.59, Bbin.6, A6Ka6pb 1985,c.4053. K. S.Venkateswarlu, G.Venkateswaran "Evaluation of andimprovements in the performance of zircaloy cladding duringand after its residence in water cooled- nuclear powerreactors"/IWGFFT/24. External cladding corrosion in water powerreactors., Vienna,1986,

roCOen
BELGIUM
H Bainot
P Deramaix
C.de Paepe
CANADA
T.J. Carter
CZECH REPUBLIC
O. Bârta
F. Pazdera
M. Valach
FRANCEP. Bournay
A. Bnssaud
A. Dumont
LIST OF PARTICIPANTS
FEXLijsterdreef 24B-2400 Mo!
BELGATOMAvenue Ariane 7B-1200 Brussels
BELGATOMAvenue Anane 7B-1200 Brussels
AECL ResearchChalk River LaboratoriesChalk River, Ontano KOJ 1JO
CHEMCOMEXAzalkova 1137102 00 Prague
Nuclear Research Institute250 68 Rez nr. Prague
Nuclear Research Institute250 68 Rez nr. Prague
Service de la production thermiqueElectricité de FranceTour Atlantique - 20e étageF-92080 Pans - La Défense Cedex 06
Service Etudes et projets thermiques et nucléairesElectricité de France12-14, avenue DutnévozF-69628 Villeurbanne Cedex
FRAGEMA/FRAMATOME Division Combustible10 rue Juliette RécamierF-69006 Lyon Cedex
C Leuthrot
D Parrat
GERMANY
R. von Jan
JAPAN
Y. Hayashi
T Okubo
K Ono
KOREA, REPUBLIC OF
Y H Kang
NORWAY
C Vitanza
Direction des reacteurs nucléairesDepartement d'études des combustiblesCommissariat a l'énergie nucléaireCentre d'études nucléaires de CadaracheF-13108 Samt-Paul-lez-Durance Cedex
Centre d'études nucléaires de GrenobleCommissariat à l'énergie atomiqueF-38041 Grenoble Cedex
Siemens AG/KWUDept. BT4Hammerbacherstrasse 12+14D-W 8520 Erlangen
Nippon Nuclear Fuel Development Co Ltd2163 Nanta-cho, Oarai-machiHigashi-lbaraki-gunIbaraki-ken 311-13
Sophia UniversityFaculty of Science and TechnologyKioi-cho 7-1, Chiyoda-kuTokyo 102
Nuclear Fuel Industries, Ltd950 Oaza-Noda, Kumaton-choSennan-gun, Osaka
Nuclear Mechanical Test DepartmentKorea Atomic Energy Research InstituteP.O. Box 7, Daeduk DanjiDaejeon City
OECD Halden Reactor ProjectInstitutt for EnergiteknikkOsAlle 13N-1750 Halden

roCO
RUSSIAN FEDERATION
V G Aden
A D Bakunyaev
Yu K Bibilashvih
B.V Budylin
K.P. Dubrovm
A.A. Egorov
A.G loltukhovskij
V B. Ivanov
V.A. Nikolaev
V.D. Onufnev
V N Prosselkov
V P Smimov
Research and Design Institute ofPower EngineeringP O Box 78810100 Moscow
Ministry of Atomic EnergyStaromonetny per 26109180 Moscow
Scientific Research Institute for Inorganic MaterialsSt. Rogov 5123479 Moscow
Ministry of Atomic EnergyStaromonetny per 26109180 Moscow
I V Kurchatov Institute of Atomic Energypi. Acad. Kurchtov, 1123182 Moscow
Ministry of Atomic EnergyStaromonetny per. 26109180 Moscow
Research Institute for NuclearPower Plant OperationFerganskaya 25109507 Moscow
Research Institute of Atomic Reactors433510 Dimitrovgrad, Ulyanovsk Region
Research and Design Institute ofPower EngineenngP.O Box 78810100 Moscow
Scientific Research Institute for Inorganic MaterialsSt. Rogov 5123479 Moscow
I V. Kurchatov Institute of Atomic Energypi Acad. Kurchtov, 1123182 Moscow
Research Institute of Atomic Reactors433510 Dimitrovgrad, Ulyanovsk Region
l N Vassilchenko
I V Zhukov
SWEDEN
M Grounes
L Hallstadius
L Lundholm
SWITZERLAND
R.W. Stratton
G Bart
S Lundberg
UNITED KINGDOM
R J. White
J.R. Stanbridge
UNITED STATES OF AMERICA
A A. Strasser
OKB 'GIDROPRESS'Ordzhomkidze Sreet 21142103 Podol'sk, Moscow Region
Research and Design Institute ofPower EngineeringP O. Box 78810100 Moscow
Studsvik Nuclear ABS-61182Nykopmg
ABB Atom ABS-721 73 Vàsterâs
ABB Atom ABS-721 73 Vàsterâs
Paul Scherrer InstituteCH-5232 Vilhgen
Paul Scherrer InstituteCH-5232 Vilhgen
Kernkraftwerk Leibstadt AGLeibstadtCH-4353 Leibstadt
Nuclear ElectricBerkeley Nuclear LaboratoriesBerkeley, Gloucestershire GL139PB
British Nuclear Fuels picB-382 Sprmgfields WorksSalwick, Preston,Lancashire PR4 OXJ
The S.M Stoller Corporation485 Washington AvenuePleasantville, NY 10570

10 UNITED STATES Of AMERICA (cont)09CD H.W. Wilson Commercial Nuclear Fuel Division
Westinghouse Electric CorporationP O. Box 355Pittsburgh, PA 15230-0355
INTERNATIONAL ATOMIC ENERGY AGENCY
J.L. Zhu Division of Nuclear Fuel Cycle andWaste ManagementInternational Atomic Energy AgencyPO. Box 100A-1400 Vienna, Austria
G. Sukhanov Division of Nuclear Fuel Cycle and(Scientific Secretary) Waste Management
International Atomic Energy AgencyP.O. Box 100A-1400 Vienna, Austria
93-01083