
Advanced Analysis Methods for 3G Cellular Networks Jaana ...
Upload
khangminh22Category
view
0download
0
IAEA-TECDOC-678
Advanced calculational methodsfor power reactors and
LWR core design parameters
Proceedings of a Specialists Meeting,held in Cadarache, France, 10-14 September 1990and a Technical Committee Meeting and Workshop
held in Rez, Czechoslovakia, 7-11 October 1991
ik g1
INTERNATIONAL ATOMIC ENERGY AGENCY 11 /A
December 1992

The IAEA does not normally maintain stocks of reports in this series.However, microfiche copies of these reports can be obtained from
INIS ClearinghouseInternational Atomic Energy AgencyWagramerstrasse 5P.O. Box 100A-1400 Vienna, Austria
Orders should be accompanied by prepayment of Austrian Schillings 100,-in the form of a cheque or in the form of IAEA microfiche service couponswhich may be ordered separately from the INIS Clearinghouse.

ADVANCED CALCULATIONAL METHODS FOR POWER REACTORSAND LWR CORE DESIGN PARAMETERS
IAEA, VIENNA, 1992IAEA-TECDOC-678ISSN 1011-4289
Printed by the IAEA in AustriaDecember 1992

FOREWORD
In the framework of its reactor physics activities, the Agency haslong been providing Member States with a forum for the exchange oftechnical information on in-core fuel management.
The Agency published the technical documents entitled "ComputerPrograms for the In-core Fuel Management of Power Reactors",IAEA-TECDOC-250, in 1981, and "In-core Fuel Management Programs for NuclearPower Reactors, IAEA-TECDOC-314, in 1984, which describes availablecomputer code packages. The Agency has also initiated a number ofCo-ordinated Research Programmes (CRPs) on selected reactor core physicsaspects of water reactors. The CRP on In-core Fuel Management Code PackageValidation was set up to obtain well defined cases for the verification ofcode packages for PWRs, BWRs and WWERs, with the participation of 16contract/agreement holders and observers.
The purpose of the Specialists Meeting on Advanced CalculationalMethods for Power Reactors, held in Cadarache, France, 10-14 September1990, was to provide a forum for reviewing and discussing selected corephysics of water cooled reactors (including high convertors). New methodsof advanced calculation for advanced fuels and complex geometries of nextgeneration reactors with a high level of accuracy were discussed and theimportance of supercomputing and on-line monitoring was also acknowledged.The meeting was attended by about 60 participants from 20 countries whopresented 30 papers.
The Technical Committee Meeting on LWR Core Design Parameters, held inRez, Czechoslovakia, 7-11 October 1991, provided an opportunity forparticipants to exchange their experience on reactor physics aspects ofbenchmark calculations of various lattices, methods for core parametercalculations, core monitoring and in-core fuel management. At the Workshopthere were further discussions related to the benchmark problems,homogenization techniques and cross-section representations. Thirty-fivepapers were presented by about 43 participants from 19 countries.

EDITORIAL NOTE/
In preparing this material for the press, staff of the International Atomic Energy Agency havemounted and paginated the original manuscripts as submitted by the authors and given some attentionto the presentation.
The views expressed in the papers, the statements made and the general style adopted are theresponsibility of the named authors. The views do not necessarily reflect those of the governments ofthe Member States or organizations under whose auspices the manuscripts were produced.
The use in this book of particular designations of countries or territories does not imply anyjudgement by the publisher, the IAEA, as to the legal status of such countries or territories, of theirauthorities and institutions or of the delimitation of their boundaries.
The mention of specific companies or of their products or brand names does not imply anyendorsement or recommendation on the part of the IAEA.
Authors are themselves responsible for obtaining the necessary permission to reproduce copyrightmaterial from other sources.
Throughout the text names of Member States are retained as they were when the text wascompiled.
CONTENTS
SPECIALISTS MEETING ON ADVANCED CALCULATIONAL METHODS FORPOWER REACTORS, CADARACHE, FRANCE, 10-14 SEPTEMBER 1990
Summary of the Specialists Meeting ...................................................................... 11
Solving the integral transport equation using the DP1/J± technique ................................ 15G. Marleau, A. Hébert
Improvements in the calculational methods of nuclear reactor assemblies ......................... 20P. Benoist, I. Petrovic, Z. Stankovski
The CACTUS transport method in WIMS ............................................................... 23M. J. Halsall
Analysis of the main physical and numerical aspects in the modelling of control clustersfor project calculations .................................................................................... 29G.B. Bruna, P.L. Cornilus, C. Poinot, C. Van Frank
Benchmarking the calculational model for gadolinium pins in square andhexagonal lattice assemblies ............................................................................. 35V. Jagannathan, R.P. Jain, V. Kumar
The APOLLO-I assembly spectrum code ................................................................ 40G. Mathonnière, Z. Stankovski
CRONOS: A modular computational system for neutronic core calculations ..................... 42J.J. Lautard, S. Loubière, C. Fedon-Magnaud
Rod ejection analysis in PWRs with a 3D kinetic new code ......................................... 50M. Gönnet, C. Neaume, T. Bisiaux
Validation of a method for HCLWR fuel assembly calculation ...................................... 54V. Ishida, N.E. Patino, M.J. Abbate, M.M. Sbaffoni
Reactor calculations with a multiparameters library .................................................... 60V. Brun, B. Chanaron, J.M. Dubois
Project cell code updating for MOX calculation ........................................................ 64A. Vallée, G.B. Bruna, M. Doucet, D. Doutriaux
Preparation of cross section libraries for PWR uranium and MOX assemblies .................. 73D.C. Lutz
Modifications of the burnup chains for advanced fuel calculations ................................. 78D.C. Lutz
Improved code system for reactor calculation and validation for advancedWER core analysis ....................................................................................... 82T.G. Apostolov, K.N. Ivanov, R.I. Prodanova
Skoda computational system for WER reactors ........................................................ 87J. Vacek, P. Mikolâs, J. Svarn], V. Krysl
The program system KARATE ............................................................................. 98J. Gado, A. Kereszturi, I. Trosztel
Nodal methods for WER core analysis .................................................................. 107M. Lizorkin, V. Pshenin, A. Novikov, A. Lazarenko
Microdepletion and efficiency investigations of burnable absorbers in WWERfuel assemblies .............................................................................................. 117R. Becker
Reflector modeling in advanced nodal analysis of pressurized water reactors .................... 125E.Z. Müller
Treatment of the reflector in two-group diffusion calculations for LWRs ......................... 130W. Bernnat

Calculational methods for PWRs ........................................................................... 136J. Krebs, M.-C. Laigle, R. Lenain, G. Mathonnière, A. Nicolas
Physical characteristics of the core of nuclear district heating plants ............................... 143V.S. Kuul', O.B. Samojlov
Description and validation of an approximate coarse mesh solution method for thediffusion equation in RZ geometry ..................................................................... 150A.Z. Tanker, E. Tanker
Evaluation of safety parameters in nodal space-time nuclear reactor analysis .................... 155H. Finnemann, R. Böer, R. Böhm, R. Müller
PWR core physics calculations using the COCCINELLE code ...................................... 162C. Bangil, F. Blanchon, P. Hemmerich, J. Planchard, D. Verwaerde, J.P. West,A. Ferrie r, V. Jour dan, J.C. Barrai
Controlled portability of fuel management software .................................................... 165S. Altomare, T.M. Camden, A.L. Casadei
Westinghouse advanced fuel management system ....................................................... 167Y.A. Chao, T.Q. Nguyen, A.L. Casadei
The RITME method: Basic principles and overview of the LOGARITME concept ............. 171J.M. Bohler, P. Dufour, J.P. Ferrera, L. Sauvage
Verification of advanced methods in TARMS boiling water reactor coremanagement system ........................................................................................ 176M. Tsuiki, T. Iwamoto, L Toyoshi
The problem of creating a full scale computer simulation code complexfor NPPs with RBMK reactors .......................................................................... 181E.N. Danilova, N.K. Zinov'eva, L.N. Podlazov, S.V. Smirnov, V.E. Trekhov
List of Participants ............................................................................................ 192
TECHNICAL COMMITTEE MEETING AND WORKSHOP ON LWR CORE DESIGNPARAMETERS, REZ, CZECHOSLOVAKIA, 7-11 OCTOBER 1991
Summary of the Technical Committee Meeting and Workshop ...................................... 199
Comparison of different WIMS library versions ........................................................ 203J. Vacek
Analysis of the Arkuszewski benchmark by 1-D supercell, 2-D collision probabilityand Monte Carlo methods ................................................................................ 205V. Jagannathan, P.D. Krishnani, H.C. Gupta
Analysis of benchmark on interactive effects of gadolinium pins in BWRs ....................... 211V. Jagannathan, P.D. Krishnani, H.C.Gupta
Polish experience with application of the RSYST modular system .................................. 216B. Szczesna
Comparison calculations for a BWR lattice with adjacent gadolinium pins ....................... 223N. Marinkovic
Calculational models for gadolinium effects in WER lattices ....................................... 228C. Alvarez-Cardona, R. Guerra-Valdés, D. Lopez-Aldama
Correction of equations based on measurements and application to theory andexperiment analysis ........................................................................................ 238V. Lelek, M. Pecka, L. Vrba
Numerical solution of the criticality problem for WER fuel assembliesby the Monte Carlo codes MOCA and MOCA 2 ................................................... 244J. Kyncl

An equivalence principle for the adjoint neutron flux in lattice cell ................................ 248M. Nasr, H. Roushdy
Evaluation of perturbation in the resonance region ..................................................... 254M. Nasr, M. Nagy
Application of depletion perturbation theory to improving depletion code BIPR5-AKusing measured performance parameters .............................................................. 258L. Korpâs
Simulation of cruciform control rods in the computer code LWRBOX ............................ 264P.D. Krishnani
Basic core parameters in on-line measurement for NRI experimental reactors ................... 271J. Broulik, B. Endt, J. Holecek, V. Rypar, Z. Turzik
RITME: A fast and simple computing code for PWR core calculationsand monitoring ............................................................................................. 275L. Sauvage
Operation flexibility and availability improvements using BEACON, an advanced coremonitoring system ......................................................................................... 280T.Q. Nguyen, R.W. Miller, A.L. Casadei, P.K. Doshi
Use of the LR-O experimental reactor for WER core parameters estimation ................... 285O. Hrazdil
WER reactor dosimetry and pressure vessel exposure monitoring ................................. 290C. Svoboda, B. Osmera
Primary experimental and calculational study of the WWER-1000 cores ofthe LR-O reactor ........................................................................................... 293J. Vanicek
COMO: A core model for parametric fuel cycle cost evaluation .................................... 298H. Moldaschl
Influence of prolonged nuclear fuel burnup on safety margins of advanced PWRs .............. 304D. Spasojevic, N. Marinkovic, M. V. Matausek
Core reload pattern optimization on desktop computers ............................................... 309A.Z. Tanker
Workstation computer systems for in-core fuel management ......................................... 315L. Clccone, A.L. Casadei
Verification of KARATE: Kalinin cycle-1 ............................................................... 319M. Makai, M. Telbisz
Validation of FUMACS code package .................................................................... 323B. Petrovic, D. Pevec, T. Smuc, N. Urli
Safety aspects of WER reactor core design and Skoda computational system ................... 327/. Svarny, V. Krysl, P. Mikolas, J. Vacek
PREWIMS-VVER: A WIMS-D/4 input data preparation code for WERs ....................... 333A. Gonzalez-Garcia, D. Lopez-Aldama, D. Milian-Lorenzo, C. Alvarez-Cardona
Gadolinium absorbers in WWER-1000 type fuel lattices .............................................. 340/. Mikus, F. Hudec, J. Rocek, M. Trgina, L. Vrba, K. Zâlesky
Use of neutronic codes for the design of MTR LEU cores .......................................... 345M. Madariaga, M. Higa
Control rod worth, reactivity and power distribution-in a 1300 MWe PWR ..................... 355M. Nurdin
Criticality calculations for a BWR spent fuel pool ..................................................... 369M. Barcenas-Robles, C. Filio-Lopez
Criticality calculations for the design analysis of a 300 MWe PWR ............................... 374Subhan Gul, Asif Waseem, M. Kamran Chughtai

A modified version of the COBRA-IV-I subchannel thermohydraulic computer code .......... 380L.L. Biro
Calculation of two cycles of Kalinin unit-1 .............................................................. 385V. Krysl, P. Mikolâs, J. Svarny
List of Participants ............................................................................................ 389

SPECIALISTS MEETING ONADVANCED CALCULATIONAL METHODS FOR POWER REACTORS
CADARACHE, FRANCE, 10-14 SEPTEMBER 1990
SUMMARY OF THE SPECIALISTS MEETING
Session 1 : LWg Cell & Assembly calculations(Chairmen: M.J. Halsall & G.B. Bruna)
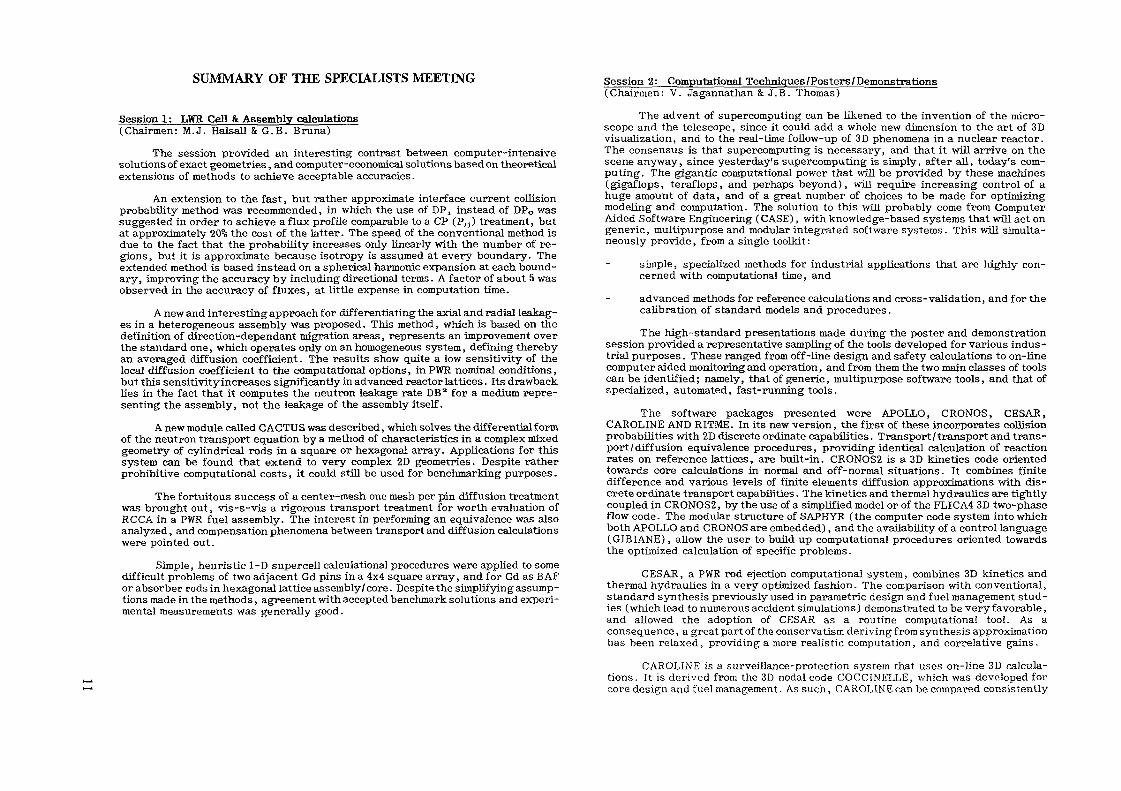
The session provided an interesting contrast between computer-intensivesolutions of exact geometries, and computer-economical solutions based on theoreticalextensions of methods to achieve acceptable accuracies.
An extension to the fast, but rather approximate interface current collisionprobability method was recommended, in which the use of DP^ instead of DP0 wassuggested in order to achieve a flux profile comparable to a CP (Py) treatment, butat approximately 20% the cost of the latter. The speed of the conventional method isdue to the fact that the probability increases only linearly with the number of re-gions, but it is approximate because isotropy is assumed at every boundary. Theextended method is based instead on a spherical harmonic expansion at each bound-ary, improving the accuracy by including directional terms. A factor of about 5 wasobserved in the accuracy of fluxes, at little expense in computation time.
A new and interesting approach for differentiating the axial and radial leakag-es in a heterogeneous assembly was proposed. This method, which is based on thedefinition of direction-dependant migration areas, represents an improvement overthe standard one, which operates only on an homogeneous system, defining therebyan averaged diffusion coefficient. The results show quite a low sensitivity of thelocal diffusion coefficient to the computational options, in PWR nominal conditions,but this sensitivityincreases significantly in advanced reactor lattices. Its drawbacklies in the fact that it computes the neutron leakage rate DB2 for a medium repre-senting the assembly, not the leakage of the assembly itself.
A new module called CACTUS was described, which solves the differential formof the neutron transport equation by a method of characteristics in a complex mixedgeometry of cylindrical rods in a square or hexagonal array. Applications for thissystem can be found that extend to very complex 2D geometries. Despite ratherprohibitive computational costs, it could still be used for benchmarking purposes.
The fortuitous success of a center-mesh one mesh per pin diffusion treatmentwas brought out, vis-s-vis a rigorous transport treatment for worth evaluation ofRCCA in a PWR fuel assembly. The interest in performing an equivalence was alsoanalyzed, and compensation phenomena between transport and diffusion calculationswere pointed out.
Simple, heuristic 1-D supercell calculational procedures were applied to somedifficult problems of two adjacent Gd pins in a 4x4 square array, and for Gd as BAFor absorber rods in hexagonal lattice assembly / core. Despite the simplifying assump-tions made in the methods, agreement with accepted benchmark solutions and experi-mental measurements was generally good.
Session 2: Computational Techniques /Posters /Demonstrations(Chairmen: V. Jagannathan & J. B. Thomas)
The advent of supercomputing can be likened to the invention of the micro-scope and the telescope, since it could add a whole new dimension to the art of 3Dvisualization, and to the real-time follow-up of 3D phenomena in a nuclear reactor.The consensus is that supercomputing is necessary, and that it will arrive on thescene anyway, since yesterday's supercomputing is simply, after all, today's com-puting. The gigantic computational power that will be provided by these machines(gigaflops, teraflops, and perhaps beyond), will require increasing control of ahuge amount of data, and of a great number of choices to be made for optimizingmodeling and computation. The solution to this will probably come from ComputerAided Software Engineering (CASE), with knowledge-based systems that will act ongeneric, multipurpose and modular integrated software systems. This will simulta-neously provide, from a single toolkit:
simple, specialized methods for industrial applications that are highly con-cerned with computational time, and
advanced methods for reference calculations and cross-validation, and for thecalibration of standard models and procedures.
The high-standard presentations made during the poster and demonstrationsession provided a representative sampling of the tools developed for various indus-trial purposes. These ranged from off-line design and safety calculations to on-linecomputer aided monitoring and operation, and from them the two main classes of toolscan be identified; namely, that of generic, multipurpose software tools, and that ofspecialized, automated, fast-running tools.
The software packages presented were APOLLO, CRONOS, CESAR,CAROLINE AND RITME. In its new version, the first of these incorporates collisionprobabilities with 2D discrete ordinate capabilities. Transport/transport and trans-port/diffusion equivalence procedures, providing identical calculation of reactionrates on reference lattices, are built-in. CRONOS2 is a 3D kinetics code orientedtowards core calculations in normal and off-nor mal situations. It combines finitedifference and various levels of finite elements diffusion approximations with dis-crete ordinate transport capabilities. The kinetics and thermal hydraulics are tightlycoupled in CRONOS2, by the use of a simplified model or of the FLICA4 3D two-phaseflow code. The modular structure of SAPHYR (the computer code system into whichboth APOLLO and CRONOS are embedded), and the availability of a control language(GIBIANE), allow the user to build up computational procedures oriented towardsthe optimized calculation of specific problems.
CESAR, a PWR rod ejection computational system, combines 3D kinetics andthermal hydraulics in a very optimized fashion. The comparison with conventional,standard synthesis previously used in parametric design and fuel management stud-ies (which lead to numerous accident simulations) demonstrated to be very favorable,and allowed the adoption of CESAR as a routine computational tool. As aconsequence, a great part of the conservatism deriving from synthesis approximationhas been relaxed, providing a more realistic computation, and correlative gains.
CAROLINE is a surveillance-protection system that uses on-line 3D calcula-tions. It is derived from the 3D nodal code COCCINELLE, which was developed forcore design and fuel management. As such, CAROLINE can be compared consistently
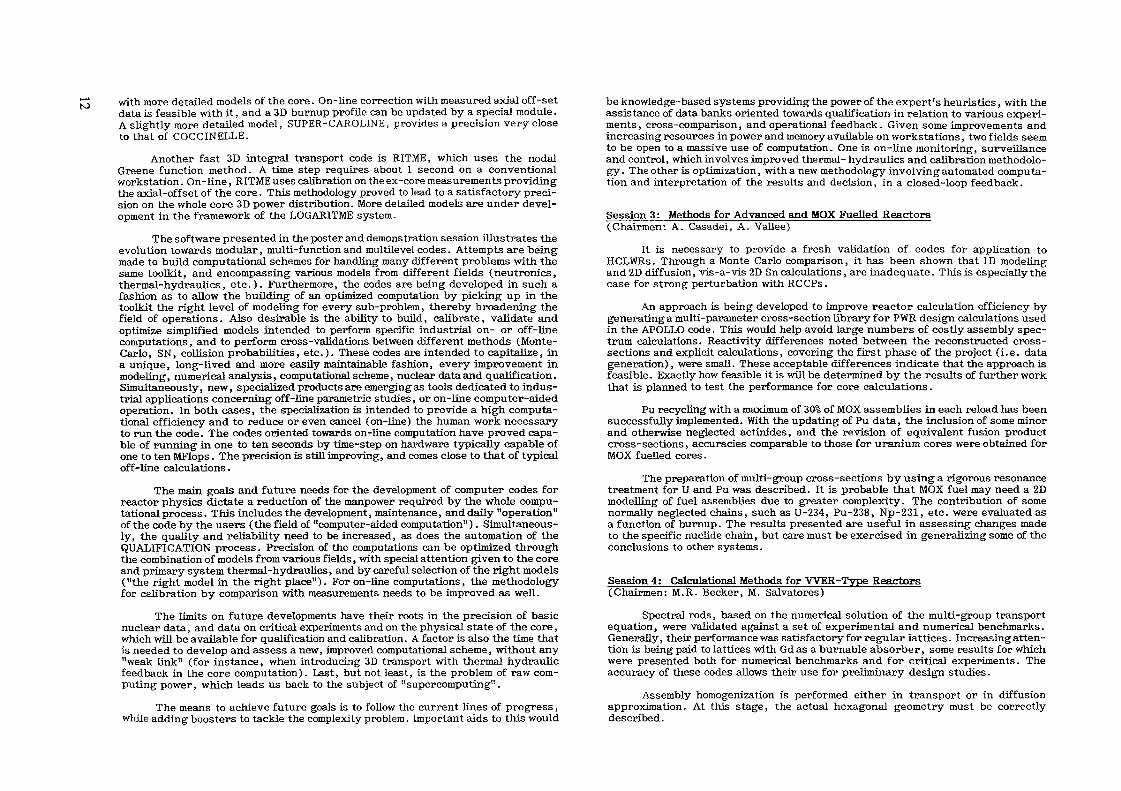
with more detailed models of the core. On-line correction with measured axial off-setdata is feasible with it, and a 3D burnup profile can be updated by a special module.A slightly more detailed model, SUPER-CAROLINE, provides a precision very closeto that of COCCINELLE.
Another fast 3D integral transport code is RITME, which uses the nodalGreene function method. A time step requires about 1 second on a conventionalworkstation. On-line, RITME uses calibration on the ex-core measurements providingthe axial-offset of the core. This methodology proved to lead to a satisfactory preci-sion on the whole core 3D power distribution. More detailed models are under devel-opment in the framework of the LOGARITME system.
The software presented in the poster and demonstration session illustrates theevolution towards modular, multi-function and multilevel codes. Attempts are beingmade to build computational schemes for handling many different problems with thesame toolkit, and encompassing various models from different fields (neutronics,thermal-hydraulics, etc.). Furthermore, the codes are being developed in such afashion as to allow the building of an optimized computation by picking up in thetoolkit the right level of modeling for every sub-problem, thereby broadening thefield of operations. Also desirable is the ability to build, calibrate, validate andoptimize simplified models intended to perform specific industrial on- or off-linecomputations, and to perform cross-validations between different methods (Monte-Carlo, SN, collision probabilities, etc.)- These codes are intended to capitalize, ina unique, long-lived and more easily maintainable fashion, every improvement inmodeling, numerical analysis, computational scheme, nuclear data and qualification.Simultaneously, new, specialized products are emerging as tools dedicated to indus-trial applications concerning off-line parametric studies, or on-line computer-aidedoperation. In both cases, the specialization is intended to provide a high computa-tional efficiency and to reduce or even cancel (on-line) the human work necessaryto run the code. The codes oriented towards on-line computation have proved capa-ble of running in one to ten seconds by time-step on hardware typically capable ofone to ten MFlops. The precision is still improving, and comes close to that of typicaloff-line calculations.
The main goals and future needs for the development of computer codes forreactor physics dictate a reduction of the manpower required by the whole compu-tational process. This includes the development, maintenance, and daily "operation"of the code by the users (the field of "computer-aided computation"). Simultaneous-ly, the quality and reliability need to be increased, as does the automation of theQUALIFICATION process. Precision of the computations can be optimized throughthe combination of models from various fields, with special attention given to the coreand primary system thermal-hydraulics, and by careful selection of the right models("the right model in the right place"). For on-line computations, the methodologyfor calibration by comparison with measurements needs to be improved as well.
The limits on future developments have their roots in the precision of basicnuclear data, and data on critical experiments and on the physical state of the core,which will be available for qualification and calibration. A factor is also the time thatis needed to develop and assess a new, improved computational scheme, without any"weak link" (for instance, when introducing 3D transport with thermal hydraulicfeedback in the core computation). Last, but not least, is the problem of raw com-puting power, which leads us back to the subject of "supercomputing".
The means to achieve future goals is to follow the current Unes of progress,while adding boosters to tackle the complexity problem. Important aids to this would
be knowledge-based systems providing the power of the expert's heuristics, with theassistance of data banks oriented towards qualification in relation to various experi-ments, cross-comparison, and operational feedback. Given some improvements andincreasing resources in power and memory available on workstations, two fields seemto be open to a massive use of computation. One is on-line monitoring, surveillanceand control, which involves improved thermal- hydraulics and calibration methodolo-gy. The other is optimization, with a new methodology involving automated computa-tion and interpretation of the results and decision, in a closed-loop feedback.
Session 3: Methods for Advanced and MOX Fuelled Reactors(Chairmen: A. Casadei, A. Vallée)
It is necessary to provide a fresh validation of codes for application toHCLWRs. Through a Monte Carlo comparison, it has been shown that ID modelingand 2D diffusion, vis-a-vis 2D Sn calculations, are inadequate. This is especially thecase for strong perturbation with RCCPs.
An approach is being developed to improve reactor calculation efficiency bygenerating a multi-parameter cross-section library for PWR design calculations usedin the APOLLO code. This would help avoid large numbers of costly assembly spec-trum calculations. Reactivity differences noted between the reconstructed cross-sections and explicit calculations, covering the first phase of the project (i.e. datageneration), were small. These acceptable differences indicate that the approach isfeasible. Exactly how feasible it is will be determined by the results of further workthat is planned to test the performance for core calculations.
Pu recycling with a maximum of 30% of MOX assemblies in each reload has beensuccessfully implemented. With the updating of Pu data, the inclusion of some minorand otherwise neglected actinides, and the revision of equivalent fusion productcross-sections, accuracies comparable to those for uranium cores were obtained forMOX fuelled cores.
The preparation of multi-group cross-sections by using a rigorous resonancetreatment for U and Pu was described. It is probable that MOX fuel may need a 2Dmodelling of fuel assemblies due to greater complexity. The contribution of somenormally neglected chains, such as U-234, Pu-238, Np-231, etc. were evaluated asa function of burnup. The results presented are useful in assessing changes madeto the specific nuclide chain, but care must be exercised in generalizing some of theconclusions to other systems.
Session 4; Calculational Methods for WER-Type Reactors(Chairmen: M.R. Becker, M. Salvatores)
Spectral rods, based on the numerical solution of the multi-group transportequation, were validated against a set of experimental and numerical benchmarks.Generally, their performance was satisfactory for regular lattices. Increasing atten-tion is being paid to lattices with Gd as a burnable absorber, some results for whichwere presented both for numerical benchmarks and for critical experiments. Theaccuracy of these codes allows their use for preliminary design studies.
Assembly homogenization is performed either in transport or in diffusionapproximation. At this stage, the actual hexagonal geometry must be correctlydescribed.

Two methods are used to account for the spectrum perturbations. For the firstone, a method of spectral indices, extensive validation of the code system withuniform and heterogeneous lattice has been done. The performance has been verygood for uniform lattice cores, although in the ZR-6 experiment with Gd, the k„ffwas somewhat over-predicted. The results of power distribution comparison fromCzechoslovakia proved to be similar to those of India. For LR0 experiments, thereis a strong under-prediction of Gd pin power, which may be due to the neglect of netleakage across the assembly.
The second is a hexagonal nodal method, based on a representation of neutrondistribution in a cell as a sum of some trial functions. It is capable of taking intoaccount the effects of thermal neutron spectrum deformations and cell heterogenei-ties, and therefore significantly increasing calculational accuracy. Substantialimprovement in power distribution was obtained for the strongly perturbed (D7)lattice experiments of ZR-6.
Generally good agreement was found for all uniform and regularly perturbedlattices, in the validation of the NESSEL 4 code with numerical and experimentalbenchmarks. The effects of fine divisions on the micro-depletion behaviour of burn-able absorber rods were described.
A code system which uses neutrons and thermal hydraulics modules to treatsteady state, and slow transient situations was presented, together with typical sub-channel analyses of the latter. The neutronics part has been validated with TRX andZR-6 experiments.
Many of the ZR-6 experiments, and other WER-type benchmarks, can beuseful in assessing the performance of hexagonal codes. It may be increasinglyimportant due to increasing interest in LWHCRs. The code systems that were pre-sented at this session should additionally be validated in the solution of appliedproblems such as reactor operation and control, load following, incidental and acci-dental transients, safety-related difficulties, and the assessment of safety margins.The comparison of safety-related critical and postulated accidents analyzed in PSABfor WERs and PWEs could help to resolve some of the problems for WER users.Further studies should be devoted to a consistent inter-comparison of the differentschemes used for WER calculations.
Session 5a: Core/Reflector Interface; Fuel Management(Chairmen: J. Mondot, G. Naudan)
Two methods of PWR reflector treatment in modern nodal diffusion codes werepresented. Both of them aim at the substitution of the theoretically and potentiallycomplicated reflector by simpler models.
In the first, the complicated water-steel reflector region was approximatelymodeled in ID, which proved to be sufficient for design purposes ( 1% error comparedto the 2D treatment). A generalized equivalence theory based on nodal techniqueswas used to obtain the environment-independent response matrices for the reflectorregion. For theoretical benchmark studies, accurate results of core power distribu-tion were obtained.
An alternate method is based on the coupling of different methods for thetreatment of neighbouring regions. This system allows for simultaneous diffusion/transport calculations connected by means of multi-group boundary conditions. In
particular the reflector, including any heterogeneities, can be implicitly representedby a simple albedo matrix. Simple modifications in the Monte Carlo technique, whichwas used, could facilitate a parametric variation of reflector constraints, even by asingle Monte Carlo run. The comparison of the average assembly power distributionin a reactor core shows a good agreement between standard explicit calculation of thereflector, and the albedo boundary condition.
Both models are very interesting and complementary in the sense that theyallow accurate simulations of the reflector effects for different core calculationalmethods. However, the homogenization and collapsing processes are based on equiv-alences which preserve boundary conditions. Hence, the precision of the final re-sults depends on the validity of a "reference" calculation, which has to be capableof explicitly treating the hard spectrum and flux transients close to theco re/reflector interface.
The subject of fuel management led to the discussion of problems of QualityAssurance (QA) and portability of software. A strict QA procedure, includingbenchmarks on a large database, is indispensable for ensuring the portability of thecode package to every kind of hardware and operating system. It is also preferableto have a single, validated version than several versions that are optimized forindividual systems. Both these points are valid, in fact, for any kind of code sys-tem. The general features of a code package that had been completely rewritten inthe framework of this QA procedure, and its validation were described subsequent-ly. Further enhancements have been incorporated into the new generation of codes,which are directed towards the complete integration of reactor physics methods fora broad range of applications from core design, safety analysis, core monitoring,operations support, and operators training.
Session 5b: Reactor CalcuIatJcmal Methods and Codes(Chairmen: H. Finneman, J.P. West)
Three complex code systems were presented, all of which have reached acertain level of maturity with respect to the methods used. The authors were awareof the necessity for producing high-quality, user-friendly and portable software,as highlighted in the previous session, and consequently yet further effort is beingdevoted to these aspects.
The SAPHYR code system, which relies on the well-known APOLLO code forassembly transport calculations, and on the diffusion code CRONOS for global reac-tor calculations, was described. APOLLO has a built-in 99 group library, and iscapable of handling other libraries as well. The heterogeneous fuel assembly isnormally treated by a 2-D transport method with either Roth approximation (multi-cell) or by «P/DPDO treatment. An exact 2-D Pti calculation may also be opted forbenchmarking purposes. The CRONOS module solves core problems by FD, FE andsynthesis methods. An outstanding feature of the code system is the FLICA IVmodule, which provides the thermal hydraulic feedback.
The space-time kinetics code system PANBOX is completely based on advancednodal methods that have been improved over the past years, as demonstrated bytheir recent extension to include hexagonal geometry. A new approach, applicableto cartesian and hexagonal geometry for the calculation of the homogeneous fluxdistribution inside the node, was presented which uses elementary Helmholtz solu-tions for the representation of the group fluxes. The PANBOX code system then usesthe reconstructed pin power distributions to evaluate safety-related parameters by
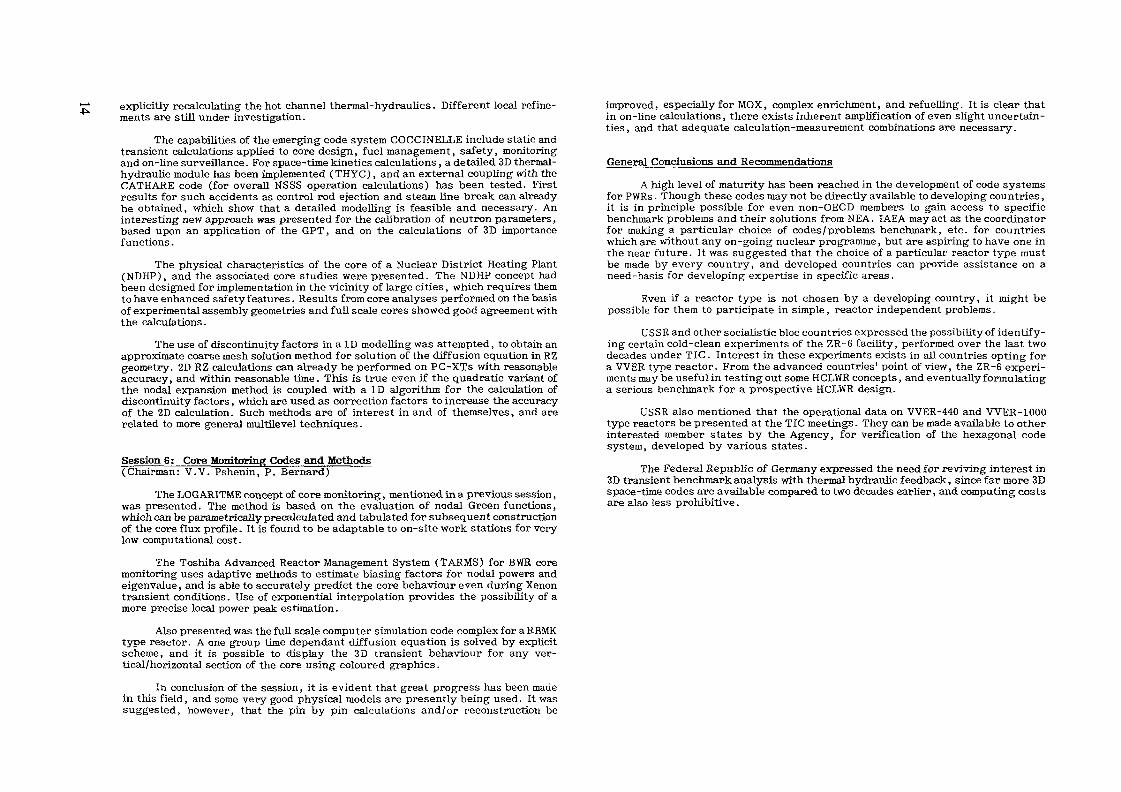
explicitly recalculating the hot channel thermal-hydraulics. Different local refine-ments are still under investigation.
The capabilities of the emerging code system COCCINELLE include static andtransient calculations applied to core design, fuel management, safety, monitoringand on-line surveillance. For space-time kinetics calculations, a detailed 3D thermal -hydraulic module has been implemented (THYC), and an external coupling with theCATHARE code (for overall NSSS operation calculations) has been tested. Firstresults for such accidents as control rod ejection and steam line break can alreadybe obtained, which show that a detailed modelling is feasible and necessary. Aninteresting new approach was presented for the calibration of neutron parameters,based upon an application of the GPT, and on the calculations of 3D importancefunctions.
The physical characteristics of the core of a Nuclear District Heating Plant(NDHP), and the associated core studies were presented. The NDHP concept hadbeen designed for implementation in the vicinity of large cities, which requires themto have enhanced safety features. Results from core analyses performed on the basisof experimental assembly geometries and full scale cores showed good agreement withthe calculations.
The use of discontinuity factors in a ID modelling was attempted, to obtain anapproximate coarse mesh solution method for solution of the diffusion equation in RZgeometry. 2D KZ calculations can already be performed on PC-XTs with reasonableaccuracy, and within reasonable time. This is true even if the quadratic variant ofthe nodal expansion method is coupled with a ID algorithm for the calculation ofdiscontinuity factors, which are used as correction factors to increase the accuracyof the 2D calculation. Such methods are of interest in and of themselves, and arerelated to more general multilevel techniques.
Sessions: Core Monitoring Codes and Methods(Chairman: V.V. Pshenin, P. Bernard)
The LOG ASITME concept of core monitoring, mentioned in a previous session,was presented. The method is based on the evaluation of nodal Green functions,which can be parametrically precaleulated and tabulated for subsequent constructionof the core flux profile. It is found to be adaptable to on-site work stations for verylow computational cost.
The Toshiba Advanced Reactor Management System ( T ARMS) for BWR coremonitoring uses adaptive methods to estimate biasing factors for nodal powers andeigenvalue, and is able to accurately predict the core behaviour even during Xenontransient conditions. Use of exponential interpolation provides the possibility of amore precise local power peak estimation.
Also presented was the full scale computer simulation code complex for a RBMKtype reactor. A one group time dependant diffusion equation is solved by explicitscheme, and it is possible to display the 3D transient behaviour for any ver-tical/horizontal section of the core using coloured graphics.
In conclusion of the session, it is evident that great progress has been madein this field, and some very good physical models are presently being used. It wassuggested, however, that the pin by pin calculations and/or reconstruction be
improved, especially for MOX, complex enrichment, and refuelling. It is clear thatin on-line calculations, there exists inherent amplification of even slight uncertain-ties, and that adequate calculation-measurement combinations are necessary.
General Conclusions and Recommendations
A high level of maturity has been reached in the development of code systemsfor PWRs. Though these codes may not be directly available to developing countries,it is in principle possible for even non-OECD members to gain access to specificbenchmark problems and their solutions from NBA. IAEA may act as the coordinatorfor making a particular choice of codes/problems benchmark, etc. for countrieswhich are without any on-going nuclear programme, but are aspiring to have one inthe near future. It was suggested that the choice of a particular reactor type mustbe made by every country, and developed countries can provide assistance on aneed-basis for developing expertise in specific areas.
Even if a reactor type is not chosen by a developing country, it might bepossible for them to participate in simple, reactor independent problems.
USSR and other socialistic bloc countries expressed the possibility of identify-ing certain cold-clean experiments of the ZR-6 facility, performed over the last twodecades under TIC. Interest in these experiments exists in all countries opting fora WER type reactor. From the advanced countries' point of view, the ZR-6 experi-ments may be useful in testing out some HCLWR concepts, and eventually formulatinga serious benchmark for a prospective HCLWR design.
USSR also mentioned that the operational data on VVER-440 and WER-1000type reactors be presented at the TIC meetings. They can be made available to otherinterested member states by the Agency, for verification of the hexagonal codesystem, developed by various states.
The Federal Republic of Germany expressed the need for reviving interest in3D transient benchmark analysis with thermal hydraulic feedback, since far more 3Dspace-time codes are available compared to two decades earlier, and computing costsare also less prohibitive.

SOLVING THE INTEGRAL TRANSPORT EQUATIONUSING THE DP1/J± TECHNIQUE
G. MARLEAU, A. HÉBERTGroupe d'analyse nucléaire,Institut de génie énergétique,Ecole polytechnique de Montréal,Montréal, Québec,Canada
AbstractThe collision probability method has been used extensively to solve the neu-
tron integral transport equation for lattice cells. The main problem with this technique isthat in order to converge on the exact neutron flux distribution inside the cell, a fine calcu-lation mesh is required. However this substantially increases the amount of computationtime required for a transport calculation since the number of collision probabilities thatmust be computed is quadratic in N, the number of regions. An alternative to this tech-nique, which is expensive ia terms of computer resources is the J± technique which is alsobased on the collision probability method. This technique involves performing a n-termsseries expansion for the angular fluxes at each interface (the DPn approximation) andthen computing the collision, leakage and transmission probabilities associated with eachindividual homogeneous region inside the cell independently of its surroundings. Theseprobabilities are then coupled using the angular fluxes at each interface surrounding a cell.In the DPO approximation, only the first order term ia this series expansion is considered.This results in fast (since the number of probabilities to compute is linear in N) but ofteninaccurate solutions to the transport equation. Here we present the DPI approximationwhere, in addition to the uniform angular flux contributions, linearly anisotropic contri-butions are also considered. This approximation retains most of the speed of the DPOapproximation (since the number of CP to compute is still linear in N) while providing animproved solution to the transport problem. We will illustrate this affirmation by lookingat ID cylindrical and 2D square and hexagonal geometry problems. As will be shown,even if the DPI results are more approximative than the standard CP method, they givesa very good description of the behaviour of the neutron flux inside a cell.
I. INTRODUCTION
One method which is widely used throughout the world to solve the neutron transportequation is the collision probability (CP) technique [1, 2]. The results obtained usingthis method can be made as accurate as desired provided the mesh discretization is suf-ficiently fine. However, a very fine discretization of the mesh has important effects onthe computation time since the number of collision probabilities that need to be com-puted is quadratic in N, the number of regions in the cell. Moreover, upon changing the
physical properties of a single region in the cell, either for self-shielding problems of dur-ing depletion calculations, the complete collision probability matrix must be recomputed.Therefore, there is a need for a faster technique for solving the transport equation whenthe number of regions to consider is large.
One alternative to this method lies in the use of the J± technique[3]. Here, one firstuses a series expansion for the interface currents in terms of spherical harmonics. Thisseries expansion is then truncated after n terms (the DPn approximation). Then, thecollision, leakage, and transmission probabilities are computed for each region and foreach component of the angular flux expansion. All the regions inside the cell are finallycoupled via the currents at each interface using a transmission/reflection matrix. Themain advantage here is that the number of probabilities that need to be evaluated for thecomplete mesh is linear m N as opposed to the quadratic dependence of the CP tech-nique, and these probabilities depend only on the cross section of each individual region.However, in the case where the order of the series expansion is too large, this linearityin N is soon overcome by the need to compute the additional leakage and transmissionprobabilities associated with each component in the current.
The J± technique was initially used assuming uniform angular fluxes at each interface(the DPO approximation). This lead to a fast solution to the transport equation whichwas found to be innacurate in many situations. In order to improve on this problemof precision, Sanchez[5) proposed to use linear current expansion at each interface (theDPI approximation). This should improve considerably on the DPO flux results sinceone takes into account, in addition to the cosine current contribution at each interface,the contribution from the anisotropic currents. However, this implies the computation ofadditional transmission and leakage probabilities associated with the various componentsof the current considered. This increased complexity has for effect to effectively slow downthe collision probability calculation process with respect to the DPO technique, howeverthe number of probabilities to compute is still linear in N, and each region remainsindependent. In fact, the improvements in the flux solutions obtained using the DPI ascompared to the DPO technique are very substantial.
The main advantage of the J± method is that it allows one to perform a completeself-shielding calculations in its exact geometry, using few computer resources. This isbecause only the CP associated with the fuel rods must be recomputed at each stage ofthe self-shielding process. This made possible the replacement of the very crude ID/4regions (annular) self-shielding approximation previously used in WIMS-AECL[2] by anexact geometry analysis without noticeable increase in the calculation time. It also speedsup the burnup calculation since only the CP associated with regions where depletion takesplace must be reevaluated at each time step.
This paper will describe the DPI approximation to the J± method and its implementa-tion in the lattice code DRAGON[4]. In section II. of this paper we will describe the basicsof the J± method while in section III. we discuss the evaluation of the DPI transmissionprobabilities for various type of 1 and 2 dimensional geometries. In section IV. we showhow these probabilities can be used directly in a lattice code. In section V. we analyze theperformance of the DPI approximation as compared with either the CP method and theDPO approximation. Finally in section VI. we present possible extensions of this methodto multicell calculations and conclude.

H. THE DPI TRANSMISSION PROBABILITIES CALCULATION
The monoenergetic integral transport equations for the scalar and angular fluxes insidea region V of total cross section S(f) with isotropic source Q(f) and bounded by a surface5 take the form[6]:
_(?., Ü) = (r,, fi' -» fî)
(2)
(3)
where the first equation is for the scalar flux, the second equation represents the behaviourof the angular flux on each surface and the last equation incorporates the boundaryconditions. In the above, f, = r — AÎÎ is a point on 5 and T(S) is the optical neutronpath.
These equations will be discretized in the following way. We assume a constant scalarflux <j>' inside each homogeneous region of the cell (volume V, boundary surface 1^5^and cross section E') and use a series expansion in terms of spherical harmonics for theangular flux of the form:
where the ^^f(T,,u) form sets of orthonormalized functions:
> o (4)
(5)
Note that the above series expansion is divided into parts: the DPO term (m = 0),which is proportional to $!j?(?,,n) and the DPI contributions (m = 1), which contains 3independent terms p = 1,3:
*£(?., fi) =
= 2(n-
with ./V-t = nj. and the unit vectors **J., iC^,^. form a three-dimensional bases on S\.This discretization procedure results in the following set of linear equations:
(6)
A. N et 4T/*'f,t _ V^ V"^ UX p/?f»• TP.* i ^y nv+»u j^/ ^^ Qt -^Aor — |A """ QI tot (7)
r".« _ V^ V^ V^J-,<- ~ 2-, L-, L-,j=lA=l f=0
JP>JJ+,x (8)
where Tf"''3 is the discretized œupling matrix.We defined in Eq. (6) and Eq. (7) four different types of CP matrices. These are not
all independent since they satisfy symmetry and conservation relations:
Symmetry relations Conservation relations
In fact it is sufficient to compute a subset of the transmission probabilities P££' which isgiven by:
\ F f (f.sj^ïtrif)) (9)v » y o v '
From further symmetry considerations, it can be shown that for 1 dimensional geometriesthe contributions of two current components (p = 2,3 components) are completely un-coupled from the scalar flux equations. Similarly, for 2 dimensional geometries the p = 3current component will not contribute to the neutron flux. Accordingly, the transmis-sion probabilities associated with these terms in the angular flux expansion will not beevaluated.
A final advantage of this technique is that the collision, leakage, and transmissionprobabilities associated with void regions can be easily evaluated[7].
HI. APPLICATION TO 1 AND 2 DIMENSIONAL GEOMETRIES
We will first present the computation of the DPI transmission probabilities for the IDcylindrical geometry described in Fig. 1.
Figure I: Example of a 1 dimensional cylindrical geometry

In this case we only need to evaluate /jj"'1 for the filled cylindrical region andand Py£'2 for the hollow cylinder with \i, v = 0,1[7]. Here we use the notation
pOO.i _ 7-1raa ~~ -'•I/>£•• = V$(32Î-22Ï)pio.t _ poi.i
pll* = 18T3 - 24r2 + 82] - 1223, - 122J0 + 82g,)
where IJ and T£„ involve 4 dimensional integrals as described in Eq. (9). From thesymmetries of the problem, these expressions can be reduced to a final one dimensionalquadrature of the form:
Tn = -( r^TT JO
(11)
where Zi = 0, 22 = ri/rj and Aïn[u] is the Bickley-Naylor function of order n. This finalexpression will be evaluated numerically using a Gauss-Jacobi quadrature. Spherical andslab geometries can be treated in exactly the same way and the results we obtained eitherinvolve a single integral or are analytic.
We also analyzed various types of two dimensional geometries including rectangular,hexagonal and cluster geometries [8] which are illustrated in Fig. 2.
Figure 2: Examples of 2 dimensional geometries analysed using the J± tech-nique
In these cases, the collision probabilities associated with each of the cylindrical regionswill be computed using the technique previously described, which involves a single Gaussnumerical quadrature, while the strictly two dimensional contributions corresponding toregion 1 will be evaluated independently. In fact the transmission probabilities for theseregions all involve a double numerical integration. This is in contrast with the standardCP technique where the geometry is always treated as a whole which implies that thecollision probabilities associated with the cylindrical region are also computed using a 2Dnumerical quadrature.
IV. USE OF THE DPI TRANSMISSION PROBABILITIES
Once all the probabilities associated with a given homogeneous regions have beenevaluated numerically, the problem of using them directly in various parts of a transportcalculation remains. In fact, collision probability matrices are used in two different partsof a complete lattice cell calculation: for the solution of the transport equation itself and inthe self-shielding calculation. In both cases, the straight forward option is to reconstructthe complete collision probability matrix for the heterogeneous cell (pVv), starting withthe known probabilities for the N individual regions:
Pvv = Pvv + PysPssPsv (12)
(13)
where I is the identity matrix. This approach is expensive in terms of computer resourcessince it requires one matrix inversion and four matrix products to be performed.
For the solution the transport equation, a totally different approach, which involvesthe direct solution of the current-flux equations using sparse matrix algebra techniques,can be considered[7]. An additional benefit of this method is that the various componentsof interface currents are also computed during the resolution process. The first step hereconsists in extracting from the Isotropie neutron source Q1, which appears in Eq. (1) andEq. (2), contributions arising from within-group scattering:
e1 = aw + Q"where S^, is the within-group macroscopic scattering cross section and Q" is the re-duced neutron source which includes neutrons generated from all other origins. Usingthis notation, the transport equation can be cast in the form:
E EA=l />=0
(14)
(15)
where the scattering modified CP matrices are denned as
1
1
Ç1'*Ji r.DIS.1 .
00 Note that the w-matrices satisfy the same symmetry and conservation relations as thestandard CP matrices provided that the total cross section £' is replaced by S' — S ,.
The resulting linear system of equations to solved can be reduced to the followingform:
where $, J+ and $* are vectors made up of the fluxes, the currents and the reducedsources Q"', and we have solved Eq. (8) explicitly for J_.
These two equations are those actually used to evaluate the neutron flux inside eachregion. As may be seen, solving Eq. (16) involves the inversion of a rather large matrix.However, this matrix has a diagonal banded structure with a constant bandwidth. ALU factorization of the matrix may therefore be performed usiûg a compressed diagonalstorage mode where the LU factors occupy the same locations as the elements of theoriginal matrix. The complete algorithm of the solution then proceeds as follows: 1) findthe elements of the lower (L) and upper (U) triangular matrix such that LU = p—W„T];2) solve successively the two linear systems Li = w,„Q* and U J+ = x by forward andbackward substitution, respectively; 3) solve the flux equations using Eq. (17). Thisalgorithm will generally be efficient and economical.
For self-shielding calculations, the evaluation of an escape matrix is required:
where EJ is a diagonal matrix containing the macroscopic cross section of the resonantisotopes in each fuel region and p0 is a matrix formed by the components of ßw relatedto fuel regions. The computation of the p0 matrix can be speed-up using again sparsematrix algebra: 1) use an LU decomposition for [I — PggT] with L a lower and U anupper triangular matrix; 2) for each fuel region i, successively solve the two linear systemsLx; = i?,- and Uyj = x,- where 5; is a column of the psv matrix corresponding to the fuelregion t; 3) compute p0 by applying Eq. (12) and Eq. (13) only to the fuel components:
Po = Po + Py8TY
with P?8 a subset of the Pvs matrix and where Y is a matrix formed with the $. Notethat a special treatment is required in cases where one or more components of S0 becomeinfinite. In these cases, the Hospital rule can be consistently applied and leads to finitecomponents for the E matrix.
V. NUMERICAL RESULTS
We will now compare the results obtained using the DPO and DPI approximation tothe J± method with standard CP calculation results. Three types of geometry will beconsidered: a one dimensional cylindrical geometry, a two dimensional square geometryand a two dimensional hexagonal geometry.
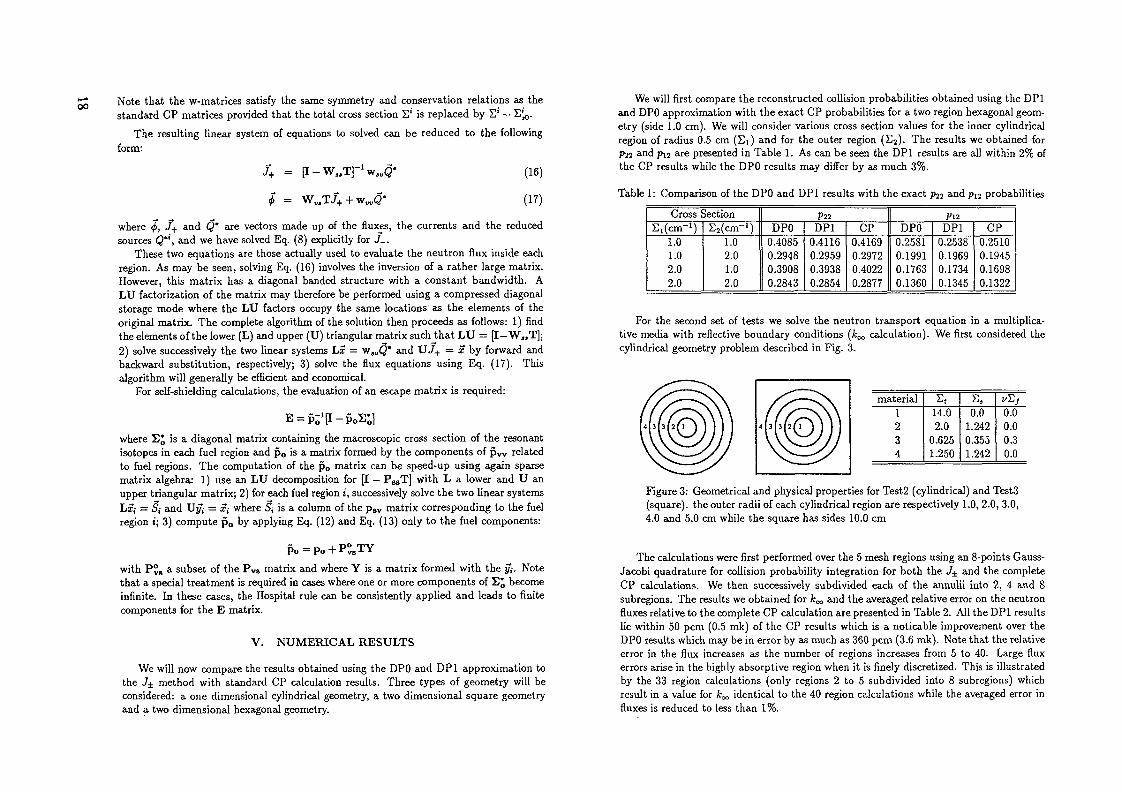
We will first compare the reconstructed collision probabilities obtained using the DPIand DPO approximation with the exact CP probabilities for a two region hexagonal geom-etry (side 1.0 cm). We will consider various cross section values for the inner cylindricalregion of radius 0.5 cm (Si) and for the outer region (£3). The results we obtained forP22 and pi2 are presented in Table 1. As can be seen the DPI results are all within 2% ofthe CP results while the DPO results may differ by as much 3%.
Table 1: Comparison of the DPO and DPI results with the exact pj2 and p]2 probabilities
Cross SectionS^cm-1)
1.01.02.02.0
S2(cm-1)1.02.01.02.0
P22DPO
0.40850.29480.39080.2843
DPI0.41160.29590.39380.2854
CP0.41690.29720.40220.2877
Pl2
DPO0.25810.19910.17630.1360
DPI0.25380.19690.17340.1345
CP0.25100.19450.16980.1322
For the second set of tests we solve the neutron transport equation in a multiplica-tive media with reflective boundary conditions (k^ calculation). We first considered thecylindrical geometry problem described in Fig. 3.
material1234
£<14.02.0
0.6251.250
s.0.0
1.2420.3551.242
i/S,0.00.00.30.0
Figure 3: Geometrical and physical properties for Test2 (cylindrical) and TestS(square), the outer radii of each cylindrical region are respectively 1.0, 2.0, 3.0,4.0 and 5.0 cm while the square has sides 10.0 cm
The calculations were first performed over the 5 mesh regions using an 8-points Gauss-Jacobi quadrature for collision probability integration for both the J± and the completeCP calculations. We then successively subdivided each of the annulii into 2, 4 and 8subrogions. The results we obtained for fco-, and the averaged relative error on the neutronfluxes relative to the complete CP calculation are presented in Table 2. All the DPI resultslie within 50 pcm (0.5 mk) of the CP results which is a noticable improvement over theDPO results which may be in error by as much as 360 pcm (3.6 mk). Note that the relativeerror in the flux increases as the number of regions increases from 5 to 40. Large fluxerrors arise in the highly absorptive region when it is finely discretized. This is illustratedby the 33 region calculations (only regions 2 to 5 subdivided into 8 subrogions) whichresult in a value for k^ identical to the 40 region calculations while the averaged error influxes is reduced to less than 1%.
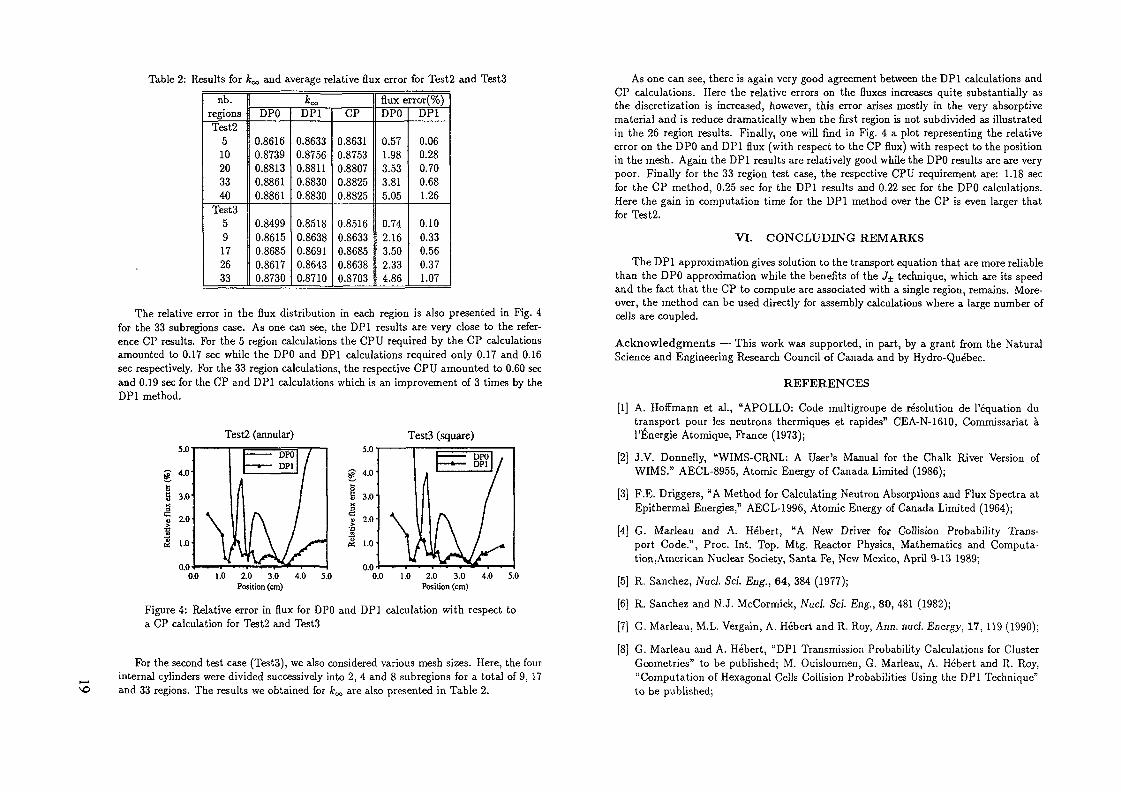
Table 2: Results for fc,» and average relative flux error for Test2 and Test3
nb.regionsTest2
510203340
TestS59172633
fc<*>DPO
0.86160.87390.88130.88610.8861
0.84990.86150.86850.86170.8730
DPI
0.86330.87560.88110.88300.8830
0.85180.86380.86910.86430.8710
CP
0.86310.87530.88070.88250.8825
0.85160.86330.86850.86380.8703
flux error(%)DPO
0.571.983.533.815.05
0.742.163.502.334.86
DPI
0.060.280.700.681.26
0.100.330.560.371.07
The relative error in the flux distribution in each region is also presented in Fig. 4for the 33 subrogions case. As one can see, the DPI results are very close to the refer-ence CP results. For the 5 region calculations the CPU required by the CP calculationsamounted to 0.17 sec while the DPO and DPI calculations required only 0.17 and 0.16sec respectively. For the 33 region calculations, the respective CPU amounted to 0.60 secand 0.19 sec for the CP and DPI calculations which is an improvement of 3 times by theDPI method.
Test2 (annular) TestS (square)
0.0 1.0 2.0 3.0 4.0 5.0Position (cm)
0.0 1.0 2.0 3.0 4.0 5.0Position (cm)
Figure 4: Relative error in flux for DPO and DPI calculation with respect toa CP calculation for Test2 and Test3
For the second test case (TestS), we also considered various mesh sizes. Here, the fourinternal cylinders were divided successively into 2, 4 and 8 subregions for a total of 9, 17and 33 regions. The results we obtained for k^ are also presented in Table 2.
As one can see, there is again very good agreement between the DPI calculations andCP calculations. Here the relative errors on the fluxes increases quite substantially asthe discretization is increased, however, this error arises mostly in the very absorptivematerial and is reduce dramatically when the first region is not subdivided as illustratedin the 26 region results. Finally, one will find in Fig. 4 a plot representing the relativeerror on the DPO and DPI flux (with respect to the CP flux) with respect to the positionin the mesh. Again the DPI results are relatively good while the DPO results are are verypoor. Finally for the 33 region test case, the respective CPU requirement are: 1.18 secfor the CP method, 0.25 sec for the DPI results and 0.22 sec for the DPO calculations.Here the gain in computation time for the DPI method over the CP is even larger thatfor Test2.
VI. CONCLUDING REMARKS
The DPI approximation gives solution to the transport equation that are more reliablethan the DPO approximation while the benefits of the J± technique, which are its speedand the fact that the CP to compute are associated with a single region, remains. More-over, the method can be used directly for assembly calculations where a large number ofcells are coupled.
Acknowledgments — This work was supported, in part, by a grant from the NaturalScience and Engineering Research Council of Canada and by Hydro-Québec.
REFERENCES
[1] A. Hoffmann et al., "APOLLO: Code multigroupe de résolution de l'équation dutransport pour les neutrons thermiques et rapides" CEA-N-1610, Commissariat àl'Energie Atomique, France (1973);
[2] J.V. Donnelly, "WIMS-CRNL: A User's Manual for the Chalk River Version ofWIMS." AECL-8955, Atomic Energy of Canada Limited (1986);
[3] F.E. Driggers, "A Method for Calculating Neutron Absorptions and Flux Spectra atEpithermal Energies," AECL-1996, Atomic Energy of Canada Limited (1964);
[4] G. Marleau and A. Hébert, "A New Driver for Collision Probability Trans-port Code.", Proc. Int. Top. Mtg. Reactor Physics, Mathematics and Computa-tion,American Nuclear Society, Santa Fe, New Mexico, April 9-13 1989;
[5] R. Sanchez, Nucl. Sei. Eng., 64, 384 (1977);
[6] R. Sanchez and N.J. McCormick, Nucl. Sei. Eng., 80, 481 (1982);
[7] G. Marleau, M.L. Vergain, A. Hébert and R. Roy, Ann. nucJ. Energy, 17, 119 (1990);
[8] G. Marleau and A. Hébert, "DPI Transmission Probability Calculations for ClusterGeometries" to be published; M. Ouisloumen, G. Marleau, A. Hébert and R. Roy,"Computation of Hexagonal Cells Collision Probabilities Using the DPI Technique"to be published;

IMPROVEMENTS IN THE CALCULATIONAL METHODS OFNUCLEAR REACTOR ASSEMBLIES
P BENOIST, I PETROVIC*, Z STANKOVSKIDirection des réacteurs nucléaires,Département de mécanique et de technologie,Commissariat à l'énergie atomique,Centre d'études nucléaires de Saclay,Gif-sur-Yvette, France
Abstract
The standard procedure for the calculation of neutron leakage rate of anassembly is based on calculating this rate for a homogeneous mediumrepresenting approximately the assembly, but not the lekage rate of theassembly itself The method presented here allowes to take into account, withsome approximations the influence of heterogeneous structure of the assemblyon the leakage The amsotropic buckhng-dependent migration area of theassembly in the direction k, which relates buckling in the same direction tothe effective and the infinite multiplication factor, can be calculated usingthe amsotropic buctding-independent migration area corrected m anapproximately way by the bucklmg-dependent and the bucklmg-mdependentmigration areas of the homogenized madium The mentioned migration areas arecalculated by means of the first flight collision probability and the firstflight directional collision probability The numerical results show that forordinary PWR fuel assembly the influence of heterogemty on the leakage isrelatively small and that the effect increases when the concentration ofwater decreases This effect could be much more important in moreheterogeneous types of reactors
I - INTRODUCTION
The calculation of a nuclear reactor as a whole remaining, at least atthe time being, beyond the possibilities of computers, certain codes used atpresent for the calculation of reactors, for instance APOLLO (Ref 1), beginby calculating the transport multigroup flux chart m a perfectly reflectedassembly by means of the collision probability method This calculation canbe made with some approximations at the boundary of each elementarycell, such as >n the multicell codes CALLIOPE and NAUSICAA (Ref 2) andEURYDICE (Ref 3) it can also be made without any approximation other thannumerical ones, such as in MARSYAS (Ref 4) Once obtained the multigroup
* On ieave from the Boris Kidne Institute — Vmca, Beigrade, Yugoslavia
flux chart m a perfectly reflected assembly, one can define for the wholeassembly a homogenized medium by weighting all the cross-sections on thevolume and the flux in each energy group This medium without leakage is notcritical In order to make it critical, it is necessary to introduce aspatial dependence in expdB r) A subroutine of APOLLO, DIFFON, calculates,
9m a multigroup scheme, the critical buckling B and the diffusioncoefficient D8 in each group g of this homogenized medium The next step
consists in introducing this leakage rate as an uniform absorption cross-section in a new heterogeneous reflected assembly transport calculationThis is made by replacing the scattering cross-section Ig^g byj-g g _ Dgg ^g new assembiy fjux chart allows to define a new
s 2homogenized medium, a new critical buckling B and a new diffusioncoefficient DE are obtained for this medium The same procedure iscontinued until convergence (K=l) Finally, one obtain by MARSYAS a fluxchart taking into account the leakage of the assembly, and the criticalbuckling BO is given by DIFFON Analogous calculations are now made by theAPOLLO-2 code (Ref 10)
II - A NEW PROCEDURE FOR LEAKAGE CALCULATION
The drawback of this procedure lies on the fact that it calculates then 2
neutron leakage rate D B of a homogeneous medium representing approximatelythe assembly, not the leakage rate of the assembly itself We propose herean improvement of the method allowing to take into account (with someapproximations) the influence of the heterogeneous structure of the assemblyon the leakage
Let us start with the initial case, concerning a perfectly reflectingheterogeneous assembly without buckling Considering a reflection conditionis equivalent to consider an infinite and regular lattice of similarassemblies This lattice can be critical only if a macroscopic dependenceexpdB r) is superimposed to the microscopic flux The buckling vector B isrelated to the effective multiplication factor K by the relationship
2- 2Mk(B) Bkk
(1)
where K is the infinite multiplication factor (i.e. with a zero-buckling),» ** 2 ~*where B is the k-component of B {with k=x,y,z), and where M. (B) is the
anisotropic buckling - dependent migration area in the direction k. Thequantity M. IB) being difficult to calculate, we shall calculate the quantity
2M. (0) (buckling-independent migration area), and correct it approximately asfollows in order to obtain M, (B) (Ref. 9).
l/T (B )? horn o
MHB) = NC(O) ———————K K ~
M7 (0)horn
(2)
where M, (B ) is the migration area of the homogenized medium obtained byhorn oflux weighting, and corresponding to the critical buckling BQ of thismedium. This quantity can be obtained by means of the DIFFON module of
2APOLLO. The calculation of M. om(0) is a simple particular case of thecalculation of M, (0) in a lattice, that we shall see later.
Assuming that the lattice is such that
(3)
2 2 2Eq. 1 gives a relation between K, B and B , where B is the radial» r* z nbuckling. Let us assume that B is known; Eq. 1 defines then the critical
2 z
radial buckling B corresponding to K=l.
Ill - CALCULATION OF
The expression Mfc(0) of the migration area in a lattice at the limitB-»0 has been obtaind by Deniz (Ref. 5,6)
= K (4)
where the brackets mean a summation over the volume of the reflectedassembly, over the solid angle 4n and over all the groups g.
The "classical" angular flux 0g(r,Q) is the solution of the equation
(5)
where T is the integro-differential transport operator (taking into account
the energy group transfer) and where F is the fission operator. The adjointflux tfi 8(r,n) is the solution of the adjoint equation.
The "directional" angular flux (d j . ( r , f l ) is the solution (the existenceof which is guaranteed by Fredholm's theorem) of the equation with source(Ref. 7,8)
(6)
In order to avoid handling of angular fluxes, let us assume that0g(r,£2) and >ji g(r,n) can be replaced by their average value 9g(r) and <p+S(r)over de solide angle 4it. Moreover let us assume that we can keep only theuncollided part of the directional flux \(c. (r,Q), which is equivalent toneglecting the "angular correction term"; this approximation is reasonablein a lattice such a PWR one, which is not extremiy far from homogeneity.Then M. (0) becomes
y y y ,*«L L L jt j
??.(7)
g g'
where the sumations are extended to all the calculatonal regions i and j ofthe reflected assembly, and to all the groups, V. being the volume of region
i and yf and <p+s being the average value of <p (r) and <f (r) over region j.
The first flight directional collision probability P?. , is defined by1 J»K
(Ref. 7,8)

topg =Pij,k V.1
d3rV.
_dV
exp(-£R)g
(8)
V. 47IFT
with R=r-r', Q=R/R and where £Rg is the optical path between r and r' (withthe total cross-section £g).
The Pg. are very close to the classical first flight collisionprobabilities P?., and since the pf. are anyway necessary to calculate thev ij ijflux chart in the assembly, the determination of the P.. . requires only a
1J,K
small additional work.
REMARK
A small difficulty arises here due to the fact that <pQg(r) is not the
solution of the adjoint integral transport equation. It can be shown (Ref.9) that it is the solution of the direct integral transport equation in
which the transfer cross-section £? ^g(r) is replaced by zf~*g ( r ) . This isS ^
important to point out since the collision probability method is based on
the integral form of the transport equation.
IV - NUMERICAL RESULTS
M2o
M2. cm2
<
5M2/M2
r o7.
5M2/M2z o
Normal waterd e n s i t y d
36.69
36.94
37.11
0.68
1 .14
d/5
183.93
185.32
187.94
0.76
2.18
d/10
281.45
284.56
291.27
1. 10
3.49
Controlassembly
34. 37
34. 54
34. 77
0. 49
1.16
The first case concerns a normal fuel assembly in which the watertemperature is 306°C {the boron concentration is 1.2 10 ). In the twofollowing cases, the density of water (and boron) has been reduced by afactor 5 and 10. In the last case, we considered a critical assembly with 24boron carbide pins.
The method presented above was performed by the APOLLO-2 code (Ref. 10)and applied to several situations of a PWR assembly. The normal fuelassembly is a 17x17 square pattern of fuel pins, this fuel being a typicalMOX mixture of uranium oxide and plutonium oxide. The pin radius is 0.413cm,the clad radius 0.474cm; the pitch is L265cm; the central cell is a water
hole; for the calculation the structure materials are homogenized with water.2 2The table presents the values of the migration area Mo
=Mhom
(B0>
obtained by the standard APOLLO procedure, and the values Mfc of the radialand axial migration areas given by the proposed method. This table givesalso the relative changes
5M Mk -(9)
V - CONCLUSIONS
It can be seen that for a normal fuel assembly the influence of theheterogeneity on the leakages is relatively small;the effect increases whenthe concentration of water decreases. Anyway, the effect of heterogeneity onleakages does not seem to be fundamental in a PWR assembly. But this effectcould be much more important in more heterogeneous types of reactors as forexample HTR.
ACKNOWLEDGEMENTS
We would like to thank Miss. M. Coste, R. Sanchez and I. Zmijarevic for
helpful discussions and useful advices in the use of the APOLLO-2 code.
REFERENCES THE CACTUS TRANSPORT METHOD IN WIMS
1 A. Hoffmann. A. Kavenoky, at all Note CEA-N-1610, Saclay (1973).
2. R. Sanchez, Nucl. Sei. Eng. 64 384 (1977).
3. A. Hébert et A. Kavenoky, Proc. International Mtg. in Math. Methods forthé Solution of Nucl. Eng. Problems, ENS, Munich, Vol 1. 195 (1981).
4. Z.Stankovski, Traitement par la méthode de Galerkin du transport desneutrons dans un milieu hétérogène à géométrie X-Y. Thèse de 3è Cycle,Belgrade, Yougoslavie, (1978). see also:
A. Kavenoky, M. Lam-Hime et Z. Stankovski, Proc. Topical Mtg. onComputational Methods in Nucl. Eng, ANS, Williamsbourg, Vol II, 7-55(1979).
5. V.C. Deniz, Nucl. Sei. Eng., 28, 397see also: Raport CEA-R-3080 (1967).
6. V.C. Deniz, CRC Handbook of Nuclear Reactor Calculations, Vol II,p.p. 409-508 (1986).
7. P. Benoist, Raport CEA-R-2278, Saclay (1964).8. P. Benoist, Nucl. Sei. Eng. 34, 285 (1968).
P. Benoist, Note CEA-N-2619, Saclay (1989).9.
10. R. Sanchez, J. Mondot, Z. Stankovski, A. Cossic, I. Zmijarevic, Proc.12th Int. Top. Mtg. Advances in Reactor Physics, Mathematics andComputations, Paris, France, April 27-30, Vol 3, p. 1563, (1987).
to
M.J. HALSALLPhysics and Thermal Hydraulics Division,AEA Thermal Reactor Services,Winfrith Technology Centre,Dorchester, Dorset,United Kingdom
Abstract
The WIMS lattice codes, written at Winfrith in the UK,have a long pedigree, dating back to about 1964 (and earlierfor several of the physics methods). It was in 1969 thatserious efforts were wade to develop the first 'modules1 of anew version to be known as WIMSE. This modular scheme is nowthe major lattice code at Winfrith for the exploitation of newmethods; because it is modular with a standard interfacebetween the individual components, it is relatively easy to addnew ones. The method we call CACTUS is such a module.
CACTUS solves the differential transport equation in twodimensions by the so-called Characteristics Method. By meansof a combination of carefully selected numerical 'tracks' and ageneral, if somewhat tedious method of geometry description,the method has been used to solve a wide range of verycomplicated geometries from simple pincells to supercells(colorsets) of Advanced Gas-cooled Reactor (AGR) channels. Inall of these cases the 2D geometry is solved exactly withoutthe need to smear fuel pins.
This Paper describes the rather simple equations solved byCACTUS and explains the tracking methods that automaticallyimpose the required boundary conditions. The accuracy of thesolution is dependent on the number of angles at which tracksare evaluated, and also on the spacing between them. In thisrespect, the method has similarities with numerical methods ofintegrating collision probabilities; it is significantlydifferent in that the transport equation is solved along eachtrack segment in turn. One disadvantage of the method is thatboth azimuthal and polar angles must be integrated numerically;in collision probability methods the polar integration isanalytic.
The methods have only been worked out in detail forrectangular outer boundaries, ie. for square or rectangularpitch lattices, but could be applied equally well to hexagonalsystems. It is these tracking methods and efficient ways ofprocessing the data produced by them that are at the heart ofCACTUS and its successful exploitation.
The generality of the CACTUS geometry has made it possibleto analyse some problems for which no other method in WIMS

would be appropriate,applications.
The Paper gives two examples of these
Essentially the same CACTUS module has been implemented inthe 'semi- modular' Light Water Reactor version of WIMS knownas LWRWIMS. In LWRWIMS the geometry interface is automatic,but is restricted to standard LWR assembly (or supercell)geometries. Comparisons are quoted of the relativeefficiencies for practical design calculations of CACTUS andthe standard LWRWIMS design route.
The specification of a theoretical benchmark based on amixed oxide PWR is given as an Appendix, together with samplesolutions derived by various methods, including CACTUS, thatare available within the WIMS family of codes.
1. INTRODUCTION
The WIMS lattice codes, written at Winfrith in the UK,have a long pedigree, dating back to about 1964 (and earlierfor several of the physics methods) . It was in 1969 thatserious efforts were made to develop the first 'modules' of anew version to be known as WIMSE. This modular scheme is nowthe major lattice code at Winfrith for the exploitation of newmethods; because it is modular with a standard interfacebetween the individual components, it is relatively easy to addnew ones. The method we call CACTUS is such a module.
An early stand-alone version of CACTUS is described in Ref1, and testing on a 'simple1 benchmark case in Ref 2. Ref 3contains a slightly more recent description of the options ofthe code as first implemented in WIMSE.
CACTUS solves the differential transport equation in twodimensions by the so-called Characteristics Method. By meansof a combination of carefully selected numerical 'tracks' and ageneral geometry description, the method has been used to solvea wide range of very complicated geometries from simplepincells to supercells (colorsets). In all of these cases the2 D geometry is solved exactly without the need to smear fuelpins. Section 2 of this Paper describes the rather simpleequations solved by CACTUS. Sections 3 to 5 describe thenumerical tracking methods used to integrate them.
Essentially the same CACTUS module has been implemented inthe 'semi-modular' Light Water Reactor version of WIMS known asLWRWIMS. In LWRWIMS the geometry interface is automatic, butis restricted to near-standard LWR assembly (or supercell)geometries.
The generality of the CACTUS geometry has made it possibleto analyse some problems for which no other method in WIMS
would be appropriate. Section 6 gives examples from WIMSE andLWRWIMS, and also gives an indication of the relativeefficiencies for practical design calculations of CACTUS andthe standard LWRWIMS diffusion theory based design route.
2. THE TRANSPORT EQUATION
One of the principle attractions of the methods used inCACTUS is the simplicity of the formulation. The Boltzmann formof the neutron transport equation for an isotropic source canbe written:
dNdS (1)
where N is the angular flux along a 'line' or 'track' in theproblem (otherwise known as a 'characteristic')S is the distance measured along the lineS is the total macroscopic cross sectionQ is the neutron source (fission-yield and scattering)
assumed to be isotropic.For any line segment of length t and constant properties
S and Q we can integrate Equation 1 to obtain:
Nout = No-Zte + (2)
StN NdS = (N - _i_)O 47TZ 4ir
Hence ** + __47TS St
(3)
where N is the average angular flux along the lineN0 is the inward value of the angular flux at S=0NO u t is the outward value at S=tA is N0-Nout
Thus for any line intersecting a system, we may, byrepeated application of Equations 2 and 3, form the averageflux along each line segment, given an initial boundarycondition.
3. NUMERICAL INTEGRATION
The entire procedure of calculating the neutron flux inCACTUS revolves around numerical integration of the linesegments as described above. By choosing a family of parallel

lines it is possible to carry out the required spatialintegration. If these lines are also rotated through a numberof discrete angles in the azimuthal direction (x-y plane) andin the polar direction (the z direction) the angularintegration can also be carried out.
This approach has significant similarities with thenumerical type of tracking that is frequently adopted incollision probability methods for geometries where theprobabilities cannot be expressed analytically. Some sort ofgeometrical algorithm has to be programmed to evaluate thetrack lengths through whatever geometry is of interest. In theWIMS PIJ code this geometry is generally of a cylindricalcluster type, with options to subdivide annuli and pinsazimuthally. In CACTUS a more general approach was adopted topermit almost any type of geometry within a rectangularboundary to be investigated.
The differences between CACTUS and PIJ tracking are:- the polar angle integration must be done numerically
rather than analytically through the use of Bickleyfunctions. In this respect, CACTUS has a similaritywith Sn methods. In CACTUS, it is convenient,though not essential, to adopt the same azimuthalangles at each polar angle, whereas in Sn methods thenumber of azimuthal angles is normally reduced athigh polar angles.because the flux is being solved directly, theboundary conditions must be built into the trackingroutine, and provision must be made for iteration ofthe solution. In this respect, also, the method hasa similarity with Sn methods.
The method by which the boundary conditions are introducedinto the solution at present restricts the use of CACTUS torectangular boundary problems with reflection or translation.Consider the simple track in Figure 1 which illustratesreflecting boundary conditions.
With the right choice of angle this track has beenarranged so that it ends at its own starting point. If a guessis made of the angular neutron flux at a starting point on thistrack (N0 in equation 2), then the final value of Nout shouldequal this if the solution has been properly converged.
Several parameters are important in achieving an accuratesolution from CACTUS. These are:
the size of region within the problem over which thesource Q is assumed to be spatially constant,
the spacing between tracks,the number of azimuthal angles,the number of polar angles.
The user has control over all of these parameters, but theprecise choice of track spacing and azimuthal angle isconstrained by the requirement that the track shall return toits starting point. The way this constraint works is easier tovisualise in a case with translational (or cyclic) boundaryconditions.
Figure 2. Translating Tracks
to Figure l. simple Reflecting Track
In Figure 2, assume that each 'box' is an identicalassembly with cyclic boundary conditions, and each letteredpoint is at an equivalent position on the assembly boundary.Then a track from A to any other lettered point will simplyrepeat itself if further extended, and the angular flux at A inthe direction of the track will be equal to that at all otherpoints in the same direction. This will be our basic boundarycondition assumption; on a track from A to C, for example, weinsist that the computed outward angular flux at C be equal tothe inward angular flux at A in a converged solution.
Along any track where NX assemblies are traversed in thex-direction, and Ny in the y-direction, then NX and Ny should

to
Figure 3.Translating
Boundary Condition
be co-prime (they must not have a common factor greater thanunity) otherwise tracks will be duplicated. (See for example,tracks AJ and AF in Figure 2.)
Along AC, Nx=2 and Ny=3, and the within assembly track isas shown in Figure 3, where e is the azimuthal angle.
A further constraint on the choice of tracks is therequired track separation; the closer the tracks and the betterthe calculation, but the computing cost will also be increased.The track separation will obviously vary inversely as the totallength of track within the assembly, and hence for a givenrequired separation we have further constraints placed upon thevalues of NX and Ny.
The choice of azimuthal angles, 6, is therefore rathercomplicated. We have first to choose a range of 'ideal' anglesand then for each one, evaluate the co-prime pair of numbers NXand Ny so that the required angle and the required trackseparation are most nearly achieved.
The easiest way to consider the reflecting boundary caseis to take units of four assemblies which then have cyclicboundary conditions. The track illustrated in Figure 4(a)across 4 assemblies is equivalent to the reflecting trackillustrated in Figure 4(b) around a single assembly. It shouldbe noted that for the translational case it is necessary tospread the azimuthal angles between 0 and 2ir, but for thereflectional case tracks starting at angles between 0 and ir/2achieve a similar coverage.
CACTUS does not presently have a capability for hexagonalgeometries, but there is no reason in principle why theseshould not be implemented. For example, tracks across a singleassembly with cyclic boundary conditions would work asillustrated in Figure 5.
Figure 4. Reflecting Boundary Condition
Figure 5. Translating Boundary Condition in Hexagonal Geometry
As noted earlier, the integration over polar angles inCACTUS, as in Sn methods, is numerical. The choice of polarangles is not constrained in any way, but some choices arebetter than others. For convenience, the same azimuthal anglesare tracked at each polar angle; this simplifies the logic ofthe tracking routine itself. In the x-y plane it is notpossible to choose tracks that preserve a mean chord length(although the actual track lengths can be used to integrateregion areas numerically, and the true track lengths in eachregion can be scaled to give the analytic areas). In the polardirection, it is straightforward and desirable to choose anglesthat reproduce mean chords. As a simple example, an infinitecylinder (of volume V, surface area S, and radius r) has a mean

chord of 4V/S = 2r. Tracks in the horizontal plane (of area Aand diameter d) have a mean length of A/d = wr/2. To achievethe required mean chord for the cylinder the horizontal tracksmust be multiplied by 4/?r, which is the secant of the requiredpolar angle. For several polar angles it has been shown semi-empirically that the best choice is to divide the range 0 toir/2 into equal angles and to select the mean secant within eachrange.
In practical cases good accuracy is obtained by choosing atrack separation of the order of 2mm, 5 azimuthal angles, and 2or 3 polar angles. Even with a single polar angle the solutionis not unrealistic (typically within 1% in k) .
4. REPRESENTATION OF GEOMETRY
There are many ways of describing geometry, even in twodimensions. With hindsight, the method used in CACTUS is notideal. It is extremely flexible but is very onerous for theuser who wishes to set up a large complicated problem. WithinLWRWIMS, which is used for standard geometries, an interface isgenerated automatically, and the user is spared this chore. Inthe modular WIMS code, WIMSE, the user is required to specifythe geometry as follows:
define the rectangular boundary of the problem,- locate by means of x-y coordinates any number of
'nodes' or points within the boundary,join pairs of nodes by straight lines or circulararcs (with a specified centre of curvature) to defineany number of 'edges',defineedges,
'elements' by specifying a sequence of
define 'inserts' of concentric regions that make upfuel pins for example,specify the material(elements + inserts).
contents of each region
The above sequence provides an extremely generalcapability for defining any geometry that can be represented bystraight lines and circular arcs. Graphical procedures havebeen written to output the geometry as defined but these areuseful only for checking, and not for data generation. Ad hocprocedures have been written by some users with specialrequirements for very large problems, but this is an area ofthe code development that will be given attention, now that wehave convinced ourselves of the power of the method.
5. ACCELERATION OF THE SOLUTION
Several methods have been employed. The original code usedan Aitken extrapolation of the fluxes every few iterations.This had limited success and has now been replaced by aChebyshev technique. In addition, the energy rebalance, whichis particularly important in multigroup light water cases, hasbeen speeded up by a simple homogenisation procedure. Aftereach iteration, the problem is smeared using conventional fluxand volume weighting, and the homogeneous eigenvalue problem issolved. (At present this is a simple unaccelerated iterativesolution which is adequate for few group cases, but as biggerproblems are now being run, this will be replaced by a betterinversion method). The homogeneous flux solution is used torescale the group spatial fluxes derived by CACTUS, and it isthese rescaled fluxes that are accelerated using the Chebyshevmethod.
A standard calculation is started by assuming a scalarflux of unity in all groups and regions, and a boundary angularflux of 1/47T. A less obvious way of obtaining a fastersolution is to run a calculation with only one polar angle toobtain a starting flux guess. This strategy is attractivebecause a better solution with more polar angles does notinvolve any further analysis of the geometry- Even better, ina depletion calculation, is to save all the track lengths fromone time step to the next for multiplication by an updated setof cross sections, and to use the previous time step fluxes(scalar and boundary) as a starting guess. This typicallyspeeds up subsequent CACTUS calculations by a factor of aboutthree.
6. EXAMPLES OF THE USE OF CACTUS
An early version of the CACTUS code was in use at Winfrithabout 10 years ago. At that time it was prone to trackingerrors and expensive to run on our main-frame computers.Double precision arithmetic in the tracking routines has curedthe tracking error problems and modern workstations have madevery large problems a practical proposition.
An early application of CACTUS was a problem that was noteasily solved by other methods available at the time. Animportant consideration in the study of PWR clad ballooning isthe local distribution of pin powers, and the question askedwas 'How important to local pin power distribution is thepossible displacement of a pin from its nominal position in theassembly?'. The answer can be obtained simply by use of CACTUSin LWRWIMS. A 5 by 5 array of identical pincells at normalconditions gives a flat power distribution; with the centre pindisplaced 2mm along the diagonal the following power map wasobtained, ie with about a 1% perturbation in the pin powersadjacent to the displaced pin.

N)oo ooooo
0000o
oo°
oo
ooooo
ooooo
1.1.1.1.1.
000001003003003
000 0.999 0.997 0.997 0.9981.000 0.990 0.992 0.9971.011 0.996 0.990 0.9971.007 1.010 1.000 0.9991.003 1.003 1.002 1.001
Figure 6. Displaced Pin Geometry and Power Map
A more complicated case that was analysed in early CACTUSdays concerned fast neutron damage to the structure of the bulkgraphite moderator in an AGR core. The case was a difficultone because it involved calculating the fast flux gradientalong a straight line junction between blocks of graphite somedistance from the cylindrical cluster of fuel pins.
The biggest case in terms of regions and track data thathas been analysed was a 9 by 9 supercell of AGR fuel channels,each comprising 36 fuel pins in a cluster, surrounded bygraphite sleeves and bulk graphite moderator. Control absorberswere placed at interstitial positions (Ref 4).
A sample case that has been used as a benchmark in the UKis described below. The problem is a two-dimensionalrepresentation of a PWR supercell (colorset) designed tohighlight the interaction between U and Pu assemblies.
Fuel compositions as weight percentages:
Geometry Keyccccccbw2222222
CCCcgcbw22g2222
ccgcccbw2222g22
cCccccbw2222222
Cgccgbbw22g22g2
ccccbbaw2222222
bbbbbaaw2222222
wwwwwwwwwwwwwww
1111111w3333333
1111111w3333333
1g11giiW33g33g3
iiiiiiiw3333333
11giiiiw3333g33
1111giiw33g3333
1111111w3333333
abc123gw
= 2.359= 2.993= 4.252= 1.053= 1.349= 3.400= guide= water
w/o Pu fissile pinw/o Pu fissile pinw/o Pu fissile pinw/o U235 pinw/o U235 pinw/o U235 pintubegap
Other data: fuel radius 0.4645 CM, temperature 900Kclad i.r. 0.4742 cm, o.r 0.5360 cm, temperature600Kguide tube i.r. and o.r. as clad, temperature 550Kcoolant temp 550Kwater gap 0.1 cm, pin pitch 1.4122 cm, assemblypitch 19.8708 cm
U235U238PU238PU239PU240PU241PU242ATO241Oxygentensity
0850100001110
a.2097.0612.0305.7691.6772.2540.1179.0323.8481.198
0840200001110
b.2097.3323.0396.2219.8466.3153.1473.0397.8476.199
0820310001110
c.2174.7772.0580.1574.2208.4495.2165.0567.8465.202
087
1110
1.9282.2218
,8500.422
186
1110
2.1891.9609
.8500
.422
32.997185.1529
11.850010.422
Clad and guide tube zirconium density 6.5g/ccWater composition to be used throughout (density 0.85943includes smeared grid material and 900 ppm boron):
g/cc
HydrogenOxygen
9.8574 Natural boron 0.079478.2332 zirconium 11.8300
Boundary conditions are reflecting on all four sides, andcorrespond to a problem of infinite extent axially. The low,medium and high enrichments of uranium correspond in reactivityto two representative fuel burnups and to fresh fuel.Requested output is a normalised (to an average of unity) pinpower map, a similarly normalised assembly power map, and k-infinity.
For an accurate calculation of the above problem, theCACTUS solution takes over 100 times longer than astraightforward diffusion solution. This may seem prohibitivefor design work, but in a typical case with depletion, thebreakdown of running times is as follows:
Microscopic cross section processingMulticell collision probabilitiesFew group constantsSmear & modified diffusion coefficientsTransport solution (GOG/CACTUS)Edits and depletion
Total
Diffusion551113
CACTUS5510
1503
16 164
Note that the derivation of modified diffusion coefficientsalso relies on CACTUS calculations for small sections of theproblem (Ref 5) . Bearing in mind that CACTUS calculationsafter the first in a depletion run (using previous fluxsolutions as starting guesses) are three times quicker, we seethat the overall factor in running time ranges from 10 down toabout 4. A factor of 4 in computing time in the context of aworkstation environment, where computing is cheap and machine

speeds are increasing every year, is not serious. The benefitof using a more reliable transport solution in designapplications is considerable and it is reasonable to anticipatethat the CACTUS approach will become the standard LWRWIMSmethod in the not-too-distant future.
1.
2.
3.
4.
5.
REFERENCES
Halsall M JCACTUS, a Characteristics Solution to theTransport Equation in Complicated Geometries.AEEW R 1291 (1980)
Neutron
Halsall M JThe Analysis by SeveralSmall PWR Model Problem.AEEW R 1378 (1980)
Neutron Transport Methods of a
Halsall M JA User's Guide to the WIMS-E Module W-CACTUS.AEEW R 1710 (1983)
Hutton J L, Phénix J & Course A FAdvanced Modelling Methods in WIMSE.International Conference on the Physics of(PHYSOR 90) Page IX-14 (Marseille, April 1990)
Reactors
Halsall M J, Powney D & Moxom Mrs M RLWRWIMS, the WIMS Code for Light Water Reactors.International Conference on Physics of Reactors (PHYSOR90) Page IV-45 (Marseille, April 1990)
ANALYSIS OF THE MAIN PHYSICAL AND NUMERICALASPECTS IN THE MODELLING OF CONTROL CLUSTERSFOR PROJECT CALCULATIONS
G.B. BRUNA, P.L. CORNILUS,C. POINOT, C. VAN FRANKFramatome,Pans-La Défense,France
AbstractCalculation of the reactivity worth of control and safety clusters isgenerally a major issue in the project studies of the PWR type nuclearreactorsAdapted procedures are to be searched for obtaining suitable data, because,in practice, computing the absorber cross-sections always implies acompromise between the often contrasting requirements of the physics andthose imposed by the environment in the computational chainIn this paper, we summarize some elements of a wide research and developmentwork carried out in FRAMATOME in the aim of getting a deeper understandingon the whole matter, taking into account both its physical and computationalaspects.All these elements contributed, in various ways, to the definition of aproject oriented preliminary cross-section generation scheme, well adaptedto fulfill the requirements of a calculation chain based on two group,finite difference, discrete, diffusion codes.The analysis was performed either with the multigroup, collision probabi-lity, two dimensional, transport APOLLO code, or with the finitedifference, centered mesh, diffusion module of the project chainAll calculations were made in an infinite medium assembly approximationIn the whole work, four main items were analyzed, in some detail
- the origin and splitting of the reactivity worth of control clusters,- the influence of the transport scheme,- the effect of the diffusion approximations,- the overall impact of these items on the structure of a projectcomputational chain
to
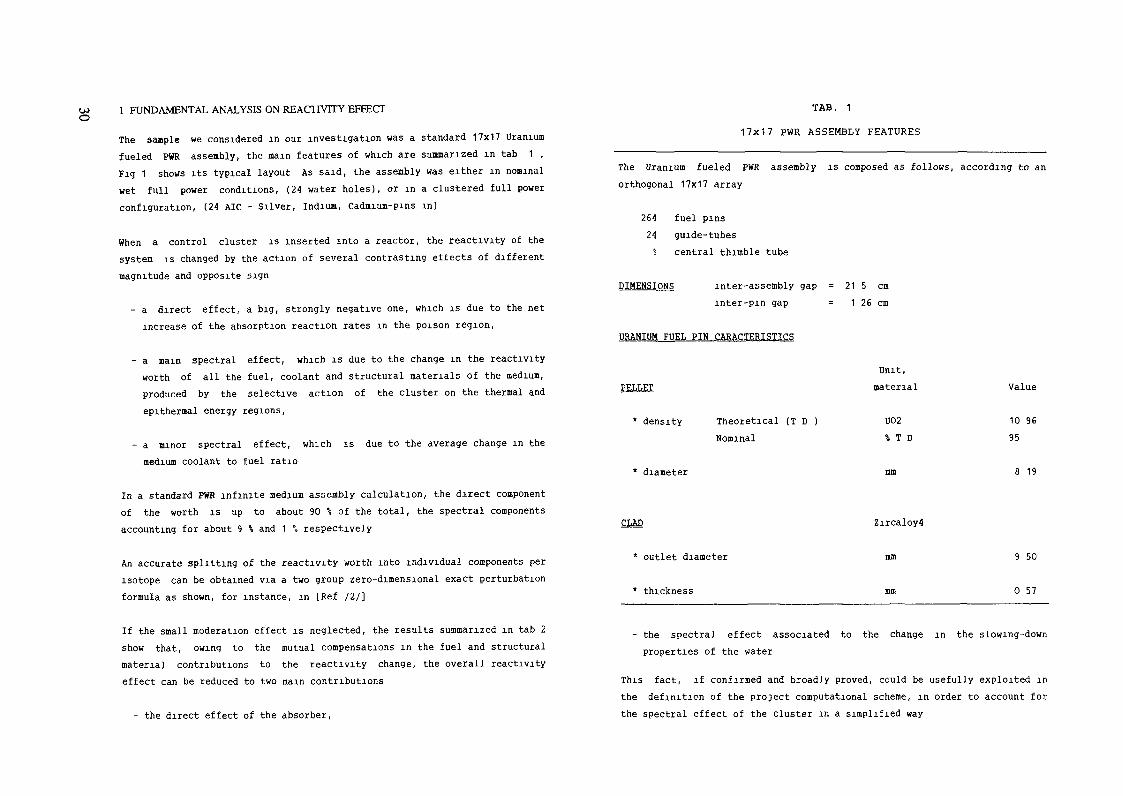
1 FUNDAMENTAL ANALYSIS ON REACTIVITY EFFECT
The sample we considered in our investigation was a standard 17x17 Uraniumfueled PWR assembly, the main features of which are summarized in tab 1 ,Fig 1 shows its typical layout As said, the assembly was either in nominalwet full power conditions, (24 water holes), or in a clustered full powerconfiguration, (24 AIC - Silver, Indium, Cadmium-pins in)
When a control cluster is inserted into a reactor, the reactivity of thesystem is changed by the action of several contrasting effects of differentmagnitude and opposite sign
- a direct effect, a big, strongly negative one, which is due to the netincrease of the absorption reaction rates in the poison region,
- a main spectral effect, which is due to the change in the reactivityworth of all the fuel, coolant and structural materials of the medium,produced by the selective action of the cluster on the thermal andepithernal energy regions,
- a minor spectral effect, which is due to the average change in themedium coolant to fuel ratio
In a standard PWR infinite medium assembly calculation, the direct componentof the worth is up to about 90 \ of the total, the spectral componentsaccounting for about 9 % and 1 °, respectively
An accurate splitting of the reactivity worth into individual components perisotope can be obtained via a two group zero-dimensional exact perturbationformula as shown, for instance, in [Ref /2/]
If the small moderation effect is neglected, the results summarized in tab 2show that, owing to the mutual compensations in the fuel and structuralmaterial contributions to the reactivity change, the overall reactivityeffect can be reduced to two main contributions
- the direct effect of the absorber,
TAB. 1
17x17 PWR ASSEMBLY FEATURES
The Uranium fueled PWR assembly is composed as follows, according to anorthogonal 17x17 array
264 fuel pins24 guide-tubes1 central thimble tube
DIMENSIONS inter-assembly gap = 21 5 cminter-pin gap = 1 26 cm
URANIUM FUEL PIN CARACTERISTICS
Unit,material Value
* density Theoretical (T D )Nominal
U02"'. T D
10 9695
diameter mm 8 19
CLAD Zircaloy4
* outlet diameter mm 9 50
* thickness 0 57
- the spectral effect associated to the change in the slowing-downproperties of the water
This fact, if confirmed and broadly proved, could be usefully exploited inthe definition of the project computational scheme, in order to account forthe spectral effect of the cluster in a simplified way

xx
x
x
x
X
xx
x
x
xxX
x
x
X
xxx
X
x
x
xx
X
TAB. 2SPLITTING OF THE CLUSTER REACTIVITYINTO COMPONENTS (TYPICAL U02 CASE)
Fuel pin
Thimble tube
Absorber
F I G . 1
A S S E M B L Y L A Y O U T
Anyway, it must be noticed that the infinite medium assembly approximation,very practical in the analysis phase, exacerbates the spectral effect in thefuel region surrounding the absorber, because, in the core, the sharpspectral shift produced by the cluster is significantly mitigated by theleakage of the unclustered assemblies.
In the following, for practical reasons, only the direct effect componentwill be explicitly taken into account.
2 INFLUENCE OF THE TRANSPORT SCHEME
In a transport PIJ computational scheme, like the one built in the APOLLOcode/1/, the results may significantly depend on the approximations made in thetreatment of the probability collision exchange matrix These approximationsmay generate important discrepancies on the calculated power values, whenblack absorbers are studied in a simplified "multicell" scheme,[Ref /3/]
ISOTOPE
URANIUM 235
URANIUM 238
WATER
OXYGEN
BORON
ZIRCONIUM
HAFNIUM
CHROMIUM
IRONNICKEL
OTHER STAINLESS STEEL
CADMIUM
SILVER
INDIUM
TOTAL
DIRECTCONTRIBUTION
0
0
6210
- 12600
391102913
347231961896
9250
SPECTRALCONTRIBUTION
- 1341878611537
4— 1
81211
0000
864
HIGHER ORDERCONTRIBUTION
0
0
- 560200
- 12- 44
40000
- 114
TOTAL
- 134187
142615
- 16141
1954
14
13347231961896
10000
Features -. U235 enrichment = 1.8 %nominal conditionsboron concentration = 1O50 1024 AIC control cluster
-6

10 All these approximations were widely investigated and their impactquantified in a previous paper, [Ref /3/], so that we focus here only on theother approximations, usually made in the transport assembly calculations,i e
cell homogem sat ion
- "cell" honogenisation in space,equivalence procedure,
eventually via a transport/transport
- finite meshing in space and energy, (coarse mesh and collapsing),
- assembly spatial amalgamation of several physically "equivalent" cells,in order to reduce the memory size in computations and simplify the datastorage
Fig 2 presents a structured synthetic flow-chart of the whole transformationprocess , the relative weight of the different steps are quantified infig 3
These approximations generate effects, which can be individually higher thanthe ones strictly related to the use of a two group diffusion approximationin a theoretical continuous meshing
An equivalence procedure is generally set up in the cell code in order toaccount for these approximations in a simplified way this procedure, oftenquoted as a "transport/diffusion equivalence", actually acts as an overallequivalence operator, which transforms fine transport calculated,multimedia, multigroup data into "equivalent" homogeneous, two media, twogroup diffusion ones
3 EFFECT OF DIFFUSION APPROXIMATIONS
The main issue in the search of a finite difference numerical solution ofthe diffusion equation, containing homogeneous pin data coming from atransport computational scheme, as seen before, is to discretize thegradient operator on a given meshing in order to set up a system of linearequations, [Ref /4/]
Heterogeneous transportcalculation
Homogeneous diffusioncalculation
Homogenscis trrnsoortcalculation
Homogeneous transportcalculation
ÎPick's law
FIG.HSTRUCTURED FLOW CHART
OF THE TRANSPORT-DIFFUSION PROCESS
A very usual system is based on a linear expansion of the Laplacian operatorover the mesh This procedure generates an error which is proportional tothe square of the mesh size, [Ref /5/]
Different expressions of the error show up, depending on whether the problemis either a centered mesh or a non centered mesh, but, in both cases, theasymptotic continuous meshing expressions of the gradient and k effectivewill be the same [Ref /6/]
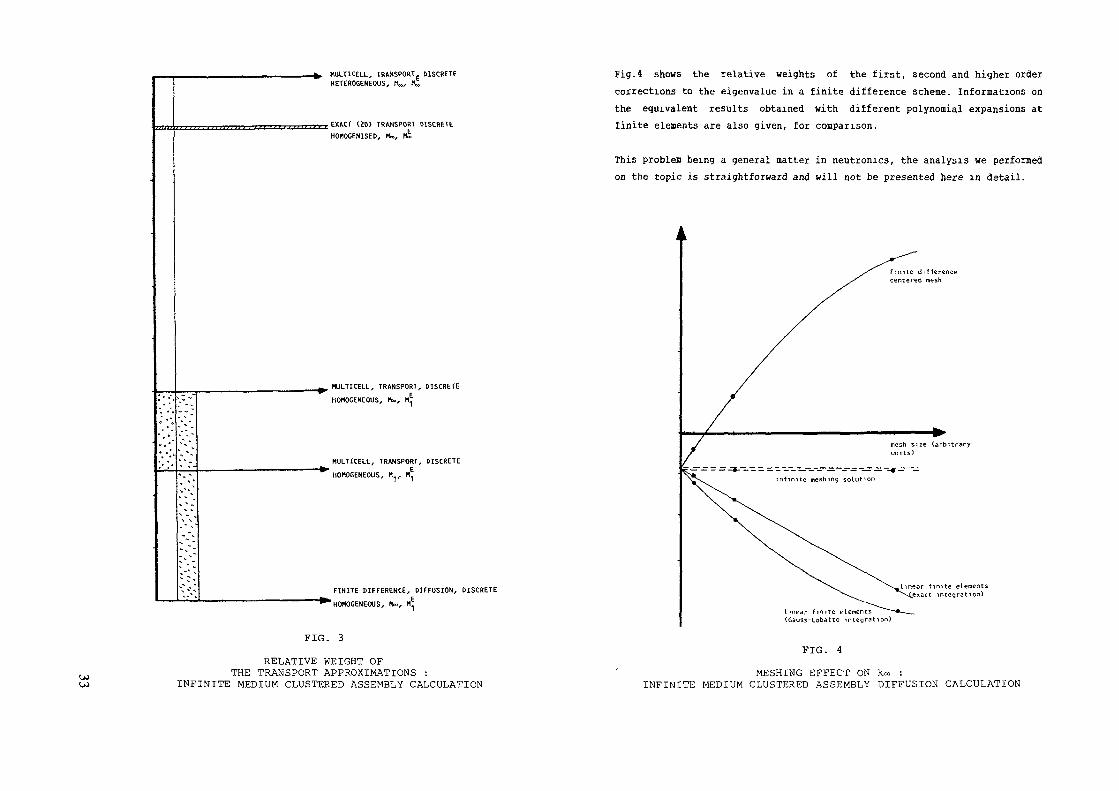
«ULTICELL, TRANSPORT, DISCRETEHETEROGENEOUS, fW 1C,
t EXACT (ZD> TRANSPORT DISCRETE
HOMOGENISED, M«, MÜ
, MULTICELt, TRANSPORT, DISCRETE
HOMOGENEOUS, N», H!J
HULTICEU, TRANSPORT, DISCRETE
' HOMOGENEOUS, M H
FINITE DIFFERENCE, DIFFUSION, DISCRETE
""^HOMOGENEOUS, M*>, n!j
FIG. 3
RELATIVE WEIGHT OFTHE TRANSPORT APPROXIMATIONS :
INFINITE MEDIUM CLUSTERED ASSEMBLY CALCULATION
Fig.4 shows the relative weights of the first, second and higher ordercorrections to the eigenvalue in a finite difference scheme. Informations onthe equivalent results obtained with different polynomial expansions atfinite elements are also given, for comparison.
This problem being a general matter in neutronics, the analysis we performedon the topic is straightforward and will not be presented here in detail.
F i n i t e differencecentered mesh
mesh size (arbitraryunits)
Linear finite elementsjïxact integration)
linear finite elements(Gauss-Lobatto integration)
FIG- 4MESHING EFFECT ON k«. :
INFINITE MEDIUM CLUSTERED ASSEMBLY DIFFUSION CALCULATION
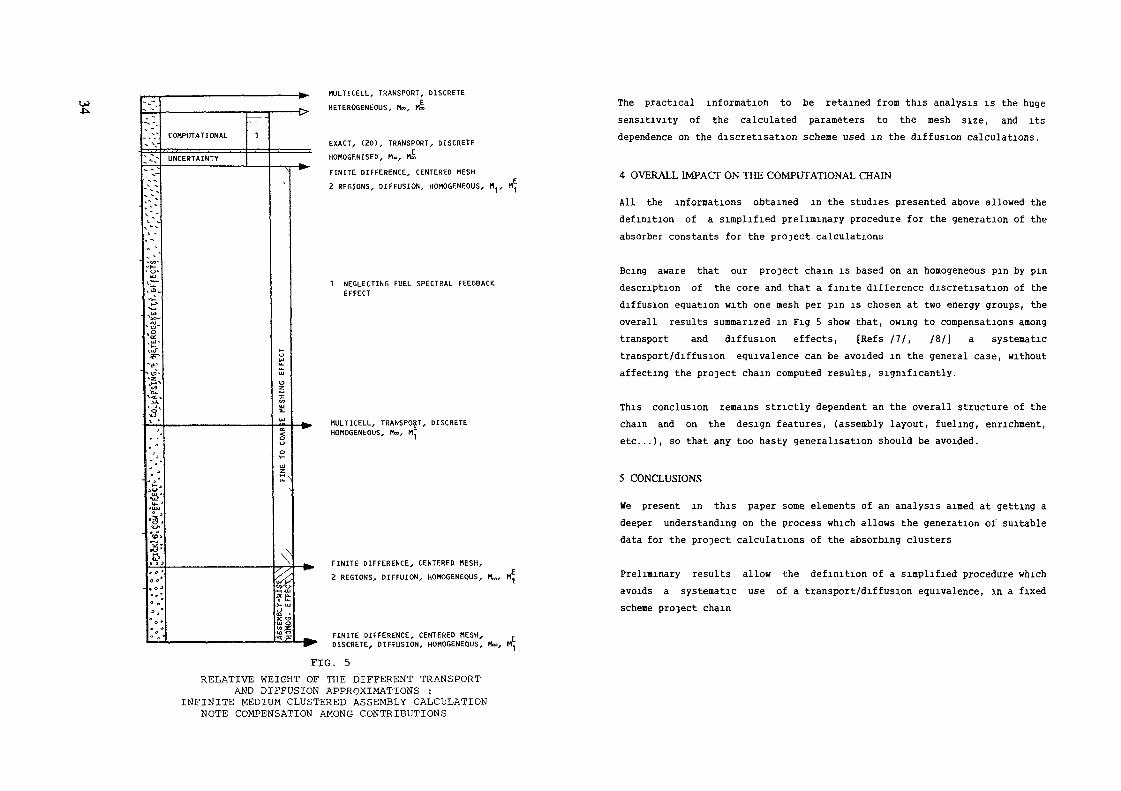
COMPUTATIONAL
UNCERTAINTY
MULTICELL, TRANSPORT, DISCRETE
HETEROGENEOUS, H», M!
EXACT, C2D), TRANSPORT, DISCRETE
HOMOGENISED, M», «£
FINITE DIFFERENCE, CENTERED MESH
2 REGIONS, DIFFUSION, HOMOGENEOUS, M^ M!J
1 NEGLECTING FUEL SPECTRAL FEEDBACKEFFECT
MULTICELL, TRANSPORT, DISCRETEHOMOGENEOUS, M», M.
FINITE DIFFERENCE, CENTERED MESH,2 REGIONS, DIFFUION, HOMOGENEOUS,
FINITE DIFFERENCE, CENTERED MESH,DISCRETE, DIFFUSION, HOMOGENEOUS, H»,
FIG. 5
RELATIVE WEIGHT OF THE DIFFERENT TRANSPORTAND DIFFUSION APPROXIMATIONS :
INFINITE MEDIUM CLUSTERED ASSEMBLY CALCULATIONNOTE COMPENSATION AMONG CONTRIBUTIONS
The practical information to be retained from this analysis is the hugesensitivity of the calculated parameters to the mesh size, and itsdependence on the discretisation scheme used in the diffusion calculations.
4 OVERALL IMPACT ON THE COMPUTATIONAL CHAIN
All the informations obtained in the studies presented above allowed thedefinition of a simplified preliminary procedure for the generation of theabsorber constants for the project calculations
Being aware that our project chain is based on an homogeneous pin by pindescription of the core and that a finite difference discretisation of thediffusion equation with one mesh per pin is chosen at two energy groups, theoverall results summarized in Fig 5 show that, owing to compensations amongtransport and diffusion effects, [Refs /?/, /8/] a systematictransport/diffusion equivalence can be avoided in the general case, withoutaffecting the project chain computed results, significantly.
This conclusion remains strictly dependent an the overall structure of thechain and on the design features, (assembly layout, fueling, enrichment,etc...), so that any too hasty generalisation should be avoided.
5 CONCLUSIONS
We present in this paper some elements of an analysis aimed at getting adeeper understanding on the process which allows the generation of suitabledata for the project calculations of the absorbing clusters
Preliminary results allow the definition of a simplified procedure whichavoids a systematic use of a transport/diffusion equivalence, in a fixedscheme project chain
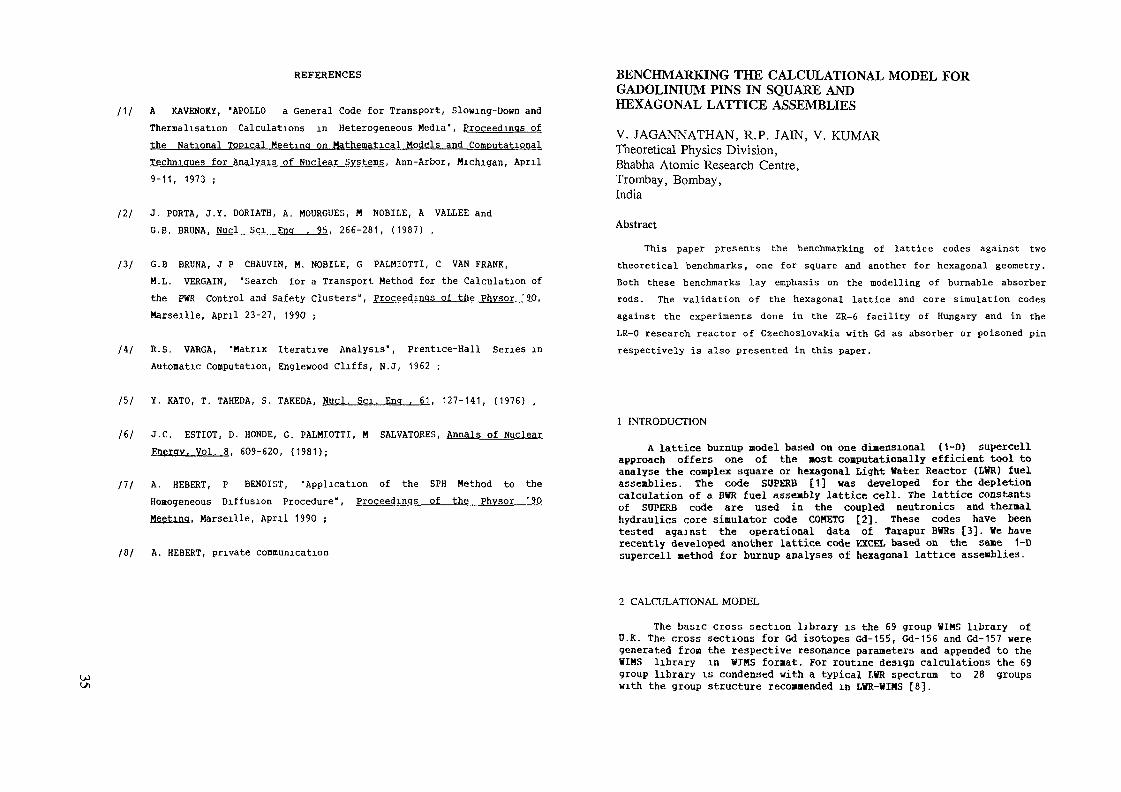
REFERENCES
/!/ A KAVENOKY, "APOLLO a General Code for Transport, Slowing-Down andThermalisation Calculations in Heterogeneous Media", Proceedings ofthe National Topical Meetina on Mathematical Models and ComputationalTechniques for Analysis of Nuclear Systems, Ann-Arbor, Michigan, April9-11, 1973 ;
121 J. PORTA, J.Y. DORIATH, A. MOURGUES, M NOBILE, A VALLEE andG.B. BRUNA, Hucl Sei Eng . 95. 266-281, (1987) ,
/3/ G.B BRUNA, J P CHAUVIN, M. NOBILE, G PALMIOTTI, C VAN FRANK,M.L. VERGAIN, "Search for a Transport Method for the Calculation ofthe PWR Control and Safety Clusters", Proceedings of the Phvsor '90.Marseille, April 23-27, 1990 ;
/4/ R.S. VARGA, "Matrix Iterative Analysis", Prentice-Hall Series inAutomatic Computation, Englewood Cliffs, N.J, 1962 ;
/5/ Y. KATO, T. TAHEDA, S. TAKEDA, Nucl. Sei. Eng . 61. 127-141, (1976) ,
/6/ J.C. ESTIOT, D. HONDE, G. PALMIOTTI, M SALVATORES, Annals of NuclearEnergy. Vol. 8. 609-620, (1981);
HI A. HEBERT, P BENOIST, "Application of the SPH Method to theHonogeneous Diffusion Procedure", Proceedings of the Phvsor '90Meeting. Marseille, April 1990 ;
/8/ A. HEBERT, private communication
BENCHMARKING THE CALCULATIONAL MODEL FORGADOLINIUM PINS IN SQUARE ANDHEXAGONAL LATTICE ASSEMBLIES
V. JAGANNATHAN, R.P. JAIN, V. KUMARTheoretical Physics Division,Bhabha Atomic Research Centre,Trombay, Bombay,India
Abstract
This paper presents the benchmarking of lattice codes against twotheoretical benchmarks, one for square and another for hexagonal geometry.Both these benchmarks lay emphasis on the modelling of burnable absorberrods. The validation of the hexagonal lattice and core simulation codesagainst the experiments done in the ZR-6 facility of Hungary and in theLR-0 research reactor of Czechoslovakia with Gd as absorber or poisoned pinrespectively is also presented in this paper.
1 INTRODUCTION
A lattice burnup nodel based on one dimensional (1-D) supercellapproach offers one of the aost conputationally efficient tool toanalyse the complex square or hexagonal Light Water Reactor (I>WR) fuelasseablies. The code SUPERB [1] was developed for the depletioncalculation of a BWR fuel assembly lattice cell. The lattice constantsof SÜPERB code are used in the coupled neutronics and thernalhydraulics core sinulator code COMETG [2]. These codes have beentested agajnst the operational data of Tarapur BWRs [3]. We haverecently developed another lattice code KXCEL based on the sane 1-Dsupercell nethod for burnup analyses of hexagonal lattice assenblies.
2 CALCULATIONAL MODEL
The bauic cross section library is the 69 group WIMS library ofU.K. The cross sections for Gd isotopes Gd-155, Gd-156 and Gd-157 weregenerated froa the respective resonance parameters and appended to theWIMS library in WTMS format. For routine design calculations the 69group library is condensed with a typical LWR spectrum to 28 groupswith the group structure recowiended in LWR-WIMS [8].
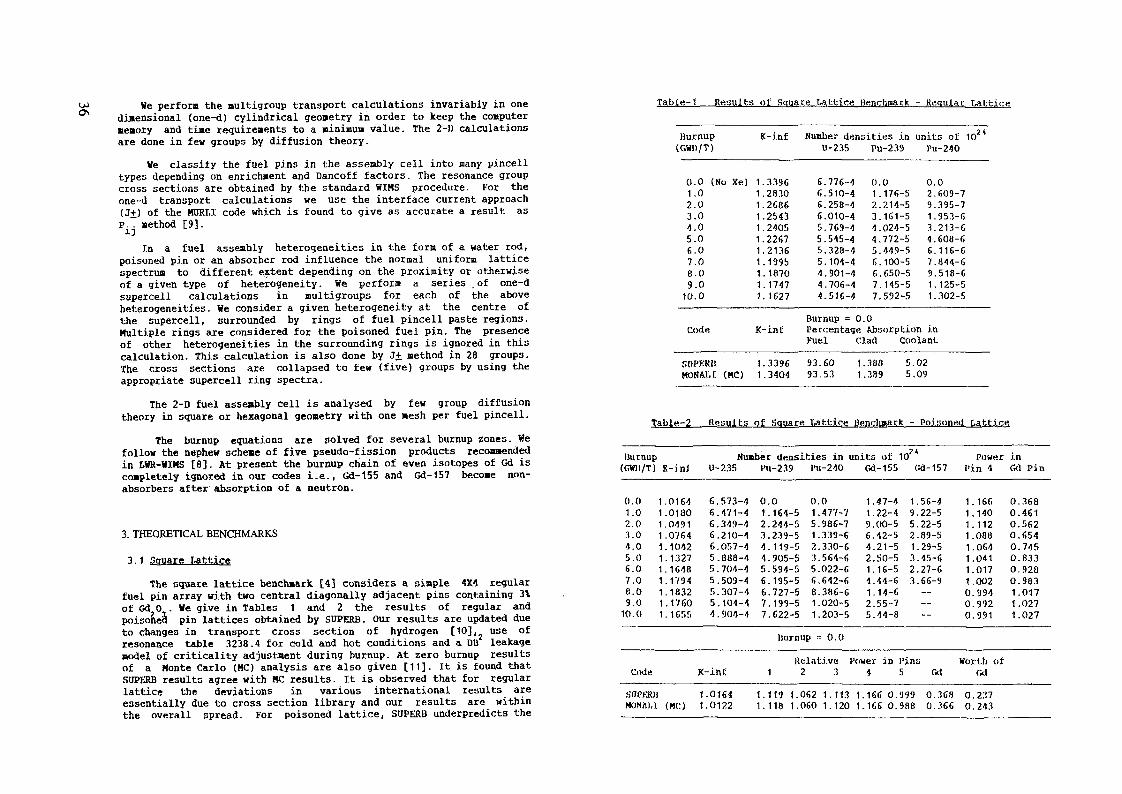
o\ We perfor« the multigroup transport calculations invariably in onedimensional (one-d) cylindrical geometry in order to keep the computermemory and tine requirements to a Bininuia value. The 2-1) calculationsare done in few groups by diffusion theory.
We classify the fuel pins in the assenbly cell into many pincelltypes depending on enrichment and Dancoff factors. The resonance groupcross sections are obtained by the standard WIMS procedure. For theone-d transport calculations we use the interface current approach(J+) of the MURLI code which is found to give as accurate a result asp.. method [9].
In a fuel assembly heterogeneities in the fora of a water rod,poisoned pin or an absorber rod influence the normal uniform latticespectrum to different extent depending on the proximity or otherwiseof a given type of heterogeneity. We perfora a series . of one-dsupercell calculations in nultigroups for each of the aboveheterogeneities. We consider a given heterogeneity at the centre ofthe supercell, surrounded by rings of fuel pincell paste regions.Multiple rings are considered for the poisoned fuel pin. The presenceof other heterogeneities in the surrounding rings is ignored in thiscalculation. This calculation is also done by J± method in 28 groups.The cross sections are collapsed to few (five) groups by using theappropriate oupercell ring spectra.
The 2-D fuel assembly cell is analysed by few group diffusiontheory in square or hexagonal geometry with one mesh per fuel pincell.
The burnup equations are solved for several burnup zones. Wefollow the nephew scheme of five pseudo-fission products recommendedin 1WR-WIMS [8]. At present the burnup chain of even isotopes of Gd iscompletely ignored in our codes i.e., Gd-155 and Gd-157 become non-absorbers after absorption of a neutron.
3. THEORETICAL BENCHMARKS
3.1 Souare LatticeThe square lattice benchmark [4] considers a simple 4X4 regular
fuel pin array with two central diagonally adjacent pins containing 3Xof Gd 0 . We give in Tables 1 and 2 the results of regular andpoisonea pin lattices obtained by SUPERB. Our results are updated dueto changes in transport cross section of hydrogen [10], use ofresonance table 3238.4 for cold and hot conditions and a DU leakagemodel of criticality adjustment during burnup. At zero burnup resultsof a Honte Carlo (MC) analysis are also given [11]. It is found thatSDPERB results agree with HC results. It is observed that for regularlattice the deviations in various international results areessentially due to cross section library and our results are withinthe overall spread. For poisoned lattice, SUPERB underpredicts the
Tabie.-1 Results of Square tottice. Henchnacfc - Régulai: Lattice.
Burnup(GWn/T)
0.0 (No Xe)1.02.03.04.05.06.07.08.09.010.0
Code.
K-inf
1.33961.28301.26061.25431.24051.22671.21361.19951.18701.17471.1627
K-inE
Number den::0-235
6.776-46.510-46.258-46.010-45.769-45.545-45.328-45.104-44.901-44.706-44.516-4
Burnup = 0.Percentage
iities inPu-239
0.01.176-52.214-53.161-54.024-54.772-55.449-56.100-56.650-57.145-57.592-5
.0
units of 10J*)>u-240
0.2.9.1.3.4,67.911.
.0
.609-7
.395-7
.953-6
.213-6
.608-6
.116-6
.844-6
.518-6
.125-5
.302-5
Absorption inFuel Clad coolant
SQPKKliMONAT,! (MC)
1.33961.3404
93.60 193.53 1
. 380 5 .
.389 5..02.09
Table-2 Uesults of Square Lattice Benchmark - Poisoned Lattice.
Burnup(GWJi/T) K-inJ
0.01.02.03.04.05.06.07.08.09.0
10.0
1.01641.01801.04911.07641 . 10421.13271.16481.17941.18321.17601.1655
Number densities in units of 10U-235
6.6.6.66.5r»55.54
,573-4.471-4.349-4.210-4.057-4.888-4. 704-4.509-4. 307-4.104-4.904-4
}>u-239
0.1.2.3.445.667.7
.0
.164-5
.244-5
.239-5
.119-5
.905-5
.594-5
.195-5
.727-5
.199-5
.622-5
llurnup
I'u-240
0.01.477-75.986-71.339-62.330-63.564-65.022-66.642-68.386-61.020-51.203-5
••-- 0.0
Gd-155
1.47-41.22-49.00-56.42-54.21-52.50-51.16-54.44-61.14-62.55-75.44-8
Gd-157
1 ,9,5.21323
.56-4
.22-5
.22-5
.89-5
.29-5
.45-6
.27-6
.66-9———
Power inI'in 4
1.1661.1401.1121.0881.0641.0411.0171.0020.9940.9920.991
Gd Pin
0.3680.4610.5620.6540.7450.8.330.9280.9831.0171.0271.027
Code. K-inl:Relative Power in 1'ins
1 2 3 4 5Worth of
Gd
SCPKRli 1.0164MONAU (MC) 1.0122
1.119 1.062 1.11.3 1.166 0.999 0.368 0.2371.118 1.060 1.120 1.166 0.988 0.366 0.243

a significantof Gd results inabsorption in Gd and hence initially there is
overprediction of K . The lower depletion ratesomewhat closer prediction of K^ at higher burnups.3.2 Hexagonal Lattice
The hexagonal lattice benchmark [5] was analysed by EXCELThe benchmark considers two half pins with about 4 % Gd,°3 in a 60sywietric sector of the fuel assembly type used in WER-1000 MWereactor. For calculations the regular lattice (pincell case), themacrocell with one Gd pin (Supercell case) and the assenbly cell casewere considered separately. The results are presented in Tables 3 to5. The results are found to be generally agreeing with the Finnish andRussian results presented at the IAEA meeting. Our results are updateddue to reasons given above. There are significant differences notedmainly in Gd pin (BA rod) . We give in Tables 4 and 5 the results forBA rod of supercell and asseably cell. It is presumed that thedifference in basic cross sections of Gd is aore responsible for thedeviations .
4. VALIDATION WITH EXPERIMENTS
4.1 ZR-6 ExperimentsIn the ZR-6 facility of Budapest, Hungary, the unifora hexagonal
fuel lattice of 3.6% enriched uranium fuel with pitch of 12.7 ma wasperturbed regularly by replacing the central and every seventh fuelpin fron central pin with either water (K7) or absorber rods(I7,..,H7). The absorber rod contained 0 to 7.5% of Gd0 in Al 0Experimental data were presented at a TCM at IAEA [€].
The supercell model of EXCEL code was used to simulate theaacrocells. We used the modifications in model mentioned above. TheK ff values of zero dinensional diffusion calculations with therieomaended measured bucklings are given in Table 6. The percentagedeviations in the nornalised pin powers of the central macrocell arealso given in Table 6. We see that the K ,- ig over-predicted by about1.1V The pin powers agree within 2V Tne spectral ratios (Np/Ce)representing the ratio of 0-238 captures to total fissions, werecompared for J7 and N7 lattices. They were overpredicted by 8-10% (notincluded in the table).4.2 LR-0 Experiments [7]
In the LR-0 facility of Czechoslovakia, 19 fuel assemblies of thehexagonal WER-440 type reactor constitute the core. In two symmetricassemblies near the central assembly one of the pins is replaced by Gdbearing fuel rods. The Gd 0 content varied from 0.5% to 2.0%. The 2-0energy release profile ?at the mid-plane in about 37 pins of the twosymmetric assemblies were measured twice for five core configurations
Table-3 Itesults of Hexagonal Lattice. Benchmark - Pincall Case
UurnupK-Jnf
MWD/MTO
o00
10002000300040005000
.4569
.3686
.32288
.30539
.29092
.27785
.26542
.252876000 1.240997500 1 . 2233610000 1.1959415000 1.1470920000 1 . 10507
Number densities in units of 102*0-235 Pu-239 J'u-240 Pu-241
(Cold no Xe)(Dot no Xe.)9.0 -48.744-48.491-48.252-48.020-47.79-1-47.574-47.255-46.748-4f.. 822- 44.999-4
0.01.104-52.139-53.070-53.930-54.726-55.465-56.474-57.937-51.020-41.180-4
0.01.883-77.045-71.449-62.378-63.452-64.630-66.557-61.004-51 . 749-52.498-5
08614712381
.0
.421-9,403-8.952-7,202-7.486-7.180-6.019-6.857-6.747-6.447-5
Table-4 «esults of Hexauonal r-attice Benchmark - Suuercell Case
BurnupMWD/MTO
K« For Supercell j luotopic dem; i tiesNumber densities in
K-.xni 0-235
for DA rodunits of 10?A
l>u-239 J'u-240 l'u-241 Gd-155 Gd-157000
10002000.10004000500060007500100001500020000
1 . 34541.24631 . 208581 .205611.203431.2O1681.199931.1 -ma1.195981.193001.184801.142411.10051
(Cold no(Hot no4.33.3.3.33,33,22
.000-4
.951-4
.893-4
.831-4
.763-4
.690-4
.612-4
.483-4
. 253-4
.790-4
.371-4
Xe)Xe)0,112345£711
.0
.009-5
.999-5
.938-5
.814-5
.639-5
.412-5
.488-5
.964-5
.009-4
.157-4
0.09.884-84.073-79.177-71 . 623-62.516-63.590-65.621-69.712-61.876-52.734-5
04312471271
.0
.189-9
.476-8
.155-7
.568-7
.794-7
.875-7
.397-6
.812-6
.041-6
.274-5
1111864253-
.920-4
.646-4
. 346-4
.080-4
.571-5
.508-5
. 722-5
.630-5
.772-6
.715-8-
2.030-41.352-49.40O-56.475-54.408-52.72.V51 . 490-54.279-63.1 77-«——
(unperturbed and perturbed with the above Gd pins). The Bean of thefour measured data for a given pin was obtained. Experimental datawere presented at a RCM at IAEA.
For calculations we used EXCEL code to obtain five group crosssections of different pincell types, water rods, poisoned pins,channel and water gap regions and reflector by appropriate supercellcalculations. These five group cross sections were then used in a

U>00
Table-5 Results oi: Hexagonal lattice Benclmark - Assembly Ceil Case
K- Kor Assembly cell j Isotopic densities for DA rod
Table-7 TJ3.Q Experiments Power distribution comparison
ßurnup«Wll/MTO
000
1000200030004000500060007500100001500020000
K-inJ
1.41141.31821.275661.263671.254181 . 245701.236761.228421 . 220631.208671.1891Ï>1.1 43781.10196
U-235(Cold no(Hot no43333333
.000-4
.952-4
.896-4
.834-4
.767-4
.694-4
.618-4
.496-43.277-422.818-4. 397-4
Number densitiesPu-239 I'u-240
in unitsI'u-241
ot 10?<Gd-155 Gd-157
Xe}Xe)09123456711
.0
.884-6
.977-5
.910-5
.807-5
.652-5
.420-5
.466-5
.942-5
.011-4
.159-4
0.09.323-83.921-78.871-71.582-62.467-63.497-65.328-69.008-61.746-52.579-5
0.33,1248.1371
.0
.910-9
.349-8
.125-7
.608-7
.986-7
.193-7
.474-6
.O09-6
.535-6
.320-5
1.1,1.1.8.6.4.
920-4660-4365-4102-4769-5669-5902-5
2.862-57.5.—
281-6684-8
2 . 030-41.376-49.629-56.700-54.574-52.841-51 . 600-55.173-6G. 939-11——
Tabifi-6 Kesull« ot ZR-6 Xxoeriaentu wilh Gd203 Absorber Rod»
Lait j ce \type Gd? 03
K7Cl.17K7L7«7N7
_-
0.00.21.02.05.07.5
K-.int
1.425461.422521.398641.379951.374681.368851.36610
en
41.1341.5641.3641.2441.2141.1241.09
K-elJ l'in \ Déviation in Relative l'in TowersLocation 17 .17 K7 1,7 M7 N7
1.00241.00631.00901.00521.00471 .00911.0108
*
2345678
-0.10-0.42-0.410.19
-0.14-0.030.51
1.060.66
-0.700.15
-0.59-0.18-0.20
0.810.27
-0.850.97
-0.780.140.17
0.800.00
-0.750.17
-0.24-0.170.00
-0.21-0.24-0.37-0.39
1.11-0.29-0.44
2.010.85
-0.900.03
-0.54-0.73-0.45
UicTcition oi water rod or absorber rod
hexagonal finite difference diffusion code TRIBEX-3D [12]. In the corecalculation we represented each individual fuel pincell region andother heterogeneities explicitly. Reflector thickness equivalent toone additional fuel assembly layer was considered. Axial buckling wasadjusted such that the reactor was nearly critical, fig.1 gives therelative pin locations within a fuel assembly which are referred to inthe following table. Percentage deviations in relative pin powers forthe measured locations after normalising at the measured peak(location 1012) are given in Table 7. For the poisoned pin cases thepin powers relative to no Gd case were obtained and deviations inthese are also given in Table 7. He see that Gd pin powers arepredicted within 2\. The maximum pin power deviation is about 6\. Ther .m.s . error is about 3V
I,ocationo£
S. No. measuredPin
123456789
1011121314151617181920212223242526272829303132333435363738
r .».:;.
10111012101910221026102710281033103610371038103910441047104810491050106010611062106710711072107310741083108410851086109110941095109611011106110911151116—
MO CdA
1.30.0
-2.10.4—
-1.9-4 10.91.5
-2.1-4.2-5.90.93.5
-1.2-3.4-6.1
1.3-2.8-5.5-0.13.2
-2.2-3.5-5.62.7
-1.1-3.6-5.7-1.72.9
-0.9-1.60.1
-1.4-1.91.10.8
2.96
Percentage Deviation in Relative Pjn PowersTwo Gtl Pins with 6d203 Content of
A H A B A B A B
0.00.0
-2.5-0.5
1.6-0.2-3.70.22.2
-2.1-3.7-6.3
1.33.00.9
-3.5-6.43.0
-0.2-3.2-1.2
4.90.3
-2.7-6.63.8
-1.6-3.6-!î. 3-2.8
2.6-1.8-3.3-1.7-2.2-1.1-0.2-0.83.00
-1.20.0
-0.4-0.9
—1.70.4
-0.60.70.00.6
-0.50.4
-0.52.1
-0.1-0.3
1.72.72.5
-1.11.72. f.0.8
-1.01.1
-0.40.00.4
-1-1-0.4-1.0-1.7-1.8-o.a0.8
-1.3-1.61.22
0.70.0
-2.5-1.7-0.5-1.4-3.80,52.4
-1.0-4.7-5.3-1.1
3.31.3
-2.8-5.93.2
-0.6-4.4-1.34.60.4
-2.2-6.1
3.4-0.5-3.9-5.5-2.12.4
-1.1-2.7-1.7-1.7-1.2
1.00.2
2.88
-0.60.0
-0.3-2.1
—0.50.3
-0.30.91.1
-0.50.6
-2.0-0.22.50.60.31.82.31.1
-1.21.42.61.3
-0.40.70.6
-0.40.3
-0.5-0.6-0.3-1.2-1.8-0.30.7
-0.1-0.61.15
2.00.0
-2.6-0.4
1.8-2.2-3.5-2.62.2
-0.9-4.1-6.80.82.21.1
-2.4-6.5
5.8-2.0-5.2-2.9
4.61.6
-2.6-6.04.1
-2.0-4.8-5.3-3.3
1.0-1.6-2.6-0.9-2.5-2.40.0
-0.93.30
0.70.0
-0.5-0.8
—-0.30 6
-3.40.71.30.2
-1.0-0.1-1.3
2.41.0
-0.44.50.90.4
-2.81.43.90.9
-0.41.4
-0.9-1.30.5
-1.7-1.9-0.8-1.0-1.0-1.1-0.5-1.1-1.71.55
0.30.0
-2.2-0.6
1.8-0.8-3.80.62.9
-0 . 3-3.7-6.3
1.04.03.4
-2.9-5.64.11.3
-3.1-1.05.41.8
-1.5-4.53.2
-1.3-2.7-5.6-2.03.1
-0.4-0.6-1.0-0.8-1.2
1.41.1
2.84
-1.0.
-0.-1.
—1.0.
-0.1.1.0.
-0.0.0.4.0.0.2.4.2.
-0.2.
0011
13249651575572691
4.02.1.0.
-0.0.0.
-0.0.0.1.
-1.0.0.0.0.
02S292415016723
1.64
A - MaxJBiira pin power noraalised with measured value£i - Deviations of Pin powers relative to no Gd case
- Gd pin 3oc.at.ion

1120 1121 1122 112i 1174 1125 1126 1061 - Gd Pin1112 1113 1114 1115 1116 1117 1118 1119
1103 1104 110e; 1106 1107 1108 1109 1110 11111091 1094 1095 1096 1097 1098 1099 1100 1101 1102ioa? io«3 UHU loss ioae 1007 1000 1009 1090 1091 1092
1070 1071 10V2 107) 1074 1075 1076 1077 1078 1079 1080 1081ns 10r>'l 1060 1061 1062 1063 0 1064 1065 1066 1067 1068 10691046 1047 104« 1049 1050 1051 1052 1051 1054 1055 1056 1057
1015 1036 1037 1038 1039 1040 1041 1042 1043 1044 10451075 1026 1027 1028 1029 1030 1031 1032 1033 1034
1016 1017 1018 1019 1020 1021 1022 1023 10241008 1009 1010 1011 1012 1013 1014 1015
1001 1002 1003 1004 1005 1006 1007
FIG 1 Location of pins in a LR-0 reactor fuel assembly.
5 CONCLUSIONSThe lattice codes SÖPERB and EXCEL and the hexagonal core
analyses code TRIHEX-3D have been used to analyse two theoreticalbenchmarks and 7.R-6 and LR-0 experimental data on Gd as absorber orburnable absorber rod. It is found that our modelling in our latticecodes are resonably good to predict the zero burnup K^ and powerdistributions. With burnup there is still some discrepancy "which naybe attributed to the Gd cross section data used.
ACKNOWLEDGEMENTS
The authors are grateful to Dr.I.Vidovszky, and Dr.J.Gado ofCRIP, Hungary and Dr.J.Bardos, NRI, Czechoslovakia for furnishing theexperimental data. We are grateful to Dr.B.C.Gupta for providing theMonte Carlo results of square lattice benchmark.
REFERENCES
1. V.Jagannathan et al., Annals of Nuclear Energy, 7, 641 (1980)2. S.R.Dwivedi et al. Report B.A.R.C.-864. (1975)3. V.Jagannathan et al., Annals of Nuclear Energy, JO, 339. (1983)4. C.Maeder and P.Wydler, Report BEACRP-A-567. (1983)5. V.D.Siderenko, 'Test Problem for Calculating Reactor Lattices With
Gadolinium Hearing Fuel Pins', TIC internal material. (1988)6 l.Vidovzoky and J.Gazso, 'Experimental Investigations of WER-Type
Lattices Containing Gd Absorber Rods', Presented at the IAEA Tech.COB». Mtg. on Incore Fuel Management, Vienna, Dec 4-7, 1989
7. J.Bardos et al., 'Burnable Absorbers in WER-Type Fuel Lattices',presented at the IAEA Research Coor. Mtg. on 'Safe Core Managementwith Burnable Absorbers in WERs', Vienna, Dec. 11-14, 1989.
8. K.J.Fayers et al., Report AEEW-R-785. (1972)9. P.Mohanakrishnan and H.C.Huria, Nucl. Sei. Kngg., 6j|, p.220. (1978)10. Vinod Kumar and R.D.S.Yadav, private communication. (1990)11. H.C Gupta, B.A.R.C. Report, under preparation. (1990)12. V.Jagannathan and R.P.Jain, Report B.A.R.C.-1515. (1990)

THE APOLLO-I ASSEMBLY SPECTRUM CODE
G. MATHONNIÈRE, Z. STANKOVSKIDirection des réacteurs nucléaires,Département de mécanique et de technologie,Commissariat à l'énergie atomique,Centre d'études nucléaires de Saclay,Gif-sur-Yvette, France
Abstract
APOLLO-I is a general purpose assembly spectrum code, theonly used by the Commissariat à l' Energie Atomique (CEA) and bythe french utility Electricité de France (EOF) for PWR's calcula-tions. It is also used by the french manufacturer FRAMATOME forreference calculations and, of course, in CEA for development ofnew reactors and to analize experimental results.
As its development begun as soon as in 1970, the code and itsassociated external cross section library, called APOLIB, has beenwidely tested and qualified, by comparison with experimentalresults coming from test facilities or EDF's PWRs.
Many studies have been carried out with APOLLO-I as differentas reference calculations for PWR using MOX assemblies, orbenchmark calculations on fuel dissolver.
The APOLLO-I assembly spectrum code is currently run at the IBM and
CRAY computers, and can be easily installed on workstations.
The APOLLO-I code has been widely described in internationalpublications and specially in [1] a very detailed presentation of the codeformalism has been presented.
So, in the present paper we will be satisfied with giving in brief themain capabilities and features of the code.
Library. The standard 99 groups APOLIB library contains multigroup
cross section data for over 400 isotopes and also pretabulated effectivereaction rates used in the frame of selfshielding calculations. This library
is continously improved through modifications in the basic data files and
through experimental results taken into account owing to the "search oftendancies" [21.
Selfshielding. For isotopes with epithermal resonances, the
selfshielding is performed, according Livolant-Jeanpierre theory [3], andusing pretabulated reaction rates of the library.
Flux calculations. APOLLO is based on the resolution of the multigroup
integral transport equation by the collision probability method. The choice
among the various possibilities offered by the code is rather large: it ispossible to deal with one and two-dimension geometries, to take into accountan isotropic or a linearly anisotropic scattering, to treat a doubleheterogenity (media containing a dispersion of grains).
Furthermore it is possible to select either modules based on a rigorous
discretisation of the integral transport equation, or modules using physical
approximation to simplify calculations. The first ones are used forreference calculation, the seconds for route calculation.
Leakage. The diffusion coefficient and the material buckling arecalculated in an equivalent flux-homogenized infinite medium. It is alsopossible to perform a streaming correction based on Benoist's theory [41.
Depletion calculations. The variation of the isotopic compositions inthe various media is taken into account as a function of the burn-up, stepsbeing chosen by the user.
Post processing capabilities. APOLLO-I computes reaction rates andaverage cross sections for any isotope and any spatial region or energymesh; but it is also able to generate a set of cross sections either in theAPOLIB or NEPLIB formats. The APOLIB library is created in order to
homogenize isotopes in space and/or energy, which can be used for otherAPOLLO transport calculations. The cross sections are created by using theSPH process [5], which allows to generate the same reactions rates as theoriginal calculation.
For the NEPLIB libraries it is exactly the same, but these crosssections are destinated to be used in a diffusion calculation code likeCRONOS. The NEPLIB structure, whose one parameter is the burnup, is suitable
for dealing with water density and temperatures feedback, which are veryimportant for PWRs [6].
For creating a multiparameter (for exemple burn-up, fuel temperature,water density, xenon concentration, boron concentration ) tabulated
NEPLIB, a specific feature, the GENALIB module may be used [7] It allows to
generate the full NEPLIB by executing only one job The process is thefollowing firstly basic calculations are performed, at the first and laststep a full grid comprising all the parameters combinations is calculated,
but for the other steps only the nominal combination is calculated Secondly
the full NEPLIB is got by using a factorisation hypothesis allowing tocalculate the full grid for each step from the basic calculations
Examples Apart from its utilisation as a mam step of a routine code
route for PWR's calculations, its versatility and its accuracy allows todeal with many various physical problems
For instance it was widely used for neutromc investigations of anadvanced pressurised water reactor with spectral shift made in CEA [8]
It was also used to determine the influence on the power peaking factorby using different isotopic compositions for various pins of the same MOXassembly 19]
As a last example, it is possible to quote a recent study devoted tothe fuel cycle and to the difficult dissolver calculation problem [10)
CONCLUSIONS
The great versatility of the APOLLO-I assembly spectrum code, theimportance and the accuracy of its associated library, the qualification ofits formalism allow to deal successfully with many various difficultphysical problems, but also to be a very precious step in a routine coderoute
REFERENCES
A. Kavenoky, R SanchezThe Apollo assembly spectrum codeANS International Topical Meeting on Advances m Reactor Physics,Mathematics and Computations, Paris, April 27-30, 1987
H. Telher and al.Joint Evaluated File Qualification for Thermal Neutron ReactorsANS Saratoga Springs September 11-14, 1986
10
M. Livolant, F JeanpierreAutoprotection des resonances dans les reacteurs nucléairesApplication aux isotopes lourdsRapport CEA-R 4533
P BenoistTheorie du coefficient de diffusion des neutrons dans un reseaucomportant des cavitésRapport CEA-R 2278A. KavenokyThe SPH Homogenization MethodIAEA Technical Meeting on Homogenization Methods in Reactor Physics,J. Krebs and alCalculational Methods for PWRthis Meeting
V Brun and al.Reactor Calculation Multigroup Parametred LibrariesThis MeetingJ Bergeron, R LenamInvestigation of an Advanced Reactor with Plutonium Fuel Controlledwithout Soluble BoronANS International Reactor Physics Conference, Jackson Hole, Septembre18-22, 1988
G. Mathonniere, M. RohartInfluence on the Power Peak of Different Plutonium IsotopicCompositions in PWR MOX Fuel AssembliesAIEA Technical Commitee on Recycling of Plutonium and Uranium in waterreactor fuels, Cadarache, Novembre 13-16, 1989
A. Santamarina and alNEACRP standard problem exercise on criticahty codes for dissolvingfissile oxides in acides, A reference method for treating the fueldouble heterogeneityPHYSOR International Conference on the Physics of Reactors, Marseille,April 23-27, 1990

to CRONOS: A MODULAR COMPUTATIONAL SYSTEMFOR NEUTRONIC CORE CALCULATIONS
J.J. LAUTARD, S. LOUBIÈRE, C. FEDON-MAGNAUDDirection des réacteurs nucléaires,Département de mécanique et de technologie,Commissariat à l'énergie atomique,Centre d'études nucléaires de Saclay,Gif-sur-Yvette, France
Abstract
The CRONOS code has been designed to provide all the computationalmeans needed for Pressurized Water Reactor calculations, including design,fuel management, follow up and accidents. CRONOS allows steady state,kinetic and transient multigroup calculations of power distribution takinginto account the thermal-hydraulic feedback effects. All this can be donewithout any limitation on any parameter (energy groups, meshes...).
The code solves either the diffusion equation or the even paritytransport equation with isotropic scattering and sources. Different geome-tries are available such as 1. 2 or 3 dimensions cartesian geometries, 2 or3D hexagonal geometries and cylindrical geometries. The numerical method isbased on the finite difference or finite element methods.
CRONOS 2 has been written with the constant will of optimizing itsportability. Presently It is running on very different computers such asIBM 3090, CRAY 1, CRAY 2, SUN 4, MIPS RS2030 or IBM RS5OOO. A special datastructure Is used in order to improve vectorization.
CRONOS is based on a modular structure thas allows a great flexibilityof use. It is implemented in the SAPHYR system which includes assemblycalculation code (APOLLO 111), and thermal-hydraulic core calculation code(FLICA IV [2]). A special object oriented language, named GIBIANE, and acommon tool library have been developed to chain the various computationmodules of those codes.
1) Cross section representation
The cross sections used come from a group collapse of a two dimensionaltransport calculation of an assembly in an infinite medium using the APOLLOcode in a 99 energy group representation. We have to apply a transport/dif-fusion equivalence to those cross sections. To do so we modify the libraryso that the reaction rates in each cell In diffusion theory is equal to thesame reaction rate in the transport theory.
The library is tabulated by depletion parameters such as burnup orfluence, by thermal-hydraulic ones - water density, fuel temperature - or
even by some characteristic isotope concentrations such as Xenon,Boron or any parameters wished by user. In CRONOS the parameters are storedplane by plane and isotope by isotope, because of the great number of theirvalues. A memory management system is used, so that at any time of theprocess no more than one plane of the parameters is loaded In the centralmemory. The calculation either of the macroscopic cross sections or theisotopic concentration evolution are vectorized by working on all the cellscontaining the same medium, at a time.
Regarding homogeneous calculation the cross sections used are comingfrom the homogeneization of heterogeneous ones with the transport fluxresulting from the transport assembly code (APOLLO). The homogeneouscalculation can be dramatically unproved if we use not only constantparameters and isotopic concentrations in each homogeneized medium but alsopolynomial space dependent ones. This case induces polynomial space depen-dent cross sections [31. The CRONOS code allows to use polynomials up toorder 2 in each direction.
2) Weak formulations
2.1 Diffusion calculation (primal form) [4]
Let us consider the simplified one group source problem :
- V D V * + 2 * = f ( r e Q )
with the boundary condition : * = 0 on r9$D -=— •»• j- * = 0 on ron 2
(1)
(2)(3)
The weak formulation can be obtained by multiplying the two members ofequation (1) by any fonction * belonging to the well-known Sobolev space H1
and by integrating the result over a
withat»,*) = ft*)
a(*,*) = f (D V*.VqJo
V * e H
f r * *Jr
f(*) -J r .JQ
(4)
2.2 Transport calculation (primal form) [5]
On each energy group assuming isotropic scattering processes we have :
+ 2 f =S « + Q (5)
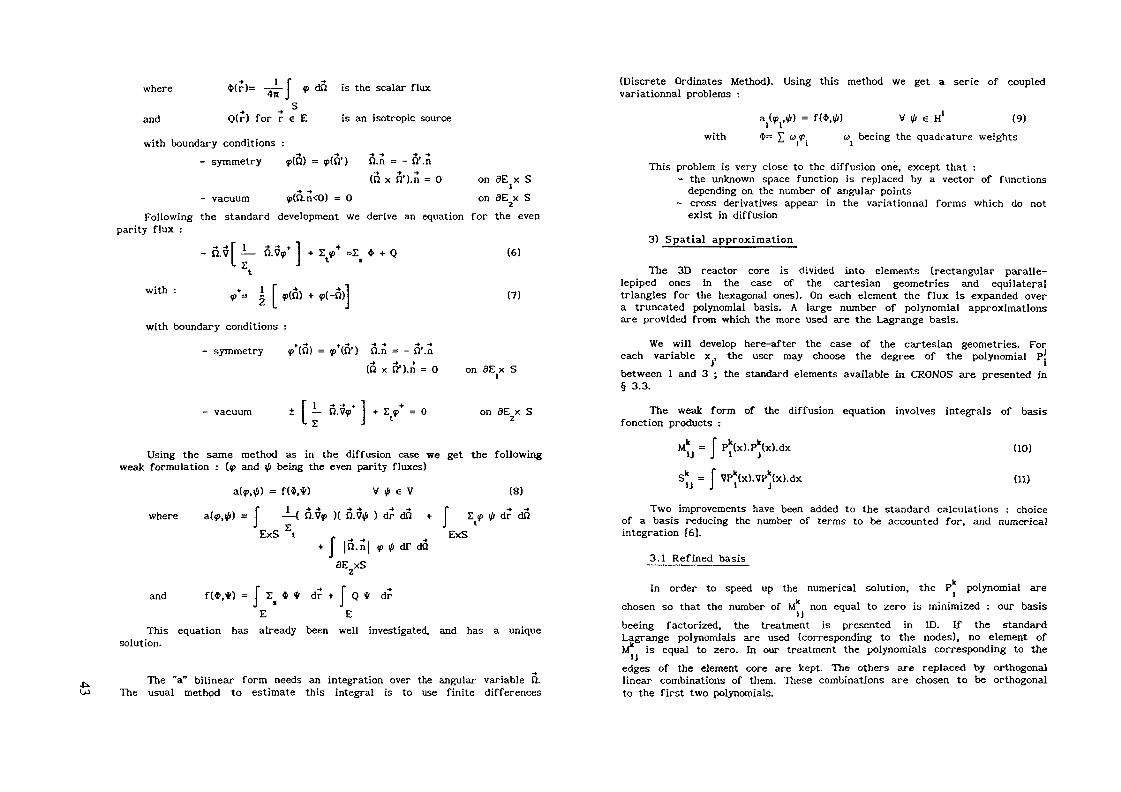
where *(r)r)= —j— I f an is the scalar flux
and Q(r) for r € E is an Isotropie source
with boundary conditions :- symmetry
- vacuum
= <p(ff) fi.n = - fi'.n(n x 5').n = 0
n<0) = 0on 3E x Son 3E x S
Following the standard development we derive an equation for the evenparity flux :
„ _r i - ^ » I +- f} VI —— Q Va> I + £ a =2
L £ J «•* + Q
with : »>=
with boundary conditions :+ -» +-* -» -» - * - »
- symmetry <p (Qi = <p (Q') ß.n = - ß'.n(ß x Q').n = O
- vacuum ± I — n.v 1 + zy1" = o
(6)
(7)
on 3E x S
on 3E x S
Using the same method as in the diffusion case we get the followingweak formulation : (<p and if being the even parity fluxes)
V 0 e V
dû
a(p(#) = f(4,*)
where a(y,0) = j —( Q.V(p )( ß.V0 ) dr dQ + | 5; p
+ f |n.n| <p 0 dr daExS
(8)
dr dQExS
and t.*) = f Z « * dr + [ Q * dr
This equation has already been well investigated, and has a uniquesolution.
The "a" bilinear form needs an integration over the angular variable 0.The usual method to estimate this integral is to use finite differences
(Discrete Ordinates Method). Using this method we get a série of coupledvariationnal problems :
with
a (y ,0) =
*= E "^j
e H' (9)u beeing the quadrature weights
This problem is very close to the diffusion one, except that :- the unknown space function is replaced by a vector of functions
depending on the number of angular points- cross derivatives appear in the variationnal forms which do not
exist in diffusion
3) Spatial approximation
The 3D reactor core is divided into elements (rectangular paralle-lepiped ones in the case of the cartesian geometries and equilateraltriangles for the hexagonal ones). On each element the flux is expanded overa truncated polynomial basis. A large number of polynomial approximationsare provided from which the more used are the Lagrange basis.
We will develop here-after the case of the cartesian geometries. Foreach variable x, the user may choose the degree of the polynomial P:between 1 and 3 ; the standard elements available in CRONOS are presented in§ 3.3.
The weak form of the diffusion equation involves integrals of basisfonction products :
MÏJ =
SÎJ =
(10)
(11)
Two improvements have been added to the standard calculations : choiceof a basis reducing the number of terms to be accounted for, and numericalintegration 16].
3.1 Refined basis
In order to speed up the numerical solution, the P polynomial arechosen so that the number of M non equal to zero is minimized : our basisbeeing factorized, the treatment is presented in ID. If the standardLagrange polynomials are used (corresponding to the nodes), no element ofM" is equal to zero. In our treatment the polynomials corresponding to theedges of the element core are kept. The others are replaced by orthogonallinear combinations of them. These combinations are chosen to be orthogonalto the first two polynomials.
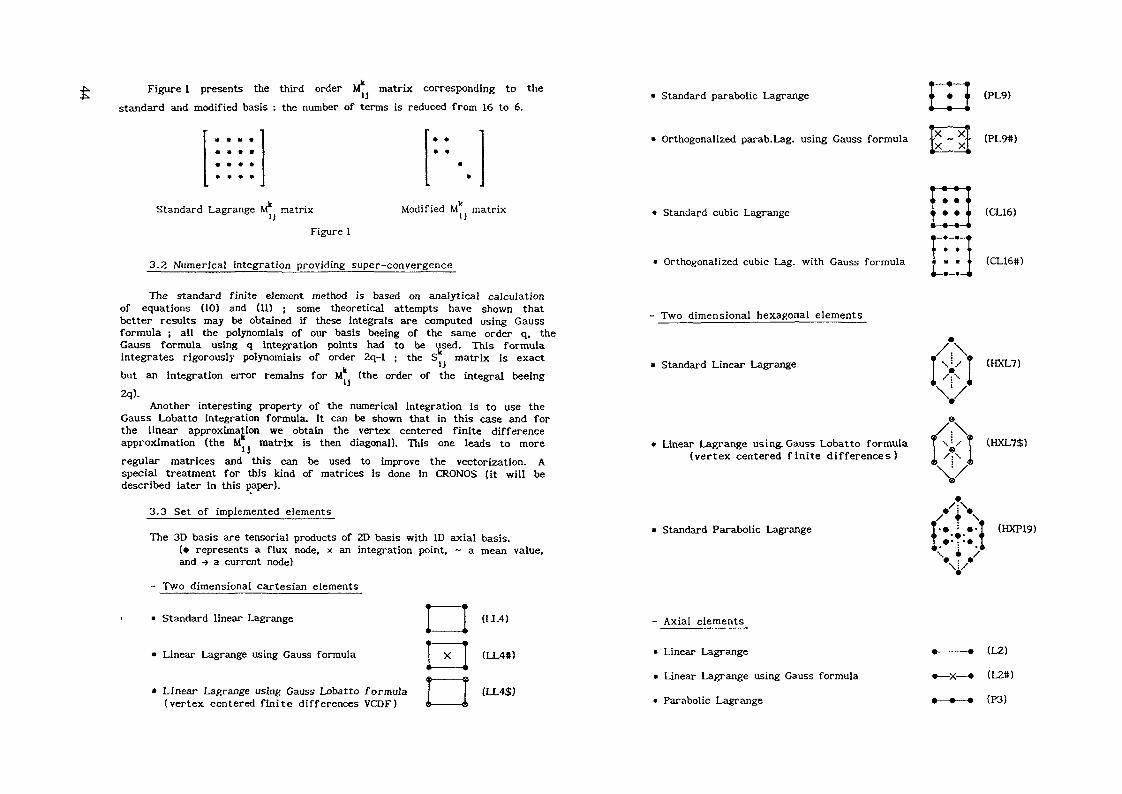
Figure 1 presents the third order KT matrix corresponding to thestandard and modified basis : the number of terms is reduced from 16 to 6.
Standard Lagrange M^ matrix Modified M matrix
Figure 1
3.2 Numerical integration providing super-convergence
The standard finite element method is based on anaiytical calculationof equations (10) and (11) ; some theoretical attempts have shown thatbetter results may be obtained if these Integrals are computed using Gaussformula ; all the polynomials of our basis beeing of the same order q, theGauss formula using q Integration points had to be used. This formulaintegrates rigorously polynomials of order 2q-l ; the S matrix is exactbut an integration error remains for M (the order of the integral beeing2q).
Another interesting property of the numerical integration is to use theGauss Lobatto integration formula. It can be shown that in this case and forthe linear approximation we obtain the vertex centered finite differenceapproximation (the M~ matrix is then diagonal). This one leads to moreregular matrices and this can be used to improve the vectorization. Aspecial treatment for this kind of matrices Is done in CRONOS (it will bedescribed later in this paper).
3.3 Set of implemented elements
The 3D basis are tensorial products of 2D basis with ID axial basis.(• represents a flux node, x an integration point, ~ a mean value,and -> a current node)
- Two dimensional cartesian elements
• Standard linear Lagrange
* Linear Lagrange using Gauss formula
» Linear Lagrange using Gauss Lobatto formula(vertex centered finite differences VCDF)
Standard parabolic Lagrange
• Orthogonalized parab.Lag. using Gauss formula
* Standard cubic Lagrange
» Orthogonalized cubic Lag. with Gauss formula
- Two dimensional hexagonal elements
• Standard Linear Lagrange
(PL9)
(PL9t)
(CL16)
- (CL16S)
(HXL7)
• Linear Lagrange using. Gauss Lobatto formula T \\s T (HXL7$)(vertex centered f in i te differences) I /:\
» Standard Parabolic Lagrange (HXP19)
- Axial elements
» Linear Lagrange
» Linear Lagrange using Gauss formula
* Parabolic Lagrange

4) Mixed-dual approximation of diffusion calculation
Mixed diffusion approximations have been recently applied to thediffusion equations [71. This method is based on a numerical approximationof the equation that links fluxes and currents. Two kinds of approximationscan be considered .
The first one is a mixed primal approximation which needs a fluxcontinuity at the element boundary (currents can be discontinuous). It canbe shown that this approximation is equivalent to the classical primal one.So it is of no interest.
The second method is the mixed dual approximation. In this case theflux can be discontinuous and the current has to be partly continuous at theelement boundaries. This method is quite interesting, it presents somerelations with the nodal methods 181. Moreover the numerical integration ofthe linear current approximation leads to the classical mesh centered finitedifference method (MCDF).
4.1 Method
The mixed dual variational formulation can be written as follows :
Find (p.u) 6 HO r (dlv.n) X L (n) so that'
(12) J -5 P-q + V.q u = 0
- 7.p v + S u v = TJo Je
t v
V q 6 HQ r (div.Q)' i
V v e L (Q)
with H _ (div.fl) = j q e H (div.n) j q.iî = 0 on r l
This problem has a unique solution which is (DVu.u), where u is asolution of the initial source diffusion problem.
4.2 Finite element approximation
The spaces H „ (div.ß) and LZ(n) are' l
dimensional spaces:
approximated by finite
, (div.n) V K ç T
v e L (Q)h
Vhl e PKh|K K
built on a triangulation, T . P., and Q„ being polynomial spaces.h lv &Usually Q„ and PK are Raviart and Thomas spaces :
Q„ = P x PK m+l,m iP - Pv —K. m,m m beeing a given integer.
4.3 Set of implemented elements
Flux
- First order elements
With G&UBI Lobitto formula
- Second order element
Current
p = p*K o.oO — P »PQK Fi,o * cu
P = PK o.o0,. = P x P
N 1 ,0 0,1
~
~
"t-
<-
4*
c =4.
Standard Linear
Mesh centered FD
PK=Pu Standard Parabolic
5) Numerical resolution
The element discretization leads to large 3D matrices. Due to thespecial choice of the finite element basis (tensorial product of 2D and IDbasis) the 3D matrix has a block symétrie structure in each energy group.Each block represents coupling terms between plans.
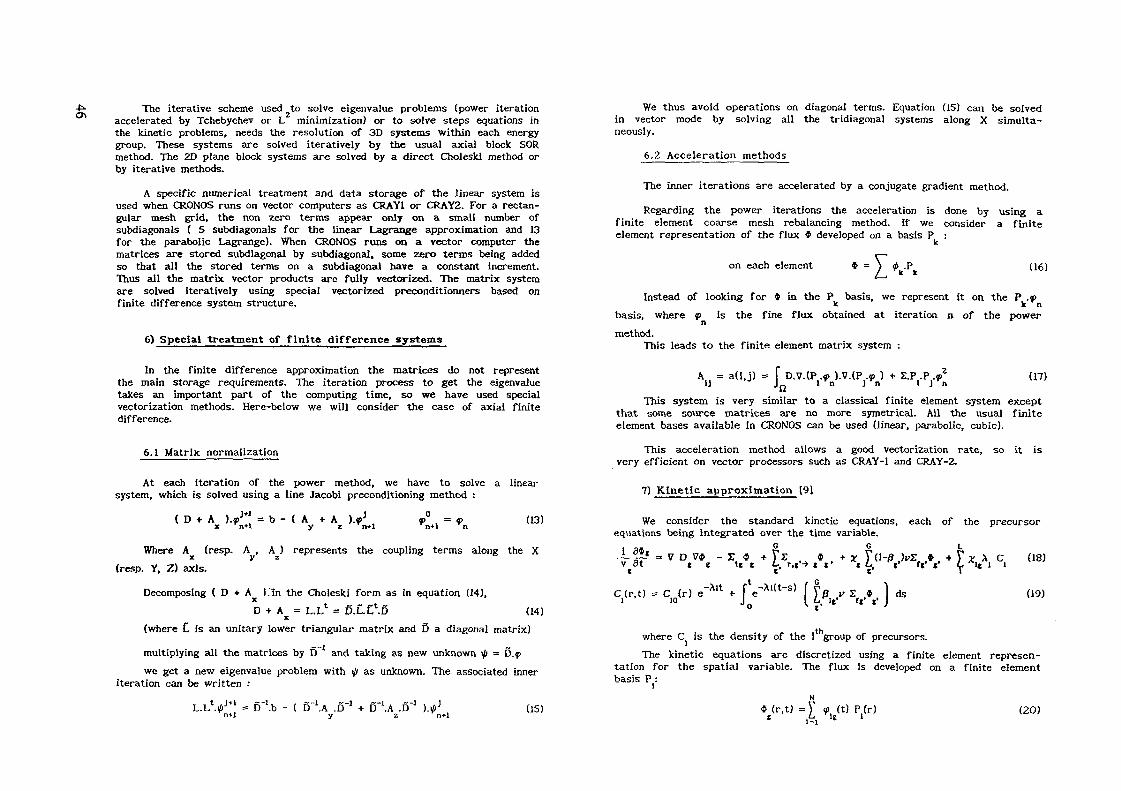
The iterative scheme used to solve eigenvalue problems (power iterationaccelerated by Tchebychev or L minimization) or to solve steps equations inthe kinetic problems, needs the resolution of 3D systems within each energygroup. These systems are solved iteratively by the usual axial block SORmethod. The 2D plane block systems are solved by a direct Choleski method orby iterative methods.
A specific numerical treatment and data storage of the linear system isused when CRONOS runs on vector computers as CRAY1 or CRAY2. For a rectan-gular mesh grid, the non zero terms appear only on a small number ofsubdiagonals ( 5 subdiagonals for the linear Lagrange approximation and 13for the parabolic Lagrange). When CRONOS runs on a vector computer thematrices are stored subdiagonal by subdiagonal, some zero terms being addedso that all the stored terms on a subdiagonal have a constant increment.Thus all the matrix vector products are fully vectorized. The matrix systemare solved Iteratively using special vectorized preconditionners based onfinite difference system structure.
6) Special treatment of finite difference systems
In the finite difference approximation the matrices do not representthe main storage requirements. The iteration process to get the eigenvaluetakes an important part of the computing time, so we have used specialvectorization methods. Here-below we will consider the case of axial finitedifference.
6.1 Matrix normalization
At each iteration of the power method, we have to solve a linearsystem, which is solved using a line Jacobi preconditioning method :
( D + A )V = b - ( A + A ).<fjx n+l y z n+1 (13)
Where A (resp. A , A ) represents the coupling terms along the X(resp. Y, Z) axis.
Decomposing ( D + A J.'ln the Choleski form as in equation (14),D + AX = L.L1 = ß.Lt'.D (14)
(where L is an unitary lower triangular matrix and ß a diagonal matrix)
multiplying all the matrices by D~ and taking as new unknown \ji = D.f>we get a new eigenvalue problem with <ft as unknown. The associated inner
iteration can be written :
L.L.V*1 = ß-'.b - ( ß-'.A .D'1 + ß-'.A -D'1 ).V (15)
We thus avoid operations on diagonal terms. Equation (15) can be solvedin vector mode by solving all the tridiagonal systems along X simulta-neously.
6.2 Acceleration methods
The inner iterations are accelerated by a conjugate gradient method.
Regarding the power iterations the acceleration is done by using afinite element coarse mesh rebalancing method. If we consider a finiteelement representation of the flux * developed on a basis P :
on each element $ = (16)
Instead of looking for * in the P basis, we represent it on the P .<pK k n
basis, where <p is the fine flux obtained at iteration n of the powern
method.This leads to the finite element matrix system :
A = a(i,j) = f D.V-tP .<f ).V.(P .y, ) + Z.P .P .1 J J . J I n J n I J (17)
This system is very similar to a classical finite element system exceptthat some source matrices are no more symetrical. All the usual finiteelement bases available in CRONOS can be used (linear, parabolic, cubic).
This acceleration method allows a good vectorization rate, so it isvery efficient on vector processors such as CRAY-1 and CRAY-2.
7) Kinetic approximation [9]
We consider the standard kinetic equations, each of the precursorequations being integrated over the time variable.
JL £» =, v D V* - Z. * + ) S . . * . - • • * T (Hî >S_ .* . + V r \ C (18)- - « ï U t i. r,t'-> » f • x L t't t t
C(r.t) = C (r) e-Alt * f^1^ f Vß ,v r .# . ) dsi 10 J0 l V- '* f« * J
. .(19)
where C is the density of the 1 group of precursors.The kinetic equations are discretized using a finite element represen-
tation for the spatial variable. The flux is developed on a finite elementbasis P :
« ( r , t ) = )« 4 '«(t) (20)
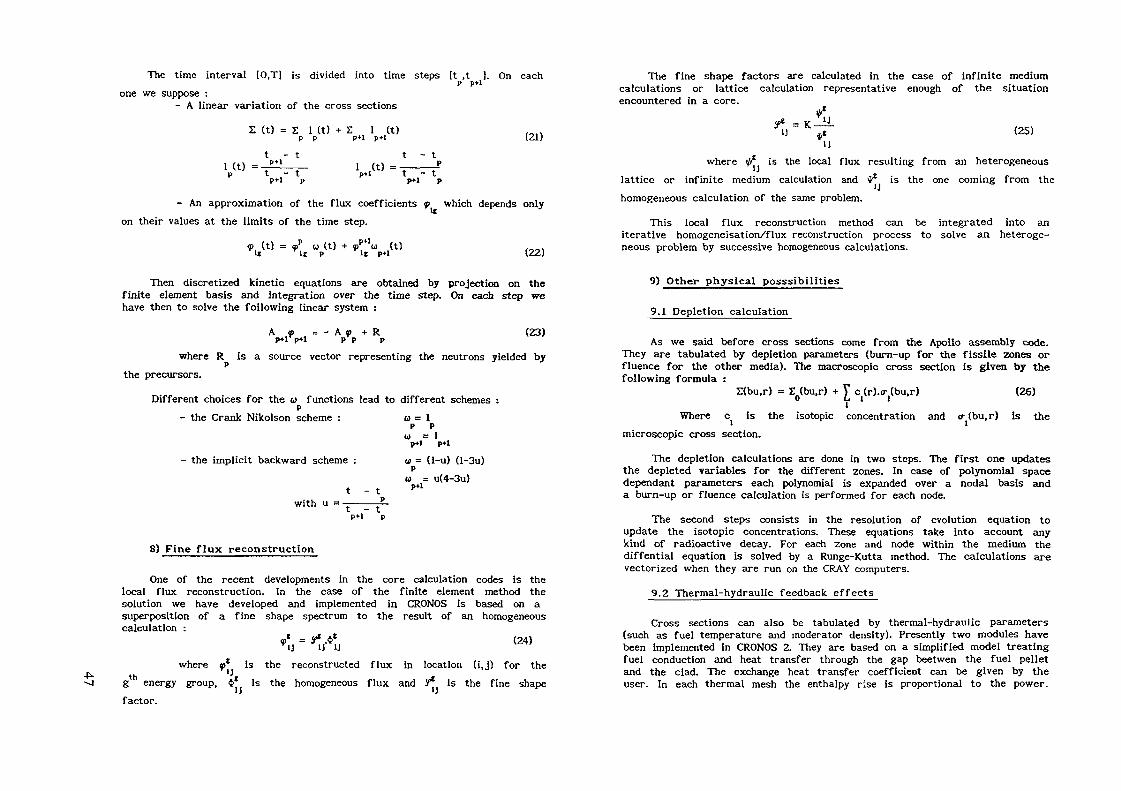
The time interval [O,T] is divided into time steps [t ,t ]. On eachp p»ione we suppose :
- A linear variation of the cross sections
S (t) = £ l (t) + 2 l (t)p p p+i p*i
t - t 1nt)=_-L__ , . ( t ,_
(21)
p+i- An approximation of the flux coefficients <f which depends only
on their values at the limits of the time step.
<p, (t) = / w (t) + 9P+1u (t)U U P U p » i (22)
The fine shape factors are calculated in the case of infinite mediumcalculations or lattice calculation representative enough of the situationencountered in a core.
IJ
U(25)
where iff is the local flux resulting from an heterogeneouslattice or infinite medium calculation and ** is the one coming from thehomogeneous calculation of the same problem.
This local flux reconstruction method can be integrated into aniterative homogeneisation/flux reconstruction process to solve an heteroge-neous problem by successive homogeneous calculations.
Then discretized kinetic equations are obtained by projection on thefinite element basis and integration over the time step. On each step wehave then to solve the following linear system :
A <p = - A ? + RP+l p+l p p p (23)
where R is a source vector representing the neutrons yielded bypthe precursors.
Different choices for the w functions lead to different schemes :p
- the Crank Nikolson scheme : w = 1p p
w = l
9) Other physical posssibilities
9.1 Depletion calculation
As we said before cross sections come from the Apollo assembly code.They are tabulated by depletion parameters (burn-up for the fissile zones orfluence for the other media). The macroscopic cross section is given by thefollowing formula :
£(bu,r) = X (bu,r) + V c (r).<r,(bu.r) (26)0 Li 1 1
Where c is the isotopic concentration and <r (bu,r) is themicroscopic cross section.
-J
- the implicit backward scheme : ta = (1-u) (l-3u)p
u = u(4-3u)t -t "*'
with u — —p+i p
8) Fine flux reconstruction
One of the recent developments in the core calculation codes is thelocal flux reconstruction. In the case of the finite element method thesolution we have developed and implemented in CRONOS is based on asuperposition of a fine shape spectrum to the result of an homogeneouscalculation :
9!j = *1j-*ÎJ (24)
where <p* is the reconstructed flux in location (i,j) for theg energy group, ** is the homogeneous flux and H* is the fine shapefactor.
The depletion calculations are done in two steps. The first one updatesthe depleted variables for the different zones. In case of polynomial spacedependant parameters each polynomial is expanded over a nodal basis anda burn-up or fluence calculation is performed for each node.
The second steps consists in the resolution of evolution equation toupdate the isotopic concentrations. These equations take into account anykind of radioactive decay. For each zone and node within the medium thediffential equation is solved by a Runge-Kutta method. The calculations arevectorized when they are run on the CRAY computers.
9.2 Thermal-hydraulic feedback effects
Cross sections can also be tabulated by thermal-hydraulic parameters(such as fuel temperature and moderator density). Presently two modules havebeen Implemented In CRONOS 2. They are based on a simplified model treatingfuel conduction and heat transfer through the gap beetwen the fuel pelletand the clad. The exchange heat transfer coefficient can be given by theuser. In each thermal mesh the enthalpy rise is proportional to the power.
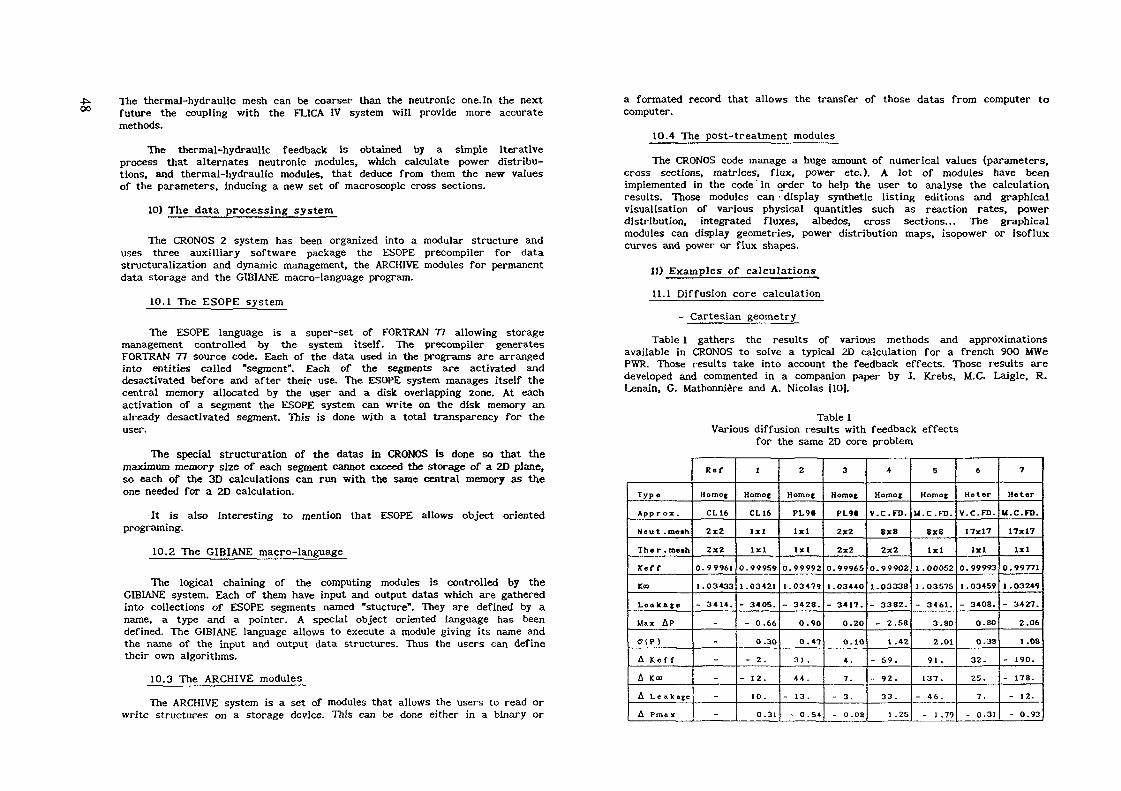
The thermal-hydraulic mesh can be coarser than the neutronic one. In the nextfuture the coupling with the FLICA IV system will provide more accuratemethods.
The thermal-hydraulic feedback is obtained by a simple Iterativeprocess that alternates neutronic modules, which calculate power distribu-tions, and thermal-hydraulic modules, that deduce from them the new valuesof the parameters. Inducing a new set of macroscopic cross sections.
10) The data processing system
The CRONOS 2 system has been organized into a modular structure anduses three auxilliary software package the ESOPE precompiler for datastructuralization and dynamic management, the ARCHIVE modules for permanentdata storage and the GIBIANE macro-language program.
10.1 The ESOPE system
The ESOPE language is a super-set of FORTRAN 77 allowing storagemanagement controlled by the system itself. The precompiler generatesFORTRAN 77 source code. Each of the data used in the programs are arrangedinto entities called "segment". Each of the segments are activated anddesactivated before and after their use. The ESOPE system manages itself thecentral memory allocated by the user and a disk overlapping zone. At eachactivation of a segment the ESOPE system can write on the disk memory analready desactivated segment. This is done with a total transparency for theuser.
The special structuration of the datas in CRONOS is done so that themaximum memory size of each segment cannot exceed the storage of a 2D plane,so each of the 3D calculations can run with the same central memory as theone needed for a 2D calculation.
It is also interesting to mention that ESOPE allows object orientedprograming.
10.2 The GIBIANE macro-language
The logical chaining of the computing modules is controlled by theGIBIANE system. Each of them have input and output datas which are gatheredinto collections of ESOPE segments named "stucture". They are defined by aname, a type and a pointer. A special object oriented language has beendefined. The GIBIANE language allows to execute a module giving its name andthe name of the input and output data structures. Thus the users can definetheir own algorithms.
10.3 The ARCHIVE modules
The ARCHIVE system is a set of modules that allows the users to read orwrite structures on a storage device. This can be done either in a binary or
a formated record that allows the transfer of those datas from computer tocomputer.
1O.4 The post-treatment modules
The CRONOS code manage a huge amount of numerical values (parameters,cross sections, matrices, flux, power etc.). A lot of modules have beenimplemented in the code in order to help the user to analyse the calculationresults. Those modules can • display synthetic listing editions and graphicalvisualisation of various physical quantities such as reaction rates, powerdistribution, integrated fluxes, albedos, cross sections... The graphicalmodules can display geometries, power distribution maps, isopower or isofluxcurves and power or flux shapes.
11) Examples of calculations
11.1 Diffusion core calculation
- Cartesian geometry
Table 1 gathers the results of various methods and approximationsavailable in CRONOS to solve a typical 2D calculation for a french 90O MWePWR. Those results take into account the feedback effects. Those results aredeveloped and commented in a companion paper by J. Krebs, M.C. Laigle, R.Lenain, G. Mathonnière and A. Nicolas [10].
Table 1Various diffusion results with feedback effects
for the same 2D core problem
Type
App r ox .
Neu t .m««h
Th« r . ro«ah
Kef f
Ko>
L e a k a g e
Hax AP
C T ( P )
A Kef f
A KCO
A L e a k a g e
A Pmox
Rat
Homot
CL16
2x2
2x2
0.99961
1.03433
- 3414.
-
_
-
-
-
-
1
Homot
CL16
1x1
1x1
O.999S9
1.03421
- 340S.
- 0.66
0.30
- 2.
- 12.
10 .
0.31
2
Homot
PL9«
1x1
1x1
O. 99992
1.03479
- 3428.
0.90
0.47
31 .
44 .
- 13 .
- O . S 4
3
Homot
PL9t
2x2
2x2
0.999&S
1.0344O
- 3417.
0.2O
0.1O
4.
7.
- 3.
- 0-08
4
Homot
V.C.FD.
8X8
2x2
0.99902
1.O3338
- 3382.
- 2.58
1 .42
- S9.
- 92.
33.
1 .25
5
Horaot
M.C.FD.
8x8
1x1
1.00052
1 .O3S75
- 3461.
3,80
2.O1
91 .
137.
- 46.
- 1 .79
6
Heter
V.C.FD.
17x17
1x1
0.99993
1.03459
- 3408.
O.80
0.33
32.
25.
7.
- 0.31
7
Meter
U.C. FD.
17x17
1x1
0.99771
1 .03249
- 3427.
2.06
I.O8
- 19O.
- 178.
- 12.
- 0.93
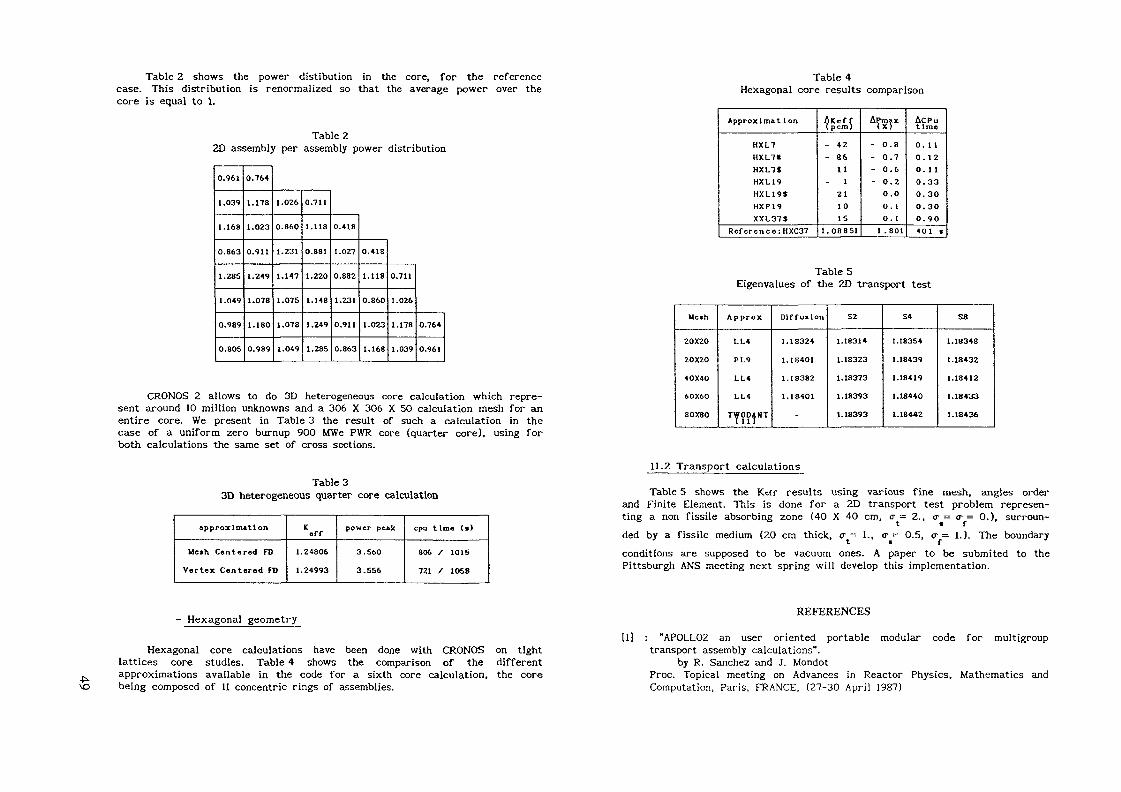
Table 2 shows the power distibution in the core, for the referencecase. This distribution is renormalized so that the average power over thecore is equal to 1.
Table 22D assembly per assembly power distribution
0.961
1.039
1.168
0.863
1.285
1.049
0.989
0.805
0.764
1.178
1.023
0.911
1.249
1.078
1.180
0.989
1.026
0.860
1.231
1.147
1.07S
1.078
1.049
0.711
1.118
0.881
1.220
1.148
1.249
1.285
0.418
1.027
0.882
1.231
0.911
0.863
0.418
1.118
0.860
1.O23
1.168
0.711
1.026
1.178
1.039
0.764
0.961
CRONOS 2 allows to do 3D heterogeneous core calculation which repre-sent around 10 million unknowns and a 306 X 306 X 50 calculation mesh for anentire core. We present in Table 3 the result of such a calculation in thecase of a uniform zero burnup 900 MWe PWR core (quarter core), using forboth calculations the same set of cross sections.
Table 33D heterogeneous quarter core calculation
approxlmatl on
Me«h Centered FD
Vertex Centered R)
K
1.24806
1.24993
power peak
3. 560
3.556
cpu t ime (*)
806 / 1O1S
721 / 1OS8
- Hexagonal geometry
Hexagonal core calculations have been done with CRONOS on tightlattices core studies. Table 4 shows the comparison of the differentapproximations available in the code for a sixth core calculation, the corebeing composed of 11 concentric rings of assemblies.
Table 4Hexagonal core results comparison
Approxlmat Ion
HXL7HXL7*HXL7$HXL19HXL19$HXP19XXL37$
Reference :HXC37
A K « f fT pcm)
- 42- 86
11- 1
2110IS
1.08851
APrn.x
- O.8
- 0.7- 0.6- 0.2
0.00. 1O . I
1 .801
ACPut Imo
0. 1 10.120. 1 10.330.300.300.90401 «
Table 5Eigenvalues of the 2D transport test
Ueah
20X20
20X2O
40X40
60X60
80X80
A p p r o x
LL«
PL9
LL4
LL4
TWODANT
Di f fus ion
1.18324
1.1S401
1.18382
1.184O1
-
S2
1.18314
1.18323
1.18373
1.18393
1.18393
S4
1.183S4
1.18439
1.18419
1.18440
1.18442
S8
1.18348
1.18432
1.18412
1.18433
1.18436
11.2 Transport calculations
Table 5 shows the Keff results using various fine mesh, angles orderand Finite Element. This is done for a 2D transport test problem represen-ting a non fissile absorbing zone (40 X 40 cm, a- = 2., cr = <r = 0.), surroun-ded by a fissile medium (20 cm thick, <r = 1., <r = 0.5, <r = 1. ). The boundary
conditions are supposed to be vacuum ones. A paper to be submited to thePittsburgh ANS meeting next spring will develop this implementation.
REFERENCES
[1] : "APOLL02 an user oriented portable modular code for multigrouptransport assembly calculations".
by R. Sanchez and J. MondotProc. Topical meeting on Advances in Reactor Physics, Mathematics andComputation, Paris, FRANCE, (27-30 April 1987}

[2l : "FLICA IV A finite volume implicit computer code for 3D two phaseflows computation of P.W.R. cores",
by D. Caruge and P. RaymondEuropean Two-Phase Flow Group Meeting, Paris, FRANCE (May 1989)
[3] : "A Finite Element Depletion Diffusion Calculation Method withDependent Cross Sections".
by A. Kavenoky and J.J. LautardNuclear Science and Engineering, 64, 563-575 (1977)
17]
[8]
[9]
Space
(41 : "State of the Art in using Finite Element Method for Neutron DiffusionCalculations"
by A. Kavenoky and" J.J. LautardProc. Topical meeting on Advances in Reactor computations, Salt LakeCity (Utah), U.S.A., (March 1983)
(51 : "Computational Methods of Neutron Transport"by E.E. Lewis and W.F. Miller
Wiley-Interscience Publication (1985)
[6] : "New Finite Element Representation for 3D reactor calculations".by J.J. Lautard
ANS/ENS Meeting, Munich, GERMANY (27-29 April 1981)
"Mixed and Mixed-hybrid elements for the Diffusion Equation"by F. Coulomb, C, Fedon-Magnaud
Proc. Topical meeting on Advances in Reactor Physics, MathematicsComputation, Paris, FRANCE, (27-30 April 1987)
and
"On the Relationship Between some Nodal Schemes and the Finite ElementMethod in Static Diffusion calculations".
by C. Fedon-Magnaud, J.P. Hennart and J.J. LautardProc. Topical meeting on Advances in Reactor computations, Salt LakeCity (Utah), U.S.A., (March 1983)
: "The Neutron Kinetics and Thermal-hydraulic transient computationmodule of Neptune System CRONOS".
by A. Kavenoky and J.J. LautardProc. Topical Meeting on Advances in Reactor Physics and CoreThermal-hydraulics, Klamesha Lake (N.Y.), U.S.A., (September 1982)
[10J: "Calculational Methods for PWR"by J. Krebs, M.C. Laigle, R. Lenain, G. Mathonnière and A. Nicolas
Proc. this meeting.
fill: "User's Guide for TWODANT : a code Package for Two Dimensional,Diffusion accelerated, Neutral-Particle Transport"
by R.E. Alcouffe, F.W. Brinkley, D.R. Marr and R.D. O'DelLA-10049-M, Los Alamos National Laboratory (march 1984)
ROD EJECTION ANALYSIS IN PWRsWITH A 3D KINETIC NEW CODE
M. GÖNNET, C. NEAUME, T. BISIAUXFramatome,Paris-La Defense,France
AbstractStandard synthesis method in control rod ejection analysis is
usually over-conservative and may affect significantly tie PWRproject parameters. A 3D kinetic applied to standard safety analysisand to a series of penalizing transients (simultaneous ejection of 2rods) is presented here. For this purpose a 3D kinetic code involving2-group time dependent diffusion and fine thermal-hydraulic modelswas developed at FRÄMÄTOME. The large number of meshes used (30000to 45000) allows a sufficient accuracy to clearly show the marginsimposed by the standard approach.
INTRODUCTION
A typical application of such a 3D kinetic code to the study of arod ejection in a PWR is presented here. In such reactors,the introductionof clusters is made by gravity starting from the uppermost part of thecore. Bod ejection is an accident which could occur in case of ruptureof the control rod drive mecanism casing located on the top of thepressure vessel. This rupture would affect the primary system pressure(155 bars) and this could propel the rod out of the core at a very highspeed. When the reactivity worth is high, the ejection could bring up thecore to be prompt-critical. She consequences of the increase in nuclearpower on the fuel integrity have to be examined. This accident, rated ANScondition IV, should lead neither to a stored energy of more than 840 J/gat the hot point, nor to an excessive clad temperature. Respect of thesecriteria commonly leads to set up rod bank insertion limits.
In this presentation, the results of the 3D and standard methods interm of global core behaviour (nuclear power),local energy and temperaturevariations foe various initial conditions and rod worth axe compared.Two types of transients are considered. First type transients araclassical cases of project studies, selected on 1450 MWe or 1300 MWe plants(refered as N4 and P4 in the text), leading to violation of criteria underthe standard approach. Second type are more pessimistic ones (simultaneousejection of two rods).
The standard FRAMATOME method for rod ejection analysis is based on asynthesis of 2D static discrete (with frozen feedbacks) and ID kineticcalculation , followed by thermal calculation for the hot spots. Thissimplified method allows to analyse a great number of situations,partioulary in case of load follow, regarding to computing time required
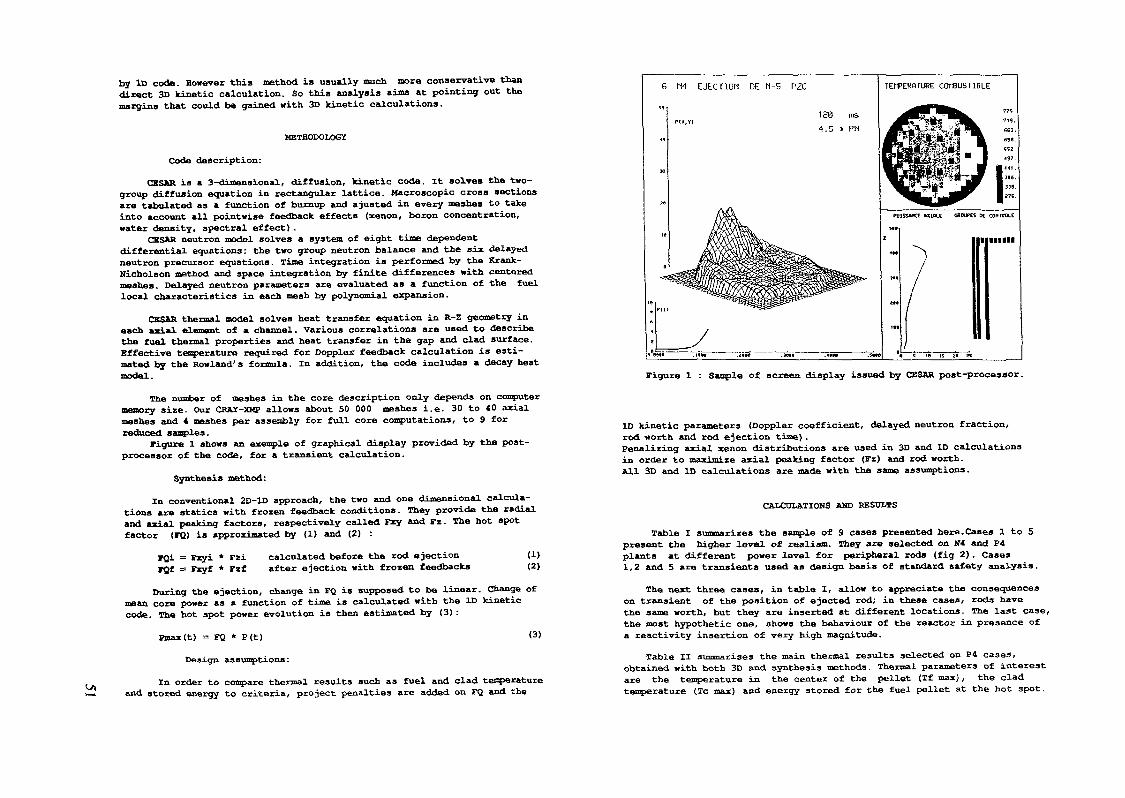
by ID code. However this method is usually much more conservative thandirect 3D kinetic calculation. So this analysis aims at pointing out themargins that could be gained with 3D kinetic calculations.
METHODOLOG*
Code description:
CBS&R is a 3-dimensional, diffusion, kinetic code. It solves the two-group diffusion equation in rectangular lattice. Macroscopic cross sectionsare tabulated as a function of burnup and ajusted in every meshes to takeinto account all pointwise feedback effects (xenon, boron concentration,water density, spectral effect) .
CESAR neutron model solves a system of eight time dependentdifferential equations: the two group neutron balance and the six delayedneutron precursor equations. lime integration is performed by the Krank-Nicholson method and space integration by finite differences with centeredmeshes. Delayed neutron parameters are evaluated as a function of the fuellocal characteristics in each mesh by polynomial expansion.
CESAR thermal model solves heat transfer equation in R-Z geometry ineach axial element of a channel. Various correlations are used to describet ho fuel thermal properties and heat transfer in the gap and clad surface.Effective temperature required for Doppler feedback calculation is esti-mated by the Rowland's formula. In addition, the code includes a decay heatmodel.
The number of meshes in the core description only depends on computermemory size. Our CRAX-XMP allows about 50 000 meshes i.e. 30 to 40 axialmeshes and 4 meshes per assembly for full core computations, to 9 forreduced samples.
Figure 1 shows an exemple of graphical display provided by the post-processor of the code, for a transient calculation.
Synthesis method:In conventional 2D-1D approach, the two and one dimensional calcula-
tions are statics with frozen feedback conditions. They provida the radialand axial peaking factors, respectively called Fxy and Fx. The hot spotfactor (TO.) is approximated by (1) and (2) :
FQi = Fxyi * FziFQf = Fxyf * Fzf
calculated before the rod ejection (1)after ejection with frozen feedbacks (2)
During the ejection, change in FO. is supposed to be linear. Change ofmean core power as a function of time is calculated with the ID kineticcode. The hot spot power evolution is then estimated by {3} :
Pmax(t) = FQ * P (t) (3)
Design assumptions:
In order to compare thermal results such as fuel and clad temperatureand stored energy to criteria, project penalties are added on FQ and the
6 H4 EJECTION DE N-5 PZC
120 ms•4.5 * PM
CO-BUS riBLE
PIHSSMKC »XIRIE GROUPES K COrtrsOU
Illlll
5 <l) tl M
Figure 1 : Sample of screen display issued by CESAR post-processor.
ID kinetic parameters (Doppler coefficient, delayed neutron fraction,rod worth and rod ejection time).Penalizing axial xenon distributions are used in 3D and ID calculationsin order to maximize axial peaking factor (Fz) and rod worth.All 3D and ID calculations are made with the same assumptions.
CALCULATIONS AND RESULTS
Table I summarizes the sample of 9 cases presented here. Cases 1 to Spresent the higher level, of realism. They »re selected on M and P4plants at different power level for peripheral rods (fig 2) . Cases1,2 and 5 are transients used as design basis of standard safety analysis.
The next three cases, in table I, allow to appreciate the consequenceson transient of the position of ejected rod; in these cases, rods havethe same worth, but they are inserted at different locations. The last case,the most hypothetic one, shows the behaviour of the reactor in presence ofa reactivity insertion of very high magnitude.
Table II summarises the main thermal results selected on P4 cases,obtained with both 3D and synthesis methods. Thermal parameters of interestare the temperature in the center of the pellet (Tf max) , the cladtemperature (Tc max) and energy stored for the fuel pellet at the hot spot.

TABLE IPresentation and summarize of studied case»
1?34SR/HQ
10111V131415
ii
iiiiiiiiiiiti
ii
iii
i
R
<NI
P
SA
SB
R
SB
SU
2A,JMI
1
2
3
4
5
6
7
8
9
N
G2
N2
N2
C2
3EÎE1
M
SA
NI
SC
Gl
SC
m
SA
1
L
G2
R
R
G2
]
K
SB
se
sn
N1
so
SC
SB
>LJ
N<
N<
P<
P4
P<
P<
P4
P<
N4
J
NZ
«
_n
1
H
R
Gl
NI
R
NI
Gl
R
l• 1
1111111111
11f
1
1
1
1
G
N2
NZ
E
F
SB
X
sn
Hl
sn
X
SB
i0»t
E
G?
K
R
G2
NITIAL 1 INITIAI1ER LEVEL 1 INSER1
N P 1 %1
100 i D 55 %i
0 1 D,C,B Mi 83,65,1Ei
100 i R 30 %
40 l R,N1,G11 30,60,10i
0 1 R,N1,N2,•30,75,15,i
100 ' R 100
100 i R 100
100 i R 1001
0 • ALL ROE1
D C B A ABC
SA
Nl SA —G2 .— —
SC SB — —
^ ~ *Gl R ---
N2 «SC SB — — —
02Nl SA l— —
SA
. E•1C
I»
<3f*
I»
,co,Gl1C
%
%
%s
D
s
s
N«
S
S
tOE>N
r
).
Ï
r
210
,G0,
I»
i»
IN
IN
E
s
N2
m
s
N2
atU
0
210
F
s
s
G3
G1
S
S
11
11
111lt1
1
0111111
11
G
N5
b
S
S
N*l
Nb
P
J
H
s
N4
Gl
W
S
OS
J
N
E
B
D
B
E
B
3+
J
>a
S
s
Nb
S
S
Ni
ROIT
3
5
14
14
12
14
11
8
B2
K
s
Cl
«1
m
s
D10
L
N5
N«
b
S
s
Nb
N
M
5
S
CI
53
S
S
1 11 ROD I1 WORTH Il pcm il il 455 'l il 770 it fl il 200 ii i' 520 1l tl ti 670 i
i i' 750 il i' 750 il i' 750 ii i' 4300 il i
N P R S T17^
s 14N2 S 13
s 12N5 11
N* S 10S N3 9
s 8N4 N5 7
6N2 5
s 4s 3
D=G1+N2+GHNJ 2c=m i
2 a2 b
Figure 2 Control rod pattern on P4 (2 a) and N4 (2 b) plants
TABLE n
Comparative thermal results on ft plant
Case 3 3D | Synthesis I Case 4 3DT£ max (C) 11Tc max (C) |
1Stored En |
J/g 1
Case 5 |—————————— +—Tf max (C) |
1Tc *"" (C) |
1Stored En I
J/g I
2100
820
440
3D
750
410
170
1 240011 85511 5201
1 Synthesis
1 107011 46011 2301
1 1 Tf max (C) III 11 1 Tc max (C) III 1I | Stored En III J/g I
1 Case 6 |
! | Tf max (C) |II 1I 1 Tc max (C) III 1I | Stored En III J/g I
2110
990
490
3D
2660
1080
630
1 248011 119011 6101
1 Synthesis
! 363011 143011 11201
11111
1
111111
These parameters are to be compared with safety criteria related torupture threshold of fuel rods They are based mainly on results of SPERTexperiment [ref 1] Criteria used in FRAMATOME are- Fuel enthalpy at hot spot should be lower than 940 J/g for fresh fuel and840 J/g for spent fuel- Fuel centerline melting is limited to 10% of pellet volume at hot spot- Clad temperature should not exceed 1480 CTable III shows up, that in cases 3 and 4, the pellet center temperatureapproach the limit (2600 C) with synthesis method The use of a 3D model leadsto release of about 15% on margins In case 6, 3D fuel temperature is close tothe limit when synthesis method exceeds it of 36%
Moreover, these results indicate that the extra-margin due to the syn-thesis method are strongly related to the ejected rod worth 14% for 200 pcmto 36% for 750 pcm
ANALYSIS AND DISCUSSION OF RESULTS
In this paragraph we analyse the origin of the conservatism in thesynthesis method for rod ejection analysis Two issues are to be studiedmargins on hot peaking factor and oa mean core power calculation
Nuclear power behaviour
Core power behaviour 13 approximately the same in all cases However,the maximum core power can be reached between 110 to 140 ms depending on thestarting fuel temperature (300 to 800 C ) and its value depends on theejected rod worth Figure 3 shows, for case 2, a large difference in 3D andID calculated nuclear power peak Conservatism is here very large (about 100%)

15. -
U11.a&4.
za
x IDA 3D
1CQ 200.• * «E-300. 4CQtime (ms)
Figure 3: Comparison between 3Dand ID calculated meanpower for an ejectedrod north of 770 pcm(case 2 of table I).
Hot peaking factor:In synthesis method the hot
spot factor is calculated withfrozen feedback in both ID and2D codes, so that flux flatteningdue to Doppler effect is not ta-ken into account. Consequentlyconservatism on FQ can reach 50%as it is shown on figure 6.More-over in this approach the de-crease of FQ according to fuelheatening ia not considered sincethe tna^rimittn value is imposedfrom the peak time to the scram.
Figure 6: Comparison between hotpeaking factor 3D calculated andthose used in synthesis method.
75. 150. 22& 300.time (ms)
. _ _ _ 1 D rest*
nH8l3D resultsYHVM
a 10. sa 3d AD. so. eo. TO. BO. ax 100.time (ms)
Figure 41 Change in radial bucklingin pcm induced by ejection of H14and R8 with ajusted worths of 750 pcm.
60. 120, 180. 240. 300. 360.âme (ms)
Figure 5: Mean core power changein pcm induced by ejection of HI4and H8 with ajusted worths of 750 pcm.
This conservatism increases as a function of control rod worth.Figure 4 shows the change in radial buckling, expressed in pcm (1 pcm=l.E-5), produced by the rod ejection. One can see that the ejection ofperipheral rod, like R14 (see figure 2), leads to a small amount ofneutron leakage when central rod ejection induces a fall in leakagecorresponding to a reactivity excursion of about 1000 pcm. This explainsthe most important part of the deviation between 3D and ID calculationsas shown on figure 5.
Effects of partial initial insertion;ID rod worth are ajusted on 2D caculations which supposes a fully
inserted rod. With partially inserted rod, ID and 3D worth results are dif-ferent: in cases 1 and 2, 3D rod worth static results are respectively 455and 550 pcm , whereas IB results give 540 and 600 pcm. This difference isexplained by the fact that the 3D axial assembly flux is more shifted towardth» bottom than the ID average axial core flux. Associated conservatism canreach 100% (Figure 7).
Simultaneous ejection of two rods:
Now let's see what happens when the reactor is driven to extremeeventuality: the simultaneous ejection of two adjacent rods, both ofwhich belong to control banks of high efficency. It's not a very rea-listic situation because the core is considered at zero power withall control and safety banks inserted, as if a scram had just occured.However the core is supposed to be critical.
This accident is much more rapid and violent than in previous cases.Prompt criticality is attained after only 30 ms, when the rods are 30%withdrawn.
The power peak is attained at 40 ms .Locally, the power hits 3000 titresits nominal value. Power iTimediatly falls, thanks to the Doppler effect,but built-in reactivity of the two rods is sufficient to bring up the coreproimpt critical again. This explains, what it ia shown on figure 8. Notethat TH51TJmum fuel temperature reachs 2670 C in R2 assembly. The fuelmelting criteria is slightly exceeded but clad temperature limit, in thiscase is violated. Stored energy reachs 840 J/g at 120 »3.
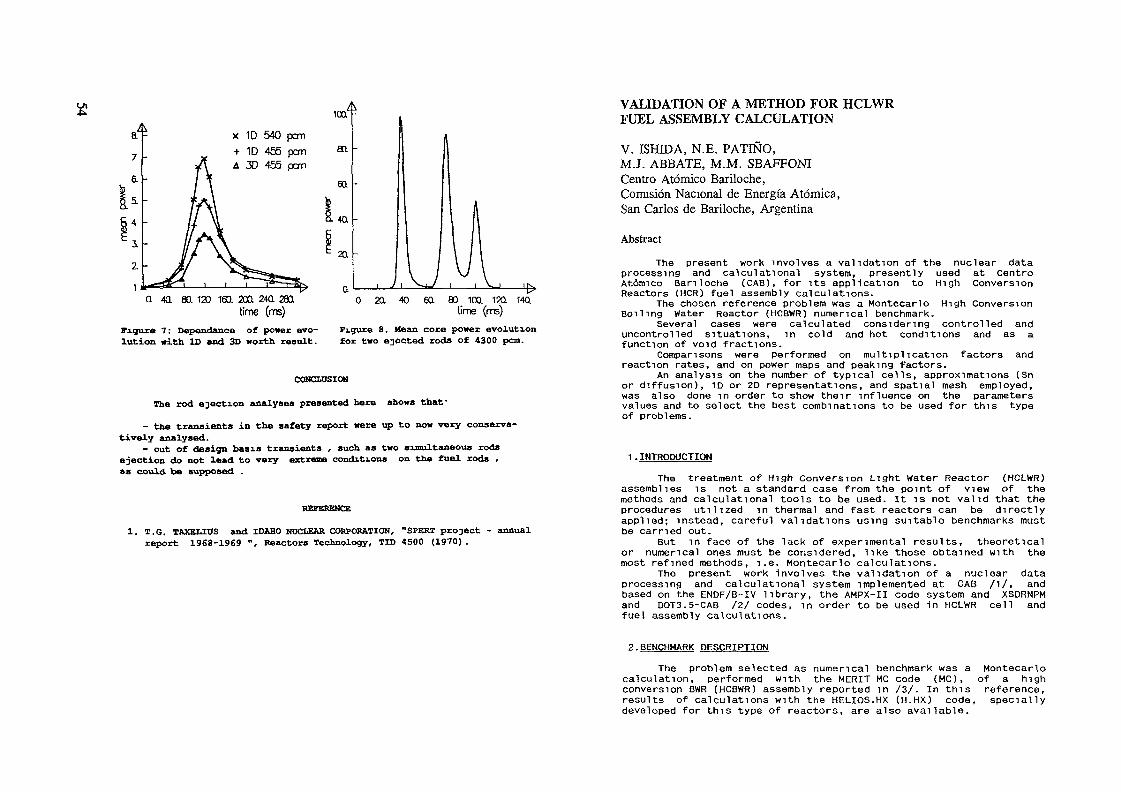
x 1D 540 pan•f ID 405 pern
3D 455 pan
Q 40 SO 120 160. 20a 240. 29time (ms)
Figur« 7: Dépendance of power evo-lution with ID and 3D worth result.
40 60, 80 100. 120. 140time (ms)Figure 8. Mean core power evolutionfor two ejected rods of 4300 pcm.
CONCLUSION
The rod ejection analyses presented here shows that-- the transients in the safety report were up to now very conserva-
tively analysed.- out of design basis transients , such as two simultaneous rods
ejection do not lead to very extreme conditions on the fuel rods ,»» could be supposed .
1. T.G. TAXELIUS and IDAHO NUCLEAR CORPORATION, "SPERT project - annualreport 1968-1969 ", Reactors Technology, TID 4500 (1970) .
VALIDATION OF A METHOD FOR HCLWRFUEL ASSEMBLY CALCULATION
V. ISHIDA, N.E, PATINO,M.J. ABBATE, M.M. SBAFFONICentro Atomico Bariloche,Comisiön Nacional de Energfa Atömica,San Carlos de Bariloche, Argentina
Abstract
The present work involves a validation of the nuclear dataprocessing and calculational system, presently used at CentroAtomico Bari loche (CAB), for its application to High ConversionReactors (HCR) fuel assembly calculations.
The chosen reference problem was a Montecarlo High ConversionBoiling Water Reactor (HCBWR) numerical benchmark.
Several cases were calculated considering controlled anduncontrolled situations, in cold and hot conditions and as afunction of void fractions.
Comparisons were performed on multiplication factors andreaction rates, and on power maps and peaking factors.An analysis on the number of typical cells, approximations (Sn
or diffusion), 1D or 2D representations, and spatial mesh employed,was also done in order to show their influence on the parametersvalues and to select the best combinations to be used for this typeof problems.
1.INTRODUCTION
The treatment of High Conversion Light Water Reactor (HCLWR)assemblies is not a standard case from the point of view of themethods and calculational tools to be used. It is not valid that theprocedures utilized in thermal and fast reactors can be directlyapplied; instead, careful validations using suitable benchmarks mustbe carried out.
But in face of the lack of experimental results, theoreticalor numerical ones must be considered, like those obtained with themost refined methods, i.e. Montecarlo calculations.
The present work involves the validation of a nuclear dataprocessing and calculational system implemented at CAB /1/, andbased on the ENDF/B-IV library, the AMPX-II code system and XSDRNPMand DOT3.5-CAB /2/ codes, in order to be used in HCLWR cell andfuel assembly calculations.
2. BENCHMARK DESCRIPTION
The problem selected as numerical benchmark was a Montecarlocalculation, performed with the MERIT MC code (MC), of a highconversion BWR (HCBWR) assembly reported in /3/. In this reference,results of calculations with the HELIOS.HX (H.HX) code, speciallydeveloped for this type of reactors, are also available.

Calculatxonal domain
FIGURE 1 : Geometrical configuration of the fuel
TABLE IFuel assembly specifications
Assembly pitch: 22.40 cm.Fuel rod diameter: 1.21 cm.Cladding thickness: 0.06 cm.Fuel rod pitch: 1.47 cm.Rod clearance: 0.26 cm.Cladding-to-channel distance: 0.24 cm.Channel box wall thickness: 0.13 cm.Moderator to fuel volume ratio (Vm/Vf): 1.03Fuel composition: mixed oxide
The fuel assembly comprises 193 fuel cells and 18 controlrods; its geometrical shape and other data are included in figure 1and table I, /3/.The fuel density was assumed to be 10.34 g/cm**3, typical ofMOX fuels, and the B4C density was taken to be 1.844 g/cm**3.
It must be pointed out that this work also includes avalidation of the working libraries used because, in the presentcase, the group constants were completely derived from the ENDF/B-IVlibrary, while in the benchmark, they were obtained from the ENDF/B-V library for the heavy nuclides and from the ENDF/B-IV for theremainder.
3. CALCULATIONAL METHODOLOGY
The methodology includes the preparation of the suitable groupconstants, that requires two steps, and the calculations of theassembly:3.1 .Generation of the working libraries:Two working libraries were prepared with AMPX-II system: coldlibrary, at 300 K, and hot library, at 900 K for fuel and 560 K for
the remainder; they were obtained in a 108 groups structure, derivedfrom the WIMS 69 group energy mesh.The resonance and heterogeneities treatments used, were differentfrom the reference case. Here, Nordheim's method was employed(NITAWL module) together with a specially defined Dancoff factor/4/. In the reference case, an improved intermediate resonance andhyperfine treatments were applied; the Dancoff factor was calculatedtaking into account all the rods seen by the considered cell /5/.It must be noted that the corresponding libraries were obtained at0, 40 and 85« of void. It was verified that to use only zero voiddata together with a density factor is not acceptable, specially, inhigh void fraction cases.3. 2. Calcul at ion of eel 1-homogeni zed 1 ibraries:In this step, the "typical cell" approach was followed, and seven
cells were defined and considered:-C1 : fuel cell in an infinite array of equal cells.-C2: outer water gap, including the channel box wall.-C3: water cell (empty guide tube) surrounded by 6 fuel cells, C1 .-C4: control rod cell, surrounded by 6 C1 cells.-C5: fuel cell surrounded by 4 C1 cells and external water gap, C2.-C6: fuel cell surrounded by 5 C1 cells and 1 of water, C3.-C7: fuel cell surrounded by 5 C1 cells and 1 of control, C4.These macrocell arrangements permit to take into account thecoupling effect among the cell to be homogenized and its neighbours.Each inner cell is explicitly modelled in 3 zones, and the outerregion is assumed as homogeneous, employing the group constantsalready homogenized in previous steps.The flux was obtained by an Sn transport 10 calculation ( XSDRNPMcode in S4-PO approximations) and was used for collapsing to 20groups and homogenizing the cross-sections of the inner cell.3. 3. Fuel assembly calculation:At the fuel assembly level, the following cases were calculated for
considering normal dependence on temperature, control rods and void:-uncontrolled and controlled cold fuel element.-uncontrolled hot fuel element at 0, 40 and 85X void fractions.-controlled hot fuel element at 40X void fraction.
As main results, integral parameters like multiplication factorsand reaction rates, and local ones, like power maps and peakingfactors were calculated. The methods employed in the calculationswere transport with discrete ordinates (Sn) and diffusion theory.For 2D calculations, the DOT3.5-CAB code was used, considering an
X-Y representation of the fuel assembly. The geometry is also shownin figure 1; two quarters of the fuel element were included in thecalculational domain with reflective boundary conditions.In 10 geometry, the fuel assembly was cyl indrical ized and the
XSDRNPM code was used for the calculations.With an auxiliary module (POSTDOT) power maps and peaking factorswere derived.
4. RESULTS
4. 1 .Comparisons with reference results:The results presented here were obtained with 2D transport
calculations in S4-PO approximation.Table II shows the k-infinite calculated with MC, together withtheir differences (Ak *100) with ths results of this work and

ON TABLE IICalculated k-infimte and H.HX values compared with benchmark
a.Uncontrol ledColdHot. OX void.Hot, 40X void.Hot, 85X void.
b. Controlled
Benchmarkresults (MO
1.20741.14421.11261.0918
Differences 1*1(H.HX-MC) (This work-HC)
- 0.58- 0.62- 0.52+ 0.19
031374
0.53
ColdHot, 40X void.
0.96020.8589
+ 0.21+ 0.54
-1.18- 0.08
TABLE HIComparison of reactivity worths
Cases
a. Of control rodsColdHot, 4058 void.
b. Of moderator void.Transition--from cold to OX-from 0 to 40X-from 40 to 85X
Benchmarkresults (MC)
24.2725.37
uncontrol led cas- 6.32- 3 16- 2.08
Differences (% A k)(H.HX-MC)
- 0.78- 1 .08
ses- 0.05+ 0.09+ 0.73
(This
+ 0.- 0.
- 0+ 0.+ 1 .
work-MC)
1566
103927
1.2
1.1
01*>•< 1
.9
.9
.7
Uncontrolled cases
Controlled cases
A MCThis work:
—— 1-D..... 2-D
O H.HX
20 40 60Void -fraction
80 100
FIGURE 2: Calculated and reported k-inf mite val ues as a functionof void fraction
Figure 3 shows the power peaking factors (fission rates) as afunction of void fraction. The values are contained within thestandard deviation of MC results for the uncontrolled cases; in thecontrolled state, the discrepancies are somewhat larger.Figures 4 and 5 present the percentual differences in power
distributions at different stages for 1/12 of the fuel element,showing a very good agreement with the reference results.The contribution of main individual isotopes to the variation of k-infinite between two voidage states was calculated (S4PO-1D) andcompared in accordance with the definition of the reference(k=Production/Absorption). The results are shown in table IV.This test is related directly with the reaction rates and can giveinformation about cross-sections. The discrepancies in thetransition from cold to OX void are reasonable; it can be noted thatbig deviations are reported with H.HX for Pu240 and U238. In thetransition from 0 to 40X void, a 9X deviation was found 1n U238 anda bigger difference 1n Pu241 (the same that with H.HX). In the lastpart (40 to 85X void), where a smaller slope was found, thereactivity contributions of U238 and Pu240 show a large discrepancywith MC results, although they cancel each other. In this case, mostof the contributions show positive differences, causing thementioned less negative slope. And, the results for PU239, Pu241 andnet are also deviated more than 10», similar to H.HX.
H.HX. As it can be seen there, a good agreement is obtained for allthe cases between these calculations and MC and H.HX ones (of theorder of 1000 pcm in Ak or better). See also figure 2.Table III shows control rod and void reactivity worths, the generalagreement is also very good, better than 0.5* , although there is adifference of approximately 1% in the transition between 40 and 85Xvoid, which shows a smaller slope than the reported values. Thisbehaviour can be observed also with H.HX
4.2 Sensitivity to the scattering order and quadraturesIn order to verify the adequacy of the PO approximation, some cases
were recalculated with the scattering matrices expanded up to orderP1 . In the controlled cold assembly a difference of approximately 156exists between PO and P1 results, and in the uncontrolled hot OXvoid case the difference is negligible.Changes in the order of quadrature from 84 to S10 do not producesignicant differences in the multiplication factors

Lft
itClD.LUÏaa.
I. -i
1.3
1.2
i. l
0Lj
"This work
Controlled cases
Uncontrolled cases
0 20 40 60
Void fraction
FIGURE ai Power peaking factors
30 100
TABLE IVContribution of individual isotopes to the variation of k-infimte
(differences re1ated to MC results)
Transition: Cold(1 )
U238Pu239PU240PU241OthersNet
332301rî5
to OX void(2)
I 1II1
1149
0 to 40*(1) (2)
40 to 05%(1) (2)
- 31- 2+ 13+ 16+ 3
3523351373
- 285+ 32+ 330- 13+ 33+ 97
Notes- (1). ( Ak(H.HX) - Ak(MC))(2) (Ak(This work) - Ak(MC))where Ak =( A Production - k-inf imte* A Absorption)*10
-4
3.0-0.2
-0.2-1 .5
0.5-0.5
-3.8-1.8
-4.3-2.3
0.7-2.3
-4.0-5.9
-1 .31.3
2.80.7
1.52.8
-2.3-0.5
-1 .3-0.9
0.12.2
0.82.5
* control rod positions.
((MC - This work)/MC*100)((MC - H.HX)/MC*100) ———
1 .52.7
-2.0-0.8
2.04.0
3.00.3
-3.0-2.6
-0.31 .4
2.54.7
Central rod ——> 6.08.0
FIGURE 4: Power map. Case: uncontrolled. O * void
-6.0-1 .6
-1.0-4.0
-0.7-1 .7
0.5-2.8
1 .80.4
-0.6-3.9
1 .41 .1
-1 .91 .2
1.2-1 0
1 .7-3.6
-0.61.5
-0.82.3
-0.90.1
2.10.3
* control rod positions.
((MC - This work)/MC*loo)((MC - H.HX)/MC*100) ———
2 21 6
-0.51 .8
3.24.1
2.45 3
3.72.62.2
-0.4-1.7
Central rod ——> 3.04.5
FIGURE 5- Power map. Case controlled 40 x void

L«GO TABLE V
Sensitivity with geometrical representation and theor used.
Parameter andcases
1 . k-inf im tea.Uncontrol led
ColdHot, OX voidHot, 40* voidHot, 85515 void
b. Control TedColdHot, 4056 void
Calculational MethodOne-dimensional Two-dimensionalS4-PO Diffusiond ) Diffusion Diffusion(2)
+ 0.68+ 0.53+ 0.10- 0.30N/C
-12.63
0.750.440.030.32
-14.04-13.14
2.Reactivity worth of control rodsCold N/C +14.79Hot, 40% void +12.65 +13.17
3.Reactivity worth of moderator void (x)Transition from:
Cold to ox0 to 40«
40 to 8536- 0.15- 0.43- 0.40
- 0.31- 0.41- 0.35
- 0.16- 0.01- 0.02+ 0.20+ 0.30- 0.42
- 0.46+ 0.40
+ 0.15- 0.01+ 0.22
0.23N/C0. 100.12
N/C0.56
N/C+ 0.46
N/CN/C
+ 0.22
(1). no changes between considering C5 type cell or not.(2): diffusion calculation considering C1 type cell instead
C5 type.N/C- not calculated.
From the fluxes point of view very important differences were foundbetween diffusion and Sn.In the one-dimensional calculations the power maps and powerpeaking factors are not good enough.b. Reduction in the number of typical cells considered:Table V also shows in the last column the effect of eliminating the
C5 type cell (fuel surrounded by 4 fuel cells and water gap), andreplacing its group constants by those of C1 type cell. The changesin k-infimte are negligible, (not larger than 150 pcm) forcontrolled and uncontrolled cases, for 2D calculations and,negligible for 1D ones.c. Relaxation of the spatial mesh employed in the calculations.A very fine and detailed spatial discretization was used,(approximately 700 intervals) with a precise description of thewater gap. However, if the actual geometry is slightly modified inorder to align' both quarters of fuel element from the point ofview of the spatial grid (figure 1), this could imply a significantreduction in the number of intervals (approximately 250).These changes reduced the running times by a factor of two, withthe following effects on the results, k-infimte was modified byless than 100 pcm and the discrepancies in the power maps were notimportant, but the fluxes were not satisfactory because they do notrepresent the depletion in the water rod position and the condensedgroup constants for reactor calculations showed big differences;moreover, there were also discrepancies with peaking factors.4.4.Group constants for reactor calculation:As a last test of the methodology, group constants for reactorcalculation were prepared condensing, the previous 20 groups crosssections, to 8 energy groups. Those obtained with weighting spectracalculated by diffusion showed big differences, specially, atthermal energies; the same was found in the case of Sn 1D spectra.
4.3.Eva!uation of other approximations:To determine the crudest approximations that can be used for designpurposes, which could imply important reductions in running timeswithout loosing the accuracy of the results, the followingaproximations were also tried:a. 2D diffusion and 1D Sn and diffusion calculations:Table V shows the differences of the various approximationsemployed for the calculation of fuel assembly, referred to the S4-PObidimensional results.If only the k-infimte values are taken into account, 1D results
did not show differences between Sn or diffusion cases. Both, inuncontrolled cases, agree reasonably well (differences lower than155), but are highly inadequate for the controlled ones. This is dueto the smearing of the control rods in concentric rings thatoverestimates their reactivity worth by more than 1056 . The k-infinite results, together with the 2D ones, are shown in figure 2.On the other hand, a 2D diffusion calculation showed to be enoughfor all the uncontrolled cases, but for the controlledconfigurations, even if that suffices to get a first-order result,better values are obtained using discrete ordinates. Of course theuse of diffusion theory reduces the running times, in this case by afactor of twenty.
5.CONCLUSIONS
As summary, it can be said that all the parameters herecalculated are in satisfactory agreement with benchmark results (MC)and also with H.HX results.
In more detai1 :- k-infimte:For the uncontrolled element the discrepancies are at most +/- 1 %in A k with the MC code and much lower with the H.HX, in both one-and bidimensional cases, which is a very good agreement with thereference.For the controlled cases, there is a very good agreement with thebidimensional calculation, while one-dimensional one is notadequate at al1.- Void coefficient:It has shown to be less negative than MC results in the transitionfrom 40 to 85X of voidage, due to a cancellation of a very negativecontribution of U238 and a positive one of Pu240. The differencesare lower if compared with H.HX results, which have the sametendencies.- Power maps:Thoy have an excellent agreement with the reference calculations,with discrepancies very similar to those of H.HX.

- Power peaking factors:They are within the statistical deviations of MC and quite close toH.HX in bidimensional calculations for both controlled anduncontrolled cases.
As conclusions, and to be applied to future work, it can besaid that:- Sn (transport), 2D calculations is the most recommendable method.- even though, a 2D diffusion calculation could be accurate enough
and cost effective, from the computational point of view, for allthe uncontrolled cases; and, for the controlled cases, they can givefirst order results.
S4 approximation showed to be good enough; and, it can beinferred that a small improvement in the results could be obtainedif amsotropy (P1) is considered.- high sensitivity with the weighting spectra was found for the fewgroups cross sections, supporting even more the first conclusion.- it is not necessary to explicitly consider the coupling effect in
calculating the group constants of the cells of the border, at leastif the channel between elements is of the size of the present one orlower; this result can be extrapolated to HCPWR fuel elementcalculation, where these channels do not exist.
the water gap must be accurately represented by the spatialgrid to obtain adecquate weighting spectra.
as soon as new libraries become worldwide available, it isconvenient to check (or change) the data of the main heavy isotopes.
as the presented and H.HX systems results, on reaction rates,showed similar discrepancies with MC, in spite of using differentlibraries, specially in the 40% void case, maybe this MC resultsshould be checked.
Finally, the whole system, which was previously tested withthe PROTEUS cell /!/, has also proved to be completely acceptablefrom the point of view of fuel elements calculations. Further testswill be done as soon as new fuel element benchmarks becomeavailable.
ACKNOWLEDGEMENTS
The authors deeply appreciate the contributions of P.C.Floridoand S.E.Gômez, members of the research group.This work was partially supported by the UNDP and the IAEAthrough projects ARG/78/020 and ARG/89/012 'Nuclear Engineering .
REFERENCES
IM M.J.Abbate et al., "Progress report on the research activitieson high conversion reactors at centro Atomico Bari locheArgentina", Technical Committee Meeting on Technical and EconomicalAspects of High Converters, Nuremberg, FRG (March 1990)./2/ M.M.Sbaffoni and M.J.Abbate, 'DOT3.5-CAB. A new version ofDOTS. 5 code", CNEA/NT 18/85 (1985), sent to RSIC and NEA data bank( 1985 ).
/3/ M.Yamamoto et al, "Validation of HELIOS.HX code for highconversion light water reactor lattice analysis", Nucl. Techno!.,80, 240 (1988).
/4/ N.E.Patiho, M.J.Abbate and M.M.Sbaffoni, 'Evaluation of someresonance self-shielding procedures employed in high conversionlight water reactor design", PHYSOR conference, Marseille, France,(April 1990)./5/ Y.Ishiguro and K.Okuraura, 'Pancake core high conversionconcept", Nucl. Techno!., 84, 331 (1989).
LWR
REACTOR CALCULATIONS WITH AMULTIPARAMETERS LIBRARY
V. BRUN, B. CHANARON, J.M. DUBOISCommissariat à l'énergie atomique,Centre d'études nucléaires de Cadarache,Saint-Paul-lez-Durance, France
Abstract
In this paper we propose an approach to compute multi-parameter cross sections files. This is the first step of ourprogramme. Our goal consists in improving the calculation of acomplete reactor cycle taking into account feedback effects.This reactor is the french St-Laurent-Bl reactor which iscomposed of a UO2 zone and a MOX zone. Assembly calculationswill be performed with the APOLLO-1 transport code. Corecalculation will be performed with the CRONOS-2 diffusion codewhich determines the evolution of local isotopicconcentrations. We are therefore looking for a library whichcontains microscopic two groups cross sections for all heavyisotopes and some fission products.
We evaluate in this paper the effects of theapproximations only by cell calculations. The good agreementbetween all the results proves the validity of the approach.These results , nevertheless, need to be confirmed by a moreglobal analysis of the experimental power distribution andreactivity coefficients of the complete core.
I METHOD
Let us consider a small zone of a fuel assembly. It ischaracterized, at the current moment, by four main parameters :TM=moderator temperature, TC=fuel temperature, CB=boronconcentration, CX=xenon concentration. This zone evolves duringthe cycle along a certain path in the four dimensional space(TM,TC,CB,CX). The local microscopic cross sections at burnupBO are a functional of this path. It is obviously not possibleto store them for several pathes because of the very largequantity of datas.
Thus we will perform depletion calculation along areference path, which is a straight line at a reference set ofparameters (R) , and then we calculate at burnup BO crosssections at the current set of parameters. (In the corecalculation, the correct path will be of course followed.) Thisis the basic approximation. We do not know any alternative wayfor this.
Let us now describe the complete method :1) Choice of the parameters:There are -a priori- 4 not négligeable parameters TM,TC,CB
and CX.TM and TC are necessary to calculate thermal-hydraulicfeedback effects.The effect of boron concentration on neutron spectrum and
on two groups cross section of some isotopes is notnégligeable. The difference between calculations performed witha boron free library and a 500 ppm library is more than 100pcm.
We have shown that neglecting the influence of xenonconcentration on microscopic cross sections is a goodassumption. The reactivity errors are < 5 pcm.
In conclusion we will say that microscopic cross sectionsare a function of (TM,TC,CB) .
2) Discretization of the parametersIt is obviously not possible to represent a continuous
set. Cross sections are calculated at discrete values. For fueltemperature they are approximately proportional to the squareroot of TC. For moderator temperature they are approximatelyproportional to TM. Between these values cross sections arelinearly interpolated. For moderator it is an interpolationwith moderator density.
3) Reconstructing fluxesAt this point the computation time of multiparameter
library is still to large: For the 1/8 of a 17*17 PWR assembly,the computation time with the EURYDICE module of APOLLO codeneeds 200 s. Let us compute the assembly depletion between 0and 55 GWD/T using a burnup interval equal to 4GWD/T. We have14 burnup values. If we consider for each burnup 4 moderatortemperatures, 3 boron concentrations and 4 fuel temperatures wewill perform 4.4.3.14=672 calculations. The global computationtime is 37 hours. This time should be multiplied by the numberof different types of fuel assemblies - 6 in our reactor - .Thecomputation time becomes : 222 hours.
In order to simplify further calculations, fluxes areactually calculated at certain nodes as shown in figure 1 andreconstructed at the others nodes. (The CB axis is notrepresented in this figure). (i,j,k) denotes the set of the 3discretized parameters (TM,TC,CB) and (ir,jr,kr) or (R) thesame object in the particular case of the reference state. Forthe new assembly and the 55 GWD/T burned assembly, fluxes atthe general parameter set are derived from the actuallycalculated fluxes by using the formula :
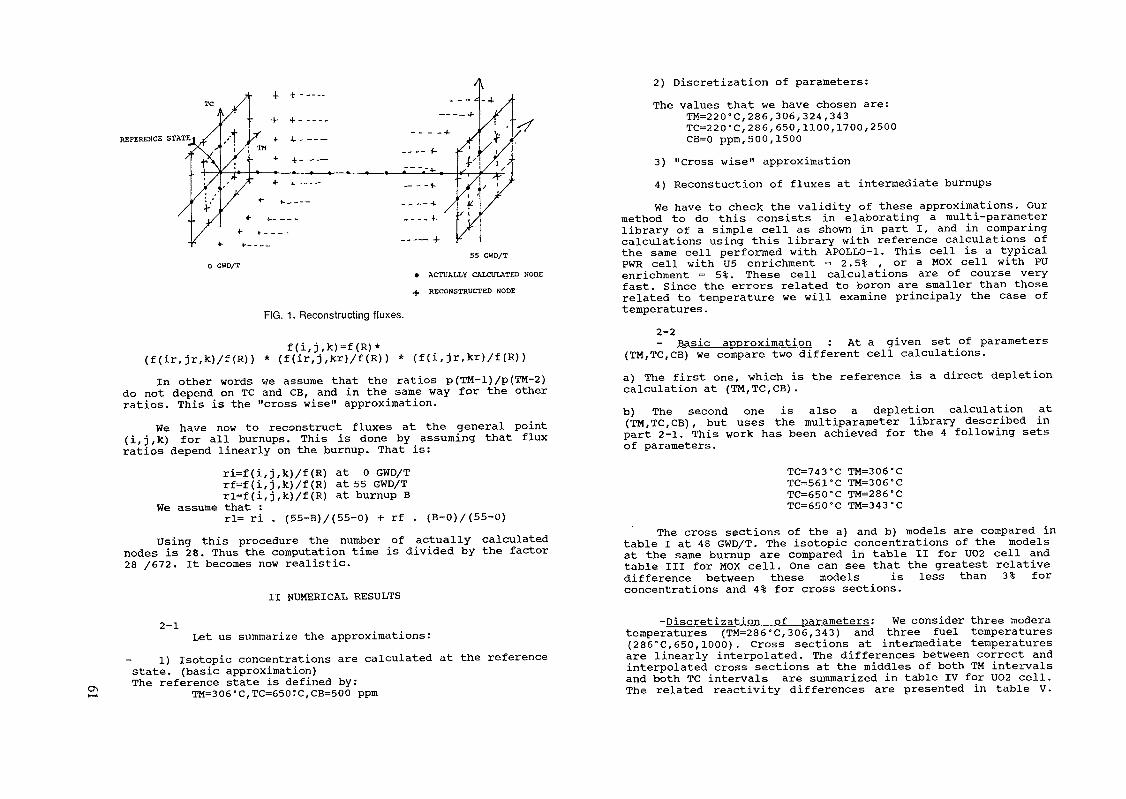
4- +-----
REFERENCE STATE
0 GWD/T
__ __ i
55 GWD/T
• ACTUALLY CALCULATED NODE-f RECONSTRUCTED NODE
FIG. 1. Reconstructing fluxes.
f ( i , j , k ) = f ( R ) *( f ( i r , j r , k ) / f ( R ) ) * ( f ( i r , j , k r ) / f ( R ) ) * ( f ( i , j r f k r ) / f ( R ) )
In other words we assume that the ratios p(TM-l)/p(TM-2)do not depend on 1C and CB, and in the same way for the otherratios. This is the "cross wise" approximation.
We have now to reconstruct fluxes at the general point(i,j,k) for all burnups. This is done by assuming that fluxratios depend linearly on the burnup. That is:
ri=f(i,j,k)/f(R) at 0 GWD/Trf=f(i,j,k)/f(R) at 55 GWD/Trl=f(i,j,k)/f(R) at burnup B
We assume that :rl= ri . (55-B)/(55-0) + rf . (B-0)/(55-0)Using this procedure the number of actually calculated
nodes is 28. Thus the computation time is divided by the factor28 /672. It becomes now realistic.
II NUMERICAL RESULTS
2-1 Let us summarize the approximations:1) Isotopic concentrations are calculated at the reference
state, (basic approximation)The reference state is defined by:
TM=306°C,TC=650:C,CB=500 ppm
2) Discretization of parameters:The values that we have chosen are:
TM=220°C,286,306,324,343TC=220°C, 286, 650, 1100, 1700, 2500CB=0 ppm, 500, 1500
3) "Cross wise" approximation4) Reconstuction of fluxes at intermediate burnupsWe have to check the validity of these approximations. Our
method to do this consists in elaborating a multi-parameterlibrary of a simple cell as shown in part I, and in comparingcalculations using this library with reference calculations ofthe same cell performed with APOLLO-1. This cell is a typicalPWR cell with U5 enrichment = 2.5% , or a MOX cell with PUenrichment = 5%. These cell calculations are of course veryfast. Since the errors related to boron are smaller than thoserelated to temperature we will examine principaly the case oftemperatures .
2-2- Basic approximation : At a given set of parameters(TM,TC,CB) we compare two different cell calculations.a) The first one, which is the reference is a direct depletioncalculation at (TM,TC,CB) .b) The second one is also a depletion calculation at(TM,TC,CB), but uses the multiparameter library described inpart 2-1. This work has been achieved for the 4 following setsof parameters.
TC=743°C TM=306°CTC=561°C TM=306°CTC=650°C TM=286°CTC=650°C TM=343°C
The cross sections of the a) and b) models are compared intable I at 48 GWD/T. The isotopic concentrations of the modelsat the same burnup are compared in table II for U02 cell andtable III for MOX cell. One can see that the greatest relativedifference between these models is less than 3% forconcentrations and 4% for cross sections.
-Discretization of parameters: We consider three modératemperatures (TM=286°C, 306, 343) and three fuel temperatures(286°C, 650, 1000) . Cross sections at intermediate temperaturesare linearly interpolated. The differences between correct andinterpolated cross sections at the middles of both TM intervalsand both TC intervals are summarized in table IV for UO2 cell.The related reactivity differences are presented in table V.

BASIC APPROXIMATIONiRMAL CROSS SECTION ERRORS AT 48 GWD/T (%)
Isotope
U235
U238PU38
PU39PU40PU41
PU42
XE35SM49
a2(D02)2,80
2,49
3,371,34
1,16
2,44
2,22
3,49
3,22
{2(U02)
2,80
-
3,26
1,46
0,582,56
2,55
--
02(MOX)
4,03
3,48
4,61
3,53
1,82
4,23
3,20
4,80
4,54
f2(MOX)4,00
-4,47
3,55
1,17
4,31
3,63
-
-
OO2
TABLE IIBASIC APPROXIMATION
CELL ; CONCENTRATION ERRORS AT 48 GWD/T (%)
IsotopeU235U236
U238NP37
PÜ38
PU39PÜ40
PU41
PU42AM41
AM42CM42
XE35SM49
TC = 743, TM = 306
- 0,41
0,01
3.10"3
0,03
- 0,10
- 0,27- 0,20
- 0,240,05
- 0,29
- 0,49
- 0,12
- 0,36
1,02
TC = 650, TM = 343
- 1,99
0,18
2.10~2
0,16- 2,21
- 1,48- 2,15
- 1,23
1,00
- 0,45
- 3,15
- 0,49
- 2,88
- 2,33
TABLE IIIBASIC APPROXIMATION
MOX CELL ; CONCENTRATIONS ERRORS AT 48 GWO/T (%)
IsotopeU235U236
U238
NP37
PU38PU39
PU40PU41
PU42AM41
AM42CM42
XE35SM49
TC = 743, TM = 306
- 0,08
0,03
4.10"3
- 0,03
- 0,07
- 0,24
- 0,05- 0,10
0,11
- 0,08
- 0,25
- 0,02
- 0,20
0,48
TC = 650 TM = 343- 0,36
0,11
2.10"2
- 0,36
- 0,65
- 1,14
0,27
- 0,68
0,83
- 0,21
- 2,18
- 0,59
- 1,49- 1,79
TABLE IVTEMPERATURE INTERPOLATION (O GWD/T)P02 CELL ; CROSS SECTION ERRORS (%1
U235U238PU239
PU240PU241BoreXEH2O
al0.027
0.0380.0280.075
0.030
a20,18
0,18
0,13
0,10
0.0440,200,21
0,19
l\
0.0300.0440.028
0.0250.029
tz0,19
0, 10
0.023

TABLE VTEMPERATURE INTERPOLATION
PO2 CELL t REACTIVITY ERRORS
TC TM
468 REF
825 REF
REF 296
REF 324
O GWD/T+ 24 (4.8)
- 13 (- 3)- 6 (- 5,3)
1 (- 1,5)
55 GWD/T41 (6)
5 (- 1,8)
+ 3 (-4,5)- 15 (-4,4)
- First number : reactivity error (pern) = eps- number in parenthesis : relative error onfeedback effect = eps / ((d /dT).(T-TKEF))
TABLE VICROSS WISE APPROXIMATION
REACTIVITY ERRORS AT 0 GWD/T (pcm)
TC TK CB
1700 324 REF
1100 286 REF
1700 REF 1500
REF 343 1500
REF 286 0
U02 Cell- 3
- 8
- 1
- 9
- 11
MOX cell+ 3
- 9
-*• 5
- 4— 7
Comparing these results, the conclusion is that the maximumerrors in the reactivities are 40 pcm for TC and 15 pcm for TM.They represent respectively 6% and 4.5% of the related feedbackeffects.
-"Cross wise" approximation : The reference library containcross sections actually calculated at each node (TM,TC,CB) Thedifferences between calculations using this reference libraryand the multiparameter one are presented in TABLE VI. Thereactivity errors are very small. Thus the hypothesis which weused for the reconstuction of fluxes is quite well verified.
-Reconstruction of fluxes at intermediate burnups : Forintermediate burnup we perform cell calculations with the multiparameter library and with a reference library actuallycalculated as this burnup. The relative differences are
TABLE VIIMOX CELL ; RECONSTRUCTION OP FLUXES BETWEEN 0 AND 55 GWD/T
REACTIVITY ERRORS (PCH)
TC TM CB
REF 343 KEF
KEF REF 1500
1100 REF REF
12 GWD/T+ 9
- 2
- 14
28 GWD/T
+ 3
- 1
- 18
44 GWD/T- 3
+ i
- 11
TABLE VIII002 CELL ; RECONSTRUCTION OP FLUXES BETWEEN O AND 55 GWD/T
REACTIVITY ERRORS (PCM)
TC TM CB
REF 343 REF
1000 REF REF
100 343 REF
10 GWD/T+ 75
+ 41
+ 112
30 GWD/T+ 46
+ 40
+ 67
45 GWD/T+ 20
+ 12
+ 19
TABLE IXDO2 CELL ; RECONSTRUCTION OF FLUXES
INTERPOLATION IN (0-12) AND (12-55) GWD/TREACTIVITY ERRORS (PCM)
TC TH CB
REF 343 REF
1000 REF REF
REF REF 1500
5 GWD/T+ 9
- 6
- 3
32 GWD/T
- 2
- 11- 4
presented in table VII for U02 cell and in table VIII for MOXcell. In the case of MOX fuel the approximation is satisfying.Unfortunately it is not true in the case of UO2 assembly. Thesolution consists in adding a third burnup B2
0 < B2 < 55 GWD/Tand in interpolating in the intervals 0-B2 and B2-55. One cansee that greatest errors occur toward 10 GWD/T. We choosetherefore B2=12 GWD/T. The errors become now acceptable. (Seetable IX).
ACKNOWLEDGMENTSWe would like to thank R LENAIN and A NICOLAS for helpfulassistance with this work.
PROJECT CELL CODE UPDATINGFOR MOX CALCULATION
A. VALLÉE, G.B. BRUNA,M. DOUCET, D. DOUTRIAUXFramatome,Paris-La Defense,France
AbstractRecycling Plutonium in PWRs was obviously followed in FRAMATOME by a
large scale research and development program, including theoreticalinspections, parametrical studies, experimental analysis and contributionsto international benchmarks.
The aim of this wide program is to acquire a full knowledge on thephysics of the water cooled and moderated Plutonium lattices, in order toallow the project computational methods up-dating.
The results have allowed an overall significant up-dating of theFRAMATOME project computational methods, mainly at the "cell" code level.
The main achievements in this field are:
- an up-dating of the four most important Pu isotopes [239, 240, 241,242] to the JEF-1 level,
- a correction of the Pu thermal v, [Ref. 5],£ jy- a simplified up-dating of the minor actinides,
a réévaluation of the equivalent F.P, cross-sections.
An outline of the whole programme is presented and the main resultsare summarized. Several elements of the qualification are given which areessentially based on critical experiments and power plant measurements.
1 . HISTORICAL BACKGROUND
Plutonium recycling in French PWRs was decided in June 1985. A genericsafety report, established jointly by FRAGEMA and EdF in 1986, demonstratedthe f disability of MOX (Mixed OXvdel recycling in such reactors, with amaximum 30 \ of MOX assemblies in each reload [Ref./1/]
Since then, several reloadings were successfully made both in Saint-Laurentand Gravelines plants
The decision to go further with plutonium recycling in PWRs initiated atFRAMATOME a wide research and development program, dealing with a fullknowledge of the physics of water moderated plutonium systems
A large scale faisability analysis, performed in FRAMATOME in the lateeighties on HCLWRs (High Converter tight gâter fieactors) [Ref./2/l, waswidely supported by a large experimental program carried on in a jointventure with EdF and CEA, [Ref./3/J.
In the meantime, a global program of up-dating the project computationalchain was started to verify the basic plutonium data and to adapt themethods to the new requirements of the system physics
A large-scale analysis, including calculation of the HCLWR benchmarkproposed by NEA Data-Bank, [Ref /4/], gave the following main conclusions
- the old basic plutonium data included in the project libraries had to besignificantly up-dated, in order to minimize the impact of cross-sectionerrors,
- the treatment of the minor actinides had to be revised to account fortheir larger contribution to the reactivity of the system, (Table 1),
the equivalent F P cross-section values had to be adapted to the newmaterial and spectral environment
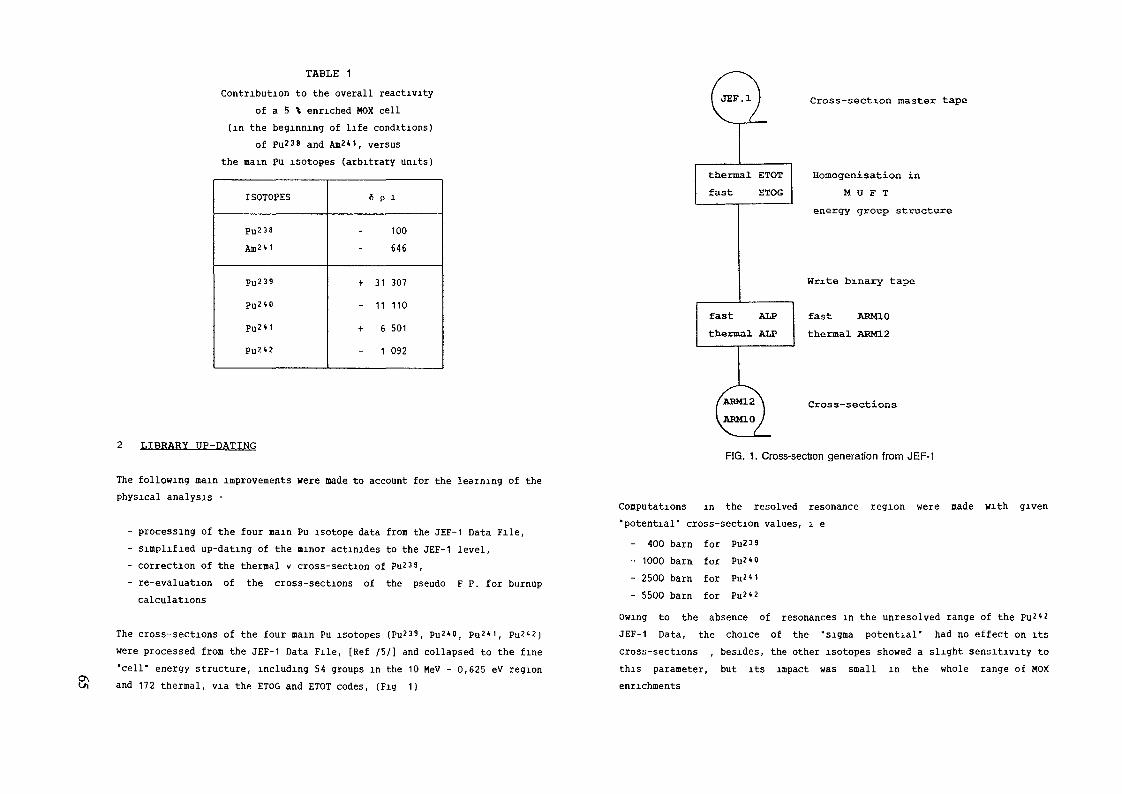
TABLE 1Contribution to the overall reactivity
of a 5 \ enriched «OX cell(in the beginning of life conditions)
of Pu238 and Am2*1, versusthe main Pu isotopes (arbitrary units)
ISOTOPES
PU238Am2*)
PU239
Puz*opU2*1
pu2*2
6 p 1
100646
+ 31 307- 11 110+ 6 501
1 092
o\
2 LIBRARY UP-DATING
The following main improvements were made to account for the learning of thephysical analysis •
- processing of the four main Pu isotope data from the JEF-1 Data File,- simplified up-dating of the ninor actinides to the JEF-1 level,- correction of the thermal v cross-section of Pu23',- re-evaluation of the cross-sections of the pseudo F P. for burnupcalculations
The cross-sections of the four main Pu isotopes (Pu238, Pu2*0, Pu2*', Pu2*2)were processed from the JEF-1 Data File, [Ref /5/] and collapsed to the fine"cell" energy structure, including 54 groups in the 10 MeV - 0,625 eV regionand 172 thermal, via the ETOG and ETOT codes, (Fig 1)
fast ALPthermal ALP
Cross-section master tape
Homogenisation inM 0 F T
energy group structure
Write binary tape
fast ARM10thermal AHM12
f ARM12 \ cross-sections
V il_
FIG. 1. Cross-section generation from JEF-1
Computations in the resolved resonance region were made with given"potential" cross-section values, i e- 400 barn for Pu233- 1000 barn for Pu2*"- 2500 barn for Pu2*'- 5500 barn for Pu2*2
Owing to the absence of resonances in the unresolved range of the Pu2*2JEF-1 Data, the choice of the "sigma potential" had no effect on itscross-sections , besides, the other isotopes showed a slight sensitivity tothis parameter, but its impact was small in the whole range of MOXenrichments
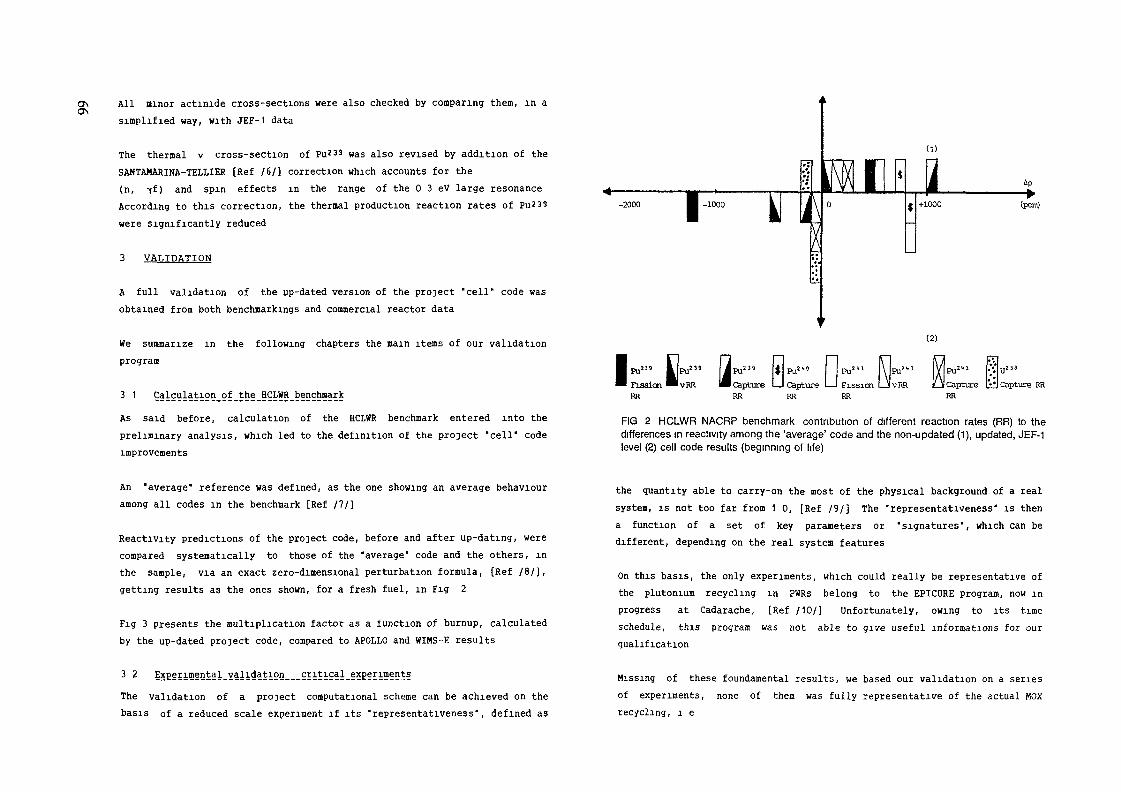
All minor actinide cross-sections were also checked by comparing them, in asimplified way, with JEF-1 data
The thermal v cross-section of Pu239 was also revised by addition of theSANTAMARINA-TELLIER [Ref /6/] correction which accounts for the(n, ff) and spin effects in the range of the 0 3 eV large resonanceAccording to this correction, the thermal production reaction rates of Pu239were significantly reduced
3 VALIDATION
à full validation of the up-dated version of the project "cell" code wasobtained from both benchmarkings and commercial reactor data
We summarize in the following chapters the main items of our validationprogram
3 1 Calculation of_the HCLWR_benchmarkAs said before, calculation of the HCLWR benchmark entered into thepreliminary analysis, which led to the definition of the project "cell" codeimprovements
(l)
-2000 • -1000 k rX
1 $0
I ;$
1 • • ""'--"-"^+1000 (pcm)
(2)
VRR
Pu2"1 K U2"
»Capture til Capture RRRR
FIG 2 HCLWR NACRP benchmark contribution of different reaction rates (RR) to thedifferences in reactivity among the 'average' code and the non-updated (1), updated, JEF-1level (2) cell code results (beginning of life)
An "average" reference was defined, as the one showing an average behaviouramong all codes in the benchmark [Ref /7/]
Reactivity predictions of the project code, before and after up-dating, werecompared systematically to those of the "average" code and the others, inthe sample, via an exact zero-dimensional perturbation formula, [Ref /8/],getting results as the ones shown, for a fresh fuel, in Fig 2
Fig 3 presents the multiplication factor as a function of burnup, calculatedby the up-dated project code, compared to APOLLO and WIMS-E results
3 2 lxp.erimental_yalidatign_critical.experimentsThe validation of a project computational scheme can be achieved on thebasis of a reduced scale experiment if its "representativeness", defined as
the quantity able to carry-on the most of the physical background of a realsysten, is not too far from 1 0, [Ref /9/] The "representativeness" is thena function of a set of key parameters or "signatures", which can bedifferent, depending on the real system features
On this basis, the only experiments, which could really be representative ofthe plutonium recycling in PWRs belong to the EPICURE program, now inprogress at Cadarache, [Ref /10/3 Unfortunately, owing to its timeschedule, this program was not able to give useful informations for ourqualification
Hissing of these foundamental results, we based our validation on a seriesof experiments, none of them was fully representative of the actual «OXrecycling, i e
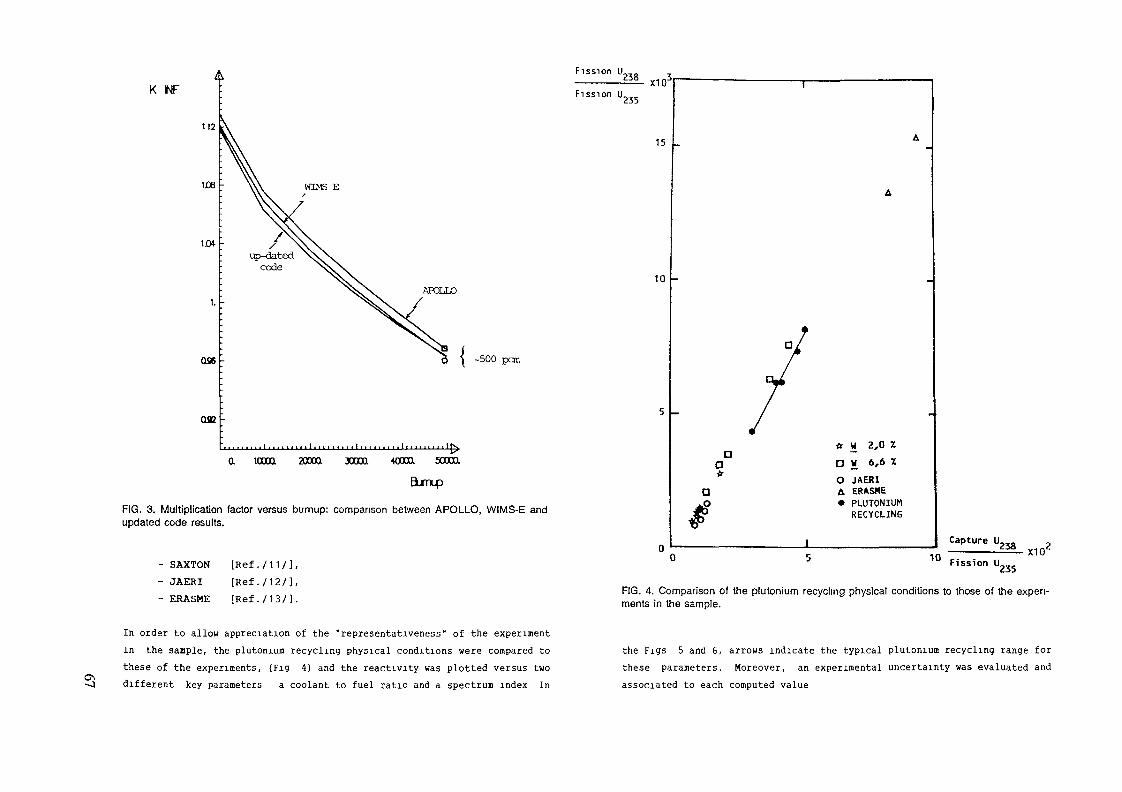
K INF
Fission U238Fission U235
APOLLO
500 pan
QSß -
a icon
FIG. 3. Multiplication factor versus burnup: comparison between APOLLO, WIMS-E andupdated code results.
- SAXTON [ R e f . / 1 1 / J ,
- JAERI [ R e f . / 1 2 / ] ,- ERASME [ R e f . / 1 3 / ] .
In order to allow appreciation of the "representativeness" of the experimentin the sample, the plutonium recycling physical conditions were compared tothese of the experiments, {Fig 4) and the reactivity was plotted versus twodifferent key parameters a coolant to fuel ratio and a spectrum index In
X10'
15
10
5 -
a** ± 2,0 ZD « 6,6 XO JAERIA ERASME• PLUTONIUM
RECYCLING
Capture U10
238 xio2Fission U.235
FIG. 4. Comparison of the plutonium recycling physical conditions to those of the experi-ments in the sample.
the Figs 5 and 6, arrows indicate the typical plutonium recycling range forthese parameters. Moreover, an experimental uncertainty was evaluated andassociated to each computed value
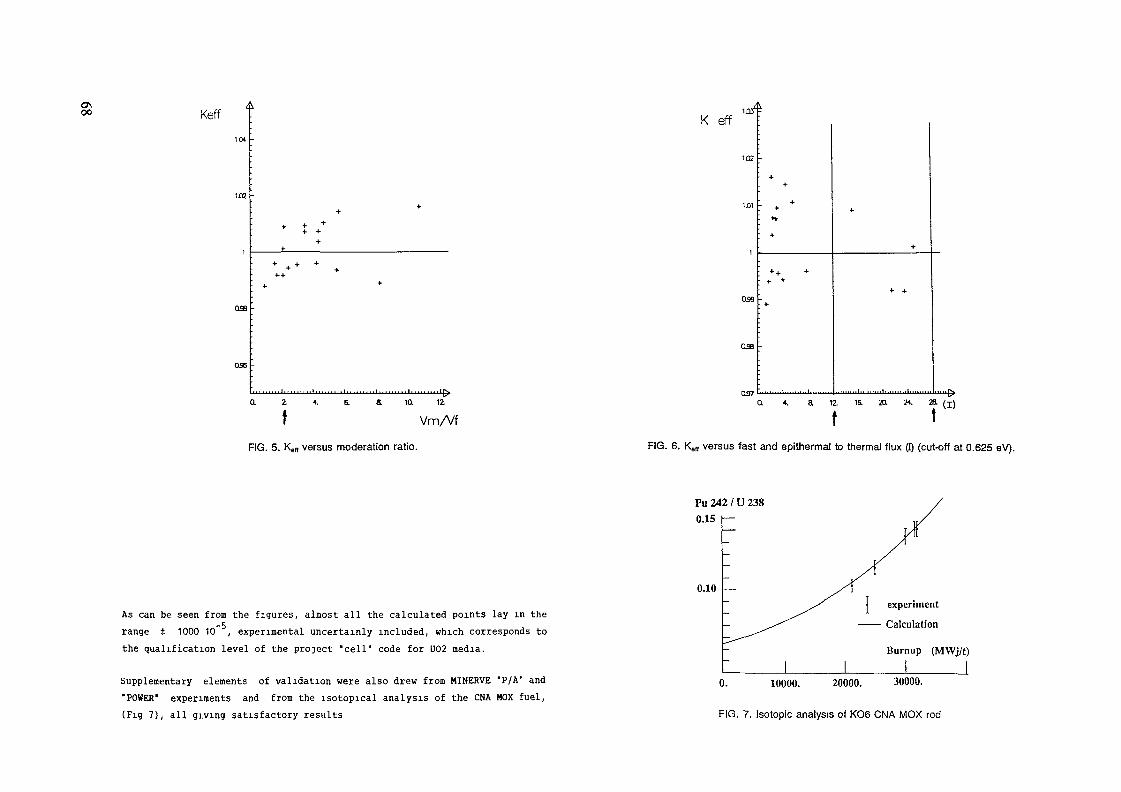
00 Keff
a 2 4. 6. a ia 12t Vm/Vf
FIG. 5. Ken versus moderation ratio.
K eff
099 -
a •*. s iz is. za 2«. a (j)t t
FIG. 6. K0„ versus fast and epithermal to thermal flux (I) (cut-off at 0.625 eV).
As can be seen from the figures, almost all the calculated points lay in therange ± 1000 10 , experimental uncertainly included, which corresponds tothe qualification level of the project "cell" code for U02 media.
Supplementary elements of validation were also drew from HINERVE "P/A" and"POWER" experiments and from the isotopical analysis of the CNA MOX fuel,(Fig 7), all giving satisfactory results
Pu 242 / U 2380.15 h—
0.10I experiment
—— Calculation
Burnup (MWj/t)
0. 10000. 20000. 30000.
FIG. 7. Isotopic analysis of KO6 CNA MOX rod
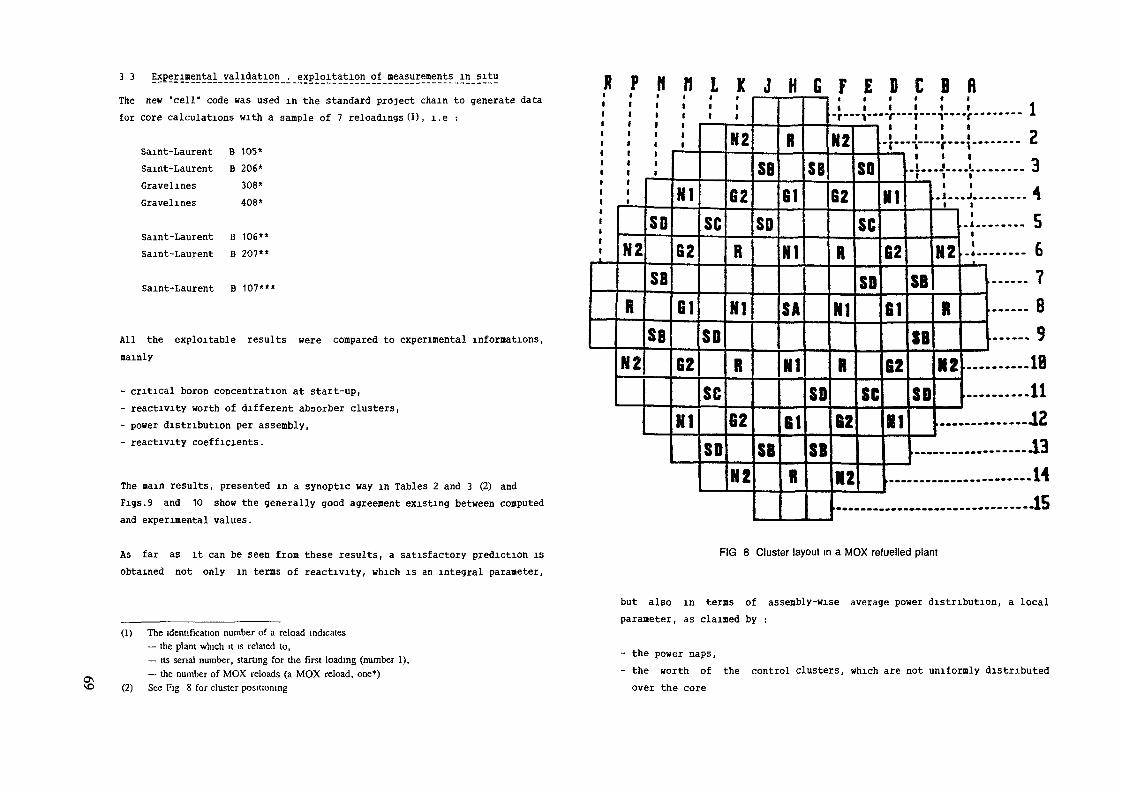
measurements in SltuThe new "cell" code was used in the standard project chain to generate datafor core calculations with a sample of 7 reloadings (1) , i.e :
Saint-LaurentSaint-LaurentGravelinesGravelines
B 105*B 206*308*408*
Saint-Laurent B 106**Saint-Laurent B 207**
Saint-Laurent B 107***
All the exploitable results were compared to experimental infornations,mainly
- critical boron concentration at start-up,- reactivity worth of different absorber clusters,- power distribution per assembly,- reactivity coefficients.
The nain results, presented in a synoptic way in Tables 2 and 3 (2) andFigs.9 and 10 show the generally good agreement existing between coaputedand experimental values.
As far as it can be seen from these results, a satisfactory prediction isobtained not only in terms of reactivity, which is an integral paraaeter,
(1) The identification number of a reload indicates— the plant which it is related to,— its serial number, starting for the first loading (number 1),— the number of MOX reloads (a MOX reload, one*)
(2) See Fig 8 for cluster positioning
K P
t
N?
N2
fi
sn
CDdB
OBOB
n
Ml
R9Q£
etH 1
R9o£
NIn •
L•
Ç.I*ou
enOU
*,rou
SD
K•i
119
ß9oc
Mln l
119
J
OBdB
enOU
en9U
H
R
61
Kln B
eiOH
Nln •
61
R
G
CBdB
SD
SD
Fi-r—
K2*i&
04iZ
NI•• 1
R
6?
E•
"V
sn«u
epou
enOU
fiCOb
Di
•T"
1l"
NI
62
61• l
62
NI
C•T"
1
•v1it
SD
enSB
B«
•v—
vs
..«..i
.1..
H9
R
N2n »
R• i-r ———— *! ?-r—— c
..L...... 3i
.1........ 4. ........ 5. ........ 6
l ...... 7...... B...... 9
..........18
..........1112
...........A3...........M...........45
FIG 8 Cluster layout in a MOX refuelled plant
but also in terms of assembly-wise average power distribution, a localparameter, as claimed by :
- the power maps,- the worth of the control clusters, which are not uniformly distributed
over the core

-Jo TABLE 2Critical boron concentrations at beginning of cycle, zero powercalculations. Comparaisons among predicted and experimental values.
RELOADING
SB105*SB206*
GR308*GR408*
SB106"SB207**
DEVIATION(ppm) $
3015
+ 9+ 5
+ 38+ 13
** *
1 MOX reload2 MOX reloads1 ppm = 1.0 10-6
Average deviation first reloadsAverage deviation second reloads
8 ± 18 ppm26 ± 16 ppm
TABLE 3Comparison between predicted and experimental cluster worth, corecalculations
Average deviation = + 1 . 1 ±4.0%
R
G1
G2
N1
N2
SB
SC
SA + SD2
SD1
SA + SD
SB 105
\ DEVIATION
+ 3.9
4.8
- 0.6
+ 0.1
•*• 4.8
+ 6.1
- 4.9
+ 0.4
0
-
SB206• DEVIATION
+ 0.5
+ 5.0
+ 1.5
1.0
+ 1.4
+ 5.9
- 2.8
+ 1.9
t 0.5
-
GR408\ DEVIATION
+ 2.5
+ 2.9
5.5
1.6
- 0.4
+ 5.1
+ 1.7
-
-
- 3.5
SB 106\ DEVIATION
+ 7.9
1.0
1.8
+ 4.1
3.0
3.2
+ 1.7
+ 8.4
0.9
-
SB207% DEVIATION
+ 5.9
+ 8.0
+ 2.1
+ 5.0
5.9
4.5
+ 8.7*
-
-
+ 0.1
4. CONCLUSION * In this case, SC cluster is inserted in HOX assemblies only
Jointly with the start-up of the plutonium recycling in PWR, a wide analysiswas made at FRAMATOHE ; the aim was to up-date the project "cell" code inorder to get its full validation for every computational circumstance forMOX reload projects.The modified code was validated on both benchmarks and experiences.
The present paper summarizes most of the results obtained in thequalification program of the code.

CENTRALE DE ST LAUR TRANCHE 1 CYCLE 5R P N U L K J H C F E D C
2
3
4
5
6
7
90 '8
9
10
11
12
13
K J H G F E180 '
45.7
-1.3
3.2
40.8
40.7
1.0
+4.9
»0.7
+•3.7
-2.5
44.4*
-2.6
-2.9
4.4
0.7
0.
-0.3
2.8
-1.3
1-3.1
-O.J
-3.2
-4.2
-3.3
E
270 •
CENTRALE DE ST LAUR TRANCHE 1 CYCLE 5R P N M L K J H G F E D C B A
180 '
6
7
90 '8
9
10
11
12
13
U
15
»-2.3
-0.7
+1.0
1-0.5
K).5
-0.9
H.l
fO.2
K>.8
K).9
h2.3*
-2.9
-4.5
+1.9
+1.3
+1.5
+0.3
-0.«
+0.
+1.4
-2.2
-5-5
-0.
-2.
E
270 '
M3X assemblies* MXC assentolies
E = C-M (%) BEGINNING OF LIFEE = C-M (%) END OF CYCLE
FIG. 9. FIG. 10.

REFERENCES
/1/ M. ROME, G. FRANCILLON, J LEBARS, "Plutonium Recylcing Experince inFrench PWR Plants : Neutronic Results", in AIEA Technical Meeting onRecycling of Plutonium and Uranium in Water Reactor Fuels, Cadarache,November 13-16, 1989 ;
/2/ A. VALLEE, J.P. MILLOT, G.B. BRUNA, "The FRAMATOME RCVS Concept andPhysics", Proceedings of the ENC '86. Geneva, June 1-6, 1986 ;
/3/ B. BARRE, J.M. COURTAUD, M. DARROUZET, C. GOLINELLI, J.P. SCHWARTZ,G. GAMBIER, "Advenced PWRs : Prospects and Experimental Basis",Proceedings of the EHC '86 Meeting. Geneva, June 1-6, 1986 ;
/4/ W. BERNNAT, Y. ISHIGURÛ, E. SARTORI, J. STEPANEK, M. TAKANO, "Advancesin the Analysis of the NEACRP High Conversion LWR Benchmark Problems",Proceedings of the Phvsor '90 Meeting. Marseille, April 23-27, 1990 ;
/5/ JEF Report 1, July 1985 OCDE - NBA Data-bank : "Index to the JEF 1Nuclear Data Library" ;
/6/ A. SANTAMARINA, H. TELLIER, "The French CEA Multigroup Cross-SectionLibrary and its Integral Qualification", Proceedings of theInternational Conference on Science and Technology Nuclear Data.Mito, Japan 1988 ;
HI Proceedings of the HEACRP Specialists' Meeting on HCLWR BurnupBenchmark. Saclay, June 1989 ;
/8/ J. PORTA, J Y. DORIATH, A. MOURGUES, «. NOBILE, A VALLEE andG.B. BRUNA, Nucl. Sei End. 95. 266-281 (1987) ;
/9/ G PALMIOTTI, P CHAUCHEPRAT, J. MONDOT, M SALVATORES, M NOBILE,A. VALLEE, "uncertainty and Sensitivity Analysis for PowerDistributions and Reactivity Coefficients", Proceedings of the ANSTopical Meeting on Advances in Nuclear Engineering. Computation andRadiation Schielding, Santa Fe, New Mexico, April 9-13 89 ;
/10/ J. MONDOT and al., "An Experimental Program Devoted to the Validationof the Schemes for Plutonium Recycling in PWRs, "Proceedings of Phvsor:90 Meeting. Marseille, April 1990.
/11/ E.G TAYLOR, "Critical Experiments for the SAXTON Partial PlutoniumCore", Report WCAP-3385-54, EURAEC-1493 (1965) ;
/12/ I. KOBAYASHI al. "Critical Experiments and Analysis on Light WaterModerated Pu 02 - 002 Lattices", JAERI, Memo 5745, (1974) ;
/13/ L MARTIN-DEIDIER, A. SANTAMARINA, S. CATHALAU, J.P. CHAUVIN,J.M. GOMIT, "Undernoderated PWR Neutronic Qualification Through theERASME Experiments", Proceedings of the International Topical Meetingon Advances in Reactor Physics. Mathematics and Computation. Pans,April 27-30, 1987.

PREPARATION OF CROSS SECTION LIBRARIESFOR PWR URANIUM AND MOX ASSEMBLIES
D.C. LUTZInstitut fir Kernenergetik und Energiesysteme,Universität Stuttgart,Stuttgart, Federal Republic of Germany
Abstract
This report regards the way from cross section data base to few group li-braries for reactor calculations It starts with the calculation of a very de-tailed weighting spectrum for the generation of multigroup cross sectionsSpecial emphasis is lam on a good resonance treatment In a second step bur-nup calculations for assembly cells have been performed, which m most casesmay be 1-dimensional, but are 2-dimensional for MOX assemblies Equiva-lence theory methods have been used to prepare homogeneous 2-group crosssections They are gathered m a multi-parameter representing the depen-dancies of macroscopic cross sections for operational conditions The appli-cability of the library is demonstrated by 2-dimensional cycle calculationsfor PWRs
"lo3 io"z 10"' 10° lo1 10* io3 10* 10" 10°Energy [eV]
Figure 1 The weighting spectrum for MOX fuel calculated with CGM [4]
1 Generation of Multigroup Cross Section Li-braries
The cross section basis is the JEF-1 data file [1], which is processed [2] withthe NJOY programm system [3] into multigroup data 3 Libraries are available infollowing energy ranges
• fast and epithermal range, 100 groups,• the resolved resonance region, 8500 groups,• the thermal range, 151 groups
These libraries are used in the code CGM [4] for one dimensional spectral calculations for group collapsing to 45 (10 fast, 35 thermal) groups The generated datasets are dependent of the cell definition in CGM, mainly in the groups containingresonances They include the effects of self and mutual shielding and resonanceoverlapping Even for HCLWR problems this method can by applied successfully(5) Figure 1 shows the weighting spectrum foi the fuel isotopes calculated withCGM for a MOX pin cell of a PWR assembly
2 Cell Burnup Calculations for the Assemblies
2.1 One-dimensional Cell Models
The local dependancy of spectra in PWR Uranium assemblies isn't verystrong Therefore one dimensional cylindrical models are a good approach for theassembly For Uranium assemblies a two stage cylindrical model is used as as-sembly cell Even if boron glas pins or control rods are inserted in the assemblythe one dimensional Models give good results because of rather good symmetricdistribution of the guide tubes The cell burnup calculations are done m RSYSTl[6] using a collision probability code For 16 Actmides and 64 fission product iso-topes the burnup equations are solved For every burnup step a series of differentassembly calculations is performed to take into account the influence of moderatorand fuel temperature and boron concentration on the cell spektra
The first series of MOX assemblies inserted in a PWR in our country contamed only 2 different pin types, low enriched at the boundary row and higherenriched ones at the other positions Such an assembly as a whole can also bepresented by a cylindrical model, but the surrounding Uranium assemblies have

1
1
3(S
* 67B
_ —— L10n1213H
lA B C D EAAA•
V
*
•
•
•
•
•
AAA
A»
•
•
•
•
•
A
A*
Ü
o
o
o•
A
o
o
1
F G H K
•
0
o•
•
o
o•
0/350*
i
L H II P R
0
O
A*
O
0
o
0•
A
A*
•
•
•
•
»
A
AAA•
*
•
»
*
•
•
•
AAA
————— « ——
[A] iov[•] me
D big
Nodal mesh lines
[A| low Pur |O| Führungsrohr
iPuf
Puf
Figure 2: Enrichment distribution in a PWR MOX assembly
to be taken into account during the burnup calculations. The new MOX assemblydevelopped for the KWO reactor [7] is shown in figure 2. It has 3 different enrichedpins and it is hard to find a 1-dimensional model for it. The same statement goesfor all BWR asssemblies mainly if they contain MOX.
2.2 Two-dimensional Cell Models
The RSYST code for 2-dimensional assembly calculations is ICM2D [8]. Itworks with the J -méthode for homogeneous meshes, treats anisotropic scatteringand includes a linear space and angular dependancy of the flux. The homogenizedpin cell cross sections for this code are prepared using the SPH method [9]. Figure3 shows the power density distribution in one eighth of the MOX assembly in figure2 surrounded by Uranium assemblies. In the inner part of the MOX assembly thepower density is low because of the shielding effect. The highest values are in theneighborhood of the outer waterholes. The power and burnup distribution in acolour set of BWR MOX and Uranium assemblies containing Gd poisoned pinsrepresents figure 5. The fuel assemblies are arranged in a chessboard way. The
4 —————— 4'
Z 0.97 Z
Z 0.99 Z
Z 1.00 Z
1 1.01 1
Z 1.02 1
Z 0.93 1
Z 0.82 Z
Z 1.02 Z
Z 1.D3 I
Z 1.02 Z
Z 0.92 Z
Z 0.87 I
Z 0.8« Z
Z 0.83 I
0
1
1
l
t>
0
D
1
0
0
J
0
0
.99
.01
.06
.06
.00
.96
.82
.03
.92
.00
.01
.97
.88
Z
Z
zzzzz
zzzz1z
1.01
1.06
0.00
1.07
1.03
0.9«
0.82
1.03
1.05
1.05
1.03
0.00
Z
zzzzzz
II
zzz
1.0«
1.08
1.09
1.05
1.03
0.9«
0.83
1.06
1.07
1.06
0.99
Z
zzzzzz
11zz
1.07
0.00
1.07
1.06
0.00
0.97
O.Bf
0.90
1.00
0.00
1
Z
zzzzI
zz
z
1.03 Z
1.06 1
1.03 1
1.02 1
1.02 Z
0.9S Z
0.87 Z
0.9« Z
1.03 1
1.01 Z Z 1.01 Z 1.03 Z 1.07 Z 1.04 Z 1.02 Z 0.99 Z 0.98 1
1.02 Z Z 1.02 Z 1.06 Z 0.00 1 1.09 Z 1.07 Z 1.02 Z
1.01 1 Z 1.01 1 1.03 Z 1.08 Z 1.10 1 D.DO Z
1.00 II 1.01 I 1.03 Z 1.08 Z 1.07 Z
0.99 Z Z 1.00 Z 1.0« Z 0.00 Z
0.95 1 Z 0.97 I 1.00 Z
0.90 Z Z 0.95 Z
I.W I
Figure 3: Power density in a cluster of PWR MOX and Uranium assemblies
1.15
1.10
1.05
1.00
..... - u—— — UUU
— ———— UUM
//
/1?
0
S'"/^
5A b b r o
^ ~-,^
, "X**N^*. *x N4
•^ \x\ X"—————
^
10n d , M W d / l j S M
-,
\\15
"20
Figure 4: kx of BWR MOX and Uranium assemblies in function of the burnup
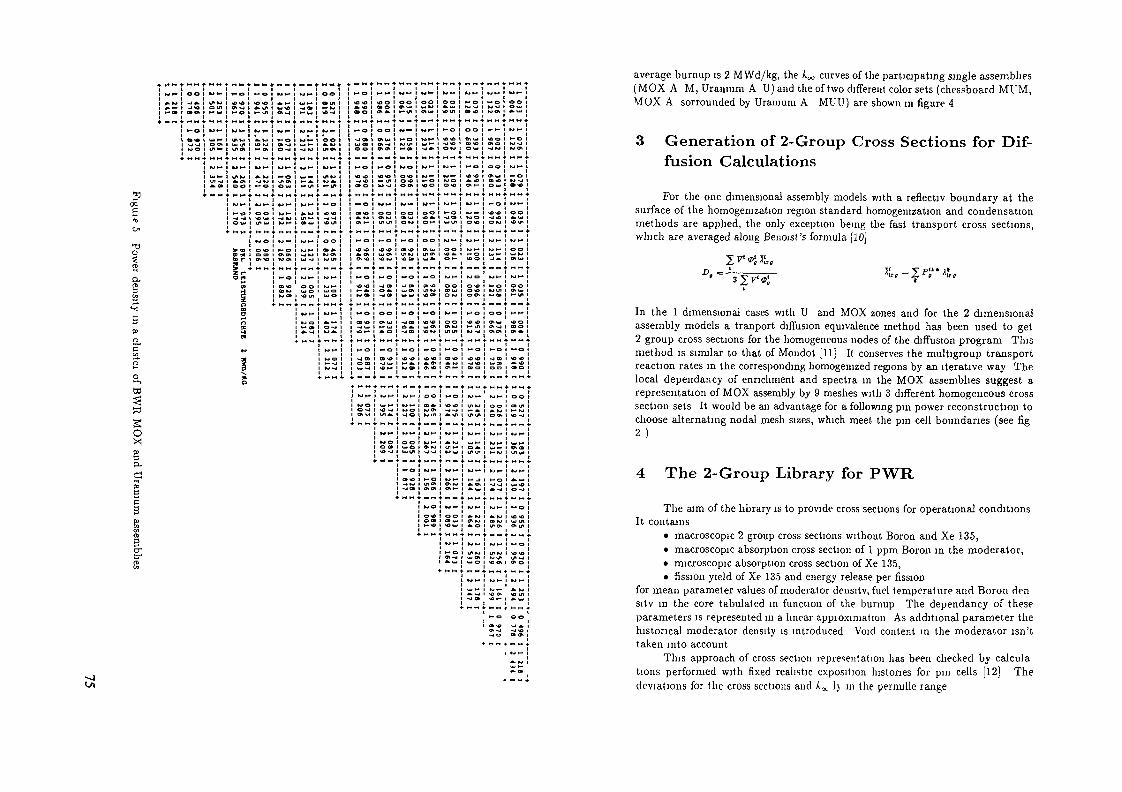
OSc
o>-*>Cd
SoX£a.0»1
gH
h-0
~4 CB
average burnup is 2 MWd/kg, the k^ curves of the participating single assemblies(MOX A M, Uranium A U) and the of two different color sets (chessboard MUM,MÜX A sorrounded by Uranium A MUU) are shown in figure 4
Generation of 2-Group Cross Sections for Dif-fusion Calculations
For the one dimensional assembly models with a reflectiv boundary at thesurface of the homogemzation region standard homogemzation and condensationmethods are applied, the only exception being the fast transport cross sections,which are averaged along Benoist's formula [10]
2 !* «i J!r,
In the 1 dimensional cases with U and MOX zones and for the 2 dimensionalassembly models a tranport diffusion equivalence method has been used to get2 group cross sections for the homogeneous nodes of the diffusion program Thismethod is similar to that of Mondot [11] It conserves the multigroup transportreaction rates in the corresponding homogenized regions by an iterative way Thelocal dependancy of enrichment and spectra in the MOX assemblies suggest arepresentation of MOX assembly by 9 meshes with 3 different homogeneous crosssection sets It would be an advantage for a following pin power reconstruction tochoose alternating nodal mesh sizes, which meet the pin cell boundaries (see fig2 )
4 The 2-Group Library for PWR
The aim of the library is to provide cross sections for operational conditionsIt contains
• macroscopic 2 group cross sections without Boron and Xe 135,• macroscopic absorption cross section of 1 ppm Boron in the moderator,• microscopic absorption cross section of Xe 135,• fission yield of Xe 135 and energy release per fission
for mean parameter values of moderator density, fuel temperature and Boron densitv in the core tabulated in function of the burnup The dependancy of theseparameters is represented in a linear appioximation As additional parameter thehistorical moderator density is introduced Void content in the moderator isn'ttaken into account
This approach of cross section representation has been checked by calculalions performed with fixed realistic exposition histories for pin cells [12] Thedeviations for the cross sections and k^, 1} m the permille range

11.0911.04
91.0261.02
171.15«1.15
251.18".1.16
S3i. 2 161.22
«01.1201.12
»70.9851.02
S30.6830.71
,___. _ 4
10J.1201.12
1t1.0791.07
261.2251.21
341.1831.17
«11.1541.16
480.9971.02
5*1 0.752I 0.77
I19 I
1.19911.1» I
127 J
1.181!1.16 I
I35 1
1.19911.19 1
I«2 I
1.08811.09 I
I49 I
0.95610.99 I
55 1I 0.633II 0.66 1
281.2031.18
361.0721.06
431.013I.OB
50Û.9710.97
560.5700.56
I37 I
1.25«!1.24 I
I44 1 4
0.9171 0.9 60.91 I 0.9
I51 1 5
0.9471 0.5 30.82 I 0.4
.1
Figure 6: Power distribution in a PWR containing Boron pins at BOC1
5 2-Dimensional Cycle Calculations
The initial cycle of a PWR with inserted Boron has been calculated usinga 2-dimensional nodal diffusion code with axial buddings and thermohydraulicfeedback. Figures 6 and 7 show the resulting power distribution at BOCl andEOCl,respectivly, together with the results of the manufacturer. The agreementis satisfactory.
Other applications are calculations of the cycles 18 and 19 of the KWOreactor. In its relativly small core ( 300 MWel ) with 109 fuel assemblies 12 and 16,respectivly, MOX assemblies have been inserted. Local dependant axial buddingstaken of the results of a 3-dimensional calculation of a previous cycle simulatedthe third dimension. Figures 8 and 9 show a comparison of the calculated Boroncurves with the measured ones. The figures contain the results based on ENDF/B-IV/V and JEF-1 base. The JEF-curves are shifted to higher Boron concentrationsup to 50 ppm.
11.0421.05
91.1021.11
171.0391.05
251.1071.12
331.0531.06
401.1291.13
471.0031.01
530.802o.to
______
101.04D1.05
IB1.1001.11
261.0441.05
341.1221.13
411.0631.06
4»1.1131.12
54O.S200.01
>
I19 I
1.04311.05 I
127 I
1.11911.13 I
I35 I
1.06511.07 1
I42 I
1.12611.13 I
I49 I
0.975t0.98 I
I55 1
0.75110.75 1
I2» I
1.07011.07 I
136 I
1.14411.14 1
I43 I
1.05211.05 I
I50 1
1.02011.03 I
I56 I
0.64310.61 I
I37 I
1.16211.18 t
I44 I 45
1.0661 1.0061.07-1 1.01
I51 I 52
0.8821 0.6110.86 I 0.57
Figure 7: Power distribution in a PWR containing Boron pins at EOC1
ieA. MD/KCSU
Figure 8: Measured and calculated Boron curves of 18. cycle of the KWO reactor
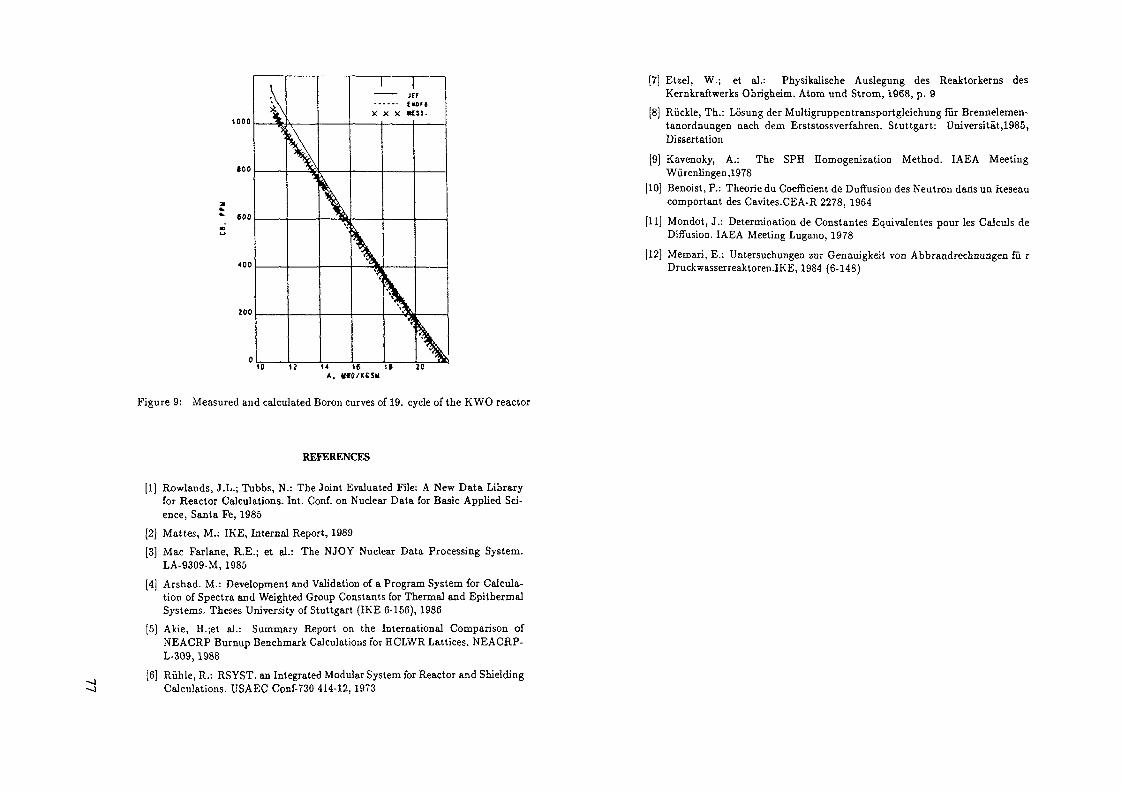
1000
zoo
Figure 9: Measured and calculated Boron curves of 19. cycle of the KWO reactor
REFERENCES
[1] Rowlands, J.L.; Tubbs, N.: The Joint Evaluated File: A New Data Libraryfor Reactor Calculations. Int. Conf. on Nuclear Data for Basic Applied Sci-ence, Santa Fe, 1985
[2j Mattes, M.: IKE, Internal Report, 1989[3] Mac Farlane, R.E.; et al.: The NJOY Nuclear Data Processing System.
LA-9309-M, 1985[4] Arshad. M.: Development and Validation of a Program System for Calcula-
tion of Spectra and Weighted Group Constants for Thermal and EpithermalSystems. Theses University of Stuttgart (IKE 6-156), 1986
[5] Akie, H.;et al.: Summary Report on the International Comparison ofNEACRP Burnup Benchmark Calculations for ECLWR Lattices. NEACRP-L-309, 1988
[6] Rühle, R.: RSYST. an Integrated Modular System for Reactor and ShieldingCalculations. USAEC Conf-730 414-12,1973
[7] Etzel, W.; et al.: Physikalische Auslegung des Reaktorkerns desKernkraftwerks Obrigheim. Atom und Strom, 1968, p. 9
[8] Rückle, Th.: Lösung der Multigruppentransportgleichung für Brennelemen-tanordnungen nach dem Erststossverfahren. Stuttgart: Universität,1985,Dissertation
[9] Kavenoky, A.: The SPH Homogenization Method. IAEA MeetingWürenlingen,1978
[10] Benoist, P.: Theorie du Coefficient de Duffusion des Neutron dans un Keseaucomportant des Cavités.CEA-R 2278, 1964
[11] Mondot, J.: Détermination de Constantes Equivalentes pour les Calculs deDiffusion. IAEA Meeting Lugano, 1978
[12] Memari, E.: Untersuchungen zur Genauigkeit von Abbrandrechnungen fü rDruckwasserreaktoren.IKE, 1984 (6-148)

-aoo MODIFICATIONS OF THE BURNUP CHAINSFOR ADVANCED FUEL CALCULATIONS
B.C. LUTZInstitut für Kernenergetik und Energiesysteme,Universität Stuttgart,Stuttgart, Federal Republic of Germany
Abstract
The influences of some minor Actinides on k„, have been proven for standardUranium fuel and some kinds of advanced fuel. Pin cell burnup calculationswith modified Actinide chains showed, that in normal Uranium fuel theeffects of (n,2n)-reactions and of the isotopes U-234 and Pu-238 are in thepermille range and cancel each other rather well up to burnup values of45 Mwd/kg. For higher burnups the connection between Np-237 and thePu chain gets significant. The Am isotopes shouldn't be neglected in theburnup range higher 30 MWd/kg. Reprocessed Uranium has a higher U-234concentration than fresh Uranium with an effect of 0.5 % on fc„. Becauseof the initial U-236 content the connection from Np-237 to the Pu isotopesbecomes earlier effective. It should be established if discharge burnups higher30 MWd/kg are projected. In MOX fuel the Am isotopes play the leadingrole, of course, and have to be taken into account. Some of the Cm isotopesshould be included also in the Actinide chain for MOX calculations.The rest absorption of Gd poisoned fuel has been calculated for extendedburnups for Gd oxide contents in fuel of 4 % and 10 %. The values at theminimum are 6 % and 14 %, respectivly. They increase with the burnupbecause of built up of Tb and Dy.
65.0 90. 110. 130. 150. 175.0Atomic weight
Figure 1: Fission yields of U-235 and Pu-239 [1]
1 Introduction
The tendency in fuel management to high burnup fuel and to insertion ofspent and reprocessed fuel in LWR cores are arguments to review the calculationalreactorphysical models. This has been done in this contribution with regard tothe isotopic chains, for which the burnup equations have to be solved performingburnup calculations. The main effects are caused by the Actinide chain, of course.Therefore the main emphasis of this report is to look for an answer to the ques-tion of which Actinide isotopes have to be taken into account in calculations fordifferent kinds of fuel. This point has been investigated for Uranium fuel with anenrichment of 4 % - the highest enrichment used ill German LWRs -, for repro-cessed Uranium fuel with an enrichment of 3.5 % and for MOX fuel with a contentof 3.2 % of fissile Plutonium. Complementary, 2 effects, sometimes neglected, aretaken into account and rated: (n,2n)-reaction and absorption of U-234. The most
(n,2n)-neutroiis are delivered in U-238. Their influence on the reactivity thereforeis nearly the same in all kinds of LWR fuel. The initial concentration of U-234 inthe fuel depends on the Uranium enrichment. It is higher in reprocessed Uraniumbecause of its double enrichment.
The fission product chains don't make any trouble normally for high Plu-tonium content, provided the shift of fission yield curves of Plutonium isotopesagainst Uranium in the range of atomic weight 97 to 110 ( see Fig.l ) is paidattention to . In this range the U-235 yields are very low whereas those of Pu-239are significant. In the other ranges the differences are not so high.
In addition a correlated problem - estimation of rest absorption in Gadolin-ium poisoned fuel - has been investigated taking into account the complete chainof Gadolinium isotopes and their successors.
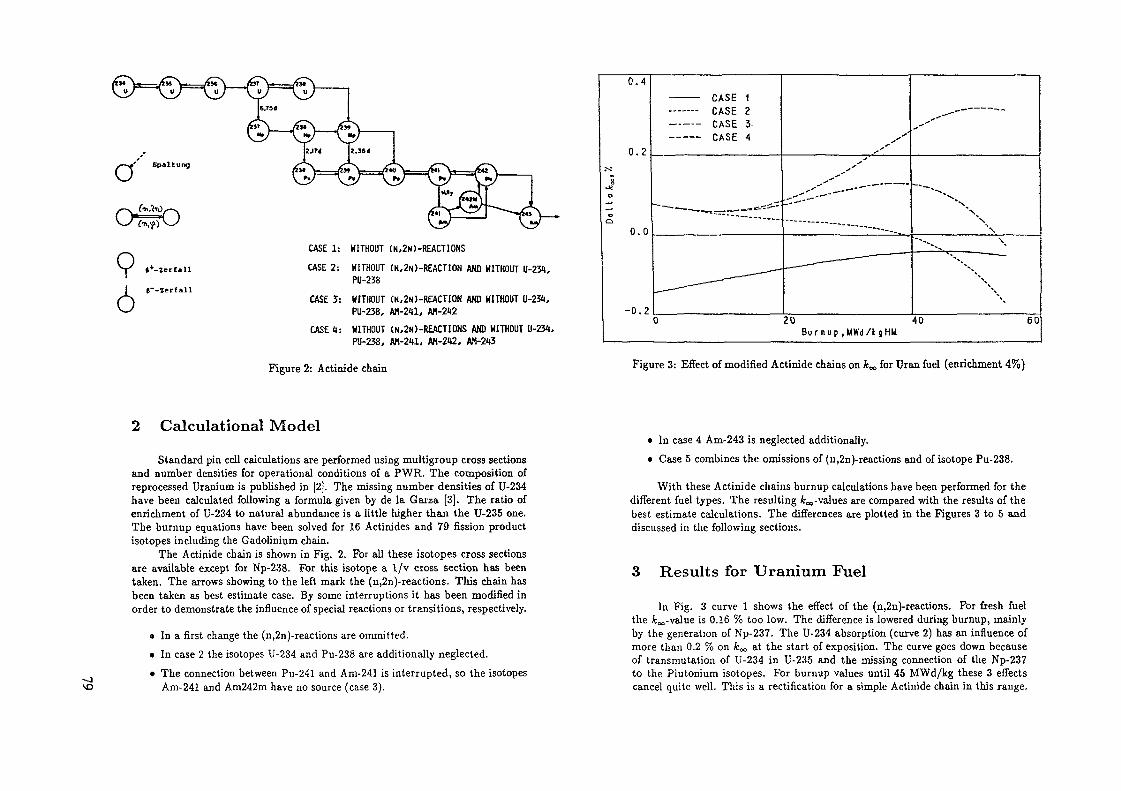
ö
>' Spaltung
(-n,f)
Sr' «*-I
f--ï
CASE I: WITHOUT (N,2H)-REACTIONS
CASE 2: WITHOUT (N,2N)-REACTION AND WITHOUT U-234,PU-238
CASE 3: WITHOUT (N,2N>-REACTION AND WITHOUT U-234,PU-238, AM-241, AM-242
CASE 4: WITHOUT (N,2N)-REACTIONS AND WITHOUT U-234,PU-238, AM-241, AM-242, A.1-243
Figure 2: Actinide chain
0.4
0.2
0.0
-0.2
———— CASE 1——- CASE 2——— CASE 3-———— CASE 4
20 40B u r n u p .MWd/lgHM
60
Figure 3: Effect of modified Actinide chains on fc«, for Uran fuel (enrichment 4%)
2 Calculational Model
Standard pin cell calculations are performed using multigroup cross sectionsand number densities for operational conditions of a PWR. The composition ofreprocessed Uranium is published in [2], The missing number densities of U-234have been calculated following a formula given by de la Garza [3]. The ratio ofenrichment of U-234 to natural abundance is a little higher than the U-235 one.The buruup equations have been solved for 16 Actinides and 79 fission productisotopes including the Gadolinium chain.
The Actinide chain is shown in Fig. 2. For all these isotopes cross sectionsare available except for Np-238. For this isotope a 1/v cross section has beentaken. The arrows showing to the left mark the (n,2n)-reactions. This chain hasbeen taken as best estimate case. By some interruptions it has been modified inorder to demonstrate the influence of special reactions or transitions, respectively.
• In a first change the (n,2n)-reactions are ommitted.• In case 2 the isotopes U-234 and Pu-238 are additionally neglected.• The connection between Pu-241 and Am-241 is interrupted, so the isotopes
Am-241 and Am242m have no source (case 3).
• In case 4 Am-243 is neglected additionally.• Case 5 combines the omissions of (n,2n)-reactions and of isotope Pu-238.
With these Actinide chains burnup calculations have been performed for thedifferent fuel types. The resulting fc„-values are compared with the results of thebest estimate calculations. The differences are plotted in the Figures 3 to 5 anddiscussed in the following sections.
3 Results for Uranium Fuel
In Fig. 3 curve 1 shows the effect of the (n,2n)-reactions. For fresh fuelthe fcoo-value is 0.16 % too low. The difference is lowered during burnup, mainlyby the generation of Np-237. The U-234 absorption (curve 2) has an influence ofmore than 0.2 % on fc«, at the start of exposition. The curve goes down becauseof transmutation of U-234 in U-235 and the missing connection of the Np-237to the Plutonium isotopes. For burnup values until 45 MWd/kg these 3 effectscancel quite well. This is a rectification for a simple Actinide chain in this range.

0.0
;<
8•* _n c
o
-1.0
-1.5
---,_
—————— _=
_ _ _ _ _ _ _ CASE 3—— — CASE 4———— CASE 5
0
*"•-..,.
*****•s,
X
20B u r n u p . M W d / t g H M
\
\ \\^ \
\ \N \
•v\ *-
N
\\\
\\\
40 60
Figure 4: Effect of modified Actinide chains on *„ for reprocessed Uran fuel (en-richment 3.5%)
For higher burnup the connection between the U-235 and the Pu chain becomesmore important. The neglection of the isotopes Am-241 and Am-242m causes anadditional underestimation of kx in the range of 0.1 % ( case 3). The influenceof the ommitted Am-243 gives the highest effect in Uranium fuel. It rises withburnup and becomes significant for values over 30 MWd/kg. In reality it is stillhigher because of the effect of Curium isotopes, which are not taken into accountin the calculations.
4 Results for reprocessed Uranium Fuel
Reprocessed Uranium has a behaviour similar to fresh Uranium with respectto (n,2n)-effect ( see Fig. 4). But the cut between Np-237 and the Plutonium chainhas a higher influence on k„ in this case ( see curve 5 ). The underestimation ofA:», is nearly 0.5 % at 40 MWd/kg and grews very fast in the high burnup range.The effect of the U-234 absorption is higher than 0.5 % at the beginning of theexposition because of the higher initial U-234 number density in reprocessed andtwice enriched Uranium (case 3). The contribution of the low Americium isotopesis not separated in this case. Am-243 has also a rising influence with burnup, 0.25% at 40 MWd/kg, but the behaviour of the corresponding curve is determined bythe missing connection of Np-237 to the Plutonium chain.
1.6
1 0.88
«o
0,0
-Û.8
———— CASE 1— „„.„ CASE 2
— —— CASE 3l* n%j L. "t
jfs
s ~-^~~*~jf _-*"S -"*s *-^
S _***
,S,."-^
_ — - ————— —— • —————
0
^__-_,^-*-
^-'''
_, ————— ——— =— —
20B u r n u p , M W d / k gHM
— —
"""---
•••.-.--.....10 60
Figure 5: Effect of modified Actinide chains on kx for MOX fuel (3.2% content of fissile Pu)
5 Results for MOX Fuel
The neglection of (u,2u)-reactions and of the isotopes U-234 and Pu-238 havein MOX fuel similar effects on kœ as in fresh Uranium fuel (case 1 and 2 in Fig. 5).Important influences are caused by the neglection of the Am isotopes, of course.The omission of Am-241 and Am-242m has an overestimation effect on k^ of upto 0.7 % ( case 3). The Am-243 influence is twice as high. It reaches 1.1 % at 40MWd/kg (case 4). Both effects are enlarged by the influences of the Cm isotopes,which should be taken into account in calculations for MOX fuel.
6 The Rest Absorption in Gadolinium PoisonedFuel
An important question for the core designer applying burnable poisons is theheight of the rest absorption. To get an impression of this term 2 burnup calcula-tions for a supercell with poisoned fuel in the center surrounded by homogenizedUranium pin cells have been performed. The content of Gd-oxide was 4 % and10 %, respectivly. A complete Gadolinium chain including Terbium and Dyspro-sium has been taken into account. In Fig. 6 the results for the lower Gadolinium

10
- 5
6DTBDYTBDY
10 20 30Burnup,MWd/lgHM
Figure 6: Rest absorption in a poisoned pin with 4% Gd oxide
concentration are shown. The upper curve presents the relative contribution of allGadolinium, Terbium and Dysprosium isotopes to the absorption in the fuel pin asa funfction of the burnup. After the burnout of the high absorbing Gadolinium iso-topes rests an effect of 6 %, which is slowly grewing with burnup. This increase iscaused by the absorption in the Terbium and Dysprosium isotopes, which reaches1 % at 30 MWd/kg. The relative absorption of Xe-135 in the fuel is the thirdcurve in the figure. The corresponding results for the higher Gadolinium contentare presented in Fig. 7. The rest absorption in this case is 14 % at the minimum.The absorption of the successor isotopes is also higher. At 30 MWd/kg it is 2.8 %and higher as the absorption of Xe-135.
REFERENCES
[1] Guidebook for the ENDF/B-V Nuclear Data Files, BNL-NCS-31451, BNL1982
[2] Schlosser,G.; et al.: Uranrückführung. Jahrestagung Kerntechnik, Frankfurt,1984. Bonn: Deutsches Atomforum, 1984, p.297
[3] de la Garza, A.:Uranium-236 in Light Water Reactor Spent Fuel Recycledto an Enriching Plant. Nucl.Technol.32,176(1977)
20
^0
- 10
-0f.
0
———— GDTBD— — - TBDY—— — X
_——""-"-0
_..---••"• -— — —
10Bur nu
_ - — - —— —————
20, WWd/lgHM
_ ———— —— —— - ——
30 40
Figure 7: Rest absorption in a poisoned pin with 10% Gd oxide

OOto IMPROVED CODE SYSTEM FOR REACTOR CALCULATIONAND VALIDATION FOR ADVANCED VVER CORE ANALYSIS
T.G. APOSTOLOV, K.N. IVANOV, R.I. PRODANOVAInstitute for Nuclear Research and Nuclear Energy,Bulgarian Academy of Sciences,Sofia, Bulgaria
Abstract
In the Institute for Nuclear Research and Nuclear Energyhas been developed WER core analysis code system on the baseof our previous codes by incorporating improvements laaccuracy and efficiency, as well as new advanced codes andmethodologies. The code system consists of the NESSEL-IV-ECcode - for lattice burnup calculations, HEXAB-3D code - three- dimensional core simulator with coupled thermohydraulic mo-dule and HEXAB- 2D code - for two-dimensional rod by rod powerdistribution calculations.
Calculational models, recent improvements and test re-sults on various WER benchmark problems are presented. Futureactivities for development and validation of the code system.are duscussed.
I. INTRODUCTIONWER core analysis code system has been developed on the
base of our previous codes by incorporating improvements inaccuracy and efficiency, as well as new advanced codes andmethodologies. The code system includes following intercon-nected computer codes and procedures:
- the NESSEL-IV-EC code - for cell calculations andcross section generation;
- the HEXAB-3D code - for global three - dimensionalimproved coarse-mesh core simulation;
- the HEXAB-2D code - for two - dimensional detailed(pin by pin) core calculations;
- thermohydraulic programme module THCALC - for calcu-lating temperature field.
Two - dimensional few-group code HEXAB-2D [1] performsrod by rod power distribution calculations in hexagonal geo-metry for WER cores. The 30"-sector of reactor core accordingto the reflective symmetry is represented. The detailed core-shroud and borated water are included in the fine-mesh gridMesh points coinside with fuel pin centures.
The correct thermal-hydraulic model is used in THCALCmodule to determine the fuel and moderator temperatures andcoolant mass flow rate. The general assumptions, which havebeen used for thermal-hydraulic analysis are treated inRef.[21.
II.HEXAB-3D - THREE-DIMENSIONAL CORE SIMULATOR CODEIN HEXAGONAL GEOMETRYII. 1. Brief Description of Programme HEXAB-3DThe few-group diffusion code HEXAB-3D [3] is designed to
calculate the three - dimensional flux distributions for powerreactors which have a hexagonal core configuration with aheterogeneous region structure in the axial direction.
There are two versions of the code:-HEXAB-III-30-the calculational model on horizontal
plane is 38o - sector (the reflective conditions are used onthe internal reactor boundariea);
-HEXAB-III-360- the calculational model on horizontalplane is full core.
In the HEXAB-3D code is applied the mesh centeredfinite-difference formulation for neutron balance equation.The high effective two-sweep iterative method AGA DSOR hasbeen used for the inner iterations in each energy group. Thismethod belongs to the family of partial factorization tec-hniques commonly used in the numerical solution of group -independent neutron diffusion equations in discrete form [4]The power method combined with Chebishev polynomial acce-leration for outer iterations is applied in the code. Thereare two possibilities for the acceleration of outer itera-tions:
- by using two-term Chebishev polynomial method accor-ding to Ref [51 ;
- by using three-term Chebishev polynomial method ac-cording to Ref [6J;
Optimized outer-inner iteration strategy has been ap-plied in the code to minimize total CPU time.
II.2. Numerical Investigations for Determination of theOptimal Combination between Chebyshev Acceleration andFactorization MethodsChebyshev method theory implicitly assumes that the
matrix equation for each energy group is solved exactly duringeach outer iteration. For multidimensional problems, this isnot the case, because the effect of solving this equation ite-ratively for each group is that the system of equations, beingsolved, bicornes modified. The dominance ratio of modified sys-tem is larger than that of the original system. One possiblesolution to this problem is to perform sufficient number ofinner iterations for each group during each outer iteration,so that the effect on the dominance ratio to be not sosignificant. The more practical approach for optimalcombination of the Chebyshev acceleration (for outeriterations) and AGA DSOR method (for inner iterations) is touse the method of preliminary inverse of inner iterationmatrix [161, which allow to decrease the inner iterationnumber per outer iteration The efficiency of this method isconnected with physical characteristic of WER core.

The goal of the optimized iteration strategy is toreduce the number of outer iterations at the expense ofinvesting relatively not so great efforts in the inner ite-rations performed during each outer iteration and in this wayto minimize the total CPU time In order to determine theoptimal parameters for AGA DSOR method and for to two- andthree-term Chebyshev methods, the convergence characteristicshave been investigated on WER-440 and WER-1000 three-dimensional test problems [13, 14). The effectiveness ofvarious combinations of the methods for outer and inneriterations have been compared and the convergencerepresentation (outer iterations and CPU times) is given intable 1.
Table 1
Test Outer Numberproblem iteration o£ mest hr/hz
method points
Outer CPU*iterations time
T(s)
WER-440
WER-1000
Power 5282-termChebyshev -/-3-termChebyshev -/-Power 56282-termChebyshev -/-3-termChebyshev -/-Power 10562-termChebyshev -/-3-termChebyshev -/-
Power 5282-termChebyshev -/-3-termChebyshev -/-
9.588 1 195-/- 1.188-/- -/-0 588 1.195-/- 1.188-/- -/-1.176 1 195-/- 1 188-/- -/-
1.326 1 20-. / — — 1 —
-1- -/-
9148451859389854750
1226469
1579084160810661048222124140
208115125
00 * All calculations were perfirmiagon IBM 3031 -Ixl0c oper per s
II.3. Approach for Improving Accuracy of Coarse-MeshFinite-Difference MethodTo improve the accuracy of the calculated integral and
local reactor parameters without significant increase ofcomputer time and storage it has been developed an effectivecoarse-mesh method. This method is based on the ICM method,proposed by Askew and Takeda [7]. It decreases errors due tothe use of coarse-mesh by means of correcting the coefficientsof. finite-difference scheme. A consistent two dimensionalprocedure [8] is used in HEXAB-3D code to avoid some ICMmethod disadvantages, which are noted in [91. As a result twoproblems have been solved - first it is improving of theradial neutron leakage expression and second - the intro-duction of average value for calculation of reaction rates indiffusion balance equation
The following expressions for the correction coeffi-cients have been suggested [10]'
y9 =(1-2.4*h2 * ß2 /27)*(l-4*h2 * B2 /81)i 1,9 i,g
a9 =(1-2.4*h2 * 82 /27J/1-2.4 * S2 /81)i 1.9 1,9
for the absorber part of boron carbide control rods, andfor the rest zones we have:
y9 =(1-1.8*h2 * fi2 /27)*(l-4*h2 * ß2 /81)l i,g 1,9a9 =(1-1.8*h2 * B2 /27)/(l-1.8*h2 * B2 /81)i i,9 i,gThe computation time for correction procedure applied in
HEXAB-3D code is only 30% of the total CPU time To attaincorrection parameters accuracy, required in practice, 3-5recalculations are enough.
II. 4. Validation of HEXAB-3D Code by WER-440 and WER-1000 BenchmarcsA lot of numerical calculations with the code have been
carried out on various test models of WER-440 and WER-1000reactors and results are presented in [11] The code givessolutions (Keff and power distribution) comparable in accuracyto similar diffusion theory calculations with six mesh pointsper assembly The typical discrepancies between the referenceand HEXAB results are
- Keff - within ± 0 15%;- power distribution within ± 2%The deviations are in any case within the désigne and
operational criteria, however the results should be analyse inorder to get some improvement if possible

I I I. NESSEL-IV-EC CODE FOR CALCULATION OF THE LOCALNEUTRON - PHYSICS PARAMETERSIII.l. Status and Recent ImprovementsThe NESSEL-IV-EC code [12] is intended to calculate the
local neutron physics characteristics of light water moderatedreactor cores. It calculates effective few-group diffusionparameters and depletion not only for a given, subzone, butalso the entire assembly, taking into considération the stronginhomogeneities inherent to this type of reactor cores. Ituses 34-group data library HB4P containing microscopic datafor about 299 isotopes. The energy distribution of neutronflux is calculated by using the multigroup approximation oftransport equation. The spatial dependence is considered byapplying the so called method of "step by step"homogenization. In this method the real assembly structure isrepresented by a set of cylindrical cells of Wigner-Zeitz,unified with respect to their properties in "homogeneousareas" (HA). Each HA contains either "elementary zones" (e.g.zones containing materials for which there are microscopicdata in the data library and by the input data we give thenumber densities, temperatures etc.), or preliminary homo-genized HA of lower rank. The present version of NESSEL-IV-ECcan calculate maximum 5 steps of homogenization ( 5 HA) main-taining in this way up to 29 elementary zones . In order toimprove the accuracy especially in the thermal region cal-culation we divide the zones by a reasonable number of thinfine (mathematical) zones (up to 49 in each HA) and apply thecollision probability method for solving the integral trans-port equation.
In order to carry out ivestigations connected with theinfluence of burnable absorbers in WERs the microscopic datalibrary LIB4P have been extended recently to contain allnecessary multigroup data for at least the most importantgadolinium isotopes Gd-155 and Gd-157.
ÏIÏ.2. Burnup Calculations for Hexagonal GadoliniumLattice BenchmarkFor hexagonal geometry burnup calculations with this
code system two different sets of infinite lattice were stu-died (the input data was specified according to Ref. 15): su-percell (Fig.l) and assembly (Fig. 2). All calculations havebeen carried out with assumption of no leakage throughout thesurfaces of the systems under consideration. Only the two mostimportant Gd-isotopes (Gd-155 and Gd-157) have been takeninto consideration. The multigroup library used is LIB4Pcontaining 34 groups (12 fast, 12 resonance and 18 thermalgroups), the cut off energy is 0.465 ev. In the thermal regioncalculation the Gd-bearing rod has been divided into 8 finemathematical zones and the first collision probability methodhas been used. For the calculations of relative pin powerdistribution the HEXAB-II-39E code [1] has been used (applying
C3 NORMflL FUEL RODonnffl GO ROD«a CLODDINGCD HftTER
SYMMETRY LINE
FIG. 1. Supercell case.
NORMflL FUEL RODGO RODCLflDDINGHflTER
SYMMETRY LINE
• Xvt»-
O
*«X O* V*?* -*VO*V' O"
aooraoöoFIG. 2. Assembly case.
power normalization such as the average power of each fuelhexagonal is equal to 1.9) and results for the "super cellcase" and for the "assembly case" at six burnup points areshown in Fig.3 and Fig.4a - 4f respectively.
IV. FUTURE ACTIVITIESThe code system will be further improved, new options
will be added and benchmark calculations will be performed. Inthe nearest future the NESSEL-IV-EC will be improved not only

3 51.036 1.049
1 2 4 63.195 0 . 9 9 0 1.042 1.052
1.265
3 51.032 1.044
2 4 60 . 9 9 3 1.038 1.046
3 51.028 1.038
1 2 4 60.345 0 .996 1.033 1.040
3 51.023 1.030
1 2 4 60.451 1.003 1.026 1.031
16 MWd/kgU
3 51.012 1.011
1 2 4 69.676 1.016 1.012 1.011
3 51.015 1.010
1 2 4 60.614 1.022 1.014 1.010
Figure 3. Pin power distributions in the aupercell atsix burnup points
from models point of view, but also with the aim to generatecross sections, necessary in the investigations of tightreactor lattice. At the next stage we intend to incorporateburnup and thermal hydraulic feedback modelling and tovalidate the improved code system on NPP design andoperational data.
oo
311.849
21 26 321.040 1.847 1.049
13 17 22 27 331.009 1.028 1.640 1.047 1.958
7 10 14 18 23 28 340.975 0.983 1.004 1.027 1.941 1.849 1.051
8 11 15 19 24 29 350.995 0.976 0.939 0.949 1.001 1.030 1.044 1.051 1.053
12 16 20 25 30 361.008 1.004 0.987 0.939 8.186 0.954 1.013 1.037 1.048 1.052 1.054
Figure 4a . Pin power distibution in the assembly at 0 MWd/kgU burnup point
311.043
21 26 321.036 1.041 1.043
13 17 22 27 331.010 1.025 1.036 1.042 1.044
7 10 14 18 23 28 34B.978 0.988 1.006 1.025 1.037 1.043 1.045
8 11 15 19 24 29 350.995 0.979 0.948 0.956 1.0C3 1.027 1.039 1.044 1.046
12 16 20 25 30 361.006 1.0>B2 0.988 e.947 0.263 0.960 1.813 1.033 1.942 1 046 1.047
Figure 4b. Pin power distibution in the assembly at 2 MWd/kgU burnup point
311.034
21 26 321.029 1.033 1.034
13 17 22 27 331.009 1.021 1.029 1.033 1.035
10 14 18 23 28 340.987 0.990 1.005 1.020 1.029 1.034 1.036
8 11 15 19 24 29 351.000 0.988 0.962 0.969 1.003 1.022 1.031 1.035 1.037
12 16 20 25 30 361.009 1.006 0.995 0.962 0.354 0.972 1.011 1.027 1.034 1.036 1.837
Figure 4c. Pin power distibution in the assembly at 4 MWd/kgU burnup point
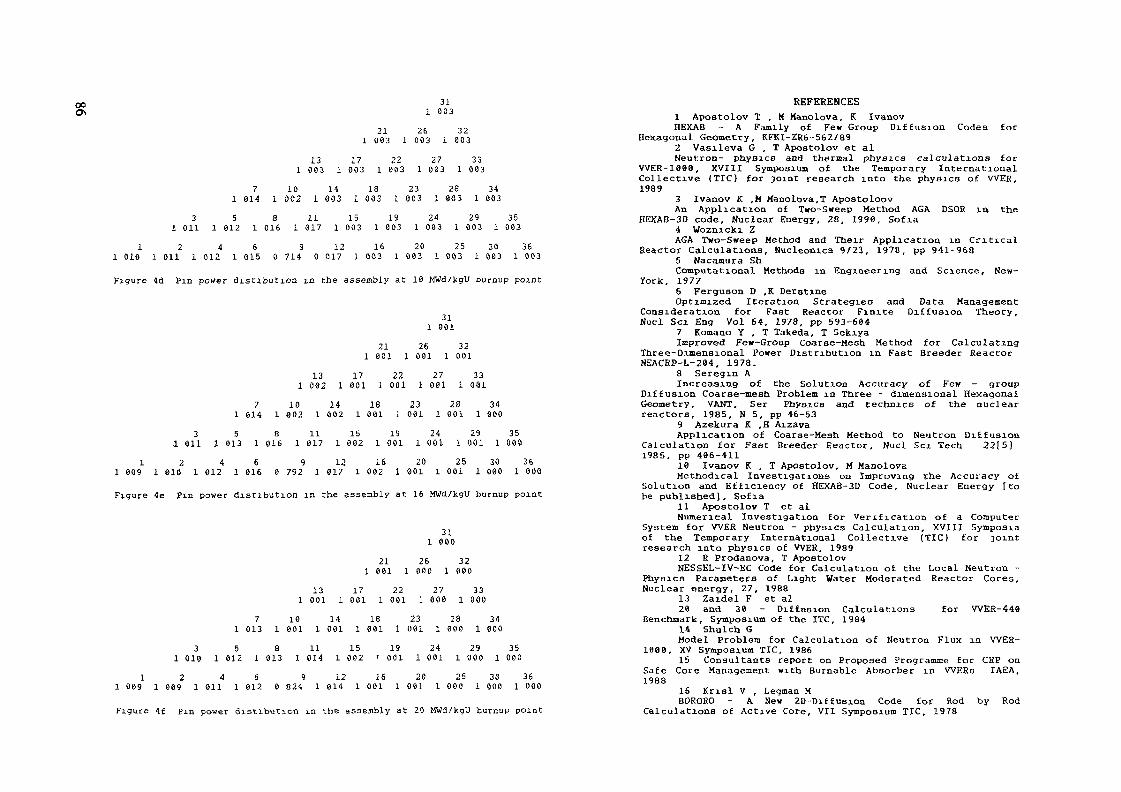
00 31l 003
21 26 32l 083 l 003 l 003
13 17 22 27 33l 003 l 003 l 003 l 003 l 003
7 10 14 18 23 28 34l 014 l 002 l 003 l 083 l 003 l 903 l 003
3 5 8 11 15 19 24 29 35l 011 l 012 l 016 l 017 l 003 l 003 l 003 l 003 l 003
l 2 46 9 12 16 20 25 30 36l 010 l 011 l 012 l 015 0 714 0 017 l 003 l 803 l 803 l 003 l 003
Figure tu PIE power distribution in the assembly at 10 MWd/kgU ouroup point
311 001
21 26 321 001 1 001 1 001
13 17 22 27 33l 002 1 001 1 001 1 001 1 001
7 16 14 18 23 28 341 014 1 002 1 002 1 001 1 001 1 OOl 1 800
3 5 8 11 15 19 24 29 35a 011 1 013 1 016 1 017 1 002 1 OOl 1 801 1 081 1 000
1 2 46 9 12 16 20 25 30 361 009 1 010 1 012 1 016 0 792 1 017 1 002 1 001 1 001 1 000 1 000
Figure 4e Pin power distibution in the assembly at 16 MWd/kgU burnup point
311 060
21 26 321 001 1 000 1 000
13 17 22 27 331 001 1 OOl 1 OOl 1 000 1 000
7 10 14 18 23 28 341 013 1 001 1 001 1 001 1 001 1 000 1 000
3 5 8 11 15 19 24 29 351 010 1 012 1 013 1 014 1 002 1 001 1 001 1 000 1 000
1 2 46 9 12 16 20 25 30 361 009 1 009 1 011 1 012 0 824 1 014 1 001 1 001 1 000 1 000 1 000
Figure 4£ Pin power distibution in the assembly at 20 MWd/kgU burnup point
REFERENCES1 Apostolov T , H Manolova, K IvanovHEXAB - A Family of Few Group Diffusion Codes for
Hexagonal Geometry, KFKI-ZR6-S62/892 Vasileva G , T Apostolov et alNeutron- physics and thermal physics calculations for
WER-1898, XVIII Symposium of the Temporary InternationalCollective (TIC) for joint research into the physics of VVER,1989
3 Ivanov K ,M Manolova,T ApostoloovAn Application of Two-Sweep Method AGA DSOR JLU the
HEXAB-3D code. Nuclear Energy, 28, 1990, Sofia4 Woznicki ZAGA Two-Sweep Method and Their Application in Critical
Reactor Calculations, Nucleonica 9/23, 1978, pp 941-9685 Nacamura ShComputational Methods in Engineering and Science, New-
York, 19776 Ferguson D ,K DerstineOptimized Iteration Strategies and Data Management
Consideration for Fast Reactor Finite Diffusion Theory,Nucl Sei Eng Vol 64, 1978, pp 593-664
7 Komauo Y , T Takeda, T SekiyaImproved Few-Group Coarse-Mesh Method for Calculating
Three-Dimensional Power Distribution in Fast Breeder ReactorNEACRP-L-2e4, 1978.
8 Seregin AIncreasing of the Solution Accuracy of Few - group
Diffusion Coarse-mesh Problem in Three - dimensional HexagonalGeometry, VAUT, Ser Physics and technics of the nuclearreactors, 1985, N 5, pp 46-53
9 Azekura K ,H AizavaApplication of Coarse-Mesh Method to Neutron Diffusion
Calculation for Fast Breeder Reactor, Nucl Sei Tech 2215]1985, pp 486-411
18 Ivanov K , T Apostolov, M ManolovsMethodical Investigations on Improving the Accuracy of
Solution and Efficiency of HEXAB-3D Code, Nuclear Energy [tobe published), Sofia
11 Apostolov T et alNumerical Investigation for Verification of a Computer
System for WER Neutron - physics Calculation, XVIII Symposiaof the Temporary International Collective (TIC) for jointresearch into physics of VVER, 1989
12 R Prodanova, T ApostolovNESSEL-IV-EC Code for Calculation of the Local Neutron -
Physics Parameters of Light Water Moderated Reactor Cores,Nuclear energy, 27, 1988
13 Zaidel F et al28 and 38 - Diffusion Calculations for WER-448
Benchmark, Symposium of the ITC, 198414 Shulch GModel Problem for Calculation of Neutron Flux in WER-
1886, XV Symposium TIC, 198615 Consultants report on Proposed Programme for CRP on
Safe Core Management with Burnable Absorber in WERs IAEA,1988
16 Krisl V , Legman MBORORO - A New 2D-Diffusxon Code for Rod by Rod
Calculations of Active Core, VII Symposium TIC, 1978

SKODA COMPUTATIONAL SYSTEM FORWER REACTORS
J. VACEK, P. MIKOLÂS,J. SVARNY, V. KRYSLSkoda Pken,Czechoslovakia
Abstract
The code system that is used in Skoda, flzen forreactor safety anaJfysisr, m-core fue7 management slwdte.s,cnticality assesment of storage pools etc. for VVEK-type reactorlait (ces, and some results of .its validation, are described inthis paper.
l . INTRODUCTION.
The code system that is used in Skoda Plzen for reactorsafety analysis, in-core fuel management studies, criticalityassesment of storage pools etc. for VVEH-type reactorlattices, consists of three main subsystems: lattice analysissubsystem, correlation subsystem and global reactor analysissubsystem.
The lattice analysis subsystem consists of following parts:- WIMS-TRAÇA, a code used for the lattice calculations at aset of discrete lattice states that span the expected range ofstate variables (buniup, fuel temperature, moderatortemperature and density, boron acid concentration etc.). Bothcell-averaged and assembly-averaged few-group diffusionconstants can be produced. The results of code validationagainst a set of a series of experimental and numericalbenchmarks for different lattices, including non-uniformlattices containing control or burnable absorbers, justify theinclusion of WIMS into the production system of codes for VVRRanalyses.- DIAMANT-Z, a. code used for studies of effects of differentapproximations (diffusion vs. transport, WCMS cylindricalrepresentation vs. actual hexagonal 2-D geometry etc.).- HOMOGS, a code for the assembly calculation in thediffusion approximation. It serves for the assemblyhomogenization at the stage of the preparation of the few-groupdiffusion data library.- HKCON, a code computing gamma-matrices, i.e. matrices relatingflux to current at the core boundary (external or internal).
To describe the influence of history and environment, themethod of •JB ui'rai_indices (i.e. the ratio of epi thermal tothermal flux), is used. Not only assymptotic lattices but alsolattices with disturbed spectrum are analyzed- Two typesof spectral indices are used - the instantaneous one describingthe influence of environment and local changes in values oftechnology cal parameters and the historical one, describing theinfluence of changing spectrum on the fuel isotopic composition.
Results of the lattice analysis subsystem for a set oflattice states enter the correlation subsystem. Here they areprocessed by the code APPRO that, on the basis of selectedcriteria of accuracy, correlates the lattice parameters anddetermines the coefficients of parametric expressions. Thesecoefficients are then stored together with original tables in thelibrary of few-group diffusion data. Both parametric expressionsand int.erpoi ati on in tables can then be used to retrievediffusion constants for the given set of parameter values. Socalled implicit method is used, i.e. macroscopic cross sectionsdependent on the burn-up are processed and stored and burn-upequations are not solved in the core Simulator. The onlyexceptions are the poisoning isotopes Xe and Sm andchemicul shim control isotope B , that are treated explicitlyand therefore their microscopic cross sections must be processedand stored.
The global reactor_analysis_ subsystem consists ofthree-dimensional core simulators MOBY-DICK and BlPK. MÛBY-D1CKis the finite difference diffusion code using Boressen'sapproximation of diffusion coeffficient as the geometric meaninstead of the usual harmonic, one. This approximation results insubstantial savings of both the computer memory and computingtime and is acceptable when there are no great differencesbetween the properties of neighbouring nodes. The code allows toperform fine-mesh and coarse-mesh calculations and also thecombined calculations, i.e. it can solve fine-mesh 2-D diffusionequation for a selected horizontal plane with axial leakagecalculated on the basis of the previous 3-D coarse meshcalculation. It also allows to account for the thermohydraulic1 eedbacks using simple correlations. HOBY-UJCK can use few-grouplibraries in different formats. The code contains the built-inverification subsystem containing at present evaluatedoperational data for the LOVIISA reactor. It facilii.at.es thefitting of the library to the operational data. Iterationaoceiaration strategies, treatment of feedback effects and someother details, together with results of the code verification,are presented in the paper.
BIPR is a »ember of the Soviet family of coarse mesh one-and-a-half group core simulators. Here it is mentioned forcompletness without any details. Through standardised interfacefiles it can be coupled to MOBY-DtCK and HKXAI.OK. HkiXALOK is acode for the assembly dehomogeni zati on at the stage of theanalysis of detailed power distributions after the corecoarse-mesh calculation.
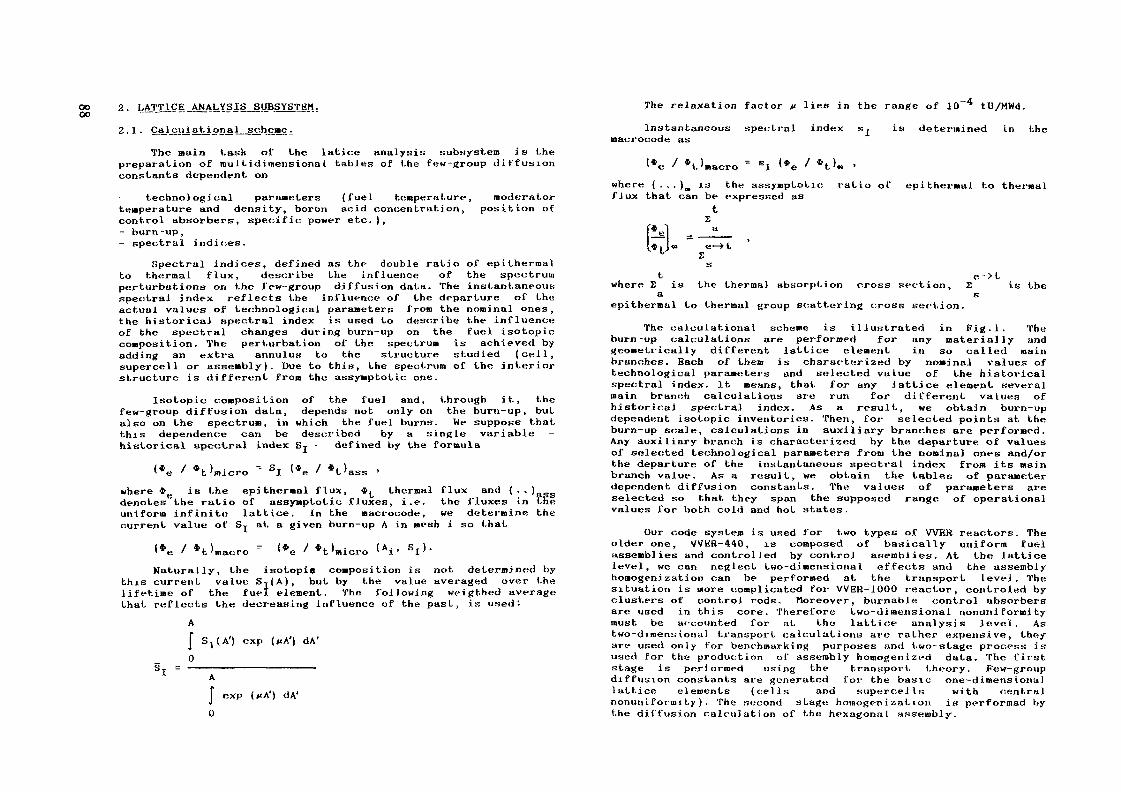
oo00
Z . fcATTlCE _ANAktS I S
2.1. Gal cui at i onal scheme .
The nain t.ask of the latice analysis subsystem is thepreparation of multidimensional tables of the few-group diffusionconstants dependent, on
technological parameters (fuel temperature, moderatortemperature and density, boron acid concentration, position ofcontrol absorbers, specific power etc.),- burn -up,- spectral indices.
Spectral indices, defined as the double ratio of epitherroalto thermal flux, describe the influence of the spectrumperturbations on the few-group diffusion dat. a. The instantaneousspectral index reflects the influence of the departure of theactual values of technological parameters fro» the nominal ones,the historical spectral index is used to describe the influenceof the spectral changes during burn-up on the fuel isotopiocomposition. The perturbation of the spectrum is achieved byadding an extra annulus to the structure studied (cell,supercel] or assembly) . Due to this, the spectrum of the interiorstructure is different froa the »asymptotic one.
Isotopic composition of the fuel and, through it, thefew-group diffusion data, depends not only on the burn-up, butalso on the spectrum, in which the fuel burns. We suppose thatthis dependence can be described by a single variablehistorical spectral index Sj - defined by the formula
*t>micro " SI *t>asswhere * is the epi thermal flux, *^ thermal flux and ( . , )„ssdenotes 'the ratio of assymptotic fluxes, i.e. the fluxes in tneuniform infinite lattice. In the macrocode, we determine thecurrent value of Sj at a given burn-up A in mesh i so that
<*e / *t »macro " <*e / *t »micro < A i - SI > 'Naturally, the isotopie composition is not determined by
this current value Sj(A), but by the value averaged over thelifetime of the fuel element. The following w<>igthed averagethat reflects the decreasing influence of the past, is used:
[ SX(A') exp (HA') dA'
The relaxation factor it lies in the range of 10 * tU/MWd.
Instantaneous spectral index s^ is determined in themacrocode as
<*e / *t»macro = SI <*e / *t>« •where (-..)„ is the assymptotic ratio of epithermal to thermalflux that can be expressed as
t2
(M =_JL_l_$ i J w e—> t
exp (*AJ) dA'
t e->twhere E is the thermal absorption cross section, 2 is thea Kepithermal to thermal group scattering cross section.
The calculational scheme is illustrated in Fig.l. Theburn-up calculations are performed for any materially andgeometrically different lattice element in so called mainbranches. Each of the» is characterized by nominal values oftechnological parameters and selected value of the historicalspectral index. It means, that for any lattice element severalmain branch calculations are run for different values ofhistorical spectral index. As a result, we obtain burn-updependent isotopic inventories. Then, for selected points at theburn-up scale, calculations in auxiliary branches are performed.Any auxiliary branch is characterized by the departure of valuesof selected technological parameters from the nominal ones and/orthe departure of the Instantaneous spectral index fro» its mainbranch value. As a result, we obtain the tables of parameterdependent diffusion constants. The values of parameters areselected so that they span the supposed range of operationalvalues for both cold and hot states.
Our code system is used for two types of WER reactors. Theolder one, VVKR-440, is composed of basically uniform fuelassemblies and controlled by control asemblies. At the latticelevel, we can neglect two-dimensional effects and the assemblyhomogen]zation can be performed at the transport level. Thesituation is «ore complicated for VVER-1000 reactor, controled byclusters of control rods. Moreover, burnable control absorbersare used in this core. Therefore two-dimensional nonuniFortuitymust be accounted for at the lattice analysis level. Astwo-dimensional transport calculations are rather expensive, theyare used only for benchmarking purposes and two-stage process isused for the production of assembly homogenizpd data. The firststage is performed using the transport theory. Few-groupdiffusion constants are generated for the basic one-dimensionallattice elements (cells and supercejls with centralnonuniforniity). The second stage homogenizatton is performad bythe diffusion calculation of the hexagonal assembly.

mul ti grouplibrary
latticegeometry &naater i ai K
V
——— - —— >I HJMS I ———— > latticee 1 cmen tfew-groupdata
V
I DJl AMANT 1 1 HOMOGS I ——— >
coregeometry &materials'
Af
assemblydata
V
1 1ÎECON 1 ——— > boundaryoondi t i on s
V
| APPRO | ——— >
—— >| Bl PR | —— f— >
parametrizedfew-groupli brary
coarse- meshdi s tri but ions
V >
I HEXAJ.OK I ——— >J
fine-meshdi stributions
applicability and good international reputation. TRAÇA versionwas selected, as it allows regionwise homogenization andtherefore several sets of data eau be prepared simultaneously fordifferent subrogions of the modelled structure. l'or ourcalculational scheme it is also important, that we can modelnon-asymtotic ceils by adding the extra region and calculatedifusion constants of the inner regions averaged in the disturbedspectrum.
Before its routine use, the code was validated against abroad set of critical experiments and numerical benchmarks. Lateron, lattices containing gadolinium were included into thevalidation process. The results of the validation were describedin [31 and therefore only the brief review of the results isgiven here.
The results for a series of assymptotic critical s aresummarized in Table 1. Series means k ... and standard deviations2 '
s together with weighted means k p and standard deviations Ak pthat are defined by the formulas [6]
Y! "i kef,i t
FIG. 1. Calculational system scheme.E «t /•
Table 1. Assymptotic .lattices, series means
00
The core boudaries are described by boundary conditions. Forboth core types, boundary conditions are applied at the externalcore boundary. For VVER-440, they nay be applied also at theinner boundaries, i.e. at the control assemblies interfaces. Atthe lattice level, the set of parameter dependent i-natrices isgenerated for different boundary types.
2.2. ÇomjCK>nen_ts ol Oie lattice subsytem.
2.2.1. WIMSj.The basic component of the lattice subsystem, the WIMS-TRACA
ft] member of the W1MS-0 Camily of codes, was aquired fioui LheNJKA Data Bank and slightly adapted to our needs. Later on, it. wasadapted to tho IBM-I'C/AT corapatJbJt: computer. This code wasselected among the available rodes for its broad range oi
ZR-6BETTISW1NFRITHWAHDBNLTKXBAPLSAXTONCAPPHI,Pu 1 att J cet.U western
mean kerf1 .0061561 .0025941 .004557.999919.999129.99881 1
1 .OOJ88?..089248.991902.99Y769.996857
1 . OOIS89
std. deviation weight.009108.003586.003641.005538.003394.003230.002003.008326.015786.002654.003134.0016Y6
i346278
?.l3
12
.0472
.5358
.5543
.8331
.5412
.1301
.6452
.2532
.3486
.3312

Table 2. Yankee - init ial st.at.es
WIMS LASKK[tV) experiment) 17]
coldhot, without powerhot, with power, unpo i soiledhot.wjth power ,poj soned
1 . 18231.1227i. 10291 .0789
1 18401.12101. J042
-1 .1396+0.00331. 1035+0.0081
where i denotes the values related to the series no. i, arcpresented here. we can see, that ^eff Ls slxgthlyoverestimated for uranium lattices and underestimated for Pulattices. Among all U-lattices ZR-6 has greatest dispersion.Experience of several TIC laboratories shows that acceptableresults are obtained, if two-dimensional calculations areperformed with diffusion constants obtained by assyraptotic cellcalculations. It means, that ZR-6 results are not. fujjyapplicable as the benchmark for asymptotic cell calculations.Having this in mind, we can regard the agreement quitesatisfactory. The applicability of WIMS to clean assymptoticlattices is confirmed by the analysis of numerical benchmarks.
In Table 2, results for the Yankee core are summarized.These results, together with the results of burn-up calculationsof Maeder-Wydler [S| and Sidorenko (3| benchmarks for regularlattices without, burnable absorber, illustrated in Figures 2 and3,justify the inclusion of WIMS into the code system for theanalyses of hot burnable lattices. In Fig.2, WIMS results arecompared with the mean values of a series of codes presented in15], in Fig.3 they are compared with results of Lutz [13].
The applicability of WIMS to the preparation of few-groupdiffusion data for nonuniformities such as control absorbers andwater gaps was verified by the analyses of selected ZR-6configurations. As an example, the results of the calculation ofconfigurations 101/100 (B^C rods) and 57/57 (water gaps) arepresented in Figures 4 and 5.
Up to now, heterogeneous boron based burnable absorbershave been used in WER-1000 cores, but they are supposed to bereplaced by homogeneous burnable absorbers containing gadolinium.The research was started in this direction. Severalinternationally defined benchmarks were analyzed and results arein detail presented in [11. fn Figure 2, our results forMaeder-Wydler benchmark are compared with average values of [5|,in Figure 3 our results for Sxdorenko benchmark are compared withthose of Lutz (13). In both cases, WIMS overestiroat.es kjnF in
comparison with other codes for cells containing Gd, Due to this,^itif is overestimated also for supercells and assembliescontaining burnable absorbers.
/k-inf
1 .3500
1.3150
1.280C
1.2450
1.2100
1.1750
1.1400
1.1 05C
1 .0700
1.0350
1 nnnn
\
\
\
_
^-^_
/
— -^
/"
-~-
//
s
--—_
///•
-^
/
s*
~^^^5=
_ ————— W
— -
— — rr
VI
— — rr
s^^.^-^
IMS, regular
eon, regular
IMS. poisoned
lean, poisoned
0.
Ak-inf
0.
3 4 5 6. 7 8 9 10
burn-up [MWdAgU]
FIG. 2. Maedler-Wydler benchmark.
1 2470
1.1340
1.0210
.9080
.7950
.6820
.5690
4560
.3430
o^nn
cxl
jf
//
— — —
//
X "~
//y
— —
/'//
==
/'"'
=- — i .
-•••• -
~~ — —
• i
- ——
i —
— — — .
~ ' -.
— - _ _
———— WIMS, regular cell— — — - Lutz, regular cell
WIMS. poisoned cell———— Lutz, poisoned cell— * —— WIMS.supercell— * — - Lutz, supercell
« WIMS, assembly
10. 12. 14. 16. 18 20
burn-up [UWd/kgUJ
FIG. 3. Sidorenko benchmark.
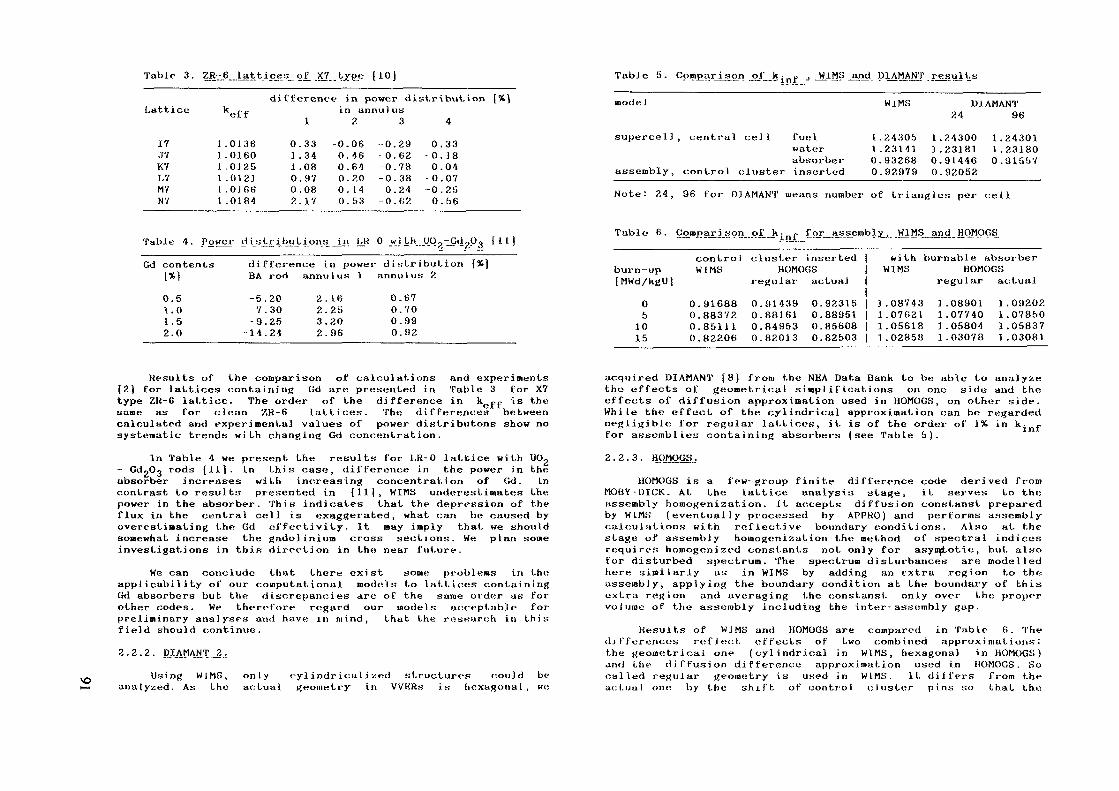
Table 3. ZKdB..JLatt_ices_ of_ X7__typ_edifference in power di
Lattice ^eff *n annu^"s
17J'lK71,7M7N 7
111111
.0136
.0160
.0125
.0121
.0166
.0184
0.1 .i .0.0.2.
1
333408970817
-000000
2
.06
.46
.64
.20
. 14
. 53
-0- 0-0-00-0
3.29.62.7».38.24.62
str ibut. ion [%}
0.- 0,0.
- 0.-0.0.
4
3318.04.07.25.56
Table 5. Comparison oï kinj, _, _W1MS _and_ DIAMANT.results-
model
supercell, central cell fuelwaterabsorber
assembly, control cluster inserted
WIMS DIAMANT24 96
1.24305 1.24300 1.243011.23141 1.23181 1.231800.93268 0.91446 0.915570.92979 0.92052
Note: 24, 96 for DIAMANT means number of triangles per cell
Table 4. Power d i a tribu tions in l,K- 0 with UO„-Gd9O,, [11]. — ———— _ _ ——— .- ——— _- , _ ———, —— _ — — — - — -ff —— —£,' O
Gd contents difference in power distribution [*]BA rod annul UK 1 annuI us 2
0.51.01.52.0
-5.20-7.30-9 .25
-14.24
?.. 162.253.202.96
0.6V0.700.990.92
Table 6. Comparison of k- r for assembly WIMS and HOMOGS——— —————— • ——— ' — — JLJIJL ——— —— — ~— ' ——— — ———————~ — " —
burn-upcontre iWIMS
[MWd/kgU]
05
1015
0000
91688883728511182206
cluster insertedHOMOGS
regui ar0.0.0.0.
91439881618495382013
actual
0000
92315889518560882503
with burnable absorberWIMS HOMOGS
regular
1111
.08743
.07621
.05618
.02858
1111
08901OÏ7400580403078
actual1 .092021.078501.058371 .03081
Results of the comparison of calculations and experiments[2) for lattices containing Gd are presented in Table 3 for X7
differencestype ZH-6 lattice. The order of the difference in »ejpf is the
betweensame as for clean 7.R-6 lattices. The ............— ~ .,,._..——calculated and experimental values of power distributons show nosystematic trends with changing Gd concentration.
In Table 4 we present the results for l.R-0 lattice with UO2- GdoOg rods [11]. In this case, difference in the power in theubsorber increases with increasing concentration of Gd. Incontrast to results presented in {11], WIMS underestimates thepower in the absorber. This indicates that the depression of theflux in the central cell is exaggerated, what can be caused byoverestimating the Gd offectivity. It may imply that we shouldsoaewhat increase the gadolinium cross sections. We p Lan someinvestigations in this direction in the near future.
We can conclude that there exist some problems in theapplicability of our computational models to lattices containingGd absorbers but the discrepancies are of the same order us forother codes. We therefore regard our models acceptable* forpreliminary analyses and have in mind, that the research in thisfield should continue.2.2.2. IHAMANT _2..
Using W1MO,analyzed. As the
only cylindrical iy.ed structures could beactual geometry in VVKRs is hexagonal, we
acquired DIAMANT (8) from the NEA Data Bank to be able to analyzethe effects of geometrical simplifications on one side and theeffects of diffusion approximation used in HOMOGS, on other side.While the effect of the cylindrical approximation can be regardednegligible for regular lattices, it is of the order of 1% in k- ~for assemblies containing absorbers (see Table 5).
2.2.3. H()MOGJj_,
HOMOGS is a few-group finite difference code derived fromMOBY-DICK. At the lattice analysis stage, it serves to theassembly homogeni zation. It accepts diffusion constanst preparedby WIMS (eventually processed by APPRO) and performs assemblycalculations with reflective boundary conditions. Also at thestage of assembly hoinogenization the method of spectral indicesrequires homogenized constants not only for asymptotic, but. alsofor disturbed spectrum. The spectrum disturbances are modelledhere similarly as in WIMS by adding an extra region to theassembly, applying the boundary condition at the boundary of thisextra region and averaging the constanst only over the propervolume of the assembly including the inter-assembly gap.
Results of WIMS and HOMOGS are compared in Table 6. The<]j t'ferences reflect effects of two combined approximations:the geometrical one (cylindrical in WIMS, hexagonal in HOMOGS)and the diffusion difference approximation used in HOMOGS. Socalled regular geometry is used in WIMS. It dilfers from theactual one by the shift of control cluster pins so that the
VDto assembly possess a 30 degrees symmetry sector. The differencesindicate that the actual geometry should be accounted for in thesecond stage homogenozatiori , even if it implies the increase incomputing time due to lower symmetry of the problem.
2.2.4. HECON .
HECON is a code computing the heterogeneous constants bycollision probability method. IL is based on HECS code ofI'edersen |9). 1'or a G- group problem, it generates a GxG matrix -ythat couples flux and current on the surface of the element,
J 1 * .Typically, the calculations are performed in 10 groups with
input data prepared by W IMS.« Resulting parameter dependentfew- group matrices (2 or 4 groups) are stored and later onprocessed by correlation subsystem.
3 . SUB_SYS_TEM_ ._
The subsystem consists of a single code - APPRO - thatprocess the files created by the lattice analysis subsystem. Thecode employs the method of the least squares and performs asearch for the optimum regression polynomials.
While some parameters are separable, others are correlatedand therefore mixed terms appear in resulting polynomials. Op tonow, the code haven't been able to determine systematically thedegree of the correlations and heuristic approach is used toselect the appropriate combinations.
The code is able to perform certain simple manipulations(e.g. select specified values, combine them together by algebraicmanipulations etc.) over the input data that are defined by inputcommands. It can solve the criticality equation, determine thecritical buckling and fluxes, that are then used for groupcollapsing. It determines the sensitivity of k. .> to differentquantities that is used in the selection of optimum polynomial,where optiaum meuns the simplest polynomial conforming to thecriteria of accuracy.
At the output of the code we obtain a list of independentvariables and, for each required quantity, the powers ofindependent variables and corresponding polynomial coefficient.s.
4 . GLOBAL_REACTOR_ .ANALYj? IS JLOgSXSTEM..
4.1. MOBY-DJJ.CK.
4.1.) . Oyerviejf of the code.
MOBY-DICK [12] is a code system solving few-group diffusionequation. Ik uses Borresen's modification of Lhe finite
difference scheme. The system allows to construct computationalpaths for two- and three-dimensional calculations with two meshtypes :- triangular mesh with subdivision of the hexagonal mesh elementl.o Bk ' triangles, used for coarse-mesh core calculât] ons with afuel assembly as the basic element;hexagonal mesh, used for fine-mesh calculation» of the core or
its subregion with an equivalent cell as the basic element.
Code allows to describe the wide variety of fuel managementschemes: rotation of fuel assemblies, application of burnableabsorbers etc. Libraries of parametrized few-group diffusion datain different formats can be easily incorporated. By specializedpaths the code allows to perform- analyses of burn up and transient processes with non-stationarypoison ing,- detailed analysis of characteristics of individual core states,core calculatioti without feedbacks.
Code results are stored in the code archive and they can befurther processed or used as input to other programs.
The Borresen's modification of the finite-difference schemeconsists in replacing the conventional averaging of the diffusioncoeffic ient
"IJ "by the geometric mean,
Using the transformation
finite-difference equations can be written in a form allowingsubstantional reduction of computer memory and time.
Generally, the boundary conditions are expressed by relationJ(r) y(r) *(r).
Special cases of the boundary conditions are
a) albedo a. Then
1- ï ï ( 1 (\ - a)

W
and, if nondiagonal elements of a are y.eros,
Sl - ««g i j
2(1 4 o2 )i j
, -y =0 for h t g.
b) extrapolated lehgths X :i j
RS S g ß*>•y -- D / X ,-y -0 for h * g.ij i ij ij
Any irregularity of finite-diflerence mesh size stronglydeteriorates the effectivity of the corresponding code. MOBY DICKtherefore uses the regular mesh. As for the fine-meshcalculations the actual mesh is not regular due to inter-assemblygap, diffusion data for those mesh elements should be Modified toaccount for this effect. Some research has been done in TIC tosolve theoretically the problem of the selection of the- properdetermination of effective constants, but up to now it has notled to conclusive recommendations. Therefore the followingapproach is used : Dilution coefficient « is determined as theratio of the actual assembly volume V , to the volume of theregularized assembly
o - Vact / regg g->hand cross sections of the gap material 2 and E are thenr s
multiplied by this factor. Corresponding diffusion coefficientsD^ are not modified. The drawback of this method is that for thecorner element at the interface among three assemblies the sameaverage dilution is used as for normal interface elements betweentwo assemblies. Mesh régularisation implies the increase of thecore size. Therefore the radii of reflector zones must becorrespondingly modified to preserve their mean thicknesses ifradial reflector it: to be treated as the diffusion medium.
For inner iterations, conventional successive overrelaxationmethod is used. Outer iterations are accelerated using the methodof Chebyshev polynomials. In special cases (no feedbacks, nocriticuiity search), the method of Ljusternik extrapolfition canbe applied with advantage.
if the diffusion data are parameter dependent, then thethird kind of iterations - feedback iterations - must beperformed. in this process, we usually demand the corecriticality and therefore criticality search is performedsiaultaneously. The iteration strutegy aims to minimixe the
overall number of iterations. The low accuracy of inneriterations deteriorates the convergence rate of outeriterations, but there exists some useful limit of sufficientaccuracy. If we exceed this limit, we only waste time. InMOBY-DICK the criterion for terminating the inner iterations isthe decrease of the error in fluxes in two successive inneriterations to approximately 154 of an error in fission source inthe preceding outer iteration,
A*1 ~ 0.01 AS(v
where it, v art-respective 1 ly.
indices of Inner and oui.er iterations,
The relation between outer and teedback iterations is morecompJioated. If the accuracy of outer iterations is relaxed, i.e.their number per one feedback iteration is relativojy small,diffusion constants must be recalculated more frequently and, at»more than 50% of the overall computational time i« spent in theserecalculations, it »ay result in the loss of computationaleffectivity. On the other side, if the convergence criterion istoo stringent, feedback iterations can be oscillatory or evendivergent. On the basis of our experience with the calculationsof VVER-440 and 1000 we require the reduction of the fissionsource error in feedback iteration no. v
AS(v) c AS(1)
where c = 0.3 for reactor with power and c - 0.1 for reactorwithout power. The total number of outer iterations is limited to15. Such strategy ensures in most cases either the monotonouscharacter of iterations or strong dumping of eventualosciIlati ons.
of the criticaiity search can beThe parametersthe following:- critical height in 2-di»ensional calculations,- critical concentration of the boron acid used as a chemicalshim control,
critical level ol the insertion of mechanical control elements.This search takes into account the limiting depths of theinsertion and the established sequence of control element groupinsertion or withdrawal.- critical time step length at the end of the fuel cycle,corresponding to the exhaustion of the available reactivityexcess.
and thermohydraulical feedbacks areThe physicalcharacterized by- thermal reactor output, determining the local specific power,
inlet coolant temperature, coolant mass flow and coolantpressure, determining fuel temperature and coolant temperatureand density,
fuel burnup,- Xe and Sm concentrations,- spectral indices.

Relatively simple theriBohydrauljcaJ models and correlationsare incorporated to the program. Fuel conductivity is determinedby the relation
X -3824130 f T
•* 4.788 . 10 T3
Coefficient of thermal conductivity fuel • clad isdetermined by GAPCON-THKKMAL3 . Thermal convectivity clad -coolant is characterized by the o.onvect i vi ty mode. Two modes areallowed ill MOBY-DÏCK:
First of them is the study of the '/.It- C, cores with absorbersand water gaps. The fitting of the library consisted inmultiplying the thermal group diffusion coefficient by factor0.7. Results of the final calculation are illustrated in Figures•3 and 5, where percent differences between calculated andmeasured power distributions are presented.
convection to sub-cooled coolant. In this case, constant,convect i vi ty coefficient is supposed in the core and it isdetermined by Mac-Adams formula
keff
- 0.023De Re0.8 0.4
- surface and nucleate boiling. Here, Jens-Lottes correlationO.Y9204 4j————i
N «W.- t » A t , At -oxp(p/6.205)
is used.
The K3ngie-channel analysis is applied to determinetherraohydraulic characteristics of the coolant. The pressurechange along the channel is neglected, homogeneous mixture water- vapour is supposed in two-phase flow, vapour is supposed to besaturated during phase transition and evaporation andcondensation are supposed to be immediate.
Osmachkin correlation, which is rather conservât.!ve, is usedto determine DNBK.
Reactivity coefficients can be calculated either directly byconsecutive calculations or using perturbation theory.
4.1.?,. Verification of the code.
The ability to predict reliably the performance of the coreis the decisive factor of the acceptance of the code system. Itcan be verified by the follow-up studies based on the operationaldata. We have seen that the lattice subsystem is able toreproduce k f^ with an accuracy of the order of one percent, buteven 1% means several days in the fuel cycle length. It means,that it is usually necessary to perform some fitting of thefew-group libraries to opérâtjonal data. Up to now, we don'tapply any mathematically rigorous method and use the intuitionand trial and-errors met.hod. 'Co estimate the ( ode systemperformance, two case studies are presented her«;.
* *-3.9 * *
-.1 * *4 + i +
.8 * * I--1.2 * 1.0 * +
--2.9 -2.8 * * i-1.8 * * - 1 .0 * h-1.9 * 3.2 * * ^
-1.1 * * -2.?. * * ^-1.4 *-3.5 * J . 9 > *
1.0 * * -1 .4 * ^ * *- 1 . 2 - . 1 * 2.2 t- 1.3 * *
-0.7 * -.7 * + * -.3 *-1.9.7 * 3.1 + 3.1 * * * - 1 . 5
+ t -i ^ 3.2 .7 * * * - 1 .02.6 * 3.8 -i .2 * * * * 2.4
-0.3* .1* + * .9* * * .7-2.0-3.0* 3.0 H 3.0 « -.5 * * 1.41.0 * * -.3 * ) 1 . 4 1 . 5 * -1.5 *-1.0
.9 * 1.3 * 2.6 + 2.0 * - 1 . 0 * *-].02.1 * * , 2 * 1 . 8 h ^ t + ^ + +
1 . 1 * .2* .3+ It * * * * * *1 . 8 * * 2 . 2 * t * * * * * * * *
. 6 . 3 * 1 . 7 1 * * # * * * * * *. 4 * . 4 * t i t * * * * * * * * *1 . 8 * 1 . 3 » * * x- * * * * * * * *
i water gap
FIG. 4. ZR-6, configuration 101/100.

(Colc.-Exp.J/Exp.
FIG. 6. Differences between power calculations and thermocouple data in Loviisa-1.
oo
* * *
* * * *
CO* * *
COCO .
* * * *O3
ro , c-* * *
;> *?* * * *
•* i* * *
O3 C*î * * * * * ^rt « K cv •* is10 • • * * • * K— i i i ta
r* -T. r-* * * * * * O*••* •"-
-3- CO CO 00 gC O * * * • • • 3
' — ' . K ^ .!?" l " ' " 1 * * * . , '. ' * gr, -, « CO. g
t- C- 1 CO — CO u
* * * 4 -0 N <0"•w «s ""' " co • co CC
+ . * * * * . - ) - • • NCO
« co o in w , >"* * * * * • • • . ^-< — i t- -< co <3
X O CC t- ' LL* * * * • • * * *
t— i 00 t"HO l *> tf> -1
* * * * * * *— 1 I t-
O i in ir> co* * * * * • * * * * * t«
rl « CO UC O ' — CO CO CC — 1 <fl -C
* * • • • * * * • M- t - , — - H 1 0
, co : c- -n s- oo v.^ . * * * • • . * * • * , £
rf i CO .-i S* ~ - — ! O u l ^ O 5 > - C * 3 C U [ > - O >
+ - . . - *CO -- CO CO 1 ul ' ' 1
*
M ilt-'^'C F- l/ MÜ
•F, X C 4^ « J.« B [^-C5-T3 5) h a, — O«r- S 4)
1 C3 ^ ï • l-< K K• M (p C t) 4< C fiî
rH^ . ) !-V Pl ^J !* Q fr
C •-( CC Ä ! M 0 -i-i I-,
00 13 "— » C« *£ $ ür t — j • c ö S 1* *^3 / M M — < V O w ^ Ck ,. M a u c a *
o -F- a s/ "c oS -Q & JS i; k FOMB s Ä (< S) 'S ->. r tF iq j ; r t ^ w i :
> Ï fc, B •" -300 _' C il 'S C C
— W XJ E * 3 BÖr- S) J .-* a, .ü 1,
ii H S .C M 0£ D -m -f. • > •* J54; j; (, p -o t.
§ C 4^ 3J -U C1! C -J 0 .£ r-n
tti 3 h « « -OW Ç M a; K t, 01 ! -•rt 0 'Jw Ü W V £. — *K E| iu SH jj 3 -jJ cC ix s ü - - < a - u - H - ^ <SJ 1>» Ä ••-' > il ^~C T5 -3 C* DMt33 K C t ^ " C C M t* •>
- * ^ C 3 J r t C » ß u , t 3 OC / K C y î B t | - j S l j Û > —
J3 -n L, S ^> -H
D a a t- i et oM M r ^ tir-l - O C•i- S 3 S! * -H K Ji rH M
U Ï X 0 •— l, S
M T3 Ä t. i.» (ü •> üa ^ ü "j c . o > >>ü yj ^, u 4) -F^ l; ü
3 ^) >r, .1 4^ ^Q — ," 0 O X ^ t â ^ 1 - C UC - C S " i ' H T 3 i ) ! Ö l ;o x^! o x t, i- i,4) 41 > a 0 ' S .0n TI <« K F. ü •-,
•i O S M » « -C ! S - ^ ' O Î - ^ 0 ' ^ 0j a c i ^ d i O v v C ^E ^ c j ^ - a P V K " j
^ r ^ C " 3 w 4 , ' O P-J3 K 5) JC — a, Î)
ta T; S -P *» I >W 4 J C 4 ) U O B C Ü " ^
— F - a S - C F O S ^ î t f
jj - 0 -J.C C- -i B
*" 0 4. Sa F- ...S a a.
ï 'J K 5— 3) 'F- XK !-c a•F- Xi: t.c 'j a0 x ^ 4 ;C JJ J2 E
>> ^ *oCÖ 41i, -j — j;Jü C -^ -^FH ' ^T- Ï
^JU — iisi •-, js
4JO JS
<H 0 —0 - H l «
C Î 350 O 0C — 1? -H•i K T3 .>-5 3 C B4J •-( c; x
•c JE ""i- *;^-^ 4? - v
X S 1-4J >Ä 0
C t»-1M O *a cC C O "
0 M XM -H JJ•-. -• cj: a a*s U c i;C ^ 1! 3-i 0,3 T
'" pF- o a.3 0 01a 4J f.
95

.20
»Idi
Io'
si
o-i01*,'
«l
3CO1
-091
a. c§8-U (t CSo •„ ^>ssoi, W J
nC l;r- S
OOPC
i Oo
r* tO O 35 —i C~ —i 1C O G O "/5
O •- O O ' - O ' H O O J O - -
C O 3 5 - ( _ X 3 5 - I Î O r C ' « ' — ' X
O T-I O ' O N O — O « O
t o o o — ( O ^ - ^ ^ c o m o c ^ o oO' -co>^« ' -O ' -> -oo — ,-
C —t O O
m t - o o o o o o o x s 5 > -
- - O 3 > O O O O O ' - t - - 3 ! C O C J Î O
-l O «<-O * ^ -< t-i
11 0 «•J S 'J C 0 CC 0 C 0 S 0l! -H i; *rt 3/ •«t, .J t, ^ L, -Pf 3 1; ä ï S
il•j cÜ JJa c u cC C C 0i; .« s .„•„ jj t, J
•H 5)•o -a ; i Ü -^ lî -^ 4! H i/ -^ i)
l * Ö n 2 ' C ' T 3 " C ~ ö " 0 ' O " 0• C 'S • fi • C •
^0 913 d"0 «T3 OJT3^ U^ O-P 2J^ O-PM S M S M S "«"' 5 M
OO
O O Oo o oen a s;
nocoOOCS
oS
o ^8 *
o _ .2
Oo(O
q
D.
Omœ(3
FIG. 7. Diflerences between power calculations and Rh data in Loviisa-1.
96
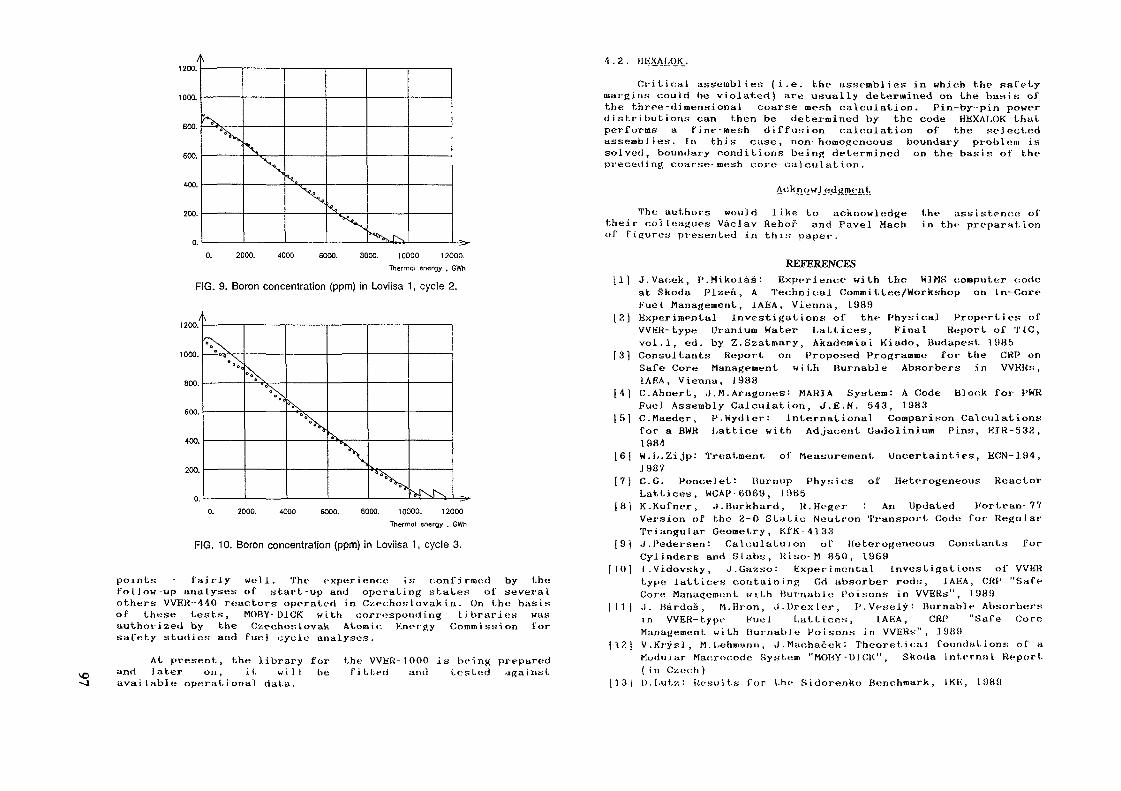
800.
600.
WO.
'X
8000. 10000 12000.
Thermal energy , GWh
FIG. 9. Boron concentration (ppm) in Loviisa 1, cycle 2.
800.
600.
400.
200.
0. 2000. 4000 6000. 8000. 10000. 12000Thermot energy . GWh
FIG. 10. Boron concentration (ppm) in Loviisa 1, cycle 3.
points - fairly well. The experience is confirmed by thefollow-up analyses of start-up and operating states of severalothers VVER--440 reactors operated in Czechoslovakia. On the basisof these tests, MOBY- DICK with corresponding libraries wasauthorized by the Czechoslovak Atomic Knergy Commission forsafety studies and fuel cycle analyses.
At present, the library forand later on, it wi) I beavailable operational data.
the WER- 1000 is being preparedFitted and tested against
4.2. HEXAI,OK ,
Critical assemblies (i.e. the assemblies in which the safetymargins could be violated) are usually determined on the basis ofthe three -dimensional coarse-mesh calculation. Pin-by-pin powerdistributions can then be determined by the code HEXALOK thatperforms a fine-mesh diffusion calcul ation of the selectedassemblies. In this case, non- homogeneous boundary problem issolved, boundary conditions being determined on the basis of thepreceding coarse- mesh core calculation.
The authors would like to acknowledgetheir colleagues Véclav ftehof and Pavel Machof figures presented in this paper.
the assistance ofin the preparation
REFERENCES11) J.Vacek, P.Mikolàè: Experience with the W3MS computer code
at Skoda Plzeh, A Technical Committee/Workshop on In-CoreFuel Management, IAEA, Vienna, 1989
[?. ) Experimental investigations of the Physical Properties ofVVKR-type Uranium Water Lattices, Final Report of TtC,vol.1, ed. by Z.Szatmary, Akademiai Kiado, Budapest 1985
[3] Consultants Report on Proposed Programme for the CRP onSafe Core Management with Burnable Absorbers in VVEHs ,lARA, Vienna, 1988
[4] C.Ahnert, ,) .M. Aragones: MARIA System: A Code Block for PWKFuel Assembly Calculation, J.Ë.N. 043, 1983
15] C.Maeder, P.Wydler: international Comparison Calculationsfor a BWR i/attice with Adjacent Gadolinium Pins, KÏR-532,1984
[6] W.L.Zijp: Treatment of Measurement Uncertainties, ECN-194,J987
[7] C.G. Poncelet: Burnup Physics of Heterogeneous ReactorLattices, WCAP-6069, JOBS
[8] K. Kufner, .».Burkhard, R. Heger : An Updated Fortran- 77Version of the 2-0 Static Neutron Transport Code for RegularTriangular Geometry, KfK-4133
[9] J.Pedersen: Calculatuion of Heterogeneous Constants forCylinders and Slabs, Hi so- M 850, 1969
[10] I.Vidovsky, J.Gazso: Experimental investigations of WERtype lattices containing Gd absorber rods, IAEA, CRP "SafeCore Management with Burnable Poisons in VVERs", 1989
| II | ,) . Bàrdos , M.Hron, J.Urexler, P.Vesely: Burnable Absorbersin VVER-t.ypt- Fuel Lattices, IAEA, CRP "Safe CoreManagement with Burnable Poisons in VVERs" , 1989
f!2| V.Krysl, M. I/ehnann , J.Machacek: Theoretical foundations of aModular Macrocode System "MOBY-D1CK", Skoda Internal Report( in Czech)
[13| ».Lutz: Results for the Sidorenko Benchmark, IKE, 19881

00 THE PROGRAM SYSTEM KARATE
J. GADO, A. KERESZTURI, I. TROSZTELCentral Research Institute for Physics,Budapest, Hungary
Abstract
The program system KARATE is being developed for the calculationof the VVER-1000 type reactor. In the first part of the paper themain features of the code system is described. In the second partthe first results are presented.
IntroductionIn the Central Research Institute for Physiscs the modular codesystem KARATE is being developed for calculation of the WER-1000type reactor. The KARATE system will be finished by the endof 1990. The purpose of the program system is the calculation ofthe neutron physical and thermal-hydraulic processes in the coreat normal, startup and slow transient conditions. The systemconsists of three calculational levels: the multigroupcalculation of the fine-mesh diffusion type constants, thefine-mesh diffusion calculations inside the assemblies and thecoarse-mesh global calculation of the reactor. In the first partof this paper the main features of these three levels aredescribed and in the second part the first results are presented.A number of input and output data of calculated and measuredbenchmark problems are collected in a qualifying system and thecalculating programs can be verified against them. Some of theresults presented in the second part belong to the verificationprocess.
I. The main features of the KARATE system1. The multigroup calculationsThe aim of the multigroup calculations is the generation of thefew-group fine-mesh diffusion type constants for each type of thelattice cells of the further fine-mesh assembly calculations. Theobtained cell averaged four-group cross sections are parametrizedas a function of burnup, boron concentration, moderator densityand temperature, fuel temperature, XE-135, SM-149, PU-239concentrations. The epithermal-to-thermal flux ratio (abbreviatedas SI for Spectral Index) is a further parameter which accountsfor the nonasymptotic behaviour of the neutron spectrum.All the multigroup calculations are performed in 35 epithermaland "in 35 thermal groups. The calculations are based on amultigroup library generated from the ENDF/B-IV file. The thermal
scattering is described by the Nelkin-model. The cross sectionsof the three resonance isotopes (U-235, U-238, PU-239) and theBell factors are tabulated as a function of the dilution crosssection of a homogeneous material and the temperature. Theequivalence theory is used for the calculation of the shieldedmultigroup cross sections for the hetrogeneous case, where theDancoff factor is determined from the first flight collisionprobabilities.The following programs can be used for the calculation of thecell averaged few-group constants.
BETTY
The code is applied for the fuel cells. First the cell ishomogenized using the multigroup collision probability methodwith white boundary condition on the edge of the cylindrizedcell, after the B-l equations are solved in order to taking intoaccount the leakage in asymptotic approximation. For the cellswith heterogeneous surroundings the nonasymptotic behaviour isassured artifically by means of an extra layer outside the cell.This way the parameter SI can be changed. The obtained few-groupconstants are parematrized as described above. For furtherapplications the multigroup homogenized macroscopic crosssections of the cells are also stored.
COLAThe code is applied for the cells containing absorber rod orwater hole surrounded by fuel cells. The surroundings isdescribed by their homogenized multigroup macroscopic crosssections created by the BETTY calculations. Not only thesymmetric solution but also the antisymmetric one is calculatedfor the determination of the diffusion coefficient. Generalizedfirst-flight collision probabilities are applied in thecylindrical geometry.
CYLAN-SNARE
This pair of progrmmes can. be used near to the complicatedheterogenities, for example near to the edge of fuel assembliesor to the reflector. The code CYLAN calculates the responsematrices for each cell and they are used in the program SNARE tosolve the response-matrix equations for a limited number of cellsnear to the heterogenities. The drawback of this method is thatbecause of its time consuming property the program SNARE works infour groups whereas the program CYLAN performs multigroupcalculations. Therefore CYLAN needs four multigroup spectra whichmust characterize all the possible spectra on the edge of thecells. These spectra can be obtained from the COLA calculations.In the program CYLAN the very similar generalized first-flightcollision probability method is used that was applied in the codeCOLA.

BURN 3. Reflector calculationsThe fuel pin cell burnup calculations extend to 15 actinide and73 fission prouduct isotopes, what allows following the burnupupto 50000 MWd/TU. Solving the burnup equations all importantxenon and kripton isotopes are determined for the fueltemperature calculation, because they are needed for thedetermination of the gap and the fuel heat-conductance.
Reflector regions are represented by albedo matrices in theglobal calculation and those matrices are deduced from a set ofspecific fine-mesh diffusion calculations with inhomogeneousboundary conditions. The albedo matrices of diverese reflectortypes are parametrized as a function of the boron concentrationand the water temperature.
2. Fuel assembly calculationsThe fuel assembly characteristics are calculated by solving thetwo-group fine-mesh diffusion equation in hexagonal geometry forthe given assembly or for the assembly and its surroundings (onethird of each neighbour assembly). The irregularity between theassemblies is also taken into account in the difference scheme.The group constants depend on the parameterss listed above atthe fuel cell calculations, and the feed-back via the theparameter SI accounts for the nonasymptotic spectrum. Theboundary condition may be the traditional white boundarycondition on the edge of the fuel assembly or may be a given fluxdistribution on the boundary of the calculation. The latterpossibility allows the determination of the response-matrices forthe fuel assembly. In this case it is reasonable not to choosethe boundary of the calculation just on the edge of the assembly.This type of the boundary condition leads to an inhomogeneous setof equations (in mathematical sense) with prescribed k-effinstead of the traditional eigenvalue problem.The aim of the fuel assembly calculations is twofold. In thefirst type of the calculations one provides the globalcalculations with two-group homogenized constants orresponse-matrices, whereas the second one determines the pinpower peaking factor using the results from the globalcalculation in the form of boundary condition.In the first case only one axial layer is calculated withpredetermined thermohidraulic characteristics of the coolant. Theburnup and concentrations of the isotopes U-235, U-238, NP-239,PU-239, XE-235, SM-149, 1-135 may be calculated pin by pin. Theresulting two-group cross-sections are parametrized before usingthem in the global calculation as in the case of the cellcalculations. The response-matrices used only for methodicalinvestigations yet.The second type assembly calculation obtaines the boundarycondition fromproblem with acalculated andaxial bucklingburnup and thecalculated pin
the global calculation and solves an inhomogeneousgiven flux on the boundary. All axial layers arethe third direction is taken into account by anoriginated also from the global calculations. Theconcentrations of the isotopes mentioned above areby pin. In this way the complete history of the
4. The global reactor calculationsThe functions of the global calculations are as follows.
Calculation of the state of the reactor core at givenassemblywise burnup distribution and at given input flow andtemperature. Determination of the k-eff or critical boronconcentration or the control rod group position. Calculationof the flux, power and temperature distribution in the core.Fuel cycle calculation.Xenon transient calculation.
- Refuelling.- Calculation
parameters.of reactivity coefficients and kinetic
assembly can be followed in details.
The global reactor neutron physics calculations are performad intwo energy groups by means of a 3D nodal code in hexagonalgeometry. The nodes are the assemblies subdivided into axiallayers. The unknowns are the partial currents on each nodeboundary. In principle the fluxes are already known everywhere inthe reactor from the partial currents. The nodes are describedeither by homogeneous cross-sections either by response-matricesavailable from the assembly calculation. In the first case theresponse-matrices coupling the partial currents for a given nodeare calculated analytically.The homogenized cross-sections are parametrized in the same wayas the fine-mesh diffusion type constants, the only differencesare that instead of the fuel temperature the average node poweris used and SI is not but k-eff is also a parameter. Thisparametrization makes it necessary, that during the burnupcalculation besides the burnup the concentrations of the isotopesU-235, U-238, NP-239, PU-239, Xe-135, SM-149, 1-135 must be alsofollowed for each node.
5 Thermal-hydraulic calculationsThe thermal-hydraulic modules of the KARATE system make itpossible to calculate the thermal properties of the whole core o.ndetail. The calculations are made on subchannel basis,
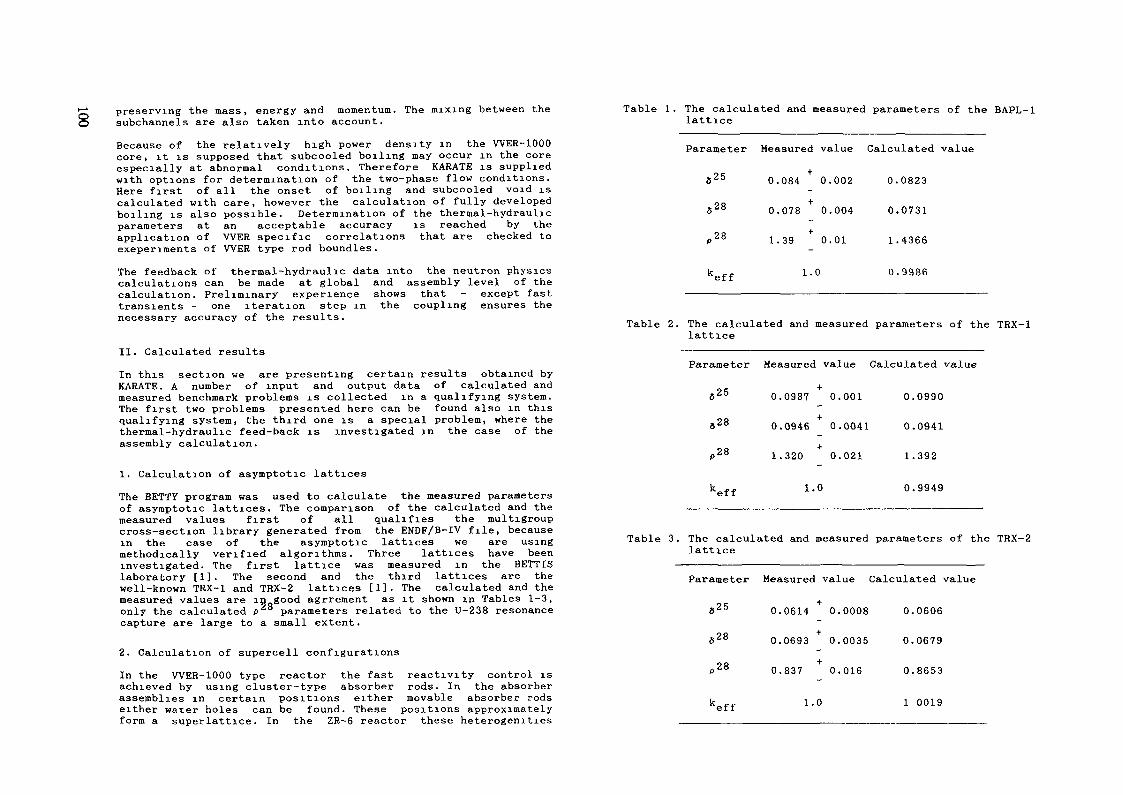
preserving the mass, energy and momentum. The mixing between thesubchannels are also taken into account.Because of the relatively high power density in the WER-1000core, it is supposed that subcooled boiling may occur in the coreespecially at abnormal conditions. Therefore KARATE is suppliedwith options for determination of the two-phase flow conditions.Here first of all the onset of boiling and subcooled void iscalculated with care, however the calculation of fully developedboiling is also possible. Determination of the thermal-hydraulicparameters at an acceptable accuracy is reached by theapplication of WER specific correlations that are checked toexeperiments of WER type rod boundles.The feedback of thermal-hydraulic data into the neutron physicscalculations can be made at global and assembly level of thecalculation. Preliminary experience shows that - except fasttransients - one iteration step in the coupling ensures thenecessary accuracy of the results.
II. Calculated resultsIn this section we are presenting certain results obtained byKARATE. A number of input and output data of calculated andmeasured benchmark problems is collected in a qualifying system.The first two problems presented here can be found also in thisqualifying system, the third one is a special problem, where thethermal-hydraulic feed-back is investigated in the case of theassembly calculation.
1. Calculation of asymptotic latticesThe BETTY program was used to calculate the measured parametersof asymptotic lattices. The comparison of the calculated and themeasured values first of all qualifies the multigroupcross-section library generated from the ENDF/B-IV file, becausein the case of the asymptotic lattices we are usingmethodically verified algorithms. Three lattices have beeninvestigated. The first lattice was measured in the BETTISlaboratory [1]. The second and the third lattices are thewell-known TRX-1 and TRX-2 lattices [1]. The calculated and themeasured values are in good agrrement as it shown in Tables 1-3,only the calculated p2 parameters related to the U-238 resonancecapture are large to a small extent.
2. Calculation of supercell configurationsIn the WER-1000 type reactor the fast reactivity control isachieved by using cluster-type absorber rods. In the absorberassemblies in certain positions either movable absorber rodseither water holes can be found. These positions approximatelyform a superlattice. In the ZR-6 reactor these heterogenities
Table 1. The calculated and measured parameters of the BAPL-1lattice
Parameter Measured value Calculated value
,25
,28
,28
0.084 0.002 0.0823
0.078 0.004 0.0731f
1.39 0.01
1.0
1.4366
0.9986
Table 2. The calculated and measured parameters of the TRX-1lattice
Parameter Measured value Calculated value
»25
,28
,28
Sff
0.0987 0.001 0.0990
0.0946 0.0041 0.0941
1.320 0.021 1.392
1.0 0.9949
Table 3. The calculated and measured parameters of the TRX-2lattice
Parameter Measured value Calculated value
525
S28
28
0.0614 0.0008 0.0606
0.0693 0.0035 0.0679
0.837 0.016 0.8653
1.0 1 0019

JXOXOTable 4. Intra-supercell energy release distribution in the
supercell containing B4C absorber
Position2345678
Measured0000011
.880
.970
.990
.961
.997
.008
.000
±±±±±+±
0000000
value.005.007.008.007.014.007.007
Calculated0.0,0,0,0,1 ,1
.847
.960
.995
.941
.987
.000
.000
value
Fig. 1. Positions in the X7 supercell
were modelled by the X7 lattices [2], where the special cells aresituated in every seventh lattice position. Apart from thetemperatures the cell parameters agree with the VVER-1000lattice parameters. The obtained supercell and the numbering ofthe positions can be seen on Fig. 1. Three types ofheterogenities were investigated: B^C absorber rod, water holeand gadolinium rod [3], The calculations were performed by theCOLA program with white boundary condition on the supercellboundary. The calculated and measured energy releasedistributions are shown in Tables 4-6.
Table 5. Intra-supercell energy release distribution in thesupercell containing water hole
Position2345678
Measured value
1.115 ± 0.0051.032 ± 0.0051.006 ± 0.0041.034 ± 0.005-1.015 ± 0.0051.000 ± 0.005
Calculated value
1.1001.0201.0021.0311.0061.0001.000
3. The calculationfeed-back
of the fuel assembly with thermal-hydraulic
The aim of these calcultions was to investigate the influence ofthe thermal-hydraulic feed-back and the nature of the iterationwhen subcooled boiling occurs.
For the sake of the simplicity only the 30° sector of a fuelassembly was calculated. The numbering of the cells and thesubchannels are shown on the Figs. 2 and 3. The bottom line onthe Fig. 3 actually does not exist, it is only because of formalreason to describe the boundary condition. The shaded cells arecontaining water holes or gaps. All absorber rods were pulled outfrom the fuel assembly.
Table 6. Intra-supercell energy release distribution in thesupercell containing Gadolinium absorber
Position Measured value Calculated value2345678
0.906 ± 0.0020.972 ± 0.0021.002 ± 0.0020.973 ± 0.0020.996 ± 0.0021.003 ± 0.0021.000 ± 0.002
0.9180.9840.9980.9750.9951.0001.000

Fiq. 2. The nuinberinq of the subchannels Fiq. 3. The nunberinq of the cells
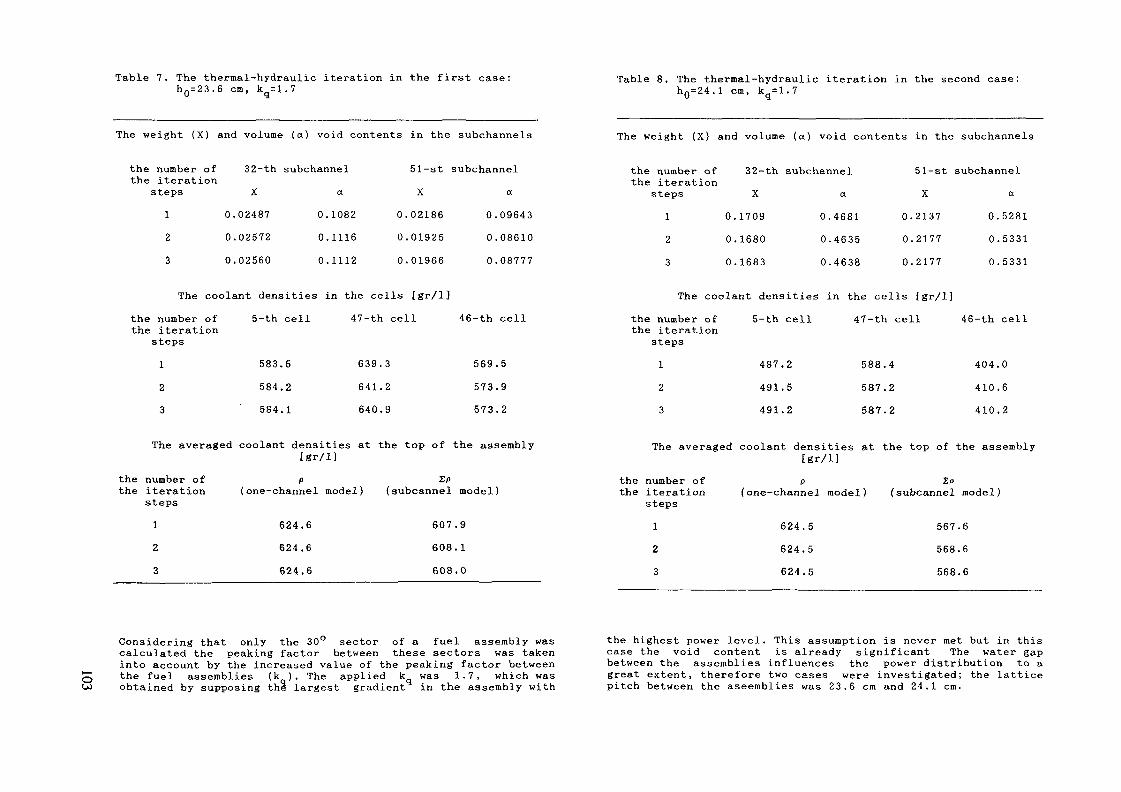
Table 7. The thermal-hydraulic iteration in the first case:h0=23.6 era, kq=1.7
Table 8. The thermal-hydraulic iteration in the second case:hQ=24.1 cm, k =1.7
The weight (X) and volume (ex) void contents in the subchannels The weight (X) and volume (a) void contents in the subchannels
the number ofthe iteration
steps123
32-th subchannelX a
0.02487 0.10820.02572 0.11160.02560 0.1112
51-st subchannel
X a
0.02186 0.096430.01925 0.086100.01966 0.08777
the number ofthe iteration
steps12
3
32-th subchannelX ex
0.1709 0.46810.1680 0.46350.1683 0.4638
51-st subchannelX cc
0.2137 0.52810.2177 0.5331
0.2177 0.5331
The coolant densities in the cells [gr/1] The coolant densities in the cells [gr/1]the number ofthe iteration
steps123
5-th cell
583.5584.2584.1
47-th cell
639.3641.2640.9
46-th cell
569.5573.9573.2
the number ofthe iteration
steps123
5-th cell
487.2491.5491.2
47-th cell
588.4587.2587.2
46-th ci
404.0410.6410.2
The averaged coolant densities at the top of the assembly[gr/1]
The averaged coolant densities at the top of the assembly[gr/1]
thethe
number ofiterationsteps123
P(one-channel model)
624.6624.6624.6
ZP(subcannel
607608608
model)
.9
.1
.0
the number ofthe iteration
steps123
P(one-channel model)
624.5624.5624.5
Zp(subcannel
567568568
model )
.6
.6
.6
Considering that only the 30° sector of a fuel assembly wascalculated the peaking factor between these sectors was takeninto account by the increased value of the peaking factor betweenthe fuel assemblies (kq). The applied k was 1.7, which wasobtained by supposing thé largest gradient in the assembly with
the highest power level. This assumption is never met but in thiscase the void content is already significant The water gapbetween the assemblies influences the power distribution to agreat extent, therefore two cases were investigated; the latticepitch between the aseemblies was 23.6 cm and 24.1 cm.

oz
To characterize the change of the power density and temperaturesduring the iteration three cells and two subchannels are chosen.The 32-th subchannel belongs to the 5-th fuel cell, which takesplace next to a water hole. The 51-st subchannel takes placebetween the 46-th and the 47-th fuel cells. The power density isthe highest in the 47-th fuel cell, in the corner of the fuelassembly. The coolant temperature is the highest in the 46-thfuel cell and in the 51-st subchannel.
H--Q
SU >-3rt y
CDrt
X f ftû fl> H
01II rt rt
I-, 13 Htr-j o eMl ft
H-rt OV 3
ÎU Hi01
Î3* 01 ftO ft S"
3 (D
O
(0nt)CD
HïP)oftoH
O- -. -P-•— OO -0
Cr -• .
O
O - -P-O OVJ v
rvj orv -
o •• *-F-vJ «OU) -*
CD - ro•— O-f- -
vC VJ1oo -O O4
•^ -. * — o
o -•UJ
0H- [7-O -
*- -ûo - t
o * •— •-
-• •— O
The weight and volume void contents (X,a) for the subchannels,the coolant densities of the cells and the assembly averagedcoolant densities can be found in the Tables 4 and 5. The datashown in these tables belong to the top of the fuel assembly. Itcan be observed that the inaccuracy of the coolantcharacteristics is smaller then 1% already after the 2-nditeration step.Tables 4 and 5 contain also the result of calculations with aone-channel model used for the whole fuel assembly (as it is inthe global calculations) instead of the detailed subchannelmodel. In this case corresponding to the average heating up ofthe coolant the void does not appear, while according to thesubchannel model the void content is not zero. In the tables theaverage density from the subchannel model and from theone-channel model are denoted by p and Zprespectively. The differences in the coolant density are 2.5% and9% at the top of the assembly.For the two cases the power densities at the top of fuelassembly are shown on the Figs. 4 and 5. The power density hasthe maximum at the corner of the fuel assembly. In the case ofthe greater water gap thickness the power peaking factorincreases by 15X.In the Figs. 6-9 the coolant void content and densitydistributions are illustrated in the cells and in the subchannelsalong the axis from the centre to the corner of the fuel assemblyat the top. Though the power density is always the highest in thecorner, the highest moderator temperature is obtained not in thisbut in the next cell. It shows that the cooling of the cornerfuel cell is better than the cooling of the next one because ofthe mixing.
i— O^- * ^-o -go *
o fjo
oo -
References[1J J. Hardy CSEWG Thermal Reactor Benchmark Compilation,
supplement to BNL-19302 (ENDF-202), Jun 1974[2] Final report of TIC, Volume 1, Experimental Investigations of
the Physical Properties of WWER-type Uranium-Water Lattices,Akademiai Kiado, Budapest, 1985.
[3] I. Vidovszky, J. Gazso Results of the experiments carriedout on WER type lattices containing Gd absorber rods,Material of the Technical Comltte/Workshop on In-Core FuelManagement, 622-I3-TC-676 . 3 6.4, Vienna, 1989.

0 S g1
o S +J
CO -P 3 OO « C
O îvj 4-J D •
S § * ïï
S e no « -a oo « "g £ *o J2 > -g
^ -p a)*— c w r-~5 S ^
o t~- o <u no "i ° 5 tro ~* ^ M-, X
o co H °CM
5 o. .S1O °. O (i,ö °
K-K DISTRIBUTION
i • 3 , 0 ,5. 5 6, 5 7, 5
.1054 l . 00. 00.
5. 6, 7, 3. 0,*< 4 5t 4 6, 4 7, • 4 8, 4
.9761 0 .9864 0 .1054 l . 00. 00.
10, l l r 12« 13t 14, 15, 0,3, 3 4, 3 i. 3 6» 3 7, 3 S, 3 <=, 3
0 0 .1014 l .073° 0 .9350 0 .1054 l . 00. 00.
17, 18, 19, 20, 21, 22, 23, 24, 0,2, Z 3, 2 4, 3 5, 2 6, 2 7, 2 8, 2 9, 2 10, 2
.9705 0 .1Q?2 l .1023 l .9314 0 .9075 0 .9343 0 .105S 1. 00. 00.
?6. 27, 28, 29, 30, 31, 32» 33, 34, 35, 0,IF l Z, l 3i l 4, l S, l 6, l 7, L 8, l 9, l 10, l 11, l
.9553 0 .9539 0 .9757 0 .1026 l .1022 l .9703 0 .9638 0 .9370 0 .1063 l . 00. 00.
37, 33, 39, 40, <•!, 42, 43, 44, 45, 46, 47, 4^, o,0, 0 l , 0 ? , P 3,0 4, 0 5, 0 6, 0 7. 0 8, U 9, 0 10, 0 11, U 12, U
0 3 .9927 0 .9532 0 .9610 0 .1014 l . 00 .1009 l .9619 0 .9SO6 0 .1003 l .1100 l . 00. 00
Fig. 5. The distribution of the power peaking factorat the top of the assembly
k = 1.7, hQ = 24.1 cm
105

700
mod
600
500
400
300 -
3738 39 40 41 42 43 44 45 46 47
1 3 5 9 13 19 25 33 44 51 612 4 7 11 16 22 29 37 46 56
cells
subchannels
0.20
0.10
0.0 - OO o O
1 3 5 9 13 19 25 33 44 51 612 4 7 11 16 22 29 37 46 56
Fig. 7. The coolant density distributionat the top of the assembly
ka = 1.7, hQ = 23 .6 cm
Fig. 8. The coolant void content distributionat the top of the assembly
k = 1.7 , hQ = 24.1 cm
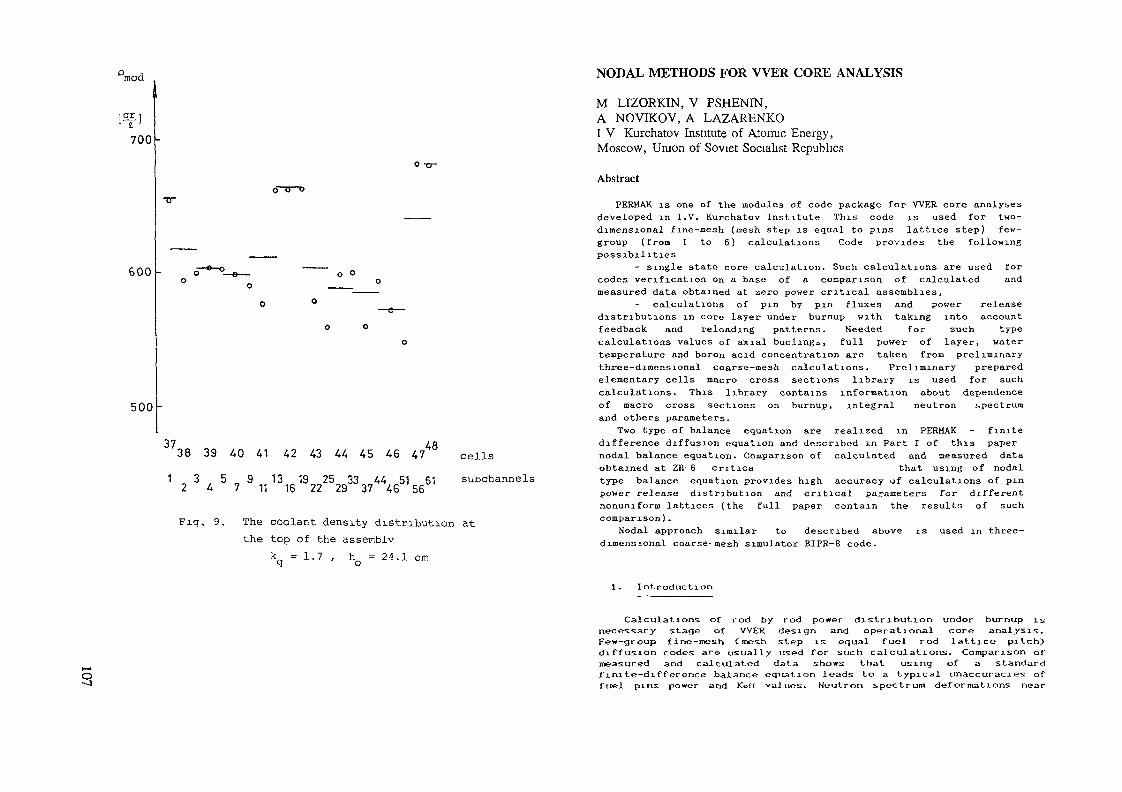
mod NODAL METHODS FOR WER CORE ANALYSIS
tar]
700-
M LIZORKIN, V PSHENIN,A NOVIKOV, A LAZARENKOI V Kurchatov Institute of Atomic Energy,Moscow, Union of Soviet Socialist Republics
0' 0 Ü
600
500
37 4838 39 40 41 42 43 44 45 46 47 cells
1 3 5 9 13 19 25 33 44 51 61 subchannels24 7 11 16 22 29 37 46 56
Fig. 9, The coolant density distribution atthe top of the assembly
kq = 1.7 , hQ = 24.1 cm
Abstract
PERMAK is one of the modules of code package for WER core analysesdeveloped in I.V. Kurchatov Institute This code is used for two-dimensional fine-mesh (mesh step is equal to pins lattice step) few-group (from 1 to 6) calculations Code provides the followingpossibilities
- single state core calculation. Such calculations are used forcodes verification on a base of a comparison of calculated andmeasured data obtained at zero power critical assemblies,
calculations of pin by pin fluxes and power releasedistributions in core layer under burnup with taking into accountfeedback and reloading patterns. Needed for such typecalculations values of axial buclingo, full power of layer, watertemperature and boron acid concentration are taken from preliminarythree-dimensional coarse-mesh calculations. Preliminary preparedelementary cells macro cross sections library is used for suchcalculations. This library contains information about dependenceof macro cross sections on burnup, integral neutron spectrumand others parameters.
Two type of balance equation are realized in PERMAK - finitedifference diffusion equation and described in Part I of this papernodal balance equation. Comparison of calculated and measured dataobtained at ZR-6 critica that using of nodaltype balance equation provides high accuracy of calculations of pinpower release distribution and critical parameters for differentnonuniform lattices (the full paper contain the results of suchcomparison) .
Nodal approach similar to described above is used in three-dimensional coarse-mesh simulator BIPB-8 code.
1. Introduction
Calculations of rod by rod power distribution under burnup isnecessary stage of WER design and operational core analysis.Few-group fine-mesh C mesh step i s equal fuel rod lattice pitchOdiffusion codes ar^ usually used for such calculations. Comparison ofrneasured and calculated data shows that using of a standardfinite-difference balance equation leads to a typical unaccuracies offuel pi ns power and Koff val ues. Neutron spectrum deformations near

ooodisturbers of a latt-o.ce uniformity C water gaps, reflector, absorbersand so orO, unaccuracy of finite-difference approximation andnondiffusion effects are main reasons of mentioned above errors,Increasing of thermal group number from 1 to 3 together with balanceequation improving based on representation of group fluxesdistributions in a elementary cell as a sum of two functions allows toavoid these errors partially. But such approach leads to a significantincreasing of processor time spending and besides this it is notwell-founded for calculations of lattices containing veryheterogeneous Cwith strong spatial flux depression} cells. Moreconsistent and rational nodal type algorithm is described below Cseealso Ref. 1-23. This algorithm allows to increase an accuracy ofcalculations without rise of energy groups number and to use for itsrealization slightly modified standard diffusion code.
2. Nodal type balance equation
$pg — $ p g
Jpg = —Jpvg
f - number of neigbouring cell.
According to C33
„r^ r<.$pg a 1 /F F
rJpg = l/P J
r
= a fpg c b fpg aapg
C43
A fpg tspg pg t apg
J"^ ri ~*= a j + b j
PS < i = p g pg o+ A Jxpg pg t = pg
Mentioned above effects determining of unaccuracies of standardfinite-differences few— group approach are the most important in athermal energy region Ccorrectness of this assumption will bedemonstrated in the next section). So assume that thermal neutron fluxdistribution in an elementary cell "p" of hexagonal lattice can berepresented as a sum of two modes - asymptotic Ca3 and transient CO :
FpgCr,O, E3 = FapgCr,D, E3 + FtpgCr,n, E3 C13
here g - thermal group number Cusually g=43.Assume that each functions in C13 can be written as a sum of symmetricalCs3 and antisymmetncal C a} modes:
Fpg = Fdspg + Faapg + Ftspg + Fla C2)
whereFospg = a f ;
pg aapgFtspg = A f ;
pg lopg
> b cos [ mp + mnX3 Ci -13 +6° 1 fL* i^pg "*pg aampg
Flo mpg costmp + mn/3 Ci -13 + ôl ] f^ mipg t arnpg C33
B ipg t C55
Condition C 4.3 under consideration of expression C5) contains eightunknown coefficients a . A . a . A and others determiningpg pg Ptg p^gamplitudes of corresponding trial functions. Coefficients a , a ,
pg p gA Apg can be easily determined using neutrons balance condition in
a cell and trivial properties of antisynunetrical functions:
» = <p st ;pg apg aspg
+ C.CV St 3apcr aapg aapg
Apg = CFpg-*>
F = - fFpgdEdOdVV
apg tspg
C63
S and a - source density and cell volume to surface ratiorespectively. H - cell averaged value of function H. Amplitude ofantisymmetrical asymptotic component of current can be expressed inthe following form:
i — number of cell bord& - phase shift;mpga, A, b, B — constants;f - trial function.
^ N=63
C73
Because of curvature of slowing down neutron f lux in WER latticesis not significant it is possible to confine to a first itemC m=l 3 in expression for Faapg- For a simplification let us assumethat such approximation can be also used for Ftapg- CIndex m is missedhereafter}. Let us use now conditions of a f lux and a currentcontinuity at y*. - a border between cells p and p
In expression C73 }'^ - currents in epithermal group. Determining
two unknown coefficients B^vand B^1 f rom system C4-55 and puttinapg p^g *- vthem into expression C53 one can arrive to the following formula forcurrent density:

2 DtpgDlp^g , _ _ _ _Jpg => _ —————- K$pg g -$pg g _)+CSpg-*> Cg -g )1P g aP 9
t }' L f 3 Dap g ^ i Dapg -. ~.p Cl- ———V 5 - f> Cl- ——— J H-^"v« Dtp g aQP9 Dlpg JJ
C8>
Balance equation writes as
- Y Jp-V L
<pa.pg - Ztpg C$pg - + Spg = O
Cell averaged reaction rates as it is seen from C95 are written in thefollowing form:
where
Eapg
Rpg = £apg tp
faspgdEdOdv
V fa
£ L pg Cïpg -
Ztpg =
ftspgdEdOdV
V faopg
It is possible to show that in a case when contribution of transientmode is negligible equation C93 is transformed to a asymptotic form:
_ Dapg Dap g\ V f ~ ~ " l ~ ~ ~—— J ^—^^—«•—— ! ïp g £: — $pg c I — Slapg S&apg + Spg == 0 C12}
hV f Dapg+Dap g <• l ""i* ap»J
whereSapg
<• Da J
Definitions of all included into eq. 8,9,12 functionals are given inAppendix 1. Equation of type C9> in principle can be spreaded onepithermal group. But in this case it is necessary to introduce intoconsideration greater number of trial functions in thermal group.Such more complicate and universal approach has been developed by N.Laletin 13,41. This approach has also some essential featuresconnected with using more universal thanC4} continuity conditions. Anexpediency of using balance equation of type C93 for epithermal groupand corresponding complication of balance equation for thermal groupis discussed in the next section.
3. Results of numerical benchmarking for a case of slab geometry
A comparison of benchmark problems solutions obtained using precisecode and code realising algorithm C9} gives most detailed informationabout accuracy of this algorithm. In this case when functionals of
trial functions are also calculated by precise code the results ofcomparison are interpreted simply. Calculations of typical WERnonuniform lattices can be performed by codes based on Monte-Carlomethod. But it is very difficult to adopt such codes for calculationsof some functionals of asymptotic and transient modes. More simplesituation takes place in a case of slab geometry when one dimensionaltransport code provides a possibility of creating the most consistentscheme of verification. In this case it is possible to validatereliability of most important approximations of equation C9D. Resultsof such calculations are described below.
Precise solutions of benchmark problems and needed functionals ofasymptotic and transient modes for elementary cells of slab latticewere calculated by one dimensional 61-group C24 thermal group} codeAKSKIN IS]. Calculations based on equation C9Ï and standardfinite-difference approach were performed by specially written codeMODISH. Calculations by this code were carried out in one groupCcalculatlons of thermal neutrons distribution with given fromtransport calculations neutron source distribution} and four—groupapproximations. A combination of one and four-group calculations allowto analyse in detail unaccuracies of algorithm C9> under thermalneutron distribution calculations, to estimate a significance of cellheterogeneity and neutron spectrum deformation effects in epithermalgroup and consequently an expediency of spreading of describedapproach on epithermal group. Calculations have been carried out forconfigurations formed by slab cells of different compositions —homogeneous with U2 and PuzaP as a fissile isotopes andheterogeneous. Main characteristics of cells have been chosen close tocorresponding characteristics of real WER lattices. Calculations ofconfigurations formed by homogeneous cells is a strong test to check areliability of approach about universality of transient modefunctionals. It is explained by an absence of water buffer which makesspectrum of neutrons crossing cell border in heterogeneous cells moreuniversal. Some typical configurations have been considered — "watergap between fuel assemblies", "boundary between core and reflector","supercell with absorber" and so on. Results of calculations aregiven in fig. 1-4 and tables 1-2.
Results of one group calculations with fixed neutron sourcedistribution for configurations formed by homogeneous andheterogeneous cells are given in fig i —2 and 3—4 accordingly. It isseen from this figures that algorithm C95 provides a significantreduction of reaction rates calculations unaccuracy. Maximaldifference in fission rate for example don't exceed 1.5—1.754.Results of foui—group calculations are given in tables 1-2. In table 1unaccuracies of ICofr and fission rate calculations for configurationswith homogeneous cells are presented. In table 2 results forconfiguration "supercell with strong absorber" formed byheterogeneous cells are given. Data of this tables allow to make aconclusion that applying of algorithm C95 only for thermal groupprovides in most cases good accuracy of K»ff and reaction ratescalculations. Performed investigations allow to come to thefollowing conclusions:
— unaccuracy of standard four—group finite—differences diffusionapproach is a result of successful compensation of separatecomponents;
- applying of algorithm C9} only to thermal neutron distributioncalculations provides significant increasing of accuracy;

s '26.0
<
6.0
4.0
2.0
0
-2.0
4.0
?
_ — .
I
4-2 3
' — .. —
4 5
_
i N11
_ _
5
X
*»»
•^
Coll numb*
7
-4.0
Fig-1 Comparison of absorption (a) and fission <b> reactionrates distributions for configuration "water gapb»twe«n assemblies" formed by slab homogeneous cells-—— — standard finite—difference balance eq-;—— - algorithm <<?>;AR/R = <Rtr-R>/Rtr-lOO
for configurations with strong boron absorbers it is necessaryto take into account cell heterogeneity effect in epithermalgroup;
functionals of transient mode are enough universal Cthis meansthat they only slightly depends on cell position in a core};
results of calculations are stable under varying of asymptoticand transient modes functionals in limits of their possibleunaccuracies.
3.0
4.0
-4.0
-8.0
I Z 3 4 5 'e~ 7 8 9
— -
10 II 12 13 U Ib16 IV 18
4.0
-4.0
10 II 12 13 14 15 16 17 T8
umtn»
Fig.2 Comparison of absorption <a> and fission <b> reactionr«t*s distributions for configuration "boundary wi th areflector" formed by slab homogeneous ce l l s .Conventional signs the same as on F i g - 1 -
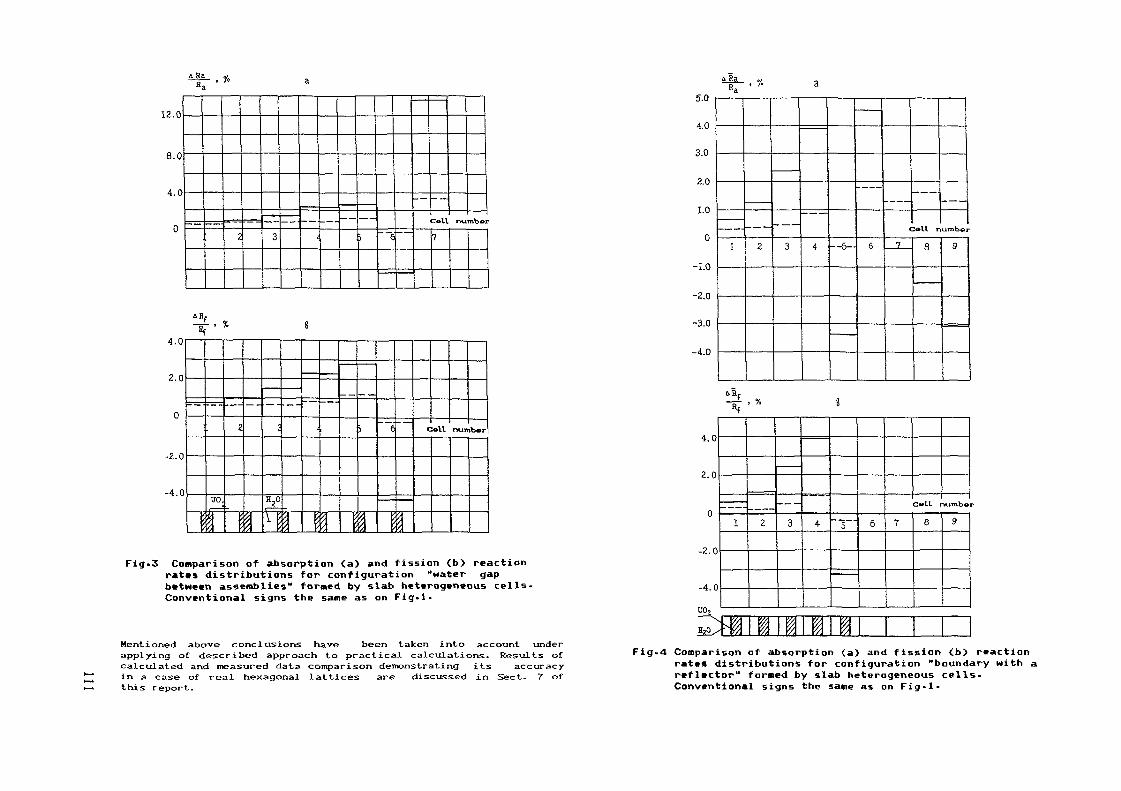
a RaH,
12.0
4.0
4. U
Z . O
n
-z.o
-4 n
r- — • .__
uo.\
— ,-
z
\Hzu
1 \
• — -
', ', '',
— — — —
j
i
é
\
C .XI nun»b«r
Fig.3 Comparison of absorption <a> and fission <b) reactionrates distributions for configuration "Hater gapbetween assemblies" formed by slab heterogeneous cells-Conventional signs the same as on Fig.l-
been taken into account under' ' "' calculations. Results of
.ng its accuracy:ussed in Sect. 7 of
4.0
3.0
2.0
1.0
0
-1.0
-2.0
_o n
-4.0
—— .
I
———
2
- — —
3
— — —
4 — 0-
_ _ _ _
6
c
7
»11 r,umbor
9
«f '4.0
Z.O
0
-2.0
-4.0
U02— xM/
-——-l
u*
———2 3 4
I 1 1
~!~~ 6 T
\
Call r
8
tumtx»i
9
Fig.4 Comparison of absorption <a) and fission <b> reactionrate« distributions for configuration "boundary with areflector" formed by slab heterogeneous cells-Conventional signs the sane as on Fig-1-
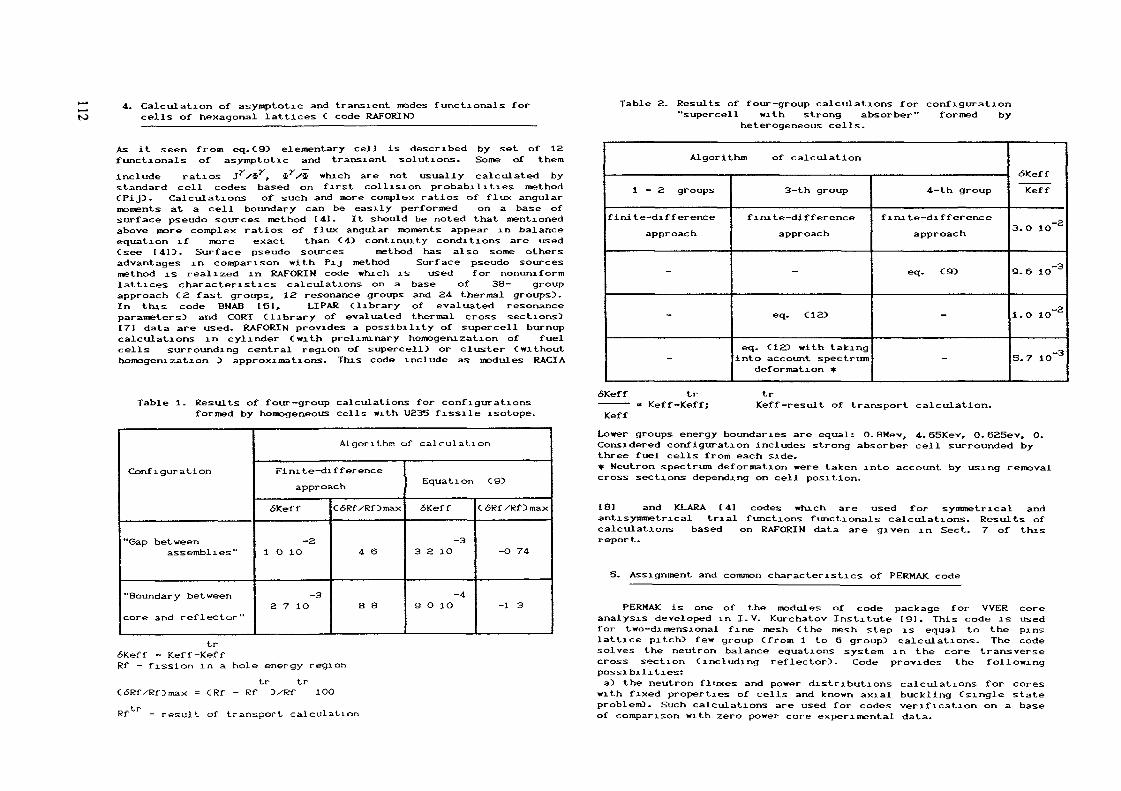
^ 4. Calculation of asymptotic and transient modes functionals forto cells of hexagonal lattices C code RAFORIN}
As it seen from eq. C9} elementary cell is described by set of 12functionals of asymptotic and transient solutions. Some of them
include ratios J?V$J', $*/$ which are not usually calculated bystandard cell codes based on first collision probabilities methodCPij}. Calculations of such and more complex ratios of flux angularmoments at a cell boundary can be easily performed on a base ofsurface pseudo sources method [41. It should be noted that mentionedabove more complex ratios of flux angular moments appear in balanceequation if more exact than C4} continuity conditions are usedC see 141). Surface pseudo sources method has also some othersadvantages in comparison with PlJ method Surface pseudo sourcesmethod is realized in RAFORIN code which is used for nonuniformlattices characteristics calculations on a base of 38- groupapproach C2 fast groups, 12 resonance groups and 24 thermal groups}.In this code BNAB [61, LIPAR Clibrary of evaluated resonanceparameters} and CORT Clibrary of evaluated thermal cross sections}171 data are used. RAFORIN provides a possibility of supercell burnupcalculations in cylinder Cwith preliminary homogenization of fuelcells surrounding central region of supercell} or cluster Cwithouthomogenization } approximations. This code include as modules RACIA
Table 1- Results of four—group calculations for configurationsformed by homogeneous cells with U235 fissile isotope.
Table 2. Results of four—group calculations for configuration"supercell with strong absorber" formed by
heterogeneous cells.
Configuration
"Gap betweenassembl i es "
"Boundary between
core and reflector"
Algorithm of calculat ion
Fi ni te-dl f f er ence
approach
6Keff
-21 O 10
-3Z 7 iO
C6Rf/Rf}max
4 6
8 8
Equation C9}
6Keff
-33 Z iO
-49 O 1O
C6Rf/Rf}max
-O 74
-1 3
6Keff = Keff-KeffRf - fission in a hole energy region
tr trC6Rf/Rf}max = CRf - Rf }XRf 10O
Rf r - result of transport calculation
Algorithm of calculation
1-2 groups
finite-difference
approach
-
-
-
3— th group
finite-difference
approach
-
eq. C12}
eq. C12} with takinginto account spectrum
deformation *
4-th group
finite-difference
approach
eq. C9}
-
-
6Keff
Keff
3.0 10~2
9.6 10"3
1.0 10~2
3.7 10~3
ÄKeff t r———— « Keff-Keff;
Keff
trKeff-result of transport calculation.
Lower groups energy boundaries are equal: O. SMev, 4. 65Kev, O. 62Sev, O.Considered configuration includes strong absorber cell surrounded bythree fuel cells from each side.* Neutron spectrum deformation were taken into account by using removalcross sections depending on cell position.
£81 and KLARA [ 4J codes which are used for symmetrical andantisymmetrical trial functions functionals calculations. Results ofcalculations based on RAFORIN data are given in Sect. 7 of thisreport.
5. Assignment and common characteristics of PERMAK code
PERMAK is one of the modules of code package for WER coreanalysis developed in I.V. Kurchatov Institute [9], This code is usedfor two-dimensional fine mesh Cthe mesh step is equal to the pinslattice pitch} few group Cf rom 1 to 6 group} calculations. The codesolves the neutron balance equations system in the core transversecross section Cincluding reflector}. Code provides the followingpossibilities:a} the neutron fluxes and power distributions calculations for cores
with fixed properties of cells and known axial buckling Csingle stateproblem}. Such calculations are used for codes verification on a baseof comparison with zero power core experimental data.

tO calculations of pin by pin power distribution variation underburnup with taking into account feedbacks and reloading patterns.Needed for such type calculations values of axial buck lings, fullpower of layer, water temperature and boron acxd concentration aretaken from preliminary coarse—mesh three-dxmensxonal BIPR—7 sxmulatorcode 11O1 calculations as a f une t x on of operation time- The 1 xbrary ofneutron macro cross sections and their dependencies on cell state isused by PERMAK in this case.
In PERMAK both finite difference method and nodal approachare realxzed.
The balance equations system is solved by iterational procedurewhich is divxded on accelerated cycles of xnner and outer xteratxons.Full reflectxon condition is used on core symmetry axis. On outer coresurface full reflection, xero flux or other type boundary conditionscan be used* Usually in practice four groups calculations are carrx edout.
In case Cb3 PERMAK uses spectral parameter to describe neutronspectrum influence on xsotopic composition changxng under burnup andcorrespondxng changing of fuel cells neutron-physical properties.Spectral parameter is defined as averaged on burnup ratio of localneutron spectrum and asymptotic cell spectrum wi th taking into accountof discount coefficient. Local values of cell macro cross sections aredetermined by tabulated values interpolation on burnup and spectralparameter. To take into account difference between actual and nominalvalues of cell state parameters C coolant density and temperature,boron acid concentration, local power, xenon and samarx urnconcentrations, etc.} corresponding sets of derivatives are used.PERMAK code is applied for:— design and operational core analysis,— interpretation of in—core monitoring system data,— analysis of critical assembles experiments,— coarse mesh codes verification,— homogenizatxon of assembles neutron cross sections,— preparation of boundary conditions for coarse mesh codes
calculations.
where
*.p a pcO =pTand using connection between boundary averaged flux and current andeel 1 averaged f 1 ux
p 2 D p p pp
one can obtain thermal neutron balance equationD D* v _Lii r— \ —————— IJ,
3h2 L D + D l P, + z a = s .*• *• J ap p p C135
where ,pT spCO
CS is thermal neutron source,pp P
Z is infinite lattice thermal absorption cross section}.apcoIn epithermal neutron energy region in addition to finite
difference method the cell block effect is taken into account,namely
and neutron balance equation has the same shape as C13} *
7. Comparison of measured and calculated data obtainedusing finite difference and nodal type approaches
6. Features of nodal type balance equation in PERMAK
Nodal type equation realized in PERMAK has some features incomparison with approach described in Sect. 3. Main difference betweenalgorithm described in Sect. 2 and algorithm realized in PERMAK isthat instead of asymptotic mode a trial function corresponding toneutron distribution in infinite lattice is introduced. In this caseall neutron currents which give contribution to eel1 neutron balancehave be considered as transient mode currents.
Taken into account conclusions of paper Ï 23 about sixght inf1uenceof difference between asymptotic and transient dlffusion coefficientson calcul atxonal result, their equalxty xn PERMAK algorithm issupposed.
Including definition c -P
Final stage of described in Sect. 3 nodal type approach verificationis a comparison of calculated and measured data obtained at criticalassembles. Some results of such comparison are given in Fig 2. 1-2. 6.Measured data has been obtained at ZR-6 till zero power criticalassemble assigned for WER lattices physical studying. Few hundreduniform and nonuniform lattices containing fuel rods of differentenrichment, absorbers of different types and water gaps have beeninvestigated at this assemble. Some typical lattices have been chosefor calculations. These lattices contain 3. OX enrichment fuel rods,absorbers from B C and water gaps of different confj.gurat.ions.
Calculated data based on 4—group fini te difference approach and onalgorx thm described above are compared xn Fig. 2.1-2.6 wx th measureddata. Al 1 needed for calculations 4.—group macro cross sections andaddxtxonal functionals have been obtained by described above RAFORINcode.
It xs seen from these figures that under usi ng of fini te differeneeapproach maximal difference in pin power Cmore than 1O3O is observedfor pins situated near reflector and absorbers. Using of nodalalgorithm provides high stability of Kwff and significant i ncreasi ng ofaccuracy of pin power distribution calculation. Average unaccuracy ofpin power calculation don"t exceed of measurement error Cl-£5O. Kfor all cores varies in inter val O. 998-1.OOO
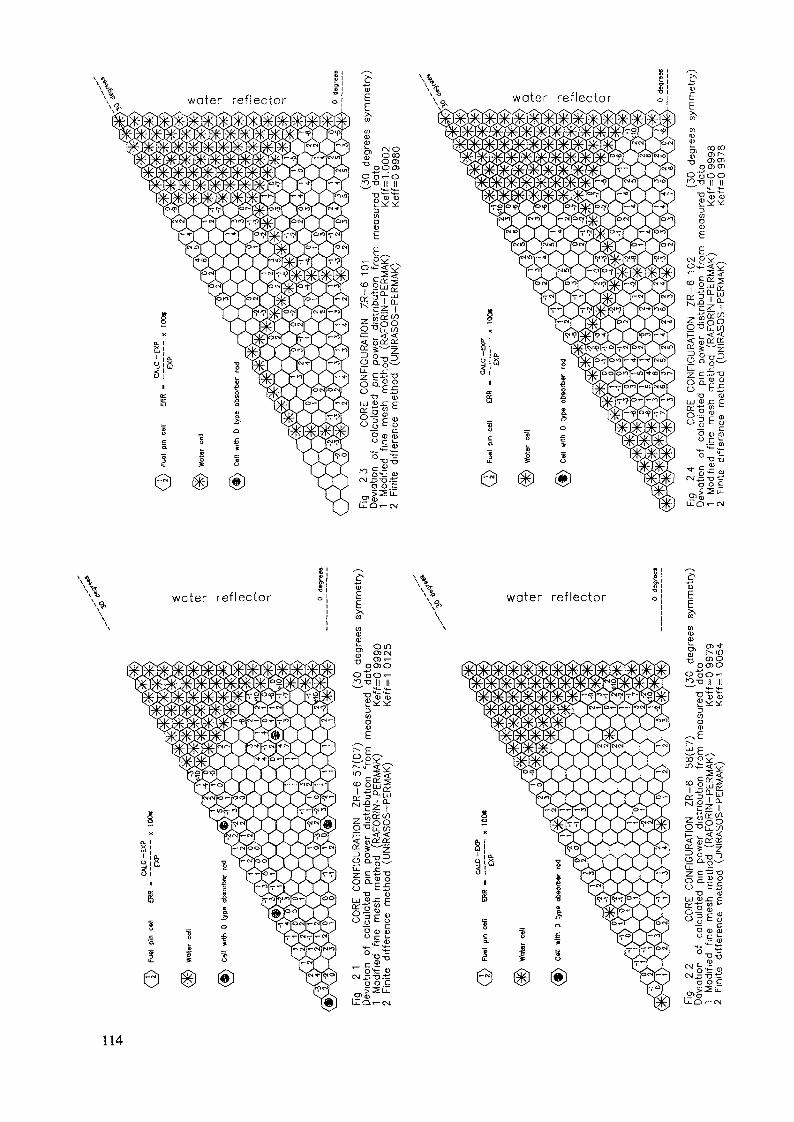
e
\ *i\ %> water reflector water reflector
Xî
e
EE^CT)a>a>^ <^^« S§oa>oo^So^-^•o ii n
-r,^*^m ® <U2^^H<no0)
^-\EPÜLE^w p^^^ir>i:<-2-
?§S|
*!î?5Ï1SP ^ «<fe^.s^ s^zi^-§3o
Sge :o c ^--
°^1"Si««N.p-O'tia o c<?f^
Ij-Q^-CM
114

/-7\ CALC -EXP( 3) Fu«l pin cell ERR - —————— x 100»
Fig 25 CORE CONFIGURATION 2R-6 103 C30 degrees symmetry)Deviation of calculated pin power distribution from measured data1 Modified fine mesh method (RAFORIN-PERMAK) Keff=0 99832 Finite difference method (UNIRASOS-PEPMAK) Keff=0 9988
8. Nodal type approach for coarse—mesh calculations
In a three-dimensional two-group coarse-mesh nodal code BIPR-8 groupneutron flux distribution in a node transverse section is written as
Agp f Cr-,B :>gpa 2
>Bgp f Cr, B D/. " gpam 2
-t- WgpCr}
C11 is assumed that node has 30 azi muthal symmetry}. Two first itemsin this expression describe symmetrical and anti symmetricalcomponents, third — contributions of transient solutions from six nodeborders. Such representation provides high accuracy of neutron balancein the node and allows openly to take into account its heterogenei t yunder keeping of differential operator description in a form close tostandard finite-difference form. Needed for calculations values oftrial functions f ,. f cosC mp-+6prtO and Ygp functional s are
gps gpamprepared by a special module based on 4,-group approxi ma t ion anddescribed above fine—mesh, nodal approach.
An accuracy of BIPR—S code has been checked on a base of wide setof benchmark problems solutions Cprecise solution have been obtainedby fine-mesh calculations}. Results of such verification show thatusing of three azimuthal harmonics Cin this case continuity solutionscondi t ions is provided in average on each node border!) provides about2 X ace uracy of VVER-44O fuel assembli es power dis tributioncalculations. To provide such accuracy for more large WER—1OOO fuelassemblies it is necessary to increase number of azimuthal harmonicsup to 5. In this case continuity conditions are provided xn averageon each half of node border. Application of described above coarsemesh nodal approach provides also a possi bi 11 ty of rod by rod powerdistribution reconstruction.
<-r\ CALC-EXP0) Fuel pin cdl ERR - —————— x 100«
^/ EXP
0f-t-01
0)o
Fig 2 6 CORE CONFIGURATION ZR-6 90 v. . .Deviotion of calculated pin power distribution from measured data1 Modified fine mssh method (RAFORIN-PERMAK) Keff=0 99772 Finite difference method (UNIRASOS-PEPMAK) Keff=1 0073
angle 0 ciegrees
(30 degrees s/mmetr,)
9. Conclusions
Performed investigations allow to come to the followingconclusions:
- high symmetry of VVERs hexagonal cells and assembles and closenessof their form to cylindrical form provide good premises for the nodaltype approaches realization in fine mesh and coarse mesh codes;- suggested algorithms ensure sufficient for practical purposes
accuracy of calculations.
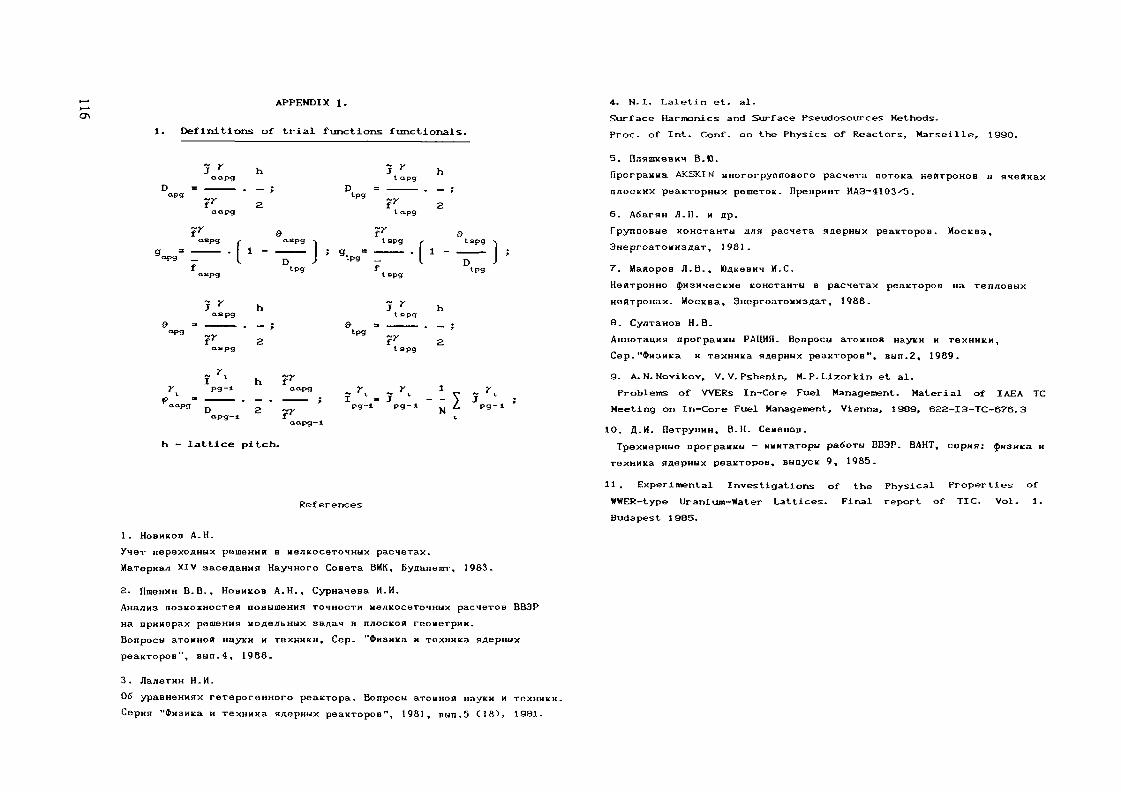
APPENDIX 1.
1. Definitions of trial functions functionals.
J Y haapg
tf 2aapg
F &aapg , aapg -.
T , 1 1 I •
F l D J'f tpgaapg
J r haapg
* ~X " 'fr 2aapg
YI v h f'
Pg D 2 ~rapg-l f
J *" htapg
r\ — »IPS
F atapg
F etapg , Is
^1P9 — I r.
f '
J r hl apg
F 2tapg
~ ^ ~ yv J 0pg-t pg-I N Z
tpg-l
h - lattice pitch.
References
1. HOBHKOB A . H ./Her nepexoAHUx pemeHMR B iieflKoceroHHUX pacnerax.
MarepHaji XIV saceAaHHsi HayiHoro Cosera BMK, Eynanemr, 1983.
2. HBIBHHH B.B., HOBHKOB A .H . , CypnaMesa H.H.Alia/IH3 BO3HOXHOCT6H nOBb)meHH5T TOHHOCTH MeTIKOCeTO^HbJX paCMCTOB BB3P
na npHHapax pemeHHsi uoAeflbHbix saaai B n^ocico« reouerpHK.Bonpocu arouHoa HayxH n rexHMKH, Cep. "fl>H3Hica H rexHMKa a«epnuxpeaKTOpos", Bbin.4, 1988.
3. Jla^eTMH H.H.06 ypasHeHHHX rereporeHHoro peaaropa. Bonpocu arounoft HayK« H rexHHCepxa "3>M3Miia n rexHMKa HflepHux peaKTopos", 1981, B U H . 5 C185, 1981.
4. N.I. Laletin et. al.
Surface Harironics and Surface Pseudosources Methods.
Proc. of Int. Conf. on the Physics of Reactors, Marseille, 1990.
5. n^flmxeBHH B.K).
iiporpaima AKSKI N MHororpynnoBoro pacnera noroica HenrpoHOB B a<ie«KaxnnocKHX peaKTOpHHX peraeTOK. DpenpHHT HA3-4103^5.
6. AßarsiH JI.I1. M ÄP-fpynnoBue KOHcraHTU anx pacnera naepnux peaKTOpoe . MocKBa,
, 1981.
7. MaaopoB ^.B., »ÄKeBHM K.C.HeRrpoHHo $H3HsecKMe KOHcraHTU a pacserax peaKTOpos Ha ren/ioauxHeHrpoHax. MocKBa, 3HeproaToa«3Aa.T, 1988.
8. CyjiraHOB H.B.
AnHOTaUMSi nporpauubi PAUHfl. Bonpocu arouHon HayKH M T C X H M K M ,
Cep."*M3MKa M rexHHKa aaepHux peaicropos", B tin. 2, 1989.
9. A. N. Novikov, V. V. Pshenin, M. P. Lizorkin et al.
Problems of VVERs In-Core Fuel Management. Material of IAEA TC
Meeting on In-Core Fuel Management, Vienna, 1989, 622-I3-TC-676. 3
1O. f l .M. fleTpyHMH, B.H. CeneHou.TpexuepHtie nporpauM« - HUMraropu padoru BB3P. BAHT, cep»s?: ^H3»Ea H
«AepHux peaKTOpoB, Bunycic 9, 1985.
11 . Experimental Investigations of the Physical Properties of
WWER-type Uranium-Water Lattices. Final report of TIC. Vol. 1.
Budapest 1985.

MICRODEPLETION AND EFFICIENCY INVESTIGATIONS OFBURNABLE ABSORBERS IN WWER FUEL ASSEMBLIES
R. BECKERKraftwerks- und Anlagenbau AG,Berlin, German Democratic Republic
Abstract
In the given material validation results of the local burnupand spectrum calculation code HESSEL-4 are summarized. A briefreview about basic of the applied calculation model and prima-ry data is included. For estimation of the code accuracy"Numerical Benchmarks", measurements of "Benchmark-Type" andexperimental data in WWER typically fuel-arrangements are used.Results of calculational-methodic&l investigations to study thebehaviour of cluster-absorber micro-depletion in WWER fuelassemblies (FA) are presented. The influence of cluster absor-ber treatment on the calculated efficiency and micro-power re-lease in FA-s is evaluated.Short remarks to the present quality of gadolinium lattice cal-culations under the "Coordinated Research Program" (GDR-5775),arranged by the IAEA Vienna, are attached.
1. IntroductionBurnable absorber-materials for a long time are applied forexample in boiling water reactors in form of clusters [1] andin pressure water reactors of WWER type they are used as anaddition to the fuel jacket [2]. In WWER case as effectiveabsorbing material for thermal neutrons bor in a Zirkoniummatrix in jackets is usually used.In WWER 1000 reactor core on the other hand in a large scalefuel assemblies (FA) with cluster-absorbers are charged.At present the clusters consist of B i> C, BZra and EUJ.OJ res-pectively. Recently in connection with large internationalexperiences [3,4] the application of gadolinium as burnableabsorbing material in WWER conditions is seriously discussed.In this case to mix fuel with gadolinium for selected fuelpins in FA-s is designed. To this subject from IAEA a "Coordi-nated Research Programm", on which GDR is taking part, wasinitiated.By reason of burnable absorbers charge in WWER-FAs a complexevaluation and validation of calculation codes is necessary.For this reason results of aero power measurements, carriedout at ZR-6 critical facility in WWER typically arrangements,are used to estimate the accuracy of calculation codes.Besides this, extensive calculational-methodical investiga-tions to evaluate the depletion behaviour of cluster absorberare carried out. For fuel-pin lattices, containing gadolinium,benchmarks for square [5,6] and hexagonal lattices [7] aresolved.
In the given paper iri chapter Ï the calculation model isshortly described. In chapter 3 results of spectrum and dif-fusion code calculations for numerical benchmarks, benchmarkexperiments and WWER lattice measurements are summarised.Calculation results of cluster micro-depletion investigationsin chapter 4 are presented. An advanced simple method to in-crease the accuracy in fine-mesh diffusion calculations inthe appendix is suggested.
2.Calculation model of NESSEL-4
For calculation of local characteristics (multiplication fac-tor, few-group constants, micro-depletion . . . ) in KAB the codeNESSEL-4 [8] is applied. Calculations on the basis of a moregroup model (24 epithermal, 10 thermal energy groups) for '& se-lected reactor part - in the following as supercell deno-ted- are carried out.In epithermal energy range for spectrum calculation B-l appro-ximation is used. In the resonance energy range (0.465 eV< E <4.65 KeV) the calculation of self--shielded Gross-section isbased on ABBN f-factors [9] and the equivalence-theorem withspecially selected Xj-parameters to get the evaluated Hell-strand resonance integrals of U-238.In thermal energy range the neutron transport equation in moregroup and more zone model on the basis of first collision pro-babilities (Pij) is solved, using methods applied in the well-known THERMOS S-II computer code [10] and suggested by Bonalumi[11] and Kavenoky [12] respectively.The necessary primary data of about 60 nuclides (fuel-nuc)ides,detector-, absorber-, construct.ion-tuat.erials, satturation pro-duets, moderator-data. . . ) in a 34 group-library are available.In epithermal energy range the data of ABBN-78 [9] are applied.The thermal part in a 10 group structure, basing on ENDF-BIVdatas, is described.The basic idea of homogen is at ion in NESSEL-4 consist in the fol-lowing: The calculation of reactor physical parameters of two-dimensional areas (supercell) is reduced by a repeated treat-ment of one-dimensional cylindrically calculations in the men-tioned many-group model. In detail the step by step hoiaogenisa-tion model in papers [8,30] is explained. At boundary of thesupercell white boundary condition is assumed. By the aim ofmore group spectrum of homogenized supercell the condensationto 4 macro-groups is realized.For local burnup calculation of fissionable nuclides twosimplified uranium-plutonium chains, containing (n, If )—proces-ses and the ß -decay, are introduced. The explicite treatment of6 satturation products (Cd-113, Xe-135, Sm-149, Sm-151, Eu-155,Qd-157) is provided. The remaining fission-products are treatedin first draft by the aim of pseudo-fission products. Forcluster absorber micro-depletion calculation additional burnup-chains (Gd, Eu, B..) are used.

oo3 Validation of NESSEL-43 1 undisturbed fuel-pin latticesFor undisturbed fuel-pin lattices the accuracy of NESSEL-4 wasevaluated on the one side by analysis of Numerical Benchmarksformulated in paper [13] and on the other side by aero-powermeasurements of "Benchmark -type [14,15] Besides this the resultsof measurements for WWEB typically configurations at ZR-6 faci-lity were used to check the accuracy of NESSEL-4 code and two-dimensional fine-mesh diffusion code for hexagonal geometriesFLEX [16] In the detail all the re&ults are published anddiscussed in the paper [17,18] Therefore in this material onlythe most important results in tables 1-4 are presented andhere summarised
For the ' Numerical Benchmark' lattices NESSEL-4 results arein the most cases in a satisfactory agreement with Monte-Carlo calculations (MC) and results of spectral codes EPRI-CELL [19] and CASMO-3 [20] It 1-3 nec^s-sary to accentuate,that MC calculations were carried out using ENDF-BV datasIn table 2 results of RAHAB-OZMA [21], WIMS-D4 [22] andNESSEL-4 for PNL [14] uranium-plutonium mixed fuel latti-ces are presented The deviations given in this table referto RAHAB-OZMA calculation results using ENDF-BV data
Results show, that Kinf and spectral parameters, obtainedby NESSEL-4, are in satisfactory agreement with the RAHAB-OZMA resultsIn tables 3-4 NESSEL-4 results are compared with experi-mental values from critical facilities TRX and BAPL Forthe given experimental buckling NESSEL-4 calculates Keffwith an accuracy, comparable with results of internationalwellknown spectral codes In compan&on with experiments,- with exception of the tight TRX-lattice a deviation incalculated NESSEL-4 keff-values lower 0 2% is observed Forthese lattices Keff-values differ until 0 2% in dependenceon the used calculation method of Pij in NESSEL-4 (table 5}
Table 2 Results of PNL-lattices(Deviations in %)
Lattice Parameter RAHAB-OZMA HIMS-D4 NESSEL-4
Table 1 Numerical Benchmark results(Deviations are ffxven in %)
Lattice Parameter
C A L C U L A T I O NM E T H O D
EPBI-CELL CASMO-3 NESSEL-4
PNL 31
PNL 33
PNL-35
Kinf£££»SH,à «8«
KinfplSI«OnjÔISs«
Kinf£ie
S'aSss»
1 2530 2110 1560 3225 20
1 1790 2200 0850 1552 60
1 1550 2280 0620 1061 80
0 02 4
-11 4-3 5-1 7
0 22 3
-11 8-3 3-3 6
0 12 2
10 1-2 9-4 0
0 5-1 45 81 9
-1 0
-0 1-0 4-3 5
2 60 7
O 3-0 43 22 81 1
NB-l
HB-2
NB-4
NB-5
KinfOi*£StsSuCR
KinfSisSvSSuCR
KinfCM
OIS
SaCR.
Kinffrlf
DiS
s«CR
11000
12002
12000
1000i
14736308030722798
175612151297148
34265415906Z549
146503548133006
-0-01
-2-0
-00000
-0-0-i-0-0
-000
-00
22443
40700
18382
34480
-0-121
-1
-00
-03
-1
25296
____-
28103
____-
-O2100
-0i0
-3-1
-03
-021
O1
-4-I-3
5110B
59044
79638
09751
Table 3 Results of HAPD-lattices
Lattice
BAPL-1
BAPL-2
BAPL- 3
Para-meter
Keff3.«SisSuMCH
Keff
?MX«£»
MCE
Keff
f it«s«
MCR
Exper Deviationdatas RSYST-CGM
100
100
000
1 00039010 01008410 00207810 004
-
1 00012OÏO Oil068*0 001070*0 004
-1 000
906tO 020052^0 001057iO 003
-
02000
0-_--
0__--
1116813
0
1
fronRAHAB-OZMA
011
-20
O41
-70
002
-60
1704810
16e0737
2413657
experl»CASMO-3
0-000
21
-40
013
1715
-_906707
_058
-
lentNESSEL-4
-01
-2-20
-04
-1-60
01
-1-40
1241806
1651735
0518658

Table 4: TRX-lattices
Lattice
THX-1Vm/V£=
2.35
TEX-2Vm/Vf=
4.02
Para- Kxper.meter datas
K«W 1.0005J» 1.320 0.021Sis 0.099 0.001Sa 0.095 O.004
MC* 0.797 0.001
*,<tt 1.000«is 0.337 0.016IK 0.061 0.001&λ 0.069 O.O04MCR 0.647 0.005
RSYST-CGM
-0.42.80.55.80.2
-0.30.0
-1.03.0
-1.2
RAH AB -OZMA
-0.5-0.22.24.40.4
-0.31.20.71.0
-0 8
NESSEL-4
-0.52.9
-1.64.3
-0.4
-0.31.9
-2.8-2.6-0.7
CASMO-3
_0.41.34.5
-1.8
_-0.40.02.0
-2.0
HIHS-D4
0.4-3.94.3
-2.7-3.5
0.6-5.73.23.6
-3.2
Table 5 : NESSEL-4 Keff-values in dependence onPij calculation method
Lattice BINA BONA ALCO
BAPL-1BAPL-2BAPL-3TRX-1TRX-2
0.99880.99931.00200.99420.9973
0. 99760. 89750. 99780.99120.9920
0. 99960. 99981.00O80.99470.9979
1.004-
1.00Z
1.0
0338
a 336
09S4
a 332
0390
Srff
FLEX
lattice pitch: 12.7 1221Enrichment : 3.6^ U-235Boron, acid concentration » 0.0
FIG. 1. Ke« (R) of ZR-6 lattice (12.7-3.6-0.0).
3.1.1 Accuracy of few-group constantsThe calculated NESSEL-4 few-group parameters are analyzed on thebasis of diffusion calculations for serial measurements. For thispurpose ZR-6 lattices with 3.6% Ü-235 enrichment, 12.7 mm lat-tice pitch and two boron acid concentrations <C^ = 0 , Cg = 4.0g H3 BOj /l HtO) are investigated. The critical water levelin dependence on core radius H (variation of fuel-pin numbers inthe assemblies) was estimated. Axial leakages of this configura-tions are taken into account by buckling values. According [23]the axial extrapolation length Xj depends only on lattice step.The calculations are carried out by one-dimensional diffusioncode DIPOL-1 [24] in cylindrically geometry and by FLEX respec-tively. The results in figures 1-2 are illustrated. For extremlysmall values of the core-radius ( E <• 19 cm) diffusion calcula-tions underpredict Keff of about 0.5%. The deviations in the cal-culated Keff values in comparison with critical state don'texceed 0.2% for core radius larger 19 cm. Differences for Keffof 0.2% between one and two-dimensional diffusion calcuiationsare observed. At boundary between core and reflector the calcula-ted power release systematically underpredict measured valuesuntil 5-10% in dependence on fuel-pin position. A simple methodfor a particular reduction of this uncertainties in paper [25] issuggested. A summary of this method in the appendix is presented.
1.004
•TO02
•f.o
0.998
0.936
1 y^\ 'S_ ~""~~~V v // ~^ ' \ // — - J v
;FLEX/
——- -C^27 \ 28 29 30 R [cm]
0.392
FIG. 2. Ke„ (R) of ZR-6 lattice (12.7-3.6-4.0).

Jt 32 Perturbed fuel-pin lattices
For accuracy validation of the used calculation methods for lat-tice arrangements with WWER-1000 typically disturbances at cri-tical facility ZR-6 large experimental investigations arecarried out The perturbations are caused by absorber rods ofseveral material compositions [23] and water gaps (removingof absorber rods) respectively Lattices of type X-n ( X meanstype of perturbance, n distance of perturbance in units of lat-tice pitch) and arrangements with imitated fuel assemblystructures (WWEH-440, WWER-1000 ) were investigated Criticalwater levels, power release distributions and spectral characte-ristics (disadvantage factors, spectral indices, epithermal pa-rameters) are measured A complete summary of experimental re-sults is given in I and III volume of TIC [23,26]Keff values of 23 regulary disturbed fuel-pin lattices on thebasis of NESSEL-4/FLEX calculations together with results pub-lished in [27] are summarised in table 6 The averaged valueof NESSEL 4/FLEX calculations (Keff= 1 0003+00025) demonstratethe satisfactory quality of the calculated few-group constantsof NESSEL-4 using the macro-cell modelKeff-values for arrangements with imitated FA-structures in tab-le 7 are summarized For lattices, containing B C absorberrods, a systematically underprediction of Keff from state ofcriticality is observed
Table 6 Keff-values of ZR-6 macroeell-configurations (mac)
Configu-ration64/6465/6466/6470/7071/7073/7376/7659/5960/5961/5962/5963/5967/5768/5754/5455/54156/155310/5757/5758/57141/138146/138147/138
X-n
E-5A-5C-5A-5C-5C-5C-5E-6A-6C-6B -6D-6A-7C-7D-7E-7G-7N-7D-7
E-7/0 0F-7/0 0F-7/1 8E-7'l 8
hcnt[CM]27 8344 344 6949 3852 3455 9468 3827 0235 6336 5637 3258 4039 4840 5047 6328 2153 1139 6957 731 446 5175 8740 19
Numberof mac7373736767615255555555553131373731313131313131
NESSEL-4FLEXt 00371 00020 99981 00030 9996Î 00061 00631 00371 00051 00040 99980 99541 00061 00050 99761 00250 99800 99940 99651 00370 99240 99341 0031
127]1 OO710 99960 99721 00471 00190 99780 99521 00500 99860 99680 99820 99171 00311 00230 99571 00420 9940-0 99551 0076
--
1 0056
Table 7
Configu-ration87/8788/8789/8790/87144/144145/145100/100101/100102/1021O3/103
NESSEL-4/FLEX Keff -values of FA-5
Lattice-description Keff
K331/A1K331/A1K331/A1K331/Hi 0KSSl/H^OK331/H OK91 /H ! OK91 -H 1 0K91 /HtOK91 /!1,.0
37 D-337 E-337 D-313 F-313 F-3Cb= 4 0Cb= 0 0without centr FA49 D-3/ 84 E-3
0 99691 00270 99730 99341 00021 00020 99470 99341 00320 9943
The calculated micro power release distributions in macro—cellsof type X-7 are in a satisfactory agreement with measuredvalues (table 8) The results demonstrate once more the application of the macro-cell model in the cell calculations, afterthis the neutron-flux distribution can be separated by & periodical function H*! (R) (micro-flux distribution in the macro-cellI) and the macro-flux J0 (B r) according ffl (r) = J« (Br r) *PxFor the lattices D-7, F-7 and E-7 in critical state bucklingvalues B by NESSEL-4 are calculated (tab 9) The realized methodsin NESSEL-4 to calculate Pij are applied for this latticesThe corresponding NESSEL-4 calculation is carried out for acylindrical macrocell of type X-7 with white boundary conditionat cell-surface In the calculations the cluster absorberregion is subdivided in several mathematically aones. By appli-cation of Pij used in THERMOS S-II c,ode (SUBROUTINE BIWA, inthe following as BIWA denoted) for Bm a strong dependence onthe Bone number is observed In this method is suggested, thatneutrons at centre of considered zones are starting Thisassumption is fulfilled much better much smaler the sons is,selected By reason of strong flux gradients in the absorber an improvement in the spatial discretization leads to anincreasing of the calculated thermal neutron-flux and thereforethe absorption rate increaseInvestigations have shown, that calculated absorber efficiencyby application of Pij on BIWA strong depends on the subdivisionof cluster region into mathematically zones Corresponding mini-mal zone-number for WWER clusters in FA-s are estimated as 8-11
4 Cluster micro-depletion in WWER-1000 FA-sIn the following calculation results of micro-depletion proper-ties of burnable cluster-absorbers in WWER-1000 prototype FA-sare discussed The calculations in each case are carried outfor two states In the first case the micro-depletion of clusterabsorbers is taken into account in NESSEL-4 calculations, but insecond case the micro-depletion is neglected In both case«., thenumber of mathematically zones inside of absorbers is varied

Table 8 Micro distribution in macro-cells of type X-7
Nunberof cell
2
3
4
5
6
7
8
Distancefrom centre
1
2
3
2
3
4
4
27
54
81
20
36
58
40
10010010010000111111
Experi-ment
1149900987950323
t*it
9773 t970400629962989503399667960599519968015000510081OOOOOOOOoooo
+t+itt1•vitt*+*-
00000000000000000000
00450045O046005O0057007200420068008100520055006700880138004500700072005100670069
NESSEL-4
100100100100100011111
104089248665020896349636002599709958031596109440006499209839999800030006OOOOOOOO0000
Lat-ticeE-7F-7D-7E-7F-7D-7E-7F-7D-7E-7F-7D-7E-7F-7B-7E-7F-7D-7E-7F-7D-7
Table 10 S Kinf-values of FA with
C = 3 0 g/1BU [MHd/KfiU] NZ=1 SZ=3 NZ=8 NZ=17
C = 0 0NZ=3 HZ=17
0612182430
1 00000 99980 89991 00031 00061 0007
1 00001 00211 00561 01161 02151 0360
1 00001 00571 01281 02231 03741 0543
1 00001 00621 01371 02351 03861 0554
1 00001 00191 00521 01121 02121 0357
1 OOOO1 00621 01371 02371 03801 0547
Table 11 &Kinf of FA-s with B^C (C =30 gHjBVtHj.0 >
BU[MWd/KgU] NZ=3
FA-Type 8NZ=8 NZ=17
FA-Type 2NZ=3 NZ=1
FA-Type 10NZ=3 NZ=17
0612182430
1 00001 00051 00131 00251 00351 0043
1 00001 00301 00631 01011 01371 0188
111111
000000340072011201510199
111111
000000010002000200100022
111111
000000460095014802060270
1 OOOO1 00061 00121 00181 00251 0032
1 OOOO1 00311 00661 01021 01421 0188
Table 9 Bucklinfi valuss of X-7 mai.rocel.ls (in units of [m"z] )
Lat- D-7 F-7 E-7tice
NZ BIHA BONA ALCO BIWA ALCO BIWA BONA ALCO
2 82 86 69 75 70 284 77 33 70 028 72 97 - 70 27
11 71 98 70 04 70 24
85 55 79 16 103 58 103 64103 57 103 65
104 31
79 59 79 17 103 57 103 65 104 31
Exper 70 93 i 0 2O 78 35 t O 20 101 26 t 0 28
BOHA Pio by method of Bonalumi C1HALCO Pij by method of Kavenoky [12]BIWA Pij by method of Stamm'1er [10]
First collision probabilities are calculated by subroutine BIWAThe interruption between cluster and fuel-pins in the FA is ta-ken into account during more group spectrum calculation Ifcluster micro-depletion is neglected in calculations , the burn-up of fuel-pins in the neighbourhood of cluster-absorbers isperformed in a to harden neutron spectra The total absorptionof FA-s - a detailled zone subdivision of cluster-absorberassumed - is therefore generally overpredictedFor several FA-s in tables 10-11 ratios of infinite multiplcal ionfactors S Kinf are summarized The definition of SK,„fis thefullowing
~C~A~
Here it meansm C A - calculation with cluster micro-depletiono C A - calculation without cluster micro-depletion
BU - burnup in units of [MWd/Kg Ü]
The results show, that ^Kmfdepends on spatial discretisationof the cluster region and on the 'blackness' of absorberFor a roughly subdivision of the cluster region (NZ < 3 forE u o O , , NZ< 5 for B u C , N Z < . 3 for BZr, the question ofcluster-absorber treatment has only a secondary importanceIn this case the calculated spatial-energetical spectra incluster-absorber is practically so wrong, that no differencebetween the possibilities of cluster-treatment is observedFor NZ=12 sones at burnup value BIJ=30 MWd/Kg 0 the followingdifferences in reactivity uncertainties of investigated WWERFA-s (table 10-11 ) are estimated
FA with Eu^Oj -rods 5 5%FA with BZrj -rods 3 9%FA with B i ^ C -rods 1 9-2 7%
These uncertainties are practically independent from boronacid concentration and from FA enrichment (table 10 arid re-sults of paper [28,29])As the above mentioned results show a neglection of clustermicro-depletion lead-3 to a generally reactivity deficit forFA-s with burnable absorbersThe influence of cluster absorber treatment on the calculatedmicro-power release distribution in FA-s in fig 3-4 isillustrated Power release calculation is carried out byFLEX code using few-group parameters for two burnup state
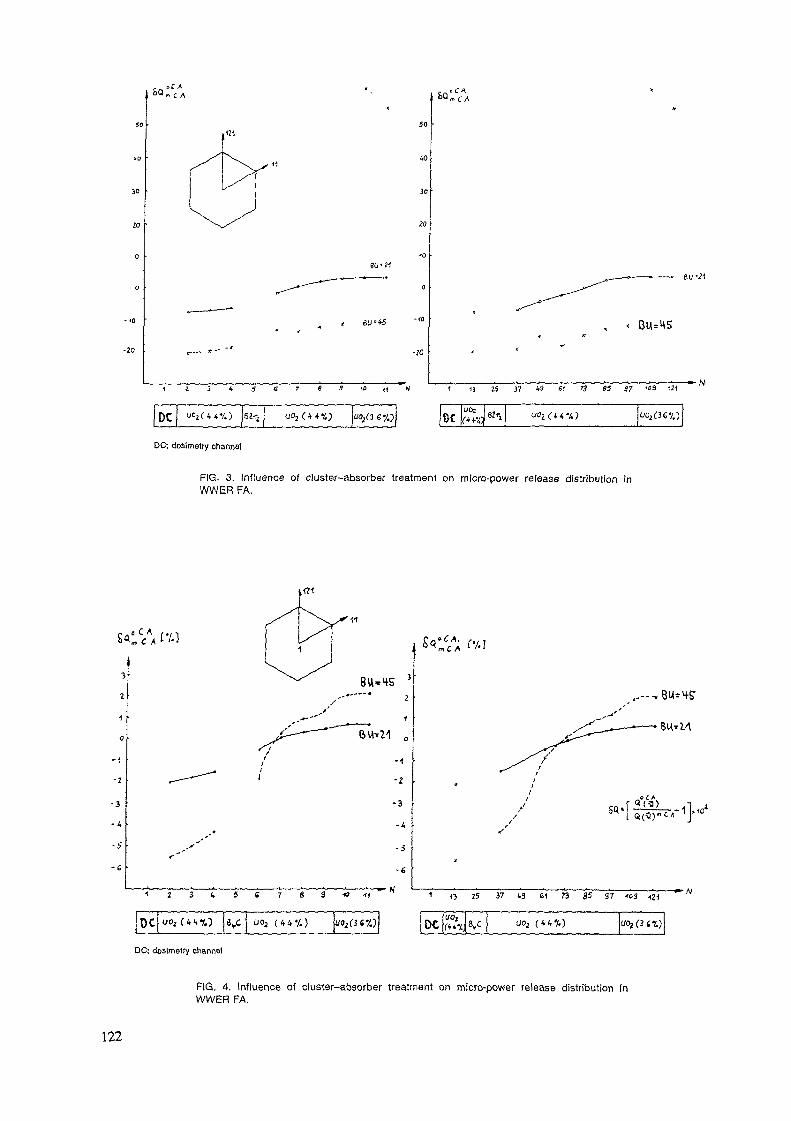
50
30
SU« 21
&Q!
3 4 5 e 7 S 3 tt> « N 1 13 25 37 *9 6f 7^ SJ 37
DC DCU02
DC: dosimetry channel
FIG. 3. Influence of cluster-absorber treatment on micro-power release distribution inWWER FA.
:,"*•/.]
i0
-1
-2
-3
-4
-5
-s
-3
-A
-6
2 3 4 5 S 7 8 3 25 37 « 61 73 85 97 «3 121
ti U«3 ( * * % ) DC
DC: doslmetry channel
FIG. 4. Influence of cluster-absorber treatment on micro-power release distribution inWWER FA.
122

(BU=21 MWd/Kg Ü and BU=45 MWd/kg 0 respectively). For each FAsix several sets of few-group parameters in FLEX calcula-tions are usedAccording to the NESSEL-4 geometry model for WWER FA-s groupconstants of the following materials are calculated centraldosirnetry channel, cluster rod cell, fuel-pins neighbouredwith cluster rods, fuel pins in neighbourhood of assemblyjacket rest of fuel-pins in the 'undisturbed ' lattice region,assembly jacket _^Calculated ratios OQ(r) as a function of pin position inFA two directions in figures 3-4 are giveno Q is defined as
o C A.
Q ( F)Q
calculated power release by FLEX
In the case of BZr^ cluster-absorber deviations in calcula-ted distributions achieve until 20% This circumstance isconnected with the relative quickly burnup of BZri rodsFor FA-s, containing B C cluster absorber, uncertaintiesuntil 6% in calculated micro-power release in dependenceon cluster treatment are expected4 1 Gadolinium lattice calculationsIn table 12 calculated Gd-efficiency values (Kinf), obtainedby NESSEL-4, CASMO-HEX [31] and HSYST-CGM [32] for the he-xagonal macro-cell of Sidorenko [7] and the square EIR lat-tice [5], are summarised
Table 12 A SUnf-values ('efficiency of Gd )
BU[MWd/Köü]
0123456
EIRNESSEL-4
[19] DIPOL-2000O000
3292276423541919142408920440
0000000
3281275224141945140508780421
Sidorenko-macrocel 1RSYST- NESSEL-4
CASMO-HEX CGM00000
11511052095307270473
0000
1197103609260705
0000
11981005092707240 0466
to
A Kinf = Kinf (UC fuel-pin; - Kinf (macro-cell)In comparison with the results of above mentioned codesNESSEL-4 not very large differs Usually, as the investiga-tions in material [30] have shown, NES3EL-4 overpredict thegadolinium absorption and therefore underestimate Keff in de-pendence on lattice type of about 0 5-1 0%
Appendix
Fine-mesh diffusion calculations with spectral-corrected few-group constants
As it was shown in chapter 3 1 1 at boundary of several mediadifferences of about 5-10'<, between measured and calculated po-wer-release distributions are observed if asymptotical fewgroup parameters in diffusion codes are used In the followinga simple method to reduce this uncertainties, on the basis ofspectral-corrected few-group constants in fine-mesh diffusioncode FLEX, is suggestedConsidering a cylindrical super-cell (fig A1 ) This cell con-sists in the inner part of fuel-pin cells of the same type(enrichment, lattice-pitch, temperature, } Around this re-gion a zone is positioned, which affects on the inner districtas a disturbance For the so defined super-cell a more-groupspectrum calculation by NESSEL-4 is carried out In dependenceon thickness and composition of the outer zone the fuel-pinspectrum in the inner part of the super cell is influenced Byobvious condensation procedure the few-group constants of thept-rt-ucbt-d region are calculated Changing outer disturbancesthe few group parameters Z! g in dependence on spectrum valueSI are calculated SI is the ratio of epitherrnal to thermalneutron-flux ( SI= 4**P' / $4^ ) ln "the fuel-pin regionThese dependencies like input datas for FLEX code are usedFLEX solves, at first for a given lattice arrangement,the fine-mesh diffusion equation in hexagonal geometry using asymptoti-cal few group constants During outer iteration for all lat-tice points fluxes are calculated These fluxes are used tocalculate a local dependend spectrum ratio 51(1?), defind as
SI(?) = 4eP> (~?By correlation on basis of interpolation between 2)a (SI) fromNESSEL-4 and SIC?) from FLE-C for each point 7 the correspon-ding spectral-corrected few group constants are calculatedUsing these parameters the further iteration process iscarried out Iteration is finished, if a given accuracy limitfor own-value Keff, fluxes and spectral-index value SI(T) isobtainedThe method is realised in FLEX-S code Details about the usedmethod in paper [25] is described For illustration of thecode accuracy at figure "j procentually deviations between caliijlrtfcrti and measured p<-wer-1 «lease distributions using it,>mp-totical and spectral-corrected few-group constants for an in-vestigated ZR-6 assembly (-^figurations 101/100 and 102/L02)are presented

£-J Configuration: 101/100*>.
Configuration: 102/102
FIG. A1. Deviations between measured and calculated micro-power release distribution(lower numbers: asymptotical few-group parameters in FLEX; upper numbers: spectral-corrected parameters).
REFERENCES[I] Kassier, Nuclear Fission Reactors, Springer Verlag Wien 1933[2] tf.H H «r.M.QT-3 A^H « ßp , aotoHwe 3Ueprn.rniei.wi 6 vjcTmcb*."*,Mce-Abo., 5H«.proQ.Tc^iAM^taT, -iSSfir.[3] B.M. Rohleder. Feasibility of using Gadolinium as a Burnable
Poison in PWR cores, EPRI-NP-1663,1981[4] L.Goldstein et.al., A Comparison of Gadolinium and Boron for
Burnable Poison Applications in Pressurised Water Reactors,Nucl. Techn. 60, p 352, 1983
[5] C. Maeder et.al , International Comparison Calculations fora BWR Lattice with Adjacent Gadolinium Pins, EIR-BenchtMr. 532, NEACRP-L-271
[6] J J.Arkussewski, Analysis of the Nine-Cell LWR GadoliniumBenchmark, PSI-Bern.ht Mr 13, 1988
[?] B.JL GagopeHKo, TecTosan aajia^a xnx nacneTa TOHJDISHHX pemeTOKc ÎSSUara; co;rçepsamnMi raflojmnaä, MocKsa, 1988 r.
[3j H Jteinnch, Kernenergie 24 (1981), S. 465[9] .A II AoariH n QO , lpMnfiobv,ie KCHCTQHT») qx\ paC'ie.Ta.
ßeaKtc^oti « 3ixw.ü!T»MM6dKtix , <iprccLTcjAU3VÂT i 4SS1 r.[10] R.J.J.Stamm'1er, K-7 THERMOS Neutron Thermalisation in aHeterogeneous CyIindrically Symmetric Reactor Cell. KjellerReport No KR-47 (1963)
[II] R.Bonalumi, Neutron First Collision Profaalities in ReactorPhysics, Energia nuoleare, 8 (1961), Nr.5, p.326
[12] A. Kavenoky, Calcul et utilisation des probabilities depremière collision pour des milieux heterogenes a une di-mension: Les programmes ALCOLL et CORTINA, CEA-N-1077,Centre d'Etudes Nucléaires de Saclay
[13] M.L.Williams et.al., Analysis of Thermal Reactor Benchmarkswith Design Codes Based on ENDF/B-V Data, Nuclear Technolo-gy, Vol. 71, Nov. 1985
[14] Thermal Reactor Benchmark Compilation CSWC Data Testing Sub-corn i tee
[15] Hardy et.al., Exponential and Critical Experiments, Vol.2,332-358, IAEA, Vienna (1964)
[16] G. Agthe et.al., Kernenergie 29 (1986), S. 413[17] R. Backer et.al., Kernenergie 32 (1989)8, S. 308[18] R. Backer et.al., Kernenergie 33 (1990)8, S.[19] Advanced Recycle Methodology Program System Documentation,
EPRI-CCM-3, Sp 118-1, Part I, Electric Power Research Insti-tute (1977 Sept.)
[20] A. Ahlin et.al., CASMO, A Fuel Assembly Burnup Program,3TUDSVIK AE-RF-76-4158 (1976)
[21] D.S. Craig, Testing ENDF/B-V Data for Thermal Reactors,AECL-7690, 1982
[22] J.S.Askew et.al , A General Description of the Lattice Code«IMS, J Br. Nucl. Energy Soc.,5, 564, 1966
[23] Experimental Investigations of the Physical Properties ofWWER-Type Uranium Water Lattices, Final Report of TemporaryInternational Collective (TIC), Volume1, Akaderaiai Kiado,Budapest 1985
[24] D.Hennig et.al.,Programmbericht DIPOL-1,KKWB-Nr. 11-72-0[25] R. Becker, Veroeffentlichung Kernenergie (in preparation)

[26] Expérimental Investigations of the Physical Properties ofWWER-Type Uranium Water Lattices, Final Report of TIC,Volume III (in preparation)
[27] V Jagannatha» et al , Validation of Hexagonal Lattice CodeSystem with WER-Type Uranium-Water Lattice Experiments,Bhabho. Atomic Research Centre, Bombay 400085, India, Report622-13-TC-676,1989
[28] R Becker, Behandlung von abbrennbaren Clusterabsorbern inBrennstoffkassetten vom Typ WWER-1000, Dissertation A ,TH Zittau, 1990
[29] R Becker, Kernenergie 30(1987),4, S 314[30] R Becker, GDR-Calcul^tluo Results of Gadolinium Fuel-Pin
Lattices, CRP-GDR-5775, IAEA Vienna[31] M Anuilla, Finish Results for a VMK Benchmark Problem Con-
cerning Use of Gadolinium in Fuel Rod Lattices, IAEA Vienna1990
[32] D Luts, Results for the Sidorenko Benchmark, University ofStuttgart!, 1990
REFLECTOR MODELING IN ADVANCED NODALANALYSIS OF PRESSURIZED WATER REACTORS
E Z. MULLERReactor Theory Division,Atomic Energy Corporation of South Africa Limited,Pretoria, South Africa
Abstract
Recent progress in the modeling of the reflector regions of pressurized waterreactors within the framework of advanced nodal diffusion analysis methods isreviewed Attention is focused on the modeling of the radial reflector of a PWRwhich is most problematic because of its irregular and heterogeneous structureNumerical results are presented to demonstrate the high accuracy of the methodswhich are now available for generating nodal reflector parameters and it is shownthat errors due to reflector modeling m multi-dimensional nodal reactor analysiscan be practically eliminated
INTRODUCTION
to
The application of advanced nodal diffusion methods to the in-core physicsn a
analysis of hght water reactors has become quite common m recent yearsThese modern nodal methods have at least one basic feature which distinguishesthem from the traditional nodal methods, namely that all energy groups and allspatial regions of the reactor (including the reflectors) are treated with the samedegree of sophistication Hence, the accuracy of advanced nodal diffusion models isdependent not only on the adequacy of the fuel assembly homogemzation methodsused to determine equivalent nodal parameters (ENPs) for fuel nodes, but alsodepends significantly on the methods used to determine ENPs for homogenized
2 6—9reflector nodes ' In this regard, the modeling of the radial reflector of apressurized water reactor (PWR) is singled out as the most challenging because ofthe heterogeneous structure of this region (This region typically consists of aclose-fitting steel baffle around the core followed by a thick water reflector withthe steel core barrel and several steel neutron pads interspersed at variousdistances from the core ) The axial reflectors represent less of a problem sincethey are normally assumed to consist of homogeneous mixtures of water andstructural materials
The purpose of this paper is to summarize the principal differences betweenthe methods which are currently available for determining ENPs for PWR radialreflector nodes and to evaluate the accuracy of these methods In particular,numerical results are presented to demonstrate that errors due to reflectormodeling in multi-dimensional nodal reactor analysis (i e due to few-groupreflector parameters) can now actually be reduced to practical insignificance

NODAL EQUIVALENCE THEORY BASED REFLECTOR MODELS
Several advanced methods for determining nodal reflector parameters (calledreflector models) have been reported i n recent years > > > > > ' Most o f thesemodels are based on applications of nodal equivalence theory (NET) ' ' 'involving one-dimensional (l-D) multigroup transport calculations (spectralgeometry calculations) which model one or more fuel assemblies, the baffle, andthe reflector (and if sufficiently close to the core, the core barrel and neutronpads) to provide the spectral and spatial information necessary to computereflector ENPs The various NET-type reflector models differ mainly in themanner in which flux discontinuity factors are computed and applied
In Koebke's6 l-D simplified equivalence theory (SET) reflector model, forexample, discontinuity factors which are identical (per energy group) on theopposite faces of a l-D homogenized reflector node are determined simultaneously(iteratively) with the group diffusion coefficients for the node These discontinuityfactors, which are called heterogeneity factors, are assumed to be valid for allcoordinate directions and are thus conveniently divided into the diffusioncoefficients and flux-volume weighted (FVW) cross sections for the l-D node toyield ENPs applicable to a corresponding three-dimensional (3-D) node TheseENPs can then be used m standard nodal diffusion codes without the introductionof additional complexities such as the inclusion of flux discontinuities m nodeinterface continuity conditions or the carrying of discontinuity factors asequivalent parameters m cross section tables
Smith applies the generalized equivalence theory (GET) method todetermine face-dependent discontinuity factors for a homogenized reflector node
Q
However, since l-D spectral geometry calculations are used for this purpose,discontinuity factors are computed only for those faces which are parallel with thecore edge More specifically, Smith utihzes only the discontinuity factors on thecoreside face of the l-D reflector node by assuming that these are vabd for allfaces of a corresponding two-dimensional (2-D) reflector node (In the axialdirection the radial reflector has no structural heterogeneities and unitydiscontinuity factors are usually assigned to axial node faces However, if axialwater density variations within the radial reflector are neglected, then the radialdiscontinuity factors can also be used in the axial direction ) These discontinuityfactors are used together with the reflector FVW cross sections and diffusioncoefficients m nodal diffusion codes which explicitly account for fluxdiscontinuities
Rathkopf and Liu12 have described a l-D GET reflector model in which asingle set of coreside discontinuity factors is determined for application to all facesof a 3-D reflector node They utilize a two-group l-D diffusion theory analyticrelationship between core-reflector interface fluxes and net currents for a finite(homogenized) reflector to determine the coreside discontinuity factorsFurthermore, they divide these two-group discontinuity factors into the two-groupFVW cross sections and diffusion coefficients for the node to obtain a set ofENPs which can be used, just like Koebke's SET parameters, m standard nodalcodes
The above two models are strictly speaking appbcable only to thick reflectornodes for which neutron transmission through the l-D reflector node is negligibleWhile this may be the case for assembly-size nodes, neutron transmission becomessignificant when homogemzation is carried out over quarter-assembly size nodesHowever, this is of little concern in practice since homogemzation for the radialreflector is nearly always applied to assembly-size nodes, even if quarter-assemblyhomogemzation is earned out for fuel nodes
A rather different simphfication of a l-D GET reflector model which achievesthe same goal as the Rathkopf-Liu model (i e no discontinuity factors as explicitENPs), but which is not limited to two energy groups or to thick reflector nodes,has been developed This model, which has been called the normalized GET
1 Q(NGET) model, utilizes a multigroup analytic method to compute discontinuityfactors and a discontinuity factor normalization procedure which starts at thecore-reflector interface and proceeds towards the outside of a l-D array ofreflector nodes (retaining the values of the discontinuity factors on thecore-reflector interface) to obtain face-independent discontinuity factors for eachnode These normalized discontinuity factors are divided into the FVW crosssections and diffusion coefficients of the nodes Thus, the NGET method can beused to determine ENPs for reflector nodes of arbitrary thickness as well as formulti-node reflector representations In this respect the NGET method is similarto the SET method The difference is that the NGET method does not require aniterative adjustment of the diffusion coefficients to determine face-independentdiscontinuity factors In the NGET method, as well as the previously mentionedGET methods, arbitrary diffusion coefficients are allowed, but FVW values arenormally used
Utilization of the nodal reflector parameters derived from these l-D modelsgives rise to so-called two-dimensional effects in multi-dimensional nodalcalculations for PWRs because these reflector parameters do not account for thetwo-dimensional structure of the baffle at core corners The two-dimensional
1 3 1 *7effects have been estimated > to be of the order of 1% maximum error inassembly powers accompanied by a core-wide power tilt of 1% to 2%Furthermore, these NET-based models yield radial reflector data which aredependent on core conditions primarily through the use of the flux-volume
•t q I Q 1*7weighting procedure for spatial homogemzation It has been shown ' that thisenvironment dependence might incur even greater uncertainty in powerdistributions than do the two-dimensional effects However, since two-dimensionaland environmental effects often (depending on core conditions) cancel fortuitously,the overall effect is frequently quite small Unfortunately, such cancellation ofeffects does not provide confidence in the projected accuracy of a particular PWRnodal reflector model, and therefore recent attempts have been directed towards amore consistent elimination or reduction of the individual effects
As far as two-dimensional effects are concerned, these can be eliminated by.10 andutilizing simplified two-dimensional calculations, like those used by Hoxie
Khalil, to compute NET parameters for corner reflector nodes Unfortunately,such 2-D NET models are still environment-dependent and are computationallymore complex and expensive than the simple one-dimensional models Therefore,the focus has been placed on developing improved one-dimensional models instead
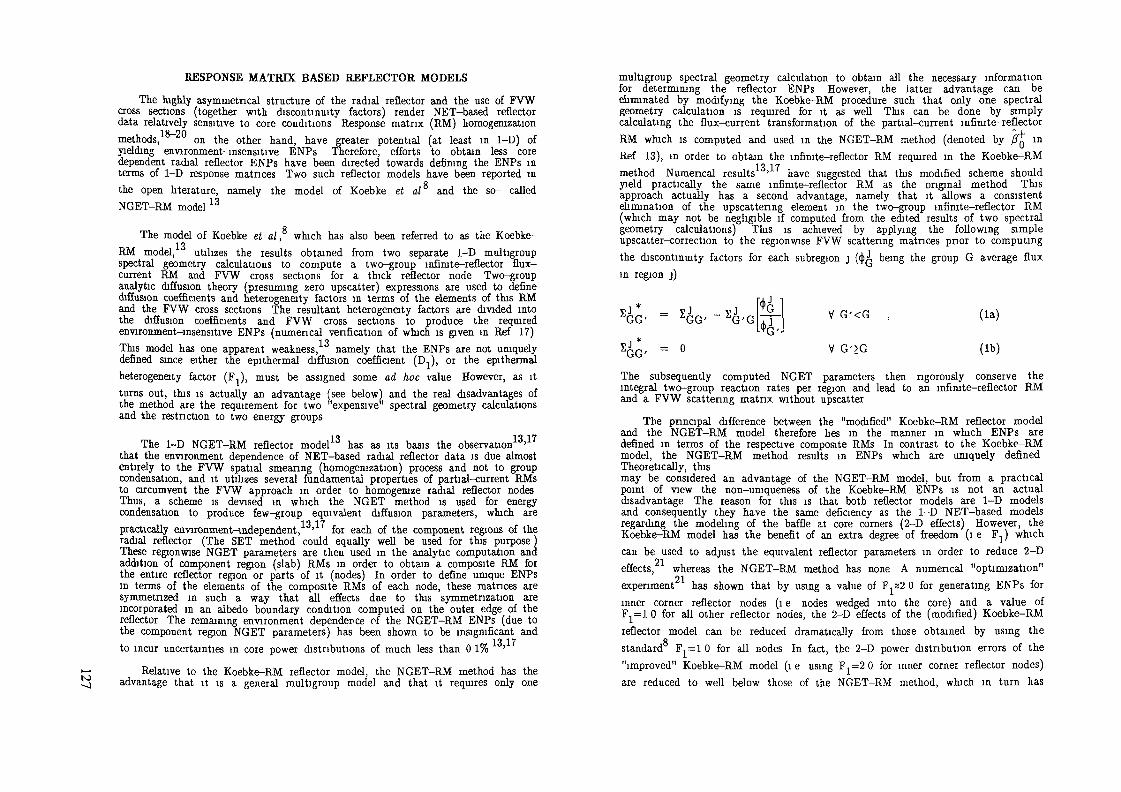
to
RESPONSE MATRIX BASED REFLECTOR MODELS
The highly asymmetrical structure of the radial reflector and the use of FVWcross sections (together with discontinuity factors) render NET-based reflectordata relatively sensitive to core conditions Response matrix (RM) homogenization
•10_ortmethods, on the other hand, have greater potential (at least in 1-D) ofyielding environment-insensitive ENPs Therefore, efforts to obtain less coredependent radial reflector ENPs have been directed towards defining the ENPs mterms of 1-D response matrices Two such reflector models have been reported in
Q
the open literature, namely the model of Koebke et al and the so- calledNGET-RM model13
oThe model of Koebke et al, which has also been referred to as the Koebke-
-t o
RM model, utilizes the results obtained from two separate 1-D multigroupspectral geometry calculations to compute a two-group infinite-reflector flux-current RM and FVW cross sections for a thick reflector node Two-groupanalytic diffusion theory (presuming zero upscatter) expressions are used to definediffusion coefficients and heterogeneity factors in terms of the elements of this RMand the FVW cross sections The resultant heterogeneity factors are divided intothe diffusion coefficients and FVW cross sections to produce the requiredenvironment-insensitive ENPs (numerical verification of which is given in Ref 17)
13This model has one apparent weakness, namely that the ENPs are not uniquelydefined since either the epithermal diffusion coefficient (Dj), or the epithermalheterogeneity factor (F^), must be assigned some ad hoc value However, as itturns out, this is actually an advantage (see below) and the real disadvantages ofthe method are the requirement for two "expensive" spectral geometry calculationsand the restriction to two energy groups
The 1-D NGET-RM reflector model13 has as its basis the observation13'17
that the environment dependence of NET-based radial reflector data is due almostentirely to the FVW spatial smeanng (homogenization) process and not to groupcondensation, and it utilizes several fundamental properties of partial-current RMsto circumvent the FVW approach m order to homogenize radial reflector nodesThus, a scheme is devised in which the NGET method is used for energycondensation to produce few-group equivalent diffusion parameters, which are
1 o -i ypractically environment-independent, ' for each of the component regions of theradial reflector (The SET method could equally well be used for this purpose)These regionwise NGET parameters are then used in the analytic computation andaddition of component region (slab) RMs in order to obtain a composite RM forthe entire reflector region or parts of it (nodes) In order to define unique ENPsin terms of the elements of the composite RMs of each node, these matrices aresymmetrized m such a way that all effects due to this symmetnzation areincorporated in an albedo boundary condition computed on the outer edge of thereflector The remaining environment dependence of the NGET-RM ENPs (due tothe component region NGET parameters) has been shown to be insignificant and
13 17to incur uncertainties in core power distributions of much less than 0 1% '
Relative to the Koebke-RM reflector model, the NGET-RM method has theadvantage that it is a general multigroup model and that it requires only one
multigroup spectral geometry calculation to obtain all the necessary informationfor determining the reflector ENPs However, the latter advantage can beeliminated by modifying the Koebke-RM procedure such that only one spectralgeometry calculation is required for it as well This can be done by simplycalculating the flux-current transformation of the partial-current infinite-reflectorRM which is computed and used in the NGET-RM method (denoted by /?Q inRef 13), m order to obtain the infinite-reflector RM required in the Koebke-RM
•t o 17method Numerical results ' have suggested that this modified scheme shouldyield practically the same infinite-reflector RM as the original method Thisapproach actually has a second advantage, namely that it allows a consistentelimination of the upscattermg element m the two-group infinite-reflector RM(which may not be negligible if computed from the edited results of two spectralgeometry calculations) This is achieved by applying the following simpleupscatter-correction to the regionwise FVW scattering matrices prior to computingthe discontinuity factors for each subregion j (<)>A being the group G average fluxin region j)
SGG' - *t
SGG' = °
UG'G L*A-JV G'<G
V G'>G
(la)
(Ib)
The subsequently computed NGET parameters then rigorously conserve theintegral two-group reaction rates per region and lead to an infinite-reflector RMand a FVW scattering matrix without upscatter
The principal difference between the "modified" Koebke-RM reflector modeland the NGET-RM model therefore bes in the manner in which ENPs aredefined in terms of the respective composite RMs In contrast to the Koebke-RMmodel, the NGET-RM method results m ENPs which are uniquely definedTheoretically, thismay be considered an advantage of the NGET-RM model, but from a practicalpoint of view the non-uniqueness of the Koebke-RM ENPs is not an actualdisadvantage The reason for this is that both reflector models are 1-D modelsand consequently they have the same deficiency as the 1-D NET-based modelsregarding the modeling of the baffle at core corners (2-D effects) However, theKoebke-RM model has the benefit of an extra degree of freedom (i e F^) whichcan be used to adjust the equivalent reflector parameters in order to reduce 2-D
91effects, whereas the NGET-RM method has none A numerical "optimization"91experiment has shown that by using a value of F,s2 0 for generating ENPs for
inner corner reflector nodes (i e nodes wedged into the core) and a value ofF1=l 0 for all other reflector nodes, the 2-D effects of the (modified) Koebke-RMreflector model can be reduced dramatically from those obtained by using the
Q
standard F,=l 0 for all nodes In fact, the 2-D power distribution errors of the"improved" Koebke-RM model (i e using F,=2 0 for inner corner reflector nodes)are reduced to well below those of the NGET-RM method, which in turn has
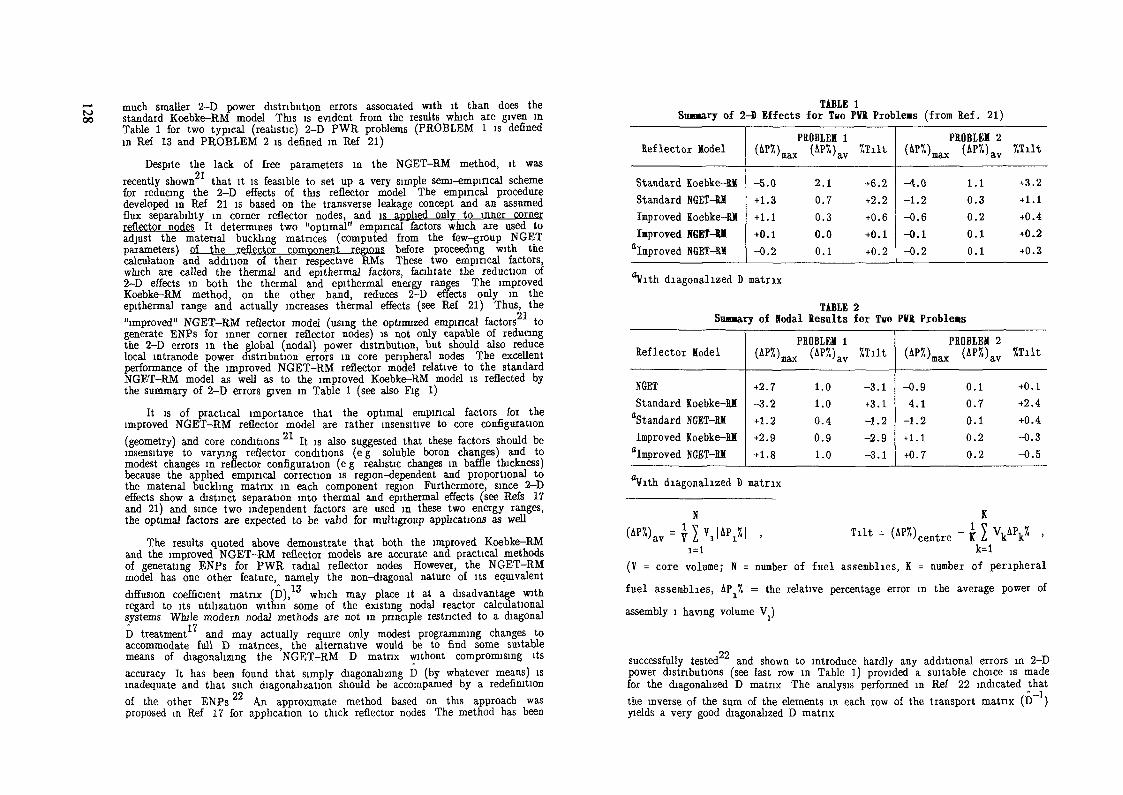
toÖD
much smaller 2-D power distribution errors associated with it than does thestandard Koebke-RM model This is evident from the results which are given inTable 1 for two typical (reahstic) 2-D PWR problems (PROBLEM 1 is definedin Ref 13 and PROBLEM 2 is defined m Ref 21)
Despite the lack of free parameters m the NGET-RM method, it wasn-i
recently shown that it is feasible to set up a very simple semi-empincal schemefor reducing the 2-D effects of this reflector model The empirical proceduredeveloped m Ref 21 is based on the transverse leakage concept and an assumedflux separability m corner reflector nodes, and is applied only to inner cornerreflector nodes It determines two "optimal" empirical factors which are used toadjust the material buckling matrices (computed from the few-group NGETparameters) of the reflector component regions before proceeding with thecalculation and addition of their respective RMs These two empirical factors,which are called the thermal and epithermal factors, facilitate the reduction of2-D effects in both the thermal and epithermal energy ranees The improvedKoebke-RM method, on the other hand, reduces 2-D effects only m theepithermal range and actually increases thermal effects (see Ref 21) Thus, the
21"improved" NGET-RM reflector model (using the optimized empirical factors togenerate ENPs for inner corner reflector nodes) is not only capable of reducingthe 2-D errors in the global (nodal) power distribution, but should also reducelocal intranode power distribution errors m core peripheral nodes The excellentperformance of the improved NGET-RM reflector model relative to the standardNGET-RM model as well as to the improved Koebke-RM model is reflected bythe summary of 2-D errors given m Table 1 (see also Fig 1)
It is of practical importance that the optimal empirical factors for theimproved NGET-RM reflector model are rather insensitive to core configuration
n-i
(geometry) and core conditions It is also suggested that these factors should beinsensitive to varying reflector conditions (e g soluble boron changes) and tomodest changes in reflector configuration (e g reahstic changes m baffle thickness)because the applied empirical correction is region-dependent and proportional tothe material buckling matrix in each component region Furthermore, since 2-Deffects show a distinct separation into thermal and epithermal effects (see Refs 17and 21) and since two independent factors are used m these two energy ranges,the optimal factors are expected to be valid for multigroup applications as well
The results quoted above demonstrate that both the improved Koebke-RMand the improved NGET-RM reflector models are accurate and practical methodsof generating ENPs for PWR radial reflector nodes However, the NGET-RMmodel has one other feature, namely the non-diagonal nature of its equivalent
* 10diffusion coefficient matrix (D), which may place it at a disadvantage withregard to its utilization within some of the existing nodal reactor calcutationalsystems While modern nodal methods are not in principle restricted to a diagonal* 17D treatment and may actually require only modest programming changes toaccommodate full D matrices, the alternative would be to find some suitablemeans of diagonalizing the NGET-RM D matrix without compromising itsaccuracy It has been found that simply diagonahzmg D (by whatever means) isinadequate and that such diagonahzation should be accompanied by a redefinition
OO
of the other ENPs An approximate method based on this approach wasproposed m Ref 17 for application to thick reflector nodes The method has been
TABLE 1Summary of 2-D Effects for Two PVÄ Problems (from Ref. 21)
Reflector Model
Standard Koebke-RMStandard NGEURMImproved Koebke-RMImproved HGET-M"improved NGET-RM
(«,.-5.0+1.3+1.1+0.1-0.2
PROBLEM 1
2.10.70.30.00.1
Wilt
+6.2+2.2+0.6+0.1+0.2
(4P7.)
.0-1.2-0.6-0.1-0.2
PROBLEM 2max "• 'av
1.10.30.20.10.1
Wilt
+3.2+1.1+0.4+0.2+0.3
diagonalized D matrix
TABLE 2Summary of Nodal Kesults for Two PW Problems
Reflector Model
NGETStandard Koebke-RM^Standard NGET-BMImproved Koebke-RM"improved NGET-RM
(AP7.
+2.7-3.2+1.2+2.9+1.8
PROBLEM 1(AP7.)max v 'av
1.01.00.40.91.0
Wilt
-3.1+3.1-1.2-2.9-3.1
(AP7.)
-0.9-4.1-1.2+ 1.1+0.7
PROBLEM 2
0.10.70.10.20.2
Wilt
+0.1+2.4+0.4-0.3-0.5
diagonalized D matrix
N K
= Y-I Wl ' Tllt = ^centre ~ K l W '1=1 k=l
(V = core volume; N = number of fuel assemblies, K = number of peripheral
fuel assemblies, AP.J. = the relative percentage error m the average power of
assembly i having volume V )
22successfully tested and shown to introduce hardly any additional errors in 2-Dpower distributions (see last row in Table l) provided a suitable choice is madefor the diagonalized D matrix The analysis performed m Ref 22 indicated thatthe inverse of the sum of the elements in each row of the transport matrix (D~ )yields a very good diagonalized D matrix
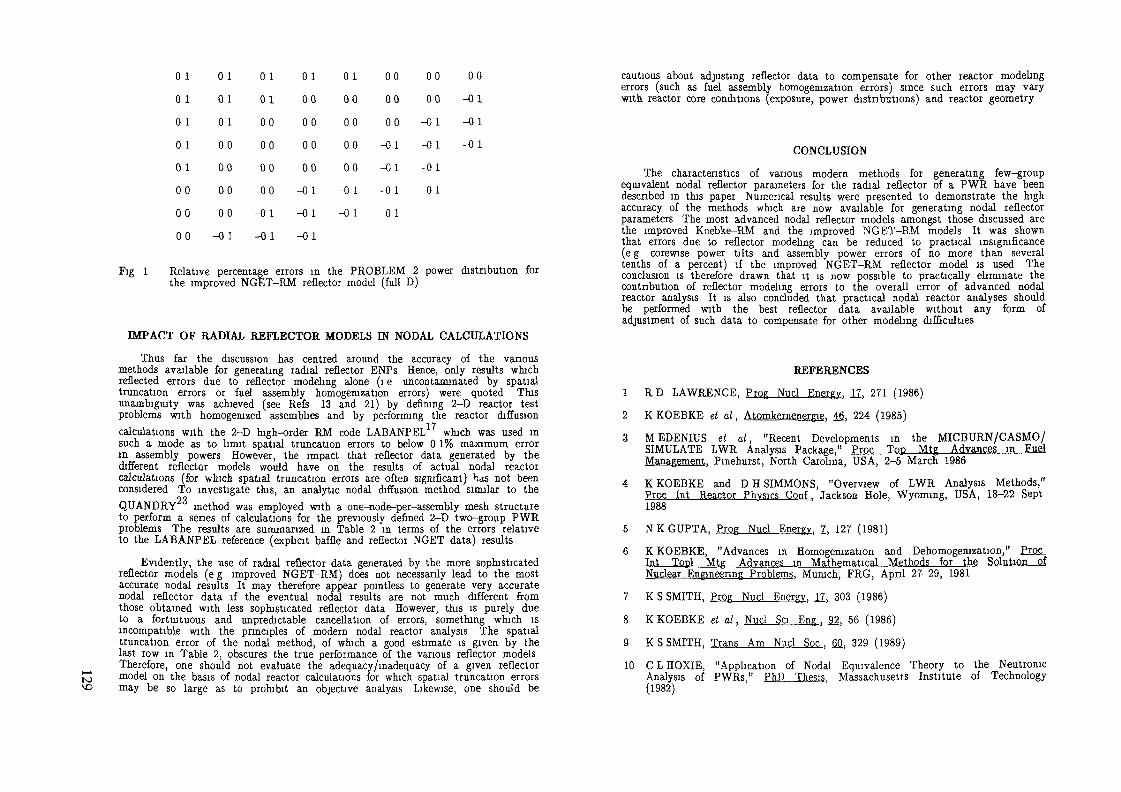
0101010 101000000
01010100000000-01
010100000000-01-01
0 100000000-01-01-0 1
0100000000-01-01
000000-01-01-010 1
0000-01-0 1-0101
00-01-01-01
N)
Fig I Relative percentage errors m the PROBLEM 2 power distribution forthe improved NGET-RM reflector model (full D)
IMPACT OF RADIAL REFLECTOR MODELS IN NODAL CALCULATIONS
Thus far the discussion has centred around the accuracy of the variousmethods available for generating radial reflector ENPs Hence, only results whichreflected errors due to reflector modeling alone (i e uncontammated by spatialtruncation errors or fuel assembly homogemzation errors) were quoted Thisunambiguity was achieved (see Refs 13 and 21) by defining 2-D reactor testproblems with homogenized assemblies and by performing the reactor diffusioncalculations with the 2-D high-order RM code LABANPEL which was used msuch a mode as to limit spatial truncation errors to below 0 1% maximum errorm assembly powers However, the impact that reflector data generated by thedifferent reflector models would have on the results of actual nodal reactorcalculations (for which spatial truncation errors are often significant) has not beenconsidered To investigate this, an analytic nodal diffusion method similar to the
ooQUANDRY method was employed with a one-node-per-assembly mesh structureto perform a series of calculations for the previously defined 2-D two-group PWRproblems The results are summarized m Table 2 m terms of the errors relativeto the LABANPEL reference (explicit baffle and reflector NGET data) results
Evidently, the use of radial reflector data generated by the more sophisticatedreflector models (e g improved NGET-RM) does not necessarily lead to the mostaccurate nodal results It may therefore appear pointless to generate very accuratenodal reflector data if the eventual nodal results are not much different fromthose obtained with less sophisticated reflector data However, this is purely dueto a fortuituous and unpredictable cancellation of errors, something which isincompatible with the principles of modern nodal reactor analysis The spatialtruncation error of the nodal method, of which a good estimate is given by thelast row m Table 2, obscures the true performance of the various reflector modelsTherefore, one should not evaluate the adequacy/inadequacy of a given reflectormodel on the basis of nodal reactor calculations for which spatial truncation errorsmay be so large as to prohibit an objective analysis Likewise, one should be
cautious about adjusting reflector data to compensate for other reactor modebngerrors (such as fuel assembly homogemzation errors) since such errors may varywith reactor core conditions (exposure, power distributions) and reactor geometry
CONCLUSION
The characteristics of various modern methods for generating few-groupequivalent nodal reflector parameters for the radial reflector of a PWR have beendescribed in this paper Numerical results were presented to demonstrate the highaccuracy of the methods which are now available for generating nodal reflectorparameters The most advanced nodal reflector models amongst those discussed arethe improved Koebke-RM and the improved NGET-RM models It was shownthat errors due to reflector modeling can be reduced to practical insignificance(e g corewise power tilts and assembly power errors of no more than severaltenths of a percent) if the improved NGET-RM reflector model is used Theconclusion is therefore drawn that it is now possible to practically eliminate thecontribution of reflector modeling errors to the overall error of advanced nodalreactoi analysis It is also concluded that practical nodal reactor analyses shouldbe performed with the best reflector data available without any form ofadjustment of such data to compensate for other modeling difficulties
REFERENCES
1 R D LAWRENCE, Prog Nucl Energy. 11, 271 (1986)
2 KKOEBKE et d, Atomkernenergie, 4fi, 224 (1985)
3 MEDENIUS et al, "Recent Developments m the MICBURN/CASMO/SIMULATE LWR Analysis Package," Proc Top Mtg Advances m FuelManagement, Pmehurst, North Carolina, USA, 2-5 March 1986
4 KKOEBKE and D H SIMMONS, "Overview of LWR Analysis Methods,"Proc Int Reactor Physics Conf, Jackson Hole, Wyoming, USA, 18-22 Sept1988
5 N K GUPTA, Prog Nucl Energy, Z, 127 (1981)
6 K KOEBKE, "Advances in Homogemzation and Dehomogemzation," ErQCInt Topi Mtg Advances in Mathematical Methods for the Solution ofNuclear Engineering Problems. Munich, FRG, April 27-29, 1981
7 K S SMITH, Prog Nucl Energy, 17, 303 (1986)
8 KKOEBKE et al, Nucl Sa Eng. 22, 56 (1986)
9 K S SMITH, Trans Am Nucl Soc . 6Û, 329 (1989)
10 C L HOXIE, "Application of Nodal Equivalence Theory to the NeutronicAnalysis of PWRs," PhD Thesis, Massachusetts Institute of Technology(1982)
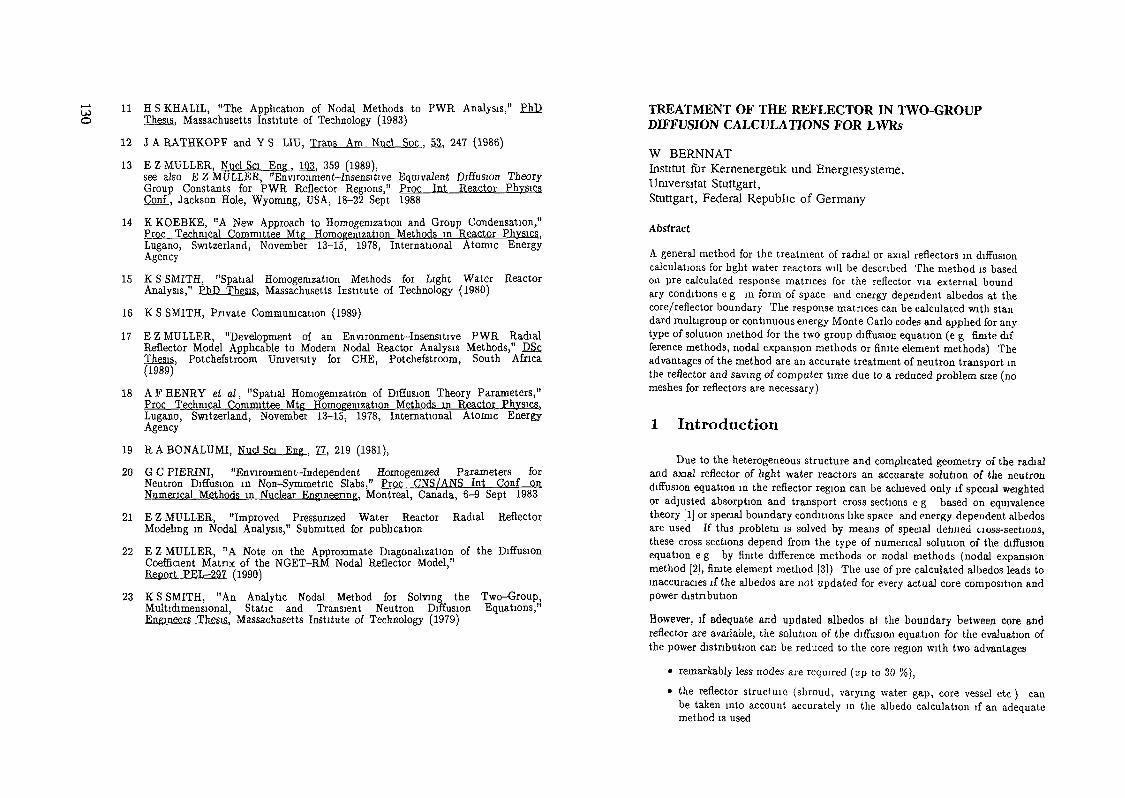
11 HSKHALIL, "The Application of Nodal Methods to PWR Analysis," PhDThesis, Massachusetts Institute of Technology (1983)
12 J A RATHKOPF and Y S LIU, Trans Am Nuci Soc . 52, 247 (1986)
13 E Z MULLER, Nucl Sei Eng, 101, 359 (1989),see also E Z MULLER, "Environment-Insensitive Equivalent Diffusion TheoryGroup Constants for PWR Reflector Regions," Proc Int Reactor PhysicsConf. Jackson Hole, Wyoming, USA, 18-22 Sept 1988
14 K KOEBKE, "A New Approach to Homogemzation and Group Condensation,"Proc Technical Committee Mtg Homogemzation Methods in Reactor Physics,Lugano, Switzerland, November 13-15, 1978, International Atomic EnergyAgency
15 K S SMITH, "Spatial Homogemzation Methods for Light Water ReactorAnalysis," PhD Thesis. Massachusetts Institute of Technology (1980)
16 K S SMITH, Private Communication (1989)
17 E Z MULLER, "Development of an Environment-Insensitive PWR RadialReflector Model Applicable to Modern Nodal Reactor Analysis Methods," DSçThesis, Potchefstroom University for CHE, Potchefstroom, South Africa(1989)
18 A F HENRY et al, "Spatial Homogemzation of Diffusion Theory Parameters,"Proc Technical Committee Mtg Homogemzation Methods m Reactor Physics,Lugano, Switzerland, November 13-15, 1978, International Atomic EnergyAgency
19 R A BONALUMI, Nucl Sei Eng , II, 219 (1981),
20 G C PIERINI, "Environment-Independent Homogenized Parameters forNeutron Diffusion m Non-Symmetric Slabs," Proc CNS/ANS Int Conf onNumerical Methods in Nuclear Engineering. Montreal, Canada, 6-9 Sept 1983
21 E Z MULLER, "Improved Pressurized Water Reactor Radial ReflectorModeling m Nodal Analysis," Submitted for publication
22 E Z MULLER, "A Note on the Approximate Diagonalization of the DiffusionCoefficient Matrix of the NGET-RM Nodal Reflector Model,"Report PEL-297 (1990)
23 K S SMITH, "An Analytic Nodal Method for Solving the Two-Group,Multidimensional, Static and Transient Neutron Diffusion Equations,"Engineers Thesis, Massachusetts Institute of Technology (1979)
TREATMENT OF THE REFLECTOR IN TWO-GROUPDIFFUSION CALCULATIONS FOR LWRs
W BERNNATInstitut für Kernenergetik und Energiesysteme,Universität Stuttgart,Stuttgart, Federal Republic of Germany
Abstract
A general method for the treatment of radial or axial reflectors m diffusioncalculations for light water reactors will be described The method is basedon pre calculated response matrices for the reflector via external boundary conditions e g in form of space and energy dependent albedos at thecore/reflector boundary The response matrices can be calculated with standard multigroup or continuous energy Monte Carlo codes and applied for anytype of solution method for the two group diffusion equation (e g finite difference methods, nodal expansion methods or finite element methods) Theadvantages of the method are an accurate treatment of neutron transport mthe reflector and saving of computer time due to a reduced problem size (nomeshes for reflectors are necessary)
1 Introduction
Due to the heterogeneous structure and complicated geometry of the radialand axial reflector of light water reactors an accuarate solution of the neutrondiffusion equation in the reflector region can be achieved only if special weightedor adjusted absorption and transport cross sections e g based on equivalencetheory [1] or special boundary conditions like space and energy dependent albedosare used If this problem is solved by means of special defined uoss-sections,these cross sections depend from the type of numerical solution of the diffusionequation eg by finite difference methods or nodal methods (nodal expansionmethod [2], finite element method [3]) The use of pre calculated albedos leads toinaccuracies if the albedos are not updated for every actual core composition andpower distribution
However, if adequate and updated albedos at the boundary between core andreflector are available, the solution of the diffusion equation for the evaluation ofthe power distribution can be reduced to the core region with two advantages
• remarkably less nodes are required (up to 30 %),
• the reflector structuie (shroud, varying water gap, core vessel etc) canbe taken into account accurately in the albedo calculation if an adequatemethod is used

The calculation of such adequate and updated albedos can be performed by meansof a response matrix method based on transport theory The geometry and mate-rial composition of the reflector remain practically constant during a reactor cycle(except the boron concentration m PWR), therefore response matrices which de-fine the relation between current directed into reflector at space variable r andenergy group i and the returning current of neutrons at space variable r' andgroup i' depend only from few changeing parameters and hence can be calculatedseparately from diffusion calculation If the complete response matrix is known,the albedo at every group and at every space point at the boundary between coreand reflector can be easily calculated by multiplying the output (from core to re-flector) current vector by the response matrix achieving the corresponding inputcurrent vector and evaluating the relation between input current and output current This can be done during the iterative solution of the diffusion equation withthe most updated fluxes and gradients with negligible computer cost
The calculation of the response matrix may be performed by any adequate trans-port code In our experience the most convenient and accurate way to calculatesuch response matrices is the use of a Monte Carlo method By this methodthe reflector structure can be taken into account as realistic as necessary and thetransport equation can be solved with high order of accuracy
A detailled study of the flux spectra at the boundary showed that the formof the energy spectra depend from the assembly type (enrichment etc ), burn-up,boron concentration (PWR) and moderator density These dependencies can betaken into account by means of a few parameters The response matrix elementsfor these parameters can be calculated simultaneously by means of a correlatedsampling Monte Carlo technique
With the response matrix method we had very good experiences also in otherapplications like calculation of SWR assemblies with cruciform absorber elementswhere the absorber region and water gap was treated by a Monte Carlo responsematrix [4] and m (2D and AD )HTR applications [5,6] wheie the complete cavitybetween core and reflector including inserted control rods were treated by meansof response matrices (in this case not by external but by internal boundary con-ditions) The applied theory worked well for both finite difference methods andnodal methods (e g finite element method with isoparametnc numerical inte-grated elements with second order expansion) The method is not only applicableto radial reflectors but also for axial reflectors Using internal boundary condi-tions instead of external albedos the method can be used to solve diffusion andtransport equation in different regions simultaneously
2 Description of the Method
The basic principle is to couple the core region in which the two-group dif-fusion equation is solved by the reflector region in which the transport equationshould be solved (due to the strong gradients in the reflector region) by means ofan adequate boundary condition
In a PL approximation of the transport equation the boundary condition for theneutron flux density between two different media generally can be written in theintegral form [7]
where <J>D(?, E, ft) and <f>T(?, E , U ) are the flux densities in the diffusion region andtransport region respectively The above boundary condition requires steadinessof the normal component of the current density along the boundary between tworegions
In the region in which the diffusion equation is solved only sufficient conditionsfor a Pi-approximation (1 = m = 0) exist In this case the boundary conditionreduces to one equation in which the neutron flux density is approximated by thelinear amsotropic term
<t>D(r,E,ä) = — U(f,E)- (f,E)}
The normal component of the current density directed into the diffusion region isthen
The neutron flux density at the boundary between core and reflector region at thephase space coordinates r, E, Û is a function of the flux distribution at the surfaceand the material composition inside this region
4>(r,L,i
e' (fi, , ,>o
<t>D(r n )dC'dä'ds

u>NJ
where A'(f ',E',U' —» f , E , U ) is a transport kernel which regards for scatteringand absorption in the transport region and tj>D(r',£',& ) can be approximatedby the mentioned linear anisotropic term. For the solution of the integral in theabove equation a Monte Carlo method can be used for any degree of complexityof the reflector structure.
The principle of coupling exists in calculating the current density directedinto the core region J~(T) (g denotes energy group number) as a function of theangular dependent current density directed into the reflector region. For a dis-cretisized surface the current density j'gl (1 denotes a surface element, e. g. whichmay be described by any possible surface type of the FE-net generator or a meshboundary of the FD- or nodal mesh net ) can be calculated by means of followingequation
Vg<VV«!'! • '
The coefficients R^ain are components of a response matrix which describe theneutron exchange between the surface elements. The fluxes <j>e't and flux gradi-ents -^- can be taken from the diffusion solution at the corresponding surfaceelements. In the finite element method the flux is approximated by a polynomialexpansion
The calculation of the average fluxes and gradients at the surface elements alongthe boundary between transport region and diffusion region can be performed bymeans of the integration over the functions £,(£)
\ dn /
where NKO is the number of nodes at the regarded side of the finite element andNK the total number of nodes of the regarded finite element.
In the nodal expansion method the average flux and gradients at the boundariescan be derived from the basic parameters (average node fluxes and input/outputcurrents at the six node boundaries) of the solution of the nodal equations [8].The coupling of input/output currents at the boundary between core and reflectorcan be realized by means of an albedo coefficient
where £,-(z) are known functions (e.g. of order two) and <jfg the fluxes at the nodesof the finite element. In the FE-program DIFGEN /3/ e. g. a general boundarycondition of the form
can be taken into account at every external or internal side of a finite element(e.g. with pentaedric or hexaedric form). In diffusion approximation the currentdensity from reflector into core region can be described by
where the input currents j~(£) can be calculated by multiplying the output cur-rents j^(a;') by the response matrix again.
For the finite difference method the difference formulas for the fluxes and gradi-ents at the boundary meshes can be used to determine the linear anisotropic fluxdistribution at every mesh boundary.
The complete solution of the diffusion equation in the core region can be achievedif the system equations corresponding to the FD- , NEM- or FE - method and si-multaneously the equations for the determination of albedos or NEUMANN sourceterms (simple matrix times vector operation) are solved. The diffusion equationhas to be solved only for the core region.
(Ds(x) is the diffusion coefficient for group g.) This input current vector can becalculated by multiplying the output current vector (into the reflector region) bythe response matrix and used as a NEUMANN source term of the gernal boundarycondition fa(x) = j ~ ( x ) with a = J, 0,(x] = \D,(S).
3 Calculation of Response Matrices
As mentioned before, the neutron transport in the complex structure of thereflector can be treated most accurately by a Monte Carlo method. A typicalgeometry for the radial reflector of a PWR is shown in Fig.l (350 MW plant KWO).

r (cm)
H coresa shroudta reflector (H2O)H reactor vesselm reflector (H2O)sa thermal shielda reflector (H2O)n pressure vessel
Figure 1: Radial Structure of a 350 MW PWR-Reflector (KWO)
For the calculation of the response matrix elements at every surface element 1' ofthe core/reflector boundary neutrons with energies corresponding to the fast orthermal energy group (index g')have to be started into the reflector region andfollowed up to their escape from system, absorption (or Russian Roulette killing) orreturn to the core/reflector boundary. The returning neutrons (at surface element1 and energy group g) contribute to the response matrix elements R%'tiit,Rl>ti>i,Rl,,,,, and R^,,,, respectively.
6
~ 1
6
0.1
_' '''I
-
,1<0-»
•U] ' Ml 1 'I'j ' ni l -|.| i i>i| i <i< ' i<i | l U'(.
-
Al\V -\
---- k.rn-up 15UWDAJ———— bum-up XOMWD/lg
i i nl i ni i nil i iii i till i in! i in i HI i nil10-' 101 10* 10«
Emri» CiV3
Figure 2: Spectrum at the Radial Core/Reflector Boundary (350MW PWR.KWO)
The spatial distribution of the starting neutrons at the surface element 1' can betaken as constant (e.g. if the mesh size is not too large), linear or with higherorder depending from degree of approximation of the diffusion solution. The an-gular distribution is taken cosine shaped in the normal direction of the regardedsurface element. With the cosine shaped source distribution the A° - term canbe calculated directly. The A1, A2, A3 - terms can be calculated simultaneouslyby multiplying the neutron starting weights (normally 0.5) by the correspondingcomponents Üx,Üy,üt of the neutron direction fl. The energy distribution of thestarting neutrons can be chosen from typical assembly spectra which mainly de-pend from assembly type, burn-up, moderator density and boron concentration(PWR). An example of a multigroup spectra at the boundary core/reflector isshown in Fig.2 for different burn-up values. Such assembly spectra may be takenfrom fundamental mode multigroup assembly calculations (ID or 2D) and interpo-lated to the group or energy structure which is used in the Monte Carlo transport

U)
25.00 SO.00 75.00 100.00 I2S.OCJ ISO.OÛ US.00 200.OO
Response function for an inputcurrent in surface element No.11
Outputelement No.
91011121314
Group 1
4.0 E-41.8 E-31.5E-32.1 E-32.4 E-21.7E-12.6 E-22.4 E-37.9 E-4
Inputelement
6789
1011121314
., Group 2NO.
2.1 E-61.9E-56.2 E-51 .9 E-41 .6 E-22.1 E-11.9E-22.2 E-41.9 E-6
Group 2
6.2 E-41.0 E-37.5 E-48.7 E-49.1 E-32.0 E-23.8 E-31.2 E-35.8 E-4
Figure 3: Response Vectors for fast and thermal Group
calculations for the response matrices. The energy structures of assembly calcula-tions and transport calculations must not be identical. The only requirement forthe calculation of the response matrix elements is the use of the identical cut-offenergy between fast and thermal group as in the two-group structure of the dif-fusion calculation. Therefore, the transport calculations can be performed also bymeans of a continuous energy Monte Carlo code e.g. by the well known MCNP-code [9]. In every case a sufficient number of energy groups- or points should beused for the transport calculation.In a first version we used the multigroup Monte Carlo code MORSE-SGCS J10] forthe calculation of reflector response matrix elements. For MORSE-SGCS two usersubroutines have to be prepared for the source phase space coordinates selection(subroutine SOURCE and a special surface detector routine for the calculationof the response matrix elements (subroutine BDRYX) [11]. Of course, The 45°-symmetry of the reflector structure can be taken into account. The modelling ofthe reflector geometry by the MORSE-code is no problem even if complex axialstructures will be regarded.
4 Examples
As an example the response matrix of a 2D- P roblem was calculated by MonteCarlo using the MORSE-code with the special user routines. The surface ele-ments of the core/reflector boundary were subdivided into three meshes/assemblyas shown in Fig. 3. The response functions for an input current at surface element11 is shown in this figure too. In Fig.4 a comparison of a 2D - diffusion solutionwith a nodal expansion method with different reflector treatment (adjusted reflec-tor cross-sections and albedos from reflector transport calculation) is shown. Forthe case of a coarse mesh net (for which the reflector cross sections were adjustedto a comparable transport solution) the two solutions are in sufficient good agree-ment. If these reflector cross-sections are used in fine-mesh calculations the largerdiscrepancies were observed.
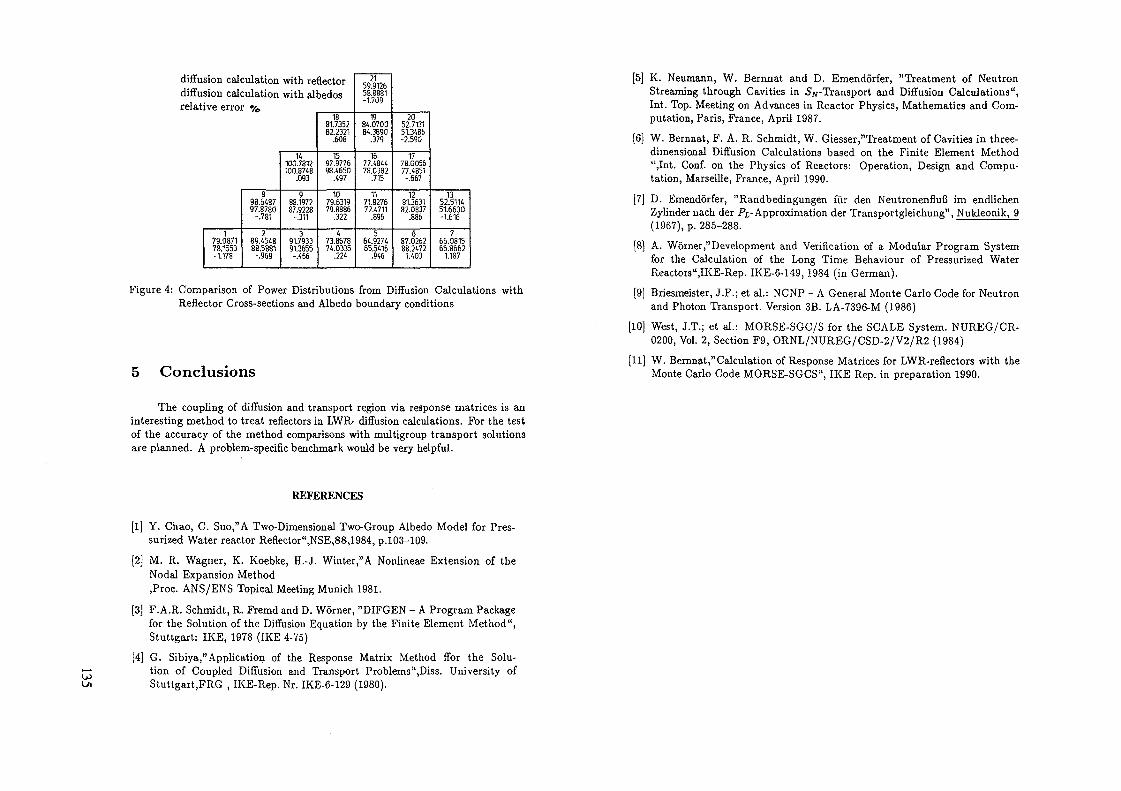
diffusion calculation with reflectordiffusion calculation with albedosrelative error %,
79.087178.1553-1.178
898.648797.8780
-.781
289.454888.5881
-.969
1«100.7812100.8748
.093
988.197287.9228
-.311
391.793391.3655-.465
1881.735282.2321
.608
1597.977698.4650
.497
1079.631979.8886
.322
473.867874.0335
.224
2159.912658.8881-1.709
1984.070084.3890
.379
1677.484478.0382
.715
1171.827672.4711
.896
564.927465.5416
.946
52.713151.3486-2.590
1778.005677.4851
-.667
81.363182.0837
.886
687.026288.2472
1.403
1352.511451.6630-1.616
766.081566.8662
1.187
Figure 4: Comparison of Power Distributions from Diffusion Calculations withReflector Cross-sections and Albedo boundary conditions
5 Conclusions
The coupling of diffusion and transport region via response matrices is aninteresting method to treat reflectors in LWR- diffusion calculations. For the testof the accuracy of the method comparisons with multigroup transport solutionsare planned. A problem-specific benchmark would be very helpful.
REFERENCES
[1] Y. Chao, C. Suo,"A Two-Dimensional Two-Group Albedo Model for Pres-surized Water reactor Reflector",NSE,88,1984, p.103-109.
[2] M. R. Wagner, K. Koebke, H.-J. Winter,"A Nonlineae Extension of theNodal Expansion Method,Proc. ANS/ENS Topical Meeting Munich 1981.
[3] F.A.R. Schmidt, R. Fremd and D. Wörner, "DIFGEN - A Program Packagefor the Solution of the Diffusion Equation by the Finite Element Method",Stuttgart: IKE, 1978 (IKE 4-75)
[4] G. Sibiya," Application of the Response Matrix Method ffor the Solu-tion of Coupled Diffusion and Transport Problems",Diss. University ofStuttgart,FRG , IKE-Rep. Nr. IKE-6-129 (1980).
[5] K. Neumann, W. Bernnat and D. Emendörfer, "Treatment of NeutronStreaming through Cavities in Sw-Transport and Diffusion Calculations",Int. Top. Meeting on Advances in Reactor Physics, Mathematics and Com-putation, Paris, France, April 1987.
[6] W. Bernnat, F. A. R. Schmidt, W. Giesser,"Treatment of Cavities in three-dimensional Diffusion Calculations based on the Finite Element Method",Int. Conf. on the Physics of Reactors: Operation, Design and Compu-tation, Marseille, France, April 1990.
[7] D. Emendörfer, "Randbedingungen für den Neutronenfluß im endlichenZylinder nach der PL-Approximation der Transportgleichung", Nukleonik, 9(1967), p. 285-288.
[8] A. Wörner," Development and Verification of a Modular Program Systemfor the Calculation of the Long Time Behaviour of Pressurized WaterReactors",IKE-Rep. IKE-6-149,1984 (in German).
[9] Briesmeister, J.F.; et al.: NCNP - A General Monte Carlo Code for Neutronand Photon Transport. Version 3B. LA-7396-M (1986)
[10] West, J.T.; et al.: MORSE-SGC/S for the SCALE System. NUREG/CR-0200, Vol. 2, Section F9, ORNL/NUREG/CSD-2/V2/R2 (1984)
[11] W. Bernnat,"Calculation of Response Matrices for LWR-reflectors with theMonte Carlo Code MORSE-SGCS", IKE Rep. in preparation 1990.

UJ CALCULATIONAL METHODS FOR PWRsJ KREBS, M.-C. LAIGLE, R LENAIN,G. MATHONNIÈRE, A. NICOLASDirection des réacteurs nucléaires,Département de mécanique et de technologie,Commissariat à l'énergie atomique,Centre d'études nucléaires de Saclay,Gif-sur-Yvette, France
AbstractThe design procedure for PWR reactors has two main stages
the assembly transport calculation (computed by the APOLLO code)and the core calculation, achieved by the diffusion code CRONOS
For rodded or poisoned assemblies, the transport calculationuses the DPOO option (no cell cylinderization and face différen-ciation) at the very time when the non rodded ones are accuratelytreated by the ROTH option (cell cylinderization and no facedifférenciation).
The core calculation in diffusion theory necessitatescondensations for cross sections on space (pin-by-pin or perassembly) and energy (2 groups) Different numerical methods havebeen studied (finite elements and finite differences)
The 3D power transient calculations need more accurate fluxprecision cntenas than fuel depletion studies This comes fromthe evolution of the axial Xenon distribution
In case of large meshes (homogeneous description of thecore), the linear approximations are not precise enough to renderthe radial flux shape Sufficient results are given by theparabolic finite element with 4 meshes per assembly, with a. reducedcost compared to the cubic approximation with 4 meshes, chosen asreference
When taking into account the feedback effects for 2D corecalculations, the power shape is more sensible to the heat transfercoefficient than to the thermalhydraulic mesh and to the channelexchange hypothesis
This design procedure has been compared to measures that havebeen obtained at the begin of life of the CP1 PWR 900 reactors Thehomogeneous one overestimates the rod efficiency (about 67.) Thepin-by-pin calculation is in very good agreement with themeasurements
* Introduction
A design procedure for PWR study has to take several points intoaccount
* reflectors calculation [1]* non-controlled assemblies nuclear properties* controlled and poisoned assemblies nuclear properties
* feedback effects consideration» core calculation, with cycle and power transient calculations
Ours has two mam steps* the first one is the calculation in transport theory of a
repetitive pattern of the core (pin, assembly or a larger pattern) tofind its nuclear properties In our case, this is computed by the APOLLOcode [2]
* the second one is devoted to obtain core calculation mmultigroup diffusion theory This is done by the CRONOS computer code [3],which solves the multigroup diffusion equation by the finite element method,for steady states and kinetics
Going from the first stage to the second one implies a reduction of theinformation generated by the detailed transport calculation homogemzationin space and energy, and use of a transport-diffusion equivalence
A particular attention should be devoted to the calculation of reflectorconstants, for which various methods may be used
The matters dealt with the different stages as follows* transport calculation choices* diffusion calculation choices (homogeneous or pm-by-pm,
selection of flux interpolation polynoms), feedback effects consideration,power transient treatment
* comparison with measure
I - Basic patterns calculation in transport theory.
The APOLLO computer code solves the Boltzmann equation in multigroupapproximation with a spatial treatment of collision probabilities It uses a99 energy group division (47 thermal groups), but for Uranium assembly 37energy group calculations are quite satisfactory [4] The various isotopeself-shielding can be calculated with APOLLO The zones interactions can beconsidered in two different ways
* direct calculation of collision probabilities m which the exactneutron path is respected , this method produces reference values but is tooexpensive for design studies
* calculation with a multicell approximation The pairings of differentcells are achieved through an interface current formalism Several optionsare available according to the approximation degree chosen for the integralflux within each cell (uniform or linear) and for the spatial and angularcurrent characteristics at the cell boundaries For design calculation, twooptions are generally chosen according to the assembly type
To reduce CPU time and memory, cells with the same flux can becalculated as the same calculation point , the choice of "associated cellsmust be validated A total discretisation of an assembly with a 1/8 tt>symmetry leads to 45 cells , for a non-rodded one about 12 cells aresufficient , for poisoned or rodded ones, about 20 cells are necessary TheCPU time is divided by 6 for rodded assemblies and by 16 for non roddedones
For non-controlled and poisonless assemblies, ROTH approximation is agood precision/CPU cost compromise (cells cylinderization, going m neutroncurrents averaged on four faces, consideration of the sole isotropic
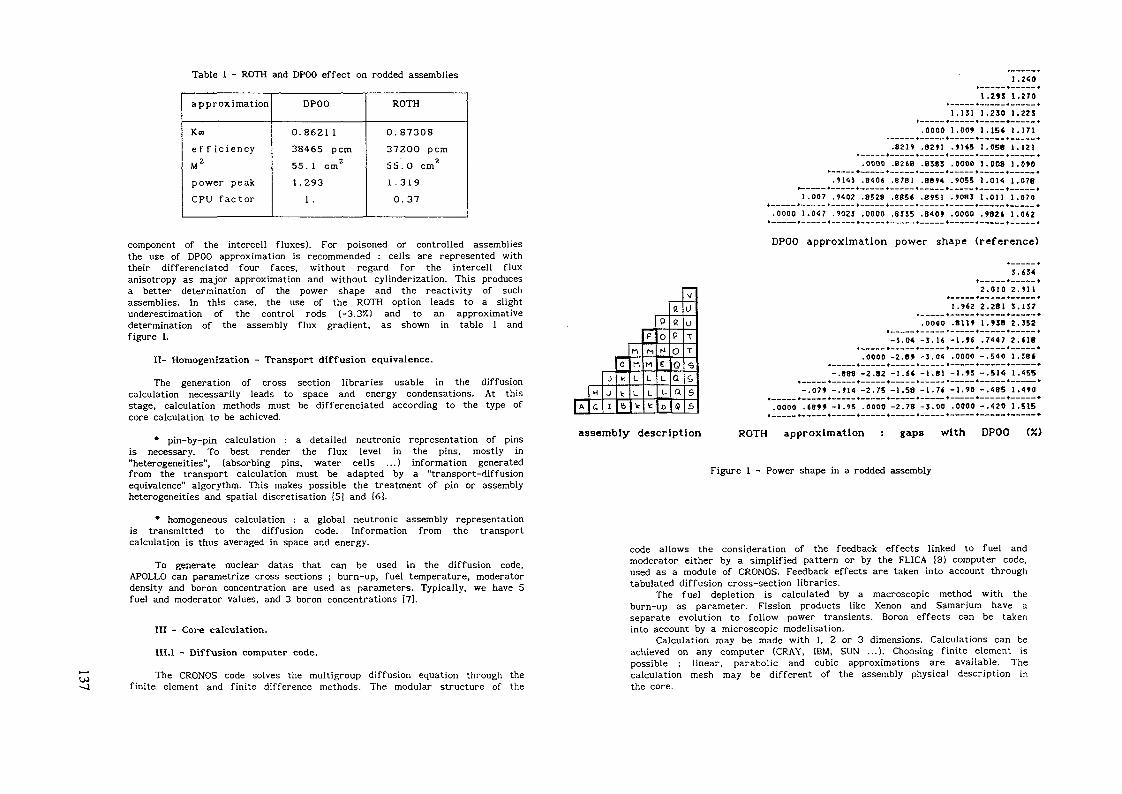
Table 1 - ROTH and DPOO effect on rodded assemblies
approximation
Kcoe f f i c i e n c y
M2
power peakCPU fac to r
DPOO
0 .86211
38465 pcm„ 255.1 cm1 .293
1 .
ROTH
0.8730837200 pcm55. O cm2
1.319
0.37
U)
component of the intercell fluxes). For poisoned or controlled assembliesthe use of DPOO approximation is recommended : cells are represented withtheir differenciated four faces, without regard for the intercell fluxanisotropy as major approximation and without cylinderization. This producesa better determination of the power shape and the reactivity of suchassemblies. In this case, the use of the ROTH option leads to a slightunderestimation of the control rods (-3.37.) and to an approximativedetermination of the assembly flux gradient, as shown in table 1 andfigure 1.
II- Homogenization - Transport diffusion equivalence.
The generation of cross section libraries usable in the diffusioncalculation necessarily leads to space and energy condensations. At thisstage, calculation methods must be differenciated according to the type ofcore calculation to be achieved.
* pin-by-pin calculation : a detailed neutronic representation of pinsis necessary. To best render the flux level in the pins, mostly in"heterogeneities", (absorbing pins, water cells ...) information generatedfrom the transport calculation must be adapted by a "transport-diffusionequivalence" algorythm. This makes possible the treatment of pin or assemblyheterogeneities and spatial discretisation [5] and (61.
* homogeneous calculation : a global neutronic assembly representationis transmitted to the diffusion code. Information from the transportcalculation is thus averaged in space and energy.
To generate nuclear datas that can be used in the diffusion code,APOLLO can parametrize cross sections ; burn-up, fuel temperature, moderatordensity and boron concentration are used as parameters. Typically, we have 5fuel and moderator values, and 3 boron concentrations [71.
Ill - Core calculation.
III.l - Diffusion computer code.
The CRONOS code solves the multigroup diffusion equation through thefinite element and finite difference methods. The modular structure of the
e> s
assembly description
1 .240»_——•——— *l ,2»S 1.270
1.1J1 1.230 1.22!.0000 1.00* 1.15« 1.171.82*1 . »U! LOSS 1 . 1 2 1
»———+———- •———— t——.— *———— »———— +.0000 ,B2t8 .BÎ8S .0000 1.008 1 .090
. 9 1 4 3 .840« .8781 .8894 .9055 1 .014 1 .078r—————— *—————— »————— *——— _.. «_ ———— »_———— *—————— t—————— t
1.007 .9402 .8529 .885« .8951 .908! 1.011 1.070+———+-—-- i——— *———— «——__ »——— »-——— •———_»——— «.0000 1.047 .9025 .0000 .85Î5 .840» .0000 .982* 1.0«»————*————+— —— *———— *———— •———— *————«————*————*
DPOO approximation power shape (reference)
3.«54t—__ 4——— 42.010 2.911»_——— 4_—.— 4~—_~4
1.9«2 2.281 S.1J7.0000 .8119 1.938 2,352
-5.04 -3.1* -1.»« .7447 2.S18.0000 -2.8* -3.04 .0000 -.540 1.38«
-.888 -2.82 -1.«« -1.81 -1.« -.51«! 1.455*______ 4——————— 4——————— «——————— 4-—— —— •——————.*-—————.4———————.4--.07» -.914 -2.75 -1.58 -1.7« -1.90 -.485 1.4»0
.——————— »——————— 4——————— .——————— 4——————— .——————— 4——————— « ——————— « ——————— «.0000 .«8»» -1.95 .0000 -2.78 -3.00 .0000 -.420 1.5154————4,-.——4————4————«————»———— »————*————+————*•
ROTH approximation : gaps with DPOO (X)
Figure 1 - Power shape in a rodded assembly
code allows the consideration of the feedback effects linked to fuel andmoderator either by a simplified pattern or by the FLICA 18) computer code,used as a module of CRONOS. Feedback effects are taken into account throughtabulated diffusion cross-section libraries.
The fuel depletion is calculated by a macroscopic method with theburn-up as parameter. Fission products like Xenon and Samarium have aseparate evolution to follow power transients. Boron effects can be takeninto account by a microscopic modélisation.
Calculation may be made with 1, 2 or 3 dimensions. Calculations can beachieved on any computer (CRAY, IBM, SUN ...). Choosing finite element ispossible ; linear, parabolic and cubic approximations are available. Thecalculation mesh may be different of the assembly physical description inthe core.
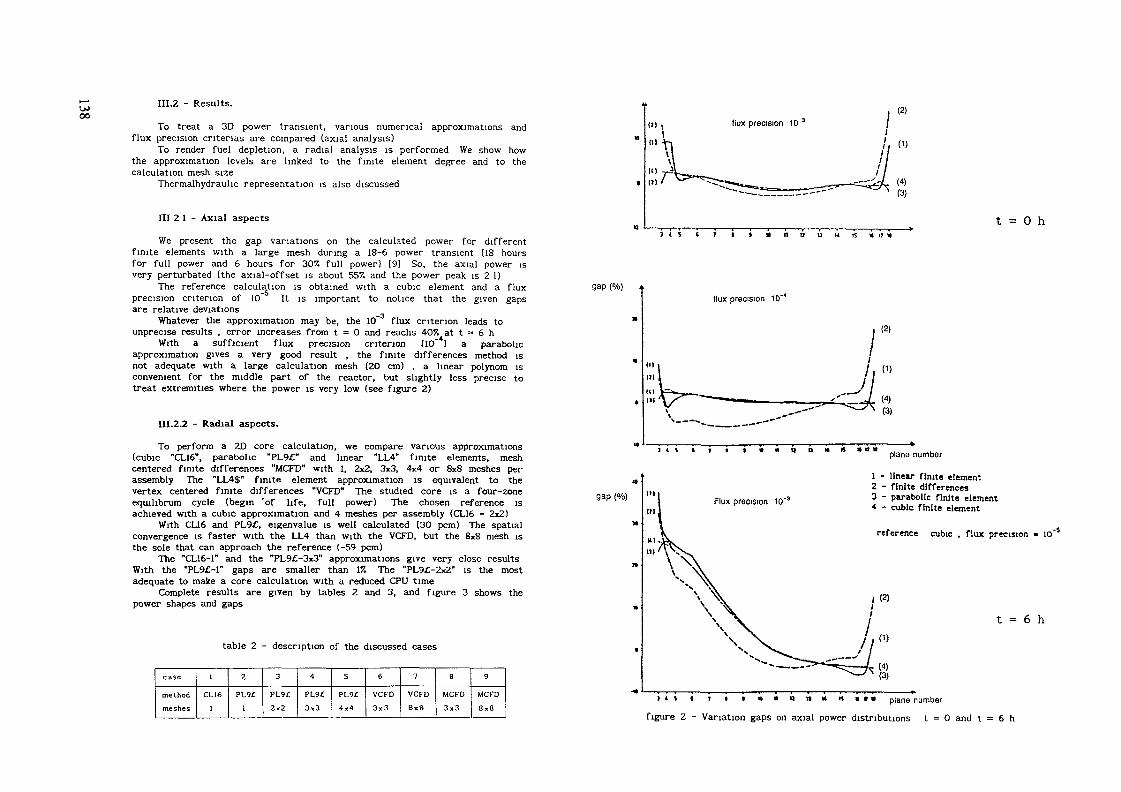
UJ00
III.2 - Results.
To treat a 3D power transient, various numerical approximations andflux precision cntenas are compared (axial analysis)
To render fuel depletion, a radial analysis is performed We show howthe approximation levels are linked to the finite element degree and to thecalculation mesh size
Thermalhydrauhc representation is also discussed
III 2 1 - Axial aspects
We present the gap variations on the calculated power for differentfinite elements with a large mesh during a 18-6 power transient (18 hoursfor full power and 6 hours for 307. full power) [9] So, the axial power isvery perturbated (the axial-offset is about 557. and the power peak is 2 1)
The reference calculation is obtained with a cubic element and a fluxprecision criterion of 10" It is important to notice that the given gapsare relative deviations
Whatever the approximation may be, the 10"3 flux criterion leads tounprecise results , error increases from t = 0 and reachs 40% at t = 6 h
With a sufficient flux precision criterion (10~4) a parabolicapproximation gives a very good result , the finite differences method isnot adequate with a large calculation mesh (20 cm) , a linear polynom isconvenient for the middle part of the reactor, but slightly less precise totreat extremities where the power is very low (see figure 2)
III.2.2 - Radial aspects.
To perform a 2D core calculation, we compare various approximations(cubic "CL16", parabolic "PL9£" and linear "LL4" finite elements, meshcentered finite differences "MCFD" with 1, 2x2, 3x3, 4x4 or 8x8 meshes perassembly The "LL4$" finite element approximation is equivalent to thevertex centered finite differences "VCFD" The studied core is a four-zoneequihbrum cycle (begin "of life, full power) The chosen reference isachieved with a cubic approximation and 4 meshes per assembly (CL16 - 2x2)
With CL16 and PL9£, eigenvalue is well calculated (30 pcm) The spatialconvergence is faster with the LL4 than with the VCFD, but the 8x8 mesh isthe sole that can approach the reference (-59 pcm)
The "CL16-1" and the "PL9£-3x3" approximations give very close resultsWith the "PL9£-r gaps are smaller than 17. The "PL9£-2x2" is the mostadequate to make a core calculation with a reduced CPU time
Complete results are given by tables 2 and 3, and figure 3 shows thepower shapes and gaps
table 2 - description of the discussed cases
case
methodmeshes
1
CL161
2
PL9£1
3
PL9£2x2
4
PL9£
3.3
S
PL9JC4x4
6
VCFD
3x3
7
VCFD
8x8
8
MCFD
3x3
9
MCFD8x8
t = 0 h
gap (%)
J < s ( i i i » t i n u u t s » n i «
flux precision 10
plane number
gap (%) Flux precision 10
1 - linear finite element2 - finite differences3 - parabolic finite element4 - cubic finite element
reference cubic , flux precision » 10"
t = 6 h
•%^
plane number
figure 2 - Variation gaps on axial power distributions t = 0 and t = 6 h
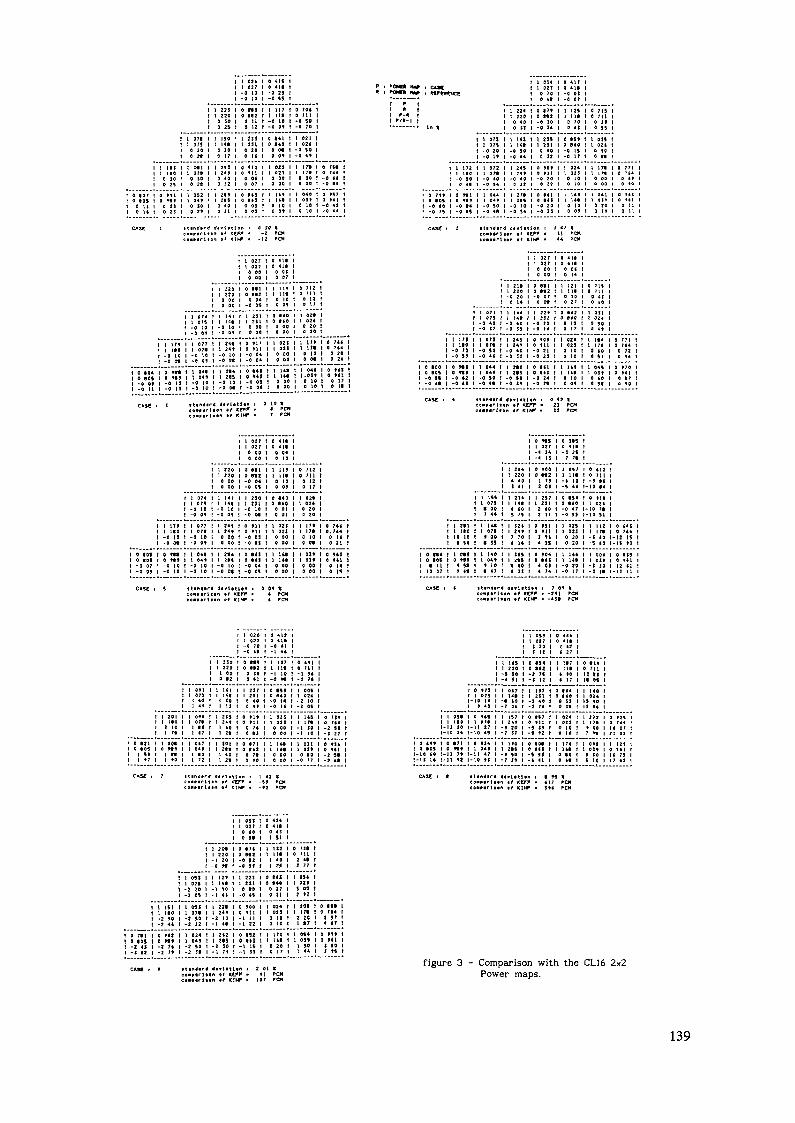
i t* i -o or1 221 I 0 ni 1 1 117 ! 4 704 11 220 I 0 8*2 t l II* I 0 711 10 SO | 0 U t -0 IB t -0 9» 10 2S t 0 12 I -0 0» t -0 70 t
1 0 »OSt 0 U1 0 1«
! 1 07« 1i i on i1 0 10 1t 0 2* 1
1 IM ! t 0*1 1
0 10 ' 0 SO !
0 »8» t l 04» '0 21 t 0 10 10 21 1 0 2» 1
) ISO1 14*
0 200 17
1 2SI
0 40
1 2flS0 400 9l
1 ÎJ!1 2110 200 It
0 »12
0 Of
0 0*10 OS0 01
1 0 tilt o «to1 9 0«( 0 9»
1 1 021
1 0 00
t i l t «t 0 10' 0 0»
t 1 021 1I 1 02* 11 -0 50 11 -0 4t 1
1 1 17» 1 0 7l*
1 D 00 t -0 4l
1 1 01* 1 0 f*l1 0 10 I -0 42| 0 10 1 -0 44
f
l
11
in*
1 1721 180-0 80
0 *•
• 0 7 » » 0 t * lI 0 »0% 0 t«»t -0 40 -0 *4t -0 75 -0 8S
t 1 22«: 1 0 17» 1 1 I2S 1 0 715
t 0 40 t -9 ÎO 1 0 70 1 0 II1 0 II 1 -0 S4 | 0 tf t 0 55
1 1 071 t 1 141 t 1 2!5 0 89t t 1 OIS1 I 073 1 1 14t 1 1 2S1 0 8*0 t l 02t1 -0 20 1 -0 SO 1 0 40 -0 15 1 0 tO
t 1 072 1 1 245 1 0 tD* 1 1 014 r 1 1 r*t 1 07* 1 1 24» 1 0 »11 t 1 021 1 1 1 r*t -0 *0 1 -0 40 1 -0 10 1 0 10 t 0 00
t 1 044 | | 278 ! 0 1(1 1 1 1*1 1 1 041t 1 04* | 1 21« t 0 **I 1 l U* t 1 Öltt -0 50 1 -0 19 I -0 20 I 0 10 t 0 201 -0 «8 l -0 S4 I -0 ÏS 1 0 Ot t 0 1t
o n\0 tt
o t*i0 M0 U
l 027 1 0 411 !l 017 t 0 411 lû oo i a ai l
l Z20 l 0 MI l l 11» l 0 712i 220 l o B« i i n« t o 7114 00 l 0 04. l 0 10 t 0 IIo oo l -o o* t o 01 i o u
l 017 ! 0 411 ll 027 l 0 4l« 1
0 00 1 0 04 t0 00 l 0 14 l
! l îli l 0 8*1 ! l 121 t 0 :l l 220 l 0 MI i l IH ! 0 ,l -o îo i -o or i o ID r o! OUI 0 0« t 0 U l 0
[ -O SI t -0 ÏS
l 21* t 0 «4Ï l l QI1l ÎJI t 0 840 t l 02«-a 20 i o n i o 50
t 0 1041 0 BÖS1 -0 Oft -0 11
1 17»l 1*0-0 10• o o*0 »t*0 t»)-0 11-0 11
! I 07T t 1 24«| 1 07* 1 1 24t| -0 10 1 -0 10[ -0 0» I -0 M
t 1 04t 1 1 2*41 l 04» 1 1 2«t -0 10 1 -0 10| -0 10 1 -0 0*
! 0 »l»t o int -0 04! -0 04
1 9 8*11 0 «411 -0 OSt -0 0(
1 1 02t1 l 021l 0 001 0 00
t 1 1t«! 1 1t«t 0 00t 0 00
: 1 17» t 0 74«t I U* t 0 7141 0 10 t 0 20! 0 0* t 0 2»
t 1 040 | 0 »41i i.oit i 9 ml D 10 I 0 17l 0 10 t 01*
l 171 l l ori l l 245 l 0 tf lt I l 024 t l 1*4 ll 184 l l 07« t l 14t l 0 tu l l 02S t l U« l-0 70 1 -0 SO l -0 40 l -0 2l l 0 10 t 9 tO l-0 5t l -0 4t | -o S2 l -0 21 l 0 10 l 0 «l |
0 MI t l 044 l l 2*0 l 0 *(1 l l lil t l 04t l0 **l t l D4t l l 2t» | 0 *lt I l 14* l l Ölt l-0 42 t -0 »0 t -0 10 i -0 14 t 0 10 l 0 10 l-0 41 f -0 4g I -0 l» l -0 2» ! 0 01 t 0 St l
0 00 t 0 04
l l 147 | l 210 l 0 1*0 l l 02*l t 14t l l 211 l 0 f l tO t l 024l -0 10 l -0 10 I 0 01 t 0 20l -8 01 i -0 0« f 0 01 1 82«
> MS t 0 1*5l 927 ! 0 4|«•4 14 l -Î 2)•4 IS I 7 7«
l 297 f 0 IS* l 0 Mil 211 t 0 «tO t l 02t
2 44 ! -0 47 1 - 1 0 7*2 11 I -0 S» I - J B 31
l 171 I I 077 l l 24t t 0 »11 I l 021 l l 17t l 0 744 tl ItO l l 679 \ l 24» t 0 «II l l 021 l l 17* l 0 .744 t-0 10 I -0 10 l 0 00 t -0 OJ ! 0 00 l 0 10 l OUt-0 0* l -0 0» l 0 00 t -0 01 I 0 00 t 0 0* l 0 21 !
a *** i i 04» i i 3ts i a 041-o 10 t -o 10 i -a 10 t -o 04-0 10 l -3 10 l -D 0« l -0 OS
o tos• 1110 or
l 2*1 f l IM t l J2t l 0 »Sl I l 029 l l l 12 1 0 (4tl ItO f t 078 l l 24» I 0 »11 ( I 021 l l m t 9 7*410 10 l f 00 1 7 70 I I t« ! 0 20 l -i 10 t-11 ISl S« l • ÎÏ I f l i t 4 IS 1 0 20 l -S (0 t - l S tO
l 0*S l l 1*0 l l US ( 0 t04 l l It4 l l 00t l 0 8tS0 «l t l 04» 1 l 2*§ ( 0 *4! l l IM I l Ölt l 0 »41
t M l t 10 l « 00 l * 01 t -0 20 l -Ï JO l 12 *1» i* l t tJ ! f 2t I 4 74 l -0 i; l -l l» f - 1 1 11
l 210 t 0 MS t l 107 l 0 *»ll 220 l 0 M2 l l 11* l 0 711
l 00 l 0 l* t -l 10 l -l «40 *2 l 0 4l l -0 *• l -Z 74
l l l*S t 0 854 t l 187 l 9 81) ll l 220 l 0 8*2 l l tl* l 0 711 1l -5 SO l -2 7l l ( 10 l II *| !
l 1*1 l l 217 l 0 •» l l 001 ll l*t l l 211 l 0 840 ! l 02« l
t 18 { 4 «0 i ~0 M f -Z 10 fl 11 t 0 4» f -0 l« l -2 OS I
1 0I 0
c
• 21• OSSlt7
ist i
l HO | 1 07* 1 1 24t2 10 1 1 tO t 1 tOi 7i i i t r i i n
1 00« t 1 Otr t 1 SOI0 t*» 1 1 04» | 1 2*1
1 8* 1 t 80 1 1 401 10 t 1 72 1 1 25
1 0 *1 1 t t 02S r1 0 7t t 0 00 1i o ai r o oo i1 0 t7l 1 1 14* 1t 0 1*1 1 l 14« 1t o 7t l o eg i1 0 »0 1 0 00 1
l its1 17»-1 10-1 10
1 OU1 Dt»-0 80-o r?
1 0 7l)1 0 7*41 -2 901 -S ZT
1 0 tl*t 0 ttl1 -2 S*1 -2 (*
1
t1
t
1
11
1 -4 11i o »7i i i o t r1-10 1t 1 -« 10t » 4J | -7 Di
1 180 t 1 078 1 1 24t12 20 l-ll 27 1 -» 2010 14 1-10 45 t -t ST
l -i 11 i t ir i i« «1 1 It7 t 0 t*4 | | 1401 -1 40 f 0 tl } }1 4«1 -1 74 1 0 J* 1 15 B*
1 4 fit 1 1 021 1 1 17*1 -9 I) t 0 10 1 » 401 -5 »2 t 0 10 1 7 *»
K 07 121 01 I
l 0 4»» l 0 »7l | 0 »14 l l 1*0 l 0 80« t l 171 ll 0 80S l 0 »«» l l 04» t l 2*9 l 0 ttl l l IM l1 - 1 0 10 l - l l 7* J - l i 47 t '* 90 l -9 II l 0 80 tt-11 14 l - l l 12 1 - 1 0 tl t -T I» 1 -t 4l | 0 M l
l Ölt t 0 424 ll 027 I 0 4 1 * l
0 tO t 0 il l0 S* l l Sl (
i i 20* i o *ri i t in i o nt it t 220 t 0 MZ t l 11* l 0 7|l tl -l ZO t -0 92 l l 40 l 2 (• tl -0 t* t -0 9» I l 29 l I Tl t
l 1S1 l l 091 t l 22* l 0 »00 l l 024 t l 20B l 0 •«• ll 1*0 l l 07* ! l Z«» l 0 111 l l 02J ! l 17« ! 0 714 l•2 »0 l -2 SO t -2 10 | -l ll l 0 19 l 7 20 l S S7 t-2 4* f -2 Ï2 I -l t* l -l 22 l 0 10 ! l »7 i 4 17 l
1
0 7*1D «OS
-I 02
o t*»-I 7t
( 1 Ü4t t 1 2« 1 0 ttt t 1 141 !
t -2 J« 1 -1 7» i -1 11 1 0 17 1
1 0541 011
1 44
1 0 »*»! 0 »tl
I I »4
f1
t
figure 3 - Comparison with the CL16 2x2Power maps.
139
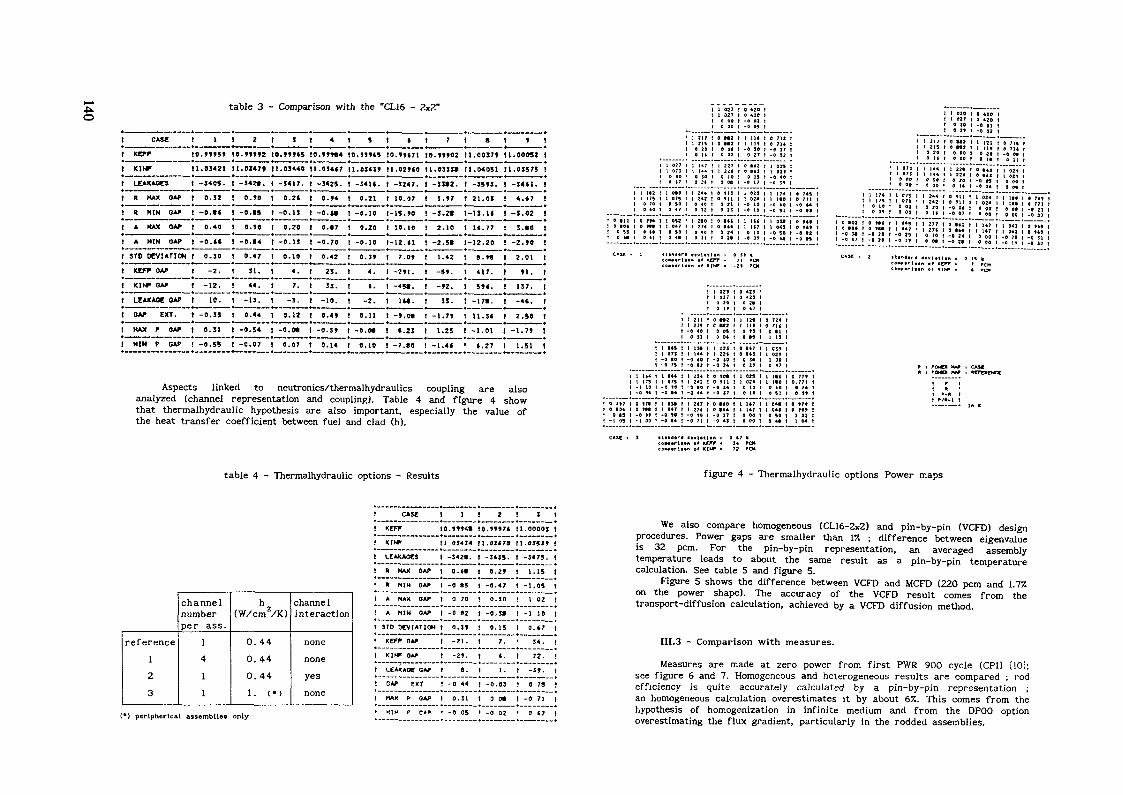
table 3 - Comparison with the "CL16 - 2x2"
!
t
t
1
!
!
1
!
!
1
1
!
I
I
1*>_
CASE
KCTF
Kit*
LEAKAGES
R MAX GAP
R HIN Off
A MAX DAP
A MIM OAP
STO DEVIATION
KCFT OAPKINF OAP
LEAKAGE SAP
OAP EXT.
MAX P SAP
MIN P GAP
! 1
10. »»»5»
II. 01421
1 -340!.
I 0.52
I -0.»«
I 0.40
1 -O.«t
1 0.30
! -2.
! -12.
I 10.
i -a.it1 0.51
! -O.SS
t 2
10. »»»*2
11.0347*
1 -142«.
1 O.»0
i -o.«s! O.*0
t -o.t«1 0.<7
f 11.
I 44.
t -U.
I 0.4«
1 -9. S«
1 -0.07
1 I
to.?»*»11.03440
1 -3417.
1 0.2«
1 -O.IS
! 0.20
! -0.13
t 0.10
I 4.
1 7.
! -3.
I 0.12
! -O.M
t 0.07
I 4
!0.*»*S4
1I.034<7
1 -3425.
I O.M
! -O.t»
! 0.«7
! -0.70
1 0.42
! 23.
1 33.
1 -10.
I 0.4V
1 -0-5»
I 0.14
1 5
10. ft»»
11.0343»
1 -141«.
1 0.21
1 -0.10
t 0.20
t -0.10
t 0.0»
t 4.
I 1.
1 -î.
1 0.11
t -0.0*
1 0.10
t tI0 .»»t71
l l .02»40
! -3247.
1 10.07
1-15.50
! 10.10
1-12. tl
t 7.0»
1 -2»1.
! -45».
1 1C«.
! -».0»
1 i. 21
! -7.80
t 7
10. »»»02
11.033»
1 -33*2.
1 l .»7
1 -S. 2«
1 2.10
t -2.51
! 1.42
1 -5».
1 -»2.
I 31.
1 -1.7»
1 1.25
! -1.4«
i S
11.0037»
M, 04051
t -35»3.
! 21.03
1-13. H
I lt. 77
i-12.20
! 8. t*
1 417.
! 5»«.
! -17*.
! 11.34
! -1.01
• ».Î7
1 »
11.00052
M. 03575
1 -34(1.
1 4.*7
1 -3.02
1 3.*0
! -2.»0
1 2.01
1 »1.
1 137.
I -4*.
1 2.50
! -1.7»
1 1.51
1
1
I
I
I
1
1
I
I
!
itiii
Aspects linked to neutronics/thermalhydraulics coupling are alsoanalyzed (channel representation and coupling). Table 4 and figure 4 showthat thermalhydraulic hypothesis are also important, especially the value ofthe heat transfer coefficient between fuel and clad (h).
1 0771 0710 «00 17
1 112 1 OtO1 1/5 I 075
0 70 0 500 40 047
1 0 10« 0 ttt 1 0*7I 0 55 0 *0 0 50t O t « D | | 0 4t
tttt
l 071 I•0 tO I-0 75 I
1 1(4 t 0(* t1 175 1 075 I-l 10 -0 to !
1 0 10« 0 ttt 1 0*7 1
COM »r It«
1 210 I0 1
1 141 I*
0 )o ;
1 241 2«0 40 3
1 Ï70 40 I
1 2111 215-0 40
-o to-0 SI
1 2141 Z*Z-0 90
1 17*
n •# KI
1 OU ! 0 420l 02.7 I 0 4200 00 t -0 02o oo t -a 05
0 «2 t 1 lit0 01 1 -0 100 07 I 0 27
1 227 1 0 It2t 22* t 0 0*1
0 10 1 0 150 M 1 -0 17
0 tll t 1 0210 111 I I OZ4
0 21 t -0 108 21 I -0 10
0 >*4 I 1 1(70 24 | 0 100 ZI ! -0 01
CTF . 2l PCXin* • -zt PCX
l OZ* ! 0 4ZJ '1 027 1 0 420 t0 20 l 0 2» !0 1t 1 0 *7 !
0 «2 1 1 12t t0 M2 1 1 11t 1
0 05 1 0 tO 1
I 22( t 0 «tl !-0 10 ! 0 S« !-0 24 l 0 λ t
0 tot 1 1 025 t0 tll t 1 OZ* t-0 J4 1 0 10 1
0 1*4 1 l 1*7 1
rr - n PO*
o ;u-0 17-0 52
1 0251 02t'0 40-0 It
1 1741 HO-0 10-U 51
1 041-0 50-0 *•
0 724 10 71* 1
0 tl 1
1 OZt 11 00 I0 17 |
1 lt( 11 ItO I
1 0«« 10 50 I
0 7*» i 17(0 771 | ,75-0*4 o 10-* *) o ot01*» t O 8 « 0 t i t0 »«* tO 80* 0 tU-« M 1 -0 ït -0 20-0 M l-o 47 -o 20
0 77»0.771• 7«
0 t«»1 01
1 07JI 07J0 000 00
l 07S1 07*0 000 00
1 0451 04;-0 20-0 1»
e»#tMi
1 2171 2150 20
1 1441 1440 000 00
1 2441 Z*Z
0 ZO0 li
1 2771 27*0 100 Ot
*n .0 XEon «t KI
f i FQME
tIt *
1 0101 0170 308 2t
0 M20 M2
0 00
1 22t1 II*0 100 1*
0 tll0 tll-0 0*-0 07
0 8*1
-0 24-0 2t
FF •
S K** i
P 1It •-* t
0 4200 420-0 01-0 03
1 1ZII lit0 20
0 tt>0 •*!-o n-0 Ot
1 024I OZ40 00U 00
1 1(7t 1*70 000 00
PCX
CASt«FCTCMC
" *
0 7154 71*'0 M
1 021l 02t0 000 0«
1 Itf • 7*1 1t» 0 7700« -| z0 00 -03
1 041 0 t*1 0*1 0 t*-0 ZO -0 1-0 n -o 3
X
table 4 - Thermalhydraulic options - Results figure 4 - Thermalhydraulic options Power maps
reference12
3
channelnumberper ass.
1
4
11
h2(W/cm /K)
0.440. 44
0 .44
1. (•)
channe 1interaction
nonenoneyesnone
(*) perlpherlcal assemblies only
! CASE
! KEFF
1 1 ) 2
10. »»»4* (0. »»»7»
1 I 1
11. 00003 1
KIN» 11 03434 11.01470 II
LCAKAO« | -342*. 1 -5435. I
0353» I
3475. (
A MAX OAP I O.t* t 0.2* !
» MIX OAP I -0 »5 I -0.47 I
1.15 t
• 1 . 0 5 t
A MAX OAP t 0 70 • 0.30 ;
A M1H OAP I -0 82 t -0.3* !
I 02.1 10
STO DEVIATION l O . S » l 0.15 l
KEFP OAP t -21. l 7. •
o.t;54.
KI«" OAP | -2». tLEAKAoe GAP t 8. l
OAP EXT ! -0 44 ] -0.03 !HAX p OAP l 0.31 t 00« lKIK' r c**> • -0 05 • -0 02 «
•0 71 l0 17 |
We also compare homogeneous (CL16-2x2) and pin-by-pin (VCFD) designprocedures. Power gaps are smaller than 17. ; difference between eigenvalueis 32 pcm. For the pin-by-pin representation, an averaged assemblytemperature leads to about the same result as a pin-by-pin temperaturecalculation. See table 5 and figure 5.
Figure 5 shows the difference between VCFD and MCFD (220 pcm and 1.77.on the power shape). The accuracy of the VCFD result comes from thetransport-diffusion calculation, achieved by a VCFD diffusion method.
III.3 - Comparison with measures.
Measures are made at zero power from first PWR 900 cycle (CPU [101;see figure 6 and 7. Homogeneous and heterogeneous results are compared ; rodefficiency is quite accurately calculated by a pin-by-pin representation ;an homogeneous calculation overestimates it by about 67.. This comes from thehypothesis of homogenization in infinite medium and from the DPOO optionoverestimating the flux gradient, particularly in the rodded assemblies.
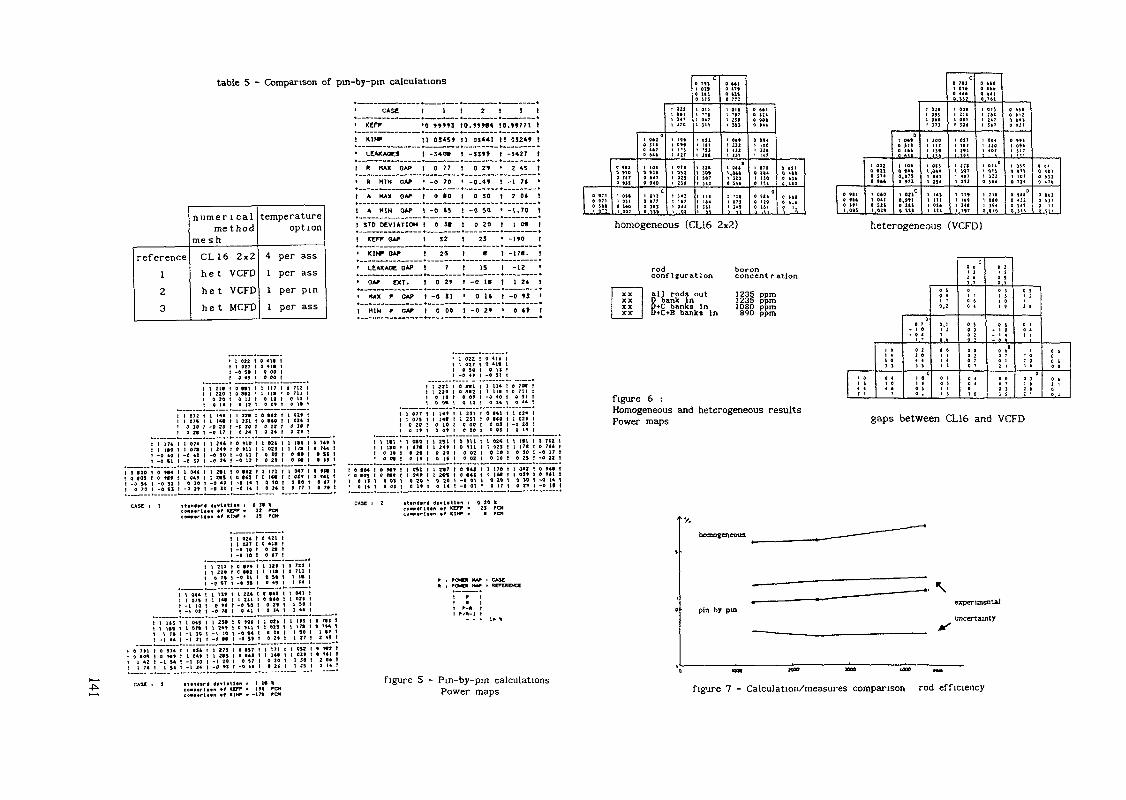
table 5 - Comparison of pm-by-pm calculations
reference
1Z3
numer i calmethod
meshCL16 2x2he t VCFD
he t VCFDhe t MCFD
temperatureoption
4 per ass1 per ass1 per pin1 per ass
.•!
•
1
.
1
1
!
•
•
•
.
1
CAS«
KtFF
KIW
LEAKAGES
ft MAX GAP
R HIN OAF
A MAX OAF
A HIM OAF
STO OtVIATIOM
KEFF OAF
K1NP OAF
LEAKAGE GAP
OAF EXT.
HAX P GAP
HIM P GAP
1
•0 V
1»MS
11 0545»
t -540*
1 0
• -0
1 0
1 -0
1 0
11!
! 0
>7
70
*0
»5
Jt
52
25
7
2»
1 -0 SI
1 0 00
1
10. »1
2 ! i>»«« 10. «771
11 05«!
i -m»1 0
• -0
1 0
1 -0
t 0
2»
.4»
50
SO
20
I 25
1
1
Il 0324» !
1 -5«27
• 2
! -1
1 2
• -1
1 1
«5
7t
Ot
.70
Ofl
• -HO
1
1•
t
t
1
1
1 « 1 -17«. !
I
1 -0
• 0
1 -0
IS
1«
U
2»
1 -
1 1
1 -0
' 0
U
λ
»5t»
•
1
•î
homogeneous (CL16 2x2) heterogeneous (VCFD)
XXXXXXXX
rodconfiguration
al 1 rods out0 bank InD+C banks InD+C+B banks In
boronconcent r
1235 ppm1235 pprn1080 ppm890 ppm
I 0721 0750 IP0 2t
1 174 1 0741 It« 1 07t-0 tft -0 40-0 51 -0 17
1 0 toe 0 W4 1 04t! 0 «05 Of« I 04»1 -0 5* -0 52 0 10I 0 70 -0 41 -0 2t
1 ZI«i no0 14
1 1441 14«-p ZO-0 17
1 24«1 24*-0 10-6 24
1 Z*lI 2W-0 «0-0 1t
C M ew.M*«n »î Ù
-1 02
t t It« i «7*
! -1 *« -1 21
t 1 7t 1 1 5t -11«
« 19-0 5Ï
-0 7«
l Z4*-1 10-ö t«
1 2711 Z»-t zo-0 tt
-0 5t t 0 000 41 t 0 00
0 Ml I 1 1170 WZ ' 1 11«
0 12 t 00*
1 22t t 0 t«1 211 t 0 ttO-D 39 I P ZZ
0 24 1 0 Z»
0 110 1 1 02t0 tlt 1 1 021-0 1t t 01«-0 12 t 0 2»
0 •*! t 1 1710 t« t t 14*-0 14 1 0 30-0 14 1 0 2<
rff m 52 PC*t* . H r-0
1 OZ< t 0 42t1 027 I 0 41t-0 10 1 02«-0 10 1 0 17
B «7* t 1 U»0 «t2 1 1 >tt-ft 11 1 ft «-0 »! 0 45
1 22* I 9 • •»1 211 I 0 «4Û-0 SO 1 0 2*
0 41 1 0 34
0 tot 1 1 02t9 J\\ 1 1 023
-0 5* t 0 2»
0 M7 ! l 1710 Ifl t 1 1t«
0 57 1 0 SO
0 7120 711
0 110 1»
1 Ölt1 OZt0 JP0 Z»
1 lt<1 17«0 «00 M
l 047t «*
0 t»0 77
t 1 221t t Z201 0 10
1 077 1 1 14*I 075 1 1 14«0 20 t 0 100 I* 1 0 At
0 7tt 1 Itl 1 MO t 1 251t 7t4 1 ItO 1 07» t 1 24*
« SI 0 ig 0 20 1 0 20g i) 00« 0 19 I 0 1*
• »U tO 104 0 M* 1 «l 1 1 2*7tt Hl ' 0 «<ft 3 f*f 1 94t t 1 2«S
0 «7 t 0 II 0 01 0 ZO ! 0 ZOt jt • e u o oi o i* i o u
CASC i Z itindii-4 divlit
1 022 t 0 41f1 027 ! 0 «1«
0 50 I 0 U-0 4* t -0 11
0 **1 t 1 1140 ««2 t 1 111
0 Ot t -0 40
1 211 1 0 Itl1 ZIt 1 0 8(0
Q 00 t 0 910 00 1 0 01
0 »11 t l 0240 tll 1 t 021
0 02 1 0 100 OZ 1 0 10
a itj t i 1704 *«I t 1 !**-0 01 1 0 20-0 Ot ' 0 17
en i 0 20 k
9 70«O 71)
4 51
1 0241 02t-q 20
0 1t
1 Ifl1 17*0 100 25
1 0431 05t0 100 Z9
cp>»*clt«n ff KErT • ZI rot
0 721
1 4t
l 041
1 50
1 1*1
1 OÏ2
r i OMM HAT i CAMK ! OMO HAT ) RCFClDd
—————— *
07«! - . . ! • . *
• m
-0 tt 1 0 2t 1 25 3 1*
0 7«0 7*4-0 17-0 ZZ
0 ttt4 ttl-0 14-0 19
co-»trii»n ff «rT • t« 'C* P/ïW^r m ânec0.,.ri.*r, «f KI* - -17» rc* rQVfQT ITiapS
figure 6 :Homogeneous and heterogeneous resultsPower maps gaps between CL16 and VCFD
pin by pinexpérimentai
uncertainty
MM iOOO
figure 7 - Calculation/measures comparison rod efficiency

- Conclusion
Our calculational method for PWR reactor is based on the computationalsystem SAPHYR : APOLLO, CRONOS and FLICA codes. Among all its possibilitieswe define a design procedure currently used to study PWR. Its scope extendsto the entire normal operation of reactors and accidental situations.Without any external fit, these tools can be used to obtain references or beintroduced in industrial procedures.
REFERENCES
[11
[21
13}
[4]
[5]
[6]
[7]
[81
J. OLIVERIElaboration d'un schéma de calcul des REP qualifié sur lesexpériences ,de démarrage des réacteurs du type CP1.Thèse de 3eme cycle, université Paris XI Orsay
G. MATHONNIERE - Z. STANKOVSKIThe APOLL01 Assembly Spectrum Code
this meeting
J.-J. LAUTARD - S. LOUBIERE - C. FEDON-MAGNAUDCRONOS : a Modular Computational System for Neutronic CoreCalculation
this meeting
G. MATHONNIEREBibliothèque neutronique à nombre restreint pour le calculdes réacteurs à eau.Thèse de 3eme cycle. Université Paris XI Orsay, Octobre 1980
J. MONDOTMise en œuvre de méthodes pour le calcul des poisonsconsommables dans les réacteurs à eauProc. IAEA Specialists Meeting on Homogénéisation Methods inReactor Physics Lugano, Nov. 1978
A. HEBERTDéveloppement de la méthode SPH : homogénéisation de cellulesdans un réseau non uniforme et calcul des paramètres deréflecteurThèse de doctorat d'Etat, Paris XI, Orsay
V. BRUN - B. CHANARON - J.-M. DUBOISReactor Calculation Multigroup Parametred Libraries
this meeting
P. RAYMONDFLICA IV : a Computer Code for Multidimensional ThermalAnalysis of Nuclear Reactor CoreInternational Topical Meeting on Advances in Reactor Physics,Mathematics and Computation Paris, 19&7
[9] G. MATHONNIEREEtude de problèmes neutroniques liés à la présence du Xénondans les réacteurs à eau pressuriséeThèse de doctorat d'Etat, Paris XI, Orsay
[10] C. MARTIN DEL CAMPOContribution à l'élaboration du schéma de calcul neutroniquedes réacteurs à eau sous pressionThèse de 3eme cycle. Université Paris XI Orsay, Janvier 1987

PHYSICAL CHARACTERISTICS OF THE CORE OFNUCLEAR DISTRICT HEATING PLANTS
V.S. KUUL', O.B. SAMOJLOVExperimental Machine Building Design Bureau,Gorki, Union of Soviet Socialist Republics
Abstract
Hie main principles of designing the nuclear districtheating plant (NDHP) reactor core are formulated. The coreneutron-physical characteristics are given. The results ofexperimental verification of design decisions using the fuelcassettes' model assemblies as well as the main results offull-scale core tests are presented.
I. Main Statements
Nuclear district heating plants (NDHPs) reactor unitsdesigned with account of siting ia the vicinity of largecities and necessity of providing a qualitatively higher safetylevai in comparison with NPP. The adopted concept of the NDHPreactor plant safety includes engineering decisions allowingto classify it among enhanced safety systems. These decisions,as applied to the core, include;
- low power density of core and fuel;- use of all-conditions' natural circulation of the cool-
ant in the reactor;- absence of boron in moderator and compensation of excessreactivity margin only by mechanically moved absorbers;
- selection of relatively low reactor coolant parameters,determining the quiet run of accidents with reactor cir-cuit loss of tightness;
- low fuel temperature;- use of materials and decisions shown a good performance
in the domestic practice of reactor engineering;- use of the enlarged diameter ( ~15.6 mm) fuel elementin the core allowing (besides design-technological ad-vantages) to improve the neutrons' balance in the core;
- use of burnable absorber for compensation of part ofcore reactivity margin;
- use of core profiling along its height by burnable ab-sorber for equalling the energy releases;
- small fuel swelling and reduced gaseous fission productsrelease at fuel burnup depth adopted in the NDHP.
2. Main Core Heat Engineering Characteristics
The NDHP reactor core is located inside the reactor vesselin its lower part. The core consists of hexahedral cassettes(fuel elements' assemblies) with 2J8 mm across flats formingtriangular lattice with 24-1 mm pitch. The cassettes are spacedby a lower plate and a holddown block plate in which holes thecassettes' ends enter. The core contains 121 cassette. Thecore cooling down is provided by natural reactor coolant circu-lation.
The cassettes include individual chimneys which are ex-tensions of core fuel assemblies and allow to provide

TABLE 1. HEAT ENGINEERING CHARACTERISTICS OF CORE AND CIRCULATIONCIRCUIT
ParameterCore power outputCore power densityAverage linear fuel elements'heat rating
Coolant parameters- pressure- inlet temperature- outlet temperature
Coolant flowrateAverage velocity of coolant flowin cassette
Units
MWkW/L
W/cmMPa°C°Ct/hrm/s
Value50027.4
972.01302085.500
0.7
in the natural circulation conditions the hydraulic coolantflowrate profiling in the cassettes according to their thermaloutput.
For technically feasible reactor vessel sizes such coolantvelocities in the core cassettes and in the built-in heat ex-changer are realized, that provide high intensity of heat trans-fer.
3. Core Neutron-Riysical CharacteristicsThe NDHP reactor cassette contains a bundle of 13.6 mm
diameter fuel elements inclosed in of 1.5 mm enclosed hexa-hedral zirconium jactcet, upper and lower head closures.
The bundle is attached to lower head closure by meansof steel support grid. The elements' spacing is achieved
by 6 intermediate spacing grids placed uniformly along theelements and placed on a central bundle tube, and by an upperend grid.
The fuel element ia made of 13.6 x 0.9 mm of zirconiumalloy and is filled with sintered uranium dioxide pellets.
For reactor power control there is a regulator in eachcassette (except for the central one). It consists of 18 movableabsorbing rods, united by a common cross-piece. The rods arelocated in 17.8 x 0.9 Jim zirconium guide tubes spaced in thebundle together with fuel elements.
The absorber rod represents a 12.5 x 1.2 mm stainless steeltube filled with boron oxide.
The cassette cartogram is shown in Pig. 1. For partialcompensation of reactivity margin for burnup and for power shapingalong the core height the rods with burnable poison areinstalled in the cassettes instead of 6 fuel elements. They re-present 13.6 x 0.9 mm zirconium alloy tube filled withnatural boron in aluminium matrix.
Special measuring probes are provided for control ofcore neutron-physical and thermal-engineering parameters.To this aim instead of one fuel element the 13«6 x 0.9 aimzirconium guide tube is installed in the cassettes which tubeserves for locating the probe containing thermal transducers.and neutron flux sensors.
Core cartogram is given in Fig. 2.The movable absorber rods from 3 or 4 cassettes are
combined and form a control and protection system (CJPS) control

Xoxoxox®x©xoxoxq=^SA$ftftPUr UrKO><OXO'
r )
— central tube
- follower for CPS absorber rods
— tube for in-reactor control probe
- burnable absorber rods
~ fuel element
member. This system functions as an emergency protection,compensates the excess reactivity necessary for providingthe required fuel life, changes reactivity during reactor powercontrol.
Core physical characteristics are given in Table 2.
TABLE 2. CORE PHYSICAL CHARACTERISTICS
Parameter
Core diameter
Core height
Core power density
Fuel power density
Uranium loading
First core:
First core cycle duration
Number of cassettes in the core
with 1.0S6 enrichmentwith 1.6$ enrichmentwith 2ye enrichment
Maximum coefficient of energyrelease non-uniformity
in the core cassettes atnominal poweralong the core height
Maximum linear heat ratingof fuel elements
Units
m
W/L
kW/kg
t
eff.day
W-cm -1
Value
2.8
5.0
2?
10
4-9.0
4-30
4-25524-
1.281.8
254-FIG. 1. Cassette cartogram.

TABLE 2. (cont.)
Parameter Units Value
Reactivity margin of cold firstcore % 6.9
Reactivity margin for fuel burnup(without burnable poisons) % 1.6
Reactivity margin for burnup com- %pensated by burnable poison(burnable poison rods worth) % 4.4
Temperature effect % -1.4
Power effect % -1.6
Effect of reactor poisoningby Xe-155 % -2.5
Worth of all control rods % 20
Steady-state regime of partial reloadings
Fresh cassettes enrichment % 1.6;2.0
Fuel life time duration year 6-8
Fuel burnup in steady stateoperation regime at:
- 3-fold reloadings MW . d 15 000
t Ü- 4—fold reloadinga - - 19-100
4-. Experiments on Model Assemblies
Core neutron-physical characteristics were calculated
using a code package developed for WEE reactor cores with modi-
fied thermal-physical block accounting for the peculiarities
of heat exchange under the natural coolant circulation condi-
tions.
cassette with 2.035 enrichment
>- .cassette with 1.6S& enrichment
> — cassette with 1 . OS6 enrichment
compensating group number
FIG. 2. Cartogram of the first core loading (combining the CPS members into compensatinggroups).
The investigations of neutron-physical characteristics
of MDHP cassettes' model assemblies in "cold" and "hot" condi-
tion? were performed for verification of the code package as
applied to NDHP cores, as well as for experimental verification
of separate design decisions.
The experimental assembly cartogram is given in Fig. 5.
The investigations of neutron-physical characteristics
were performed on the critical facilities enabling the experi-
ments with moderator level changes and boric acid reactivity

cassette with 2 <3f> enrichment
>~ cassette with 1.656 enrichment
FIG 3 Experimental assembly cartogram
compensation in "cold" state, as well as measurements duringheating up and at real core operating parameters.
The investigations performed can be divided into thefollowing main groups:
1. Experiments on determining the parameters of criticalstates, as well as differential and integral reactivity aspects.
2. Activation experiments for determination of power dis-tribution fields.
J. Experimental studies to assure core subcnticalityin the state with maximum multiplication factor at the mosteffective OPS member stuck in the upper position.
The analysis of a large number of critical experimentsdifferent in composition of experimental assemblies, tempera-ture conditions, modelling the composition of standard core,showed the stability of calculated values of the effectivemultiplication factor for the systems under study. The effectivemultiplication factor calculation values for critical states
1,0
2,0
50 100I . ISOI - 200__!_T, °C
§*.
I - full-scale core£ - model assembly (experiment)3 - model assembly (calculation)
FIG 4 Model assembly and full-scale core temperature reactivity effect
falling in the narrow enough range ( K ff = 1 ± 0.005) wereused in the standard core design calculations.
In the experiments modelling the core heating up to opera-ting temperatures, the reactivity temperature effect value, aswell as the values of reactivity coefficients versus moderatortemperature were obtained.
The model assembly reactivity change with temperature andthe similar change obtained on its basis for full-scale coreare depicted in Fig. 4-.
The analysis of the "hot" activation experimentsenabled receiving the information on the accuracy of relativecassettes' power calculations (See Pig. 5). The maximum differencein calculation and exoerimental values does not exceed ~5%.
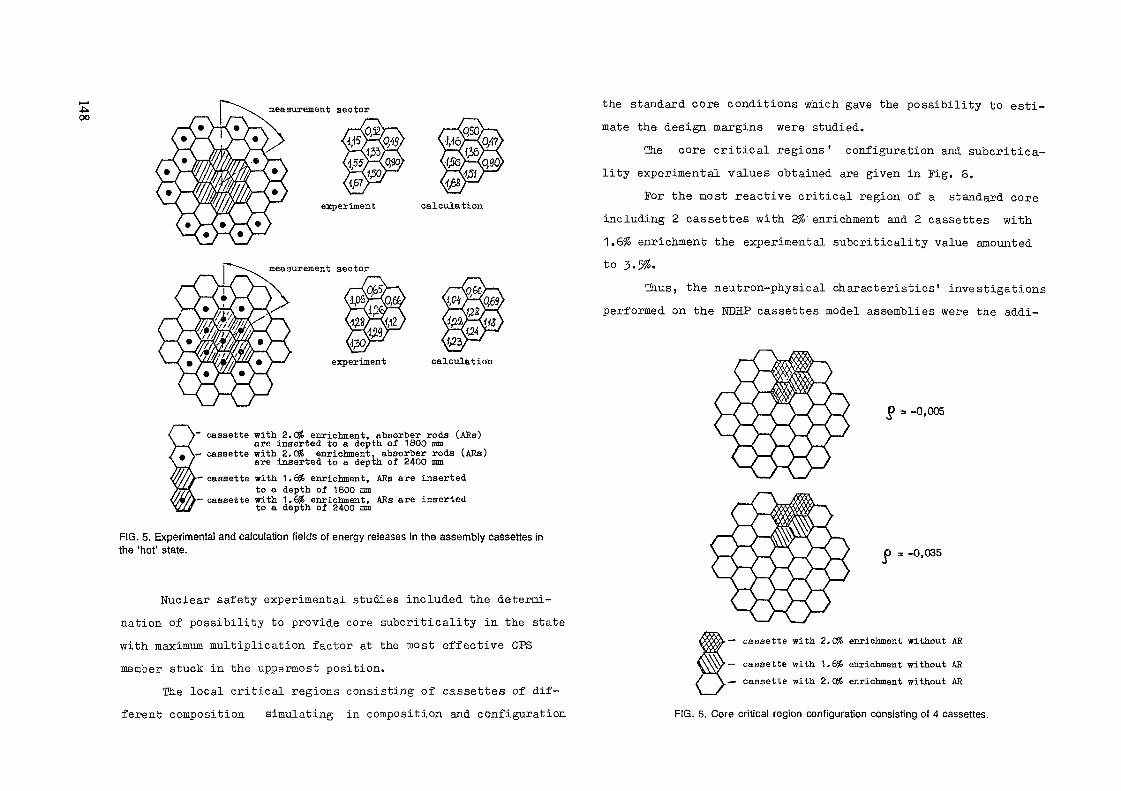
COmeasurement sector
calculation
leasurement sector
calculation
V" cassette with 2.0& enrichment, absorber rods (Afis)are inserted to a depth of 1800 mm
V- cassette with 2.056 enrichment, absorber rods (ARs)are Inserted to a depth of 2400 mm
^~ cassette with 1.656 enrichment, ARs are insertedto a depth of 1800 mm
^cassette with 1.6S6 enrichment, ARs are insertedto a depth of 2400 mm
FIG. 5. Experimental and calculation fields of energy releases in the assembly cassettes inthe 'hot' state.
Nuclear safety experimental studies included the determi-nation of possibility to provide core subcriticality in the statewith maximum multiplication factor at the most effective CPSmember stuck in the uppermost position.
The local critical regions consisting of cassettes of dif-ferent composition simulating in composition and configuration
the standard core conditions which gave the possibility to esti-mate the design margins were studied.
The core critical regions' configuration and subcritica-lity experimental values obtained are given in Pig. 6.
For the most reactive critical region of a standard coreincluding 2 cassettes with 2%' enrichment and 2 cassettes with1.6% enrichment the experimental subcriticality value amountedto 5.5$.
Thus, the neutron-physical characteristics' investigationsperformed on the NDEU? cassettes model assemblies were the addi-
-0,005
O = -0,035
> — cassette with 2.0% enrichment without AR
\\V/ — cassette with 1.6% enrichment without AR
^— cassette with 2.CfH> enrichment without AR
FIG. 6. Core critical region configuration consisting of 4 cassettes.

tional source for verification WER code package allowed tosubstantiate the possibility of using it as applied to NDHPreactors, as well as to prove by experiment a number of full-scalecore design characteristics.
5. Full-Scale Core Tests
The experimental investigations of neutron-physical charac-characteristics of the first standard core were performed onthe full-scale critical facility.
The experimental determination of the core reactivitymargin, OPS members' startup positions and their differentialeffectiveness, emergency protection effectiveness, as well asthe verification of fulfilling the requirements on nuclearsafety were the objectives of fche tests.
.Physical non-identity of each cassette was determinedby experiments at the initial tests using high-sensitive criticalassembly.
The maximum differences in multiplication properties ofthe cassettes with 1.655 and 2.0 enrichment was 0.1%, with 1.0%enrichment - 0.3%. Measurement results were used for the sub-sequent core buildup and flattening of energy releases distribu-tion along the core radius and azimuth.
During the experiments the major core characteristics -reactivity margin with withdrawn OPS menbers in the "cold" statewas determined which agreed with design value.
The confirmation of the core energy releases absence ofnon-uniformity was one of the important results of the activationexperiments.
During the core tests the effectiveness of each of 120individual control rods, as well as the effectiveness of standardCPS members were determined.
The measurements results testify to the clusters physicalidentity and confirm the core azimuth uniformity.
Compensating groups' effectiveness was determined at theirsequential insertion into the core at actuation by emergencyprotection signals.
The results obtained were compared with the design data(see Table 3).
TABLE 3
Number of compensatinggroups immersed intocore (groups' numbers)
Effectiveness of compensatinggroups immersed into core, %experiment calculation
1 (no. 2)2 (no. 2; no. 6)3 (no.2; no. 6; no. 1)4 (no.2; no. 6; no. 1;no. 3)
2.44.65.5
6.0
2.34.25.4
6.1
During the tests the characteristics important for the sub-sequent core operation were determined.
They include:- determination of OPS members' critical positions in the
core) differential effectiveness of movable members, as well asexperimental verification of standard algorithm of transitionto critical state including the investigation of present neutron
t/loflux controllability during transition of the reactor to critical
state.
CChe core subcriticality values obtained at the most effective
CK3 members stuck in the uppermost position.
Thus, the calculation-experimental investigations performed
allowed to verify reliably the main neutron-physical characteristics
of the NDHP pilot units' core.
DESCRIPTION AND VALIDATION OF AN APPROXIMATECOARSE MESH SOLUTION METHOD FOR THEDIFFUSION EQUATION IN RZ GEOMETRY
A.Z. TANKER, E. TANKERTurkish Atomic Energy Authority,Ankara, Turkey
AbstractA coarse mesh method based on a nodal method in which the
transverse—integrated flux is assumed to have a quadratic shapecorrected with discontinuity factors is described and evaluated in thisstudy. The quadratic is required to yield the volume—averaged flux whenaveraged over its argument and to yield the face—averaged net currentswhen Pick's Law is applied to it at the nodal interfaces, and itscoefficients are determined accordingly. The quadratic is evaluated atthe nodal interfaces and the resulting relation is corrected byintroducing a discontinuity factor for each face of the node in eachenergy group.
The equations corrected by discontinuity factors have thecapability of reproducing a reference exactly. In routine calculationsfor which a reference case will not be available, even approximatevalues for these factors can improve the calculation speed considerablyby reducing the number of unknowns.
In the approximate method evaluated in this study thediscontinuity factors for 2—D coar-se mesh problems are found from l—Dfine mesh calculations. Comparisons with finite difference referencecalculations indicate that, for coarse mesh layouts consisting of onlya few nodes, this method is faster by a factor of 3 than a fine meshfinite difference calculation of comparable accuracy (about 1% error ink ^, and about a maximum error (located at a node producing an insigni-ficant fraction of the total power) of i&7. in nodal powers). Thismethod is found applicable to quick survey type calculations that canbe performed on a microcomputer.
INTRODUCTIONNodal methods present fast and accurate means of calculating the
global properties of nuclear reactors such as k and powerdistribution. The main goal of these methods is to use coarser meshesthan conventional finite difference schemes without loosing accuracy.
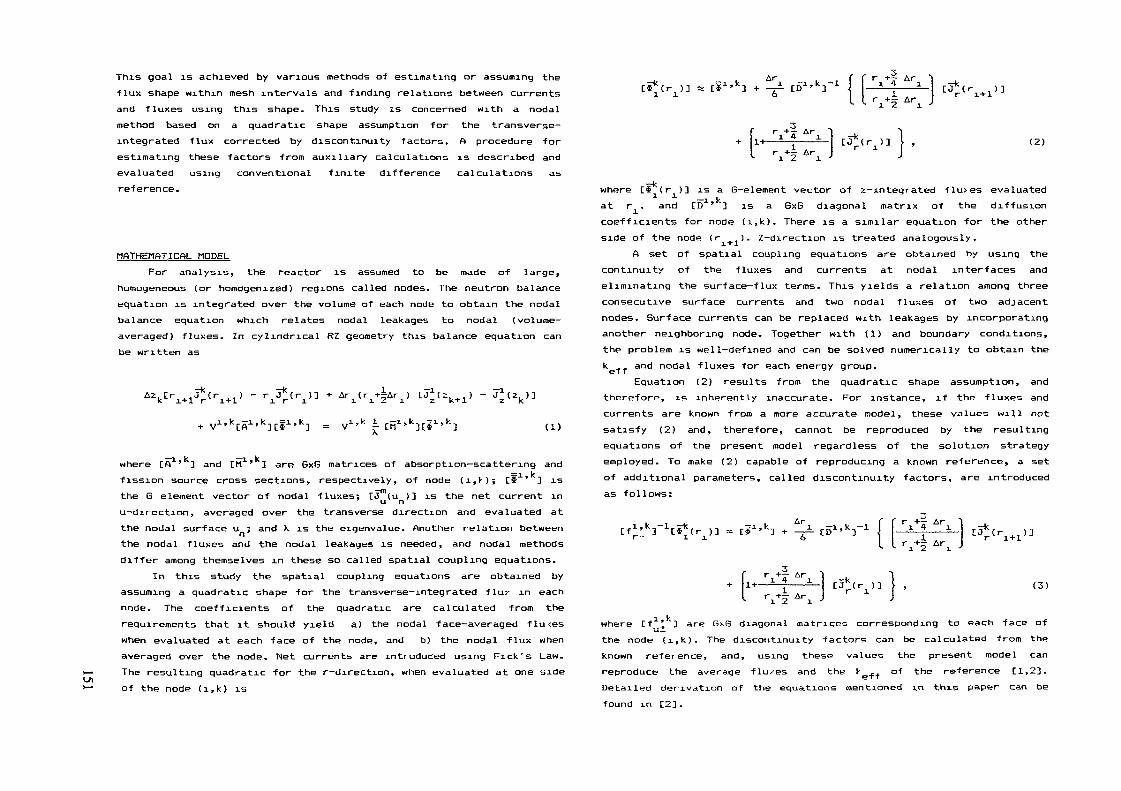
This goal is achieved by various methods of estimating or assuming theflux shape within mesh intervals and finding relations between currentsand fluxes using this shape. This study is concerned with a nodalmethod based on a quadratic shape assumption for the transverse-integrated flux corrected by discontinuity factors. A procedure forestimating these factors from auxiliary calculations is described andevaluated using conventional finite difference calculations asreference.
MATHEMATICAL MODELFor analysis, the reactor is assumed to be made of large,
homogeneous (or homogenized) regions called nodes. The neutron balanceequation is integrated over the volume of each node to obtain the nodalbalance equation which relates nodal leakages to nodal (volume-averaged) fluxes. In cylindrical RZ geometry this balance equation canbe written as
[$
(1)
_ , %>'
_ , _ , >where Cft ' ] and CM ' 3 are BxS matrices of absorption— scattering andfission source cross sections, respectively, of node (1,10; C$ ' 3 isthe S element vector of nodal -fluxes; [J (u )3 is the net current inu— direction, averaged over the transverse direction and evaluated atthe nodal surface u ; and X is the eigenvalue. Another relation betweenthe nodal fluxes and the nodal leakages is needed, and nodal methodsdiffer among themselves in these so called spatial coupling equations.
In this study the spatial coupling equations are obtained byassuming a quadratic shape for the transverse— integrated flux in eachnode. The coefficients of the quadratic are calculated from therequirements that it should yield a) the nodal face— averaged flu<eswhen evaluated at each face of the node, and b) the nodal flux whenaveraged over the node. Net currents are introduced using Pick's Law.The resulting quadratic for the r-direction, when evaluated at one sideof the node (i,k) is
f r -! Ar ^ _t l 4 i l —k[T T-J »;«* )3
(2)
_ i.where Cs£*(r )3 is a 6-element vector of z~ integrated flu>es evaluatedat r . and CD ' ~3 is a SxB diagonal matrix of the diffusioncoefficients for node d,k). There is a similar equation for the otherside of the node (r +,)- Z-direction is treated analogously.
A set of spatial coupling equations are obtained by using thecontinuity of the fluxes and currents at nodal interfaces andeliminating the surface— flux terms. This yields a relation among threeconsecutive surface currents and two nodal fluxes of two adjacentnodes. Surface currents can be replaced with leakages by incorporatinganother neighboring node. Together with (1) and boundary conditions,the problem is well-defined and can be solved numerically to obtain thek and nodal fluxes for each energy group.
Equation (2) results from the quadratic shape assumption, andtherefore, is inherently inaccurate. For instance, if the fluxes andcurrents are known from a more accurate model, these values will notsatisfy (2) and, therefore, cannot be reproduced by the resultingequations of the present model regardless of the solution strategyemployed. To make (2) capable of reproducing a known reference, a setof additional parameters, called discontinuity factors, are introducedas follows:
Ar
(3)
i kwhere [f ^."3 are BxB diagonal matrices corresponding to each face ofthe node (i,k). The discontinuity factors can be calculated from theknown reference, and, using these values the present model canreproduce the average fluxes and the k ,, of the reference Cl,23.Detailed derivation of the equations mentioned xn this paper can befound in C23 .
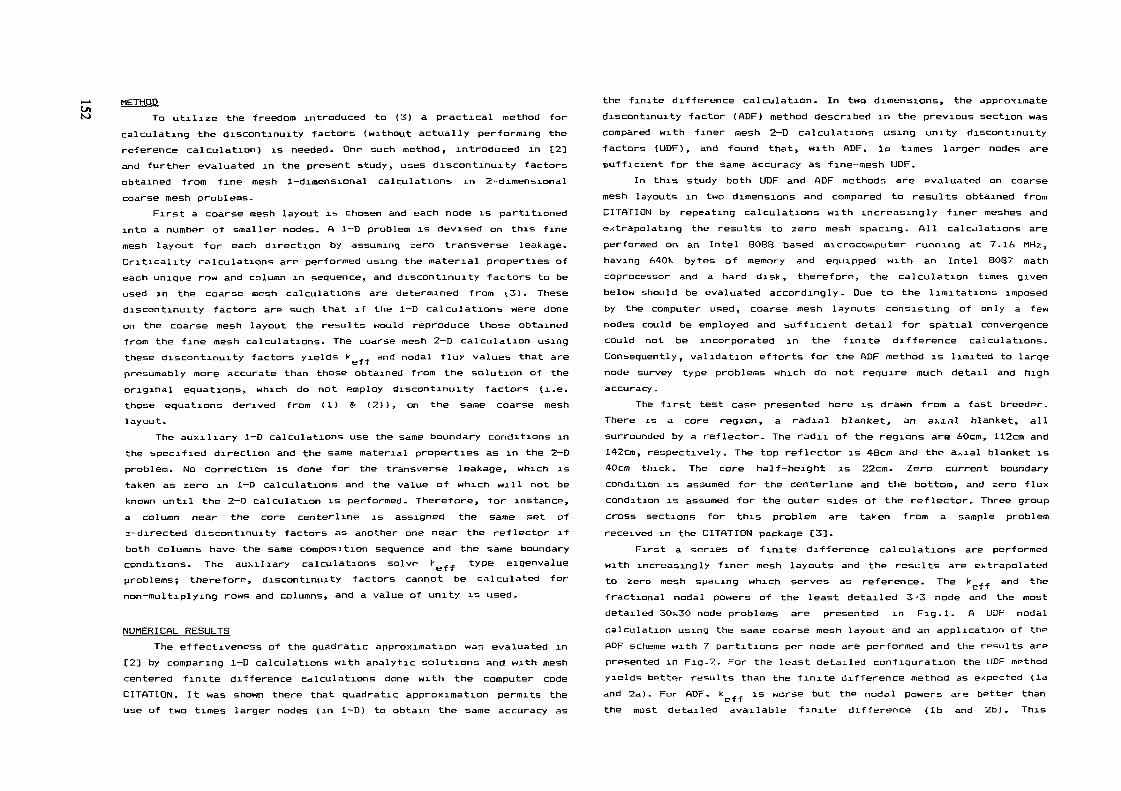
I/INJMETHDD
To utilize the freedom introduced to (3) a practical method forcalculating the discontinuity factors (without actually performing thereference calculation) is needed. One such method, introduced in [23and further evaluated in the present study, uses discontinuity factorsobtained from fine mesh 1-dimensional calculations in 2-dimensionalcoarse mesh problems-
First a coarse mesh layout is chosen and each node is partitionedinto a number of smaller nodes. A l—D problem is devised on this finemesh layout for each direction by assuming zero transverse leakage.Criticality calculations are performed using the material properties ofeach unique row and column in sequence, and discontinuity factors to beused in the coarse mesh calculations are determined from i3). Thesediscontinuity factors are such that if the l—D calculations were doneon the coarse mesh layout the results would reproduce those obtainedfrom the fine mesh calculations. The coarse mesh 2—D calculation usingthese discontinuity factors yields k and nodal flux values that arepresumably more accurate than those obtained from the solution of theoriginal equations, which do not employ discontinuity factors (i.e.those equations derived from (1) 8- (2)), on the same coarse meshlayout.
The auxiliary 1-D calculations use the same boundary conditions inthe specified direction and the same material properties as in the 2-Dproblem. No correction is done for the transverse leakage, which istaken as zero in 1-D calculations and the value of which will not beknown until the 2—D calculation is performed. Therefore, for instance,a column near the core center line is assigned the same set ofz—directed discontinuity factors as another one near the reflector ifboth columns have the same composition sequence and the same boundaryconditions. The auxiliary calculations solve *e^f type eigenvalueproblems; therefore, discontinuity factors cannot be calculated fornon-multiplying rows and columns, and a value of unity is used.
NUMERICAL RESULTSThe effectiveness of the quadratic approximation was evaluated in
[23 by comparing l—D calculations with analytic solutions and with meshcentered finite difference calculations done with the computer codeCITATION. It was shown there that quadratic approximation permits theuse of two times larger nodes (in 1-D) to obtain the same accuracy as
the finite difference calculation. In two dimensions, the approximatediscontinuity factor (ADF) method described in the previous section wascompared with finer mesh 2-D calculations using unity discontinuityfactors (UDF), and found that, with ADF, lo times larger nodes aresufficient for the same accuracy as fine-mesh DDF.
In this study both UDF and ADF methods are evaluated on coarsemesh layouts in two dimensions and compared to results obtained fromCITATION by repeating calculations with increasingly finer meshes andextrapolating the results to zero mesh spacing. All calculations areperformed on an Intel 8O88 based microcomputer running at 7.16 MHz,having 640K. bytes of memory and equipped with an Intel 8087 mathcoprocessor and a hard disk, therefore, the calculation times givenbelow should be evaluated accordingly. Due to the limitations imposedby the computer used, coarse mesh layouts consisting of only a fewnodes could be employed and sufficient detail for spatial convergencecould not be incorporated in the finite difference calculations.Consequently, validation efforts for the ADF method is limited to largenode survey type problems which do not require much detail and highaccuracy.
The first test case presented here is drawn from a fast breeder.There is a core region, a radial blanket, an axial blanket, allsurrounded by a reflector. The radii of the regions are 60cm, 112cm and142cm, respectively. The top reflector is 48cm and the a^ial blanket is40cm thick. The core half—height is 22cm. Zero current boundarycondition is assumed for the centerline and the bottom, and zero fluxcondition is assumed for the outer sides of the reflector. Three groupcross sections for this problem are taken from a sample problemreceived in the CITATION package [3].
First a series of finite difference calculations are performedwith increasingly finer mesh layouts and the results are extrapolatedto zero mesh spacing which serves as reference. The k ,_ and thefractional nodal powers of the least detailed 3 '3 node and the mostdetailed 30x30 node problems are presented in Fig.l. A UDF nodalcalculation using the same coarse mesh layout and an application of theADF scheme with 7 partitions per node are performed and the results arepresented in Fig.2. For the least detailed configuration the UDF methodyields better results than the finite difference method as expected (laand 2a). For ADF, k ,, is worse but the nodal powers are better thanef fthe most detailed available finite difference (Ib and 2b). This
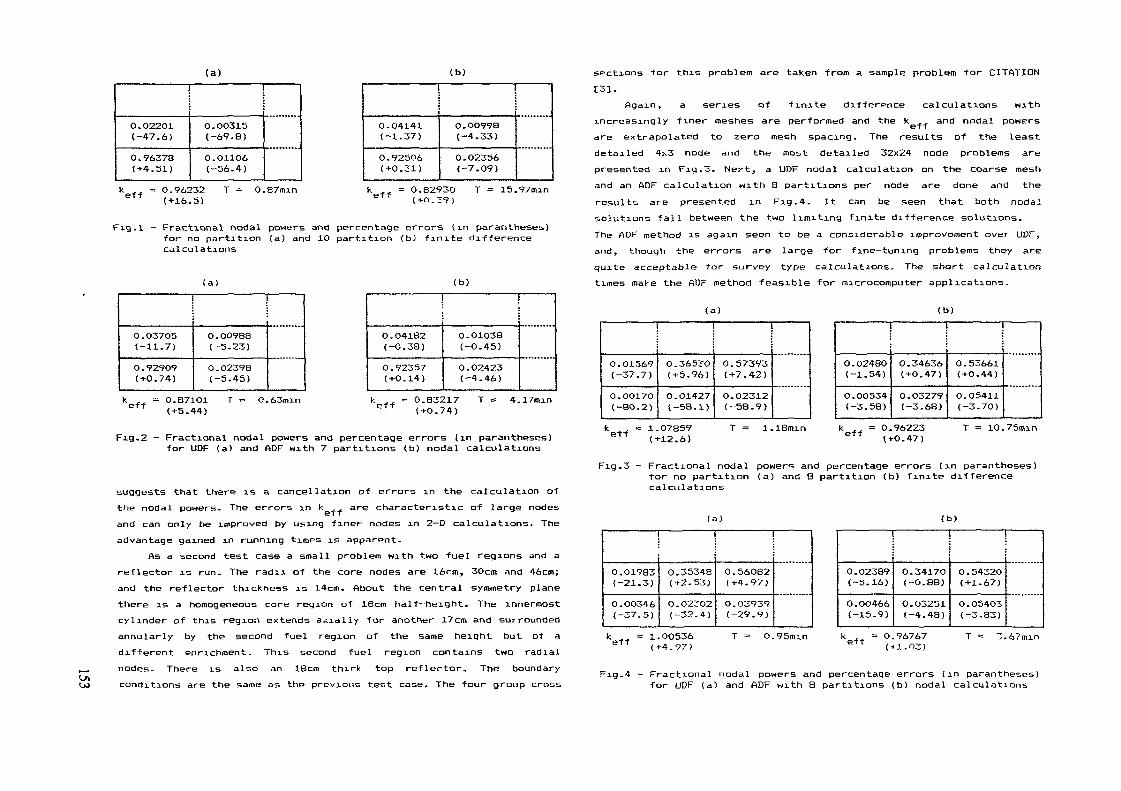
(a) (b) sections for this problem are taken from a sample problem for CITATION
0.02201(-47.6)
0.96378(+4.51)
O.O0315(-69.8)
O.O11O6(-56.4)
j
O.O4141(-1.37)
O.925O6(+0.31)
O.OO79S(-4.33)
O.O2356(-7.09)
k = 0.96232(+16.5)
T = 0.87min eff O.B293O(+0.39)
15.97min
Fig.l - Fractional nodal powers and percentage errors (in parantheses)for no partition (a) and 1O partition (b) finite differencecalculations
(a) (b)
O . O37O5(-11.7)
0 . 929O9(+0.74)
O . 00988(-5.23)
0 . 02398(-5.45)
O. 04182(-0.38)0.92357(+0.14)
.
O.O1O38(-0.45)0 . O2423(-4.46)
k = O.871O1T (+5.44)
T = O.63min = 0.83217 T = 4.17min(+0.74)
Fig.2 - Fractional nodal powers and percentage errors (in parantheses)for UDF (a) and ADF with 7 partitions (b) nodal calculations
suggests that there is a cancellation of errors in the calculation ofthe nodal powers. The errors in k are characteristic of large nodesand can only be improved by using finer nodes in 2—D calculations. Theadvantage gained in running times is apparent.
As a second test case a small problem with two fuel regions and areflector is run. The radii of the core nodes are 16cm, 3Ocm and 46cm;and the reflector thickness is 14cm. About the central symmetry planethere is a homogeneous core region of 18cm half—height. The innermostcylinder of this region extends axially for another 17cm and surroundedannularly by the second fuel region of the same height but of adifferent enrichment- This second fuel region contains two radialnodes. There is also an 18cm thick top reflector. The boundaryconditions are the same as the previous test case. The four group cross
Again, series of finite difference calculations withincreasingly finer meshes are performed and the k and nodal powersare extrapolated to zero mesh spacing. The results of the leastdetailed 4x3 node and the most detailed 32x24 node problems arepresented in Fig. 3. Nert, a UDF nodal calculation on the coarse meshand an ADF calculation with 8 partitions per node are done and theresults are presented in Fig. 4. It can be seen that both nodalsolutions fall between the two limiting finite difference solutions.The ADF method is again seen to be a considerable improvement over UDF,and, though the errors are large for fine— tuning problems they arequite acceptable for survey type calculations. The short calculationtimes make the ADF method feasible for microcomputer applications.
(a) (b)
0.01569(-37.7)
O.OO17O(-80.2)
0.3653X5(+5.96)
O. 01427(-58. 1)
0.57393(+7.42)
O.O2312(-58.9)
O. 02480(-1.54)
O.OO534(-3.58)
O. 34636(+0.47)
O.O3279(-3.68)
0.53661(+O.44)
O.O5411(-3.70)
ef-f 1.07859(+12.6)
T = 1.18mm = 0.96223(+0.47)
T = 10.75min
Fig.3 - Fractional nodal powers and percentage errors (in parantheses)for no partition (a) and 8 partition (b) finite differencecalculations
(a) (b)
0.01983(-21.3)
O.O0346(-37.5)
0.35348(+2-53)
O. 02302(-32.4)
0.56082(+4.97)
O. 03939(-29.9)
0.02389(-5.16)
O.OO466(-15.9)
O.3417O(-O.8B)
0.03251(-4.48)
O. 54320(+1.67)
0.05403(-3.83)
k ,, = 1.O0536eff (+4.77)
0.95min eff 0.96767 j.67min
Fig.4 - Fractional nodal powers and percentage errors (in parantheses)for UDF (a) and ADF with 8 partitions (b) nodal calculations
In both of the above cases the coarse meshes consist of only a fewnodes. Consequently, the time spent in auxiliary l—D calculations israther large compared to the 2—D calculations. In realistic cases wherethe reactor is represented by a more detailed coarse mesh layout thisproportions are reversed and the time spent in auxiliary calculationsbecome a small fraction of the total calculation time C2] .
C2] E.Tanker, "A Nodal Analysis of Graphite—Moderated Reactors," Ph.D.Thesis, Department of Nuclear Engineering, M.I.T., Cambridge,Massachusetts, USA, June 1989.
[~] D.R.Vondy, T.B.Fowler, "Job Stream of Cases for the Computer CodeCITATION," ORNL-TM-3793, Reactor Division, ORNL, Oak Ridge,Tennessee, USA. July 1972.
CONCLUSIONIn this study a two dimensional nodal method based on a quadratic
flux shape corrected with discontinuity factors which are calculatedfrom auMliary 1-D calculations is evaluated using references obtainedfrom finite difference calculations. Due to the limitations imposed bythe computer used for calculations, layouts consisting of only & fewnodes can be employed, fts a result, the errors in calculated k ,, areabout 17- and those in nodal powers are about a maximum of 16X locatedat a node producing an insignificant fraction of the total power.Although a large fraction of the total calculation time is spent in theauxiliary calculations the results indicate that the ADF method is aconsiderable improvement over UDF, and the time spent in an ADFcalculation is at least a factor of 3 shorter than a finite differencecalculation of comparable accuracy. This suggests that ADF can be avaluable tool in survey calculations to be performed on microcomputers.
ACKNOWLEDGEMENTSThe authors would like to thank the OECD/NEfl Data Bank for
providing the computer code CITATION. They also wish to express theirgratitude to the Turkish Scientific and Technical Research Council(TUBITAK) Information Technologies Center for allowing Dr. A.Z. Tankerto use their computer facilities for adaptation of CITATION to Intel8O86 class of microcomputers.
REFERENCESCl] K.Smith, A.F.Henry and R.Loretz, "Determination of Homogenized
Diffusion Theory Parameters for Coarse Mesh Nodal Analysis," ANSTopical Meeting, Sun Valley, Idaho, USA, September 1980.

EVALUATION OF SAFETY PARAMETERS INNODAL SPACE-TIME NUCLEAR REACTOR ANALYSIS
H. FINNEMANN, R. BÖER, R. BÖHM, R. MÜLLERSiemens AG/Unternehmensbereich KWU,Erlangen, Federal Republic of Germany
Abstract
The integrated program system PANBOX features neutronics models for solving the time-dependentfew-group diffusion equations in Cartesian or in hexagonal-z geometry coupled with an advancedversion of the well-known thermal-hydraulics code COBRA-111 Combined with an accurate andefficient pin power reconstruction module the program is thus capable of performing not only globalneutromc / thermal-hydraulic calculations but also to evaluate important safety-related parameterslike DNB ratios and centerline fuel temperatures
For the solution of the basic neutronics equations, the nodal expansion and the nodal integrationmethods are implemented m PANBOX Time-integration is based on a fully implicit Euler method incombination with an exponential transformation technique to reduce truncation errors Thereconstruction of pinwise power distributions relies on Cartesian or hexagonal versions of the weakelement approximation method
The thermal-hydraulic part of the reactor calculation is based on the program COBRA III-C/P. It allows3-dimensional steady-state and transient full- or part-core analyses to be performed. The capabilityto calculate crossflow effects is essential to achieve the high degree of spatial resolution and accu-racy aimed at in the coupled system
The present paper gives a description of the coupled neutron kinetics / thermal hydraulics programsystem PANBOX for steady-state and transient calculation of reactors with rectangular or hexagonalfuel element geometry The underlying physical models, the calculation procedure betweenneutronics and thermal hydraulics, and the related thermal margin and DNB evaluation methodologyare presented in some detail, together with perspectives for further development and refinements
1 Introduction
The numerical analysis and simulation of nuclear reactor phenomena still ranks amongst the mostdemanding scientific tasks, requiring coupled neutromc / thermal-hydraulic computer programs Forthe established light water reactors (BWRs, PWRs) such programs have been developed and continu-ously improved over the last decades, both with regard to mathematical methods and physical mod-eling For calculating PWR behaviour under steady-state and transient conditions, solving the few-group neutron diffusion equations by the nodal expansion method (NEM) IM and/or the analyticnodal integration method (NIM) 121 coupled with a thermal-hydraulic model has proved to combinehigh accuracy of the results with acceptable computing times. This approach has recently been ex-tended /3, 4/ to also allow evaluations for hexagonal geometries as encountered in WER type andpressurised water high converter reactors (PWHCRs) These nodal methods are the basis of theneutromc part of the PANBOX code system for space-time reactor analysis The computational effi-ciency of PANBOX was improved by an order of magnitude compared with earlier implementations ofNIM / NEM by exploiting their high vectorization potential in a multi-level iteration process
The thermal-hydraulic part of PANBOX makes use of the open-channel methods as implemented inCOBRA III-C/P /10,11/ Coupling between subchannels is modeled for the net diversion crossflow
resulting from flow redistribution and for turbulent mixing without net mass exchange. The diversioncrossflow is considered to be small compared with the axial mass flow rate. In the case of boiling, aone-dimensional homogeneous two-phase slip flow is assumed to exist in each affected subchannel.
The time derivatives of the neutromc equations are approximated by a fully implicit differencingscheme rendering the solution procedure for the time-dependent problem similar to that for a staticsource problem. The fluid conservation equations are converted to a system of linear equations by adifferencing scheme implicit both in space and time Control of the overall coupled steady-state andtransient iteration and calculation procedure includes examination of local truncation errors as well asof the behaviour of relative changes of the neutromc and thermal-hydraulic solutions between timesteps
2 Cartesian and Hexagonal Nodal Methods
2.1 Basic Equations
Consistent nodal methods enjoy widespread computational use because they are easy to programand very accurate even on a coarse mesh The nodal expansion method NEM /1,5/ and the nodalintegration method NIM 121 are consistent higher-order nodal methods which can be derived by con-verting the Pj-form of the neutron diffusion equation into a set of nodal equations and equivalentone-dimensional diffusion equations for the average flux in each space direction. The nodal equa-tions are obtained by formally integrating the diffusion equation over each volume element (box,hexagonal prism) into which the nuclear assembly is partitioned In matrix notation, the system con-sists of the nodal balance equations
1 d (t> 1 ^—— —— + M < J > =—— ( 1 - 6 ) y FT0 + B Jm+ S X v C +G (1)
V dt A, XP ,= , ,*d ' '
the outgoing current equations
J°ul = D* + EJ'% H
Jm = AJ°U1
the precursor equations
= - \ C + ß1JC,
d t ' ' ' ' X.
and a set of transverse-integrated 1-D diffusion equations, with
(2)
(3)
(4)
$ flux density vector,J partial current vector,C precursor density vector,F fission vector,Xl decay constants,M absorption and scattering matrix,X. eigenvaluexp, xd prompt, delayed emission spectrum vectorA generalized Albedo matrix which describes
coupling to neighbours and
J-| B, D, E, G H matrices whose elements are functions of theON diffusion coefficient and parameters dependent on the
method by which the 1-D diffusion equations were solved
The matrix M contains as a nonlinear contribution the coupling coefficients defined as the ratio ofoutgoing currents to average fluxes
The nodal integration method N1M is practically restricted to two-group problems whereas NEM is anefficient multigroup technique A procedure which combines the merits of both methods was recentlyimplemented in the PANBOX code system for space-time analysis of nuclear reactors This methodrelies on the fact that the 1-D diffusion equation can be solved analytically if the scattering and fissionsource is represented by a parabolic or higher-order polynomial It turns out that a parabolic approxi-mation of the source is already sufficiently accurate if the coefficients are determined iteratively by asuitable weighted-residual method The method was therefore termed NIM-WR The NIM-WR me-thod is equally well applicable to Cartesian and hexagonal problems Introducing some additionalsimplifying assumptions /3 4/ nodal methods, originally developed for Cartesian geometry, canreadily be transferred to hexagonal geometry For a hexagonal prism, however, three 1 -D equationsfor the transverse-averaged flux in the three directions perpendicular to the hexagon faces areneeded, and solved by NIM-WR Thus the system of equations is formally identical for both geome-tries With a proper ordenng for the unknowns, the coefficient matrices of the flux and current equa-tions have a regular sparse structure, and highly vectonzable solution algorithms can be used Theseare explained in more detail in the next subsection
2.2 Efficient Solution Algorithms
In order to solve equations (1 ) through (4) the time derivative term d<j>dt has to be approximated
This is done by the application of the implicit first order Euler method combined with the frequencytransformation /5/
- e w A t < t , ( t 0 )
It has been shown 151 that the resulting system of equations describing the solutions <)> (t) and J (t)has the same structure as that for the stationary problem The fundamental principles for an efficientsolution technique are therefore exemplified for the stationary system of equations The nodal bal-ance equation reduces now to
M* = + B (18)
where X is the total spectrum vector The outgoing current equations (2) and (3) remainvalid also in the stationary case
The system of equations ( 1 a). (2) (3) canbe solved by an iterative Gauss-Seidel method for neu-tron fluxes and partial currents Efficient solution techniques for this iteration process include both theapplication of acceleration techniques and an appropriate formulation of the algorithms to gain themost possible profit on modern high speed vector computers
Firstly, multi-level adaptive techniques are applied to accelerate the convergence process Thesetechniques solve adapted simplified equations on a hierarchy of successively coarser grids Appro-priate restriction operators transform the fine-mesh solutions to the coarser grid whereas prolonga-tion operators interpolate the fine mesh solutions from the coarse mesh solution /6/
Secondly, indexing of the calculational nodes by a red-black checkerboard scheme allows a vecto-rized formulation of the Gauss-Seidel iteration process for equations (1 a), (2), (3) For this purposethe matrices and the vectors 4> J and C can be split and ordered into "red" or "black" components(index c, where c = red or black) as follows
MC*
1—— v F * + B J
, A , C C C C
= D <S> + E Jc c c c
A J'
+ H
Ob)
(2a)
(3a)
Flux and current solution vectors are now determined by a loop over all red and all black nodes Thisensures typical vector lengths of at least N/2 where N is the tota! number of nodes to be calculated Inconsequence, a substantial computational speedup on computers equipped with vector facilities isobtained The iteration is formulated as a multigrid cycle to accelerate the convergence process
It should be noted that the complete algorithm is highly vectonzable Indeed, the bulk of the calcula-tion of matrix coefficients needed for the multi-level process and of the iterative solution on all gridscan be performed in vectorized form Furthermore, it was demonstrated that the described algo-rithms can efficiently be parallelized on multiprocessor systems by applying the principle of domainsplitting /7/ Efficiencies of about 80 % can be reached Therefore, these algorithms are also wellsuited for multi-CPU vector computer architectures
3 Thermal Hydraulics and Coupling to Neutronics
The thermal-hydraulic part of the PANBOX code system for the analysis of space-time effects innuclear reactors is based on the program COBRA III-C/P It allows 3-dimensional steady-state andtransient pressurised and boiling water reactor analyses to be performed The capability to calculatecrossflow effects is essential to achieve the high degree of spatial resolution and accuracy aimed at inthe coupled neutronics - thermal hydraulics system Geometry specification for the reactor core isflexible, relying on information about flow areas and lateral interconnections, i e no particular coordi-nate system is defined This allows application to Cartesian and hexagonal problems The underlyingconservation equations for the fluid have been given in /4/ and need not be reproduced here
The calculation scheme of the coupled reactor core simulation in PANBOX is as described in /4/ forthe hexagonal option The modules for neutron kinetics (HEX-CART) and thermal hydraulics (CO-BRA) now represent the pure calculation parts of the formerly independent programs In the coupledsystem, their internal solution procedures have remained unchanged, i e suitable convergence cri-teria and iteration step limits can still be specified individually However, coupling of the modulesintroduces the need for an additional outer iteration loop which also contains the interface routines forupdating cross sections and power density in dependence of thermal-hydraulic conditions and nu-clear fission rate, respectively

4 Pin Power Reconstruction Schemes
The solution of nodal balance and currents equations yields volume- and surface-averaged fluxesand currents for each energy group. The nodal averages can further be used to construct cornervalues by linear extrapolation and a subsequent smoothing step. This method can be used in Carte-sian and hexagonal geometry:
Geometry
Extrapolation
= ? * + ? * - l3 A 3 B 3
= î * + 5 t -i3 TB 3 C 3
. 5 + + l * _ i3 C 3 A 3
Smoothing
'•- w
,1According to the above formulae the extrapolated node values <!>
00 at the corner under consider-ation are averaged to get a smoothed flux estimate <t>0o . Both arithmetic and diffusion coefficientweighting (W| = D| / 2 D|) have proved to yield sufficiently accurate results. Further boundary valueslike gradients in the corner or average values on subsurfaces can be estimated. Weak element ap-proximations l&l to the diffusion equation can then be used to match point and average values on theboundary of the fuel assembly. Though the proposed method is also applicable in three dimensionswe assume that the intra-nodal flux distribution is separable in the axial and radial directions. Thusafter having obtained suitable boundary values the interpolation problem is reduced to the solution ofa two-dimensional inhomogeneous diffusion problem for each node. For the construction of thissolution the buckling B2 is calculated by the condition that the determinant of the multigroup diffusion
equation system with Ait> replaced by -B2 « is zero. Denoting the solutions of this algebraic equationby K| (g = 1.....G) the flux solution is a linear combination of the corresponding solution func-tions T| g
where ß „„' are the group coupling constants. The elementary functions -r\ are solutions of theHelmholtz equation
and chosen as follows
n(x,y)K < 0
K = \ - K
i\ (x,y) = sinn g > 0
where
§ . = x cos a : + y sin a . and «. arbitrary .
The coefficients of the symmetric ( cj } and the asymmetric ( cj ) solution functions have to bedetermined by the 2" J boundary conditions. The choice of the arbitrary parameters a j is suggestedby symmetry considerations. If we use only corner and surface-average fluxes as boundary condi-tions we have J = 4 for Cartesian and J = 6 for hexagonal geometry. The following a j for point andintegral conditions can be chosen :
Cartesian geometry: Point/Integral: a = 45°, 135° / 0°, 90°Hexagonal geometry: Point/Integral: a = 30°, 90°, 150° / 0°, 60°, 120°
Given the parameters a the further evaluation of point and integral conditions is a somewhat tediousbut elementary task. In two-group problems, the matrix to be evaluated in Cartesian geometry splitsup into two 4x4 systems which can easily be inverted. In hexagonal geometry we correspondinglyhave two 8x6 systems. Thus the proposed method can be made very efficient with respect to compu-tation. This is a necessary prerequisite for an extensive use of on- and off-line pin power reconstruc-tion methods. The resulting interpolating flux functions fulfill the two-dimensional diffusion equation inthe interior of the node. Experience has shown that for large nodes this approximation is superior topolynomial interpolation both with respect to accuracy and computational efficiency. This is especial-ly true in case of steep flux gradients as they occur under off-nominal conditions. It should be noted

ft that the procedure outlined is applicable for steady-state and transient problems. In time-dependentoo 3-D problems a buckling and a time absorption term have to be added to the removal cross section.
For the precursors an approximation similar to that made in the derivation of the equivalent one-di-mensional diffusion equation of NEM can be used. The behaviour of the solution at the boundary ofthe node can be improved by using more than the discussed minimum of boundary conditions. If atall, this is only necessary for the thermal flux in strongly absorbing nodes or fuel assemblies at thecore-reflector boundary and thus does not impair computational efficiency 191.
5 Local Evaluation of Coupled Neutronic / Thermal-Hydraulic Calculations
5.1 Basic Methodology
The coupled neutronics / thermal hydraulics steady-state and transient nodal reactor calculationsyield thermal-hydraulic results for each flow channel node. These results reflect the influences ofneutronic feedback and of crossflows between neighbouring channels. For safety-related analyses,they must be checked against the maximum permissible values in order to determine thermal mar-gins. One of the most important safety criteria is the departure from nucleate boiling ratio (DNBR). It isdefined as the ratio between critical heat flux and local heat flux at any particular position on thesurface of a fuel rod. Some of the most widely used critical heat flux (CHF) correlations available arethose of W-3-L/R-Grid, B&W, and the KWU CHF Tables.
In standard nodal space-time kinetics applications, reactor core subdivision in the horizontal plane isbased on the actual fuel assembly arrangement, i.e. both the neutronic and the thermal-hydraulicmodules will treat the problem in a comparatively coarse full assembly geometry rather than perfor-ming more detailed subchannel analyses. This implies that each of the flow channels is calculated asthough containing only one fuel rod which then represents an average of all the rods actually present.Therefore in such fuel element based calculations only average values of thermal-hydraulic condi-tions (for instance quality, enthalpy) of the coolant and of heat flux can be determined.
In DNB evaluations, however, maximum local (or pin) values of the thermal-hydraulic quantities wouldbe needed. In order to estimate these values without expensive pin-based subchannel analysis localneutron flux and pin power reconstruction methods must be applied, as described in the previoussection. In current methods the resulting average and maximum nodal neutronic power formfactorsserve as multipliers to the average nodal heat flux. The maximum heat flux within a node thus deter-mined is then used in the DNB analysis.
In the following a refined methodology for hot channel analysis will be presented. It is suitable foron-line local safety margin evaluation and applicable to both Cartesian (pressurised water reactorPWR) and hexagonal (pressurised water high converter reactor PWHCR) geometries.
The method relies on the identification and explicit re-calculation of relevant hot channels in thereactor core. The module for this on-line local safety margin evaluation is integrated into the normalneutronic / thermal-hydraulic calculation procedure, Its details are given in Fig. 1. To start with, thethermal-hydraulic results of the assembly based nodal calculation are available. As already men-tioned, these results are average values. However, they allow recognition of channels in whichmaximum values of selected quantities (for instance exit quality, local heat flux, enthalpy increase)occur. These criteria can be used to identify one or more channels ("hot channels") to be examinedin more detail. For each axial level of the hot channel the local pin power values must be calculatedapplying the corresponding Cartesian or hexagonal methods discussed in section 4. If these localpower factors are already available (they might have been calculated for other purposes) they canserve as another criterion for hot channel identification.
GEOMETRY REFINEMENT SELECTION
CONSTRUCTION OF
HOTTEST PIN
AXIAL POWER DISTRIBUTION
THERMAL-HYDRAULIC RE-CALCULATION
LOCAL THERMAL MARGINS RE-EVALUATION
Fig. 1: Integrated Local Safety Margin Evaluation
Next, the grade of geometric refinement of the hot channel must be defined. The first branch (cf.Fig. 1) with the option to generate a very detailed subchannel layout based on the actual fuel pinarrangement will be described in section 5.3. At present, the second branch giving a one-zone,one-rod representation of the hot channel is implemented. It corresponds to a refined methodologyfor hot channel analysis which has been proved efficient for nodal reactor calculations in Cartesiangeometry /121. In the normal channel calculation the average nodal rod power was used. In contrast,for the improved safety margin evaluation now a "hottest" pin condition has to be examined. The axialpower distribution of this hottest pin is constructed by selecting the maximum power value from eachaxial layer of the hot channel. As this maximum is not necessarily encountered in always the samepin, the resulting "hottest pin" axial power distribution is kind of fictitious and therefore represents aconservative "worst case" when re-calculating thermal hydraulics.
In both steady-state and transient applications, the next step is to re-calculate the hot channel ther-mal hydraulics. This implies re-calculation of heat conduction in the individual fuel pins, of heat trans-fer to the coolant, of thermal-hydraulic channel conditions, and of coolant crossflow between sub-channels. After this procedure, exact maximum values for the safety-related quantities are available.In the final step, these quantities are used to realistically re-evaluate local thermal margins, for in-stance with regard to centerline fuel temperatures and DNB ratios.
This methodology for realistic thermal margin re-evaluation applies to steady state as well as to eachtransient time step. In particular, it solves the problems encountered in transient calculations (whereneutronic and thermal-hydraulic quantities are not directly coupled any more due to their differenttime constants) by identification and explicit re-calculation of the relevant hot channels in the core.
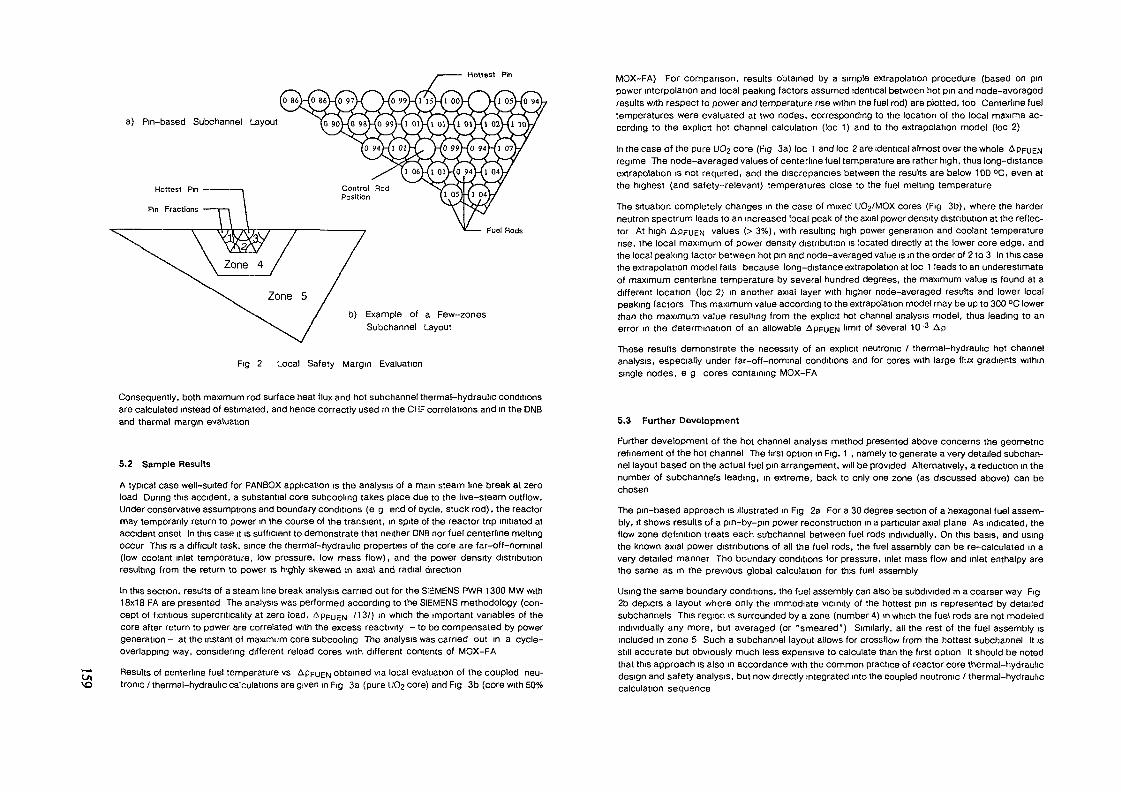
Hottest Pin
a) Pin-based Subchannel Layout
Fuel Rods
b) Example of a Few-zonesSubchannel Layout
Fig 2 Local Safety Margin Evaluation
Consequently, both maximum rod surface heat flux and hot subchannel thermal-hydraulic conditionsare calculated instead of estimated, and hence correctly used in the CHF correlations and in the DNBand thermal margin evaluation
5.2 Sample Results
A typical case well-suited for PANBOX application is the analysis of a mam steam line break at zeroload During this accident, a substantial core subcoolmg takes place due to the live-steam outflow.Under conservative assumptions and boundary conditions (e g end of cycle, stuck rod), the reactormay temporarily return to power m the course of the transient, in spite of the reactor trip initiated ataccident onset In this case it is sufficient to demonstrate that neither DNB nor fuel centerline meltingoccur This is a difficult task, since the thermal-hydraulic properties of the core are far-off-nominal(low coolant inlet temperature, low pressure, low mass flow), and the power density distributionresulting from the return to power is highly skewed in axial and radial direction
In this section, results of a steam line break analysis carried out for the SEMENS PWR 1300 MW with18x18 FA are presented The analysis was performed according to the SIEMENS methodology (con-cept of fictitious supercriticality at zero load, AppUEN /13/) in which the important variables of thecore after return to power are correlated with the excess reactivity - to be compensated by powergeneration - at the instant of maximum core subcoolmg The analysis was carried out in a cycle-overlapping way, considering different reload cores with different contents of MOX-FA
Results of centerlme fuel temperature vs Appg£N obtained via local evaluation of the coupled neu-tronic / thermal-hydraulic calculations are given m Fig 3a (pure UÛ2 core) and Fig 3b (core with 50%
MOX-FA) For comparison, results obtained by a simple extrapolation procedure (based on pinpower interpolation and local peaking factors assumed identical between hot pin and node-averagedresults with respect to power and temperature rise within the fuel rod) are plotted, too Centerlme fueltemperatures were evaluated at two nodes, corresponding to the location of the local maxima ac-cording to the explicit hot channel calculation (loc 1) and to the extrapolation model (loc 2)
In the case of the pure (JOz core (Fig 3a) loc 1 and loc 2 are identical almost over the wholeregime The node-averaged values of centerline fuel temperature are rather high, thus long-distanceextrapolation is not required, and the discrepancies between the results are below 100 °C, even atthe highest (and safety-relevant) temperatures close to the fuel melting temperature
The situation completely changes in the case of mixed UOj/MOX cores (Fig 3b), where the harderneutron spectrum leads to an increased local peak of the axial power density distribution at the reflec-tor At high APFUEN values (> 3%), with resulting high power generation and coolant temperaturerise, the local maximum of power density distribution is located directly at the lower core edge, andthe local peaking factor between hot pin and node-averaged value is m the order of 2 to 3 In this casethe extrapolation model fails because long-distance extrapolation at loc 1 leads to an underestimateof maximum centerline temperature by several hundred degrees, the maximum value is found at adifferent location (loc 2) in another axial layer with higher node-averaged results and lower localpeaking factors This maximum value according to the extrapolation model may be up to 300 °C lowerthan the maximum value resul'mg from the explicit hot channel analysis model, thus leading to anerror in the determination of an allowable APFUEN lim'l of several 10~3 A p
These results demonstrate the necessity of an explicit neutronic / thermal-hydraulic hot channelanalysis, especially under far-off-nominal conditions and for cores with large flux gradients withinsingle nodes, e g cores containing MOX-FA
5.3 Further Development
Further development of the hot channel analysis method presented above concerns the geometricrefinement of the hot channel The first option in Fig. 1 , namely to generate a very detailed subchan-nel layout based on the actual fuel pin arrangement, will be provided Alternatively, a reduction in thenumber of subchannels leading, in extreme, back to only one zone (as discussed above) can bechosen
The pin-based approach is illustrated in Fig 2a For a 30 degree section of a hexagonal fuel assem-bly, it shows results of a pin-by-pm power reconstruction in a particular axial plane As indicated, theflow zone definition treats each subchannel between fuel rods individually. On this basis, and usingthe known axial power distributions of all the fuel rods, the fuel assembly can be re-calculated in avery detailed manner The boundary conditions for pressure, inlet mass flow and inlet enthalpy arethe same as in the previous global calculation for this fuel assembly
Using the same boundary conditions, the fuel assembly can also be subdivided in a coarser way Fig2b depicts a layout where only the immediate vicinity of the hottest pin is represented by detailedsubchannels This region is surrounded by a zone (number 4) in which the fuel rods are not modeledindividually any more, but averaged (or "smeared") Similarly, all the rest of the fuel assembly isincluded in zone 5 Such a subchannel layout allows for crossflow from the hottest subchannel It isstill accurate but obviously much less expensive to calculate than the first option It should be notedthat this approach is also in accordance with the common practice of reactor core thermal-hydraulicdesign and safety analysis, but now directly integrated into the coupled neutronic / thermal-hydrauliccalculation sequence
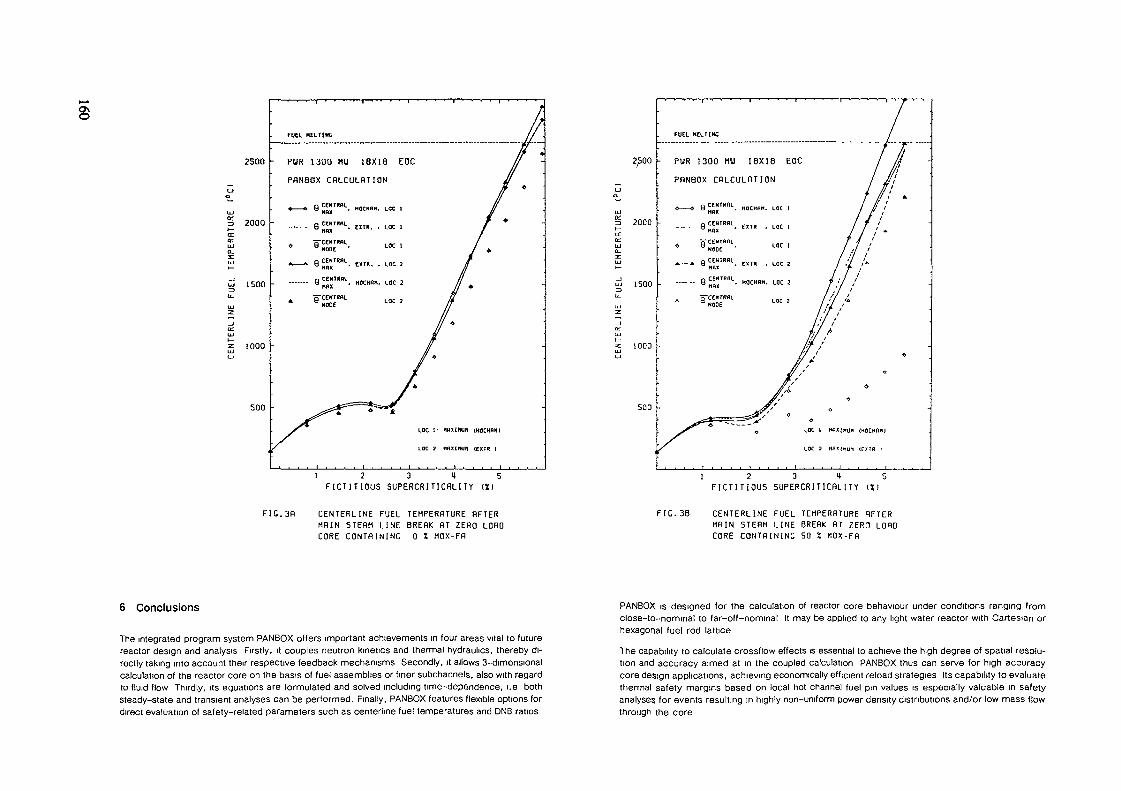
2500 h
2000 -
1 SOO -
1000 -
SOO -
PUR 1300 WJ 18X18 EOC
PRNBÖX CRLCULflTION
1 2 3 UF I C T I T I O U S SUPERCRITICflLITY
FIG.3R CENTERLINE FUEL TEMPERBTURE RFTERURIN STERM LINE BRERK RT ZERO LORDCORE CONTflININC 0 î MOX-FR
6 Conclusions
The integrated program system PANBOX offers important achievements in four areas vital to futurereactor design and analysis Firstly, it couples neutron kinetics and thermal hydraulics, thereby di-rectly taking into account their respective feedback mechanisms Secondly, it allows 3-dimensionalcalculation of the reactor core on the basis of fuel assemblies or finer subchannels, also with regardto fluid flow Thirdly, its equations are formulated and solved including time-dependence, i.e bothsteady-state and transient analyses can be performed. Finally, PANBOX features flexible options fordirect evaluation of safety-related parameters such as centerline fuel temperatures and DNB ratios
2^00
2000
1500
SOO
FUEL BELT!«
PUR 1300 MU 18X18 EOC
PHNBOX CflLCULflTlON
CE»I»flLHflX
LOC I «flxlmJH (HOCKflni
LOC 2 HflxIHUH (EXIR I
1 2 3 t SF I C T I T I O U S SUPERCRITICf lL ITY 111
FIC.38 CENTERLINE FUEL TEMPERHTURE RFTERHRIN STERM LINE BREHK RT ZERO LORDCORE C O N T A I N I N G 50 ï M O X - F R
PANBOX is designed for the calculation of reactor core behaviour under conditions ranging fromclose-to-nominal to far-off-nominal It may be applied to any light water reactor with Cartesian orhexagonal fuel rod lattice
The capability to calculate crossflow effects is essential to achieve the high degree of spatial resolu-tion and accuracy aimed at in the coupled calculation PANBOX thus can serve for high accuracycore design applications, achieving economically efficient reload strategies Its capability to evaluatethermal safety margins based on local hot channel fuel pin values is especially valuable in safetyanalyses for events resulting in highly non-uniform power density distributions and/or low mass flowthrough the core

References
IM H Finnemann, F Bennewltz, M R WagnerInterface Current Techniques for Multidimensional Reactor CalculationsAtomkernenergie/Kerntechnik 30 (1977), pp 123-128
121 H D. Fischer, H FinnemannThe Nodal Integration Method - A Diverse Solver for Neutron Diffusion ProblemsAtomkernenergie/Kerntechnik 39 (1981), pp 229-236
131 M R WagnerThree-DImenslonal Nodal Diffusion and Transport Theory Methodsfor Hexagonal-z GeometryNuclear Science and Engineering 103 (1989), pp 377-391
/4/ H Finnemann R Bohm, J Hüsken, R. Müller J MackiewiczHEXTIME A Hexagonal Space-Time Kinetics Code for theAnalysis of PWHCR TransientsIAEA Technical Committee Meeting on Technical and Economic Aspectsof High Converters Nuremberg. FRG, 26-29 March 1990
151 H Finnemann, H RaumNodal Expansion Method for the Analysis of Space-Time Effects In LWRsProceedings of a Specialists' Meeting onThe Calculation of 3-Dimenslonal Rating Distributions In OperatingReactors, Paris, 26-28 November 1979, NEA/OECD 1980
/6/ A BrandtMulti-Level Adaptive Solutions to Boundary-Value-ProblemsMath Comp 31, p 333-390, 1977
111 R Müller, R Boer, H FinnemannSoftware Development for Reactor Simulation on Multiprocessor SystemsProceedings of the ANS Topical Meeting on Advances in NuclearEngineering Computation and Radiation Shielding, Santa Fe. NewMexico, USA, April 9-13, 1989
lui M. E. RoseWeak-element Approximations to Elliptic Differential EquationsNumer Math 24 (1975) pp 185-204
/9/ R Böer. H FinnemannMSS-AS A Pin Power Reconstruction Method Based on Weak ElementApproximations to the Neutron Diffusion Equationto be published
/11/ R. E Masterson, L WolfCOBRA III P An Improved Version of COBRA for Full CoreLight Water Reactor AnalysisNuclear Engineering and Design 48 (1978),p 293
/12/ R MullerThe Hot Channel Analysis Model for Improved Local Safety Margin EvaluationProceedings Jahrestagung Kerntechnik 88, Travemunde, FRGMay 17-19, 1988. pp 97-100
/13/ R Bohm, H Finnemann H Roth-SeefndCycle-Overlapping Analysis of Faults in Pressurized Water Reactors with AssumedRecnticality of the Reactor CoreVGB Kraftwerkstechnik 59 (1984) English edition pp 86-93
O\
/10/ D S RoweCOBRA III C A Digital Computer Program for Steady State andTransient Thermal Analysis of Rod Bundle Nuclear Fuel ElementsBNWL-1695 Battelle-Pacific Northwest Laboratories (1973]

toPWR CORE PHYSICS CALCULATIONSUSING THE COCCINELLE CODE
C. BANGIL, F. BLANCHON, P. HEMMERICH,J. PLANCHARD, D. VERWAERDE, J.P. WESTDirection des études et recherches,Electricité de FranceClamartA. FERRIER, V. JOURDANService Etudes et projets thermiques et nucléaires,Electricité de FranceVilleurbanneJ.C. BARRALService de la production thermique,Electricité de FranceParis-La DéfenseFranceAbstract
In France, thé large share of Nuclear (PWR) power plantsin the installed electricity generation capacity has, foreconomic reasons, led to consider different operation modes, aswell as different fuel management strategies. As a matter offact, load follow, strech-out, together with four batches fuelmanagement and plutonium recycling are part and parcel of EOF'snuclear reactor operation situations.
In this context and in order to improve the PWRsproductivity and flexibility, calculation routes as well assurveillance systems have to take into consideration suchsituations that require detailed core calculations (3D, Pinpower distribution...).
Therefore, EOF is developing its own core calculationtools including neutronics diffusion and thermalhydraulicscodes.
As regards Neutronics, the COCCINELLE software is beeingdeveloped for light water reactor static and kineticcalculations, mainly devoted to the following applications :Core Design, Fuel Management, Safety, Off line Monitoring, On-line Surveillance.
Major efforts of development were recently devoted to 3Dspace time kinetics calculations using detailed thermalhydraulics. (THYC code for 3D core thermalhydraulics andC.VTKARË for overall NSSS thermalhydraulics) . First applications
were obtained for such accidental situation as a control rodejection or a steam line break which put forward thefeasibility of such internal or external code coupling.
The paper also presents a specific module that wasdeveloped for neutron data parameters adjustment based upon 3Dimportance calculation. A first series of tests is presented inthe case of core monitoring calculations which put forward theapplicability of such a module.
INTRODUCTION
The COCCINELLE code is developed in EOF for light waterreactor, 3D, static and kinetic calculations, mainly devoted tothe following applications : core design, fuel management,safety analysis, off line monitoring and on line surveillance.
An overview of the COCCINELLE performances was given inreference/1/ which put forward its capabilities in terms ofnumerical solution methods and modellings, computing timeperformances and accuracy. Reference /2/ details the extensivevalidation work performed during an on-line PWR core monitoringusing the CAROLINE system derived from COCCINELLE.
The present paper is devoted to the following core physicscalculations :
- adjustment of neutronic data using 3D inversecalculations.
- 3D Space time Kinetics, with emphasis on theaccident situations we have modelized by couplingCOCCINELLE calculations with 3D thermalhydraulicsTHYC and CATHARE calculations.
2 - ADJUSTMENT OF NEÜTROHIC DATA AND INVERSE PERTURBATIONS
A specific module was developed in cooperation with INRIAaimed at neutron data adjustment using 3D importancecalculations.(Reference /3/). On the basis of experimental datarecorded and on the comparison with calculated values, neutrondata parameters may be calibrated by :
- evaluating the gradient of an error functionbetween the predicted and measured fluxes withrespect to model parameters,
- minimizing this error function with an optimizationmethod.

The computation of the gradient is based on theGeneralized Perturbation Theory, which leads to an adjointdiffusion system (which has a singular matrix) with a nonzerosource term. The solution of this adjoint system, the so-called"importance" function, is obtained via a power iterationmethod.
A first series of tests were run using experimental datafrom CRUAS 2 power plant aimed at calibrating neutron reflectordiffusion parameters in a coarse mesh nodal calculation.
Table hereafter and Figure 1 summarize the major resultswe have obtained in terms of radial power distribution, with anadjusted set of neutron coefficients:
CRPAS 2 - cycle 4 - Flux map analysis
R P N M L K J H O F E D C B A
BURN UP
E/CDiscrepanciesInitial SetAdjusted set
103 MWD/TMaxError11.2 %8.8 %
StandardDeviation4.5 %2.9 %
5500 MWD/T
Max StandardError Deviation8.9 % 3.4 %6.0 % 2.4 %
Such results put forward the ability of the module toimprove the accuracy of the calculations. Such tests have to bepursued by considering other neutron parameters.
This module may also be used for fuel shufflingoptimization.
3 - USE OF COCCINELLE FOR ACCIDENT CALCULATIONS
As regards space time kinetics calculations, efforts ofdevelopment in the framework of the COCCINELLE code are devotedto the following aspects :
- Numerical methods and acceleration techniques forfast and slow transients.
- Coupling with the 3D thermalhydraulics code THVC(See Reference/I/) and concatenation of COCCINELLEand CATHARE calculations (overall NSSS therraalhy-draulic code developed by CEA/FRAMATOME/EDFReference /4/).
INITIAL E/C DISCREPANCIESR P N M L K J H C F E D C B A
A,~
m
ff
*
JU
E/C DISCREPANCIES AFTER ADJUSTMENT OF THE REFLECTORDIFFUSION COEFFICIENTS
FIGURE 1 : Experiment/calculation comparison on radial fluxdistribution

Po
Ta
0 1
PÛT- *» — *'Cf lT-T0-T,PÛ>TO
i jcocci : ; p
!
PoJo-T,
W..V -;
CflT: '• '',D O T
Pi : CORE POWER ftT THE INSTftNT iTi : CORE INLET CONDITIONS
flssembly temperature and pressure,Boron concentration
FIGURE 2 : COCCINELLE/CATHARE External coupling
From the basic methodology of a steam line break accidentcalculation using a point kinetic model, new studies anddevelopments are undertaken aimed at using 3D COCCINELLE spacetime kinetics in association with CATHARE calculations. Thefollowing sequence has been implemented (see Figure 2) :
- Overall operation conditions analysis of thereactor with the CATHARE code, using COCCINELLEresults, via an external "coupling" :
. CATHARE provides COCCINELLE with coreinlet conditions (Assembly Temperatureand Pressure, Boron Concentration)
. COCCINELLE produces the core powerdistribution.
- 3D fine core power distribution assessment(COCCINELLE) at the most penalizing time.
- DNBR assessment using the COBRAhydraulic code.
core thermal
COREPOWER(M)l.20E*08
s.ooe-07
OOE»07
0 OOE*OQ 100. UO. TIME
The first results we have obtained so far show thefeasibility of such an external coupling.
1. "Disconnected" Methodology2. CRTHARE - COCCINELLE calculations (external coupling)
FIGURE 3 : Power evolution during a steam line break accident.
A comparison is given on Figure 3 with values produced bya standard "disconnected" methodology, in terms of core powerevolution during the accident.
Present developments and studies are devoted to :- further analysis of these preliminary results toquantify conservatism of the previous "disconnec-ted" methodology,
- optimization of the coupling methodology aimed atreducing computing times.
4 - CONCLUSIONIn the present stage of development, the COCCINELLE code
covers the major needs for standard PWR calculations, with awide range of applications and capabilities.
As regards design static calculations, an extensivevalidation programme was performed aimed at assessingCOCCINELLE's accuracy on the different core parameters, which

has evidenced the ability of the code to reproduce thedifferent core configurations.
The present paper put forward the efforts devoted to theanalysis of core accidental situations using 3D space timekinetics with detailed thermalhydraulics.
Studies are now undertaken by EOF to introduce COCCINELLEin the standard calculation route for fuel management.
Major efforts are also devoted to the following aspects :pin by pin calculations, neutron feed-back, as well asCOCCINELLE's extension to hexagonal geometries in multigrouptheory.
REFERENCES
/!/ COCCINELLE : a consistent software for light water reactorphysics calculations ; Design, Safety, Management,Monitoring and SurveillanceInternational Conference on the Physics of Reactors :Operation, Design and ComputationPHYSOR 90 - April 23-27 1990 Marseille
/2/ CAROLINE : On - line 3D Surveillance System for 900 MWePWR'sInternational Conference on the Physics of Reactors :Operation, Design and ComputationPHYSOR 90 - April 23-27 1990 Marseille
/3/ An off - line calibration method to improve the accuracyof a PWR reactor diffusion model.CMEM (Computational Methods and Experimental Measurements- conference) Capri - May 89.
/4/ Assessment results of the French advanced safety codeCATHARE4 th International ENS/ANS Conference - juin 86.
CONTROLLED PORTABILITY OFFUEL MANAGEMENT SOFTWARE
S. ALTOMARE, T.M. CAMDEN, A.L. CASADEIWestinghouse Commercial Nuclear Fuel Division,Pittsburgh, Pennsylvania,United States of America
AbstractAn important aspect in the transfer of technology is for design computer softwareto be operational on a number of computer platforms In order for Westinghouseto make /ts technology transfers in an efficient, controlled and timely manner toany computer system, Westinghouse adopted a set of control procedures and com-bined this with a set of portable software standards while still preserving thesoftware quality assurance basis
With the dynamic changes occurring with computer hardware, computer intensiveengineering calculations can now be performed on mini- computers and engineer-ing workstations at substantially reduced hardware costs This is demonstrated bya set of Westinghouse benchmarks that were executed on several computer systemsfrom supercomputers to engineering workstations
1. INTRODUCTION
The current trend in the nuclear industry of nuclear utility owners acquiring in-dependent engineering analysis capability for reload core analysis requires thatsoftware be operational on a number of computer platforms. In addition, theevolution of computer hardware makes it possible to have nuclear, thermal-hydraulics and accident analysis computer codes operate efficiently on a varietyof hardware with significant improvement on cost/performance ratio overmainframe computers. This is only possible if the corresponding softwarestrategy can provide the necessary portability while preserving the softwarequality assurance basis.
This paper reviews the Westinghouse approach and experience in delivering itsdesign computer programs in a controlled software environment, and presentsrunning time benchmarking results for a number of different computer hardware
2. SOFTWARE APPROACH
Strict quality standards are required in order to generate error free softwareoperational on a variety of computer hardware. The software delivery procedureadopted at Westinghouse maximizes portability and maintains the integrity of

0\the Quality Assurance basis of its software. The procedure adopted considerstwo key elements. Software Development Life Cycle and software standards.
The software life cycle provides a systematic approach to the development,use, and operation of all production software from initial request to finalproduct release, and provides the framework for the evolution of the softwarein a controlled environment. The explicit phases of this software lifecycle in-clude-
• Evaluation and Planning
• Functional Specification
» Software Design
• Software Implementation
» Software QA Testing
• Software Release
The software life cycle provides a framework for controlled evolution ofsoftware applications, with emphasis on upfront planning, design and testing.Extensive testing prior to software release includes the execution of a com-prehensive test matrix, exercising most of the software options and comparisonwith reference solutions. The adoption of a software life cycle methodologyis receiving increasing regulatory attention.
The Westmghouse software standards were developed in order thatWestmghouse software products could execute on multiple target computersystems using a single version of the source code. The strategy employedwas to organize the software into a three (3) level hierarchy
• Application Software
• Utility Packages
• System Dependent Utilities
For the portable application code the objective was to develop guidelines thatwould enable the application code to be highly portable to multi-target com-puters The portable application code guidelines address such portability re-quirements as conformance to the ANSI 1977 FORTRAN Full Language Standard,naming conventions, variable initialization, FORMAT statements, data packing,etc The general purpose portable utility routines are used across all applica-tions to perform general purpose functions. The system dependent utility rou-tines serve to interface between the application codes and general purposeportable utilities, and the target computer system hardware and operating sys-tem
The software process adopted at Westmghouse has evolved over the years asa result of Quality Improvement initiatives. The experience obtained in deliver-ing fuel management software to external customers indicates that these ap-proaches are successful in minimizing installation and maintenance costs.
3 COMPUTER HARDWARE
The rapid evolution of computer hardware is forcing some changes in computerconfigurations for engineering calculations from mainframe supercomputers todesktop engineering workstations. These changes are coming because some ofthe minicomputers/workstations currently available offer necessary power andspeed, and can provide the capability to support highly computer intensive ap-plications at decreasing prices. In addition, the physical equipment is small, andis installed and operated without any significant investments in facil it ies andoperations support
Hardware performance is usually established with the help of standardbenchmarking tests, a set of controlled problems. A typical parameter of in-terest, MIPS (Million Instructions Per Second) can be used to rank hardware.Shown in Figure-1 are the corresponding MIPS for a host of engineering work-stations varying from 1 5 MIPS to 100 MIPS. Another important considerationin ranking hardware is the cost/performance ratio ($/MIPS). The computer hard-ware shown in Figure-1 varies in cost from about $ 5K to $ 100K with a cost/performance ratio variation of 0 6 $K/MIPS to 2.5 $K/MIPS.
Performance benchmarks have also been established using a more representativeapplication, 3D ANC'" model depletion, from CPU and I/O demands. Figure-2shows the results (running time relative to the CRAY-IS) for several different
80-
60-(0Q.i
40-
20
0-
og o S
I o S gg s 1 2 g g |m m «r T O n- S« « z ï m ~. mz z o O O £ E ~o o a o H & ï 1 0 — —o . û . 1 0 + c u r i ' S -Ï Ï Ô S J ^ z a i SS S § r § = < « i — —d d d I « « i —n o n tan n. ^
OgO
2QQ.
_l
S<
FIG 1 Workstation performance benchmarks

[H Running Tim« FMOly* to CRAY IS
FIG 2. 3D ANC computer running time benchmarks
platforms. As can be seen, there is a wide spread on performance with a rangeof acceptable results for intermediate minicomputers to workstation ranges, withvery favorable relative performance times. Such results are useful in guiding thedefinition of appropriate computer architecture for each organization accordingto specific requirements on computer turnaround, investment, number of users,capacity for emergency situations, and expansion capability. Other requirementsthat must be considered in selecting a software/hardware configuration are disk,memory, word size, compilers, network communications, etc
4. CONCLUSIONS
Fuel Management computer codes presently reside on a number of differentcomputer systems which range from mainframe supercomputers (CRAY, IBM3090), minicomputers (SCS 40) to APOLLO worstations. The technology transferagreements in place provide a variety of commercial arrangements for thetransfer of fuel management technology, including, computer program, designmethods, and training to meet specific customer requirements. The softwareapproach used enable the portability of design software to a variety of com-puter hardware hosts in a controlled fashion that preserves the qualificationbasis of each computer program.
The development of powerful workstations enables the availability of fuelmanagement software to be operational effectively on dedicated workstations,with significant cost performance improvement compared to mainframes. Thesealternatives clearly depend on the user global computational requirements
REFERENCE
1. Y.S. Liu et al, "ANC - A Westinghouse Advanced Nodal Computer Code",WCAP-10966 NP, December 1985.
WESTINGHOUSE ADVANCED FUEL MANAGEMENT SYSTEM
Y.A. CHAD, T.Q. NGUYEN, A.L. CASADEIWestinghouse Commercial Nuclear Fuel Division,Pittsburgh, Pennsylvania,United States of America
AbstractThe Westinghouse Incore Fuel Management analysis methodology has been qualifiedand implemented for a broad range of fuel management stratégie and operatingconditions Monitoring of the performance and additions to the qualification da-tabase provide a continuous process for methodology upgrades Additions to theexperience database include performance for other NSSS and fuel assembly de-signs, including large guide thimble and off-center assembly core configuration,Mixed-Oxide reload design, and Gadolinta burnable absorber Several other func-tional interlaces are required for the design, safety evaluation, licensing, operationsupport and core monitoring of PWR cores in-core fuel management methods needto provide the data required for these interfaces in a consistent manner (formatand accuracy! so as to avoid unnecessary conservatisms that penalize operationalmargins This paper reviews recent results in the Westinghouse I ncore Fuel Man-agement methodology
1. INTRODUCTION
The need for accurate and efficient methods for design and licensing of PWRfuel has become more important as more complex fuel assembly concepts andcore designs are placed into operation. Current emphasis on plant license ex-tension, power upratmg, and high burnups introduce additional fuel managementconstraints that make core designs more difficult. This increased complexityrequires accurate three-dimensional models for most of the analysis to avoidunnecessary conservatisms in design, safety analysis and monitoring of PWRcores.
The design, safety analysis, licensing, operational support, and core monitoringrequire integrated methodologies in several key areas. These areas, includingIncore Fuel Management, Thermal-Hydraulics, System Transient Analysis, andanalysis of mcore instrumentation These methodologies require a high level ofintegration, in order to meet licensing requirements and Utility Customers needs
2. INCORE FUEL MANAGEMENT SYSTEM
The design, licensing, and operational support of PWR fuel requires a designsystem composed of computer programs and methodology that provide highlevel of accuracy and flexibility to meet a variety of fuel management strate-gies, licensing requirements, and scheduler oeeds.

ON00
• PHOENIX-P/ANC Methods
The qualification of a code system requires extensive data comparison thatcovers a broad range of applications. Considering the initial philosophy of noempirical model adjustments, the Westmghouse system provides a quality con-trolled basis for methods evolution from its initial qualification
Code enhancements were introduced in PHOENIX-P/ANC recently to addressspecific user needs. In addition, a processing code ALPHA was implemented toautomate core model development, thus enhancing quality assurance basis byeliminating manual preparation of input data and processing of data fi les Con-sistent collapsed ID or 2D models from the referenced three-dimensional modelhas also been completed.
The system's performance was also established for other NSSS core design andfuel features, including large guide-thimble fuel assembly designs, core layoutwith off-center assemblies in the periphery, Gadolmia, and MOX core designs.Core modeling benchmarked for the first two features were completed for aCombustion Engineering reactor design (133 assembly core, 14x14 fuel array).Figure 1 shows Critical boron concentration compared to measurements andTable 1 provides summary information of key startup parameters. The perform-ance for these fuel/core configurations are consistent with the extensive data-base for Westmghouse reactors and fuel assembly designs
Performance for mixed-oxide fuel was included in the original qualification da-tabase of PHOENIX-P/ANC. More recent design results, including a large fraction
1,200
1.000
800
600
400
200
0 1000 3000 5000 7000 9000Cycle Burnup (MWD/MTU)
11000
Table 1 : Large Guide Thimble, Off-Center Assembly Core Design133 Assembly Core, 14x14 Fuel AssemblyBOL HZP Physics Measurements
Meas Pred Delta
CB AROITC ARORodworthBank 4Bank 3Bank 2Bank 1SASBTotal
(ppm)(pcm/°F)
(pcm)
15753.1
4507301120580178015806240
15683.7
4397851084609175515866258
-7.0-0.6
2.5 (%)-743.3-501.4-0.4-0.3
FIG 1 large guide thimble, off-center assembly core design,133 assembly core, 14 X 14 fuel assembly
of MOX assemblies were obtained at a two loop European plant. The criticalboron concentration compared to measurement is presented in Figure 2, indi-cating excellent agreement. Power distribution and startup parameters showedvery high level of accuracy (Figure 3 and Table 2, respectively) These resultsare also consistent with the overall database performance of thePHOENIX-P/ANC design system.
» SPNOVA Methodology
The SPNOVA methodology represents the next generation of advanced nodalmethod to provide accurate and very fast computational capability. This meth-odology has been developed and qualified for PWRs applications, including staticand kinetic applications SPNOVA is being implemented in several differentapplications in a manner consistent with ANC designed-based cores.
As part of the qualification of the kinetic capability, a severe rod ejection casewas analyzed. SPNOVA results were compared to those of TWINKLE, presentlylicensed code using a finite-difference coarse-meshed approach. The resultsshown in Figure 4 indicate the excellent performance and stability of SPNOVAmethodology. In terms of running time, the SPNOVA case was two orders ofmagnitude faster than the TWINKLE'S solution with a much higher level of ac-curacy.
• Loading Pattern Optimization
Loading Pattern optimization is an area of focused effort, considering the ben-efits on fuel economics that can be achieved through optimized fuel managementstrategies. Enhancements added to the Loading Pattern Computer OptimizationProgram (LPOP) provide enhanced consistency in cross sections representation

1,200
0 1000 MOO ;OOC 4000 5000 6COO 70CO SOOO 9000Cycle Burnup (MWD/MTU)
FIG 2. MOX core design — critical boron concentration, 2 loop core, cycle 19.
1 0551 064*0 9
1 01«1 025»0 B
1 3071.313+0 5
1.0121 003-0 9
1 3371 330-0 5
0 «190 »07-1 3
1 0191 025«0 8
1 08B1 091»0 8
1 O4B1 05O+0 2
1 15«1 180*0 2
1 O681 084-0 4
1 2111 111-1 7
0 727 II 0 8150 72S 0 802-0 3 -22
1 3071 313»0 5
1 0561 094-O 2
1 1801 183»0 3
1 1141 116*O 2
1 O241 022-0 2
0 9390 956+ 1 8
1 012 1 3371 O03 H 1 330-0 » | -05
1 1621 158-0 3
1 1101 119+0 t
1 1251 127*0 2
1 1781 173-0 4
0 4420 451i2 0
1 O641 058-0 6
1 0121 019»0 7
1 1741 171-0 3
0 7430 752•M 2
O 9190 907-1 3
1 2041 187- 1 4
0 9170 952»3 8
0 4470 445-0 4
0 7270 725-0 3
0 8100 800-1 3
1 M MEASURP PR£DICPO PERCEK
X
FIG. 3 MOX core design — assembly average power distribution, 2 loop core, cycle 19
Table 2 : MOX Core Design - 2 Loop Core, Cycle 19BOL HZP Physics Measurements
CB AROITC AROBank 1Bank 2
(ppm)(pcm/°C)
(ppm)(ppm)
Meas
1286-12.0
200195
Pred
1279-12.1
198200
Delta
700 12.0
-50
with ANC, and minimizes any differences in reactivity prediction The per-formance, compared to several cores, shows that the differences in reactivityare small and within the target band desirable for a scoping tool Therefore, itmaximizes the number of acceptable loading pattern candidates that are con-firmed to be acceptable with design pedigree analysis.
3. CORE MONITORING METHODS
Instrumentation systems available for core monitoring in existing plants includesmoveable or fixed in-core detectors. Plant technical specifications for moni-toring of limiting condition of core operations depend on the detector systemavailable, as well as the design analysis, licensing philosophy, and core controlstrategy.
With the increasing need for additional margin to safety limits for plan avail-ability and operation flexibility, improvements in core limits and operatingstrategies are becoming more important. Simulator based on-line systems arenow being developed to provide enhanced monitoring and operational marginsfor existing plants. The BEACON System provides integrated core operationsupport capabilities which includes on-line power distribution monitoring, pre-dictive functions, instrumentation analysis, and core follow functions. Theconsistency between design and core operation is achieved by the use ofSPNOVA as the neutronics module This approach provides a totally integratedsystem that minimizes model inconsistencies and at the same time, providesexceptional computational efficiency After an extensive qualification anddemonstration program, this system is now being installed at two Westmghouseplants, with plans for delivery and installation in several other plants.
The qualif ication of this system followed a detailed plan which included the 3Dcore model predictions and its coupling with the on-line signals from plantinstrumentation for the range of conditions covered in the plant operationFigure 5 shows a typical example of the excellent performance of the BEACONsystem in predicting core performance for severe load maneuvering conditions

16-
14-
o. 12-U-
£10-
a: 6-UJ
§a 4-
Eighth Core. R W =$1 6456, Beto=0 00325
A TWINKLE-8
• TWINKLE
-SPNOVA
000 050 100 150(SEC)
200 250 300
FIG 4 SPNOVA/TWINKLE rod ejection comparison, BOL, HZP conditions
4 CONCLUSIONS
The ultimate objective of the fuel management activities is to provide a strategyfor fuef utilization that meets economics, operation and safety requirements.As such. Reactor Physics has to be integrated with Thermal-Hydraulics, TransientAnalysis, and instrumentation systems methodologies Therefore, it is imperativethat the mcore fuel management tools provide information consistent with therequirements of other functional areas methodology, format and accuracy In-consistencies in the interfaces may require conservatisms to be added with di-rect negative impact on operational margin
The development of Best Estimate Safety Analysis methodologies will make theinterface between fuel management and safety analysis more tightly coupledThe development of on-hne core monitoring and predictive systems wil! requireincreased accuracy for In-core fuel management methods as they will havesignificantly more visibility in plant operation These trends will demand a lotmore of Incore Fuel Management methods, which will require broader scope ofbenchmarking data and qualification efforts than presently used
The direction at Westmghouse is to achieve complete integration of reactorphysics methods With the SPNOVA methodology, Westmghouse has enabledthe utilization of accurate and self-consistent core models for all phases ofengineering applications These applications range from core design, safetyanalysis, core monitoring, operations support to operations training This inte-gration will set the framework for new applications that will provide enhancedoperational and safety margins to existing plants
1 W
»0
70
f,n
\
iliiii
ii
1l
l1\
l"'l
111
tlll1l
----- »«
> ——————— 1- S * 9 ••
*t Iv« Pow*r|
lf
10
so 9 ————— tf
«0
30
20
'0
0<
10
•30
_^ft
i»Vf
J-'
*f
Itt/r*t
t
«
iiv\>. i,
ili1itti
nV
v
f,11ttllttil
-'-. \— t-*
tr
1
1lI
x i*•"..,.
. ... . W
*-^/ \1 1i \
\1—— v
\V
-W
\\i\\../«\
7
\ _
'.-•»* '»s<
* M««Bur*d »oron ChiAf«.^--» 9r«4lvt*<* »»reft C*Er>4«
1»o «o
TIM (Mt.)
«0 70
FIG S BEACON core monitoring system performance load follow test
REFERENCES
K.C. Hoskins et al., "Implementation of the Westinghouse Nuclear DesignSystem for In-core Fuel Management Analysis", Proceedings of the Interna-tional Conference on the Physics of Reactors: Operation, Design and Computa-tion, Marseille, France, V.130-138,1990.
Y.A. Chao et al, "Theory and Qualification of SPNOVA - A MultidimensionalStatic and Transient PWR Core Analyzer", Proceedings of the InternationalConference on the Physics of Reactors' Operation, Design and Computation,Marseille, France, V.55-64, 1990
C.L. Beard et al, "BEACON Core Monitoring System: Load Follow Qualifica-tion", Proceedings of the International Conference on the Physics of ReactorsOperation, Design and Computation, Marseille, France, XIII.51-57, 1990.
THE RITME METHOD: BASIC PRINCIPLES ANDOVERVIEW OF THE LOGARITME CONCEPT
J.M. BOHLER, P. DUFOUR,J.P. FERRERO, L. SAUVAGEDirection des réacteurs nucléaires,Département d'études des réacteurs,Commissariat à l'énergie atomique,Centre d'études nucléaires de Cadarache,Saint-Paul-lez-Durance, France
Abstract
This paper dicusses the basic principles of the RITME method of 3-dimensionnal reactor core flux and power calculations, and briefly de-scribes the LOGARITME development environment for implementingand managing applications based on the RITME method .
RITME is a nodal method for solving the neutron transport equation;it obtains an integral solution in which the fluxes are related to the sourceterms by precalculated Green functions .
The mean flux value per mesh and point flux values are calculatedusing a library of Green functions computed once and for all by a refer-ence transport code . The carrier and microscopic power distributionscan be determined from these flux values .
LOGARITME is a computerized environment based on softwarecase (object-oriented analysis aid software utilities) and ADA language .It provides a consistent framework for applications using the RITMEmethod . The general specifications of this environment are described,and potential applications are noted .
1 INTRODUCTIONRITME is a nodal method for solving the transport equation that is
suitable for a wide variety of reactor cores . The possibility of performing3-dimensionnal flux and power calculations quickly and accurately on astandard workstation makes the method available to a variety of core cal-culation applications .
This paper presents the method formalism through a solution to thesteady-state transport equation . The LOGARITME development envi-ronment is then described.
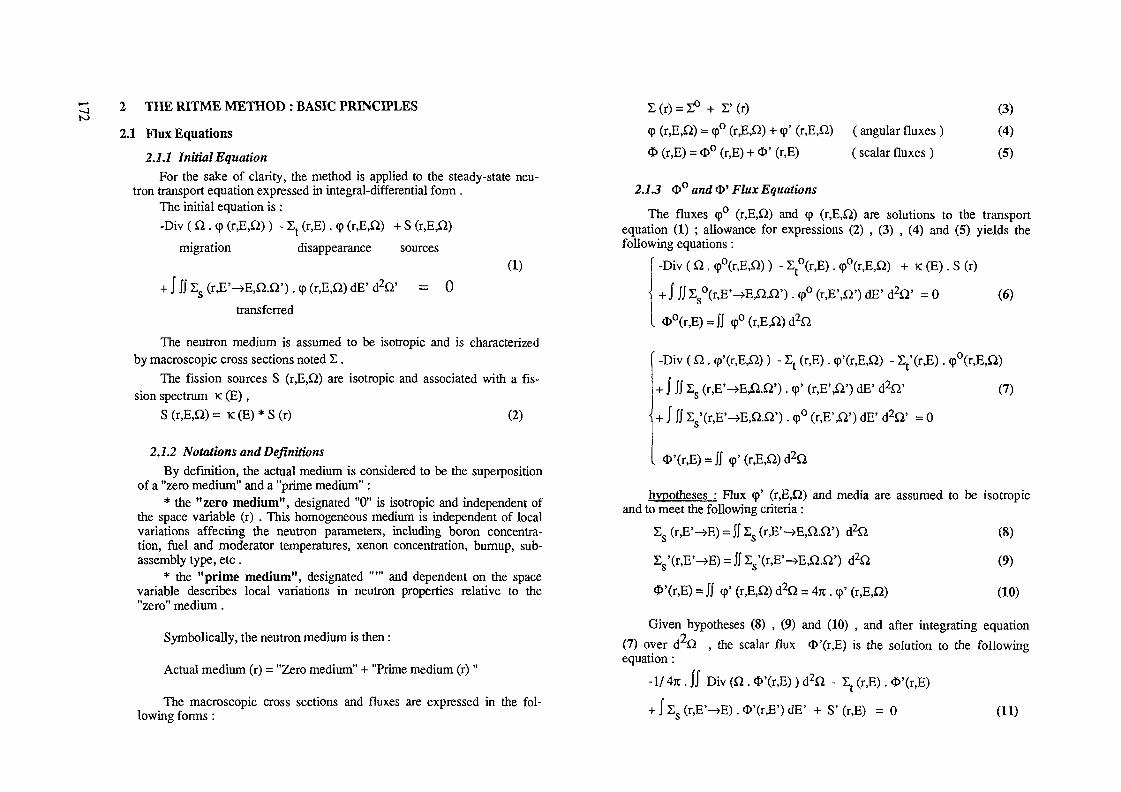
to2 THE RITME METHOD : BASIC PRINCIPLES
2.1 Flux Equations2.1.1 Initial Equation
For the sake of clarity, the method is applied to the steady-state neu-tron transport equation expressed in integral-differential form .
The initial equation is :-Div ( Q . <p (r,E,Q) ) - Zt (r,E) . <p (r,E,Q) + S (r,
migration disappearance sources(1)
= 0
transferred
The neutron medium is assumed to be isotropic and is characterizedby macroscopic cross sections noted Z .
The fission sources S (r,E,Q) are isotropic and associated with a fis-sion spectrum K (E) ,
S (r,E,Q) = K (E) * S (r) (2)
2.7.2 Notations and DefinitionsBy définition, the actual medium is considered to be the superposition
of a "zero medium" and a "prime medium" :* the "zero medium", designated "0" is isotropic and independent of
the space variable (r) . This homogeneous medium is independent of localvariations affecting the neutron parameters, including boron concentra-tion, fuel and moderator temperatures, xenon concentration, burnup, sub-assembly type, etc .
* the "prime medium", designated "'" and dependent on the spacevariable describes local variations in neutron properties relative to the"zero" medium .
Symbolically, the neutron medium is then :
Actual medium (r) = "Zero medium" + "Prime medium (r) "
The macroscopic cross sections and fluxes are expressed in the fol-lowing forms :
I (r) = 1° + E' (r) (3)<p (r,E,£2) = 9° (r,EA> + 9' (r,E,£i) ( angular fluxes ) (4)<ï> (r,E) = <D° (r,E) + O' (r,E) ( scalar fluxes ) (5)
2.1.3 <&° and O' Flux Equations
The fluxes 9° (r,E,Q) and 9 (r,E,Q) are solutions to the transportequation (1) ; allowance for expressions (2) , (3) , (4) and (5) yields thefollowing equations :
-Div ( Q . 9°(r,E,Q) ) - Et°(r,E) . 9°(r,E,Q) + K (E) . S (r)
+ J JJ 2,°(r,E'-»E,ß.ß') . 9° (r,E',ß') dE' ' =0 (6)
<D°(r,E) = JJ 9° (r,E,£i)
-Div ( ft. 9'(r,E,a) ) - Et (r,E). 9'(r,E,ß) - Et'(r,E). 9°(r,E,Q)
+ J JJ E. (r,E'->EAß'). 9' (r,E',Q') dE' d2&' (7)o
+ J JJ E'(r,E'->E,ß.ß'). 9° (r,E',Q') dE' d2Q' = 0
hypotheses : Flux 9' (r,E,£2) and media are assumed to be isotropicand to meet the following criteria :
(8)
(9)
(10)
Given hypotheses (8) , (9) and (10) , and after integrating equationo(7) over d Ü , the scalar flux <3>'(r,E) is the solution to the followingequation :
-I/ 4ic. JJ Div (Q . *'(r,E) ) d2Q - Et (r,E). <E>'(r,E)
+ J E (rJE'-»E). *'(r,E*) dE' + S' (r,E) = 0 (11)
Is (r,E'->E) = JJ £s (r,E'->E,a.Q')
E,'(r,E'-»E) - JJ 2,'(r,E'->E^.U')o o
<D'(r,E) = JJ 9' (rjEjQ) d2Q = 4ic. <p' (r,E,£

where ,
S' (r,E) = - £t'(r,E) . O°(r,E) + 1 %' (r, . <E>°(r,E') dE' (12)
2.2 Solving the Flux EquationsThe A° and A' operators associated with equations (6) and (11) ,
defined by A°<I>O = S and A'<E>' = S' are linear and thus integral . Conse-quently, fluxes O° and <!>' may be expressed as integrals over space, fora given source term neutron emission spectrum .
The kernel of operator A° ( or A' ) is known as a Green function,noted T° ( or T' ) . The scalar fluxes O°(r,E) and O'(r,E) are ex-pressed as follows :
<D°(r,E) = JJJ ¥° (r,r',E) * S (r') * dVcore
0'(r,E) = 111 ¥' (r,r',E) * S'(r',E) * d3r
(13)
(14)core
2.3 RITME - Specific Green Functions
23.1 DéfinitionsT° (r,r',E) ( or *P' ) is the flux at r of energy E due to one neu-
tron/second emitted at r' , in the form of a Dirac distribution, with thespectrum of source S ( or S' ) in the "zero" medium ( or actual medium).
2.3.2 Procedure for <S>°(rJE)O°(r,E) is by definition a flux in a homogeneous medium, therefore :- <3>°(r,E) will have a "clean" spatial form (no interface between dif-
ferent neutron media ); it involves "long-range" migration, and can be cal-culated with a coarse mesh consistent with the migration properties ofthe selected "zero" medium . The "zero" medium corresponds in fact tothe average neutron medium of the configuration in question .
- the T0 functions depend only on the distance between r and r' ,and thus involve geometrical symmetries . For a given "zero" mediumand neutron emission spectrum, they may be calculated once and for allto constitute a compact function library .
233 Procedure for <S>'(rJE)The Green functions necessary to calculate <&' depend on the S'
source spectrum as well as the r and r' media, which generally have dif-ferent neutron properties .
Flux <&'(r,E) results from "short-range" neutron effects; neutron vari-ations between the actual medium and the "zero" medium generally takeplace in the thermal and epithermal energy ranges . Compared with<E>°(r,E) it is generally a low-amplitude flux , and its accuracy is primarilyrelated to the quality of the cross sections in the r medium . The *i" func-tions are tabulated according to sensitive parameters of the S' spectrum(e.g. the moderator density) and to characteristic neutron migration pa-rameters (e.g. absorbers in intermediate energy ranges ) .
2.3.4 Calculating the Green FunctionsThe Green functions for a given application are calculated once and
for all using multigroup transport code . The energy discretization is fineenough to provide an accurate description of neutron migration in thehigh-energy ranges; these values are then condensed to a smaller num-ber of groups for flux calculations in the application .
3 APPLICATION TO CORE CALCULATIONS
3.1 GeneralThe RTTME method yields an integral solution to the neutron trans-
port equation with approximations concerning the isotropism of the mediaand flux q>' , and possible allowance for simplifying hypotheses in consti-tuting the Green function library . It is therefore suitable for a wide vari-ety of cores, and has been extensively qualified for PWR cores 111 121 .
This section discusses the approach used to calculate a 3D flux distri-bution in a reactor core, with attention to some aspects of the algorithmsand calculation meshes . The results are described in part 3.5 for an actu-al application : PRO-RFTME 131 .
3.2 Discrete Formulation of <ï>°After dividing the core (and reflector) into meshes (subscript j),
equation (13) becomes the following, for a resolution with G energygroups :
Jg (15)

where :k is the neutron source density in the "emitting" mesh k
Vi^ is the volume of mesh k
T0,- is the flux in mesh j, of group g, due to a neutron/second emit-ted in mesh k according to fission spectrum K(E).
The Green function ^: , also known as the coupling function be-tween meshes j and k at energy g, is calculated by integrating the charac-teristic function of the kernel of integral operator A° over the spatialmesh of 4>° .
• Mesh CharacteristicsO° involves "long-range" migration in a homogeneous medium, and
is calculated over the most regular possible coarse mesh for symmetryreasons, to minimize the coupling function library and the run time .
• Calculating 4>° for every pointThe integral formalism of RTTME makes it possible to determine 4>°
at every point from the source distribution Sk and precalculated "local"Green functions :
* Vk * Sk (16)
The emitting meshes k are meshes in which the mean flux O° andsources have been calculated . The smooth shape of flux <E>° makes itpossible to interpolate the result throughout the core from a few suitablyselected points depending on the type of core and application . This ap-proach makes it possible to calculate the source term S' in order to calcu-late <&' for an irregular mesh .
3.3 Calculating *'Flux <E>' results from local variations in the neutron properties of the
actual medium relative to the "zero" medium . It is thus advantageous toadapt the <£>'• calculation mesh to the neutron heterogeneities of the con-figuration . The RITME method is well suited to this type of solution usingthe following approach :
- <&o is first calculated using the O' mesh based on the carrier formdetermined from the point O° flux values
- the source term S'(r,E) is then computed- at last, <!>'• is computed from the sources S' and tabulated Green
Jo
functions precalculated on the O' mesh .The ability to use different,irregular meshes for <E>° et O' makes it
possible to use simple algorithms for a precise assessment of neutron het-erogeneities such as absorber assemblies or mixed oxide assemblies,without any significant run time penalty .
3.4 Total Flux calculationThe total flux ,
> • =<I>0. +0'-Jg Jg Jg
(17)v 'is obtained after iteration of the fission sources . The procedure is
carried out on the O' mesh; from the mean flux distribution, a carrierform (flux in homogenized medium) is obtained throughout the core by in-terpolation .
The microscopic flux (i.e. the flux on elementary items rcells, pins,etc.) is factorized in so far as the infinite-medium microscopic fluxeswere stored in the neutron library associated with the RITME calcula-tion .
3.5 ThePRO-RITME ApplicationA version of the RITME code III 121 applied to a 900 MW PWR
has been qualified with a coarse mesh (regular meshes 20 cm on a side).This version is used for on-line monitoring of a PWR core as part of
the PRO-RTTME application .PRO-RITME is a software package for 3-dimensionnal power recon-
stitution of a PWR core. The program is installed at the CRUAS 2 site ,and was used to monitor the entire 4th campaign in an open-loop configu-ration.
This experimentation showed that the 3D RITME code can be imple-mented on a commercial workstation (HP9000/350 running under UNIX)for on-line core monitiring purposes, and demonstrated the code execu-tion speed : a 3D power distribution for 2669 meshes was calculated in 3seconds on the site using a MOTOROLA MC680320 microprocessor;the same calculation required only about 1 second in a laboratory settingwith a MC68030 microprocessor .
An off-line accuracy study was conducted with static and transienttests during the experiment . Table 1 summarizes the statistical investiga-tion for 25 static maps; similar results were obtained for normal operatingtransients .
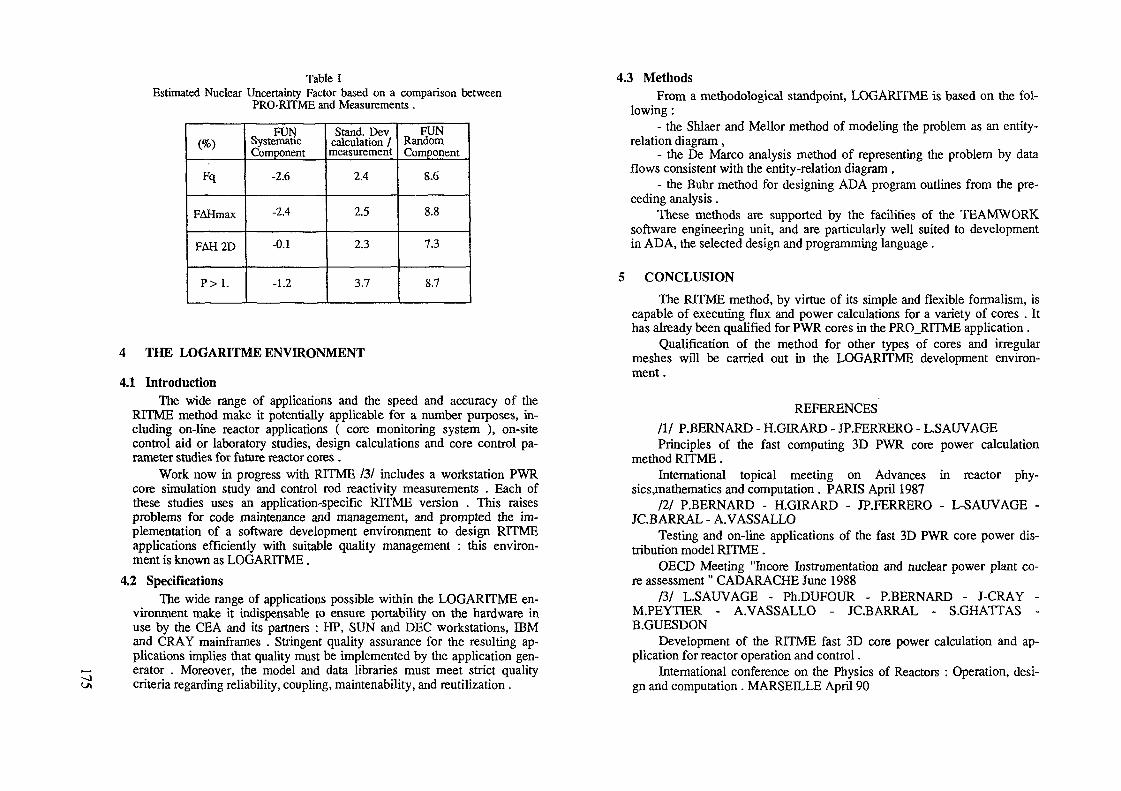
Table IEstimated Nuclear Uncertainty Factor based on a comparison between
PRO-RTTME and Measurements .
(%)Fq
FAHmax
FAH2D
P>1.
o FUNSystematicComponent
-2.6
-2.4
-0.1
-1.2
Stand. Devcalculation /measurement
2.4
2.5
2.3
3.7
FUNRandomComponent
8.6
8.8
7.3
8.7
4 THE LOGARITME ENVIRONMENT
4.1 IntroductionThe wide range of applications and the speed and accuracy of the
RTTME method make it potentially applicable for a number purposes, in-cluding on-line reactor applications ( core monitoring system ), on-sitecontrol aid or laboratory studies, design calculations and core control pa-rameter studies for future reactor cores .
Work now in progress with RITME /3/ includes a workstation PWRcore simulation study and control rod reactivity measurements . Each ofthese studies uses an application-specific RITME version . This raisesproblems for code maintenance and management, and prompted the im-plementation of a software development environment to design RITMEapplications efficiently with suitable quality management : this environ-ment is known as LOGARITME.
4.2 SpecificationsThe wide range of applications possible within the LOGARITME en-
vironment make it indispensable to ensure portability on the hardware inuse by the CEA and its partners : HP, SUN and DEC workstations, IBMand CRAY mainframes . Stringent quality assurance for the resulting ap-plications implies that quality must be implemented by the application gen-erator . Moreover, the model and data libraries must meet strict qualitycriteria regarding reliability, coupling, maintenability, and reutilization.
4.3 MethodsFrom a methodological standpoint, LOGARITME is based on the fol-
lowing :- the Shlaer and Mellor method of modeling the problem as an entity-
relation diagram ,- the De Marco analysis method of representing the problem by data
flows consistent with the entity-relation diagram ,- the Buhr method for designing ADA program outlines from the pre-
ceding analysis .These methods are supported by the facilities of the TEAMWORK
software engineering unit, and are particularly well suited to developmentin ADA, the selected design and programming language .
5 CONCLUSIONThe RITME method, by virtue of its simple and flexible formalism, is
capable of executing flux and power calculations for a variety of cores . Ithas already been qualified for PWR cores in the PRO_RITME application .
Qualification of the method for other types of cores and irregularmeshes will be carried out in the LOGARITME development environ-ment .
REFERENCESIII P.BERNARD - H.GIRARD - JP.FERRERO - L.SAUVAGEPrinciples of the fast computing 3D PWR core power calculation
method RITME .International topical meeting on Advances in reactor phy-
sics,mathematics and computation . PARIS April 1987111 P.BERNARD - H.GIRARD - JP.FERRERO - L-SAUVAGE -
JC.BARRAL - A.VASSALLOTesting and on-line applications of the fast 3D PWR core power dis-
tribution model RITME .OECD Meeting "Licore Instrumentation and nuclear power plant co-
re assessment " CADARACHE June 1988/3/ L.SAUVAGE - Ph.DUFOUR - P.BERNARD - J-CRAY -
M.PEYTffiR - A.VASSALLO - JC.BARRAL - S.GHATTAS -B.GUESDON
Development of the RITME fast 3D core power calculation and ap-plication for reactor operation and control .
International conference on the Physics of Reactors : Operation, desi-gn and computation . MARSEILLE April 90

VERIFICATION OF ADVANCED METHODS IN TARMSBOILING WATER REACTOR CORE MANAGEMENT SYSTEM
M. TSUIKI, T. IWAMOTONuclear Engineering Laboratory,Toshiba Corporation,KawasakiI. TOYOSHIToshiba Corporation,YokohamaJapan
Abstract
The TARMS (Toshiba Advanced Reactor Management System) software package wasdeveloped as an effective on-line, on-site Boiling Water Reactor (BWR) coreoperation management system It covers almost all the functional requirements to thecurrent process computer to increase on-site core management capability, capacityfactors, thermal margins, fuel reliability, and so on, by supporting application functionsfor monitoring the present core power distribution, and for aiding site engineers inmaking the core operation plans, by predicting future core performance
It is based on a three dimensional, 15 energy group, coarse mesh nodal diffusiontheory code "LOGOS02", and includes advanced methods to increase the accuracy ofcore power distribution calculations as well as a local peaking factor calculationmethod by which the effect of neighboring nodes on mtra-nodal power distributioncan j» considered TARMS has been installed in eight BWR plants and was verified tobe an effective BWR core operation management tool This paper describes itsadvanced methods and the results of verifications with actual plant data
1 Introduction
The TARMS (Toshiba Advanced Reactor Management System) software package was developedas an effective on-line, on site Boiling Water Reactor (BWR) core operation management systemIt covers almost all the functional requirements to the current process computer to increase on-site core management capability, capacity factors thermal margins, fuel reliability, and so on, bysupporting application functions for
-monitoring the present core power distribution, and-aiding site engineers in making the core operation plans, by predicting future core performance
It is based on a three dimensional, 1 5 energy group, coarse mesh nodal diffusion theory code"LOGOS02", and includes advanced methods to increase the accuracy of core power distributioncalculations as well as a local peaking factor calculation method by which the effect ofneighboring nodes on mtra nodal power distribution can be considered
To increase the accuracy of power distribution calculations by utilizing in-core neutron detectorsignals, a method (named "adaptive learning") was developed and implemented in TARMS The
mam part of the adaptive learning is automatically triggered following the whole-core TIP(Traversing In core Probe) scanning, which is performed about once in 30 through 60 days Thebest estimated TIP readings are then obtained from LOGOS02 simulated results, and themeasured TIP readings by minimizing possible errors in the measured ones, that are caused mainlyby (he dislocations of the detectors Then, the best estimated nodal power is obtained bycorrecting LOGOS02-calculated nodal power, so that it becomes consistent with the bestestimated TIP readings The accuracy of the best estimated nodal power so obtained was verifiedby comparing the data to gamma-scanning experiments results
Biasing factors to correct the LOGOS02 nodal power deviation from the best estimated valueare obtained at the same time In the core monitoring calculations performed hourly, whereLPRM (Local Power Range Monitor) readings are available, or m the predictive core simulation,where no detector signals are available, the nodal power calculated by LOGOS02 is corrected bysuch biasing factors "experienced" above The factor was observed to be almost independentfrom core operating parameters However, its axial shape was found to be weakly dependent onthe coolant flow rate The biasing factor correction method was verified by core followcalculations that emulate the core monitoring and the predictive simulations
The linear heat generation rate of an individual fuel rod in a node has to be calculated to monitorfuel integrity Since nodal methods are based on node by-node homogenized diffusion equations,the local peaking factors are not straightforwardly obtained by nodal methods In the presentwork, a method was developed to accurately calculate local peaking factors within reasonablecomputing time, and was verified by comparing the factors to those obtained by multigroup,multi assembly, heterogeneous (rod-by-rod) diffusion theory calculations
2. System Overview
Figure 1 shows an overview of TARMS functional linkage The user can operate the coremonitoring, and the core prediction modules via the man-machine interface It is easy to use thecore monitoring module, because its function - monitonng the present core power distribution -is quite simple and requires almost no data input from the user The core prediction calculations,on the other hand, require many complicated input data Also, it is sometimes difficult todetermine at what time point the three-dimensional (3D) core simulator should be run Tominimize the user's operating effort, the TARMS core prediction module includes inputgenerators and the automatic 3D core simulator dnvers for typical predictive calculation patternsfor, e g ,
- Haling calculations,- control rods pattern search calculations,- subcycle predictions,- core startup plannings,- scram recovery plannings,- control rods pattern adjustment plannings
The adaptive learning is accomplished by the adaption, and the power distribution best estimatemodules, fully automatically without any interaction to the user The biasing factors obtained bythese modules are stored and supplied to the core monitoring, and the core prediction modulesto increase the accuracy of the 3D core simulator outputs Core status data, such as the coolantflow rate, the control rod positions, and the in core detector signals, are transferredautomatically from the core to TARMS via process I/O modules
3. Methods
This section presents the adaptive learning method, and the local peaking factor calculationmethod used in TARMS

Man-Machine Interface
-Cotor Graph es- Keyboard, Mouse
Core Monitoring Module
- Periodic Core Evaluation- Historical Data Update- Edit Operating Data-ete.
Con Prediction Module
- General Core Prediction- Event Prediction Package- Target Exposure Calculator!- Edrt Results
3D Cor« Simulator
-3D Diffusion Calculation- Channel Row Distribution- Void Distribution- Xe Transient Calculation- Bumup Calculation- Thermal Unit Calculation- Isotope Concentration-etc.
Adaption Module
Correction Factors Calculation for Power Dfetrfoution and keff
Power Distribution Best Estimât* Modul«
Best Estimate :- 3D Core Simulator + In-Core Measurement
Vwiftod wfttf Actual Plant Da!* •,•-
I^Cor» HcuUon Delator CTIPIl-PHM) Signal»
Fig. 1 TARMS functional linkage Overview.
-J-J
3.1 Adaptive Learning Method
The purpose of the adaptive learning is to obtain correction factors to increase the accuracy ofLOGOS02-calculated nodal power distribution, it is implemented in two phases. Phase 1 isexecuted following the whole-core TIP scannings (about once in 30 through 60 days). Phase 2 isaccomplished in the periodic (almost hourly) core monitoring calculation.
3.1,1 Best Estimate of Nodal PowerIn the first half of Phase 1, the best estimated nodal power is calculated by using the 3D coresimulator and the measured TIP readings.
The 3D core simulator LOGOS02 first calculates nodal power, PC(k,j), taking into considerationcore operating condition, specified by the total coolant flow rate, the core pressure, the controlrod pattern, the inlet temperature, and so on. Here, (k,j) indicates a node of axial position indexk in fuel assembly j. From the nodal power, one readily obtains simulated TIP readings, TC(k.i), foran axial position k of a TIP string i, by, e.g.
TC(k, i) = Sum- C(k, j). PC(k, j) / Sum. 1.0,Sum. : summation over fuel assemblies surrounding TIP string i,
(1)
where C(k,j) is a conversion coefficient from nodal power to the thermal neutron flux at the TIPposition, obtained by the infinite lattice calculations.
Let TM(k,i) be the measured TIP readings for the same core operating condition. The simulatedand measured TIP readings are generally different from each other. This is mainly because of theerrors in PC(k,j) caused by approximations included in the physical model of the 3D coresimulator, and due to the errors in TM(k,i) caused by the dislocations of the detectors. Bycomparing the results to the data obtained from gamma scanning experiments, it was found thatthe radial component of TM(k,i) includes a greater error than that for TC(k,i). On the contrary,the axial component of TM(k,i) agrees with gamma scanning experiments much better than that

00
Root Mean Square Error ofNodal Power Distributions.
Root Mean Square Error ofRadial Power Distributions.
Root Mean Square Error ofAxial Power Distributions.
A, B, C : BWR Plants.
[i gj : Gamma Scanning Uncertainty.
fi : Conventional Method.
|^j : The Present Method.
0.0
Relative La140 Concentration
0.5 1.0 1.5
CoreTop
CoreBottom
Gamma Scanning
Conventional Method
Control Rod
Fig. 2 Error indices of nodal power distributions to gamma scanning experiments.
for TC(k,i). Therefore, the best estimated TIP readings, TB(k,i), can be obtained by taking theaxial part of TM(k,i) and the radial part of TC(k,i), namely:
(2)TB(k,i)=TMa(k,i).TCr(i),
where
TMa(k, i) = TM(k, i)TMr(i) = Sumk TM(k, i) / Sumk 1.0,TCr(i) = SumR TC(k, i) / Sumk 1.0,TCa(k, i) = TC(k, i) / TCr(i),Sumk : summation over k.
(3)(4)(5)(6)
The best estimated nodal power, PB(k,j), values are obtained by correcting LOGOS02-calculatednodal power, PC(k,j), so that it becomes consistent with the best estimated TIP readings.
The accuracy of the best estimated nodal power, PB(kj), obtained by the present method, wasverified by comparing it to gamma-scanning experiments. Figure 2 shows error indices for thenodal power distributions, obtained by the present method, to those by the gamma scanningexperiments for three BWR plants. This figure also shows the error indices for nodal power
Fig. 3 Relative nodal La140 concentration comparison along a fuel assemblywhich was adjacent to a deep control rod, (La140 concentrationrepresents nodal power distribution at the end of a cycle.)
distributions obtained by the conventional process computer method, where nodal power iscalculated directly from the measured TIP readings. As can be seen from the figure, the error innodal power distributions, obtained by the present method, decreased to about 1/2 thoseobtained by the conventional method. Figures 3 and 4 show the node-by-node comparison ofpower obtained by the gamma scannings, by the present method, and by the conventionalprocess computer method. In these figures, the conventional process computer method haslarger errors than average, because of abnormally large radial dislocation for TIP strings. Thepresent method gives quite accurate nodal power, in spite of such dislocation. From thesecomparisons, it can be concluded that the agreement of the present method with the gammascanning experiments is much better than that for the conventional process computer method,mainly because the errors included in the radial component of the measured TIP readings arerejected in the present method.
3.1.2 Biasing Factors
In the latter half of Phase 1 in the adaptive learning, biasing factors to correct nodal power bythe 3D core simulator will be calculated.
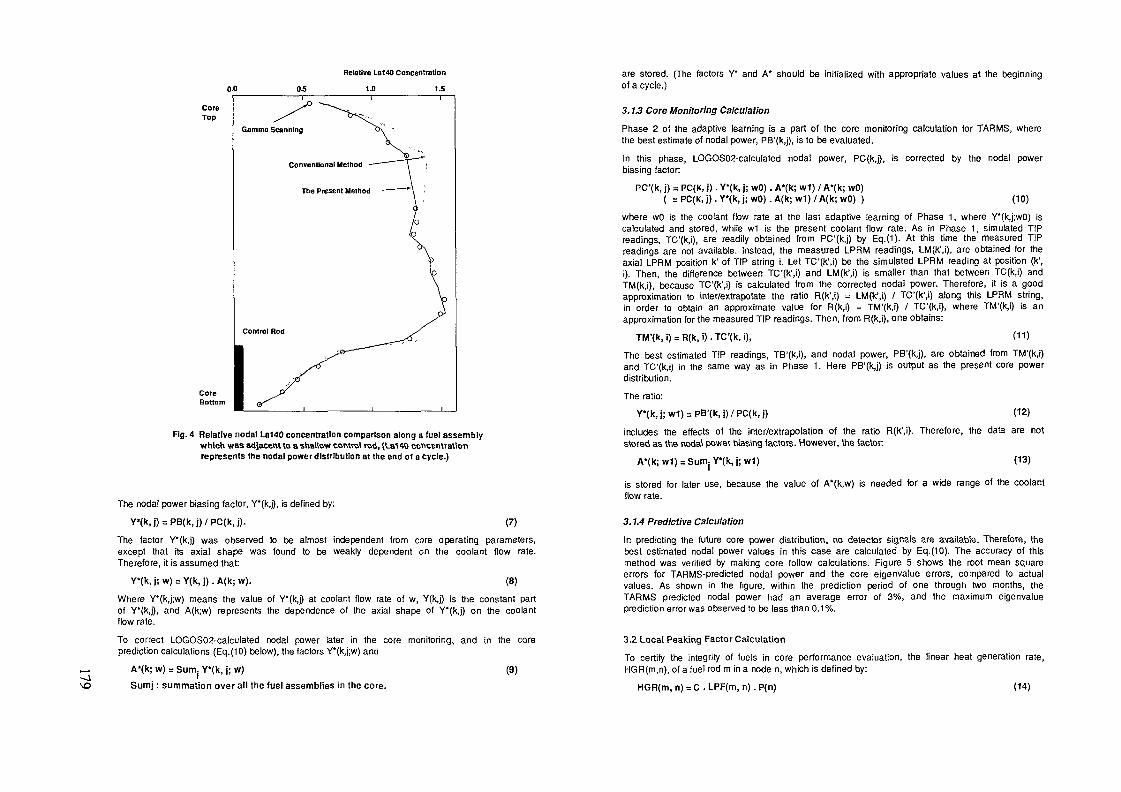
0.0
Relative La140 Concentration
1.0 1.5
CoreTop
CoreBottom
Gamma Scanning
Fig. 4 Relative nodal La140 concentration comparison along a fuel assemblywhich was adjacenuo a shallow control rod, (La140 concentrationrepresents the nodal power distribution at the end of a cycle.)
The nodal power biasing factor, Y*(k,j), is defined by:
Y«(k,j) = PB(k,i)/PC(k,i). (7)
The factor Y"(k,j) was observed to be almost independent from core operating parameters,except that its axial shape was found to be weakly dependent on the coolant flow rate.Therefore, it is assumed that:
Y*(k, j; w) = Y(k, j). A(k; w). (8)Where Y*(k,j;w) means the value of Y*(k,j) at coolant flow rate of w, Y(k,j) is the constant partof Y"(k,j), and A(k;w) represents the dependence of the axial shape of Y*(k,j) on the coolantflow rate.
To correct LOGOS02-calculated nodal power later in the core monitoring, and in the coreprediction calculations (Eq.(10) below), the factors Y*(k,j;w) and
A*(k; w) = Sum. Y*(k, j; w)'
Sumj : summation over all the fuel assemblies in the core.(9)
are stored. (The factors Y* and A* should be initialized with appropriate values at the beginningof a cycle.)
3. U Core Monitoring Calculation
Phase 2 of the adaptive learning is a part of the core monitoring calculation for TARMS, wherethe best estimate of nodal power, PB'(k,j), is to be evaluated.
In this phase, LOGOS02-calculated nodal power, PC(k,j), is corrected by the nodal powerbiasing factor
PC'(k, j) = PC(K, j). Y*(k, j; wO). A*(k; w1) / A*(k; wO)( = PC(K, j). Y*(k, j; wO). A(k; w1) / A(k; wO) ) (10)
where wO is the coolant flow rate at the last adaptive learning of Phase 1, where Y*(k,j;wO) iscalculated and stored, while w1 is the present coolant flow rate. As in Phase 1, simulated TIPreadings, TC'(k.i), are readily obtained from PC'(k.j) by Eq.(1). At this time the measured TIPreadings are not available. Instead, the measured LPRM readings, LM(k',i), are obtained for theaxial LPRM position k' of TIP string i. Let TC'(k',i) be the simulated LPRM reading at position (k',i). Then, the difference between TC'(k',i) and LM(k',i) is smaller than that between TC(k,i) andTM(k,i), because TC'(k'.i) is calculated from the corrected nodal power. Therefore, it is a goodapproximation to inter/extrapolate the ratio R(k',i) = LM(k',i) / TC'(k'.i) along this LPRM string,in order to obtain an approximate value for R(k,i) = TM'(k,i) / TC'(k,i), where TM'(k,i) is anapproximation for the measured TIP readings. Then, from R(k,i), one obtains:
TM'(k, i) = R(k, i). TC'(k, i), (11)
The best estimated TIP readings, TB'(k,i), and nodal power, PB'(k.j), are obtained from TM'(k.i)and TC'(k,i) in the same way as in Phase 1. Here PB'(k,j) is output as the present core powerdistribution.
The ratio:Y*(k,j;w1) = PB'(k,j)/PC(k,j) (12)
includes the effects of the inter/extrapolation of the ratio R(k',i). Therefore, the data are notstored as the nodal power biasing factors. However, the factor:
A*(k; w1) = Sum, Y*(k, j; w1) (13)
is stored for later use, because the value of A*(k,w) is needed for a wide range of the coolantflow rate.
3.1.4 Predictive CalculationIn predicting the future core power distribution, no detector signals are available. Therefore, thebest estimated nodal power values in this case are calculated by Eq.(10). The accuracy of thismethod was verified by making core follow calculations. Figure 5 shows the root mean squareerrors for TARMS-predicted nodal power and the core eigenvalue errors, compared to actualvalues. As shown in the figure, within the prediction period of one through two months, theTARMS predicted nodal power had an average error of 3%, and the maximum eigenvalueprediction error was observed to be less than 0.1%.
3.2 Local Peaking Factor CalculationTo certify the integrity of fuels in core performance evaluation, the linear heat generation rate,HGR(m.n), of a fuel rod m in a node n, which is defined by:
HGR(m, n)=C.LPF(m, n).P(n) (14)

00oCore Thermal Power, and Statepolnts 0 -12 (0 Is only for learning).
0 2 3 7 8 1 2—— ———«h
Control Rod Pattern Changed.
Core Thermal Power Change = 60% -100%," Coolant Flow Rate Change = 40% -100%.
Errors(%) Equivalent Eigenvalue Error(%)
RUS Error of Nodal Power Distribution\ ^ 0
„ • o- -o '*' •'-
^*</
b~
o0 • ' 'x ,' °
"n" *
0Core Thonn*l Power Prediction
-~~ Etrar(Equlv«lenttoElgenvaluoProdiction Error)
02
0.1
0.0
-0.1
1 2 3 4 5 6 7 8 9 10 11 12
Statepolnts
Fig. 5 Root mean square (RHS) error of TARHS-predlcted nodal powers, andthe core eigenvalue prediction error, observed In core follow calculations.
has to be calculated. Here, P is the average power density of node n, LPF is the local peakingfactor of fuel rod m in node n, and C is the unit conversion constant (watt/cc to watt/cm). Theaverage power density can readily be obtained from the nodal power. However, the local peakingfactors are not straightforwardly obtained by nodal methods, which are based on node-by-nodehomogenized diffusion equations. The lowest level approximation for local peaking factors in anode is obtained by the infinite-lattice calculations of the node. However, it does not include theeffect of neighboring nodes of different compositions on local peaking factors, because infinite-lattice calculations are usually carried out with zero-current boundary conditions. Several methodshave already been proposed to accurately calculate LPP '' ' " ' '.
In TARMS, the local peaking factors are calculated with sufficient accuracy within reasonablecomputing time by a method described below. Here, the point is to take into account the effectof radially neighboring nodes on the intra-nodal power distribution. Let Q(r) be the intra-nodalpower distribution, and adopt the 2-group diffusion model, then
10
-0
i0
-0
242001Oil
213006029
1.3690.007
-0.052
1.2740
-0
10
005061
242000
-0.070
1-0
384002
-0.084
l.-tüi-0.001-0.080
1 316-0.003-0 096
1.172-0.004
0.013
1.1680.0040.010
1.0770.0070.005
0.9730.0110.003
0.2570.0170.013
1.0850.008
-0.020
1.2260.005
-0.046
1.251-0.001-0.080
1.290-0.0060.028
1.0500.0030.032
0.2490.0100.017
0.8060.0090.031
0.7490.0130.026
0.8930.0110.011
0.008-0.020
1.384-0.002-0.084
1.187-0.008
0.028
0.9390.0020.038
0.7940.007
0.0000.0000.000
0.2390.0080.018
0.7490.0130.026
0.0170.013
1.2420.000
-0.070
1-0
0
@0
152010022
254007
0.017
00
000
000
000
00
1
735
239006019
000000000
806009031
Oil003
2740.005
-0.061
1.285-0.010
0.018
1.033-0.0020.03«
0.864
0.041
0.7350.0050.041
0.7940.0070.043
0.24 90.0100.017
0.0070.005
1.3690.007
-0.052
1-0
167007
0.007
1-0
0
10
o00
00o1o0
00
10
-0
158005024
033
034
254007on939002038
050003032
004010
213006029
1-0
230007
-0.007
1-0
0
1-0
0
1-0
0
1-0
0
1-0
0
-00
10
-0
167007007
285010018
152010022
187008028
2SO006028
004013
242 .001 .Oil .
Fuel enrichment (U235w/o) of the node In problem(center) and Its surroundings.
Local peaking factor by detailed calculation.Error of the present method (rms=0.007).Error of Infinite lattice calculation (rms=0.038).
Maximum LPF fuel rod.
Fig. 6 Local peaking factor comparison.
Q(r) = Sf1(r). F1(r) + Sf2(r). F2(r), (15)
where r is intra-nodal spatial coordinate, Sfg(r) is the g-th group macroscopic fission crosssection, and Fg(r) is g-th group neutron flux. Because the 1st (fast neutron) flux distributionF1(r) is much flatter than the 2nd (thermal neutron) flux F2(r), F1(r) can be well approximatedby the infinite-lattice solution. Only the effect of neighboring nodes on thermal neutron flux willbe considered. The thermal neutron flux F2(r) can be separated into:
F2(r) = Finf(r) + Ftr(r). (16)Here, Finf(r) is the infinite-lattice solution for the thermal neutron flux, obtained by the latticecalculation. Function Ftr(r) represents the deviation in the thermal neutron flux from the infinitelattice value caused by the non-zero thermal neutron current at the node boundary. In thepresent method, Ftr(r) is approximated by an analytic solution of a 2-dimensional node-by-nodehomogeneous diffusion equation with asymptotic boundary conditions. By using the approximatesolutions for thermal neutron flux and Eq.(13), one finally obtains local peaking factors in anode. The accuracy of local peaking factors so obtained was verified by comparing them to thoseobtained by multigroup, multi-assembly, heterogeneous (rod-by-rod) diffusion theorycalculations. Figure 6 shows comparisons of local peaking factors for a node obtained by (1)multigroup, multi-assembly, heterogeneous diffusion theory calculations, (2) by the presentmethod, and (3) by the infinite-lattice calculation. Here (2) and (3) are represented by thedifference from (1). In this case, the average fuel enrichment (3.3w/o) for the node in problem(containing eight by eight fuel rods, including two water rods at the center) is relatively higherthan those for its surrounding nodes. Therefore, the thermal neutrons flow into this node fromthe surrounding nodes, especially from the lowest enriched (1.3w/o) ones. This makes the localpeaking factors of fuel rods at the lower-left part of this node larger than those of the infinitelattice calculation. As can be seen from the figure, such effects can be taken into account verywell by the present method .
4. Conclusions
The TARMS on-line, on-site BWR core operation management system was developed, and is nowm use in eight BWR plants The adaptive learning method for TARMS was tested by using actualplant data, including gamma scannings, and was verified to be effective to increase the accuracyof power distribution evaluations, both in the core monitoring, and in core predictivecalculations A method for calculating the local peaking factors for fuel rods was also developedand tested by detailed heterogeneous calculations, and was verified to be sufficiently accurate Itcan be concluded that TARMS, with such advanced methods, can be a great aid for theoperators and site engineers to manage BWR core operations.
References
[1J I Mitsuhashi "Local power peaking monitor", Japanese patent document, Tokkaisho-62-106396,1987 (In Japanese)
[2] K R Rempe et al. "SIMULATE-3 Pin Power Reconstruction Methodology andBenchmarking", N S E, 103,1989.
[3] T. Iwamoto et al "A method to calculate local power distribution in fuel segments", Japanesepatent document, to be published (In Japanese)
THE PROBLEM OF CREATING A FULL SCALECOMPUTER SIMULATION CODE COMPLEX FORNPPs WITH RBMK REACTORS
E.N. DANILOVA, N.K. ZINOV'EVA, L.N. PODLAZOV,S.V. SMIRNOV, V.E. TREKHOVR&D Institute of Power Engineering,Moscow, Union of Soviet Socialist Republics
Abstract
At the present time one of decisive lactors both in creatinga new generation of reactors with improved safety and in safetyof the now operating NPP's i3 creation of qualitively newmathematical models and programs capable of modelling processestruly enough as well as capable of taking into account the wholecomplex of processes characteristic for normal NPP operation andemergency conditions.
The creation of the full scale computer code complex for NPPwith RBMK is a multispectral task which requiers joint efforts ofthe specialists of different specialities. This task covers thechoice and the justification of mathematical models of specifiedprocesses or reactor facility equipment, the choice and adjustment("calibration") of algorithmes for digital realisation of thesemodels, verification of computer codes and on the basis ofthese programs creation of programming complexes thatenables NPP researchers and development engineers to carry outall necessary investigations in ease interactive form andobtain informative images of the investigations. It is obviousthat each of the above-mentioned trends represents by itself aserious and large scale research work and must be thesubject of a special discussion.
The present paper reviews the problem of choice andjust- ification of digital solution algorithms of spatial model
ootoand its realization on computers, as well as research technicalproblems which deal with the creation of the lull scale modellingcomplex and special dialog system of communication with thiscomplex, system that will be applicable to NPP reactors ofthe channel-type.
I. GENERAI ASSUMPTIONS
At the present time one of decisive factors both in creating anew generation of reactors of improved safety and in increasing asafety of now operating NPPs is the creation of qualitatively newmathematical models and computer codes capable to reproducethe processes truly enought as well as capable of taking intoaccount the whole complex of process characteristics fornormal NPP operation and emergency conditions.
In spite of this it is necessary to stipulate exactly thetypes of both the models and the simulation that should bementioned in this paper.
For the total safety analysis we want to have not only themodels but the models of NPPs processes and components thatcombines both the features of pure "mathematical" models as alsothe features of so-oalled "computer simulation" models. The modelsof last type now are widely spread in the NPP's trainingsimulators and research simulators, but for the safety analysistheir speed is not very important. Therefore, we must effectivelycombine the either.
The following main features of safety simulation models are ofthe most importance:
- information-object space for processes and components of thesystem to be modelled although does not copy the physical 3D (ormore) images of its elements, but must be constructed according tothe popular ideas because of extremely large value ofinformation that excludes or brings to minimum the "training" or"getting used" function;
- the modelling a situation is a machine experiment and itsorganization and analysis are imposible without less or moreautomatized data base because of a lot of parameters to be given,calculated and analysed;
- code complex for the model must be "mobile" (that is it mustbe transferable from one machine to another) in correspondingcomputer class ( mainly "main-frame" or higher), and all itscomponents, including the data input-output, must be written inhigh level international standard computer language what is nowthe Fortran-77.
That's why the creation of full-scale code complex for NPPswith RBMK is a multispectral task which requiers joint efforts ofthe specialists of different specialities.
In this list of tasks are:- the choice and the ground of different processes or
equipment mathematical models of a reactor unit;- models numerical realization methods choice and refinement;- code verification;- code complex creation on the ground of these oodes allowing
to NPP's research and development personnel to get all thenecessary images of the results and to carry out their studies infriendly interactive form.
Apparently, that every of listed above areas is itself a seri-ous and large-scale scientific work and must be the subject ofspecial discussion [3,4,5]-
Now in the institutes connected to the RBMK design and safetyanalyses ( NIKIBT, IAE, NPPKD) there are some experience of RBMKprocesses and component adequate models creation.
There are the mathematical models of:- one- or two-group 3D diffusion core neutron kinetics;- heat transfer in the reactor core graphite laying;- two-phase time-dependent thermohydraulics of the core
channels;- primary loop, including safety systems;- RCS logic (especialy LAR, LAZ, AZ, BAZ, plant on-line
computer);- turbine and electrical systems.As the mathematical models being improved, the numerical
realization problems being promoted to the first plan. It isespecially illustrated by the comparison of requirements foralgorithms fast running and modern computer industry capacity.
The present paper reviews the problems of choice and algorithmsjustification of digital solution of the reactor spatial model andits realization on computers, as well as research technicalproblems which deal with the creation of full-scale modellingcomplex: and special dialog system of communications with thiscomplex, that will be applicable to NPPs with channel-typereactors.
II. THE COMPARISON OP SOME NUMERICAL LITTLE-GROUP SPATIALNEUTRON DYNAMICS PROBLEMS SOLVING METHODS USED FOR THE CODECOMPLEX "TROJA"
The choice of effective numerical equations solving methodsis one of the most complicated problems in spatial kineticsfull-scale modelling complex creation.
Now there is developed the complex problem studying technologybased on the creation and computer-aided analysis of themathematical models of the object to be investigated. This methodis called a computer experiment.
It is naturally to treat a calculation algorithm like anecessary component of a computer experiment.
The same mathematical task can correspond to a number ofdifferent discrete models. However far from the all of them aresuitable for a practice realization. Calculation algorithms mustsatisfy the contradictory requirements: the adequacy and thecomputer feasibility. The memory value and performance limitsusualy are the main obstacle for a correctly developed algorithmcomputer realization.
The task specifics is in the complex transient considerationnecessity in a large geometric size area and the calculation timeeven for the modern fast computers may be about of a number ofhours. This makes important the fast running of a numericalalgorithm.
The other important requirement for the numerical scheme isits absolute stability (at any D>0) and "unconditionalapproximation", that is the source equation acceptable

approximation with some difference scheme independently from thetime step (l) and the space step (h) corellation.
These requirements for the numerical method are connectedfirst to the full-scale reactor core model development and itleads not only to the calculation nodes number increase (about2000 plane points and a number of dozens hight levels) but even tothe large scale diffusion equation coefficients change.
Now the implicit schemes for the spatial kinetics equationssolving are of most eficiency but it does not exclude the othermethods applying.
The matematical model discrlpticnThe mathematical modelling of the neutron flux behavior
usualy is carried out in diffusion approzimation and it leads tothe parabolic nonlinear equations system solving having the zeroconditons at a border. In the one-group approximation the processis described in partial derivatives equation:
o\iKJ]
dci- = X,(* - C . ) ,dt 1 x i = 1,6
(1)
(2)
where: D = D{Dx ,Dy, Dz}Dx, Dy, Dz - diffusion coefficients accordingly in X-.Y-.Z-
directions.
dA - space derivatives vector,
di1r
t -
d d d= ( i — , 3 — , k — )3x ay dz
- neutron sources.
Equations coefficients D and are functions of feedbackparameters: burnup P, xenon concentracion X, fuel temperature T-,graphite temperatureTc , coolant density 7, the adsorber, followeror water presence (for RCS channels).
All the convent ionals in eq. 1,2 are of commonuse. Theequations are reduced to the finite-difference mode. In the caseof implicit scheme using we can solve then both by the direct orthe iterational methods.
The numerical methodsNow there are widely spread the iterational methods, in
partioulary the "over-relaxation" method. Those iteration methods(or succesive approximations methods) are that the decision z ofthe system Ax=f can be found like the limit at n going to oo forthe succesiive approximationsx , where n- iterations number. Asa rule, we cannot reach this limit in finite number of iterations.Usually we set a small quantity £>0 and continue our calculationswhile is not fulfilled the condition |X n'-x| < £. We can comparethe different iterational processes quality using the necessarynumber of iterations n(s) .

The "over-relaxation" method The using of the local-one-dimensional difference schemes
The "over-relaxation" method is the generalization of Seidelmethod and can be writen as:
.,) 1/0) (x<n+1)-x<n>) + Ax< n> = t (3)
oo
where D =diag[a.... ,a22,.... ,a ]-a diagonal matrix whith the samemain diagonale that is the A matrix;
A.J - lower triangular matrix with zero main diagonals;0) >0 - a given numerical parameter. \
The method converges at 0<u<2 .At the optimal choice of parameterOJ the necessary number of iterations needed to obtain a given
—1 —2accuracy s is of magnitude 0(h ) ,but not 0(h ) like in Jacobyand Seidel methods that is the main advantage of "over-relaxation" method to the other mentioned iterational methods.
The over-relaxation method was used in the code "TRIADA" forthe 3D spatial kinetics calculations with maximun 540 plane nodes.
We firstly assumed to use the code "TRIAUA" like a componentof the code complex "TROJA" that includes the spatial kineticscalculations like a subsystem together with the thermohydraulicsmodel, tne neutron physics constants calculation and the outerprimary equipment model.
But after changing to the full-scale reactor model we had metthe requirement to rise abruptly the number of the nodes thatleads to the considerable increase the computer runtime.
Besides that the runtime, if we use this method, essentialydepends on the inserted perturbation value and this can essentialymade difficult its using.
According to the mentioned above assumptions it seems possiblethe using of implicit schemes together with the "economical"methods where the number of arithmetical operations for gettingthe solution is proportional to the number of nodes. Among thesemethods there are: variable directions method, brokenup stepsmethod and local-one-dimensional methods.
2Prom the special methods of accuracy 0(1+ h ) the local-one-dimensional scheme is of most economical matter. Thecalculations with this scheme reduces to the succession of drivesin different directions. Because of the accuracy 0(T+h ) is notsufficient for fast transients calculations it seems reasonable touse the "predictor-corrector" Yanenko scheme together with the
o 2local-one-dimensional one, that provides the accuracy 0(1 + h ) .In the neutron kinetics calculation code used the local-one-
dimensionals (LOS) there are realized the following economicaldifference schemes:
A. The Douglas-Rachford scheme:
UH - U
u 2-u 1
(4)
(5)
(6)
u = + it (V)

B. The Yanenko "predictor-corrector" scheme:
U., - U
0.51= A1U1 (8)
Diffusion coefficient D and Kœ can vary in every activeelement, and the D coefficient can depend on the direction, so itis the vector D = (Dz, Dy, Dz) .
Let's consider the diffusion operator:a au a au a au
LU= (D (r,t) ) + (D(r.t) ) + (D(r,t) (12)
0.5t
U3 ~ U20.51
Û - U
= A3U3
(9)
(10)
(ID
A1, A«, A~ -difference (variational-difference) operatorscorrespondong to the three spatil components ofthe operator,
U = U ( t, x, y, z ) - the function to be found,Û = U ( t+T , x, y, s )f* = f (t + 0.51 ,x, y, z)
U.., U?, U,,- intermediate grid functions without theindependent physical meaning.
For the applying the local-one-dimensional schemes wecalculate for every direction the difference three-diagonal matrixof coefficients.
At every fixed t in every direction this operator is approximatedby the following difference expression :
i = -i? t a(zi+1,t) ] (13)
where the difference coefficient a(x ,t) is set lucea(xi,t) = 0.5 ( D1(zi,t) + D xj .t)) (14)
(1 - tli.| -
The local-one-dimensional schemes using leads to thefollowing two errors :
1) discretization error ;2) error of the method, i.e. the substitution of the operator
- ili-j ) by local-one-dimensional reverse(1 - 1L.J ) (1 - lLg)(1 - tLo) for a complitely implicitscheme .Theoretical considerations show that both errors are of
2 2 2magnitude 0(i +h ) or 0(1 +h ) depending on the method beingused
The Da Fort - Frankel three-layer schemeThe three-layer schemes sometimes are used to icrease the
approximation order and to improve the stability.

The Du Fort and Frankel scheme ("rhomb") looks :
n+1_ 11-1 y? _ n+1_jiyi yi yi-1 yi yin+1._„n-1 n(15)
and is derived from the Richardson's explicit scheme by means ofsubstitution in the right pert to the . The
n+scheme remains explicit for y. and is absolutly stabil (at anyh and t ) . We can write the "rhomb" scheme like:
r t
where: y =(y -2y /+?
(16)
(17)
The term ~ provides the stability . The scheme has the? 2conditional approximation of the order 0(h ) at 1 =0(h ) .
So, if we put, for example, 1 =h , then the equation (13)will approximate the hyperbola- type equation.
The main advantage of the Du Port and Frankel scheme is itsrealization simplicity. The necessity to use the small time step(in order of 0.001) is compesated by the possibility of comletevectorization for matrix-CPU computers.
To compare the effectivities of different numerical methodswe take in capacity of base variant the variant with the numbercalculation nodes 540*43 (540 points in plane, 43 - in hight). Thecalculation yields that the runtime per 1 node per 1 time step isfor the:
over-relaxation method - 4.2*10 - 7.2*10 s for Ap = 0.5-1.5 correspondingly;
local-one-dimesional scheme - 8.3*10" s.Du Fort - Frankel scheme - 4-8*10~5 s.
This characteristics show that we can use the over-relaxation method for the calculation slowly changing processesallowing the time step of magnitude 0.1 s and higher. In the sametime, the time step for fast transients (taking to account the RCSfeatures simulation) can not be more than 0.01 s.
III. THE CODE COMPLEX STRUCTURE AND THE OPERATIONALPRINCIPLES
The code complex "TROJA" is written on Fortran-77 and consistof the following main parts:
- the leading code (main);- the neutron diffusion equation solving code (flux);- the code for initial input from the reactor data base(cyltran);
- the control system simulation code (res);- the hydrostatics and hydrodinamics boiling channels code(xfzO.sdyn);
- the diffusion equation coefficients calculation code(kcl);the three-dimensional distribution calculations of
graphite temperature, fuel temperature andxenon concentration (termoxen);
- the data acquisition code for displaying and control thesimulation (speoout).

00ooThese codes works under the management of the leading code
"main" as shown on fig.1
main
cyltran xfzO/sdyn kcl|
flux res termoxen specout
Pig.1 Complex TROJA subroutines controlled by leading code
"main".
Besides that we have the data displaying codes that works inasynchronous regime of information exchange with the the mentionedabove codes:
- the code to yield the "pancake-type" images, power trendsand the other time-dependent graphics(z4);
- the code to yield height distributions of the coreparameters(v2);
- the code to yield isometrical images(s6).Both z4,v2 H z6 codes interact with the main calculation code
complex using the file system as shown on fig.2.The files "fotol","foto2",... are the "snapshots" of modelled
object and, using them we can make an arbitrary quantity imagesproduced dy codes z4,v2 and z6.
The amount of simultaneosly made displays is restricted onlyby the needs of the research work and by the quantity of screensavailable.
We have a practical experience in simulataneous usage of 15terminals, to which the RBMK state was yielded during the controlrod self-moving experiments and Chernobyl-like accident computersimulation.
The examples of yielded images are shown on the slides1,2,3,4,5,6,7,8,9,10, applied to the report.
The file "control" contens the control information to set thesimulation regime. Research-operator can, at arbitrary time, usingthe orbitrary screen editor, to set the change of reactor internaland external parameters at any current or future time, forexample :
- to move or to stop a control rod or a group of control rods;- to increase or to decrease the inlet coolant flow for achannel or a group of channels;
- to change the inlet enthalpy for channel or a group ofchannels;
- to change the steam-drum pressure.This given parameters' set was used in practice during the
RBMK accident simulation, but we can enlarge it arbitrary.Including this, according to the testing interests, we can enterthe local or total flux or reactivity perturbatuions at any time.
To monitor the perturbations the results are displayed in file"inf" which cab be read using an ordinary screen editor.
The file "ixjy.p" is used for on-line changes in data listsfor files "fotol","foto2",...
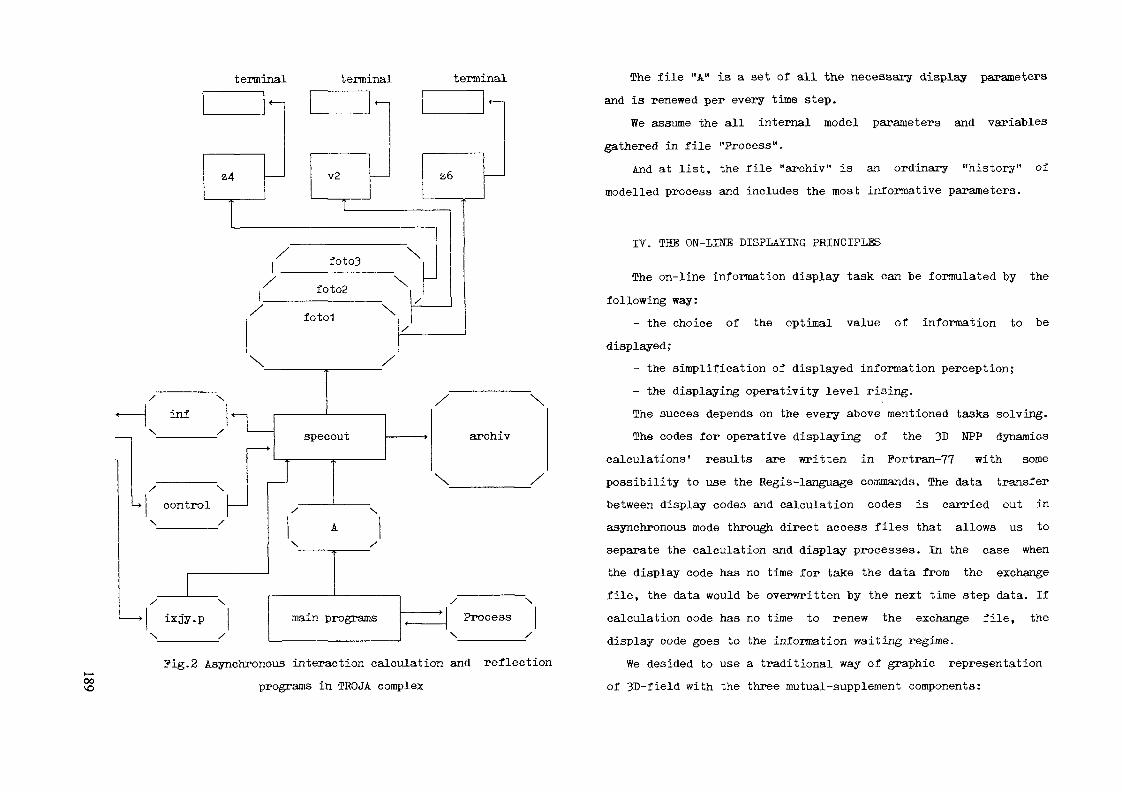
terminal terminal terminal
/foto2
fotol
s,
to3
\
\
\
H
specout
X
main programs
00VO
Pig.2 Asynchronous interaction calculation and reflectionprograms in TROJA complex
The file "A" is a set of all the necessary display parametersand is renewed per every time step.
We assume the all internal model parameters and variablesgathered in file "Process".
And at list, the file "archiv" is an ordinary "history" ofmodelled process and includes the most informative parameters.
IV. THE ON-LINE DISPLAYING PRINCIPLES
The on-line information display task can be formulated by thefollowing way:
- the choice of the optimal value of information to bedisplayed;
- the simplification of displayed information perception;- the displaying opérâtivity level rising.The succès depends on the every above mentioned tasks solving.The codes for operative displaying of the 3D NPP dynamics
calculations' results are written in Fortran-77 with somepossibility to use the Regis-language commands. The data transferbetween display codes and calculation codes is carried out inasynchronous mode through direct access files that allows us toseparate the calculation and display processes. In the case whenthe display code has no time for take the data from the exchangefile, the data would be overwritten by the next time step data. Ifcalculation code has no time to renew the exchange file, thedisplay code goes to the information waiting regime.
We desided to use a traditional way of graphic representationof 3D-field with the three mutual-supplement components:
- the height-averaged coloured map of a field or the one-levelmap (vertical or horizontal) for the current or previoustime step together with process trend for integral and localreactor power;
- the height functioins graphics in an arbitrary plane point atthe current time step;
- the isometrical field image with user-guided colour scale ata given time step.
The mentioned above is realized by the three codes z4,v2,z6.The code z4 outputs on a screen the two coloured maps of NPP
power field. The one shows the current reactor state and the other- the previous (initial) one. ?or every map it also displayed themodel time of the data generation, the colour scale and thegraphic of two parameters, one of which is integral power and theother is arbitral. The frequency of the information renovationdepends on:
- the data renovation speed;- the quality and the magnitude of data changes considerable
to the previous step, but in any case it can be regulatedtaking into account the ergonomical and computer experimenttasks requirements.
The code z6 outputs on a terminal screen the colouredisometrical power field image, obtained at a current time stepfrom the calculation code. We can turn around the image on 0 ,90°,180°, and 270° .
To the same screen we output the model time, obtained fromthe calculation code, the colour scale and the isometrical anglesmarks.
Note that the colour scale in z4-code is fixed and in thez6-code is variable. This is made for z4 to simplify the mapscomparison and for z6 to use the all colour range.
The code v2 outputs to the screen the hight functions graphicsthat describes the reactor core, for example:
(N)- the height profile of initial neutron flux U (Z),- the height profile of current neutron flux U(Z),- the local manifolding factor K(X)(Z),- the diffusion factor M2(Z) or L2(Z),- the coolant density
for the two arbitrary choosed channels (z is the height )at currenttime step.
We output to the same screen the model time obtained from thecalculation code, the channels coordinates and the colour scale.
We consider that the described above information value beingdisplayed by the mentioned graphics mode is enough foroperational displaying of the simulated process, but someextension can be made, for example, the control rods positioningetc.
V. THE CONCLUSION
Now in the KDIPE it is constructed the code complex TROJAthat allows to solve full-scale simulation task for RBMK-typereactors. The complex has intellegent means for calculationresults displaying and also the computer experiment control duringthe simulation that allows one to make operative decision duringthe modelling.

The solved tasks scope covers complicated tramsients andaccidents without the core damage.
The complex TROJA is written in Portran-77 and can be used atany computer having a Fortran-77 compiler without anymodifications.
The creation of this complex required the thorough analysis,choise and improving firstly the numerical methods of neutronkinetics tasks solving.
All the methods was specially tested using the reactor neutronflux behavior criteria under the conditions of inserted flux andreactivity perturbations. And also there were choosed or speciallydeveloped the methods and the software means for operationalcalculation results displaying that allows to make the computerexperiment analysis in an acceptable time.
Now we use the complex TROJA to carry out the comprehensiveanalysis of the Chernobyl accident.

VD LIST OF PARTICIPANTS
M.J. ABBATE
U. ADALIOGLU
K.J. ANDEZEJEWSKI
C. BANGIL
R. BECKER
P. BERGEONNEAU
P. BERNARD
W.E.O. BERNNAT
P. BIOUX
Gerencia Area Investigaciony DesarrolloAvenida del Libertador 82501429 - Buenos AiresArgentinaCekmece Nuclear Researchand Training CenterP.K. 1Navaalani/IstanbulTurkey
Institute of Atomic EnergySwierk05-AOO OtwockPolandEDF/DER1, Av. du General de GaulleF-92141 Clamart CedexFranceVEB Bergman-BorsigStammbetrieb des Kombinates KabAbt. NI -4Petersplatz 9Allee der Kosmonauten 32D-1140 BerlinGermanyCEADER/SPRC/LEDC. BT.212CEN CADARACHEF-13108 St. Paul-lez-Durance CedexFrance
C.E. A., Centre d'Etudes Nucléairesde Cadarache, DRP/SPRC - Bldg. 230
F-13108 St. Paul-lez-Durance CedexFranceUniversität StuttgartInstitut für Kernenergetikund Energiesysteme
Pfaffenwaldring 31D-7000 Stuttgart 80GermanyEDF/DERl, Av. du General de GaulleF-92141 Clamart CedexFrance
T. BISIAUX
F. BLANCHON
G.B. BRUNA
A,L. CASADEI
B. CHANARON
H. CHOUHA
P.L. CORNILUS
M.J. CRIJNS
A.S. ERK
H. FINNEMANN
Tour Fiat, Cedex 15F-92084 Paris - La DéfenseFranceEDF/DERl, Av. du General de GaulleF-92141 Clamart CedexFranceFRAMATOMETour Fiat, Cedex 15F-92084 Paris - La DéfenseFranceWestinghouse Electric Corp.Commercial Nuclear Fuel DivisionP.O. Box 3912Pittsburgh, PA. 15230USA
C.E.N. - CadaracheCEA/DRN/DEC/SCOSF-13108 St. Paul-lez-Durance CedexFranceFRAGEMA/FRAMATOME10, rue Juliette RécamierF-69006 LyonFranceTour Fiat, Cedex 15F-92084 Paris - La DéfenseFranceInternational Atomic Energy AgencyDivision of Nuclear PowerNuclear Power Technology SectionP.O. Box 100A-1400 ViennaAustria
Faculty of Sciences and ArtsYildiz University80270 Sisli, IstanbulTurkey
Siemens AG, KWU, B3/B313Hammerbacher Str. 12 + 14D-8520 ErlangenGermany

E. FIOEINO
M.J. HALSALL
K.N. IVANOV
V. JAGANNATHAN
A. KAVENOKY
A. KERESZTUEI
T. KÜLIKOWSKA
V.S. KUUL
J.J. LAUTARD
R. LENAIN
EHELDirezione Studi e Ricerche -Vice Direzione Nucleare
G.B. Martini 31-00198 RomeItalyAEA TechnologyWinfrith Technology CentreDorchester, DorsetUnited KingdomInstitute for Nuclear Researchand Nuclear EnergyBoulevard Lenin 72Sofia 1784Bulgaria
Bhabha Atomic Research CentreTheoretical Physics DivisionBhabha Atomic Research CentreTrombay, Bombay 400085IndiaCommissariat a l'Energie AtomiqueC.E.N. SaclayF-91191 Gif-sur-Yvette CedexFranceCentral Research Institute for PhysicsKonkoly Thege Ut 29-33Budapest XIIHungaryInstitute of Atomic EnergySwierk05-400 OtwockPolandExperimental Machine BuildingDesign Buereau
GorkyRussia
C.E.A.DRH/DMT/SEEMA/LENRCentre d'Etudes Nucléaires de SaclayF-91191 Gif-sur-Yvette CedexFrance
C.E.A.DRN/DMT/SEEMA/LENRCentre d'Etudes Nucléaires de SaclayF-91191 Gif-sur-Yvette CedexFrance
M. LIZORKIN
D. LUTZ
G. MARLEAU
E. MARTINELLI
G. MATHONNIERE
G. MINSART
J. MONDOT
E.Z. MUELLER
Gérard NAUDAN
I.V. Kurchatov Institute ofAtomic Energy
I.V. Kurchatov Sq.lMoscow 123182Russia
Institut für Kernenergetikund Energiesysteme (IKE)
Universität StuttgartPfaffenwaldring 31Postfach 801140D-7000 Stuttgart 80GermanyInstitut de Génie EnergétiqueEcole Polytechnique de MontréalCase Postale 6079, Succursale AMontréal, QuébecH3C 3A7CanadaENEA - CRE CASACCIAS.P. Anguillarese, 3011-00060 RomeItalyC.E.N./SaclayDMT/SERMAF-91191 Gif-sur-Yvette CedexFrance
CEN/SCKKRO Reactor Physics (BRI)Boeretang 200B-2400 MolBelgiumC.E.A.Centre d'Etudes Nucléaires
de CadaracheDRN/DER/SPEC/LEPhF-13108 St. Paul-lez-Durance CedexFrance
Atomic Energy Corporationof South Africa Ltd.P.O. Box 582Pretoria 001South Africa
C.E.A.Centre d'Etudes Nucléaires
de CadaracheDRN/DEC/SECAF-13108 St. Paul-lez-DuranceFrance

S. NISAN
B. PETROVIC
I. PETROVIC
D. PEVEC
J. PLANCHARD
V.V. PSHENIN
B. ROULIER
M. SALVATORES
E. SARTORI
L. SAUVAGE
Commissariat à L'Energie AtomiqueDER/SISBat. 211CEH/CadaracheF-13115 St. Paul-lez-DuranceFranceRuder Boskovic InstituteMaterials Research andElectronics Dept. (OOUR IME)Bijenicka C.54P.O. Box 101641001 ZagrebYugoslaviaC.E.A., Centre d'Etudes Nucléairesde Saclay, DRN/DMT/LENR/SERMAF-91191 Gif-sur-Yrette CedexFranceFaculty of Electrical EngineeringDepartment of PhysicsUnska 3, P.O. Box 17041001 ZagrebYugoslaviaE.D.F.Direction des Etudes et Recherches1, avenue du General de GaulleF-92141 Clamart CedexFranceI.V. Kurchatov Institute ofAtomic Energy
I.V. Kurchatov Sq.lMoscow 123182RussiaE.D.F./SEPTEH12-14 Avenue DutrievozF-69628 Villeurbanne CedexFranceC.E.A., Centre d'Etudes Nucléairesde Cadarache, DRP/SPRC - Bldg. 230
F-13108 Saint-Paul-Iez-Durance CedexFranceOECD/NEA Data BankF-91191 Gif-sur-YvetteFrance
DER/SSAECEN CadaracheF-13115 Saint-Paul-Iez-DuranceFrance
J. SLOBBEN
T. SMUG
Z. STANKOVSKI
E. TANKER
J.-B. E. THOMAS
V.E. TREKHOV
A. TRKOV
M. TSUIKI
J. VACEK
Netherlands Energy ResearchFoundation ECN
P.O. Box 11755 ZG PettenNetherlands
Ruder Boskovic InstituteBijenicka C.54, P.O. Box 1016OOUR IME41001 ZagrebYugoslavia
C.E.N./SaclayDMT/SERMAF-91191 Gif-sur-Yvette CedexFranceTurkish Atomic Energy AuthorityAlacam Sokak no.9Kavaklidere-06690AnkaraTurkeyC.E.N./SaclayDMT/SERMAF-91191 Gif-sur-Yvette CedexFranceR&D Institute of Power Engineering(RDIPE)Moscow, 101000RussiaJozef Stefan InstituteJamova 39P.O. Box 10061111 LjubljanaYugoslaviaToshiba CorporationNuclear Engineering Lab.4-1, Ukishima-cho, Kawasaki-ku,Kawasaki 210Japan
Power Machinery PlantSkoda Plzen, Concern Enterprise316 00 PlzenCzechoslovakia
A. VALLEE FRAMATOMETour Fiat, Cedex 15F-92084 Paris La DefenseFrance

J.P. WEST EDF/DER1, Av. du Général de GaulleF-92141 Clamart CedexFrance
L. WILK Ontario Hydro700 University AvenueToronto, OntarioH5G 1X6Canada
CD
T3Û)
COCD
CT0)

TECHNICAL COMMITTEE MEETING AND WORKSHOP ONLWR CORE DESIGN PARAMETERS
REZ, CZECHOSLOVAKIA, 7-11 OCTOBER 1991

SUMMARY OF THE TECHNICAL COMMITTEE MEETINGAND WORKSHOP
Session 1 - Benchmarks
Chairman: Mr. T.Q. NguyenRapporteur: Mr. J. Vacek
Six papers concerning the reactor core benchmark calculations werepresented in this session. Most of them analyze benchmarks for latticescontaining Gd as a burnable absorber. The performance of simpler codes(SUPERB ID transport, 2D-diffusion, LWRBOX 2D transport) was compared withMonte-Carlo (MONALI and MCNP) and was shown to be satisfactory. While theinitial Gd worth in SUPERB was lower than that in LWRBOX, Gd depletionburns at a fasten rate. The application of RSYST to Gd-containing latticewas presented with stressing the importance of homogenization procedure andproper treatment of fission products. The results in various cases for BWRbenchmark with adjacent Gd pins were near to target accuracies, butsubstantial differences exist between individual codes even in the case ofthe uniform lattice. A comparison of performance of HEA Data Bank andAHSWERS code and library versions was reviewed. The use of "1986 AHSWERS"library results in increase of kinf and its slower decrease during burnupfor uniform lattice and in decrease of kj f for Gd cells. Theapplication of WIMS to both calculational and experimental benchmarks wasalso presented in this session.Highlights of the discussion were as follows:1. WIMS and its library are widely used. Therefore all the library
development is relevant to broad range of participants.2. Simple methods are often successfully used in the analysis of
experiments and operating data thanks to the cancellation of errors atdifferent stages of the calculation.
3. To analyze some effect in more detail, it seems to be necessary toinclude into intercomparison more detailed data, e.g., microscopiccross sections or reaction rates of individual isotopes.
4. Attention should be paid to the proper treatment of Gd isotopes andfission products.
5. In advanced codes homogenization based on conservation of reactionrates is better than just flux volume weighted approach. Effectivediffusion coefficient for cells with strong absorber, based on theconservation of leakage can be used to link transport and diffusiontheory. The discontinuity factor should be used more widely.
6. Influence of time step length in integration of burn-up equations andof the radial pin subdivision for Gd absorbers were investigated. The
analysis shows that steps of the order of hundreds of MWd/tU and 4zones in the pin are satisfactory.
7. Data for diffusion codes can be based on the calculation of fuelassemblies with reflective boundary conditions. In more complicatedlattices (MOX) and on the boundary with the reflector, moresophisticated methods should be applied.
8. The dispersion of results even for uniform lattices suggests that forthe codes to be successfully applied in core analysis it is necessaryto validate the computing system against the broad database ofoperational data.
Session 2 - Methods for Core Parameters Calculation
Chairman: Mr. M.J. HalsallRapporteur: Mr. V. Lelek
There were six presentations in the framework of the Session 2,concerning basic theoretical concepts, comparison with experimental dataand the simulation of strong absorbers. Most of them used variationalapproaches to connect the experimental data with the theoretical models andto find the reasons for the differences between models and reality. It isclearly possible to use theoretical methods and experimental informationtogether in such a way that the computer code's will smooth out random andeven systematic uncertainties in experimental measurements, and will rejectmeasurements that are definitely in error.
A new theoretical approach was formulated on the interpretation,computation, and use of the adjoint function. Further theoretical analysesare necessary to be sure that the new formulations will keep themathematical and physical properties of adjointness. Demonstration onsimplified examples would be desirable.
In the context of theory and its verification by means of benchmarks,it is necessary to formulate more explicitly what the precise targets areand within which bands the results are acceptable. Such bands or targetswould add useful information to the sets of curves which are the results ofbenchmark calculations and code intercomparison. The use of high qualityexperimental data is necessary to provide the final evidence about errorsand computational accuracy.
l-J Session 3 - Core Monitoring and Experiment
Chairman: Mr. L. SauvageRapporteur: Mr. 0. Hrazdil
Session 3 consisted of two topics(a) Core Monitoring(b) Experiment
Gore Monitoring:
Three papers were presented in this part of the Session 3. The PCcontrolled system of CAMAC units used for the measurement and for theevaluation of the basic safety and reactor physics parameters of theexperimental reactors in H8I at Rez was described. This system has beenused for the measurement of the critical height, reactivity, reactivitycoefficients, buckling, radial and axial neutron flux distributions on theLR-0 and LVR-15 experimental reactors. An overview of the use of the RITMEmethod for on-line applications and studies based on 3-D PWR coresimulation was presented. The simulator is used in a testing facility forPWR core monitoring and instrumentation optimization. An advanced coremonitoring and operational support system, BEACON, was also presented withan outline of the numerical scheme, hardware requirements and applicationsof the system to improve plant operational flexibility and availability.Experiment:
Three papers were presented, all concerning experiments on the LR-0reactor in NRI at Rez. An outline of recent experimental programmes forWWER core parameters estimation was presented. The versatility of LR-0reactor for experimental studies of core parameters was demonstrated on astudy concerning the interpretation of a self-powered detector response.WWER reactor dosimetry and pressure vessel exposure monitoring is aprogramme which is aimed to increasing the pressure vessel life. Modelexperiments performed on LR-0 in connection with this programme werepresented and the PC experimental data base and the evaluation programmeswere described and discussed. For years the LR-0 reactor has played asignificant role in the verification of the accuracy of calculationmethods. Some examples of this testing were also presented.
Session 4 - Fuel Management
Chairman: Mr. H. MoldaschlRapporteur: Mr. J. Rocek
Many of technical and economic features of a nuclear plant arecross-coupled and partially nonlinear. Thus, when calculating energycosts the complete set of all influences should be considered. While
complex computer programs can improve precision for design, they do notnecessarily foster understanding of fundamental interrelations. Thereforea rather simple plant model ("COMO") developed at Siemens and based onexisting results and experiences is under preparation, which considers allimportant design parameters and process variables, e.g. water sidecorrosion with, temperature correction, optimization of the power history orthe RPV fluency. Since fuel expenses are an important component of totalnuclear power costs, the first module of the above mentioned code dealswith the core and the fuel cycle. A set of examples is given. Anothermodules for the steam generator and the whole secondary loop are underpreparation.
Results of analysis of the departure from nucleate boiling ratio(DNBR) for an equilibrium cycle of an advanced PWR core with prolongednuclear fuel burnup carried out at VINCA were presented. The analysis andthe results given indicate that increasing the total discharge burnup andintroducing advanced refueling schemes require more sophisticated safetyanalysis, i.e. more detailed both physical and thermal-hydrauliccalculation models and methods.
Activities in Turkey concentrate on one step from the in-core fuelmanagement of PWR, which includes: (i) a criterion to select the bestreload pattern; (ii) power and depletion calculations on trial patterns tocheck the safety constraints; (iii) an optimization method to determine thebest pattern. Strong dependence on initial guess pattern was observed, sothat the method generates and calculates final patterns for each of thedistinctly different initial guesses. The optimization method was foundsuitable for sifting through a large number of possible patterns, to selecta few to be analyzed more accurately.
The advancement of powerful engineering workstations has made itpossible to have thermal-hydraulics and accident analysis computer programsoperating efficiently with a significant performance/cost ratio compared tolarge mainframe computer. Recognizing these trends Westinghouse adopted asoftware development life cycle process for the software developmentactivities which strictly controls the development, testing andqualification of design computer codes. In addition, the results ofcomprehensive test matrices establish the Quality Assurance basis andconsistency for the same software operating on different computer platforms.
The KARATE program system of the Hungarian Atomic Energy ResearchInstitute has been constituted to calculate WWER-1000 units. Test resultsobtained for the first fuel cycle of NPP Kalinin are given. The calculatedboron concentrations agree fairly well with the measurements. The kqdistributions are also in accord with the measurements, though there theexperimental values are sometimes contradicting. As to the axial shapes,they suit fairly well, but some corrections of the extrapolation distancesat the top and bottom of the core should be introduced.
The FUMACS code package developed at the University of Zagreb enablesin-core fuel management analysis of PWR core. Its validation was performedby comparison of FUMACS results with design parameters for the first eightreload cycles of NPP Krsko core. The differences between obtained resultsand reference data show that the FUMACS code package is the fast andreliable code system suitable for repetitive and numerous in-core fuelmanagement calculations.

N)O
Conclusions of the session were as follows:1. The development effort on the one hand and the large amount of
knowledge available, offer the chance of performance of optimizationprocedures for the whole power plant on a work station.
2. The large amount of nuclear energy installed, asks for a perfectcalculation of all important parameters and variables to decreaseuncertainties.
3. The wide-spread of nuclear energy also asks for coupled treatment ofneutronic-thermohydraulic problems for quasi-stationary and fastdynamics calculation.
Session 5a - Core Design of WWER
Chairman: Mr. M. MakaiRapporteur: Mr. J. Svarny
The presentations indicate a tendency in WWER using countries toverify their core design and operational codes. The presentation pointedout the need for an up-to-date safety analysis of WWERs. The verificationis done by benchmark calculations and by comparison to experiments.Extended measured data on critical facilities (ZR-6, LR-0) are availableand help the verification. As to the benchmark problems, they are justbeing set out. The first calculations of the Kalinin-1 benchmark revealedcontradictions in the benchmark data.In conclusion the following recommendations can be formulated:1. The endeavor of WWER users to reassess safety analysis requirements
should be assisted by recommendations concerning the structure andmethodology of SAR.
2. The verification of core calculation raises such problems as softwaredocumentation, quality assurance, verification standards etc. IAEAassistance in this field is desirable.
3. The effort to define benchmark problems should be countinued. Thebenchmark data should be revised taking into account the remarks above.
4. Those having capabilities of WWER calculations are encouraged tocalculate the proposed benchmarks.
Session 5b - Core Design for PWR. BWR. HWR
Chairman: Mr. M. NurdinRapporteur: Mr. P.D. Krishnani
In this session papers on various aspects of core design sight fromthe design of the core to the design of spent fuel pool and thermalhydraulics for studying, hot spots were presented.
The experimental reactors of early design were having 93% enrichedU-235. In order to prevent the proliferation of such a highly enrichedfuel (HEU) it is being suggested to use low enriched uranium (LEU) withenrichment less than 20%. The design of small LWRs using LEU and SEU fueldeveloped in Argentina were presented. The particular case of HEU to LEUfuel conversion was also considered. Finally, he discussed theoptimization of the fuel management by taking into account the radioisotopeproduction requirement of RAS.
In order to improve the accuracy of calculation for Th-core fuelmanagement, a new Indonesian procedure to overcome the over-estimation ofthe worth of the control fuel assembly was discussed. It was interestingto see the corrections applied depending upon the environment and theequivalence of homogeneous transport and diffusion calculations.
A paper presented the results under various conditions for a 300MW(e) PWR calculated using the lattice code WIMS D-4 and 2-D diffusioncode EXTERMINATOR-2.
A physical and mathematical model used in the Romanian thermalhydraulic code COBRA-VI-I for hot spot analysis of fuels for both LWRs andPHWRs was discussed. Included were some results obtained in assessing thedegree of conservatism of the hot spot factors evaluation during the LWRcore thermohydraulic design.
Workshop Session 1 - IFM Code Package Validation for PWR
Chairman: Mr. D. PevecRapporteur: Mr. V. Jagannathan
Under the CRP on In-core Fuel Management (IFM) Code Package Validationfor PWRs, the present status was reviewed and future plan of action bydifferent participants was discussed.
During the previous RCM in Vienna (December 1989), there were onlyparticipants present from Spain, Yugoslavia and India. South Africa,Turkey and the IBK Institute from Belgrade have joined later in this CRP.The country status is given below:Spain: Calculations for cycle-1 follow-up have been completed. Cycle-2results are to be provided.Yugoslavia (Zagreb): Revised calculations following some changes in inputdata will be completed in 3-4 months.
India: Results of a 2-D code (Level-2) for the two cycle follow-upanalysis were submitted in March 1991. Revised reformatted data can beprovided in about 6 months.
South Africa: All results have been received.
lo Turkey: Calculations are to be started. All possible results of level-2J3 codes will be provided by about 6 months.
Yugoslavia (Belgrade): Similar to Turkey.The participants have been provided with a specific format for submitting
the results of lattice analysis. Additional temperature points have also beenincluded.
Workshop Session 2 - IFM Code Package Validation for WWER
Chairman: Mr. M. MakaiRapporteur: Mr. S. Thomas
Workshop session 2 discussed the problems of WWER benchmarks, which formpart 3 of the CRP on In-core fuel management. The WWER benchmarks consist oftwo parts:
first six fuel cycles of WWER-440, Kozloduy unit 2, submittedby Mr. T. Apostolov;first six fuel cycles of WWER-1000, Kalinin unit 1, submittedby Mr. V. Saprikin.The CRP participants began solving the benchmarks and presented the first
results at the TCH. The session concluded that the WWER-440 benchmark waswell documented, the minor errors could easily been corrected. However, majorerrors and discrepancies were found in the WWER-1000 benchmark. Theparticipants could not clarify them and they proposed to contact Mr. Saprikinfor eliminating the discrepancies in the benchmark.
In addition to the WWER-1000 benchmark, Mr. T. Apostolov presented abenchmark problem and solution for Kozloduy unit 5, a WWER-1000 unit. Thebenchmark was based on the first two fuel cycles. The operational history wasspecified and the assembly features are the same as in the Kalinin unit 1benchmark. Some participants volunteered to perform also a calculation onthis benchmark.
The participants were sorry that the submitted benchmarks did not includereliable experimental data for comparison thus creating a physical benchmark.Benchmark parameters were discussed and suggestions were made for values ofneeded input parameters.
Workshop Session 3 - Homogenization Techniques/Cross Section Representation
Chairman: Mr. M.J. HalsallRapporteur: Mr. T.G. Nguyen
1. Homogenization TechniquesDr. Halsall began by giving an overview of the cross section
generation process for core model calculation.Some discussion arose as to the need for such a topic as it was
pointed out that there are many publications/references available.Overall, the audience reached a consensus that this topic is worthwhile andthey would like to hear what is being done by others.
Dr. Hguyen discussed the fundamentals of homogenization as to why itis needed. Comments were given by Dr. Nguyen and supplemented by Dr.Halsall as to the strengths and weaknesses of various approaches(flux-volume weighted constants vs. reaction rate matching etc). Theconcepts of discontinuity factors and diffusion coefficient adjustment werediscussed. Specific examples were given for both lattice andbaffle/reflector region homogenization schemes in the PHOENIX-P and WIMScodes. The discussion was supplemented by several questions from theaudience.2. Cross-section Representation
Both Westinghouse and Winfrith cross section representation approacheswere presented. In general, a macroscopic cross section model is used incore calculations. Feedback mechanisms (such as water, doppler, boron,xenon, samarium) are treated either microscopically or by interpolation oftabulated data. History effect treatments were discussed and the generalconsensus is that this effect is relatively small and can be ignored ortreated in a simple manner by tracking fast to thermal flux ratios.

COMPARISON OF DIFFERENT WIMS LIBRARY VERSIONS TABLE 1. WIMS - Test Case 4
J VACEKNuclear Engineering Plant,Skoda Plzen,Plzen, Czechoslovakia
Abstract
This year Skoda has rented the authorized version of WIMS fromthe ANSWERS service. This version of the code is accompanied bythe 1986 version of the multigroup library. Employing differentversions of the code and its library now available at SKODANuclear Engineering Plant, we aim to evaluate the differences inresults caused by the use of different library versions and toassess their effects on the core characteristicsBasically, the use of the new library results in the increase inthe multiplication factor for experimental lattices and initialcore states and, due to the modificatiuon of fission productcross sections, to its slower decrease during burn-up. While thelatter property seems to have an favorable effect on results forWER analyses, the overall improvement of multiplicativeproperties has to be carefully analyzed, as it is directlyreflected in such basic core characteristics as the boron acidconcentration and the cycle length.
This year Skoda has rented the authorized version of WIMS fromthe ANSWERS service. This version of the code is accompanied bythe 1986 version of the multigroup library. At the time being, wehave at our disposal several versions of the code and itslibraries. Currently in use is the WIMS-D/4 version acquired fromNEA Data Bank (NEA 0329/13) with associated library received onJuly 2, 1990, and the WIMSD2A version rented from ANSWERS servicewith "1986' data library (AEEW-R 2133), which has been in usesince February 1991. Both versions are operated on IBM-4341mainframe, adapted NEA version also on the IMB-PC compatiblepersonal computer. Both versions can use either version of thelibrary.
Comparison of NEADB and ANSWERS versions performance withdifferent multigroup libraries is presented In Table 1. It can beconcluded that not the version of the program, but the version ofthe library makes a substantial difference
What troubles us a bit is a remarkable difference between8-group and 2-group values of k-inf in NEADB version It isprobably connected with incorrect interpretation - while k-inf in8 groups is computed using corresponding leakage spectrum, k-infin two groups is determined using zero leakage spectrum When
Program versionLibrary versionk-inf, SPECTROXPIJ Dancoff, innerk-inf, SPECTROXk-inf, CHAIN 14k-eff, BenoistPu-239 w/%, 500MWd/tPu-239 siga-epiPu-239 siga-th
NEANBA
1.3053460 498361.3063691.2943231 2181562.763E-214.981167.0
NEAANSWERS1.3204540.503441.3228031.3107011.2330642.367E-217 101174 7
ANSWERSNEA
1.3053430.498361.3063661.2943321.2181742.730E-215 111165.3
ANSWERSANSWERS
1.3204620.503441.3228081 3107341.2331262.374E-217 261173 2
Program version = NEA, library version = NEAbuckling search
input bucklings ratio radial axialk-inf 8 groupsk-inf 2 groups
1.2892121.293813
1.2723701.292195
1.2719551.292238
1.2725521 292176
ZADOC option is used with NEADB version, values of fission crosssections are not correct and ZADOC option is not compatible withMOMOD. Test case considered corresponds to standard WIMS TestCase no. 4.
At the end of the last year, a new WIMS Library UpdateProject has been initiated by the IAEA, coordinated by J.StefanInstitute. As we have been using WIMS for many years and intendto use it further on, we are naturally interested in any WIMSdevelopment and therefore we would like to take part in thecooperation proposed. We will not be able to participate ingeneration of WIMS multigroup libraries from basic nuclear datafiles, as we have no financial support for such an activity, butwe are prepared to participate in solution of selected problemsusing available libraries. The solution of numerical benchmarkssuggested for the first stage of the Project is presented inTable 2.
To assess an influence of the library version on theburnup, we re-solved a widely used Yankee burnup problem. Resultsare presented in Figure 1.
An influence of the new library version on the results forlattices containing Gd absorbers is illustrated in Figs. 2 and 3Results presented here under WIMS correspond to [4], WIMS86 arenew results with ANSWERS library, Lutz correspond to [5], Lutz-2to [6], Psenin to [7] and Prodanova to [8] Fig. 3 suggeststhat the inclusion of complete Gd chain (present in 1986 WIMSlibrary) results in decrease in kinf. The discrepancies betweenthe results of different codes are still remarkable
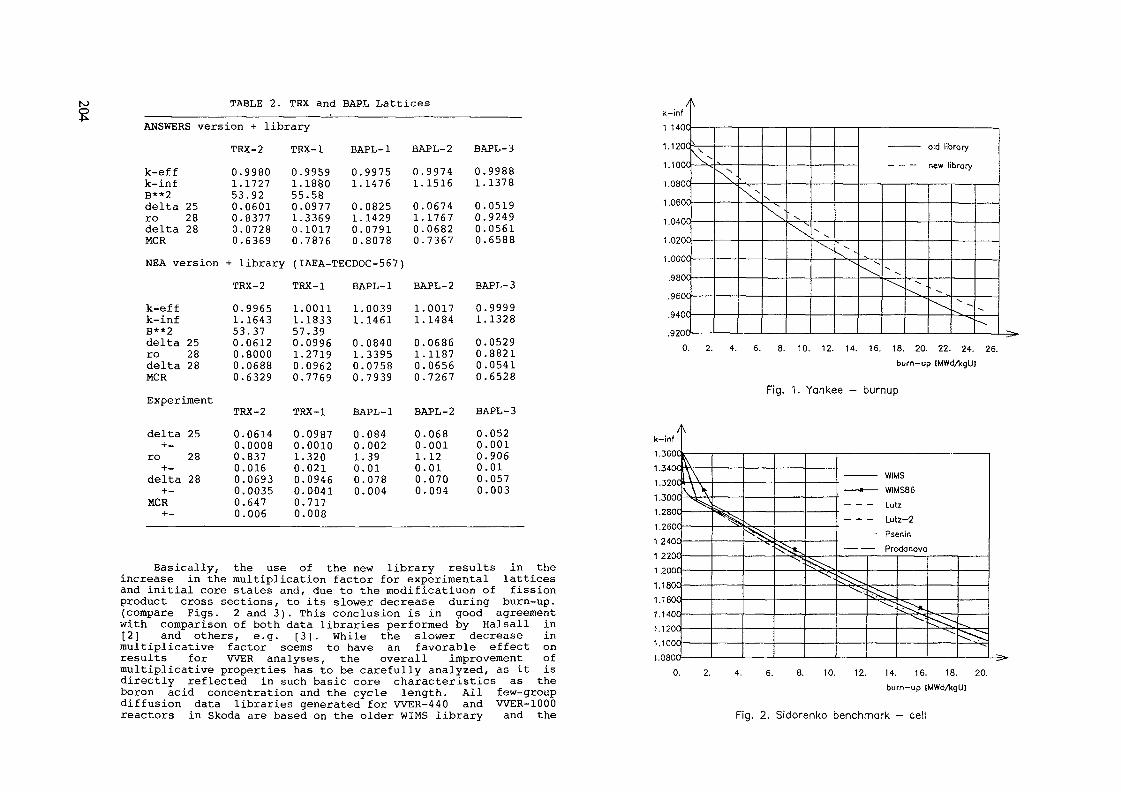
TABLE 2. TRX and BAPL Lattices
ANSWERS version + library
TRX-2 TRX-1 BAPL-1 BAPL-2 BAPL-3
0.9959 0.9975 0.9974
TRX-2 TRX-1 BAPL-1
0.99881.172753.920.06010.83770.07280.6369
1.188055.580.09771.33690.10170.7876
1.14760.08251.14290.07910.8078
1.15160.06741.17670.06820.7367
1.13780.05190.92490.05610.6588
k-eff 0.9980k-infB**2delta 25ro 28delta 28MCRNBA version + library (IAEA-TECDOC-567)
TRX-2 TRX-1 BAPL-1 BAPL-2 BAPL-3k-effk-infB**2delta 25ro 28delta 28MCRExperiment
0.99651.164353.370.06120.80000.06880.6329
1.00111.183357.390.09961.27190.09620.7769
1.00391.14610.08401.33950.07580.7939
1.00171.14840.06861.11870.06560.7267
0.99991.13280.05290.88210.05410.6528
BAPL-2 BAPL-3
delta+_ro+_delta+_MCR+-
252828
00000000
.0614
.0008
.837
.016
.0693
.0035
.647
.006
00100000
.0987
.0010
.320
.021
.0946
.0041
.717
.008
001000
.084
.002
.39
.01
.078
.004
0.0.1.0.0.0.
0680011201070004
000000
.052
.001
.906
.01
.057
.003
Basically, the use of the new library results in theincrease in the multiplication factor for experimental latticesand initial core states and, due to the modificatiuon of fissionproduct cross sections, to its slower decrease during burn-up,(compare Figs. 2 and 3). This conclusion is in good agreementwith comparison of both data libraries performed by Halsall in[2] and others, e.g. [3]. While the slower decrease inmultiplicative factor seems to have an favorable effect onresults for WER analyses, the overall improvement ofmultiplicative properties has to be carefully analyzed, as it isdirectly reflected in such basic core characteristics as theboron acid concentration and the cycle length. All few-groupdiffusion data libraries generated for WER-440 and WER-1000reactors in Skoda are based on the older WIMS library and the
/k-inf
1 HOC
1.100C
1 .080C
1.060C
1.040C
1 .0200
1.000C
.980C
.960C
Q70C
\
X-x~x N
X;• ^
X.•\N"v
v\ -^\^ -
old lib
• -_
\"
"
^^
0. 2. 4. 6. 8. 10. 12. 14. 16. 18. 20. 22. 24. 26.
burn-up [MWdAgU)
Fig. 1, Yankee - burnup
k-inf
1.340C
1.320C
1.300C
1.280C
1.260C
1 240C
1 22ÛC
1 200C
1.180C
1.160C
1.140C
t . 1 £V{j
1 nftnr
l\\M\"X^
^%5^
^^>v -^^vK^5$^
^
— *-
___ _,
§^^
— Will
- Lut
- Lut
• PS
— Prr.
^>^
tstsasz
2-2
snin
xJanova
sSst" ^^?-v" ~
^^^
^ S:
10. 12. H. 16. 18. 20.
burn-up [MWdAgU]
Fig. 2. Sidorenko benchmark - cell
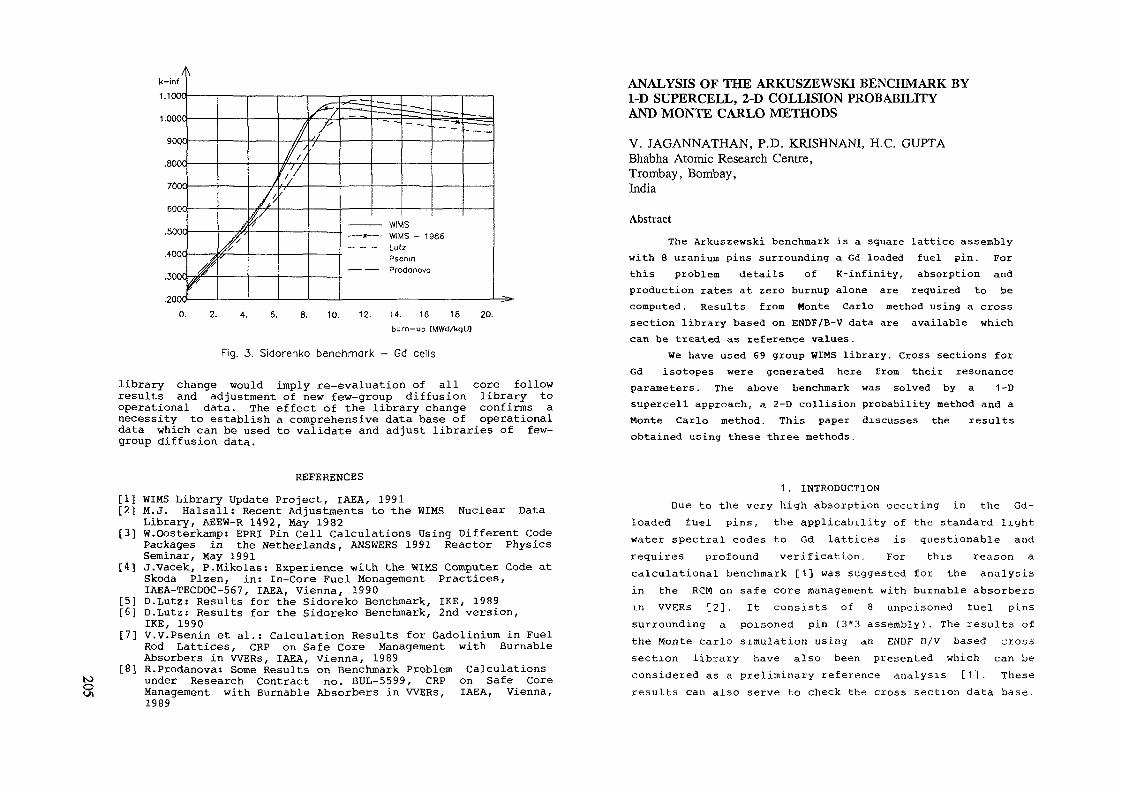
16 18 20.burn-up [MWdAgUJ
Fig. 3. Sidorenko benchmark — Gd cells
library change would imply re-evaluation of all core followresults and adjustment of new few-group diffusion library tooperational data. The effect of the library change confirms anecessity to establish a comprehensive data base of operationaldata which can be used to validate and adjust libraries of few-group diffusion data.
ANALYSIS OF THE ARKUSZEWSKI BENCHMARK BY1-D SUPERCELL, 2-D COLLISION PROBABILITYAND MONTE CARLO METHODS
V. JAGANNATHAN, P.D. KRISHNANI, H.C. GUPTABhabha Atomic Research Centre,Trombay, Bombay,India
Abstract
The Arkuszewski benchmark is a square lattice assemblywith 8 uranium pins surrounding a Gd loaded fuel pin. Forthis problem details of K-infinity, absorption andproduction rates at zero burnup alone are required to becomputed. Results from Monte Carlo method using a crosssection library based on ENDF/B-V data are available whichcan be treated as reference values.
We have used 69 group WIMS library. Cross sections forGd isotopes were generated here from their resonanceparameters. The above benchmark was solved by a 1-Dsupercell approach, a 2-D collision probability method and aMonte Carlo method. This paper discusses the resultsobtained using these three methods.
Si
REFERENCES
[1] WIMS Library Update Project, IAEA, 1991[2] M.J. Halsall: Recent Adjustments to the WIMS Nuclear Data
Library, AEEW-R 1492, May 1982[3] W.Oosterkamp: EPRI Pin Cell Calculations Using Different Code
Packages in the Netherlands, ANSWERS 1991 Reactor PhysicsSeminar, May 1991
[4] J.Vacek, P.Mikolas: Experience with the WIMS Computer Code atSkoda Plzen, in: In-Core Fuel Monagement Practices,IAEA-TECDOC-567, IAEA, Vienna, 1990
[5] D.Lutz: Results for the Sidoreko Benchmark, IKE, 1989[6] D.Lutz: Results for the Sidoreko Benchmark, 2nd version,
IKE, 1990[7] V.V.Psenin et al.: Calculation Results for Gadolinium in Fuel
Rod Lattices, CRP on Safe Core Management with BurnableAbsorbers in WERs, IAEA, Vienna, 1989
[8] R.Prodanova: Some Results on Benchmark Problem Calculationsunder Research Contract no. BUL-5599, CRP on Safe CoreManagement with Burnable Absorbers in WERs, IAEA, Vienna,1989
1 . INTRODUCTIONDue to the very high absorption occuring in the Gd-
loaded fuel pins, the applicability of the standard lightwater spectral codes to Gd lattices is questionable andrequires profound verification. For this reason acalculational benchmark [1] was suggested for the analysisin the RCM on safe core management with burnable absorbersin VVERs [2]. It consists of 8 unpoisoned tuel pinssurrounding a poisoned pin (3*3 assembly). The results ofthe Monte carlo simulation using an ENUF-B/V based crosôsection library have also been presented which can beconsidered as a preliminary reference analysis [1]. Theseresults can also serve to check the cross section daba base.

£o\ We have analysed this benchmark using three methods(il 1-D supercell approach [3], (11) 2-D collisionprobability method [4] and (111) Monte Carlo method [5] Thelatter two analyses have been performed using 69 group WIMScross section library In bhe first method a condensed 28-group WIMS library was used
A brief description of the three methods used in theanalysis is given in Section 2 Section 3 gives problemspecifications for the benchmark Results of the analysisare summarised in Section 4
2 CODES USED IN THE ANALYSISThe calculations were performed using the computer
codes SUPERB, LWRBOX and MONALI The computer codes SUPERBand LWRBOX are used for lattlceburnup analysis of LWRlattice cells and MONALI is a general geometry Monte Carlocode A brief description of these codes is given below
2 1 METHOD IN SUPERBIn the computer code SUPERB the calculations are
performed in three steps In the first step, various pincelltypes according to their enrichment and Dancoff factors areidentified in the lattice cell The multigroup transportcalculations are performed by interface current method in 1-D cylidrical geometry for these pincells and the multigroupcross sections for these lattice cell are spatially smeared
In the second step, a series of supercell calculationsin multigroups are performed in 1-D cylindrical geometry byinterface current method for assembly lattice cell, and forvarious heterogeneities such as water rod, poisoned pin oran absorber rod We consider a water rod, a poisoned pin oran absorber rod at the centre of the supercell, surroundedby rings of fuel pincell paste regions Multiple lings aieconsidered for the poisoned fuel pin The presence ot otherwater rod 01 other absorber iwatenais in the sunoundingrings is ignored in this calculation The cross sections are
collapsed to few (five) groups by using the appiopriatesupercell ring spectra For fuel isotopes microscopic crosssections are condensed after multiplying with respectiveflux advantage factors of pincell calculations tor non-burnable regions macroscopic cross sections are condensedafter multiplying with disadvantage factors for water rodand absorber rods the homogenisation and group collapsingare done upto the equivalent area of a pincell by normalflux and volume weighting procedure
In the third step, the 2-D fuel assembly i_ell isanalysed by few group diffusion theory Reflective boundarycondition is used Five point centre-mesh finitedifferencing of the diffusion equations is used Theeigenvalue or K , flux and power distribution are obtainedfrom this calculation
2 2 METHOD IN LWRBOXThe computer program LWRBOX has been developed to
calculate lattice parameters as a function of burnup forrectangular assemblies of LWRs In this code, the muitigroupintegral transport equation is solved by the combination ofsmall scale collision probability (CP) method and largescale interface current technique In this method, the wholelattice cell is divided into several connected cells whichcan further be subdivided into homogeneous zones Theinteraction between various zones within a cell and theircontribution to outgoing currents at cell interfaces aredirectly calculated by the CP method Each cell is connectedto neighbouring cells by interface currents At theseinterfaces, the angular flux in the incoming and outgoingdiiection is separately expanded in terms of sphericalhaimonics The simplest assumption is that of Isotropieangular flux ui pupulaily knuwn as cosine currentapproximation (i e , one term expansion) This appioximationhas been found tu be adequate foi nuiraal calculationsHowever, at present, upto six terms can be considered in the(_ode LWRBOX Anothei basic assumption of Hie method is that

the scalar flux is constant in each zone ot{i e , flat flux app
the region
2 3 COMPUTER CODE MONALIThe computer code MONALI is a Monte Carlo code
piimanly written tor calculating nuclear parametersassociated with thermal reactors The parameters calculatedby the code include multiplication factor, neutron flux,material absorptions, and leakage from outermost surfacesTreatment of anisotropy is possible upto the fust orderThe geometry module can handle any region which can beenclosed by a set of quadratic surfaces Six special formsincluding planes, cylinders and spheres are also presentAny number and combination of the surfaces can enclose aregion The outermost surface can also be any combination ofthese surfaces Any of the three boundary conditions,namely, reflective, white or vacuum boundary condition canbe applied on bhe outermost surfaces Neutron absorption isaccounted by reducing the weight at each collision When theweight reduces below a usei defined value the neutronhistory is terminated by Russian Roulette Iluxes arecalculated by any of the three estimators, namely, track-length, collision, or expected track-length estimatorsFrequency distribution of the multiplication factor is alsofound The Shapiro and Walk normality test is optionallyapplied to the batch estimates of the multiplication factorApplication of the test gives an indication about theadequacy of bhe batch size The code has restart optionalso
too
3 PROBLEM SPECIFICATIONSThe Arkuszewski benchmark [1] is a square lattice LWR
assembly with 8 uianium pins surrounding a gadolinium loadedtuel pin Fig 1 gives the cell numbering aftei taking intoaccount the symmetiy of the pioblem The cell yeometiyspecifications are yiven below
3Gd
Fig 1 Numbering of cells
Fuel pellet radiusInner clad radiusOuter clad radiusLattice pitch
The generic material specificatiuns aieRegular fuel enrichment (U-235)Regular fuel densityGd fuel enrichment (U-235)Gd tuel densityGd 0 fractionClad densityWater densityTemperature of medium
0 41135 cm0 4215 cm0 4015 cm1 35 cm
3 19 w/o10 126 g/cm33 48 w/o10 106 g/cm32 99 w/o6 55 g/cm30 9983591 g/cm320 °C
4 RESULTSIn the following results, 69-group WIMS library has
been used with identifiers 235, 2238, 3239 tor U-235, U-238and Pu-239 The cross sections for Gd-155 and Gd-157 havebeen obtained from their resonance parameters The resonancetable numbers 235 4, 2238 4 and 3239 1 respectively, havebeen used for the three isotopes mentioned above However,the calculations by the computer code SUPERB were performedby a condensed 28 group WIMS labraiy

800 The calculations by LWRBOX have been performed byng 1 zone each in the fuel and clad and 2 zones in
the water in the radial direction and 4 divisions in thei / j, mu Ilia 1 Uiiection in the ceils containing unpoisoned fuelpin» and 5 zones in tuel, 1 in clad and 2 in water in thexc.Uj.al direction and 1 division in the azimuthal directionin the cells containing poisoned tuel pins 1 term has beenconsidered in the expansion of angular flux at cellinterfaces
The lesults for this benchmark using the MCNP codehave also been piovided [1] The code MCNP is Monte Carlo
i_uue ctnd these results have been obtained using a crosssection library based on ENDF/B-V data These results arectlsu given in the following tables
The Tables 1 and 2 give the different eigenvalues andthe power, flux and absoipt:ons in the three cells Unitabsorption in the entire solution domain is assumed for fluxnoimaiisation The eigenvalue calculated by the computercode LWRBOX compares well with the MCNP value However, the^-infinity calculated by SUPERB and MONALI are higher byapproximately 1 8% and 1 1°. respectively The absorptions inthe Gd cells are underpredicted by SUPERB code and relativepin powers as calculated by different codes compare wellThe one-group integrated flux as calculated by the threecodes compare well except in the Gd cell in which the SUPERBvalue is approximately 3 \ larger compared to other codes
Table 1 Eigenvalues for the Arkuszewski Benchmark
Table 2 Local distributions of power tlux and absorption
Computer code
SUPERBLWRBOXMONALIMCNP
Eigenvalue
1 11821 10181 1119 ± 0 00231 1010 ± 0 0022
Computer code
SUPERBLWRBOXMONALIMCNP
SUPERBLWRBOXMONALI
SUPERBLWRBOXMONALI
0-Cell 1 U-Cell 2 Gd-Cell
Relative power density1 122 1 059 0 2791 120 1 060 0 2811 120 1 060 0 283
1 0885 0 2916
One Group Flux integral3 908 3 860 3 6243 900 3 841 3 5443 924 3 856 3 537
Relative absorption distribution0 100 0 0953 0 2190 0985 0 0941 0 22970 0992 0 0947 0 224
+ 0 0087 + 0 0083 ± 0 0451
Table 3 gives the absorption and production rates ofthe Gadolinium and Uranium isotopes in the 3 differentpincells for two eneigy groups with cutoff energy at 0 625ev and for single group
In general, the results of LWRBOX and SUPERB are onopposite sides of MONALI results and they are within 1 \ ofMONALI values The absorption in Gd isotopes is more in theLWRBOX results and less in SUPERB results compared to theMonte Carlo values As a result of this, the K calculatedooby LWRBOX is low compared to SUPERB
Tables 4 and 5 give the one and two group microscopiccross sections of U, Pu and Gd lootopes In Table 4 theyhave been Calculated using the following definition
xGnlef geG
^ /(i i vi + )ig ig'lef geG
(1)
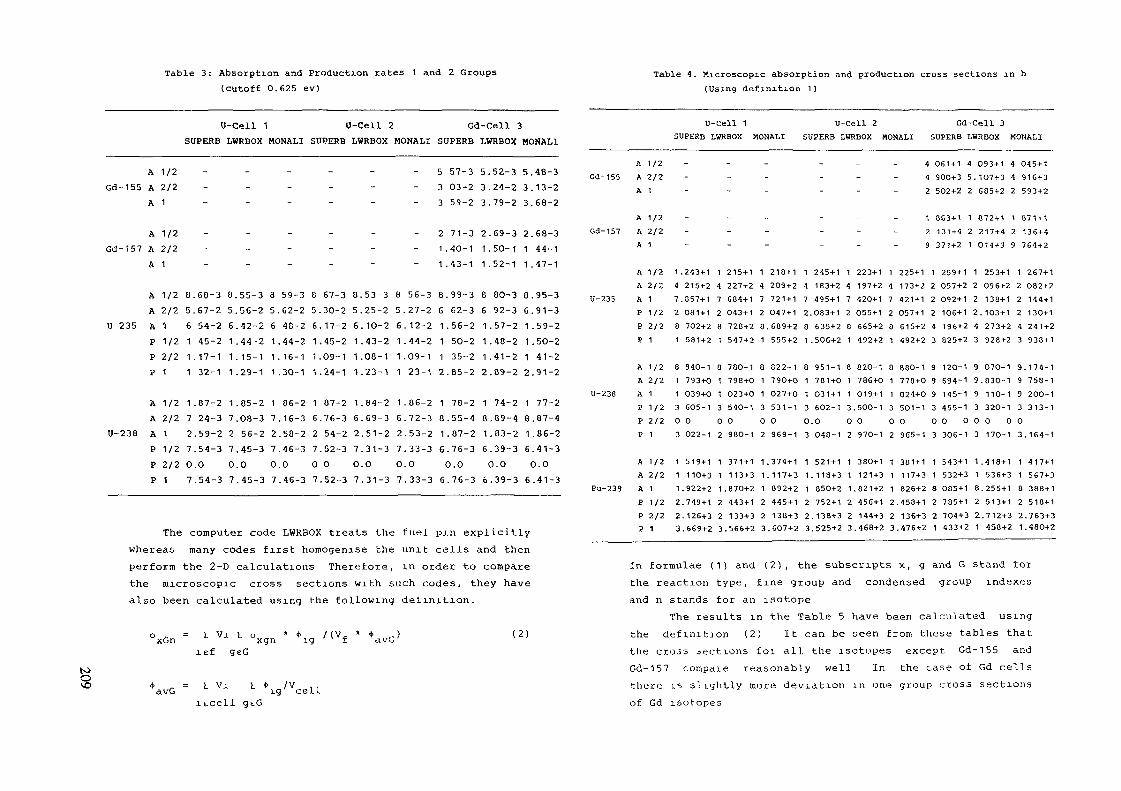
Table 3: Absorption and Production rates 1 and 2 Groups(cutoff 0.625 ev)
U-Cell 1 U-Cell 2 Gd-Cell 3SÜPERB LWRBOX MONALI SUPERB LWRBOX MONALI SUPERB LWRBOX MONALI
Table 4. Microscopic absorption and production cross sections in b(Using definition 1)
U-Cell 1SUPERB LWRBOX MONALI
U-Cell 2SUPERB LWRBOX MONALI
Gd-Cell 3SUPERS LWRBOX MONALI
AGd-155 A
A
AGel-157 A
A
AA
0 235 APPP
AA
U-238 APPP
1/22/21
1/22/21
1/22/211/22/21
1/22/211/22/21
8.5.611 .1
1 .727.0.7
—
60-367-254-245-217-132-1
,87-224-3.59-2.54-3.0.54-3
8.5.6.1 .1.1 .
1 .7.27,0.7
;55-356-2,42-2,44 -215-1.29-1
.85-2
.08-356-2.45-3.0.45-3
85.61 .1 .1 ,
17.27.0.7
;59-362-248-2,44-216-1
. 3O-1
86-2.16-3.58-2.46-3.0.46-3
85,6,11 ,1
162707
-
67-3.30-2.17-2.45-2,09-1.24-1
87-2.76-354-2.52-30.52-3
856111
162707
-
.53-3
.25-2
. 10-2
.43-2
.08-1
.23-1
.84-2
.69-3
.51-2
.31-3
.0
.31-3
85.6.1 .1 .1
1 .6.27,0,7
-
56-327-2,12-2,44-209-123-1
.86-2
.72-3
.53-2
.33-3
.0
.33-3
533
211
861112
1a16
6
57-303-259-2
71-3.40-1.43-1
.99-362-3.56-250-235-2.85-2
78-2.55-4.87-2.76-30.0.76-3
533
211
861112
1816
6
.52-3
.24-2
.79-2
.69-3
.50-1
.52-1
80-392-3.57-2.48-2.41-2.89-2
74-2.89-4.83-2.39-30.0.39-3
533
211
8G1112
1816
6
.48-3
.13-2
.68-2
.68-344-1.47-1
.95-3
.91-3
.59-2
.50-241-2.91-2
77-2.87-4.86-2.41-30.0.41-3
AGd-155 A
A
AGd-157 A
A
AA
U-235 APPP
AA
U-238 APPP
AA
Pu-239 A
1/22/21
1/22/21
1/22/211/22/21
1/22/211/22/21
1/22/21
1.47.281
811303
111
.243+1215+2.857+1081+1702+2581+2
940-1793+0039+0605-10022-1
519+1110+3.922+2
147281
011302
111
215+1227+2684+1043 + 1720+2547+2
700-1798+0023+0540-10980-1
371 + 1113+3.870+2
14720,1
011302
1.11
210+1209+2721 + 1O47 + 1,609+2555+2
322-1790+O027+0531-1O969-1
.374+1
. 117+3092+2
1472.81.
a1i3o.3
11.1
245+1103+2495+1083+1635+2. 50G+2
951-1701+0O31 + 1602-1.0040-1
521 + 1.118+3050+2
147281
8113O2
111
223+1197+2420+1O55+1665+2492+2
820-1786+0019+1.50O- 10970-1
38O+1121+3.821+2
147201
011302
111
4 061+1 4 093+1 4 045+14 900+3 5.1O7+3 4 91G+32 502+2 2 G85+2 2 593+2
1 OG3+1 1 872+1 1 571+12 131+4 2 217+4 2 136+49 371+2 1 014+3 9 7G4+2
225+1 1 259+1 1 253+1 1 267+1173+2421 + 1O57 + 1615+2492+2
800-1778+0024+0501-109G5-1
381 + 1117+3826+2
22243
9993O3
118
057+2092+1106+1196+2825+2
12O-1694-1145-1455-10 0306-1
543+1532+3O05+1
222.43
99.9303
1 .18
096+2138+11O3+1273+2928+2
070-1830-1110-1320-10 017O-1
,418+1536+3.255+1
22243
9.99303.
118
O82+?144+1130+1241+2930 + 1
174-1758-1200-1313-1
.164-1
417+1567+3388+1
The computer code LWRBOX treats the fuel pin explicitlywhereas many codes first homogenise the unib cells and thenperform the 2-D calculations Therefore, in order to comparethe microscopic cross sections with such codes, they havealso been calculated using the following definition.
xGn
avG
lef geG°xgn * *xg /(Vf * *avG> (2)
itcell gtG*ig/Vcell
P 1/2 2.749+1 2 443+1 2 445+1 2 752+1 2 4SG+1 2.458+1 2 785+1 2 513+1 2 510+1P 2/2 2.126+3 2 133+3 2 130+3 2.138+3 2 144+3 2 136+3 2 704+3 2.712+3 2.763+3P 1 3.669+2 3.566+2 3.607+2 3.525+2 3.468+2 3.476+2 1 433+2 1 458+2 1.480+2
In formulae (1) and (2), the subscripts x, g and G stand forthe reaction type, fine group and condensed group indexesand n stands for an isotope
The results in the Table 5 have been calculated usingthe definition (2) It can be seen from these tables thatthe croas oections foi all the isotopes except Gd-155 andGd-157 corapaie reasonably well In the case of Gd cellsthere is si ightly more deviation in one group cross sectionsof Gd isotopes
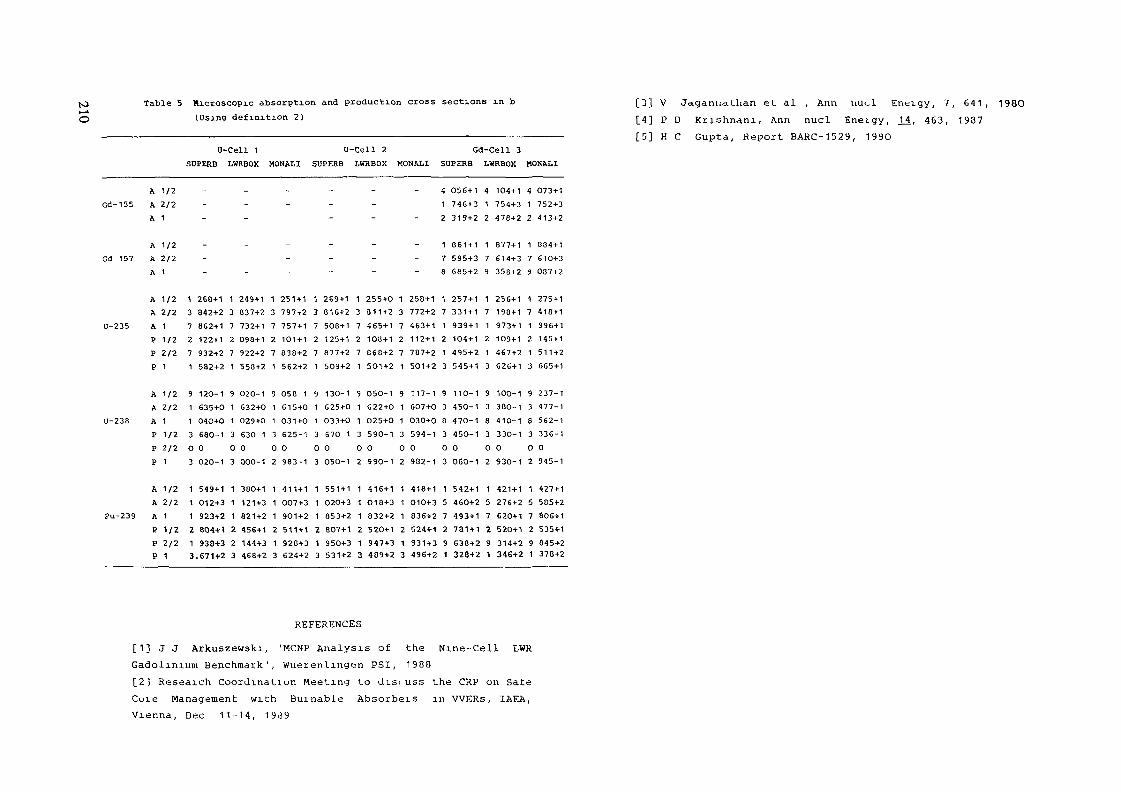
IO Table 5 Microscopic absorption and production cross sections in b»_•*O (Using definition 2)
U-Cell 1 U-Cell 2 Gd-Cell 3SÜPERB LWRBOX MONALI SUPERB LWRBOX MONALI SUPERB LWRBOX MONAtl
[3] V Jaganiiathan et al , Ann uut_l Energy, 7, 641, 198O[4] P D Krrshnani, Ann nucl Eneigy, 14, 463, 1987[5] H C Gupta, Report BARC-1529, 1990
Gd-155A 1/2A 2/2A 1
4 056+1 4 104+1 4 073+11 746+3 1 754+3 1 752+32 319+2 2 478+2 2 413+2
Od 157
A 1/2A 2/2
A 1
1 061+1 1 877+1 1 004+1
7 595+3 7 «14+3 7 61O+38 685+2 9 350+2 9 087+2
U-235
Pu-239
A 1/2 1 268+1 1 249+1 1 251 + 1 1 269+1 1 255+0 1 258+1 1 257+1 1 256+1 1 275+1A 2/2 3 842+2 3 837+2 3 797r2 3 816+2 3 011+2 3 772+2 7 331+1 7 198+1 7 410+1A 1 7 862+1 7 732+1 7 757+1 7 500+1 7 465+1 7 463+1 1 939+1 1 973+1 1 996+1P 1/2 2 122+1 2 090+1 2 1O1 + 1 2 125+1 2 1O8 + 1 2 112+1 2 1O4+1 2 1O9+1 2 145 + 1P 2/2 7 932+2 7 922+2 7 830+2 7 877+2 7 868+2 7 787+2 1 495+2 1 467+2 1 511+2P 1 1 582+2 1 558+2 1 562+2 l 509+2 1 5O1+2 1 501+2 3 545+1 3 626+1 3 665+1
A 1/2 9 12O-1 9 020-1 9 050 1 9 130-1 9 050-1 9 117-1 9 11O-1 9 100-1 9 237-1A 2/2 1 635+O 1 632+O 1 615+0 1 625+0 1 622+O 1 607+0 3 45O-1 3 30O-1 3 477-1
1 1 04O+O 1 029+0 1 031+O 1 033+O 1 O25+O 1 030+0 8 47O-1 8 410-1 8 562-13 68O-1 3 630 1 3 625-1 3 670 1 3 590-1 3 594-1 3 45O-1 3 33O-1 3 336-100 00 00 00 00 00 00 00 003 020-1 3 000-1 2 903-1 3 050-1 2 990-1 2 902-1 3 060-1 2 930-1 2 945-1
AP 1/2
P 2/2
P 1
A 1/2 1 5-59+1 1 380+1 1 411 + 1 1 551 + 1 1 416+1 1 418+1 1 542+1 1 421 + 1 1 427+1A 2/2 1 012+3 1 121+3 1 007+3 1 020+3 1 O18+3 1 O10+3 5 460+2 5 276+2 5 505+2A 1 1 923+2 1 821+2 1 901+2 1 853+2 1 832+2 1 836+2 7 493+1 7 620+1 7 8O6+1P 1/2 2 804+1 2 456+1 2 511+1 2 807+1 2 520+1 2 524+1 2 781+1 2 520+1 2 535+1P 2/2 1 938+3 2 144+3 1 928+3 1 950+3 1 947+3 1 931+3 9 638+2 9 314+2 9 845+2P 1 3.671+2 3 468+2 3 624+2 3 531+2 3 489+2 3 496+2 1 328+2 1 346+2 1 370+2
REFERENCES
[1] J J Arkuszewski, 'MCNP Analysis of the Nine-Cell LWRGadolinium Benchmark ' , Wuerenlingen PSI, 1988[2] Research CoorJrnatiun Meeting to d r s i u s s the CRP on SateCuie Management with Burnable Absorbers in VVERs, IAEA,Vienna, Dec 11-14, 19<39

ANALYSIS OF BENCHMARK ON INTERACTIVEEFFECTS OF GADOLINIUM PINS IN BWRs
V JAGANNATHAN, P D KRISHNANI, H C GUPTABhabha Atomic Research Centre,Trombay, Bombay,India
AbstractPresently, fuel as^emblips with adjacent poison pins
are employed in BWRs In ordei to check the capability ofvarious calculational methods used for calculating latticeparameters uf such assemblies, tht- Nuclear Energy AgencyCommittee on Reactor Physic-? (NEACRP) suggested a benchmarkwhich (.uiisisLs uf a. simple 4*4 fuel assembly with twoadjacent gadolinium rods In this report, the results of theburnup calculations fur this benchmark as calculated by the<_umputei codt^ SUPERB (1 D super cell) and LWRBOX (2-Deullrsiun probability) are piesented At 7eio burnup a MonteCarlo analvbis by MONALI codi1 has also been made Theanalysis by SUPERB cude used a condensed 20 group WIMSlibrary while for the other two methods the analyses havebeen earned ouL with G'J groups WIMS library The eumiaiisunof lesulto with these three codes is presented in thispaper
\ INTRODUCTIONIn boiling water reactors (BWRs), the gadolinium fuel
pins are used to control the reactivity changes due to fuelburnup Earlier, fuel assemblies of BWR contained twoisolated gadolinium fuel lods Now, fuel elements withadjacent poisoned fuel pins have been introduced in BWRs toenhance the peiforniance of the fuel It has to be checked,whether the ialculatiotial methods used in BWRs canadequately piedict the insulting mutual shielding ot thepins and, in particular, its effect on the depletion of theburnable poison
The Swiss federal Institute for Reactor Research (EIR)in 1900 proposed a new gadolinium benchmark for a simplifiedBWR fuel assembly with 14 unpoisoned and 2 adjacent poisonedfuel rods [1] The intention was to investigate whethercalculational methods us^d for isolated Gd pins are capableof treating this more complex geometry with sufficientaccuracy
The Nuclear Energy Agency Committee on Reactor Physics(NEACRP) provided an organizational basis for thisbenchmark The participants were asked to use their owncioss section libraries and group structures and to performburnup calculations upto 10 GWD/T In adjitji.n, a referencesolution for thi» regular unpoisoned pin was requested,allowing checks on basic data and calculalional methods tobe made
This calculation^! benchmark in square lattice wassuggested for the analysis in the RCM for CRP on ^afe c oremanagement with burnable absorbers in VVERs [2] (Thoughthis CRP is essentially engaged in improving nuclear dataand methods foi use of Gd in hexagonal cures like VVERs, itwas cosidered worthwhile to analyse parellelly some squarelattice benchmarks fur which many international solutions areavailable)
In this paper, the results of the burnup calculationsfor this benchmark as calculated by the computer codesSUPERB (1-D supercell) and LWRBOX (2-D collisionprobability) are presented At zero burnup a Monte Carlodiialybls by MONALI cude ua = als<. been niauc Section 2describes the calculational methods as used in SUPERB,LWRBOX, MONÀLI The Sectiun 3 gives the yiublemspecification and in Section 4 the it-oulto are presented
i CubnS USED IN THEThe calculations were performed using the computer
codes SUPERB, LWRBOX alid MONALI The computer *. udts SUPERBand LWRBOX aie u^ed 1 jr lattice burnup -iiuly^is ot LWR
to Ictttice cells and MONALI ib a geneial geometry Monte Cailo10 code A brief description of these codes is given below
2 1 METHOD IN SUPERBIn the compute! code SUPERB the calculations are
performed in three steps In the first step, various pincelltypes according tu bhen enrichment and Dancoff faeturs areidentified in the lattice cell The multigiuup tianspoitcalculation» aie pcrfuimed by interlace: cuirent method in 1-D cylidrical geometry for these pincells and the multigioupcross sections foi these labbice cell aie spatially smeaied
In the second step, a series of supercell calculationsin mulbigioups are performed in 1-D cylindr:cal geometry byinterface current method for assembly lattice cell, and forvarious heterogeneities such as water rod, poisoned pin oran absorber rod We consider a water rod, a poisoned pin oran absorber lod at the cenbre of the supercell, surroundedby rings of fuel pincell paste regions Multiple rings areconsidered for bhe poisoned fuel pin The presence of otherwater rod 01 other absorber materials in the surroundingrings is ignored in this calculation The cioss Sections arecollapsed to few (five) groups by using the appropriateiupeicell .cing tpectia ïui fuel isotopes microscopic crosssections are condensed after multiplying with respectiveflux advantage factors of pincell calculations For nun-burnable legions macroscopic cioss sections aie condensedattex multiplying with disadvantage factors Foi water rodand absorber rods the homogenisation and group collapsingaie done upLo the equivalent aiea of a pincell by noimalflux and volume weighting procedure
In the thud step, the 2-D fuel assembly cell isanalysed by few group diffusion theory Reflective boundarycondition la used iive point cell tl e-)\\esh finitedifferencing ot the diffusion equations is used Theeigenvalue 01 K , flux and puwei distribution aie obtainedflora this calculation
2 2 METHOD IN LWRBOXThe computer piogram LWRBOX has been developed to
calculate lattice parameters as a function of burnup forrectangular assemblies of LWRs In this code, the multigroupintegral transport equation is solved by the combination ofsmall scale collision piobability (CP) method and largescale interface current technique In this method, the wholelattice cell is divided into several connected cells whichcan further be subdivided into homogeneous zones Theinteraction between various zones within a cell and theircontribution to outgoing currents at cell interlaces aredirectly calculated by the CP method Each cell is connectedto neighbouring cells by interface currents At theseinterfaces, the angular flux in the incoming and outgoingdirection is separately expanded in terms of sphericalharmonics The simplest assumption is that of Isotropieangular flux or popularly known as cosine currentapproximation (i e , one term expansion) This approximationhas been found to be adequate for normal calculationsHowevel, at present, upto six terms can be considered in thecode LWRBOX Another basic assumption of the method is thatthe scalar flux is constant in each zone of the region(i e , flat flux approximation)
2 3 COMPUTER CODE MONALIThe computer code MONALI is a Monte Carlo code
primarily written for calculating nuclear paiametersassociated with thermal reactors The parameters calculatedby the code include multiplication factor, neutron flux,material absorptions, and leakage from outermost surfacesTreatment of anisotropy is possible upto the first orderThe geometry module can handle any region which can beenclosed by a set of quadratic surfaces Six special formsincluding planes, cylinders and spheres are also presentAny number and combination of the surfaces can enclose aregion The outermost surface can also be any combination ofthese surfaces Any of the thiee boundary conditions,

namely, reflective, white or vacuum boundary condition canbe applied on the outermost surfaces Neutron absorption isaccounted by reducing the weight at each collision When theweight reduces below a user defined value the neutronhistory is terminated by Russian Roulette Fluxes arecalculated by any of the three estimators, namely, track-length, collision, or expected track-length estimatorsfrequency distribution of the multiplication factor is alsofound The Shapiro and Walk normality test is optionallyapplied to the batch estimates of the multiplication factorApplication of the test gives an indication about theadequacy of the batch size The code has restart optionalso
3 PROBLEM SPECIFICATION
The simplified fuel element consists of 14 initially identical unpoisoned fuel rodi and
2 Gd rods Taking the symmetry into account, the 16 pins can be reduced to 5 different
unpoisoned pins and a single Gd pin Reflective boundary conditions arc prescnbcd on thefour surfaces The material properties are as follows
fuel Material U02 , density=10 g/cm3 , diameter = 1 cm,temperature = 600 °C, U-235 enrichment = 3 w/0,The Gd pin contains 3 w/0 of Gd 0
Clad Material = zircaloy-2, density = 6 55 g/i_m3 ,temperature = 300 °C, inside diameter - 1 cm,outside diameter = 1 2 cm
Moderator Material = HO, void content=0 °. , saturated at atemperature of 286 °C, (pressure = 70 06 bar),square lattice pibch = 1 6 cm
The assembly average power density is 20 W per gram of theuranium metal in the fresh fuel In addition, a burnupcalculation has also to be performed for a régulai latticewithout, buinable poison rods The regular lattice isequivalent to a single unpoisoned fuel pin with a UO3 2density of 10 g/cm and associated cladding and moderator
4 RESULTS
The calculations by the computer code SUPERB wereperformed by a condensed 28 group WIMS library 69-groupWIMS libiaiy has been used in LWRBOX and MONAL1 Elementidentifiers 235, 2238, 3239 for U-235, U-238 and Pu-239 andthe pseudo-fission product scheme for burnup calculationThe resonance table numbers 235 4, 2238 4 and 3239 1xesptctively , have been used for the three isotopesmentioned above The crob3 sections for Gd-155 and Gd-157have been obtained ft urn then resonance parameters
In LWRBOX, the calculations have been performed byconsidering 4 azimuthal zones in the cells containingunpoisoned fuel pins and 1 azimuthal zone in the cellscontaining poisoned fuel pins and 1 term has been consideredin the expansion of angular flux at cell interfacesHowevei , for the purpose ot comparing the results with MonteCarlo method we have taken 8 azimuthal zones instead of 4
Table 1 compares the multiplication factors of the twolattices, the absorptions in different materials andlelative pin power distribution in the poisoned lattice ascalculated by the three methods at zero burnup In the MonteCarlo results, percent fractional deviations (psd) are alsogiven It is seen from this table that the K and absorptionrates for regular lattice compare very well For poisonedlattice the Monte Carlo K value lies in between those ofoo
SUPERB and LWRBOX SUPERB over predicts K^ by 0 4\ TheLWRBOX K_ is slightly less compared to the Monte Carlovalue This trend may be due to the fact that theabsorptions in the Gd pin as calculated by LWRBOX is morecompared to MC value This can be further improved by takingmore subdivisions but the memory requirement increases to avery laige value The power in the Gd pin as calculated bySUPERB is more compared to MC value Because of 1-Dapproximation the Gd oeil absorption and GJ pin power areexpected to deviate more compared to LWRBOX from the MCvalues and is also st_en from Table 1 A detailed comparison

N> Table 1 Comparison of Results of SUPERB, LWRBOX and MONALI•^ aL 0 Burnup
Table 2 Reactivity and Poison Worth for Regular and Poisoned Latticea
Multiplication factorsSUPERB LWRBOX
Regular lattice 1 3395 1 3409Poisoned lattice 1 0163 1 0086
MONALI1 3404 ± 0 00291 0122 •*- 0 0023
Absorption in each matenal in regular lattice cellMaterial SUPERB LWRBOX MONALI psdluel 9 360-1 9 354-1 9 353 1 0 3Sheath 1 380-2 1 387-2 1 379-2 0 5Moderator 5 020-2 5 076-2 5 094-2 0 3Absorption in each material in poisoned lattice cellMaterial LWRBOX MONALI psdFuel-reg 7 005-1 7 049-1 0 2Fuel-Gd 2 470-1 2 425-1 0 8SheaLh 1 263-2 1 259-2 0 3Moderator 3 988-2 4 001-2 0 2
Relative pin powers in poisoned latticePin no
123456 (Gd-pin)
SUPERB1 1181 0611 1111 1631 0000 374
LWRBOX111100
114059116167998368
MONALI111100
118060120166988366
psd000000
644446626455
of flux distribution between LWRBOX and MONALI is given inthe reference [6]
Now we shall give the lesuits AS a function of burnupIn LWRBOX burnup steps were taken to be 500 MWD/T for therégulai lattice and 200 MWD/T for poisoned lattice cellinitially (upto 6000 GWD/T burnup) which was increased to500 MWD/T afterwards In SUPERB th<± buinup steps were
BurnupGWD/T
0 No Xe12345G78910
K-inf inityRégulai e-Reg
SUPERS
1 33951 20291 26851 25421 24031 22651 21331 19931 18671 17431 1623
LWRBOX SUPERB
11111111111
340920362691 0 01125532417 0 03322032151 0 05420221896 0 07517721652 0 094
K-in£iniLyCE) Poxsoned
LWRBOX SUPERB
1 01631 0179
0 011 1 04891 0763
O 033 1 10411 1325
0 053 1 16461 1791
0 073 1 18291 1757
0 092 1 1651
LWRBOX
1 00771 00401 03201 06371 09961 14041 17501 19021 18871 17941 1680
Gd - WorthSUPERB
00OOO00000-0
241207173142110077040017003001002
LWRBOX
0000000000-0
248218187153114072033010001002002
20O,3OO,500, 9*10OO MWD/T for regular lattice and 200,300,6*250, 8*500 and 4*1000 MWD/T tor poisoned lattice
Table 2 gives the variation of multiplication factorK^, with burnup for regular and poisoned lattices In thistable we d.lso give g (E) for regular lattice and o_, worthreg *Gdfor poisoned lattice o (E) is the reactivity loss above 1GWD/T for the regular lattice calculated as follows
< E ) = t K ( 1 0 ) ~ Kreg(E) K < 1 °>Q (E) compares well for the two methods The totalreactivity loss at 10 GWD/T as calculated by SUPERB is 94 mkwhile that of LWRBOX is 92 mkQG(J is the reactivity worth of Gd isotopes at any burnupdefined by
or-j(E) differ substantially which can explain the different(j<ntrends in the calculated K^, values of SUPERB and LWRBOX
Table 3 gives the number densities for U-235, Pu-239and Pu-240 for the regular lattice anU Table 4 gives thesame for the poisoned pin of the poisoned lattice cell
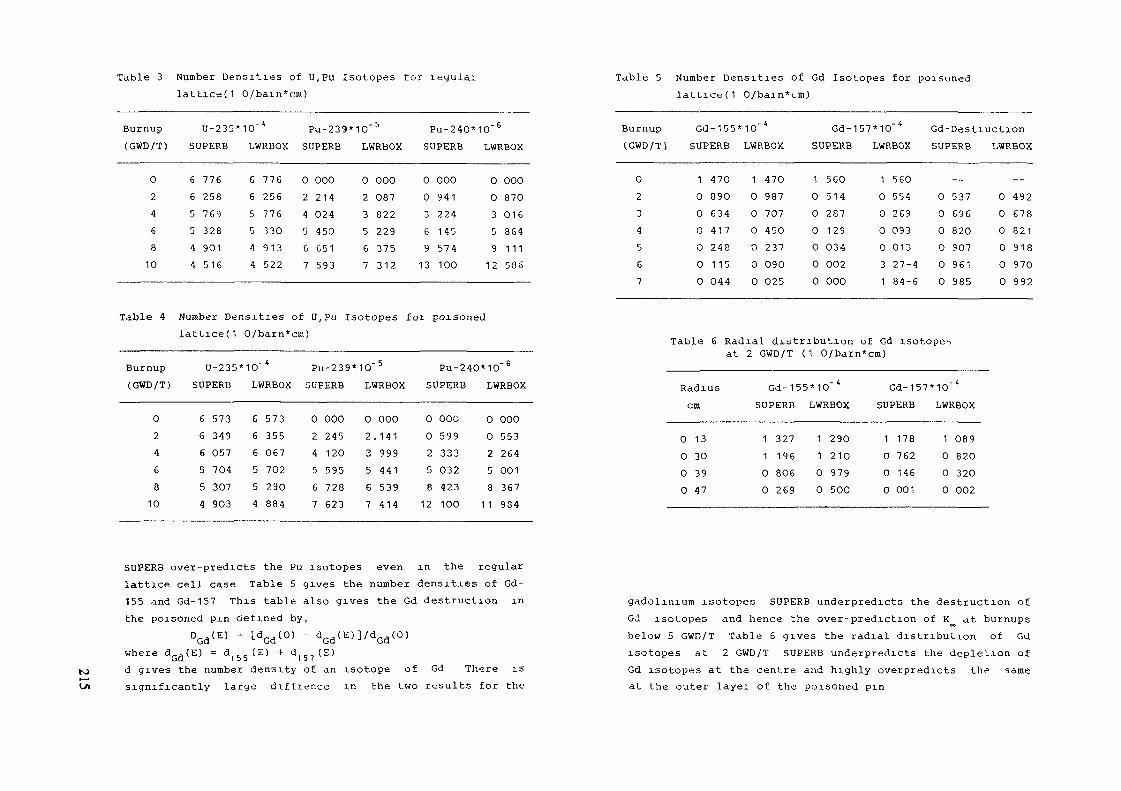
Table 3 Number Densities of U,Pu Isotopes torlattice(1 0/bain*cm)
Table 5 Number Densities of Gd Isotopes for poisoned1 0/bain*cin)
Burnup(GWD/T)
0246810
Table 4
Burnup(GWD/T)
0246010
U-235*10~A Pu-239*10"bSUPERB
6 7766 2585 7695 3284 9014 516
LWRBOX
6 7766 2565 7765 3304 9134 522
Number DensitieslatLice( 1
U-235:SUPERB
6 5736 3496 O575 7045 3074 903
SUPERB
0 0002 2144 0245 4506 6517 593
of U, Pu
LWRBOX
0 0002 0873 8225 2296 3757 312
Isotopes
Pu-240*10~6SUPERB LWRBOX
0 0000 9413 2246 1459 574
13 100
foi poisoned
0 0000 8703 0165 8649 11112 536
0/barn*cm)
MO"* Pu-239*10"5LWRBOX
6 5736 3556 0675 7025 2904 884
SUPERB
0 0002 2454 1205 5956 7287 623
LWRBOX
0 0002.1413 9995 4416 5397 414
Pu-240*SUPERB
0 0000 5992 3335 0328 423
12 100 1
io-6LWRBOX
0 0000 5532 2645 0018 3671 984
Burnup(GWD/T)
G2-~>
4567
Gd-155*10~4
SUPERB
1 4700 8900 6340 4170 248011 50 044
LWRBOX
1 4700 9870 7070 4000 2370 0900 025
Gd-157*10~4SUPERB
1 5600 5140 2370 1290 0340 0020 000
LWRBOX
1 5600 5540 2690 0930 0133 27-41 84-6
Gd-DestiuctionSUPERB
-_0 5370 6960 82O0 S070 9610 985
LWRBOX
--0 4920 6780 8210 9180 9700 992
Table 6 Radial distribution of Gd isotope^at 2 GWD/T (1 0/barn*cm)
Radiuscm
0 13O 300 390 47
Gd-155SUPERB
1 3271 1960 8060 269
*10~4LWRBOX
1 2901 2100 9790 500
Gd-157SUPERB
1 1780 7620 1460 001
MO'*LWRBOX
1 0890 8200 3200 002
10
SUPERB over-predicts the Pu isotopes even in the regularlattice cell case Table 5 gives the number densities of Gd-155 and Gd-157 This table also gives the Gd destruction inthe poisoned pin defined by,
DGdtE) = [dGd(0) - dGd(E)]/dGd(0)
where dGd<E) = <!,„<£) + d)57(E)d gives the number density of an isotope of Gd There issignificantly large dxffrence in the two results for the
gadolinium isotopes SUPERB underpredicts the destruction ofGd isotopes and hence the over-prediction of K^ at burnupsbelow 5 GWD/T Table 6 gives the radial distribution of GUisotopes at 2 GWD/T SUPERB underpredicts the depletion ofGd isotopes at the centre and highly overpredicts tht=- sameat the outer layei of the poisoned pin
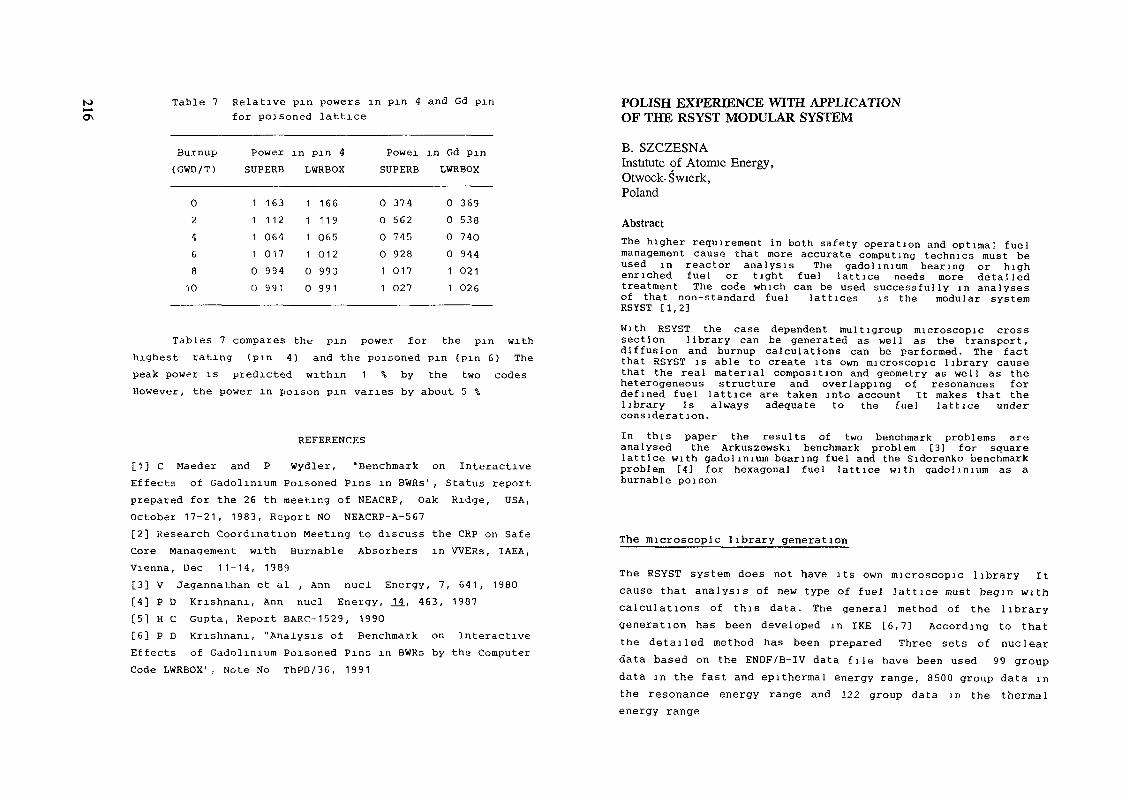
to Table 7 Relative pin powers in pin 4 and Gd pinfor poisoned lattice
Burnup(GWD/T)
0246810
Power in pin 4SUPERB LWRBOX
111100
163112064017994991
111100
166119065012993991
Powei in Gd pinSUPERB LWRBOX
000011
374.562745928017027
000011
369538740944021026
Tables 7 compares the pin power for the pin withhighest rating (pin 4) and the poisoned pin (pin 6) Thepeak power is predicted within 1 % by the two codesHowever, the power in poison pin varies by about 5 %
REFERENCES
[1] C Maeder and P Wydler, "Benchmark on InteractiveEffects ot Gadolinium Poisoned Pins in BWRs', Status reportprepared for the 26 th meeting of NEACRP, Oak Ridge, USA,October 17-21, 1983, Report NO NEACRP-A-567[2] Research Coordination Meeting to discuss the CRP on SafeCore Management with Burnable Absorbers in WERs, IAEA,Vienna, Dec 11-14, 1989[3] V Jagannathan et al , Ann nucl Energy, 7, 641, 1980[4] P D Krishnani, Ann nucl Energy, 14, 463, 1907[5] H C Gupta, Report BARC-1529, 1990[6] P D Krishnani, "Analysis of Benchmark on InteractiveEffects of Gadolinium Poisoned Pins in BWRs by the ComputerCode LWRBOX1, Note No ThPD/36, 1991
POLISH EXPERIENCE WITH APPLICATIONOF THE RSYST MODULAR SYSTEM
B. SZCZESNAInstitute of Atomic Energy,Otwock-Swierk,Poland
AbstractThe higher requirement in both safety operation and optimal fuelmanagement cause that more accurate computing technics must beused in reactor analysis The gadolinium bearing or highenriched fuel or tight fuel lattice needs more detailedtreatment The code which can be used successfully in analysesof that non-standard fuel lattices is the modular systemRSYST [1,2]With RSYST the case dependent multigroup microscopic crosssection library can be generated as well as the transport,diffusion and burnup calculations can be performed. The factthat RSYST is able to create its own microscopic library causethat the real material composition and geometry as well as theheterogeneous structure and overlapping of resonances fordefined fuel lattice are taken into account It makes that thelibrary is always adequate to the fuel lattice underconsideration.In this paper the results of two benchmark problems areanalysed the Arkuszewski benchmark problem [3] for squarelattice with gadolinium bearing fuel and the Sidorenko benchmarkproblem [4] for hexagonal fuel lattice with gadolinium as aburnable poison
The microscopic library generation
The RSYST system does not have its own microscopic library Itcause that analysis of new type of fuel lattice must begin withcalculations of this data. The general method of the librarygeneration has been developed in IKE [6,7] According to thatthe detailed method has been prepared Three sets of nucleardata based on the ENDF/B-IV data file have been used 99 groupdata in the fast and epithermal energy range, 8500 group data inthe resonance energy range and 122 group data in the thermalenergy range
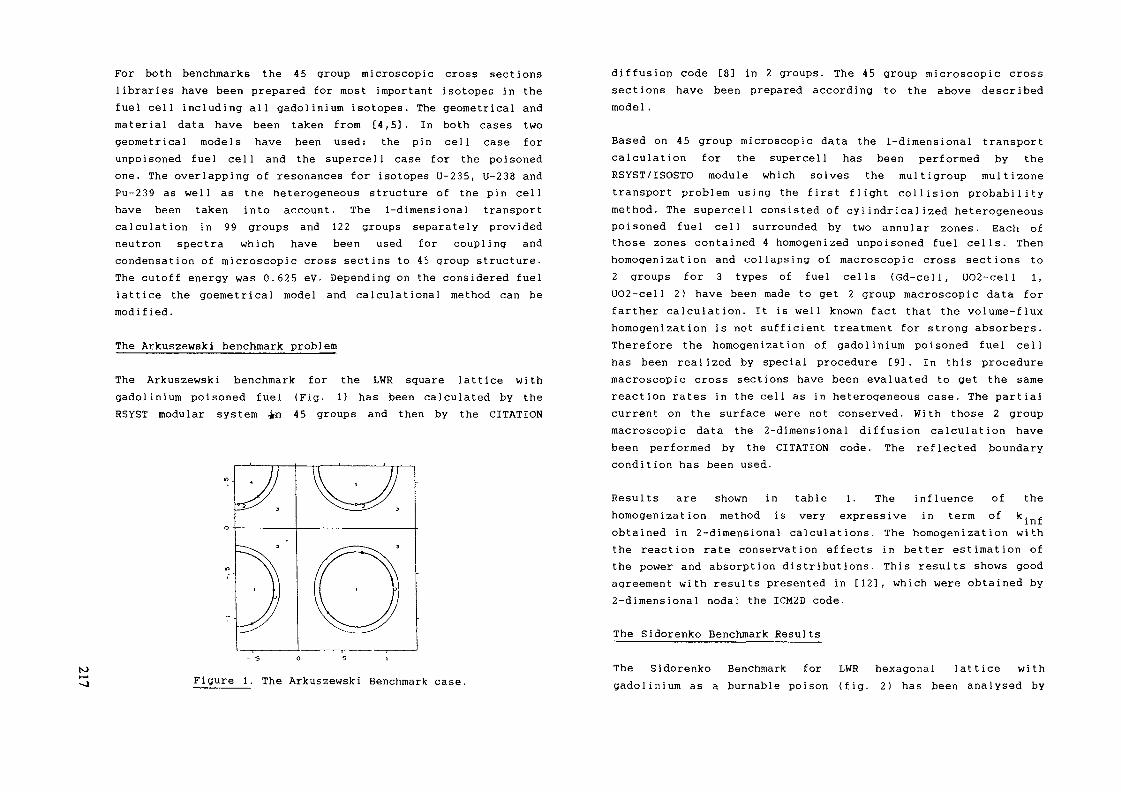
For both benchmarks the 45 group microscopic cross sectionslibraries have been prepared for most important isotopes in thefuel cell including all gadolinium isotopes. The geometrical andmaterial data have been taken from [4,5], In both cases twogeometrical models have been used: the pin cell case forunpoisoned fuel cell and the supercel 1 case for the poisonedone. The overlapping of resonances for isotopes U-235, U-238 andPu-239 as well as the heterogeneous structure of the pin cellhave been taken into account. The 1-dimensional transportcalculation in 99 groups and 122 groups separately providedneutron spectra which have been used for coupling andcondensation of microscopic cross sectins to 45 group structure.The cutoff energy was 0.625 eV- Depending on the considered fuellattice the goemetrical model and calculational method can bemodi f ied.
The Arkuszewski benchmark problem
The Arkuszewski benchmark for the LWR square lattice withgadolinium poisoned fuel (Fig. 1) has been calculated by theRSYST modular system in 45 groups and then by the CITATION
Figure 1. The Arkuszewski Benchmark case.
diffusion code [8] in 2 groups. The 45 group microscopic crosssections have been prepared according to the above describedmodel.
Based on 45 group microscopic data the 1-dimensional transportcalculation for the supercell has been performed by theRSYST/ISOSTO module which solves the multigroup multizonetransport problem using the first flight collision probabilitymethod. The supercell consisted of cylindricali2ed heterogeneouspoisoned fuel cell surrounded by two annular zones. Each ofthose zones contained 4 homogenized unpoisoned fuel cells. Thenhomogen ization and collapsing of macroscopic cross sections to2 groups for 3 types of fuel cells (Gd-cell, UO2-cell 1,UO2-cell 2) have been made to get 2 group macroscopic data forfarther calculation. It is well known fact that the volume-fluxhomogen ization is not sufficient treatment for strong absorbers.Therefore the homogenization of gadolinium poisoned fuel cellhas been realized by special procedure [9], In this proceduremacroscopic cross sections have been evaluated to get the samereaction rates in the cell as in heterogeneous case. The partialcurrent on the surface were not conserved. With those 2 groupmacroscopic data the 2-dimensional diffusion calculation havebeen performed by the CITATION code. The reflected boundarycondition has been used.
Results are shown in table 1. The influence of thehomogenizat ion method is very expressive in term of k. ,obtained in 2-dimensional calculations. The homogenization withthe reaction rate conservation effects in better estimation ofthe power and absorption distributions. This results shows goodagreement with results presented in [12], which were obtained by2-dimensional nodal the ICM2D code.
The Sidorenko Benchmark Results
The Sidorenko Benchmark for LWR hexagonal lattice withgadolinium as a burnable poison (fig. 2) has been analysed by
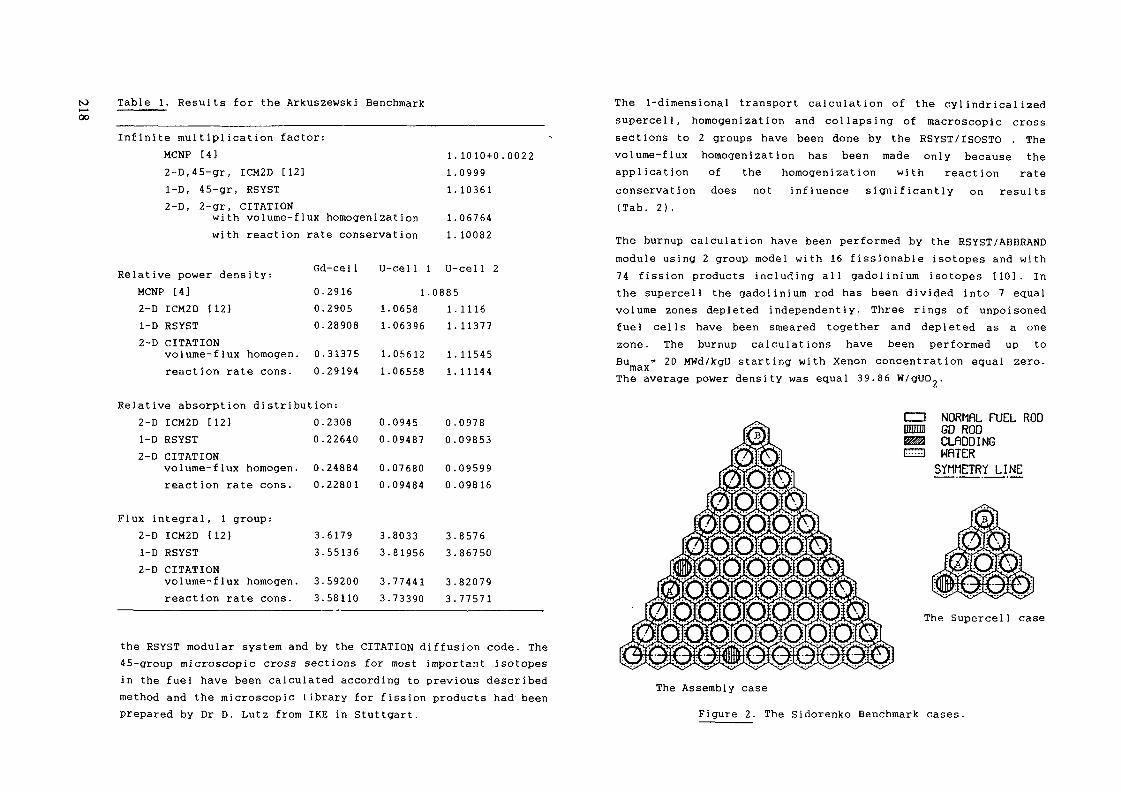
N)H-»00
Table 1. Results for the Arkuszewski Benchmark
Infinite multiplication factor:MCNP [ 4 ]2-D,45-gr, ICM2D [12]1-D, 45-gr, RSYST2-D, 2-gr, CITATION
with volume-flux homogen iza t ionwith reaction rate conservation
Relative power density:MCNP [4]2-D1-D2-D
ICM2D [12]RSYSTCITATIONvolume- flux homogen.reaction rate cons.
Gd-cell0.0.0.
0.0.
2916290528908
3137529194
U-cell :
1111
1..0658.06396
.05612
.06558
1.1.1.
1.1.
1010+0.0022099910361
0676410082
1 U-cell 2.0885
1.1.
1.1.
111611377
1154511144
Relative absorption distribution:2-D1-D2-D
ICM2D [12]RSYSTCITATIONvolume- flux homogen.reaction rate cons.
0.0.
0.0.
230822640
2488422801
00
00
.0945
.09487
.07680
.09484
0.0.
0.0.
097809853
0959909816
Flux integral, 1 group;2-D1-D2-D
ICM2D [12]RSYSTCITATIONvolume- flux homogen.reaction rate cons.
3.3.
3.3.
617955136
5920058110
33
33
.8033
.81956
.77441-73390
3.3.
3.3.
857686750
8207977571
the RSYST modular system and by the CITATION diffusion code. The45-group microscopic cross sections for most important isotopesin the fuel have been calculated according to previous describedmethod and the microscopic library for fission products had beenprepared by Dr D. Lutz from IKE in Stuttgart.
The 1-dimensional transport calculation of the cylindricalizedsupercell, homogenization and collapsing of macroscopic crosssections to 2 groups have been done by the RSYST/ISOSTO . Thevolume-flux homogenization has been made only because theapplication of the homogenization with reaction rateconservation does not influence significantly on results(Tab. 2).
The burnup calculation have been performed by the RSYST/ABBRANDmodule using 2 group model with 16 fissionable isotopes and with74 fission products including all gadolinium isotopes [10]. Inthe supercell the gadolinium rod has been divided into 7 equalvolume zones depleted independently. Three rings of unpoisonedfuel cells have been smeared together and depleted as a onezone. The burnup calculations have been performed up toBu = 20 MWd/kgU starting with Xenon concentration equal zero.rnsxThe average power density was equal 39.86 W/gUO,.
NORMflL FUEL ROD6D RODCLflODINGWRTERSYMMETRY LINE
OÏŒOIOIŒQÏQIOÏ3The Supercell case
The Assembly case
Figure 2. The Sidorenko Benchmark cases.
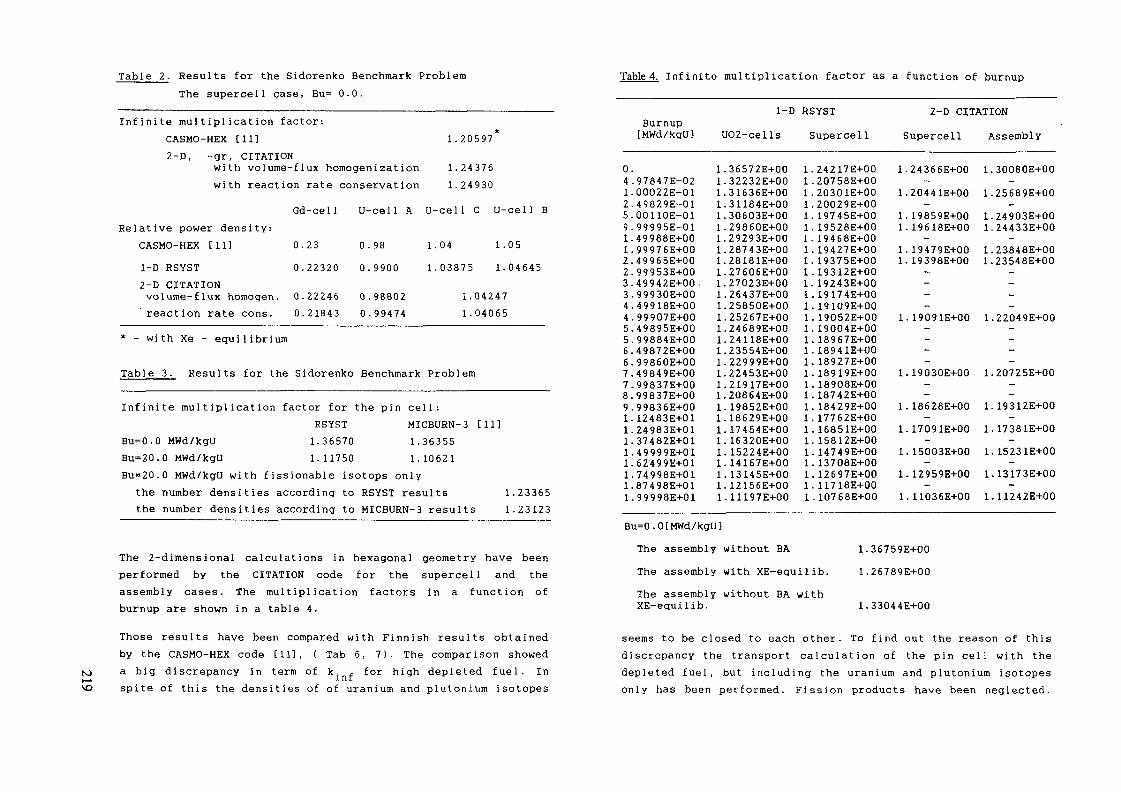
Table 2. Results for the Sidorenko Benchmark ProblemThe supercell case, Bu= 0 . 0 .
I n f i n i t e m u l t i p l i c a t i o n factor:CASMO-HEX [11]
Table 4. Infinite multiplication factor as a function of burnup
2-D, -gr, CITATIONwith volume-flux homogenization
1.20597
1.243761.24930with reaction rate conservation
Gd-cell U-cell A U-cell C U-cell BRelative power density:
CASMO-HEX [11]1-D RSYST2-D CITATIONvolume-flux homo gen.reaction rate cons.
0.23
0.22320
0.222460.21843
0. 980.9900
0.988020.99474
1.04 1.051.03875 1.04645
1.042471.04065
to
* - with Xe - equilibrium
Table 3. Results for the Sidorenko Benchmark Problem
Infinite multiplication factor for the pin cell:RSYST MICBURN-3 [11]
Bu=0.0 MWd/kgU 1.36570 1.36355Bu=20.0 MWd/kgU 1.11750 1.10621Bu=20.0 MWd/kgU with fissionable isotops only
the number densities according to RSYST results 1.23365the number densities according to MICBURN-3 results 1.23123
The 2-dimensional calculations in hexagonal geometry have beenperformed by the CITATION code for the supercell and theassembly cases. The multiplication factors in a function ofburnup are shown in a table 4.
Those results have been compared with Finnish results obtainedby the CASMO-HEX code [11], ( Tab 6, 7). The comparison showeda big discrepancy in term of k. , for high depleted fuel. Inspite of this the densities of of uranium and plutonium isotopes
041259112233445566778911111111
Burnup[MWd/kgU]
-97847E-02.00022E-01.49829E-01-00110E-01.99995E-01-49988E+00.99976E+00.49965E+00.99953E+00.49942E+00 .-99930E+00.49918E+00.99907E+00.49895E+00.99884E+00.49872E+00-99860E+00.49849E+00.99837E+00.99837E+00.99836E+00.12483E+01.24983E+01.37482E+01.49999E+01.62499E+01.74998E+01.87498E+01.99998E+01
111111111111111111111111111111
1-DU02-cells
.36S72E+00-32232E+00.31636E+00.31184E+00.30603E+00.29860E+00.29293E+00.28743E+00.28181E+00.27606E+00.27023E+00.26437E+00.25850E+00.25267E+00.24689E+00.24118E+00-23554E+00.22999E+00.22453E+00.21917E+00.20864E+00.19852E+00.18629E+00. 17454E+00.16320E-1-00-15224E+00.14167E+00. 13145E+00.12156E+00-U197E+00
RSYSTSupercell
111111111111111111111111111111
.24217E+00
.20758E+00
. 20301E+00
.20029E+00
. 19745E+00
. 19528E+00
. 19468E+00
. 19427E+00
. 19375E+00
.19312E+00
. 19243E+00
. 19174E-KIO
. 19109E+00
. 19052E+00
. 19004E+00
. 18967E+00
. 18941E+00
. 18927E+00
. 18919E+00
. 18908E+00
. 18742E+00
. 18429E+00
. 17762E+00
. 16851E+00
. 15812E+00
.14749E+00
. 13708E+00
. 12697E+00
. 11718E+00
. 10768E+00
2-D CITATIONSupercell
111111
1
1
11111
.24366E+00-
.20441E+00-
. 19859E+00
. 19618E+00-
. 19479E+00
. 19398E+00----
. 19091E+00----
. 19030E+00——
. 18628E+00—
.17091E+00-
. 15003E+00-
.12959E+00-
.11036E+00
Assembly
1.30080E+00-1.25689E+00
_1.24903E+001.24433E+00-1.23848E+001.23548E+00-
—-_
1.22049E+00----
1.20725E+00--
1.19312E+00-
1.17381E+00-1.15231E+00-1.13173E+00-1.11242E+00
Bu=0.0[MWd/kgU]The assemblyThe assembly
without BA 1.36759E+00with XE-equilib. 1.26789E+00
The assembly without BA withXE-equilib. 1.33044E+00
seems to be closed to each other. To find out the reason of thisdiscrepancy the transport calculation of the pin cell with thedepleted fuel, but including the uranium and plutonium isotopesonly has been performed. Fission products have been neglected.
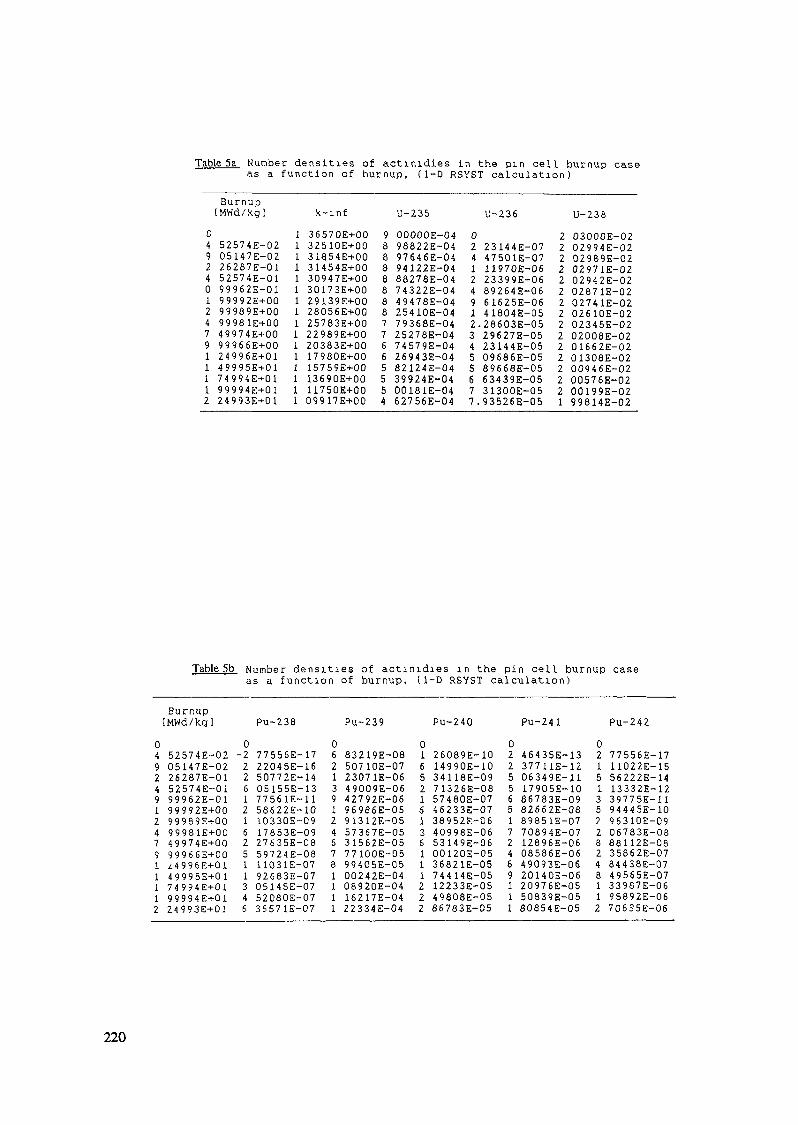
Number densities of actinidies in the pin cell burnup caseas a function of burnup, (1-D RSYST calculation)
0492401247911112
Burnup[MWd/kg)
52574E-0205147E-0226287E-0152574E-0199962E-0199992E+0099989E+0099981E+0049974E+0099966E+0024996E+0149995E+0174994E+0199994E+0124993E+01
1111111111111111
k-inf36570E+0032510E+0031854E+00314S4E+0030947E+0030173E+0029139E+0028056E+0025783E+0022989E+0020383E+0017980E+0015759E+0013690E+0011750E+0009917E+00
9888888877665554
U-23SOOOOOE-0498822E-0497646E-0494122E-0488278E-0474322E-0449478E-0425410E-0479368E-0425278E-0474579E-0426943E-0482124E-0439924E-040<H81E-04627S6E-04
0241249123455677
U-236
23144E-074750LE-Q7H970E-0623399E-0689264E-0661625E-0641804E-05.28603E-0529627E-OS23144E-0509686E-0589668E-0563439E-0531300E-05.93526E-05
2222222222222221
U-23803000E-0202994E-0202989E-0202971E-0202942E-0202871E-02Q2741E-0202610E-0202345E-0202008E-0201662E-0201308E-0200946E-02OOS76E-0200199E-0299814E-02
Table 5b Number densities of actinidies in the pin cell burnup caseas a function of burnup, (1-D RSVST calculation)
Burnup[MWd/kg]0492491247911112
52574E-0205147E-0226287E-0152574E-0199962E-0199992E+0099989E+0099981E+0049974E+0099966E+00^4996E-*-0149995E+0174994E+0199994E+0124993E+01
0-222612162511346
Pu-238
77556E-1722045E-1650772E-1405155E-1377561E-1158622E-1010330E-0917853E-0927635E-08S9724E-0811031E-0792683E-0705145E-0752080E-0736571E-07
0621391246781111
Pu-239
83219E-0850710E-0723071E-0649009E-0642792E-0696986E-0591312E-0557367E-0531562E-0577100E-0599405E-0500242E-0408920E-0416217E-0422334E-04
0165216136111222
Pu-240
26089E-1014990E-1034118E-0971326E-0857480E-0746233E-0738952E-0640998E-0653149E-0600120E-0536821E-0574414E-0512233E-0549808E-0586783E-05
0225565172469111
Pu-241
46435E-1337711E-1206349E-1117905E-1086783E-0982662E-0889851E-0770894E-0712896E-0608586E-0649093E-0620140E-0620976E-0550839E-058Û854E-05
0215135?282481:2
Pu-242
77556E-17U022E-1556222E-1413332E-1239775E-U94445E-1096310E-0906783E-0888112E-0835862E-0784438E-0749565E-0733987E-0695892E-0670635E-06
220
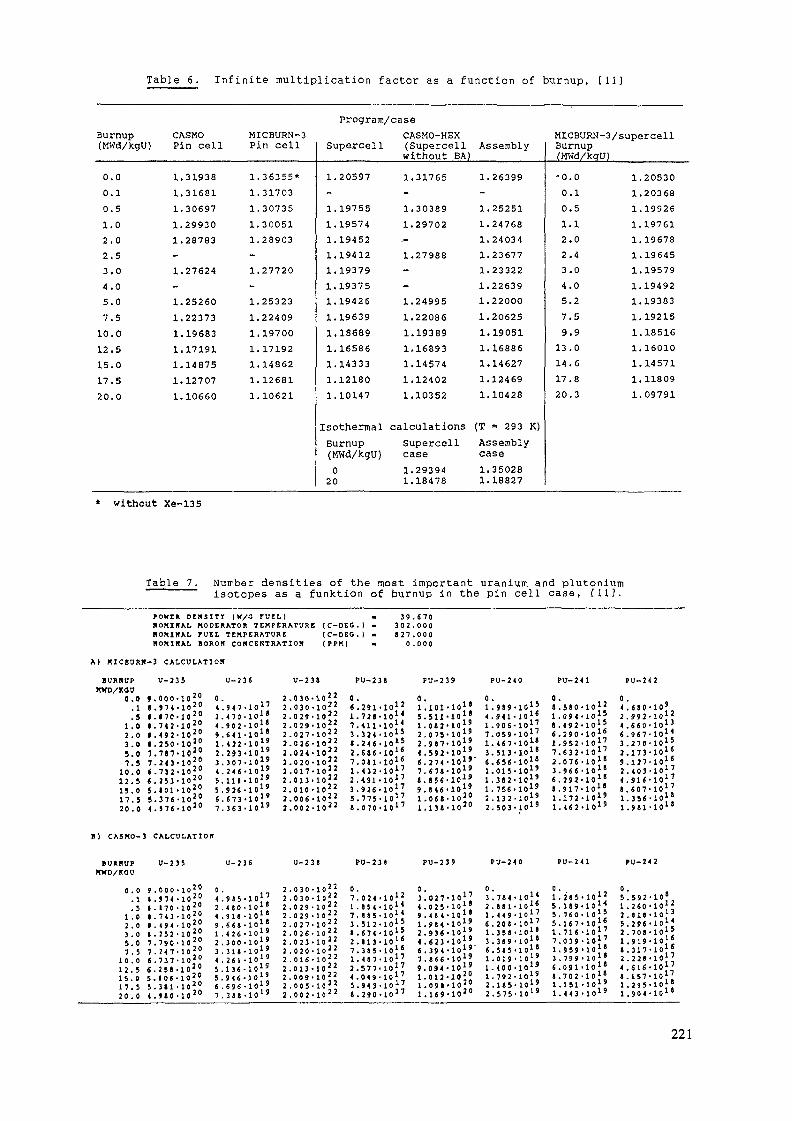
Table 6. Infinite multiplication factor as a function of trarnup, [11]
Burnup(MWd/kgU)
0.00.10.51.02.02.53.04.05.07.510.012.515.017.520.0
CASMOPin cell
1.319381.316811.306971.299301.28783-1.27624-1.252601.223731.196831.171911.148751.127071.10660
MICBURN-3Pin cell
1.36355*1.317031.307351.300511.28903-1.27720-1.253231.224091.197001.171921.148621. 126811.10621
Program/caseCASMO-HEXSupercell (Supercellwithout BA)
1.20597-1.197551.195741.194521.194121.193791.193751.194261.196391.186891.165861.143331.121801.10147
IsothermalBurnup(HWd/KgU)0
20
1.31765-1.303891.29702--1.27988--1.249951.220861.193891.168931.145741.124021.10352
calculationsSupercellcase1.293941.13478
Assembly
1.26399-1.252511.247681.240341.236771.233221.226391.220001.206251.190511.168861.146271.124691.10428
(T = 293 K)Assemblycase1.350281.18827
MICBURN-3/supercellBurnup
-0.00.10.51.12.02.43.04.05.27.59.913.014.617.820.3
1.205301.203681.199261.197611.196781.196451.195791.194921.193831.192151.185161.160101.145711.118091.09791
* without Xe-135
Table 7. Number densities of the most important uranium and plutoniumisotopes as a function of burnup in the pin cell case, I 111.POKZ* DENSITY IK/0 rUEL] . 39.670XON1HAL KODERATOR TEMPERATURE [C-DEO.I . 302.000ItOHIBAL ruEL TEHPERATUHE [ C-DEO. I » 827.000KOKIKAL BORON CONCENTRATION IPPK) •> 0.000
A) KICSURR-3 CALCULATION
BURRUPXHD/KOB
0.0.1.5
1.02.03.0Î.O7.510.012.5
U-23S.OOO-IO20..»74-10*870-103742-102
492-102
.250-103
,7<7-102
10.243',732253-10
15.0 5.101-1017.5 5.376-1020.0 «.»76 • 10
2020
U-236
0.4.947-lfll7
2.470-10,*4.902•10*°9,641-10**1.422-10"2.293-10"3.307.10l*4.246-10"5.11!-10"5.926-10"6.673-10"7.363-lol 9
U-2382.030-102.030-102.029.029.027.026-10.024-10.020.017
2 . 0 1 32 .0102 . 0 0 6 - 1 02 . 0 0 2 - 1 0
22
"
22
PU-2380.«.291-101.721-107.411-103.324-108.246-101
2.686-10*
15
7.041-101.432-102.491-103.926-105.775-10*?,
PU-2390 .1.101-105.511-101.082*102,075-10 19
8 .070-1017
2.9874.592-101*6.274-10"'7.678-10*;;t9.146'1.068'1.138'
'"10
PU-2400.1.989-104.941-101.906-107.059-101.467-103.513-106.656-101.015-101.3821.756-102.132-102.503-10
17
19
PU-2410.8.580-1013
1.094-1015S.492-101*«.290-1016
1.952-lOj7
7.632-1017
2.076-3.966•6.292-1.917-1.172-1.462-
ill
PU-242
«• ,4.680-10'2.992-lol4.660-1016.967'lOj3.270-1012.173-1019.127-10*2.403-10*4. »K-lfll!.607-10*1.356-loJ-1.941-101
S) CAÎKO-J CALCULATIOIt
BUKKUP U-235HXD/KOU
0 0 0.000.
j235•7
1012151720
1 I.J74 •5 1 . 170 •0 1. 743 •0 1. <94 •0 1 . 252 •0 7 . 790 •S 1 . 247-0 6.7J7-5 6.258-0 5.106'5 5.381 •0 4.980-
U-236 U-23S
10» 0.1020 4.S451020 2.440102010^^1020
l"20
.918
.668
.426
.300
.314
.261i.13«
1020 5.94610» 6.69610" 7.344
2.030-1022
•IQl7 2.030-1022
•101' 2 .029-1022
* 1 0 1 «. 1 0 1 9•10"•10"•I»•10"• 10"•1°-10"
.029-1022
.027-1022
.026-1022
.023-1022
.020-1022
.016-1022
, 013-10".009-1022
.005-1022
.002-1022
PU-234
0 .7.024-loJ 2
1 .454-101'T.ajs-io 1*3.512-tol5
a.674.101»2.ai3-ioi 67.385-10161.4J7-1017
2.577'IOJ'4.049-1017S.943-1017
*.290-1017
PU-239
0 .3.027-loJ7
4.025-lOj'9. 484-lOj'1.944-10"2.93S-10"4.623-10"6.394-10*'7.866-10"9.094-10"1.012-10?«1.098-102"1.169-1020
PU-240
0 .3.784-101'!2.481- 101S1.449- 1»17
6.208-lOj7
1.358-101'3.389-lolJ6.585-101.019 -10"1.400-10"1.792-101?2.145-10"2.575-101'
PU-241
0 .1 .245.5.349-5.760-5.167-1.716 -7.039 •1.959 •3.799 •6.091 •4.702 •1.151-1.443 •
iJ"ioi510tT1010t71018io*«1010i9
PU-242
o. ,5. 592-10°1.260-lOf2
2.414-10*^5.296-102.708-10"1.919-lOj'4.317-loJ!2.228-1017
4:i57-lol7
1.295-lOj-'1.904-101'
221

s Two sets of number densities for uranium and plutonium isotopeshave been taken from RSYST (tab. 5) and MICBURN-3 (tab. 7)results corresponding to burnup equal 20.0 MW/kg(J. Results ofmultiplication factors are shonw in table 3. Good agreement ofk. f leads to assumption that besides of fissionable isotopesthe fisson product data or/and the model of the burnable chainhave a significant influence on the burnup results.
11. M. Anttila, Finnish Results for a VMK Benchmark ProblemConcerning Use of Gadolinium in Fuel Rod Lattices, CRP onSafe Core Management with Burnable Absorbers in WERs, IAEA,Viena, 1989.
12. D. Lutz, Results for the Arkuszewski Benchmark Problem, IKE,University of Stuttgart, 1990.
REFERENCES
1. R.Ruhle, RSYST- An Integrated Modular System with a DataBasis for Automated Calculations of Nuclear Reactor,IKE-BNR-4-12, Stuttgart, 1973.
2. R.Ruhle, RSYST- Kurtzbeschreibung der Moduln, IKE 4-5,Stuttgart, 1983.
3. L.Bordzan, Implementation of RSYST Modular System on the CDCCYBER-72 Computer, Int. Rep. 18/E-II/89, Swierk, 1989.
4. J.Arkuszewski, MCNP, Analysis of the Nine-Cell LWR GadoliniumBenchmark, Wuerenlingen, PSI, 1988.
5. Consulting Report on Proposed Programme for the CRP on SafeCore Manegement with Burnable Absorbers in WERs, IAEA,Viena, 1988.
6. R. Wartmann, W. Bernnat, Nachrechnung einer KritischenAnordung von Siedewassrreaktorbrennelementen auf der Basisvon ENDF/B-IV Daten, IKE 6-118, Stuttgart, 1978.
7. J. Keinert, Therm-126, a Thermal Neutron Cross-sectionLibrary Including Scattering Matrices, Part A, Part B,IKE6-105, Stuttgart, 1978.
8. H.Tomecki, The CITATION Code - The Reference of the Versionfor the CDC CYBER-72 Computer, Rep IBJ 0-199, Swierk, 1974.
9. D. Lutz, personal communication.10. D.Lutz, ABBRAND 98 eine Abbranddatei fur 19 Aktinide und 79
Spaltprodukte fur Gadolinimhaltinge Brennstoffe, InterneIKE-Notiz, Stuttgart, 1978.

N>K>W
COMPARISON CALCULATIONS FOR A BWR LATTICEWITH ADJACENT GADOLINIUM PINS
N. MARINKOVICNuclear Engineering Laboratory,Bons Kidné Institute of Nuclear Sciences,Belgrade, Yugoslavia
AbstractHittun the frame of the Coordinated Research Program (CRP) SAFE CORE HftNAGEHENT «ITH BURNABLEABSORBERS !» VVERs the m supl i f ied fuel element N i t h two adjacent gadolinium pins naschosen as the square lattice benchmark problei. The input calculation data, the foriat and thecomparison of the results of the CRP participants Here defined according to the NEACRPcoipanson as previously done at Eidg. Institute fur Reaktorforschung, Hurenhngen (EIR) .The results Here received froi the fol loning CRP participants; Skoda Czechoslovakia; TechnicalResearch Center of Finland (VTT); VEB Bergman-Borsig Stammbetrieb des Kombinates Kab, Germany;Inst i tut fur Kernenergetik Universität Stuttgart, Germany; Bhabha Atomic Research Center,India and Boris Kidric Institute of Nuclear Sciences, Yugoslavia. Besides the comparison ofthese six CRP available data sets, an analysis Has perforiert taking into account the 10 NEACRPdata sets, which »hen added to the results of CRP participants gave the totasl of 16 sets alltogether. This is a number wi th tore significance froi statistical point of VICK. Toi l lustrate the significance of tho nuiber of data sets taken into account, both treatmentsnere compared to NEACRP results.Var ia t ion coefficients of the lost important parameters Here compared to typical targetaccuracies for poner reactors recommended by IAEA. The var ia t ions of most CRP results are ingood agreement ni th the target accuracies except for the l i fe t ime and Pu-239 build-up for thepoisoned lattice. The variations of NEACRP+CRP and NEACRP results are larger than targetaccuracies for both the regular and the poisoned lattice.On the nhole, an acceptably good agreement is obtained for the results suuphed by CRPparticipants «hen treated separately. Smaller variations are observed in treating li sets ofresults (NEACRP+CRP) than in NEACRP comparison.
INTRODUCTION
Since no data for a suitable PWR square lattice with burnableabsorber were available, a simplified BWR lattice wag adopted forcomparison as benchmark within the CRP on SAFE CORE MANAGEMENTWITH BURNABLE ABSORBERS IN VVERs. Comparison of the results, aswell as the format, were the same as the previously adopted onesin the NEACRP comparison-'3'' This paper summarizes the mostimportant comparison results and draws conclusions concerning theinfluence of gadolinium burnable absorber on the neutroniclattice parameters Comparison of all the available results isshown in detail in the report COMPARISON CALCULATIONS FOR A BWRLATTICE WITH ADJACENT GADOLINIUM PINS performed at the NuclearEngineering Laboratory of the Boris Kidric Institute of NuclearSciences'10'
The mean values, standard deviations and variation coefficientswere computed for the obtained as well as for the calculated
parameters Besides the comparison of six CRP data sets, ananalysis was performed taking into account the CRP data added tothose of ten NEACRP participants (marked NEACRP+CRP in Tables) .The sixteen sets of results were considered as more significantfrom statistical point of view. To illustrate the significance ofnumber of data sets which are taken into account, both treatmentswere compared to NEACRP results'2'
The list of all the participants including those of NEACRPInternational comparison is shown in Table 1 with the mostimportant relevant data concerning the calculations applied.
PROBLEM SPECIFICATION
The benchmark BWR fuel element consists of 16 fuel pins, 14initially identical U02 fuel cells and 2 gadolinium poisonedones Taking into account the lattce symmetry 6 different celltypes were defined The input data applied were the same as thoseadopted in Ref '=' Fuel pins 1 cm in diameter were made of UO3,
Table 1 List of participants with main relevant data
No Participant Data Library Code nameN E A C R P
12345678910
AEEWAMNCEACISEEIRENEAJAERINAIGOSAKARISC
WIMSENDP/B-4ENDF/B-3+ENDF/B-4MUFT-IV+TEMPESTENDF/B-4ENDF/B-4-t-UKNDLENDF/B-4ENDF/B-4+ENDF/B-5WIMS + ENDF/B-3UKNDL
LWR-WIMSBLAAPOLLONUOVO, AUTOBUSBOXERKIMSRACTGBLARESPLACRS+CDB
Ref/2/
C R P111213141516
SKODA (CSR)VTT(FIN )VEB(GERM )IKE (GERM )BARG (INDIA)IBK(YU)
WIMSENDF/B-4ENDF/B-4JEF-1WIMSWIMS+UKNDL
WIMSMICBURN-3 CASMO-3GNESSEL-4 , DIPOL-2RSYST ICMD KENOLWRBOXWIMSD-4
/3//4//5//6//7//8/
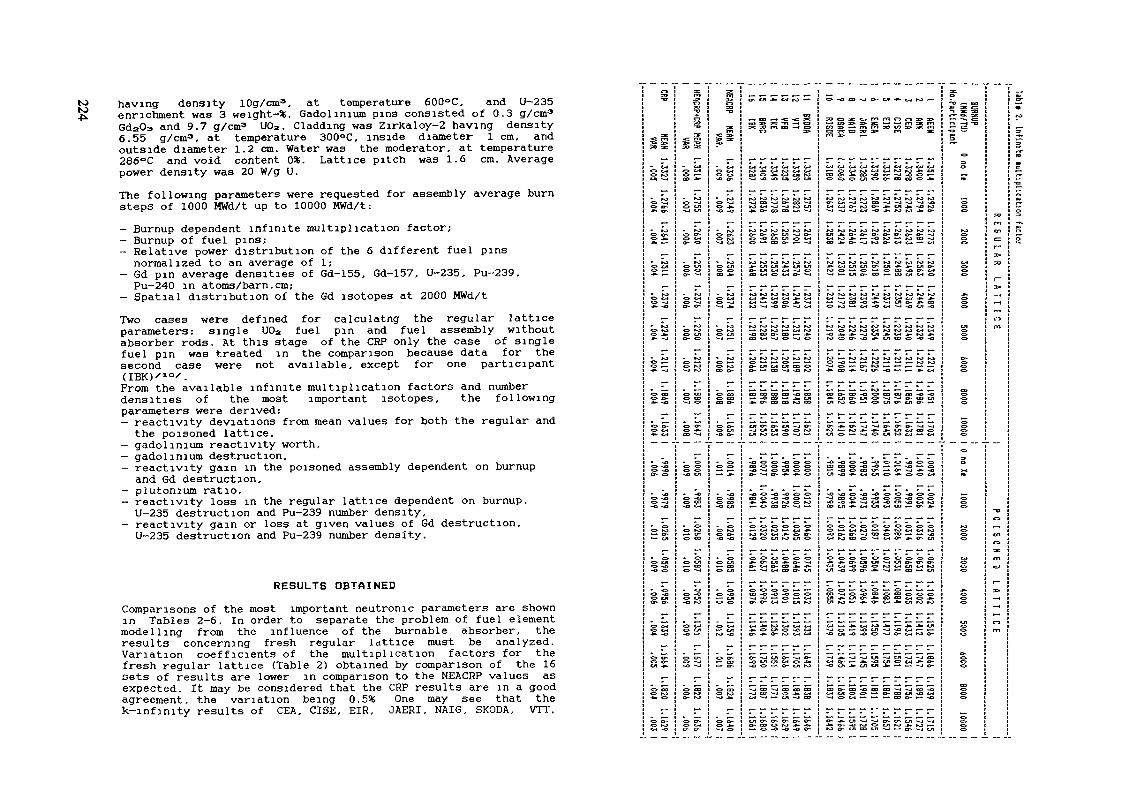
having density lOg/cm3, at temperature 600°C, and U—235enrichment was 3 weight-%. Gadolinium pins consisted of 0.3 g/cm3Gda03 and 9.7 g/cm3 U02. Cladding was Zirkaloy-2 having density6.55 g/cm3, at temperature 300°C, inside diameter 1 cm, andoutside diameter 1.2 cm. Water was the moderator, at temperature286°C and void content 0*. Lattice pitch was 1.6 cm. Averagepower density was 20 W/g U.The following parameters were requested for assembly average burnsteps of 1000 MWd/t up to 10000 MWd/t:- Burnup dependent infinite multiplication factor;- Burnup of fuel pins;- Relative power distribution of the 6 different fuel pins
normalized to an average of 1;- Gd pin average densities of Gd-155, Gd-157, U-235, Pu-239,Pu-240 in atoms/barn.cm;
- Spatial distribution of the Gd isotopes at 2000 MWd/tTwo cases were defined for calculatng the regular latticeparameters: single U02 fuel pin and fuel assembly withoutabsorber rods. At this stage of the CRP only the case of singlefuel pin was treated in the comparison because data for thesecond case were not available, except for one participant(IBK)''10-'.From the available infinite multiplication factors and numberdensities of the most important isotopes, the followingparameters were derived:- reactivity deviations from mean values for both the regular and
the poisoned lattice,- gadolinium reactivity worth,- gadolinium destruction,- reactivity gain in the poisoned assembly dependent on burnup
and Gd destruction,- plutonium ratio,- reactivity loss in the regular lattice dependent on burnup,U-235 destruction and Pu-239 number density,
- reactivity gain or loss at given values of Gd destruction,U-235 destruction and Pu-239 number density.
RESULTS OBTAINEDComparisons of the most important neutronic parameters are shownin Tables 2-6. In order to separate the problem of fuel elementmodelling from the influence of the burnable absorber, theresults concerning fresh regular lattice must be analyzed.Variation coefficients of the multiplication factors for thefresh regular lattice (Table 2) obtained by comparison of the 16sets of results are lower in comparison to the NEACRP values asexpected. It may be considered that the CRP results are in a goodagreement, the variation being 0.5* One may see that thek-infinity results of CEA, CISE, EIR, JAERI, NAIG, SKODA, VTT,
o
-=sSS
- C4o ro
- »0
O 0^
• *o0 o-
SS
i§- »O
ISi>£S=;
f co-o
§ e£CJC-l
SS
ii
öS*— c*
i»S«3. ^o
_- o
O cw
sSr
S£
SS,_,
c> e^^> »OO4 -O
a=m
ii
s ss =- c~li?
K3s a~j cn
ro
ig
i>K
ro«> C*J^ -Jo* o-
••O^ roo cn
*O
--j ro
4Z> OOÖ CD-0 <=>
0 0-
OO -J
f _
0
^og-sa
OO-0 C-J
o•O tO•— O-c> t»
• o.o cn
.—
§ tu-0 rO
•Ö <-J0 01
r-
0 CDo to
w
0 t»l
s
3E
P1
" C*t•» W
S g:
t. ySS
0 Ko ro-1 C-«
• »o
» roO C-l
»O0 »0«3> LF1
* to
S £
O OO
0 c£•o cn,0 o-
_O -0
0- CO»O tfl
il• <=>•O fl
„i>Si — c*lo o
0 Wi — tn
S £
•CD- Kl
,—
— J O
CO« œ ^ -c ^ g: =a m oo —* ca
O 3>
c i t»* f i t*t e-* c^*0 J>- OJ KÏ Cx< C-tCD <=> -te <H «Jl tO
Kl »O KS IO »O tO
2 P2 S § 3ro >o K> ro *o »-oo» o- er- tu ---j o -o ~o ui cn o> <-->e=> «-•• Œ» o-- —* -*a
fO »0 |0 K3 »O »0*- et oi - c« cn
»o rO »o »o ro i~o4*1 •**• Cf4 ti-t -^ C-4
îo ^Ö -o o- i! o«
ro »o KI ro ro ro. ro ro *- O4 ro
CD C-4 -~J C> -~J «O-
ro ro ro ro ro ro
o- »— co ^J -a ro
£S S S ™ -£ S-^- o- oo eo ro co
" 5 S Ï5 S Ktjt ro <^« ^ ^j fc—
»>- r— - •—
S3 S S S §, _ (_ t_n
-0 O -O -0 O O
S ^» w ro S ^
•— c*j ro - c»i •*-ro ro o-i -fc. o o--o *3> cn K> tn o
c> o «• c> o <=•0^ O4 0- S S^ -«-
3 5 ^S S 2 SOr- O- t*l * Cfl IO
<-» -*N fo c-i e»i c-i. o Crt <i> o o-*
-j CO - 00 00 CO
0- 07 0 tO . -^
„
=oesacc jmrn<-><- )3> i>S S S S f S 5 3 S 5 = E SS Sro S =* m *
C«J <-4 O4 CJ O4 O4 £r4 C-l C-« O4«— oe**roc>ic-«roro-^" t j ioo o- -*» co --o *•— -o ^o «> r—
h O r o t o r o r o r o r o r o r o r owc4C^roo- . * -cn .^ .^a»o• J -o - i o-« -o -•*• ro ro -*» cr-
r o > o r o r o l O r o K > * o r o r ocn -»>. er- o- Cr» Cf* Or» o- &- ---4C-i f-O *- . — -0 >0 *— »0 O> ~-JCO- I« .0-^J*OC*-C-<0<»-*0*
r o f o r o r o r o r o r o r o r o r o^»cgcT tc^ i c ^c j i - ^ - ^ - c / l c r -
h o * o r o * o t o t o r o r o r o r oO-< •— C-l O4 -*• C*t OW Ol -*• -«-* " J OO -O -*» ---J Cfl O- -*» O3OK3 t - * ( ^ l -OC- l ^ -< -OCn-0
r o r o r o r o r o r o i o r o r o r o"-* es- ro ro o-t ro t-o »o c-t c-<-J3 -*• .*• -o cn .»• c-i *. ro .».K J o c r - ^ o - * - t n c o o - - c ' - o
ro • — ro ro ro ro ro ro ro ro
- ^ ^ 4 O - » O * — •— -^<^«
S S S £ c S S £ 3 S 3 c 2 œ è St/i ro «• "-• <^ tn e^ tn o^ «-*
Kj^ -^o- * . - f c - f cc^c - ieo<3.t/i-O.— -w j«=>cAroc -4M.c - i
_ _ , _ _ <_
- O - o O - O - ^ O O - O O Oc o o a g - o - O t - ^ — -o — O
^- ^- — E— »—
^ Q ^ o S ^ c S S u ^ S S Scx>tn-^c- icnc- toc i^ -o ->-
^ >o ^ o ^ o ^ <^ o- o<=* •— t-t ro « — -^roc^ic-iroC-l KJ CD C> •"-4 C l Cr- - O- tw
• 0 0 0 « 3 . O O O O O O•*• ^> o^ CM est -J 01 er- v o-tst t*i ^o MJ <? ro c«i cn c-« ro
cn -** CJi O- -B» co ™ C-* -O .hit/i 10 ^* - v- cj -»« cj» *o ro
t-i •— -*• c~i ro j* * — -*• -•«• et
a a s s s s 2 s * s
o-j cn o- o *-* o~ co cji -o t-4
S g : S S S £ 3 " S y 5 ;
g:
BURNUP(Hüll /TU!
0Plrticlpant
o
0>
to
0
04
<=>
CJI
10~
<=>
o
o0
oD
y
o
o
e*i§
•=>•o
01o-
0-
oo
i
|
,
30
cnez:r-
30
i —
-
m
-d
to0
m«=>
( _3>
— (
rt

Table 3. Gjdohnin» nor th and Gadohniu» destruct ion in the poisoned pin (l .E-04/barn c«>
; ———————————————————————————————————
I BURHUP1 (KKd/TU) 0 no le 1000 2000 3000 4000 5000 6000 7000 8000 9000IHo. Participant1 1
234547a9101112IIH15U
NEACRP
AEEHAHNCEAC1SEEIRENEAJAERINAI6OSAKARISOESKODAVÎTVEBIKEBARCIÎK
HEANST.DEV
NEACRPtCRP MEAN
CRP
ST.DEVHEANST.DEV
.253
.243
.250
.235
.241,254.249.250.242.255.250.251.2W.250.248.255
,247.007.249.004
.250
.003
.225,216,216.211,208.228,216,213,211,225
,207.219,1U.222.218.227
,217.007
.217,007.218,007
.194
.186
.183,184.174.197.186.180,182.195
.172,189.m.19!,187.196
.186
.007
.187
.007
.188
.008
.159
.154
.147,157.142,148.153.145,151.160
.141
.153,i5t.157.153.161
.154,008,154.007.154.007
.116
.114,108.119,104,129.115,107.117.118
.108
.115
.IU
.120
.114
.118
.115
.007
.115
.004
.115
.004
.067
.074
.066
.085
.063
.089
.072
.068
.078,067,074.075.Ml.082.072,070
,073.00?.073,007,074.004
.028
.038
.031
.050
.030
.052
.035,033.037.028.038.040.4Î5.048.033.030
.036
.008
.037
.008
.037
.006
.008
.017
.015
.023,008,020.012,013.Oil.008.011,017.911.023.010,010.015.005.013.005,014,005
.001,008.009.007.001.016.004.005.000.001.002.008.0«.010.001.003
.005
.005
.005
.004
.004
.004
-.001.005.008,003
-.001,007.002.001
-.003-.001-.001,005-Ml.005
-.002.002.005.003.003.002.003.002
10000 11
-- —— -1--.001 !.005 !.007 i.003 1
-.001 1.003 !.002 !.002 1
-.005 1-.001 1———— !-•-.002 1.005 1-,WI 1.004 !-.002 !.001 1....... |..004 1.002 1.003 !.002 !.003 !.001 !
2000
.507
.495,523.457,501.537.495,508.487.508.488.«i.475.491,511.502.022
.494,023,483.017
3000
.699
.681
.710
.634
.691
.701
.682
.693
.669
.701
.665
.«Î
.657
.678
.704
.686
.021
.479
.025
.665
.023
4000
.842,823.850.781.834.822.825.832.810.846.803.W.798.821,845.826.020
.819
.026
.804,027
5000
.933
.919
.935
.884
.928
.909
.921
.923
.910,933.902.«5Ï.896.917.933.919.016,913.022.901,025
6000
.978
.949
.979
.950
.973
.942
.972
.972,947.978.962,«5.955,970.978.970.009.966.014
.958
.018
——— i1
7000 1I
.... — |,995 1.990 !.995 !.983 1.994 !.988 1.992 1.992 !.991 1.994 1.989 1
i.%& \.984 1.992 !.995 !.-—I.991 1.004 1.989 1.007 1. —— ~|.985 !.010 !
Table 4. Reactivity loss f ro» 1000 NHd/ t for regular la t t ice and react iv i ty gain for poicontd littict
BURNUP(Iffld/TU)
No. Participant1 AEEHi m3 CEA4 C1SE5 EIR6 ENEA7 JAER!8 NA189 OSAKA10 RISOE11 SKODA12 VTT13 VF814 IKE15 BARC16 I8K
HEACRP VimST.DEV
HEACRPtCRP MEANST.DEV
——————CRP DEAN
ST.ÜEV
2000
.012
.»OS
.009
.Oil
.009
.014
.008
.009
.009,008.009.009.010.009.011.010.41».002.010.003
.010
.001
4000
.034,<m
.029,031.029.033.026.030.029.024.030.029,029.030,033.031Alt.003.030.004
.030
.001
6000
.055
.MS
.050
.OSO
.049
.050
.044,051.050.045.051.049.049.050.053.052.W.003.050.009.051.002
8000
.075,0«.OM.069.069.068.061.071.071.063.070.069,068.070.073.072.0«.004.069,007
.070
.002
10000
.095.ois
.087
.086
.086
.088
.077
.090
.090,080,089.087.086.088.092.090.«ei.006.087.009
.089
.002
2000
.027,018.032.023.031.025.030.032.027.030.033.030.022.030.028.029.»11.003.029.003,029.004
3000
.060
.4SI
.067
.047
.0(3
.057
.062,065.055.065.062.064.057,063.039.063.044,006.061.005.061.002
4000
.102
.OU
.104
.082
.098
.092
.099
.100
.086
.108
.090,101,098.098.095.105.OS?.008.097.007.098.005
5000
.149.ra
.144
.113
.137
.132
.143
.137
.122,141.120.139.139.133.136.153.m.013.137.012,136.010
6000
.184.no,174.143.165.167.178.166.159.198.150.170.172.162.170.189.174.015.170.014.169.012
17000 1
1———— 1.196 !.1« 1.182 1.165 1.179 !.191 !.194 !.173 !.177 !.211 !
- ——— 1.168 !.185 i,190 1,181 1.185 1,201 !.«i 1.013 !
—— --I.186 1.012 1... —— |.185 !.010 1
225
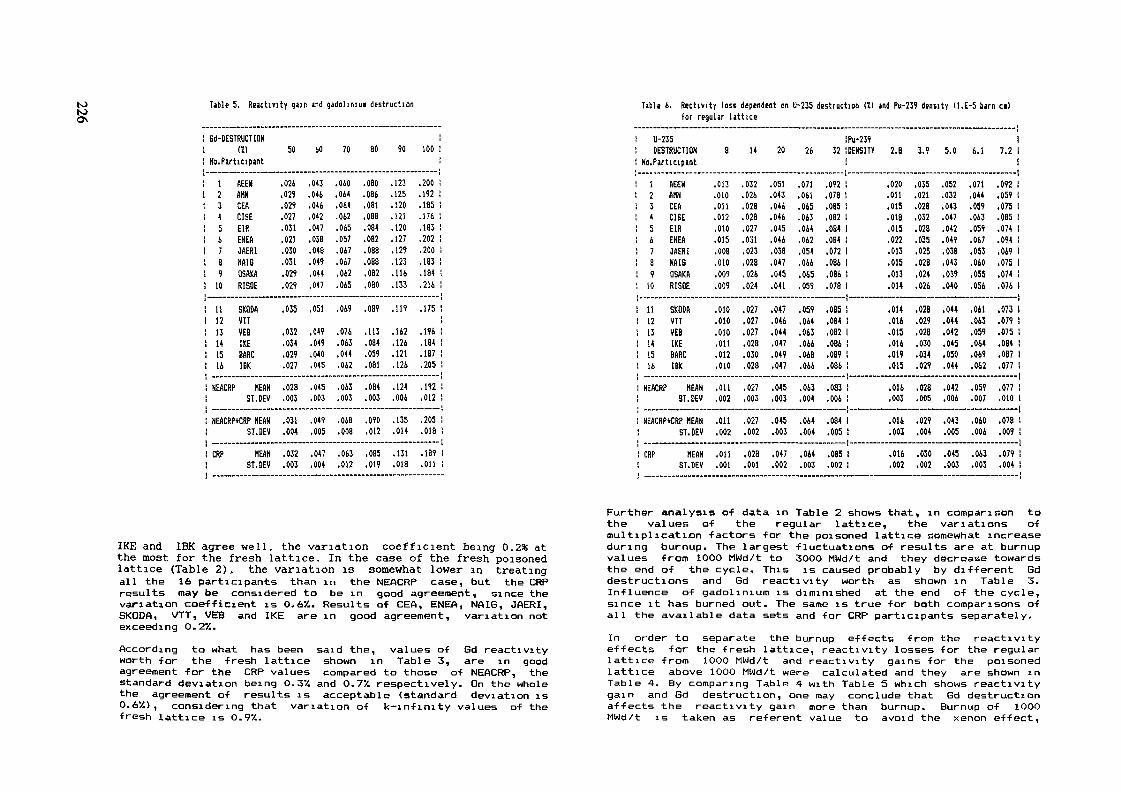
sa\ Table 5. Reactivity gain and gadohmu» destruction Table 6. Rectmty lass dependent an U-235 destruction (I) and Pu-239 density 11,£-5 barn ci)far regular lattice
6d-DESTRlKTION(ï) 50 40 70 80 90 100
Ho. Participant12345478910
111213141516
NEACRP
AEEHAHNCEAC1SEE1RENEAJAERINAISOSAKAR1SDE
SKODAVITVEBIKEBARCIBK
HEANST.DEV
NEACRP+CRP NEAN
CRP
ST.DEV
HEflNST.DEV
.024
.029
.029
.027
.031
.021
.OÎO
.031
.029
.029
.035
.032
.034
.029
.027
.029
.003
.031
.004
.032
.003
.013
.046
.OU
.042
.047
.038
.048
.049
.044
.047
.051
.049
.049
.040
.045
.045
.003
.049
.005
.047
.004
.060
.044
.064
.062
.065
.057
.067
.067
.062
.065
.06?
.076
.063
.044
.062
.063
.003
.068
.008
.063
.012
.080
.086
.081
.088
.084
.082
.088
.088
.082,080
.089
.113
.084
.059
.081
.034
.003
.090
.012
.085
.019
.123
.125
.120
.121,120.127.129.123.116.133
.119
.162
.126
.121
.126
.124
.006
.135
.014
.131
.018
.200
.192
.185
.176
.183
.202
.200
.183
.184
.216
.175
.196
.184
.187
.205
.192
.012
.205
.018
.189
.011
U-235DESTRUCTION 8 14 20 26 32
No. Participant12345678910
111213141516
NEACRP
AEEHAHNCEACISEEIRENEAJAERINAI6OSAKARISOE
SKODAVTTVEBIKEBARCIBK
HEAN3T.DEV
NEACRPtCRP HEAN
CRP
ST.DEVHEAN
ST.DEV
.013
.010
.011
.012
.010
.015
.008
.010
.009
.009
.010
.010
.010
.011
.012
.010
.011
.002
.011
.002
.011
.001
.032
.026
.028
.028
.027
.031
.023
.028
.026
.024
.027
.027
.027
.028
.030
.028
.027
.003
.027
.002
.028
.001
.051
.043
.046
.046
.045
.046
.038
.047
.045
.041
.047
.046
.044
.047
.049
.047
.045
.003
.045
.003
.047
.002
.071
.061
.065
.063
.064
.062
.054
.066
.065
.059
.059
.064
.063
.066
.068
.066
.063
.004
.064
.004
.064
.003
.092
.078
.085
.082
.084
.084
.072
.086
.086
.078
.085
.084
.082
.086
.089
.086
.083
.006
.084
.005
.085
.002
Pu-239DENSITY 2.8
.020
.011
.015
.018
.015
.022
.013
.015
.013
.014
.OU
.016
.015
.016
.019
.015
.016
.003
.016
.003
.016
.002
3.9
.035
.021
.028
.032
.028
.035
.025
.028,024.026
.028
.029
.028
.030
.034
.029
.028
.005
.029
.004
.030
.002
5.0
.052
.032
.043
.047
.042
.049
.038
.043
.039
.040
.044
.044
.042
.045
.050
.044
.042
.006
.043
.005
.045
.003
6.1
.071
.044
.059
.063
.059
.067
.053,060.055.056
.Oil
.063
.059
.064
.069
.062
.059
.007
.060
.006
.063
.003
I7.2 1
1.092 i.059 i.075 !.085 !.074 1.094 !.069 1.075 1.074 !.076 1
.073 !
.079 !
.075 !
.084 !
.087 1
.077 1——— 1
.077 !
.010 1
.078 !
.009 !—— .„1
.079 !
.004 !
IKE and IBK agree well, the variation coefficient being 0.2% atthe most for the fresh lattice. In the case of the fresh poisonedlattice (Table 2), the variation is somewhat lower in treatingall the 16 participants than in the NEACRP case, but the CRPresults may be considered to be in good agreement, since thevariation coefficient is 0.6X. Results of CEA, ENEA, NAIB, JAERI,SKODA, VTT, VEB and IKE are in good agreement, variation notexceeding O.2X.According to what has been said the, values of Bd reactivityworth for the fresh lattice shown in Table 3, are in goodagreement for the CRP values compared to those of NEACRP, thestandard deviation being 0.3X and O.77. respectively. On the wholethe agreement of results is acceptable (standard deviation is0.6X), considering that variation of k-infinity values of thefresh lattice is 0.9X.
Further analysis of data in Table 2 shows that, in comparison tothe values of the regular lattice, the variations ofmultiplication factors for the poisoned lattice somewhat increaseduring burnup. The largest fluctuations of results are at burnupvalues from 1000 MWd/t to 3000 MWd/t and they decrease towardsthe end of the cycle. This is caused probably by different Bddestructions and Bd reactivity worth as shown in Table 3.Influence of gadolinium is diminished at the end of the cycle,since it has burned out. The same is true for both comparisons ofall the available data sets and for CRP participants separately.In order to separate the burnup effects from the reactivityeffects for the fresh lattice, reactivity losses for the regularlattice from 100O MWd/t and reactivity gains for the poisonedlattice above 10OO MWd/t were calculated and they are shown inTable 4. By comparing Table 4 with Table 5 which shows reactivitygain and Sd destruction, one may conclude that Bd destructionaffects the reactivity gain more than burnup. Burnup of 100OMWd/t is taken as réfèrent value to avoid the xenon effect,

Table 7. Variation of the main results
P a r a m e t e r
Multiplication factor forregular lattice
O MWd/t5000 MWd/t1000O MWd/t
Multiplication factor forpoisoned lattice
0 MWd/t5000 MWd/t1OOOO MWd/t
Reactivity life timefor regular lattice'*"Reactivity life timefor poisoned lattice <->Changes in isotope densities-regular lattice'10''U-235 depletionPu-239 build-upPu-240 build-upChanges in isotope densities-poisoned lattice'10'U— 235 depletionPu-239 build-upPu-240 build-up
Pin power relativeto lattice'10'Pin No. 4Gd pin
V A R I A T I O N
NEACRP
0.90.70.9
1. 11.20.7
6.1
13.2
0.85.83.6
1.24.66.9
0.83.6
NEACRPCRP
0.80.60.8
0.9O.90.6
7.4
10.3
0.74.73.0
1.24.45.5
1.33.3
CRP
0.5O.40.4
0.6O.40.3
2.1
1O. 1
0.51.92.2
1.34.42.1
2.53.1
Targetaccuracy
(X)
O.25-O.5
O.25-O.5
2-5
2-5
22-
22-
2
to
Deduced from the standard deviation of the reactivity lossbetween 1OOO and 1OOOO MWd/t (Table 2) and assuming areactivity swing of 17. per 1OOO MWd/t at end of cycle.
although it has been shown'10' that the magnitude o-f xenon effectseems insensitive to gadolinium poisoning and it may be neglectedin treatment of burnup dependent solutions. Reactivity loss iscorrelated with U-235 destruction and Pu-239 build-up presentedin Table 6.. It may be seen that the Pu-239 build-up does notaffect significantly the reactivity loss.Summary of the variations of the most important parameters isshown in Table 7. Since experimental values for tnis benchmarkare not known, the computed variations are compared to thetypical target accuracies for power reactors recommended byIAEA'". The variations of CRP results are in good agreement with
the target accuracies except for the li-fetime and Pu-239 build-upin case o-f the poisoned lattice.The NEACRP and NEACRP+CRP variations are somewhat larger thantarget accuracies for the regular lattice except -for the U-235concentrations. Particularly large is the variation o-f Pu-239concentration. Variation of the multiplication factor for thepoisoned lattice is somewhat larger, but the variation of thededuced reactivity lifetime is rather large compared to thetarget accuracy. The pin power variations are acceptable incomparison to the target accuracies'10'.
CONCLUSIONFrom the obtained comparison results one may conclude that theuncertainties of calculating the important parameters for boththe regular and the poisoned lattice are due to differentreaction rates for U-235, Pu-239 and gadolinium isotopes. Thisresults from different data libraries applied. Results of theparticipants applying ENDF/B-4 library show much betteragreement. Taking into account the complexity of the problem, thevalues of initial gadolinium worth are in quite a good agreement.Variations of the reactivity loss and reactivity gain abovelOOOMWd/t lead to higher uncertainties of the reactivitylifetime, particularly in the case of the poisoned lattice. Thefact that the variation of the Pu-239 build-up is large suggeststhat it may be influenced by the spectrum effect.On the whole, an acceptably good agreement is obtained for theCRP results treated separately although their number is rathersmall. Smaller variations are observed in treating 16 sets ofresults (NEACRP+CRP) than in the NEACRP comparison.The analysis would be complete if a larger number of results wereavailable. It could be suggested to the participants to repeatcalculations by applying the same cross section library toseparate the effect of data, base from the computational methods.
REFERENCES/!/ Report of the Research Coordination Meeting on Safe Core
Management with Burnable Absorbers an VVERs, IAEA, Vienna,Dec.1989.
/2/ C.Maeder, P.Wydler, International Calculations for a BWRLattice with Adjacent Gadolinium Pins. EIR-Bericht Nr.532NEACRP-L-271, Wurenlingen, 1984.
/3/ J.Vacek, P.Mikolas, Experience with WIMS Computer Code atSkoda Plzen, A Technical Committee Workshop on In-Core FuelManagement IAEA, Vienna, Dec. 1989, 622-I3-TC-676.3
/4/ M.Anttila, Co-ordinated Research Project on Safe CoreManagement with Burnable Absorbers in VVERs. Finnish Resultsfor the Benchmark problem 4.2.,VTT Report No. RFD-5/90, 1990.
toN)oo
/5/ R Becker, GDR-Calculation Results of Gadolinium Fuel-PinLattices, CRP-GDR-5775, 1990
/6/ D Lutz, Results for the Square Lattice Benchmark of Maederand Wydler, Private communication, 1990
/7/ P D Krishnani, Analysis of Benchmark on Interactive effectsof Gadolinium Poisoned Pins in BWRs by the Computer CodeLWRBOX, Note No ThPD/336, Bhabha Atomic Research Center,Trombay, Bombay, 1991/8/ N Marinkovic, Use of Burnable Poisons in Prolonged WER FuelCycles, Annual Report IAEA Contract No 5330/RB, Dec 1989
/9/ Reactor Burnup Physics, Proc of IAEA panel, 12-16 July 1971,p 278, Vienna, 1973
/10/N Marinkovic, COMPARISON CALCULATIONS FOR A BWR LATTICE WITHADJACENT GADOLINIUM PINS performed at the Nuclear EngineeringLaboratory of the Boris Kidric Institute of Nuclear Sciences,IAEA Contract No 5330/RB. Juiy 1991
CALCULATIONAL MODELS FOR GADOLINIUMEFFECTS IN WER LATTICES
C ALVAREZ-CARDONA, R GUERRA-VALDES,D LOPEZ-ALDAMACentro de Estudios Aplicados al Desarrollo Nuclear,La Habana, Cuba
AbstractThe advantage of gadolinium as burnable absorber in LWR have beenpractically demonstrated
Nowadays experimental and theoretical studies on the effect ofthe introduction of gadol inium as burnable absorber in WER typereactors are in progress
This work presents calculational models developed for thedescription and analysis of the physical characteristics of WERtype hexagonal lattices containing gadolinium based on the WIMS-D/4 code
In the f i rs t part of the work the models are applied toexperimentally studied lattices of the critical assemblies ZR-6Mat K F K I , Budapest and LR-O at Rez, Czechoslovakia The integrallattice parameters K» and the spectral indexes as well as thepower rate distribution were calculated our calculationalresults show fair agreement wi th the experimental results
The second part deals wi th the description of the effects due tothe presence of gadolinium during the reactor cycle To this endfour in f in i te lattices proposed in the Sidorenko's task werecalculated by means of WIMS-D/4 code
As main results the dependencies of K», nuclear densities for theU, Pu and Gd isotopes and power rate distribution on the burnupwere obtained
This work was under the In ternat ional Atomic Energy Agencyresearch contract S7O1/RB
Introduction
In the f rame of CRP Safe Core Management wi th BurnableAbsorbers in VVERs, altogether with numerical benchmarks ,twoexperimental benchmarks and an operational one were investigated
The present paper shows the obtained results in WERlattices calculations containing Gd20s in d i f f e r e n t w/0 in thefue l at zero power, experimentally investigated in ZR-6 criticalassembly in CRIP, Budapest, Hungary and in the LR-O criticalassembly, in Rez, Czechoslovaquia and also presents the solutionof the operational benchmark designed as Sidorenko task
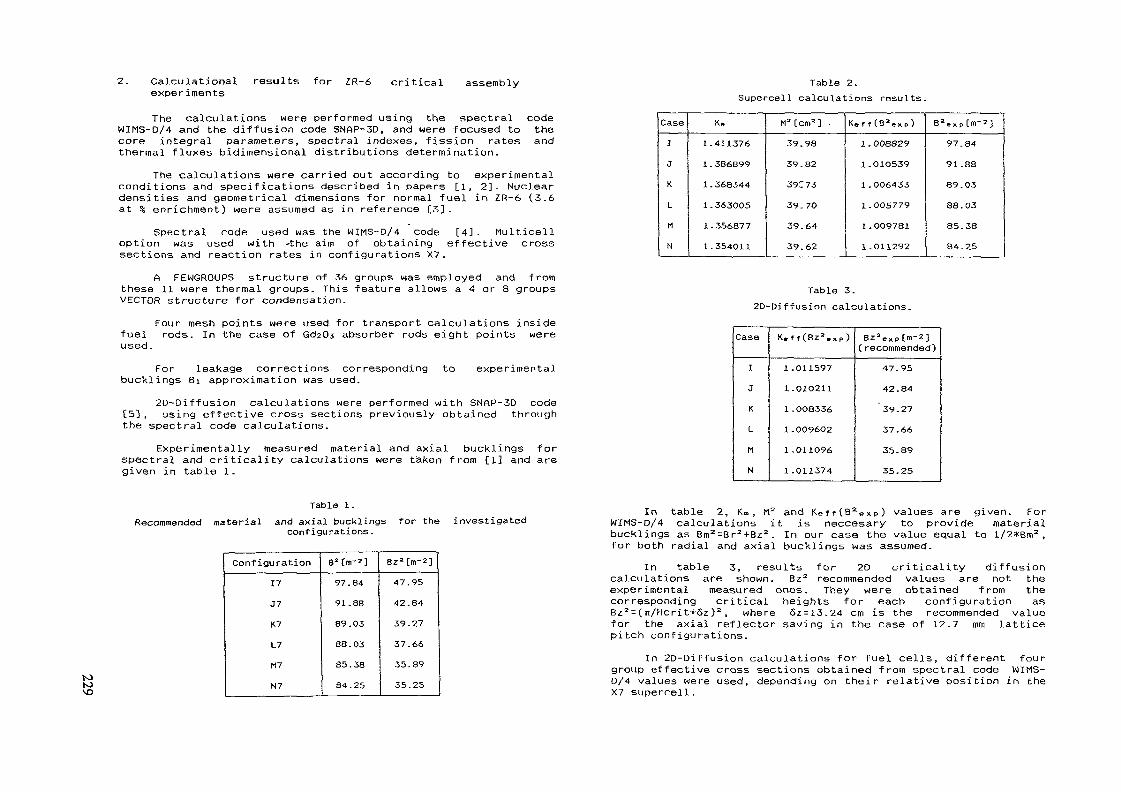
2. Calculationalexperiments
results for ZR-6 critical assembly
The calculations were performed using the spectral codeWIMS-D/4 and the diffusion code SNAP-3D, and were focused to thecore integral parameters, spectral indexes, fission rates andthermal fluxes bidimensional distributions determination.
The calculations were carried out according to experimentalconditions and specifications described in papers [1, 2]. Nucleardensities and geometrical dimensions for normal fuel in ZR-6 (3.6at % enrichment) were assumed as in reference [3].
Spectral code used was the WIMS-D/4 code [4]. Multicelloption was used with 'the aim of obtaining effective crosssections and reaction rates in configurations X7.
A FEWGROUPS structure of 36 groups was employed and fromthese 11 were thermal groups. This feature allows a 4 or 8 groupsVECTOR structure for condensation.
Four mesh points were used for transport calculations insidefuel rods. In the case of GdzOj absorber rods eight points wereused.
For leakage corrections correspondingbucklings Bi approximation was used.
to experimental
2D-Diffusion calculations were performed with SNAP-3D code[5], using effective cross sections previously obtained throughthe spectral code calculations.
Experimentally measured material and axial bucklings forspectral and criticality calculations were taken from [1] and aregiven in table 1.
Table 2.
Supercell calculations results.
CaseIaKLM
N
K.
1.411376
1 . 386899
1.368344
l . 3630O5
1 . 356877
1.354011
M=[cm2] .3V. 98
39.82
39T73
39.70
39.6439.62
K»f f (B'Uxp)
1 . 0088291 -O1O539
1.O06433
1.005779
1.009781
1 .O11292
B2*xpO-23
97.84
91.8889.0388.0385.3884.25
Table 3.
2D-Diffusion calculations.
Case
IJK
LMN
K.f f (8z2. XP)
1.0115971.0102111 . OO8336
1 -OO96O2
1.011096
1.011374
Bz2exp[tn-2]( recommended)47-9542.8439.2737.6635.8935.25
Table 1.Recommended material and axial bucklings for the investigated
configurations.
10VD
Configuration17J7K7L7M7N7
B^Cro-*]97.84
91.88
89.03
88.03
85.38
81.25
8z2[m-2]47.9542.8439.2737.66
35.89
35.25
In table 2, K», M2 and Keff(B2exp) values are given. ForWIMS-D/4 calculations it is neccesary to provide materialbucklings as Bm^Br^+Bz2 . In our case the value equal to l/2*Bm2 ,for both radial and axial bucklings was assumed.
In table 3, results for 2D criticality diffusioncalculations are shown. Bz2 recommended values are not theexpérimental measured ones. They were obtained from thecorresponding critical heights for each configuration asBza=(n/Hcrit+oz)2, where 5z=13.24 cm is the recommended valuefor the axial reflector saving in the case of 12.7 mm latticepitch configurations.
In 2D-Diffusion calculations for fuel cells, different fourgroup effective cross sections obtained from spectral code WIMS-D/4 values were used, depending on their relative position in theX7 supercell.

to 1.O10
1.027 1.O14 1 OilO.O 1.057 1 022 1.O12
case I
1.O221.O21 1 022 1 022
O.O 1.O16 1.021 1.O22case J
1 01O1 O24 1 O22 l O1O
O 101 1 020 1.O2O 1 Oil
case I
1 OOS1.004 1 004 l OO5
0.801 1.002 1.0O4 1 005case J
1 0301.016 1.027 1.030
0.0 0.987 l O2O 1.029
case K
1 0331.014 1.O29 1 032
O.O O 979 1.O20 1.031
case L
1 0010.989 O 998 1.O03
1 332 0 967 O 993 O.999
case K
O 9990.985 0 996 O.999
1 485 0.958 0.989 O 998
case L
1 0351 013 l O30 1 035
O.O 0.970 1 020 l O33
case M
1 0371.012 1 031 1 036
O.O 0.967 l O19 1.034
case N
0 9980.979 O.994 O.997
1 662 O 947 O 985 O 996
case M
O 9970.977 O 993 O 996
1 744 0.943 0.983 0 995
case N
Fig 1Fission rate distributions
WIMS-D/4 calculation with K« spectrum.
Fig. 2Absorption rate distributions.
WIMS-D/4 calculation with K» spectrum
In the case of reflector, four group effective crosssections were obtained from a developed calculational model foran equivalent 20 cm radius core with several edition zones in the20 cm thick water reflector region.
Afterwards, several attempts were made in order to achievebetter agreement between calculational and experimental resultsNevertheless Keff maximum deviation from experimental valueremains about 1%. Best agreement corresponds to cases K and L inboth approximations from spectral and 2D-Diffusion codes.
Fission rate and absorption rate distributions are given infigs. 1 and 2 for K« spectrum as they were obtained from WIMS-D/4code
Thermal flux and fission rate distributions were obtainedfrom SNAP-3D four group flux distribution by using adequateweighting factors by means of the CDF transformation module [6]
In figs 3 and 4 thermal flux and fission rate distributionsfor fuel elementary cells from 2D-Diffusion calculations areshown
In table 4 spectral indexes for specified positions in thesupercell are given (.positions 2, 3 and 8)
In table 5 comparisons between calculated and measuredresults for spectral index SI(Np/Ce) are made
3. LR-0 Experimental BenchmarkThe aim of this task was the calculation and comparison of
the energy release distributions in fuel assemblies withburnable absorbers, performed at the LR-0 critical assembly inRez, Czechoslovaquia.
The burnable absorber rods composition is an homogeneousmixture of UQ.2 and Gd2U3 with different contents of gadolinium Adetailed description for the LR-O experimental facility, as wellas a description for the research plan carried out may be foundin paper [8]
Oui calculations were realized using the CLUSTER andMULTICELL options of WIMS-D/4 code [4], with the aim to performthe comparisons with the experimental results given in f8]
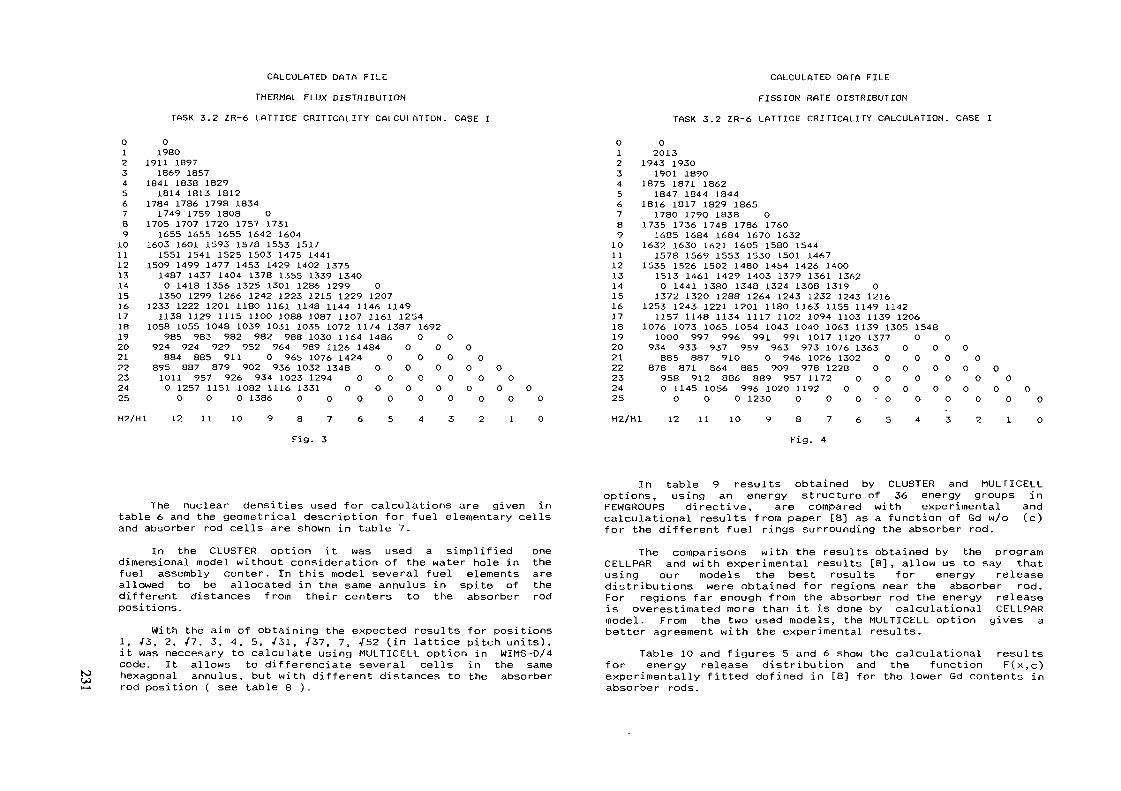
CALCULATED DATA FILE
THERMAL FLUX DISTRIBUTION
TASK 3.2 ZR-6 LATTICE CRITICALITY CALCULATION- CASE I
CALCULATED DATA FILE
FISSION RATE DISTRIBUTIONTASK 3.2 ZR-6 LATTICE CRITICALITY CALCULATION. CASE I
O12345678910111213141516171819202122232425H2/H1
01980
1911 18971869 1857
1841 1838 18291814 1813 1812
1784 1786 1798 18341749 1759 1808 O
1705 17O7 1720 1757 17311655 1655 1655 1642 1604
1603 16O1 1593 1578 1553 15171551 1541 1525 1503 1475 1441
15O9 1499 1477 1453 1429 1402 13751487 1437 1404 1378 1355 1339 134OO 1418 1356 1325 1301 1286 1299 01350 1299 1266 1242 1223 1215 1229 1207
1233 1222 1201 1180 1161 1148 1144 1146 11491138 1129 1115 1100 1088 1087 1107 1161 1254
1O58 1055 1048 1039 1O31 1O35 1072 1174 1387 1692985 983 982 982 988 103O 1164 1486 0
924 924 929 952 964 989 1126 1484 O O884 885 911 0 965 1076 1424 0 0
895 887 879 9O2 936 1O32 1348 O O O1011 957 926 934 1O23 1294 0 0 O0 1257 1151 1082 1116 1331 0 O 0 OO O 0 1386 0 O O 0 0
12 11 10 8
Fig. 3
012345678910111213141516171819202122232425
H2/H1
02013
1943 19301901 1890
1875 1871 18621847 1844 1844
1816 1817 1829 18651780 179O 1838 0
1735 1736 1748 1786 17601685 1684 1684 1670 1632
1632 1630 1621 1605 1580 15441578 1569 1553 153O 15O1 1467
1535 1526 1502 1480 1454 1426 140O1513 1461 1429 1403 1379 1361 13620 1441 1380 1348 1324 1308 1319 01372 132O 1288 1264 1243 1232 1243 1216
1253 1243 1221 1201 1180 1163 1155 1149 11421157 1148 1134 1117 1102 1094 1103 1139 1206
1076 1O73 1O65 1O54 1043 104O 1O63 1139 1305 154810OO 997 996 991 991 1017 112O 1377 O
934 933 937 959 963 973 1076 1363 O O885 887 91O O 946 1O26 1302 0 0
878 871 864 885 909 978 1228 O O O958 912 886 889 957 1172 0 O OO 1145 1056 996 1O2O 1192 0 0 0 0O O O 1230 O 0 O • 0 O
12 II 1O 8
Fig. 4
to
The nuclear densities used for calculations are given intable 6 and the geometrical description for fuel elementary cellsand absorber rod cells are shown in table 7.
In the CLUSTER option it was used a simplified onedimensional model without consideration of the water hole in thefuel assembly center. In this model several fuel elements areallowed to be allocated in the same annulus in spite of thedifferent distances from their centers to the absorber rodpositions.
With the aim of obtaining the expected results for positions1, V3, 2, /7, 3, 4, 5, V31, /37, 7, V52 (in lattice pitch units),it was neccesary to calculate using MULTICELL option in WIMS-D/4code. It allows to differenciate several cells in the samehexagonal annulus, but with different distances to the absorberrod position ( see table 8 ).
In table 9 results obtained by CLUSTER and MULTICELLoptions, using an energy structure of 36 energy groups inFEHGROUPS directive, are compared with experimental andcalculational results from paper [8] as a function of Gd w/o (c)for the different fuel rings surrounding the absorber rod.
The comparisons with the results obtained by the programCELLPAR and with experimental results [8], allow us to say thatusing our models the best results for energy releasedistributions were obtained for regions near the absorber rod.For regions far enough from the absorber rod the energy releaseis overestimated more than it is done by calculational CELLPARmodel. From the two used models, the MULTICELL option gives abetter agreement with the experimental results.
Table 1O and figures 5 and 6 show the calculational resultsfor energy release distribution and the function F(x,c)experimentally fitted defined in [8] for the lower Gd contents inabsorber rods.
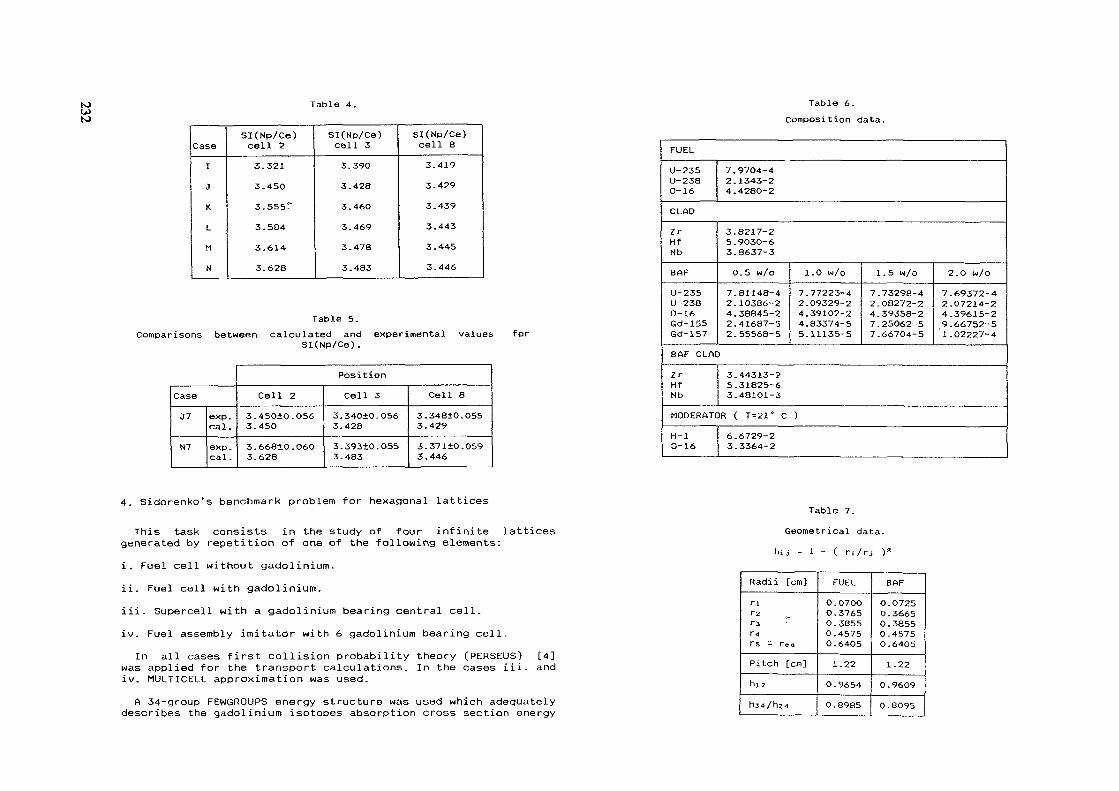
toWtoTable 4.
CaseI3
KL
M
N
SI(Np/Ce)cell 23.3213.45O3.555T3.5843.614
3.628
SI(Np/Ce)cell 33.39O
3.428
3.4603.469
3.478
3.483
SI(Np/Ce)cell 83.4193.4293.439
3.4433.4453.446
Table 6.Composition data.
Table 5.
Comparisons between calculated and experimental values forSI(Np/Ce).
CaseJ7
N7
exp.cal.exp.cal.
PositionCell 2
3.450±O.O563.4503.668±O.O6O3.628
Cell 33.340+O.O563.428
3.393±O.0553.483
Cell 8
3.348+0.0553.4293.3711O.0593.446
FUEL
U-235U-238O-16
7.9704-42.1343-24.4280-2
CLAD
ZrHfNb8AF
U-235U-2380-16Gd-155Gd-157
3.8217-25.9030-63.8637-3O. 5 w/o 1.0 w/o7.81148-4 7.77223-42.10386-2 2.09329-24.38845-2 4.391O2-22.41687-5 4.83374-52.55568-5 5.11135-5
1.5 w/o 2.O w/o7.73298-4 7.69372-42.08272-2 2.07214-24.39358-2 4.39615-27.25062-5 9.66752-57 . 66704-5 1 . 02227- 4
8AF CLADZrHfNb
3.44313-25.31825-63.48101-3
MODERATOR ( T = 21° C )
H-lO- 16
6.6729-23.3364-2
4. Sidorenko's benchmark problem for hexagonal lattices
This task consists in the study of four infinite latticesgenerated by repetition of one of the following elements:i. Fuel cell without gadolinium.ii. Fuel cell with gadolinium.iii. Supercell with a gadolinium bearing central cell.iv. Fuel assembly imitator with 6 gadolinium bearing cell.
In all cases first collision probability theory (PERSEUS) [4]was applied for the transport calculations. In the cases iii. andiv. MULTICELL approximation was used.
A 34-group FEWGROUPS energy structure was used which adequatelydescribes the gadolinium isotopes absorption cross section energy
Table 7.
Geometrical data,
hio = 1 - ( r i / r j )'
Radii [cm]rirzT3r4rs = rfaPitch [cm]h,2rt3*i /hz^
FUELO . 07000.3765O.38550.4575O.64O5
1.22
O.9654
O.8985
BAF
0.07250.36650 . 38550.45750.6405
1-22
0 . 9609
0.8095

Table 8MULTICELL option data.
Cellpositionx [pitch]
01•T32.•17345•/3l/3774S2
LR-0 cell typenumber
06,7, 13, 14,19,203,5,8,18,21,23
2, 12,24,151 ,4,22,25,26, 17
11,2710,289,29
16,3031,3734 32,3633,35
MULTICELLtype
number14165
1767821251012
Numberof cells
N166612666121266
Total fuelvolume
Vf [cm3]0 4219852 6719642 6719832 6719635 3439712 6719622 6719622 6719615 343973S 3439712 6719622 671974
Table 9Experimental and calculated values of relative energy release
in the BAF pin and its neighbouring fuel pins
toOJCO
c [H/O]
0 5
1 0
1 51
2 0
x [pitch]01230123
0123
012
exp
0 40940 92550 98201 0000
0 33440 91810 98021 OOQO
0 30340 90650 97651 0000
0 27550 90740 9769
3 ] 1 0000i i
CELLPftR
0 46920 94300 98461 0000
0 39350 93360 98211 0000
0 i538
DSH/CIUSTER
0 44800 94200 98601 0000
0 37140 93570 98381 0000
0 3360
miTICEU
0 42370 94180 9853. 0000
0 34820 93350 98291 0000
0 31360 9291 | 0 9298 1 0 92900 9808 | 0 98261 0000
0 33500 92640 97991 0000
1 0000
0 31430 92700 98181 0000
i
0 98161 0000
0 29240 92570 98071 0000
Table 10MULTICELL option results
P(x,c) =P'(x,c) = P(x,c)/Np(x,c) = P' (x,c)/max[P' (x c)]P (x c) z p'(x,c) for x<4
= (1/5) £ CP'Cx.c)] for x>4P°(x,c) = P (x,c)/max[P (x,c)]F(x,c) = l-[l-exp(-b c)] g exp(-a /x)
c - O 5 w/o of GdzOsF(x,0 5) - 1-0 5049 exp(-l 944 /x)
Cellpositionx [pitch]
01a2n345/31/377/52
———————P(x c)il/5]
3 04354 34 05901 14 21831 24 24653 28 58870 24 31007 24 33705 24 35069 28 71014 28 71413 24 36088 24 36001 2
P (x c)U/s)
3 04354 3
Dix c)
0 41886 76502 3 1 0 93087 03052 37 07755 37 15725 37 18345 37 22842 37 25115 37 25845 37 26178 37 26813 37 26668 3
0 96730 97380 98470 98830 99450 99770 99870 99911 00000 9998
P"(x c)[1/s]
3 04354 36 76502 37 03052 37 07755 37 15725 37 18345 37 22842 3
7 26124 3
P'(x c)
0 41920 93170 96820 97470 98570 98930 9955
1 0000
F(xc)
0 49510 92770 96060 96770 97860 98260 98970 99J50 99490 99580 99710 9973
dependence and the plutonium isotopes resonances at thermalenergies [9].
The transport calculations were done taking 6 material regionsin the gadolinium bearing rod and 1 material region in otherrods Later calculations considering 8 material regions in thegadolinium bearing rods had shown no significant differences
The number of mesh intervals was taken as followsCases i, 11 and 111 . 18 mesh intervals in the gadolinium
bearing cells and 1O mesh intervals in the other ones cellsCase iv 18 mesh intervals in the gadolinium bearing cells, 9
mesh intervals in the B cells as well as in the nearestneigboring cells of the gadolinium bearing cells, and only 5 meshintervals in the other one cells
The number of different cell types considered was 6 in thesupercell case and 25 in the fuel assembly case, respectively Inthe later case a higher number of different cells was not useddue to the prohibitively large main memory and CPU time required

Ni
0.75
0.5
0.25
-1
0.5 1.5 2c tu/o]
Fig. 5, Energg Release Distribution
xlO14
12
10
**»
» Fuel Pin Latticeo Gd Pin Latticef Supercell Latticeo fissenbly Lattice
5 10 15 20BURHUP
Fig. 7. K-inf us Burnt«.
Nevertheless, the description used is well suited to study theparticularities of this configuration. According to theliterature available to us this is the problem of largestdimensions solved using the WIMS-D/4 MULTICELL approximation in aburnup calculation.
In all cases the burnup calculation ranged from O toMWd/tU with the following lattice calculation frequency:
20000
Fig, 6. Energy Release Distribution
Each 250 MWd/tU for the interval from O to 1000 MWd/tU.Each 500 MWd/tU for the interval from 1OOO to 100OO MWd/tU.Each 100O MWd/tU for the interval from 1OOOO to 1600O MWd/tU.Each 200O MWd/tU for the interval from 1600O to 2OOOO MWd/tU.Calculational results were:
- K« (fig 7), r, L2, Mz as functions of burnup.- Nuclear number densities of the isotopes of gadolinium, uraniumand plutonium as functions of burnup for each of the specifiedcells (figs. 8, 9, 10, 11).
One-group constants as functions of burnup for the specifiedcells
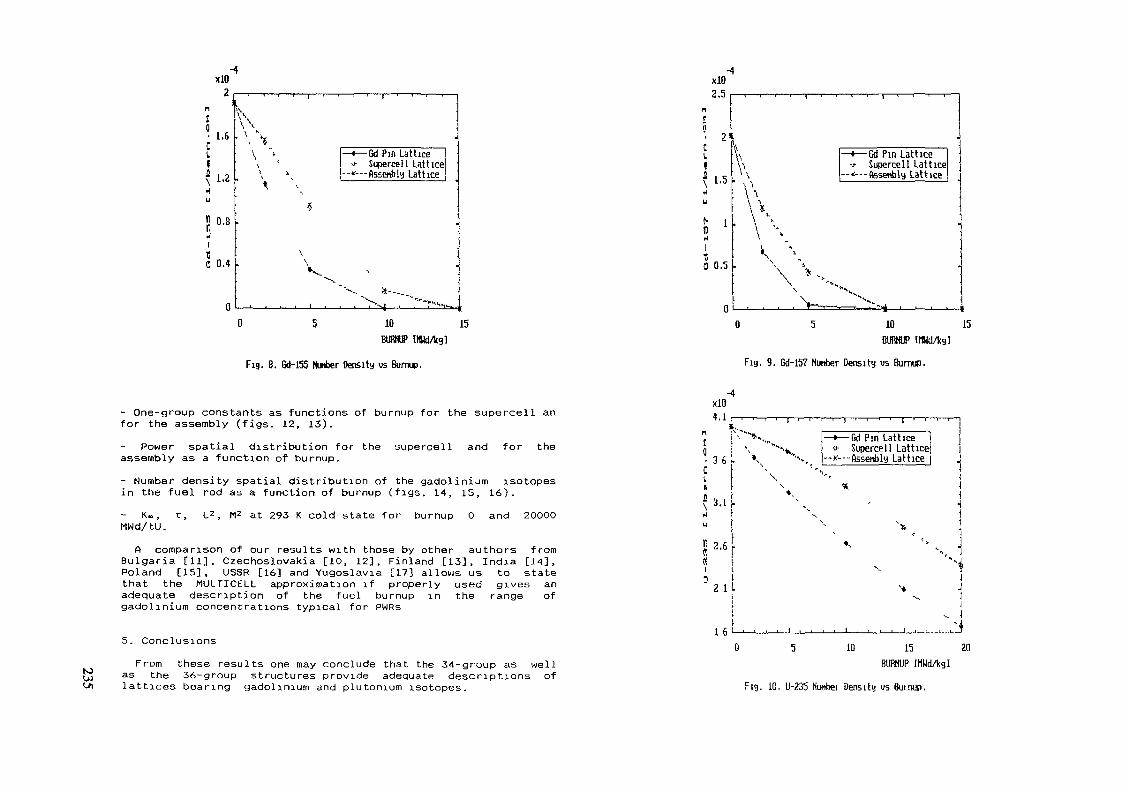
xlO2 ,
n£°1.6Cl(£ 1 9\ ll<!
U
S °-8nit0 0,4
0 ———————————— ._.- ——————— ,
— i — i — i — i — i — i — i — i — i — i — i — i — i — , — i
^\ *
"x'. V
\ v — •— Gd Pin Lattice 1\ l -.- Supercell Lattice\ \ --*— flssenbly Lattice |^ i
•
\
V."^v. X--__
i . . . "^rxj , r~"!->""n.. .0 5 10
BUfflUP MWAg)15
xlO2.5
nr
?'rî
a . s\ 1>s
u
S 1•41
0 0.5
0
. , . . , . . . . , . . . .
L J
li — »— Gd Pin Lattice\N •*• Supercell Lattice'\ —^---Assertbly Lathce
' s \
\\ :
' \ \\ +v
•L ^
' X^-.0 5 10
BURNUP tmidAg]15
Fig. 8. Gd-155 Nurtber Density us Burnup. Fig. 9. Gd-157 Nimber Density vs Burnup.
N»OJ
- One-group constants as functions of burnup for the supercell anfor the assembly (figs. 12, 13).
Power spatial distribution for the supercell and for theassembly as a function of burnup.- Number density spatial distribution of the gadolinium isotopesin the fuel rod as a function of burnup (figs. 14, 15, 16).
K«, r, L2, M2 at 293 K cold state for burnupMWd/tU.
O and 20000
A comparison of our results with those by other authors fromBulgaria [11], Czechoslovakia [10, 12], Finland [13], India [14],Poland [15], USSR [16] and Yugoslavia [17] allows us to statethat the MULTICELL approximation if properly used gives anadequate description of the fuel burnup in the range ofgadolinium concentrations typical for PWRs
5. ConclusionsFrom these results one may conclude that the 34-group as well
as the 36-group structures provide adequate descriptions oflattices bearing gadolinium and plutonium isotopes.
xlO
"c — ••-1 —— 1 —— T—— 1 —— p-, —— 1 —— 1 —— . —— J—— 1 —— ! ——— 1—— T——
i 3 a f
-Gd Pin Latticej » Supercell Lattice)l--*— flssenbly Lattice î
\
S 2 ' 6 rw ii i3 f
2 1 Lt1
1 fi ï . ! , 1 1
s, \NJ> -1>, JJ^ 1
. . . . . . . . . . . . . . * 45 10 15
BURNUP tMHdAg]
Fig. 10. U-235 Nunbei Density us Buinup,
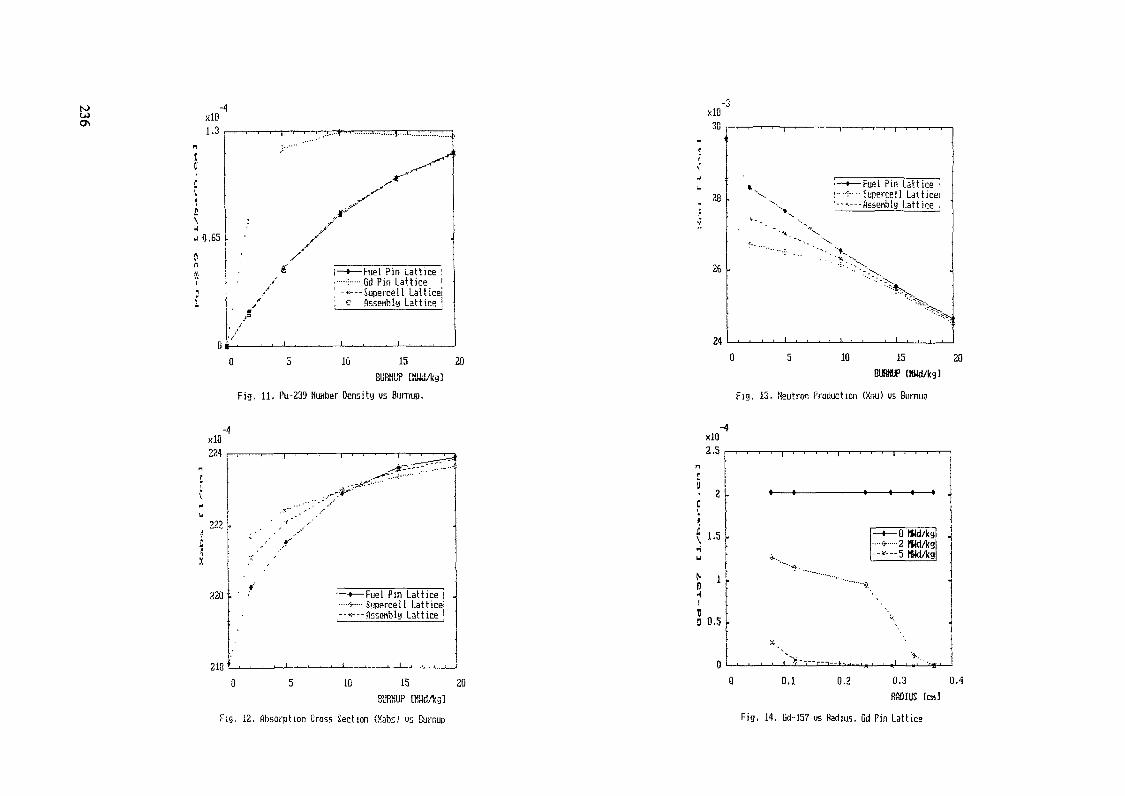
xlO1 *31 .J
ntor
t\it
u 0,65
nin1
n
— i— ' —— ' — ' — f— ' — ' — . .i..-»'-"-'--'-.!..-!-.!....!....!... i 1
«***^-r"~"~*
s-*^
^l o-1"1 >-*'
^ 1 — i — Fuel Pin Lattice :. ••-:-- Gd Pin Lattice i •/ '--« — Supercell Lattice!/ ; 2 flssenbly Lattice i
if ' ————————————————————————— '
•/. 1 . . , 1 , - t . . , .
5 iü 15 20BURNÜP [Mild/kg]
Fig, 11, Pu-239 Nimber Density vs Bumup.
xlO224
222
220
2180
i—Fuel Pin Lattice |r-~ Suparcell Lattice^;—flsse«blu Lattice '
5 10 15 20mm [«HdAg]
Fig. 12, Absorption Cross Section (Xabs) us Burnup
xlO-3
28 .
26
24
-Fuel Pin Lattice •- ;uperce!l Latticei-ftssenbly Lattice .
0 5 10 15BURNUP [HUd/kg]
Fig. 13, Neutren Production (Xnu) vs Burnuo
20
xlO2,5
2 L
1.5H
ni0 0,5
0 0.1 0,2 0.3mm D
Fig. 14. Gd-157 vs Radius. Gd Pin Lattice
0,4
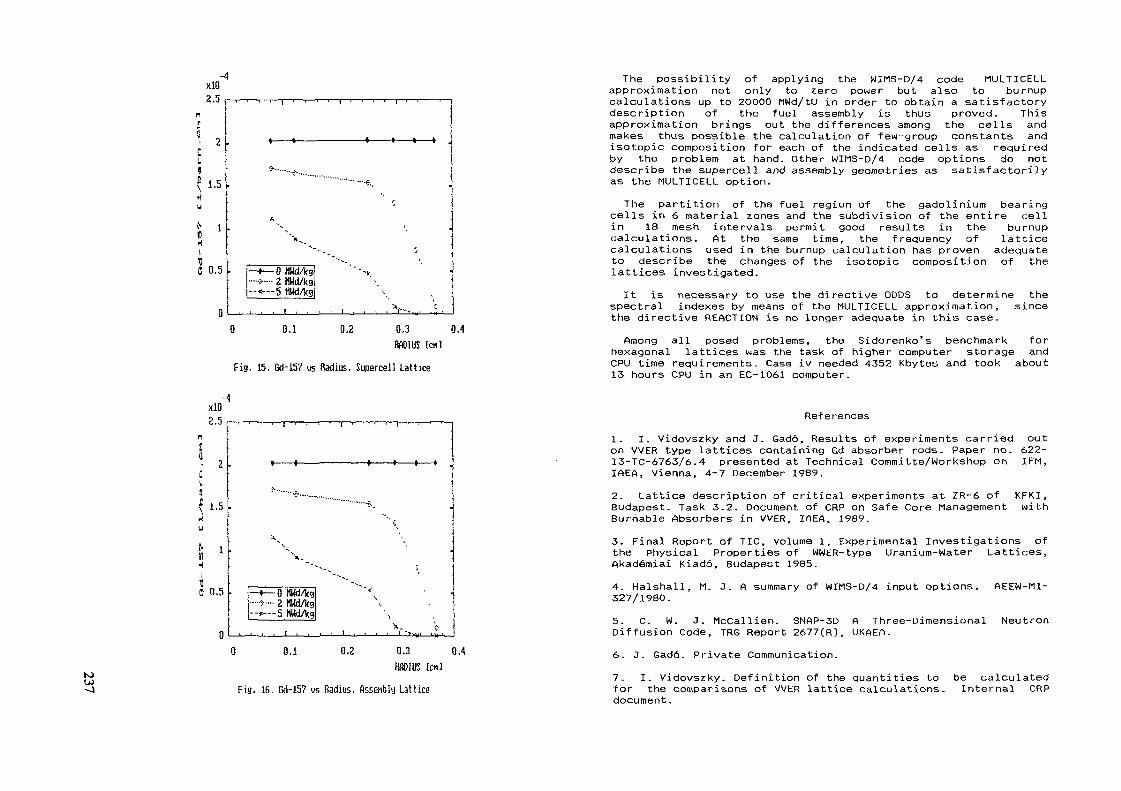
xlO
ni0 0.5
0.1 0.2 0.3RADIUS [en]
0.4
Fig. 15. Gd-157 ys Radius. Supercell Lattice
The possibility of applying the WIMS-D/4 code MULTICELLapproximation not only to zero power but also to burnupcalculations up to 2OOOO MWd/tU in order to obtain a satisfactorydescription of the fuel assembly is thus proved. Thisapproximation brings out the differences among the cells andmakes thus possible the calculation of few-group constants andisotopic composition for each of the indicated cells as requiredby the problem at hand. Other WIMS-D/4 code options do notdescribe the supercell and assembly geometries as satisfactorilyas the MULTICELL option.
The partition of the fuel region of the gadolinium bearingcells in 6 material zones and the subdivision of the entire cellin 18 mesh intervals permit good results in the burnupcalculations. At the same time, the frequency of latticecalculations used in the burnup calculation has proven adequateto describe the changes of the isotopic composition of thelattices investigated.It is necessary to use the directive ODDS to determine the
spectral indexes by means of the MULTICELL approximation, sincethe directive REACTION is no longer adequate in this case.Among all posed problems, the Sidorenko's benchmark for
hexagonal lattices was the task of higher computer storage andCPU time requirements. Case iv needed 4352 Kbytes and took about13 hours CPU in an EC-1061 computer.
to
xiO2.5
1.5).
»i0 0.5
\.-
0.1 0.2 0.3RADIUS ten]
0.4
Fig. 16. Gd-15? us Radius, flssehbly Lattice
References1. I. Vidovszky and J. Gado, Results of experiments carried outon WER type lattices containing Gd absorber rods. Paper no. 622-I3-TC-6763/6.4 presented at Technical Committe/Workshop on IFM,IAEA, Vienna, 4-7 December 1989.2. Lattice description of critical experiments at ZR-6 of KFKI,Budapest. Task 3.2. Document of CRP on Safe Core Management withBurnable Absorbers in WER, IAEA, 1989.3. Final Report of TIC, volume 1, Experimental Investigations ofthe Physical Properties of WWER-type Uranium-Water Lattices,Akadémiai Kiadô, Budapest 1985.4. Halshall, M. J. A summary of WIMS-D/4 input options. AEEW-M1-327/1980.5. C. W. J. McCallien. SNAP-3D A Three-DimensionalDiffusion Code, TRG Report 2677(R), UKAEA.
Neutron
6. J. Gado. Private Communication.7. I. Vidovszky. Definition of the quantities tofor the comparisons of WER lattice calculations,document.
be calculatedInternal CRP
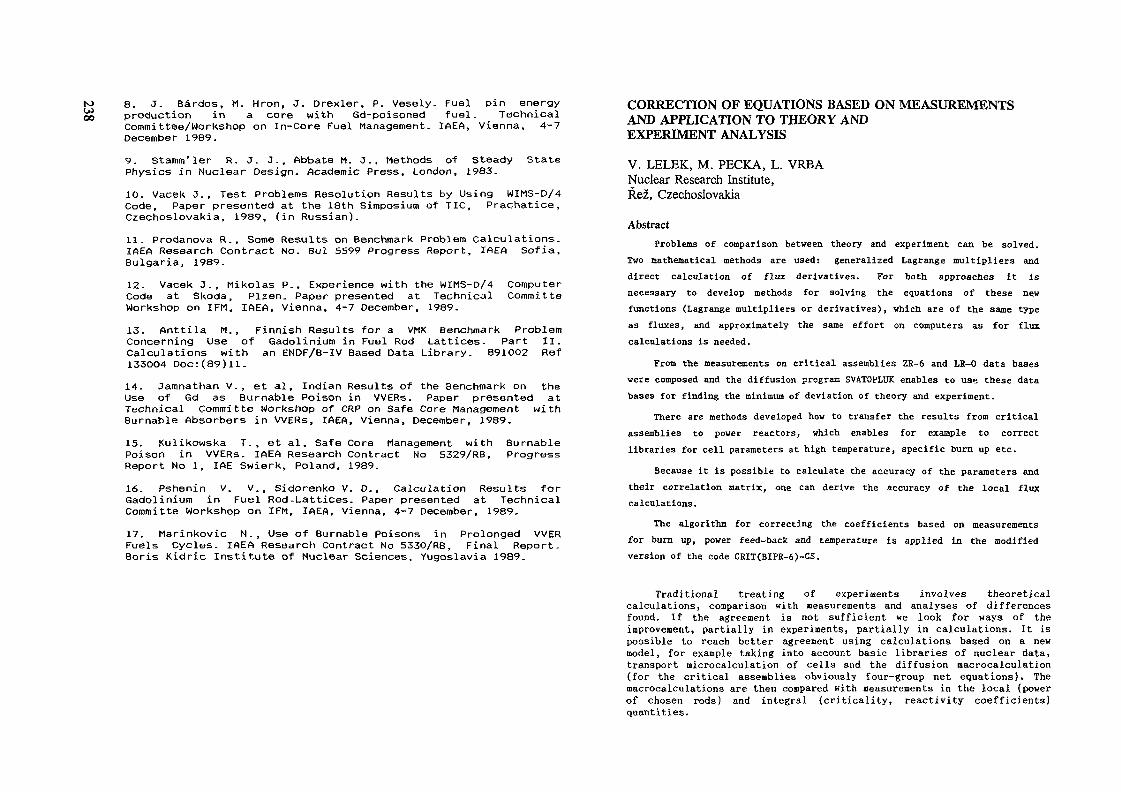
N)WCO8. J. Bârdos, M. Hron, J. Drexler. P. Vesely. Fuel pin energyproduction in a core with Gd-poisoned fuel. TechnicalCommittee/Workshop on In-Core Fuel Management. IAEA, Vienna, 4-7December 1989.9. Stamm'ler R. J. J., Abbate M. J., Methods of SteadyPhysics in Nuclear Design. Academic Press, London, 1983.
State
10. Vacek J.t Test Problems Resolution Results by Using WIMS-D/4Code, Paper presented at the 18th Simposium of TIC, Prachatice,Czechoslovakia, 1989, (in Russian).11. Prodanova R., Some Results on Benchmark Problem Calculations.IAEA Research Contract No. Bul 5599 Progress Report, IAEA Sofia,Bulgaria, 1989.12. Vacek J., Mikolas P., Experience with the WIMS-D/4 ComputerCode at Skoda, Plzen. Paper presented at Technical CommitteWorkshop on IFM, IAEA, Vienna, 4-7 December, 1989.13. Anttila M., Finnish Results for a VMK Benchmark ProblemConcerning Use of Gadolinium in Fuel Rod Lattices. Part II.Calculations with an ENDF/B-IV Based Data Library. 891002 Ref1330O4 Doc:(89)11.14. Jamnathan V., et al, Indian Results of the Benchmark on theUse of Gd as Burnable Poison in VVERs. Paper presented atTechnical Committe Workshop of CRP on Safe Core Management withBurnable Absorbers in VVERs, IAEA, Vienna, December, 1989.15. Kulikowska T., et al, Safe Core Management with BurnablePoison in VVERs. IAEA Research Contract No 5329/RB, ProgressReport No l, IAE Swierk, Poland, 1989.16. Pshenin V. V. , Sidorenko V. D., Calculation Results forGadolinium in Fuel Rod-Lattices. Paper presented at TechnicalCommitte Workshop on IFM, IAEA, Vienna, 4-7 December, 1989.17. Marinkovic N., Use of Burnable Poisons in Prolonged WERFuels Cycles. IAEA Research Contract No 5330/RB, Final Report.Boris Kidric Institute of Nuclear Sciences, Yugoslavia 1989.
CORRECTION OF EQUATIONS BASED ON MEASUREMENTSAND APPLICATION TO THEORY ANDEXPERIMENT ANALYSIS
V. LELEK, M. PECKA, L. VRBANuclear Research Institute,Rez, Czechoslovakia
AbstractProblems of comparison between theory and experiment can be solved.
Two mathematical methods are used: generalized Lagrange multipliers anddirect calculation of flux derivatives. For both approaches it isnecessary to develop methods for solving the equations of these newfunctions (Lagrange multipliers or derivatives), which are of the same typeas fluxes, and approximately the same effort on computers as for fluxcalculations is needed.
From the measurements on critical assemblies ZR-6 and LR-0 data baseswere composed and the diffusion progras: SVA.TOVLUK enables to use these databases for finding the minimum of deviation of theory and experiment.
There are methods developed how to transfer the results from criticalassemblies to power reactors, which enables for example to correctlibraries for cell parameters at high temperature, specific burn up etc.
Because it is possible to calculate the accuracy of the parameters andtheir correlation matrix, one can derive the accuracy of the local fluxcalculations.
The algorithm for correcting the coefficients based on measurementsfor burn up, power feed-back and temperature is applied in the modifiedversion of the code CEIT(BIPR-6)-CS.
Traditional treating of experiments involves theoreticalcalculations, comparison with neasurements and analyses of differencesfound. If the agreement is not sufficient we look for ways of theimprovement, partially in experiments, partially in calculations. It ispossible to reach better agreement using calculations based on a newmodel, for example taking into account basic libraries of nuclear data,transport microcalculation of cells and the diffusion macrocalculation(for the critical assemblies obviously four-group net equations). Themacrocalculations are then conpared with measurements in the local (powerof chosen rods) and integral (criticality, reactivity coefficients)quantities.
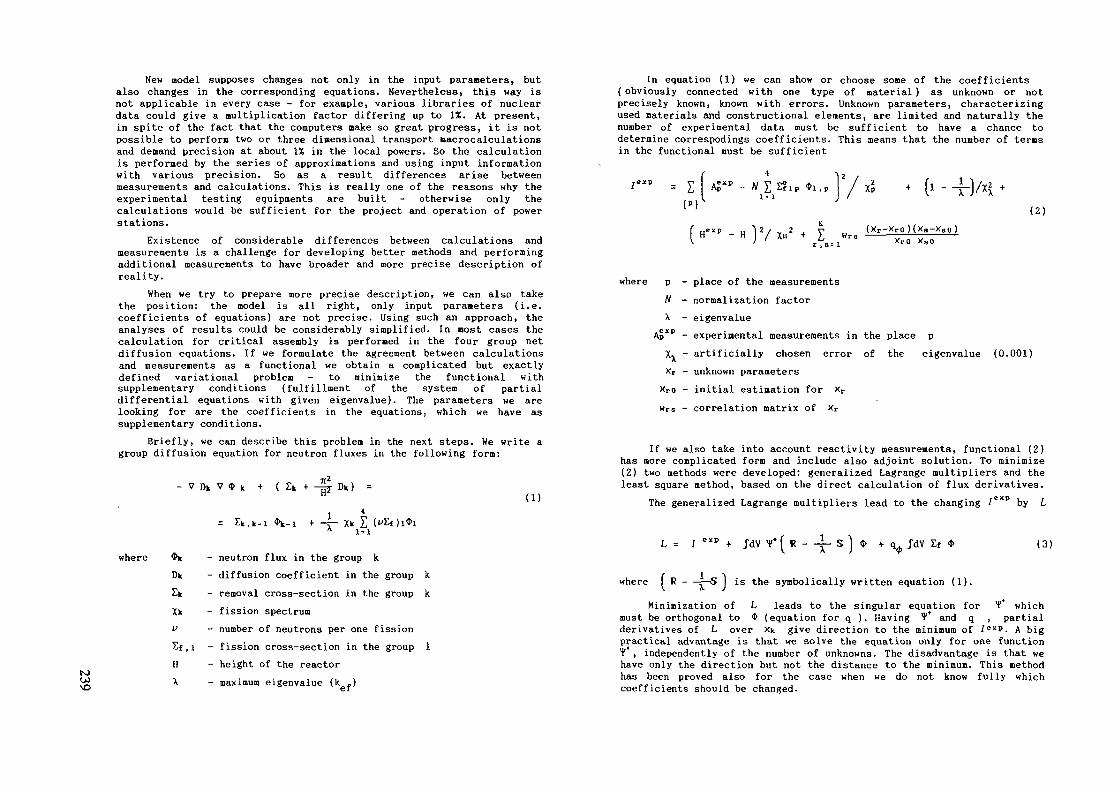
K)
New model supposes changes not only in the input parameters, butalso changes in the corresponding equations. Nevertheless, this way isnot applicable in every case - for example, various libraries of nucleardata could give a multiplication factor differing up to 1%. At present,in spite of the fact that the computers nake so great progress, it is notpossible to perform two or three dimensional transport nacrocalculationsand demand precision at about 1% in the local powers. So the calculationis performed by the series of approximations and using input informationwith various precision. So as a result differences arise betweenmeasurements and calculations. This is really one of the reasons why theexperimental testing equipments are built - otherwise only thecalculations would be sufficient for the project and operation of powerstations.
Existence of considerable differences between calculations andmeasurements is a challenge for developing better methods and performingadditional measurements to have broader and more precise description ofreality.
When we try to prepare more precise description, we can also takethe position: the model is all right, only input parameters (i.e.coefficients of equations) are not precise. Using such an approach, theanalyses of results could be considerably simplified. In most cases thecalculation for critical assembly is performed in the four group netdiffusion equations. If we formulate the agreement between calculationsand measurements as a functional we obtain a complicated but exactlydefined variational problem - to minimize the functional withsupplementary conditions (fulfillment of the system of partialdifferential equations with given eigenvalue). The parameters we arelooking for are the coefficients in the equations, which we have assupplementary conditions.
Briefly, we can describe this problem in the next steps. We write agroup diffusion equation for neutron fluxes in the following form:
- V Dk V * k 4. ( £k +- - Dk ) =n, 4
= Sk.k-l *k-i 4- -i- Xk Z
(1)
whereDk£kXkvSfHX
, i
- neutron flux in the group k- diffusion coefficient in the group k- removal cross-section in the group k- fission spectrum- number of neutrons per one fission- fission cross-section in the group 1- height of the reactor- maximum eigenvalue (k -)
In equation (1) we can show or choose some of the coefficients( obviously connected with one type of material ) as unknown or notprecisely known, known with errors. Unknown parameters, characterizingused materials and constructional elements, are limited and naturally thenumber of experimental data must be sufficient to have a chance todetermine correspodings coefficients. This means that the number of ternsin the functional must be sufficient
( 4 -i2AF'-^aip^pj/rf * (i-4-W*
(*"-»Y/»2*$m.r.(*'-^,l(Z?-'}
(2)
where p - place of the measurementsN - normalization factorX - eigenvalue
Ap*p - experimental measurements in the place pX, - artificially chosen error of the eigenvalue (0.001)xr - unknown parameters
Xro - initial estimation for xrwrs - correlation matrix of xr
If we also take into account reactivity measurements, functional (2)has more complicated form and include also adjoint solution. To minimize(2) two methods were developed: generalized Lagrange multipliers and theleast square method, based on the direct calculation of flux derivatives.
The generalized Lagrange multipliers lead to the changing /exp by L
L - I e*p 4- JdV T* [ R - -i- S ] <S> JdV (3)
where is the symbolically written equation (1).Minimization of L, leads to the singular equation for Y which
must be orthogonal to * (equation for q ). Having ¥* and q , partialderivatives of L over Xk give direction to the minimum of /e*D. A bigpractical advantage is that we solve the equation only for one functionf* , independently of the number of unknowns. The disadvantage is that wehave only the direction but not the distance to the minimum. This methodhas been proved also for the case when we do not know fully whichcoefficients should be changed.

Direct calculation of derivatives leads to the equations for
„a* i _ a*ax x " ax "i ax _, _ aRT—— —5:—— S <J> + —5——x ax ax
(4)* - -ax
which have formally the sane structure and properties as those for VUsing (4) in the process of «inimizing (2) we obtain equations for xrwhich are often nearly singular equations due to correlations betweenunknowns and small influence of unknowns on the results.
This negative features and also time consuming calculations of alla$/ox favor the treatment by the method of generalized Lagrangemultipliers.
Lagrange multipliers treat also very simply the tolerances of fuelfabrication parameters which can lead to remarkable changes in fluxes fora large reactor where the solution of equations is not stable.
Both methods are included in the program SVATOPLUK [1] which wasdeveloped from the program BRETISLAV [2]. In this new program newdeveloped iteration schemes were included for singular equations for ¥and d*/ax •
The last version of this code was implemented on the personalcomputers AT-286 and AT-386, using operating systems DOS 3.30 and OS/2.
For the PCs, a system of some special programs for operating withinput data and with output files was developed. User can operate directlywith all of the input files that contain physical parameters of reactorcores and experimental data from the measurements on critical assemblies.In this time the input files describe more than 20 different experiments(which could be openly distributed) realized on assemblies ZR-6 (KFKIBudapest) and LR-0 (NEI Rez) and contain a lot of different sets ofdiffusion constants.
With the help of the special graphic program user can evaluateresults of calculations more easily and quickly. It is possible to showon the screen - in color graphic Bode - neutron fluxes in all groups,power distribution, differences between measured and calculated valuesetc.
All results can be saved on the disk in the binary form. User cansimply modify this binary files and use them as an input for newcalculations. All the system of the input and output files can beexpanded and modified by the programs.
Suitable experimental data were the collection of measurements doneon ZR-6 [3] critical assembly in Budapest which was in the technical andphysical conception forerunner to the LR-0 critical assembly.
A lot of calculations based on various sets of four group parameterswere performed in which various subsets of these were corrected. Initial
differences between measurements and calculations were practically thesane. Results obtained with corrected parameters were dependent on chosensubset of group parameters which were corrected.
The quantities of a special attention are diffusion coefficients.Using them for minimization, it is possible to reach the best results.
Table 1 demonstrates the simultaneous minimization of a series ofexperiments. Methods were developed how to transfer these results fromcritical assemblies to power reactors, which enables us, for example, tocorrect libraries of cell's parameters for states with highertemperature, burn-up, etc. [4],
Tests and controls were performed on the experimental data notincluded in the minimization algorithm. From all these calculations wecan conclude that it is possible completely exclude systematic characterof errors and differences near the water holes, reflector and absorbers.Survey of chosen results cannot fully show the degree of improvementsbecause lot of measured cores are pure (only with fuel elements of thesame type) with small amount of measurements near the reflector. Resultscould be demonstrated on color pictures which have been from resultspainted by special software.
The fact that the diffusion term in the equation (1) is necessary toformulate in a new way, taking into account explicitly non-zerc currentson the cells boundaries is also demonstrated by the last works of sovietauthors [5]. We have tested results also comparing them with theMonte-Carlo calculation of subregions with the zero currents boundaryconditions. Resulting mean absorption cross sections for cells withabsorber rods are nearer after correction. It is clear because in thelattices with studied materials and composition we are trying to reachtransport accuracy with corrected diffusion approximation.
In the framework of our corrected equation we can conclude, thateven higher precise of calculation could be reached than that ofexperiments. Generally it is explainable' the corrected equation arecomposed from the two parts - theory and experiment - on the same leveland so they carry more information that alone each of their components(equations ha\e been learned by experience).
Because we are able to calculate the accuracy of our parameters andtheir correlation matrix, we can find the accuracy of the local fluxcalculation, concepts which are one of the greatest interest for powerreactor.
The above mentioned algorithm, for corrections of coefficients onthe basis of measurements for equations with burn-up and both power andtemperature feedback, was used for the correction of some coefficientsin the computing code BIPR-6. The modified version of this codeCRIT (BIPR-6)-CS [6] was created. The parameters which are looked forare the coefficients of approximations which reflect dependencies onthe reactor state (burn-up, power, etc.) in the equations describing thereactor.
In the present version of the code, the algorithm of a correctionbased on the method of generalized Lagrange multipliers for a reactor on

Table 1. Improvement in the description of local power densities of variouscores. Measurements from the critical assembly ZR-6 are used.Great errors in effective multiplication factor ( denotes by * }are due to underestimation of extrapolated lengths.
Number of groups 1 R._..it_ 4.akpn ,,„,„,, initial data (UNIRASOS)4 | Results taken using corrected data(SVATOPLUK)
Controlnumber
188/188
188/188
188/188
154/154
154/154
154/154
161/161
161/161
161/161
163/161
163/161
163/161
58/57
147/138
57/57
100/100
101/100
103/103
90/87
Temp.[ "C ]20
80
130
20
80
130
20
80
130
90
80
130
20
20
20
20
20
20
20
affectivemult,factor0.99540.99760.99540.99750.99470.99680.99711.00130.99811.00231.00011.00400.99861.00060.99831.00060.99710.99971.00201.00401.00301.00521.00401.00630.99701.00030.99751.00040.99380.99640.9877 ...0.98850.99340.99810.9808 *0.98360.9863 „.0.9893
Value ofFunc.
291260928327418359115816469
74 E+640 E+6826323148796431 E+615 E+684 E+642 E+6121 E+660 E+6145 E+662 E+673 E+633 E+655016556162090768238115933413911697829210178990
Averagedeviation[ % )1.320.912.651.642.151.141.671.301.181.131.090.841.201.091.311.161.321.181.351.121.160.950.930.832.151.312.171.482.331.523.201.533 221.003.982.003.101.02
Maximum cpositive( % ]
+ 2.70+ 1.69+ 4.86+ 3.48+ 3.64+ 3.16+ 5.03+ 4.32+ 3.40+ 3.09+ 3.01+ 1.90+ 4.43+ 3.99+ 4.91+ 4.57+ 3.27+ 2.50+ 3.34+ 2.67+ 2.12+ 2.01+ 1.99+ 2.02+ 4.17+ 5 06+ 5.97+ 4.57+ 4 82+ 5 51+ 7.64+ 5.32+ 5.73+ 3.33+ 11.4+ 6.48+ 5,02+ 2 50
eviationnegative
I % 1- 17.4- 5.74- 20.3- 8.87- 18.1- 4.91- 5.58- 2.54- 4.59- 2.23- 5.91- 3.09- 7.72- 3.24- 7.43- 3.45- 8.04- 3.14- 9.01- 3.97- 8.84- 3.78- 6.87- 2.28- 10.4- 4.32- 8.95- 4.19- 16.2- 8.11- 6.08- 3.95- 10.1- 3.90- 10.2- 5.83- 8.02- 2.25
power is used. For the time being, it is possible to perfora thecorrection according to measurements of thermocouples or according torelative powers in assemblies, which are obtained by a reconstruction ofpower distribution from measurement of self-powered detectors.
The functional
I=y- r r Pi(f)-PKf) i'dt, +{fe} ° L x(f)PKf) J
i2r [ p(xj,t') - p(xj,f)
v [ .Cn(t>) - Cg(ti) Y. [t L Xc(t.) j [1*1. B
X(x0,t') p(x0,t')
TEOB - TEOBXT
dt' +
TEOC - TEOCXT
(5)
is minimized,
where ( ~ denotes experimental values )Pi - relative assemblywise power according to thermocoup-
le measurement in assembly 1p - relative power according to self-powered detector mea-
surementNTC - number of thermocouplesNSPD - number of self-powered detectorsX - relative errorCB - boron concentrationTEOB - part of operating lifeline, in which reactor was
controlled by boric acidTEOC - full operating lifetime of a cycle
The work of the code was tested by calculations of the VVER-440reactor on the basis of mean relative power in assemblies according tothermocouple measurements from the 1st, 2nd and 3rd fuel cycle of the4th unit of the Jaslovske Bohunice Nuclear Power Plant ( NPP ).
Considerable differences of relative power in assemblies on the coreedge led to a correction of boundary conditions on the boundary withradial reflector. In case there are great differences with opposite signin adjacent assemblies a better agreement can be reached by correctionof local boundary coefficients only. These coefficients correct localvalues of boundary conditions of a single abscissa of the interfacecore - radial reflector. Their correction ( on the base of measurementsfrom the beginning of the 1st cycle ) led to the decreasing of relativeerrors in boundary absemblies.

NI Table 2 An improvement of relative assemblywise powers descriptionjij J.Bohunice-4 NPP, 1st, 2nd, 3rd cycle
( 0 - original data set, C - corrected data set )
1 0C
2 0C
3 0C
Deviationmean1.91.44.12.93.22.8
..maximumpositive negative7.30 -8.764.03 -3.519.00 -11.598.54 -7.79
15.86 -7.8612.72 -8.14
Functionalrel.power
1725707
4913267237002817
CB
39243967551211
total211711464980272737122828
All coefficients for an approximation of the diffusion length werecorrected ( for all fuel types ) on the data from the 3rd fuel cycle( the reason is to consider the whole interval of burn-up ) for thedecreasing of relative errors in internal assemblies.
The comparison of calculational results with original input data andwith a data set with corrected diffusion length coefficients and localboundary coefficients is presented in Table 2. The comparison of relativeerrors at one time point is demonstrated in Figure 1. Experimental datain the sector of symmetry 60° for a fuel charge with symmetry 30° weregiven. Relative great differences of measured values for some assenbliesin symmetric position influence error distribution after the correction,too, and speaks about the quality of measurements or about the othersources of differences ( manufacturing, geometry ).
The general validity of corrected data was tested by experinentaldata from the 2nd fuel cycle, which were not used for the correction.
Later the code was tested by experimental data from the 1st cycle ofthe Loviisa-1 NPP, which had a different initial loading pattern. It isnot possible to use for this reactor the data set corrected on the baseof measurements from the J.Bohunice-4 NPP. An influence of correction ofthe same groups of coefficients ( diffusion length approximation wascorrected in spite of little burn up ) on the measurements from thisreactor and comparison with results of HEXBU-3D and BIPR-7 codes [7] ispresented in Tab. 3 and on Fig. 2, 3.
The experimental data for this reactor were given in the 30° sectorof symmetry. An influence of measured values differences in symmetricpositions is eliminated in this case.
Most of all it is necessary to test widely the code by measurementsfrom other reactors. According to up to now obtained results from themeasurements which were at our disposal it can be supposed, thatcorrected data set can be probably used for other cycles of the sanereactor to reach better agreement at least. It can be supposed, thatthis situation is partly caused by the fact, that the described
x.xx.x
number of assembly in60° sector
BIPR-6BIPE-6cr
597.22.8
57 580.0 0.9
-2.8 1.553 54 55 56
-4.6 4.9 4.9 -1.1-0.5 1.5 2.5 2.248 49
-1.6 2.31.7 -0.3
50 51 523.7 -3.62.5 0.7
42 43 44 45 46 473.2 1.2 -1.1 0.2 -0.9 -5.31.3 -1.4 2.0 -0.3 2.0 -1.1
35 36 37 38 39 40 410.3 -2.6 -1.2 -0.3 0.0 3.1 -3.3
-2.0 0.5 1.3 -2.6 -0.6 1.8 -0.2281.60.0
20-1.42.8
210.
-I.
29-2.31.0
30 31-2.20.2
2292
-3.0.03
232.30.9
24-0.-3.
32-2.60.4
33 342.40.0
2562
1.-1.
.4
.2262.5
-0.827
-2.0-1.3
11 12 13 14 15 16 17 18 191.6 -2.9 3.0 0.3 1.8 -3.1 -4.3 0.1 4.9
-0.5 1.2 1.4 -2.0 -0.1 0.1 -0.2 -2.8 0.72
-2.80.6
33.31.7
5 6-3.7 -4.40.2 -0.8
8 91.5 2.4
-1.4 -1.510
Fig.l An ioprovenent in relative assemblywise power description( cr - corrected data set )J.Bohunice-4, 1st cycle, 13 EFPD
correction can reduce systematic differences between the results ofcalculations and measurements, which can be different for differentreactors ( units ) or for different loading patterns of the same unit,too. The reduction of systematic errors is estimated about 30 - 50 %and for the calculated examples practically vanish. But the experiencefrom various calculation should be greater to support such statements.
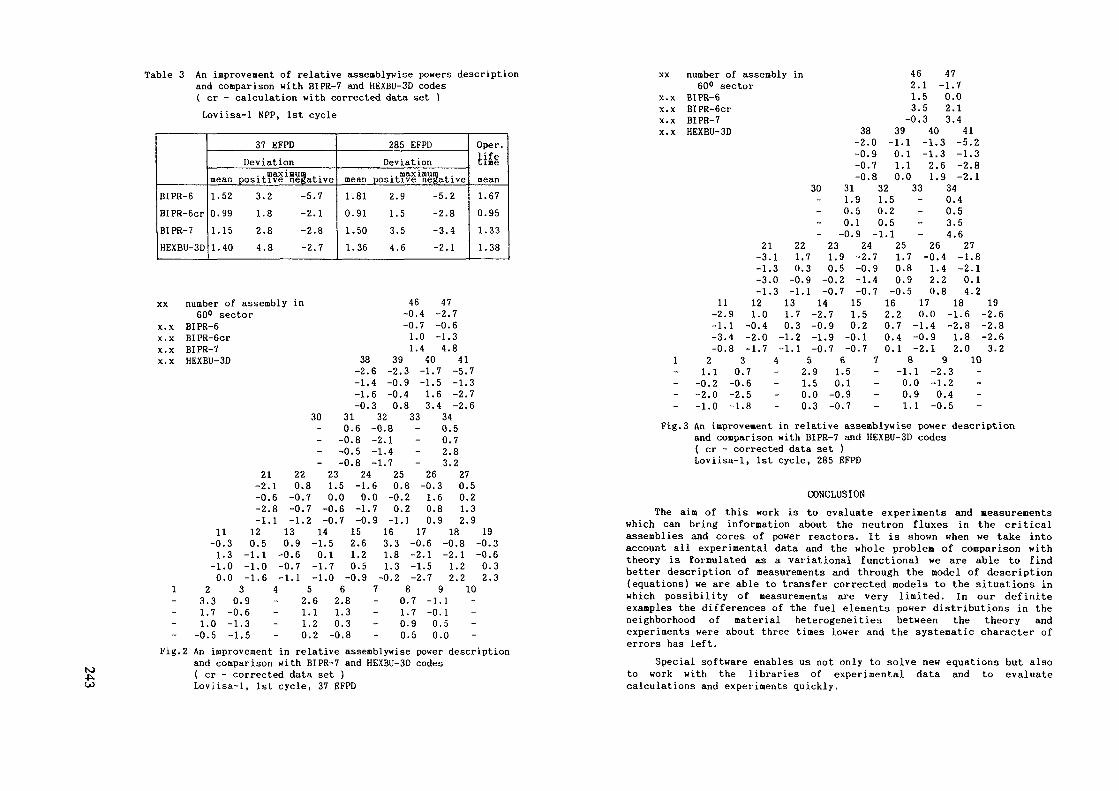
Table 3 An improvement of relative assemblywise powers descriptionand comparison with BIPR-7 and HEXBU-3D codesC cr - calculation with corrected data set )Loviisa-1 NPP, 1st cycle
BIPR-6BIPR-6crBIPR-7HEXBU-3D
37 EFPDDeviation
. maxiuummean positive negative1.52 3.2 -5.70.99 1.8 -2.11.15 2.8 -2.81.40 4.8 -2.7
285 EFPDDeviation.^maximum . .mean positive negative
1.81 2.9 -5.20.91 1.5 -2.81.50 3.5 -3.41.36 4.6 -2.1
Oper.lifetinemean1.670.951.331.38
XX number of assembly in60° sector
x.xx.xx.xx.x
BIPR-6BIPR-6crBIPR-7HEXBU-3D
11
1----
-01
-10
23.31.71.0-0.5
.3
.3
.0
.00-0-1-1
21-2.1-0.6-2.8-1.1
220.8-0.7-0.7-1.2
12 130.5 0-1.1 -0-1.0 -0-1.6 -13 4.9.6.3» o —
.9
.6
.7
.1
30----
38-2.-1.-1.-0.
310.6-0.8-0.5-0.8
23 2410-0-014
-1.50.1-1.7-1.052.1.1.0.
612
.5 -1.
.0 0.
.6 -1.
.7 -0.152.61.20.5-0.962.81.30.3
46-0.4-0.71.01.4
396 -24 -06 -03 032
-0.8-2.1-1.4-1.7
47-2.7-0.6-1.34.8
40 41.3 -1.7 -5..9 -.4.833----
256 00 -07 09 -1
163.31.81.3-0.27---
2 -0.8
1.5 -1.1.6 -2.3.4 -2.
340.50.72.83.2
26 27.8 -0.3 0..2.2.]
1.6 0.0.8 1.0.9 2.
17 18-0.-2.
6 -0.81 -2.1
-1.5 1.2-2.7 2.280.71.70.90.5
7376
5239
19-0.-0.0.2.
3633
9 10-1.1-0.10.50.0
----
XX
x.xx.xx.xx.x
1----
number of assembly in60° sector
BIPR-6BIPR-6crBIPR-7HEXBU-3D 38
-2.-0.-0.-0.
30 311.90.50.1-0.9
11-2.-1.—3-0.21.1
-0.2-2.0-1.0
9148
0-0-2-1
21-3.-1.-3.-1.121.0
-0.4-2.0-1.73.7.6.5.8
22 23 241 1.7 1.9 -2.3 0.3 0.5 -0.0 -0.9 -0.2 -1.3 -1.1 -0.7 -0.13 14 151.7 -2.7 1.50.3 -0.9 0.2-1.2 -1.9 -0.1-1.1 -0.7 -0.74 5 6
2.9 1.51.5 0.10.0 -0.90.3 -0.7
46 472.1 -1.71.5 0.03.5 2.1-0.3 3.4
39 40 410 -1.1 -1.3 -5.29 0.1 -1.3 -1.37 1.1 2.6 -2.88 0.0 1.9 -2.132 33 341.5 - 0.40.2 - 0.50.5 - 3.5-1.1 - 4.67947
7----
251.70.80.9-0.5162.20.70.40.1
8-1.0.0.1.
26-0.41.42.20.8
170-1-0-2
.0
.4
.9
.1
27-1-204
18-1.6-2.81.82.0
91091
-2.-1.0.-0.
3245
.8
.1
.1
.219-2.-2.-2.3.
10----
6862
Fig. 2 An improvement in relative assemblywise power descriptionand comparison with BIPR-7 and HEXBU-3D codes( cr - corrected data set )Loviisa-1, 1st cycle, 37 EFPD
Fig.3 An improvement in relative assemblywise power descriptionand comparison with BIPR-7 and HEXBU-3D codes( cr - corrected data set )Loviisa-1, 1st cycle, 285 EFPD
CONCLUSION
The aim of this work is to evaluate experiments and measurementswhich can bring information about the neutron fluxes in the criticalassemblies and cores of power reactors. It is shown when we take intoaccount all experimental data and the whole problen of comparison withtheory is formulated as a variational functional we are able to findbetter description of measurements and through the model of description(equations) we are able to transfer corrected models to the situations inwhich possibility of neasurements are very limited. In our definiteexamples the differences of the fuel elements power distributions in theneighborhood of material heterogeneities between the theory andexperiments were about three times lower and the systematic character oferrors has left.
Special software enables us not only to solve new equations but alsoto work wi th the libraries of experimental data and to evaluatecalculations and experiments quickly.

to REFERENCES
[1] Lelek, V.. A Code for Correction of Coefficients of Few-GroupDiffusion Equations Based on Measurements ( in Russian )( Report UJV 8249 - R,A ). NRI Rez 1987 . 76 pp.
[2] Lelek, V.. BRETISLAV - A Net Code for Calculation of a Reactor inHexagonal Geometry ( in Russian )( Report UJV 7771 - R,A ). NRI Rez 1986 . 40 pp.
[3] Final Report TIC. Vol.1.Akadémiai Kiado, Budapest 1984
[4] Lelek V., Pecka M.: The Use of Results from Critical Experimentsto the Correction of Exploitational Parameters of Reactor Cores1st Symposium of AER, Rez, Czechoslovakia, 23-27 September 1991
[5] Laletin N . P . , Novikov A . N . - Final Report TIC. Vol.2.Akadémia Kiado, Budapest ( at press )
[6] Vrba L. : Correction of Coefficients Based on Measurement in theCode CRIT(BIPR-6)-CS( Report UJV ) ( to be published )
[7] Styrm J.A.' personal information
NUMERICAL SOLUTION OF THE CRITICALITYPROBLEM FOR WER FUEL ASSEMBLIES BY THEMONTE CARLO CODES MOCA AND MOCA 2
J. KYNCLNuclear Research Institute,Rez, Czechoslovakia
Abstract
The codes, MOCA and MOCA 2 seive to detailed solution to theproblem £01 transport equation in case of thr ee-dimensiolldlhexagonal geometry and energy gioup description They have beenimplemented to personal computei In MOCA code, the pioblem issolved by method of successive generations Different way ofthe solution is used in MOCA 2 code it is based on theoiy ofpositive opeiatois and it enables to avoid the problem of biaswhich fiequeiitly occuis in the method of successivegeneiations In this contribution, infozmation conceiniuginput and output of the codes, then possible applications andsome results aie presented
THE PROBLEM SOLVED
The codes have been developed to numerical solution of theonticality pioblem foi steady state linear Boltzmann equationThey aie designated £01 calculation of detailed neution fluxdistribution in a reactoi and they aie composed in such a wayto model correctly a real situation Nevertheless, thefollowing conditions aie assumed to be satisfied
a) Region of fuel assembly is considered which is placed eitheiin vacuum 01 in infinite legular hexagonal lattice Next,existence of 30° - or 60° - sectoi of symmetry of theassembly is supposed (Fig 1 and 2)
b) The assembly is composed of cells which, in transversal(i e x - y) direction have shape of regular hexagonsfilling up regular hexagonal lattice and of an envelope

FIG 1 Infinite hexagonal lattice
FIG 2 Permissible sectors of symmetry
consisting of triangles and quadiangles The cells havegeometrical structure as shown at Fig 3
c) The problem has form
Aip = B(p + €<p/X X = k eff
where D is the spatial sector of bymmetry considered, M(D) ato linear space of complex functions which are defined on the<-" set M = D x E3 and
l \
7FIG 3 Permissible geometrical structure of cells
Aip s <
JdE'/dS' £„ (x ,E ' ->E,2 ' ->5) i p ( x , E ' , W ' ) ,0 0 S
= ;dE'JdS'<p(x,E' ,w' ){X f0 0 £
+ 2 X n ( E ) Z n ( x , E ' ) } / 4 / 7 t
Ntxt, x, E, ü mean the spatial cooidinate, eneigy and theangulai vectoi , ft the surface of unit spheie, Zt the totalmacioscopic effective cioss-section, S , IL, and Z the
S £ 11macio&copic clots-sections foi scatteiing, fission and(n,2n) lea^tion, Xp and xn the eneigy spectium of neutionsfiom the fission and (n,2n) leaction, f(E') the nunibei offission neutrons conebponding to eneigy E' of impingingneution, k. cc the effective multiplication factoi and <p isthe differential neution flux

d) Problem (I) is solved in energy group formalism assumingthat scattering cross-section is known as a decomposition toLegendre polynomials in angular variable.
The main result of numerical solution to problem (1) is themultiplication coefficient and integral neutron flux
4>(x,E) = Jdu <p(x,E,w)0
in individual energy groups and spatial zones. This fluxcomputed serves as a basis for evaluation of another physicalquantities: power in any of zones, mean power density per fuelrod, mean neutron flux per cell, the mean flux in the assembly,activation rate, mean effective cross-sections per cell andreductions of groups and the mean diffusion constants for theassembly in reduced energy groups /!/.
METHOD OF THE SOLUTION
In both codes, the problem is solved by monte Carlo method.Specifically, method of successive generations is used in MOCAcode:Problem (1) is transformed to the integral form
\<f = ( I - ft~1B)"1ft"1C1p s
and iterative scheme
e D(T) * m(D) (2)
Xi =
x = lim x. , ,
is employed. Here, g is a function and (<p.,g) means scalarproduct, e.g.
= /
In any generation i, scalar product { <p., g) is simulated bymeans of results of N. mutually independent trials in a processof random collisions. Unfortunately, such a computation leadsto a bias . It has been shown that the error depends on thenumber N of trials per one generation and it does not decreasewith the number of generations used (see e.g. /If).To avoid this difficulty we have employed rather different ideaof computation in code MOCA 2:By appropriate choice of the domain D(T) operator T gains theseproperties:
a) T is linear and positive .b) T is compact.c) Spectral radius r(T) of T is positive
(see e.g. /3/) . Then, according to theory of positive operators/4/, there is one and only one nonnegative eigensolution <p tothe problem (2) eigenvalue XQcorresponding to it being positiveand
xo = r(T).
Next, for any function x e D(T) and for any positive integer n,relation
(3)
holds. Here, v<0 is a positive eigensolution to the problemadjoint to (2) and T. is a linear operator such that
Clearly, by (3)
X. = limn-m-»<">
(4)

vatercladding fu»l
fuel cell •water
1.275 0.7«
FIG. 4a. Structure of cassette. FIG. 4b. Details of fuel cell.
In the code MOCA 2, scalar product (T x,g) ismeans of special random process and X^ = kaccording to expression (4) for n,
o ~ effm sufficiently
simulated bycalculated
great.Accuracy £expression
ffl corresponding to eigenvalue is computed from
-1
where e, denotes the accuracy o£ product (T x/9) determined.K,by Monte Carlo method, in this way, using MOCA 2 code, weobtain numerical results bias of which can be made arbitrarilysmall (for some details, see /5/).
APPLICATIONS
The codes MOCA and MOCA 2 are written in FORTRAN and recentlythey have been implemented also to personal computers AT-286and AT-386 using operating system DOS 3.30 and OS/2. Theyconsist of 2313 and of 2523 statements and they need about 400kB of the computer memory, under OS/2, history of a particletakes about 0 . 1 sec .MOCA code has been utilized to the computations connected withthe project "Compact Spent Fuel Storage". Three-dimensionalfour-group calculations of a fuel assembly of the WER typewith an absorbing envelope have been carried out with the code.In this way, preparation of the mean diffusion constants for
such assemblies was evaluated. Also, the utilization ofdiffusion codes to more detailed calculations in the case ofcomplicated fuel assembly geometry has been tested. In thiscase, remarkable differences frequently appeared between theresults computed by transport and by diffusion codes.Several problems were computed also by MOCA 2 code and resultsof two of them are shown from the table. Problem 1 ( a ) - d) )corresponds to the case of fuel assembly WER-1000 being placedin infinite regular hexagonal lattice of the same assemblies.Absorbing rods are in and the height of the assembly isconsidered as infinite. Formulation of second problem is thesame but the absorbing rods are replaced by water. Thecomputations were performed in two steps: Resulting particledistribution from the first step served as a starting point inthe next one of computation (see variants a), b) and c) , d) ,respectively). In both steps, we have put n = 100 and m = 5.For comparison, the same problems were computed by the methodof successive generations (code MOCA).In this case we have considered 100 particles per onegeneration, 5 initial generations were omitted.
TableResults of two test problems
MOCA
Var.
la)lb)1C)id)
2a)2b)2c)2d)
N. hist
6001100400900
700800400
1100
2
' keff
0000
1111
.9585
.9610
.9650
.9643
.1547
.1533
.1528
.1522
MOCA
Err.(%) N.hist. keff Err. (%)
0000
0000
.19
.11 '
.11 124500 0.9517 0.31
.1
.16
.15
.15 177400 1.1434 0.24
.12
REFERENCES
/!/ Kyncl J., The code MOCA, ÛJV 6487 R (1983)/2/ zolotukhin v.G. and Mayorov L.V., Estimate of reactor
criticality parameters by Monte Carlo method, Moscow(1984), (Russian)
/3/ Shikhov S.v., Problems of mathematical theory of reactors,Moscow (1973), (Russian)
/4/ Krein M.G. and Rutman M.A., Linear operators leavinginvariant a cone in a Banach space, Usp. mat. nauk III,N.I, pp.3-95 (1948), (Russian)
/5/ Kyncl J., Numerical solution to the problem of criticalityby Monte Carlo method, OJV 8727-R (1989)
AN EQUIVALENCE PRINCIPLE FOR THE ADJOINTNEUTRON FLUX IN LATTICE CELL
M. NASRAtomic Energy Authority,CairoH. ROUSHDYFaculty of Engineering,Alexandria University,AlexandriaEgyptAbstractThe adjoint flux calculated by multigroup effective crosssections generated by considering the conservation ofreaction rates in the direct flux has a noticable errorspecially in the resonance energy range. In this work anequivalence principle for adjoint flux is developed for thecalculation of multigroup effective cross sections to beused in adjoint flux calculation. These multigroup effectivecross sections can be tabulated as functions of twoindependent parameters, namely: the equivalent cross sectionand the total macroscopic cross section of the moderatormedium. The numerical calculations showed a lineardependence of the multigroup effective cross sections withthe second parameter.
to•t».
1. Introduction
The equivalence principle [1] is widly used in reactor cellcalculation codes [2], [3], for generating the effectivemultigroup cross sections which are tabulated as functionsof a parameter named equivalent cross section [4-], and arestored in the code library.
In most of the cell calculation codes the effectivemultigroup cross sections are generated considering theconservation of reaction rates in the direct flux, they areused in calculation of both direct and adjoint multigroupflux distribution. It is evident that the adjoint fluxcalculated by this method is erroneous. The error is smallin energy regions in which the spectrum is slowly varyingwith energy, such as in thermal energy range. In theresonance energy range the error is significant [5], Infact, in direct flux weighting, the reaction rates areconserved, what is required in the adjoint flux calculationis not to conserve the reaction rates but to conserve theintegral of the neutron importance function multiplied bythe cross section. In case of homogeneous medium this errorwas estimated numerically using very fine group width [6],To our knowledge there is no published estimation of this
error in case of heterogeneous reactor lattice cellcalculations.
In the present work, a trial is made to derive anequivalence principle applicable for generating theeffective multigroup cross sections in the resonance energyregions suitable for adjoint flux calculations in reactorlattice cells.
2. Derivation of Adjoint Spectrum Equation
The equation describing the neutron adjoint spectrum for thefuel zone can be written in the form:
* * * x xso *o : POO R o $o + poi Ri *1 t1'where$*: Adjoint fluxE: Total macroscopic cross sectionP1ji Probability that a neutron born in zone (i) has its
first collision in zone (j)
POO + PO! = *R : Adjoint slowing down operatorEquation (1) can be written as
x x• E< (i-Poo) ————— (2)OO
to How define a Green's function such that 1 - PE0(U) -- Pcc R (1-P00) (3)
where } (u,uc) is the adjo.r.t flux inside the absorber atlethargy (u) due to a unit source at lethergy u0, <5 is theDirac delta function.
How, define the functionRÏ «Ï
which describes the contribution of the moderator. Theadjoint flux spectrum in fuel region can be described by:
du0 f (u, u0)-coIf we consider that v(u) is a slowly varying function oflethargy, we can write that
(u)where
du.
(5)
(6)-0)
In order to get 00, equation (3) is integrated over u0 from-co to u, then
-x ,* » 2e
00(0)
roo
ca0 describes the fine structure of the adjoint spectruminside a particular resonance. It can be seen from equation(7) that the value of 00 depends only on two independentparameters: £e and Ej whatever the physical structure of thelattice cell is. This means that an effective cross sectiontabulation for the adjoint calculation can be realized asfunction of the two parameters £e and Ej.
In the following section the narrow resonanceapproximation will be considered.
3. Harrow Resonance Approximation
RO $1 is given by
R
where P(u—m } is the scattering kernel. If the lethargywidth of the resonance is small compared to the averagelethargy decrement by collision, narrow resonance
* Kapproximation is applicable and 00(u ) must taKe its
X \asymptotic value outside the resonance, i.e. #o(u ) = li..
so that
where, Ee is the equivalent cross section given by:
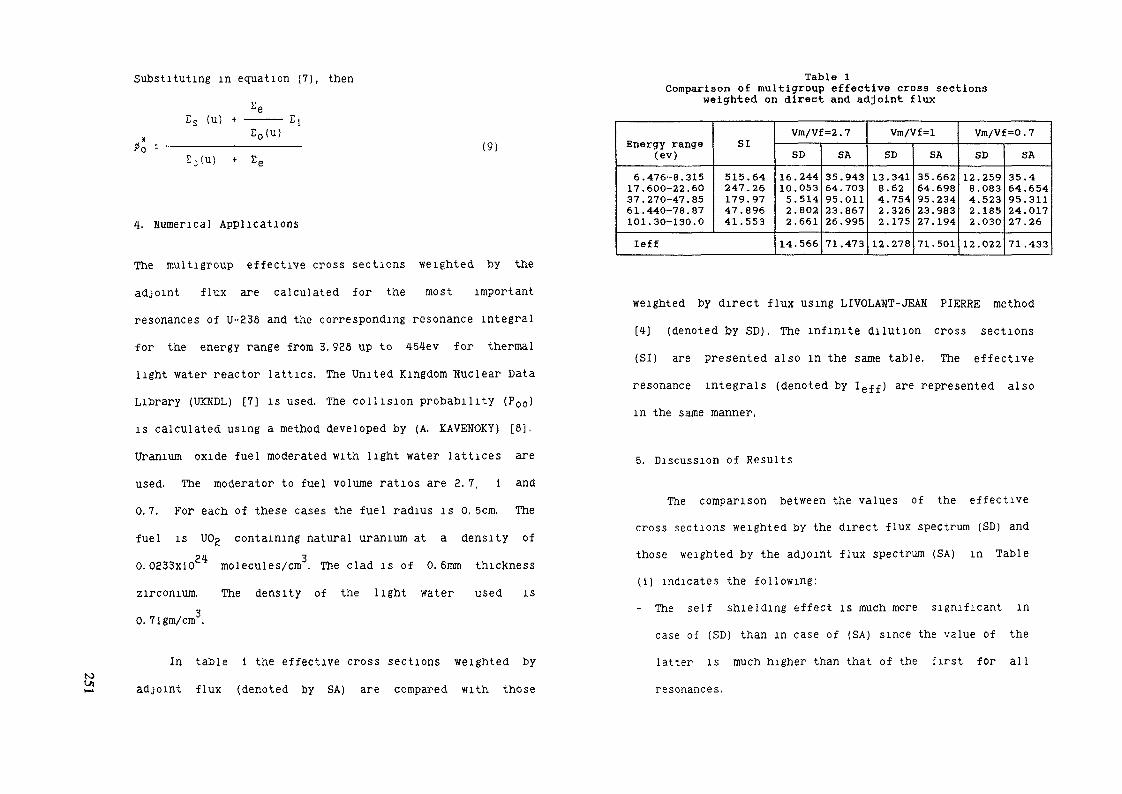
Substituting in equation (7), then Table 1Comparison of multigroup effective cross sections
weighted on direct and adjoint flux(u)
E0(U)(9!
4. numerical Applications
The multigroup effective cross sections weighted by theadjoint flux are calculated for the most importantresonances of U-238 and the corresponding resonance integralfor the energy range from 3,928 up to 4-54ev for thermallight water reactor lattics. The United Kingdom Nuclear DataLibrary (UKHDL) [7] is used. The collision probability (P00)is calculated using a method developed by (A. KAVENOKY) [8],Uranium oxide fuel moderated with light water lattices areused. The moderator to fuel volume ratios are 3.7, 1 and0.7. For each of these cases the fuel radius is 0.5cm. Thefuel is UOg containing natural uranium at a density of
24- 30.0233x10 molecules/cm . The clad is of 0.6mm thicknesszirconium. The density of the light water used is0. 71 gin/cm .
In table 1 the effective cross sections weighted byadjoint flux (denoted by SA) are compared with those
Energy range(ev)
6.476-8.31517.600-22.6037.270-47.8561.440-78.87101.30-130.0
SI
515.64247.26179.9747.89641.553
leff
Vm/Vf =2 . 7SD
16.24410.0535.5142.8022.66114.566
SA35.94364.70395.01123.86726.99571.473
Vm/Vf=lSD
13.3418.624.7542.3262.17512.278
SA35.66264.69895.23423.98327.19471.501
Vm/Vf =0 . 7SD
12.2598.0834.5232.1852.03012.022
SA35.464.65495.31124.01727.2671.433
weighted by direct flux using LIVOLAHT-JEAN PIERRE method[4] (denoted by SD). The infinite dilution cross sections(SI) are presented also in the same table. The effectiveresonance integrals (denoted by Ieff) are represented alsoin the same manner,
5. Discussion of Results
The comparison between the values of the effectivecross sections weighted by the direct flux spectrum (SD) andthose weighted by the adjoint flux spectrum (SA) in Table(1) indicates the following:- The self shielding effect is much more significant in
case of (SD) than in case of (SA) since the value of thelatter is much higher than that of the first for allresonances.
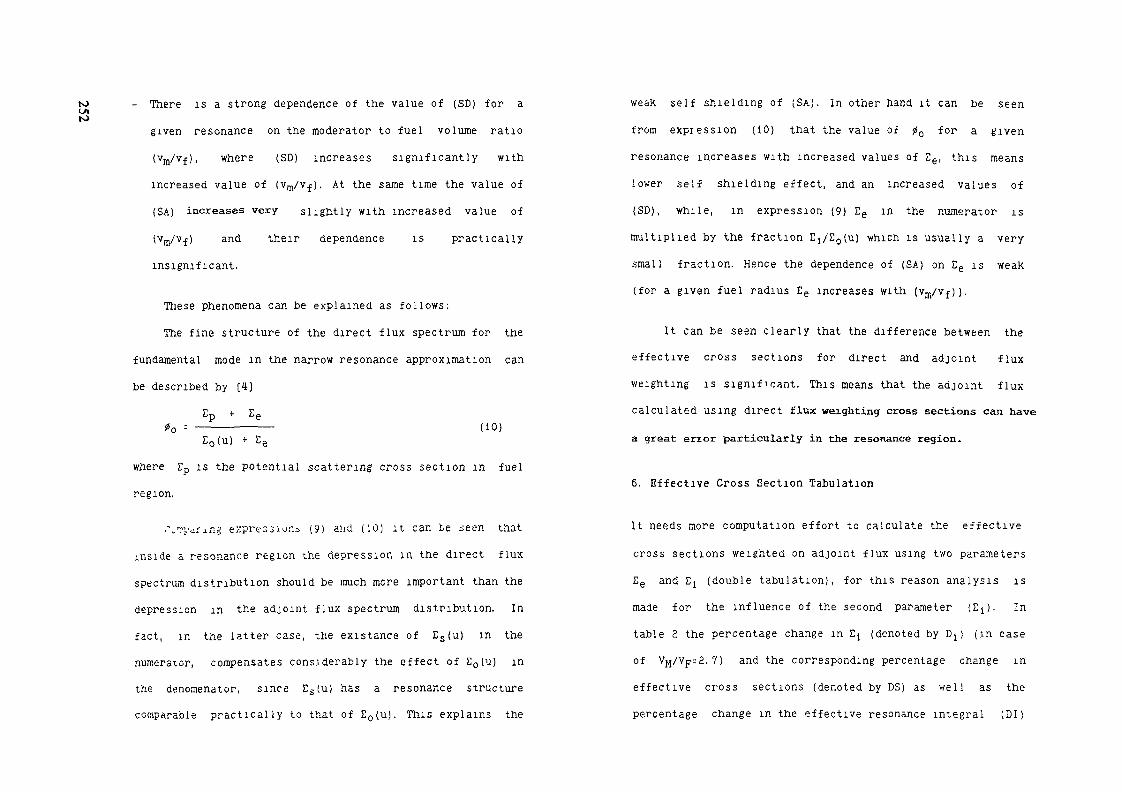
to - There is a strong dependence of the value of (SD) for agiven resonance on the moderator to fuel volume ratio(vm/Vf), where (SD) increases significantly withincreased value of (vm/Vf). At the same time the value of(SA) increases very slightly with increased value of(vm/vf) and their dependence is practicallyinsignificant.
These phenomena can be explained as follows:The fine structure of the direct flux spectrum for the
fundamental mode in the narrow resonance approximation canbe described by [4]
En + Ep(10)
E0(u)where 2p is the potential scattering cross section in fuelregion.
^vTyuring expression.* (9) ana (10) it can be seen thatinside a resonance region the depression in the direct fluxspectrum distribution should be much more important than thedepression in the adjoint flux spectrum distribution. Infact, in the latter case, the existance of Es(u) in thenumerator, compensates considerably the effect of £0(u) inthe denomenator, since Es(u) has a resonance structurecomparable practically to that of S0(u). This explains the
weak self shielding of (£A). In other hand it can be seenfrom expression (10) that the value of ?0 for a givenresonance increases with increased values of 2e, this meanslower self shielding effect, and an increased values of(SD), while, in expression (9) Ee in the numerator ismultiplied by the fraction E1/E0(u) which is usually a verysmall fraction. Hence the dependence of (SA) on Ee is weak(for a given fuel radius Ee increases with (vm/vf)).
It can be seen clearly that the difference between theeffective cross sections for direct and adjoint fluxweighting is significant. This means that the adjoint fluxcalculated using direct flux weighting cross sections can have
a great error particularly in the resonance region.
6. Effective Cross Section Tabulation
It needs more computation effort to calculate the effectivecross sections weighted on adjoint flux using two parametersEg and Ej (double tabulation), for this reason analysis ismade for the influence of the second parameter (Ej). Intable 2 the percentage change in Ej (denoted by Dj) (in caseof VH/VF:2.7) and the corresponding percentage change ineffective cross sections (denoted by DS) as well as thepercentage change in the effective resonance integral (DI)

Table 2The effect of the moderator total macroscopic cross sectionon the effective cross sections weighted on adjoint flux
Energy range(ev)
6.476-8.31517.600-22.6037.270-47.8561.440-78.87101.30-130.0
Dl
Dl=-50*
DS
-10.7*- 3.6*- 0.8*- 2.1*- 2 *
- 6.4*
Dl=-25*
DS
- 5.9*- 1.8*- 0.4*- 1.1*- 1 *
- 3.3*
Dl=25*
DS
4.9%1.8*0.4*1.1%1 %
3 %
Dl=50*
DS
9.8*3.6*0.8*2.1*2 *
6.1*
for the energy ranges considered in table 1 are represented.It can be concluded that the effective cross section valuei s approximately a linear function of £j. Then the tabulationprocedure is considerably facilitated, since we can use onlytwo values for linear interpolation.
to
7, Conclusion
In this worK an equivalence principle is derived for thecalculation of multigroup effective cross sections to beused for adjoint flux calculations. It was verified thatthey can be tabulated as functions of two independentparameters, namly the equivalent cross section (£e) and themacroscopic total cross section of the moderator (2j).However the numerical calculations showed that theeffective multigroup cross sections have a linear dependence
on EI which considerably facilitate the tabulationprocedure.
REFERENCES
[1] Bell G.I. and Glasstone S. 1970 "Nuclear reactortheory".
[H] Hoffmann A. et al. 1973 "APOLLO, code multigroupe deresolution de 1'equation du transport pour les neutronsthermiques et rapides, " CEA. K. 1610, Commissariat, al'Energie Atomique.
[3] Halsal H. J. 1980 "A summary of WIHSD4 code", AEEW-M1327.
[4] Livolant H. and Jeanpierre F. 1974 "Autoprotection des
résonances dans les reacteurs nucléaires: application aux
isotopes lourds", CEA. R. 4533, Commissariat a l 'Energie
Atomique.
[5] Greenspan E. and Kami Y. 1979 Sud. Sei. Eng,, 69, 169-
190.
[6] Wade D. C. and Bucher R. G. 1977 Sud, Sei, Eng., 64, 517-538.[7] UKNDL (United Kingdom Nuclear Data Library), 1973, given
by IAEL (NOS) 1978.
[8] KavenoKy A. 1969 "Calcul et utilisation desprobabilités 6e première collision pour des milieux hetero-genes a une dimension" Note CEA, , Nlo77.

«^ EVALUATION OF PERTURBATION*• IN THE RESONANCE REGION
M. NASRAtomic Energy Authority,CairoM.NAGYFaculty of Engineering,Alexandria University,AlexandriaEgypt
AbstractIn the present work the mathematical expressions for the direct and adjoint flux in fine
structure and in multigroup formalisms are analyzed. A mathematical correlation between the valuesof the reactivity effect calculated by each formalism is established. The discrepancy in multigroupcalculation is estimated and analyzed for different categories of perturbations in light water reactorsystems.
- £ is the perturbed flux, D is the total importance.< > signify integration over space and energy variables.
In the resonance region both f . <ji and 5H have a fine structure as funclion of energy variable.
The effective multigroup cross section data in the resonance region are calculated withconsideration of the fine structure effect on the direct flux only [3]. If these cross sections data areuscd-as k is the usual practice-in evaluating the reactivity effect (equation 2); it is not evident that theresult will be exeat. By the word exact we mean that the solution agrees with the result which can beobtained when using the exact Tine structure distribution for both the cross-section data, the direct fluxand the adjoint flux.
The aim of this work is to clarify some aspects of this problem.
2. Fine structure of direct and adjoint flux
In an infinite homogeneous medium, the neutron flux must staiisfyes the equal ion
E,CEM>(E) ,- J E.CE') . P(E' -E)O
+ X(E)| v S
(3)
NOMENCLATURE
H : integru differential operator in Uull/inunn neutron balance equationH : the adjoir.t »pemtor of H(ji, <£ : direct arid adjoint neutran flux flue structure distributionI,(E) : macroscopic total cross section for a neulran of energy E£,(E), 2({E): macroscopic scattering and fission cross sections for a neutron of energy E.P(E —• E): the probability that a neutron suffering a collision at initial energy E to have a final energyE.u : A verage number of neutrons irnimillcil per fission.X : Distribution function of fissiun neutrons energy spectrum.
INTRODUCTION
Reactivity effects resulting from crosi section variations can be evaluiilcd by using theperturbation theory.) 1] This can 1«; formulated as follows:Consider the balance equation for the direct ami adjoin! flux in Ihe unpeiturlwd situations:
H j> = 0H* 0* = 0
The reactivity effect (5p) due lo a variation SU in H is given by the equation.[2]
op = — < <)>' . OH<t> >
(la)(Ib)
(2)
Since £(E) and P (E' —» E) are indcpcmdanl of the cross section value at E, the right hand .side ofequation (3) docs not have an energetic fine structure correlated to the cross section al E. Again if thehypothesis of narrow resonance is assumed, it will be a slowly varying funclion of energy, which canbe considered as constant over some resonances situated within an energy group around Ihe energyE [4], Equation (3) can then be written as:
(310
E, (E) («E) = F(E)
(4(E) = F(E) / Z, (E)
where F(E) is a slowly varying function of E representing the right hand side.This show that the direct flux have a fine structure similar to that of 1/Z,(E).
The adjoint flux is given by the adjoint version of Equation (3), namely.
,(R)4>*(E) - 2.<E)J P(E-E/)<j>'(E'WE/
O
+vE,(E> / xOBVOBO dJE'
In the same way the two integrals in the right hand side of equation (-1) do not have lino structurescorrelated to that of the cross section at E. The second integral is constant by normalisation and isdenoted by H , while the first one is a slowly varying function in energy; denoted by G (E)
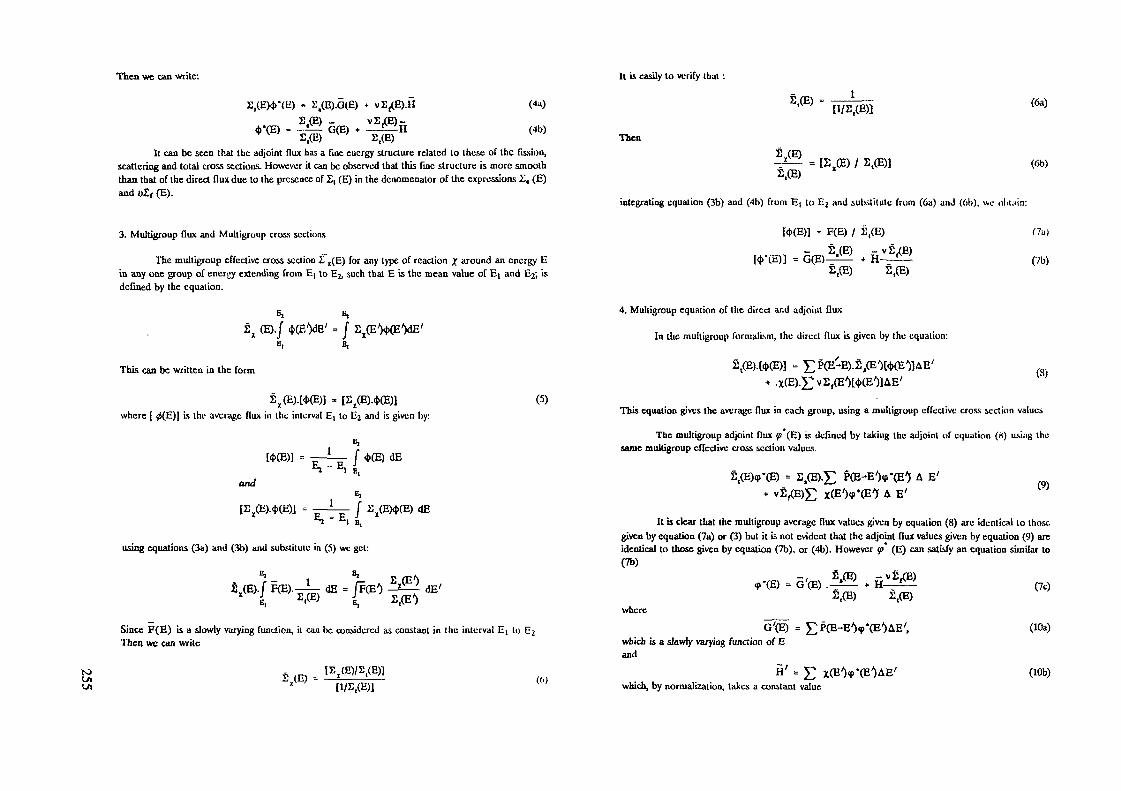
Then we can write: It is easily to verify that :
toLft
G(E)£,(E) k '
(4a)
(4b)
It can be seen that the adjoint flux has a fine energy structure related to these of the fission,scattering and total cross sections. However it can be observed that this fine structure is more smooththan that of the direct flux due to the presence of 2, (E) in the dcnomenator of the expressions X, (E)and «If (E).
3. Multigroup flux and Multigroup cross sections
The multigroup effective cross section iT,(E) for any type of reaction % around an energy Ein any one group of energy extending from Ej to £2, such that E is the mean value of EI and £2; isdefined by the equation.
x (E)./
This can be written in the form
where [ 0(E)J Ls the average flux in the interval Ej to £2 and is given by:
B,
(5)
- Ed£
and1 E,
i— / SX(EX>(E) «JE
i'ng equations (3a) and (3b) and substitute in (5) we gel:
- iSX(E)./ F(E).-^- dE = JF(E')x £ E dE'
Since F(E) is a slowly varying function, it can be considered as constant in the interval Ej toThen we can write
(6a)
Then
(6b)
integrating equation (3b) and (4b) from Ej to E^ and substitute from (6a) and (6h), we oU.iin:
= F(E) / £,(E)
2,(E) 2,{E)
4. Multigroup equation of tlie direct ar.d adjoint flux
In the mulligroup IbrmalLsm, the direct flux is given by the equation:
C?b)
(8)
This equation gives the average flux in each group, using a multigroup effective cross section values
The multigroup adjoint flux <f (B) is defined by taking the adjoint of equation (8) usi;ig thesame multigroup effective cross section values.
(9)
It is clear that the multigroup average flux values given by equation (8) arc identical to thosegiven by equation (7a) or (3) but it is not evident that the adjoint flux values given by equation (9) areidentical to those given by equation (7b). or (4b). However If (E) can satisfy an equation similar to(To)
S,(E)(p-(E) = S,(E).X) PfJa-EVCE'j A E''CElf A E'
,.W = G'(E) . * H
whereG'(E) =
which û a slawiy varying function of Eand
which, by normalization, takes a constant value
(7c)
(lOa)
(lOb)
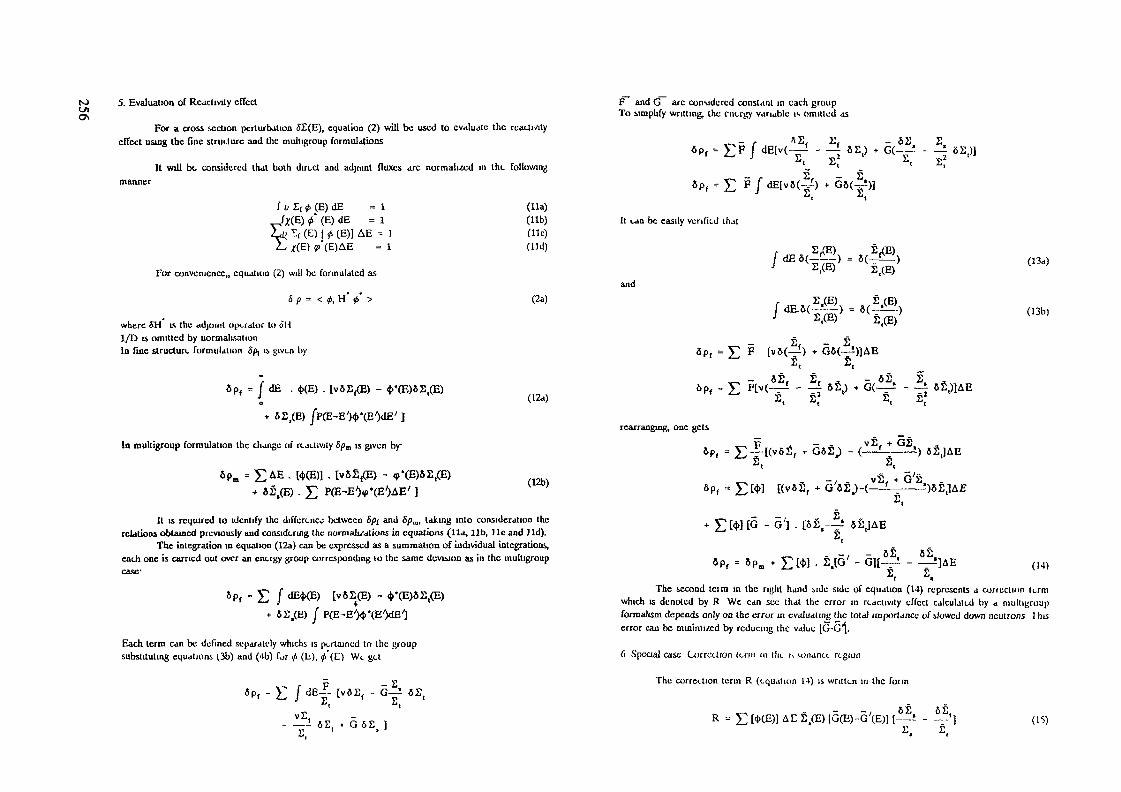
to 5. Evaluation of Reactivily effect
For a cross section perturbation 5£(E), equation (2) will be used to evaluate the reacli/ityeffect using the fine structure and the multigroup formulations
It will be considered that both direct and adjmnl fluxes arc normalised in the following
/ u Zf <t> (E) dE =1(X(ß) i (E) dE = 1
Xa> tf (E) J 0 (E)] AE -- 1L /(E) «>'(E)AE = 1
For convenience,, equation (2) will be formulated as
S p = < #, H* £* >
where 5H is the adjoint operator to oH1/D is omitted by normalisationIn fine structure formulation 5p, is given by
op, = I dE . <KE) . tvôS^E) - <p«(E)SS,(E)O
* 6S/E) |p(E-E')«|)*(E/)<lE/ ]
In multigroup formulation (he change of reactivity Spm is given by
6pm =
(lia)(lib)(He)(lid)
(2a)
(12-)
oS,(E) . E PCE-(12b)
It is required to identify the difference between Sp[ and Spm, taking into consideration therelations obtained previously and considering the normali/atioos in equations (lia, lib, lie and lid).
The integration in equation (12a) can be expressed as a summation of individual integrations,each one is carried out over an energy group corresponding lo the same devision as in the mulllgroupcase'
6pf
Each term can be defined separately whichs is pertained to I he groupsubstituting equations t.3b) and (4b) for <j> (h), ji'(E) We get
(E> - 4>'(E)OS,(E)
«pf - E / •
F and G are considered constant in each groupTo simplify willing, ihc energy variable is omiiled as
<V ' -^ «P,** T^vOp, ~ >r 1 J—j
It ean be easily verified that
and(E)
(^î) + G6(-i)]AE
6pf . £ p[v( - ö,) + G( -
rearranging, one gets
«PI =E-rlG, + OS,
OJ5,]AE
KvoS, * G/
'] .[*£.--: JS.- ÔÊ 62
(I3b)
(14)
The second tcira in the riglit hand side side of equalion (14) represcnls a coneclion termwhich is denoted by R We can see that the error in reaclivtly effccl calculated by a multiyroupformalism depends only on the error in evdJualing the told) importance of slowed down nculrons 1 hiserror can be mmimi/.cd by reducing the value [G-ü^.
6 Special case Correction (erni in (lie. iv wmantc region
The correelion term R (equation 14) is written in the form
„ -,R = E [*(E)] AE 2.(E) IG(E)-G'(E)] [—i - --']
2. E.(15)
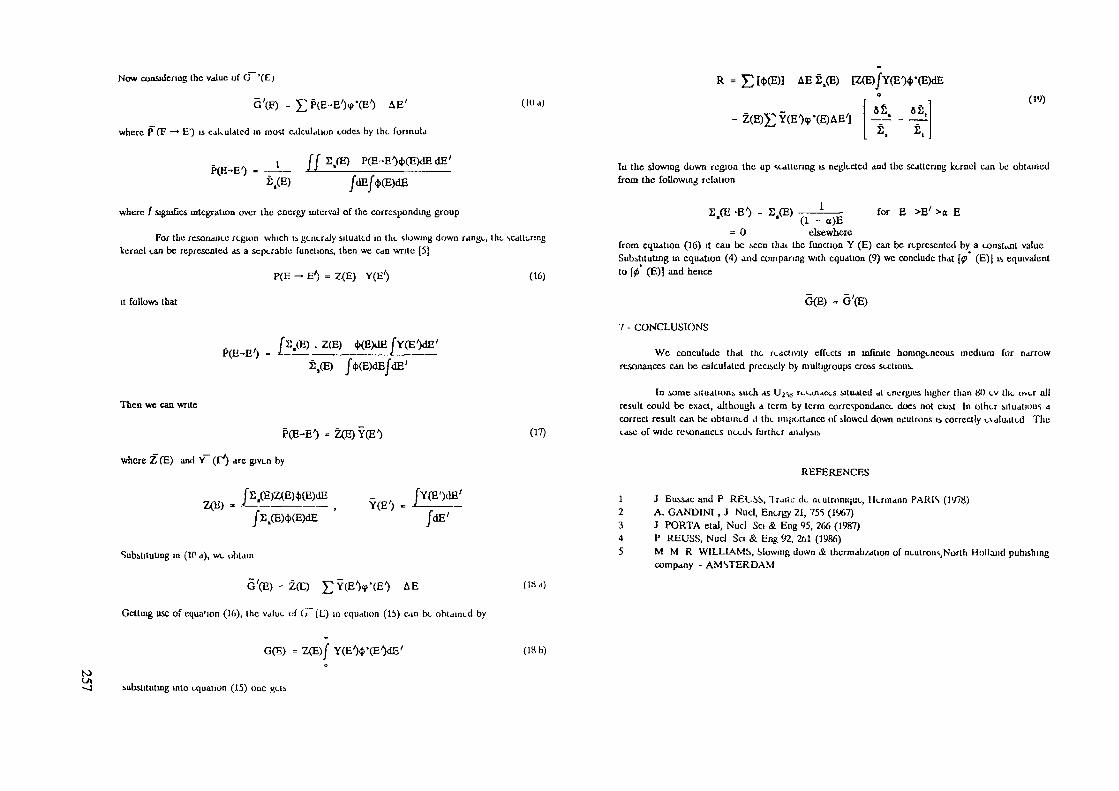
(O
Now considering the value of G '(£)
G'(F) - 5^P(E-E')<<''(E') AE'
where P (F —* E') is emulated in most calculation axles by the formula
R =(Ida)
S.(E) JdEj<j>(E)dE
where / signifies integration over the energy interval of the corresponding group
For the resonance region which is generaly situated in the slowing down range, Ihe scatteringkernel tan be represented as a scperable functions, then we can write [5]
it follows that
P(E
Then we can write
Î
where Z (E) anil Y (V*) arc given by
Z<H>
P(E — E') = Z(E) Y(E')
E/ /S.(B).Z,E) 4>(E)dE/Y(E/)dE'
/2,(E)4>(E)dEY(B')
[YtBQdE'
/dE'
Substituting m (IP a), we obtain
5'(E) - Z(E) £Y(EV(EO AE
Getting use of equa'ion (16), the value of C> (E) in equation (15) can be obtained by
G(E) = Z<E)/
substituting into equalion (15) one gels
(16)
(17)
( I K
(18 b)
AE S,® [Z(E)/Y(E04>-(E)dE
2. £.
la the slowing down region the up scattering is neglected and the scattering kernel can be obtainedfrom the following relation
S.(E •E') - S,(E) ——-—— for B >E' >« E(1 - a)E
= 0 elsewherefrom equation (16) it cau be !>ecrj thai the function Y (E) can be represented by a constant valueSubstituting in equation (4) and comparing with equation (9) we conclude that [(p (E)| LS equivalentto \<f> (E)] and hence
G(E) = G'(E)
7 - CONCLUSIONS
We conculudc that the reactivity effects in infinite homogeneous medium for narrowresonances can be calculated precisely by mulligroups cross sections.
In some situations suth as U2%s resanaces situated at energies higher than 80 ev the over allresult could be exact, although a term by term correspondance does not exist In other situations acorrect result can be obtained .1 the importance of slowed down ne'utrons is correctly evaluated Theease of wide resonances needs further analysis
REFERENCES
1 J Bussac and P RELSS, Irailc de niulronique, Hermann PARIS (l'/78)2 A. GANDINI , J Nucl, Energy 21, 755 (1967)3 J PORTA étal, Nucl Se. & Eng 95, 266 (1987)4 P REUSS, Nud Sei & Eng 92, 2f,l (1986)5 M M R WILLIAMS, Slowing down & thcrmah/ation of neulrons(North Holland pubishmg
company - AMSTERDAM

^ APPLICATION OF DEPLETION PERTURBATION THEORY00 TO IMPROVING DEPLETION CODE BIPR5-AK USING
MEASURED PERFORMANCE PARAMETERS
L. KORPÄSPaks Nuclear Power Plant,Paks, Hungary
Abstract
This paper presents the formulation of the adjoint depletionequations for BIPRS—AK depletion code This code is used in NPPof Paks to calculate the pei formance parameters of the WER—4iOcore The adjoint depletion equations are developed usingDepletion Perturbation Theory
Perturbation expressions are used to define sensitivitycoeffi( lents for responses that depend on the coupled interactionbetween the neutron end the special depletion fields
For the solution of adjoint depletion equations and foi thedetermination of sensitivity coefficient is developed the TAROkkfode Results obtained flora direct calculations and from thecoupled perturbation theory are compared
The derived sensitivity coefficients are used to modifv inputparameters of BIPRS—AK The modification is taken placeby the minimalisation of squared deviation of measured endcalculated performance parametei s In the presented example theappointed performance parameter is the assemblywise powerdistribution
1 INTRODUCTION
The purpose of this paper is the presentation of acalculational method with the help of which one can improve aDepletion Code the BIPR-5AK The improvement is carried out withthe utilisation of measured performance parameters
The main task of the Depletion Codes used in NPP is thedetermination of the performance parameters or operationalcharacteristics of the core These parameters are very importantand must be known precisely to ensure safe and economic reactorperformance
These parameters are for example the length of cycle,assemlywise power distribution and various reactivitycoefficients etc The above mentioned parameters are measurablequantities, but for the case of burnup analysis or depletion codethese parameters are integrals of the flux and nuclide fieldsthat is it is mathematically a functional of both fields
The accuracy of depletion code is proven if we can calculatethese performance parameters with satisfactory exactness Fromthe operational point of view these calculated and measurableparameters are crucial but it seems very useful an anotherutilisation of measured data This is the 'feed back of thisdata to the Depletion Code to improve it The improvement meansthe modification of input data with respect to measuredparameters
To achieve the modification of input parameters we have toknow the sensitivity coefficients of functional to given inputparameters For the determination of the sensitivity coefficientswe used the Depletion Perturbation Theory The DepletionPerturbation Theory is a special case of Generalised PerturbationTheory In our work we use it in approximative form developped byM L Williams Ref Cl ) and enriched by others RefC2-lJ Thisis the so called quasi—static approximation This formulation isconsistent with the computational methods used for depletionanalysis
This method provides a very good and fast ttay tor thedetermination of sensitivity coefficients Thesensitivity coefficient have been used to determine the optimalvalue of input parameters minimizing the squared deviation

«O
between the calculated and measured performance parameters withgradient method
The BIPR-SAK is a suitable depletion code for fitting ,becauseit's a simple 1 5 groupe diffusion code with previously fittedk , formula This doesn't contain cross—sections, thei. nfcoefficients in k were obtained by fitting procedureOubviosly an another fitting based on performance parameters isunderstandable
2 DERIVATION OF ADJOINT DEPLETION EQUATIONS
The governing equations in BIPR-5AK are the follovings
CA1 - X'B1) * = 0 1
ST-[ *v l 3 = T"
The Eq <1> is the eigenvalue equation for "f1" at t ,
where AL 4|L the diffusion and absorption termBL *"• the source term
The very simple Eq C2) describes the change of depletion withonly one variable, The equation for K the depletion variable,substitues the nuclide transmutation equation CBateman equation)The p1" is the power of the volume element
The last equation is the flux normalization equation obtainedfrom the power constraint at t
where T' is the reactor power at t1L is unambiguous function of pl
t=t + For the derivation of sensitivity coefficients we use avaiiaLional technique With this method the quasi—static burnup
equations Eq Cl—3) are treated as constraints on the functionalP1 1 and as such are appended to functional using Lagrangemultipliers
The problem of sensitivity analysis for quasi—static burnupequations reduces to finding the appropriate stacionaryconditions on F following functional
F = pI + 1d) - 2 [ T1 C A1 -VB1) *l]l =1
+5 J1=1 t[ LCt3.Cc PL - a|
i+i
1=1
Consider first the functional derivative with respect to
5.
At this point it should be noted that Eq CS5 and Eq Cl) demandthat the flux function must be orthogonal to the adjoint source
= 0
For the mo«ït rases of practical interest the first term inEq C6) is zero
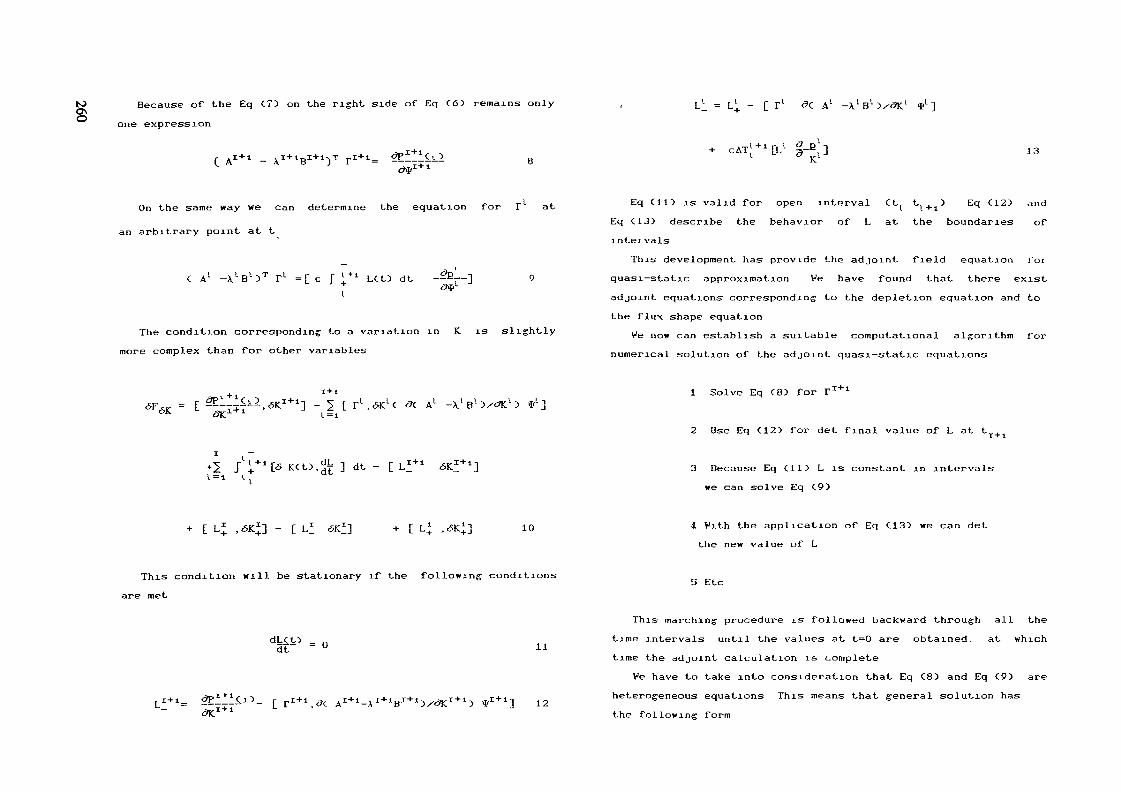
Because of the Eq C7) on the right side of Eq C6D remains onlyone expression
r,I+i8
= L [ r1 da AL -x lB l3/ôK1 «i/1]
CAT 13
On the same way we can determine the equation for T* at
an arbitrary point at t
C A1 -A.1BL>T T1 =[c f 1+1 "O dt
The condition corresponding to a variation in K is slightlymore complex than for other variables
Eq C113 is valid for open interval Ctt t-l+ ) Eq C12) andEq C13> describe the behavior of L at the boundaries ofinter vais
This development has provide the adjoint field equation forquasi—static approximation Ve have found that there existadjoint equations corresponding to the depletion equation and tothe flux shape equation
Ve now can establish a suitable computational algorithm fornumerical solution of the adjoint quasi—static equations
+-p. _ r &P___C.i.2. [rl,6KlC <?< A1 -XlBl >/<?Kl 3 'I'1]
_i_^ P l- ~*" l r c »/•/• 4. -\ QJL.+2 J + [* KCO.d£1=1 tt
1 Solve Eq €83 for rI+1
2 Use Eq C12> for det final value of L at tI4
3 Because Eq Cil 5 L is constant in intervalswe can solve Eq €93
10
This condition will be stationary if the following conditions
are met
11dt
12
4 Vith the application of Eq €133 we can detthe new value of L
3 Etc
This marching procedure is followed backward through all thetime intervals until the values at t=0 are obtained, at whichtime the adjoint calculation is complete
Ve have to take into consideration that Eq €83 and Eq C9> areheterogeneous equations This means that general solution hasthe following form
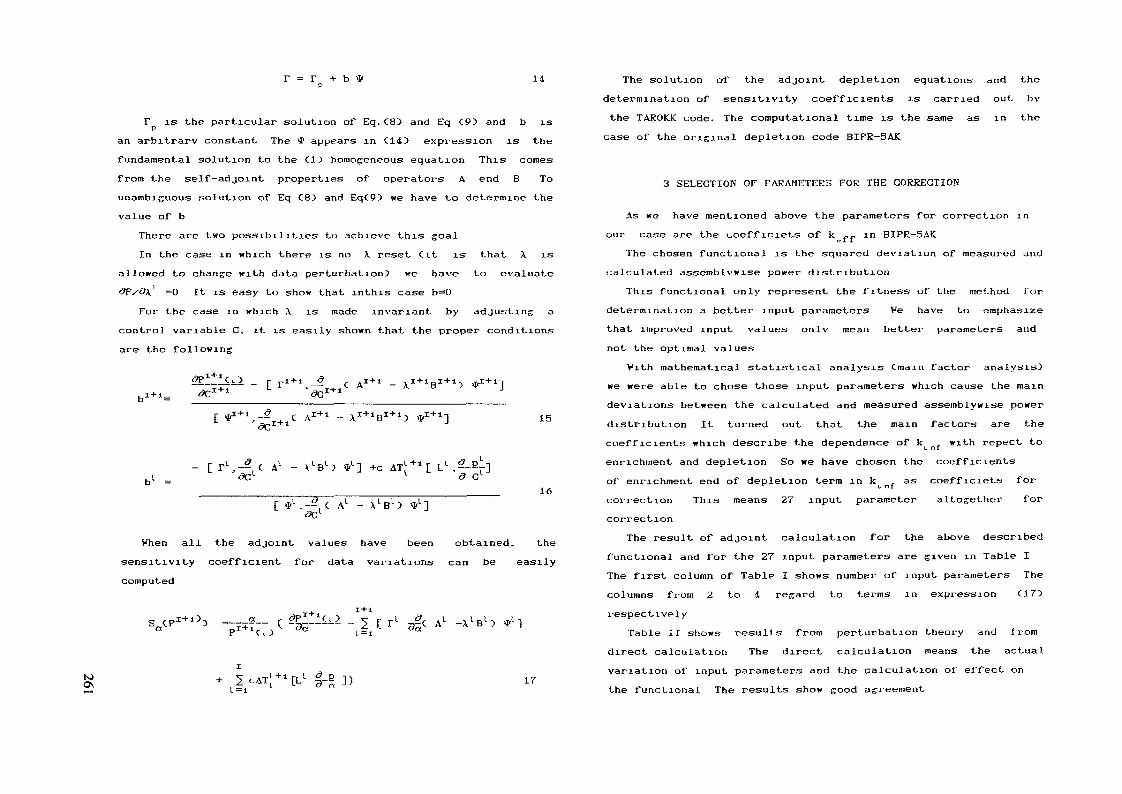
r = r b "P
T is the particular solution of Eq.<8) and Eq C9> and b isan arbitrary constant The * appears in CIO expression is thefundamental solution to the (ID homogeneous equation This comesfrom the self—adjoint properties of operators A end B Tounambiguous solution of Eq C8) and Eq{9) we have to determine thevalue of b
There are two possibilities to achieve this goalIn the case in which there is no X reset Cit is that X is
allowed to chance with data perturbation) we have to evaluate<3F/<9X =0 It is easy to show that inthis case b=0
For the case in which ,\ is made invariant by adjusting acontrol variable C, it is easily shown that the proper conditionsare the following
-,1+1
l,-^,C A1 - \1B1> *l1b1 =
15
16.--, C A1 - XlBl>
Vhen all the adjoint values have been obtained, thesensitivity coefficient for data variations can be easilycomputed
PI"flCt > a I =1 '
K) [+1CLl g-E 17
The solution of the adjoint depletion equations and thedetermination of sensitivity coefficients is carried out bvthe TAROKK code. The computational time is the same as in thecase of the original depletion code BIFR—5AK
3 SELECTION OF PARAMETERS FOE THE CORRECTION
As we have mentioned above the parameters for correction inour case are the coefficiets of k ff in BIPR-SAK
The chosen functional is the squared deviation of measured andcalculated assemblvwise power distribution
This functional only represent the fitness of the method fordetermination a better input parameters Ve have to emphasizethat improved input values only mean better parameters andnot the optimal values
Vith mathematical statistical analysis Cmain factor analysis)we »ere able to chose those input parameters which cause the maindeviations between the calculated and measured assemblywise powerdistribution It turned out that the main factors are thecoefficients which describe the dependence of kin{ with repect toenrichment and depletion So we have chosen the coefficientsof enrichment end of depletion term in k^ f as coefficiets forcorrection This means 27 input parameter altogether forcorrection
The result of adjoint calculation for the above describedfunctional and for the 27 input parameters are given in Table IThe first column of Table I shows number of input parameters Thecolumns from 2 to 4 regard to terms in expression C17)respectively
Table II shows results from perturbation theory and fromdirect calculation The direct calculation means the actualvariation of input parameters and the calculation of effect onthe functional The results show good agreement

MO\Si
TABLE la Sensitivity coefficients of squai ed deviation ul
mf*ci<:ui eel end calculated assemblvwise powei distribution to input
paiamelers The chosen distribution regard to Uni t 2 Cycle 3 at
15 full day
N 1 1 column 1 2 column
1 1 -881 I 385
i \ 099 1 045
•3 I 000 1 000
4 1 6 887 I - 517
5 I 14 092 1 - 959
6 1 -47 128 1 3 094
7 | 71 432 1 -4 608
8 I -60 081 1 3 829
9 I 28 264 1 -1 700
10 1 -6 836 1 425
11 1 642 1 - 039
1 3 column
1 - 324
1 033
1 000
I 2 702
1 6 905
1 -25 911
1 42 OSO
1 -37 153
1 18 229
1 -4 589
1 642
1 <l column
I 000
1 000
1 000
1 - 001
1 - 003
1 Oil
1 - 017
1 014
1 - 007
1 007
1 000
TABLE Ib Sen&itivi t\ coefficients of squared deviation utmeasured end calc.ulctt.ed asaemblvwise power distribution to input.
The chosen distribution regard to Unit 2 Cycle 3 at15 full day
N
12
13
14
IS
16
17
18
19
?0
23
2?
1 1 column 1 ? column
1 - 243 I 012
1 -4 342 1 209
1 20 084 1 - 975
1 -45 329 1 2 211
1 57 496 1 -2 779
1 -40 947 1 1 965
1 IS 357 1 - 730
1 -2 33? I 111
1 000 I 000
1 000 | 000
1 000 [ 000
1 ^ column
1 010
1 144
1 - 569
1 1 163
1 -1 381
1 946
1 - 347
1 052
1 000
1 000
1 00(1
1 4 column
1 000
1 000
1 - 002
1 OO4
1 - 004
1 OO3
1 - 001
I 000
1 000
1 000
1 000

TABLE Ic Sensit.ivi.lv coefficients of squared deviation of
measured end calculated assemblvwise power distribution to input
parameters. The chosen distribution regard to Unit 2 Cycle 3 at
15 ful l day
!N 1 J . column 1 2. column | 3 culumn
23 1 000 | 000 I 000
24 1 000 | 000 | 000
25 1 000 | 000 | 000
26 1 000 | 000 | 000
27 1 000 | 000 I 000
1 <1 Column
I .000
1 000
1 .000
1 000
I 000
4.THE ACTUAL MODIFICATION OF INPUT PARAMETERS
The actual modification of input parameters is fulfiled byminimizing the squared deviation of assemlywise powerdistribution The gradient method is used to find a minimum Onan average it requires ten production of sensitivitycoefficients In the iterational process the advantage of fastand easv determination of sensitivity coefficient is veryusefull The modification algorithm of the input parameters isthe following
Ks q r C C
t = l18
toO\
where n the number of iteration and k number of input parameterThe value of "step" <5" was determined by trial
TABLEDSensitivity coefficients calculated with DPT and with direct way
Data referring Unit 2 Cycle 4 at 21 full day
BCl,43*E-5-.70522018-.70562018- 70602018
SCCdirect way?-54.4686-21.9737-4 8993
SCCwith GPO-53.6590-25.9905-5.1745
Data referring Unit 3 Cycle 3 at 34 full day
BCl,5)*E-6.23767601.23787601.23807601
SGCdirect way?-17. 1829-5.961014.9290
SCC with OPT)-15.9873-4.967414 1783
We have examined 15 different assemblvwise power distribution.These distributions refer to different loading end differentmoment of the cycle of different unit. Only data from NPP of PaksUnit 1 to 4 were used. The procedure led to different input-values We accepted the average value of these different impovedparameters. The mean values have provided better agreementbetween calculated and measured assemblywise power distributionin the examined IS cases Ve consider these results temporary.The temporary, improved parameters are given in Table III.
5 CONCLUSION
A very effective and exact algorithm was developped toestimate the effect of input parameter changes on functionalscalculated by BIFR-5AK This algorithm is suitable to carry outthe task of "feed back" of measured performance parameters todepletion code. A temporary input modification was given
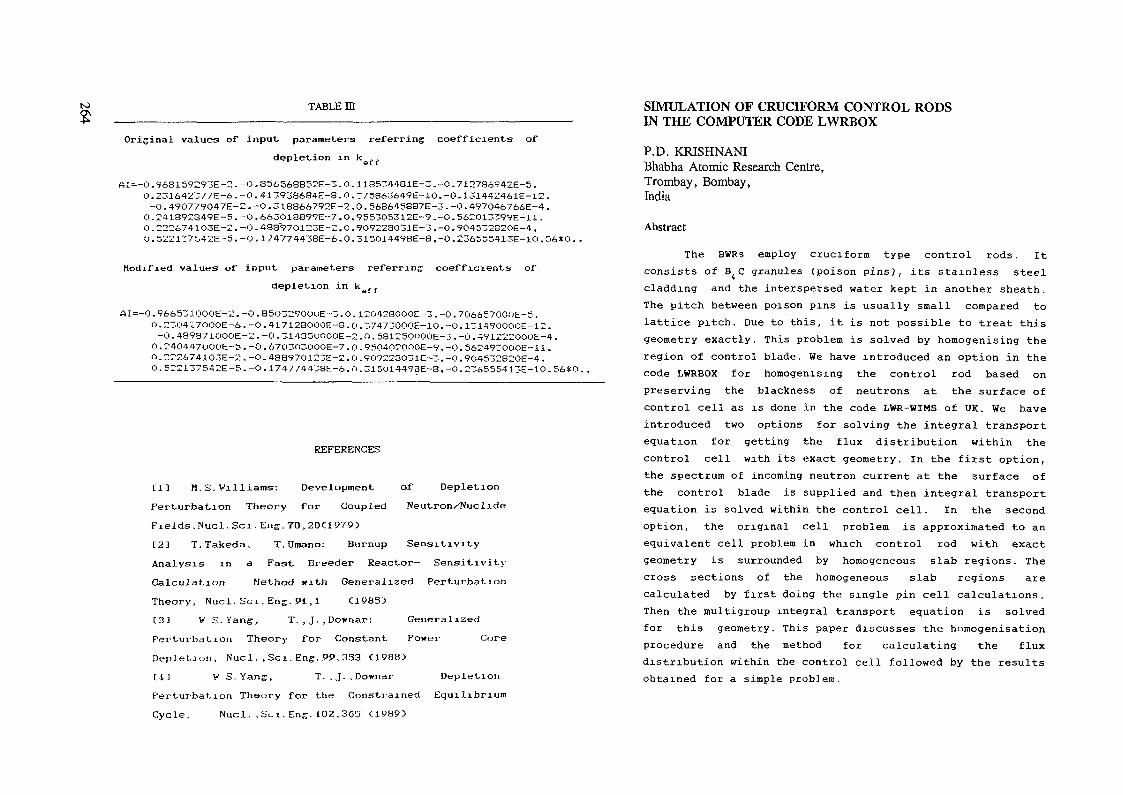
TABLED!
Original values of input. parameters referring coefficients ofdepletion in kaff
AI=-0.763159293E-2 . -0.356568852E-3. 0 .l18534481E-3. -0.712786942E-5.0.231642377E-6.-0.413938684E-8.O.775863649E-10.-O.131442461E-12.-0. 4V0779047E-2 . -O . 318366792E-2,0 . 5686458S7E-3. -0.497O46766E-4 .0. 241892849E-5 . -O . 663O18899E-7 . 0 . 955305312E-9 . -O . 562O13399E-11.0 .222674IO3E-2. -0 . 483~97O123E-2,0.9O9223031E-3.-0.90453232OE-4,0. 5221T7b42E -5 . -u . 1 7477443SE-6.0 .315014498E-8,-0 .236555413E-10 . 56*O. .
Modified values of input parameters referring coefficients ofdepletion in keff
AI =-0 .9é6531000E-2. -0.85O3290OUE--3. 0.12O428OOCC-3. -0.70665700DE-5 .O . 23O4270OOE-6 . -O . 417128OOOE-8 . O . 37473000E-1O. -0.13149000OE-12 .-0 . 489371OOOE-2 . -0 . 31435OOOOE-2 . O . 5S125O"OOE-3. -0 . 491222000E-4 .0.24O447OOOE-5 . -O . 6703<">3000E-7 . 0 . 9504020OOE-9. -0. 562497OOOE-11.i"). 2226741O3E-2 , -O . 488970123E-2 . 0 . 9O9223O31E-3 . -O . 904532S20E-4 .0.522137542E-5.-O.174774433E-6,t'>. 31 SOI 449BE-8, -0 .236555413E-10 . 56* O.
REFERENCES
[1] M.S.Villiams: Development of DepletionPerturbation Theory for Coupled Neutron/NuclideFields,Nucl.Sci.Eng.70,20C1979)[2] T.Takeda. T.Umano: Burnup SensitivityAnalysis in a Fast Breeder Reactor- SensitivityCalculation Method with Generalized PerturbationTheory, Nucl. Sei.Eng.Pi,l C1985)[33 W S.Yang, T. , J. , Downar : GeneralizedPerturbation Theory for Constant Power CoreDepletion, Nucl.,Sei.Eng.PP.333 C1988>tl) V S.Yang, T..J.,Downar DepletionPerturbation Theory for the Constrained EquilibriumCycle. Nucl..Sei.Eng.102,363 C1989)
SIMULATION OF CRUCIFORM CONTROL RODSIN THE COMPUTER CODE LWRBOX
P.D. KRISHNANIBhabha Atomic Research Centre,Trombay, Bombay,India
Abstract
The BWRs employ cruciform type control rods. Itconsists of B;C granules (poison pins), its stainless steelcladding and the interspersed water kept in another sheath.The pitch between poison pins is usually small compared tolattice pitch. Due to this, it is not possible to treat thisgeometry exactly. This problem is solved by homogenising theregion of control blade. We have introduced an option in thecode LWRBOX for homogenising the control rod based onpreserving the blackness of neutrons at the surface ofcontrol cell as is done in the code LWR-WIMS of UK. We haveintroduced two options for solving the integral transportequation for getting the flux distribution within thecontrol cell with its exact geometry. In the first option,the spectrum of incoming neutron current at the surface ofthe control blade is supplied and then integral transportequation is solved within the control cell. In the secondoption, the original cell problem is approximated to anequivalent cell problem in which control rod with exactgeometry is surrounded by homogeneous slab regions. Thecross sections of the homogeneous slab regions arecalculated by first doing the single pin cell calculations.Then the multigroup integral transport equation is solvedfor this geometry. This paper discusses the homogenisationprocedure and the method for calculating the fluxdistribution within the control cell followed by the resultsobtained for a simple problem.
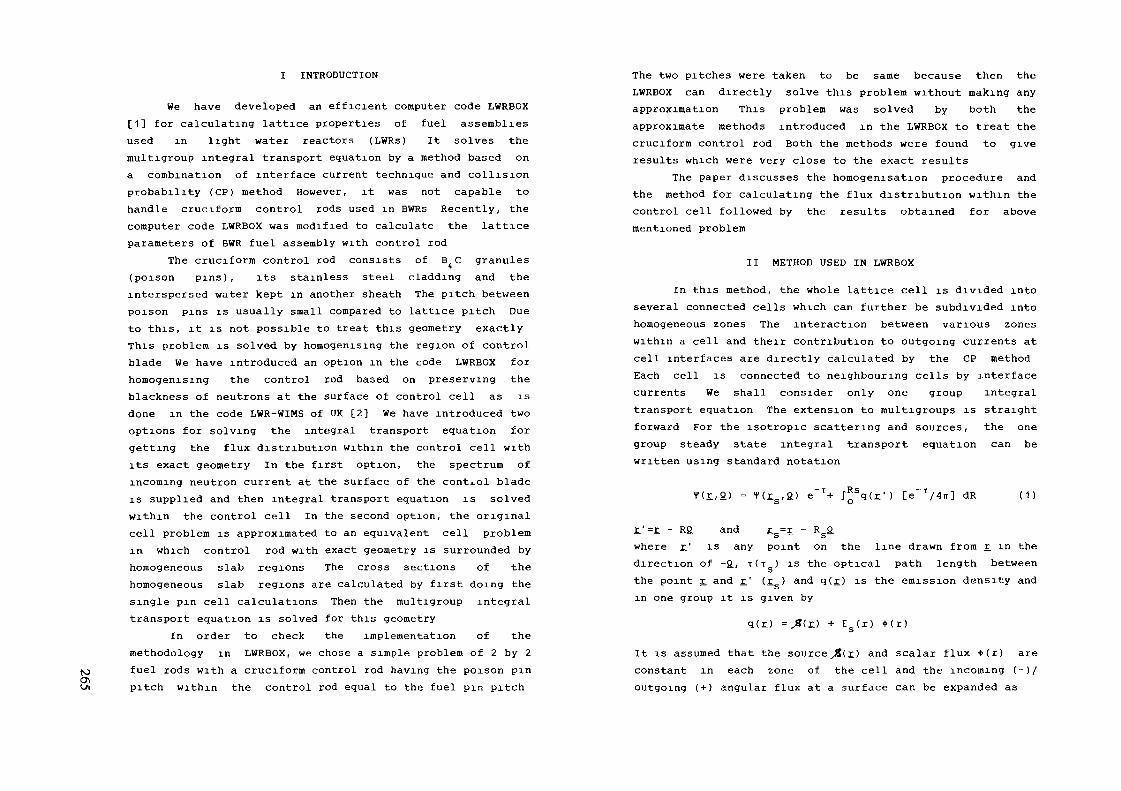
to&t/l
I INTRODUCTION
We have developed an efficient computer code LWRBOX[1] for calculating lattice properties of fuel assembliesused in light water reactors (LWRs) It solves themultigroup integral transport equation by a method based ona combination of interface current technique and collisionprobability (CP) method However, it was not capable tohandle cruciform control rods used in BWRs Recently, thecomputer code LWRBOX was modified to calculate the latticeparameters of BWR fuel assembly with control rod
The cruciform control rod consists of B^C granules(poison pins), its stainless steel cladding and theinterspersed water kept in another sheath The pitch betweenpoison pins is usually small compared to lattice pitch Dueto this, it is not possible to treat this geometry exactlyThis problem is solved by homogenising the region of controlblade We have introduced an option in the code LWRBOX forhomogenising the control rod based on preserving theblackness of neutrons at the surface of control cell as isdone in the code LWR-WIMS of UK [2] We have introduced twooptions for solving the integral transport equation forgetting the flux distribution within the control cell withits exact geometry In the first option, the spectrum ofincoming neutron current at the surface of the control bladeis supplied and then integral transport equation is solvedwithin the control cell In the second option, the originalcell problem is approximated to an equivalent cell problemin which control rod with exact geometry is surrounded byhomogeneous slab regions The cross sections of thehomogeneous slab regions are calculated by first doing thesingle pin cell calculations Then the multigroup integraltransport equation is solved for this geometry
In order to check the implementation of themethodology in LWRBOX, we chose a simple problem of 2 by 2fuel rods with a cruciform control rod having the poison pinpitch within the control rod equal to the fuel pin pitch
The two pitches were taken to be same because then theLWRBOX can directly solve this problem without making anyapproximation This problem was solved by both theapproximate methods introduced in the LWRBOX to treat thecruciform control rod Both the methods were found to giveresults which were very close to the exact results
The paper discusses the homogenisation procedure andthe method for calculating the flux distribution within thecontrol cell followed by the results obtained for abovementioned problem
II METHOD USED IN LWRBOX
In this method, the whole lattice cell is divided intoseveral connected cells which can further be subdivided intohomogeneous zones The interaction between various zoneswithin a cell and their contribution to outgoing currents atcell interfaces are directly calculated by the CP methodEach cell is connected to neighbouring cells by interfacecurrents We shall consider only one group integraltransport equation The extension to roultigroups is straightforward For the isotropic scattering and sources, the onegroup steady state integral transport equation can bewritten using standard notation
T(r,Q) = T(rs,Q) dR (1)
£'=£ - RQ and r_s=r - RSQwhere r.' is any point on the line drawn from r. in thedirection of -Q, T(T ) is the optical path length betweenSthe point r and r1 (r. ) and q(r) is the emission density andSin one group it is given by
q(r) =^?(r) + £s(r) * t r )
It is assumed that the source Str) and scalar flux +(r) areconstant in each zone of the cell and the incoming (-)/outgoing (+) angular flux at a surface can be expanded as

(O
V|(£s,2> = [1/irS] E (2)
the expansion,S is the surafce area
linearly;entation
They satisfy the following orthonormallzatlon
where Nfc is the number of terms retained inj° are the expansion coefficients,•i * **and f° (S) are the properly orthonormalizedindependent functions and are known as representationfunctionscondition
the code LWRBOX is similar to the CRUX procedure used in thecode LWR-WIMS of UK [2] The homogenisation method is basedon the conservation of outgoing neutron current for the twotypes of assemblies
Fig 1 illustrates the internal row of pinsconstituting a typical BWR cruciform control rod blade Letus assume that the cell is divided into N homogeneous zonesIf the angular flux of the incoming neutrons at the surfaceof the control blade is expanded as in Eq (2) then thecollision rate in a zone 3 for any group g can be written as
'sV±,s(a) a) as da =„ swhere 6 is the Kronecker delta function With thisnormalisation, the first component of the coefficient Jgives the total number of neutrons crossing the surface
With these assumptions, the collision density in a zoneand the expansion coefficients of the outgoing currents canbe given by
= E l P Jw + E P QS3 -,s 13 ii
and
with Q1 = Vi(probabilitiesrelations
These
(3)
(4)
* ) The coefficients P's are known asobey conservation and reciprocity
III HOMOGENISATION PROCEDURE
A typical BWR control blade consists of a shrouded rowof cooled absorber pins The basic problem is to convertthis heterogeneous system consisting of B C granules, itsstainless steel cladding and the interspersed water into anequivalent homogeneous slab region The method adopted in
with
2 L Pv Jv + E P O339 in,g 13g wig
g'where Je are the expansion coefficients and + ,scalar flux of neutrons of energy group g' in zone 3
(5)
(6)
is the
T
V
-MODERATING MATERIAL-CLADDING-CONTROL ROD
BLADE SHROUD
FIG 1

The coefficients of outgoing current from each surfaceof the cell in group g is given by
out, g = E Pve jV"ssg in,g
eisg
The first component of the coefficient J gives the totalnumber of neutrons going out of the surface
1 1J = J = E PV1 JV + E P Qout, g out, g ssg in, g isg v (7)
Using the conservation relations
Pv1 =5 - I Pvss,g 1v sig
2Pisg
We have
Jout, g = Jin,g
i3g
«ig/2 ' Eig Vi (8)
Eqs (5) and (8) give the collision rate and outgoing neutroncurrent from a surface of the cell for the heterogeneoussystem
For homogeneous system, the equations for collisiondensity and outgoing neutron current from a surface can bewritten as :
V *g *g = PVV,g °g 2 E Jin,g SV,g
withJ =J' + 0 / 2 - V + E/2out,g in,g g 9 g
(9)
(10)
V = E V Qg = v g 1
The total cross sections E and transfer cross section E ,refer to homogeneous cell These cross sections are
calculated so that they preserve the blackness, ß, derivedfor the heterogeneous problem in each group Now, p=(JJ j.)/J i and since J is same for both models of controlout in inblade it is required that Jout be preserved ComparingEqs (8) and (10), two physically reasonable sufficientconditions for equality of out leakage are apperent
o = E Qvg vi (11)
and(12)
There are no slowing-down sources for energy group 1 so thatcondition of Eq (11) imposes equality of within groupscatterers and condition (12), in turn requires equalneutron removals from the group In general, therefore, werequire the following equalities
V + E = E V E +g gg i igg ig
g gg' i igg' igi
V * Vi Eaig *ig
(13)
(14)
(15)
where E is the absorption cross section.Returning to Eq (12) and using Eq.(9) gives
VV,g
Since
sv,g ig
= _*SV,g 1C SS,g
PSS,g = 2 ^g'
VV,g

too\oowhere
T is the thickness of the cell (control blade withoutsheath) containing control rod We obtain,
- 2E in,g
- E V = o (16)
This is the condition which should be satisfied by theequivalent homogeneous system in order to preserve theblackness in each group First, the integral transportequation is solved by either of the two methods mentionedbelow from which we obtain the flux distribution (+ ) inthe control cell From this, we obtain the Q using Eq (11)Then Eq (16) is solved for E using the Newton-Raphson
-4iterative procedure, converged to 10 precision in E As agfirst guess for the iterations, E = E E V* / E V +is applied
IV CALCULATION OF FLUX DISTRIBUTION IN CONTROL CELL
Fig 1 illustrates the internal row of pinsconstituting a typical BWR cruciform control rod blade Thebasic problem is to calculate the flux distribution withinthe control blade There are two options for it In thefirst option (ICONTR=2) the spectrum of the incoming neutroncurrent at the surface of the inner shroud is provided(which can be obtained from 2-D box calculations in aniterative manner) and then multigroup integral transportequation is solved within the control cell In the codeLWRBOX, this problem is converted to a single pin cell asshown in Fig 2 with zero net current (reflective) boundarycondition at the two surfaces and a given spectrum ofincoming neutrons at the remaining two surfaces The programhas been suitably modified to take account of such mixed
out
HOMOGENISED CONTRCH20 PIN CELLS H20 CELL
i
(9)iFIG 3
boundary condition The multigroup integral equation withinthe control cell is solved by the CP method and the angularflux at the cell surface is expanded in terms of half spaceangular representation functions as explained in the methodof LWRBOX
In the second option (ICONTR=3), the reaction ratesand flux distribution in the control cell are calculated byconsidering an equivalent problem shown in Fig 3 In thismethod, the whole lattice cell is converted into anequivalent homogeneous slab cell However, the geometry ofthe control rod is accurately represented Therefore, thecalculations are performed in two stages In the first

stage, the single pin cell calculations are performed fordifferent type of pin cells which are then spatiallysmeared. In the second stage, the control cell is surroundedby different layers of different materials. The crosssections of the layers containing fuel are obtained bymixing the smeared cross sections of various pin cellsobtained in the first stage in proper proportion which isgiven in the input. Then in the second stage, the integraltransport equation is solved for the geometry shown in Fig.3 by the method based on combination of interface currentand CP method normally used in the code LWRBOX. Thereflective boundary condition is applied at the threesurfaces and at the center of the control cell. Therafter,the equivalent homogenised cross sections of the controlcell are obtained by preserving the blackness of theneutrons as explained above.
ZR
0.8
V. RESULTS
In order to check the implementation of themethodology in LWRBOX, we chose a simple problem of 2 by 2fuel rods with a cruciform control rod having the poison pinpitch within the control rod equal to the fuel pin pitch.The two pitches were taken to be same because then theLWRBOX can directly solve this problem without homogenisingthe control rod. For the sake of bravity, the shroud sheathhas not been considered. The lattice cell is shown in Fig.4. The material properties are as follows :
Fuel:
Clad:too\
Material UO , density = 10 g/cm , temperature =600 °C, U-235 enrichment = 3 w/0, diameter =1 cm.Material = zircaloy-2, density =6.55 g/cm3,temperature = 300 C, inside diameter = 1 cm,outside diameter = 1.2 cm.
2.4 4.0 4.3 5.3 CM
FIG. 4
Material = HO, void content = 0 %, temperature= 286 °C, density = 0.7358 g/cm3, lattice
Moderator :
Control rod: Material = B+C, density = 1.761 g/cm ,temperature = 286 °C, diameter = 0.6 cm havingS.S. sheath (density =8.03 g/cm3) with outsidediameter 0.8 cm and temperature 286 C.
The calculations have been done in 27 groups and only1 term has been considered in the expansion of angular fluxat region interfaces to save the computer time. Though, morenumber of terms should be considered but the aim here is tointer compare the two methods under the same approximation.In fuel cell, 3 zones have been considered whereas in thecontrol cell 4 zones (corresponding to 2 zones in poison

tube, 1 in sheath and 1 in the moderator) have beenconsidered In the approximate method, in which control cellhas been homogenised, only 1 zone has been considered
In the exact method, the calculations were done in theexact geometry talcing control rod exactly In rest of thecalculations, the control rod along with its sheath and theinterspersed moderator was homogenised first and then thecalculations were done using the homogenised cross sectionsfor the control cells In the second method, the control rodparameters (homogenised cross sections) were generated bygiving the current spectrum of the incoming neutrons at thesurface of the cell in the input (ICONTR=2) which was takenfrom the exact calculations done in the case 1 Ideallyspeaking, the results of this case should match with thecase 1 The difference in the results of the two cases isdue to the fact that 4 zones were considered in the controlcell in case 1 whereas only 1 zone was considered in thesecond case Therefore, the difference in the results of thetwo cases is due to the poor representation of flat fluxapproximation in the second case In the third method, thecontrol rod parameters were generated by approximating thewhole lattice cell in slab geometry in which the geometry ofthe control cell was preserved and the fuel cell wasspatially smeared (ICONTR=3) The control rod parameterswere generated by preserving the blackness of the neutronsat the surface of the cell as in the case 2 In order to seethe difference in the results if the control rod parametersare generated by usual volume and flux weighting instead ofpreserving the blackness of neutrons, we repeated thegeneration of control rod parameters as in case 2 but theusual flux and volume weighting was used to generate themThe results of these calculations are given in the case 4
Table 1 gives the K-infinity for the 4 cases mentionedabove The results of first three methods agree well withinthe approximation mentioned above However, the results ofcase 4 are far away from the case 2 and 3 and this indicatesthe superiority of these methods which preserve the
Table 1 Comparison of K-infinity
Method K-infinity
Exact MethodICONTR=2ICONTR=3Flux,Volumeweighting
0 65960 65380 65410 6314
Table 2 Power Distribution
1 1651 1661 1661 177
0 8370 8350 8360 826
0 9990 9990 9990 999
ExactICONTR=2ICONTR=3+V Weighting
blackness of the neutrons The lower value of K-infinity incase 4 indicates that there are more absorptions in thecontrol rod
Table 2 gives the power distribution (normalised to 4)as calculated by the four methods There is hardly anydifference in the first three methods In the fourth method,the fuel pin near the control rod produces less power due todepression of flux caused by relatively more absorptions inthe control rod
VI. CONCLUSIONS
The two options to generate control rod parameters inthe computer code LWRBOX are working properly The methodbased on preserving the blackness of neutrons to generatehomogenised parameters of the control cell has been found tobe more accurate compared to the usual flux-volume weightingprocedure.
REFERENCES
[1] P.D. Krishnani, Ann Nucl. Energy, H, 675(1985).[2] F.J. Payers et al , AEEW-R 785 Part 1, 1972
BASIC CORE PARAMETERS IN ON-LINE MEASUREMENTFOR NRI EXPERIMENTAL REACTORS
J. BROULÏK, B. ENDT, J. HOLECEK,V. RYPAR, Z. TURZÖCNuclear Research Institute (NRI),Rez, Czechoslovakia
AbstractThe PC (XT/AT) controled system of CAMAC units used for themeasurement and for the evaluation of the basic safety andreactor physics parameters of the experimental reactorsin U.R.I. &ez is described. The has been used, for themeasurement of the critical height, reactivity, reactivitycoefficints, buckling, radial and axial neutron fluxdistributions on LR-O and LVR-15 experimental reactors.
to
INTRODUCTION
Personal computer based systems for the measurement of thebasic core parameters have been developed in the Reactorphysics division, NRI Re2 . The systems have been used onthe LR-0 reactor (critical assembly WER 1000) and on theexperimental reactor LVR-15 (LWR, 15 MWt) for the start-upexperiments, for the measurements of space and time - spacedependent neutron flux distribution, for reactivity measure-ment and for basic macro parameters measurement. Previouslyhardware of all these experiments used the special singlepurpose equipments consisting of the analog part for detec-tor signal processing (HV supply, amplification, discrimina-tion, AD conversion, etc.), the analog and digital units forthe sampling of signal pulses (sealers, real time pulseclock, etc.) and data output devices (punch tape or prin-ters). Recently with the HW and computers development aswell as with the standardisation of the analog and digitalunits (NIM, CAMAC) we have transferred old experimental sys-tems to the general PC based experimental system, where forthe different measurements only special CAMAC units are tobe changed in the controlled CAMAC crate . The block diagramof the experimental system is on the Fig 1. One part of theexperimental hardware are analog electronics units providingdetectors high voltage supplies as well as detectors signaladjustment and amplification. The second part of the systemare CAMAC units for signals sampling and if necessary forthe absorption cluster or fuel element movement control.
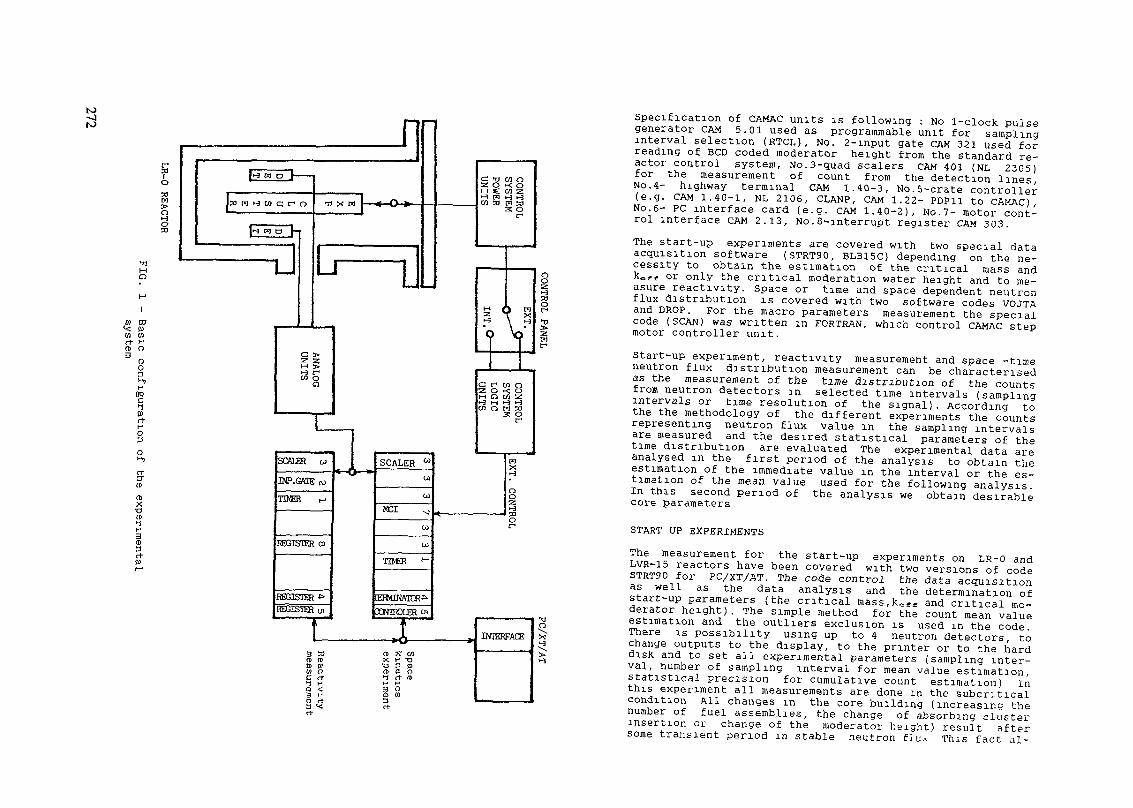
Ia> na<< SB01 uci- H(0 O3 OO3
OQC>-!(1)rt-HO3O*->>
rt-nr(D
01X•oa>nH
CD
ctP)
lo1-3OSd
|*-3 M P~l ———
ha M H co a t-1 o
|»3 P) O tl
n 1
D
1]
H f
"g
L.SCAIBR u
INP.GAIE io
TWER t-'
REGISTER co
RESISTER*REGISTER m
\
3 »n> roa a>tn nc <t1 Pm <3 H(D rt
•Hk-»SCALER "
co
coMCI M
co
Cu
TMR >-*
ŒHflNATûR-kOSNTROLERüi
, \
—— »<> ———m 7T cnX H -O•o 3 pa> d» o1 et <I>H H
1 S
c f cn oZ 0 K 0M n cn zH M 1-3 t-3cn o M »
S 0
ro*
8rf———— »;nt-
INIERFACE
Specification of CAMAC units is following : NO 1-clock pulsegenerator CAM 5.01 used as programmable unit for samplinginterval selection (RTCL), No. 2-input gate CAM 321 used forreading of BCD coded moderator height from the standard re-actor control system, No.3-quad sealers CAM 401 (ML 2305)for the measurement of count from the detection linesNo. 4- highway terminal CAM 1.40-3, No.5-crate controller(e.g. CAM 1.40-1, NL 2106, CLANP, CAM 1.22- PDP11 to CAMAC)No. 6- PC interface card (e.g. CAM 1.40-2), No. 7- motor cont-rol interface CAM 2.13, No. 8-interrupt register CAM 303.The start-up experiments are covered with two special dataacquisition software (STRT90, BLB15C) depending on the ne-cessity to obtain the estimation of the critical mass and)W<r or only the critical moderation water height and to me-asure reactivity. Space or time and space dependent neutronflux distribution is covered with two software codes VOJTAand DROP. For the macro parameters measurement the specialcode (SCAN) was written in FORTRAN, which control CAMAC stepmotor controller unit.Start-up experiment, reactivity measurement and space -timeneutron flux distribution measurement can be characterisedas the measurement of the time distribution of the countsfrom neutron detectors in selected time intervals (samplingintervals or time resolution of the signal). According tothe the methodology of the different experiments the countsrepresenting neutron flux value in the sampling intervalsare measured and the desired statistical parameters of thetime distribution are evaluated The experimental data areanalysed in the first period of the analysis to obtain theestimation of the immediate value in the interval or the es-timation of the mean value used for the following analysisIn this second period of the analysis we obtain desirablecore parameters
START UP EXPERIMENTS
The measurement for the start-up experiments on LR-0 and«™~™ £eactors have been covered with two versions of codeIs well°r3/C(f/A .The C°?e C°ntro1 the data «luisitionas well as the data analysis and the determination ofrt rUPv,Par fer (the crltlcal <nass,ke« and critical mo-derator height). The simple method for the count mean valueestimation and the outliers exclusion is used in the codeThere is possibility using up to 4 neutron detectors tochange outputs to the display, to the printer or to the hardaisx and to set all experimental parameters (sampling inter-val, number of sampling interval for mean value estimationstatistical precision for cumulative count estimation) r nthis experiment all measurements are done in the subcriticalcondition All changes in the core building (increasing thenumber of fuel assemblies, the change of absorbing clusterinsertion or change of the moderator height) result aftersome transient period in stable neutron fUu This fact al-

N>
lows to sura up the counts from the single time intervals.Firstly to see if there is stable neutron flux we estimatethe reactor period from monitored counts.At the beginning of the experiments in the table of the in-terrupt vectors the address of standard interrupt 1C hex isoverwritten to the address of procedure covering time samp-ling (Timelntr). Interrupt procedure is called app. every20 ms and it controls data acquisition. After finishing datasampling procedure ETIME renew previous values for interrupt1C hex. In the data sampling and analysing we have used ac-tive control for the data acquisition from the keyboard.The output parameters are:on-line • estimated reactor period, filtered count rateoff-line predicted critical mass and keff, the graph ofI/counts (critical mass, H).
REACTIVITY MEASUREMENT
The code BLB15C is devoted for the measurement of the reac-tivity and/or for the measuring of the critical moderatorheight in the start-up experiment on LR-0 reactor. The codeestimates also the reactor period used to determine the corecritical state. The output of the code is the experimentaldata file containing the measured values of the reactivity,moderator level and estimation of the errors. Reactivity me-asurement is based on the inverse kinetics method. The oldversions of the code, written in FORTRAN and ALGOL, was pre-viously used on the HP 21MX and PDF 11/4 computers for thesame purpose. New code version for PC is written in Turbo-Pascal 6.0 and its most frequently used procedures and func-tions was rewritten to assembler. The code is working onPC/XT/AT286/AT386 with or without the coprocessor. The choi-ce of the fastest sampling rate depends on the real timeclock frequency and on the type of PC : AT286/10 + 287 co-processor works already with dt=0.05 s and with 4 measuredlines. The same configuration without coprocessor works onlywith dt=0.1s. We have used 16 bits counters with SH correc-tion on 17th after overflow. There are two basic possibili-ties for the time synchronisation of the measurement cont-rol:- active waiting in the loop,- passive waiting for the interrupt.in the last version of BLB15C code we have used the activewaiting in the loop and at the end of sampling interval rea-ding and erasing of the sealer :repeatuntil TestLAM(CAM 5 01 position) {end of sampling interval}clear LAM {CAMAC function F10,A15 }read+erase sealer {CAMAC function F2 }read CAM 321 {moderator height },
where TestLAM is the procedure for the testing LAM signalfrom RTCL (CAM 5.01). Time consumption in the waiting loopand asynchronous character of HW routines in DOS kernel re-sults in the fluctuation around mean value of measured fre-quency which was bellow true value from RTCL. DOS kernelroutines could not be influenced. We have to change the codeitself to increase the precision of the measurement influen-ced by the time scale uncertainty. The first method to over-come this inherent uncertainty was to apply the coprocessorwith data type Real Extended and the second one was to useassembler part in the procedure NAFD, which provide the com-plex communication between PC and CAMAC crate. NAFD procedu-re works at every experimental data transfer from the crateto the PC (read), at every control of CAMAC units (write) aswell as in the special operations on the crate Using assem-bler part in TurboPascal code we have decreased time in thewaiting loop (decrease the time uncertainty of the time syn-chronisation) . The up described methods minimise the discre-pancy between true and measured frequency from RTCL.
SPACE DEPENDENT NEUTRON FLUX DISTRIBUTION
NRI ftea and ZfK Rossendorf have jointly prepared and perfor-med neutron detectors response measurement due to reactivityperturbation on LR-0 reactor /1,2/. space-time neutron fluxdistribution was measured in 31 and 55 fuel assemblies coreconfigurations. Experimental data files have been used forthe verification of kinetics codes for WER-1000 type core.Time dependent local reactivity perturbation induced by themovement of the one experimental cluster was used in thefirst period of experiment. Cluster deposition has respondedto the ramp negative reactivity perturbation from the criti-cal state and back with hold on in the subcntical state inthe first period of experiments, followed by cluster dropmeasurements in the second period. The second type of reac-tivity perturbation has been the absorption cluster drop.The experimental hardware is based on a computer controlledCAMAC system for simultaneous data acquisition of 20 spati-ally distributed neutron detectors and for absorption clus-ter control. HV supply units and the amplifiers are in ana-log units crates, which are placed in well shielded metalbox. To minimise electromagnetic disturbances on low levelneutron detector signal the box is as close to the core aspossible and it is grounded to the vessel. Signal amplifiersare galvanicaly isolated from following crate with impulsediscriminators, which are placed 20 m apart in the controlroom. PC controlled CAMAC system has been used in the alldescribed experiments. PC sets real time sampling of measu-red detectors signal and it control fuel element or absorp-tion cluster depositions with the CAMAC step motor interfaceCAM 2.13. The real time clock module sets the time axis ofexperiments. Neutron detectors signals aie sampled by 5 quadsealers. CAMAC crate controller represents interface between

PC used for experiment control as well as for the data acqu-isition system, and the controlled CAMAC crate. To set allexperimental parameters as well as to control the measure-ment the codes VOJTA and DROP was written. Sampled countsare stored on floppy diskettes or to the hard disk. Softwarepackage has been written in FORTRAN or TurboPascal to evalu-ate primary experimental data files, to check detectors re-liability, to correct and to accumulate primary data files,to calculate the inverse kinetics reactivity and to analysefinal data files. All codes use the same experimental datafiles.The space-kinetics experiments have been measured in1986-1989 with PDP 11/4 computer. The data acquisition andcontrol system were based on code VOJTA to provide the desi-red changes of reactivity perturbation or DROP for the expe-rimental absorbing cluster drop. The codes were recentlyrewritten to TurboPascal for PC/XT/AT, sampling time inter-val, cluster down and/or up motion start the velocity andthe direction of the motion, the end of the data sampling,total numbers of the motor steps (the amplitude of reactivi-ty perturbation) and the address of CAMAC units in the crateare set in the codes To identify the experiment we have al-so to write the critical height, the initial and final posi-tion of the cluster as necessary information. The code usefollowing procedure for sampling time loopif TestLAM(CAM 5.01} thenbeginread + erase sealerwrite data to hard diskerase LAM (CAM 5.01)until index >N
{end of sampling interval}{CAMAC function F2 }{CAMAC function F10,A15}{Number of intervals >
MACRO PARAMETERS MEASUREMENT
One of the basic tasks being solved on each LR-0 reactor co-re is finding its spatial neutron flux distribution. Themethod used for this purpose is based on the measurement ofthe induced gamma activity of U235 fission products. A setof the fuel elements which are designed to be used for themeasurement are pulled out from the core after the irradia-tion and transported to the laboratory. There they are scan-ned at the same axial coordinate in order to determine theradial part of the spatial distribution. The axial part ofthe distribution is derived from the scanning of severalsingle fuel elements along their longitudinal axis. In bothcases gamma rays in the energy range 600-900 kev are takeninto account. HPGe detector in connection with CANBERRA Se-ries 80 multichannel analyser is used to measure fuel ele-ments' activity in the radial direction. Axial distributionprofile is scanned using the device consisting of two inde-pendent channels equipped with Nal(Tl) scintillation detec-
HighVoltage
.Preamp
hMCA
Series 80
RS 232
LiquidNitrogenDewar
, Fuel element
CHANNEL B
Fig. 2 - Block diagram of macroparameters system.

tors and standard analogue part (HV power supply, amplifierand single channel analyser) of CAMAC modules. The wholesystem is schematically shown on Fig. 2. The PDP 11/04 com-puter provides the control over the whole system. This con-sists in the control of the CANBERRA analyser measuring cyc-le for the radial part of the distribution measurement andsimultaneous scanning of single fuel elements to find theaxial part. In the latter case one of the measuring channelsis equipped by the device consisting of KINEX step motorcontrolled by the computer via special CAMAC interface pro-viding automatic motion of the scanned fuel element in frontof the detector. The other channel is used for fission pro-ducts radioactive decay monitoring. To control the devicea code called SCAN was written in FORTRAN. The program pro-vides the control of the CAMAC crate using special interruptservice routines, data acquisition and their record intofloppy diskettes files. The further data evaluation is doneby the complex of codes calculating the standard correctionsof the measured data (e.g. dead time, radioactive decay, ca-libration and background correction). The obtained resultsare then related to the fission density distribution. Theabove described method has not been applied to define thespatial distribution only. Basic macro parameters such asmaterial buckling and multiplication factor can be also es-timated as a function of spatial distribution. This approachhas been used recently to estimate the subcriticality of va-rious spent fuel compact configurations, for example. Withrecent experiences with PC control of CAMAC crate SCAN codeis under transferring to above described general PC/AT basedsystem.
REFERENCES
/!/ V. RYPAR, J. RACEK, K.H. FÄHRMANN,U. GRUNDMANN, D. ZIEGENBEINNeutron Kinetic Investigation at the Zero Power ReactorLR-0.Nucl.Sci. and Eng. 105,3,218,1990
/2/ E. NOVÂK, J. RACEKTechnical arrangement of the experiment space kinetics onreactor LR-0 in 1987 (in Czech)ÛJV 9104 R,A , 1990
RITME: A FAST AND SIMPLE COMPUTING CODEFOR PWR CORE CALCULATIONS AND MONITORING
L. SAUVAGEDirection des réacteurs nucléaires,Département d'études des réacteurs,Centre d'études nucléaires de Cadarache,Commissariat à l'énergie atomique,Saint-Paul-lez-Durance, France
Abstract
This paper discusses an overview of the use of the RITME method foron-line applications and studies based on PWR core simulation .
Section I outlines the basic principles of the method; some equations aregiven m order to illustrate the simplicity of the method .
Section u discusses the PRO-RITME application, PRO-RITME is asoftware package for 3-dimensional power reconstitution of a PWR core. Neutronic pa-rameter 3D distributions (fuel and moderator temperature, xenon concentration, bum-up) and synthetic factors such as axial-offset, hot peaking factors are also performed bythe PRO_RITME system . The run time performances and the qualification results arealso given in this section .
The last section describes the 3D PWR core simulator RITME . Themain features, and particularly the graphic interface developed with an advancedgraphic software, are presented .
INTRODUCTION
This paper discusses an overview of the use of the RITME method foron-line applications and studies based on PWR core simulation.
The basic principles of the method and the main equations are presentedin the first section.
The RITME method is a close solution to the neutron transport and thus,this makes it well adapted to a variety of core calculation applications . In this paper,we present two software systems based on the RITME method .
Section n discusses the PRO-RITME application. It is a software pack-age for 3-dimensional power reconstitution of a PWR core . The principal features andperformances are presented.
The last section describes the 3D PWR core simulator RITME and par-ticularly its graphic interface developed using an advanced graphic software .

I. PRESENTATION OF THE RITME METHOD
I.I. IntroductionRITME is a nodal Green's function method for solving the neutron
transport equation . In this section, only the main characteristics and the methodologyto calculate fluxes per mesh on PWR cores are discussed ; the detailed formulations aregiven in reference 111.
For the sake of clarity, the method is applied here to the steady-stateneutron transport equation expressed in integral-differential form.
The initial equation is the following :
-Div ( Cl. 9 (r,E,Q) ) - Et (r,E). <p (r,E,Q) + S (r,E,:migration disappearance sources
+ JljEs(r,E'-^E,Q.Q').(p(r,E',£2>)dE>d2n' = 0transferred
(Eq: 1)
The neutron medium is assumed to be isotropic and is characterized bymacroscopic cross sections (I.). The fission sources S (r,E,£2) are isotropic and associ-ated with a fission spectrum K (E),
5(7-,E,0) = K(E) xS(r) (Eq:2)
1.2. Notations and definitionsBy definition, the actual medium is considered to be the superposition
of a "zero medium" and a "prime medium" :* the "zero medium", designated "0" is isotropic and independent of
the space variable (r). This homogeneous medium is independent of local variationsaffecting the neutron parameters, including boron concentration, fuel and moderatortemperatures, xenon concentration, burn-up, etc .
* the " prime medium", designated "'" and dependent on the space var-iable describes local changes in neutron properties relative to the "zero" medium .
Symbolically, the neutron medium is then :Actual medium (r) = "Zero medium" + "Prime medium (r)"The macroscopic cross sections and fluxes are expressed in the follow-
ing forms :
E (r) = £° + Z'(r)
(p (r, E, Q) = <p° (r, E, O) + (p' (r, E,
O (r, E) = O0 (r, E) + *' (r, E)
(Eq: 3)
(Eq: 4)
(Eq: 5)
1.3. Calculating the flux O°• TheoryWriting <&° is solution to the transport equation (Eq: 1) and using the lin-
earity of the operator A° associated with equation (Eq:l), one obtains without approx-imations :
<D° (r, E) = (r, r', E)xS (r1) x (Eq: 6)
where T0 is known as a Green function .4** (r,r',E) is the flux at r of energy E due to one neutron/second emitted
at r', in the form of a Dirac distribution, with the spectrum of source S in the "zero"medium.
« Application0°(r,E) is by definition a flux in a homogeneous medium, therefore :- <I>0(r,E) will have a smooth spatial form (no interface between differ-
ent neutron media ); it involves "long-range" migration, and can be calculated with acoarse mesh consistent with the migration properties of the selected "zero" medium .The "zero" medium corresponds in fact to the average neutron medium of the configu-ration in question.
- the T0 functions depend only on the distance between r and r' , andthus involve geometrical symmetries . For a given "zero" medium and neutron emis-sion spectrum, they may be calculated once and for all to constitute a limited functionlibrary.
After dividing the core (and reflector) into meshes (subscript j), equa-tion (Eq: 6) and for a resolution with G energy groups, the discrete formulation of O°is the following :
*°A = Z*%,xVtxSt (Eq:7)K
where :c
k is the neutron source density in the "emitting" mesh kV,, is the volume of mesh k*kie 's me Green function between meshes j and k at energy g .

1.4. Calculating the flux O'»TheoryWriting the total flux defined by equation (Eq: 5) and considering the
following hypotheses :I/ the media are isotropic21 the angular flux <p' (r,E^i) is isotropicthe scalar flux <E>' (r,E) is solution to the simplified equation :
' = S' (Eq:8)
whereA' is a linear operator (thus integral) associated with the developed
equation giving 0' (r,E) (see reference III)and,S' is a source term function of the flux <ï>°(r,E) and cross sections of the
"prime medium".Thus, the scalar flux 0' (r,E) can be expressed as follows :
0' (r, E) = JJJ^' (r, r', E) x S' (r') x efr' (Eq: 9)
where 4** is a Green function in an heterogeneous medium, it dependson both the S' source spectrum and the neutron media in r and r'.
- Application
Flux 0' results from local changes in the neutron properties of the ac-tual medium relative to the "zero" medium . It is thus advantageous to adapt the 0'calculation mesh to the neutron heterogeneities of the core calculated .
For PWR cores, the neutron variations will affect the thermal and epi-thermal ranges, thus the migration term concerning 0' will be small. That means:
- the accuracy on 0' is mainly related to the quality of the cross sectionsin the r medium
- the coupling area necessary to calculate 0' is reduced .The RITME method enables the users to define different meshes for 0'
and 0°. This allows us to obtain a precise assessment of neutron heterogeneities (ab-sorber , mixed oxide assemblies ... ) saving the computational time .
1.5. Remarks concerning the Green functionsThe *V' functions are tabulated according to sensitive parameters of the
S' spectrum (e.g. the moderator density) and to characteristic neutron migration param-eters (e.g. absorbers in intermediate energy ranges ).
The Green functions for a given application are calculated once and forall using multigroup transport code. The energy discretization is precise enough to pro-vide an accurate description of neutron migration in the high-energy ranges; these val-ues are then condensed to a smaller number of groups for flux calculations in theapplication.
1.6. Total flux calculationThe total flux O j = <E>°- + <!>'• is obtained, on the <I> mesh, after
"outer" iterations on the fission sources in order to obtain the critical flux form and theeffective multiplication factor.
A carrier flux (flux in homogenized medium) is calculated throughoutthe core by interpolation . The microscopic flux is reconstructed by a factorization ofthe carrier form with the pin-by-pin infinite medium flux stored in the neutron library .
II. THE PRO-RITME ON-LINE SYSTEM
ILL General descriptionPRO-RITME 111 is a software package for 3-dimensional flux and pow-
er reconstitution of a 900 MWe PWR core. The flux calculation is based on the RITMEmethod, thus the use of a transport method makes PRO-RTTME well suited to a widevariety of cores.
PRO-RITME allows for a fast and an accurate core performance assess-ment consistent with a use in an on-line monitoring system. The input measured coreparameters for the 3D calculation are the following :
- inlet and outlet primary loop temperatures- primary pressure and flow rate- control rod positions- two stage excore detector signals to adjust the axial power distribution
using a measured axial offset /3/ .Fluxes per energy-group, power and the neutron parameters (fuel and
moderator temperature, burn-up, xenon concentration) are performed throughout theentire core over a 21.5 cm edge regular mesh .
From the 3D distributions, synthetic factors are generated :- average power per assembly- average axial power with axial offset- hot peaking factors : FAHmax , FQ , Plin_max(kw/ft)The responses of the core instrumentation (thermocouples , moveable
or fixed chambers) can be simulated and compared with the measured values .
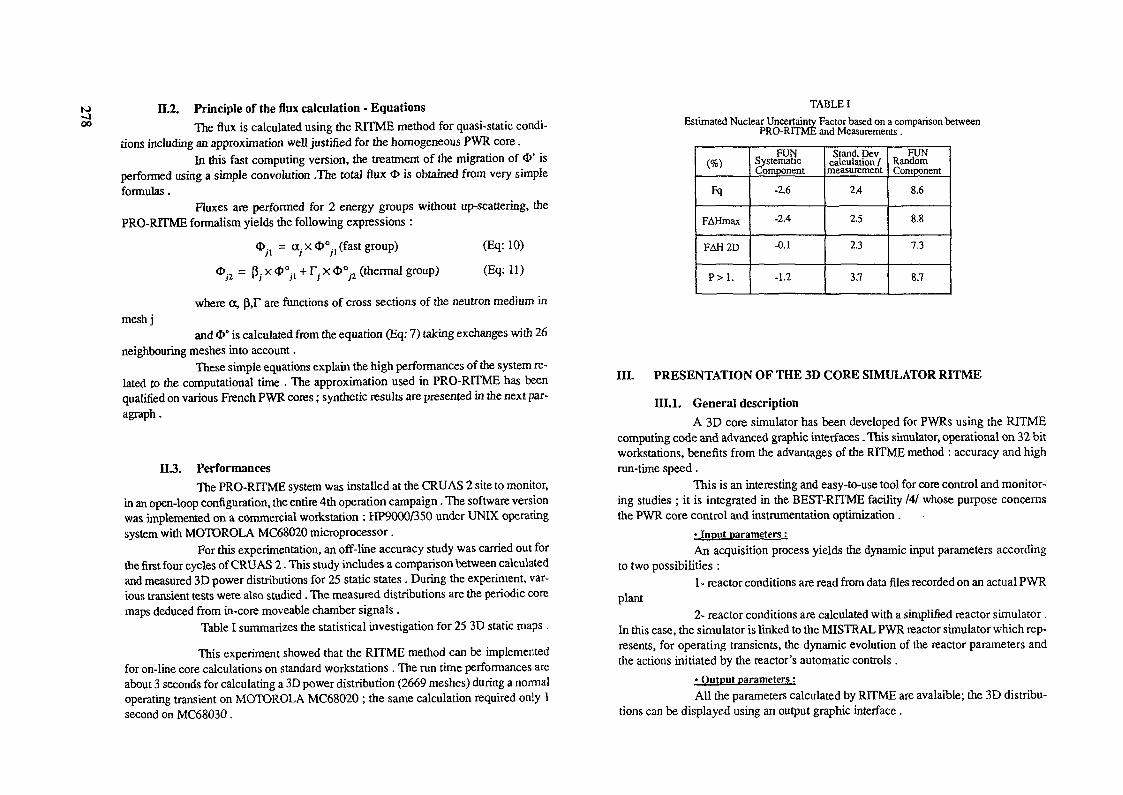
oon.2. Principle of the flux calculation - Equations
The flux is calculated using the RITME method for quasi-static condi-tions including an approximation well justified for the homogeneous PWR core.
In this fast computing version, the treatment of the migration of <!>' isperformed using a simple convolution .The total flux <I> is obtained from very simpleformulas.
Fluxes are performed for 2 energy groups without up-scattering, thePRO-RTTME formalism yields the following expressions :
O^ = a;.xO0., (fast group) (Eq: 10)
<D)2 = ß;. x <t>0;i + T. x 0°^ (thermal group) (Eq: 11)
where ot, ß,F are functions of cross sections of the neutron medium inmeshj
and <D° is calculated from the equation (Eq: 7) taking exchanges with 26neighbouring meshes into account.
These simple equations explain the high performances of the system re-lated to the computational time . The approximation used in PRO-RITME has beenqualified on various French PWR cores ; synthetic results are presented in the next par-agraph .
EL3. PerformancesThe PRO-RITME system was installed at the CRU AS 2 site to monitor,
in an open-loop configuration, the entire 4th operation campaign. The software versionwas implemented on a commercial workstation : HP9000/350 under UNIX operatingsystem with MOTOROLA MC68020 microprocessor.
For this experimentation, an off-line accuracy study was carried out forthe first four cycles of CRU AS 1. This study includes a comparison between calculatedand measured 3D power distributions for 25 static states. During the experiment, var-ious transient tests were also studied. The measured distributions are the periodic coremaps deduced from in-core moveable chamber signals.
Table I summarizes the statistical investigation for 25 3D static maps .
This experiment showed that the RITME method can be implementedfor on-line core calculations on standard workstations . The run time performances areabout 3 seconds for calculating a 3D power distribution (2669 meshes) during a normaloperating transient on MOTOROLA MC68020 ; the same calculation required only 1second on MC68030.
TABLE IEstimated Nuclear Uncertainty Factor based on a comparison between
PRO-RITME and Measurements.
(%)Fq
FAHmax
FAH2D
P>1.
- PUNSystematicComponent
-2.6
-2.4
-0.1
-1.2
Stand. Devcalculation /measurement
2.4
2.5
2.3
3.7
FUNRandomComponent
8.6
8.8
7.3
8.7
III. PRESENTATION OF THE 3D CORE SIMULATOR RITME
III.l. General descriptionA 3D core simulator has been developed for PWRs using the RITME
computing code and advanced graphic interfaces. This simulator, operational on 32 bitworkstations, benefits from the advantages of the RITME method : accuracy and highrun-time speed.
This is an interesting and easy-to-use tool for core control and monitor-ing studies ; it is integrated in the BEST-RITME facility /4/ whose purpose concernsthe PWR core control and instrumentation optimization .
- Input parameters :An acquisition process yields the dynamic input parameters according
to two possibilities :1- reactor conditions are read from data files recorded on an actual PWR
plant2- reactor conditions are calculated with a simplified reactor simulator.
In this case, the simulator is linked to the MISTRAL PWR reactor simulator which rep-resents, for operating transients, the dynamic evolution of the reactor parameters andthe actions initiated by the reactor's automatic controls .
• Output parameters :All the parameters calculated by RITME are avalaible; the 3D distribu-
tions can be displayed using an output graphic interface.

to
Date: 19/06/91 BEST-RITMEPRORITME CRUAS 204 __________ _____Pn:100% Tin: 286 oC Boron: 450 ppm B.U : 4500 Mwd/T
I RADIAL MAP REPRESENTATION |
~R l P | N | M | L | K | J | H [ G | F | E | D C | B | A
Elevation
590 653
567 673 619 530
«3 713 534 620 680
«3 Vit 536 574 669 597
587 713 556 535 662 636 570
673 534 574 662 601 605 672
590 619 628 669 636 603 668 608
653 590 660 597 570 672 60S 57O
590 619 628 669 636 6O5 668 608
673 334 374 6£2 601 603 672
587 713 566 535 662 636 570
443 694 556 574 (At 597
619 590
S90 653
590
619 673 SB7
628 534 713 443
669 574 556 634 4d3
636 662 535 556 TU 587
605 601 662 574 534 673
666 60S £36 669 6ZB 619 590
60S 672 570 597 660 S9O 653
666 605 636 669 628 619 590
609 601 662 574 534 673
636 662 535 556 713 587
66? 574 556 694 443
619 673 507
590
Top
101112
141516
Bot.
FIGURE 1 : Radial representation of the core state.
IIL2. The graphic interfacesA colour graphic interface has been carried out using D ATAVIEWS ad-
vanced graphic software.Several displays, belonging to a fully interactive process, have been de-
veloped to represent the core state. One gives a synthetic view that contains the valuesof the operating parameters, the average power per assembly and the average poweraxial form. The others concern the radial (example given in figure 1) and axial detailedrepresentation in order to follow parameters such as power, burn-up, xenon concentra-tion , fuel and moderator temperature .
The operating parameters can also be initialized or modified using aninteractive input graphic interface .
CONCLUSIONThe RITME method allows researchers to perform flux and power cal-
culations for a variety of cores. Up to now, it has been used for 900 PWR studies relatedto core control and monitoring such as improvement of core protection systems, instru-mentation optimization....
At present, future applications including other types of cores and basedon paramétrable RTTME versions are carried out within the framework of LOGARIT-ME project 151.
REFERENCES
III J.M. BOHLER, Ph. DUFOUR, J.P. FERRERO, L. SAUVAGE"The RITME method: Basic principles and presentation of the LOGA-RITME concept"Specialists meeting on advanced methods of calculations for power re-actors - AIE A - Cadarache, September 1990.
121 P. BERNARD, H. GIRARD, L. SAUVAGE"Principles of the fast computing 3D PWR core power calculationsmethod RITME"International topical meeting on advances in reactor physics, mathemat-ics and computation - Paris, April 1997 .
/3/ P. BERNARD, H. GIRARD, J.P. FERRERO, L. SAUVAGE, J.C. BAR-RAL, A. VASSALLO"Testing and on-line applications of the fast 3D PWR core power distri-bution model RITME"Incore instrumentation and nuclear power plant core assessment -OCDE - Cadarache, June 1988 .
/4/ M. GUEVARA, L. SAUVAGE"BEST-RITME : A versatile testing facility for PWR core control andinstrumentation optimization"Specialists meeting on in-core instrumentation and reactor core assess-ment - OCDE - Pittsburgh, October 1991 .
151 L. SAUVAGE, Ph. DUFOUR, P. BERNARD, J. CRAY, M. PEYTDER,JC. BARRAL, A. VASSALLO, S. GHATTAS, B. GUESDON"Development of the RITME fast 3D core power calculation and appli-cation for reactor operation and control."International conference on the physics of reactors : operation, designand computation - Marseille, April 90.

K» OPERATION FLEXIBILITY AND AVAILABILITYo IMPROVEMENTS USING BEACON, AN ADVANCED
CORE MONITORING SYSTEM
T.Q. NGUYEN, R.W. MILLER,A.L. CASADEI, P.K. DOSHIWestinghouse Commercial Nuclear Fuel Division,Pittsburgh, Pennsylvania,United States of America
AbstractIn response to utilities needs in improving plant operation flexibility andplant availability, Westinghouse introduced the advanced core monitoring andoperational support system, BEACON, two years ago. Since then, the continuousdevelopment of the BEACON system has led to significant advances in furtherreducing utilities Operation and Maintenance (O&M) costs. The development ofthe BEACON system is made possible by two breakthroughs: 1) advanced numericalmethod to solve the diffusion equations extremely fast and 2) development ofcost effective, state-of-the-art computing system, workstation. This paperpresents the numerical scheme used in the neutronic solution and how BEACONuses the core instrumentations to provide the continuous three-dimensional(3D) core power distribution. Once the state of the core is known on acontinuous basis, several indirect surveillance and/or TechnicalSpecifications on core power distribution can be relaxed or totallyeliminated. Section 1 outlines the numerical scheme used in BEACON forsolving the diffusion equations and to provide the 3D continuous powerdistribution. Section 2 describes the hardware requirements. Section 3discusses applications of BEACON to improve plant operation flexibility andplant availability. Examples of actual BEACON usage to demonstrate itseffectiveness are presented in Section 4 and the paper is closed with asummary of future directions.
1. BEACON POWER DISTRIBUTION INFERENCE METHODOLOGY
BEACON uses a combination of incore instrumentation (e.g. , movable detectors,thermocouples) and excore detectors in conjunction with an advanced nodalmethod to provide continuous 3D core power distribution. The advanced nodalmethod employed by BEACON is based on an innovative concept called DiffusiveHomo gene ity(l) . Simply speaking, this concept is based on the recognitionthat the coupling between assemblies in light water reactor environment isdominated by fast group diffusion which has long diffusion length. As such,the core can be considered homogeneous in diffusion, although heterogeneous inreactivity. Mathematically, the fast group (in conventional two-groupequations) flux can be expressed as follows:
where: G represents the transit probability of a neutron from onenode to anotherk* represents an effective fast group multiplication factorwith thermal leakage correction
Once the fast flux is calculated, the thermal flux is constructed with thehigher order leakage term included. The instrumentation tube flux isreconstructed by a combination of an homogeneous intranodal flux shapesuperposed with a heterogeneous instrumentation tube flux calculation from atransport-based lattice code, PHOENIX-P(2). Once the assembly flux iscalculated, the assembly power is easily obtained via conventional method.This advanced nodal method is embodied in the SPNOVA computer code used byBEACON. The continuous power distribution provided by BEACON is obtained viathe following process:
a. The BEACON 3D SPNOVA model is calibrated against the incore fluxtrace measurements. By using the calibrated power distribution,the excore detectors and thermocouples are cross-calibrated.These calibration factors are used until the next flux map istaken.
b. The BEACON model is updated following the actual reactor operation asclosely as possible. Typically, once every fifteen minutes, the modelis updated by integrating the actual core operating history (power, rodposition, temperature) using the calibrated power in step (a) as thebasis.
c. The continuous power distribution is provided by applying thermocoupleand excore detector measurements which are available virtually on acontinuous basis. The thermocouple measurements are not applied on anabsolute basis. Rather, the deviation of the continuous thermocouplemeasurements from the cross-calibrated values (taken at the flux map) isused. During normal operation, the deviation is very small as expected.In abnormal condition, such as dropped rod, the deviation will be largerand this methodology enables the reactor operator to detect anomaly andknow precisely what is happening in the reactor core.
A two-dimensional surface spline fitting technique is used to fit the adjustedinformation from the incore flux map and the thermocouple readings.Flexibility to properly weight the individual measurement is available toaccount for the quality of the individual reading. Extrapolation touninstrumented assemblies is performed by the surface spline fitted valuesfrom the instrumented assemblies in conjunction with the up-to-date core modelpower distribution for the uninstrumented assemblies.
2. HARDWARE REQUIREMENTS
To effectively develop a continuous core monitoring and operational supportsystem, it is a must to have a computer which allows multi-task operation, becompact without special environment requirements and with good computationalspeed for multidimensional calculations. The advent of the workstationaddresses all of these requirements. The capability to link multipleworkstations in a network enables the users to receive information from asingle data source to address each user's specific needs. BEACON presently isconfigured with an HP/APOLLO workstation with the following characteristics:
- A 25MHz 32-bit Motorola 68040 central processor- A 24 MB of RAM

00
- A 19 inch color display with a 1280x1024 pixel resolution- A 660 MB formatted Winchester disk drive- A 60 MB 1/4 inch cartridge tape for disk backup, systemupdates and data transfer
- Ethernet/IEEE-803 network for communication protocol
BEACON can be configured to access the plant data directly through the plantprocess computer or linked to a network. The capability to link BEACON in anetwork enables multiple users to access consistent core information and toperform core operation support functions.
3. PLANT OPERATION FLEXIBILITY AND AVAILABILITY IMPROVEMENTS WITHTHE BEACON SYSTEM
Traditionally, Westinghouse Pressurized Water Reactor employs movable incoreand excore detectors as a mean to monitor the core power distribution.Technical Specifications and surveillance requirements are in place to assurethat the core is operating within analyzed limits. The power distributionrelated limits typically consist of indirect measure of core powerdistribution and thermal margins, such as axial flux difference, quadrantpower tilt ratio. Detailed power distribution is measured once a month toconfirm peaking factors limit. With BEACON, the detailed core powerdistribution is available on a continuous basis which is analogous to having afixed incore detector system or a continuous movable incore detector system.In addition, with the extremely fast neutronic model using actual measuredparameters, BEACON provides analysis of actual thermal margins in terms ofkw/ft and DNBR. Directly monitoring these parameters enable the users todetermine the impact of anomaly without having to take drastic action, such asreduction in power, unless absolutely necessary.With kw/ft and DNBR monitoring capabilities, the need for axial fluxdifference is eliminated. This significantly improves the utility operatorability to return to power quickly. An example of this benefit is illustratedin Figure 1. In a core with conventional monitoring devices and employing theConstant Axial Offset Control (CAOC) strategy, the reactor operator isrequired to keep the axial offset within the CAOC limit. This necessitatesmovement of the control rod frequently and slowly to assure that the axialpower distribution is within limit. If the axial power distribution isoutside of the prescribed limit, penalty minutes are taken which limit futureoperation flexibility. With BEACON kw/ft and DNBR calculation on anessentially continuous basis, the core thermal margin is known at all times.This allows the reactor operator to capitalize on operating margin, inparticular at low power, to trade-off with more relaxed operating space.Actual plant data shows that operation of a more relaxed operating space(RAOC) can result in a saving of eight effective full power hours relative toa conventional +/- 5% delta-I CAOC band.Another benefit of having an up-to-date neutronic model is the ability to"know" the xenon distribution in details to devise strategy to control it. InBEACON, the xenon mode (XeMode) display enables the operator to determine theappropriate rod movement to control xenon distribution very effectively inpreventing xenon oscillation or dampening one if one is in progress (3). TheXeMode represents the latest advancement in core control strategy in that it
ri r i i i r r-SO -40 -3O -20 -IO O D 33 33
Figure I: Startup With and Without BEACON
allows the projection of the future core axial power distribution based onaction taken by the reactor operator at a particular instant. Future axialpower distribution is really determined by the iodine and xenon distributionwhich is created due to a certain control rod, core power and axial powerdistribution intermix during a plant maneuvering. In BEACON, two newquantities are invented to describe the movement of the xenon distribution(4).
A Xe = fL Xe(z)dz - fL/*Xe(z) dzJL/2 JOJL/2 JO
A free running xenon oscillation can be approximated by:
AJTe(t) = AXe0 eAC Sin ( wit t)For a stable xenon oscillation, the time derivative is defined by:
dAjfe(t)/at = wjt AXe0 COS (writ)
A parameter T can be defined which determines the rate of change of the xenonskewness as a function of time. A phase diagram can be constructed topictorially see the behavior of xenon due to plant maneuvering. An example ofsuch a diagram is shown in Figure 2.
This phase diagram provides invaluable information for the reactor operator tocontrol the axial power distribution. For example, a stable xenon conditionwould have the derivative equal to zero and the delta xenon at the nominalequilibrium value. To effective dampen a xenon oscillation, action via
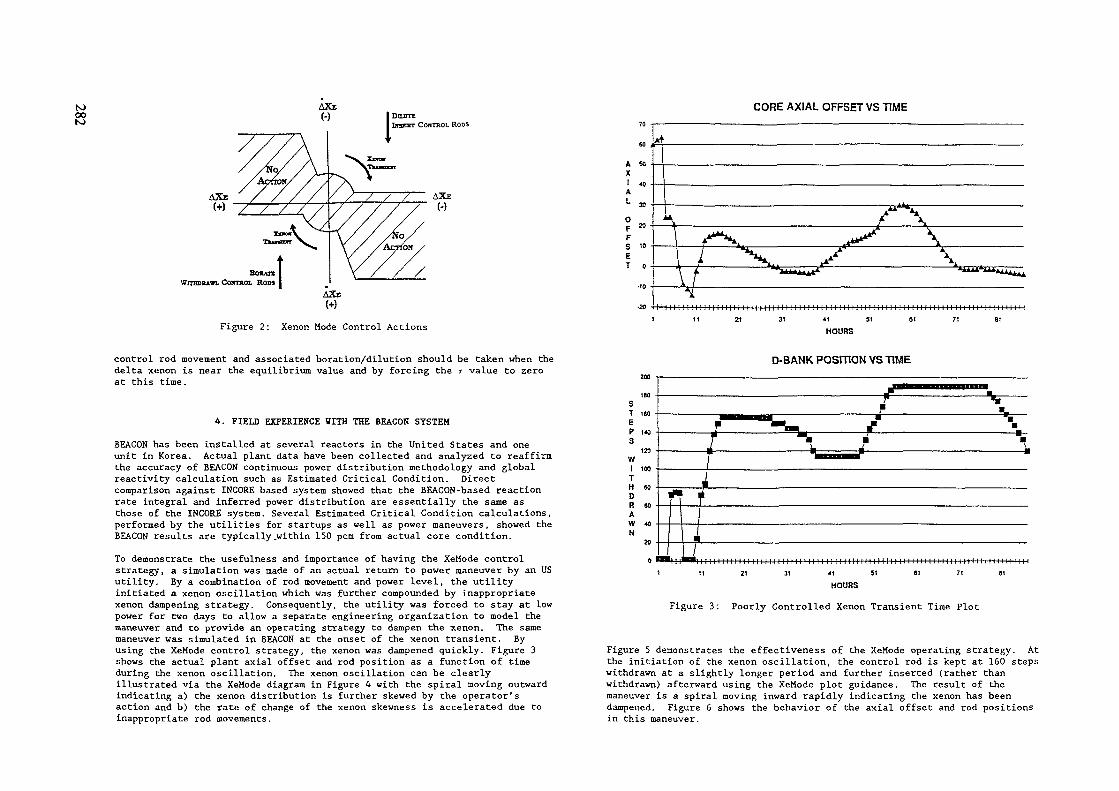
(OootoAXE CORE AXIAL OFFSET VS TIME
BORA1X\7irmKun. ComtoL RODS
Figure 2: Xenon Mode Control Actions HOURS
control rod movement and associated boration/dilution should be taken when thedelta xenon is near the equilibrium value and by forcing the r value to zeroat this time.
4. FIELD EXPERIENCE WITH THE BEACON SYSTEM
BEACON has been installed at several reactors in the United States and oneunit in Korea. Actual plant data have been collected and analyzed to reaffirmthe accuracy of BEACON continuous power distribution methodology and globalreactivity calculation such as Estimated Critical Condition. Directcomparison against INCORE based system showed that the BEACON-based reactionrate integral and inferred power distribution are essentially the same asthose of the INCORE system. Several Estimated Critical Condition calculations,performed by the utilities for startups as well as power maneuvers, showed theBEACON results are typically .within 150 pcm from actual core condition.To demonstrate the usefulness and importance of having the XeMode controlstrategy, a simulation was made of an actual return to power maneuver by an USutility. By a combination of rod movement and power level, the utilityinitiated a xenon oscillation which was further compounded by inappropriatexenon dampening strategy. Consequently, the utility was forced to stay at lowpower for two days to allow a separate engineering organization to model themaneuver and to provide an operating strategy to dampen the xenon. The samemaneuver was simulated in BEACON at the onset of the xenon transient. Byusing the XeMode control strategy, the xenon was dampened quickly. Figure 3shows the actual plant axial offset and rod position as a function of timeduring the xenon oscillation. The xenon oscillation can be clearlyillustrated via the XeMode diagram in Figure 4 with the spiral moving outwardindicating a) the xenon distribution is further skewed by the operator'saction and b) the rate of change of the xenon skewness is accelerated due toinappropriate rod movements.
D-BANK POSITION VS TIME
Figure 3: Poorly Controlled Xenon Transient Time Plot
Figure 5 demonstrates the effectiveness of the XeMode operating strategy. Atthe initiation of the xenon oscillation, the control rod is kept at 160 stepswithdrawn at a slightly longer period and further inserted (rather thanwithdrawn) afterward using the XeMode plot guidance. The result of themaneuver is a spiral moving inward rapidly indicating the xenon has beendampened. Figure 6 shows the behavior of the axial offset and rod positionsin this maneuver.

zoz
usou
Zor
u.oz«c
DELTA XENON KUX ÄNON
Figure 4: Poorly Controlled Xenon Transient Phase Plane Diagram Figure 5: Phase Plane Diagram for Xenon Transient withXenon Mode Control
to00
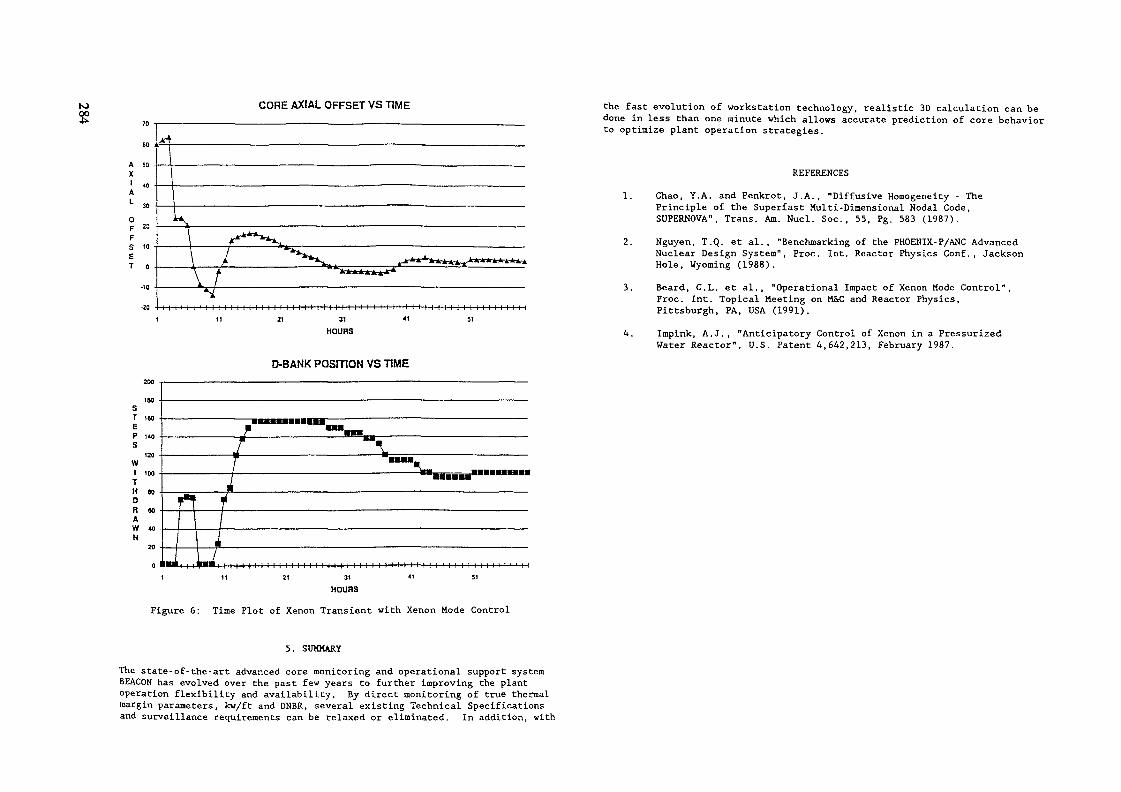
NiooCORE AXIAL OFFSET VS TIME
TO
60 i
SO
40
30
7
31
HOURS
D-BANK POSITION VS TIME
the fast evolution of workstation technology, realistic 3D calculation can bedone in less than one minute which allows accurate prediction of core behaviorto optimize plant operation strategies.
REFERENCES
1. Chao, Y.A. and Penkrot, J.A., "Diffusive Homogeneity - ThePrinciple of the Superfast Multi-Dimensional Nodal Code,SUPERNOVA", Trans. Am. Nucl. Soc., 55, Pg. 583 (1987).
2. Nguyen, T.Q. et al., "Benchmarking of the PHOENIX-P/ANC AdvancedNuclear Design System", Proc. Int. Reactor Physics Conf., JacksonHole, Wyoming (1988).
3. Beard, C.L. et al., "Operational Impact of Xenon Mode Control",Proc. Int. Topical Meeting on M&C and Reactor Physics,Pittsburgh, PA, USA (1991).
4. Impink, A.J., "Anticipatory Control of Xenon in a PressurizedWater Reactor", U.S. Patent 4,642,213, February 1987.
Figure 6: Time Plot of Xenon Transient with Xenon Mode Control
5. SUMMARY
The state-of-the-art advanced core monitoring and operational support systemBEACON has evolved over the past few years to further improving the plantoperation flexibility and availability. By direct monitoring of true thermalmargin parameters, kw/ft and DNBR, several existing Technical Specificationsand surveillance requirements can be relaxed or eliminated. In addition, with
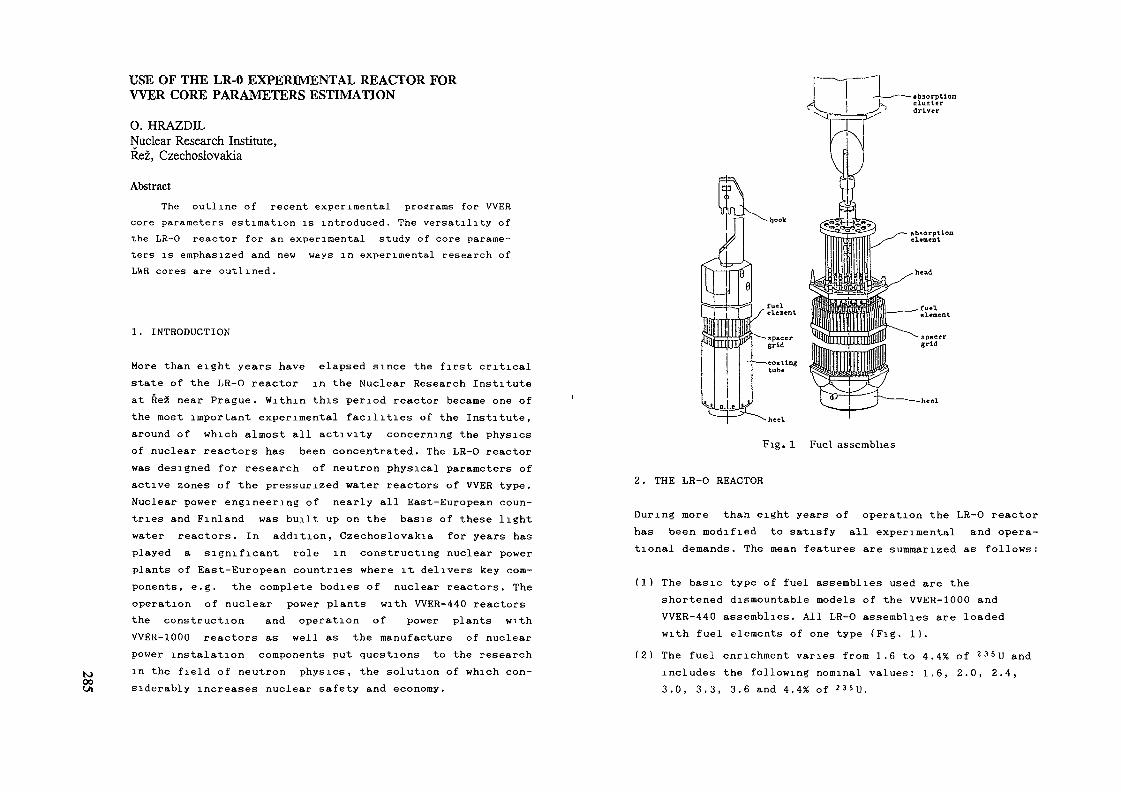
USE OF THE LR-0 EXPERIMENTAL REACTOR FORWER CORE PARAMETERS ESTIMATION
O. HRAZDILNuclear Research Institute,Rez, Czechoslovakia
AbstractThe outline of recent experimental programs for WER
core parameters estimation is introduced. The versatility ofthe LR-0 reactor for an experimental study of core parame-ters is emphasized and new ways in experimental research ofLtoR cores are outlined.
1 . INTRODUCTION
More than eight years have elapsed since the first criticalstate of the LR-0 reactor in the Nuclear Research Instituteat Reä near Prague. Within this period reactor became one ofthe most important experimental facilities of the Institute,around of which almost all activity concerning the physicsof nuclear reactors has been concentrated. The LR-O reactorwas designed for research of neutron physical parameters ofactive zones of the pressurized water reactors of WER type.Nuclear power engineering of nearly all East-European coun-tries and Finland was built up on the basis of these lightwater reactors. In addition, Czechoslovakia for years hasplayed a significant role in constructing nuclear powerplants of East-European countries where it delivers key com-ponents, e.g. the complete bodies of nuclear reactors. Theoperation of nuclear power plants with WER-440 reactorsthe construction and operation of power plants withVVER-1000 reactors as well as the manufacture of nuclearpower instalation components put questions to the researchin the field of neutron physics, the solution of which con-siderably increases nuclear safety and economy.
•—— absorptioncluster
Fig. 1 Fuel assemblies
2. THE LR-O REACTOR
During more than eight years of operation the LR-O reactorhas been modified to satisfy all experimental and opera-tional demands. The mean features are summarized as follows:
(1) The basic type of fuel assemblies used are theshortened dismountable models of the VVER-1000 andVVER-440 assemblies. All LR-O assemblies are loadedwith fuel elements of one type (Fig. 1).
(2) The fuel enrichment vanes from 1.6 to 4.4% of 2 3 5U andincludes the following nominal values: 1.6, 2.0, 2.4,3.0, 3.3, 3.6 and 4.4% of 235U.

to00ON
(3) A small part of fuel elements of each enrichment isdismountable, which enables, e.g., to place activationdetectors between fuel pellets or experimental devicesinto the zirconium coating tube.
(4) Fuel elements containing Gd were prepared for experi-ments. A set of fuel elements containing a homogeneousdi-gadolinium-tri-oxide admixture has the followingnominal values: 3605, 3610, 3615, 3620, 4401, 4403,4420 and 4460, where the first group of two digitsgives the fuel enrichment with the 235U isotope and thesecond one means the «eight content of GdzOa in fuelpelets (e.g. 4460 designates a fuel element with 4.4%enrichment and 6.0 w% of Gd20s).
(5) The main part of the technology equipment is thereactor core (Fig. 2) located on the supporting systemin the reactor vessel.This system consists of- the standard supporting plate, which enables to setvarious configurations with fuel assemblies ofVVER-1000 type with a pitch of 236 mm (Fig. 3),
- the auxiliary inserted plate, which makes itpossible to place 7 fuel assemblies of VVER-440 typewith a pitch of 147 mm into the central part ofthe core, while the standard coatless assemblies ofVVER-1000 type are placed in the periphery of thecore (Fig. 4 ) ,
- the special plate with radial grooves, which enablesto change continuously the assembly pitch (Fig. 5).
Fig. 2 Reactor vessel and its equipment
(6) The H.3BO3 concentration in the moderator may vary from0 to 12 g per l l H20.
(7) The moderator may be heated up to 70°C.
(8) The thermal power of the reactor is limited to 5 kW for1 hour and the thermal neutron flux density in thecentre of the reactor core to 1013 nr2. s'1

VVER-lOOO-typefuel assembly
WSR-4<0-typossembljr
Fig. 3 Standard supporting plate
The reactor equipment is closely connected with its experi-mental program and is continuously modified and refined tomeet requirements of design specialists, suppliers and ope-rators of nuclear power plants.
Fig. 4 Auxiliary inserted plate
tooo
3. THEORETICAL RESEARCH
An experimental program on the LR-0 reactor involvesa number of calculations that are performed to support thedesign and evaluation of experiments. The elaborated methodsand codes create a library and programme equipment, whichinvolve- generating of multigroup cross.section libraries,- calculation of microparameters and condensed four-groupconstants,
- macroscopic calculations,
WER-lOOO-type,fuel assembly
specialsupportingplate
Fig. 5 Special supporting plate with grooves

N)ce00- Monte-Carlo calculations,- kinetic calculations,- special calculations.
Detailed information about the theoretical research on theLR-O reactor is not a purpose of this paper and a shortoverview was introduced only to complete an integralresearch activity on this facility.
periphery of both type - VVER-440 and VVER-1000 - as well.The precise physical model makes it, possible to obtain di-rect experimental estimation of some quantities for the po-wer reactors, such as fast neutron spectra at "crucialpoints", which are very important for a pressure vessel ra-diation damage estimation. The research programme will beclosed by elaboration of operational rules for VVER-440 re-actor operation with shielding fuel assemblies.
4. EXPERIMENTAL RESEARCH
Experimental and theoretical research in physics ofVVER-type nuclear reactors in last years has been concentra-ted on solution of the following problems:
- study of nuclear fuel utilization improvement, especiallyresearch of nuclear fuel with burnable poison,
- WER pressure vessel neutron exposure evaluation in thecontext with solution of problems concerning the pressurevessel life increasing,
- spent fuel storage investigation,- experimental research in space kinetics,
A research programme with the nuclear fuel containing gado-linium is aimed at- experimental verification of the influence of gadolinium-bearing fuel elements on fission sources distribution ina model reactor core,
- verification on an accuracy of computer codes andprogramme libraries for a description of WER cores con-taining fuel elements with burnable poison,
- obtaining a physical basis for safety analyses, with atendency to ensure a reliable manipulation of nuclearfuel containing a burnable poison in WER systems.
For WER pressure vessel neutron exposure evaluation the mo-del experiments have been performed with models of reactor
A research programme concerning the nuclear safety aspectsof the spent nuclear fuel storage of the WER-1000 type hasbeen closed recently. This programme has covered a series ofexperiments aimed at the obtaining of the physical founda-tion for nuclear safety evidence of nuclear fuel reposito-ries, based on the utilization of hexagonal absorption tubesfrom the boron steel with a minimum content of natural boronof 0.8 w%. The subcriticality greater then 0.95 Ik < 0.95)has been proved both experimentally and theoretically, evenwith fresh fuel of 4.4% enrichment and with pure moderator.The results of this research are realized in a compact spentfuel storage of our own conception, which covers the boronsteel production, the boron steel sheets rolling and theproduction of hexagonal absorbing tubes and storage con-struction system.
The LR-O is a versatile facility, where a wide spectrum ofexperiments with various kinds of light water lattices canbe performed. An experimental verification of an effect ofasymmetry of rhodium self-powered detector (SPD) could bementioned as an example of a nonstandard experiment.From Fis.6 it results that an emitter of the SPD is placed inthe fuel assembly asymmetrically with regard to the assemblyaxis. As the azimutal orientation of a channel with SPD isunknown, a systematical error in the interpretation of theSPD signal arises when such a SPD is placed in the gradientof the neutron flux. Both theoretical and experimentalresearch of this effect were performed and results were in-

self-powered detector
feed andcompensation 1inï
Fig. 6
ooooooOQOpOQOo7oo\oo/ooOOOOOOQO
" © © o ) ^DCDCOO\O / OXOOAooooooooo 00 o ooo/o o\oo/ooooooo
TFfïïIESL
volved in the software of the control system HINDUKUSH onthe NPP V-2 at Jaslovské Bohunice [1,2].
A brief description of the experimental arrangement:A gradient of the neutron flux was created in the centralfuel assembly by means of a water gap and neutron fluxdistribution was measured along the main diagonal in theassembly (Fig. 7). An effect of »symmetrical placementof an SPD emitter was estimated by means of the SPD responsein two opposite positions - in the maximum and minimum ofneutron flux. The orientation of the SPD was changed by re-mote control without changing the reactor output. Experimen-tal results were compared with calculation and a good agree-ment was chosen. This result enabled to confirm an analyti-cal expression which was derived for the dependence of anSPD-emitter activation on its eccentricity and on thegradient of the neutron flux (Fig. 8).
f-ig.ts>OOVO
Fig. 7 Experimental and calculated neutron flux densitydistribution in a fuel assembly with a water gap
4 [cm]
Dependence of the relative change of SPD responseon the SPD eccentricity (A) and on the gradient ofneutron flux density (k[%l)
REFERENCES
[11 0. HrazdilImpact of a. measuring channel asymmetry on the inter-pretation of a. SPD signal. (In Czech)UJV 8107 R, 1987
(21 O. Hrazdil, J.V, Ushakov, S.A. CimbalovExperiments with a model of the diagnostic fuelassembly, (In Russian)UJV 8304 R.T, 1987
[3] 9. Sochor, R. StaryThe experimental reactor LR-0 after five years'operation.Nucléon, A special issue. 1988
VVER REACTOR DOSIMETRY AND PRESSUREVESSEL EXPOSURE MONITORING
C. SVOBODA, B. OSMERANuclear Research Institute,Rez, Czechoslovakia
AbstractThe pressure vessel exposure is determined by means ofsurveillance neutron monitors ana by the ex-vessel monitoring.The dosimetry data of CSFR WER-440 reactor have beencallected in order to reevaluate them using the new IRDF-90cross section library. The PC experimental data base andthe evaluation programmes are described and discussed.
Introduction
The pressure vessel exposure is determined by meansof surveillance neutron monitors and by ex-vesselmonitoring The surveillance chains are equipment with Nb,Cu and 54Fe detectors (Fe for the 1st fuel cycle only) Theacceleration of the specimen (the ratio between fluxes inthe its position to the fluxes on the pressure vessel) isabout 10 and the last chain is pulled out afxer 5 fuelcycles
The present standard surveillance evaluationprocedure requires the fluence above 0,5 MeV with targetaccuracy 20 % This accuracy corresponds to thedetermination of the material characteristics changes withaccuracy better than 5 %
The neutron exposure evaluation is based on thefollowing data
- measured activity of tbe surveillance specimens monitorsand ex-vessel monitors
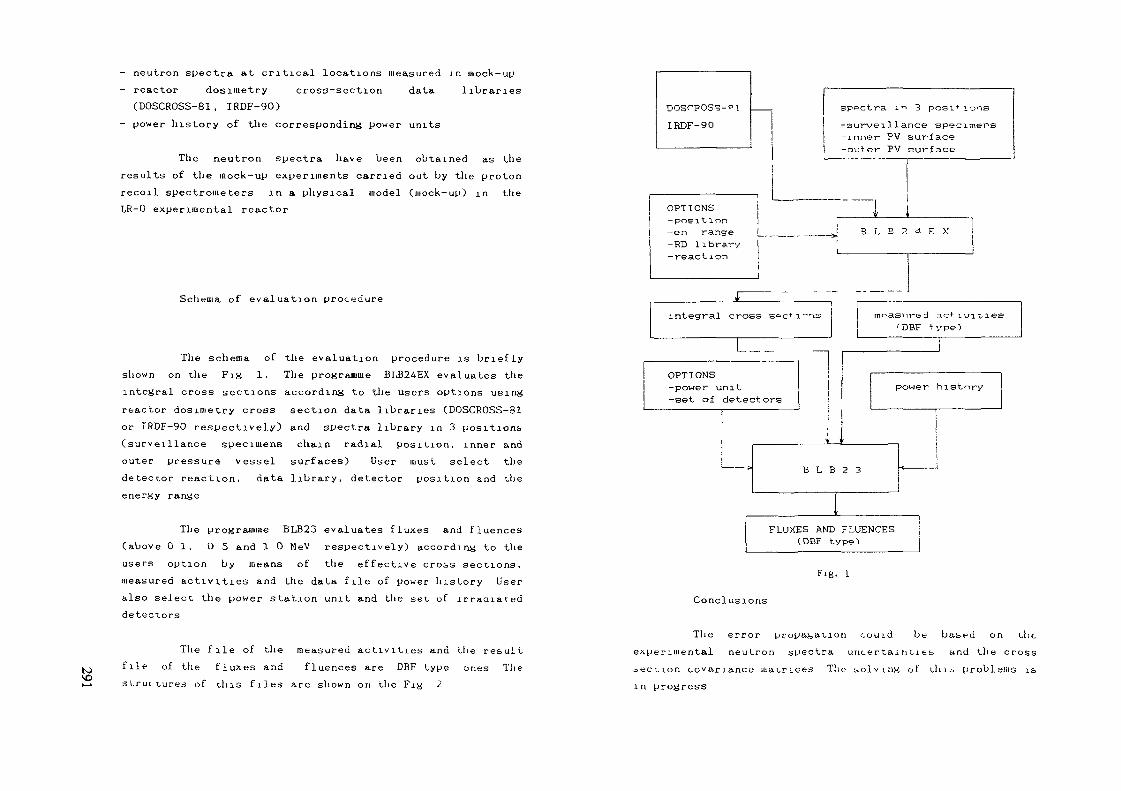
- neutron spectra at critical locations measured in mock-up- reactor dosimetry cross-section data libraries(DOSCROSS-81 , IRDF-90)
- power history of the corresponding power units
The neutron spectra have been obtained as theresults of the mock-up experiments carried out by the protonrecoil spectrometers in a physical model (mock-up) m theLR-0 experimental reactor
Schema of evaluation procedure
The schema of the evaluation procedure is brieflyshown on the FIK 1 • The programme BLB24EX evaluates theintegral cross sections according to the users options usingreactor dosi.iietry cross section data libraries (DOSCEOSS-81or IRDF-90 respectively) and spectra library in 3 positions(surveillance specimens chain radial position, inner andouter pressure vessel surfaces) User must select thedetector reaction, data library, detector position and theenergy ranse
The programme BLB23 evaluates fluxes and fluences(above 01, O 5 and 1 0 MeV respectively) according to theusers option by means of the effective cross sections,measured activities and the data file of power history Useralso select the power station unit and the set of irradiateddetectors
ultThe file of the measured activities and the resifile of the fluxes and fluences are DBF type ones The"'"""".res of this files are shown on the Fig 2
DOSrpOSS-PlIHDF-90
OPTIONS |L_ _______
spectra i *•» 3 posit Ons-surveillance specimens-inner PV surface-outer PV surface
] -positinn- en range-RD library-reaction
L E 2 •* E X
integral cross sec* i"" measured act iv/itiee'DBF type)
I____
OPTIONS-power unit-set of detectors
power history
B L B 2 3
FLUXES AND FLUENCES(DBF type.
Flg. l
Conclusions
i—k struc tu
The error propagation could be bated on theexpérimental neutron spectra uncertainties und the crossoection covariance uiatrLCes The solving of thio problems isin progress

tos Structure for database: C:\FOX\ZA21DU.DBFNumber of data records: luSDate o-f last update : 06/17/91
DecField Field Name Type1 RETEZEC Numeric2 DATUM Character3 MONITOR Character4 CAPS Numeric5 HMOTA_MG Numeric6 ACT_KBO Numeric7 FOI NumericS FO5 Numeric9 Fl Numeric10 FLUENCE01 Numeric11 FLUENCEOS Numeric12 FLUENCE1 Numeric
** Total **
Width I426*~4SQ
ll'l1010101010113
Structure for database: C:\FOX\1DUF.DBFNumber of data records:Date of last update : t>9/i>Field Field Name T"pe
1 h-Eititu Character2 STARTDAY Bate~ ENDDAY »ate4 EVALDAY »ate5 MONITOR Character6 CAPS Character7 HMOTNOST Numeric3 AKT I VITA Numeric9 FLLIENCE Numeric
** Total **
1 05r/"iWidth I1
oso227O
752
unbelievable exceptions which could be probably caused bythe impurities A0 concern chis detector, there are alaosome troubles with the integral cross section evaluationbecause the spectra were measured up to 10 MeV only and thecontribution above this energy is not negligible and anextrapolation is needed
Tlie different conclusion should be done for Nbdetectors, the DOSCROSS data provide evidently betterconsistency
Ref erence
Osuiera, B. , Holman, M Surveillance n e u t r o n aosiuietry and
cavi ty neutron f l u x monitoring at Czechoslovak VVER-440power reactors 7 Ui ASTM-EURATOM Symp on ReactorDosimetry , Strasbourg, August 1990
Fig. 2
Supposing the «lock-up spectra are the bestestimation of these quantities it is possible to test theconsistency of the measured reactions rates and thecorresponding cross section data We have compared theDOSCROSS-81 and IRDF-90 cross sections data libraries The93Nb(n,nO and 63Cu(n,alpha) dosimeter results for bothlibraries were compared with the 54Fe(n,p) result (dosimetrystandard, identical cross section in both libraries) Wehave found improvment of the detector Cu consistency for theouter PV wall position (for IRDF-90). Similar conclusion forthe surveillance position was obtained, but there are some
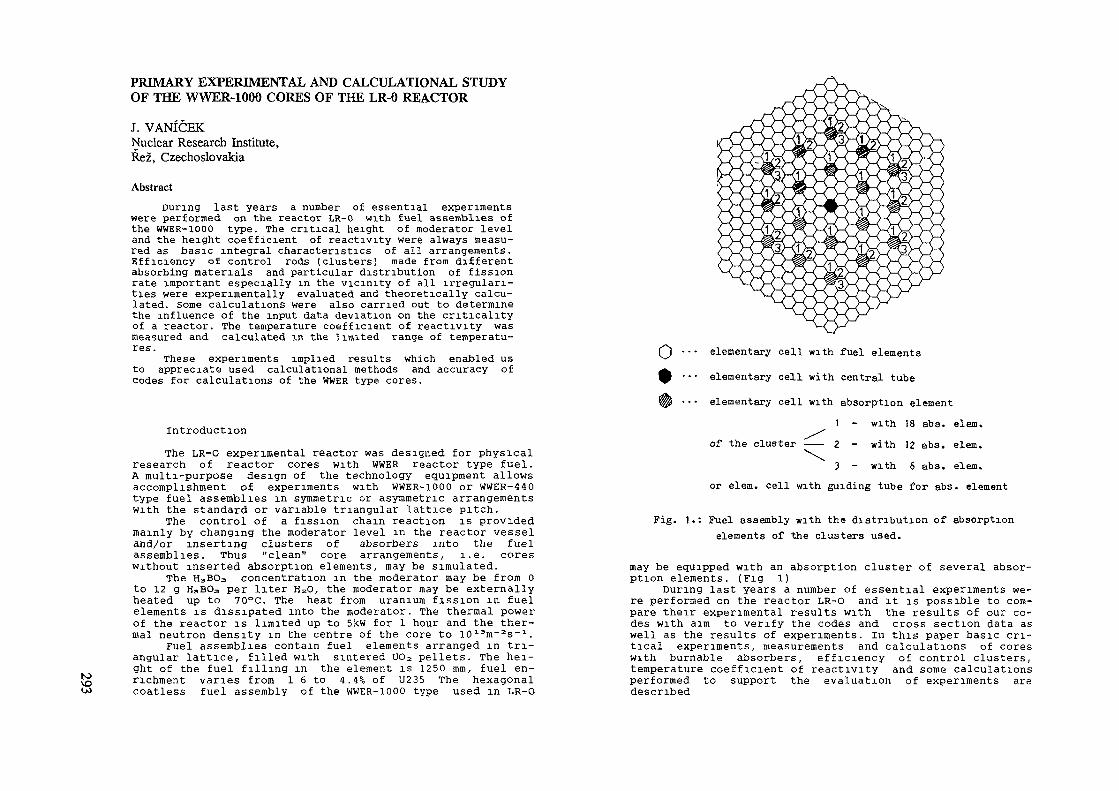
to
PRIMARY EXPERIMENTAL AND CALCULATIONAL STUDYOF THE WWER-1000 CORES OF THE LR-0 REACTOR
J. VANÏCEKNuclear Research Institute,Rez, Czechoslovakia
AbstractDuring last years a number of essential experiments
were performed on the reactor LR-0 with fuel assemblies ofthe WWER-1000 type. The critical height of moderator leveland the height coefficient of reactivity were always measu-red as basic integral characteristics of all arrangements.Efficiency of control rods (clusters) made from differentabsorbing materials and particular distribution of fissionrate important especially in the vicinity of all irregulari-ties were experimentally evaluated and theoretically calcu-lated. Some calculations were also carried out to determinethe influence of the input data deviation on the criticalityof a reactor. The temperature coefficient of reactivity wasmeasured and calculated in the 3imited range of temperatu-res.
These experiments implied results which enabled usto appreciate used calculational methods and accuracy ofcodes for calculations of the WWER type cores.
IntroductionThe LR-O experimental reactor was designed for physical
research of reactor cores with WWER reactor type fuel.A multi-purpose design of the technology equipment allowsaccomplishment of experiments with WWER-1000 or WWER-440type fuel assemblies in symmetric or asymmetric arrangementswith the standard or variable triangular lattice pitch.
The control of a fission chain reaction is providedmainly by changing the moderator level in the reactor vesseland/or inserting clusters of absorbers into the fuelassemblies. Thus "clean" core arrangements, i.e. coreswithout inserted absorption elements, may be simulated.
The H3BO3 concentration in the moderator may be from 0to 12 g H3BO3 per liter HZ0, the moderator may be externallyheated up to 70°C. The heat from uranium fission in fuelelements is dissipated into the moderator. The thermal powerof the reactor is limited up to 5kw for I hour and the ther-mal neutron density in the centre of the core to 10a3m-2s-1.
Fuel assemblies contain fuel elements arranged in tri-angular lattice, filled with sintered UO2 pellets. The hei-ght of the fuel filling in the element is 1250 mm, fuel en-richment varies from 1 6 to 4.4% of U235 The hexagonalcoatless fuel assembly of the WWER-1000 type used in LR-O
Q - • • elementary cell with fuel elements^ • • • elementary cell with central tube(P ... elementary cell with absorption element
1 - with 18 aba. elenuof the cluster —— Z - with 12 abs. elem.
3 - with 6 abs. elem.or elem. cell with guiding tube for abs. element
Fig. 1.: Fuel assembly with the distribution of absorptionelements of the clusters used.
may be equipped with an absorption cluster of several absor-ption elements. (Fig 1)
During last years a number of essential experiments we-re performed on the reactor LR-O and it is possible to com-pare their experimental results with the results of our co-des with aim to verify the codes and cross section data aswell as the results of experiments. In this paper basic cri-tical experiments, measurements and calculations of coreswith burnable absorbers, efficiency of control clusters,temperature coefficient of reactivity and some calculationsperformed to support the evaluation of experiments aredescribed

7 F.A. 19 F.A.
31 F.A.
0- Z i-3* - 4.4 %
Fig. 2.: Configurations of the LR-O coresand 31 fuel assemblies
with 7, 19
Other areas of research programme performed on the LR-Oreactor concerning spent nuclear fuel storages subcnti-cality investigation, space kinetics, experiments for WWERpressure vessel neutron exposure evaluation and experimentswith Gd poisoned fuel for WWER reactors are processedseparately.
Basic Critical ExperimentsMeasurements of basic physical parameters of the LR-O
reactor were realized on three fundamental configurationsof the core with 7, 19 and 31 fuel assemblies (Fig. 2)
at the physical start-up of the reactor. The critical stateof a given core arrangement is attained and successive powercontrol is performed by changing the height of moderatorlevel or by inserting clusters of absorbers into the fuelassemblies. A preliminary estimation of a critical heightof moderator level, height coefficient of reactivity andknowledge of cluster efficiency are necessary for prepara-tion of all experiments with different reactor core configu-rations.
The measurements of the critical height of moderatorlevel and of the height coefficients of reactivity were per-formed by an inverse kinetics method [1]. A special effectcaused by interaction of water with the surface of fuel ele-ments in the case of close lattice was recorded and quanti-tatively evaluated. The level of moderator in close proxi-mity of the fuel elements does not correspond with the mode-rator level measured with the moderator level meter and theshape (convex or concave) depends on the previous history ofa level movement, so that the special operational procedureand evaluation method were used.
Typical results of this measurement are shown in Fig.3,from where it is obvious and was also experimentally checkedthat there is a region of heights (width of span of about1.5 mm) at which the reactor can be critical. The actualcritical height must lie in this region and depends on theprevious history of a moderator level movement.
The next important effect was caused by dry latticeof fuel elements over the moderator level. The reactor"feels" the cluster practically when the lower end of thecluster is about 30 cm above the moderator level, when thelower end of the cluster touches the moderator level, theworth of the cluster is about 5% of the worth of the fullyinserted cluster.
The final results of the critical heights (H«,x») andthe height coefficients of reactivity for three basic confi-gurations are presented in Table 1 together with results oftheoretical calculations [2]. For the calculations of thesequantities the code Bfetislav [3] (solution of diffusionequations by finite-difference method with one mesh-pointper elementary cell) was used, the irregularities at theboundaries of fuel assemblies being taken into account.Four-group diffusion constants for all different elementarycells were prepared by the programme Microbe [4],
At all configurations the critical height (H==i=) ofthe moderator level was calculated including the reflectorsavings and the influence of a dry lattice (/aHo^io)Hc Ä i G — lio>«E> T" Z\ H.«: OL 3. cr *
With the help of a perturbation theory the height coef-ficient of reactivity C>p /2H was found
The difference of the calculated critical height HQ„ICand the measured height HeJ<i. increases with decreasinga critical height. To make the thing clear it will be ne-cessary to find extrapolation distances experimentally forall cores and to involve spacing grids material in calcula-

100
50
-50
co J
H f ma3*2—r——'——itr
The measurement of the height coefficientof reactivity
tions. Agreement in experimental and calculated values ofthe height coefficient of reactivity is good.
Calculations of the effect of a fully inserted clusterinto the central fuel assembly on core criticality were alsoperformed for each core. The results (K^tt for core with in-serted central cluster, an estimation of critical heightHole (incl. AHooi=) , and the worth of cluster) are shownin Tab. 2 together with the experimental worth of clustersmeasured by an inverse kinetics method.
CJ l->h-i \û -J
o o ovo ^o \oCO --J >£*O ID ~-len o oo
»-»ji en *>CO CO Co.ISJ CO CO
>-» i-j enOl M5 H»~J 00 Wcn eo w1+ 1+ i+en en toCO CO CO
ro
M N) enCD O OO CO <Tii-» en co
+ -t- i-j en M4^ H* to
«1 Z 0• O O> n• O (D
Hi
*y-ll >
9ttI»
toVIrt K
i— • H- I)n 3 a3 B> H-— rt o
ID&
MXo >d
Hi (Di—1 H•Ü 0 H-0 H-33 C -^ tn
rt S(D O•1 >-!
rt&•
nO BJMl I-1
o•— ' O •tl !-•0 d 5S 0) oi— * rt i-f
(D rtn v
ßi öo a roHI pi ^H
n (D tuH1 X rtC tJ HM 0) Ort if a(t> •n o
S Hlo•— i l-l Oo\° rt B>- D" !-•
O
OJo-
aHlMc;(Dao(B
p)Hi
f-Jf-<•<
(D»-irt(Dp-
rt(B
H-prtO
rtif(D
o(Dart^DI
0>toui(Bger
Co t-1M U3 ^J
N> CO O^CO .£> H-1
00 CO -Jh-1 0% Oï
(p. Jit -Jt-> o roo ro tvjo -J ffi
--J >t> O
^ U) (Jl\D I-1 O
VX> Ul *-*cn co ONCo to vo<JÎ -4 M1+ H- H-H* m ooch
vo en h-1<y\ co oo-J h-» CO
CO CO CD
1 + +o ÛD Jt-i »c» y>
^ 2: o• 0 0> M• o n>
hh
TT 03 X
v__, f H
"0" (1S 1| —— H
0
>O 03 »
(1
"— i (D•a x çjxo -O-S?3 m a•^ i v.O H Cv>
E?^
3p/d
Hc
alc
ul .
[pcm/cm
]
rj>0 S)<y MI mQ H->. 0 B>Vj B> rt^cT'— . p,oV (D" a> <
p. o>rt
X O•d a
1-3B)tr
&
ooroHlHlH-OH(Ü£3rt
OHl
Ort
rt•<
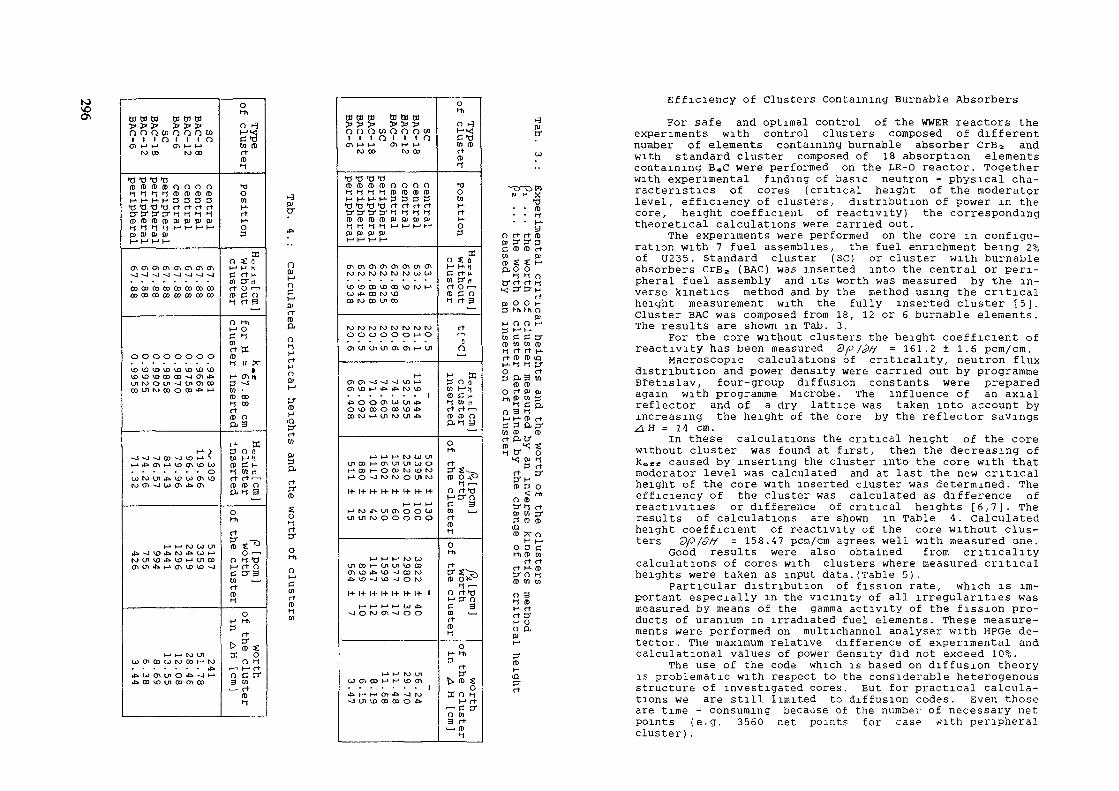
(O
OJ W 03 Cd CO to» > > > >o o o c n n o n wi i i n i i i o<T1 M M Ol I-* f-1
K) 00 FO 00
TJ T3 "Ü *ÖC D I B I B I D O r i O Ol f l f f l f ( B ( B ( B I BP - H - P - H 3 3 3 3'O'd'd'O rt rt ft rtCrS'S'S'i-Iiff lf( B O ) ( B < B P ) D J P J P >tflflf'-JI-'l-'l-'H'DJ PJ OJ Q)H-1 t-1 (-" H1
CTlChO^CT iC^CJ lC f lC^
O O O O C O C O O O O O C O O OO O C D C O O O C O C O C O O O
o o o o o o o oU > U Ï U 3 V Û \ O \ Û U 3 ^ ÛV O » £ > U 5 0 D C O ~ 4 C ! t e «UlloOLn-~]U!C100couirocoooo**!-1
M ?-~I "JvJt t>~J\OI-* s
i-»»P»crvt-1uJ<n'£)W
O)NlUlrf i \£J<jJCrvU3ro cri ~J to a\ *> <n
l-1 l-1 IM O3 Ul4*~~}l0£»tvJt£»Ci) l - troCny3«P><0*-1( / i03OlC14»h- iaikuU3-J
t-1 f-i !\> CJ1COO1UOtOI \ )OOt - t M
t t *LJO%uiO*>-4l- '*» CO VO Ul 00 Ol CO
Typeo
f clu
ste
rP
ositio
n
XO S (1h-1 H I)
rt O i—i(P P 0if rt S
O Mll-i OC f0)rt KIP C
..f=
67
.88
cm-
inserte
d
H- Xs o n01 l-niIP C H-
rt rt'-'(t> (B Ofi if 3
OMl
rtl^
O i—ia if -dl-1 rt oC tT30) i—rtIBi-i
OH Hi3 rt
0 rost£ 0
O f
o c crg 01— rt
IBif
PJer
n&
rtIBa-
rtHo01
cr(B
O
rtV
e.01rt(Bif01
CO 00 DO W Gü tö» > > > >n n o c n o o o w1 1 1 O 1 1 1 O
O\ M l-> O% h-> t-*W 00 K> 00
*0 *O *O *0( B I B I B I B O O O Oi f > f i f > i i B n i ( B < BH H - H - H - 3 D 3 3'dtJ'O'U rt rt rt rtCrtf tr S-f f f fi B ( B O D ( D p i o > p i 9 >01 0> QJ 0)h-1 l-1 H • M
en i o1! o^ (ri rji o> crir s i h j N i w w r o w wU 3 U 3 C O V Û C O V Û W V - *w ift» oo ro \uco ro oo (-n o>
N>N)rots)N)MNiroO O O O O O h - > O
OlUlU1(JiChO*H*Ul
t-ten en ^J ~J --J vo t-*CTl <£> t~» ift» *» M yD
»p> o o en ui vi *»O U> 00 O CO VO if>oo w t-* en to (ji rf*
l-i M l-* M UJ Ul(JICOMCJIUIUIGJOv - ' O O h ^ O O O t o U Ï Mt ^o - ^ iw roou t to
H-I+H-H-H- I+H-H-
M ^ Mi - i ro iJ>cncT>oowcnu i r^ooooo
»-* M M M WUl CO I-» Cn Ln VO 00en us it» \O -J CO fsJ*> *a <i vu --a o IM
1+ 1+ 1+ H- H- 1+ 1+ 1
F-* I-» l-1 M CO if»~-l O N) O* --J O O
>-* h-* N) Lnco cn oo i-» i-* U3 cn
•£• t-1 h-1 O1 t£> J Ni-J Cn tu 00 CD o ip*
Typeo
f clu
ste
rP
ositic
3
o S oM P- rçC rt ^
rt O r-,m c o•1 tt 3
rt
n
P X3 0 n« M»
i-! to rtrt et —(D (B Op, f 3
Ol-h
rtÖ1«-^® O^f->
ff .— ,0 rfOH" D'0c gm ^^rt(DifOt-h
rtP"*"^(B OK"'
•f "O <t-oMp- 0P 301 ! ———
rt(Di-J
OH- HlO
rt
t> (B Ssrthclu
ste
rH
[cm
]
X•d(B
gn rt rt (Bpi 31 3- 3£ IB IB et
ro S S Mp, o O
f f ner et rt if*< 31 3* p
rteu O O H3 Hi Hi o
01H O O. H*3 !-• I—01 c c er(0 01 01 CBif et rt H-rt (B (1> tQH- f if B"O rt3 P. 3 01
IB (DO rt eu pjHi <» 01 3
f C O,O 3 fHI H- (B rt
CO (B (Brt p. Cr
•f tr o*< OJ If
3 et
(B 3 O< Mi
O IB3" f rt91 01 er3 (B (BkQ<B ?r o
H h-"o 3 c:Hl IB Öl
rt rtrt K IB31 O >f(D W 01
n 3if (BK- rtrt erH Oo n,
p-IBH
Efficiency of Clusters Containing Burnable AbsorbersFor safe and optimal control of the WWER reactors the
experiments with control clusters composed of differentnumber of elements containing burnable absorber CrB2 andwith standard cluster composed of 18 absorption elementscontaining B«C were performed on the LR-0 reactor. Togetherwith experimental finding of basic neutron - physical cha-racteristics of cores (critical height of the moderatorlevel, efficiency of clusters, distribution of power in thecore, height coefficient of reactivity) the correspondingtheoretical calculations were carried out.
The experiments were performed on the core in configu-ration with 7 fuel assemblies, the fuel enrichment being 2%of U235. Standard cluster (SC) or cluster with burnableabsorbers crB2 (BAC) was inserted into the central or peri-pheral fuel assembly and its worth was measured by the in-verse kinetics method and by the method using the criticalheight measurement with the fully inserted cluster [5].Cluster BAC was composed from 18, 12 or 6 burnable elements.The results are shown in Tab. 3.
For the core without clusters the height coefficient ofreactivity has been measured Qp /2n = 161.2 ± 1.6 pcm/cm.
Macroscopic calculations of criticality, neutron fluxdistribution and power density were carried out by programmeBfetislav, four-group diffusion constants were preparedagain with programme Microbe. The influence of an axialreflector and of a dry lattice was taken into account byincreasing the height of the core by the reflector savingsA H = 14 cm.In these calculations the critical height of the corewithout cluster was found at first, then the decreasing ofk,,** caused by inserting the cluster into the core with thatmoderator level was calculated and at last the new criticalheight of the core with inserted cluster was determined. Theefficiency of the cluster was calculated as difference ofreactivities or difference of critical heights [6,7]. Theresults of calculations are shown in Table 4. calculatedheight coefficient of reactivity of the core without clus-ters dpI3H - 158.47 pcm/cm agrees well with measured one.
Good results were also obtained from criticalitycalculations of cores with clusters where measured criticalheights were taken as input data.(Table 5).
Particular distribution of fission rate, which is im-portant especially in the vicinity of all irregularities wasmeasured by means of the gamma activity of the fission pro-ducts of uranium in irradiated fuel elements. These measure-ments were performed on multichannel analyser with HPGe de-tector. The maximum relative difference of experimental andcalculatlonal values of power density did not exceed 10%.
The use of the code which is based on diffusion theoryis problematic with respect to the considerable heterogenousstructure of investigated cores. But for practical calcula-tions we are still limited to diffusion codes. Even thoseare time - consuming because of the number of necessary netpoints (e.g. 3560 net points for case /Jith peripheralcluster).

Tab. 5.: Calculated ke£ï of configurations with cluster in central fuelassembly for measured critical heights of cores
Configuration
Ha^cm jK-fsff
without cluster
630.9930
BAC- 18
119.4440.9999
BAC- 12
92.5950.9978
BAC -6
74.382
0.9946
to
sensibility AnalysisIn some experiments which were repeated with different
fuel assemblies but with the same number of fuel assembliesof the same nominal enrichment of uranium (i e. with the sa-me type of fuel elements) in the core, some deviations incritical height were found. To reveal the reason a number ofexperiments and calculations were performed to verify theinfluence of technological tolerances and input data devia-tions on neutron-physical properties of fuel assemblies.
In these experiments always one central fuel assemblyout of the collection of 18 assemblies investigated wassuccessively inserted into the ring-shaped core compoundof 6 assemblies with an enrichment of 2% and the influenceon the core reactivity was studied
Experimental dependence of the critical height on thefuel enrichment was formed by using data from the fuel cer-tificate. Another experiment was performed where certainnumber of fuel elements with 2% enrichment in the centralassembly were replaced by fuel elements with 3% enrichmentand nonstandard mean enrichment in the central assembly wasreached.
To find out the influence of the enrichment deviationby theoretical way, the possibility of calculations withnon-standard enriched fuel, for which diffusion constantswere not calculated in advance, was included into the pro-gramme Bfetislav.
Obtained dependence of the critical height and of reac-tivity on fuel enrichment showed, that the mean reason fordifference in nuclear qualities of the fuel assembliesinvestigated is their difference in the U235 content. How-ever, some fuel assemblies showed another deviation in re-activity than would correspond to the fuel certificate dataand further investigations had to be done.
To separate the influence of temperature the tempera-ture coefficient of reactivity was calculated. The influenceof a water gap between fuel assemblies, the influence of thecladding tube diameter deviation and that of fuel densitywere also contemplated. This sensibility analysis is veryimportant for better understanding of technological tole-rances influence on neutron-physical properties of fuelassemblies.
The Temperature Coefficient of ReactivityThe influence of possible unequal temperature of the
core on the reactivity when experiments were performedsuccessively was determined in the range of temperaturesfrom 18 to 32 °C both calculationally and experimentally.Further reason was safe operation of a reactor with insertedabsorption elements, it was necessary to verify thatthe temperature coefficient is not positive.
Calculations were made for temperatures 20, 25 and 30°Cfor two arrangements of the core with seven fuel assemblies.First core (Cl) without absorbers had critical height61.23 cm, second core (C2) contained in each of 6 peripheralfuel assemblies 13 inserted absorber rods so that the criti-cal height was increased up to 103.83 cm [8]. The fuel en-richment was 2% of U235 in both cores.
Calculated values of the temperature coefficient of re-activity are presented in Table 5 from where it is possibleto see that the temperature coefficient of the LR-0 core isin the interval of temperatures considered negative and thatit remains negative for core with inserted absorbers aawell [9].
These theoretical results were very well confirmedexperimentally [8]. For core C2 the mean temperature coeffi-cient in the temperature interval 18 - 28 ""C has oeenmeasured c>pldt = - 12.65 ± 0.67 pcm/ "'C, for the core Clexperiment was not performed but for the core where the cen-tral fuel assembly in core Cl was replaced by fuel assemblywith 4.4% enrichment has been measured in interval of tempe-ratures 18 - 32 "C dp/dc - - 11.53 r 0.42 pcm/°C. Thesevalues are in good agreement with calculated ones.
ConclusionIn this report several experiments performed on the
LR-0 reactor were described together with brief mention ofcalculational methods used for theoretical determination ofbasic characteristics of the core, calculational and experi-mental results were always compared which enabled us to ap-preciate used calculational methods and cross section data,
Tab. 6.: Temperature coefficient of reactivity in pcm/"c
Core
Cl
C2
Temperature interval f°C]20 - 25- 10.2- 12.5
25 - 30- 12- 14.3
20 - 30
-11.1- 13.4
to\o00accuracy of codes for calculations of the WWER type coresand credibility of experimental results as well
The results of comparison drew our attention to what isnecessary to calculate with moie precision, what is possibleto neglect and on the contrary what requires to be takeninto account This information was always included infurther calculations to improve their accuracy
COMO: A CORE MODEL FOR PARAMETRICFUEL CYCLE COST EVALUATION
H MOLDASCHLSiemens AG/Unternehmensbereich KWU,Erlangen, Federal Republic of Germany
ReferencesRypar V., Hudsc F., Svoboda a The Results of the Ba-sic Experiments on the LR-0 Reactor Report UJV 6885-R,Re2 1984, (in Czech)Vanieek J . Calculations of Criticality and NeutronFlux Distribution of Selected LR-0 Cores foi ReactorStart-up and Design of Experiments In Results ofResearch on WWER-1000 NPPs, cSVTS ZES, k p âkodaPlzen, Plzen 1984, (in Czech)Lelek V. Finite-Difference Code Bfetislav for Calcula-tion of a Reactor in Hexagonal GeometryReport UJV 7771-R,A, Re2 1986, (in Russian)Zalesky K.. Programming Handbook for Microbe-02 Code toCalculate Local Burn-upReport UJV 6880-R,A, Re2 1984, (in Czech)Svoboda fi., Hudec F.. Experiments on the core contai-ning Absorption Elements of the WWER-1000 Type.Report UJV 9221-R,T, Re2 1990, (in Czech)VaniCek J., Vrba L. Macroscopic Calculations of theReactor LR-O Cores with Burnable AbsorbersReport UJV 8870-R, Rez" 1989, (in Czech)Vanicek J. et al. A Study of Neutron-PhysicalCharacteristics of the WWER-Type Cores with AbsorbersReport UJV 9159-R,A, Re2 1990, (in Russian)Hudec F et al • An Experimental Verification of PhysicalIdentity of WWER-1000 Fuel Assemblies on the ReactorLR-0 Report UJV 8879-R,T, ftez, 1989, (in Russian)Vaniöek J. The Temperature Criticality Coefficient ofthe Reactor LR-OReport UJV 8867-R, Re2 1989, (in Czech)
AbstractMany of the technical and economic features of a nuclear plant are cross coupled and partiallynonlinear Thus, when calculating energy costs the complete set of all influences should be consideredWhile complex comnuter programs can >*~.prove precision for design, Ihev do not necessarily fosterunderstanding of fundamental mterreldtionb
Therefore a rather simple plant model based on existing results and experiences is under preparation,which considers all important design parameters and process variables
Since fuel expenses are an important component of total nuclear power costs, the first module of theabove mentioned code deals with the core and the fuel cycle A set of examples is given
1 Problem description
Fuel expenses are an important component of nuclear power costs In fact, since costs can be reduced byimproving both fuel cycle technology and fuel design during the lifetime of a plant, the analysis of fuelcost is of continuing interest to the electric utility, whereas fixed charges of the plant do not changeafter the plant has been built The primary objectives have to be to identifiy the principal costcomponents and to examine how they are affected by changes in the reactor design
The technical and economic features of a nuclear power plant are defined by a lot of technicalparameters and system variables Many of them are cross- coupled, and there are several nonlinearparameters among them Therefore the analysis of the fuel cycle expenses is complicated, however,since a number of operations are involved and economic factors are sensitive to burnup as well as tonumerous financial and process variables
The energy cost component attributable to the fuel can be determined in principle by sophisticatedcomputer programs,, which include the fine structure of present worth and other second order effectsBut as in so many other fields of endeavour, complex computer programs sometimes cumbersome andslow are normally used to carry out state of the art design calculations While this improvesprecision, U does not necessarily foster understanding and ability to integrate it into optimizationprocedure
Thus there ib a chance as well as the necessity for simpler models describing nuclear power reactorbehaviour ma very fast way by the aid of personal computers or work stations Those methods are veryuseful for illustrating the principles involved and the influence of changes in design parameters and atleast can also be used within optimization procedures based e g on the method of steepest descent or ona trial and error strategy
2 Core Model
At Siemens KWU there is a plant model under development (Fig 1). consisting of several modules-which can describe all important systems and processes, influencing economy The first module ofthem is the core module which will be described herein

I nstrumentation and Control
to
Systems — )
Pressurtzer
1»• Reactor
1 I
Steam Generator
rage
Fuel Cycle;
Final Storac
U1Pump
e 4- Recycling FA Fabrication
1Pump
CoolingSystems
Civil
Fig 1; COPAS: Principle schedule
Durmg the last decades of reactor design and operation a large amount of knowledge has beencollected as an available data base Those date stam from many design calculations, formerlyperformed with very sophisticated tools We fitted them while we employed our knowledge aboutreactor physics By that we can calculate all parameters which mainly influence fuel cycle costs, e gbatch burnup, reload enrichment, fuel cycle length and load factor under boundary conditions, forexample given by waterside corrosion or RPV fluence
2.1 Input table
All parameters and process variables which are necessary to perform quantitative relevant results aretaken into account The input table contains
Fuel assembly (FA) data
Core data
RPV data
Operational data
Economic data
active core height, FA type, number of rod positions, number ofguide tubes, pitch, rod outer diameter, thickness of the cladding,fuel density etcnumber of FA or maximum outer radius of the core, position ofcontrol assemblies (CA)
thickness of the shroud, size of the core barrel si/e of the RPV
thermal and electric reactor power, load factor, operation modeof the reactor (U or Pu, with or without reprocessing), fuelshuffling charactenstmg reload burnup/cycle length/batch size
2.2 Output table
The output table contains the following variables and parameters of the core
Geometry, masses
Average thermodynamicvalues
Neutron physics
Fissile mass balance
Fuel cycle and energy cost
number of FA if maximum radius of the core is given,moderation ratio with and without CA, FA width over flats,mass of heavy metal m the FAlinear heat rate, heat flux, rating
neutron fluence at the RPV, reload burnup/cycle length/batchsue, fissile mais recovery rate, reload enrichment, watersidecorrosion oxide layer
inventory, mass flow
3 Description of important modules
3.1 Geometry, average thermodynamic values
A module calculates the maximum number and pattern of fuel assemblies from the maximum radialdistance Rmal of the outermost FA edge in the core given (Fig 2) and the most commonthermodynamic values, like the average linear heat rate, the heat flux and the fissile material rating
plant investment, naturalreprocessing, waste disposal
uranium FA fabrication,Fig 2 Determination of the FA Pattern
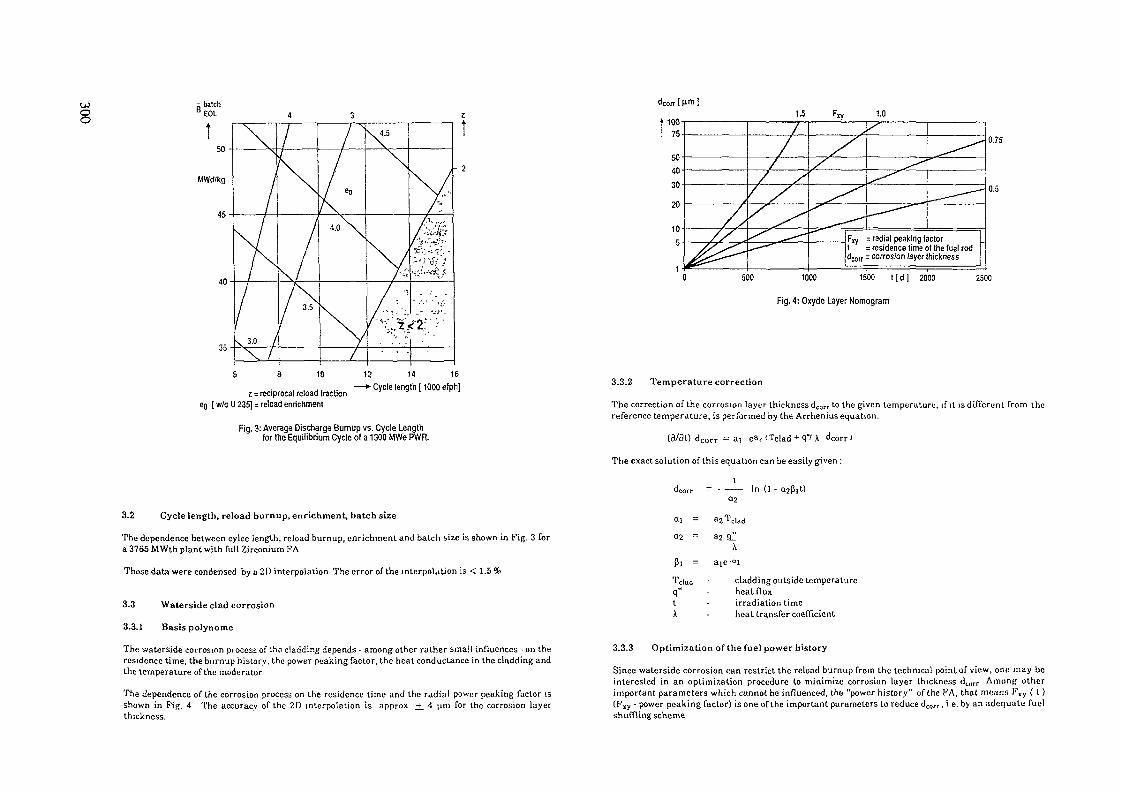
-balchBEOL
50
MWd/kg
45
40
353.0
7
3.5
7
4.0
4.5
- 2
6 8 10
z ± reciprocal reload traction[ w/o U 235] = reload enrichment
12 14 16-»-Cycle !ength[ 1000 efph]
Fig. 3: Average Discharge Burnup vs. Cycle Lengthfor the Equilibrium Cycle of a 1300 MWe PWR.
3.2 Cycle length, reload burnup, enrichment, batch size
The dependence between cylce length, reload burnup, enrichment and batch bize is shown in Fig. 3 fora 3765 MWth plant with full Zirconium KA
Those data were condensed by a 2D interpolation The error of the interpolation is < 1.5%
3.3 Waterside clad corrosion
3.3.1 Basis polynôme
The waterside corrosion process of the cladding depends - among other rather smai) influences - on theresidence time, the burnup history, the power peaking factor, the heat conductance in the cladding andthe temperature of the moderator
The dependence of the corrosion process on the residence time and the radial power peaking factor isshown in Pig. 4 The accuracy of the 20 interpolation is approx ^f_ 4 urn for the corrosion layerthickness.
• 10075
504030
20-
15 1.0
= radial peaking factort ' = residence time of the fuel roddco,r = corrosion layer thickness
0.75
0.5
500 1000 1500 t [ d ] 2000 2500
Fig. 4: Oxyde Layer Nomogram
3.3.2 Temperature correction
The correction of the corrosion layer thickness dcorr to the given temperature, if it is different from thereference temperature, is performed by the Arrhenius equation.
(3/80 dcorr = aj e»; <Tclad + q"/ A dcorr>
The exact solution of this equation can be easily given :
1
02
O.J = 32 Tcla(j
°-2 ~ ^2 Q"
In (1 - Q2pit)
pi =
Tciadq"tÀ
Xaic-°i
cladding outside temperatureheat fluxirradiation timeheat transfer coefficient
Optimization of the fuel power histor

Normalize FXy{t)
TEOL
TEOI TBOL J Fxy« dt = iTBOL
TEOLf d\ — dcorr (F»y(t) t)dt =J dt
TBOL
Example for Fxy(t)
Shake Fxx(t)Fxy«=>Fxy(t) ± AFxy(t)AFny (t) = statistical variation' xyw J$L Fxy max
yes
Fuel Load History t
Fxy power peaking factor
Fig 5 Minimization Procedure for the Oxide LayerThickness by Optimizing the Fuel Assembly LoadHistory
4 Calculation of the Rl'V fluence
The dependency of the RPV fluence from the thickness of the shroud, the water gaps between bhroudand core barrel and the core barrel itself (see Fig 7) can be calculated using the results of existingMonte Carlo calculations for several geometries The following approximative equation for theshielding effect was established
<1>RPV 4——— = exp ( E b, Ax, )4>Core i = 1
b, constants
The error of the estimate compared to a precise calculation is smaller than 10 %
5 Results
Fig 8 shows for example the fuel cycle cost (FCC) for 5 cases (reference case and 4 variations) as afunction of the parameters
core heightnumber of fuel assembliesfuel assembly type
One should mind that changes of one of these parameters cause changes of several others, as it isshown in the table
Comments to the results (referred to the reference case)
Variation 1 Reduction of the core height
The linear heat rate and the heat flux increase, as a consequence also the corrosionrale and the RPV fluence do, the reload enrichment requested to gam the givencycle lenght is higher than in the reference case, also is the reload burnup, despitethe fact that due to the higher enrichment effort the specific fuel cost increase, thefuel cycle cost decrease since burnup is enlarged and fissile mass inventory issmaller
Since the problem is of the functional kind and the basic corrosion behaviour as well as the Arrheniusequation for the temperature correction are highly nonlinear, we developed a stochastic optimizationprocedure to do the job we called it "Shake procedure", since the basic idea is to shake the FIy function,which is to be optimized, by a stochastic variation around the actually best solution, as long as thefunctional value, i e the corrosion layer thickness dcorr decreases (Fig 5)
TEc &0 atTA
»rr(FXy(t))dt = drorr = Mm'Fly(t)
Two examples for such an optimization procedure are given in Figs 6a and 6b, for two different upperlimits for Fxy(t)
Variation 2 Knlargment of the FA cross section. FA number reduced
Only the HPV fluence will be increased markedly due to the more protruding core
Variation 3 Smaller number of FA
This case is similar to variation 1, but the FCC and the RPV fluence arc markedlyreduced, unfortunately at the expense of waterside corrosion layer thickness
Variation 4 Less FA with the same FA cross section and reduced core height
Compared to variation 3 the FCC are reduced at the expense of clad corrosion as itwas for variation 3

g SHAPE Procedure far Fuel Shar n.g Qp t iSIEMENS KWU V231 iC> M. Moidacchl O"*
JS - iteration numbeiF.:y — power peat ing factorSP - I- ind o-f shuffling £ *1 aut-uSS - corrosion layer thicl nessCyc 1 e Number = 5Residence t imes TA - in ,
Fxy
TE - out
SP
MAXTATE
14567
11121620212226293134414751566170757680859210510812Î140141267274303485558633766
1.00,0
250
0.81,0.87,0.93,0.98,O.98,0.98,l.OO,O.97,0.99,O.99,0.99,l.OO,1 . OO ,0.99,l.OO,l.OO,l.OO,1 . OO ,l.OO,l.OO,l.OO,l.OO,l.OO,l.OO,1.00,l.OO,l.OO,l.OO,l.OO,l.OO,1.00,l.OO,l.OO,1.00,1.00,l.OO,l.OO,l.OO,
1.
1.o.1.1.1.1.1.1.1.1.1.l.1.1.1.1.1.1.1.1.1.
.
.
1.1.1.1.1.1.1.1.1.1.1.
20,250SOU
01,97,02,03,O4,04,04,09,09,11 i14,13,13,15,14,15,16,16,17,17,17,18,17,17,18,18,19,20,19,20,20,20,20,20,20,20,20,20,
1.30,500750
1.O9,1.06,1.06,1.04,1.09,1. 16,1.17,1. 16,1. 15,1.14,1.13,1.12,1. 12,1.11,1. 10,1.11,1.11,1. 10,1.11,1. 12,1.11,l. 11,1.11,1. 10,1.10,1. 10,1. 10,1. 10,1.11,1. 1O,1.10,1. 10,1. 10,1. 10,1. 10,1.09,1.09,1.O9,
1 . 20 ,750
l.OOO1.O4,1.O4,1.00,O.90,0.92,0.88,0.93,0.91,0.89,0.89,0.87,0.87,0.88,0.8B,0.8B,0.87,0.87,0.87,0.86,0.86,O.86,0.86,0.97,0.87,0.87,0.87,O.B6,0.86,O.B6,O.86,O.B6,O.86,O.86,O.S6,O.87,O.87,0.87,0.87,
1.1 ,1,1.1.O.1.O.o.0.o.o.o.o.o.o.o.o.o.o.o.o.o.o.o.o.0.o.o.0.o.o.o.o.o.0.o.0.o.0.o.
20,ooo250
06,07,99,06,98,94,86,87,87,87,87,88,87,87,88,87,87,87,B6,86,B6,85,85,86,86,85,85,84,84,84,B5,84,84,84,84,84,84,84,
O.OO,O0
0.00,O.OO,O.OO,O.OO,0.00,0.00,O.OO,0.00,0.00,0.00,O.OO,O.OO,0.00,0.00,0.00,O.OO,O.OO,O.OO,O.OO,O.OO,O.OO,O.OO,O.OO,O.OO,O.OO,O.OO,0.00,O.OO,0.00,0.00,0.00,0.00,0.00,0.00,O.OO,O.OO,0.00,O.OO,
o.o.o.0.0.0.
68,66,54,50,46,42,
0. 37 ,o.0.0.o.o.0.o.0.0.0.0.0.0.0.0.0.0.0.0.0.o.0.o.o.o.0.o.
37,35,34,33,33,33,33,33,32,32,32,31,3O,30,30,30,30,30,30,29,29,28,28,2S,28,28,28,
O.28,0.o.o.28,28,29,
75.2174.3464.4163.4559.8458.7456.4756.2254.6253.9753.2853. 1753. O452.7852.7052.5052.2452.2152. 1251.8851.8651.8151.7451.6151.5451.2751.17
• 51. 1O51.0250.9250.8950.8450.8450.7950.7750.7650.735O.68
Optimization of a Fuel Shuffling Scheme by SHAKE
SHAKE Procedure -for Fuel Sharing Opt imi zat ionSIEMENS KWU V231 <C> H. Moldaschl 07.91
JS - iteration numberF>:y - power peal ing factorSP - kind of shuffling £ -1 out-in, Q in-out_SS - corrosion layer thiclnessCyc1e Number = 5Residence times TA ~
Fxy
TE - out
SSCMm3
MAXTATE2112l22232429303233374149SB616?70768O1071161441341571741771791952372432492522642672693O341S45S46163365767569O792801838022
0.
0.0.o.0.o.o.o.o.0.o.o.0.o.o.o.o.o.o.o.o.0.o.o.0.o.o.o.o.o.o.0.o.0.0.0.0.0.0.o.o.o.
90,o25O
88,SB,88,88,86,84,84,86,86,87,85,85,89,89,89,90,89,90,90,90,90,90,9O,9O,90,89,9O,9O,90,90,9O,89,9O,9O,9O,9O,9O,9O,90,9O,9O,
0.9O,O.9O,0.0.0.0.
9O,90,9O,90,
1
11111111111111111111111111111i11111111111111111
.20,25O5OO
.03,
.03,
. 10,
.19,
. 18,
.18,
.19,• 17,.17,.15,• 17,.20,.20,.19,.20,.19,.20,.20,.20,.19,.20,.20,.20,-2O,- 19.-2O,• l9,.20,.20,.20,.20,.20,.20,.20,.20,.20,.20,.20,.20,.20,.20,.20,.20,.20,.20,.20,.20,
1.30,500750
1.O1,1.10,1.05,1.O3,1.O4,1.O8,1.O9,1.13,1.14,1. 13,1.14,1. 16,1. 17,1.15,1.16,1.15.1.15,1. 14,1. 13,1.14,1.14,1.14,1. 14,1.14,1.14,1.14,1. 13,1.14,1.14,i . 1 4 ,1.14,1.14,1. 14,1. 14,1. 14,1. 14,1.14,1. 14,1.14,1. 14,1. 14,1. 13,1.13,1.14,1.14,1.13,1.13,
0.90,750
1 , 000
O.89,0.85,0.83,0.76,0.79,0.81,0.82,0.82,0.82,0.85,O.B7,O.83,0.81,0.83,0.83,0.83,0.83,0.84,0.84,0.84,O.B4,0.84,0.84,0.84,O.85,0.85,O.86,0.85,0.85,0.36,0.86,0.86,0.86,0.87,0.86,0.86,O.87,0.87,0.87,0.87,O.B8,O.88,O.B8,0.88,0.88,0.88,0.88,
1.20,1,0001 , 250
• 19,• 14,.13,.14,.12,. 10,.06,.02,.00,1.00,O.97,0.95,0.93,0.94,0.93,0.93,0.93,O. 93,0.93,0.93,0.93,0.92,0.92,0.92,0.92,0.92,0.92,0.91,0.91,0.9Î,0.91,0.90,0.90,0.90,0.90,0.90,0.90,0.90,0.89,0.89,0.89,0.89,0.89,0.88,0.88,0.88,0.88,
0.00,00
O.OO,0.00,O.OO,O.OO,O.OO,O.OO,O.OO,O.OO,O.OO,O.OO,O.OO,O.OO,O.OO,0.00,0.00,O.OO,O.OO,O.OO,O.OO,O.OO,O.OO,O.OO,0.00,0.00,O.OO,0.00,0.00,O.OO,O.OO,O.OO,O.OO,O.OO,0.00,O.OO,O.OO,0.00,0.00,0.00,0.00,0.00,0.00,0.00,0.00,0.00,O.OO,O.OO,0.00,
0.0.o.0.o.0.0.o.0.0.0.o.0.0.o:0.o.0.0.0.
66,61,58,53,54,55,53,49,48,49,4B,44,4O,41,40,40,40,40,40,40,
0.40,0.40,0.40,0.0.0.0.0.0.o.0.0.0.0.0.0.0.0.0.0.0.0.0.0.
40,40,40,40,39,39,39,39,39,39,39,39,39,39,39,39,39,39,39,-9,38,
0.38,0.0.38,38,
79.9974.8672.5172. O47O.6769.8466.7963. 8063.4062.9361.8260. 8O58.9758.8958.5558.2458. 1158.0558.0257.9957.9757.8057.7557.7157.6357.5957.4257.2757.2757.2737.2657.2457.2157. 1357. O856.9756.8856.8756.7456.7456.7256.7156.5956.5856.5856.5556.53
Optimization of a Fuel Shuffling Scheme by SHAKE
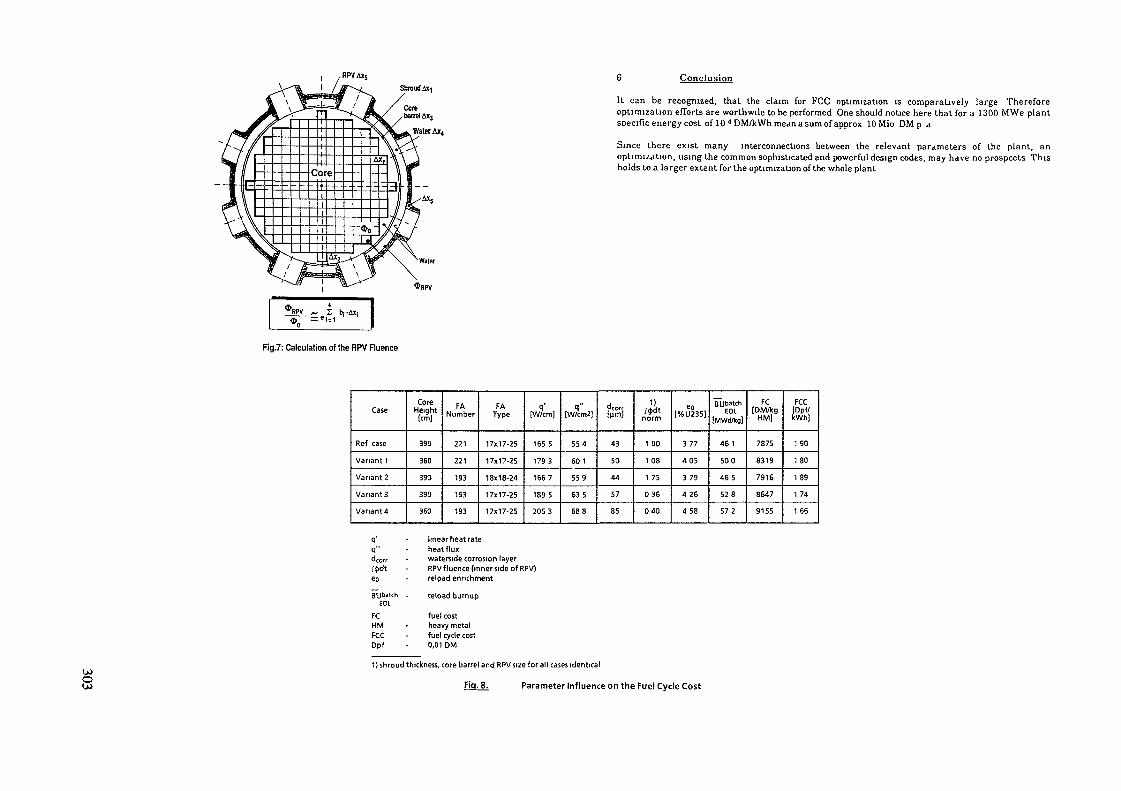
Shroud Äxi6 Conclusion
It can be recognized, that the claim for FCC optimization is comparatively large Thereforeoptimization efforts are worthwile (a be performed One should notice here that for a 1300 M We plantspecific energy cost of 104DM/kWhmeanasumofapprox 10 Mio DM p a
Since there exist many interconnections between the relevant parameters of the plant, anoptimization, using the common sophisticated and powerful design codes, may have no prospects Thisholds to a larger extent for the optimization of the whole plant
Fig.7: Calculation of the RPV Fluence
Case
Ref case
Variant 1
Variants
Variants
Variant 4
CoreHeight
(cm)
390
360
390
390
360
FANumber
221
221
193
193
193
FAType
17x17-25
17x17-25
18x18-24
17x17-25
17x17-25
q'[W/cm]
1655
1793
1667
1895
2053
q"[VWcm2]
554
601
559
635
688
llîrn)
43
50
44
57
85
;*dtnorm
1 00
108
1 75
036
040
eo[%U235)
377
405
379
426
458
BUbatchEOL
(MWd/kgJ
461
500
465
528
572
FC[DM/kg
HM]
7875
8319
7916
8647
9155
FCC[Dpf/kWh!
190
1 80
189
174
166
qq"dcorr
eo
EOt
FCHMFCCDpf
linear heat rateheat fluxwaterside corrosion layerRPV fluence (inner side of RPV)relpad enrichment
reload burnup
fuel costheavy metalfuel cycle cost0,01 DM
U)S
1} shroud thickness, core barrel and RPVsize for all cases identical
Fig. 8. Parameter Influence on the Fuel Cycle Cost

g INFLUENCE OF PROLONGED NUCLEAR FUEL BURNUPS ON SAFETY MARGINS OF ADVANCED PWRs
D. SPASOJEVIC, N MARINKOVIC, M V. MATAUSEKBoris Kidric Institute of Nuclear Sciences,Belgrade, Yugoslavia
Abstract
Prolonged nuclear fuel burnup in advanced NFP with four or moreinstead of three one-year cycles, and/or 15- to 18-months instead ofstandard 12-month cycles, requires the fresh fuel with increasedinitial enrichment combined with burnable absorber. This causeschanges in axial and radial power distribution during particularfuel cycles, so that detailed analysis of thermal reliability ofreactor core becomes inevitable This paper presents the results ofthe analysis of the departure from nucleate boiling ratio (DNBR) foran equilibrium cycle of an advanced IWR core
INTRODUCTIONThe basic goal of in-core nuclear fuel management is the minimumvalue of nuclear power production cost for the given systemproperties and safety margins. This goal is achieved if the totalburnup of discharged fuel has the maximum possible value, whilefrom both economic and safety reasons it is desirable that theradial and the axial burnup distribution in discharged fuelassemblies lie in tne narrowest possible range. The direct approachin solving the so defined optimization problem is the powergeneration flattening, which for LWRs led to partitioning ofreactor core into three radial zones containing fuel with differentinitial enrichment (first core) or different burnup histories(succeeding cores). In the course of its three years lifetime afuel assembly occupies different positions during the three 12-month cycles Inserting the fresh fuel in the outer low neutronflux zone, and moving it gradually towards the center of reactorcore (out-in reloading scheme) , it is provided that the fuelcontaining higher percentage of fissionable material operates inthe lower neutron flux, which results in better reactor core safetyproperties Since the burnup process itself leads towards powergeneration flattening, from the safety point view the beginning ofeach cycle is critical and thus it is used as the design basisRecent developments in nuclear power production, however, dictatedifferent criteria for in-core nuclear fuel management First, thetendency of nuclear power plant life extension, from present 30years to possible 50 years, makes the preservation of reactorvessel integrity the goal of primary importance In order tominimize the radiation damage of reactor vessel, fresh fuel withhigh content of fissionable material is placed in the intermediateor the central core zone, while loading patterns are designed so to
minimize the leakage of neutrons (particularly fast neutrons) fromthe core Second, increasing prices of back-end fuel cycleservices, as well as the global delay of commercial use of fastreactors, result in a permanent requirement for increasing thetotal discharge burnup. Improvements in fuel production technologycan already guarantee average discharge burnup of 50 instead ofpresent 30-40 MWd/kgU This increased discharge burnup can beachieved either by increasing the power generation density, or byprolonging the fuel resident time in the reactor. In both cases,there appears the question of keeping up with safety margins.Fuel designed to spend in a reactor four three-months or three 15-to 18-months cycles, instead of original three one-year cycles,must have increased initial enrichment in order to providesufficient built-in reactivity for the prolonged operation. On theother hand, use of fuel with higher initial enrichment, which is nolonger necessarily inserted in the lowest neutron flux zone, canseriously jeopardize safety characteristics of the systemconsidered. Thus the expected peaks of power generation at thebeginning of cycle are compensated by applying burnable absorbers,while control rods can be used for compensating high built-inreactivity. Obviously, this kind of in-core fuel managementrequires additional safety analysisHaving in mind that the future nuclear power plants will certainlybe of the advanced type, with prolonged fuel cycles and extendedlifetime the nuclear characteristics of such systems werestudied' ''. The following quantities were calculated:- axial and radial distribution of neutron flux and powergeneration in a fuel rod for different burnup values;
- space (assemblywise) distribution of neutron flux and powergeneration in the reactor core having initial or equilibriumconfiguration and for different options of built-in reactivitycompensâtion ;
- isotopic fuel composition and fission product inventory fordifferent burnup values The problem of worsened reactor coresafety characteristics in the course of fuel burnup was noticedin the case when burnable absorbers were applied for powergeneration flattening, particularly towards the end of the cycle,when most of the burnable absorbers were already burnt Thenecessity of more detailed analysis of thermal reliability of thereactor core was pointed out
In the present paper the results of reactor core neutroniccalculations presented in'' are used as input data for calculatingthe temperature distribution in a fuel rod and a reactor core, aswell as critical thermal flux ratio and the departure from nucleateboiling ratio (DNBR). The results of the thermal-hydrauliccalculations are. given for an equilibrium cycle of a typical 1000MWe power plant for the case of fresh fuel having standardinitial enrichment, and for the case of fuel with increased initialenrichment and burnable absorbers An analysis of results obtainedusing different heat transfer correlations suitable for thiskind of reactor safety calculations has been performed

METHOD AND CORRELATION APPLIED FOR CALCULATION OF DNBRis one of the main constraints for the
in nuclear fuel, since the integrity of theCritical heat flux, qpower density generatefirst safety barriers, namely fuel element cladding, depends on itsvalue'1' Value of q^ depends on the local conditions of „tjiecoolant and on the thermal conditions of the heating surface' ' 'Value of the departure from nucleate boiling ratio (DNBR=qcrlt/qcja(])is applied to validate the thermal reliability of the reactor coreHaving in mind the complexity of the procedure for determining heatflux distribution on the surface of the fuel cladding qcij,j, on onehand and the correlation for calculating values of local neat fluxq -jt • on the other hand, distribution of DNBR is represented in avery complex implicit form. That is why the direct determination ofminimum DNBR value, which is the safety margin, is practicallyimpossible.Procedure for calculating the DNBR distribution performed in thisanalysis is the followingDistribution of the heat flux on the surface of a fuel rod and itscladding q,,a(j (z) , is calculated by applying coupled code packagesWIMSD-VAMPIR and HITOC-MOD3 For a chosen reactor coreconfiguration, burnup Bu(r.z) and power P(r,z) distribution werecomputed by WIMSD-VAMPIR' ' code package The so obtained heatdistribution was used as input in the HITOC-MOD 3 code forcalculating thermal and hydrodynamic parameters of the heatingchannel and the fuel rod. In this procedure choice and method ofapplying the correlation for calculating the critical heat flux qorlthas special significance. Among a number, of availableexperimentally obtained correlations for q^j , the followingthree correlations are applied for the analysis performed in thispaper :
Correlation W-3:/5/
9e«t <z> = I2 • 002-0 . 0000624P+ (0 . 1722-0 . 0000143p) e '" 17?-° °<>o599p)*][0 . 00073474 (0 . 1484-1 . 596X+0 . 1729x|x|) G+l . 037] ID
(1. 157-0. 869X) (0.2664+0. 8357e1" "*•' (0 8258+0 000341ajjU(>(:)
which is valid for the following ranges of parameters:p=6895 - 15860 kPa, x=-0.15- 0.15, G= 1356 - 6780 kg/ms,De=0.005 - 0.018 m.
Correlation RELAP 4 - MOD 5:'
25487 (,(*)=•
— —13 56 (2)
valid for the following ranges:p=690 - 15200 kPq, x= -0.10 - 0 10 , G= 100 - 4100 kg/ms,FFP= maximum value of the fuel rod radial form factor.Correlation GIDROPRESS:
) -795000 (l-
valid for the following ranges:
5-G° -Jrt-o 127-(l-0.0185p) 13)
p= 7450 - 16700 kPa, x=-0.7 - 0 4 , G= 700 - 3800 kg/ms,De > 0.009 mIn the previously mentioned relations steam quality x is a functionof axial coordinate z and it is calculated according to thefol lowing:
(4)
3906-0.5356p°
where i[.let is the enthalpy of the coolant entering the core, A isthe coolant cross section in the fuel element, and 0 is the wetperimeter of the fuel element.
RESULTS OF CALCULATIONBasic parameters of the system analyzed in this paper are shown inTable 1 Assemblywise radial distribution of form factor at thebeginning of cycle (BOC) and at the end of cycle (EOC) for anequilibrium core is shown in Figure 1 This results from neutroniccalculations of the core with burnable absorbers (IFBA).Critical heat flux for chosen reactor types (PWR or WER) isdetermined by applying the above correlations, but for a finalcomparison of DNBR at BOC and EOC with and without burnableabsorbers, correlation W-3 was applied for PWR case while thecorrelation GIDROPRESS is applied for the WER case. The resultsfor WER case are not cited here, because they are still inpreliminary form.Results of thermal-hydrodynamic calculations are shown in Table 2and in Figures 2-4 Axial distributions of q jj, q jt and DNBR atthe beginning and at the end of an equilibrium cycle are computedfor the cases with and without burnable absorber by applying axialdistribution at the fuel assembly maximum of generated heat fuelEffects of the reliability of applied experimental correlations fordetermining the critical heat flux and engineering uncertaintyfactors of reactor parameters are shown in Figure 5 It may be seenthat in the case of extended fuel cycle analyzed here, the designedsafety margin DNBR is jeopardized towards the end of cycle.
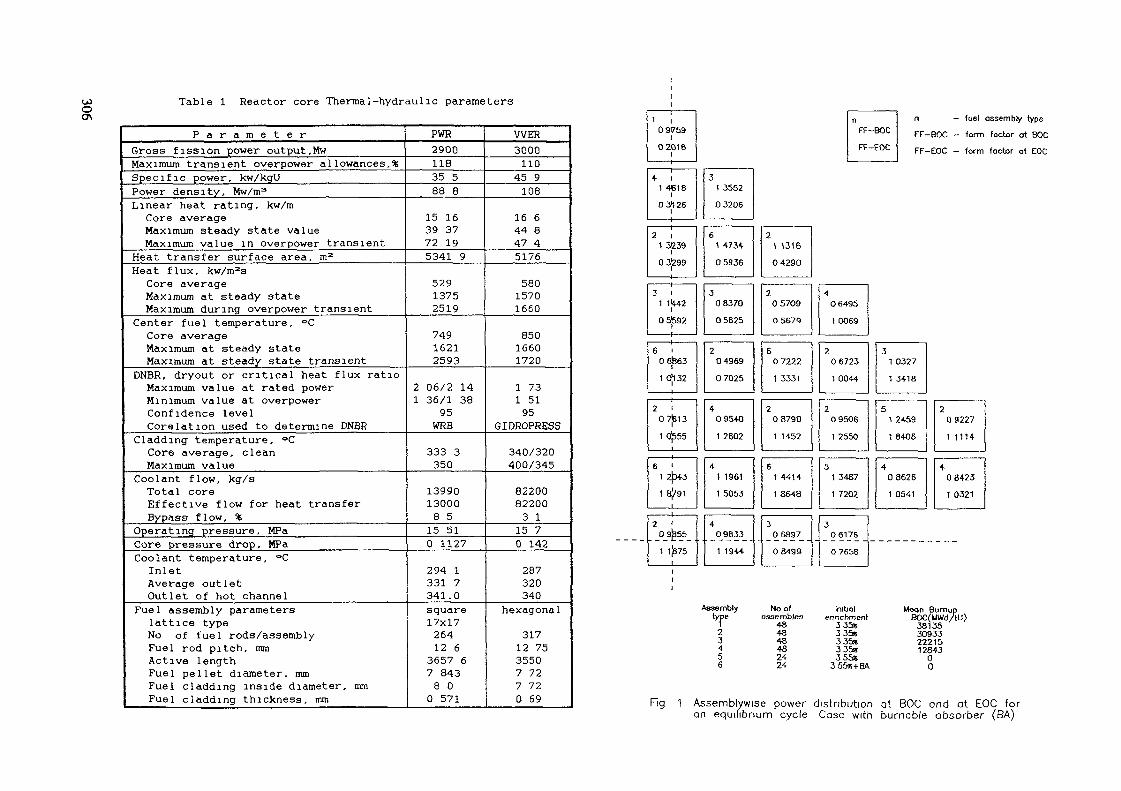
Oo\Table 1 Reactor core Thermal-hydraulic parameters
P a r a m e t e rGross fission power output, MwMaximum transient overpower allowances.*Specific power, kw/kgUPower density, Mw/m3Linear heat rating, kw/mCore averageMaximum steady state valueMaximum value in overpower transient
Heat transfer surface area, m2Heat flux, kw/m2s
Core averageMaximum at steady stateMaximum during overpower transient
Center fuel temperature, °CCore averageMaximum at steady stateMaximum at steady state transient
DNBR, dryout or critical heat flux ratioMaximum value at rated powerMinimum value at overpowerConfidence levelCorelation used to determine DNBR
Cladding temperature, °CCore average, cleanMaximum value
Coolant flow, kg/sTotal coreEffective flow for heat transferBypass flow, %
Operating pressure, MPaCore pressure drop, MPaCoolant temperature, °C
InletAverage outletOutlet of hot channel
Fuel assembly parameterslattice typeNo of fuel rods/assemblyFuel rod pitch, mmActive lengthFuel pellet diameter, mmFuel cladding inside diameter, mmFuel cladding thickness, mm
PWR290011835 588 8
15 1639 3772 195341 9
52913752519
74916212593
2 06/2 141 36/1 38
95WRB
333 3350
13990130008 515 510 1127
294 1331 7341.0square17x1726412 63657 67 8438 00 571
WER3000110
45 9108
16 644 847 45176
58015701660
85016601720
1 731 5195
GIDROPRESS
340/320400/345
82200822003 115 70 142
287320340
hexagonal31712 7535507 727 720 69
11
1 I091759
l02018
I
4 i1 4618
lQ3>!26
2 l1 3239
t0 3(299
3 i1 1<W2
05J592
6 i06(363
1 0|l32
2 i07JB13
1 OJ555
6 l1 2J343
1 S|791
.
2 '09^55
1 1JS75
31 3552
03206
61 4734
05936
308370
05625
204969
07025
409540
1 2802
41 1961
1 5053
409833
1 1944
21 1316
04290
205709
05679
607222
1 3331
208790
1 1452
$1 4414
1 8648
306897
08499
nFF-BOC
FF-EOC
406435
1 0069
206723
1 0044
209505
1 2550
51 3487
1 7202
306176
07658
n - fuel
FF-BOC - form
FF-EOC - form
31 0327
1 3418
51 2459
1 8406
408626
1 0541
209227
1 1114
408423
1 0321
Assemblytype
23456
No ofassembles
484848482424
Initialenrichment
335«335«335*335«355«
355Z+EW
Mean BumupBOC(UiVd/tU>
38135309332221512843
00
Fig 1 Assemblywise power distribution at BOC ond at EOC foran equil ibrium cycle Case with burnable absorber (BA)
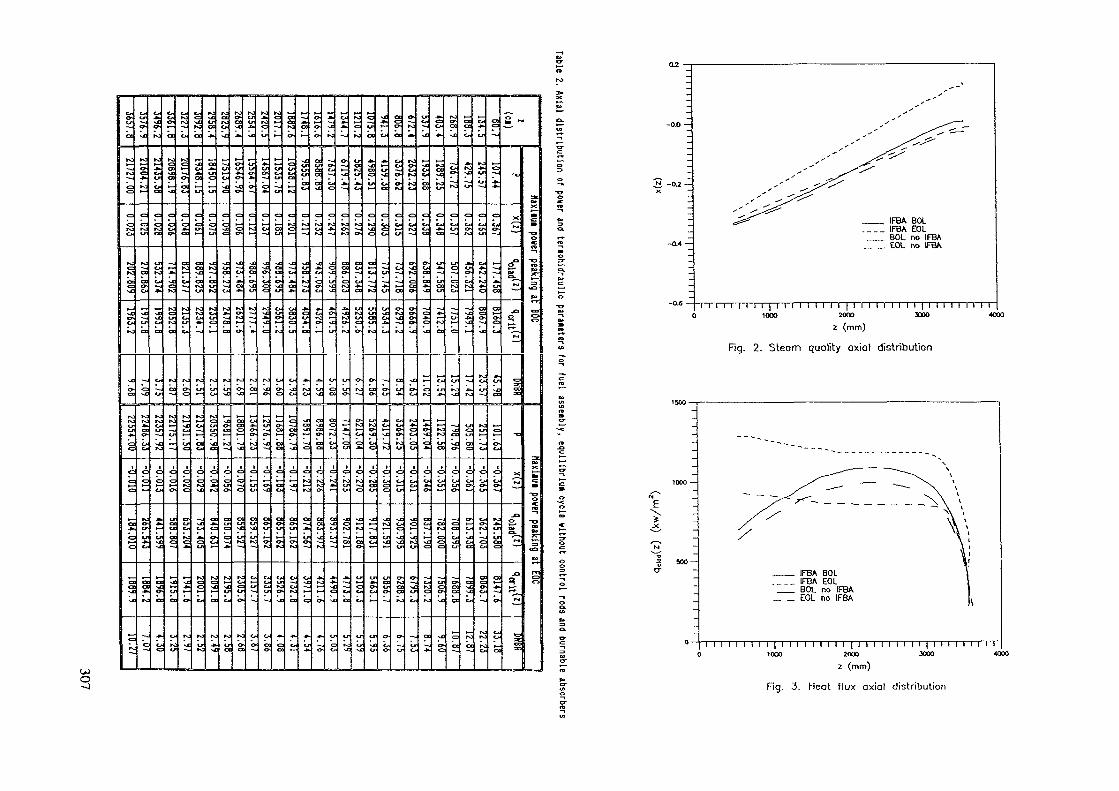
s ~
&.
IFBA BOL___ IFBA EOL__ BOL no IFBA_ _ EOL no IFBAi
-0-6 -TTTTI M M | I I I I I M I I | I I I M I I I I | I I I I I I I I I0 1000 2000 3000 4000
z (mm)
Fig. 2. Steam quality axial distribution
3
2 500-er
1 1 1 11000
1 ' I '2000
2 (mm)
Fig. 3. Heat flux axial distribution

ooo
l M l l M l l | l l l l l M M | l l l l l l l M | l l l l l l l l l1000 2000 3000 4000
z (mm)
uncertinittfls orplant parameter?
1 00DNBR
1 17 119UMtTDNBR
1 36DESIGNDNBR
Fig 4 Axial DNBR distribution
CONCLUSION
Prolonged fuel cycles from original 12 months to 15 or more demandincrease of fresh fuel enrichment and application of burnableabsorbers. This causes variations of radial and axial powerdistribution during the cycle which impose the need for detailedanalysis of the reactor core thermal reliability.In this paper an analysis of the variation DNBR parameter isperformed for a PWR fuel rod cladding. Results of the analysis showthat reactor core having («ïcnt/^iad'fin Ä 2-5 at the beginning of thecycle may change to (<3crit'/'<ïclaiJ'iiiL *-2 at the end of cyde when theburnable absorber is applied. This is not acceptable from safetypoint of view since the accepted design value is '
Engineering factors- Heat factor = 1 03— Enthalpy rise factor — 1 03- Pitch, bowing and clad enthalpy ns« = 1 O5— Linear heat rote = 1 03
Fig 5 Uncertainity effects of the correlation for DNBR reactor parameters
The analysis and the results given the present paper indicate thatincreasing the total discharge burnup and introducing advancedrefuelling schemes require more sophisticated safety analysis, i e.more detailed both physical and thermal -hydraulic calculationmodels and methods
REFERENCES
/!/ M.V.Matausek, N Mannkovic, Prolonged Fuel Burnup in AdvancedLWRs, IAEA Int. Topical Meeting on Burnup Determination ofWater Reactor Fuel, Karlsruhe, 1988
111 US Government/Industry Seminar on Nuclear power technology,Bled, 1982.
/3/ Ginoux J.J , Two-Phase Flows and Heat Transfer with Applicationto Nuclear Reactor Design Problems, Hemisphere PublicationCorporation, New York, 1978.
/4/ Z.Stosic, D Spasojevic, Modification Heat Influence to PWRCore Thermal Reliability Owing to Burnup, Proc. of the XXIVYug. Conf of ETAN, Vol.IV, pp 105-110, 1980.
/5/ D.C. Groeneveld, C.W. Snoek, A Comprehensive Examination ofHeat Transfer Correlations Suitable for Reactor SafetyAnalysis, Multiphase Science and Technology, Vol.2, 1984
/6/ L N. Polianin, M H. Ibragimov, G.I. Sabelev, Teploobmen vjadermh reaktorah, Energoizdat, Moscow, 1984.
Ill D Spasojevic et al. Study of Nuclear Reactor Safety, pp 459,Beograd 1988, [in Serbian)
/8/ M V Matausek et al., Study Fuel Cycle Management, pp 148,Beograd 1989. (in Serbian)
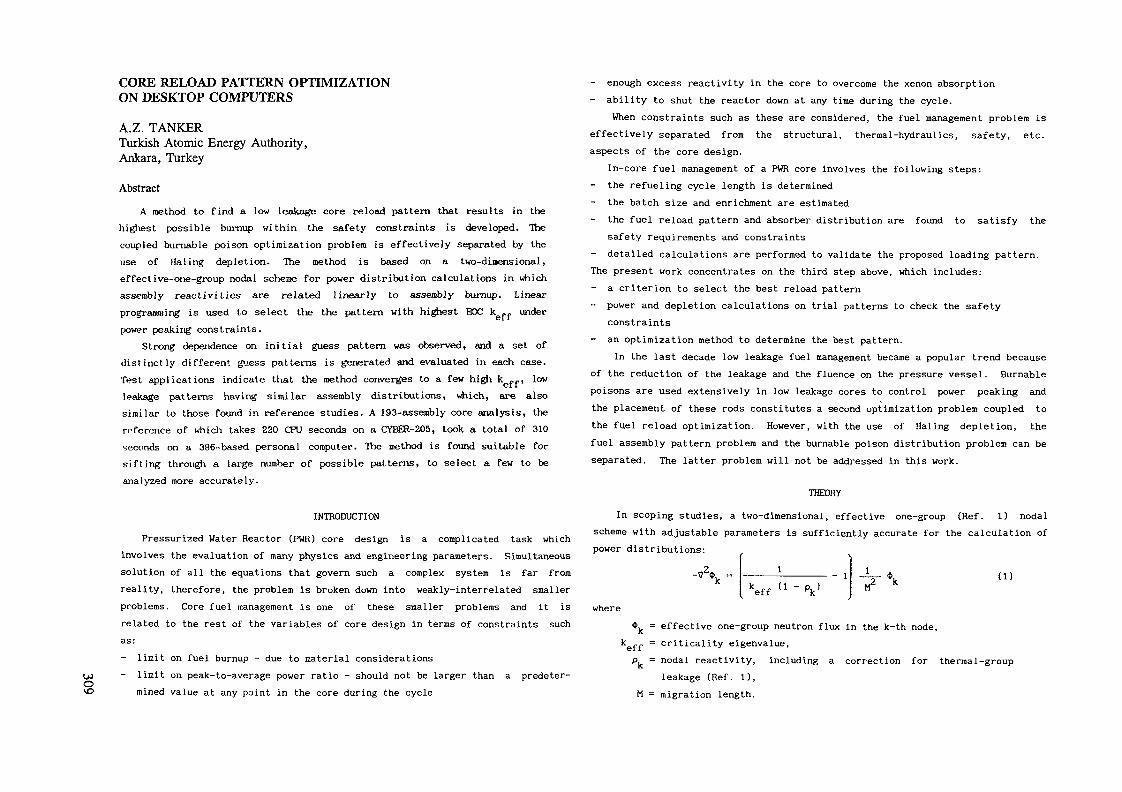
CORE RELOAD PATTERN OPTIMIZATIONON DESKTOP COMPUTERS
A.Z. TANKERTurkish Atomic Energy Authority,Ankara, Turkey
Abstract
A method lo find a low leakage core reload pattern that results in thehighest possible burnup within the safety constraints is developed. Thecoupled burnable poison optimization problem is effectively separated by theuse of Haling depletion. The method is based on a two-dimensional,effective-one-group nodal scheme for power distribution calculations in whichassembly reactivities are related linearly to assembly burnup. Linearprogramming is used to select the the pattern with highest HOC keff underpower peaking constraints.
Strong dependence on initial guess pattern was observed, and a set ofdistinctly different guess patterns is generated and evaluated in each case.Test applications indicate that the method converges to a few high kef.fi lowleakage patterns having similar assembly distributions, which, are alsosimilar to those found in reference studies. A 193-assembly core analysis, therpference of which takes 220 CPU seconds on a CYBER-205, took a total of 310seconds on a 386-based personal computer. The method is found suitable forsifting through a large number of possible patterns, to select a few to beanalyzed more accurately.
INTRODUCTION
Pressurized Water Reactor (PVIR) core design is a complicated task whichinvolves the evaluation of many physics and engineering parameters. Simultaneoussolution of all the equations that govern such a complex system is far fromreality, therefore, the problem is broken down into weakly-interrelated smallerproblems. Core fuel management is one of these smaller problems and it isrelated to the rest of the variables of core design in terms of constraints suchas:
limit on fuel burnup - due to material considerationslimit on peak-to-average power ratio - should not be larger than a predeter-mined value at any point in the core during the cycle
- enough excess reactivity in the core to overcome the xenon absorption- ability to shut the reactor down at any time during the cycle.
When constraints such as these are considered, the fuel management problem iseffectively separated from the structural, thermal-hydraulics, safety, etc.aspects of the core design.
In-core fuel management of a PWR core involves the following steps:the refueling cycle length is determinedthe batch size and enrichment are estimatedthe fuel reload pattern and absorber distribution are found to satisfy thesafety requirements and constraints
- detailed calculations are performed to validate the proposed loading pattern.The present work concentrates on the third step above, which includes:- a criterion to select the best reload pattern- power and depletion calculations on trial patterns to check the safety
constraints- an optimization method to determine the best pattern.
In the last decade low leakage fuel management became a popular trend becauseof the reduction of the leakage and the fluence on the pressure vessel. Burnablepoisons are used extensively in low leakage cores to control power peaking andthe placement of these rods constitutes a second optimization problem coupled tothe fuel reload optimization. However, with the use of Haling depletion, thefuel assembly pattern problem and the burnable poison distribution problem can beseparated. The latter problem will not be addressed in this work.
THEORY
In scoping studies, a two-dimensional, effective one-group (Ref. l) nodalscheme with adjustable parameters is sufficiently accurate for the calculation ofpower distributions:
- 1eff
lM2
* (1)
where*k = effective one-group neutron flux in the k-th node,
keff = criticality eigenvalue,pfc = nodal reactivity, including a correction for thermal-group
leakage (Ref. l),M = migration length.

This equation is solved at the end of cycle (EOC) assuming that all burnablepoison in the core will be burned at the EOC.
By taking *. ~ f, (1 - p ) , Eq. 1 can be written as a function of f. = the1C K K Knormalized nodal power, p = nodal reactivity, k and M. The migration lengthis shown to be independent of burnup and assembly (Ref. l). f, is assumed tostay constant throughout the cycle (Haling depletion) whereas p, and k „ f are EOC
BOCparameters. Since the available values are pk - the initial reactivitydistribution - and not p at the EOC, a way must be found to relate p and p.k K KThis is done by using the linear reactivity model (Ref. 2) in which the assemblyreactivities are assumed to depend linearly on the assembly burnup:
p = PBOC ,„
ABk '
The coefficients p and A^ in this relation are determined by curve fitting todetailed burnup calculations for the assemblies. This approximation greatlyfacilitates the determination of the state of the core at any time during thecycle. To relate the burnup AB. of node k to the prechosen cycle burnup AB, a
mexpression of the form AB = f core AB , where m denotes the heavy metalk k n^loading, is used. Now the EOC state is described by the reactivity distributionat BOC, M and f values which are taken to be independent of burnup, AB which isspecified beforehand, and k at the EOC. The problem is reduced to finding thehighest EOC k f for different initial reactivity distribution patterns. Theadvantages of this method are the following:
BOC andthe resulting quadratic equation for f, can be solved very fast,the memory requirements are extremely small, since all variables butA, are lumped into assembly-independent M and h (node size),
- allows one step treatment of the depletion process,- there is no need to further partition the one-eighth core into zones to keep
the number of calculations at a reasonable level.
This calculational method reduces the time spent in power distributioncalculations significantly and permits the reload assembly pattern analyses to beperformed on desktop computers.
The optimization of initial reactivity distribution to maximize the EOC kwithout having power peaking above the given limits has been done using a numberof methods including dynamic programming, optimal control strategy, linear
programming and direct search. The method used in this study is linearprogramming with the objective function :
Nmaximize J = = krff
3keff
where N is the total number of nodes in the core, and the BOC superscript of p.is dropped. Three conditions are imposed on the reactivities:
i = 1,2,
Z w.p. = const,i i
(2)
(3)
where w^ is the total number of nodes in the full core that, because of symmetry,are identical to the i-th node in the one-eighth core,
f m i n < f i < f m a x • i = l'2' •" 'N C4)
where f is the assembly power normalized to unity over the full core and islinearized with respect to the reactivities as (Ref. 3):
Ni
m=l(5)
(the superscript p indicates that the results of the previous iteration are to beused in the evaluation of the variable).
THE COMPUTER CODE
The theory described above is incorporated in a computer program consistingof power calculation, optimization, assembly matching and input-output modules.This modular structure allows improvement of a particular section such as thepower calculation without changing other parts of the program. The flow diagramof the code is presented in Fig. 1.
The program starts by reading groups of assemblies and their enrichments.Throughout the work it was found that the convergence of the linear programmingroutine is strongly dependent on the initial guess pattern. Therefore, the code
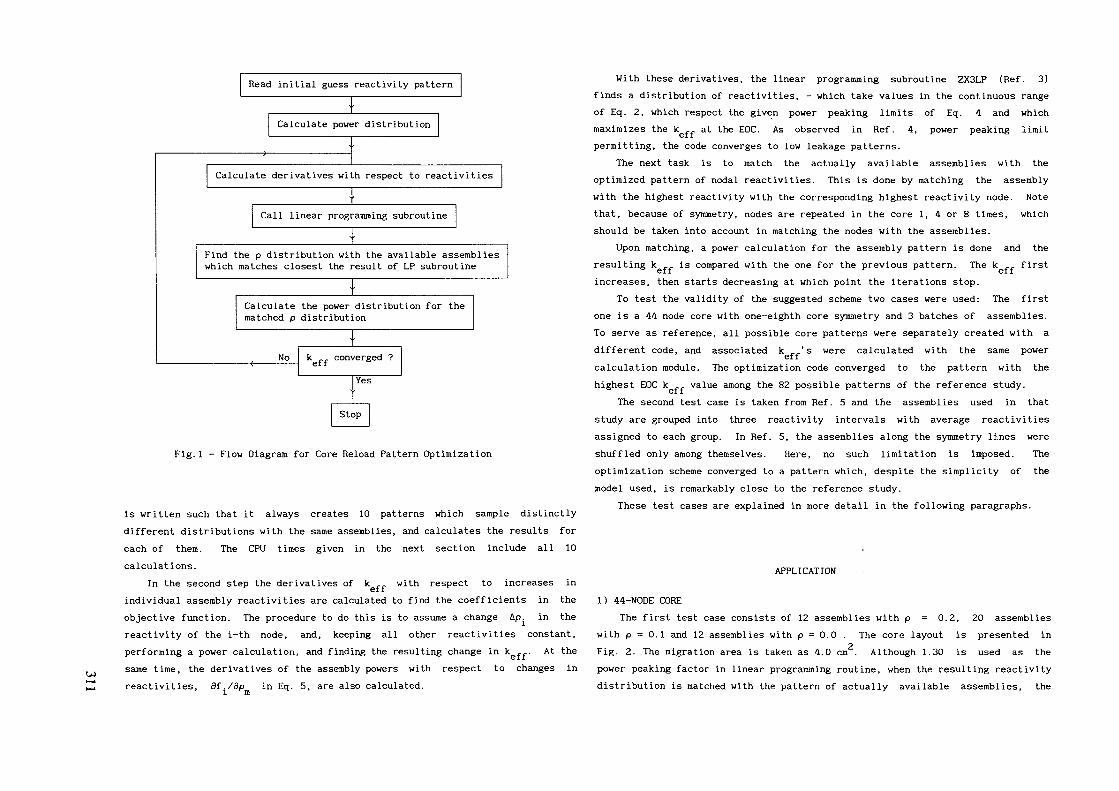
Read initial guess reactivity pattern
Calculate power distribution
Calculate derivatives with respect to reactivities
Call linear programming subroutine
Find the p distribution with the available assemblieswhich matches closest the result of LP subroutine
Calculate the power distribution for thematched p distribution
No k ,., converged ?
Yes
Fig.1 - Flow Diagram for Core Reload Pattern Optimization
is written such that it always creates 10 patterns which sample distinctlydifferent distributions with the same assemblies, and calculates the results foreach of them. The CPU times given in the next section include all 10calculations.
In the second step the derivatives of k with respect to increases inindividual assembly reactivities are calculated to find the coefficients in theobjective function. The procedure to do this is to assume a change âp in thereactivity of the i-th node, and, keeping all other reactivities constant,performing a power calculation, and finding the resulting change in k ,.,.. At thesame time, the derivatives of the assembly powers with respect to changes inreactivities, df./dp in Eq. 5, are also calculated.*
With these derivatives, the linear programming subroutine ZX3LP (Ref. 3)finds a distribution of reactivities, - which take values in the continuous rangeof Eq. 2, which respect the given power peaking limits of Eq. 4 and whichmaximizes the k at the EOC. As observed in Ref. 4, power peaking limitpermitting, the code converges to low leakage patterns.
The next task is to match the actually available assemblies with theoptimized pattern of nodal reactivities. This is done by matching the assemblywith the highest reactivity with the corresponding highest reactivity node. Notethat, because of symmetry, nodes are repeated in the core 1, 4 or 8 times, whichshould be taken into account in matching the nodes with the assemblies.
Upon matching, a power calculation for the assembly pattern is done and theresulting k is compared with the one for the previous pattern. The k __ firstincreases, then starts decreasing at which point the iterations stop.
To test the validity of the suggested scheme two cases were used: The firstone is a 44 node core with one-eighth core symmetry and 3 batches of assemblies.To serve as reference, all possible core patterns were separately created with adifferent code, and associated k 's were calculated with the same powercalculation module. The optimization code converged to the pattern with thehighest EOC k value among the 82 possible patterns of the reference study,et i
The second test case is taken from Ref. 5 and the assemblies used in thatstudy are grouped into three reactivity intervals with average reactivitiesassigned to each group. In Ref. 5, the assemblies along the symmetry lines wereshuffled only among themselves. Here, no such limitation is imposed. Theoptimization scheme converged to a pattern which, despite the simplicity of themodel used, is remarkably close to the reference study.
These test cases are explained in more detail in the following paragraphs.
APPLICATION
1) 44-NODE COREThe first test case consists of 12 assemblies with p = 0.2, 20 assemblies
with p = 0.1 and 12 assemblies with p = 0.0 . The core layout is presented inFig. 2. The migration area is taken as 4.0 cm . Although 1.30 is used as thepower peaking factor in linear programming routine, when the resulting reactivitydistribution is matched with the pattern of actually available assemblies, the
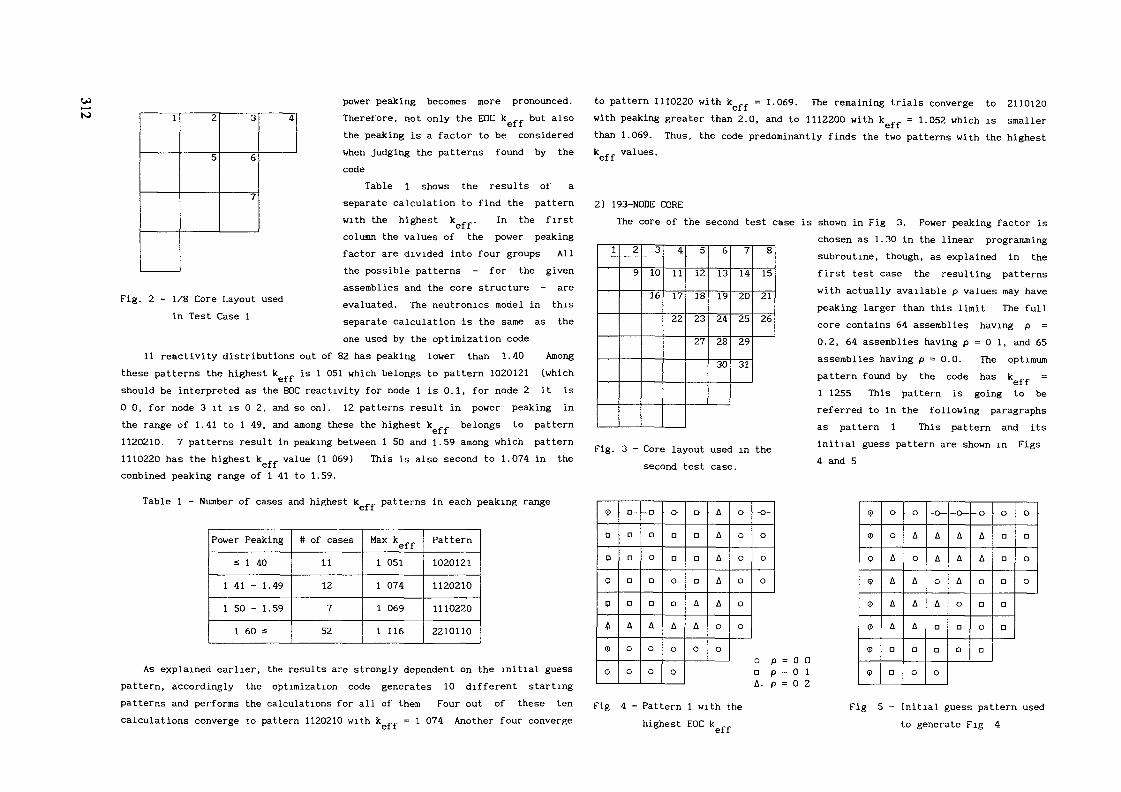
Wh—4tsJ
power peaking becomes more pronounced.Therefore, not only the EOC k .... but alsothe peaking is a factor to be consideredwhen judging the patterns found by thecode
Table 1 shows the results of aseparate calculation to find the patternwith the highest k _ . In the firstcolumn the values of the power peakingfactor are divided into four groups Allthe possible patterns - for the givenassemblies and the core structure - areevaluated. The neutronics model in thisseparate calculation is the same as theone used by the optimization code
11 reactivity distributions out of 82 has peaking lower than 1.40 Amongthese patterns the highest k is 1 051 which belongs to pattern 1020121 (whichshould be interpreted as the BOC reactivity for node 1 is 0.1, for node 2 it is0 0, for node 3 it is 0 2, and so on). 12 patterns result in power peaking inthe range of 1.41 to 1 49, and among these the highest k belongs to pattern1120210. 7 patterns result in peaking between 1 50 and 1.59 among which pattern1110220 has the highest k ff value (1 069) This is also second to 1.074 in thecombined peaking range of 1 41 to 1.59.
Table 1 - Number of cases and highest k .,. patterns in each peaking range
Fig. 2 - 1/8 Core Layout usedin Test Case 1
Power Peakings 1 40
1 41 - 1.49
1 50 - 1.59
1 60 ^
# of cases11
12752
Max keff1 051
1 074
1 069
1 116
Pattern
1020121
1120210
1110220
2210110
As explained earlier, the results are strongly dependent on the initial guesspattern, accordingly the optimization code generates 10 different startingpatterns and performs the calculations for all of them Four out of these tencalculations converge to pattern 1120210 with k ,., = 1 074 Another four converge
to pattern 1110220 with kgff = 1.069. The remaining trials converge to 2110120with peaking greater than 2.0, and to 1112200 with k = 1.052 which is smallerthan 1.069. Thus, the code predominantly finds the two patterns with the highestk values.
2) 193-NODE COREThe core of the second test case is shown in Fig 3. Power peaking factor is
chosen as 1.30 in the linear programmingsubroutine, though, as explained in thefirst test case the resulting patternswith actually available p values may havepeaking larger than this limit The fullcore contains 64 assemblies having p =0.2, 64 assemblies having p = 0 1, and 65assemblies having p = 0.0. The optimumpattern found by the code has k ff =1 1255 This pattern is going to bereferred to in the following paragraphsas pattern 1 This pattern and itsinitial guess pattern are shown in Figs4 and 5
1 2
9
3
10
16
4
11
17
22
5
12
18
23
27
6
13
19
24
28
30
7
14
20
25
29
31
8
15
21
26
Fig. 3 - Core layout used in thesecond test case.
V
0
p
0
IP
A
C>
9
o-
n
D
a
a
A
o
o
-o
n
o
a
D
A
0
o
a
a
a
o
D
A
o
o
D
D
D
a
A
A
o
A
A
A
A
A
o
o
0
0
o
0
o
o
"O-
o
o
0
0 pa pA rA. p = 0 2
9-
|J>
0
<?
<p
<!>
<p
9
O
0
A
A
A
A
a
a
o
A
o
A
A
A
D
O
-0-
A
A
O
A
D
a
o
— c—
A
A
A
o
D
n
-o
A
A
D
D
O
D
O
D
a
D
D
D
O
D
0
O
Fig 4 - Pattern 1 with thehighest EOC keff
Fig 5 - Initial guess pattern usedto generate Fig 4
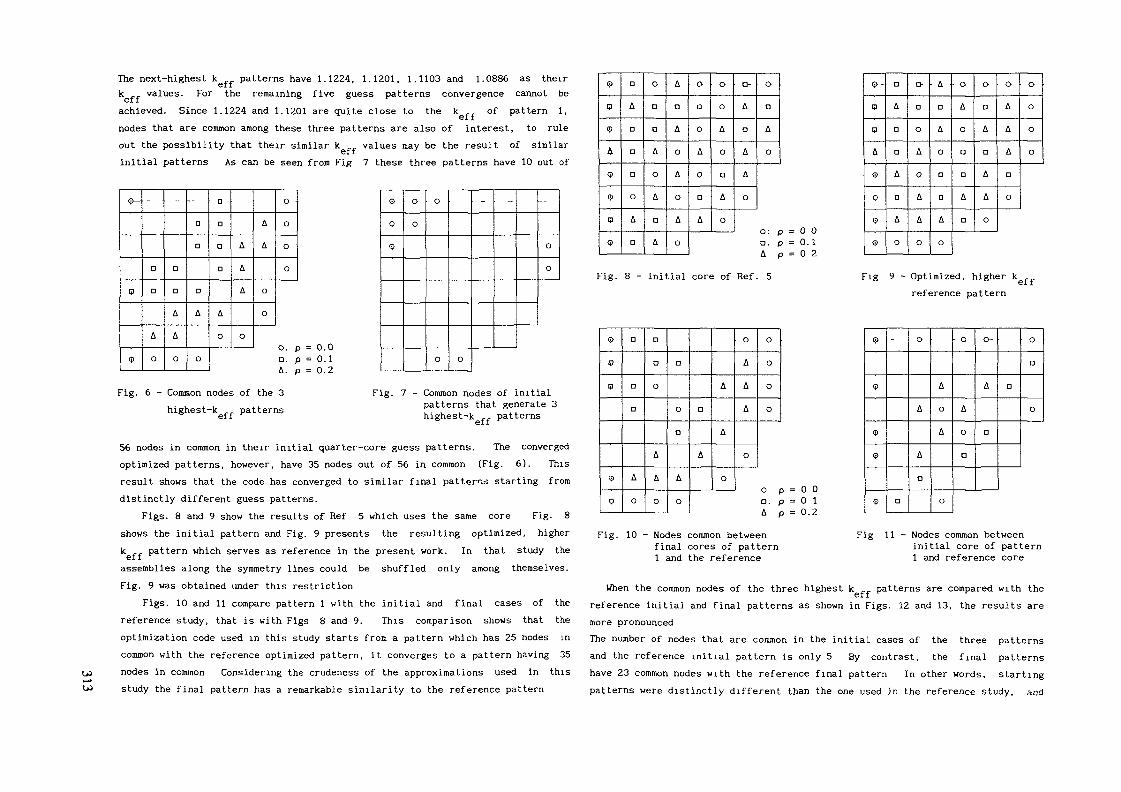
The next-highest k patterns have 1.1224, 1.1201, 1.1103 and 1.0886 as theirk -, values. For the remaining five guess patterns convergence cannot beachieved. Since 1.1224 and 1.1201 are quite close to the k , of pattern 1,nodes that are common among these three patterns are also of interest, to ruleout the possibility that their similar k values may be the result of similarinitial patterns As can be seen from Fig 7 these three patterns have 10 out of
<j>~
Q
9
O
D
A
o
-
a
D
A
A
0
-
a
D
a
A
0
a
D
a
D
A
o
A
A
A
o
A
A
o
o
0
o
o
0
0. (
D- /A t
5 = 0.0
3 = 0.1
1 - 0 2
<t>
9
<?>
o
0
0
o o
- - -
o
o
Fig. 6 - Common nodes of the 3highest-k patterns
Fig. 7 - Common nodes of initialpatterns that generate 3highest-k ff patterns
56 nodes in common in their initial quarter-core guess patterns. The convergedoptimized patterns, however, have 35 nodes out of 56 in common (Fig. 6). Thisresult shows that the code has converged to similar final patterns starting fromdistinctly different guess patterns.
Figs. 8 and 9 show the results of Ref 5 which uses the same core Fig. 8shows the initial pattern and Fig. 9 presents the resulting optimized, higherk f pattern which serves as reference in the present work. In that study theassemblies along the symmetry lines could be shuffled only among themselves.Fig. 9 was obtained under this restriction
Figs. 10 and 11 compare pattern 1 with the initial and final cases of thereference study, that is with Figs 8 and 9. This comparison shows that theoptimization code used in this study starts from a pattern which has 25 nodes incommon with the reference optimized pattern, it converges to a pattern having 35nodes in common Considering the crudeness of the approximations used in thisstudy the final pattern has a remarkable similarity to the reference pattern
9
Q
<S>
A
q>
<i>
IP
Q>
a
A
a
a
D
o
A
a
O
a
D
A
o
A
a
A
A
D
A
0
A
0
A
o
o
a
O
A
o
a
A
o
o
A
o
D
A
O
a-
A
a
A
A
O
o
D
A
o
0: fD. pA tA p = 0 2
Fig. 8 - Initial core of Réf. 5
<!>
IP
IP
<p
<?
a
n
D
A
o
a
a
o
A
A
o
a
0
D
A
o
o
A
A
A
o
o
A
A
A
o
o
o
0
0
o (a. f.A r
p = 0 0p = 0 l
A p = 0.2
Fig. 10 - Nodes common betweenfinal cores of pattern1 and the reference
<i>-
Ip
cp
A
c>
0
<?
<i>
D
A
D
a
A
D
A
o
o-
D
O
A
o
A
A
0
A •
a
A
0
D
D
A
0
o-
A
o
a
D
A
a
o
a
A
D
A
A
o
o
A
A
A
D
O
O
o
o
o
Fig 9 - Optimized, higher kreference pattern
eff
<i>
<!>
<P
<i>
<5>
-
o
0
A
A
D
A
o
A
0
o
A
0
D
O-
A
D
a
o
D
o
Fig 11 - Nodes common betweeninitial core of pattern1 and reference core
When the common nodes of the three highest k patterns are compared with thereference initial and final patterns as shown in Figs. 12 and 13, the results aremore pronouncedThe number of nodes that are common in the initial cases of the three patternsand the reference initial pattern is only 5 By contrast, the final patternshave 23 common nodes with the reference final pattern In other words, startingpatterns were distinctly different than the one used in the reference study, and

9-
*
n
A
o
- -
A
A
O
D
D
O
D
A
A
A
0
-A
A
o
o
o
o
o
o (o: fA -
3 = 0.0
3 = 013 - 0 2
9--
0
- - - O
o
-
o
Fig. 12 - Nodes common betweenfinal cores of 3 highestk patterns and the réf.
Fig 13 - Nodes common betweeninit. cores of 3 highestpatterns and initialreference core
REFERENCES
1 Y.A. CHAD, C.W. HU, C.A. SUO, Nucl. Sei, Eng., 93, 78 (1986).2 M.J. DR1SCOLL, T.J. DOWNAR, E.E. PILAT, The Linear Reactivity Model for
Nuclear Fuel Management, Department of Nuclear Engineering, MassachusettsInstitute of Technology, Cambridge, Massachusetts (1986).
3. "Problem-Solving Software System for Mathematical and Statistical FORTRANProgramming," International Mathematical and Statistical Libraries (1984).
4 J.S SUH, S H. LEVINE, Hucl. Sei. Eng., 105. 371 (1990).5 Y. KIM, T. DOWNAR, A. SESONSKE, Nucl. Sei. Eng., 96, 85 (1987)
so were from each other; but they all converged to final patterns that aresimilar to each other and to the reference one. The reference calculation took220 CPU seconds on the CYBER-205 computer whereas all 10 initial patternsanalyzed in this study with a 386-based Personal Computer took a total of 310seconds.
CONCLUSIONS
In this study an optimization method for beginning-of-cycle fuel loadingbased on the linear reactivity model, effective one-group approximation to thediffusion equation, and linear programmming, is investigated. The method wasfound to converge to high EOC k patterns, respecting power peaking limits.Strong dependence on initial guess pattern was observed, so that the methodgenerates and calculates final patterns for each of the distincly differentinitial guesses These final patterns are to be analyzed by more accurateneutronics and depletion models to arrive at a single reload pattern.
The optimization method was found suitable for sifting through a large numberof possible patterns, to select a few to be analyzed more accurately, on adesktop computer in an acceptably short time.
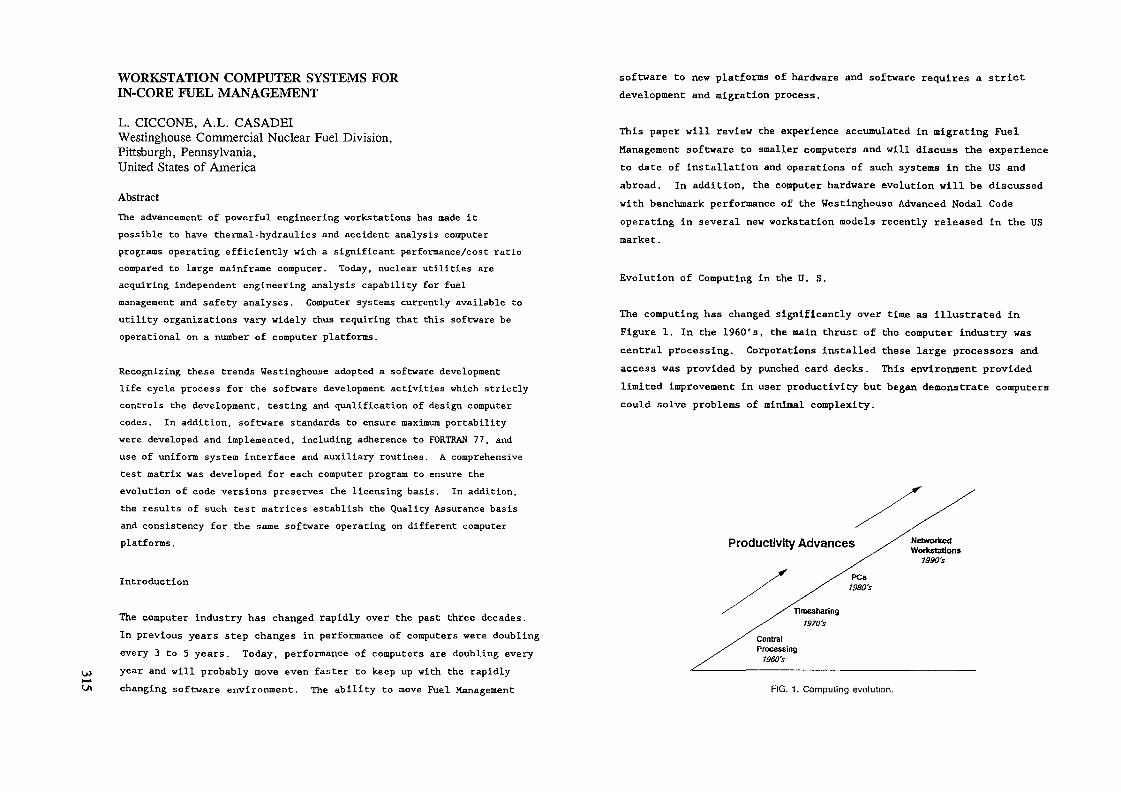
WORKSTATION COMPUTER SYSTEMS FORIN-CORE FUEL MANAGEMENT
L. CICCONE, A.L. CASADEIWestinghouse Commercial Nuclear Fuel Division,Pittsburgh, Pennsylvania,United States of America
AbstractThe advancement of powerful engineering workstations has made it
possible to have thermal -hydraulics and accident analysis computerprograms operating efficiently with a significant performance/cost ratiocompared to large mainframe computer. Today, nuclear utilities are
acquiring independent engineering analysis capability for fuel
management and safety analyses. Computer systems currently available to
utility organizations vary widely thus requiring that this software be
operational on a number of computer platforms.
Recognizing these trends Westinghouse adopted a software developmentlife cycle process for the software development activities which strictly
controls the development, testing and qualification of design computercodes. In addition, software standards to ensure maximum portability
were developed and implemented, including adherence to FORTRAN 77, and
use of uniform system interface and auxiliary routines. A comprehensive
test matrix was developed for each computer program to ensure the
evolution of code versions preserves the licensing basis. In addition,
the results of such test matrices establish the Quality Assurance basis
and consistency for the same software operating on different computer
platforms .
Introduction
The computer industry has changed rapidly over the past three decades.In previous years step changes in performance of computers were doublingevery 3 to 5 years. Today, performance of computers are doubling everyyear and will probably move even faster to keep up with the rapidlychanging software environment. The ability to move Fuel Management
software to new platforms of hardware and software requires a strictdevelopment and migration process.
This paper will review the experience accumulated in migrating Fuel
Management software to smaller computers and will discuss the experience
to date of installation and operations of such systems in the US andabroad. In addition, the computer hardware evolution will be discussedwith benchmark performance of the Westinghouse Advanced Nodal Codeoperating in several new workstation models recently released in the USmarket.
Evolution of Computing in the U. S.
The computing has changed significantly over time as illustrated inFigure 1. In the I960's, the main thrust of the computer industry wascentral processing. Corporations installed these large processors andaccess was provided by punched card decks. This environment providedlimited improvement in user productivity but began demonstrate computerscould solve problems of minimal complexity.
Productivity Advances NetworkedWorkstations
199O's
CentralProcessing
1960's
FIG. 1. Computing evolution.

OsTimesharing computing was the highlight of the 1970's. The largeprocessors of the 60's were advanced by software developments thatallowed users access via Cathode Ray Tubes (CRT). Users threw awaytheir card decks and now could edit files interactively and submitapplication input data directly to the computer. This environmentincreased the productivity of users over central processing systems andbegan the era of sharing information via computers.
Probably the largest advance in computing was the Introduction of thepersonal computer. This advance gave users dedicated power at theirdesk and provided an environment for the greatest advance in personalproductivity software. Databases and graphical based software was beingdeveloped and users were Incorporating these features Into their dailyjob functions. Still, the sharing of data was limited at best in thisstructure.
Starting in the mid 1980's, the computing revolution moved toworkstations. Initially, they appeared to be another version of thepersonal computer with more power but their development over the past 5years has made them stand out. The first systems performed at around .5million Instructions per second (MIPS) and were used to perform simplecalculations. Today, just 7 years later, machines are performing at 76HIPS and cost about the same as the mid 1980s systems. This has placeddesktop workstations in the same performance class as the largemainframes.
Software Migration Process
Westinghouse has experienced the computing evolution like many othercorporations. Westinghouse has installed large central processorsaccessed via timesharing techniques, Invested In personal computers andare now basing our development, testing and qualification of nuclearapplications on workstations.
Migration from one platform to another is imperative to survive in therapidly changing computing industry. Westinghouse has established amigration environment with several key elements that insure a QualityAssurance basis for Its software. These elements Include a softwaredevelopment life cycle process, development standards and a uniformsystems interface.
The software development life cycle process provides an organized methodfor developing, testing and maintaining applications. The life cycleprocess Is characterized by the following phases:
o Preliminary Evaluation
o Functional Specification
o Software Design
o Software Implementation
o Software Verification
o Release for Production/Acceptance Testing
The hallmark of this process is the rigorous application testing. Eachapplication Is validated for a specific range of calculations. Thisrange Is modelled in a series of applications tests called a "testmatrix". Each tiae an application is modified or migrated to anotherplatform, the test matrix is executed and checked against reference QAresults. This process of testing each application and verifying againstpreviously validated results maintains the Quality Assurance basis forour software.
The ability move between platforms to take advantage of computingtechnology advances has prompted Westinghouse to adopt softwarestandards. These software standards insure maximum portability while

maintaining the software Quality Assurance basis. Standards have beendeveloped for application software, utility packages and systemdependent utilities. The application software standards include ANSI
1977 FORTRAN Full Language Standard, naming conventions, variableinitialization, FORMAT statements, alphanumeric data handling, data
packing, array subscript usage, file handling, data types, etc.
Software utility packages, adhering to the above standards, provide a
repository for commonly used programs. This technique avoidsduplication of software by each application. Finally, a uniform
interface between the applications and the operating system centralizesall system dependencies.
The software development life cycle process, standards based software
development and the uniform system interface technique are essential
elements of a migration environment. These processes and standards
greatly reduce the effort in migrating to other platforms.
Platform Implementations
The development of a computer infrastructure, standards and a softwaredevelopment life cycle enables Westinghouse to move efficiently betweenplatforms. In the fuel design arena, Westinghouse supports four
Cray KM P
IBM
HP-Apollo
FIG. 2. Westinghouse CNFD software development network.
platforms (Figure 2) from their software development network. Platformsinclude specific operating systems for Cray, IBM, HP-Apollo andScientific Computer Systems.
The software development and delivery process (Figure 3) was developedto ensure that all nuclear application software is developed andreleased consistently for all platforms. The software repositoryresides on the workstation where initial development is performed.
Failed Validation
*'«tetation Network
1 ————————— 1 ^Software
Repository
Source CodeTest Matricies
—— Portto
Platform<£*
*?
Cray
IBM
HP
ses
-»••Va^on VaHdadcn ^^ ™°~*
Testina Passed PackageProduction
FIG. 3. Software development and delivery process.

Wl—koo
After successful testing of modifications to an application, the sourceis generated for all supported platforms and tested in each environment.If any testing fails, changes are made to the applications in the
software repository and retested on each platform. After all validationis successfully competed, softwate is then released for production.
The software delivery process uses the software life cycle, standardsand uniform system interfaces as the basis for applications developmentand maintenance. This process insures that only one copy of the sourceis maintained for each application. This technique has improved ourability to maintain applications and has enhanced the portability of ournuclear software.
Workstation Hardware
The impact of workstations on the computing industry has beentremendous. Nuclear calculations that were only capable of being solvedon mainframes can now be performed by smaller computers. Although thesecomputers are physically smaller, their power is extremely impressiveand their price/performance ratio is outstanding.
Westinghouse benchmarks many computers as a means of targeting platformsfor development and to illustrate the performance of our applications indiffering computer and operating system environments. Figure 4 showsbenchmark results for the Westinghouse Advanced Nodal Code nuclear
application. The benchmark is a representative analysis core consistingof 15 depletion steps for a Westinghouse four loop reactor. As can beseen, there is a wide spread on performance with a range of acceptableresults for intermediate minicomputers to workstations. Until recently,this performance comparison chart only contained large mainframes andmini-computers. Last year, the Hewlett Packard (HP) 400 system made thechart and the recently announced HP 700 series computers' has brokeninto the elite group of computers rivaling Cray and IBM computers.Performance is only one component in selecting an Implementationplatform. Comparing costs in these differing environment provides themost dramatic improvement in computing. Mainframes and mini-computer
IBM 3090 - 200E VCray 1-SVCray 1-S S
IBM 3090 - 200E SIBM3090-200SS
HP Series 720 SCONVEX C-210VRISC/6000-320 S
IBM 3084 SARDENT Titan 3VCYBER 960 - 31 S
FPS500-VCYBER 960-11 S
APOLLO DN 10000 SCYBER 870 S
SCS-40 SIBM 4381 MG-14 S
ARDENT Titan 2 VHP Séries 425 S
CONVEX C-120VIBM 3090 MG - 90 S
CYBER 932 - 31 SHP Séries 400 S
: Time Reraove to Cray XMPS-Scalar V-Vector
110.55• 10.81••11.39
FIG. 4. 2D ANC benchmark results.
l 22.57
costs range from $100,000 to $1,000,000 and even higher. The typicalworkstation configuration, consisting of a 19" color graphics monitor,16 megabytes of memory and 400 megabytes of disk, costs between $15,000and $20,000. This price breakthrough has driven the cost/MIP tobelow $300.
Conclusion
Workstations are providing performance and price improvements that placesignificant power on the nuclear designers desk. There now exists acomputer platform that will foster development of computer aided designapplications for nuclear fuel management. Taking advantage of theseimprovements can only be possible with an infrastructure that provides aQuality Assurance basis for software applications. Software Developmentlife cycle process and standards play a significant part in providingthis Quality Assurance basis. Clearly the computing evolution has andwill continue to impact the development of fuel management applications.
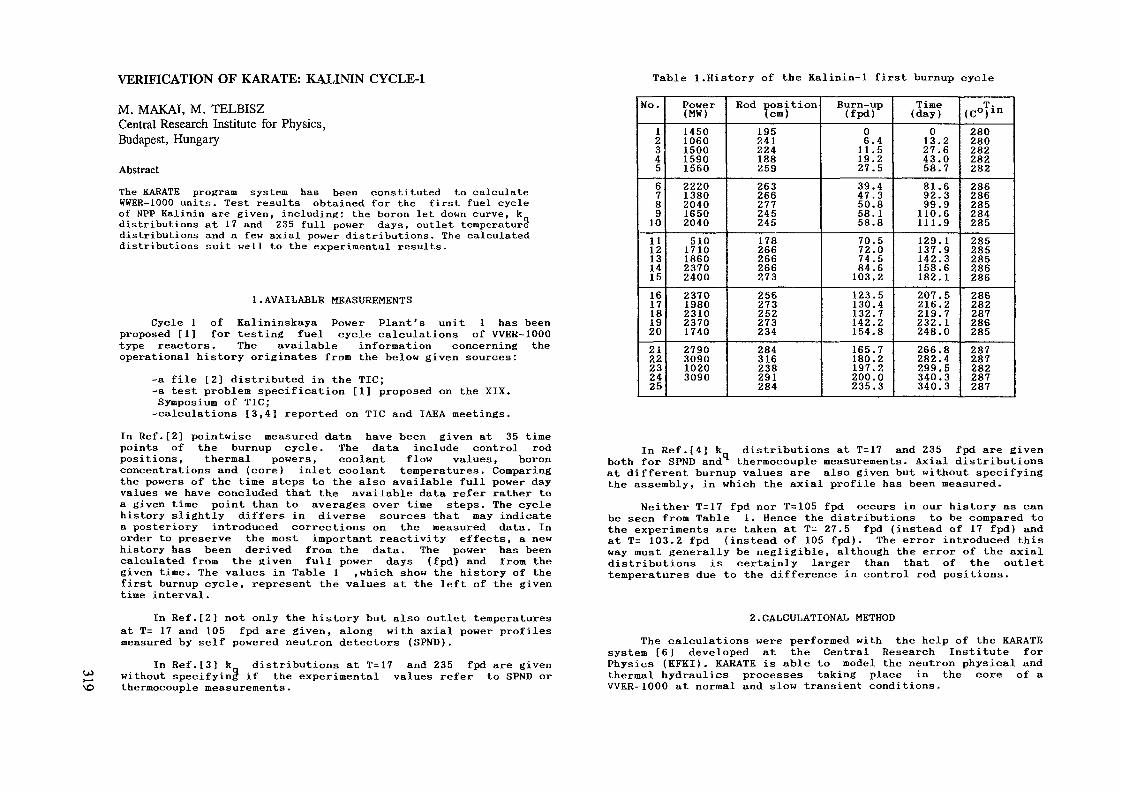
VERIFICATION OF KARATE: KALININ CYCLE-1 Table 1.History of the Kalinin-1 first burnup cycle
M. MAKAI, M. TELBISZCentral Research Institute for Physics,Budapest, Hungary
Abstract
The KARATE program system has been constituted to calculateWWER-1000 units. Test results obtained for the first fuel cycleof NPP Kalinin are given, including: the boron let down curve, kdistributions at 17 and 235 full power days, outlet temperaturedistributions and a few axial power distributions. The calculateddistributions suit well to the experimental results.
1.AVAILABLE MEASUREMENTSCycle 1 of Kalininskaya Power Plant's unit 1 has been
proposed [1] for testing fuel cycle calculations of WER-1000type reactors. The available information concerning theoperational history originates from the below given sources:
-a file [2] distributed in the TIC;-a test problem specification [1] proposed on the XIX.Symposium of TIC;-calculations [3,4] reported on TIC and IAEA meetings.
In Ref.[2] pointwise measured data have been given at 35 timepoints of the burnup cycle. The data include control rodpositions, thermal powers, coolant flow values, boronconcentrations and (core) inlet coolant temperatures. Comparingthe powers of the time steps to the also available full power dayvalues we have concluded that the available data refer rather toa given time point than to averages over time steps. The cyclehistory slightly differs in diverse sources that may indicatea posteriory introduced corrections on the measured data. Inorder to preserve the most important reactivity effects, a newhistory has been derived from the data. The power has beencalculated from the given full power days (fpd) and from thegiven time. The values in Table 1 ,which show the history of thefirst burnup cycle, represent the values at the left of the giventime interval.
In Ref.[2] not only the history but also outlet temperaturesat T= 17 and 105 fpd are given, along with axial power profilesmeasured by self powered neutron detectors (SPND).
In Ref.[3] k distributions at T=17 and 235 fpd are givenwithout specifying if the experimental values refer to SPND orthermocouple measurements.
No.
12345678910111213141516171819202122232425
Power(MW)14501060150015901560222013802040165020405101710186023702400237019802310237017402790309010203090
Rod positionTern)195241224188259263266277245245178266266266273256273252273234284316238291284
Burn -up(fpd)06.411.5
19.227.539.447.350.858.158.870.572.074.584.6103.2
123.5130.4132.7142.2154.8165.7180.2197.2200.0235.3
Time(day)013.227.6
43.058.781.692.399.9
110.6111.9129.1137.9142.3158.6182.1207.5216.2219.7232.1248.0266.8282.4299.5340.3340.3
(C°Iin280280282282282286286285284285285285285286286286282287286285287287282287287
In Ref. [4] k distributions at T=17 and 235 fpd are givenboth for SPND and thermocouple measurements. Axial distributionsat different burnup values are also given but without specifyingthe assembly, in which the axial profile has been measured.
Neither T=17 fpd nor T=105 fpd occurs in our history as canbe seen from Table 1. Hence the distributions to be compared tothe experiments are taken at T= 27.5 fpd (instead of 17 fpd) andat T= 103.2 fpd (instead of 105 fpd). The error introduced thisway must generally be negligible, although the error of the axialdistributions is certainly larger than that of the outlettemperatures due to the difference in control rod positions.
2.CALCULATIONAL METHOD
The calculations were performed with the help of the KARATEsystem [6] developed at the Central Research Institute forPhysics (KFKI). KARATE is able to model the neutron physical andthermal hydraulics processes taking place in the core of aWER-1000 at normal and slow transient conditions.

OJts>o
KABATE involves three levels: cell, assembly and globallevels. On the cell level the multigroup transport equation (TE)is solved in a cell, and the output cell averaged few group (i.e.2 or 4 group) constants are placed in a suitable library. On theassembly level the few group diffusion eqation (DE) is solved foran assembly made up from homogeneous regions. Here a portion ofthe assembly's surroundings is also taken into account. Theoutput of this level consists of assembly averaged cross-sections, organized in a suitable library. The power distributionand the burnup are calculated at the third, so called globallevel. The flux distribution is calculated by response matrix(RM) iteration. The RM's of a given assembly are calculated bymeans of analytical solutions to the DE in the given assembly.
The thermal hydraulic feed back is taken into account sothat in the neutron physical calculations the thermal hydraulicsvariables (moderator density and temperature, steam fraction) aretaken as parameters, and are calculeted by an adopted COBRAalgorithm from the power distribution. The power distribution,moreover, is calculated in the neutron physical calculation withfixed thermal hydraulics parameters. Thermal hydraulics andneutron physical calculations are organized in a loop.
Reflector and structural materials around the core aredescribed by albedo matrices. Also albedo matrices are utilizedat the top and bottom of the core.
3. ADJUSTMENT OF PROGRAMS, ASSUMPTIONSNo adjustment has been made in the KARATE sytem although
because of some lacking information we resorted to theassumptions as follows:
-the structure of the space above and under the core is notknown. In both cases a. - 6 cm extrapolation distance hasbeen taken.-the structure of the assembly at the end of the absorberrod is not known. After the end of the rod water isassumed.
The calculations were performed in a 60-deg sectorassemblies) and 14 axial mesh points were taken.
4.RESULTS
(with 34
A - «oyiSUREMZNTO -KAKATE— - BIPR-7
2 dofull power day
Fig.l. Comparison of boron concentrations/Cycle 1 of Kalinin Unit I/
the same effect can be observed with BIPR-7 though there theoverestimation occurs 20 fpd earlier. The reason must be areactivity effect having displayed in the models but not in themeasurements. Such a reason may be a power change not representedin the given history.
the measured and calculatedcompares the measured and calculated ka 30-deg sector at 27 fpd. The measured value!
Figure 2distributions inare taken from Ref. [4]. Though neither the experimentalmethodology (the derivation of k from the measurements) nor theexperimental error is known, the distribution calculated byKARATE seems to agree with the measurements within the presumableexperimental error.
Figure 3 shows a similar comparison at 235 fpd, close to theend of the burnup cycle. Here considerable differences can beobserved at positions 4, 8, 13, 18 and 19. Yet the measuredvalues enclose the values calculated by KARATE at positions2,3,5,6, and 19. The calculation seems to agree better with theSPND measurements than with the thermal measurements. There is aconsiderable difference between the SPND and thermal measurementsas well.
The boron let-down curve is shown in Fig.l. The measuredvalues along with the BIPR-7 calculations originate from Ref.[4].BIPR-7 apparently underestimates the boron concentrationeverywhere but at the fresh core. KARATE slightly overestimatesthe first two values but shows a fairly good agreement with themeasured values. At 200 fpd KARATE seriously overestimates and
Fig. 4 and 5 shows the measured and calculated energyrelease at 17 fpd and 105 fpd, respectively. The coordinate ofthe displayed assembly is 23-08. The good coincidence at theinner points of Fig.4 and the deviations at the first and lastaxial points may indicate the inadequacy of the extrapolationdistances at the top and bottom of the core. It is very difficult
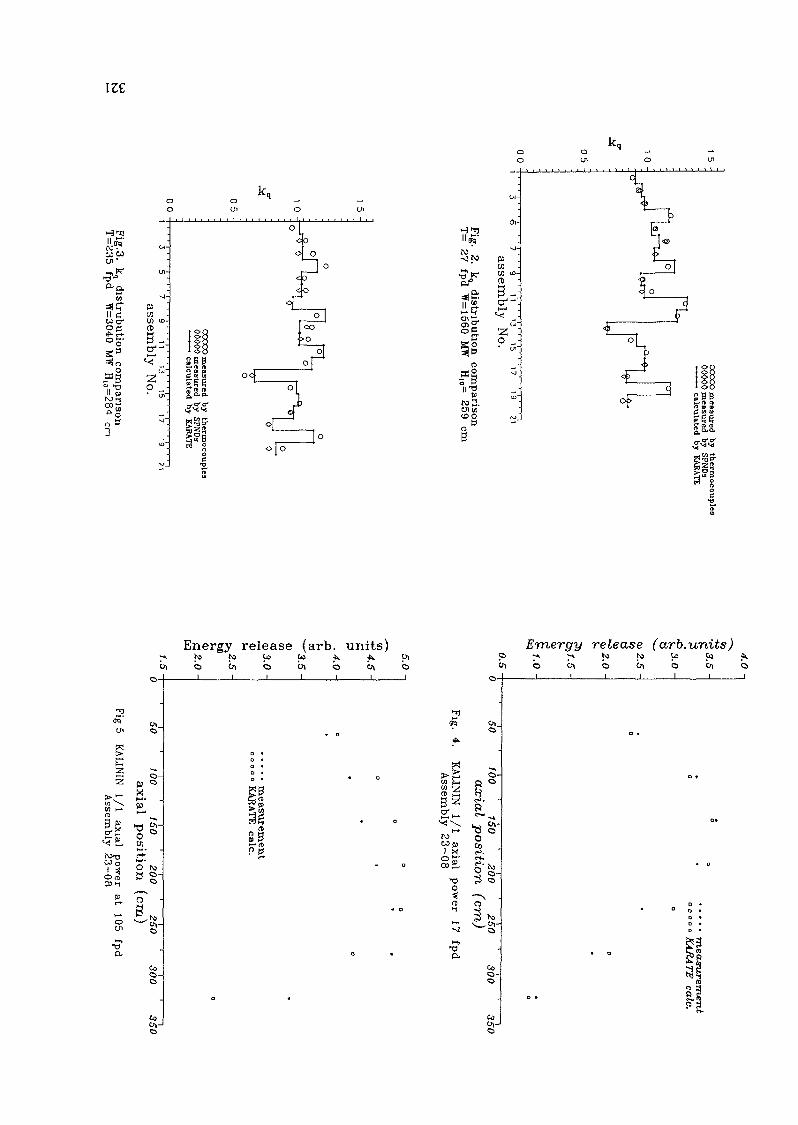
ize
M Ccocr
»Ili 'SMÏ;2go a3
MU) 10-n
•<
o
gagöS Sü u ««" säs. s.ef&<r#•«•«sl?lliM S
•S1*"w°*&11 ».
o
I"!n-o.
U1Wtoo0
Cöl
OÜ1
*>•••
E
1 p §•>C B.°|> »
li ^g-*<! 5-. U)
il 2 S.o
Energy release (arb. units)iva Jv3 Co W . -U. Ol
Emergy release (arb.units)ol >«J~
(W Ol_
>b S-œ t-i Û ^
P 1 "X*\ o»-ro1" o °w» S
g» |^_
on n
h- 5 **
?Co
0
CO
Cs
a *
».
a»
• 0
= SDDD
* Q fQ Q
*a|o äll

COtoto
Fig. 6, Difference of Calculated and MeasuredOutlet Temperatures at 17 fpd Fj,g. 7, Difference of Calculated and Measured
Outlet Temperatures at 1O5 fpd
to say anything about Fig. 5. The axial shape suggested by themeasurements is unrealistic and the calculated shape bears noresemblence to it. It should be pointed out that after comparingthe measured and calculated distributions at every measuredposition the calculated and measured shapes are similar ingeneral, the disagreement shown in Fig. 5 occurs only a couple oftimes out of the available 70 SPND measurements. In general thecalculation agrees better with the measurements at 17 fpd than at105 fpd. The reason, besides cumulating possible calculationalerrors, must be the cumulating uncertainty of the burnup cycle.
It is known that rod position, local power and burnup allinfluence the local energy release and none of those quantitiesis known fully and certainly from the history.
Fig. 6 and 7 shows the differences of calculated and measuredoutlet temperatures at 17 fpd and at 105 fpd, respectively. Themaximal difference is 4.9 C° and 6.8 C» , respectively. Comparingmeasured values of symmetric positions we conclude the error ofthe temperature measurement must be somewhere about 2-3 O . Nosignificant deviation can be observed between the measured andcalculated temperature distributions.

5.CONCLUSIONS VALIDATION OF FUMACS CODE PACKAGEWe have presented the first calculations by the KARATE
system. The first burnup cycle of unit-1 of the Kalinin NPP hasbeen calculated and the boron concentrations as well as the kvalues, axial shapes have been compared to measurements. Thecalculated boron concentrations agree fairly well with themeasurements. The k distributions are also in accord with themeasurements, thougff there the experimental values are sometimescontradicting. As to the axial shapes, the calculated shapes arenot far from the measured ones in some cases and suggestcorrections of the extrapolation distances at the top and bottomof the core.
I.V. Saprykin et al.manuscript, 1990
REFERENCES
Benchmark Problems of Kalininskaya NPS,
2.The quoted file represents the conribution of USSR to theactivity of the TIC working group called " TewaTMMecKasi rpynnano CO3A3HMIO MHipopMauMOHHO TO cpaM/ia 3KCn/iy arauwOHHbJX danHbixBB3P-440 n BB3P-1000" (group establishing information file onoperational data of VVER-440 and WER-1000). The file wasdistributed on the meeting of the group in Sofia.
3.A.1,Collective (TIC),
A Suslov et al. Core Characteristics of Kalinin NPP Unitp. 267-284, Proc. XIX. Symposium of Temporary International
Siofok, Hungary. 19904.A. N. Novikov et al.: Problems of WER In-Core Fuel Management,Proc. In-Core Fuel Management Practices Mtg., IAEA-TECDOC-567,p.325, Vienna, 1990
5.J. Gado. State of Calculational Complex KARATE,Symposium of TIC, 1,175, Prahatice, CSSR, 1989
Proc. XVIII.
B PETROVIC*, D. PEVEC**, T SMUC*, N URLI*
*Ruder Boskovic Institute**Faculty of Electrical Engineering,
Zagreb UniversityZagreb, Yugoslavia
AbstractThe FUMACS code package (an acronym for Fuel MAnagement code System) was
developed at Ruder Boskovic Institute with the aim to enable m core fuel management analysisof PWR core FUMACS encompasses computer codes PRELEO, PSU LEOPARD/RBI andMCRAC/RBI The computer code PRELEO is designed to fully automate preparation of inputtor the PSU LEOPARD/RBI code PSU LEOPARD/RBI is based on the PSU LEOPARDcode with several options added, including the method to model integral fuel burnableabsorbers The group constants generated by PSU LEOPARD/RBI are used to perform globalreactor calculations using the MCRAC/RBI code MCRAC/RBI is improved version of theMCRAC code, including burnup modelling on quarter assembly level and local power peakingfactor prediction The code package is completely written in FORTRAN 77 standard and itruns on a personal computer (IBM-PC or compatible) The validation of the FUMACS codepackage was performed by comparison of FUMACS results with design parameters for thefirst eight reload cycles of NPP Krsko core The differences between critical boronconcentrations calculated by FUMACS and design data are typically within 30 ppm Thedifferences in assemblywise power and burnup distributions are typically within 6%, and thedifference in power peaking factor is typically within 3% The comparison showed that theFUMACS code package is the fast and reliable code system suitable for repetitive andnumerous in core fuel management calculations
INTRODUCTION
to
FUMACS code package has been developed at Ruder Boskovic Institute (RBI) for in-core fuel management analysis of NPP Krsko core*-1) It is based on PSU LEOPARD andMCRAC codes which are obtained from Penn State University in the frame of IAEA expertservice These codes were constantly improved and modified to enable modeling ofinnovations which were introduced in PWR technology in the last decade The experienceaccumulated in applying these codes to in core fuel management calculations of NPP Krsko
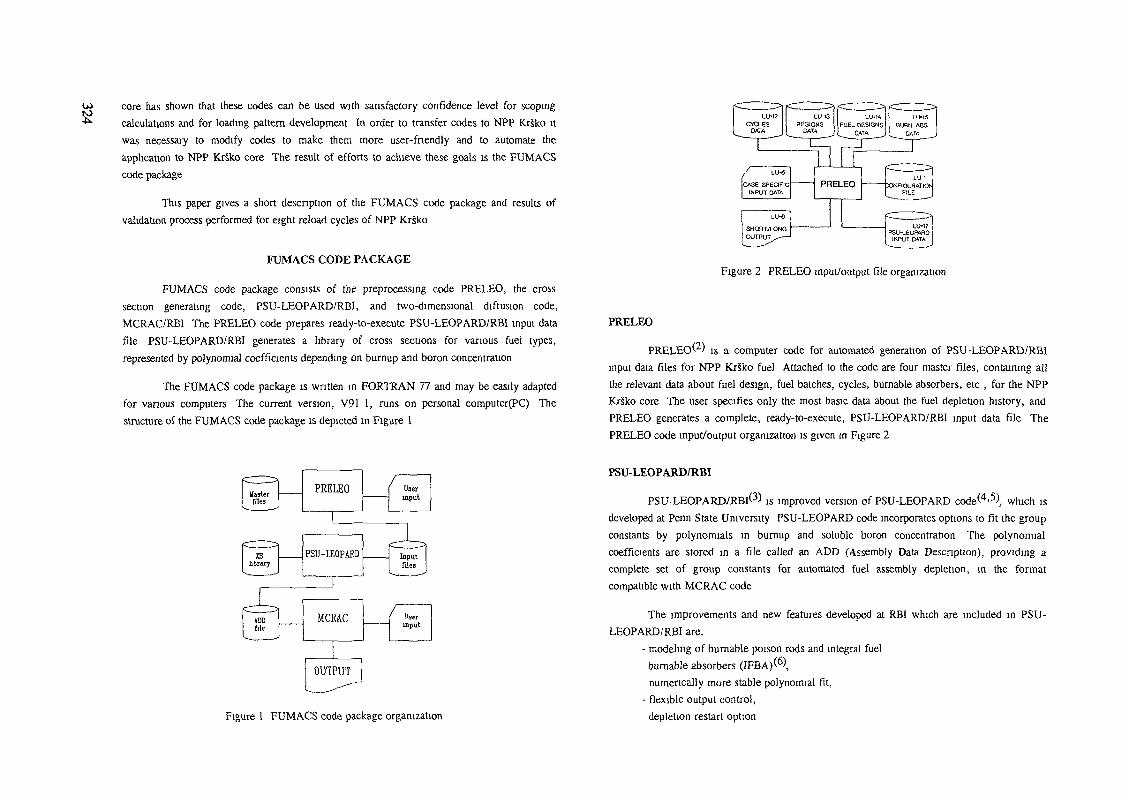
core has shown that these codes can be used with satisfactory confidence level for scopingcalculations and for loading pattern development In order to transfer codes to NPP Krsko itwas necessary to modify codes to make them more user-fnendly and to automate theapplication to NPP Krsko core The result of efforts to achieve these goals is the FUMACScode package
This paper gives a short description of the FUMACS code package and results ofvalidation process performed for eight reload cycles of NPP KrSko
FUMACS CODE PACKAGE
FUMACS code package consists of the preprocessing code PRELEO, the crosssection generating code, PSU-LEOPARD/RBI, and two-dimensional diffusion code,MCRAC/RB1 The PRELEO code prepares ready-to-execute PSU-LEOPARD/RBI input datafile PSU-LEOPARD/RBI generates a library of cross sections for various fuel types,represented by polynomial coefficients depending on burrwp and boron concentration
The FUMACS code package is written in FORTRAN 77 and may be easily adaptedfor various computers The current version, V91 1, runs on personal computer(PC) Thestructure of the FUMACS code package is depicted in Figure 1
Figure 2 PRELEO input/output file organization
PRELEO
PRELEO^2) is a computer code for automated generation of PSU-LEOPARD/RBIinput data files for NPP Krsko fuel Attached to the code are four master files, containing allthe relevant data about fuel design, fuel batches, cycles, burnable absorbers, etc , for the NPPKrsko core The user specifies only the most basic data about the fuel depletion history, andPRELEO generates a complete, ready-to-execute, PSU-LEOPARD/RBI input data file ThePRELEO code input/output organization is given m Figure 2
filesPRELEO User
input
PSU-LEOPARD
Figure 1 FUMACS code package organization
PSU-LEOPARD/RBI
PSU-LEOPARD/RBl(3) is improved version of PSU-LEOPARD code<4>5), which isdeveloped at Penn State University PSU-LEOPARD code incorporates options to fit the groupconstants by polynomials in burnup and soluble boron concentration The polynomialcoefficients are stored in a file called an ADD (Assembly Data Description), providing acomplete set of group constants for automated fuel assembly depletion, in the formatcompatible with MCRAC code
The improvements and new features developed at RBI which are included in PSU-LEOPARD/RBI are.
- modeling of burnable poison rods and integral fuelburnable absorbers (IFBA)(6\numerically more stable polynomial fit,
- flexible output control,depletion restart option

MCRÀC/RBI FUMACS VALIDATION
MCRAC/RBI^7) is improved version of MCRAC code^8»9), which is developed atPenn State University MCRAC performs global analysis of PWR core using ADD filegenerated by PSU-LEOPARD
MCRAC/RBI Version 91 1 is specially developed to perform in-core fuelmanagement calculations of NPP Krako core. The main characteristics of this version are
- core modeling by following separately quarter fuelassembly bumups,
- unfolding of core loading from quarter core level tofull core level,
- pin-power reconstruction,- simplified input structure,
diversified output levels,fuel assembly interchange option including "rotations"
Difference in Critical BoronNEK Cy-6, RBI (m-91-27/mcy6-2) and W
U>to
9080706050403020100
-10-20-30-40-50-60-70
prj
-90
//
»~ — •» -^- — 1 — • — .—— —^~ -~-~
-~»
0 2 4 6 8 10 12
Burnup [MWd/kqU]
The validation of the FUMACS code package has been made against operational datafor cycle 2 to cycle 9 of NPP KrSko The results for nominal conditions were compared withdata from Westmghouse core design reports The parameters compared include critical solubleboron concentration, average and peak power and burnup per assembly dunng each cycleDifferences m concentration of soluble boron, power peaking factor, and average fuelassembly power throughout cycle 6 of NPP Krsko are depicted m Figures 3 to 5 EOC burnupdifference distribution is given in Figure 6 A summary of the difference intervals for eightreload cycles of NPP Krsko is given in the Table 1 and Table 2 The critical soluble borondifferences are typically within 30 ppm The differences in assemblywise power and burnupdistributions are typically within 6 %, and the difference in power peaking factor is typicallywithin 3% The validation has shown that FUMACS code package can be used for performingm-core fuel management analysis of NPP Krsko, even when complex loading patterns areconsidered
Cyclewise Difference in FxyNEK Cy-6, RBI (m-91-27/mcy6-2) and W
Q97
17,5%5%42iwp
-1%
-4%C *f
P°7
-7«-
-9%-10?S
\.,—s _ — . — ,— ~— -, 1 "
4 6 8
Bimjp [MWd/kqU]
10 12
Figure 3 Difference in critical boron vs burnup for NPP Krsko, cycle 6 Figure 4 Difference in power peaking factor vs burnup for NPP Krsko, cycle 6

to Cyclewise Difference in NPsNEK Cy-6, R8I (m-91-27/mcy6-2) ond W
1555
10%
5%
0%
*:5 -57.
-10%
-15%
-20%
'b-
2 4 5 8
Bu-rxjp [NWd/kgU]a avrg + max neg. o max pos
10 12
Figure 5. Difference in normalized power vs. burnup for NPP Krsko, cycle 6
Table I
CycleNumber
23456789
Difference intervalin boron concentr.
(ppm)
(-15, +20)(-10, +20)(+30, +65)( -2S,+5)(-15, +15)(-10, +20)(-50, +10)(-10, +50)
Difference interval inpower peaking factor
(*)
(-1.5, +1 .5)(-0.0, + 3 . 0 )(-1.0, +1.0)(-1.0, +6 .0 )(+3.0, + 4 . 0 )(-1.0, +3. 5)(+2. 5, + 4 . 0 )(-1.5, + 0 . 5 )
1347613710-1.7
1254113061-4.0
1186612355-4.0
15177146363.7
1242312732-2.4
13750134602.2
57346090-5.8
1252513048-4.0
1238912700-2.4
1286013148-2.2
1248212787-2.4
13632135031.0
13123129931.0
616559972.8
1179212286-4.0
1281413108-2.2
1148311824-2.9
14674142063.3
12810127970.1
11292108873.7
15145146123.6
1246212768-2.4
14664141723.5
1190412293-3.2
12757127130.3
51855229-0.8
1241112712-2.4
13619134811.0
12800127620.3
12754126930.5
753372513.9
13742134262.4
13115129691.1
11287108663.9
51845223-0.7
57326083-5.8
616159872.9
Legend:FUMACS EOC burnup in MWd/tUReference EOC burnup in MWd/tURelative difference in %
Figure 6. Companson of FUMACS and reference EOC burnup distribution for NPP Krsko,cycle 6
Table 2
CycleNumber
23456789
Difference intervalin normalized power(*)
(-6.0, +6.0)(-6.0, +9.0)(-9.0, +11.0)(-5.0, +7.0)(-6.0, +6.0)(-5.0, +6.0)(-9.0, +8.0)(-6 0,+7.0)
Difference intervalin EOC burnup
(-S.8,+6.1)(-4. 7, +6.1)(-7.1, +8. 3)(-4. 6, +5.0)(-5. 8, +3. 9)(-8. 7, +6.1)(-4.0, +7.0)(-3. 7, +4.1)
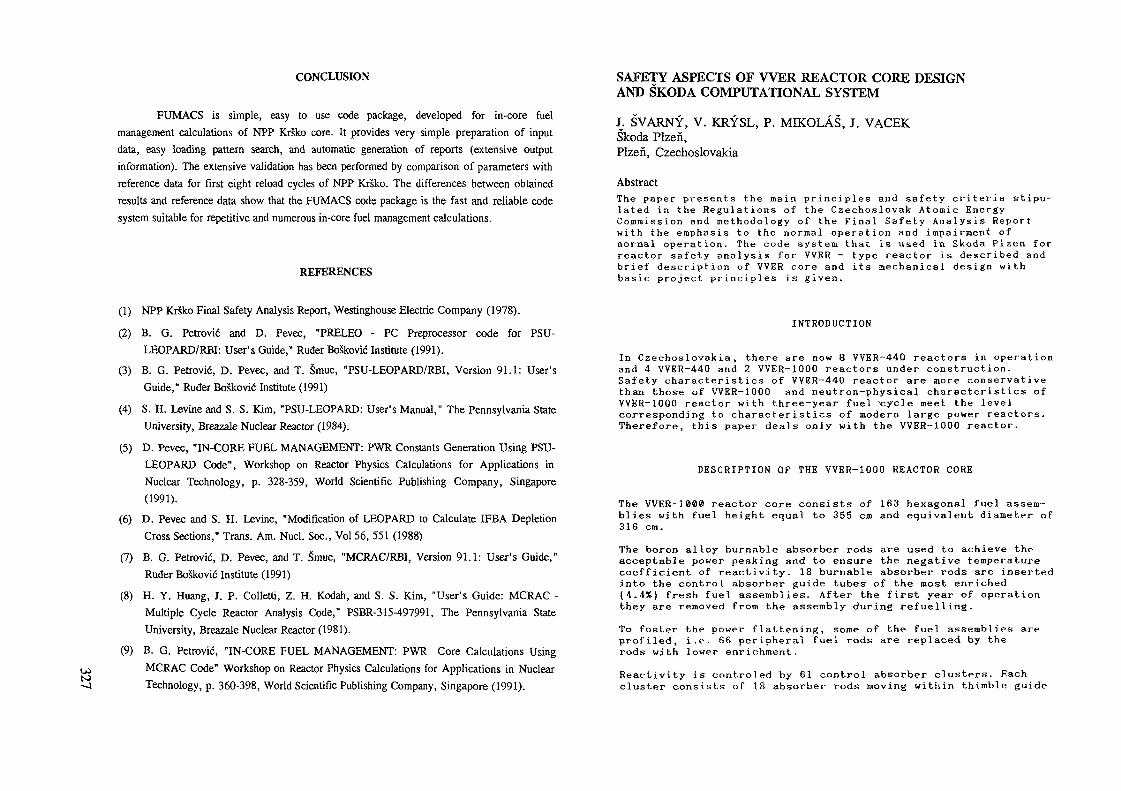
CONCLUSION
FUMACS is simple, easy to use code package, developed for in-core fuelmanagement calculations of NPP Krsko core. It provides very simple preparation of inputdata, easy loading pattern search, and automatic generation of reports (extensive outputinformation). The extensive validation has been performed by comparison of parameters withreference data for first eight reload cycles of NPP Krsko. The differences between obtainedresults and reference data show that the FUMACS code package is the fast and reliable codesystem suitable for repetitive and numerous in-core fuel management calculations.
REFERENCES
SAFETY ASPECTS OF WER REACTOR CORE DESIGNAND SKODA COMPUTATIONAL SYSTEM
J. SVARNY, V. KRYSL, P. MIKOLÂS, J. VACEKSkoda Pken,Plzen, Czechoslovakia
AbstractThe paper presents the main principles and safety criteria stipu-lated in the Regulations of the Czechoslovak Atomic EnergyCommission and methodology of the Final Safety Analysis Reportwith the emphasis to the normal operation and impairment ofnormal operation. The code system that is used in Skoda Plzen forreactor safety analysis for WER - type reactor is described andbrief description of WER core and its mechanical design withbasic project principles is given.
(1) NPP Kräko Final Safety Analysis Report, Westinghouse Electric Company (1978).
(2) B. G. Petrovié and D. Pevec, "PRELEO - PC Preprocessor code for PSU-LEOPARD/RBI: User's Guide," Ruder Boskovié Institute (1991).
(3) B. G. Petrovié, D. Pevec, and T. Smuc, "PSU-LEOPARD/RBI, Version 91.1: User'sGuide," Ruder Boskovic Institute (1991)
(4) S. H. Levine and S. S. Kim, "PSU-LEOPARD: User's Manual," The Pennsylvania StateUniversity, Breazale Nuclear Reactor (1984).
(5) D. Pevec, "IN-CORE FUEL MANAGEMENT: PWR Constants Generation Using PSU-LEOPARD Code", Workshop on Reactor Physics Calculations for Applications inNuclear Technology, p. 328-359, World Scientific Publishing Company, Singapore(1991).
(6) D. Pevec and S. H. Levine, "Modification of LEOPARD to Calculate IFBA DepletionCross Sections," Trans. Am. Nucl. Soc., Vol 56, 551 (1988)
(7) B. G. Petrovié, D. Pevec, and T. Smuc, "MCRAC/RBI, Version 91.1: User's Guide,"Ruder BoSkovie Institute (1991)
(8) H. Y. Huang, J. P. Colletti, Z. H. Kodah, and S. S. Kirn, "User's Guide: MCRAC -Multiple Cycle Reactor Analysis Code," PSBR-315-497991, The Pennsylvania StateUniversity, Breazale Nuclear Reactor (1981).
(9) B. G. Petrovié, "IN-CORE FUEL MANAGEMENT: PWR Core Calculations UsingMCRAC Code" Workshop on Reactor Physics Calculations for Applications in NuclearTechnology, p. 360-398, World Scientific Publishing Company, Singapore (1991).
INTRODUCTION
In Czechoslovakia, there are now 8 WER-440 reactors in operationand 4 WER-440 and 2 WER-1000 reactors under construction.Safety characteristics of WER-440 reactor are more conservativethan those of VVER-1000 and neutron-physical characteristics ofWER-1000 reactor with three-year fuel -cycle meet the levelcorresponding to characteristics of modern large power reactors.Therefore, this paper deals only with the WER-1000 reactor.
DESCRIPTION OF THE WER-1000 REACTOR CORE
The VVER-1<9«0 reactor core consists of 163 hexagonal fuel assem-blies with fuel height equal to 355 cm and equivalent diameter of316 era.The boron alloy burnable absorber rods are used to achieve theacceptable power peaking and to ensure the negative temperaturecoefficient of reactivity. 18 burnable absorber rods are insertedinto the control absorber guide tubes of the most enriched(4.4%) fresh fuel assemblies. After the first year of operationthey are removed from the assembly during refuelling.To foster the power flattening, some of the fuel assemblies areprofiled, i.e. 66 peripheral fuel rods are replaced by therods with lower enrichment.Reactivity is controled by 61 control absorber clusters. Eachcluster consists of 18 absorber rods moving within thimble guide

Wtooctubes under control of the individual drive. Clusters are groupedinto ten groups. The tenth group is the operating one, the fifthgroup consists of part length absorber rods and is used tocontrol axial power distribution during Xenon transients.
SAFETY ANALYSIS REPORTS FOR THE WER
The Rules of the Czechoslovak Atomic Energy Commission (CAEC)require that each application for the construction permit of anuclear reactor facility include a Preliminary Safety AnalysisReport ( PSAR) and each application for the operating license isaccompanied by a Final Safety Analysis Report (FSAR).
In the 88's, the CAEC issued a series of the Safety Guides speci-fying in general terms the contents of the Safety AnalysisReports (SAR). The Guides are updated so that they reflect thecurrent developments in the nuclear technology and reactorphysics. Each edition is approved by the CAEC board.The department of Physics of the Skoda Works Nuclear EngineeringPlant is responsible for the Volume 3 of the SAR which deals withthe reactor physics aspects of the reactor safety in normal,abnormal and emergency operating conditions. This volume containsthe information relevant to the other SAR's volumes covering thethermohydraulic aspects and accident analyses.Some of the safety considerations incorporated into the VVER-1000core design are summarized in the this section.
An ultimate objective of nuclear fuel design is to producenuclear fuel that will not release fission products to the pri-mary coolant under any conditions of normal operation .This isassured by the first general design fuel cladding integrity cri-teria 2'3:a) No more than 1 percent of the fuel elements can have defects
of gas leakage type.b) No more than 0.1 percent of the fuel elements disrupture with
pellet - coolant contact.These limits are defined only from the point of view of operationand repair. In reality, the probability of the occurence of suchfuel element damages during VVKR operation is lower than 0.0075'.For the accident with a rupture of the primary circuit (the maxi-mum design breakdown), according to GRS the emergency coolingsystem must secure the following general design cladding integri-ty criteria:a) The temperature of the cladding must be lower than 1200C-b) The local depth of oxidation doesn't excceed 18 percent of the
cladding thickness.c) Chemical reaction Zr - HoO doesn't exceed 1 percent of the
total Zr mass.
The nuclear fuel design criteria require that the fuel is able toaccomodate both normal operating transients as well as singlecomponent malfunections in the reactor control and protectionsystem without loss of integrity. The malfunctions considered maybe:- failures in the reactor control and monitoring system,- a loss of main circulating pumps feeding,- an outage of the turbo-generator and heat removal systems,- a complete loss of external power supplies,- a leakage of the primary circuit which can be compensated by
operational refilling systems.Main fuel lattice parameters are fuel rod diameter, fuel rodpitch, geometry of the fuel rod lattice, and moderator/fuelratio. Core design data for the VVER-1000 and a typical PWR ofcurrent generation are presented in Table 1.
Light water reactors of current generation are generally under-moderated at power operating conditions, because an under-mode-rated reactor has a negative temperature coefficient of reacti-vity and a higher conversion ratio, which improves the fueleconomy. The moderator/fuel ratio of the VVERs and PWRs issimilar (or for VVERs little smaller then for many PWR ).
Because diameter of the fuel rod in VVER is smaller than inPWR , the fuel rod surface-to-mass ratio is higher. It causes anincrease in the resonance absorption and a consequent decrease ink~inf of the VVERS. Other consequence of the smaller rod diameteris the necessity of higher enrichment of the VVKR fuel (4.4%).In the present VVER design the reload fuel enrichment is strictlydetermined and cannot be changed on the basis of the reqruire-ments of the cycle bein loaded like in the PWR projects.As the fissile content of VVER fuel is higher than that of PWRfuel, the relative absorption in moderator decreases and thelocation of the k-inf maximum occurs at a higher moderator/fuelratio, and also temperature coefficient of reactivity is morenegative.In VVER design, the fuel rod cladding (Zr + 1 * Nb) must accom-modate thermal, pressure, and fatigue stress without failure in ahigh temperature and radiation environment for three yearsperiod. All these effects are both theoretically and experiumta] --ly explored.In both normal and deviated from normal operating conditionsthe following criteria having a leading role in the core designmust be fulfiled:
1. For operability of fuel elements, the criteria of strengthare: the stability of cladding, the deformation criteria, andthe acceptable crevice corrosion under stress in the presenceof aggressive fission products. The last one is very impor-tant: A defect in the cladding /crevice/ accumulated during

Table 1. Comparison of the Main WER and PWR Core Characteristics
1. Geometry of the fuel rodlattice
2. Rod pitch, mm
3. Fuel rod outside diameter, mm
4. Clad thickness, mm
5. Pellet central hole, mm6. Composition of grids
7. Core average active fuel
WER
triangular
12.75
9.1
0.69
2 4steel
PWR
square
>12.6
>~9.50.57 (Fr.)
,56-0.64 (West.),64-0.72 (KWU)
Zircaloy
8.9.
10.11.12.
13.14.
height, cm
Height - to - diameter ratioNumber of guide t.himblesper assemblyComposition of guide thimblesNeutron absorber
Linear heat generation rate,KW/m
Power density, KW/i
Coolant pressure, MPa
3561. 14
18st eelB4C
165.710715.9
>3561.08... 1.14
24Zi rcaloy
Ag-In-Cd
>170
95--104
-16
2. Temperature of the cladding should not exceed level about400C.
VVTSR cladding temperatures during normal operation are as fol-lows:cladding external surface 352Coxide-metal layer 358Ccladding internal surface 416C
3. The diametral clearance between the fuel and cladding must bechosen so that during normal operation internal pressuredoesn't exceed external pressure.
After three years of operation the internal pressure reaches16 MPa, which is equal to the pressure of the coolant. Maximumguaranteed permissible mean burnup value in most loadedelement is 55.3 MWd/kgU. Design maximum burnup value afterthree years of operation is 54 MWd/KgU. Relatively highburnup limit is achieved by the presence of the central holein the fuel pellet and small initial internal pressure (2MPa).
4. Fuel temperature must be more than 10 percent lower than thefuel melting point.
The melting point of fresh fuel is ~3100C and for burnup60 MWd/kgl) it. is -2870C. During normal operation thiscritérium is fulfiled with 80 percent reserve.
5. The Departure from Nucleate Boiling Ratio (DNBR) must begreater then 1.15.In the actual WER project under the most unfavourable combi-nation of parameters deviations from nominal values the crité-rium for DNBR is fulfiled and reach value 1.19 (by both theTong's and 0KB Gidropress correlations). The 15 percent marginwith confidence level of 95 percent is taken into account.
6. The power coefficient is a measure of the feedback that isassociated with changes in power. In the WER project,requirements of GRS ' on negativity of the total powercoefficient of reactivity are met in all critical states.
K>
the cycle period must not exceed 60 >im in depth, with takinginto consideration the permisible initial defect correspondingto 50 urn.
It is supposed that this critérium can be met during normaloperation and predicted power transients only by minimizingdeviations of the local power changes so that they should notexceed +13 percent of nominal values.
The last issue of GRS requires the negativity of the tempe-rature coefficient of reactivity (ap/ST^) in all operating andstart-up critical states. Negative value of ap/ôTv. in the WERproject is more suitable influenced than in the PWR projectby the higher enrichment, leakage of neutrons fromthe core, and moderator/fuel ratio. Unfortunately, the prevai-ling effect of a soluble boron concentration causes thatdp/3Tj, becomes positive in some critical states (e.g. duringthe reactor startup) This effect is closely connected withthe chosen nonoptimal type of burnable absorbers made of boronalloy, high enrichment, and lifetime of the fuel cycle. Therecommendation that each critical state must have temperature
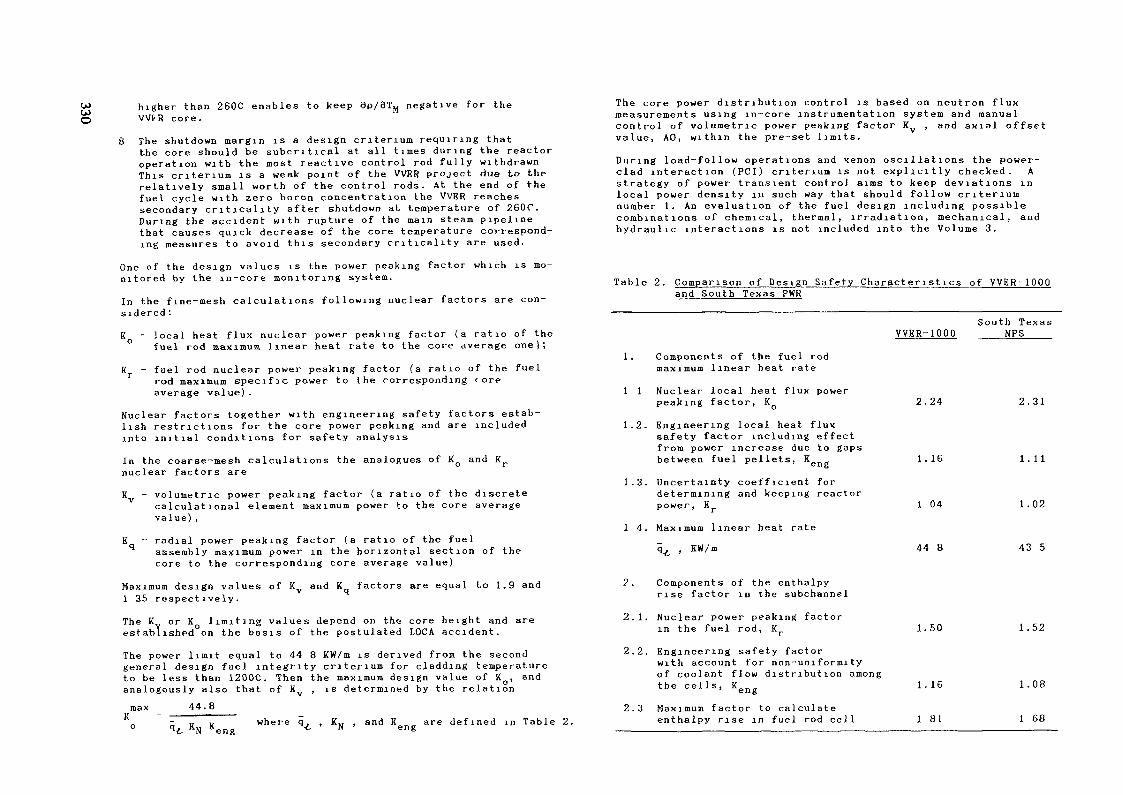
W higher than 260C enables to keep 3p/3TM negative for theO VVI'R core.
8 The shutdown margin is a design critérium requiring thatthe core should be subcritical at all times during the reactoroperation with the most reactive control rod fully withdrawnThis critérium is a weak point of the WER project due to therelatively small worth of the control rods. At the end of thefuel cycle with zero boron concentration the WER reachessecondary criticality after shutdown at temperature of 260C.During the accident with rupture of the main steam pipelinethat causes quick decrease of the core temperature correspond-ing measures to avoid this secondary criticality are used.
One of the design values is the power peaking factor which is mo-nitored by the in-core monitoring system.In the fine-mesh calculations following nuclear factors are con-sidered :KQ - local heat flux nuclear power peaking factor (a ratio of the
fuel rod maximum linear heat rate to the core dverage one);
K - fuel rod nuclear power peaking factor (a ratio of the fuelrod maximum specific power to the corresponding (oreaverage value).
Nuclear factors together with engineering safety factors estab-lish restrictions for the core power peaking and are includedinto initial conditions for safety analysisIn the coarse-mesh calculations the analogues of KO and Krnuclear factors areK - volumetric power peaking factor (a ratio of the discrete
calculational element maximum power to the core averagevalue) ,
K - radial power peaking factor (a ratio of the fuelassembly maximum power in the horizontal section of thecore to the corresponding core average value)
Maximum design values of Ky and K factors are equal to 1.9 and1 35 respectively.The K or KQ limiting values depend on the core height and areestablished on the basis of the postulated LOCA accident.The power limit equal to 44 8 KW/m is derived from the secondgeneral design fuel integrity critérium for cladding temperatureto be less than 1200C. Then the maximum design value of KQ, andanalogously also that of Ky , is determined by the relationmax 44.8~ — —— — — -~ ——— • _where q,
The core power distribution control is based on neutron fluxmeasurements using in-core instrumentation system and manualcontrol of volumetric power peaking factor K , and axial offsetvalue, AO, within the pre-set limits.
During load-follow operations and xenon oscillations the power-clad interaction (PCI) critérium is not explicitly checked. Astrategy of power transient control aims to keep deviations inlocal power density in such way that should follow critériumnumber 1. An evaluation of the fuel design including possiblecombinations of chemical, thermal, irradiation, mechanical, andhydraulic interactions is not included into the Volume 3.
Table 2. Comparison of Design Safety Characteristics of VVER-1000and South Texas PWR
South TexasVVER-1000 NFS
1. Components of the fuel rodmaximum linear heat rate
Kq K K , and K are defined in Table 2.
1 1 Nuclear local heat flux powerpeaking factor, KQ 2.24
1.2. Engineering local heat fluxsafety factor including effectfrom power increase due to gapsbetween fuel pellets, K 1.16
1.3. Uncertainty coefficient fordetermining and keeping reactorpower, Kr 1 04
1 4. Maximum linear heat rateq, , KW/m 44 8
?. Components of the enthalpyrise factor in the subchannel
2.1. Nuclear power peaking factorin the fuel rod, Kr 1.50
2.2. Engineering safety factorwith account for non-uniformityof coolant flow distribution amongthe cells, Kgng 1. 16
2.3 Maximum factor to calculateenthalpy rise in fuel rod cell 1 81
2.31
1.11
1.02
43 5
1.52
1.08
1 68

SKODA code systea
WIMS-TRACA1D,2D spectral ca lcu la t ions
HECONalbedo boundary conditionsAPRO, PARAMETparametrizat ion ^HOMOGShomo gen ization
HEXALOK3D fine mesh assembly calculationsMOBY-DICK (PERMAK)2D fine mesh core calculations
CALOPEA3D te rmohydraul ic subchannelassembly analys is
CALOPEA-R3D termohydraulic subchannelcore analysis
MOBY-DICK (TRAP, PETR)2D, 3D coarse-meshcalculations
OPTICONID simulator of Xe oscilations
Fig.l. (physical and thermohydraulic codes for normal operation)
During coarse control (bank-bank), the value of axial offset iskept within its limits by part length rods. Control which assuressuppression of power distribution xenon oscillations within theshortest period of time i& realised. More refined power distribu-tion control aimed at the minimization of the axial offsetdeviation (±5 %) from its stationary value is under development.The main design safety characteristics of VVER-1000 and SouthTexas PWR , presented in Table 2, show that corresponding safetycharacteristics are comparable, the values of WER safety factorsbeing more conservative.
SKODA WORK'S CODE SYSTEM
The Skoda Work's system for physical and thermohydraulic calcu-lation of VVER cores is presented in Fig.l. The backbone of thissystem, which is used for all SAR calculations, is a vprsion of
the WIMS code (WIMS-TRACA) used for the lattice calculations andoriginal Skoda global core simular MOBY-DICK based on the 3Dcoarse-mesh and 2D fine-mesh few-group difference diffusionapproximation.
The code WIMS-TRACA5 is used for the lattice calculations at aset of discrete lattice states that span the expected range ofstate variables. Both cell-averaged and assembly-averaged few-group diffusion constants can be produced for global reactorcalculations. TRAÇA version was selected, as it allows region-wise homogenization and therefore several sets of data can beprepared simultaneously for different subregions of the modelledstructure. For our calcul ationa1 scheme it is also important,that we can model non-asymptotic cells by adding the extra regionand average diffusion constants of the inner regions in thedisturbed spectrum The applicability of WIMS to the preparationof few-group diffusion data for uniform and non-uniform latticesW)th control absorbers and water gaps was verified by theanalysis of selected experiments .

w The code HECON is a ID code computing the heterogeneous constantsto by collision probability method. The calculations are performed
in 10 groups with input data prepared by WIMS Resulting 2 or 4group y matrix coupling flux and current on the surface of theelement, J = -y 4> , is used to simulate boundary conditions in thecoarse-mesh approximation of the MOBY-DICK code
HOMOGS is a few-group 2D finite difference diffusion code intend-ed for the assembly homogenization. The fine-mesh diffussionconstants obtained from WIMS and processed by the code PARAM orAPRO are input to this code. The spectrum perturbations aremodelled similarly as in WIMS by adding an extra region to theassembly and averaging the constants only over the volume of theassembly including the inter-assembly gap Advantage of thissecond stage homogenization is that code HOMOGS, in contrast tocylindrical model of WIMS, is able to treat the fuel assembly inthe actua) regular hexagonal iepresentation
The correlation codes APRO and PARAM process the files preparedby WIMS in the form of few-group libraries based on the method ofthe least squares and perform search for the optimum regressionpolynomials While some parameters are separable, others arecorrelated and therefore mixed terms appear in resultingpolynomials Up to now, the code has not been able to determinesystematically the degree of the correlations and heuristicapproach is used to select the appropriate combinations
nMOBY-DICK is a code system solving few-group diffusion equa-tion It uses Borresen's modifications of the finite differencescheme by which averaged diffusion coefficient can be expressedlike the geometric mean,
Using the transformation
vi = ^ Di ' *i 'finite-difference equations can be written in a form allowingsubstantlonal reduction of computer memory and time The systemallows to construct two computational paths- triangular mesh with subdivision of the hexagonal mesh element
to 6K triangles, used for 3D coarshe mesh core calculations,- hexagonal mesh, used for 2D fine-mesh calculations of the layer
of the coreCritical assemblies (i e the assemblies in which the safetymargins could be violated) are usually determined on the basis ofthe three dimensional coarse-mesh calculation Pin-by-pin powerdistributions can then be determined by the code HEXALOK thatperforms a 3D fine-mesh diffusion calculations of the selectedassemblies Non-homogenous boundary problem is solved, boundaryconditions being determined on the basis of the precedingcoarse-mesh core calculation
The code OPTICON is a ID simulator of the Xenon oscillationsduring reactor operation The calculations are performed in 2groups with input data prepared by MOBY-DICK. The code is intended for the quick analysis and preparation of recommendations fordamping of axial xenon oscillations during start-up and normaloperation of VVER-1000
Basic input data for coarse- and fine-mesh codes are parametrizedin dependence on the burnup A, technological parameters V (fueltemperature, moderator temperature (or density), concentrationsof soluble boron and Xe, Sm) and corrected by the instantaneousand the historical spectral corrections:Z - 2AS
where t
\\
K IN + KIS (1)AS macroscopic cross section of the basic calculation
(without spectral and V perturbations),correction on perturbations of V,correction on instantaneous spectral perturbations,correction on historical spectral perturbations
Under spectral perturbation we understand the departure of thespectrum from the basic calculation and it is characterized byinstantaneous spectral index (defined as the double ratio ofepithermal to thermal flux) and historical spectral index(defined as the instantaneous spectral index averaged over thelifetime of the fuel element)
Shortly, preparation of the few-group library is realized in thefolowing steps In the first step, one-dimensional spectralcalculations (cell and supercell geometry) for nominal andperturbed spectra and technological parameters V are performed bythe code WIMS Resulting equivalent cell constants are in nextstep processed by the codes PARAM (or APRO) into fine-meshlibrary of the form (1). With this library, the fuel assembly ishomogenized by the code HOMOGS and homogenized data are thenagain processed by PARAM or APRO into coarse-mesh input librariesof global code MOBY-DICK in the form (1)
The program CALOPEA uses the subchanne] analysis to predictthermohydraulic properties of the individual fuel assemblies andof the core in normal and transient operating modes. Program isbased on methods employed in the code COBRA-TII . As inputs,coarse mesh (in case of CALOPEA-R) or fine-mesh (pinwise, in caseof CALOPEA) power distributions created by MOBY-DICK, BIPR andHEXALOK, are used.
REFERENCESCode of Regulations on the Nuclear Safety of NuclearFacilities (in Czeuh ) , Prague, 1984
o OCTM A3C npw npoeKTnpo-(OPIB-82) , 3neproa-ro«n3flaT,
1983

npaBMJia naepnon ôeaonacHocru a-ro/nHux 3/ieKTpoCTaHu.nii,(OES)-04-74) , MocKBa, ATOMHS/OT, 1977
06mnecoopyxeHMM
1983
6e3onacHOCTn A3C ripn npoexTMpo-BKcnjiy arau.MH (OITE-89) , 3neproa-roAM3AaT,
C Ahnert, J M. Aragones MARIA System A code Block for PHRFuel Assembly Calculation, JEN 543, 1983J. Vacek, P. Nikolas, J. Svarny, V. Krysl SKODA ComputationalSystem for WWER Reactors, Specialist Meeting on Advanced Cal-culational Methods for Power Reactors, Cadarache, France,September 1990V. Krysl, M. Lehmann, J Machacek Theoretical foundations ofa Modular Macrocode System "MOBY-DICK", Skoda Internal ReportA A MapanasoB Me-roanKa pacnera MOIMHOCTBM xacceT pean-ropoBBB3P B AByxrpynnoBOM An4>4>y3MOHHOA npuß/imceHMM, Mocusa, 1977
D.S.Rowe' COBRA-IJJ, A Digital Computer Program ... ,BNWL-B-82 (1971)
PREWIMS-VVER: A WIMS-D/4 INPUT DATAPREPARATION CODE FOR VVERs
A. GONZALEZ-GARCIA, D. LOPEZ-ALDAMA,D. MILIAN-LORENZO, C. ALVAREZ-CARDONACentro de Estudios Aplicados al Desarrollo Nuclear,La Habana, Cuba
Abstract
The establishment of a fewgroup l ibrary requires the developmentof the d " i f f e r p n t geometr ica l models to calculate the neut ron andphysical characteristics of the studied lattice In order top e r f o r m this work using the WIMS-D/4 code previous calculationsand the preparation of the input data are needed. This is atedious work l iable to error
In this paper we describe the geometrical models developed tocalculate a fewgroup constants library for VVERs lattices andalso we show the relevant features of the PREWIMS-VVER code,which is able to prepare the WIMS-D/4 input data for differentconditions
This work was under the International Atomic Energy Agencyresearch contract 5701/RB.
10
1 INTRODUCTION
For the calculation of WER lattices by means of WIMS-D/4code, previous calculations and the preparation of input data forsuch code are needed This is a tedious work liable to errors.Therefore it is convenient to automatize this work in order toreduce the time for input data preparation as well thepossibility of errors.
The PREWIMS-VVER module generates interface unitscontaining input data for WIMS-D/4 code for different geometricalmodels considered for the calculation of neutron and physicalcharacteristics of WER reactors. For different conditions oftemperature, boron concentration, fuel enrichment and latticeperturbations the module calculates.
-Nuclear densities for basic materials and material mixtures-Water density as a function of temperature and pressure.-Dimensional expansions-Dancoff and Bell factors as a funct ion of geometry, waterdensity and resonance energies
This paper presents the PREWIMS-VVER general characteristicstogether with description of the geometrical and physical modelsconsidered Finally a sample problem is shown.
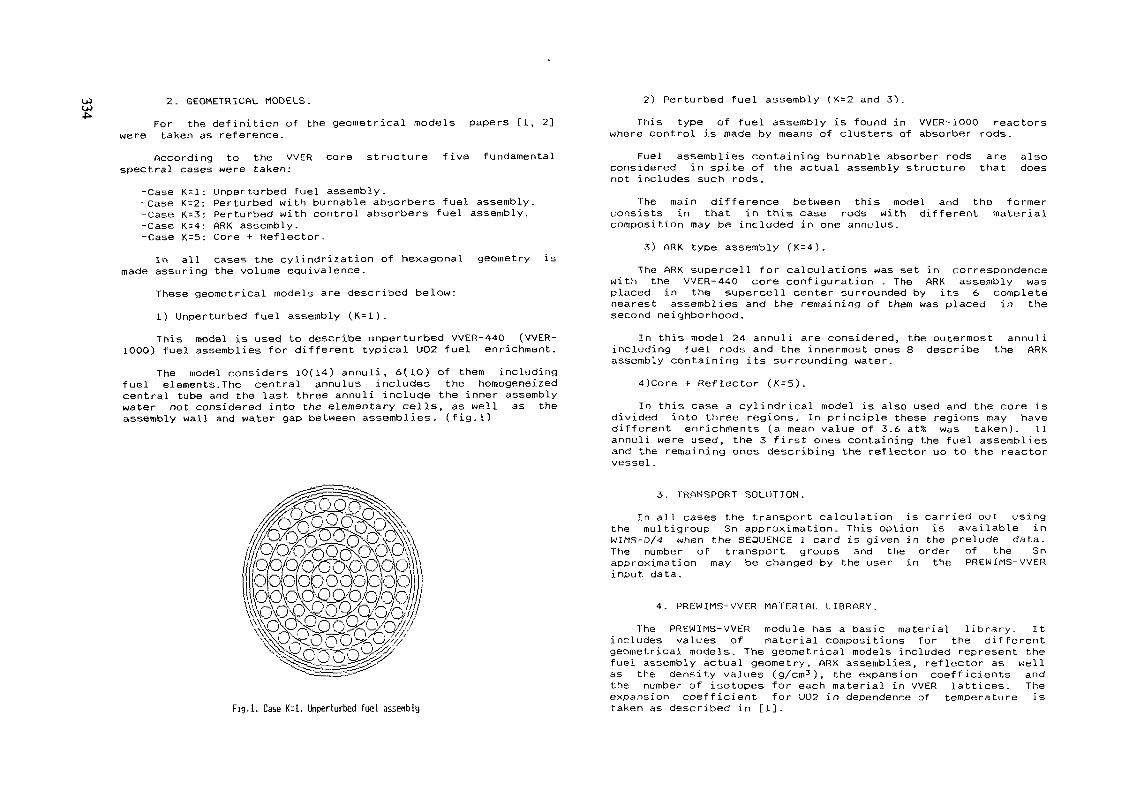
2. GEOMETRICAL MODELS.
For the definition of the geometrical models papers [I, 2]were taken as reference.
According to the WER core structure five fundamentalspectral cases were taken:
-Case K=l: Unperturbed fuel assembly.-Case K=2: Perturbed with burnable absorbers fuel assembly.-Case K-3: Perturbed with control absorbers fuel assembly.-Case K = 4: ARK assembly.-Case K=5: Core + Reflector.
In all cases the cylindrization of hexagonal geometry ismade assuring the volume equivalence.
These geometrical models are described below:1) Unperturbed fuel assembly (K=l).This model is used to describe unperturbed VVER-44O (VVER-
1OOO) fuel assemblies for different typical UO2 fuel enrichment.The model considers 1O(14) annuli, 6(1O) of them including
fuel elements.The central annulus includes the homogeneizedcentral tube and the last three annuli include the inner assemblywater not considered into the elementary cells, as well as theassembly wall and water gap between assemblies, (fig.l)
2) Perturbed fuel assembly (K=2 and 3).This type of fuel assembly is found in WER-1OOO reactors
where control is made by means of clusters of absorber rods.Fuel assemblies containing burnable absorber rods are also
considered in spite of the actual assembly structure that doesnot includes such rods.
The main difference between this model and the formerconsists in that in this case rods with different materialcomposition may be included in one annulus.
3) ARK type assembly (K=4).The ARK supercell for calculations was set in correspondence
with the VVER-440 core configuration . The ARK assembly wasplaced in the supercell center surrounded by its 6 completenearest assemblies and the remaining of them was placed in thesecond neighborhood.
In this model 24 annuli are considered, the outermost annuliincluding fuel rods and the innermost ones 8 describe the ARKassembly containing its surrounding water.
4)Core + Reflector (K-5).
In this case a cylindrical model is also used and the core isdivided into three regions. In principle these regions may havedifferent enrichments (a mean value of 3.6 at% was taken). 11annuli were used, the 3 first ones containing the fuel assembliesand the remaining ones describing the reflector up to the reactorvessel.
Fig.I. Case K:l, Unperturbed fuel assenbly
3. TRANSPORT SOLUTION.
In all cases the transport calculation is carried out usingthe multigroup Sn approximation. This option is available inWIMS-D/4 when the SEQUENCE 1 card is given in the prelude data.The number of transport groups and the order of the Snapproximation may be changed by the user in the PREWIMS-VVERinput data.
4. PREWIMS-VVER MATERIAL LIBRARY.
The PREWIMS-VVER module has a basic material library. Itincludes values of material compositions for the differentgeometrical models. The geometrical models included represent thefuel assembly actual geometry, ARK assemblies, reflector as wellas the density values (g/cm3), the expansion coefficients andthe number of isotopes for each material in WER lattices. Theexpansion coefficient for U02 in dependence of temperature istaken as described in [1],
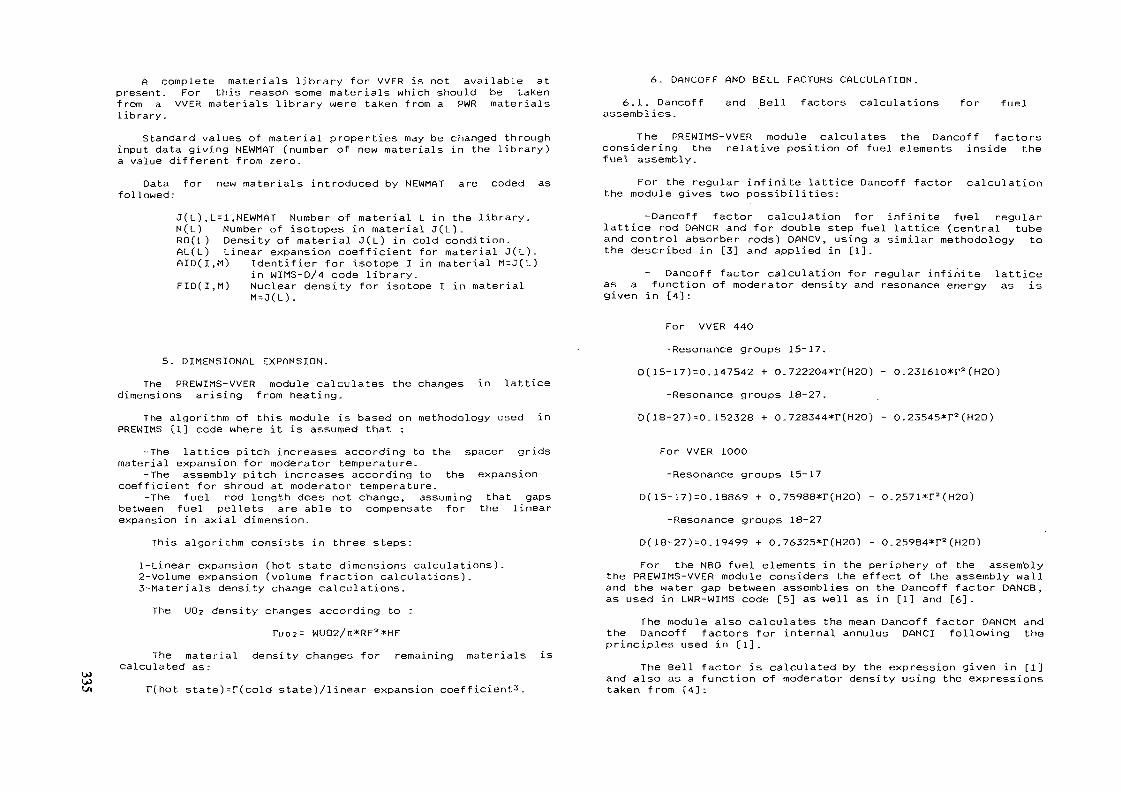
A complete materials library for WER is not available atpresent. For this reason some materials which should be takenfrom a WER materials library were taken from a PWR materialslibrary.
Standard values of material properties may be changed throughinput data giving NEWMAT (number of new materials in the library)a value different from zero.
6. DANCOFF AND BELL FACTORS CALCULATION.
Datafollowed:
for new materials introduced by NEWMAT are coded as
J(L) ,L=1, NEWMAT Number of material L in the library.N(L) Number of isotopes in material J(L)_RO(L) Density of material J(L) in cold condition.AL(L) Linear expansion coefficient for material J(L).AID(I,M) Identifier for isotope I in material M = J(t.)
in WIMS-D/4 code library.FID(I,M) Nuclear density for isotope I in material
6.1. Dancoffassemblies.
and Bell factors calculations for fuel
The PREWIMS-WER module calculates the Dancoff factorsconsidering the relative position of fuel elements inside thefuel assembly.
For the regular infinite lattice Dancoff factor calculationthe module gives two possibilities:
-Dancoff factor calculation for infinite fuel regularlattice rod DANCR and for double step fuel lattice (central tubeand control absorber rods) DANCV, using a similar methodology tothe described in [3] and applied in [1].
Dancoff factor calculation for regular infinite latticeas a function of moderator density and resonance energy as isgiven in [4] -.
5. DIMENSIONAL EXPANSION.
The PREWIMS-WER module calculates the changes in latticedimensions arising from heating.
The algorithm of this module is based on methodology used inPREWIMS [1] code where it is assumed that :
-The lattice pitch increases according to the spacer gridsmaterial expansion for moderator temperature.
-The assembly pitch increases according to the expansioncoefficient for shroud at moderator temperature.
-The fuel rod length does not change, assuming that gapsbetween fuel pellets are able to compensate for the linearexpansion in axial dimension.
This algorithm consists in three steps:1-Linear expansion (hot state dimensions calculations) .2-Volume expansion (volume fraction calculations) .3-Materials density change calculations.
The U02 density changes according to := WU02/n*RF2*HF
The material density changes for remaining materials iscalculated as:
r(hot state)=r(cold state)/linear expansion coefficient3.
For WER 440-Resonance groups 15-17.
D(15-17)=0.147542 + O.722204*r(H20) - 0.23161O*r2(H20)
-Resonance groups 18-27.D(18-27)=O.152328 + 0.728344*T(H20) - 0.23545*r2(H20)
For WER 1000
-Resonance groups 15-17D(15-17)=0.18869 + 0.75988*F(H20) - 0.2571*F2(H20)
-Resonance groups 18-27D(18-27)=0.19499 + O.76325*F(H2O) - O.25984*F2(H2O)
For the N80 fuel elements in the periphery of the assemblythe PREWIMS-WER module considers the effect of the assembly walland the water gap between assemblies on the Dancoff factor DANCB,as used in LWR-WIMS code [5] as well as in [1] and [6].
The module also calculates the mean Dancoff factor DANCM andthe Dancoff factors for internal annulus DANCI following theprinciples used in [1].
The Bell factor is calculated by the expression given in [1]and also as a function of moderator density using the expressionstaken from [4];
WER 440
Bel1=1.12867+0.011463*F(H20)
WER lOOO
Bell-1.13871
For Dancoff and Bell factors calculations in the case ofcore + reflector the methodology used is the same as for the fuelrods.
6.2. Dancoff and Bell factors for the ARK assembly.Dancoff factors for the external rod annulus (including the
assembly wall and a half of the gap between assembliesinfluence), average and for the internal annulus of ARKgeometrical model are calculated in the PREWIMS-WER module bythe following expressions:
DBARK=(267.57*DANCB+36*DANARK)/303.57
DMARK=DANCR+o and5 = ( 135 . 43* (DANCV-DANCR ) +267. 57* (DANC8-DANCR ) +
+36*(DANARK-DANCR))/1062
DIARK=(1062*DMARK-303.57*D8ARK)/758.43
respectively, where:DANARK: Dancoff factor for the external rod annulus
corresponding to the 36 fuel rods allocated in the assemblyperiphery for fuel assemblies placed in the first ARKneighborhood, calculated with an optical thickness HARK.
DANCB: Dancoff factor for fuel elements in fuel assembliesnot facing the ARK assembly; calculated taking into account theHGAP thickness.
7. INPUT-OUTPUT DATA FILES STRUCTURE DESCRIPTION.
A detailed input-output data description for the PREWIMS-WER code is shown in reference [8] _ Here only the table of filesused during PREWIMS-WER module execution and their function isshown below.
FILE12345710
FUNCTION
File for input data.File PREFLS (gives a resume of files createdduring a run).File for previous results.File to resume previous results.Macroscopic cross sections file for HPS cards.File for input data to WIMS-D/4 code.Intermediate file for input to the module.
8. RESTRICTIONS FOR CALCULATIONAL TASKS SOLUTION.
The PREWIMS-WER module fixes the dimensions for the arraysin order to describe enrichment values, geometry, groupsstructure, basic material library and burnup.
For work extending to dimensions outside the ranges of thearray as fixed by the PREWIMS-WER module, it becomes necessaryto introduce the changes in the corresponding program unitsaccording to [8].
9. TECNICHAL REQUIREMENTS OF PREWIMS-WER MODULE.
The PREWIMS-WER module is written in FORTRAN-77 language,elaborated in a personal computer with an operative memory of 64OKbytes, with processor 8O286 (12MHz), with mathematical co-processor 80287(10 MHz) and a hard disk with 4O Mbytes. RMFORTcompiler from Ryan Mcfarland corp. was used.
are:Typical running times for WIMS-D/4 input data preparation
DANCR :fuel elements.
Regulär infinite lattice Dancoff factor for the
DANCV: Double pitch Dancoff factor for fuel assembliescentral tubes inside fuel assemblies and the central tube in ARK,and the 126 absorber rod cells in ARK assembly.
Bell factor for ARK assembly is calculated the same as forthe fuel assemblies considering only geometrical dependence.ForARK assembly the average Dancoff factor is defined by DMARK inthe expression for the Bell factor calculation.
-VVER-44O fuel assembly: 6.21 s-WER-440 fuel assembly including geometrical model changes:12.96 s-WER-440 fuel assembly for three different enrichments in asingle run: 8.O2 s
Other tasks show similar typical run times.
1O. PREWIMS-WER input data sample case.A sample problem corresponds to unperturbated WER-44O
assembly calculation (K=l) is shown in appendix 1.

Appendix 1. PREWIMS-VVER output sample case.
* cortco440CELLSEQUENCENGROUPNMESHNREGIONNMATERIALNRODSPREOUTINITIATESUPPRESS
.01671
255210 6 2212 61 2 6 1 1 1 6 2 1
1 1 1 1 1 1 1 1 1 1 1 0 1 O 1 O*** CALCULO DEL CONJUNTO COMBUSTIBLE 1.6% BIBLIOTECA DALE91* CONJUNTOANNULUSANNULUSANNULUSANNULUSANNULUSANNULUSANNULUSANNULUSANNULUSANNULUSARRAYARRAYARRAYARRAYARRAYARRAYRODSUBRODSUBRODSUBRODSUBRODSUBRODSUBRODSUBRODSUBRODSUBRODSUBRODSUBRODSUBMATERIAL
11.01056. O
52.0MATERIAL
11. O1056.0
52.0MATERIAL
11.01056.0
52.0MATERIAL
WER 440 85.14 POT1 0.643494 12 1.7O2524 23 2.804924 24 3.914218 25 5.O25845 26 6.138537 27 7.251804 28 7.368681 39 7.589742 410 7.753570 51 ( 1 6.0000002 ( 1 12.0000003 ( 1 18. OOOOOO4 ( 1 24.0000005 ( 1 30. OOOOOO6 ( 1 36. OOOOOO1 1 0.381091 ( 61 2 0.456306 ( 122 1 0.381091 ( 72 2 0.456306 ( 123 1 0.381091 ( 83 2 0.456306 ( 124 1 0.381091 ( 94 2 O.4563O6 ( 125 1 0.381091 ( 105 2 0.4563O6 ( 126 1 0.381O91 ( 116 2 0.456306 ( 121 -1 553.15 4 $
0. 1743671E-04 2OO1.00.3924661E-04 56.00.4228347E-04 91.0
2 -1 553.15 3 $0.21O2977E-O4 2O01.00.1102366E-03 56.00. 1187666E-O3
3 -1 553.15 4 $O.21O2977E-O4 2OO1.00.1102366E-03 56.00. 1187666E-03
4 -1 553.15 4 $O.41397UE-01 1OOO.O
TMOD= 28O.OO
1.1730092.2537243.3595714.47O0325.5821916.695171O.OOOOOO)0 . OOOOOO )0 . OOOOOO )0 . OOOOOO )O.OOOOOO)O.OOOOOO)0.000000)O.OOOOOO)O.OOOOOO)0.000000)O.OOOOOO)O.OOOOOO)
0.4190411E-O10.9157541E-040.7279027E-O2
0.5053900E-010.2572188E-03
0.5053900E-O10.2572188E-03
0.1042199E-02
C 1.60 A/O 2.86 g/Kg
O.OOOOOO)O.OOOOOO)0.000000)O.OOOOOO)O.OOOOOO)0 . OOOOOO )
16.0 0.2O97821E-O1 $58.0 0. 1939974E-04 $
1OOO.O 0.7219108E-O4
16.0 0.25301O5E-O1 $58.0 O.5449037E-04 $
16.0 O.2530105E-01 $58. O 0. 5449O37E-04 $
MATERIAL11.0
MATERIAL235.43239.1
MATERIAL235.43239.1
MATERIAL235.43239 . 1
MATERIAL235.43239. 1
MATERIAL235.43239.1
MATERIAL235.43239. 1
MATERIAL91.0
BELLDANCOFFSTOLERANCEFEWGROUPS
MESHPOWERCBÜCKLINGSBEGINCPUNCHALPHASATURATETHERMALBUCKLINGLEAKAGEBEEONEDNBDNBDN8DNBMATERIALSBEGINC* PASO 2POWERCBEGINCMATERIALSBEGINC* PASO 3POWERCBEGINCMATERIALSBEGINC* PASO 4POWERCBEGINC
5 -1 553.15 4 $0.2116634E-O4 2OO1.0
6-1 859.99 1 $0.3452227E-03 2238.40 . OOOOOOOE+OO 1240.0
7-1 859.99 1 $0.3452227E-O3 2238.40. OOOOOOOE+OO 1240.0
8-1 859.99 1 $O.3452227E-03 2238.40. OOOOOOOE+OO 1240.0
9-1 859.99 1 $0.3452227E-O3 2238.40. OOOOOOOE+OO 1240.0
1O -1 859.99 1 $0.3452227E-03 2238.40. OOOOOOOE+OO 1240.0
11 -1 859.99 1 $0.3452227E-O3 2238.40. OOOOOOOE+OO 1240.0
12 -1 569.15 2 $0.3876441E-01 1OOO.O
1.13865578O.6O028124 O. 633416
5.00OOOOE-O62 3 4 5 6 8 11
51 55 59 63 66 694 7 7 7 7 7 71 33.0530 1.
0.5086721E-01
0.2123119E-01O. OOOOOOOE+OO
0.2123119E-O10. OOOOOOOE+OO
0.2123119E-010. OOOOOOOE+OO
0.2123119E-01O. OOOOOOOE+OO
0.2123119E-010. OOOOOOOE+OO
0.2123119E-010. OOOOOOOE+OO
0.384453OE-03
463
16.0 0.2S46536E-01
16.0 0.4272131E-O1 S
16.0 0.4272131E-O1 $
16.0 0.4272131E-O1 $
16.0 0.4272131E-O1 $
16.0 O.4272131E-01 $
16.0 0.4272131E-O1 $
14 15 21 25 26 27 32 35 38 41 45 48 $
2 2 2OOOOOOE-20 1
0.00025363 O. 00014713 O.OOOO2536
016 161357
O.OOOO1471
O.OO025363 O. 00014713611 0.419O411E-O1 0.2 O.5053900E-01 0.3 0.5053900E-01 O.5 O.5086721E-01 0.
OO.OO MWD/TU
1 33.0530 1.
O
10O.OO MWD/TU1 33.0530 1.
O
300. OO MWD/TU1 33.0530 1.
0 O.2097821E-O1O 0.2530105E-01O 0.25301O5É-O10 0.2S46536Ë-01
2.86 g/Kg512722E+OO 2
2.86 g/Kg512722E+OO 4
2.86 g/Kg512722E+OO 3
0.0O.OO.OO.O
l.OOOO DEL XENON PREVIO
l.OOOO DEL XENON PREVIO
l.OOOO DEL XENON PREVIO

!» MATERIALS^ BEGINC
* PASO 5POWERCBEGINCMATERIALSBEGINC* PASO 6POWERCBEGINCMATERIALSBEGINC* PASO 7POWERCBEGINCMATERIALSBEGINC* PASO 8POWERCBEGINCMATERIALSBEGINC* PASO 9POWERCBEGINCMATERIALSBEGINC* PASO 10POWERCBEGINCMATERIALSBEGINC* PASO 11POWERCBEGINCMATERIALSBEGINC* PASO 12POWERCBEGINCMATERIALSBEGINC* PASO 13POWERCBEGINCMATERIALSBEGINC* PASO 14POWERCBEGINCMATERIALSBEGINC* PASO 15POWERCBEGINCMATERIALSBEGINC
-1
450.00 MWD/TU1 33.0530
O600.00 MWD/TU
1 33.0530
-1750. OO MWD/TU
1 33.053O
09OO.OO MWD/TU
1 33.053O
O
1200.OO MWD/TU1 33.0530
O1800.00 MWD/TU
1 33.O53O
O
24OO.OO MWD/TU1 33.0530
03OOO.OO MWD/TU
1 33.O53O
O
3600.00 MWD/TU1 33.0530
O45OO.OO MWD/TU
1 33.053O
0
5400. 00, MWD/TU1 33.0530
O
2.86 g/Kg1.512722E+00
2.86 g/Kg1.512722E+00
2.86 g/Kg1.512722E+00 .
2.86 g/ Kg2.269083E+00
2.86 g/Kg2.269083E+00
2.86 g/Kg2.269083E+00
2.86 g/Kg2.269O83E+OO
2.86 g/ Kg2.269O83E+OO
2.86 g/Kg2.269O83E+OO
2.86 g/Kg2.269083E+00
2.86 g/Kg2.269O83E+00
1.0000 DEL XENON PREVIO
1.0000 DEL XENON PREVIO
l.OOOO DEL XENON PREVIO
i.OOOO DEL XENON PREVIO
l.OOOO DEL XENON PREVIO
1.0000 DEL XENON PREVIO
l.OOOO DEL XENON PREVIO
l.OOOO DEL XENON PREVIO8
l.OOOO DEL XENON PREVIO12
1.0000 DEL XENON PREVIO12
1.0000 DEL XENON PREVIO12
* PASO 16POWERCBEGINCMATERIALSBEGINC* PASO 17POWERCBEGINCMATERIALSBEGINC* PASO 18POWERCBEGINCMATERIALSBEGINC* PASO 19POWERCBEGINCMATERIALSBEGINC* PASO 2OPOWERCBEGINCMATERIALSBEGINC* PASO 21POWERCBEGINCMATERIALSBEGINC* PASO 22POWERCBEGINCMATERIALSBEGINC* PASO 23POWERCBEGINCMATERIALSBEGINC* PASO 24POWERCBEGINCMATERIALSBEGINC* PASO 25POWERC8EGINCMATERIALSBEGINC* PASO 26POWERCBEGINCMATERIALSBEGINC* PASO 27POWERCBEGINC
6300.00 MWD/TU1 33.0530 2.
7200.00 MWD/TUl 33.O530 2.
8400.00 MWD/TUl 33.O53O 2.
96OO.OO MWD/TU1 33.0530 2.
1O8OO.OO MWD/TU1 33.0530 2.
12000.00 MWD/TUl 33.O53O 2.
13200.00 MWD/TU1 33.0530 2.
144OO.OO MWD/TUl 33.053O 2.
15600.OO MWD/TUl 33.053O 2.
2.86 g/Kg269O83E+OO
2.86 g/Kg593237E+OO
2.86 g/Kg593237E+00
2.86 g/Kg593237E+00
2.86 g/Kg593237E+00
2.86 g/Kg593237E+OO
2.86 g/Kg593237E+OO
2.86 g/Kg593237E+00
2.86 g/Kg593237E+00
l.OOOO DEL XENON PREVIO12
16800.00 MWD/TU1 33.0530 2
2.86 g/Kg.593237E+00
18OOO.OO MWD/TUl 33.D53O 2.
19200.00 MWD/TUl 33.053O 2.
2.86 g/Kg593237E+00
2.86 g/Kg593237E+00
i.oooo DEL XENON PREVIO14
i.oooo DEL XENON PREVIO14
i.oooo DEL XENON PREVIO14
l.OOOO DEL XENON PREVIO14
l.OOOO DEL XENON PREVIO14
1.0000 DEL XENON PREVIO14
l.OOOO DEL XENON PREVIO14
l.OOOO DEL XENON PREVIO14
l.OOOO DEL XENON PREVIO14
l.OOOO DEL XENON PREVIO14
l.OOOO DEL XENON PREVIO14

MATERIALSBEGING* PASO 28POWERCBEGINGMATERIALSBEGING* PASO 29POWERCBEGINGMATERIALSBEGING* PASO 3OPOWERCBEGINGMATERIALSBEGING* PASO 31POWERCBEGINGMATERIALSBEGING* PASO 32POWERCBEGINGMATERIALSBEGING* PASO 33POWERCBEGINGMATERIALSBEGING* PASO 34POWERCBEGINGMATERIALSBEGING* PASO 35POWERCBEGINGMATERIALSBEGINC* PASO 36POWERCBEGINCMATERIALSBEGINC* PASO 37POWERCBEGINCMATERIALSBEGINC
20400.00 MWD/TU1 33.0530
21600.OO MWD/TU1 33.0530
22800.00 MWD/TUl 33.O530
24OOO.OO MWD/TU1 33.0530
25200.OO MWD/TU1 33.0530
26400.00 MWD/TU1 33.0530
276OO.OO MWD/TU1 33.0530
28800.00 MWD/TU1 33.0530
3OOOO.OO MWD/TUl 33.O530
31200.OO MWD/TUl 33T0530
-1
2.86 g/Kg2.593237E+OO
2.86 g/Kg2.593237E+00
2.86 g/Kg2.593237E+OO
2.86 g/Kg2.593237E+OO
2.86 g/Kg2.593237E+OO
2.86 g/Kg2.593237E+OO
2.86 g/Kg2.593237E+OO
2.86 g/Kg2.593237E+00
2.86 g/Kg2.S93237E+00
2.86 g/KgO.OOOOOOE-01
l.OOOO DEL XENON PREVIO14
l.OOOO DEL XENON PREVIO
l.OOOO DEL XENON PREVIO14
1.0000 DEL XENON PREVIO14
l.OOOO DEL XENON PREVIO14
l.OOOO DEL XENON PREVIO14
l.OOOO DEL XENON PREVIO14
l.OOOO DEL XENON PREVIO14
l.OOOO DEL XENON PREVIO14
l.OOOO DEL XENON PREVIO
REFERENCES
1. C. Anhert, J. M. Aragonés, MARIA SYSTEM: A code block forPWR fuel assembly calculations.
2. P. Mikolash, Spectral calculations of WER lattices usingWIMSD-4 code. TIC 16th Symposium. Moskow, 1987( in russian).
3. L.E. Strawbridge, R.F. Barry. Nucl. Sei. Eng. 3,(1965).
58
4. P.Mikolash, I. Vacek, T. Kulikovska, Application of WIMS-D/4 code for few groups constants libraries calculations. TIC15th Symposium. Rostock, 1986 (in russian).
5. F.J. Payers, et al-, LWR-WIMS, a modular computer codefor the evaluation of light water reactors. Description ofmethods. AEEW-R-785. UKAEA, Winfrith (1972).
6. T.Kulikovska, B. Sadovska, Auxiliary programs for WIMS-D/4 in IBM/PC/AT. TIC 17th Symposium. Varna, 1988 (in russian).
7. P. T. Petkov, SPPS-1 version for XT and AT personalcomputers. TIC 17th Symposium. Varna, 1988 (in russian).
8. A. Gonzalez, D. Löpez, D. Miliân, C. M. Alvarez, PREWIMS-VVER PC module for VVERs Input Data Preparation. IAEA ResearchContract No. 57O1/R8, Annual Final Report. Oct, 1990.

GADOLINIUM ABSORBERS IN WWER-1000 TYPEFUEL LATTICES
J. MIKUS, F. HUDEC, J. ROCEK, M. TRGINA,L. VRBA, K. ZÂLESKYNuclear Research Institute,Rez, Czechoslovakia
AbstractA complex scheme based on the use of separate
computer programmes to obtain the data needed for theWWER-type Gd-poisoned lattices has been built up and appliedto a number of cores behaviour determination. The calculatedvalues have been compared with the experimental ones frommeasurements carried out in the LR-O reactor. Somepreliminary results concerned with one of the coresconsidered are presented in this paper.
1. Introduction
A wide research programme has been prepared andcarried out on the LR-O reactor to obtain information neededfor using fuel with burnable absorbers in the WWER-typereactors.
The previous activity was concerned with WWER-440type lattices containing single fuel pins with homogeneousGd2O3 admixture /!/. The present investigations are devotedto the cores consisting of WWER-1000 type assemblies withvarious number (up to 24) of fuel pins with gadolinium atthem. A number of such cores was investigated and detailedanalysis and comparison of the calculated and in the LR-Omeasured values has been carried out.
In this paper a brief information only is givenabout some preliminary results concerned with one of thecores considered.
2. Experimental arrangement
The reactor core investigated consists of 7WWER-1000 type fuel assemblies with 4.4 % enriched uranium,where in the central assembly 18 fuel pins were replaced bythe fuel pins with 3.6 % enriched uranium containing 2.0 %(by weight) of Gd2Oa admixture (Fig. 1). Detaileddescription of the LR-O reactor can be found in /2/, here ashort information only is given concerning our experiment.
To compare the specific gadolinium-effects, seri-es of measurements were performed both in the clean core(without gadolinium) and above mentioned one. The irradiati-ons were made at room temperature with critical heights H„of the H2O moderator levels being 226.64 mm (variant NoI - clean core) and 266.10 mm (variant No 2 - core to be in-vestigated with gadolinium).
assembly with 44^ tnrit,hed tucl pins
A , B
Fig. 1 - Ihe scheme of the I R-0 corf

3. Method of calculation and codes used
A set of PC programmes has been developed and canbe used to predict the behaviour of the wwER-type corescontaining fuel pins with burnable absorbers.
The calculations for both cores considered wereperformed in two steps, in the first one the four - groupconstants of elementary cells and super-cells containingfuel pins with gadolinium (in the following text abbreviatedas "Gd-pins") or water holes were calculated using the codeMICROBE /3/. In the second step calculations in the 30° -sector of symmetry were performed by weans of the codeBftETISLAV /4/. This code treats the two - dimensionalfour-group diffusion equations using the so called fine meshmethod Results of this calculations are four-group fluxdensities and criticality factor for a given extrapolationheight H„x = H„ + d«,*, where A„x is the extrapolationdistance, which value has been found to be 140 mm for coresof such a type
The calculated criticality factors arekntr = 0.9861 - variant No 1ke« = 1.0015 - variant No 2.
4. Results
In a plane perpendicular to the core axis, thefission rate distribution was determined for both variantsof cores (clean and to be investigated) by means ofirradiated fuel pins measuring of their gamma radiation inthe energy range of 600 to 900 keV. The fuel pins to bemeasured were placed in 100 positions shown in Fig 2 Thepreliminary results of such measurements carried out bothin the clean and investigated cores were published in thepaper /5/, where the values of corresponding calculationswere presented too
) - fu«l pin |Q) - fu»i pia »i'H Cdt| - abaorbing »le»*nt chanrtl
3 - ctnt-al tub»o-y=x
Flg. 2 - The positions of fuel pinsto be measured.
To compare the experimental and calculated powerdistributions, a brief graphic information only is given inthis work by means of Fig. 3 - 6 , where the energy releaseper one fuel pin (abbreviated as "power") is plotted asa function of distance from the core axis. Following normwas used in this comparison mean energy release (inarbitrary units) per one measured fuel pin is equal to one.
All experimental and calculated data in the30°-sector of symmetry are plotted in Fig 3 and 4 for bothvariants. Of course, this way of depicting causes a certainadditional dispersion of points in both series Therefore,a comparison of "pure" data series along 30°-line (y = x) isshown in Fig. 5 and 6 for the clean core and the one withGd-pins, respectively. Such a way of depicting is free ofabove mentioned additional dispersion

UJ-«o 1.4
1.2
1
0.6
0.6
0.4
0.2
power / (arbitrary unit)
4 6 8 10 12 14 16 18 20 22 24 26 28 30distance / (lattice pitch)
1.2
1
0.8
0.6
0.4
0.2
power / (arbitrary unit)
10 16 20distance / (lattice pitch)
26 30
Fig.3: Variant No 1 - Clean coreAll experimental and calculated
data In the 30 deg. sector.
Flg.5: Variant No 1 - Clean coreExperimental and calculated data
along the 30 deg. line.
power / (arbitrary unit) power / (arbitrary unit)
10 16 20distance / (lattice pitch)
26 10 16 20distance / (lattice pitch)
26 30
Flg.4: Variant No 2 - Core with Gcl-plnsAll experimental and calculated
data in the 30 deg. sector.
FlB-6: Variant No 2 - Core with Gd-plnsExperimental and calculated data
along the 30 deg. line.
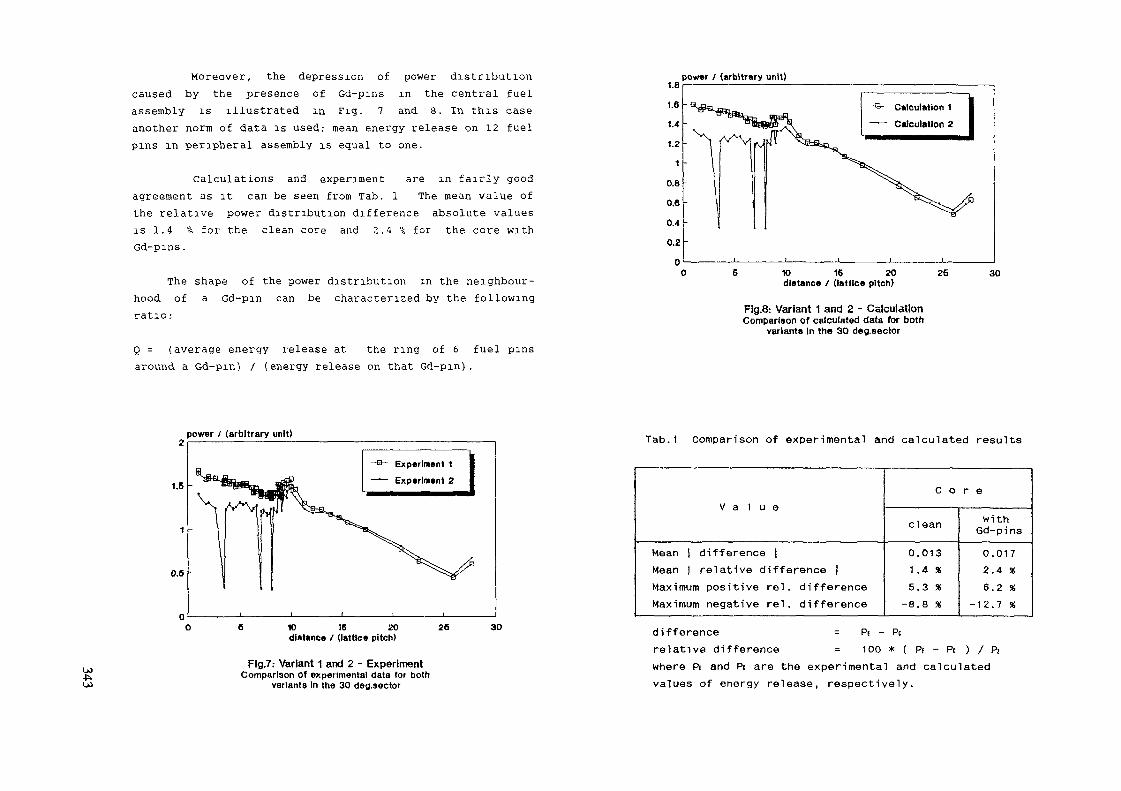
Moreover, the depression of power distributioncaused by the presence of Gd-pins in the central fuelassembly is illustrated in Fig. 7 and 8. In this caseanother norm of data is used: mean energy release on 12 fuelpins in peripheral assembly is equal to one.
Calculations and experiment are in fairly goodagreement as it can be seen from Tab. 1 The mean value ofthe relative power distribution difference absolute valuesis 1.4 % for the clean core and 2.4 "'„ for the core withGd-pins.
The shape of the power distribution in the neighbour-hood of a Gd-pin can be characterized by the followingratio:
Q = (average energy release at the ring of 6 fuel pinsaround a Gd-pin) / (energy release on that Gd-pin).
power / (arbitrary unit)
1.6
0.6
-s- Experiment 1—— Experiment 2
fi 10 16 20 26distance / (lattice pitch)
Flg.7: Variant 1 and 2 - ExperimentComparison of experimental data for both
variants in the 30 decj.8ector
30
1.8
1.6
1.4
1.2
1
0.8
O.S
0.4
0.2
power / (arbitrary unit)
10 16 20distança / (lattice pitch)
Fig.8: Variant 1 and 2 - CalculationComparison of calculated data for both
variants in the 3O deg.sector
26 30
Tab.1 Comparison of experimental and calculated results
Mean |Mean |MaximumMaximum
difference |relative difference |positive rel. differencenegative rel. difference
C o r e
clean
0.0131 .4 %5.3 %
-8.8 %
withGd-pins0.0172.4 %6.2 %
-12.7 X
difference = Pf - Pcrelative difference = 100 * ( P! - Pc ) / Piwhere Pi and Pc are the experimental and calculatedvalues of energy release, respectively.

Tab.2 Core with Gd-pins. Comparison of experimental andcalculated values of power ratio Q for threepositions of Gd-pins.
No
1
2
3
Experimentalratio
Qf
3.7183.669
3.694
Calculatedratio
Qt
3.553
3.501
3.523
Difference
d = Qt-Qt
0. 1650.168
0. 171
Relativediffer.
100*d/Qi
4.44.6
4.6
Q = (average value of energy release on 6 fuel pinsaround a Gd-pin) / (energy release on Gd-pin)
Results for three different positions of Gd-pins are presen-ted in Tab. 2, where a fairly good agreement between calcu-lated and experimental power distributions can be seen too.The relative difference of quantity Q is about 4.6 % for allthree positions of Gd-pins.
5. Conclusions
The results presented in this paper demonstrate a goodagreement between calculated and experimental power distri-butions. It can be concluded that both the experimental andevaluating methods seem to be the hopeful tools for furtheiinvestigations of reactor lattices winh Gd-pins.
References
/!/ Bârdoë J., Hron M., Drexler J., vesely P.: "BurnableAbsorbers in WWER-Type Lattices", Meeting ofparticipants in the Co-ordination Research Programme on"Safe Core Management with Burnable Absorbers inWWERs", IAEA, Viena, 11-14 December 1939.
/2/ Sochor Q., Stary R." "The Experimental Reactor LR-0after Five Year's Operation". Nukleon, 1988, A specialissue.
/3/ Zâlesky K.: "Manual of the Program MICROBE-02 for theCalculation of Local Burn-up" (in Czech).(Report ÜJV 6880-R,A). NRI Re2 1984.
/4/ Lelek V.:"BRETISLAV - A Net Program for calculation of aReactor in Hexagonal Geometry" (in Russian).(Report ÜJV 7771-R,A). NRI Re2 1986.
/$/ Hudec F., Mikuë J., RoCek J., Trgina M., Vrba L. ,Zâlesky K.: "Investigations with WWER-1000 Type FuelAssemblies with Gd-Burnable Absorbers on the LR-0Reactor", 1. Symposium AER, Re2, 23-28 September 1991

USE OF NEUTRONIC CODES FOR THEDESIGN OF MTR LEU CORES
M. MADARIAGA, M. HIGAComisiön Nacional de Energia Atdmica,Buenos Aires, Argentina
Abstract
The Comisiön Nacicnal de Energia Atoraica from Argentina (CNEA) has beenworking in the last years in several LWR designs. Two lines could bedestiguished:
a) experimental and/or radioisotope production reactors up to 22 MW, withLEU (20% U235 enrichment) or slightly enriched (about 5%) fuel .
b) power reactor about 15 MWe (or other appl icat ions) loaded with slightlyenriched fuel w i t h an intrinsically safe design (Carem reactor).
Many of the tools for neutronic calculations are the same in both lines.On the other hand it is in case a) that CNEA has made the complete process:basic and detail design, construction of the fac i l i ty , fuel fabrication andstart-up. This is the case of RA3 (Argent ina) , RP10 (Peru) and NUR (Argelia)reactors.
In case b) the design work is in progress, being now under construction acritical facility and a pressurize loop in order to check the main neutronicand thermohydraulic design parameters .
In this work it is at f i r s t presented a review of the LWR design thathave been studied at CNEA in the last years. Next the neutronic calculationmethods and codes are discussed related with the d i f f e r en t stages of the coredesign. The part icular case of HEU and LEU fue l conversion is considered.
The experimental results coming from the start up of RP10, NOR and RA3are discussed with certain detail and compared w i t h the design calculations.Finally, taking in account the radioisotope product ion requirements of RA3,the optimization of the fue l management and the equi l ib r ium core is studiedconsidering two levels: basic and de ta i l w i t h a realist ic fuel managementincluding the control fue l e lements .
A good agreement of the calculated an experimental design parameters isconcluded for the case of MIR, HEU and LEU cores. Thus the calculationmethods are completely va l ida te for case a) while they could be consideredpartially validate for case b).
1 Introductory Concepts
1-1 IntroductionThe main purpose of this paper is to present a. review of theneutronic design work done at the Atomic Energy Commission fromArgentina (CNEA) in MTR cores during the last years, understanding
by MTR cores those corresponding to open pooltype fuel elements (FE) .
reactors with plate
CNEA, together with an associated company, INVAP, has been workingduring the last 10 years in several projects related to the designof LWR. Some of these projects (which are MTR type) have beencompleted including the reactor start-up. All of them but one areLow Enriched Uranium (LEU) cores (20 % enr . ) corresponding to newreactors or conversions from Highly Enriched Uranium (HEU, 90 %enr . ) .
Although the calculation methods and neutronic codes used in thedifferent projects are not the same they are quite similar andhence, general conclusions are obtained. The particular case ofHEU to LEU conversion of the RA3 reactor is considered in somedetail.
1.2 General ideas about MTR core design
The starting point for the design work is the conceptualdefinition of the reactor. In this connection, and speaking onlyabout MTR reactors, we can distinguish 4 different (not excluding)items:
A) Critical facilities and reactors up to 0.5 Mw.
B) Radioisotopes production.
C) High flux performance.
D) HEU to LEU conversion.
Although many reactors can be classified in more than one of thesetypes we can separate them according to the main differences inthe design parameters to be optimized:
A) The core configuration is variable and the burnup of the fuelelement ( F E ) ie not significant so the design job is done mainlyby considering one typical fresh core configuration.
B) The typical power range is between 1 Mw and 20 Mw. More than 20or 30 Mw will probably require an ascending coolant flow whilethe lower powers use descending flows.The utilisation factor (UF)
UF = % of full power operating days per year
is about 60 % or more and thus, the economy of the fuel cyclehas to be optimized. We can say thatthe design could be set as:
the boundary conditions for
Discharge Burnup > Minimum (ie 40 % U235 consumed)
Neutronic flux inirradiation channels > Minimum (ie 1014 n/cm2sec / 5 Mw)

j£ In this case the design optimization is performed on theON equilibrium core and hence, a first fresh core is analyzed in
connection only with the start up of the reactorC) As it is known, the increase of neutronic flux in theirradiation channels, is normally obtained f'-o-n a decrease ofdischarge burnup We can then say that the main difference betweenB and C is that the fuel cycle economy is no longer the firstpriority and hence, the increasing of the neutronic flux per Mw isthe only main objective of the design This allows compact cores,highly sub-moderated, where the reflector (usually Be or DzO)partially works as moderator obtaining large values of the thermalflu in the irradiation channels This design philosophy is usedin iredium flux reactors (more than 1014 and less than 1015) withpowers about 10 Mw or more, and high llux reactors (mo>~e than101/="i with powers about 200 MwD) The HEU to LEU conversion has been widely analyzed in severalmeetings organized bv the RERTR program and the IAEA We will hereonly recall that HEU to LEU conversion is a design task that couldbe done following two different criteriaDl) Obtain a LEU core rfith a similar performance than theexisting HEU core and hence, the reference for the LEUdesign are the parameters of the existing HEU core Inthis case it is usual to set the following designcondition
Neutronic thermal fluy in
irradiation channela (LEU)
0 9 * HEU corresponding flux
for the same operating powerD2) Use the HEU to LEU conversion in order to define a
different reactor by means of some other significant cnanges (forexample a power increase ) In this case the conceptualdefinition of the reactor is modified and the core design may bequite similar to the case of a new reactor1 3 Calculation methodsOnce the conceptual design is defined, different calculationlevels are performed in agreement with the corresponding designsteps We can briefly describe them as followsBasic Design. Parametric studies are applied for the FE and coredesign optimization (geometry and composition) The models aresimp IP for the sake of efficiency and smaller computer times Themain output of this step is- Geometry and composition of the FE- Core geometry is defined but the detailed fuel management has
not, been studied yet This means that the equilibrium burnupdistribution has been obtained with a simplified refuelling chainwithout consiHering for example control FE replacement
- The main parameters of the core are known, for e'ampleapproximate flu< distributionavailable flu> for irradiationtemperature and void coefficientsexcess reactivityshutdown marginscycle length (time and reactivity)xenon reactivity worthcontrol rods worthtotal power peaking factor (most unfavourable case)Average discharge burnup
Detailed Design. Some details are studied at this step, forexample- The functioi of each control rod is defined AT CNEA the
control rod functions are usually split as followsControl rod banJ-Regulating rodSafety rods
5 rods1
2 shim-safety rods2 safety-rods only
The safety-rods-only are totally withdrawn during operation whilethe shim-safety rods could be in any desirable position in orderLO compensate reactivity or modifj. the flux distribution
A detailed refuelling scheme is studied considering therefuelling of the control FE as well as dividing the whole coreinto several chains of 4 or 5 FE each The idea is to move only afraction of the core in each refuelling- The detailed equilibrium core calculation is performed and the(expected) flux distribution in the operating condition isobtained
Oscillations of the discharge burnup due to a realistic FEmanagement are obtained- Definition and detailed study of the start-up core, includingthe calculation of several transients due to normal or accidentalpostulated conditionsThe following calculation conditions aredesign stepDIMENSION0
X-Y (X-Y (X-Y (X-Y-Z
set depending on the
ENERGY GROUPS FE GEOMETRY DETAIL CONTROL RODS2 or more Homogeneous No2-3 Homogeneous No2-3 Horn except CFE Yes2-3 Explicit Frames Yes2-3 Explicit Frames Yes
The cross sections for the different materials, including controlrods and reflectors are obtained from WIMS '!/ and in some specialcases GGTC code /2/ HERMET /3/, a cell code (developed at CNEA)has also been used producing similar results as WIMS (it has thesame nuclear data library)
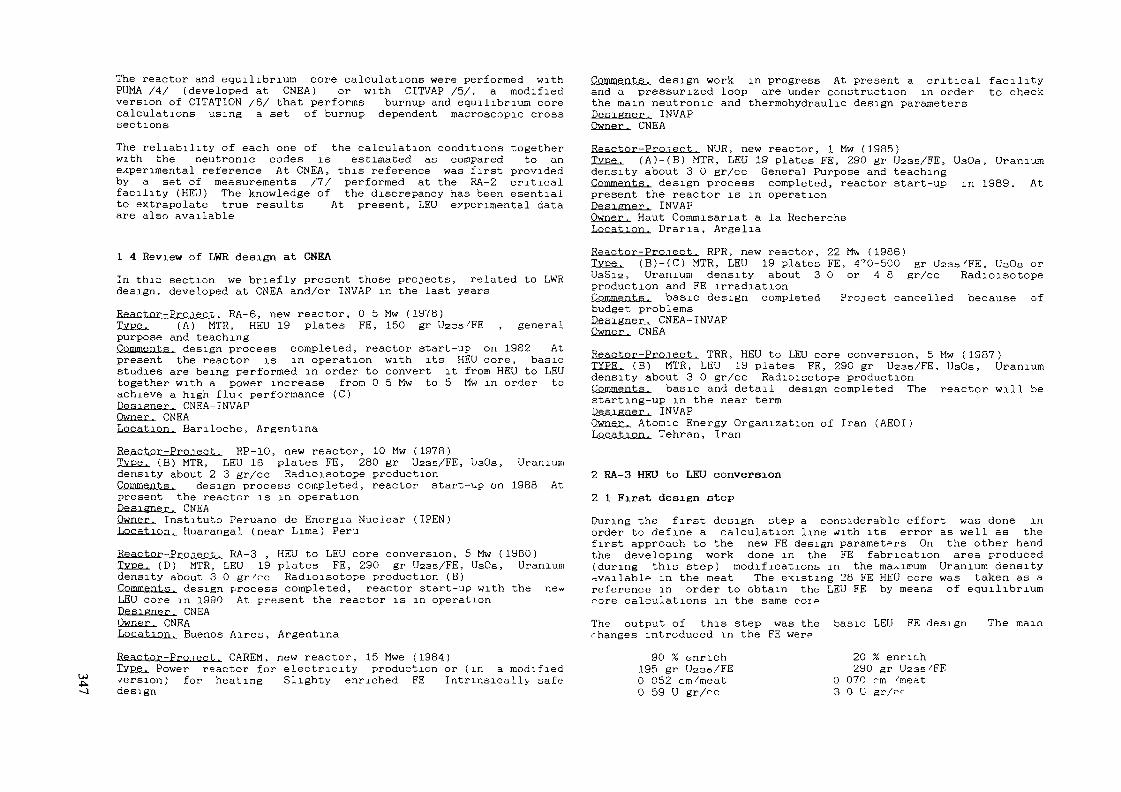
U)-p-
The reactor and equilibrium core calculations were performed withPUMA /4/ (developed at CNEA) or with CITVAP /5/, a. modifiedversion of CITATION /6/ that performs burnup and equilibrium corecalculations using a set of burnup dependent macroscopic crosssectionsThe reliability of each one of the calculation conditions togetherwith the neutronic codes is estimated as compared to anexperimental reference At CNEA, this reference was first providedby a set of measurements /?/ performed at the RA-2 criticalfacility (HEU) The knowledge of the discrepancy has been esentialto extrapolate true results At present, LEU experimental dataare also available
i 4 Review of LWR design at CNKAIn thic section we briefly present those projects, related to LWRdesign, developed at CNEA and/or INVAP in the last yearsReactor-P_r_P.J_e_ct. RA-6, new reactor, 0 5 Mw (1978)Type. (A) MTR, HEU 19 plates FE, 150 gr Usse/FE , generalpurpose and teachingComment^ design process completed, reactor start-up on 1982 Atpresent the reactor is in operation with its HEU core, basicstudies are being performed in order to convert it from HEU to LEUtogether with a power increase from 0 5 Mw to 5 Mw in order toachieve a high flu< performance (C)Designer. CNEA-INVAPOwner. CMEALocation. Bariloche, ArgentinaReactor-Pro.1 ect. RP-10, new reactor, 10 Mw (1978)Type. (B) MTR, LEU 16 plates FE, 280 gr U236/FE, baOe, Uraniumdensity about 2 3 gr/cc Radioisotope productionComments. design process completed, reactor start-up on 1988 Atpresent the reactor is in operationDesigner. CNEAOwner. Institute Peruano de Energia Nuclear (IPEN)Location. Huarangal (near Lima) PeruReactor-ProjBnt. RA-3 , HEU to LEU core conversion, 5 Mw (1980)Type. (D) MTR, LEU 19 plates FE, 290 gr Usas/FE, U30a, Uraniumdensity about 3 0 gr 're Radioisotope production (B)Comments, design process completed, reactor start-up with the ne«vLEU core in 1990 At present the reactor is in operationDesigner. CNEAOwner. CNEALocat,]oru Buenos Aires, ArgentinaReactor-Pro.iect. CAREM, new reactor, 15 Mwe (1984)Type. Power reactor for electricity production or (in a modifiedversion) for heating Slighty enriched FE Intrinsically safedesign
Comments. design work in progress At present a critical facilityand a pressurized loop are under construction in order to checkthe main neutronic and thermohydraulic design parametersDesigner. INVAPOwner. CNEAReactor-Pro.i ect. NUR, new reactor, 1 Mw (1985)Type. (A)-(B) MTR, LEU 19 plates FE, 290 gr Uase/FE, UsOa, Uraniumdensity about 3 0 gr/cc General Purpose and teachingComments. design process completed, reactor start-up in 1989. Atpresent the reactor is in operationDesigner. INVAPOwner. Haut Commisariat a la RechercheLocation. Draria, ArgeliaReactor-Pro.Tect. RPR, new reactor, 22 Mw (1986)Type. (B)-(C) MTR, LEU 19 plates FE, 4'70-500 gr usse'FE, UsOs orUsSis, Uranium density about 30 or 48 gr/cc Radioisotopeproduction and FE irradiationComments,., basic design completed Project cancelled because ofbudget problemsDesigner. CNEA-INVAPOwner. CNEAReactor-Pro.iect. TRR, HEU to LEU core conversion, 5 Mw (1987)IÏEEL. (B) MTR, LEU 19 plates FE, 290 gr Uzss/FE, UsOs, Uraniumdensity about 3 0 gr/cc Radioisotope productionComments. basic and detail design completed The reactor will bestarting-up in the near termDesigner. INVAPOwner. Atomic Energy Organization of Iran (AEOI)Location. Tehran, Iran
2 RA-3 HEU to LEU conversion
2 1 First design stepDuring the first design step a considerable effort was done inorder to define a calculation line rfith its error as well as thefirst approach to the new FE design parameters On the other handthe developing work done in the FE fabrication area produced(during this step) modifications in the maximum Uranium density•available in the meat The existing 28 FE HEU core was taken as areference in order to obtain the LEU FE by means of equilibriumrore calculations in the same cor PThe output of this step was the basic LEU FE designrhanges introduced in the FE were
The main
90 % enrich195 gr U235/FE0 052 cm /meat0 59 U gr/oc
20 % enrich290 gr U236'FE
0 070 rm 'meatS O U gr/rr

00The number of plates (19) and the grid pitch remained constantThe main design result obtained with this FE was about 55-60%discharge burnup in a similar core as the HEU core (no centralirradiation box) together with similar fluxes in the irradiationboxes, let us say more than 0 9 times the HEU case
2 2 Second design stepThe second design step refers to the equilibrium coreoptimization The possibility of reducing the core size from 28 FE(HEU) to 25 FE was considered together with the possibility ofintroducing a high flux irradiation position at a centralirradiation box (GIB) /8/ The feasibility of this CIS was relatedwith the economical cost (due to the lack of discharge burnup) andsafety requirementsIn other words, the main questions to be answered with the designjob were-With 5 Mw, is it possible to achieve an irradiation thermal flu''above 1014 n/cm2sec using the designed LEU FE •>-Which is the economical cost of the GIB 9-Roughly speaking which kind of FE management is convenientIN—>OUT or OUT—>IN 9
The equilibrium core calculations were performed with theX-Y(B2Z) 2 groups-Homogeneous scheme, with no Control FE Onlyone refuelling chain with 25 standard FE was considered Recentdata coming from the NUR start up were used /12 / in order toimprove the experimental reference for the calculated reactivityThe results are presented in tables 1 and 2 Briefly theconclusions of this design step were-It is possible to get the desired irradiation flux (1014) in theCIB (5 Mw) in order to produce Inss and improve the Mossproduction
Table 1 Comparison between different FE managements25 FE core configuration, 5 Mwwith Central Irrad Box (CIB)
Table 2 Economic cost of the CIB25 FE core configuration
( 5 Mw )
C I BMean Neutronic Thermal Flux
(best Irrad box)Discharged BurnupFE per full power year
withIQi-t
n/ctn2sec45 % U23B
16 8
without6 7 1013n/cm2sec55 % U238
13 7
-The economical cost of the CIB, although significant (about 3 FEper full power operating year) is considered to be partiallycompensated with the reactor production increase The 25 FE corewith CIB (fig 1) is adopted as final geometry for the equilibriumcore-An intermediate IN—>OUT, OUT—>IN refuelling scheme was selectedin order to obtain a power peaking factor less than 3 5 and adischarge burnup about 45 % of Uz35 consumed
FE ManagementCycle Length ( T )Discharged BurnupPower Peaking Factor
Mean Neutronic Thermal Flux( CIB )
In - -> Out23 8 days
49 8 % U236
4 01 1 101*n /cn^sec
Out —— j- In20 0 days41 8 % U23B
3 09 9 lui3n/cm2sec
G
G
G
G
G
G
G
G
IB
R5
IB
G
G
R4
G
G
RI
R3
IB
G
G
CIB
G
G
R2
G
G
G
IB
G
IB
G
G
G
G
G
Standard FERi Control FEIB !i rucli<stion boxG Graphite reflector
Figure 1 25 FF conf igui ation for the equilibrium core
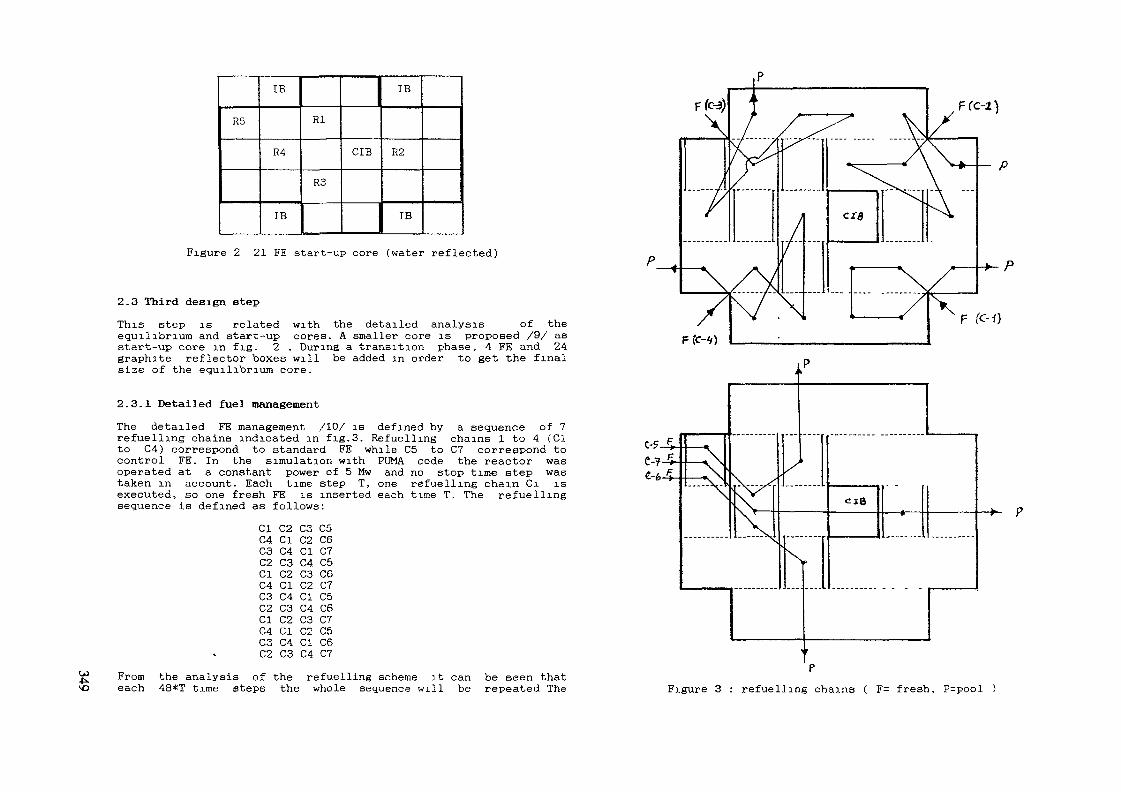
R5
IB
R4
IB
Rl
R3
hJ10CIS R2
-I-
F(C-Z)
Figure 2 21 FE start-up core (water reflected)
2.3 Third design stepThis step is related with the detailed analysis of theequilibrium and start-up cores. A smaller core is proposed /9/ asstart-up core in fig. 2 . During a transition phase, 4 FE and 24graphite reflector boxes will be added in order to get the finalsize of the equilibrium core.
2.3.1 Detailed fuel managementThe detailed FE management /10/ is defined by a sequence of 7refuelling chains indicated in fig.3. Refuelling chains 1 to 4 (Clto C4) correspond to standard FE while C5 to C7 correspond tocontrol FE. In the simulation with PUMA code the reactor wasoperated at a constant power of 5 Mw and no stop time step wastaken in account- Each time step T, one refuelling chain Ci isexecuted, so one fresh FE is inserted each time T. The refuellingsequence is defined as follows:
Cl C2C4 ClC3 C4C2 C3Cl C2C4 ClC3 C4C2 C3Cl C2C4 ClC3 C4C2 C3
C3 C5C2 C6Cl C7C4 C5C3 C6C2 C7Cl C5C4 C6C3 C7C2 C5Cl C6C4 C7
OJ From the analysis of the refuelling scheme it can be seen thateach 48*T time steps the whole sequence will be repeated The Figure 3 : refuelling chains ( F= fresh, P=pool )

u»op hot with Xe (pom) Table 3: Detailed FE management results
2400 -
2200
2 000
1.800
1,600
1,400
1.200-
1.000
BOC
£OC
—i———\———;———i———i———\———i———;———i———i——0 100 200 300 400 500 600 700 800 900 1000
t (days)
Figure 4 : BOC and EOC reactivity versus operation time
X-Y(B2z) 2gr homogeneous calculation scheme was applied, anyway,the control FE were included in the model in order to take theright volumes and UZSB loadings into account. The insertion ofcontrol rod-4 during the operation was also considered.Setting the condition:
EOC reactivity (hot with Xe) > 1000 pcma cycle length of T = 21 days was found in agreement with previousnon detailed calculations. Once the equilibrium methods wereapplied and a BOC core state was obtained, a detailed simulation,starting from this BOC state was performed. During the48*T = 1008 days the neutronic flux of the reactor wasre-calculated after each refuelling (ie each 21 days). It wasverified that the initial core was in equilibrium obtaining theoscillations of the different parameters during a macro-cycle( 48*T ). Fig. 4 shows the BOC and EOC reactivities versus theoperation time, while table 3 gives the main parameters obtainedwith this detailed refuelling scheme.
BOC reactivity (hot, with Xe )EOC reactivity (hot, with Xe )U23B mass in the BOC coreU23B mass in the EOC core
Ap BOC —— >EOCAM235 BOC —— >EOC
Äp / AM23S
MINIMUM1869 pcm1123 pcm5129.5 gr5002.0 gr
716 pcm126.85 gr5.64 pcm/gr
MAXIMUM2085 pcm1365 pcm5168.1 gr5041.1 gr735 pcm126.85 gr
5.79 pcm/gr
AEnergy (BOC—>EOC) = 5 Mw * 21 daysDISCHARGED BURNUP :Standard FE = ( 47.4 ± 2.1 )Control FE = ( 44.3 ± 1.0 )
of U23B consumedof U23S consumed
2.3.2 Operative core conditionsUsual design requirements have been put together in a set ofconditions that shall be verified by the start-up core as well asthe equilibrium core.Let us consider:
pmajc = core reactivity excess (ie calculatedreactivity, cold, without Xe, all control
rods withdrawn).P4 = calculated reactivity of the core (cold withno Xe) with the 4 safety-rods bank inserted
P2 = calculated reactivity of the core (cold withno Xe) with any 2 safety rods inserted
Then we have the following static conditions to be verified inorder to consider that a core is operable:
( pmax - p 4 ) / pmax > 1.5
-p-i > 3000 pcm
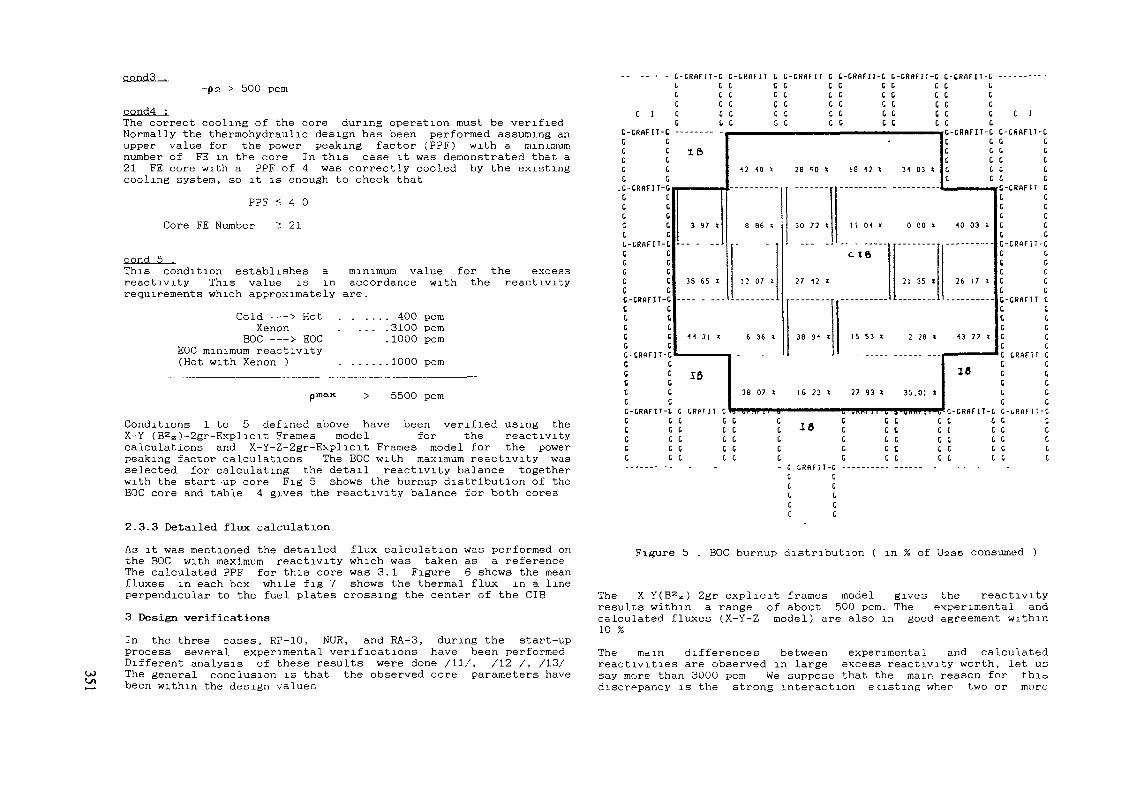
-p2 > 500 pcm
The correct cooling of the core during operation must be verifiedNormally the thermohydraulic design has been performed assuming anupper value for the power peaking factor (PPF) with a minimumnumber of FE in the core In this case it was demonstrated that a21 FE core with a PPF of 4 was correctly cooled by the existingcooling system, so it is enough to check that
PPF < 4 0Core FE Number 2 21
cond 5This condition establishes a minimum value for the excessreactivity This value is in accordance with the reactivityrequirements which approximately are.
Cold ——> HotXenon
BOC ——> EOCEOC minimum reactivity(Hot with Xenon )
. 400 pcm
.3100 pcm
.1000 pcm. .1000 pcm
u>
pmax > 5500 pcm
Conditions 1 to 5 defined above have been verified using theX-Y (B2z)-2gr-Explicit Frames model for the reactivitycalculations and X-Y-Z-2gr-Explicit Frames model for the powerpeaking factor calculations The BOC with maximum reactivity wasselected for calculating the detail reactivity balance togetherwith the start-up core Fig 5 shows the burnup distribution of theBOC core and table 4 gives the reactivity balance for both cores
2.3.3 Detailed flux calculationAs it was mentioned the detailed flux calculation was performed onthe BOC with maximum reactivity which was taken as a referenceThe calculated PPF for this core was 3.1 Figure 6 shows the meanfluxes in each box while fig 7 shows the thermal flux in a lineperpendicular to the fuel plates crossing the center of the CIS3 Design verificationsIn the three cases, RP-10, NUR, and RA-3, during the start-upprocess several experimental verifications have been performedDifferent analysis of these results were done /ll/, /12 /, /13/The general conclusion is that the observed core parameters havebeen within the design values
C I
C-CRflFIT-CG CC CC CC CC C
C CG CC CC CC CC-CRf lF IT-CC CC CC CC CC CC-CRflFH-CC CC CC CG CC C
C , C G C G C G C G C C CC C C C C C G C G C G CC C G G C C C C C C G CC C C C G C C C C C C CC G C G C C G C C C C C
1&
3 97 t
35 65 l
12 10 l 2B «0 « I8 12 »
8 B6 l
12 07 2
•M 31 « 6 36 l
C Cc t IßC CC CC CG-CRf tF IT -C 0 G R A F I T CC C C CC C t CC G G CC C G CC C C C
38 07 t
30 72 » 11 01 u
CI6
27 12 t
38 91 t
16 23 l
15 53 »
27 93 »
C C C CC C •* w C CC C C CC C G CC C C C
31 03 *
C GC CC CC CC C
0 00 x 10 03 î
21 35 X 26 1 7 »
2 28 > 13 22 <
35.0! *
18
C C C CC C C CG C C CG C C CG C C C
C I
G-CRf tF IT -CG GC CC CG CC CC-CRf lF lT CG CC GC CC CC CG-CRfl f n-CC GC CC CC CC CC-CRf lFIT CG CC CG CC CC G
l>KHf 1 l tj
c cC CG CC CG CC - u R d F I I - CC GC CC CC CC C
Figure 5 . BOC burnup distribution ( in % of Usse consumed )
The X-Y(B2z) 2gr explicit frames model gives the reactivityresults within a range of about 500 pcm. The experimental andcalculated fluxes (X-Y-Z model) are also in good agreement within10 %The main differences between experimental and calculatedreactivities are observed in large excess reactivity worth, let ussay more than 3000 pcm We suppose that the main reason for thiodiscrepancy is the strong interaction e-cisting when two or more

W
N) i 0.59
1.6B
1.52
2.65
2.70
2 67
3 .19
2.50
2.72
2.15
; 58
2.18
0.82
2.08
1.70 :
2.86 :
3.26
1.26
6.32
2 '8
t.ri
2. M
5.98
2.23
3.16
1.06
1.69
2.71
3.Ï1
3.09
6.39
2.61
9.11
2.71
9.63
2.19
9.15
2.51
6.57
2.15
: 2.90
': 3 .12
1.13
3.33
8.91
2.69
11.11
3.62
11 .12
3.82
10.62
3.61
8.35
2 51
3.22
1.16
l .09
2.60
1.69
3.39
9.18
2.67
l l. 70
3.61
c»9. 15
10.36
11.10
3.56
8.66
2.62
3.99
3.16
1.00
3.18
8.11
2.58
10.8?
2.86
10.83
3.81
10.30
2.79
7.28
2.58
3.11
3.09
2.56
2 88
5.10
2 87
7 63
2 50
6 27
2 60
': 7. OS
2 60
163 61
1 67
1 95
2 95
C.T
0.98
2.12
2.12-4"
2.75 - — *
3.60
2.83
3.91
2.87
3.25
2.87
l. 86
2.81
0.96
2.31
Table 4: Reactivity balance of the start-up and equilibriumcores
Figure 6 : BOG mean neutronic fluxes per region
control rods are inserted together. Normally the experimental coreexcess reactivity is obtained by adding linearly the control rodsworth obtained from the control rod calibration which givesgreater results than the calculated values. Figures 8 and 9 showsdifferent cores that have been measured in the NUR and RA-3reactor. The FE data are the same in both cases and can beobtained from table 5 ( more details are given in /12/).
TEMP.
COLD20 C
HOTHOT
XENON
without
withoutwith
HI
1
111
1
R2
1
1
11
1
R3
1
1
1
11
R4
1
)
111
p (pcm)start-up4981
89720978571202
-2621-3969-2413-2721-3100-2491-1377545441554
p (pcm)equilibrium
5300
1320228013301920-2020-2990-1630-2040-2400-1370-1180049502120
Ri = 1 indicates control rod i 100% insertedRi = blank indicates control rod 1 100% withdrawn
( 1013 n/cmzsec
16-
14-
12-
10-
8-
6-
4-
O _ _
Figure 7: Neutronic thermal flux versus position ina central line perpendicular to the fuelplates
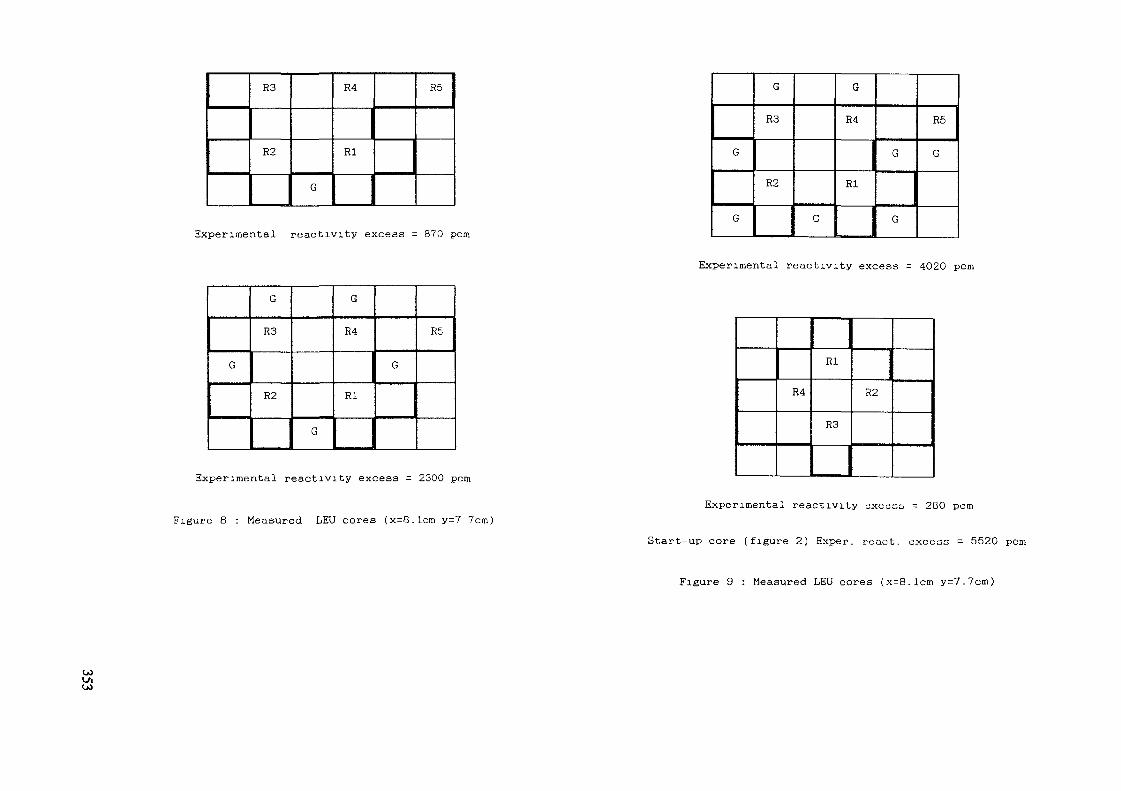
R3
R2
R4
Rl
R5
Experimental reactivity excess = 870 pcm
R3 R4
R2 Rl
Experimental reactivity excess = 2300 pcm
Figure 8 : Measured LEU cores (x=8.1cm y=7 7cm)
OJ
G
G
G
R3
R2
G
G
R4
RI
G
G
R5
G
Experimental reactivity excess - 4020 pcm
RI
R4 R2
R3
Experimental reactivity excess = 280 pcm
Start-up core (figure 2) Exper. react, excess = 5520 pcm
Figure 9 : Measured LEU cores (x=8.1cm y=7.7cm)
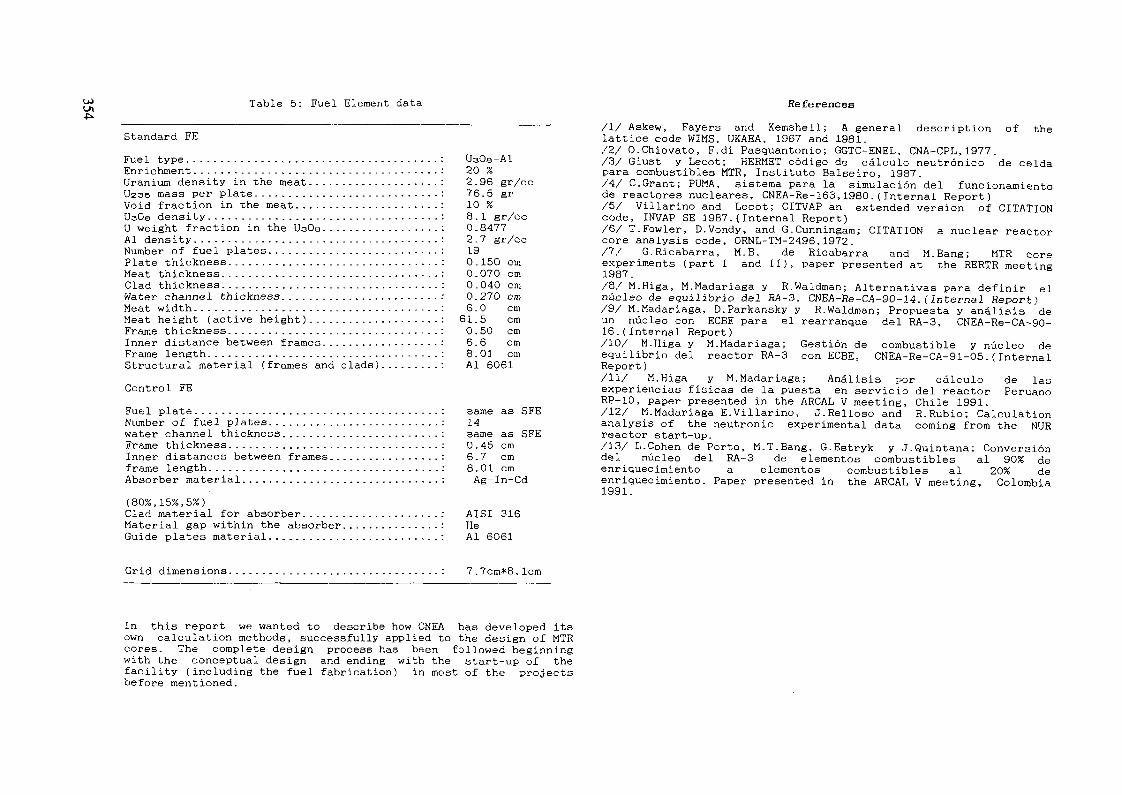
Table 5: Fuel Element data References
Standard FEFuel type......................................: U30a-AlEnrichment.....................................: 20 %Uranium density in the meat....................: 2.96 gr/ccUz36 mass per plate............................: 76.5 grVoid fraction in the meat......................: 10 %UsOs density...................................: 8.1 gr/ccU weight fraction in the UsOa..................: 0.8477Al density.....................................: 2.7 gr/ccNumber of fuel plates..........................: 19Plate thickness................................: 0.150 cmMeat thickness.................................: 0.070 cmClad thickness.................................: 0.040 cmWater channel thickness........................: 0.270 cmMeat width.....................................: 6.0 cmMeat height (active height)....................: 61.5 cmFrame thickness................................: 0.50 cmInner distance between frames..................: 6.6 cmFrame length...................................: 8.01 cmStructural material (frames and clads).........: Al 6061Control FEFuel plate.....................................: same as SFENumber of fuel plates..........................: 14water channel thickness........................: same as SFEFrame thickness................................: 0.45 cmInner distances between frames.................: 6.7 cmframe length...................................: 8.01 cmAbsorber material..............................: Ag-In-Cd(80%,15%,5%)Clad material for absorber.....................: AISI 316Material gap within the absorber...............: HeGuide plates material..........................: Al 6061
Grid dimensions......--..................-.....: 7.7cm*8.1cm
/!/ Askew, Fayers and Kemshell; A general description of thelattice code WIMS, UKAEA, 1967 and 1981./2/ O.Chiovato, F.di Pasquantonio; GGTC-ENEL, CNA-CPL, 1977./3/ Giust y Lecot; HERMET cödigo de câlculo neutrônico de celdapara combustibles MTR, Institute Balseiro, 1987./4/ C. Grant; PUMA, sistema para la simulaciôn del funcionamientode reactores nucleares, CNEA-Re-163, 1980. ( Internai Report)/5/ Villarino and Lecot; CITVAP an extended version of CITATIONcode, INVAP SE 1987. ( Internai Report)/&/ T. Fowler, D.Vondy, and G.Cunningam; CITATION a nuclear reactorcore analysis code, ORNL-TM-2496, 1972./7/ G.Ricabarra, M.B. de Ricabarra and M.Bang; MTR coreexperiments (part I and II), paper presented at the RERTR meeting1987./8/ M.Higa, M.Madariaga y R.Waldman; Alternativas para définir elnûcleo de equilibrio del RA-3, CNE.A-Re-OA-90-14. ( Internal Report)/9/ M.Madariaga, D.Parkansky y R.Waldman; Propuesta y anàlisis deun nûcleo con ECBE para el rearranque del RA-3, CNEA-Re-CA-90-16. (Internal Report)/10/ M.Higa y M.Madariaga; Gestion de combustible y nûcleo deequilibrio del reactor RA-3 con ECBE, CNEA-Re-CA-91-05. ( InternalReport)/11/ M.Higa y M.Madariaga; Anàlisis por câlculo de lasexperiencias fisicas de la puesta en servicio del reactor PeruanoRP-10, paper presented in the ARCAL V meeting, Chile 1991./12/ M.Madariaga E. Villarino, J.Relloso andanalysis of the neutronic experimental datareactor start-up./13/ L.Cohen de Porto, M.T.Bang, G.Estryk y J.Quintana; Conversiondel nûcleo del RA-3 de elementos combustibles al 90% deenriquecimiento a elementos combustibles al 20% deenriquecimiento. Paper presented in the ARCAL V meeting, Colombia1991.
R.Rubio; Calculationcoming from the NUR
In this report we wanted to describe how CNEA has developed itsown calculation methods, successfully applied to the design of MTRcores. The complete design process has been followed beginningwith the conceptual design and ending with the start-up of thefacility (including the fuel fabrication) in most of the projectsbefore mentioned.

OiOi
CONTROL ROD WORTH, REACTIVITY AND POWERDISTRIBUTION IN A 1300 MWe PWR
M. NURDINNational Atomic Energy Agency,Jakarta, Indonesia
AbstractThe objectives of the presentation are to perform the
amelioration of the precision in the burn-up calculation forthe purpose of In-Core Fuel Management and impl ic i t ly theimprovement of the reactor performance and the reactor
safety. In generating the cross section set for the nuclear
fuel assemblies having the absorber rods, a new procedure
has been formulated to overcome the over-es t imat ion of the
worth of the control fuel assembly. The new procedureenables us to adjust the homogeneous nuclear constants by anadjus tment factor t ak ing into account the in f luence of theenvironment of control fuel assemblies in the core and theequivalence of the t ranspor t -d i f fus ion calculat ion. The
adjus tment factor calculated at the beginning of l i fe of thereactor has been proved r igorously to be su f f i c i en t for all
core condi t ion . Generat ion of the adius ted nuclear constantsbecome a simple process. Hence this procedure enables us to
improve three dimensional study of the core wi th reasonable
computing cost and to anticipate the consequences of any
movement of the absorber rods d u r i n g operat ion of thereactor.
INTRODUCTION
The present study deal with the calculational scheme forpressurized water reactors aiming to improve the precisionof core computation for the augmentation of safety andreactor performance. This is especially intended for thereactors operating as load fol lower, where the permanent
movement of the control rods are needed. Hence it is reallynecessary to know correctly the worth of different group ofrods insertion in the three dimensional calculation, wheref rom computing cost point of view, they must be executed inhomogeneous one.In the calculational sequence known so far , the homogeneousor heterogeneous cross sections of fuel assembly arecalculated in infinite medium.Core calculations using one library per fuel assembly(homogeneous cross section) have good result compared to thereference if there is no control fuel element in the core,and if the rods are in the core they overestimate thecontrol rod worth from 6 to 10% compared to the reference.On the other hand core calculation using cell by celllibraries give good result what ever the configuration ofthe core, but such computation is very expensive and needvery high space of memory.Concerning the calculational schema requiring newdevelopment, the study consist of two main subjects, f i rsthow to represent heterogeneously a certain fuel assemblies inthe transport calculation and second how to improve thehomogeneous nuclear constants of the control fuelassemblies. Hence the contribution of this study are :
1. On one hand, determination of the grouping procedure ofthe cell as a funct ion of fuel enr ichment , concentrationof boron in the moderator, fuel burn-up etc. Using thetransport code APOLL01, based on the best discretisationof the fuel assembly, reactivity and power distributionper fuel assembly are calculated both at time zero andin burnint f -up ( e v o l u t i o n ) situation.
2. On the other hand, establishment of a method in calcu-lating the homogeneous nuclear constants for the controlfuel assemblies.

WUla\
So the study covers the following analysis- Pressurized Water Reactor 1300 MWe- Calculational Method used for Cross Section Generation- New Procedure for Generating Homogeneous NuclearConstants of the Control Fuel Assemblies
- Generalisation of the Calculational Procedure- Conclusion
R P N M L K O H G F E D C B A
i. PRESSURIZED WATER REACTOR 1300 MWe
1-1 Principal Characteristics of the Core
This system use light water reactor both as coolant and mo-derator Moderation ratio of a cell is 1.655 and for a stan-dard fuel assembly the ratio is 1.982.Active length of the core (H) is 426.7 cm and its equivalentdiameter (D) is 337.03 cm. The core produce 3 800 MWth.The first core of the reactor consist of 193 fuel assemblieshaving three different enrichments. There are 65 fuel assem-blies with the enrichment of 1.50%, 64 fuel assemblies withenrichment of 2.40% and the rest is 2.95%Loading pattern of the first core is shown in Fig. 1-1.There are 58 instrumented fuel assemblies in the core,equipped by mobile detector, intended for detail fluxmapping.For the first core, at beginning of life, with obligation tohave negative temperature coefficient of the moderator,a certain fuel assemblies are equipped by burnable-poison(glass of borosilicate).There are 80 burnable fuel assemblies in the core an afterthe first cycle all burnable rods will be removed from thefuel assembliesFor the purposes of reactor operation and safety, there arethree control system available, i.e
1.50% 2 40% 2 95%
Fig. 1-1 LOADING PATTERN OF THE FIRST CORE
Urgent shut-down of the reactor the system must becapable of stopping the reactor at any moment of ope-ration.Power regulation the objectives of the system are,- to regulate the variation of moderator average tempe-rature during operation,
- to regulate the power demand, regulation of reactorpower level
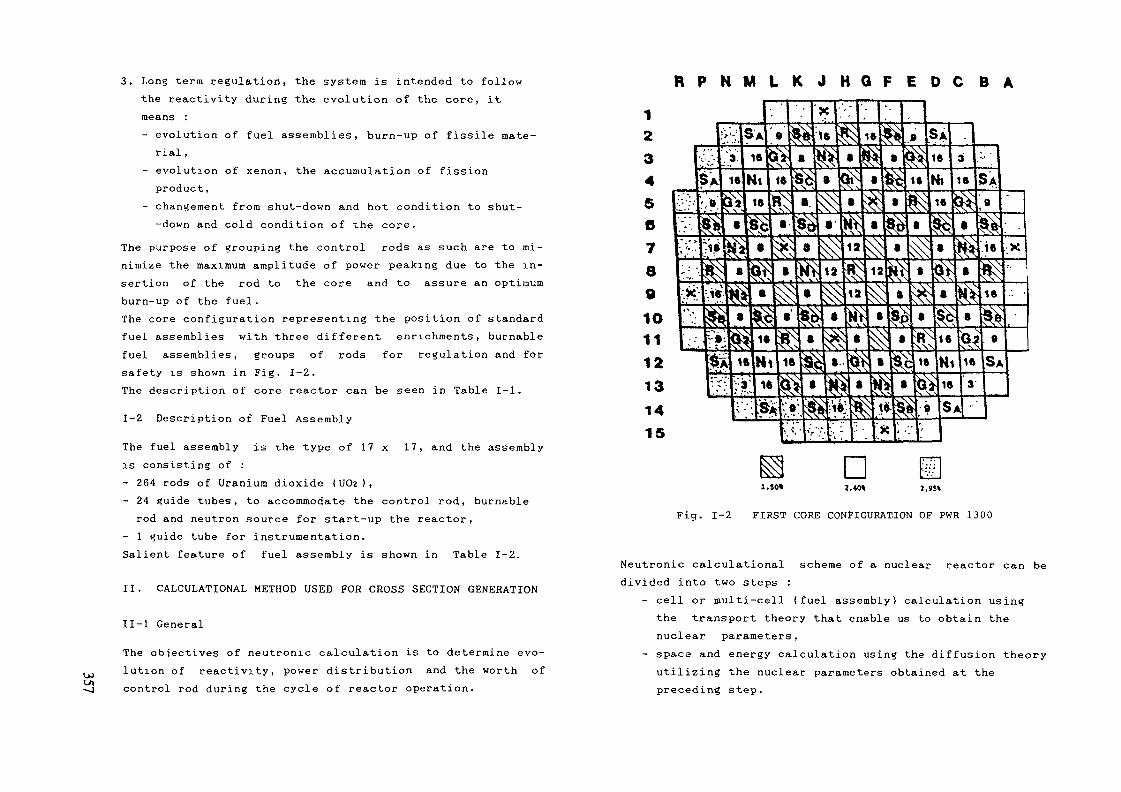
3. Long term regulation, the system is intended to followthe reactivity during the evolution of the core, itmeans :- evolution of fuel assemblies, burn-up of fissile mate-
rial ,- evolution of xenon, the accumulation of fissionproduct,
- changement from shut-down and hot condition to shut--down and cold condition of the core.
The purpose of grouping the control rods as such are to mi-nimize the maximum amplitude of power peaking due to the in-sertion of the rod to the core and to assure an optimumburn-up of the fuel .The core configuration representing the position of standardfuel assemblies with three different enrichments, burnablefuel assemblies, groups of rods for regulation and forsafety is shown in Fig. 1-2.The description of core reactor can be seen in Table 1-1.
1-2 Description of Fuel Assembly
The fuel assembly is the type of 17 x 17, and the assemblyis consisting of :- 264 rods of Uranium dioxide ( UO2 ) ,- 24 guide tubes, to accommodate the control rod, burnable
rod and neutron source for start-up the reactor,- 1 guide tube for instrumentation.Salient feature of fuel assembly is shown in Table 1-2.
II. CALCULATIONAL METHOD USED FOR CROSS SECTION GENERATION
II-l General
The objectives of neutronic calculation is to determine evo-lution of reactivity, power distribution and the worth ofcontrol rod during the cycle of reactor operation.
R P N M L K J H G F E D C B A
D1 .SO» 2,40« ],9S%
Fig. 1-2 FIRST CORE CONFIGURATION OF PWR 1300
Neutronic calculational scheme of a nuclear reactor can bedivided into two steps :
- cell or multi-cell (fuel assembly) calculation usingthe transport theory that enable us to obtain thenuclear parameters,
- space and energy calculation using the diffusion theoryutilizing the nuclear parameters obtained at thepreceding step.

TABLE 1-1. DESCRIPTION OF REACTOR CORE TABLE 1-2. SALIENT FEATURE OF FUEL ASSEMBLY00
Thermal Power, MWth 3 800Percentage of Power produced in fuel (%) 97.4Disposition of Fuel Assembly 3 regionAssembly with enrichment of 1.50% : 65Assembly with enrichment of 2.40% : 64Assembly with enrichment of 2.95% : 64Burnable fuel assembly (E=2.4% & E=2.95%) 80- Uranium, kg 103 909- U02, kg 117 880- Zircaloy, kg 24 700- Inconel, kg 1 110- Steel, kg 220- Water, kg 20 250
Temperature of coolant, C :- hot, zero power 297.20- inlet, hot, nominal power 293.10- average in core, hot, nominal power 311.80
Nominal pressure in bars 155.10Average linear power, kw/m 17.02Power produced in core kw/kg uranium 36.60Power density, kw/1 core 99.80
The cross section sets of each fuel assembly in 2 groups ofenergy used in the diffusion calculations are generated bythe transport code "Apollo 1" using the approximation ofmulti-groups for energy spectrum 10 - 10 Mev) and collisionprobability method (best adaptation for heterogeneous thinmediums of the lattice).
The nuclear constants obtained from this calculation can bein two forms :
- heterogeneous nuclear constants, cell by cell libraryof an assembly,
Type of arraySide of the assembly, cmNumber of fuel rod per assemblyNumber of guide tube per assemblyNumber of grid along the active coreNumber of grid along the fuel assembly
Material :- fuel- pressurization gas- cladding- grid- cladding absorber rod
Cold fuel cell dimension :- pitch, cm- outer diameter of the cladding, cm- inner diameter of the cladding, cm- pellet diameter, cm
Cold guide tube dimension :- outer diameter, cm- inner diameter, cm
Fuel enrichment- region 1, 65 assemblies (%)- region 2, 64 assemblies (%)- region 3, 64 assemblies (%)
17 x 1721.504264259m
UOHeliumZircaloy 4Inconel 718SS 304
1.2600.9500.8360.819
1.2241.143
1.502.402.95
- homogeneous nuclear constants, one library of anassembly.
Having two forms of library, we can have two calculationalschemes :
- heterogeneous transport-diffusion,- homogeneous transport-diffusion.

At the first scheme, the calculation of core or a fractionof core (motif, assembly) is carried out for each cell indiffusion theory. This calculation is considered as the re-ference for the calculation of the second scheme.
II-2 Cross Section Generation
In this step, it is necessary to determine the represen-tation of fuel assembly for the transport calculation, sincemost of the assemblies in the core are symmetric; aftera certain verification basing on :
- correction factor of equivalence heterogeneous andhomogeneous transport (factor SPH) ,
- level of integrated flux in 13 physical cells and inthe fuel assembly,
- reactivity of each assembly,- computing time,
it was refound that the symmetrical fuel assembly can berepresented by 1/8 of the assembly, total cells of this pre-sentation are 45, see Fig. II-l.According to the core configuration, and taking into accountthe water layer between the assemblies, there are 8 genericcells in the core :a. fuel cell at the corner of assemblyb. fuel cell at the peripheryc. inner fuel celld. water rod cell (TE)e. water rod cell for instrumentation (TI)f. grey rod cell (BG-ACIER)g. black rod cell (BN-AIC )h. black rod cell (BN-B4C)i. burnable rod cell (PC)
The distribution of these generic cellassemblies are as follow :
in the fuel
REPARTITION UF GENERIC CELL PER FUEL TYPE
Beneviccell
n ja
b
c
d
e
"f
9
h
I
StandardFuel
Assembly
1t0
SO
5
1
-
-
-
-
GreyCF«
i
B
30
-
1
3
2
-
-
Black CFA
AglnCd
j
r»
30
-
i
-
5
-
-
B4C——————— i
1
8
30
-
1
-
-
5
-
Burnable Fuel
8PC
1
8
3O
4
*---i
12PC
1
8
30
3
i
-
-
-
2
16PC
t
8
3O
2
1
-
-
-
3
Cold dimension of absorber rod used in our calculations isillustrated in Fig. II-2.
For each fuel assembly, it has 5 or 6 generic cells, eachhas different isotopic composition or different geometry,and due to the limit of code, we determine 13 physical cell.The complete schemes for the elaboration of nuclear cons-tants at time zero and during evolution of core are illu-strated in Fig. Il-3a and Fig. II-3b.

/ ——A-H
X
A |TE37
ORIENTATION CELL
N - - —— »• GENERIC CELL
' ——— *" PHÏSICAL CELL
A 3
29
« 338
A 322
G 3
30
F 339
A 2TE16
i 323
G 3
31
A 1TE40
A 3
II
H 317
E 324
H 3
32
H 34l
A 2TE7
E 3
12
F 318
F 325
G 3
33
F 342
A 3
*H 38
G 3
13
A 2TE19
E 326
G 3
34
A 2TE43
A 3
2
A 3
')
A 39
H 3
14
H 320
E 327
H 3
35
H 344
A 5
1
A 43
A 4
6
A «10
A 4
15
A *2l
A 428
A 4
36
A 445
7
16
15
14
U
12
11
10
9
10 11 12 13 U IS 16
Fig. II-l REPRESENTATION OF 1/8 FUEL ASSEMBLY
17
Using the two calculational schemes mentioned above, we have9,24 and 22 groups of cells in the standard, grey and blackcontrol fuel assembly respectively.For burnable fuel assemblies having 8,12 and 16 rods ofpirex, we have respectively 20,27 and 24 groups of cells.Representation of 22 groups of cells for black control fuelassembly is shown in Fig. J.I-4.
12,60 nrnZONE/RADIUS
12345
MATERIALZircaloy (G.T.)WaterSS 304GapAIC or B4C
COLD RADIUS (cm)
Fig. II-2 COLD DIMENSION OF ABSORBER CELL
The validity of cell grouping have been verified rigorouslyby taking into consideration, the following situations :
- level of discretisation,- degree of enrichment,- concentration of boron in moderator,

OJ
E U R Y D I C E - D P O Ö3 7 G R O U P S O F E N E R G Y
5 O R 6 G E N E R I C C E L L S1 3 P H Y S I C A L C E L L S
W I T H S P H 2 f T - T ] " H O M O G E
1 3 E Q U I V A L E N T I S O T O P S
S E C T I O N S W I T H
3 7 G R O U P S O F E N E R G Y
E U R Y D I C E - D P O O3 7 G R O U P S O F E N E R G Y
1 3 G E N E R I C C E L L S5 0 P H Y S I C A L C E L L S
S E C T I O N S H O M O G E S + E Q U I V A -L E N C E T - D f D I F l ü F O R D I A N E 3
D I A N E 3 H E T E R O G E N E O U S
C R O N O S 2 H O M O G E N E O U S
C R O N O S 2 H E T E R O G E N E O U S
Fig. II-3a GENERATION OF CROSS SECTION AT STEP 0
- burn-up level ,- d ispar i t ion of burnable po ison in the fue l a s sembly .
The relative discrepancies of the po^er d i s t r i b u t i o n compa-red to the reference are in the order of 1 or 2%. The cellat the corner present around 3 or 5%, f o r t u n a t e l y the powerin such k ind of assembly is lov,er t han the average one.It is wor th to ment ion that the g roup ing used for g rey con-trol fue l assembly can not be app l i cab l e for to the blackcontrol fuel assembly even the degree of d i s c r e t i s a t i on ofthe fo rmer is better than the last one ; the p r o i i l e of phy-sical interact ion between the ce l l s are not ident ic an thoseassemblies.
E U R Y D I C E DPOOHET. TRANSP. CALC.
G - 13 - 45
EURYDICE DPOOHOM. TRANSP. CALC.
13 - 45 - 45
DIANE 3HET. DIFF. CALC.
CELL BY CELL
FUEL ASSEMBLIESPWR 1300
EURYDICE 0"00WITHOUT SPH
HET. TRANSP. CALC.G - RG - 45
GROUPED CELL, DIFl
DIANE 3HET. DIFF. CALC.
CELL BY CELL IN
NON REASONABLE
ACCEPT THE DEFINEDGROUPING
Fig. II-3b CALCULATIONAL SCHEME FORGROUPING THE CELLS

o\Ni
, ORIENTATION OF CELL
A-HX. YZ
P, q r
A 1Tt
N _•. PHYSICAL CELL
—•-NORMALIZED POWER PROM 22 CELLS
» GPR
A B0.97051,27
A 70,99521.31
A 100,88221.91
G 100,90941,69
C 90,87621,19
A 38N
mmm6 U
0,81261.66
F U0,82251,59
A 2Bfi
1 —————A 13
0.8038-2,24
A 130.80051.82
t 120,85370,90
C 120,85910,80
A 110,81951,86
A «BH
•MMB 13
0,82380,17
C 130.82372,32-H 12
0.87540,75
D 120,87750,61
C 110,03521.80
A 161,157-0,86
A 151,0262,09
D 140.92060.49
A S I8N I
•ndft 12
0,90213.050 12
0.89813,06
A 48N
A 17U.343I-2.54
A 171.260-2.17
A 161,185O.ZS
A 151,081-1.00
A 181 1.012
1.41
G 18t. 010-0,69
A 181,000-0.60
A ie0.97742,07
A 19
1.300-5,80A 7 0
1,327-4,12
A 201.263-3.88
A 211.210-1.79
A 211.137-1.56
A 221,1020,64
A 221,0810,65
A 221,0680,83
A 221,0591,34
17
16
IS
14
13
12
U
u
10 u 12 13 14 15 16
Fig. II-4 REPRESENTATION OF 22 PHYSICALCELLS OF BLACK CONTROL FUELASSEMBLY /B,C ABSORBER ROD/ENRICHMENT = 1.5%BORON CONCENTRATION = 1150 ppmTE = WATER RODBN = CELL OF B4CWORTH = 48761 pern
17
Cell grouping must of course be determined properly, other-wise we lose the precision. It is important to note herethat cell grouping is relevant to minimize the computingcost, especially in generating the evoluti\e library v>heremany steps of burn-up are required.
III. NEW PROCEDURE FOR GENERATING HOMOGENEOUS NUCLEARCONSTANTS OF CONTROL FUEL ASSEMBLIES
III-l General
In following the demand of the grid, PWR 1300 use the greycontrol assembly (Gl, G2 ) and black control assembly (Nl,N2 and R). For this purposes, it is really necessary to knowprecisely the worth of the rods and from safety point ofview it is important to anticipate any consequences of therods movement on reactivity, power distribution and peakingposition.
III-2 Position of the Problem
Core calculations using one library per fuel assembly (homo-geneous cross section) have good result compared to the re-ferential ones if there is no control fuel element in thecore, and if the rods are in the core they overestimate thecontrol rod worth from 6 to 10% compared to the reference.On the other hand core calculation using cell by cell libra-ries give good result what ever the configuration of the co-re, but such computation is very expensive and need veryhigh space of memory. To show this phenomena, it is nece-ssary to have 6 motifs (each motif consists of 9 fuel assem-blies ) representing both the configuration of the core andthe spectrum of neutron energy, they are as follow

1 2 l2 c 2l 2 l
Motif B
l 2 y2 x 2l 2 l
Motif D
3 5 3l c 53 4 l
Motif C
1 2 y2 l 2x 2 l
Motif E
2 y 22 l 2l 2 x
Motif F
2 y 22 l 22 x 2
Motif G
Where : l = standard fuel assembly, E = 1.50%2 = standard fuel assembly, E = 2.40% + 8 pyrex3 = standard fuel assembly, E = 2.95%4 = standard fuel assembly, E = 2.40% + 12 pyrex5 = standard fuel assembly, E = 2.95% + 16 pyrex
C, X and Y = position for control fuel assembly.
Since we use the motifs to qualify our libraries, the refe-rences should be defined before.
Based on the work done on PWR 900 MWe (REP - CP1 (2)), ope-rating in mode A, a series of measurement on the worth oftheir control rod were compared to the results of hetero-geneous diffusion calculations as illustrated below
C o n t r o l r o d o r t h
UJ
Groupinsertion
Measurement( pcm )
1310+261+2.0%)1120+33(±2.9%)1857+571+3.1%)
Heterogeneousdiff. calculation
( pcm )
131811321906
+ 06+ 1 1+ 2.6
From the results in the above table, the heterogeneous cal-culation are slightly bigger than the measurement, but allof them are in the incertitude of the measurement. So we cantake the heterogeneous diffusion calculation as the refe-rence .If the control fuel assembly are replaced by standard fuelassembly (6 motifs), the maximum difference in reactivitybetween heterogeneous and homogeneous calculation is only83 pcm, it is negligible compared to the reactivity at themotif C. When absorber rods are inserted completely in thosemotifs (B, C, D, E. F and G), the relative discrepanciesrange from 6.6% to 7.95% in the motif B and motif C for theblack control assembly and they range from 2% to 2.29% forthe grey control assembly.For the other motifs, the discrepancies are slightly decrea-sed, but they are still untolerable.From the above presentation, our conclusion is that the ho-mogeneous nuclear constants of the control fuel assemblyshould be elaborated by certain amelioration.
HI-3 Calculational Scheme for Control Fuel Assembly
Homogeneous nuclear constants generated in infinite mediumdo not take into account the following phenomena
- the environment of the control fuel assembly in thecore,
- the equivalence of homogeneous transport-diffusioncalculation.
According to the core configuration, the proper environmentfor the control fuel assembly is the burnable fuel assembly.The modul treating the equivalence of homogeneoustransport-diffusion calculation is not available in theEURYDICE (direct homogenesation) Another constraint of Eu-rydice is in geometrical capacity
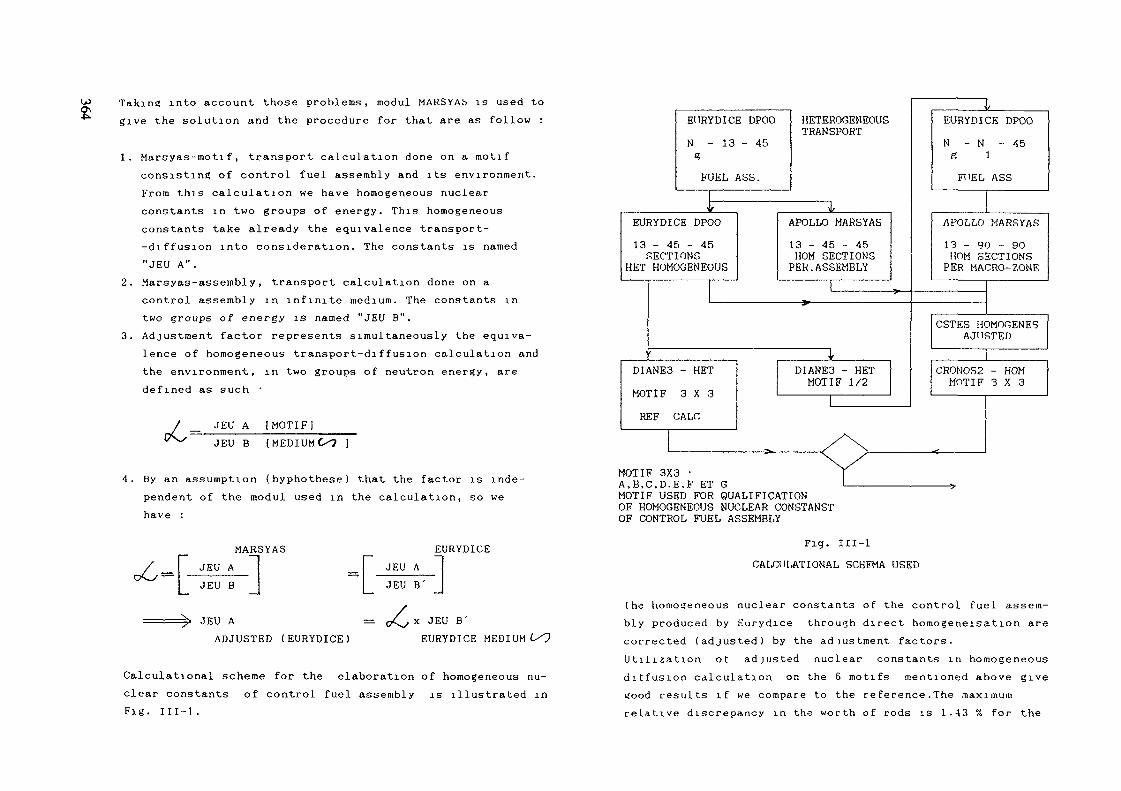
Taking into account those problems, modul MARSYAb is used togive the solution and the procedure for that are as follow :
1. Marsyas-motif) transport calculation done on a motifconsisting of control fuel assembly and its environment.From this calculation we have homogeneous nuclearconstants in two groups of energy. This homogeneousconstants take already the equivalence transport--diffusion into consideration. The constants is named"JEU A".
2. Marsyas-assembly, transport calculation done on acontrol assembly in infinite medium. The constants intwo groups of energy is named "JEU B".
3. Adjustment factor represents simultaneously the equiva-lence of homogeneous transport-diffusion calculation andthe environment,, in two groups of neutron energy, aredefined as such •
JEU A [MOTIF]_____JEU B (MEDIUMC--7 )
4. By an assumption (hyphothese) that the factor is inde-pendent of the modul used in the calculation, so wehave :
MARSYAS
JEU A
JEU B _J
JEU AADJUSTED (EURYDICE)
EURYDICEJEU AJEU B'
x JEU B'EURYDICE MEDIUM
Calculational scheme for the elaboration of homogeneous nu-clear constants of control fuel assembly is illustrated inFig. IIÏ-1.
EURYDICE DPOON - 13 - 45
a,
FUEL ASS.
EURYDICE DPOO13 - 45 - 45SECTIONS
HET HOMOGENEOUS
DIANE3 - HETMOTIF 3X3REF GALT.
HETEROGENEOUSTRANSPORT
APOLLO MARSYAS13 - 45 - 45HOM SECTIONSPER.ASSEMBLY
DIANE3 - HETMOTIF 1/2
MOTIF 3X3 •A,B.C.D.E.F ET GMOTIF USED FOR QUALIFICATIONOF HOMOGENEOUS NUCLEAR CONSTANSTOF CONTROL FUEL ASSEMBLY
EURYDICE DPOON - N 45
Ff'EL ASS
APOLLO MARSYAS13 - 90 - 90HOM SECTIONS
PER MACRO-ZONE
CSTES HOMOGENESAJUSTED
CRONOS2 - HOMMOTIF 3X3
Fig. III-1CALCULATIONAL SCHEMA USED
I he homogeneous nuclear constants of the control fuel assem-bly produced by Eurydice through direct homogénéisation arecorrected (adjusted) by the adiustraent factors.Utilization ot adjusted nuclear constants in homogeneousditfusion calculation on the 6 motifs mentioned above givegood results if we compare to the reference .The maximumrelative discrepancy in the worth of rods is 1.43 % for the

OJ
black control assembly on the motif C, compared to the valueof 0% using unadjusted homogeneous nuclear constants. Fromthe power distribution point of view that the maximum rela-tive discrepancy is 2.8% in the black control assembly, butfor the peripheral assemblies only 1.4%, both in thefuel assembly having less power.
IV. GENERALIZATION OF THE CALCULATIONAL PROCEDURE
IV-1 General
A.fter starting-up the reactor, all original characteristicsbegin to change, the evolution of the core are due to thefollowing phenomenas and needs :
-. at beginning of life1. depletion of fissile material,2. dilution of boron or its depletion in the moderator,3 accumulation of the fission product,4. depletion of boron in the burnable rod,-. beginning of the second core until equilibrium core :5. depletion of fissile material and fission product
accumulation in the control fuel element,6. chargement of the environment due to fuel element
shufflingfor the future cycle.
According to the various phenomenas mentioned above, doesadjustment factor calculated at the beginning of life chan-ge' To answer this question, a series of sensitivity studyis of course necessary; namely as a function of :
1. influence of the environment2. influence of the boron concentration in the moderator3. influence of burnable poison depletion
4. influence of the fuel evolution5. influence of the changement of the environment due to
fuel management path.
IV-2 Influence of the Environmental Modification
At the first cycle, the position of control fuel assemblyare also side by side with the burnable fuel assembly having9, 12 and 16 rods of pyrex and the enrichment of 2.40% and2.95%. To know the concequences of this modification on theadjusted nuclear constants, we use the motif B and C asbelow :
1 2 12 c 21 2 1
Motif B
3 5 31 c 53 4 1
Motif C
It is found that the maximum relative discrepancy on thecontrol rod worth of B4 C is only 1.43%. So the adjustmentfactor is still applicable.
IV-3 Influence of Boron Concentration in Moderator
Due to the operational demand, boron is diluted and so theconcentration decrease, for example until 25 ppm.When the adjustment factor generated, the concentration ofboron is 1150 ppm; there fore the simulation of boron con-centration like 650 ppm, 250 ppm and 25 ppm are required totest the factor.
Usina the same adiustment factor for each boron concen-tration, the adjusted homogeneous nuclear constants of the

EFFICRCITE DES BflRRES DRNS LE MOTIF CENRICHISSEMENT DU COMBUSTIBLE 2,kO 7.
3200. -
3800.
EFFICRCITE DE EflRRE (PCM)
1y ;§ is - BflRRESBflRRES
NOIRESWIRES
flICSIC
1 - REFERENCE2 - JEU EURY. II. I.3 - JEU HF4 - REFERENCE5 - JEU EURl. M. I.6 - JEU MP
CONCENTRRTION EN OORE (PPM)
0. 200. 100. 600. SCO. 1000. 1300
3
1
3
5
grappe
4
3
5
i
1 • assemblage sans poison (E=l,5<n)
3 « assemblage sans poison (E=2,95*)
4 » assemblage empoisonné (E=2,4tn, 12 pyrex)
5 • assemblage empoisonné (E=2,95*, 16 pyrex)
Fig. IV- 1 CONTROL ROD WORTH AS A FONCTIONOF BORON CONCENTRATION
control fuel assemblies having the fuel enrichment of 2 . 4 %are calculated.Utilization of these constants in the motif C give the maxi-mum relative discrepancy of 0.8% for Bt C; as shown in Fig.IV-1.
IV-4 Influence of Boron Depletion in Burnable Fuel Assembly
To simulate this study, boron concentration of 75,50 and25% from their natural concentration are taken as the basicof evaluation.In this case, the environment itself change, but nothing todo with the control fuel. For control fuel with fuel enrich-ment of 2,40%, the maximum relative discrepancy in the motifC is 0.73% for 84C at 75% concentration of boron in the bur-nable fuel assembly, it is shown in Fig. IV-2.
IV-5 Influence of Fuel Depletion
The conditions belong to this phenomena can be divided into3 situations :
- evolution of core during the first cycle, there arestill burnable rods in the core,
- evolution of core during the second and the thirdcore , there is no anymore the burnable rod in thecore, the original enrichment is still different,
- evolution of equilibrium core where the fuel assemblyhave the same initial enrichment.
The first case is much more complicated due to the hetero-geneous medium in the core, so it will be shown here the re-sult of verification both as a function of power distri-bution in the motif and reactivity/worth of the control fuelassembly.It is worth to remind here again that the adjustment factorused is always the first one, it was elaborated at the be-ginning of life.As shown in Fig IV-3 (A, A', B and B'), the maximum relativediscrepancy are in the control fuel element for the powerdistribution, so it is well accepted, because this fuel ge-
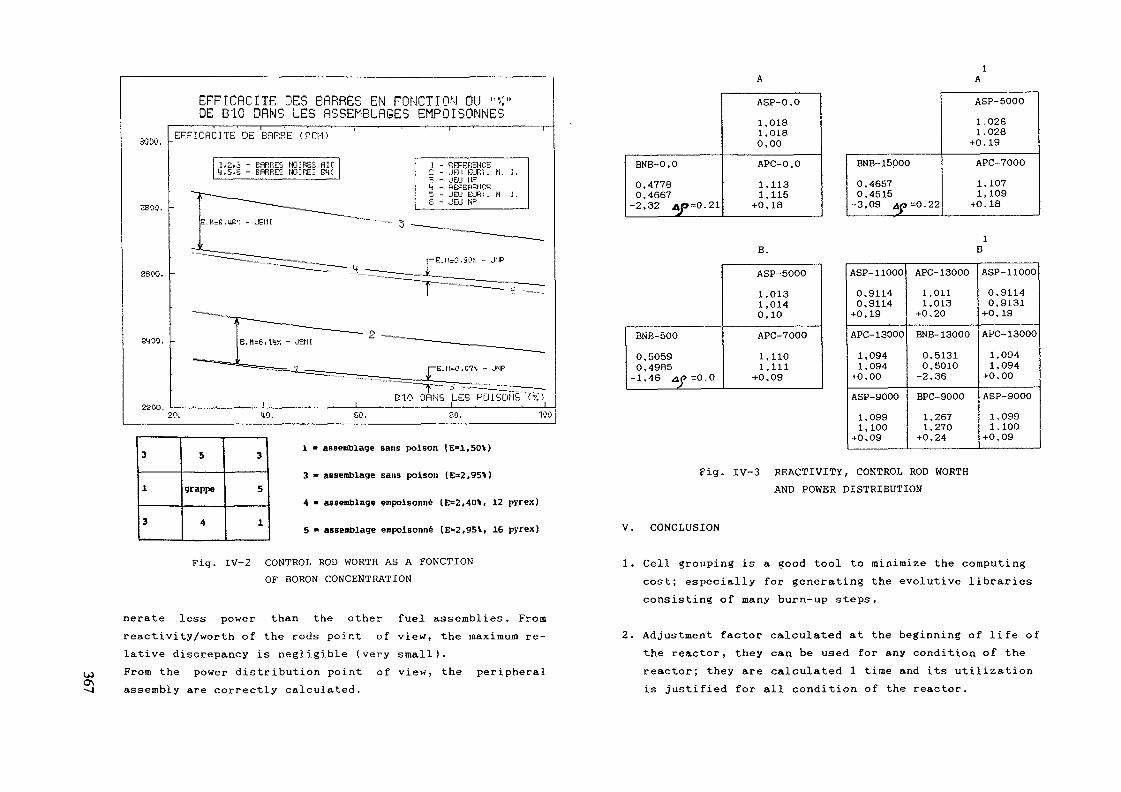
EFFICflCITE DES BflRRES EN FONCTION DU "••:»DE BIO DflNS LES flSSEMBLHGES EMPOISONNES
MOO. -EFFICflCITE DE BHRRE !PCM>
1,2.3 - BHRRES MOIRES flICy ,5.s - EfiRRES NOIRE; em: 12-45S
- REFERENCE- JEU EUR'.. II.- JEU IF- REFERENCE- JEU EURl . M- JEU NF
I.
1.
B 10 ORN5 LES POISOHS"7»;1. . i . . . i20. <to. so. 100
3
l
3
5
grappe
4
3
5
1
o\
i • assemblage sans poison (E=l,50\)
3 - assemblage Bans poison (E=2,95%)
4 » assemblage empoisonné (E=2,40*, 12 pyrex)
5 " assemblage empoisonné (E=2,95%, 16 pyrex)
Fig. IV-2 CONTROL ROD WORTH AS A FONCTION
OF BORON CONCENTRATION
nerate less power than the other fuel assemblies. Fromreactivity/worth of the rods point of view, the maximum re-lative discrepancy is negligible (very small).From the power distribution point of view, the peripheralassembly are correctly calculated.
BNB-0,00,47780,4667-2,32 0=0.21
ASP-0.01,0181,0180,00APC-0,01,1131,115
+0,18
BNB-15pOO0.46570,4515-3.09 40=0.22
ASP- 50001.0261,028+0,19APC-70001,1071,109+0,18
B.
BNB- 5000 , 50590,4985-1.46 j>=0.0
ASP-50001,0131,0140,10APC-70001,1101,111+0,09
ASP- 110000,91140,9114+0,19APC-130001,0941,094+0,00ASP-90001,0991,100+0,09
APC-130001,0111.013+0.20BNB- 130000.51310,5010-2,36BPC-90001,2671,270+0,24
ASP- 110000,91140,9131+0,19APC-130001,0941.094+0,00ASP-90001,0991,100+0,09
Fig. IV-3 REACTIVITY, CONTROL ROD WORTHAND POWER DISTRIBUTION
V. CONCLUSION
1. Cell grouping is a good tool to minimize the computingcost; especially for generating the evolutive librariesconsisting of many burn-up steps.
2. Adjustment factor calculated at the beginning of life ofthe reactor, they can be used for any condition of thereactor; they are calculated 1 time and its utilizationis justified for all condition of the reactor.
U)o\oo 3. Application of this homogeneous cross section, enable usone day to modify all the constants for the purpose ofthree dimensional diffusion calculation by the new p.c.
4. Adjustment of the nuclear constants is then quitesimple; but the result are well justified both by powerdistribution in the core on in the fraction of the core(motif) and by the reactivity & the worth of rods.
REFERENCES
1. M. NURDINReactor a eau sous pression de 1300 MWe:Amelioration de la representation des assemblages et ducalcul des absorbantsPh.D Thesis. Université de Paris XI. Centre d'OrsayJune 1989
2. J. BERGERONPrivate communication
3. J. BILLECOCQUEPrivate communication
4. A. PUILLPrivate communication
5. M. NURDINCalculational method for PWR burnable fuel assemblyIAEA-TEC DOC-587VIENNA - December 1989
6. J. KREBSUtilisation dans Marsyas de Jeux de sections équivalen-tes transport. Comparaison EURYDICE - MARSYIASRapport DEMT/481
7. J. KREBSPrivate communication
8. APPOL01 :- Note de principe. Report DEMT 85-450/SERMA 728/1- Note de informatique. Report DEMT 86-322/SERMA 728/2- Notice d'utilisation. Report DEMT 87-446/SERMA 954
9. J.L. FRANÇOIS, R. LENAINDIANE3 :Presentation de la procédure No : 1.Report DEMT 85/457
SERMA/LENR/85/733 "T"
10. CRONOS- Note de principe. Report DEMT 85-305/SERMA 704/1- Notice d'utilisation. Report DEMT/87-019/SERMA 704-3
11. M. DETOCModule TRISYNTHESEReport SERMA SPM 460 DR
12. R. LENAINEUGENE :Un générateur externe de NEPLIBNote SERMA/LENR/85/1657February 1985
13. G. MATHONNIEREBibliothèque neutronique a nombre restreint pour lecalcul des reacteur a eauPh.D Thesis. Université de Paris XI. Centre d'OrsayOctober 1980
14. A. HEBERPrivate communication

Os
CRITICALITY CALCULATIONS FOR ABWR SPENT FUEL POOL
M. BARCENAS-ROBLES, C. FILIO-LOPEZComisidn Nacional de Seguridad Nuclear y SalvaguardiasandEscuela Superior de Fisica y Maternaticas,Mexico City, Mexico
AbstractIn this paper we present the methodology used for calculating
the effective multiplication constant (Kcff) for BWR spent fuelarrangements. The calculations were performed for the spent fuelpool specified in the Final Safety Analysis Report'11 for the BWRNuclear Plant at Laguna Verde, Veracruz. The computer codesRECORD12' and MIXQUIC<3) were used to perform these calculations.The macroscopic cross sections for two energy groups were obtainedwith the RECORD code assuming 3 w/o U-235 enrichment and nogadolinium for the fuel elements and stainless steel surroundingthe fuel assembly. The spent fuel racks geometry and crosssections were used along with the MIXQUIC code to perform thetwo-dimensional criticality calculations with no neutron leakagealong the axial axis. Additional calculations were performedchanging the temperature, fuel assemblies pitch and tube wallthickness. The results show that the multiplication constantobtained is less than the value of 0.95 required as a limit forthe design of a spent fuel pool.
GENERAL DESCRIPTION
The present mexican nuclear project comprises two BoilingWater Reactors (BWR/5) of 654 MWe, one is now in operation and theother is still under construction. Both reactors are located inLaguna Verde, Veracruz and were supplied by General Electric. Inthe first cycle of the operating plant the reactor was loaded with444 fuel assemblies of the type GE5. There are three differenttypes of fuel assemblies. The average enrichment are 2.19 w/o,1.76 w/o and .711 w/o with several gadolinium contents.
Fuel Assemblies2809668
U-235 Average Enrichment (w/o)2.191.760.711
Each of the fuel assemblies consists of 62 fuel rods and 2water rods surrounded by a square flow box (Figure !.}• The fuelrods have the following dimensions:
Parameter
Pitch
Pellet diameter
Outer diameter of clad
Inner diameter of clad
Rod active length
Dim.
16.256
10.41
12.268
10.642
3810
mm
mm
mm
mm
mm
SPENT FUEL RACKS
The spent fuel assemblies are stored in racks which areplaced on the pool floor without any floor attachment, andlaterally supported by the bracing system as illustrated inFigure 2.
The capacity of each of the spent fuel racks is 9 x 6 or 54fuel assemblies. Each rack consists of tube cluster assembliessupported by a cross-braced framing system, a base plate, andfour leg assemblies as shown in Figure 3.
One 36-space "special purpose rack" has been designed tostore the control rods, the defective spent fuel bundles with
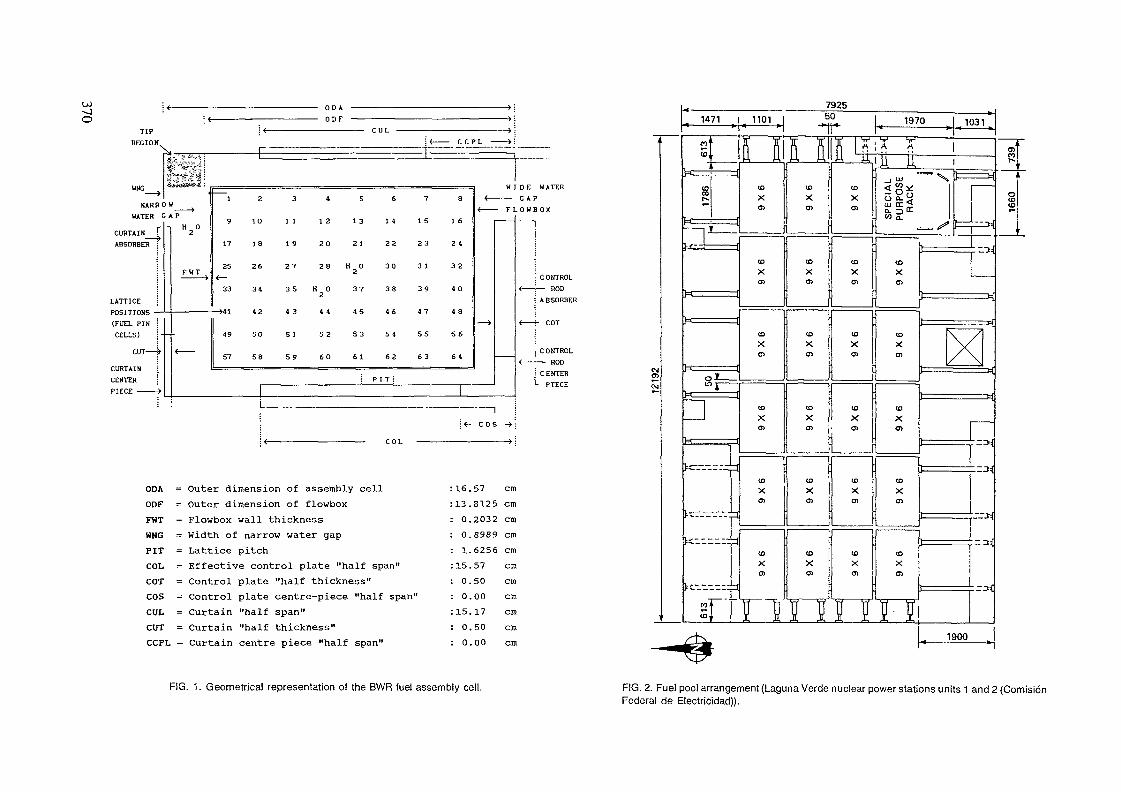
U) :,.
O * —————
REGION^( ...„..„.M..äi
1
HATER G A P
CURTAIN TABSORBER
LATTICE
(FUEL PINCELLS)
CUT ——
CURTAIN
CENTERPIECE ———— >
1 "2°17
F HT 2SF_HJ_^ ^_
33
49
\< ——— C C P L ——— >
———— 1 ——————————————————————————————— 1 ————————————————
18 19 20 21 22 23 24
2 6 2 7 2 8 H O 3 0 3 1 3 2
3 4 3 5 H O 3 7 3 8 3 9 4 O
SO 5J 52 S3 54 SS 56
< ———— GAP< ——— F L O H B O X
— *
: P I T :
1 1
- 1i
C ONTROL< ———— ROD
A BSORBER
< ——— COT
C ONTROL< ———— ROD
CENTER
1
j<- cos ->
ODA = Outer dimension of assembly cell 16.57 cmODF = Outer dimension of flowbox 13.8125 cmFWT = FlowboxWNG = Width ofPIT = Lattice
wall thickness 0.2032 cmnarrow water gap 0.8989 cm
pitch 1.6256 cmCOL = Effective control plate "half span" 15.57 cmCOT = ControlCOS = ControlCCJL = CurtainCUT = CurtainCCPL = Curtain
plate "half thickness" 0.50 cmplate centre-piece "half span" 0.00 cm"half span" 15.17 cm"half thickness" 0.50 cmcentre piece "half span" 0.00 cm
.
14
CO
) .......sr».
H=
P
fcd ———
gta ———
^ —._ _
VT--
£
^K
71
f
f'1
1
3.
-|
-f
3
4
b
1101
nXCl
COXOl
CO
X
XOl
CO
XOl
XOl
Ï
ftu,
B
5
"1
(1 fl
XOl
i
CO
X01
CO
Xen
CD
X01
CD
X01
CD
XOl
UlfX X
u*II
CI
>o
et>o
ceXo
et>a
ce>a
ce>o
Jf
)*
1
>
;>
?
î
3«•
1
3
C3
3
<1
"»
t"
i
1
3
197
1 U_jUJ
Ils
CO
XOl
CO
XOl
COX01
CO
X01
CO
XOl
S W• s
0
"""X
= «#*"
•l ————
3
t=s
/l ——
i ——
i ——
i ——
i ——
1 —————
1
i
t=
E=
>
900
331
—— fc-
.__ ,
/\
^
'
— *i
- M
r*
ocoCO
FIG. 1. Geometrical representation of the BWR fuel assembly cell. FIG. 2. Fuel pool arrangement (Laguna Verde nuclear power stations units 1 and 2 (ComisionFederal de Electricidad)).

TUBE CLUSTERASSEMBLY
LEG ASSEMBLY
FOOT PAD
TUBE CLUSTERASSEMBLY
BASE PLATE
FOOT PADBASE PLATE
FIG. 3. Spent fuel rack (9 x 6) (Laguna Verde nuclear power stations units 1 and 2 (ComisionFederal de Electricidad)).
containers, and control rod guide tubes. This rack assembly iscomposed of twenty-seven 10-inch diameter and nine 12-inchdiameter stainless steel pipes welded together in a array asshown in Figure 4.
The spent fuel racks as well as the special purpose rack arespecified to be Type 304 stainless steel.
The spent fuel high density storage racks contain storagespace sufficient for 280 percent of the core fuel assemblies.
FIG. 4. Special purpose rack (Laguna Verde nuclear power stations units 1 and 2 (ComisionFederal de Electricidad)).
NUCLEAR SAFETY DESIGN BASES
The Final Safety Analysis Report for the BWR Nuclear Plantat Laguna Verde, Veracruz, specifies the following bases for thenuclear safety design.
a. Pool is filled with fuel with 3.3 w/o U-235 enrichmentand no burnable poison. This fuel has a higher k thanany fuel which will be used in the core.
b. The water in the fuel storage pool is clean andunborated.

toc. The pool temperature is 115°C. (No boiling)d. No credit is taken for the fuel assembly support
structure. However, the neutron absorption of the 5 mmthick stainless steel tubes in which the fuelassemblies are supported while in the storage racks isconsidered in the calculation.
e. Axial neutron leakage is not considered, that is, aninfinite array is assumed in the axial direction.
The above assumptions are considered as a conservative basefor the calculations.
For all spent fuel storage conditions:Maximum keff ^ 0.95
TABLE I
MULTIPLICATIVE REGION
Group
Fast
Thermal
D
0.12319E+01
0.33406E+00
Zr
0.28650E-01
0.0
ZA
0.11050E-01
0.10469E+00
v*f0.52714E-02
0.12407E+00
X
1.0
0.0
(*) £ZM = 3.9700E-2r
= 1.0469E-1
Z* z= 2.8650E-2
= 0.0
Fast groupThermal group
NUCLEAR CALCULATIONS USING THE RECORD AND MIXQUIC CODES
In order to simulate a rack in the pool we considered amultiplicative and a non multiplicative region. For both regions,the RECORD code was used to calculate the two energy groupmacroscopic cross sections.
The calculations for the multiplicative region considered acell to be formed by a fuel assembly, the surrounding water and astainless steel tube of the rack. It was assumed that twostainless steel curtains and a stainless steel control rod with noboron, were the walls of a tube in the rack. For thenon-multiplicative region, the water nuclear parameters wereobtained from the water region surrounding the flow box in theRECORD cell (Figure 1.). The nuclear cell constants obtained areshown in Table I.
NON-MULTIPLICATIVE REGION
Group
Fast
Thermal
D
1.4701
1.9538E-1
Zr
4.6000E-2
0.0
Za
3.2098E-4
1.7652E-2
"Zr
0.0
0.0
X
0.0
0.0
E = 4.6318E-2r
= 1.7652E-2£j_2 = 4.6000E-2
= 0.0X fision neutron fraction
Fast groupThermal group
(*) The removal cross section (E ) for MIXQUIC code is given asthe sum of removal (£R) and absorbtion (Zn) cross sectionsof the RECORD code. The RECORD code removal cross section(Z ) is the scattering cross section (£H ) for the MIXQUICcode.
The MIXQUIC code solves the diffusion equation in X-Ygeometry using numerical nodal finite element methods. This codewas used to perform criticality calculations for the spent fuel
pool using the rack's geometry (Figure 5.) and the nuclearconstants obtained by the RECORD code. As stated in the FSAR, herewe also assume no neutron leakage along the axial axis.

WATER REGION
FUEL REGION
CONCLUSIONS
The results show that the multiplication constant obtained isless than the value of 0.95 required as a limit for the design ofa spent fuel pool.
Since the macroscopic cross sections generated by the RECORDcode can take into account fuel pins of different enrichment,gadolinium content as burnable poison and also their burnup, it ispossible to perform less conservative calculations using thesecodes, although it should be noted that a homogeneous compositionalong the axial axis will be still considered since the MIXQUICcode is a two dimensional code.
There was a design change in the spent fuel pool whichincludes stainless steel mixed with boral for the racks's tubewalls, this composition can be taken into account in the RECORDcode since we can specify a boron fraction in the curtains andcontrol rod materials.
FIG. 5. MIXQUIC mesh for a rack.REFERENCES
Additional calculations were performed changing thetemperature, lattice pitch and tube wall thickness, in order totake into account their tolerance effects.
For 1mm decrease in tube wall thickness we obtained aAK« = 0.01589, for a 2mm decrease in lattice pitch we obtainedAKp = 0.00856 and for a 115 °C temperature we obtained aAKt = -0.0020, therefore when these tolerances effects areincluded we have.
(1) Final Safety Analysis Report, Chap. 9.1.2 Vol. X, CFE 1974
(2) T. Skardhamar "User Manual For Record" FMS Vol. IIScandpower, 1983
(3) Del Valle, E., J.P. Hennart D. Meade, "Finite elementformulations of nodal schemes for neutron diffusion andtransport problems:. Advances in Nuclear EngineeringComputational Methods, Vol.2,p.473, A.N.S, Knoxville,Tennessee, 1985 Nuc. Sei. Eng. ,92,p.204,1986.
Keff 0.91746 + 0.01589 + 0.00856 - 0.002 = 0.9399

w CRITICALITY CALCULATIONS FOR THE^ DESIGN ANALYSIS OF A 300 MWe PWR
Subhan GUL, Asif WASEEM, M. KAMRAM CHUGHTAIDesign and Engineering Department,Pakistan Atomic Energy Commission,Islamabad, Pakistan
Abstract
A 300 MWe PWR having nearly the same characteristics as the current PWR plants, analyzed
for the criticality calculation. Lattice code WIMS-D4 and two dimensional diffusion codeEXTERMINATOR-2 were employed for this purpose. Calculations were performed with
three neutron energy groups, fast (10 MeV to 9118 eV) resonance (9118 eV to 4.00 eV) andthermal (4.00 eV to 0.00 eV). The reactivity for cold/clean, hot/clean zero power and
hot/clean full power reactor states were found.
The Keff for the three states were 1.267, 1.222 and 1.200 respectively, which is quite in
agreement with the available data. Further calculations are underway to calculate the same
states of the reactor with burnable poison rods.
2. REACTOR CORE
2.1 Description
For a 300 MWe PWR the number of fuel assemblies in the core is 121. All of the fuel
assemblies have identical external dimensions and hydraulic characteristics. So they may be
inserted in any position within the core array. The core height as reported in literature varies
from 275 cm to 305 cm and the equivalent diameter varies from 248 cm to 255 cm. This is
according to the development process in which the initial core design was cast, taking into
account all other parameters.
The core is cooled/moderated by H2O and surrounded by a stainless steel baffle. Each fuel
assembly could consist of either a 14x14 or 15x15 rod array. The rod pitch within the fuel
assembly could vary between 1.3 to 1.4 cm and the assembly pitch may be between 19.5 and
20.5 cm. The cladding material is Zircaloy 4. The fuel rods within each assembly are held by
spacer grids and top & bottom fittings. The fuel assembly is also provided with guide thimbles
for cluster of control rods. All other details and features are according to the standard PWRassembly.
1. INTRODUCTION
Neutronic analysis techniques for PWR are well established. For detailed analysis and for
licensing purpose the verifying analysis is based on finite difference solution of diffusion
equation. For incore fuel management nodal and finite element methods have become
standards because of their having short run time on computers.
The present paper describes the criticality calculations based on finite difference solution of
diffusion equation for a 300 MWe PWR having nearly the same characteristics as the current
PWR plants. The geometrical data and material specification are generally available from
literature and IAEA directories. This is an initial exercise to be developed later through
participation in IAEA coordinated research programs for incore fuel management and core
design parameters.
2.2 Fuel Enrichment & Loading
Fuel assemblies of three different enrichments are used in the initial core, inorder to obtain
the favourable radial power distribution.
Region IRegion II
Region III
.2.28 to 2.45 U235
2.50 to 2.80 w/0 U235
2.90 to 3.50 "/„U233
41 fuel assemblies
40 fuel assemblies
40 fuel assemblies
The first two regions, which consist of the lower enrichments, are arranged in a modified
checkerboard pattern towards the centre of the core. The third region of highest enrichment is
arranged around the periphery of the core.

3. METHOD OF ANALYSIS
The methodology adopted in our analysis is based on the multigroup scheme to evaluate theneutron distribution in space and energy. This is achieved by solving transport equation in one
dimension at the cell level.
Later flux weighted group constants for the few group model are produced. Finally finite dif-ference method is applied to solve diffusion equation in two dimensions using few group
model data, to determine the reactor criticality, flux distribution etc. The computational
scheme is as follows:
Cell material densities
Cell geometry
Mic
1 r
Macroscopic group
consts. generation
module WIMS-D4
(Cell calculations)t
roscopic X-sections
Core g
D,sa s:r,vSf ^
sometry
12D, multigroup
diffusion code
EXTERMINATOR-2
(Core calculations)
Keff.0^
The cell calculations are performed using WIMS-D4 computer code. A variety of geometries
can be treated in WIMS-D4, the basic ones are slab array including bundles of plates, regular
rod array and rod clusters in cylindrical geometry. In our case we treated fuel lattice as a
regular rod array form. Calculations were performed with three neutron energy groups, fast
(10 Mev to 9118 ev) resonance (9118 ev to 4.00 ev) and thermal (4.00 ev to 0.00 ev). The
scattering matrix included one upscattering and two down scatterings.
oo0ooo00o0ooooo
oo0ooo000Ü0oooo
o0•oo•000•0o•oo
000ooo0•0Ü00ooo
000o•oooo0•0ooo
oo•ooooooooo•o0
oooooooooÜooooo
ooo•ooo0oÜo•ooo
ooooooo-ooÜooooo
oo•ooooo0Üoo•oo
oooo•oQooo•oooo
oooooo-a•ooooooo
oo»oo•.ooo•oo•0o
oo-0oo&oooo00o0o
0ty6ooQooooooooo
FUEL RODCONTROL CLUSTER ELEMENT
INSTRUMENTATION TUBE
FIG. 1. 15 x 15 fuel assembly cross-section.
GAPCLADDING <Zr-4>COOLANT/MODERATORCH., 0>
WATER <HgO)GUIDE TUBE<S.S>VATER (H20)
0. ) b )
FIG. 2. (a) fuel lattice cell; (b) guide thimble cell.
U)~JLn
Lattice cells modeled for group constant generation are shown in figures 1 and 2. Cell
parameters for each fuel enrichment are calculated. Similarly guide thimble and reflector
cross-sections are generated. Parameters thus obtained for core are fed to
EXTERMINATOR-2 code. Core calculations with EXTERMINATOR-2 can be performed
by taking 1/4 core symmetry. Figure 3 shows 1/4 symmetry of the core with 91 rows and 91
columns in mesh specification. Three types of outer boundary conditions, zero flux, zero
normal derivatives or periodic condition may be imposed according to problem requirement.
Here we used X-Y geometry with zero flux and zero normal derivative boundary conditions.

-JOS
Zero flux boundaries
Y 2
3O.O
U
"C
I'l
?
Symmetric boundaries
0)
S-
O_oX
Oi-o>
FIG 3. Core mesh specification for % core symmetry in EXTERMINATOR-2

TABLE-1: GROUP CONSTANTS OF FUEL ASSEMBLIES CELL FOR COLD/CLEAN CORE CASE
ENRICHMENT ENERGY DIFFUSION COEFFREGION GROUP D(cm)
1 143583Region I 2 0 60107
3 0 42772
1 143600Region II 2 060071
3 0 42519
1 1 43612Region III 2 0 60048
3 0 42370
4 RESULTS AND DISCUSSION
Group constant generated for WIMS-D4 for cold/clean, Hot/clean zero power and Hot/clean
full power cases are given in tables 1 to 6 The group constants are used in
EXTERMINATOR-2 code for finding effective multiplication factor and power distribution in
the core Keff calculated for each case are presented in table 7 Keff calculated for three
reactor states compare fairly well with the values available m literature
The standard approach is to use LWR version of WIMS code, which is LWR-WIMS. Since it
is proprietary code therefore we do not have any access to it Also an assembly code is not
available with us which could be an intermediate step of calculations before going to global
core calculations The basic aim in this work is to go through the available computer codes and
ABSORPTION X-SEC REMOVAL X SEC FISSION X-SEC^ a(cm ) Sr(cm ) \^-f(cin" )
303948E03 468054E-02220367E02 863089EÛ2783527E02 1 11833E-Û5
3 07156E-03 4 67876E-02226400E02 860175E028 28610E 02 1 18166E-05
309295E-03 467756E-022 30328E-02 8 58284E-02857255E-02 1 22338E 05
4 39476E-038 55206E-031 20821E-01
447088E-039 55787E-031 31119E-01
4 52166E 031 02154E-021 37642E-01
TABLE-2: CELL AVERAGE SCATTERING CROSSFOR COLD/CLEAN CORE CASE
ENRICHMENTREGION
Region I
Region II
Region III
ENERGY 1GROUP
1 1 7681E 012 OOOOOE+003 OOOOOE+00
1 1 7676E-012 OOOOOE + 003 OOOOOE + 00
1 1 7674E 012 OOOOOE+003 OOOOOE+00
2
4 6786E-024 6805E 011 1180E-05
46768E-0246822E-011 1810E-05
4 6757E-024 6833E-011 2209E 05
SECTIONS
3
19086E0586309E0294739E-01
19079E0586017E-029 3419E 01
1 9074E-058 5828E-0292621E-01
cnticahty Later 3D calculations can be undertaken using CITATION It is also envisaged that
participating in CRP will enable us to develop expertise in nodal and finite element based
computer codes, which will have direct application for incore fuel management of PWR

TABLE-3: GROUP CONSTANTS OF FUEL ASSEMBLIES CELL FOR HOT/CLEAN ZERO POWER CASE
ENRICHMENTREGION
Region I
Region II
Region III
ENERGY DIFFUSION COEFFGROUP D(cm)
1 1 679702 0713143 0 50788
1 1 679982 0 712823 0 50614
1 1 680222 0712573 050489
ABSORPTION X-SEC REMOVAL X SEC
2 94810E-03 3 61095E-022 17443E-02 6 14992E 026 02210E-02 2 18786E-05
298044E-03 360917E-02223167E-02 6 12220E-026 40812E-02 2 32607E-05
3 00739E-03 3 60767E-02227774E-02 6 10020E-02671474E-02 243262E05
FISSION X-SEC
4 16662E 03837684E-039 41947E 02
424329E-039 34577E-031 02739E-01
4 30716E-031 01293E-021 09507E-01
TABLE-4: CELL AVERAGE SCATTERING CROSS SECTIONS
FOR HOT/CLEAN ZERO POWER CASE
TABLE-5:
ENRICHMENTREGION
Region I
Region II
Region III
ENRICHMENT ENERGYREGION GROUP
1Region I 2
3
1Region II 2
3
1Region III 2
3
1 2 3
15924E01 36095E-02 14673E-050 OOOOE + 00 4 0988E-01 6 1499E-020 OOOOE + 00 2 1863E-05 6 9192E 01
1 5919E-01 3 6077E 02 1 4665E-050 OOOOE + 00 4 1001E-01 6 1222E-020 OOOOE+ 00 2 3222E-05 6 8383E-01
1 5915E-01 3 6062E 02 1 4659E 050 OOOOE +00 4 1010E-01 6 1002E-020 OOOOE +00 2 4296E-OS 6 7771E-01
GROUP CONSTANTS OF FUEL ASSEMBLIES CELL FOR HOT/CLEAN
ENERGY DIFFUSION COEFFGROUP D(cm)
1 1 721012 0 731763 0 51939
1 1721302 0 731453 0 51792
1 1 721562 0 731213 051688
ABSORPTION X SEC REMOVAL X-SECSafcm"1) ^(cm"1)
293595E03 347861E-02225723E-02 581590E-025 87845E-02 3 19108E-05
2 96834E-03 3 47682E-02231363E-02 578867E-026 25679E-02 3 38703E-05
299533E03 347533E02235909E-02 576704E-026 55734E-02 3 53977E-05
FULL POWER CASE
FISSION X SEC
4 13288E-03831280E-03921063E-02
420965E-039 27169E-031 00467E-01
4 27360E-031 004S2E-021 07090E 01
378

TABLE-6: CELL AVERAGE SCATTERING CROSS SECTIONSFOR HOT/CLEAN FULL POWER CASE
ENRICHMENTREGION
Region I
Region II
Region III
ENERGYGROUP
123
123
123
1
1 5713E 01OOOOOE + 00OOOOOL+00
1 5709E 01OOOOOE+00OOOOOE+00
1 5705E 01OOOOOE + 00OOOOOE + 00
2
3 4772E 0240291E013 1890E 05
3 4754E 0240303E013 3870E 05
3 4739E 0240311E013 5433E 05
3
1 4126E 0558159E0266400E01
1 4119E 0557887E0265632E01
1 4113E 0557670E0265050E-01
TABLE-7: TYPICAL EFFECTIVE MULTIPLICATION CONSTANTS CALCULATEDBY EXTERMINATOR-2 (BOL, NO BURNABLE POISON, SOLUBLEPOISON AND CONTROL RODS)
STATE K E F F ( T R )
Cold/Clean Core
Hot/Clean Zero Power
Hot/Clean Full Power
1267
1222
1200
REFERENCES
1 A general description of the Lattice Cell code WIMS D by J R Askew, FJ Payersand P B Kemshell
3 EXTERMINATOR-2 A multigroup code for Solving Neutron Diffusion Equations mone and two dimensions, USAEC Report, ORNL TM 842, Oak Ridge National
Laboratory, by T B Fowler, M L Tobies and D R Vondy
4 Nuclear Reactor Analysis by James J Duderstadt and Louis J Hamilton
5 Hand Book of Engineering Materials by MINER and SEASTONE
6 Directory of Nuclear Reactors IAEA
7 Directory of Nuclear Power Plants m world edited by Haruo Fujn of Japan Nuclear
Energy Information Centre Co LTD, Tokyo Japan
8 World Nuclear Industry Hand Book special Nuclear Engineering International
Publication 1988
2 WIMS D4 and cataloged procedure by CJ Taubman and J H Lawerence
oooA MODIFIED VERSION OF THE COBRA-IV-I SUBCHANNELTHERMOHYDRAULIC COMPUTER CODE
L.L. BIRONational Commission for Nuclear Activities Control,Bucharest, Romania
Abstract
This paper presents the study model used in COBRA-IV-Icomputer code for the analysis of the fuel rod temperaturesdistributions in non-uniform operating conditions induced by theheated generated rate and the heat transfer conditions.
An example of using the code is presented for LWR typefuel bundles with the 25 fuel rods model.
The subroutines which are added to COBRA-IV-I computercode perform the computations to determine the influences on thespatial heat flux and fuel rod temperatures distributions of theazimuthal and radial heat generation microdistributions,the azimuthal gap clading heat transfer coefficient distributionsand the azimuthal coolant heat transfer coefficient distribution.
The models are based on using Fourier series for the heatgeneration rate and for the heat transfer coefficients in the fuelgap and on the outter fuel rod surface.
The numerical example presented in the paper provides someresults obtained in assessing the degree of conservatism of the hotspot factors evaluation during the LWR core thermohydraulic design.
1. INTRODUCTION
The well known COBRA-IV-I [1], subchannel thermohydrauliccomputer code, it is designed to perform calculations for obtainingthe spatial distribution of the thermohydraulic parameters in LWRfuel rods arrays type in steady-state and transients operationconditions. The main assumptions of this computer code do not includethe azimuthal and radial micro-distributions of the heat generatedrate in the fuel pellet and of the azimuthal distribution of the fuelgap thermal conductance. A more understanding of the fuel rodsbehaviour conditions can be obtained using an adequate post-proccesingtechniques of the COBRA-IV-I computed results.
The influences of non-uniformities existing for the heatgenerated rate, for the fuel gap thermal conductance and for coolantheat transfer coefficient on the spatial temperature ditributions inthe fuel pellet and cladding can be analysed with the Nijsing [2]analytical model.
Based on this analytical approch a number of subruotineswere performed and coupled at the COBRA-IV-I computer code standardversion.
2. COBRA-IV-I MODIFIED VERSION CHARACTERISTICSThe subroutines added to the COBRA-IV-I computer code
deal with the effects of non-uniform heat generated rate and non-
uniform heat transfer conditions on the temperature and heat fluxdistribution in thr fuel rods of a LWR fuel bundle type.
The mathematical model of this subroutines is based on theNijsing's analytical approch and have the following assumptions:
- thermal conductivity is not dependent by thetemperature;
- non-uniformities of the heat generated distribution,fuel-cladding contact resistance and coolant heattransfer coefficients can be simulated by the user bymeans of analytical expressions which are dependent bythe local radial coordinate and azimuthal angle cosine;
- the temperature fields are obtained as general solutionsof the heat Conduction equation, founded by combiningthe solutions of the homogeneous and inhomogeneous partsof this equation;
- the coefficients of the Fourier series are obtained fromthe boundary conditions and from the continuity and symmetryrequirements;
- the different types of non-uniformities are separatellystudied.
This subroutines provide a post-processing of the standardCOBRA-IV-I computed results using the following procedures:
- based on COBRA-IV-I computed results the spatialposition with the maximum heat flux and the maximumclad surface temperature are selected;
- the azimuthal variations of the coolant temperaturesand heat transfer coefficients located in these specifiedpositions are fitted to the subchannels local heat transferconditions arround the selected fuel rod.
- according with the fuel temperature dependent thermalconductivity expression used in COBRA-IV-I and withcomputed temperature radial profile for uniform heatgenerated rate, the average value of the fuel thermalconductivity is computed;
- after these data preparation the absolute and relativevalues of the heat generated rate, temperatures and heatfluxes are computed for the fuel pellet and the claddingversus radial and azimuthal coordinates;
- finally, the isovalues curves for the heat generatedrate and for temperature distribution are computed andplotted.
This COBRA-IV-I modified version is installed on CNCANPC-386 type computer. The suplimentary memory reqiurements are200 Kb more than standard version. For the complete non-uniformities calculations the computed run time increse with 60seconds for each case.
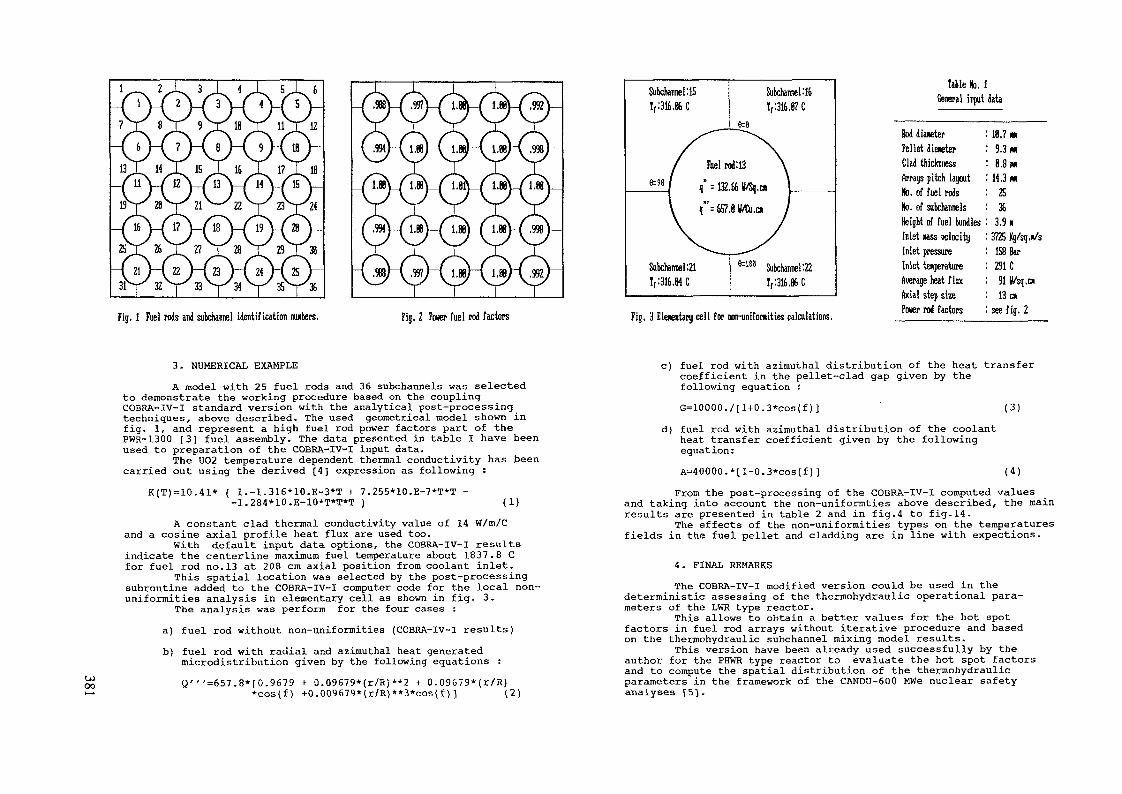
Fig. 1 Fuel rods and subchannel identification nmbers. Fig. 2 Poner fuel rod factors Fig. 3 Elenentary cell for non-unifomities calculations.
Table Ho. 1General input data
Rod diaieterFeilet dieneterClad thicknessArrays pitch layoutHo. of fuel rodsHo. of subchannelsHeight of fuel bundlesInlet »ass velocityInlet pressureInlet temperatureAverage heat fluxAxial step sizePoyer rod factors
ie.?m9.3m8.8 M
14,3m2536
3.9»3725 Xg/sq.«/s
158 Bar291 C91 U/sq.n13 M
see fig. 2
3. NUMERICAL EXAMPLEA model with 25 fuel rods and 36 subchannels was selected
to demonstrate the working procedure based on the couplingCOBRA-IV-I standard version with the analytical post-processingtechniques, above described. The used geometrical model shown infig. 1, and represent a high fuel rod power factors part of thePWR-1300 [3] fuel assembly. The data presented in table I have beenused to preparation of the COBRA-IV-I input data.
The UO2 temperature dependent thermal conductivity has beencarried out using the derived [4] expression as following :
K(T)=10.41* ( l.-l.316*10.E-3*T + 7.255*10.E-7*T*T --1.284*10.E-10*T*T*T ) (1)
OJoo
A constant clad thermal conductivity value of 14 W/m/Cand a cosine axial profile heat flux are used too.
With default input data options, the COBRA-IV-I resultsindicate the centerline maximum fuel temperature about 1837.8 Cfor fuel rod no. 13 at 208 cm axial position from coolant inlet.
This spatial location was selected by the post-processingsubroutine added to the COBRA-IV-I computer code for the local non-uniformities analysis in elementary cell as shown in fig. 3.
The analysis was perform for the four cases :a) fuel rod without non-uniformities (COBRA-IV-I results)b) fuel rod with radial and azimuthal heat generated
microdistribution given by the following equations :g.'"=657.8*[0.9679 + 0.09679*(r/R) **2 + 0.09679*(r/R)
*cos(f) +0.009679*(r/R)**3*cos(f)] (2)
c) fuel rod with azimuthal distribution of the heat transfercoefficient in the pellet-clad gap given by thefollowing equation :G=10000./[l+0.3*cos(f)] ' (3)
d) fuel rod with azimuthal distribution of the coolantheat transfer coefficient given by the followingequation:A=40000.*[l-0.3*cos(f)] (4)From the post-processing of the COBRA-IV-I computed values
and taking into account the non-uniformties above described, the mainresults are presented in table 2 and in fig.4 to fig.14.
The effects of the non-uniformities types on the temperaturesfields in the fuel pellet and cladding are in line with expections.
4. FINAL REMARKSThe COBRA-IV-I modified version could be used in the
deterministic assessing of the thennohydraulic operational para-meters of the LWR type reactor.
This allows to obtain a better values for the hot spotfactors in fuel rod arrays without iterative procedure and basedon the thermohydraulic subchannel mixing model results.
This version have been already used successfully by theauthor for the PHWR type reactor to evaluate the hot spot factorsand to compute the spatial distribution of the thermohydraulicparameters in the framework of the CANDU-600 MWe nuclear safetyanalyses [5].

Table fc. 2
Coiparasion beteen COBRHH standard version coiputed resultsand imrum'foniities operations conditions post-processing results,
Fuel rod Ho. 13Axial position : 288 o
No.
crt.
1
2
3
4
5
6
7
8
9
IB
P A R ft H E T E S S
Hax im» fueltexperature (C)
Haximw fuel surfacetexperature (C)
Maxim* fuel gap droptenperature (fird. C)
HaxiKM inner cladsurface tenperature (0
Naxiniw outer cladsurface tenperatore (C)
Haximn clad droptenperature ((fi. C)
HaxiMM dad-coolant droptenperature (Grd. C)
Kaxinm pellet surfaceheat flux (ll/Sq.CH)
HaxiMW inner cladheat flux (V/Sq.Cft)
KaxiMn outer cladheat flux (U/Sq.OI)
COBRA-IIHstandardversionresults
1837.8
576,8
152.64
428.44
349.25
71.898
33.258
152.64
152.64
132.66
Hon-anifom heatgenerated case
Absolute«lues
1838.4
585.1
159,88
425.39
358.98
74.391
34.781
159.66
159.66
138.77
Relativevalues*1
8.833
1.439
4.698
1.156
8.472
4.643
4.694
4.688
4.688
4.682
Non-unifor» fuelgap conductancecase
Absolutevalues
1B54.7
623.2
284.51
422.28
349.98
72.311
33.816
155.22
155.22
134.92
Relativevalues*'
8.919
8.844
33.98
8.418
8.186
1.715
1.782
1.698
1.698
1.788
Non-tinifor* coolantheat transfercoefficient
Absolutevalues
1848.9
585.6
153.88
433.78
363.18
71.357
47.827
153.33
153.88
133.27
Relativevalues**
8.683
1.525
8.288
3.154
3,965
8.375
41.43
8.452
8.452
8.456
Heat generated rate(Local to average value ratio)
= 1688C
lenperature distribution fornorunifoni heat generated rate.
30
120
Ie»perature distribution fornonmifor* fuel gap conductance.
lenperature distribution fornon-nnifom coolant heat transfercoefficients.
30
150180
Azimthal angle (Deg.)
c)
120
180
Aziwthal angle (Heg,)
d)
Fig, 4 ISWALUES CURVES FOR FUEL PELEI CROSS SECTION
[ Absolute value - COBRA-IV-I value )/( COBBHV-I value ) * 188 (X)
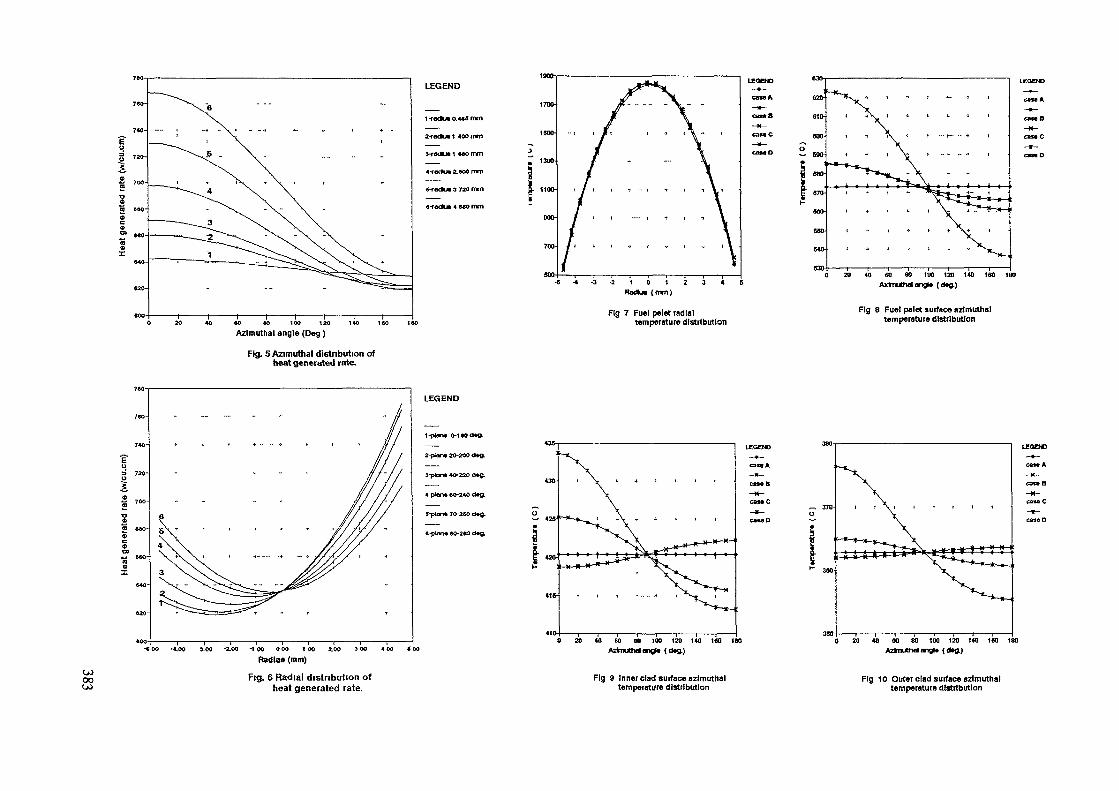
LEGEND
40 «O «o 100 120 140 ieo ieoAzimuthal angle (Deg )
Fig. S Azimuthal distnbutlon ofheat generated rate.
6 - 4 - 3 - 2 1 0 1 2 3 4 5Radii» (mm)
Fig 7 Fuel pelet radialtemperature distribution
40 60 SO 100 120 140 160 laAxtnutnm angl» (<*»0-)
Fig 8 Fuel palet surface azlmuthaltemperature distribution
ten- —-«oo
LEGEND
1-pton« 0-1*
a-ptarw 20-200 cfcfl.
3-ptan« 4O-220 d«9.
4 pt*n« 6O-240 d«g.
5-ptdn« 70-250 <14
» «o-a«o d .
OJ00OJ
•4.00 3.00 -2.00 -1 OO 0 oo 1 00 2.00 3 00 4 00 (00
Radius (mm)
Fig. 6 Radial distribution ofheat generated rate.
Fig 9 Inner clad surface azlmuthaltemperature distribution
Fig 10 Outer clad surface azlmuthaltemperature distribution
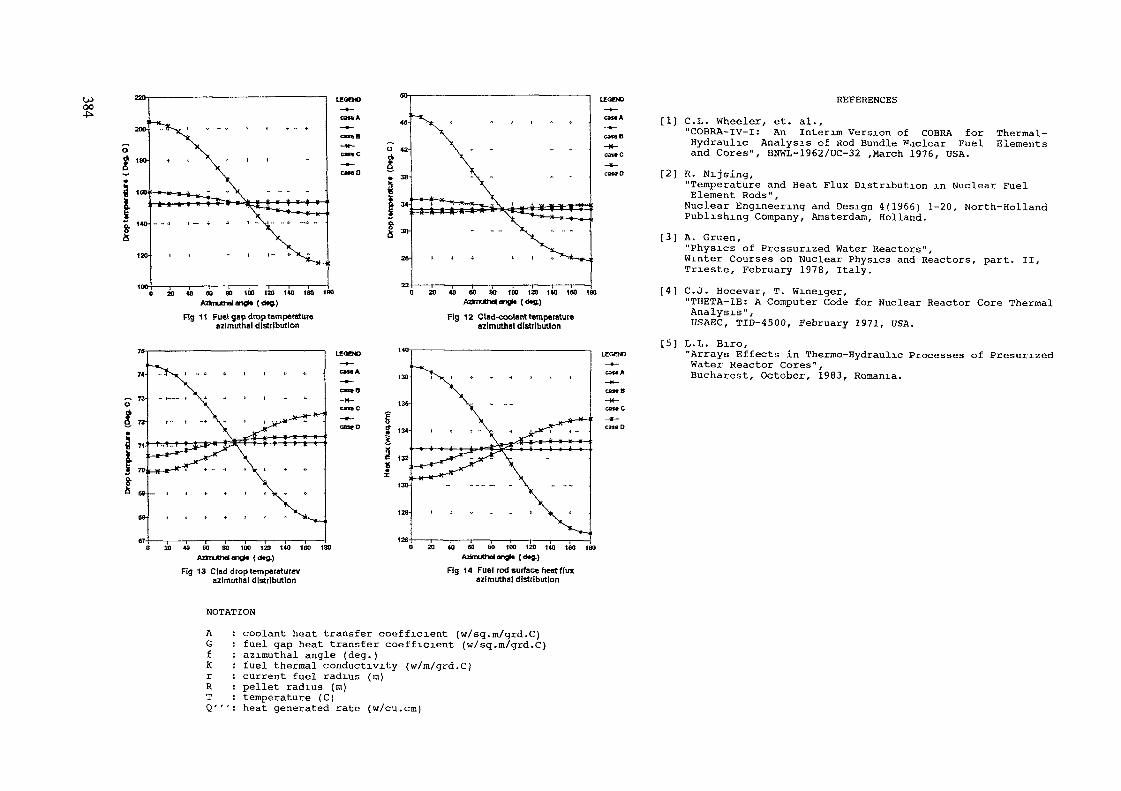
Fig 11 Fuel gap drop temperatureazlmuthal distribution
20 40 60 80 1» 120 140 160 180AztnuttidangM (dtg.)
Fig 12 Clad-coolant temperatureazlmuthal distribution
20 40 60 80 100 120 140 100 1
Fig 13 Clad drop temperaturevazlmuthal distribution
20 40 »0 80 100 120 140 160 180Azimuthol tm&* (dtg.)
Fig 14 Fuel rod surface heat fluxazlmuthal distribution
REFERENCES
[1] C.L. Wheeler, et. al.,"COBRA-1V-1: An Interim Version of COBRA for Thermal-Hydraulic Analysis of Rod Bundle Naciear Fuel Elementsand Cores", BNWL-1962/UC-32 ,March 1976, USA.
[2] R. Nijsing,"Temperature and Heat Flux Distribution in Nuclear FuelElement Rods",
Nuclear Engineering and Design 4(1966) 1-20, North-HollandPublishing Company, Amsterdam, Holland.
[3] A. Gruen,"Physics of Pressurized Water Reactors",Winter Courses on Nuclear Physics and Reactors, part. II,Trieste, February 1978, Italy.
[4] C.J. Hocevar, T. Wineiger,"THETA-IB: A Computer Code for Nuclear Reactor Core ThermalAnalysis",USAEC, TID-4500, February 1971, USA.
[5] L.L. Biro,"Arrays Effects in Thermo-Hydraulic Processes of PresurizedWater Reactor Cores",Bucharest, October, 1983, Romania.
NOTATION
AGfKrRT
coolant heat transfer coefficient (w/sq.m/grd.C)fuel gap heat transfer coefficient (w/sq.m/grd.C)azimuthal angle (deg.)fuel thermal conductivity (w/m/grd.C)current fuel radius (m)pellet radius (m)temperature (C)heat generated rate (w/cu.cm)
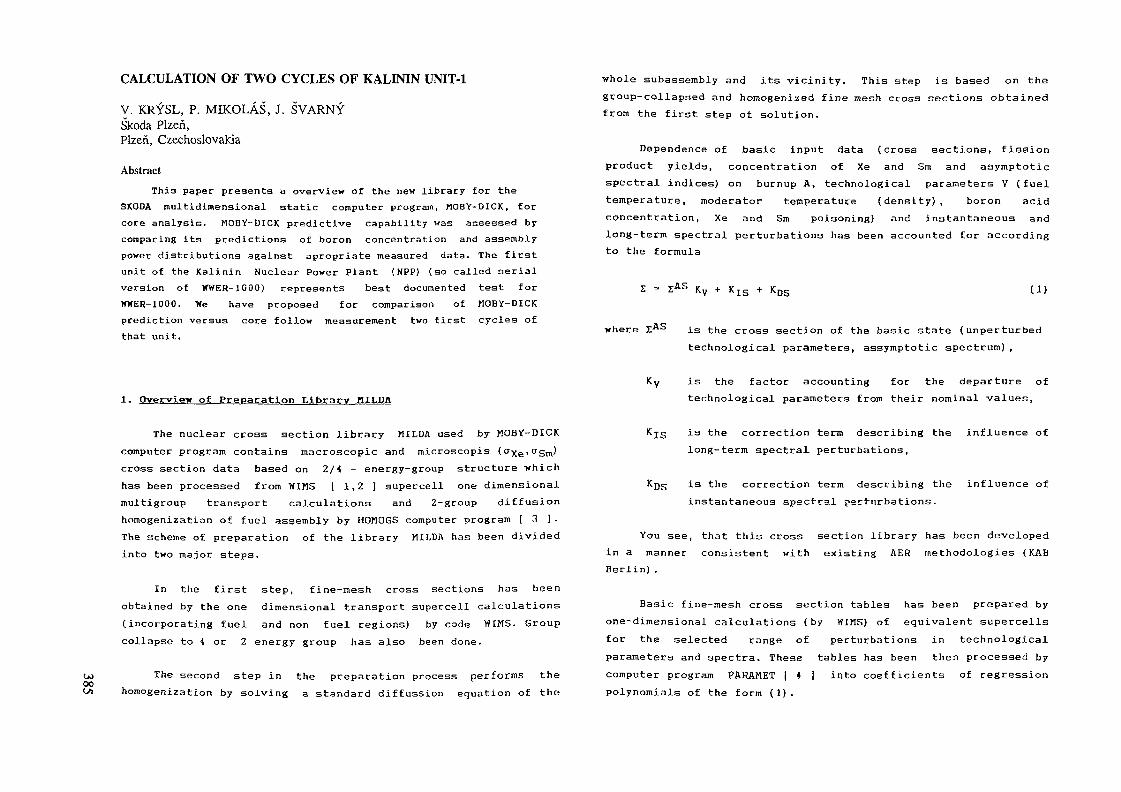
CALCULATION OF TWO CYCLES OF KALININ UNIT-1
V. KRYSL, P. MIKOLÂS, J. SVARNYSkoda Plzen,Plzen, Czechoslovakia
Abstract
This paper presents a overview of the new library for theSKODA multidimensional static computer program, MOBY-DICK, for
core analysis. MOBY-DICK predictive capability was assessed bycomparing its predictions of boron concentration and assemblypower distributions against apropriate measured data. The firstunit of the Kalinin Nuclear Power Plant ( N P P ) (so called serialversion of YTWER-1000) represents best documented test forHKER-1000. We have proposed for comparison of MOBY-DICKprediction versus core follow measurement two first cycles ofthat unit.
whole subassembly and its vicinity. This step is based on thegroup-collapsed and homogenized f ine mesh cross sections obtainedfrom the first step ot solution.
Dependence of basic input data (cross sections, fissionproduct yields, concentration of Xe and Sm and asymptoticspectral indices) on burnup A, technological parameters V ( fue l
temperature, moderator temperature (dens i ty ) , boron acidconcentration, Xe and Sm poisoning) and instantaneous andlong-term spectral perturbations has been accounted for accordingto the formula
Z = ZAS KV + KIS + Kr (1)
where ZAS is the cross section of the basic state (unperturbedtechnological parameters, assymptotic spectrum),
1- Overview of Preparation Library HILDAis the factor accounting for the departure oftechnological parameters from their nominal values,
00
The nuclear cross section library MILDA used by MOBY-DICKcomputer program contains macroscopic and microscopis (a e Sm)cross section data based on 2/4 - energy-group structure whichhas been processed from WIMS [ 1,2 ] supercell one dimensionalmultigroup transport calculations and 2-group diffusionhomogenization of fuel assembly by HOMOGS computer program 1 3 ] .The scheme of preparation of the library MILDA has been dividedinto two major steps.
In the first step, fine-mesh cross sections has beenobtained by the one dimensional transport supercell calculations(incorporating fuel and non fuel regions) by code WIMS. Groupcollapse to 4 or Z energy group has also been done.
The second step in the preparation process performs thehomogenization by solving a standard diffussion equation of the
i3 the correction term describing the influence oflong-term spectral perturbations,
is the correction term describing the influence ofinstantaneous spectral perturbations.
You see, that this cross section library has been developedin a manner consistent with existing AER methodologies ( KABBerlin) .
Basic fine-mesh cross section tables has been prepared byone-dimensional calculations (by WIMS) of equivalent supercellsfor the selected range of perturbations in technologicalparameters and spectra. These tables hag been then processed bycomputer program PARAMET | 4 ] into coefficients of regressionpolynomials of the form (1).
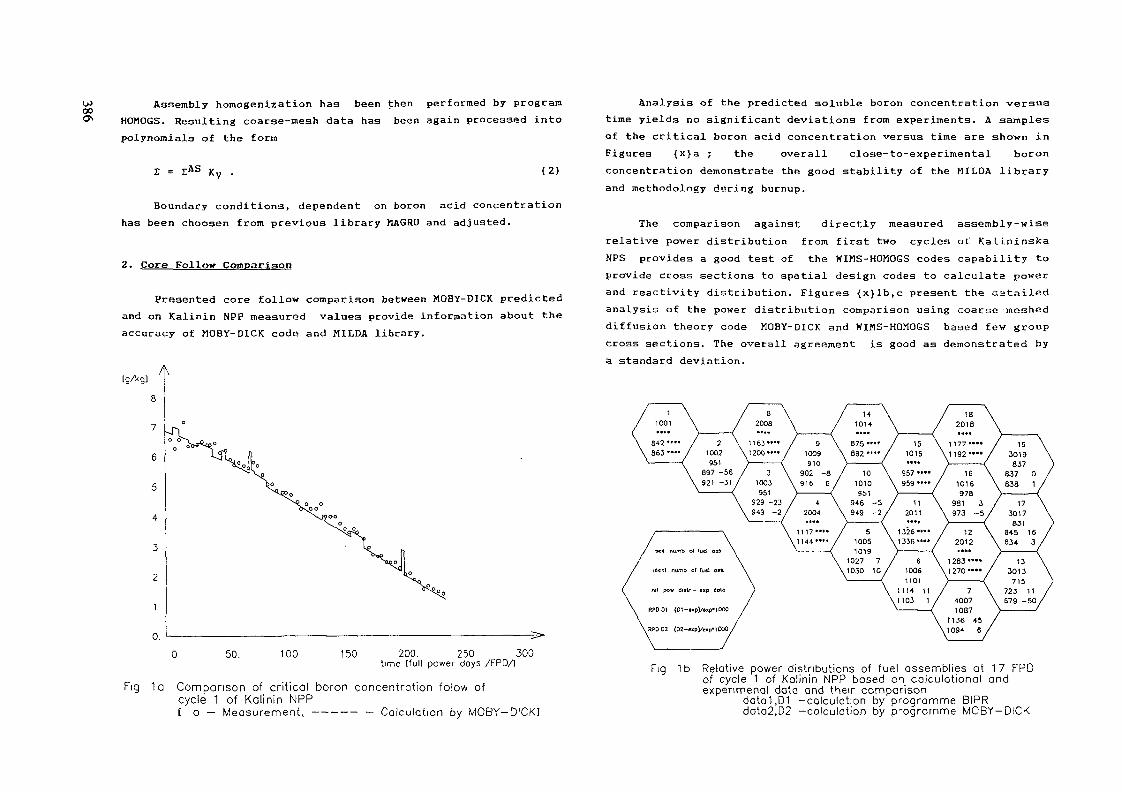
00ON
Assembly homogenization has been then performed by programHOMOGS. Resulting coarse-mesh data has been again processed intopolynomials of the form
I = ZAS Kv . (2 )
Boundary conditions, dependent on boron acid concentrationhas been choosen from previous library MAGRU and adjusted.
2. Core Folloy Comparison
Presented core follow comparison between MOBY-DICK predictedand on Kalinin NPP measured values provide information about theaccuracy of MOBY-DICK code and HILDA library.
tg/kg)
50. 100 150 200. 250 300time [full power doys /FPD/1
Fig 1a Comparison of critical boron concentration folow ofcycle 1 of Kalinin NPPC o - Measurement, —--- - Calculation by MOBY-DICK]
Analysis of the predicted soluble boron concentration versustime yields no significant deviations from experiments. A samplesof the critical boron acid concentration versus time are shown inFigures {x}a ; the overall close-to-experimental boronconcentration demonstrate the good stability of the HILDA libraryand methodology during burnup.
The comparison against directly measured assembly-wiserelative power distribution from first two cycles oL' KalLninskaNPS provides a good test of the WIMS-HOMOGS codes capability toprovide cross sections to spatial design codes to calculate powerand reactivity distribution. Figures {x}lb,c present the c.atailedanalysis of the power distribution comparison using coarse-mesheddiffusion theory code MOBY-DICK and WIMS-HOMOGS based few groupcross sections. The overall agreement is good as demonstrated bya standard deviation.
Tig 1b Relative power distributions of fuel assemblies at 17 FPDof cycle 1 of Kolinin NPP based on calculational andexpenmenal data and their comparison
datai,D1 -calculation by programme BIPRdoto2,D2 -calculation by p-ogramme MOBY-DICK

Fig 1c Relotive power distributions of fuel assemblies at 235 FPDof cycle 1 of Kalinin NPP based on calculotional andexpenmenal dato and their comparison
datai ,D1 -calculation by programme BlPRdata2,D2 -calculation by programme MOBY-DICK
tg/kg)A
50 100 150 200 250 300time [full power days /FPD/]
Fig 2a Comparison of critical boron concentration folow ofcycle 2 of Kalinin NPP[ o - Measurement, ----- - Calculation by MOBY-DICK]
Fig 2b Relotive power distributions of fuel assemblies at 92 FPDof cycle 2 of Kalinin NPP based on calculational andexpenmenal data and their comparison
datai,D1 —calculation by programme BlPRdata2,D2 -calculation by programme MOBY-DICK
Fig 2c Relative power distributions of fuel assemblies at 208 FPDof cycle 2 of Kalinin NPP based on calculational andexpenmenol dato and their companson
datai,D1 -calculation by programme BlPRdata2,D2 -calculation by programme MOBY-DICK
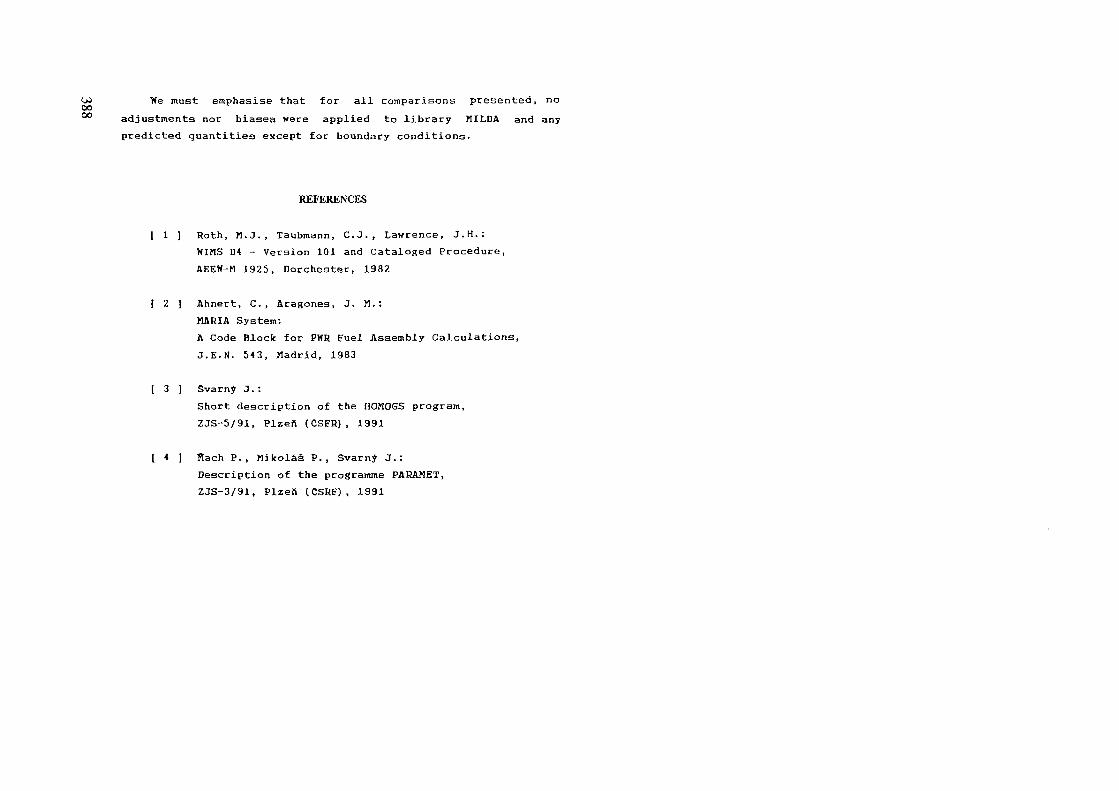
OJ We must emphasise that for all comparisons presented, nooo00 adjustments nor biases were applied to library HILDA and any
predicted quantities except for boundary conditions.
REFERENCES
I 1 ] Roth, M.J., Taubmann, C.J., Lawrence, J.H.:WIMS D4 - Version 101 and Cataloged Procedure,AEEW-M 1925, Dorchester, 1982
I 2 ] Ahnert, C., Aragones, J. M.:MARIA System:A Code Block for PWR Fuel Assembly Calculations,J.E.N. 543, Madrid, 1983
I 3 ] Svarn? J.:Short description of the HOMOGS program,ZJS-5/91, Plzefi (CSFR) , 1991
I 4 ] flach P., Nikolas P., Svarn? J.:Description of the programme PARAMET,ZJS-3/91, Plzeft CCSRF), 1991

LIST OF PARTICIPANTS
C. ALVAEEZ-CAEDONA
T.G. APOSTOLOV
J. BAEDOS
L.L. BIEO
J. BROULIK
K.J. CEIJNS
H.J. HALSALL
0. HRAZDIL
V. JAGANNATHAN
L. KOSPAS
Higher Institute for Nuclear Scienceand Technology
Ave. Salvador Allende y LuaceaQuinta de los HolinosCiudad de la HabanaCubaInstitute for Nuclear Research andNuclear Energy
Boul. Trakia 72Sofia 1784BulgariaNuclear Research Institute250 68 RezCzechoslovakia
National Commission for NuclearActivities Control
Bd. Libertatii nr. 12Bucharest - 5Romania
Nuclear Research Institute250 68 RezCzechoslovakiaInternational Atomic Energy AgencyWagramerstr. 5A-1400 ViennaAustria
Winfrith Technology CentreDorchester, DorsetUnited Kingdom
Nuclear Research Institute250 68 RezCzechoslovakia
Bhabha Atomic Research CentreTheoretical Physics DivisionBhabha Atomic Research CentreTrombay, Bombay 400085India
Paks Nuclear Power StationP.O. Box 717031 PaksHungary
P.D. KRISHNANI
CAELOS FILIO LOPEZ
J. KYNCL
V. LELEK
M.E. HADARIAGA
H. MAKAI
N. MARINKOVIC
K.S. MEEK
A. MIASNIKOV
P. MIKOLAS
J. MIKÜS
Bhabha Atomic Research CentreTheoretical Physics Division5th floor, Central ComplexB.A.R.C., Trombay, Bombay-85IndiaSEMIPComision Nacional de SeguridadNuclear y Salvaguardias
MexicoNuclear Research Institute250 68 RezCzechoslovakiaNuclear Research Institute250 68 EezCzechoslovakia
Comision Nacional de Energia AtomicaAv. del Libertador 82501429 Buenos AiresArgentinaCentral Research Institute for PhysicsKFKI/AEKIAtomic Energy Research InstituteP.O. Box 49H-1525 BudapestHungaryBoris Kidric Institute of Nuclear SciencesNuclear Engineering LaboratoryP.O. Box 52211001 BeogradYugoslavia
Siemens AG, ÜB KWUPostfach 3220W-8520 ErlangenGermanyNuclear Eesearch Institute250 68 EezCzechoslovakiaSKODA PlzenNuclear Engineering Plant316 00 PlzenCzechoslovakiaNuclear Eesearch Institute250 68 RezCzechoslovakia

OJ H. MOLDASCHLVOO
M. NASR
T.Q. NGUYEN
M. NURDIN
B. OSMERA
M. PECKA
D. PEVEC
J. ROCEK
V. RYPAE
L. SAUVAGE
HOHG-GI SHIM
Siemens KWUPower Generation GroupHammerbacherstr. 12-14P.O. Box 3220D-8520 ErlangenGermanyAtomic Energy Authority101, Kasr El-Eini StreetCairoEgyptWestinghouse Electric CorporationP.O. Box 355Pittsburgh15230-0355 PennsylvaniaUSANational Atomic Energy Agency (BATAN)Nuclear Technology Assessment CentreP.O. Box 85 Kby12710 JakartaIndonesiaNuclear Research Institute250 68 RezCzechoslovakiaNuclear Research Institute250 68 RezCzechoslovakiaFaculty of Electrical EngineeringUniversity of ZagrebUnska 341000 ZagrebYugoslaviaNuclear Research Institute250 68 RezCzechoslovakiaNuclear Research Institute250 68 RezCzechoslovakiaCommissariat à l'Energie AtomiqueC.E.N. Cadarache13108 St. Paul lez DuranceFranceInternational Atomic Energy AgencyWagramerstr. 5A-1400 ViennaAustria
A. SHUMSKY
G. SUBHAN
A. SUSLOV
J. SVARNY
C. SVOBODA
B. SZCZESNA
A.Z. TANKER
S. THOMAS
H.H. TUERGUT
T. TUERKER
GidropressUe. Ordijonikidze 21142103, Podolsk, Moscow regionRussiaChashma Nuclear Power ProjectChasnuppP.O. Box 1133PAEC, IslamabadPakistanI.V. Kurchatov Institute of Atomic EnergyI.V. Kurchatov Sg, 46MoscowRussiaSKODA PlzenNuclear Engineering Plant316 00 PlzenCzechoslovakiaNuclear Research Institute250 68 RezCzechoslovakia
Institute of Atomic EnergyNuclear Safety Analysis Dept.PI. 05-400 Otwock-SwierkPolandEnergy Technologies Research Inst.Saraykoy Research CenterTurkish Atomic Energy Authority06105 AnkaraTurkeyDep. NS4 (Core Design and Evaluation)
in Section 1 (Nuclear Power Plant)Kraftwerks- und Anlagenbau AGAllee der Kosmonauten 320-1140 Berlin-MarzahnGermanyCEKMECENuclear Research and Training CenterP.O. Box l HavaalaniIstanbulTurkeyCEKMECENuclear Research and Training CenterP.O. Box l HavaalaniIstanbulTurkey

J. VACEK SKODA PlzenHuclear Engineering Plant316 00 PlzenCzechoslovakia
J. VAHICEK Nuclear Research Institute250 68 RezCzechoslovakia
L. VRBA Nuclear Research Institute250 68 RezCzechoslovakia
Copyright © 2022 FDOKUMEN