Mixing experiment in a stirred tank using blue maize flour suspensions
7
A Colorful Mixing Experiment in a Stirred Tank Using Non-Newtonian Blue Maize Flour Suspensions Grissel Trujillo-de Santiago, Cecilia Rojas-de Gante, Silverio García-Lara, Adriana Ballesca ́ -Estrada, and Mario Moise ́ s Alvarez* Centro de Biotecnología-FEMSA, Tecnoló gico de Monterrey at Monterrey, Monterrey, Nuevo Leó n, CP 64849 Mexico * S Supporting Information ABSTRACT: A simple experiment designed to study mixing of a material of complex rheology in a stirred tank is described. Non- Newtonian suspensions of blue maize flour that naturally contain anthocyanins have been chosen as a model fluid. These anthocyanins act as a native, wide spectrum pH indicator exhibiting greenish colors in alkaline environments, blue tones in neutral conditions, and pink− violet colors in acid environments. Students used a continuous injection of a basic solution in an initially acidic environment to reveal mixing patterns and flow structures and to follow their evolution over time in a typical stirred tank configuration. These experiments aim to demonstrate, in a laboratory setting, basic concepts related to mixing: (i) the existence of mixing pathologies in laminar-stirred tanks; (ii) the complex rheology of some real suspensions; (iii) the effect of tank geometry on mixing performance; and (iv) the quantitation of mixedness and mixing evolution using digital color analysis. KEYWORDS: Second-Year Undergraduate, Upper-Division Undergraduate, Chemical Engineering, Hands-On Learning/Manipulatives, Acids/Bases, Applications of Chemistry, pH, Chemometrics ■ INTRODUCTION Mixing is one of the most frequently used unit operations in chemical engineering. In particular, the dispersion of a solid in a liquid is a classic example of a mixing operation occurring in diverse applications in the areas of food technology, biotechnology, mining, refining, polymer processing, and wastewater treatment. In many instances, mixing may determine the quality of a product or the efficiency of a process. The recognized importance of mixing by the scientific community is illustrated by the exponential growth in the number of papers related to this subject in the past decade (see Supporting Information; Figure S1). Despite this practical importance, and with some notable exceptions, 1,2 mixing has received modest coverage in chemical engineering textbooks. In addition, fluid mixing has been relatively poorly addressed in journals related to science and engineering education. Only two papers referring to mixing experiments have been published in the Journal of Chemical Education. In one of them, the authors 3 illustrated the immiscibility of layers of liquids; in a simple experiment, a homogeneous layer in a multiphasic mixture separated into two new layers upon shaking. In the second, an experiment in which students were introduced to the concept of statistical process control (SPC) through a simple inline mixing experiment is presented. 4 In this work, a simple experiment conducted in a stirred tank is presented. Stirred tanks may be the most commonly used agitation equipment in the chemical industry. Mixing at low speeds and high viscosities (in the laminar regime) is examined. While at low fluid viscosities and/or high agitation rates mixing is caused by turbulence 2,5 (see Supporting Information), in the laminar regime mixing mechanistically proceeds by triggering chaos, 6−8 and stirred tanks are known to exhibit severe mixing pathologies. 8−10 Laminar mixing scenarios are frequently found in practical applications related to food technology, 11−13 and biotechnology settings. 14,15 In many industrial applications and experimental settings, suspensions behave as non-Newtonian fluids; 14,15 they do not obey Newton’s law of viscosity (constant viscosity at different shear or agitation rates). In particular, this experiment is intended to illustrate the complexities of laminar mixing in a real non-Newtonian fluid 6,16 (its apparent viscosity is a strong function of shear or agitation rate), using as a model a suspension of blue maize flour (a corn variety native to Mexico) in water. This model is convenient and practical for didactic mixing experiments, because the anthocyanins naturally present in blue maize kernels 17−19 serve as a natural pH indicator that undergoes drastic changes in color in a wide range of pH values (1.36 to 11.6; see Figure 1a). This experiment can be used to illustrate to students various general concepts relevant to chemical engineering, including mixing, mixing evaluation, rheology of non-Newtonian mixtures, and the importance of the geometry of a system in mixing efficiency in lab courses Published: September 19, 2014 Laboratory Experiment pubs.acs.org/jchemeduc © 2014 American Chemical Society and Division of Chemical Education, Inc. 1729 dx.doi.org/10.1021/ed500150z | J. Chem. Educ. 2014, 91, 1729−1735
Transcript of Mixing experiment in a stirred tank using blue maize flour suspensions

A Colorful Mixing Experiment in a Stirred Tank Using Non-NewtonianBlue Maize Flour SuspensionsGrissel Trujillo-de Santiago, Cecilia Rojas-de Gante, Silverio García-Lara, Adriana Ballesca-Estrada,and Mario Moises Alvarez*
Centro de Biotecnología-FEMSA, Tecnologico de Monterrey at Monterrey, Monterrey, Nuevo Leon, CP 64849 Mexico
*S Supporting Information
ABSTRACT: A simple experiment designed to study mixing of amaterial of complex rheology in a stirred tank is described. Non-Newtonian suspensions of blue maize flour that naturally containanthocyanins have been chosen as a model fluid. These anthocyaninsact as a native, wide spectrum pH indicator exhibiting greenish colorsin alkaline environments, blue tones in neutral conditions, and pink−violet colors in acid environments. Students used a continuousinjection of a basic solution in an initially acidic environment toreveal mixing patterns and flow structures and to follow theirevolution over time in a typical stirred tank configuration. Theseexperiments aim to demonstrate, in a laboratory setting, basicconcepts related to mixing: (i) the existence of mixing pathologies inlaminar-stirred tanks; (ii) the complex rheology of some realsuspensions; (iii) the effect of tank geometry on mixing performance; and (iv) the quantitation of mixedness and mixingevolution using digital color analysis.KEYWORDS: Second-Year Undergraduate, Upper-Division Undergraduate, Chemical Engineering,Hands-On Learning/Manipulatives, Acids/Bases, Applications of Chemistry, pH, Chemometrics
■ INTRODUCTIONMixing is one of the most frequently used unit operations inchemical engineering. In particular, the dispersion of a solid in aliquid is a classic example of a mixing operation occurring indiverse applications in the areas of food technology,biotechnology, mining, refining, polymer processing, andwastewater treatment. In many instances, mixing maydetermine the quality of a product or the efficiency of aprocess. The recognized importance of mixing by the scientificcommunity is illustrated by the exponential growth in thenumber of papers related to this subject in the past decade (seeSupporting Information; Figure S1). Despite this practicalimportance, and with some notable exceptions,1,2 mixing hasreceived modest coverage in chemical engineering textbooks. Inaddition, fluid mixing has been relatively poorly addressed injournals related to science and engineering education. Only twopapers referring to mixing experiments have been published inthe Journal of Chemical Education. In one of them, the authors3
illustrated the immiscibility of layers of liquids; in a simpleexperiment, a homogeneous layer in a multiphasic mixtureseparated into two new layers upon shaking. In the second, anexperiment in which students were introduced to the conceptof statistical process control (SPC) through a simple inlinemixing experiment is presented.4
In this work, a simple experiment conducted in a stirred tankis presented. Stirred tanks may be the most commonly usedagitation equipment in the chemical industry. Mixing at low
speeds and high viscosities (in the laminar regime) is examined.While at low fluid viscosities and/or high agitation rates mixingis caused by turbulence2,5 (see Supporting Information), in thelaminar regime mixing mechanistically proceeds by triggeringchaos,6−8 and stirred tanks are known to exhibit severe mixingpathologies.8−10
Laminar mixing scenarios are frequently found in practicalapplications related to food technology,11−13 and biotechnologysettings.14,15 In many industrial applications and experimentalsettings, suspensions behave as non-Newtonian fluids;14,15 theydo not obey Newton’s law of viscosity (constant viscosity atdifferent shear or agitation rates). In particular, this experimentis intended to illustrate the complexities of laminar mixing in areal non-Newtonian fluid6,16 (its apparent viscosity is a strongfunction of shear or agitation rate), using as a model asuspension of blue maize flour (a corn variety native to Mexico)in water. This model is convenient and practical for didacticmixing experiments, because the anthocyanins naturally presentin blue maize kernels17−19 serve as a natural pH indicator thatundergoes drastic changes in color in a wide range of pH values(1.36 to 11.6; see Figure 1a). This experiment can be used toillustrate to students various general concepts relevant tochemical engineering, including mixing, mixing evaluation,rheology of non-Newtonian mixtures, and the importance ofthe geometry of a system in mixing efficiency in lab courses
Published: September 19, 2014
Laboratory Experiment
pubs.acs.org/jchemeduc
© 2014 American Chemical Society andDivision of Chemical Education, Inc. 1729 dx.doi.org/10.1021/ed500150z | J. Chem. Educ. 2014, 91, 1729−1735
related to transport phenomena, mass transfer phenomena,mass transfer unit operations, or rheology. This experimentcould also be appropriate to illustrate the existence of and apractical application for natural pH indicators in an analyticalchemistry or a food chemistry course.
■ MATERIALS AND METHODS
A Complex and Didactic Fluid ModelA suspension of blue maize flour in water was used as a fluidmodel. Flours of 150 mesh from decorticated blue maize wereobtained according to Rojas-de Gante et al.19 To prepare thesuspension, 585 g of blue maize flour was dispersed in 1300 mLof distilled water.Stirred Tank SystemThe basic requirement for conducting the experiment was atransparent, stirred-tank vessel preferably equipped with avariable speed agitation system. It is desirable, but notnecessary, to use a system with a pH monitor and controlcapabilities.In our particular case, a 3 L fully instrumented Applikon
model EZ-control reactor (Applikon Biotechnology, Schiedam,The Netherlands) with a working volume of 1.0 to 1.7 L,equipped with a variable speed control, was used (Figure 2).Visualization ExperimentsVisualization experiments were conducted by teams of threestudents per tank in individual lab sessions lasting 3 h. Studentsrevealed the 3D mixing patterns within the reactor using acontinuous injection of a basic solution in an initially acidicenvironment. To establish a low-pH initial state, a hydrochloric
acid solution (i.e., HCl 3 N) was dispensed to the system(surface addition) and the system was agitated at 1000 rpmuntil a uniform pink color was achieved; this gave a pHbetween 3.0 and 4.0. For best results, this addition wasperformed slowly using small pulses of acid. From the initialhomogeneous acidic condition, the students established a newpH set point value of 8.5 and activated the pH control system.A sodium hydroxide solution (NaOH 1 N) was continuouslyadded dropwise using the bioreactor automatic dispensingsystem until the pH set point was reached. The excursion of pHinduced by the continuous injection of a sodium hydroxidesolution (NaOH 1 N) allowed for the visualization of themixing progress and the existence of mixing pathologies.To follow the evolution of the mixing process, frontal
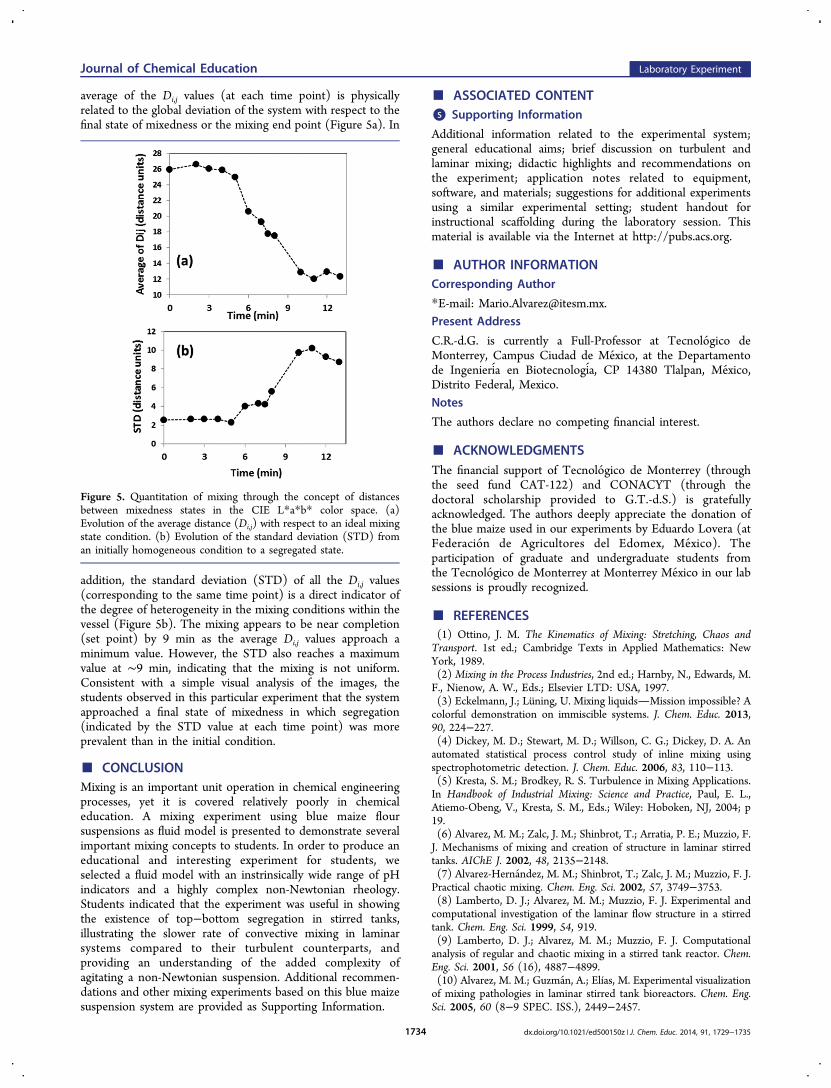
photographic images of the entire tank volume were taken atdifferent times using a professional digital camera (CanonRebel XTi) mounted on a tripod (Figure 2c and Figure 3).Special care was taken to maintain the illumination quality andthe camera position for all pictures. During the lab period,students downloaded images and saved them on a cloud filestorage site (i.e., Dropbox, from Dropbox Inc., San Francisco,CA). To complete color analysis, the students imported theimages into the application Color Companion 4.0 for iPad(Digital Media Interactive LCC, USA). Using this application,the students determined the color (in the CIE L*a*b* colorspace) for 16 locations in each image (Figure 2). The studentsprocessed the data at home, which required approximately 2 h,and generated plots showing the mixing’s evolution over timebased on the distance changes between the color at each pointand the color at a final mixing state.
■ HAZARDSSpecial attention should be placed to preparation anddispensing of the hydrochloric acid and the sodium hydroxide
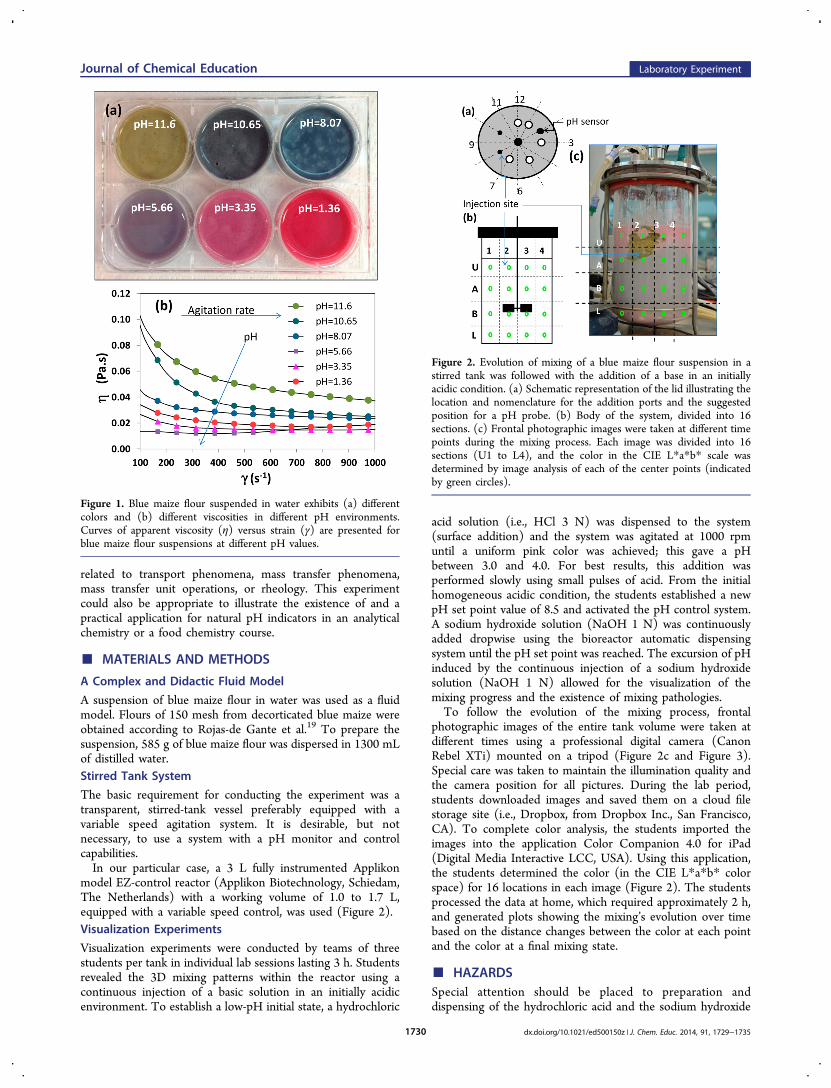
Figure 1. Blue maize flour suspended in water exhibits (a) differentcolors and (b) different viscosities in different pH environments.Curves of apparent viscosity (η) versus strain (γ) are presented forblue maize flour suspensions at different pH values.
Figure 2. Evolution of mixing of a blue maize flour suspension in astirred tank was followed with the addition of a base in an initiallyacidic condition. (a) Schematic representation of the lid illustrating thelocation and nomenclature for the addition ports and the suggestedposition for a pH probe. (b) Body of the system, divided into 16sections. (c) Frontal photographic images were taken at different timepoints during the mixing process. Each image was divided into 16sections (U1 to L4), and the color in the CIE L*a*b* scale wasdetermined by image analysis of each of the center points (indicatedby green circles).
Journal of Chemical Education Laboratory Experiment
dx.doi.org/10.1021/ed500150z | J. Chem. Educ. 2014, 91, 1729−17351730

solution. In particular, the process of dissolution of NaOH inwater is highly exothermic, and NaOH solutions above 0.5 Nare corrosive and irritant. Students should wear gloves andprotective eyeglasses when preparing or dispensing NaOHsolutions. Solution preparation should be done under a safetyhood.
■ THE EXPERIMENT AND THE ANALYSIS OFRESULTS
Rationale of the Experiment
In the related literature, examples of simple experiments tocharacterize mixing mainly focus on Newtonian systems. Dyeinjection experiments in transparent or nearly transparentfluids, such as glycerin or water, are typical examples.10,20,21
Frequently, pH indicators are used8 to reveal the transientbehavior of a system after the injection of an acidic or basicsolution. Here, a model flow consisting of a blue maizesuspension that exhibits a complex rheology (i.e., non-Newtonian) allows conducting flow visualization experimentswithout the need for adding a foreign pH indicator. Theanthocyanins naturally present in blue maize flour18 respond tochanges in pH by displaying a wide range of colors. At low pHvalues, blue maize suspensions exhibit a magenta/fuchsia color.Progressively, as pH is increased, transitions to pink, lavender,gray-blue, blue-green, green, and intense green occur (Figure1a). The presence of this intrinsic and wide-range pH indicatorhas important practical advantages in the laboratory. In general,available pH indicators exhibit a narrower range of colorchanges. In a highly viscous system, the adequate dispersion ofthe indicator might be an issue itself. An additional character-istic makes this system even more interesting from a didacticpoint of view. Blue maize suspensions not only undergochanges in color as the pH value changes but also show changesin viscosity (see Figure 1b). At basic pH values above 8.0, theviscosity of blue maize suspensions increases dramatically andabruptly, reducing flow and further obstructing mixing.Visualization of Mixing Pathologies in a RheologicalComplex Suspension
In the laminar regime, at low velocities and/or high viscosities,the existence of chaotic motion is mandatory for mixing tooccur.6 In conventional stirred tanks, the mechanism forcreating chaos and the onset of mixing has been studied in
Figure 3. (a) The CIE L*a*b* scale represents a color in a three-coordinate system in which L is associated with luminosity, rangingfrom 0 for black to +100 for white. The a and b values define a planeof colors. (b) In the CIE L*a*b* color space, the difference betweentwo colors can be calculated by determining the distance betweenthem in this 3D space.
Figure 4. Mixing evolution in a conventional stirred-tank geometry from an initially homogeneous acidic state (t = 0) toward a final process state (t= 13.0 min) in which segregation still prevails (particularly top−bottom segregation).
Journal of Chemical Education Laboratory Experiment
dx.doi.org/10.1021/ed500150z | J. Chem. Educ. 2014, 91, 1729−17351731

Table 1. CIE L*a*b* Scale Color Measurements Taken at Different Times and Positions in the Figure 2 Image Seta
Sampling Point,Coordinate j Time, min; Coordinate i
0 2 3 4 5 6 7 7.5 8 10 11 12 13
U1 L 52.5 52.7 54.3 52.4 55.5 54.6 55.2 61.8 52.5 61.4 62.7 61.4 66.6a 14.8 17.1 15.8 17.4 15.5 13.8 11.5 11.4 11.9 8.0 10.0 9.6 8.9b 6.4 6.1 6.8 6.9 7.8 5.9 6.2 6.7 10.0 6.5 8.5 7.1 8.5Dij 22.7 24.7 23.1 24.6 22.2 21.8 19.8 20.1 18.4 17.7 18.3 18.4 19.3
U2 L 59.3 59.6 60.5 58.6 63.4 60.7 59.9 65.9 59.0 70.9 67.7 68.8 69.8a 16.8 19.3 18.4 17.8 16.1 15.0 11.4 11.0 12.5 11.0 7.3 13.2 11.5b 5.3 5.8 7.2 8.2 6.8 5.2 5.5 5.9 6.5 9.3 7.9 9.6 7.8Dij 24.8 26.7 25.4 24.2 24.3 23.6 20.4 21.8 20.5 22.9 19.2 23.0 23.1
U3 L 61.2 61.6 61.5 61.9 64.2 61.9 60.9 67.5 61.2 70.3 71.0 70.5 67.7a 19.3 17.1 18.8 20.7 19.2 16.6 15.5 14.4 18.1 16.3 17.6 14.4 16.7b 7.0 6.0 8.6 6.4 8.1 5.3 6.6 7.2 6.5 9.1 7.4 6.6 8.2Dij 26.4 25.1 25.4 28.1 26.6 25.1 23.3 24.3 25.6 26.4 28.4 26.1 25.8
U4 L 60.7 62.8 63.7 62.4 65.9 60.6 59.5 69.3 61.0 71.9 69.4 66.8 66.4a 16.1 18.4 18.8 17.0 18.4 15.6 17.5 15.7 17.2 11.1 15.7 16.0 14.5b 7.4 6.6 8.0 5.4 7.2 7.8 7.5 5.4 6.7 4.7 8.3 7.9 8.5Dij 23.4 26.2 26.2 25.5 26.9 22.7 24.4 27.0 24.7 25.7 25.8 24.9 23.3
A1 L 54.0 53.3 54.3 48.9 55.6 53.7 54.4 60.6 52.2 47.2 45.6 44.4 49.2a 17.6 17.0 17.8 17.5 17.3 8.4 8.2 6.5 7.1 −3.9 −5.4 −1.4 −3.3b 5.7 6.1 8.2 7.6 8.0 6.2 5.5 5.9 6.3 43.2 37.2 38.4 32.3Dij 25.2 24.6 24.2 25.2 23.8 17.6 17.9 16.9 16.9 26.5 21.8 23.5 15.7
A2 L 57.9 58.4 58.9 57.7 62.7 58.7 59.9 44.7 58.0 52.8 58.4 56.8 59.7a 18.9 19.4 19.6 17.9 17.9 9.9 6.9 −5.2 −1.5 −3.0 −4.8 −3.8 −4.2b 6.3 5.9 6.6 8.3 7.0 4.9 6.1 25.9 5.5 31.6 17.4 24.2 19.8Dij 26.0 26.7 26.6 24.2 25.5 19.5 16.8 13.9 13.2 13.8 2.4 5.9 3.7
A3 L 60.5 61.0 63.8 62.2 64.7 62.4 61.9 69.0 61.6 62.7 61.5 60.7 64.1a 21.3 20.2 18.9 18.6 19.5 10.8 5.7 0.2 −0.6 −4.5 −4.7 −5.1 −3.2b 6.1 6.8 9.2 9.1 8.3 7.0 5.6 2.9 2.8 17.8 20.1 21.7 17.6Dij 28.5 27.3 25.8 25.2 27.0 19.7 17.0 20.4 16.8 6.4 5.5 5.6 7.9
A4 L 59.2 61.6 60.7 62.7 64.4 61.2 60.9 65.3 58.9 58.2 58.5 59.7 64.9a 20.3 19.1 18.9 19.3 18.2 9.0 9.1 0.0 −1.1 −5.6 −4.7 −4.6 −3.9b 8.7 7.5 8.6 8.2 8.3 7.5 8.7 7.0 5.6 17.1 23.8 21.4 11.5Dij 26.4 26.1 25.3 26.3 25.7 17.7 17.0 15.0 13.3 2.7 6.0 4.6 11.0
B1 L 54.2 47.5 52.1 51.4 56.4 50.7 51.6 57.3 50.4 48.6 47.4 44.7 45.8a 15.5 18.3 17.5 16.3 15.8 7.7 3.1 −1.5 −0.8 −4.9 −4.8 −4.8 −4.8b 4.8 6.7 6.3 7.7 8.8 5.9 2.3 4.3 5.9 16.7 16.3 20.1 18.2Dij 23.9 26.7 25.1 23.5 22.1 18.0 18.2 14.3 14.1 7.9 9.1 11.8 10.5
B2 L 57.2 57.4 57.7 56.1 61.1 56.5 55.4 62.2 57.1 57.1 56.1 57.2 56.3a 19.0 18.5 19.3 19.2 17.6 8.9 4.1 −0.2 −0.4 −3.7 −4.8 −3.6 −4.1b 7.6 6.1 8.3 8.9 6.9 5.7 5.7 5.3 4.7 18.4 17.5 19.6 18.3Dij 25.5 25.7 25.5 25.1 25.0 18.1 15.1 14.8 14.1 0.9 1.1 1.7 0.0
B3 L 60.6 59.8 60.5 60.7 64.6 60.5 59.4 66.0 59.2 60.5 60.4 60.3 60.9a 20.3 21.5 19.7 20.1 17.8 9.0 4.4 0.0 0.4 −4.2 −4.7 −3.6 −4.0b 6.9 5.6 9.0 9.2 8.1 7.5 5.8 5.8 4.9 21.5 20.2 21.1 20.9Dij 27.3 28.8 25.9 26.2 25.5 17.5 15.4 16.3 14.4 5.3 4.6 4.9 5.3
B4 L 57.0 58.4 58.5 59.6 61.8 57.5 58.3 58.0 57.8 58.7 58.5 56.3 56.3a 18.1 20.0 18.0 19.0 18.5 11.1 11.1 1.9 −0.7 −5.4 −4.5 −4.6 −4.1b 7.7 8.6 7.7 8.7 9.7 8.4 8.4 5.5 5.7 16.5 18.0 25.7 23.5Dij 24.6 26.1 24.6 25.2 24.8 18.2 18.2 14.2 13.1 3.3 2.3 7.4 5.2
L1 L 31.6 28.9 29.0 27.7 33.2 27.8 27.6 39.0 27.0 28.0 25.1 27.2 28.7a 16.9 16.6 15.5 13.9 14.7 9.6 7.3 6.2 4.7 −1.7 −0.3 −1.3 −2.7b 7.7 8.3 8.5 9.1 11.9 7.9 6.9 8.1 7.2 18.1 14.9 16.4 17.7Dij 34.1 35.8 35.0 35.0 30.5 33.3 32.9 22.6 32.5 28.4 31.6 29.3 27.6
L2 L 46.2 52.0 47.0 47.7 51.2 49.1 47.9 59.2 47.8 47.0 45.6 46.5 45.8a 19.2 19.4 22.1 20.1 18.4 13.7 9.0 8.5 8.4 −3.1 −2.3 −3.8 −3.1b 9.1 9.6 10.4 10.7 8.6 9.7 8.4 9.7 8.8 20.5 19.6 23.8 16.9Dij 27.0 25.4 28.9 26.8 25.0 21.0 18.4 15.5 17.9 9.6 10.9 11.2 10.6
L3 L 54.4 54.8 54.7 52.6 62.0 53.5 55.3 60.6 54.7 52.4 56.9 54.1 61.2a 18.7 17.5 18.1 17.7 13.4 12.0 8.3 3.1 2.4 −4.1 −2.9 −3.5 −1.2b 9.9 8.7 10.2 10.7 10.4 9.5 7.9 7.1 6.9 20.3 20.4 23.3 21.9
Journal of Chemical Education Laboratory Experiment
dx.doi.org/10.1021/ed500150z | J. Chem. Educ. 2014, 91, 1729−17351732

detail.6 Briefly, in the laminar regime, conventional concentri-cally agitated tanks possess a regular flow skeleton.7 When animpeller with blades is used, the repetitive (and normallyperiodic) passing of the blades disturbs the otherwisecompletely regular flow structure, thereby triggering chaos.6,8
However, chaos is not widely distributed in concentric laminar-stirred tanks, and different mixing pathologies have beenidentified in Newtonian laminar-stirred tanks.10
Figure 4 presents a sequence of images corresponding to anexperiment in which an initially acidic blue maize floursuspension is agitated in a conventional tank after a basic setpoint has been established. The tank is equipped with aconcentrically located radial impeller with an approximatediameter of 0.33D (where D is the tank diameter) rotatingclockwise at 1000 rpm. The H/D of the system is 1.15 (whereH is the height of the liquid within the tank). The impeller islocated at approximately (1/4)H from the bottom of the tank.This experiment visually illustrates the progression of mixing
in a concentrically agitated tank, from an initial homogeneouscondition to a final state that shows top−bottom segregation.The students noted the development of an area of high pH (seethe dark green zone in Figure 4; time from 7.5 to 13 min)resulting from an accumulation of the base around the point ofinjection. This suggests that the local intensity of mixing at thepoint of injection is insufficient to effectively and quicklydisperse the base. The increase in pH causes also an increase inviscosity (see Figure 1b), further obstructing the dispersion ofthe base and aggravating the problem, as revealed by theincrease in size of the dark green area (see also SupportingInformation; Figure S2).The students (a) observed the progress of the mixing
process; (b) understood that the rheology of the systemimposed conditions that slowed the progress of the acid−basereaction; (c) recognized that in this case, although the reactionwas instantaneous, the mixing process became rate limiting anddetermined the rate of the overall process; and (d) understoodthat in concentric systems with this geometry (H/D between1.1 and 1.3 and one agitator), top−bottom segregationpersisted even after extended periods of agitation.
Following Mixing Dynamics in a Color Space UsingExternal Images
The students were able to follow the mixing process byanalyzing the photographic images in Figure 4. A simple,didactic methodology to quantify the state of mixedness andthe mixing dynamics through color change analysis wasintroduced to students. A color scale normally used for imageanalysis and color applications, namely, CIE L*a*b*, was used
(Figure 3). In this system, each color is characterized by threevalues, L, a, and b. The L value is associated with luminosity,ranging from 0 for black to +100 for white. The a and b valuesdefine a plane of colors, shown in Figure 3, where a ranges fromnegative to positive values (green to red) and b ranges fromnegative to positive values (blue to yellow).The students estimated the deviation of a particular state of
mixing (at a particular location and time) from the final mixingpoint or the “ideal mixing” state (presumably the finalcondition of complete mixing) by evaluating differences incolors in the two states (i.e., evaluating the distance betweentwo corresponding points in the CIE L*a*b* coordinatesystem). For any two L, a, b value points, the distance in thecolor space, defined by a straight line connecting both points,was calculated by eq 1.
= − + − + −D L L a a b b[( ) ( ) ( ) ]i j i j i j i j, , f2
, f2
, f2 0.5
(1)
Here, Di,j is defined as the distance, in the CIE L*a*b* space, ofthe points defined by the L, a, and b coordinates of the sampletaken at time i and location j (Li,j, ai,j, bi,j) and a samplerepresentative of the final mixing state (Lf, af, bf).Digital color analysis (DCA), using colors themselves or
digital information on colors, has been suggested before as atool to quantify chromatic changes.22 Students analyzed thissequence of images using the following protocol. A referencegrid was used to define 16 sections within every image (Figures2b and 2c). The center point within each zone was used as a“sample” location where color was determined according to theCIE L*a*b* scale. Consider a sample taken at a time (i) and alocation (j) (for example, t = 8 min and location B3 in Figure4). The color at this sample point in the CIE L*a*b* scale, asdetermined by analysis using the Color Companion 4.0application, was Li,j = 59.2, ai,j = 0.4, bi,j = 4.9 (Table 1). Byvisual inspection, a final state for the mixing process can beapproximated. In this experiment students considered theaverage of the CIE L*a*b* values at the final time point (t = 13min) in location B2 (i.e., Lf = 56.3, af = −4.1, bf = 18.3) toapproximate a desirable, well-mixed condition (mixing endpoint). Table 1 presents all L, a, and b color values calculatedfor the series of images in Figure 4, in each one of the samplinglocations indicated in Figure 2c. Based on these values, studentscalculated the set of distances (Di,j) from each time and locationto the mixing end point; Di,j values are also reported in Table 1.Therefore, for the case under consideration, the value of
D8min,B3 was 14.4. For the set of images in Figure 3, the distancevalues (Di,j) in the CIE L*a*b* color space corresponding to alltimes and sampling points are presented in Table 1. The
Table 1. continued
Sampling Point,Coordinate j Time, min; Coordinate i
0 2 3 4 5 6 7 7.5 8 10 11 12 13
Dij 24.4 23.7 23.7 23.4 20.0 18.6 16.2 14.0 13.2 4.4 2.5 5.5 6.7L4 L 52.9 53.9 54.9 53.2 57.7 56.0 56.3 53.2 56.9 52.6 58.4 58.0 57.2
a 18.9 19.8 20.3 20.0 19.1 11.2 10.9 2.9 1.8 −4.8 −2.9 −1.5 −3.3b 9.4 9.2 10.6 10.5 10.6 10.3 9.5 8.3 8.5 19.5 18.6 18.5 18.5Dij 24.9 25.7 25.6 25.5 24.5 17.3 17.4 12.6 11.5 4.0 2.4 3.1 1.2
STD 2.57 2.64 2.64 2.63 2.30 4.03 4.31 4.21 5.58 9.75 10.19 9.28 8.74aReadings were taken at the center point of each one of the 16 sections defined by the grid in Figure 2b. The distance in the CIE L*a*b* color spaceto the mixing end point (Di,j) was calculated, as defined by eq 1, for each of the 16 reading positions (U1 to L4) and 13 time points considered in theexperiment. For this particular experiment the final mixing point was considered to be the coordinate t = 13 min at location B2. STD is defined as thestandard deviation of the Dij values at the 16 reading positions of each time point.
Journal of Chemical Education Laboratory Experiment
dx.doi.org/10.1021/ed500150z | J. Chem. Educ. 2014, 91, 1729−17351733
average of the Di,j values (at each time point) is physicallyrelated to the global deviation of the system with respect to thefinal state of mixedness or the mixing end point (Figure 5a). In
addition, the standard deviation (STD) of all the Di,j values(corresponding to the same time point) is a direct indicator ofthe degree of heterogeneity in the mixing conditions within thevessel (Figure 5b). The mixing appears to be near completion(set point) by 9 min as the average Di,j values approach aminimum value. However, the STD also reaches a maximumvalue at ∼9 min, indicating that the mixing is not uniform.Consistent with a simple visual analysis of the images, thestudents observed in this particular experiment that the systemapproached a final state of mixedness in which segregation(indicated by the STD value at each time point) was moreprevalent than in the initial condition.
■ CONCLUSIONMixing is an important unit operation in chemical engineeringprocesses, yet it is covered relatively poorly in chemicaleducation. A mixing experiment using blue maize floursuspensions as fluid model is presented to demonstrate severalimportant mixing concepts to students. In order to produce aneducational and interesting experiment for students, weselected a fluid model with an instrinsically wide range of pHindicators and a highly complex non-Newtonian rheology.Students indicated that the experiment was useful in showingthe existence of top−bottom segregation in stirred tanks,illustrating the slower rate of convective mixing in laminarsystems compared to their turbulent counterparts, andproviding an understanding of the added complexity ofagitating a non-Newtonian suspension. Additional recommen-dations and other mixing experiments based on this blue maizesuspension system are provided as Supporting Information.
■ ASSOCIATED CONTENT*S Supporting Information
Additional information related to the experimental system;general educational aims; brief discussion on turbulent andlaminar mixing; didactic highlights and recommendations onthe experiment; application notes related to equipment,software, and materials; suggestions for additional experimentsusing a similar experimental setting; student handout forinstructional scaffolding during the laboratory session. Thismaterial is available via the Internet at http://pubs.acs.org.
■ AUTHOR INFORMATIONCorresponding Author
*E-mail: [email protected] Address
C.R.-d.G. is currently a Full-Professor at Tecnologico deMonterrey, Campus Ciudad de Mexico, at the Departamentode Ingenieria en Biotecnologia, CP 14380 Tlalpan, Mexico,Distrito Federal, Mexico.Notes
The authors declare no competing financial interest.
■ ACKNOWLEDGMENTSThe financial support of Tecnologico de Monterrey (throughthe seed fund CAT-122) and CONACYT (through thedoctoral scholarship provided to G.T.-d.S.) is gratefullyacknowledged. The authors deeply appreciate the donation ofthe blue maize used in our experiments by Eduardo Lovera (atFederacio n de Agricultores del Edomex, Mexico). Theparticipation of graduate and undergraduate students fromthe Tecnologico de Monterrey at Monterrey Mexico in our labsessions is proudly recognized.
■ REFERENCES(1) Ottino, J. M. The Kinematics of Mixing: Stretching, Chaos andTransport. 1st ed.; Cambridge Texts in Applied Mathematics: NewYork, 1989.(2) Mixing in the Process Industries, 2nd ed.; Harnby, N., Edwards, M.F., Nienow, A. W., Eds.; Elsevier LTD: USA, 1997.(3) Eckelmann, J.; Luning, U. Mixing liquidsMission impossible? Acolorful demonstration on immiscible systems. J. Chem. Educ. 2013,90, 224−227.(4) Dickey, M. D.; Stewart, M. D.; Willson, C. G.; Dickey, D. A. Anautomated statistical process control study of inline mixing usingspectrophotometric detection. J. Chem. Educ. 2006, 83, 110−113.(5) Kresta, S. M.; Brodkey, R. S. Turbulence in Mixing Applications.In Handbook of Industrial Mixing: Science and Practice, Paul, E. L.,Atiemo-Obeng, V., Kresta, S. M., Eds.; Wiley: Hoboken, NJ, 2004; p19.(6) Alvarez, M. M.; Zalc, J. M.; Shinbrot, T.; Arratia, P. E.; Muzzio, F.J. Mechanisms of mixing and creation of structure in laminar stirredtanks. AIChE J. 2002, 48, 2135−2148.(7) Alvarez-Hernandez, M. M.; Shinbrot, T.; Zalc, J. M.; Muzzio, F. J.Practical chaotic mixing. Chem. Eng. Sci. 2002, 57, 3749−3753.(8) Lamberto, D. J.; Alvarez, M. M.; Muzzio, F. J. Experimental andcomputational investigation of the laminar flow structure in a stirredtank. Chem. Eng. Sci. 1999, 54, 919.(9) Lamberto, D. J.; Alvarez, M. M.; Muzzio, F. J. Computationalanalysis of regular and chaotic mixing in a stirred tank reactor. Chem.Eng. Sci. 2001, 56 (16), 4887−4899.(10) Alvarez, M. M.; Guzman, A.; Elías, M. Experimental visualizationof mixing pathologies in laminar stirred tank bioreactors. Chem. Eng.Sci. 2005, 60 (8−9 SPEC. ISS.), 2449−2457.
Figure 5. Quantitation of mixing through the concept of distancesbetween mixedness states in the CIE L*a*b* color space. (a)Evolution of the average distance (Di,j) with respect to an ideal mixingstate condition. (b) Evolution of the standard deviation (STD) froman initially homogeneous condition to a segregated state.
Journal of Chemical Education Laboratory Experiment
dx.doi.org/10.1021/ed500150z | J. Chem. Educ. 2014, 91, 1729−17351734

(11) Maingonnat, J. F.; Doublier, J. L.; Lefebvre, J.; Delaplace, G.Power consumption of a double ribbon impeller with Newtonian andshear thinning fluids and during the gelation of an iota-carrageenansolution. J. Food Eng. 2008, 87, 82−90.(12) Bouvier, L.; Moreau, A.; Line, A.; Faqtah, N.; Delaplace, G.Damage in agitated vessels of large visco-elastic particles dispersed in ahighly viscous fluid. J. Food Sci. 2010, 76, E384−E391.(13) Migliori, M.; Correra, S. Modelling of dough formation processand structure evolution during farinograph test. Int. J. Food Sci. Technol.2013, 48 (1), 121−127.(14) Craig, K. J.; Nieuwoudt, M. N.; Niemand, L. J. CFD simulationof anaerobic digester with variable sewage sludge rheology. Water Res.2013, 47, 4485−4497.(15) Zhang, H. L.; Baeyens, J.; Tan, T. W. Mixing phenomena in alarge-scale fermenter of starch to bio-etanol. Energy 2012, 48, 380−391.(16) Arratia, P. E.; Shinbrot, T.; Alvarez, M. M.; Muzzio, F. J. Mixingof non-Newtonian fluids in steadily forced systems. Phys. Rev. Lett.2005, 94, 084501.(17) Ryu, S. H.; Werth, L.; Nelson, S.; Scheerens, J. C.; Pratt, R. C.Variation of kernel anthocyanin and carotenoid pigment content inUSA/Mexico borderland land races of Maize. Econ. Bot. 2013, 67, 98−109.(18) Urias-Peraldí, M.; Gutierrez-Uribe, J. A.; Preciado-Ortiz, R. E.;Cruz-Morales, A. S.; Serna-Saldívar, S. O.; García-Lara, S. Nutraceut-ical profiles of improved BM (Zea mays) hybrids for subtropicalregions. Field Crops Res. 2013, 141, 69−76.(19) Rojas-de Gante, C.; Ríos-Licea, J. M.; Tinoco-Perez, B. Methodfor producing biofilms from cereal grains, biofilms obtained saidmethod and use thereof for producing receptacles for containing andpreserving foods. Instituto Tecnologico y de Estudios Superiores deMonterrey. Published on March 2010; WO 2010/024657.(20) Sanchez-Cervantes, M. I.; Lacombe, J.; Muzzio, F. J.; Alvarez, M.M. Novel bioreactor design for the culture of suspended mammaliancells. Part 1: Mixing characterization. Chem. Eng. Sci. 2006, 61, 8075−8084.(21) Bulnes-Abundis, D.; Carrillo-Cocom, L. M.; Araiz-Hernandez,D.; García-Ulloa, A.; Granados-Pastor, M.; Sanchez-Arreola, P. B.;Murugappan, G.; Alvarez, M. M. A simple eccentric stirred tank mini-bioreactor: Mixing characterization and mammalian cell cultureexperiments. Biotechnol. Bioeng. 2013, 110, 1106−1118.(22) Suzuki, K.; Hirayama, E.; Sugiyama, T.; Yasuda, K.; Okabe, H.;Citterio, D. Ionophore-based lithium ion film optode realizing multiplecolor variations utilizing digital color analysis. Anal. Chem. 2002, 74,5766−5773.
Journal of Chemical Education Laboratory Experiment
dx.doi.org/10.1021/ed500150z | J. Chem. Educ. 2014, 91, 1729−17351735