Animation rendering with Population Monte Carlo image-plane sampler
Upload
independentCategory
view
2download
0
CNw
JAL
a
ARRAA
KCCTPP
1
bfnaSpdhstsaaa
0d
Journal of Chromatography A, 1216 (2009) 5783–5792
Contents lists available at ScienceDirect
Journal of Chromatography A
journa l homepage: www.e lsev ier .com/ locate /chroma
onstantly stirred sorbent and continuous flow integrative samplerew integrative samplers for the time weighted averageater monitoring
ulio Llorca, Cristina Gutiérrez, Elisabeth Capilla, Rafael Tortajada, Lorena Sanjuán,licia Fuentes, Ignacio Valor ∗
ABAQUA S.A., Poligono Industrial Las Atalayas, C/Dracma, 16-18 03114 Alicante, Spain
r t i c l e i n f o
rticle history:eceived 1 April 2009eceived in revised form 26 May 2009ccepted 5 June 2009vailable online 10 June 2009
eywords:ontinuous flow integrative sampler (CFIS)onstantly stirred sorbent (CSS)
a b s t r a c t
Two innovative integrative samplers have been developed enabling high sampling rates unaffected byturbulences (thus avoiding the use of performance reference compounds) and with negligible lag timevalues. The first, called the constantly stirred sorbent (CSS) consists of a rotator head that holds thesorbent. The rotation speed given to the head generates a constant turbulence around the sorbent makingit independent of the external hydrodynamics. The second, called the continuous flow integrative sampler(CFIS) consists of a small peristaltic pump which produces a constant flow through a glass cell. The sorbentis located inside this cell. Although different sorbents can be used, poly(dimethylsiloxane) PDMS under thecommercial twister format (typically used for stir bar sorptive extraction) was evaluated for the sampling
ime weighted average (TWA)assive samplingolydimethylsiloxane (PDMS)
of six polycyclic aromatic hydrocarbons and three organochlorine pesticides. These new devices havemany analogies with passive samplers but cannot truly be defined as such since they need a small energysupply of around 0.5 W supplied by a battery. Sampling rates from 181 × 10−3 to 791 × 10−3 L/day wereobtained with CSS and 18 × 10−3 to 53 × 10−3 with CFIS. Limits of detection for these devices are in therange from 0.3 to 544 pg/L with a precision below 20%. An in field evaluation for both devices was carriedout for a 5 days sampling period in the outlet of a waste water treatment plant with comparable results
classi
to those obtained with a. Introduction
Since the introduction of passive sampling in water, which datesack to 1980, when Byrne and Aylott [1] patented a simple deviceor the passive sampling of organic contaminants, a multitude ofew devices and set-ups have been developed, and their maindvantages and disadvantages have been discussed in publications.everal configurations of passive samplers for apolar organic com-ounds have been tested, being the semipermeable membraneevice (SPMD) one of the most developed methods used to sampleydrophobic semi-volatile organic compounds. The SPMD con-ists of a lay-flat polyethylene tubing filled with a thin film ofriolein, a high molecular weight lipid [2]. Other representative pas-
ive samplers are Chemcatcher (apolar organic version) that usesdiffusion-limiting low density polyethylene (LDPE) membranend a C18 Empore disk as a solid receiving phase [3–5], MESCO,bbreviation of both, Membrane Enclosed Sorptive Coating [6] and
∗ Corresponding author. Tel.: +34 96 510 60 70; fax: +34 96 510 60 70.E-mail address: [email protected] (I. Valor).
021-9673/$ – see front matter © 2009 Elsevier B.V. All rights reserved.oi:10.1016/j.chroma.2009.06.012
cal sampling method.© 2009 Elsevier B.V. All rights reserved.
Membrane Enclosed Silicone Collector [7], that uses a glass stir barcoated with polydimetylsiloxane (PDMS) or silicone polymer rodenclosed in a membrane of regenerated cellulose or LDPE, ceramicdosimeter that consists of a porous ceramic membrane (diffusivecontrol) with a suitable adsorbent inside [8] and Sorbisense, a plas-tic housing with the solid sorbent content [9].
However, the range of possibilities for the development of newdevices is relatively restricted by the theoretical principles gov-erning passive sampling. It is clear that the ideal passive samplerwould be one which would allow high sampling rates, and would bealmost unaffected by environmental variables, such as turbulence,and with very low, or even zero lag time. Passive sampling devicestypically consist of a receptor phase that acts as a sink for the com-pounds under study, which is usually totally or partially surroundedby a barrier through which the target substances can permeate ordiffuse [10]. This barrier plays a decisive role. When the membranecreates a barrier enough to avoid the influence of the changes in
flow turbulence, the lag phase becomes high and peak events areignored [7], which is the case of ceramic dosimeter [8]. In the case ofpassive sampling of volatile compounds in air, where the diffusioncoefficients are between two and three orders of magnitude higherthan in water, this is not a problem. The situation being as it is,
5784 J. Llorca et al. / J. Chromatogr. A 1216 (2009) 5783–5792
(2) ba
givTlt
F(
Fig. 1. Scheme and photograph of the CSS device. (1) Motor;
enerally a compromise is accepted in which the barrier thicknesss minimised, thus allowing high sampling rate, and low lag time
alues, but which does not fully prevent the effects of turbulence.hese types of devices, therefore, allow the measurement of lowevels of concentration, while also responding reasonably rapidlyo any concentration peaks in the sample medium.
ig. 2. Scheme and photograph of the CFIS device. (1) Electronic board; (2) lithium batte6) glass sleeve.
ttery; (3) stern tube; (4) stirred head with PDMS twistersTM.
The variation in the uptake kinetics which result from thevariations in turbulence can generate important problems in deter-
mining accurately time weighted average concentrations obtainedfrom sampling rates calculated from tests under laboratory con-ditions. In samplers which are based on sorbents, where theabsorption and the release of compounds are isokinetic processes,ries; (3) mini-peristaltic pump; (4) glass cell with sorbent; (5) stainless steel filter;

togr. A 1216 (2009) 5783–5792 5785
tecwsmiiarc[sw
dtuaasjtmosgfffpst“
fd(wtagicawBp
2
aoaa
fafbabt
J. Llorca et al. / J. Chroma
he problem has been resolved elegantly by using performance ref-rence compounds (PRCs). These are compounds added at a knownoncentration to the sorbent, and which are then released in a wayhich is proportional to the turbulence [2,4,5,9]. In this way the
ampling rate values can be estimated from the loss of the PRCs. Itust be remembered however, that the concentrations calculated
n this way are no longer proportional to the exposure time, butnstead, to the turbulence. For this reason, the term “time weightedverage concentration” should not be used, and should really beeplaced by the more adequate term “flow weighted average (FWA)”oncentration, which is gaining attention in scientific publications9]. The problems of turbulence vs sampling rate are still the mainticking point of passive samplers of polar compounds in general,ith sorbents governed by adsorption principles.
In this study, the development of two new devices for the TWAetermination of apolar compounds is presented. The main objec-ive was to develop a device able to offer high sampling ratesnaffected from turbulences thus allowing to avoid the use of PRCs,nd with negligible lag time values. Two fully immersible devicesre presented in this paper. The first one called constantly stirredorbent (CSS) consists of a rotator head that holds the sorbentointed to a small motor by an axle (Fig. 1). The rotation speed giveno the head generates a constant turbulence around the absorbent
aking it independent by the external hydrodynamics. The secondne called continuous flow integrative sampler (CFIS) consists of amall peristaltic pump which produces a constant flow through alass cell (Fig. 2). The sorbent is located inside this cell. Although dif-erent sorbents can be used, PDMS under the commercial twisterTM
ormat (typically used for stir bar sorptive extraction) was evaluatedor both devices, due to its proven suitability for apolar organic com-ounds [11]. These new devices cannot truly be defined as passiveamplers because they need a small energy supply of around 0.5 Wo operate the rotor and the mini-pump, and can be classified asintegrative samplers”.
In the present paper the main performances of both devicesor the sampling of selected apolar compounds are evaluated andiscussed. Sampling rate values and the integrative time periodt50) were obtained as well as precision and the limit of detectionhich can be obtained after a sampling period of 5 days (which is
he autonomy of the present version of the developed prototypes)nd the analysis of PDMS twistersTM by thermal desorption andas chromatography coupled to a mass spectrometer detector. Ann field evaluation of both prototypes is also presented. The TWAoncentration of selected polycyclic aromatic hydrocarbons (PAHs)nd three organochlorine pesticides (�-HCH, lindane and p,p′-DDE)ere monitored in the effluent of a waste water treatment plant.ecause of the superior behaviour and versatility, CFIS has beenatented (patent application number P200801970).
. Theoretical considerations
Models describing the uptake of organic compounds by anbsorbent directly exposed to a sample matrix have been previ-usly developed for SPMD, where the whole device is extracted [2],nd applied to several passive sampling devices based on differentbsorbents [3,6,8,12].
The mass transfer of an analyte in the sampler includes the dif-usion and interfacial transport steps across the barriers: stagnantqueous boundary layer and the possible biofilm layer and the dif-
usion inside the absorbent medium (Fig. 3). The resistances of eacharrier to the mass transfer of analytes are assumed to be additivend independent [13], and the interfacial resistances are assumed toe negligible compared with diffusional resistances [14]. Accordingo Fick’s first law of diffusion, the rate of transport under steady-Fig. 3. Scheme of the different barriers in analyte transport. ıi represents the effec-tive thickness of each region and the black continuous line represents the evolutionof the concentration.
state conditions can be described by the following equation:
Ms(t) = M0 + (CwKPDMSWVs − M0)[
1 − exp(
− koA
KPDMSWVPDMSt)]
(1)
Ms is the mass of analyte in the PDMS, M0 is the amount of analytein the sampler at the start of the exposure, Cw is the concentrationof analyte in the water bulk, KPDMSW is the PDMS–water partitioncoefficient, VPDMS is the volume of the PDMS receiving phase, A isthe PDMS surface area, ko is the overall mass transfer coefficientand t equals time.
The importance of barrier thickness in resistance to mass trans-fer is more explicit in the expression of the transport resistance,1/ko, which is given by the sum of particular barrier resistances [2].
1ko
= ıw
Dw+ ıb
DbKbw+ ıPDMS
DPDMSKPDMSW(2)
where ı is the particular barrier thickness, D is the diffusion coeffi-cient in the barrier, and K is the partition coefficient between eachpair of barriers (designed as subscripts for the water, “w”, biofilm,“b” and sorbent, “PDMS”.
In the initial uptake period, when the exponential term is verysmall (�1) or Ms/(VsCw) � KPDMSW, chemical uptake is linear orintegrative. Thus Eq. (1) can be reduced to Eq. (3):
Ms(t) = M0 + CwkoAt (3)
Defining the sampling rate Rs = koA, that represents the hypo-thetical volume of aqueous solution cleared of analyte per time,the Eq. (3) can be rewritten as follows:
Ms(t) = M0 + CwRst (4)
The chemical uptake into the sampler remains linear and inte-grative approximately until the passive sampler concentrationfactor (ratio Cs(t)/Cw) reaches half-saturation [2]. When calibrationdata, i.e., Rs and KPDMSW, are available, the following equation canbe used to estimate maximal exposure time in which the passivesampling system accumulates integratively under field conditions:
t50 = ln2KPDMSWVs
Rs(5)
where the term t50 is the first-order half-time of the uptake curve.Under these conditions the concentration of a chemical in the

5786 J. Llorca et al. / J. Chromatogr. A
Table 1Physicochemical properties of selected test analytes.
Compound MW log KOW log KPDMSWc Dw
d
Lindane 290.8 3.8b 3.36 5.4 × 10⁻¹⁰
�-HCH 290.8 3.9b 3.44 5.4 × 10⁻¹⁰
Fluorene 166.2 4.2a 3.68 6.8 × 10⁻¹⁰
Phenanthrene 178.2 4.5a 3.93 6.6 × 10⁻¹⁰
Fluoranthene 202.3 5.1a 4.42 6.3 × 10⁻¹⁰
Chrysene 228.3 5.7a 4.91 5.8 × 10⁻¹⁰
p,p′-DDE 318.0 6.1b 5.24 5.1 × 10⁻¹⁰
Benzo[a]pyrene 252.3 6.2a 5.32 5.5 × 10⁻¹⁰
Benzo[g,h,i]perylene 276.3 6.9a 5.90 5.3 × 10⁻¹⁰
MW: molecular weight, log KOW: octanol–water partition coefficient, log KPDMSW:PDMS–water partition coefficient, Dw: diffusion coefficients in water.
a [15].b
m
oct
3
3
sir2CsaStam
aRafl
3
3
tsrcdmstta(tMaaw(
[16].c [17].d Diffusion coefficient in water (m2/s) from Hayduk–Laudie equation. Compoundolar volume estimated from Schroeder equation.
rganic phase is directly proportional to the product of the con-entration in the surrounding aqueous medium and the exposureime.
. Experimental
.1. Materials and chemicals
In order to study the behaviour of the samplers in function ofolute polarity, a list of priority apolar compounds were selectedn the range from log KOW 3.8 to 6.9 (Table 1). The organochlo-ide pesticides: lindane, �-HCH and p,p′-DDE at a concentration of000 mg/L in methanol were purchased from Supelco (Oakville, ON,anada). The PAHs: fluorene, phenanthrene, fluoranthene, chry-ene were purchased from Dr. Ehrenstorfer (Augsburg, Germany)nd benzo[a]pyrene and benzo[g,h,i]perylene from Fluka (Buchs,witzerland). The purity of all the standards was always higherhan 97%. A working solution containing all studied compounds atconcentration of 500 �g/L in methanol was prepared. HPLC gradeethanol was provided by Merck (Darmstadt, Germany).
Commercial stir bars, TwistersTM (20 mm length × 0.5 mm thicknd 49 �L of PDMS), were purchased from Gerstel (Mülheim a/duhr, Germany). Prior to use, the TwistersTM were conditioned inn empty thermodesorption tube at 300 ◦C for 4 h with a heliumow of 50 mL/min.
.2. Sampler design
.2.1. Constantly stirred sorbent (CSS)This immersible device consists of a motor connected to a bat-
ery inside a cylindrical watertight cover. The motor transmits thetirring movement to a removable head by an axle (Fig. 1). A screwedemovable head is able to hold up to 4 twistersTM. The cylindri-al watertight cover, which is made of stainless steel (AISI 304), isivided into two internal chambers by a fixed wall (of the sameaterial) where the motor is fixed, placing the battery in the other
ide and connecting them through a hole in the wall. Both sides ofhe cover are closed by two stainless steel discs with joints, screwedo the main structure. The axle passes through the watertight coverlong a cylindrical chamber (stern tube), which is made of brassDIN 8513, alloy 414) and filled with Vaseline, to further ensurehere are no water leaks. A Mabuchi RF-330TK motor (Mabuchi
otor Co., Ltd., Chiba, Japan) was used. The motor is fed by a lead-cid battery E 3.2-6 (Enerbat S.A., Madrid, Spain). The system isble to maintain a rotation speed of up to 1000 rpm inside theater during 5 days. The energy consumption of the system is 0.6 W
0.1 A × 6 V).
1216 (2009) 5783–5792
3.2.2. Continuous flow integrative sampler (CFIS)The fully immersible device consists of a small peristaltic pump
(WPX1-P3/32M2-WM4-B, Welco, Japan) powered by three lithiumbatteries (ER34615, 3.6 V, 14.5 Ah, Guangzhou Markyn Battery Co.,Guangzhou, China) connected in parallel, which produces a con-stant flow through a glass cell. An ad hoc electronic circuit board wasdesigned in order to supply a constant voltage to the pump duringthe 5 days autonomy of the system independently from the batterycharge level, thus allowing a constant flow during the deploymenttime. The energy consumption of the system is 0.5 W (0.1 A × 5 V). A2.4 mm I.D. and 1.6 mm wall thickness pharmed tube (ISMATEC S.A.,Glattbrugg, Switzerland) was selected for the peristaltic pump dueto the excellent mechanical resistance which is also a critical aspectto take into account to get a constant flow during the deploymentperiod. As can be seen in Fig. 2 the peristaltic tube is installed downstream from the glass cell to avoid adsorptions of the analytes inthe polymeric tube. All the elements upstream of the glass cell aremade from glass or stainless steel to avoid any adsorption beforethe PDMS sorbent. Once immersed in the sampling point the waterflows downwards inside the glass cell avoiding accumulation of sus-pended solids. Furthermore a 40 mesh cylindrical stainless steelfilter (FEVAL FILTROS, Barcelona, Spain) covered by a glass sleeveallows its application for long sampling periods even in raw watersfrom waste water treatment plants.
3.3. Exposure system
3.3.1. Flow through exposure systemThe flow through system, consist of a 5 L glass exposure tank
with an overflow to waste (Fig. 4). The distilled water and thesolution of test analytes dissolved in methanol are pumped intothe exposure tank separately at known controlled rates. Distilledwater is fed using a peristatic pump (Reglo Analog MS-4/8, ISM827, ISMATEC S.A) at 60 mL/min, allowing the complete renewalof water in the tank approximately every 83 min, and the chemi-cals dissolved in methanol (40 �g/L) at 0.3 mL/min by a HPLC pump(series I, Chrom Tech Inc., Apple Valley, MN, USA). To obtain the per-formance data of the samplers a nominal concentration of 200 ng/Lfor each analyte was maintained in the exposure tank except forthe calculation of the limits of detection as explained later. Prior toeach exposure, the system operated for a minimum of 48 h withoutsampler to allow the stabilization of the water concentration of ana-lytes. To ensure uniform concentration in the samplers, the distilledwater and the chemicals in methanol are fed in the bottom of theexposure tank and are agitated by a magnetic glass bar (Agimatic– ND, JP Selecta S.A., Barcelona, Spain), which makes it possible tosimulate different exposure velocities as well. In order to controlthe real concentration, samples of water (100 mL each) were takenfrom the outlet of the exposure tank at different times and the con-centration of the analytes determined. Similar systems have beenpreviously used in several experiments involving passive samplingdevices, as the flow through system in column [6,11,18–20] and thecarousel device flow through system [4].
3.4. Instrumental analysis
The concentration of the water samples from the exposure tankand the in field campaign were determined using the stir barsorptive extraction method, and the quantification of the analytesaccumulated in the twistersTM in the different experiments eitherwith CSS and CFIS with thermal desorption on line with GC–MS
analysis as described earlier [21–23]. The analyses were performedby thermodesorption-GC–MS using an Agilent 6890 GC – 5973 MSsystem (Agilent Technologies, Palo Alto, CA, USA) equipped witha commercial thermal desorption unit, TDS-2 (Gerstel, Mülheima/d Ruhr, Germany) and connected to a programmed-temperature
J. Llorca et al. / J. Chromatogr. A 1216 (2009) 5783–5792 5787
w thr
vGwawc9
ffiriaptt2iwt
dtu
3
fipl
TMt
C
L�FPFCpBB
n
Fig. 4. Scheme of the flo
aporisation (PTV) injector CIS-4 plus (Gerstel, Mülheim a/d Ruhr,ermany) by a heated transfer line. The TDS-2 plus was equippedith a TDSA autosampler (Gerstel, Mülheim a/d Ruhr, Germany)
ble to handle the program for 20 coated stir bars. The analysesere carried out using an TR-5 MS (Tecknocroma, Barcelona, Spain)
olumn (30 m × 0.25 mm I.D × 0.25 �m film thickness of 5% phenyl-5% polydimethylsiloxane).
After the exposure time, the TwistersTM were removed eitherrom the CSS or the CFIS, gently dried with a paper tissue andnally introduced in glass desorption tubes. Desorption was car-ied out at 280 ◦C during 6 min under a helium flow of 75 mL/minn the splitless mode while maintaining a cryofocussing temper-ture of 20 ◦C in the PTV injector of the GC–MS system. Therogrammable temperature vaporisation system (PTV) was rampedo a final temperature of 280 ◦C and the analytes were transferredo the GC column. The column was programmed for 70 ◦C duringmin, ramped at 30 ◦C/min to 200 ◦C, held for 1 min and finally
ncreased 3 ◦C/min to 280 ◦C and held during 2 min. The analytesere detected by MS using full scan mode (60–400 m/z), analysing
he area of a characteristic ion for each compound for quantification.A programmable auto sampler, Avalanche® Multi-bottle (Tele-
yne ISCO Ind., Lincoln, NE, USA) was used to collect samples fromhe waste water treatment plant (WWTP) during the in field eval-ation of the prototypes (see Section 4.4 for more details).
.5. Data processing
The experimentally determined accumulated time profiles weretted by linear regression analysis using Eq. (3). The adjustablearameters were the intercept (M0) and the slope (CwRs) of the
inear uptake curve Ms = f(t). The sampling rates of the device, Rs
able 2ain performance parameters obtained with CSS (the equations were obtained with
he data from Fig. 7).
ompound t50 (h) Rs (L/day) Equation R2
indane 3 0.557 y = 6.67x − 0.67 0.986a
-HCH 3 0.600 y = 7.5x − 0.42 0.975a
luorene 6 0.640 y = 8.67x − 0.17 0.975a
henanthrene 9 0.682 y = 8.64x − 0.17 0.980b
luoranthene 31 0.791 y = 9.17x − 0.81 0.972c
hrysene 133 0.617 y = 7.77x − 1.33 0.965d
,p′-DDE 344 0.438 y = 5.44x − 1.23 0.979d
enzo[a]pyrene 1529 0.202 y = 2.6x − 1.44 0.976d
enzo[g,h,i]perylene 2144 0.181 y = 2.33x − 1.32 0.976d
= 3 repetitions and 4 twisters each one.a Calculated for t: 1.5 and 3 h.b Calculated for t: 1.5, 3 and 9 h.c Calculated for t: 1.5, 3, 9 and 24 h.d Calculated for t: 1.5, 3, 9, 24, 48, 72 and 96 h.
ough exposure system.
values, for individual test compounds were calculated by dividingthe slope of the linear uptake curve by the mean aqueous analyteconcentration during exposure. For this calculation, data from theaccumulation time profiles were used by only including the expo-sure times below the t50 as specified in Tables 2 and 3. Quality of thefit was characterized by the correlation coefficient. Limits of detec-tion were calculated as the concentration giving a signal to noiseratio (S/N) of 3 from the analysis of the twistersTM exposed at theworking conditions with each sampler at 20 ng/L for the CFIS and2 ng/L for CSS during 96 h. For those compounds outside the lin-ear (integrative) period: lindane, �-HCH, fluorene, phenanthreneand fluoranthene with CSS and lindane, �-HCH and fluorene withCFIS, the highest integrative time was used to calculate the limit ofdetection. Finally, results were expressed for a sampling period of5 days.
4. Results and discussion
4.1. Sampling rates
4.1.1. CSSTo check the rotation effect, a preliminary comparison of the
sampling rates at different rotation speeds (0, 500 and 900 rpm)was carried out for a 3 h exposure time at a nominal concentra-tion of 200 ng/L in the flow through system and room temperature(20 ◦C). As expected (Fig. 5) a huge increase of the sampling rateswere observed with values about 100-fold greater at either 500 rpm
or 900 rpm compared to 0 rpm. The Rs values at 0 rpm rangedfrom 1 × 10⁻³ to 35.1 × 10⁻³ L/day which are similar to the val-ues obtained by MESCO (TwisterTM inside a membrane of LDPE orregenerated cellulose filled by water) that ranged from 2.4 × 10⁻³Table 3Main performance parameters obtained with CFIS (the equations were obtainedwith the data from Fig. 8).
Compound t50 (h) Rs (L/day) Equation R2
Lindane 51 0.032 y = 0.41x − 0.69 0.982a
�-HCH 49 0.038 y = 0.49x − 0.55 0.980a
Fluorene 80 0.050 y = 0.64x − 0.07 0.979b
Phenanthrene 120 0.053 y = 0.48x − 0.99 0.982c
Fluoranthene 519 0.047 y = 0.43x − 0.79 0.976c
Chrysene 2494 0.033 y = 0.303x − 0.59 0.972c
p,p′-DDE 7723 0.020 y = 0.13x − 0.45 0.976c
Benzo[a]pyrene 12859 0.024 y = 0.21x − 0.69 0.976c
Benzo[g,h,i]perylene 21506 0.018 y = 0.15x − 0.49 0.976c
n = 3 repetitions and 4 twisters each one.a Calculated for t: 0, 12, 24 and 48 h.b Calculated for t: 0, 12, 24, 48 and 72 h.c Calculated for t: 0, 12, 24, 48, 72 y 96 h.

5788 J. Llorca et al. / J. Chromatogr. A 1216 (2009) 5783–5792
speed
ttabtr
swcrwttiittuirr
Fig. 5. Comparison of the sampling rates obtained at three rotation
o 23.6 × 10⁻³ L/day [6]. The repeatability of the results from the 4wistersTM in the CSS rotating head was always below 20% as can beppreciated from the error bars in Fig. 5. There was no differenceetween the Rs values for 500 and 900 rpm applying a Student’s-test (p = 0.05). A rotation speed of 900 rpm was selected for theest of the experiments.
Sampling rates were calculated at 900 rpm and different expo-ure times (Fig. 7 and Table 2). The average concentration in theater calibration tank was always within 15% of the nominal con-
entration. High sampling rates values (Table 2) were obtainedanging from 0.18 to 0.79 L/day. Excellent regression coefficientsere obtained in the linear uptake periods with R2 values higher
han 0.98 for all the compounds. Due to the direct exposure ofhe absorbent into the aqueous matrix, the only existing barriers the water stagnant layer on its surface. The high stirring veloc-ty reduces the stagnant layer to a minimum making it possibleo obtain Rs independent from external turbulences. To evaluate
his independence, turbulence inside the calibration tank was sim-lated by stirring the tank to obtain a linear velocity near themmersion point of the CSS of about 0.6 m/s. The average samplingates, at 0 and 0.6 m/s shows independence of flow turbulence at aotary speed of the CSS of 900 rpm in water (Fig. 6). There was no sta-
Fig. 6. Comparison of the sampling rates obtained at two linear velocitie
s with CSS. Exposure time 3 h (average results from the 4 twisters).
tistical differences between Rs at 0 and 0.6 m/s when a Student’s testwas applied (p = 0.05). The sampling rate of CSS remains constantand independent from hydrodynamic changes in the media.
4.1.2. CFISAs can be seen in Table 3, sampling rates obtained with CFIS
are about 10 times smaller than the ones obtained with CSS rang-ing from 18 × 10−3 for benzo[g,h,i]perylene to 53 × 10−3 L/day forfluoranthene. Excellent regression coefficients were obtained inthe linear uptake periods with R2 values higher than 0.98 for allthe compounds. These lower Rs results were expected taking intoaccount that the turbulence inside the glass cell containing thetwistersTM is much lower than the corresponding turbulence in theCSS. An estimation from the release mass of each compound overtime obtained from preloaded twisters in CFIS, allowed the estima-tion of a water boundary layer thickness, ıw, of about 400–500 �m.It is reasonable to think that a ıw value around ten times smaller
could be expected in the well agitated CSS. Because in this samplerthe sorbent is inside a closed system with controlled conditions interms of turbulence, which is maintained at a constant water flowof 9 mL/min, the independence of the Rs values with the externalturbulence variations is ensured.s with CSS. Exposure time 3 h (average results from the 4 twisters).

J. Llorca et al. / J. Chromatogr. A 1216 (2009) 5783–5792 5789
for th
tittc
sdftdststfsahosmmb
4
4
t
Fig. 7. Accumulation time profiles
According to the theory the resistance of the mass transfer fromhe water to the PDMS sorbent is controlled by Eq. (2). Nevertheless,n the case of CSS and CFIS the biofilm formation is negligible dueo the fact that the continuous flow around the sorbent preventshe accumulation in the surface of the twisterTM. In this case Eq. (2)an be reduced to Eq. (6)
1ko
= ıw
Dw+ ıPDMS
DPDMSKPDMSW(6)
Nevertheless, taking into account that diffusion in PDMS for thetudied compounds are in the range of 10−11 m2/s according to theata published for some PAHs by Rusina et al. [24], KPDMSW values
rom Table 1 and a ıPDMS of 0.5 mm (the PDMS film thickness inhe twisterTM), the main contribution in the mass transfer is theiffusion of the compounds in the water boundary layer ıw. Con-idering the estimated ıw for CSS and CFIS described before, andhe Dw of the studied compounds listed in Table 1, sampling rateshould decrease with the increase of KPDMSW by a factor not higherhan 1.5 for the range of compounds in this work. The Rs resultsor CSS and CFIS are not far from the predicted from theory butome Rs results such us p,p′-DDE with CFIS and benzo[a]pyrenend benzo[g,h,i]perylene with both CSS and CFIS differ from theighest sampling rates more than this factor expected from the-ry. It should be, nevertheless, considered that the model is veryensitive to the KPDMS input data that are particularly difficult toeasure for the most apolar compounds [25–29]. Furthermore, aore in depth study of release data of preloaded twistersTM has to
e carried out for a more precise calculation of ıw.
.2. Linear integrative period (t50)
.2.1. CSSAs can be seen from the accumulation time profiles in Fig. 7a,
he equilibrium for lindane, �-HCH, fluorene and phenanthrene,
e different compounds with CSS.
is reached before 30 h. For fluoranthene, chrysene, p,p′-DDE,benzo[a]pyrene and benzo[g,h,i]perylene (Fig. 7b) the equilibriumwas not observed at the maximum exposure time studied of 96 h.These profiles are in perfect agreement with the t50 calculated withEq. (5) from the experimental sampling rates presented in Table 2.As can be seen for lindane, �-HCH, and fluorene the t50 values arebelow 5 h, and below 9 and 31 h for phenanthrene and fluoran-thene, respectively. Finally, for chrysene, p,p′-DDE, benzo[a]pyreneand benzo[g,h,i]perylene t50 are higher than 100 h, again in agree-ment with the obtained accumulation time profiles. These resultslimit the applicability of CSS (at least in the present format) to com-pounds with log KPDMSW higher than 4.9 for sampling periods of 5days for which this prototype was designed. TwistersTM of 1 mmPDMS thickness (instead of 0.5 mm used in this work) will increaseby a factor of two the t50 which is still not enough. Other sorbentformats such as PDMS rods can be also used with higher volume tosurface ratios. Nevertheless, thicknesses higher than 1 mm will gen-erate no quantitative thermal desorptions, limiting the applicationto solvent extraction for the subsequent analysis by GC.
4.2.2. CFISThe accumulation time profiles for all the studied compounds
(Fig. 8) show that only for lindane and �-HCH, equilibrium isreached before 96 h. As well as with CFIS these profiles agree withthe t50 calculated from the Rs results. In fact, lindane and �-HCHpresent a t50 of 51 and 49 h respectively, 80 h for fluorene andmore than 120 h for the rest of compounds. This increases therange of compounds which can be sampled integratively for peri-ods higher than 5 days with CFIS; in particular compounds with
log KPDMSW > 3.9. In fact, PDMS has itself a limitation for compoundswith KPDMSW values below 4 if we take into account that if such com-pounds are sampled at the beginning of the exposure period, theycould be released back to the water because of the relatively smallpartition coefficient, thus resulting in inaccurate TWA results.
5790 J. Llorca et al. / J. Chromatogr. A 1216 (2009) 5783–5792
for th
t2attbcs
4
daipbRttwtD2iwptD
on and off cycles in the peristaltic pump. This will permit enlargingconsiderably the sampling periods up to 3–4 weeks with the sameenergy supply and probably with only a small decrease in the Rs
values.
Table 4LOD calculated for CSS and CFIS.
Compound CSS (pg/L)a CFIS (pg/L)a
Lindane 3.6 63�-HCH 5.7 91Fluorene 1.6 20Phenanthrene 1.2 15Fluoranthene 0.3 4.0
Fig. 8. Accumulation time profiles
For both devices the repeatability of the 12 results obtained fromhe three repetitions and 4 twistersTM each one, was always below0% (RSD) as can be appreciated from the error bars in Fig. 8. Theverage RSD values were 12% for CSS and 11% for CFIS. The intersec-ion with the x-axis was near zero as expected, taking into accounthat no lag time should be considered for CSS and CFIS devicesecause no membrane is present. This makes both samplers appli-able to measure instantly episodic concentration events during theampling period.
.3. Limits of detection (LODs)
The increase in Rs values implies for the same sampling period aecrease in the limits of detection. Limits of detection expressed forn exposure period of 5 days after thermal desorption and GC–MSn the SIM mode ranged from 0.3 for fluoranthene to 64 pg/L for,p′-DDE with CSS and from 4 for fluoranthene to 544 pg/L forenzo[g,h,i]perylene with CFIS (Table 4). This is as expected froms values a factor of about 10 times smaller with CSS, giving inhis point a better performance compared to CFIS device. Never-heless, the limits of detection for CFIS are sufficient to complyith even the more restrictive legislations such as the environmen-
al quality standards, EQS [29] imposed by the Water Frameworkirective (WFD) 2000/60/CE [30] that has established an EQS ofng/L as annual average for the sum of benzo[g,h,i]perylene and
ndene[1,2,3-cd]pyrene for surface waters (care should be takenhen interpreting results obtained with samplers, like the ones
resented here, collecting exclusively the dissolved fraction and nothe total concentration of water like stated in the referred WFD).espite this, an improvement in the LODs for CFIS is quite easy to
e different compounds with CFIS.
be obtained via different strategies. The first one would be sim-ply changing the geometry of the PDMS sorbent. This is currentlybeing evaluated in our laboratory by using 5 cm PDMS tubes and1 mm wall thickness replacing the glass cell with the twistersTM. Inthis sense many possibilities are available and one should not onlytake into account the surface to volume PDMS ratios in order toobtain the desired LODs but also the adequate t50 values. Anotherinteresting possibility which is also being considered for the futureimprovements of this prototype is the increase of the autonomy ofthe CFIS device which will allow sampling periods higher than 5days thus improving sensitivity as well as versatility. An interest-ing possibility under study is the implementation of intermittent
Chrysene 0.6 12p,p′-DDE 64 144Benzo[a]pyrene 23 200Benzo[g,h,i]perylene 54 544
a LOD calculated for 5 days sampling period.
J. Llorca et al. / J. Chromatogr. A
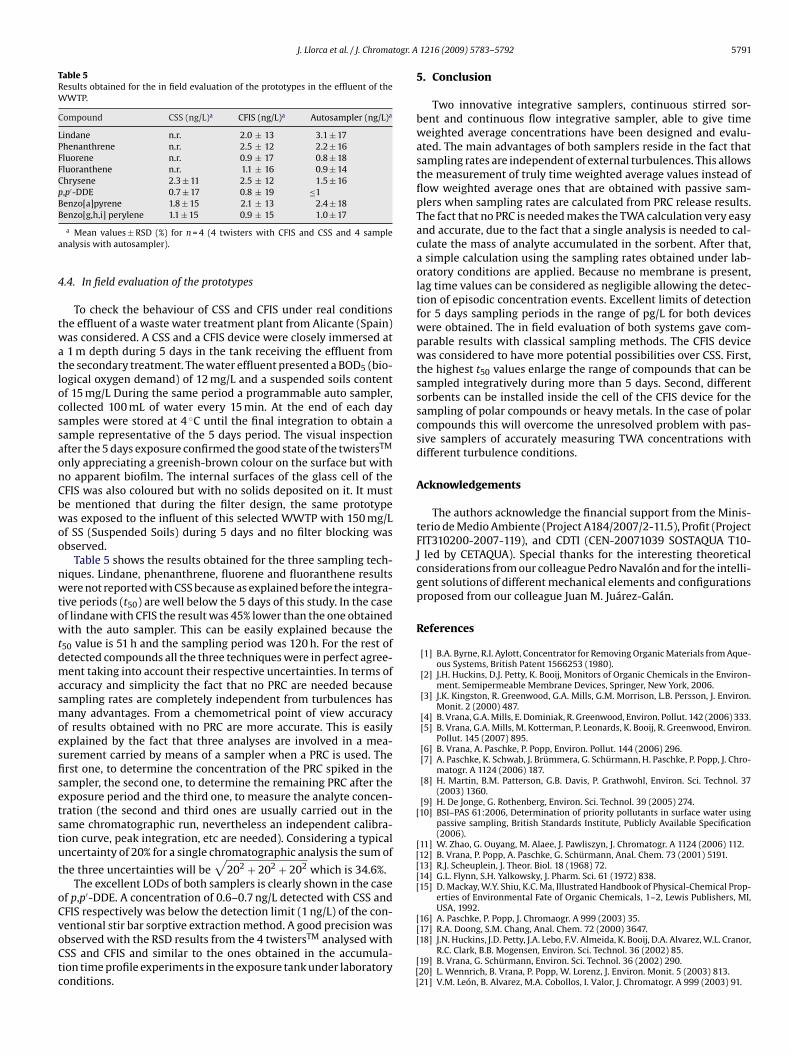
Table 5Results obtained for the in field evaluation of the prototypes in the effluent of theWWTP.
Compound CSS (ng/L)a CFIS (ng/L)a Autosampler (ng/L)a
Lindane n.r. 2.0 ± 13 3.1 ± 17Phenanthrene n.r. 2.5 ± 12 2.2 ± 16Fluorene n.r. 0.9 ± 17 0.8 ± 18Fluoranthene n.r. 1.1 ± 16 0.9 ± 14Chrysene 2.3 ± 11 2.5 ± 12 1.5 ± 16p,p′-DDE 0.7 ± 17 0.8 ± 19 ≤1Benzo[a]pyrene 1.8 ± 15 2.1 ± 13 2.4 ± 18B
a
4
twatlocssaonCbwoo
nwtowtdmasmoesfisetstu
t
oCvoCtc
[
[[[[
[
enzo[g,h,i] perylene 1.1 ± 15 0.9 ± 15 1.0 ± 17
a Mean values ± RSD (%) for n = 4 (4 twisters with CFIS and CSS and 4 samplenalysis with autosampler).
.4. In field evaluation of the prototypes
To check the behaviour of CSS and CFIS under real conditionshe effluent of a waste water treatment plant from Alicante (Spain)as considered. A CSS and a CFIS device were closely immersed at1 m depth during 5 days in the tank receiving the effluent from
he secondary treatment. The water effluent presented a BOD5 (bio-ogical oxygen demand) of 12 mg/L and a suspended soils contentf 15 mg/L During the same period a programmable auto sampler,ollected 100 mL of water every 15 min. At the end of each dayamples were stored at 4 ◦C until the final integration to obtain aample representative of the 5 days period. The visual inspectionfter the 5 days exposure confirmed the good state of the twistersTM
nly appreciating a greenish-brown colour on the surface but witho apparent biofilm. The internal surfaces of the glass cell of theFIS was also coloured but with no solids deposited on it. It muste mentioned that during the filter design, the same prototypeas exposed to the influent of this selected WWTP with 150 mg/L
f SS (Suspended Soils) during 5 days and no filter blocking wasbserved.
Table 5 shows the results obtained for the three sampling tech-iques. Lindane, phenanthrene, fluorene and fluoranthene resultsere not reported with CSS because as explained before the integra-
ive periods (t50) are well below the 5 days of this study. In the casef lindane with CFIS the result was 45% lower than the one obtainedith the auto sampler. This can be easily explained because the
50 value is 51 h and the sampling period was 120 h. For the rest ofetected compounds all the three techniques were in perfect agree-ent taking into account their respective uncertainties. In terms of
ccuracy and simplicity the fact that no PRC are needed becauseampling rates are completely independent from turbulences hasany advantages. From a chemometrical point of view accuracy
f results obtained with no PRC are more accurate. This is easilyxplained by the fact that three analyses are involved in a mea-urement carried by means of a sampler when a PRC is used. Therst one, to determine the concentration of the PRC spiked in theampler, the second one, to determine the remaining PRC after thexposure period and the third one, to measure the analyte concen-ration (the second and third ones are usually carried out in theame chromatographic run, nevertheless an independent calibra-ion curve, peak integration, etc are needed). Considering a typicalncertainty of 20% for a single chromatographic analysis the sum of
he three uncertainties will be√
202 + 202 + 202 which is 34.6%.The excellent LODs of both samplers is clearly shown in the case
f p,p′-DDE. A concentration of 0.6–0.7 ng/L detected with CSS andFIS respectively was below the detection limit (1 ng/L) of the con-entional stir bar sorptive extraction method. A good precision was
bserved with the RSD results from the 4 twistersTM analysed withSS and CFIS and similar to the ones obtained in the accumula-ion time profile experiments in the exposure tank under laboratoryonditions.[
[[[
1216 (2009) 5783–5792 5791
5. Conclusion
Two innovative integrative samplers, continuous stirred sor-bent and continuous flow integrative sampler, able to give timeweighted average concentrations have been designed and evalu-ated. The main advantages of both samplers reside in the fact thatsampling rates are independent of external turbulences. This allowsthe measurement of truly time weighted average values instead offlow weighted average ones that are obtained with passive sam-plers when sampling rates are calculated from PRC release results.The fact that no PRC is needed makes the TWA calculation very easyand accurate, due to the fact that a single analysis is needed to cal-culate the mass of analyte accumulated in the sorbent. After that,a simple calculation using the sampling rates obtained under lab-oratory conditions are applied. Because no membrane is present,lag time values can be considered as negligible allowing the detec-tion of episodic concentration events. Excellent limits of detectionfor 5 days sampling periods in the range of pg/L for both deviceswere obtained. The in field evaluation of both systems gave com-parable results with classical sampling methods. The CFIS devicewas considered to have more potential possibilities over CSS. First,the highest t50 values enlarge the range of compounds that can besampled integratively during more than 5 days. Second, differentsorbents can be installed inside the cell of the CFIS device for thesampling of polar compounds or heavy metals. In the case of polarcompounds this will overcome the unresolved problem with pas-sive samplers of accurately measuring TWA concentrations withdifferent turbulence conditions.
Acknowledgements
The authors acknowledge the financial support from the Minis-terio de Medio Ambiente (Project A184/2007/2-11.5), Profit (ProjectFIT310200-2007-119), and CDTI (CEN-20071039 SOSTAQUA T10-J led by CETAQUA). Special thanks for the interesting theoreticalconsiderations from our colleague Pedro Navalón and for the intelli-gent solutions of different mechanical elements and configurationsproposed from our colleague Juan M. Juárez-Galán.
References
[1] B.A. Byrne, R.I. Aylott, Concentrator for Removing Organic Materials from Aque-ous Systems, British Patent 1566253 (1980).
[2] J.H. Huckins, D.J. Petty, K. Booij, Monitors of Organic Chemicals in the Environ-ment. Semipermeable Membrane Devices, Springer, New York, 2006.
[3] J.K. Kingston, R. Greenwood, G.A. Mills, G.M. Morrison, L.B. Persson, J. Environ.Monit. 2 (2000) 487.
[4] B. Vrana, G.A. Mills, E. Dominiak, R. Greenwood, Environ. Pollut. 142 (2006) 333.[5] B. Vrana, G.A. Mills, M. Kotterman, P. Leonards, K. Booij, R. Greenwood, Environ.
Pollut. 145 (2007) 895.[6] B. Vrana, A. Paschke, P. Popp, Environ. Pollut. 144 (2006) 296.[7] A. Paschke, K. Schwab, J. Brümmera, G. Schürmann, H. Paschke, P. Popp, J. Chro-
matogr. A 1124 (2006) 187.[8] H. Martin, B.M. Patterson, G.B. Davis, P. Grathwohl, Environ. Sci. Technol. 37
(2003) 1360.[9] H. De Jonge, G. Rothenberg, Environ. Sci. Technol. 39 (2005) 274.10] BSI–PAS 61:2006, Determination of priority pollutants in surface water using
passive sampling, British Standards Institute, Publicly Available Specification(2006).
[11] W. Zhao, G. Ouyang, M. Alaee, J. Pawliszyn, J. Chromatogr. A 1124 (2006) 112.12] B. Vrana, P. Popp, A. Paschke, G. Schürmann, Anal. Chem. 73 (2001) 5191.13] R.J. Scheuplein, J. Theor. Biol. 18 (1968) 72.14] G.L. Flynn, S.H. Yalkowsky, J. Pharm. Sci. 61 (1972) 838.15] D. Mackay, W.Y. Shiu, K.C. Ma, Illustrated Handbook of Physical-Chemical Prop-
erties of Environmental Fate of Organic Chemicals, 1–2, Lewis Publishers, MI,USA, 1992.
16] A. Paschke, P. Popp, J. Chromaogr. A 999 (2003) 35.
[17] R.A. Doong, S.M. Chang, Anal. Chem. 72 (2000) 3647.18] J.N. Huckins, J.D. Petty, J.A. Lebo, F.V. Almeida, K. Booij, D.A. Alvarez, W.L. Cranor,R.C. Clark, B.B. Mogensen, Environ. Sci. Technol. 36 (2002) 85.19] B. Vrana, G. Schürmann, Environ. Sci. Technol. 36 (2002) 290.20] L. Wennrich, B. Vrana, P. Popp, W. Lorenz, J. Environ. Monit. 5 (2003) 813.21] V.M. León, B. Alvarez, M.A. Cobollos, I. Valor, J. Chromatogr. A 999 (2003) 91.

5 togr. A
[
[
[
[[[[
[
83/513/EEC, 84/156/EEC, 84/491/EEC, 86/280/EEC and amending Directive2000/60/EC of the European Parliament and of the Council Official J. Eur. Union.
792 J. Llorca et al. / J. Chroma
22] V.M. Leon, J. Llorca-Porcel, B. Alvarez, M.A. Cobollos, S. Munoz, I. Valor, Anal.Chim. Acta 558 (2006) 261.
23] J. Llorca-Porcel, G. Martínez-Sánchez, B. Alvarez, M.A. Cobollos, I. Valor, Anal.Chim. Acta 569 (2006) 113.
24] T.P. Rusina, F. Smedes, J. Klanova, K. Booij, I. Holoubek, Chemosphere 68 (2007)
1344.25] Z. Yang, D. Greenstein, E.Y. Zeng, K.A. Maruya, J. Chromatogr. A 1148 (2007) 23.26] J. Kwon, T. Wuethrich, P. Mayer, B.I. Escher, Anal. Chem. 79 (2007) 6816.27] T.L. ter Laak, F.J.M. Brusser, J.L.M. Hermens, Anal. Chem. 80 (2008) 3859.28] K. Yates, I. Davies, L. Webster, P. Pollard, L. Lawton, C. Moffat, J. Environ. Monit.
9 (2007) 1116.
[
1216 (2009) 5783–5792
29] Directive 2008/105/EC of the European Parliament and of the Council of 16December 2008, on environmental quality standards in the field of waterpolicy, amending and subsequently repealing Council Directives 82/176/EEC,
L 348/84, 24.12.2008.30] Directive 2000/60/EC of the European Parliament and of the Council of 23 Octo-
ber 2000 establishing a Framework for Community action in the field of waterpolicy, The European Parliament and Council, L327/1 (2000) 72.
Copyright © 2022 FDOKUMEN