
unit-1-sampler-inspire-chemistry.pdf - McGraw Hill
176
C he m istry Student Edition
-
Upload
khangminh22 -
Category
Documents
-
view
0 -
download
0
Transcript of unit-1-sampler-inspire-chemistry.pdf - McGraw Hill

Chemistry
Student Edition

000i_Chem_NA_S_FM_TP_138115.indd 07/01/19 07:31PM
Chemistry
Program: HSS_NA Component: TPPDF Pass
Vendor: Lumina Chapter: Chemistry FM

McGraw-Hill is committed to providing instructional materials in Science, Technology, Engineering, and Mathematics (STEM) that give all students a solid foundation, one that prepares them for college and careers in the 21st century.
Copyright © 2020 McGraw-Hill Education
All rights reserved. No part of this publication may be reproduced or distributed in any form or by any means, or stored in a database or retrieval system, without the prior written consent of McGraw-Hill Education, including, but not limited to, network storage or transmission, or broadcast for distance learning.
Send all inquiries to:McGraw-Hill EducationSTEM Learning Solutions Center8787 Orion PlaceColumbus, OH 43240
ISBN: 978-0-02-138115-9MHID: 0-02-138115-1
Printed in the United States of America.
5 6 7 8 9 10 11 QVS 24 23 22 21 20 19
mheducation.com/prek-12
COVER: SupernanPhoto/iStock/Getty Images BACK COVER: SupernanPhoto/iStock/Getty Images
Program: HSS_NA Component: CopyrightPDF Pass
Vendor: Aptara Chapter: Chemistry FM
Phenomenon: Chemical ReactionsThin strands of steel wool, which is made mostly of iron, react with oxygen to form iron(III) oxide, releasing energy as heat and light. The reaction, and therefore the glow, intensifies as the steel wool is spun in the air.
CAUTION: Burning steel wool gets extremely hot. Do not try this at home.
Rusting is a slow reaction between iron and oxygen that also forms iron(III) oxide.
Fun Fact
ii-CHEM_NA_S_FM_CP-MP_138115.indd 2 04/10/19 2:53 AM

Explore Our Phenomenal World
Welcome to
iii
Cop
yrig
ht ©
McG
raw
-Hill
Edu
cati
on
The Inspire High School Series brings phenomena to the forefront of learning to engage and inspire students to investigate key science concepts through their three-dimensional learning experience.
Start exploring now!
Inspire Curiosity • Inspire Investigation • Inspire Innovation
Program: HSS_NA Component: MarketingPDF Pass
Vendor: Lumina Chapter: Chemistry FM
iii-v_CHEM_NA_S_FM_MP_138115.indd 05/01/19 04:20AM

iv
Phot
o cr
edit
her
e©
fitop
ardo
.com
/Mom
ent O
pen/
Get
ty Im
ages
Program: HSS_NA Component: UOPDF Pass
Vendor: Lumina Chapter: 02
Program: HSS_NA Component: UOPDF Pass
Vendor: Lumina Chapter: 02
0044-0045_CHEM_CA_S_CH02_UO_674695.indd 03/01/19 11:37AM 0044-0045_CHEM_CA_S_CH02_UO_674695.indd 03/01/19 11:37AM
Look for EvidenceAs you go through this unit, use the information and your experiences to help you answer the phenomenon question as well as your own questions. For each activity, record your observations in a Summary Table, add an explanation, and identify how it connects to the unit and module phenomenon questions.
Solve a ProblemSTEM UNIT PROJECT
Optimize Battery Chemistry Investigate a real-world application of chemical reactions: batteries. Propose a way to optimize their potential and maximize electrical output.
GO ONLINE In addition to reading the information in your Student Edition, you can find the STEM Unit Project and other useful resources online.
Ask QuestionsWhat questions do you have about the phenomenon? Write your questions on sticky notes and add them to the driving question board for this unit.
UNIT 1STRUCTURE AND PROPERTIES OF MATTER
ENCOUNTER THE PHENOMENON
How do fireworks get their colors?
How muchdo bubblesweigh?
Unit 1 • Structure and Properties of Matter 45
MODULE 3THE STRUCTURE OF THE ATOM
ENCOUNTER THE PHENOMENON
What is matter made of?
GO ONLINE to play a video about the size of an atom.
Ask QuestionsDo you have other questions about the phenomenon? If so, add them to the driving question board.
CER Claim, Evidence, ReasoningMake Your Claim Use your CER chart to make a claim about what matter is made of.
Collect Evidence Use the lessons in this module to collect evidence to support your claim. Record your evidence as you move through the module.
Explain Your Reasoning You will revisit your claim and explain your reasoning at the end of the module.
GO ONLINE to access your CER chart and explore resources that can help you collect evidence.
LESSON 2: Explore & Explain: The Modern Model of the Atom
LESSON 1: Explore & Explain: Origins of Atomic Theory
Additional Resources
0077-0077_CHEM_NA_S_CH03_Investigate_Phenom_138115.indd 30/04/19 08:41PM
(l t
o r,
t to
b)V
ideo
Sup
plie
d by
BB
C W
orld
wid
e Le
arni
ng; W
eepi
ng W
illow
Pho
togr
aphy
/Mom
ent/
Get
ty Im
ages
; McG
raw
-Hill
Edu
cati
on; T
inke
Ham
min
g/In
gram
Pub
lishi
ng; M
cGra
w-H
ill E
duca
tion
Module 3 • Encounter the Phenomenon 77
Program: HSS_NA Component: IPPDF Pass
Vendor: Lumina Chapter: 03
0076-0076_CHEM_NA_S_CH03_MO_138115.indd 30/04/19 09:35PM
Mon
ty R
akus
en/C
ultu
ra/G
etty
Imag
es
76 Module 3 • The Structure of the Atom
Program: HSS_CA Component: COPDF PASS
Vendor: Lumina Chapter: 03
Owning Your Learning
WELCOME TO INSPIRE CHEMISTRY
1 Encounter the PhenomenonEvery day, you are surrounded by natural phenomena that make you wonder.
2 Ask QuestionsAt the beginning of each unit and module, make a list of the questions you have about the phenomenon. Share your questions with your classmates.
How do fireworks get their colors?
What is matter made of?
How do we know what stars are
made of?
What can we learn from the periodic table?
Why is this volcano spewing bright blue
flames?
Why are some
flames colorful?What do atoms
look like?What is light
made of?
Have we already dis-
covered all the elements?
Module Opener
Phenomenon Video
Unit Opener
Are we made
of atoms?
(t)V
ideo
Sup
plie
d by
BB
C W
orld
wid
e Le
arni
ng, (
b)m
oi/a
man
aim
ages
RF/
Get
ty Im
ages
iii-v_CHEM_NA_S_FM_MP_138115.indd 30/04/19 09:50PM iii-v_CHEM_NA_S_FM_MP_138115.indd
Program: HSS_NA Component: MarketingPDF Pass
Vendor: Aptara Chapter: Chemistry FM

v
Cop
yrig
ht ©
McG
raw
-Hill
Edu
cati
on
3 Claim, Evidence, ReasoningAs you investigate each phenomenon, you will write your claim, gather evidence by performing labs and completing reading assignments and Applying Practices, and explain your reasoning to answer the unit and module phenomena.
4 Summarize Your WorkWhen you collect evidence, you can record your data in a summary table and use the data to collaborate with others to answer the questions you had.
5 Apply Your Evidence and ReasoningAt the end of the unit, modules, and lessons, you can use all of the data you collected to help complete your STEM Unit Project.
SUMMARY TABLEActivity Model
Observation Evidence
Explanation Reasoning
Connection to Phenom
Questions Answered
New Questions
Applying Practices: Is light a wave or a particle?
Light has both wavelike and particlelike properties.
Light is made up of bundles of energy called photons.
Unit: Firework colors are a result of the photons emitted by different elements.
Module: Astronomers use light to determine the composition of the stars.
Why do elements emit photons?
Chemistry STEM Unit 3 ProjectOcean Acidification PreventionTeacher Project Materials
NGSS Standards: HS-ESS1-6, HS-ESS2-7, HS-ESS3-4, HS-ESS3-5, HS-ESS3-6
Preparation: This STEM unit project is mainly a research project that students can complete in small groups. Ocean acidification is a critical issue, especially in areas with bays and estuaries that are particular-ly vulnerable to ocean acidification. The following can be found to be contributing to the causes of ocean acidification:
• Agricultural source runoff • Sulfur dioxide • Sewage treatment discharge • Nitrogen dioxide • Stormwater discharge • Public pollution • Energy production emissions
Prior to the start of the activity, review the following key concepts: • Respiration • Chemical equilibrium • Calcium • Human impact on natural systems • Acids and bases
Key Question:What can be done to mitigate the causes and effects of ocean acidification? As students develop solutions to the problem, they should consider impacts and consequences. Encourage students to use a graphic organizer such as a web to capture and describe all of the po-tential consequences of their recommended action. For the entire research and develop portions of the project, students will need a total of approximately 360 minutes.
What is light made of?
MODULE 3THE STRUCTURE OF THE ATOM
ENCOUNTER THE PHENOMENON
What is matter made of?
GO ONLINE to play a video about the size of an atom.
Ask QuestionsDo you have other questions about the phenomenon? If so, add them to the driving question board.
CER Claim, Evidence, ReasoningMake Your Claim Use your CER chart to make a claim about what matter is made of.
Collect Evidence Use the lessons in this module to collect evidence to support your claim. Record your evidence as you move through the module.
Explain Your Reasoning You will revisit your claim and explain your reasoning at the end of the module.
GO ONLINE to access your CER chart and explore resources that can help you collect evidence.
LESSON 2: Explore & Explain: The Modern Model of the Atom
LESSON 1: Explore & Explain: Origins of Atomic Theory
Additional Resources
0077-0077_CHEM_NA_S_CH03_Investigate_Phenom_138115.indd 30/04/19 08:41PM
(l t
o r,
t to
b)V
ideo
Sup
plie
d by
BB
C W
orld
wid
e Le
arni
ng; W
eepi
ng W
illow
Pho
togr
aphy
/Mom
ent/
Get
ty Im
ages
; McG
raw
-Hill
Edu
cati
on; T
inke
Ham
min
g/In
gram
Pub
lishi
ng; M
cGra
w-H
ill E
duca
tion
Module 3 • Encounter the Phenomenon 77
Program: HSS_NA Component: IPPDF Pass
Vendor: Lumina Chapter: 03
03/05/19 01:43PM iii-v_CHEM_NA_S_FM_MP_138115.indd 03/05/19 01:43PM
Program: HSS_NA Component: MarketingPDF Pass
Vendor: Aptara Chapter: Chemistry FM

Program: HSS_NA Component: ChemistryPDF Pass
Vendor: Lumina Chapter: FM
vi Advisors and Consultants
00vi-viii_CHEM_NA_S_FM_Authors_Contrib_138115.indd 18/12/18 12:55PM
Alton J. Banks, PhD Professor of Chemistry North Carolina State University Raleigh, NC Howard Drossman, PhD Professor of Chemistry and Environmental Science Colorado College Colorado Springs, CO
Michael O. Hurst, Sr., PhD Associate Professor of Chemistry Georgia Southern University Statesboro, GAKristen Kulinowski, PhD Faculty Fellow, Department of Chemistry Rice University Houston, TX
Maria Pacheco, PhD Associate Professor of Chemistry Buffalo State College Buffalo, NY
Peter Carpico Louisville, OHJennifer Gonya Galena, OHCindy Klevickis Elkton, VA
Jack Minot Columbus, OHRichard G. Smith Ocean Isle Beach, NCStephen Whitt Columbus, OH
Jenipher Willoughby Forest, VAMargaret K. Zorn Yorktown, VA
Kenneth R. Roy, PhD Director of Environmental Health and Safety Glastonbury Public Schools Glastonbury, CT
Content Consultants Content consultants each reviewed selected chapters of Inspire Chemistry for content accuracy and clarity.
Safety ConsultantThe safety consultant reviewed labs and lab materials for safety and implementation.
Contributing WritersAdditional science writers added feature content, teacher materials, assessment, and laboratory investigations.
ADVISORS AND CONSULTANTS
Teacher Advisory Board The Teacher Advisory Board gave the editorial staff and design team feedback on the content and design of both the Student Edition and Teacher Edition. We thank these teachers for their hard work and creative suggestions.Ann CooperScience TeacherUnited Local SchoolsHanoverton, OHDavid L. FrenchChemistry TeacherMilford High SchoolMilford, OHRichard GlinkChemistry/Physics TeacherIndian Lake High SchoolLewistown, OH
Susan GodezChemistry/Physics TeacherGrandview Heights High SchoolColumbus, OHJudith JohnstonScience Teacher, Department ChairWilmington High SchoolWilmington, OHChristine LewisScience TeacherMartins Ferry High SchoolMartins Ferry, OH
Jennifer L. MostChemistry Teacher,Science Department ChairWest Holmes High SchoolMillersburg, OHSandra Petrie-ForgeyNational Board Certified Science TeacherGallia Academy High SchoolGallipolis, OH
Jason J. ZarosChemistry/Physics TeacherWaterford High SchoolWaterford, OH

Program: HSS_NA Component: ChemistryPDF Pass
Vendor: Lumina Chapter: FM
Key Partners vii
00vi-viii_CHEM_NA_S_FM_Authors_Contrib_138115.indd 18/12/18 12:55PM
KEY PARTNERS
SmithsonianFollowing the mission of its founder James Smithson for “an establishment for the increase and diffusion of knowledge,” the Smithsonian Institution today is the world’s largest museum, education, and research complex. To further their vision of shaping the future, a wealth of Smithsonian online resources are integrated within this program.
SpongeLab InteractivesSpongeLab Interactives is a learning technology company that inspires learning and engagement by creating gamified environments that encourage students to interact with digital learning experiences.
Students participate in inquiry activities and problem-solving to explore a variety of topics using games, interactives, and video while teachers take advantage of formative, summative, or performance-based assessment information that is gathered through the learning management system.
PhET Interactive SimulationsThe PhET Interactive Simulations project at the University of Colorado Boulder pro-vides teachers and students with interactive science and math simulations. Based on extensive education research, PhET sims engage students through an intuitive, game-like environment where students learn through exploration and discovery.

viii About the Authors
Program: HSS_NA Component: ChemistryPDF Pass
Vendor: Lumina Chapter: FM
00vi-viii_CHEM_NA_S_FM_Authors_Contrib_138115.indd 18/12/18 12:55PM00vi-viii_CHEM_NA_S_FM_Authors_Contrib_138115.indd 18/12/18 12:55PM
Thandi Buthelezi Thandi is Associate Professor of Chemistry and Chemistry Department Chair at Wheaton College, Norton, MA. She earned her BA in Chemistry from Williams College, Williamstown, MA, and PhD in Experimental Physical Chemistry from the University of Florida, Gainesville, FL. Dr. Buthelezi has taught Chemistry at the under-graduate and graduate (master’s) level. She was the co-founder and co-director of the Girls in Science Outreach Program at Western Kentucky University. She is a member of the American Chemical Society, the American Association for the Advancement of Science, and Sigma Xi.
Laurel Dingrando Laurel is currently serving as the Secondary Science Coordinator for the Garland Independent School District. Mrs. Dingrando has a BS in Microbiology with a minor in Chemistry from Texas Tech University and an MAT in Science from the University of Texas at Dallas. She taught Chemistry for 35 years in the Garland Independent School District. She is a member of the American Chemical Society, National Science Teachers Association, Science Teachers Association of Texas, Texas Science Educators Leadership Association, and T3 (Teachers Teaching with Technology).
Nicholas Hainen Nicholas taught chemistry and physics in the Worthington City Schools, Worthington, Ohio, for 31 years. Mr. Hainen holds BS and MA degrees in Science Education from The Ohio State University, majoring in chemistry and physics. His honors and awards include: American Chemical Society Outstanding Educator in Chemical Sciences; The Ohio State University Honor Roll of Outstanding High School Teachers; Ashland Oil Company Golden Apple Award; and Who’s Who Among America’s Teachers. Mr. Hainen is a mem-ber of the American Chemical Society and the ACS Division of Chemical Education.
Cheryl Wistrom Cheryl is a Visiting Assistant Professor of Chemistry at Purdue University Northwest in Westville, Indiana. She has taught chemistry, biology, and science education courses at the college level since 1990 and is also a licensed pharmacist. She earned her BS degree in biochemistry at Northern Michigan University, a BS in pharmacy at Purdue University, and her MS and PhD in biological chemistry at the University of Michigan. Dr. Wistrom is a member of the Indiana Academy of Science, the National Science Teachers Association, and the American Society of Health-System Pharmacists.
Dinah Zike Dinah is an international curriculum consultant and inventor who has developed educa-tional products and three-dimensional, interactive graphic organizers for over 30 years. As president and founder of Dinah-Might Adventures, L.P., Dinah is the author of more than 100 award-winning educational publications, including The Big Book of Science. Dinah has a BS and an MS in educational curriculum and instruction from Texas A&M University. Dinah Zike’s Foldables are an exclusive feature of McGraw-Hill textbooks.
ABOUT THE AUTHORS

Table of Contents ix
Program: HSS_NA Component: ChemistryPDF Pass
Vendor: Lumina Chapter: FM_TOC
©fit
opar
do.c
om/M
omen
t O
pen/
Get
ty Im
ages
00ix_xiii_CHEM_NA_S_FM_TOC_674695.indd 04/01/19 05:34PM
UNIT 1
STRUCTURE AND PROPERTIES OF MATTERENCOUNTER THE PHENOMENON
How do fireworks get their colors?
STEM UNIT 1 PROJECT ...................................................... 45
INTRODUCTION TO CHEMISTRYThis module introduces the nature of science, what Chemistry is, and provides tools for the study of Chemistry.
MODULE 1: THE CENTRAL SCIENCEENCOUNTER THE PHENOMENONCER Claim, Evidence, Reasoning ................................................... 3
Lesson 1 What is Chemistry? ................................................... 4Lesson 2 Measurement............................................................ 11Lesson 3 Uncertainty in Data ............................................... 27Lesson 4 Representing Data ................................................. 36
SCIENCE & SOCIETY A Deadly Chemical Attraction ........................................................ 4 1
C C C
SEP DCI Module Wrap-Up ......................................................................... 43
SEP GO FURTHER Data Analysis Lab ........................................ 43
MODULE 2: MATTER—PROPERTIES AND CHANGESENCOUNTER THE PHENOMENONCER Claim, Evidence, Reasoning ................................................ 47
Lesson 1 Properties of Matter ............................................... 48Lesson 2 Changes in Matter ................................................. 55Lesson 3 Elements and Compounds ................................. 60Lesson 4 Mixtures of Matter .................................................. 68
SCIENCE & SOCIETY In Rare Form ......................................................................................... 73
C C C
SEP DCI Module Wrap-Up ......................................................................... 75
SEP GO FURTHER Data Analysis Lab ........................................ 75
MODULE 3: THE STRUCTURE OF THE ATOMENCOUNTER THE PHENOMENONCER Claim, Evidence, Reasoning ................................................. 77
Lesson 1 Early Ideas About Matter ..................................... 78Lesson 2 Defining the Atom .................................................. 82Lesson 3 How Atoms Differ .................................................... 9 1Lesson 4 Unstable Nuclei and Radioactive Decay ....... 98
SCIENTIFIC BREAKTHROUGHS Mapping the Mysteries of Materials ........................................... 101
C C C
SEP DCI Module Wrap-Up ........................................................................ 103
SEP GO FURTHER Data Analysis Lab ....................................... 103
MODULE 4: ELECTRONS IN ATOMSENCOUNTER THE PHENOMENONCER Claim, Evidence, Reasoning .............................................. 105
Lesson 1 Light and Quantized Energy ............................. 106Lesson 2 Quantum Theory and the Atom ....................... 116Lesson 3 Electron Configuration ........................................ 126
SCIENTIFIC BREAKTHROUGHS Batteries of the Future: Super Charged! .................................. 133
C C C
SEP DCI Module Wrap-Up ........................................................................ 135
SEP GO FURTHER Data Analysis Lab ....................................... 135
MODULE 5: THE PERIODIC TABLE AND PERIODIC LAWENCOUNTER THE PHENOMENONCER Claim, Evidence, Reasoning ............................................... 137
Lesson 1 Development of the Modern Periodic Table ...................................................... 138Lesson 2 Classification of the Elements ......................... 146Lesson 3 Periodic Trends ...................................................... 152
NATURE OF SCIENCE The Evolving Periodic Table ......................................................... 161
C C C
SEP DCI Module Wrap-Up ........................................................................ 163
SEP GO FURTHER Data Analysis Lab ....................................... 163 STEM UNIT 1 PROJECT .......................................................... 163

x Table of Contents
Program: HSS_NA Component: ChemistryPDF Pass
Vendor: Lumina Chapter: FM_TOC
Rus
tin
Gud
im/Z
UM
A P
ress
/New
scom
00ix_xiii_CHEM_NA_S_FM_TOC_674695.indd 04/01/19 05:35PM
MODULE 6: IONIC COMPOUNDS AND METALSENCOUNTER THE PHENOMENONCER Claim, Evidence, Reasoning .............................................. 167
Lesson 1 Ion Formation ......................................................... 168Lesson 2 Ionic Bonds and Ionic Compounds ................ 173Lesson 3 Names and Formulas for Ionic Compounds ........................................ 180Lesson 4 Metallic Bonds and the Properties of Metals ........................................... 187
ENGINEERING & TECHNOLOGY From Salty to Fresh .......................................................................... 191
C C C
SEP DCI Module Wrap-Up ........................................................................ 193
SEP GO FURTHER Data Analysis Lab ....................................... 193
MODULE 7: COVALENT BONDINGENCOUNTER THE PHENOMENONCER Claim, Evidence, Reasoning .............................................. 195
Lesson 1 The Covalent Bond .............................................. 196Lesson 2 Naming Molecules .............................................. 205Lesson 3 Molecular Structures ........................................... 2 1 1Lesson 4 Molecular Shapes ............................................... 220Lesson 5 Electronegativity and Polarity ......................... 225
SCIENCE & SOCIETY Plastics: The Good, The Bad, and the Ugly ............................ 232
C C C
SEP DCI Module Wrap-Up ....................................................................... 234
SEP GO FURTHER Data Analysis Lab ...................................... 234
MODULE 8: CHEMICAL REACTIONSENCOUNTER THE PHENOMENONCER Claim, Evidence, Reasoning .............................................. 236
Lesson 1 Reactions and Equations ................................... 237Lesson 2 Classifying Chemical Reactions ...................... 245Lesson 3 Reactions in Aqueous Solutions .................... 255
SCIENCE & SOCIETY How One Woman Led the FDA to Save Lives ...................... 266
C C C
SEP DCI Module Wrap-Up ...................................................................... 268
SEP GO FURTHER Data Analysis Lab ..................................... 268
MODULE 9: THE MOLEENCOUNTER THE PHENOMENONCER Claim, Evidence, Reasoning .............................................. 270
Lesson 1 Measuring Matter ................................................. 2 7 1Lesson 2 Mass and the Mole ............................................ 277Lesson 3 Moles of Compounds ....................................... 285Lesson 4 Empirical and Molecular Formulas ................ 294Lesson 5 Formulas of Hydrates ......................................... 304
SCIENCE & SOCIETY Making Cents ................................................................................... 309
C C C
SEP DCI Module Wrap-Up ....................................................................... 3 1 1
SEP GO FURTHER Data Analysis Lab ...................................... 3 1 1
MODULE 10: STOICHIOMETRYENCOUNTER THE PHENOMENONCER Claim, Evidence, Reasoning ............................................. 3 1 3
Lesson 1 Defining Stoichiometry ...................................... 3 1 4Lesson 2 Stoichiometric Calculations ............................. 320Lesson 3 Limiting Reactants................................................ 326Lesson 4 Percent Yield ......................................................... 332
NATURE OF SCIENCE The Stoichiometry That Just Might Save Your Life .............. 336
C C C
SEP DCI Module Wrap-Up ....................................................................... 339
SEP GO FURTHER Data Analysis Lab ...................................... 339 STEM UNIT 2 PROJECT ........................................................ 339
UNIT 2
CHEMICAL BONDING AND REACTIONSENCOUNTER THE PHENOMENON
How can understanding chemical bonding and reactions support fire safety?
STEM UNIT 2 PROJECT ................................................... 165

Table of Contents xi
Program: HSS_NA Component: ChemistryPDF Pass
Vendor: Lumina Chapter: FM_TOC
Seap
hoto
art/
Ala
my
Stoc
k Ph
oto
00ix_xiii_CHEM_NA_S_FM_TOC_674695.indd 04/01/19 05:36PM
UNIT 3
MATTER, ENERGY, AND EQUILIBRIUMENCOUNTER THE PHENOMENON
How does ocean chemistry affect coral reefs?
STEM UNIT 3 PROJECT .................................................... 341
MODULE 11: STATES OF MATTERENCOUNTER THE PHENOMENONCER Claim, Evidence, Reasoning .............................................. 343
Lesson 1 Gases ........................................................................ 344Lesson 2 Forces of Attraction ............................................. 354Lesson 3 Liquids and Solids ................................................ 359Lesson 4 Phase Changes ..................................................... 370
SCIENTIFIC BREAKTHROUGHS New Matter ............................. 377C C C
SEP DCI Module Wrap-Up ....................................................................... 379
SEP GO FURTHER Data Analysis Lab ...................................... 379
MODULE 12: GASES ENCOUNTER THE PHENOMENONCER Claim, Evidence, Reasoning ............................................. 3 8 1
Lesson 1 The Gas Laws ......................................................... 382Lesson 2 The Ideal Gas Law ............................................... 392Lesson 3 Gas Stoichiometry ............................................... 400
SCIENCE & SOCIETY What Goes Up Doesn’t Always Come Down ........................ 405
C C C
SEP DCI Module Wrap-Up ....................................................................... 407
SEP GO FURTHER Data Analysis Lab ...................................... 407
MODULE 13: MIXTURES AND SOLUTIONS ENCOUNTER THE PHENOMENONCER Claim, Evidence, Reasoning ............................................. 409
Lesson 1 Types of Mixtures ................................................. 4 1 0Lesson 2 Solution Concentration ..................................... 4 1 5Lesson 3 Factors Affecting Solvation .............................. 426Lesson 4 Colligative Properties of Solutions ................ 436
SCIENTIFIC BREAKTHROUGHS Blood Falls: A Salty Secret Under the Ice ............................... 443
C C C
SEP DCI Module Wrap-Up ....................................................................... 445
SEP GO FURTHER Data Analysis Lab ...................................... 445
MODULE 14: ENERGY AND CHEMICAL CHANGE ENCOUNTER THE PHENOMENONCER Claim, Evidence, Reasoning .............................................. 447
Lesson 1 Energy ....................................................................... 448Lesson 2 Heat .......................................................................... 456Lesson 3 Thermochemical Equations .............................. 463
Lesson 4 Calculating Enthalpy Change .......................... 468Lesson 5 Reaction Spontaneity ......................................... 477
ENGINEERING & TECHNOLOGY Cement That “Eats” Pollution ...................................................... 486
C C C
SEP DCI Module Wrap-Up ....................................................................... 488
SEP GO FURTHER Data Analysis Lab ...................................... 488
MODULE 15: REACTION RATES ENCOUNTER THE PHENOMENONCER Claim, Evidence, Reasoning ............................................. 490
Lesson 1 A Model for Reaction Rates ............................ 4 9 1Lesson 2 Factors Affecting Reaction Rates .................. 500Lesson 3 Reaction Rate Laws ............................................. 507Lesson 4 Instantaneous Reaction Rates and Reaction Mechanisms .............................. 512
BREAKTHROUGHS IN SCIENCE Predicting Combustion ...... 517C C C
SEP DCI Module Wrap-Up ........................................................................ 519
SEP GO FURTHER Data Analysis Lab ....................................... 519
MODULE 16: CHEMICAL EQUILIBRIUM ENCOUNTER THE PHENOMENONCER Claim, Evidence, Reasoning ............................................. 521
Lesson 1 A State of Dynamic Balance ........................... 522Lesson 2 Factors Affecting Chemical Equilibrium ...... 535Lesson 3 Using Equilibrium Constants ........................... 5 4 1
SCIENCE & SOCIETY Equilibrium in the Blood ........................ 553C C C
SEP DCI Module Wrap-Up ...................................................................... 555
SEP GO FURTHER Data Analysis Lab ..................................... 555
MODULE 17: ACIDS AND BASES ENCOUNTER THE PHENOMENONCER Claim, Evidence, Reasoning .............................................. 557
Lesson 1 Introduction to Acids and Bases ................... 558Lesson 2 Strengths of Acids and Bases ........................ 568Lesson 3 Hydrogen Ions and pH ....................................... 574Lesson 4 Neutralization ........................................................ 583
SCIENCE & SOCIETY The Litmus Test for Healthy Horticulture ................................. 593
C C C
SEP DCI Module Wrap-Up ...................................................................... 595
SEP GO FURTHER Data Analysis Lab ..................................... 595 STEM UNIT 3 PROJECT ....................................................... 595

xii Table of Contents
Program: HSS_NA Component: ChemistryPDF Pass
Vendor: Lumina Chapter: FM_TOC
John
A. A
nder
son/
Shut
ters
tock
00ix_xiii_CHEM_NA_S_FM_TOC_674695.indd 04/01/19 12:47PM
UNIT 4
OXIDATION AND REDUCTION REACTIONSENCOUNTER THE PHENOMENON
Why do some metals tend to corrode?
STEM UNIT 4 PROJECT ................................................... 597
MODULE 18: REDOX REACTIONSENCOUNTER THE PHENOMENONCER Claim, Evidence, Reasoning ............................................. 599
Lesson 1 Oxidation and Reduction .................................. 600Lesson 2 Balancing Redox Equations............................. 609
NATURE OF SCIENCE Better Eating Through Chemistry .............................................. 617
C C C
SEP DCI Module Wrap-Up ...................................................................... 6 19
SEP GO FURTHER Data Analysis Lab ...................................... 619
MODULE 19: ELECTROCHEMISTRYENCOUNTER THE PHENOMENONCER Claim, Evidence, Reasoning ............................................. 621
Lesson 1 Voltaic Cells ........................................................... 622Lesson 2 Batteries .................................................................. 633Lesson 3 Electrolysis ............................................................. 644
STEM AT WORK The Wide World of an Electrochemist ..................................... 650
C C C
SEP DCI Module Wrap-Up ..................................................................... 653
SEP GO FURTHER Data Analysis Lab ..................................... 653 STEM UNIT 4 PROJECT ....................................................... 653

Table of Contents xiii
Program: HSS_NA Component: ChemistryPDF Pass
Vendor: Lumina Chapter: FM_TOC
(bkg
d)D
an F
agre
/US
GS,
(in
set)
T.J.
Hile
man
, Gla
cier
Nat
iona
l Par
k A
rchi
ves/
US
GS
00ix_xiii_CHEM_NA_S_FM_TOC_674695.indd 04/01/19 05:38PM
UNIT 5
ORGANIC AND NUCLEAR CHEMISTRYENCOUNTER THE PHENOMENON
How has our use of carbon-based fuels affected our climate?
STEM UNIT 5 PROJECT .................................................. 655
MODULE 20: HYDROCARBONSENCOUNTER THE PHENOMENONCER Claim, Evidence, Reasoning ............................................. 657
Lesson 1 Introduction to Hydrocarbons ........................ 658Lesson 2 Alkanes ................................................................... 665Lesson 3 Alkenes and Alkynes .......................................... 675Lesson 4 Hydrocarbon Isomers ......................................... 681Lesson 5 Aromatic Hydrocarbons ................................... 686
SCIENTIFIC BREAKTHROUGHS Like Oil and Water .......................................................................... 692
C C C
SEP DCI Module Wrap-Up ...................................................................... 694
SEP GO FURTHER Data Analysis Lab ..................................... 694
MODULE 21: SUBSTITUTED HYDROCARBONS AND THEIR REACTIONSENCOUNTER THE PHENOMENONCER Claim, Evidence, Reasoning ............................................. 696
Lesson 1 Alkyl Halides and Aryl Halides ........................ 697Lesson 2 Alcohols, Ethers, and Amines .......................... 703Lesson 3 Carbonyl Compounds ....................................... 7 1 0Lesson 4 Other Reactions of Organic Compounds .......................................... 7 1 8Lesson 5 Polymers ................................................................. 725
ENGINEERING & TECHNOLOGY Promising New Plastics from Plant Polymers ....................... 732
C C C
SEP DCI Module Wrap-Up ....................................................................... 734
SEP GO FURTHER Data Analysis Lab ..................................... 734
MODULE 22: THE CHEMISTRY OF LIFEENCOUNTER THE PHENOMENONCER Claim, Evidence, Reasoning .............................................. 736
Lesson 1 Proteins .................................................................... 737Lesson 2 Carbohydrates ...................................................... 743Lesson 3 Lipids ........................................................................ 746Lesson 4 Nucleic Acids ......................................................... 751Lesson 5 Metabolism ............................................................. 755
SCIENTIFIC BREAKTHROUGHS Antibiotics from Amphibians ........................................................ 760
C C C
SEP DCI Module Wrap-Up ....................................................................... 762
SEP GO FURTHER Data Analysis Lab ...................................... 762
MODULE 23: NUCLEAR CHEMISTRYENCOUNTER THE PHENOMENONCER Claim, Evidence, Reasoning .............................................. 764
Lesson 1 Nuclear Radiation ................................................. 765Lesson 2 Radioactive Decay ............................................... 7 7 1Lesson 3 Nuclear Reactions ................................................ 782Lesson 4 Applications and Effects
of Nuclear Reactions ........................................... 793STEM AT WORK Disease Detectives ......................................................................... 799
C C C
SEP DCI Module Wrap-Up ....................................................................... 801
SEP GO FURTHER Data Analysis Lab ...................................... 801 STEM UNIT 5 PROJECT ........................................................ 801

0002_CHEM_CA_S_CH01_MO_674695.indd 07/01/19 08:31PM
Shut
ters
tock
/Kat
hari
na13
2 Module 1 • The Central Science
Program: HSS_NA Component: COPDF Pass
Vendor: Lumina Chapter: 01

MODULE 1THE CENTRAL SCIENCE
ENCOUNTER THE PHENOMENON
What do plants and buildings have in common?
GO ONLINE to play a video about the discovery of potassium.
Ask QuestionsDo you have other questions about the phenomenon? If so, add them to the driving question board.
CER Claim, Evidence, ReasoningMake Your Claim Use your CER chart to make a claim about what plants and build-ings have in common.
Collect Evidence Use the lessons in this module to collect evidence to support your claim. Record your evidence as you move through the module.
Explain Your Reasoning You will revisit your claim and explain your reasoning at the end of the module.
GO ONLINE to access your CER chart and explore resources that can help you collect evidence.
LESSON 1: Explore & Explain: Matter and Its Characteristics
LESSON 1: Explore & Explain: The Central Science
Additional Resources
0003_CHEM_NA_S_CH01_Investigate_138115.indd 03/05/19 03:58PM
(t)V
ideo
Sup
plie
d by
BB
C W
orld
wid
e Le
arni
ng, (
bl)J
akub
Zak
/Shu
tter
stoc
k, (
br)©
Jorg
Gre
uel/
Dig
ital
Vis
ion/
Get
ty Im
ages
Module 1 • Encounter the Phenomenon 3
Program: HSS_NA Component: IPPDF Pass
Vendor: Aptara Chapter: 01

COLLECT EVIDENCEUse your Science Journal to
record the evidence you collect as you complete the readings and activities in this lesson.
INVESTIGATE GO ONLINE to find these activities and more resources.
Identify Crosscutting ConceptsCreate a table of the crosscutting concepts and fill in examples you find as you read. Revisit the Encounter the Phenomenon QuestionWhat information from this lesson can help you answer the module question?
(l)N
AS
A, E
SA
, J. H
este
r an
d A
. Lol
l (A
rizo
na S
tate
Uni
vers
ity)
; (r)
tigg
erlil
y/iS
tock
phot
o/G
etty
Imag
es
0004_0010_CHEM_CA_S_CH01_L1_674695.indd 07/01/19 12:41PM
Disciplinary Core Ideas Crosscutting Concepts Science & Engineering Practices3D THINKINGC C C
SEP DCI
FOCUS QUESTION
How can chemistry help you understand the world?
LESSON 1WHAT IS CHEMISTRY?
Why study chemistry?Take a moment to observe your surroundings and Figure 1. Where did all the “stuff ” come from? All the stuff in the universe, including everything in the photos, is made from building blocks formed in stars. Scientists call these building blocks and the “stuff ” made from these building blocks matter.
Figure 1 Everything in the universe, including particles in space and things around you, is composed of matter.
4 Module 1 • The Central Science
Program: HSS_NA Component: LessonPDF Pass
Vendor: Lumina Chapter: 01

0004_0010_CHEM_CA_S_CH01_L1_138115.indd 21/05/18 09:18AM0004_0010_CHEM_CA_S_CH01_L1_138115.indd 21/05/18 09:18AM
As you begin your study of chemistry—the study of matter and the changes that it undergoes—you are probably asking yourself, “Why is chemistry important to me?” Whether you read this because of ink on a printed page or phosphors in a monitor or screen, you are relying on chemistry. Through chemistry, people have made the fibers in your clothing and those in the body panels of a car. If you cook food in a metal pan on a gas stove or in a glass bowl in a microwave oven, you make use of chemistry.
Chemistry: The Central ScienceBecause chemistry is the study of matter and the changes that it undergoes, a basic understanding of chemistry is central to all sciences—biology, physics, Earth science, ecology, and others. Science is the use of evidence to construct testable explanations and predictions of natural phenomena, as well as, the knowledge generated through this process. A testable explanation of a situation or phenomena is called a hypothesis. The nature, or essential characteristic, of science is scientific inquiry—the development of new explanations. Scientific inquiry is both a creative process and a process rooted in unbiased observations and investigation.
Because there are so many types of matter, there are many areas of study in the field of chemistry. Chemistry is traditionally broken down into branches that focus on specific areas, such as those listed in Table 1. Although chemistry is divided into specific areas of study, many of the areas overlap. For example, as you can see from Table 1, an organic chemist might study plastics, but an industrial chemist or a polymer chemist could also focus on plastics.
Table 1 Some Branches of ChemistryBranch Area of Emphasis Examples of Emphasis
Organic chemistry most carbon-containing chemicals pharmaceuticals, plasticsInorganic chemistry in general, matter that does not
contain carbonminerals, metals and nonmetals, semiconductors
Physical chemistry the behavior and changes of matter and the related energy changes
reaction rates, reaction mechanisms
Analytical chemistry components and composition of substances
food nutrients, quality control
Biochemistry matter and processes of living organisms
metabolism, fermentation
Environmental chemistry
matter and the environment pollution, biochemical cycles
Industrial chemistry chemical processes in industry paints, coatingsPolymer chemistry polymers and plastics textiles, coatings, plasticsTheoretical chemistry chemical interactions many areas of emphasisThermochemistry heat involved in chemical processes heat of reaction
Lesson 1 • What is chemistry? 5
Program: HSS_NA Component: LessonPDF Pass
Vendor: Lumina Chapter: 01

(l)P
hilip
pe P
saila
/Sci
ence
Sou
rce;
(r)D
avid
Sch
arf/
Scie
nce
Sour
ce
0004_0010_CHEM_CA_S_CH01_L1_674695.indd 17/12/18 05:58PM0004_0010_CHEM_CA_S_CH01_L1_674695.indd 17/12/18 05:58PM
ACADEMIC VOCABULARYvalidityreasonableness; logical soundnessThe inventor’s claims seemed outrageous, but their validity was supported bycareful testing.
The Benefits of ChemistryChemists are an important part of the team of scientists that solve many of the prob-lems or issues that we face today. Chemists are involved in resolving global issues, such as the ozone depletion problem. They are also involved in finding cures or vaccines for diseases, such as AIDS and influenza. Almost every situation that you can imagine involves a chemist, because everything in the universe is made of matter.
Figure 2 shows some of the advances in technology that are possible because of the study of matter. The car on the left is powered by compressed air. When the compressed air is allowed to expand, it pushes the pistons that move the car. Because the car is powered by compressed air, no pollutants are released. The photo on the right shows a type of lens that is made using nanofabrication techniques. Microscopic gears and even submarines have been developed through an understanding of matter.
Theory and Scientific LawYou might have heard of Einstein’s theory of relativity or the atomic theory. In science, a theory is an explanation of a natural phenomenon based on many observations and investigations over time. A theory states a broad principle of nature that has been supported over time. All theories are still subject to new experimental data and can be modified. Also, theories often lead to new conclusions. A theory is considered valid if it can be used to make predictions that are proven true.
Figure 2 This car, which is powered by compressed air, and this tiny lens, which is about 0.4 mm wide, are examples of technologies that are made possible by the study of matter.
6 Module 1 • The Central Science
Program: HSS_NA Component: LessonPDF Pass
Vendor: Lumina Chapter: 01

moo
dboa
rd/G
etty
Imag
es
0004_0010_CHEM_CA_S_CH01_L1_674695.indd 17/12/18 05:58PM0004_0010_CHEM_CA_S_CH01_L1_674695.indd 17/12/18 05:58PM
ACADEMIC VOCABULARYqualitativerelating to or measuring the quality or characteristics of something rather than the quantityThe salesperson described the qualitative aspects of the car, like its color and its smooth ride—but never mentioned the quantitative aspects of gas mileage or cost.
Figure 3 It does not matter how many times skydivers leap from a plane; Newton’s law of universal gravitation applies every time.
Sometimes, many scientists come to the same conclusion about certain relationships in nature and they find no exceptions to these relationships. For example, you know that no matter how many times skydivers, like those shown in Figure 3, leap from a plane, they always return to Earth’s surface. Sir Isaac Newton was so certain that an attractive force exists between all objects that he proposed his law of universal gravitation. Newton’s law is a scientific law—a relationship in nature that is supported by many experiments. It is up to scientists to develop further hypotheses and experiments to explain why these relation-ships exist.
Types of Scientific InvestigationsEvery day in the media—through TV, newspapers, magazines, or the Internet—the public is bombarded with the results of scientific investigations. Many deal with the environment, medicine, or health. As a consumer, you are asked to evaluate the results of scientific research and development. How do scientists use qualitative and quantita-tive data to solve different types of scientific problems?
Scientists conduct pure research to gain knowledge for the sake of knowledge itself. It is often driven by the curiosity of the researcher. For example, Harry Kroto, a chemist at the University of Sussex, had helped to discover long, linear-chain molecules of carbon in interstellar space. He was interested in investigating whether they might be formed in red giant stars. His investigations led to the discovery of buckminsterfullerenes, or buckyballs—a form of carbon composed of 60 carbon atoms arranged in the shape of a soccer ball.
Scientists conduct applied research to solve a specific problem. In the search for cancer therapies, scientists have developed ways to use fullerenes to destroy cancer cells through the process of photodynamic therapy (PDT). Scientists researched methods to modify fullerenes so that on exposure to light, the fullerene changes oxygen in a cell into highly reactive forms that damage cell components, which leads to cell death.
Lesson 1 • What is chemistry? 7
Program: HSS_NA Component: LessonPDF Pass
Vendor: Lumina Chapter: 01

Tany
a C
onst
anti
ne/B
lend
Imag
es
0004_0010_CHEM_CA_S_CH01_L1_674695.indd 17/12/18 05:58PM0004_0010_CHEM_CA_S_CH01_L1_674695.indd 17/12/18 05:58PM
Matter and Its CharacteristicsMatter, the stuff of the universe, has many different forms. Everything around you, like the things in Figure 4, is matter. Some matter occurs naturally, such as ozone, and other substances are not natural, such as chlorofluorocarbons (CFCs). A substance, which is also known as a chemical, is matter that has a definite and uniform composition.
You might realize that everyday objects are composed of matter, but how do you define matter? Recall that matter is anything that has mass and takes up space. Also recall that mass is a measurement that reflects the amount of matter. You know that your textbook has mass and takes up space, but is air matter? You cannot see it and you cannot always feel it. However, when you inflate a balloon, it expands to make room for the air. The balloon gets heavier. Thus, air must be matter. Is everything matter? The thoughts and ideas that fill your head are not matter; neither are heat, light, radio waves, nor mag-netic fields. What else can you name that is not matter?
Mass and weight Have you ever used a bathroom scale to measure your weight? Weight is a measure not only of the amount of matter but also of the effect of Earth’s gravitational pull on that matter. This force is not exactly the same everywhere on Earth and actually becomes less as you move away from Earth’s surface at sea level. You might not notice a differ-ence in your weight from one place to another, but subtle differences do exist.
Figure 4 Everything in this photo is matter and has mass and weight.Compare and contrast mass and weight.
SCIENCE USAGE V. COMMON USAGEweightScience usage: the measure of the amount of matter in and the gravitational force exerted on an objectThe weight of an object is the product of its mass and the local acceleration of gravity.Common usage: the relative heaviness of an objectThe puppy grew so quickly it doubled its weight in a matter of weeks.
8 Module 1 • The Central Science
Program: HSS_NA Component: LessonPDF Pass
Vendor: Lumina Chapter: 01

(l)Jo
hn L
und/
Mar
c R
oman
elli/
Ble
nd Im
ages
/Ala
my;
(r)N
AS
A/S
cien
ce S
ourc
e
0004_0010_CHEM_CA_S_CH01_L1_138115.indd 21/05/18 09:18AM0004_0010_CHEM_CA_S_CH01_L1_138115.indd 21/05/18 09:18AM
Office building model Airplane model
It might seem more convenient for scientists to simply use weight instead of mass. Why is it so important to think of matter in terms of mass? Scientists need to be able to compare the measurements that they make in different parts of the world. They could identify the gravitational force every time they weigh something, but that would not be practical or convenient. They use mass as a way to measure matter independently of gravitational force.
Structure and observable characteristics What can you observe about the outside of your school building? You know that there is more to the building than what you can observe from the outside. Among other things, there are beams inside the walls that give the building structure, stability, and function. Consider another example. When you bend your arm at the elbow, you observe that your arm moves, but what you cannot see is that muscles under the skin contract and relax to move your arm.
Much of matter and its behavior is macroscopic; that is, you do not need a microscope to observe it. Chemistry seeks to explain the submicroscopic events that lead to macro-scopic observations. One way this can be done is by making a model. A model is a visual, verbal, or mathematical explanation of experimental data. Scientists use many types of models to represent things that are hard to visualize, such as the structure and materials used in the construction of a building and the computer model of the airplane shown in Figure 5. Chemists also use several different types of models to represent matter, as you will soon learn.
Get It?Identify two additional types of models that are used by scientists.
Figure 5 Scientists use models to visualize complex ideas, such as the materials and structure used to build office buildings. They also use models to test a concept, such as a new airplane design, before it is mass produced.Infer why chemists use models to study atoms.
Lesson 1 • What is chemistry? 9
Program: HSS_NA Component: LessonPDF Pass
Vendor: Lumina Chapter: 01

0004_0010_CHEM_CA_S_CH01_L1_674695.indd 17/12/18 05:58PM0004_0010_CHEM_CA_S_CH01_L1_674695.indd 17/12/18 05:58PM
Go online to follow your personalized learning path to review, practice, and reinforce your understanding.
Check Your ProgressSummary• Chemistry is the study of
matter. There are several branches of chemistry, includ-ing organic, inorganic, physical, analytical, and biochemistry.
• Science is the use of evidence to construct testable explana-tions and predictions of natural phenomena, as well as, the knowledge generated through this process.
• Models are tools that scientists, including chemists, use. A hypothesis is a testable expla-nation of a situation or phe-nomena. A theory is a hypothesis that is supported by many experiments.
Demonstrate Understanding 1. Explain why the study of chemistry should be import-
ant to everyone. 2. Define substance and give two examples of things that
are substances. 3. Explain why there are different branches of chemistry. 4. Explain why scientists use mass instead of weight for
their measurements. 5. Summarize why it is important for chemists to study
changes in the world at a submicroscopic level. 6. Infer why chemists use models to study submicrosco-
pic matter. 7. Identify three models that scientists use, and explain
why each model is useful. 8. Evaluate How would your mass and weight differ on
the Moon? The gravitational force of the Moon is one-sixth the gravitational force on Earth.
9. Evaluate If you put a scale in an elevator and weigh yourself as you ascend and then descend, does the scale have the same reading in both instances? Explain your answer.
10. Distinguish Jacques Charles described the direct relationship between temperature and volume of all gases at constant pressure. Should this be called Charles’s law or Charles’s theory? Explain.
You will learn in Module 2 that the tremendous variety of stuff around you can be broken down into more than a hundred types of matter called elements, and that elements are made up of particles called atoms. Atoms are so tiny that they cannot be seen even with optical microscopes. Thus, atoms are submicroscopic. They are so small that over a trillion atoms could fit onto the period at the end of this sentence. The structure, composition, and behavior of all matter can be explained on a submi-croscopic level—or the atomic level. All that we observe about matter depends on atoms and the changes they undergo.
10 Module 1 • The Central Science
Program: HSS_NA Component: LessonPDF Pass
Vendor: Lumina Chapter: 01

McG
raw
-Hill
Edu
cati
on
0011_0026_CHEM_NA_S_CH01_L2_138115.indd 08/04/19 07:23PM0011_0026_CHEM_NA_S_CH01_L2_138115.indd 08/04/19 07:23PM
UnitsYou use measurements almost every day. For example, reading the bottled water label in Figure 6 helps you decide what size bottle to buy. Notice that the label uses a number and a unit, such as 700 mL, to give the volume. The label also gives the volume as 23.7 fluid ounces. Fluid ounces, pints, and milliliters are units used to measure volume.
Figure 6 The label gives the volume of water in the bottle in three different units: fluid ounces, pints, and milliliters. Notice that each volume includes a number and a unit.Infer Which is the larger unit of volume: a fluid ounce or a milliliter?
LESSON 2MEASUREMENT
FOCUS QUESTION
Why do scientists use standardized units?
Disciplinary Core Ideas Crosscutting Concepts Science & Engineering Practices3D THINKINGC C C
SEP DCI
COLLECT EVIDENCEUse your Science Journal to
record the evidence you collect as you complete the readings and activities in this lesson.
INVESTIGATE GO ONLINE to find these activities and more resources.
Laboratory: Laboratory Techniques and Lab Safety Plan and carry out an investigation to determine the quantity and scale of the mass of a substance and the volume of water.
Virtual Investigation: Density Use models to identify patterns in the densities of several known and unknown solids and liquids.
Lesson 2 • Measurement 11
Program: HSS_NA Component: LessonPDF Pass
Vendor: Aptara Chapter: 01

0011_0026_CHEM_CA_S_CH01_L2_138115.indd 21/05/18 09:18AM0011_0026_CHEM_CA_S_CH01_L2_138115.indd 21/05/18 09:18AM
Système Internationale d’UnitésFor centuries, units of measurement were not exact. A person might measure distance by counting steps, or measure time using a sundial or an hourglass filled with sand. Such estimates worked for ordinary tasks. Because scientists need to report data that can be reproduced by other scientists, they need standard units of measurement. In 1960, an international committee of scientists met to update the existing metric system. The revised international unit system is called the Système Internationale d’Unités, which is abbreviated SI.
Base Units and SI PrefixesThere are seven base units in SI. A base unit is a defined unit in a system of measure-ment that is based on an object or event in the physical world. A base unit is indepen-dent of other units. Table 2 lists the seven SI base units, the quantities they measure, and their abbreviations. Some familiar quantities that are expressed in base units are time, length, mass, and temperature.
To better describe the range of possible measurements, scientists add prefixes to the base units. This task is made easier because the metric system is a decimal system—a system based on units of 10. The prefixes in Table 3 are based on factors of ten and can be used with all SI units. For example, the prefix kilo- means one thousand; therefore, 1 km equals 1000 m. Similarly, the prefix milli- means one-thousandth; therefore, 1 mm equals 0.001 m. Many mechanical pencils use lead that is 0.5 mm in diameter. How much of a meter is 0.5 mm?
Table 2 SI Base UnitsQuantity Base UnitTime second (s)Length meter (m)Mass kilogram (kg)Temperature kelvin (K)Amount of a substance mole (mol)
Electric current ampere (A)
Luminous intensity candela (cd)
Table 3 SI Prefixes
Prefix Symbol Numerical Value in Base Units
Power of 10 Equivalent
Giga G 1,000,000,000 109
Mega M 1,000,000 106
Kilo k 1000 103
– – 1 100
Deci d 0.1 10–1
Centi c 0.01 10–2
Milli m 0.001 10–3
Micro μ 0.000001 10–6
Nano n 0.000000001 10–9
Pico p 0.000000000001 10–12
12 Module 1 • The Central Science
Program: HSS_NA Component: LessonPDF Pass
Vendor: Lumina Chapter: 01

And
rew
Bro
okes
, Nat
iona
l Phy
sica
l Lab
orat
ory/
Scie
nce
Sour
ce
0011_0026_CHEM_CA_S_CH01_L2_674695.indd 17/12/18 05:58PM0011_0026_CHEM_CA_S_CH01_L2_674695.indd 17/12/18 05:58PM
TimeThe SI base unit for time is the second (s). The physical standard used to define the second is the frequency of the radiation given off by a cesium-133 atom. Cesium-based clocks are used when highly accurate timekeeping is required. For everyday tasks, a second seems like a short amount of time. In chemistry, however, many chemical reactions take place within a fraction of a second.
LengthThe SI base unit for length is the meter (m). A meter is the distance that light travels in a vacuum in 1/299,792,458 of a second. A vacuum exists where space contains no matter.
A meter is close in length to a yard and is useful for measuring the length and width of a small area, such as a room. For larger distances, such as between cities, you would use kilometers. Smaller lengths, such as the diameter of a pencil, are likely to be given in millimeters.
MassRecall that mass is a measure of the amount of matter an object contains. The SI base unit for mass is the kilogram (kg). Currently, a platinum and iridium cylinder kept in France defines the kilogram. The cylinder is stored in a vacuum under a triple bell jar to prevent the cylinder from oxidizing. As shown in Figure 7, scientists are working to redefine the kilogram using basic properties of nature.
A kilogram is equal to about 2.2 pounds. Because the masses measured in most laboratories are much smaller than a kilogram, scientists often measure quantities in grams (g) or milligrams (mg). For example, a laboratory experiment might ask you to add 35 mg of an unknown substance to 350 g of water. When working with mass values, it is helpful to remember that there are 1000 g in a kilogram. How many milligrams are in a gram?
SCIENCE USAGE V. COMMON USAGEmeterScience usage: the SI base unit of lengthThe metal rod was 1 m in length.Common usage: a device used to measureThe time ran out on the parking meter.
Figure 7 Scientists at the National Institute of Standards and Technology are experimenting with redefining the kilogram using an apparatus known as a watt balance. The watt balance uses electric current and a magnetic field to measure the force required to balance a one-kilogram mass against the force of gravity. Other scientists are counting the number of atoms in a one-kilogram mass to redefine the kilogram.
Lesson 2 • Measurement 13
Program: HSS_NA Component: LessonPDF Pass
Vendor: Lumina Chapter: 01

0011_0026_CHEM_NA_S_CH01_L2_138115.indd 27/08/19 05:24PM 0011_0026_CHEM_NA_S_CH01_L2_138115.indd 0011_0026_CHEM_NA_S_CH01_L2_138115.indd 27/08/19 05:24PM 0011_0026_CHEM_NA_S_CH01_L2_138115.indd
TemperaturePeople often use qualitative descriptions, such as hot and cold, when describing the weather or the water in a swimming pool. Temperature, however, is a quantitative measurement of the average kinetic energy of the particles that make up an object. As the particle motion in an object increases, so does the temperature of the object.
Measuring temperature requires a thermometer or a temperature probe. A thermome-ter consists of a narrow tube that contains a liquid. The height of the liquid indicates the temperature. A change in temperature causes a change in the volume of the liquid, which results in a change in the height of the liquid in the tube. Electronic temperature probes make use of thermocouples. A thermocouple produces an electric current that can be calibrated to indicate temperature.
Several different temperature scales have been developed. Three temperature scales—Kelvin, Celsius, and Fahrenheit—are commonly used to describe how hot or cold an object is.
Fahrenheit In the United States, the Fahrenheit scale is used to measure temperature. German scientist Gabriel Daniel Fahrenheit devised the scale in 1724. On the Fahrenheit scale, water freezes at 32°F and boils at 212°F.
Celsius Another temperature scale, the Celsius scale, is used throughout much of the rest of the world. Anders Celsius, a Swedish astronomer, devised the Celsius scale. The scale is based on the freezing and boiling points of water. He defined the freezing point of water as 0 and the boiling point of water as 100. He then divided the distance between these two fixed points into 100 equal units, or degrees. To convert from degrees Celsius (°C) to degrees Fahrenheit (°F), you can use the following equation.
°F = 1.8(°C) + 32
Imagine a friend from Canada calls you and says that it is 35°C outside. What is the temperature in degrees Fahrenheit? To convert to degrees Fahrenheit, substitute 35°C into the above equation and solve.
1.8(35) + 32 = 95°F
If it is 35°F outside, what is the temperature in degrees Celsius?
35°F - 32 ________ 1.8 = 1.7°C
Kelvin The SI base unit for temperature is the kelvin (K). The Kelvin scale was devised by a Scottish physicist and mathematician, William Thomson, who was known as Lord Kelvin. Zero kelvin is a point where all particles are at their lowest possible energy state. On the Kelvin scale, water freezes at 273.15 K and boils at 373.15 K. Later, you will learn why scientists use the Kelvin scale to describe properties of a gas.
Get It?Infer Which is warmer, 25°F or 25°C?
14 Module 1 • The Central Science
Program: HSS_NA Component: LessonPDF Pass
Vendor: Aptara Chapter: 01

C02_005A-904239
380
370
360
350
340
330
320
310
300
290
280
270
260
Boilingpoint ofwater
Freezingpointof water
Absolutezero
Kelvin Scale Celsius Scale
°CK110
100
90
80
70
60
50
40
30
20
10
0
−10
−250
−260
20
10
373.15
273.15
0
100.00
0.00
−273.15
21/05/18 09:18AM 0011_0026_CHEM_CA_S_CH01_L2_138115.indd 21/05/18 09:18AM21/05/18 09:18AM 0011_0026_CHEM_CA_S_CH01_L2_138115.indd 21/05/18 09:18AM
Figure 8 compares the Celsius and Kelvin scales. It is easy to convert between the Celsius scale and the Kelvin scale using the following equation.
Kelvin-Celsius Conversion Equation
K = °C + 273 K represents temperature in kelvins. °C represents temperature in degrees Celsius.
Temperature in kelvins is equal to temperature in degrees Celsius plus 273.
As shown by the equation above, to convert temperatures reported in degrees Celsius to kelvins, you simply add 273. For example, consider the element mercury, which melts at -39°C. What is this temperature in kelvins?
-39°C + 273 = 234 K
To convert from kelvins to degrees Celsius, just subtract 273.
For example, consider the element bromine, which melts at 266 K. What is this temperature in degrees Celsius?
266 K - 273 = -7°C
You will use these conversions frequently throughout chemis-try, especially when you study how gases behave. The gas laws you will learn are based on kelvin temperatures.
Derived UnitsNot all quantities can be measured with SI base units. For example, the SI unit for speed is meters per second (m/s). Notice that meters per second includes two SI base units—the meter and the second. A unit that is defined by a combination of base units is called a derived unit. Two other quantities that are measured in derived units are volume (cm3) and density (g/cm3).
Volume Volume is the space occupied by an object. The volume of an object with a cubic or rectangular shape can be determined by multiplying its length, width, and height dimensions. When each dimension is given in meters, the calculated volume has units of cubic meters (m3). In fact, the derived SI unit for volume is the cubic meter.
It is easy to visualize a cubic meter; imagine a large cube whose sides are each 1 m in length. The volume of an irregularly shaped solid can be determined using the water displacement method.
Figure 8 A change of 1 K on the Kelvin scale is equal in size to a change of 1°C on the Celsius scale. Notice also that the degree sign (°) is not used with the Kelvin scale.
Lesson 2 • Measurement 15
Program: HSS_NA Component: LessonPDF Pass
Vendor: Lumina Chapter: 01

C02_006A-904239
Illustration not to scale.
1 m3 = 1000 dm3
1 m
1 m
1 dm
1 dm 1 dm
1 m
1 dm3 = 1000 cm3 = 1 L
1 cm3 = 1000 mm3
1 cm1 cm 1 cm
1 dm
1 mm1 mm 1 mm
1 cm
1 dm
1 cm
1 cm
1 dm
0011_0026_CHEM_CA_S_CH01_L2_138115.indd 21/05/18 09:18AM 0011_0026_CHEM_CA_S_CH01_L2_138115.indd 0011_0026_CHEM_CA_S_CH01_L2_138115.indd 0011_0026_CHEM_CA_S_CH01_L2_138115.indd 21/05/18 09:18AM
The cubic meter is a large volume that is difficult to work with. For everyday use, a more useful unit of volume is the liter. A liter (L) is equal to one cubic decimeter (dm3), that is, 1 L equals 1 dm3. Liters are commonly used to measure the volume of water and beverage containers. One liter has about the same volume as one quart.
For smaller quantities of liquids in the laboratory, volume is often measured in cubic centimeters (cm3) or milliliters (mL). A milliliter and a cubic centimeter are equal in size.
1 mL = 1 cm3
Recall that the prefix milli- means one-thousandth. Therefore, one milliliter is equal to one-thousandth of a liter. In other words, there are 1000 mL in 1 L.
1 L = 1000 mL
Figure 9 shows the relationships among several different SI units of volume.
Figure 9 The three cubes show volume relationships between cubic meters (m3), cubic decimeters (dm3), cubic centimeters (cm3), and cubic millimeters (mm3). As you move from left to right, the volume of each cube gets 10 × 10 × 10, or 1000 times, smaller.Interpret How many cubic centimeters (cm3) are in 1 L?
Get It?Observe the photo at the beginning of this module. Explain why it is important for architects and builders to pay close attention to units when designing and constructing a new building.
16 Module 1 • The Central Science
Program: HSS_NA Component: LessonPDF Pass
Vendor: Lumina Chapter: 01

(t)M
att
Mea
dow
s/M
cGra
w-H
ill E
duca
tion
; (b)
Fahi
m A
bdel
maj
id/A
lam
y
17/12/18 05:58PM 0011_0026_CHEM_CA_S_CH01_L2_674695.indd 17/12/18 05:58PM0011_0026_CHEM_CA_S_CH01_L2_674695.indd 17/12/18 05:58PM17/12/18 05:58PM
Density You can explain why it is easier to lift a backpack filled with gym clothes than the same backpack filled with books in terms of density—the book-filled backpack contains more mass in the same volume. Density is a physical property of matter and is defined as the amount of mass per unit volume. Common units of density are grams per cubic centimeter (g/cm3) for solids and grams per milliliter (g/mL) for liquids and gases. Another exam-ple is shown in Figure 10.
The density of a substance usually cannot be measured directly. Rather, it is calculated using mass and volume measurements. You can calculate density using the following equation.
Density Equation
density = mass _ volume
The density of an object or a sample of matter is equal to its mass divided by its volume.
Because density is a physical property of matter, it can sometimes be used to identify an unknown element. For example, imagine a piece of an unknown metallic element that has a volume of 5.0 cm3 and a mass of 13.5 g. Substituting these values into the equation for density yields:
density = 13.5 g
______ 5.0 cm3 = 2.7 g/cm3
Real-World ChemistryLiquid Density Measurement
HYDROMETERS A hydrometer is a device that measures the specific gravity (the ratio of the fluid’s density to that of water) of a fluid. Fluids of different densities result in different readings. Hydrometers are often used at service stations to diagnose problems with an automobile’s battery.
Get It?State the quantities that must be known in order to calculate density.
Figure 10 The grape and the foam have the same mass, but the grape occupies less volume. The grape’s density must be greater than the foam’s.Interpret How would the masses compare if the volumes were equal?
Lesson 2 • Measurement 17
Program: HSS_NA Component: LessonPDF Pass
Vendor: Lumina Chapter: 01

0011_0026_CHEM_CA_S_CH01_L2_138115.indd 21/05/18 09:18AM 0011_0026_CHEM_CA_S_CH01_L2_138115.indd 0011_0026_CHEM_CA_S_CH01_L2_138115.indd 21/05/18 09:18AM 0011_0026_CHEM_CA_S_CH01_L2_138115.indd
Now go to Table R–7 in the Student Resources and find a density value that closely matches the calculated value of 2.7 g/cm3. What is the identity of the unknown element?
Your textbook includes many Example Problems, each of which is solved using a three-step process. Read Example Problem 1 and follow the steps to calculate the mass of an object using density and volume.
EXAMPLE Problem 1
USING DENSITY AND VOLUME TO FIND MASS When a piece of aluminum is placed in a 25-mL graduated cylinder that contains 10.5 mL of water, the water level rises to 13.5 mL. What is the mass of the aluminum?
1 ANALYZE THE PROBLEMThe mass of aluminum is unknown. The known values include the initial and final volumes and the density of aluminum. The volume of the sample equals the volume of water displaced in the graduated cylinder. According to Table R-7, the density of aluminum is 2.7 g/mL. Use the density equation to solve for the mass of the aluminum sample.
Known Unknowndensity = 2.7 g/mL mass = ? ginitial volume = 10.5 mLfinal volume = 13.5 mL
2 SOLVE FOR THE UNKNOWNvolume of sample = final volume - State the equation for volume.
initial volume
volume of sample = 13.5 mL - Substitute final volume = 13.5 mL 10.5 mL and initial volume = 10.5 mL.
volume of sample = 3.0 mL
density = mass _____ volume State the equation for density.
mass = volume × density Solve the density equation for mass.
mass = 3.0 mL × 2.7 g/mL Substitute volume = 3.0 mL and density = 2.7 g/mL.
mass = 3.0 mL × 2.7 g/mL = 8.1 g Multiply, and cancel units.
3 EVALUATE THE ANSWERCheck your answer by using it to calculate the density of aluminum.
density = mass _____ volume = 8.1 g
_____ 3.0 mL = 2.7 g/mL
Because the calculated density for aluminum is correct, the mass value must also be correct.
THE PROBLEM 1. Read the problem carefully.2. Be sure that you understand
what is being asked.
ANALYZE THE PROBLEM 1. Read the problem again.2. Identify what you are given,
and list the known data. If needed, gather information from graphs, tables, or figures.
3. Identify and list the unknowns.
4. Plan the steps you will follow to find the answer.
SOLVE FOR THE UNKNOWN 1. Determine whether you need
a sketch to solve the problem.
2. If the solution is mathematical, write the equation and isolate the unknown factor.
3. Substitute the known quantities into the equation.
4. Solve the equation.5. Continue the solution
process until you solve the problem.
EVALUATE THE ANSWER 1. Reread the problem. Is the
answer reasonable?2. Check your math. Are the units
and the significant figures correct? (Refer to Lesson 3.)
18 Module 1 • The Central Science
Program: HSS_NA Component: LessonPDF Pass
Vendor: Lumina Chapter: 01

C02_011A-904239
©D
enni
s M
acD
onal
d/A
lam
y
21/05/18 09:18AM 0011_0026_CHEM_CA_S_CH01_L2_138115.indd 21/05/18 09:18AM21/05/18 09:18AM 0011_0026_CHEM_CA_S_CH01_L2_138115.indd 21/05/18 09:18AM
Figure 11 At more than 45 carats, the Hope Diamond is the world’s largest deep-blue diamond. Originally mined in India, the diamond’s brilliant blue color is due to trace amounts of boron within the diamond. Diamonds are formed from a unique structure of carbon atoms, creating one of nature’s hardest known substances. Note that a carat is a unit of measure used for gemstones (1 carat = 200 mg).
PRACTICE Problems
11. Is the cube pictured at right made of pure aluminum? Explain your answer.
12. What is the volume of a sample that has a mass of 20 g and a density of 4 g/mL?
13. CHALLENGE A 147-g piece of metal has a density of 7.00 g/mL. A 50-mL graduated cylinder contains 20.0 mL of water. What is the final volume after the metal is added to the graduated cylinder?
C02_009A-904239
Mass = 20 gVolume = 5 cm3
ADDITIONAL PRACTICE
EARTH SCIENCE Connection As air at the equator is warmed, the particles in the air move farther apart and the air density decreases. At the poles, the air cools and its density increases as the particles move closer together. When a cooler, denser air mass sinks beneath a rising warm air mass, winds are produced. Weather patterns are created by moving air masses of different densities.
Scientific NotationThe Hope Diamond, which is shown in Figure 11, contains approximately 460,000,000,000,000,000,000,000 atoms of carbon. Each of these carbon atoms has a mass of 0.00000000000000000000002 g. If you were to use these numbers to calculate the mass of the Hope Diamond, you would find that the zeros would get in your way. Using a calculator offers no help, as it won’t let you enter numbers this large or this small. Numbers such as these are best expressed in scientific notation. Scientists use this method to conveniently restate a number without changing its value.
Lesson 2 • Measurement 19
Program: HSS_NA Component: LessonPDF Pass
Vendor: Lumina Chapter: 01
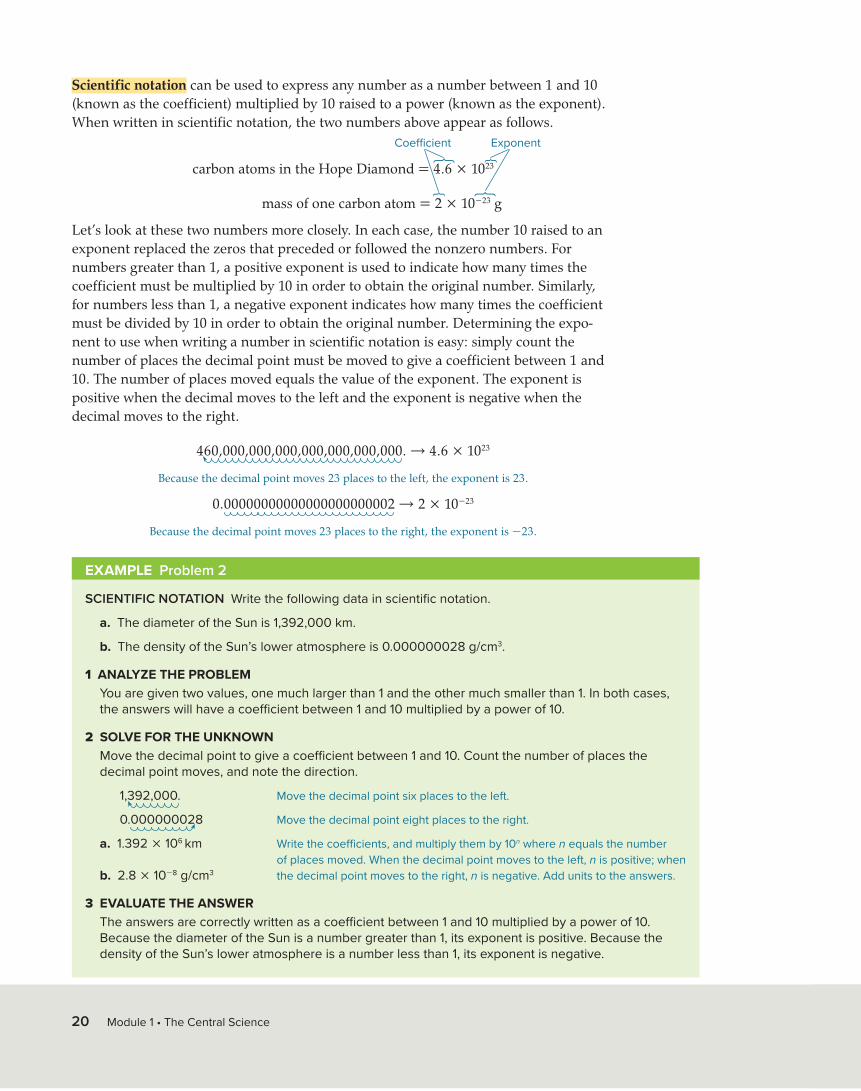
0011_0026_CHEM_CA_S_CH01_L2_138115.indd 21/05/18 09:18AM 0011_0026_CHEM_CA_S_CH01_L2_138115.indd 0011_0026_CHEM_CA_S_CH01_L2_138115.indd 21/05/18 09:18AM 0011_0026_CHEM_CA_S_CH01_L2_138115.indd
Scientific notation can be used to express any number as a number between 1 and 10 (known as the coefficient) multiplied by 10 raised to a power (known as the exponent). When written in scientific notation, the two numbers above appear as follows.
carbon atoms in the Hope Diamond = 4.6 × 10²³
mass of one carbon atom = 2 × 10-23 g
Let’s look at these two numbers more closely. In each case, the number 10 raised to an exponent replaced the zeros that preceded or followed the nonzero numbers. For numbers greater than 1, a positive exponent is used to indicate how many times the coefficient must be multiplied by 10 in order to obtain the original number. Similarly, for numbers less than 1, a negative exponent indicates how many times the coefficient must be divided by 10 in order to obtain the original number. Determining the expo-nent to use when writing a number in scientific notation is easy: simply count the number of places the decimal point must be moved to give a coefficient between 1 and 10. The number of places moved equals the value of the exponent. The exponent is positive when the decimal moves to the left and the exponent is negative when the decimal moves to the right.
460,000,000,000,000,000,000,000. → 4.6 × 10²³
Because the decimal point moves 23 places to the left, the exponent is 23.
0.00000000000000000000002 → 2 × 10-23
Because the decimal point moves 23 places to the right, the exponent is -23.
Coefficient Exponent
}
}}
}
EXAMPLE Problem 2
SCIENTIFIC NOTATION Write the following data in scientific notation.
a. The diameter of the Sun is 1,392,000 km.
b. The density of the Sun’s lower atmosphere is 0.000000028 g/cm3.
1 ANALYZE THE PROBLEMYou are given two values, one much larger than 1 and the other much smaller than 1. In both cases, the answers will have a coefficient between 1 and 10 multiplied by a power of 10.
2 SOLVE FOR THE UNKNOWNMove the decimal point to give a coefficient between 1 and 10. Count the number of places the decimal point moves, and note the direction.
1,392,000. Move the decimal point six places to the left.
0.000000028 Move the decimal point eight places to the right.
a. 1.392 × 10⁶ km Write the coefficients, and multiply them by 10n where n equals the number of places moved. When the decimal point moves to the left, n is positive; when b. 2.8 × 10⁻⁸ g/cm3 the decimal point moves to the right, n is negative. Add units to the answers.
3 EVALUATE THE ANSWERThe answers are correctly written as a coefficient between 1 and 10 multiplied by a power of 10. Because the diameter of the Sun is a number greater than 1, its exponent is positive. Because the density of the Sun’s lower atmosphere is a number less than 1, its exponent is negative.
20 Module 1 • The Central Science
Program: HSS_NA Component: LessonPDF Pass
Vendor: Lumina Chapter: 01

©D
azzo
/Rad
ius
Imag
es/A
lam
y
21/05/18 09:18AM 0011_0026_CHEM_CA_S_CH01_L2_138115.indd 21/05/18 09:18AM21/05/18 09:18AM 0011_0026_CHEM_CA_S_CH01_L2_138115.indd 21/05/18 09:18AM
Figure 12 The uneven heating of Earth’s surface causes wind, which powers these turbines and generates electricity.
Addition and subtraction In order to add or subtract numbers written in scientific nota-tion, the exponents must be the same. Suppose you need to add 7.35 × 10² m and 2.43 × 10² m. Because the exponents are the same, you can simply add the coefficients.
(7.35 × 10² m) + (2.43 × 10² m) = 9.78 × 10² m
How do you add numbers in scientific notation when they have different exponents? Consider the amounts of energy produced by renewable energy sources in the United States, such as the wind-powered turbines in Figure 12. In 2008, the energy pro-duction amounts from renewable sources were as follows.
Hydroelectric 2.643 × 10¹⁸ J*
Biomass 4.042 × 10¹⁸ J
Geothermal 3.89 × 10¹⁷ J
Wind 5.44 × 10¹⁷ J
Solar 7.8 × 10¹⁶ J
* J stands for joules, a unit of energy.
To add these values, you must rewrite them with the same exponent. The two largest values have an exponent of 1018, so convert the other numbers to values with this exponent. These other exponents must increase to become 1018. As you learned earlier, each place the decimal shifts to the left increases the exponent by 1. Rewriting the values with exponents of 1018 and adding yields the following.
Hydroelectric 2.643 × 10¹⁸ J
Biomass 4.042 × 10¹⁸ J
Geothermal 0.389 × 10¹⁸ J
Wind 0.544 × 10¹⁸ J
Solar 0.078 × 10¹⁸ J
Total 7.696 × 10¹⁸ J
ADDITIONAL PRACTICEPRACTICE Problems
14. Express each number in scientific notation. a. 700 c. 4,500,000 e. 0.0054 g. 0.000000076 b. 38,000 d. 685,000,000,000 f. 0.00000687 h. 0.0000000008
15. CHALLENGE Express each quantity in regular notation along with its appropriate unit. a. 3.60 × 10⁵ s c. 5.060 × 10³ km b. 5.4 × 10⁻⁵ g/cm3 d. 8.9 × 10¹⁰ Hz
Lesson 2 • Measurement 21
Program: HSS_NA Component: LessonPDF Pass
Vendor: Lumina Chapter: 01

0011_0026_CHEM_CA_S_CH01_L2_674695.indd 17/12/18 05:58PM 0011_0026_CHEM_CA_S_CH01_L2_674695.indd 0011_0026_CHEM_CA_S_CH01_L2_674695.indd 17/12/18 05:58PM 0011_0026_CHEM_CA_S_CH01_L2_674695.indd
PRACTICE Problems
16. Solve each problem, and express the answer in scientific notation. a. (5 × 10⁻⁵) + (2 × 10⁻⁵) c. (9 × 10²) - (7 × 10²) b. (7 × 10⁸) - (4 × 10⁸) d. (4 × 10-12) + (1 × 10-12)
17. CHALLENGE Express each answer in scientific notation in the units indicated. a. (1.26 × 10⁴ kg) + (2.5 × 10⁶ g) in kg b. (7.06 g) + (1.2 × 10⁻⁴ kg) in kg c. (4.39 × 10⁵ kg) - (2.8 × 10⁷ g) in kg d. (5.36 × 10⁻¹ kg) - (7.40 × 10⁻² kg) in g
EXAMPLE Problem 3
MULTIPLYING AND DIVIDING NUMBERS IN SCIENTIFIC NOTATION Solve the following problems.
a. (2 × 103) × (3 × 102)b. (9 × 10⁸) ÷ (3 × 10⁻⁴)
1 ANALYZE THE PROBLEMYou are given numbers written in scientific notation to multiply and divide. For the multiplication problem, multiply the coefficients and add the exponents. For the division problem, divide the coefficients and subtract the exponent of the divisor from the exponent of the dividend.
9 × 10⁸ The exponent of the dividend is 8.3 × 10⁻⁴ The exponent of the divisor is -4.
Multiplication and divisionMultiplying and dividing numbers in scientific notation is a two-step process, but it does not require the exponents to be the same. For multiplication, multiply the coeffi-cients and then add the exponents. For division, divide the coefficients, then subtract the exponent of the divisor from the exponent of the dividend.
To calculate the mass of the Hope Diamond, multiply the number of carbon atoms by the mass of a single carbon atom.
(4.6 × 10²³ atoms)(2 × 10–23 g/ atom) = 9.2 × 100 g = 9.2 g
Note that any number raised to a power of 0 is equal to 1; thus, 9.2 × 100 g is equal to 9.2 g.
Get It?Restate the process used to multiply two numbers that are expressed in scientific notation.
ADDITIONAL PRACTICE
22 Module 1 • The Central Science
Program: HSS_NA Component: LessonPDF Pass
Vendor: Lumina Chapter: 01

Ble
nd Im
ages
/Mox
ie P
rodu
ctio
ns/G
etty
Imag
es
21/05/18 09:18AM 0011_0026_CHEM_CA_S_CH01_L2_138115.indd 21/05/18 09:18AM21/05/18 09:18AM 0011_0026_CHEM_CA_S_CH01_L2_138115.indd 21/05/18 09:18AM
EXAMPLE Problem 3 (continued)
2 SOLVE FOR THE UNKNOWNa. (2 × 103) × (3 × 102) State the problem.
2 × 3 = 6 Multiply the coefficients.
3 + 2 = 5 Add the exponents.
6 × 10⁵ Combine the parts.
b. (9 × 10⁸) ÷ (3 × 10⁻⁴) State the problem.
9 ÷ 3 = 3 Divide the coefficients.
8 - (-4) = 8 + 4 = 12 Subtract the exponents.
3 × 10¹² Combine the parts.
3 EVALUATE THE ANSWERTo test the answers, write out the original data and carry out the arithmetic. For example, Problem a becomes 2000 × 300 = 600,000, which is the same as 6 × 10⁵.
Dimensional AnalysisWhen planning a pizza party for a group of people, you might want to use dimensional analysis to figure out how many pizzas to order. Dimensional analysis is a systematic approach to problem solving that uses conversion factors to move, or convert, from one unit to another. A conversion factor is a ratio of equivalent values having different units. How many pizzas do you need to order if 32 people will attend a party, each person eats 3 slices of pizza, and each pizza has 8 slices? Figure 13 shows how conversion factors are used to calculate the number of pizzas needed for the party.
Figure 13 Dimensional analysis can be used to calculate the number of pizzas that must be ordered for a party. How many pizzas will you need if 32 people eat 3 slices per person and there are 8 slices in each pizza?
(32 people) ( 3 slices _ person ) ( 1 pizza
_ 8 slices ) = 12 pizzas
ADDITIONAL PRACTICEPRACTICE Problems
18. Solve each problem, and express the answer in scientific notation. a. (4 × 102) × (1 × 108) c. (6 × 10²) ÷ (2 × 101) b. (2 × 10-4) × (3 × 102) d. (8 × 10⁴) ÷ (4 × 101)19. CHALLENGE Calculate the areas and densities. Report the answers in the correct units. a. the area of a rectangle with sides measuring 3 × 101 cm and 3 × 10⁻² cm b. the area of a rectangle with sides measuring 1 × 103 cm and 5 × 10⁻¹ cm c. the density of a substance having a mass of 9 × 10⁵ g and a volume of 3 × 10⁻¹ cm3
d. the density of a substance having a mass of 4 × 10⁻³ g and a volume of 2 × 10⁻² cm3
Lesson 2 • Measurement 23
Program: HSS_NA Component: LessonPDF Pass
Vendor: Lumina Chapter: 01

0011_0026_CHEM_CA_S_CH01_L2_138115.indd 21/05/18 09:18AM 0011_0026_CHEM_CA_S_CH01_L2_138115.indd 0011_0026_CHEM_CA_S_CH01_L2_138115.indd 21/05/18 09:18AM 0011_0026_CHEM_CA_S_CH01_L2_138115.indd
Writing conversion factorsAs you just read, conversion factors are ratios of equivalent values. Not surprisingly, these conversion factors are derived from equality relationships, such as 12 eggs = 1 dozen eggs, or 12 inches = 1 foot. Multiplying a quantity by a conversion factor changes the units of the quantity without changing its value.
Most conversion factors are written from relationships between units. For example, the prefixes in Table 3 are the source of many conversion factors. From the relationship 1000 m = 1 km, the following conversion factors can be written.
1 km _ 1000 m and 1000 m _ 1 km
A derived unit, such as a density of 2.5 g/mL, can also be used as a conversion factor. The value shows that 1 mL of the substance has a mass of 2.5 g. The following two conversion factors can be written.
2.5 g
_ 1 mL and 1 mL _ 2.5 g
Percentages can also be used as conversion factors. A percentage is a ratio; it relates the number of parts of one component to 100 total parts. For example, a fruit drink containing 10% sugar by mass contains 10 g of sugar in every 100 g of fruit drink. The conversion factors for the fruit drink are as follows.
10 g sugar
__ 100 g fruit drink and 100 g fruit drink
__ 10 g sugar
Using conversion factorsA conversion factor used in dimensional analysis must accomplish two things: it must cancel one unit and introduce a new one. While working through a solution, all of the units except the desired unit must cancel. Suppose you want to know how many meters there are in 48 km. The relationship between kilometers and meters is 1 km = 1000 m. The conversion factors are as follows.
1 km _ 1000 m and 1000 m _ 1 km
To convert km to m, use the conversion factor that causes the km unit to cancel.
48 km × 1000 m _ 1 km = 48,000 m
PRACTICE Problems
20. Write two conversion factors for each of the following. a. a 16% (by mass) salt solution b. a density of 1.25 g/mL c. a speed of 25 m/s
21. CHALLENGE What conversion factors are needed to convert: a. nanometers to meters? b. density given in g/cm3 to a value in kg/m3?
ADDITIONAL PRACTICE
24 Module 1 • The Central Science
Program: HSS_NA Component: LessonPDF Pass
Vendor: Lumina Chapter: 01

1 km ______ 1000 m
21/05/18 09:18AM 0011_0026_CHEM_CA_S_CH01_L2_138115.indd 21/05/18 09:18AM21/05/18 09:18AM 0011_0026_CHEM_CA_S_CH01_L2_138115.indd 21/05/18 09:18AM
EXAMPLE Problem 4
USING CONVERSION FACTORS In ancient Egypt, small distances were measured in Egyptian cubits. An Egyptian cubit was equal to 7 palms, and 1 palm was equal to 4 fingers. If 1 finger was equal to 18.75 mm, convert 6 Egyptian cubits to meters.
1 ANALYZE THE PROBLEMA length of 6 Egyptian cubits needs to be converted to meters.
Known Unknownlength = 6 Egyptian cubits 1 palm = 4 fingers 1 m = 1000 mm length = ? m7 palms = 1 cubit 1 finger = 18.75 mm
2 SOLVE FOR THE UNKNOWNUse dimensional analysis to convert the units in the following order.
cubits → palms → fingers → millimeters → meters
6 cubits × 7 palms
_ 1 cubit × 4 fingers
_ 1 palm × 18.75 mm __ 1 finger × 1 meter __ 1000 mm = ? m
6 cubits × 7 palms
_ 1 cubit × 4 fingers
_ 1 palm × 18.75 mm __ 1 finger × 1 meter _ 1000 mm = 3.150 m
3 EVALUATE THE ANSWEREach conversion factor is a correct restatement of the original relationship, and all units except for the desired unit, meters, cancel.
Multiply by a series of conversion factors that cancels all the units except meter, the desired unit.
Multiply and divide the numbers as indicated, and cancel the units.
When converting a value with a large unit, such as km, to a value with a smaller unit, such as m, the numerical value increases. For example, 48 km (a value with a large unit) converts to 48,000 m (a larger numerical value with a smaller unit). Figure 14 illustrates the connection between the numerical value and the size of the unit for a conversion factor.
Now consider this question: How many eight-packs of water would you need if the 32 people attending your party each had two bottles of water? To solve the problem, identify the given quantities and the desired result. There are 32 people and each of them drinks two bottles of water. The desired result is the number of eight-packs. Using dimensional analysis yields the following.
32 people × 2 bottles _ person × 1 eight-pack
__ 8 bottles = 8 eight-packs
Figure 14 The two quanti-ties shown above are equivalent; that is, 1 km = 1000 m. Note that a smaller numerical value (1) accompa-nies the larger unit (km), and a larger numerical value (1000) accompanies the smaller unit (m).
ADDITIONAL PRACTICEPRACTICE Problems
Use Table 3 to solve each of the following.22. a. Convert 360 s to ms. e. Convert 2.45 × 10² ms to s.
b. Convert 4800 g to kg. f. Convert 5 μm to km. c. Convert 5600 dm to m. g. Convert 6.800 × 103 cm to km. d. Convert 72 g to mg. h. Convert 2.5 × 101 kg to Mg.
23. CHALLENGE Write the conversion factors needed to determine the number of seconds in one year.
Lesson 2 • Measurement 25
Program: HSS_NA Component: LessonPDF Pass
Vendor: Lumina Chapter: 01

C02_014A-904239
MPH
605040
30
20
10
0
7080
90
100
110
1200 1 6 4 5 3
2 3 5 01
0011_0026_CHEM_CA_S_CH01_L2_674695.indd 17/12/18 05:59PM0011_0026_CHEM_CA_S_CH01_L2_674695.indd 17/12/18 05:59PM
Go online to follow your personalized learning path to review, practice, and reinforce your understanding.
Summary• SI measurement units and
prefixes allow scientists to report data easily.
• Density is a ratio of mass to volume and can be used to identify a substance.
• A number expressed in scien-tific notation is written as a coefficient between 1 and 10 multiplied by 10 raised to a power.
• Dimensional analysis uses conversion factors to solve problems.
Check Your ProgressDemonstrate Understanding27. Define the SI units for length, mass, time, and
temperature.28. Describe how adding the prefix mega- to a unit
affects the quantity being described.29. Compare a base unit and a derived unit, and list the
derived units used for density and volume.30. Calculate Samples A, B, and C have masses of 80 g,
12 g, and 33 g, and volumes of 20 mL, 4 cm3, and 11 mL, respectively. Which of the samples have the same density?
31. Design a concept map that shows the relationships among the following terms: volume, derived unit, mass, base unit, time, and length.
32. Describe how scientific notation makes it easier to work with very large or very small numbers.
33. Write a conversion factor relating cubic centimeters and milliliters.
34. Explain how dimensional analysis is used to solve problems.
35. Apply Concepts A classmate converts 68 km to meters and gets 0.068 m as the answer. Explain why this answer is incorrect, and identify the likely source of the error.
36. Organize Create a flowchart that outlines when to use dimensional analysis and when to use scientific notation.
PRACTICE Problems
24. The speedometer at right displays a car’s speed in miles per hour. What is the car’s speed in km/h? (1 km = 0.62 mile)
25. How many seconds are in 24 h?26. CHALLENGE Vinegar is 5.00% acetic acid by mass and has a
density of 1.02 g/mL. What mass of acetic acid, in grams, is present in 185 mL of vinegar?
ADDITIONAL PRACTICE
26 Module 1 • The Central Science
Program: HSS_NA Component: LessonPDF Pass
Vendor: Lumina Chapter: 01

C02_015A-904239
An arrow in the centerindicates high accuracy.
Accurate
Precise butnot accurate
Arrows far from the centerindicate low accuracy.Arrows close togetherindicate high precision.
Accurateand precise
Arrows in the centerindicate high accuracy.Arrows close togetherindicate high precision.
Not accurateor precise
Arrows far from the centerindicate low accuracy.Arrows far apartindicate low precision.
0027_0035_CHEM_CA_S_CH01_L3_674695.indd 17/12/18 05:59PM0027_0035_CHEM_CA_S_CH01_L3_674695.indd 17/12/18 05:59PM
Accuracy and PrecisionTo a scientist, the terms accuracy and precision have very different meanings. Accuracy refers to how close a measured value is to an accepted value. Precision refers to how close a series of measurements are to one another. The archery target in Figure 15 illustrates the difference between accuracy and precision. For example, you measure in the lab the mass of an object three times. The arrows represent each measurement, and the center of the target is the accepted value.
Figure 15 An archery target illustrates the difference between accuracy and precision. An accurate shot is located near the bull’s-eye; precise shots are grouped closely together.Apply Why is it important to measure the same data more than once?
LESSON 3UNCERTAINTY IN DATA
Disciplinary Core Ideas Crosscutting Concepts Science & Engineering Practices3D THINKINGC C C
SEP DCI
COLLECT EVIDENCEUse your Science Journal to
record the evidence you collect as you complete the readings and activities in this lesson.
INVESTIGATE GO ONLINE to find these activities and more resources.
ChemLAB: Use Density to Date a Coin Plan and carry out an investigation to predict the patterns in mass and volume of pre-1982 or post-1982 pennies.
Laboratory: Effective Use of a Bunsen BurnerInterpret data to predict the effect of beaker distance from a Bunsen burner for efficient heating.
FOCUS QUESTION
Why are significant figures important?
Lesson 3 • Uncertainty in Data 27
Program: HSS_NA Component: LessonPDF Pass
Vendor: Lumina Chapter: 01

0027_0035_CHEM_CA_S_CH01_L3_138115.indd 21/05/18 09:19AM 0027_0035_CHEM_CA_S_CH01_L3_138115.indd 0027_0035_CHEM_CA_S_CH01_L3_138115.indd 21/05/18 09:19AM 0027_0035_CHEM_CA_S_CH01_L3_138115.indd
Table 4 Student Density and Error Data (Unknown was sucrose; density = 1.59 g/cm3)Student A Student B Student C
Density Error (g/cm3) Density Error (g/cm3) Density Error (g/cm3)Trial 1 1.54 g/cm3 –0.05 1.40 g/cm3 –0.19 1.70 g/cm3 +0.11
Trial 2 1.60 g/cm3 +0.01 1.68 g/cm3 +0.09 1.69 g/cm3 +0.10
Trial 3 1.57 g/cm3 –0.02 1.45 g/cm3 –0.14 1.71 g/cm3 +0.12
Average 1.57 g/cm3 1.51 g/cm3 1.70 g/cm3
These trial values are the most precise.
This average is the most accurate.
Consider the data in Table 4. Students were asked to find the density of an unknown white powder. Each student measured the volume and mass of three separate samples. They reported calculated densities for each trial and an average of the three calcula-tions. The powder, sucrose (table sugar), has a density of 1.59 g/cm3. Which student collected the most accurate data? Who collected the most precise data? Student A’s measurements are the most accurate because they are closest to the accepted value of 1.59 g/cm3. Student C’s measurements are the most precise because they are the closest to one another.
Recall that precise measurements might not be accurate. Looking at just the average of the densities can be misleading. Based solely on the average, Student B appears to have collected fairly reliable data. However, on closer inspection, Student B’s data are neither accurate nor precise. The data are not close to the accepted value, nor are they close to one another.
Error and percent error The density values reported in Table 4 are experimental values, which means they are values measured during an experiment. The known density of sucrose is an accepted value, which is a value that is considered true. To evaluate the accuracy of experimental data, you can compare how close the experimental value is to the accepted value. Error is defined as the difference between an experimental value and an accepted value. The errors for the experimental density values are also given in Table 4.
Error Equation
error = experimental value - accepted valueThe error associated with an experimental value is the difference between the experimental value and the accepted value.
a
a
b
b
28 Module 1 • The Central Science
Program: HSS_NA Component: LessonPDF Pass
Vendor: Lumina Chapter: 01

Food
Stoc
ker/
Shut
ters
tock
.com
21/05/18 09:19AM 0027_0035_CHEM_CA_S_CH01_L3_138115.indd 21/05/18 09:19AM21/05/18 09:19AM 0027_0035_CHEM_CA_S_CH01_L3_138115.indd 21/05/18 09:19AM
Scientists often want to know what percent of the accepted value an error represents. Percent error expresses error as a percentage of the accepted value.
Percent Error Equation
percent error = |error| ___________ accepted value × 100
The percent error of an experimental value equals the absolute value of its error divided by the accepted value, multiplied by 100.
Figure 16 This digital caliper is being used to check the size of a nut to one-hundredth of a millimeter (0.01 mm). Skill is required to correctly position the part in the caliper. Experienced machin-ists will obtain more precise and more accurate readings than inexperienced machinists.
Notice that the percent-error equation uses the absolute value of the error. This is because only the size of the error matters; it does not matter whether the experimental value is larger or smaller than the accepted value.
Percent error is an important concept for the machinist who made the nut shown in Figure 16. The machinist must check the tolerances of the nut. Tolerances are a narrow range of allowable dimensions based on acceptable amounts of error. If the dimensions of the nut do not fall within the acceptable range—that is, the nut exceeds its tolerances—it will be retooled or possibly discarded.
Get It?Summarize why error is important.
State the percent error equation.
Substitute error = -0.05 g/cm3, and solve.
Substitute error = 0.01 g/cm3, and solve.
Substitute error = -0.02 g/cm3, and solve.
EXAMPLE Problem 5
CALCULATING PERCENT ERROR Use Student A’s density data in Table 4 to calculate the percent error in each trial. Report your answers to two places after the decimal point.
1 ANALYZE THE PROBLEMYou are given the errors for a set of density calculations. To calculate percent error, you need to know the accepted value for density, the errors, and the equation for percent error.
Known Unknownaccepted value for density = 1.59 g/cm3 percent errors = ?errors: -0.05 g/cm3; 0.01 g/cm3; -0.02 g/cm3
2 SOLVE FOR THE UNKNOWN
percent error = |error|
________ accepted value × 100
percent error = |-0.05 g/cm3|
__ 1.59 g/cm3 × 100 = 3.14%
percent error = |0.01 g/cm3|
__ 1.59 g/cm3 × 100 = 0.63%
percent error = |-0.02 g/cm3|
__ 1.59 g/cm3 × 100 = 1.26%
Lesson 3 • Uncertainty in Data 29
Program: HSS_NA Component: LessonPDF Pass
Vendor: Lumina Chapter: 01

C02_017A-904239
0.03 cm is anestimated digit
0.2 cm is aknown digit
5 cm is a known digitCentimeters
43 4
652
0027_0035_CHEM_CA_S_CH01_L3_138115.indd 21/05/18 09:19AM 0027_0035_CHEM_CA_S_CH01_L3_138115.indd 0027_0035_CHEM_CA_S_CH01_L3_138115.indd 21/05/18 09:19AM 0027_0035_CHEM_CA_S_CH01_L3_138115.indd
EXAMPLE Problem 5 (continued)
3 EVALUATE THE ANSWERThe percent error is greatest for Trial 1, which had the largest error, and smallest for Trial 2, which was closest to the accepted value.
ADDITIONAL PRACTICE
Significant FiguresOften, precision is limited by the tools available. For example, a digital clock that displays the time as 12:47 or 12:48 can record the time only to the nearest minute. With a stopwatch, however, you might record time to the nearest hundredth second. As scientists have developed better measuring devices, they have been able to make more precise measurements. Of course, for measurements to be both accurate and precise, the measuring devices must be in good working order. Additionally, accurate and precise measurements rely on the skill of the person using the instrument; the user must be trained and use proper techniques.
The precision of a measurement is indicated by the number of digits reported. A value of 3.52 g is more precise than a value of 3.5 g. The reported digits are called significant figures. Significant figures include all known digits plus one estimated digit.
Consider the rod in Figure 17. The end of the rod falls between 5.2 cm and 5.3 cm. The 5 and 2 are known digits corresponding to marks on the ruler. To these known digits, an estimated digit is added. This last digit estimates the rod’s location between the second and third millimeter marks. Because it is an estimate, one person might report the measurement as 5.22 cm and another as 5.23 cm. Either way, the measurement has three significant figures—two known and one estimated.
Figure 17 The markings on the ruler represent known digits. The reported measurement includes the known digits plus the estimated digit. The measurement is 5.23 cm.Infer What is the estimated digit if the length of an object being measured falls exactly on the 5-cm mark?
PRACTICE Problems
Answer the following questions using data from Table 4. 37. Calculate the percent errors for Student B’s trials.38. Calculate the percent errors for Student C’s trials.39. CHALLENGE Based on your calculations in questions 37 and 38, which student’s trial was the
most accurate? The least accurate?
30 Module 1 • The Central Science
Program: HSS_NA Component: LessonPDF Pass
Vendor: Lumina Chapter: 01

21/05/18 09:19AM 0027_0035_CHEM_CA_S_CH01_L3_138115.indd 21/05/18 09:19AM21/05/18 09:19AM 0027_0035_CHEM_CA_S_CH01_L3_138115.indd 21/05/18 09:19AM
PROBLEM-SOLVING STRATEGY
Recognizing Significant FiguresLearning these five rules for recognizing significant figures will help you when solving problems. Examples of each rule are shown below. Note that each of the highlighted examples has three significant figures.Rule 1. Nonzero numbers are always significant.Rule 2. All final zeros to the right of the decimal are significant.Rule 3. Any zero between significant figures is significant.Rule 4. Placeholder zeroes are not significant. To remove placeholder
zeros, rewrite the number in scientific notation.Rule 5. Counting numbers and defined constants have an infinite
number of significant figures.
EXAMPLE Problem 6
SIGNIFICANT FIGURES Determine the number of significant figures in the following masses.
a. 0.00040230 g
b. 405,000 kg
1 ANALYZE THE PROBLEMYou are given two measured mass values. Apply the appropriate rules to determine the number of significant figures in each value.
2 SOLVE FOR THE UNKNOWNCount all nonzero numbers, zeros between nonzero numbers, and final zeros to the right of the decimal place. (Rules 1, 2, and 3)
Ignore zeros that act as placeholders. (Rule 4)
a. 0.00040230 g has five significant figures.
b. 405,000 kg has three significant figures.
3 EVALUATE THE ANSWEROne way to verify your answers is to write the values in scientific notation: 4.0230 × 10⁻⁴ g and 4.05 × 10⁵ kg. Without the placeholder zeros, it is clear that 0.00040230 g has five significant figures and that 405,000 kg has three significant figures.
Remember that measurements reported with a lot of significant figures might be precise but not accurate. For example, some chemistry labs have balances that report mass to the nearest hundreth of a gram. If you and each of your classmates measured the same copper cylinder on the same balance, you would probably have a group of very precise measurements. But what if the balance had been previously damaged by an object that was too large for it? Your precise measurements would not be very accurate.
72.3 g has three.6.20 g has three.60.5 g has three.0.0253 g and 4320 g (each has three)6 molecules 60 s = 1 min
Lesson 3 • Uncertainty in Data 31
Program: HSS_NA Component: LessonPDF Pass
Vendor: Lumina Chapter: 01

Mat
t M
eado
ws/
McG
raw
-Hill
Edu
cati
on
0027_0035_CHEM_CA_S_CH01_L3_138115.indd 21/05/18 09:19AM 0027_0035_CHEM_CA_S_CH01_L3_138115.indd 0027_0035_CHEM_CA_S_CH01_L3_138115.indd 0027_0035_CHEM_CA_S_CH01_L3_138115.indd 21/05/18 09:19AM
PRACTICE Problems
Determine the number of significant figures in each measurement.40. a. 508.0 L c. 1.0200 × 10⁵ kg b. 820,400.0 L d. 807,000 kg 41. a. 0.049450 s c. 3.1587 × 10⁻⁴ g b. 0.000482 mL d. 0.0084 mL42. CHALLENGE Write the numbers 10, 100, and 1000 in scientific notation with two, three, and four
significant figures, respectively.
ADDITIONAL PRACTICE
Rounding NumbersCalculators perform flawless arithmetic, but they are not aware of the number of significant figures that should be reported in the answer. For example, a density calculation should not have more significant figures than the original data with the fewest significant figures. To report a value correctly, you often need to round. Consider an object with a mass of 22.44 g and volume of 14.2 cm3. When you calculate the object’s density using a calculator, the displayed answer is 1.5802817 g/cm3, as shown in Figure 18. Because the measured mass had four significant figures and the measured volume had three, it is not correct to report the calculated density value with eight significant fig-ures. Instead, the density must be rounded to three significant figures, or 1.58 g/cm3.
Consider the value 3.515014. How would you round this number to five significant figures? To three significant figures? In each case, you need to look at the digit that follows the desired last significant figure. To round to five digits, first identify the fifth significant figure, in this case 0, and then look at the number to its right, in this case 1.
Last significant figure
3.515014Number to right of last significant figure
Do not change the last significant figure if the digit to its right is less than five. Because a 1 is to the right, the number rounds to 3.5150. If the number had been 5 or greater, you would have rounded up. To round to three digits, identify the third significant figure, in this case 1, and then look at the number to its right, in this case 5.
Last significant figure
3.515014Number to right of last significant figure
If the digits to the right of the last significant figure are a 5 followed by 0, then look at the last significant figure. If it is odd, round it up; if it is even, do not round up. Because the last significant digit is odd (1), the number rounds up to 3.52.
Figure 18 You need to apply the rules of significant figures and rounding to report a calculated value correctly.
32 Module 1 • The Central Science
Program: HSS_NA Component: LessonPDF Pass
Vendor: Lumina Chapter: 01

21/05/18 09:19AM 0027_0035_CHEM_CA_S_CH01_L3_138115.indd 21/05/18 09:19AM0027_0035_CHEM_CA_S_CH01_L3_138115.indd 21/05/18 09:19AM21/05/18 09:19AM
PROBLEM-SOLVING STRATEGY
Rounding NumbersLearn these four rules for rounding, and use them when solving problems. Examples of each rule are shown below. Note that each example has three significant figures.
2.532 → 2.53 Rule 1. If the digit to the right of the last significant figure is less than 5, do not change the last significant figure.
2.536 → 2.54 Rule 2. If the digit to the right of the last significant figure is greater than 5, round up the last significant figure.
2.5351 → 2.54 Rule 3. If the digits to the right of the last significant figure are a 5 followed by a nonzero digit, round up the last significant figure.
2.5350 → 2.54 Rule 4. If the digits to the right of the last significant figure are a 5 followed by 0 or no other number at all, look at the last significant figure. If it is odd, round it up; if it is even, do not round up.
PRACTICE Problems
43. Round each number to four significant figures. a. 84,791 kg c. 256.75 cm b. 38.5432 g d. 4.9356 m44. CHALLENGE Round each number to four significant figures, and write
the answer in scientific notation. a. 0.00054818 g c. 308,659,000 mm b. 136,758 kg d. 2.0145 mL
Addition and subtraction When you add or subtract measurements, the answer must have the same number of digits to the right of the decimal as the original value having the fewest number of digits to the right of the decimal. For example, the measurements 1.24 mL, 12.4 mL, and 124 mL have two, one, and zero digits to the right of the decimal, respectively. When adding or subtracting, arrange the values so that the decimal points align. Identify the value with the fewest places after the decimal point, and round the answer to that number of places.
Get It?Determine how many places after the decimal point should the sum of 22.7 m, 5.16 m, 16.287 m, and 124.31 m have?
Multiplication and division When you multiply or divide numbers, your answer must have the same number of significant figures as the measurement with the fewest significant figures.
ADDITIONAL PRACTICE
2.5250 → 2.52
Lesson 3 • Uncertainty in Data 33
Program: HSS_NA Component: LessonPDF Pass
Vendor: Lumina Chapter: 01

0027_0035_CHEM_CA_S_CH01_L3_674695_13329.indd 25/06/18 03:53PM0027_0035_CHEM_CA_S_CH01_L3_674695_13329.indd 25/06/18 03:53PM
EXAMPLE Problem 8
ROUNDING NUMBERS WHEN MULTIPLYING Calculate the volume of a book with the following dimensions: length = 28.3 cm, width = 22.2 cm, height = 3.65 cm.
1 ANALYZE THE PROBLEMVolume is calculated by multiplying length, width, and height. Because all of the measurements have three significant figures, the answer also will.
Known Unknownlength = 28.3 cm height = 3.65 cm Volume = ? cm3
width = 22.2 cm
2 SOLVE FOR THE UNKNOWNCalculate the volume, and apply the rules of significant figures and rounding.
Volume = length × width × height State the formula for the volume of a rectangle.
Volume = 28.3 cm × 22.2 cm × 3.65 cm = 2293.149 cm3 Substitute values and solve.
Volume = 2290 cm3 Round the answer to three significant figures.
EXAMPLE Problem 7
ROUNDING NUMBERS WHEN ADDING A student measured the length of his lab partners’ shoes. If the lengths are 28.0 cm, 23.538 cm, and 25.68 cm, what is the total length of the shoes?
1 ANALYZE THE PROBLEMThe three measurements need to be aligned on their decimal points and added. The measurement with the fewest digits after the decimal point is 28.0 cm, with one digit. Thus, the answer must be rounded to only one digit after the decimal point.
2 SOLVE FOR THE UNKNOWN 28.0 cm 23.538 cm Align the measurements and add the values.+ 25.68 cm
77.218 cm
The answer is 77.2 cm. Round to one place after the decimal; Rule 1 applies.
3 EVALUATE THE ANSWERThe answer, 77.2 cm, has the same precision as the least-precise measurement, 28.0 cm.
ADDITIONAL PRACTICEPRACTICE Problems
45. Add and subtract as indicated. Round off when necessary. a. 43.2 cm + 51.0 cm + 48.7 cm b. 258.3 kg + 257.11 kg + 253 kg46. CHALLENGE Add and subtract as indicated. Round off when necessary. a. (4.32 × 103 cm) - (1.6 × 104 mm) b. (2.12 × 107 mm) + (1.8 × 103 cm)
34 Module 1 • The Central Science
Program: HSS_NA Component: LessonPDF Pass
Vendor: Lumina Chapter: 01

0027_0035_CHEM_CA_S_CH01_L3_674695.indd 17/12/18 05:59PM0027_0035_CHEM_CA_S_CH01_L3_674695.indd 17/12/18 05:59PM
Go online to follow your personalized learning path to review, practice, and reinforce your understanding.
Summary• An accurate measurement is
close to the accepted value. A set of precise measurements shows little variation. The measurement device deter-mines the degree of precision possible.
• Error is the difference between the measured value and the accepted value. Percent error gives the percent deviation from the accepted value.
• The number of significant figures reflects the precision of reported data.
• Calculations are often rounded to the correct number of significant figures.
Check Your ProgressDemonstrate Understanding50. State how a measured value is reported in terms
of known and estimated digits. 51. Define accuracy and precision.52. Identify the number of significant figures in each of
these measurements of an object’s length: 76.48 cm, 76.47 cm, and 76.59 cm.
53. Apply The object in Question 52 has an actual length of 76.49 cm. Are the measurements in Ques-tion 52 accurate? Are they precise?
54. Calculate the error and percent error for each measurement in Question 52.
55. Apply Write an expression for the quantity 506,000 cm in which it is clear that all the zeros are significant.
56. Analyze Data Students collected mass data for a group of coins. The mass of a single coin is 5.00 g. Determine the accuracy and precision of the measurements.
Number of coins 5 10 20 30 50Mass (g) 23.2 54.5 105.9 154.5 246.2
EXAMPLE Problem 8 (continued)
3 EVALUATE THE ANSWERTo check if your answer is reasonable, round each measurement to one significant figure and recalculate the volume. Volume = 30 cm × 20 cm × 4 cm = 2400 cm3. Because this value is close to your calculated value of 2290 cm3, it is reasonable to conclude the answer is correct.
ADDITIONAL PRACTICEPRACTICE Problems
Perform the following calculations. Round the answers. 47. a. 24 m × 3.26 m c. 1.23 m × 2.0 m b. 120 m × 0.10 m d. 53.0 m × 1.53 m48. a. 4.84 m ÷ 2.4 s c. 102.4 m ÷ 51.2 s b. 60.2 m ÷ 20.1 s d. 168 m ÷ 58 s49. CHALLENGE (1.32 × 10³ g) ÷ (2.5 × 102 cm3)
Lesson 3 • Uncertainty in Data 35
Program: HSS_NA Component: LessonPDF Pass
Vendor: Lumina Chapter: 01

C02_019A-904239
Carbontetrachloride
12%
Hydrogenchloride
3%
Chlorine in the Stratosphere
Manufactured compoundsNatural sources
CFC–1228%
CFC–1123%
Methylchloride
15%
Methylchloroform
10%
HCFC–223%
CFC–136%
0036_0040_CHEM_CA_S_CH01_L4_674695.indd 07/01/19 12:43PM0036_0040_CHEM_CA_S_CH01_L4_674695.indd 07/01/19 12:43PM
GraphingA goal of many experiments is to discover whether a pattern exists in a certain situa-tion. When data are listed as shown in Table 5, a pattern might not be obvious. How-ever, using data to create a graph can help to reveal a pattern if one exists. A graph is a visual display of data.
Circle graphs The circle graph shown in Figure 19 is based on the percentage data given in Table 5. A circle graph is sometimes called a pie chart because it is divided into wedges that look like a pie. A circle graph is useful for showing parts of a fixed whole. The parts are usually labeled as percents with the whole circle representing 100%.
Figure 19 Although the percentage data presented in the table and the circle graph are basically the same, the circle graph makes it much easier to analyze.
Table 5 Sources of Chlorine in the Stratosphere
Source PercentHydrogen chloride (HCl) 3Methyl chloride (CH3Cl) 15Carbon tetrachloride (CCl4) 12Methyl chloroform (C2H3Cl3) 10CFC-11 23CFC-12 28CFC-13 6HCFC-22 3
FOCUS QUESTION
How can displaying data help you interpret it?
LESSON 4REPRESENTING DATA
3D THINKINGC C C
SEP DCI
COLLECT EVIDENCEUse your Science Journal to
record the evidence you collect as you complete the readings and activities in this lesson.
INVESTIGATE GO ONLINE to find these activities and more resources.
Laboratory: Making a GraphPlan and carry out an investigation to determine the patterns in information graphs provide beyond the initial data. Review the NewsObtain information from a current news story that uses graphs to convey information. Evaluate your source and communicate your findings to the class.
Science & Engineering Practices Crosscutting Concepts Disciplinary Core Ideas
36 Module 1 • The Central Science
Program: HSS_NA Component: LessonPDF Pass
Vendor: Lumina Chapter: 01

C02_020A-904239
Halibut(3 oz)
Almonds(1 oz)
Cashews(1 oz)
Spinach(½ cup)
Bakedpotato
(medium)
Branflakes
(¾ cup)
Kidneybeans(½ cup)
Raisins(¼ cup)
Food Serving
Dietary Sources of Magnesium
30
50
10
0
70
40
60
20
80
90
Mag
nesi
um c
onte
nt (m
g)
0036_0040_CHEM_CA_S_CH01_L4_674695.indd 07/01/19 12:44PM0036_0040_CHEM_CA_S_CH01_L4_674695.indd 07/01/19 12:44PM
Figure 20 A bar graph is an effective way to present and compare data. This graph shows various dietary sources of the element magnesium. Magnesium plays an important role in the health of your muscles, nerves, and bones.
Bar graphsA bar graph is often used to show how a quantity varies across categories. Examples of categories include time, location, and temperature. The quantity being measured appears on the vertical axis (y-axis). The independent variable appears on the horizon-tal axis (x-axis). The relative heights of the bars show how the quantity varies. A bar graph can be used to compare population figures for a single country by decade or the populations of multiple countries at the same point in time. In Figure 20, the quantity being measured is magnesium, and the category being varied is food servings. When examining the graph, you can quickly see how the magnesium content varies for these food servings.
Line graphs In chemistry, most graphs that you create and interpret will be line graphs. The points on a line graph represent the intersection of data for two variables—the independent variable and the dependent variable.
STEM CAREER Connection Graphic DesignerDo you enjoy art as much as you enjoy science? Graphic designers are good at making complicated scientific data more accessible. They can help scientists communicate their work to broad audiences in visually appealing ways. Some-times designers work by hand, but specialized design software is also commonly used. In general, graphic designers have a bachelor’s degree in graphic design or a related field.
Get It?Interpret Which two food servings provide equal amounts of magnesium?
Lesson 4 • Representing Data 37
Program: HSS_NA Component: LessonPDF Pass
Vendor: Lumina Chapter: 01

C02_021A-904239
AB
C
Volume (cm3)
Mas
s (g
)
Density of Aluminum
(20.0 cm3, 54 g)
(10.0 cm3, 27 g)
a
C02_022A-904239
Tem
pera
ture
(°C
) 212019181716150
Elevation (m)0 100 300 500 700
Temperaturev. Elevation
b
0036_0040_CHEM_CA_S_CH01_L4_138115.indd 21/05/18 09:19AM0036_0040_CHEM_CA_S_CH01_L4_138115.indd 21/05/18 09:19AM
Slope Equation
slope = rise ___ sun = Δy
___ Δx =
y2 - y1 ______ x2 - x1
The slope of a line is equal to the change in y divided by the change in x.
y2, y1, x2, and x1 are values from data points (x1, y1) and (x2, y2).
Independent and dependent variables The independent variable is the variable that a scientist deliberately changes during an experiment. The independent variable is plotted on the x-axis. The variable whose value depends on, or changes in response to, the independent variable is called the dependent variable. It is plotted on the y-axis. In Figure 21a, the independent variable is volume and the dependent variable is mass. What are the values for the independent variable and the dependent variable at Point B? Figure 21b is a graph of temperature versus elevation. Because the data points do not fit perfectly, the line cannot pass exactly through all of the points. The line must be drawn so that about as many points fall above the line as fall below it. This line is called a best-fit line.
Relationships between variables If the best-fit line for a set of data is straight, there is a linear relationship between the variables and the variables are said to be directly related. The relationship between the variables can be described further by analyzing the steepness, or slope, of the line.
If the best-fit line rises to the right, then the slope of the line is positive. A positive slope indicates that the dependent variable increases as the independent variable increases. If the best-fit line sinks to the right, then the slope of the line is negative. A negative slope indicates that the dependent variable decreases as the independent variable increases. In either case, the slope of the line is constant. You can use two pairs of data points to calculate the slope of the line. The slope is the rise (Δy) divided by the run (Δx).
When the mass of a material is plotted against its volume, the slope of the line rep-resents the material’s density. An example of this is shown in Figure 21a. To calculate the slope of the line, substitute the x and y values for Points A and B in the slope equation and solve.
slope = 54 g - 27 g
___ 20.0 cm3 - 10.0 cm3
= 27 g _ 10.0 cm3
= 2.7 g/cm3
Get It?Identify the graph that shows a direct relationship.
Figure 21 Both of these line graphs show linear relationships. The slope of each line is defined as the ratio of rise over run.
38 Module 1 • The Central Science
Program: HSS_NA Component: LessonPDF Pass
Vendor: Lumina Chapter: 01

C02_023A-904239
Aug Sep Oct Nov Dec Jan Feb Mar Apr
Tota
l ozo
ne (D
U) 400
300
200
100
0
1957–1972
1979–2010
Ozone Measurements
Month
0036_0040_CHEM_CA_S_CH01_L4_138115.indd 21/05/18 09:19AM0036_0040_CHEM_CA_S_CH01_L4_138115.indd 21/05/18 09:19AM
Thus, the slope of the line, and the density, is 2.7 g/cm3. When the best-fit line is curved, the relationship between the variables is nonlinear. In chemistry, you will study nonlinear relationships called inverse relationships. Refer to the Math Handbook for more discussion of graphs.
Interpreting GraphsYou should use an organized approach when analyzing graphs. First, note the indepen-dent and dependent variables. Next, decide if the relationship between the variables is linear or nonlinear. If the relationship is linear, is the slope positive or negative?
Interpolation and extrapolationWhen points on a line graph are connected, the data are considered to be continuous. Continuous data allow you to read the value from any point that falls between the recorded data points. This process is called interpolation. For example, from Figure 21b, what is the temperature at an elevation of 350 m? To interpolate this value, first locate 350 m on the x-axis; it is located halfway between 300 m and 400 m. Project upward until you hit the plotted line, and then project that point horizontally to the left until you reach the y-axis. The temperature at 350 m is approximately 17.8°C.
You can also extend a line beyond the plotted points in order to estimate values for the variables. This process is called extrapolation. It is important to be very careful with extrapolation, however, as it can easily lead to errors and result in very inaccurate predictions.
Interpreting ozone data The value of using graphs to visualize data is illustrated by Figure 22. These important ozone measurements were taken at the Halley Research Station in Antarctica. The graph shows how ozone levels vary from August to April. The independent and depen-dent variables are the month and the total ozone, respectively.
Figure 22 The two lines in this graph represent average ozone levels for two time periods, 1957–1972 and 1979–2010. The graph shows clearly that ozone levels in recent years have been lower overall than in 1957–1972. The ozone hole is generally considered to be the area where total ozone is less than 220 Dobson Units (DU).
Get It?Explain why extrapolation might be less reliable than interpolation.
Lesson 4 • Representing Data 39
Program: HSS_NA Component: LessonPDF Pass
Vendor: Lumina Chapter: 01

0036_0040_CHEM_CA_S_CH01_L4_674695.indd 17/12/18 05:59PM0036_0040_CHEM_CA_S_CH01_L4_674695.indd 17/12/18 05:59PM
Go online to follow your personalized learning path to review, practice, and reinforce your understanding.
Summary• Circle graphs show parts of
a whole. Bar graphs show how a factor varies with time, location, or temperature.
• Independent (x-axis) variables and dependent (y-axis) variables can be related in a linear or a nonlinear manner. The slope of a straight line is defined as rise/run, or Δy/Δx.
• Because line graph data are considered continuous, you can interpolate between data points or extrapolate beyond them.
Check Your ProgressDemonstrate Understanding 57. Explain why graphing can be an important tool for
analyzing data.58. Infer What type of data must be plotted on a graph
for the slope of the line to represent density?59. Relate If a linear graph has a negative slope, what
can you say about the dependent variable?60. Summarize What data are best displayed on a circle
graph? On a bar graph? 61. Construct a circle graph for the composition of air:
78.08% N2, 20.95% O2, 0.93% Ar, and 0.04% CO2 and other gases.
62. Infer from Figure 22 how long the ozone hole lasts.63. Apply Graph mass versus volume for the data given
in the table. What is the slope of the line?
Each line on the graph represents a different period of time. The red line represents average ozone levels from 1957 to 1972, during which time ozone levels varied from about 285 DU (Dobson units) to 360 DU. The blue line shows the ozone levels from 1979 to 2010. At no point during this period were the ozone levels as high as they were at corresponding times during 1957–1972.
The graph makes the ozone hole clearly evident—the dip in the blue line indicates the presence of the ozone hole. Having data from two time periods on the same graph allows scientists to compare recent data with data from a time before the ozone hole existed. Graphs similar to Figure 22 helped scientists identify a significant trend in ozone levels and verify the depletion in ozone levels over time.
Volume (cm3) 7.5 12 15 22Mass (g) 24.1 38.5 48.0 70.1
Get It?Interpret By how much did the total ozone vary during the 9-month period shown for 1979–2010?
40 Module 1 • The Central Science
Program: HSS_NA Component: LessonPDF Pass
Vendor: Lumina Chapter: 01

Julia
Hie
baum
/Ala
my
Stoc
k Ph
oto
COMMUNICATE SCIENTIFIC INFORMATION
Using digital or print resources, find more information about fentanyl and its analogs. Create a short video that warns your peers about the deadly substances that are often mixed with heroin. Include information about the differing chemical formulas of the analogs.
C C C
SEP DCI
0041-0041_CHEM_CA_S_CH01_Feature_674695.indd 17/12/18 05:59PM0041-0041_CHEM_CA_S_CH01_Feature_674695.indd 17/12/18 05:59PM
Fentanyl and Its Analogs
Opioids are chemicals that interact with receptors on nerve cells to reduce pain. They can also cause pleasurable feelings. Because of the effects that opioids have on the body, they can be highly addictive. Fentanyl is an opiate that is used to relieve post-surgical pain, as well as the pain of some cancers. It is also powerfully euphoric, which is why it is illegally mixed with heroin. However, just a few grains of fentanyl are fatal to most people—thus the uptick in overdoses.
It is illegal in the U.S. to sell or use fentanyl, unless a person has a prescription. In response, chemists in illegal underground labs—many located in China and other countries, beyond the reach of U.S. law enforcement—have slightly altered the formula of the fentanyl molecule, creating substances known as analogs that
are weaker or stronger than fentanyl. Chemists do this by adding atoms to the molecule or by moving groups of atoms within the molecule.
For example, chemists add two atoms of carbon and two atoms of hydrogen to the fentanyl molecule to create the analog carfentanil, which is 100 times as strong as fentanyl. Illegal overseas labs also sell the chemicals needed to make fentanyl and its analogs, including carfentanil, to underground chemists working with drug dealers in the U.S.
Analogs have effects similar to fentanyl, but they are not illegal because their chemical structures are different. Lawmakers are constantly playing catch-up; they outlaw one substance, only to find another, similar substance being sold on the streets a short time later.
A Deadly Chemical Attraction
SCIENCE & SOCIETY
The chemical formula of fentanyl is C22H28N2O, but parts of the molecule can be modified to form slightly different drugs.
Over the last few decades, heroin addiction has claimed the lives of thousands of people in the United States. The heroin-related overdose death rate has quadrupled since 2010. In recent years, however, the mixing of heroin with a drug called fentanyl has sent the overdose death rate skyrocketing. In 2016, for example, more than 20,000 of the total estimated 64,000 U.S. drug overdose deaths were attributed to fentanyl and related synthetic opioids.
Module 1 • Science & Society 41
Program: HSS_NA Component: FeaturesPDF Pass
Vendor: Lumina Grade: Chpater 1

0042-0042_CHEM_CA_S_CH01_SG_674695.indd 07/01/19 12:46PM0042-0042_CHEM_CA_S_CH01_SG_674695.indd 07/01/19 12:46PM
Lesson 1 WHAT IS CHEMISTRY? • chemistry• science • hypothesis• theory• scientific law• pure research• applied research• substance• mass• weight• model
• Chemistry is the study of matter. There are several branches of chemistry, including organic, inorganic, physical, analytical, and biochemistry.
• Science is the use of evidence to construct testable explanations and predictions of natural phenomena, as well as, the knowledge generated through this process.
• Models are tools that scientists, including chemists, use. A hypothesis is a testable explanation of a situation or phenomena. A theory is a hypothesis that is supported by many experiments.
Lesson 2 MEASUREMENT • base unit• second• meter• kilogram• kelvin• derived unit• liter• density• scientific notation• dimensional analysis• conversion factor
• SI measurement units and prefixes allow scientists to report data.• Density is a ratio of mass to volume and can be used to identify a
substance.• A number expressed in scientific notation is written as a
coefficient between 1 and 10 multiplied by 10 raised to a power. • Dimensional analysis uses conversion factors to solve problems.
Lesson 3 UNCERTAINTY IN DATA • accuracy• precision• error• percent error• significant figures
• An accurate measurement is close to the accepted value. A set of precise measurements shows little variation. The measurement device determines the degree of precision possible.
• Error is the difference between the measured value and the accepted value. Percent error gives the percent deviation from the accepted value.
• The number of significant figures reflects the precision of reported data.
• Calculations are often rounded to the correct number of significant figures.
Lesson 4 REPRESENTING DATA • graph• independent variable• dependent variable
• Circle graphs show parts of a whole. Bar graphs show how a factor varies with time, location, or temperature.
• Independent (x-axis) variables and dependent (y-axis) variables can be related in a linear or a nonlinear manner. The slope of a straight line is defined as rise/run, or Δy/Δx.
slope = y2 - y1 _ x2 - x1
= Δy
_ Δx
• Because line graph data are considered continuous, you can interpolate between data points or extrapolate beyond them.
GO ONLINE to study with your Science Notebook.
MODULE 1STUDY GUIDE
42 Module 1 • Study Guide
Program: HSS_NA Component: SGPDF Pass
Vendor: Lumina Chapter: 01

Shut
ters
tock
/Kat
hari
na13
0043-0043_CHEM_CA_S_CH01_MC_674695.indd 17/12/18 05:59PM
C C CSE
P DCI
Module Wrap-UpTHREE-DIMENSIONAL THINKING
GO FURTHER Data Analysis Lab
How can mass and volume data for an unknown sample be used to identify it?
A student collected from a stream bed several samples that looked like gold. She measured the mass of each sample and used water displacement to determine each sample’s volume. Her data are given in the table.
Mass and Volume Data for Unknown Samples
Sample Mass Initial Volume (water only)
Final Volume (water + sample)
1 50.25 g 50.1 mL 60.3 mL2 63.56 g 49.8 mL 62.5 mL3 57.65 g 50.2 mL 61.5 mL4 55.35 g 45.6 mL 56.7 mL5 74.92 g 50.3 mL 65.3 mL6 67.78 g 47.5 mL 60.8 mL
CER Analyze and Interpret DataFor a given sample, the difference in the volume measurements made with the graduated cylinder yields the volume of the
REVISIT THE PHENOMENON
What do plants and buildings have in common?CER Claim, Evidence, ReasoningExplain Your Reasoning Revisit the claim you made when you encountered the phenomenon. Summarize the evidence you gathered from your investigations and research and finalize your Summary Table. Does your evidence support your claim? If not, revise your claim. Explain why your evidence supports your claim.
sample. Thus, for each sample, the mass and volume are known, and the density can be calculated. Note that density is a property of matter that can often be used to identify an unknown sample.
1. Calculate the volume and density for each sample and the average density of the six samples. Be sure to use significant figure rules.
2. Claim The student hopes the samples are gold, which has a density of 19.3 g/cm3. A local geologist suggested the samples might be pyrite, which is a mineral with a density of 5.01 g/cm3. What is the identity of the unknown sample?
3. Calculate the error and percent error of each sample. Use the density values given in Question 2 as the accepted values.
4. Evidence, Reasoning Was the data collected by the student accurate? Explain your answer.
Module 1 • The Central Science 43
Program: HSS_NA Component: MCPDF Pass
Vendor: Lumina Chapter: 01

©fit
opar
do.c
om/M
omen
t Ope
n/G
etty
Imag
es
Program: HSS_NA Component: UOPDF Pass
Vendor: Lumina Chapter: 02
0044-0045_CHEM_CA_S_CH02_UO_674695.indd 07/01/19 08:31PM 0044-0045_CHEM_CA_S_CH02_UO_674695.indd

Program: HSS_NA Component: UOPDF Pass
Vendor: Aptara Chapter: 02
08/04/19 08:05PM 0044-0045_CHEM_NA_S_CH02_UO_138115.indd 08/04/19 08:05PM
Look for EvidenceAs you go through this unit, use the information and your experiences to help you answer the phenomenon question as well as your own questions. For each activity, record your observations in a Summary Table, add an explanation, and identify how it connects to the unit and module phenomenon questions.
Solve a ProblemSTEM UNIT PROJECT
Construction Projects How do the properties of matter affect the materials chosen for a construction project? Investigate the ways in which materials can be engineered to meet our needs.
GO ONLINE In addition to reading the information in your Student Edition, you can find the STEM Unit Project and other useful resources online.
Ask QuestionsWhat questions do you have about the phenomenon? Write your questions on sticky notes and add them to the driving question board for this unit.
UNIT 1STRUCTURE AND PROPERTIES OF MATTER
ENCOUNTER THE PHENOMENON
How do fireworks get their colors?
How muchdo bubblesweigh?
Unit 1 • Structure and Properties of Matter 45

0046-0046_CHEM_CA_S_CH02_MO_674695.indd 07/01/19 08:31PM
Sopo
n C
hien
wit
taya
kun/
Mom
ent/
Get
ty Im
ages
46 Module 2 • Matter—Properties and Changes
Program: HSS_NA Component: COPDF Pass
Vendor: Lumina Chapter: 02

MODULE 2MATTER—PROPERTIES AND CHANGES
ENCOUNTER THE PHENOMENON
Why is this volcano spewing bright blue flames?
GO ONLINE to play a video about the mystery of the Kawah Ijen volcano.
Ask QuestionsDo you have other questions about the phenomenon? If so, add them to the driving question board.
CER Claim, Evidence, ReasoningMake Your Claim Use your CER chart to make a claim about why this volcano is spewing bright blue flames.
Collect Evidence Use the lessons in this module to collect evidence to support your claim. Record your evidence as you move through the module.
Explain Your Reasoning You will revisit your claim and explain your reasoning at the end of the module.
GO ONLINE to access your CER chart and explore resources that can help you collect evidence.
LESSON 2: Explore & Explain: Chemical Changes
LESSON 1: Explore & Explain: Physical Properties
Additional Resources
0047-0047_CHEM_NA_S_CH02_Investigate_Phenom_138115.indd 03/05/19 03:58PM
(t)V
ideo
Sup
plie
d by
BB
C W
orld
wid
e Le
arni
ng; (
bl)D
esig
n Pi
cs/K
elly
Red
inge
r; (
br)P
ablo
Sca
pina
chis
/Shu
tter
stoc
k.co
m
Module 2 • Encounter the Phenomenon 47
Program: HSS_NA Component: IPPDF Pass
Vendor: Aptara Chapter: 02

(l)E
lad
Shar
on/F
lickr
RF/
Get
ty Im
ages
, (r)
Iako
v Fi
limon
ov/S
hutt
erst
ock.
com
0048-0054_CHEM_CA_S_CH02_L01_674695.indd 17/12/18 06:00PM0048-0054_CHEM_CA_S_CH02_L01_674695.indd 17/12/18 06:00PM
Salt from a mineSalt from the sea
Figure 1 Harvested from the sea or extracted from a mine, salt always has the same composition.
SubstancesAs you know, matter is anything that has mass and takes up space. Everything around us is matter, including things that we cannot see, such as air and microbes. For example, table salt is a simple type of matter that you are probably familiar with. Table salt has a unique and unchanging chemical composition. Its chemical name is sodium chloride. It is always 100% sodium chloride, and its composition does not change from one sample to another. Salt harvested from the sea or extracted from a mine, as shown in Figure 1, always has the same composition and properties.
FOCUS QUESTION
What are the differences between physical and chemical properties?
LESSON 1PROPERTIES OF MATTER
Disciplinary Core Ideas Crosscutting Concepts Science & Engineering Practices3D THINKINGC C C
SEP DCI
COLLECT EVIDENCEUse your Science Journal to
record the evidence you collect as you complete the readings and activities in this lesson.
INVESTIGATE GO ONLINE to find these activities and more resources.
Laboratory: The Density of WoodPlan and carry out an investigation to determine the patterns in mass and volume of different types of wood.
Identify Crosscutting Concepts Create a table of the crosscutting concepts and fill in examples you find as you read.
48 Module 2 • Matter—Properties and Changes
Program: HSS_NA Component: LessonPDF Pass
Vendor: Lumina Chapter: 02
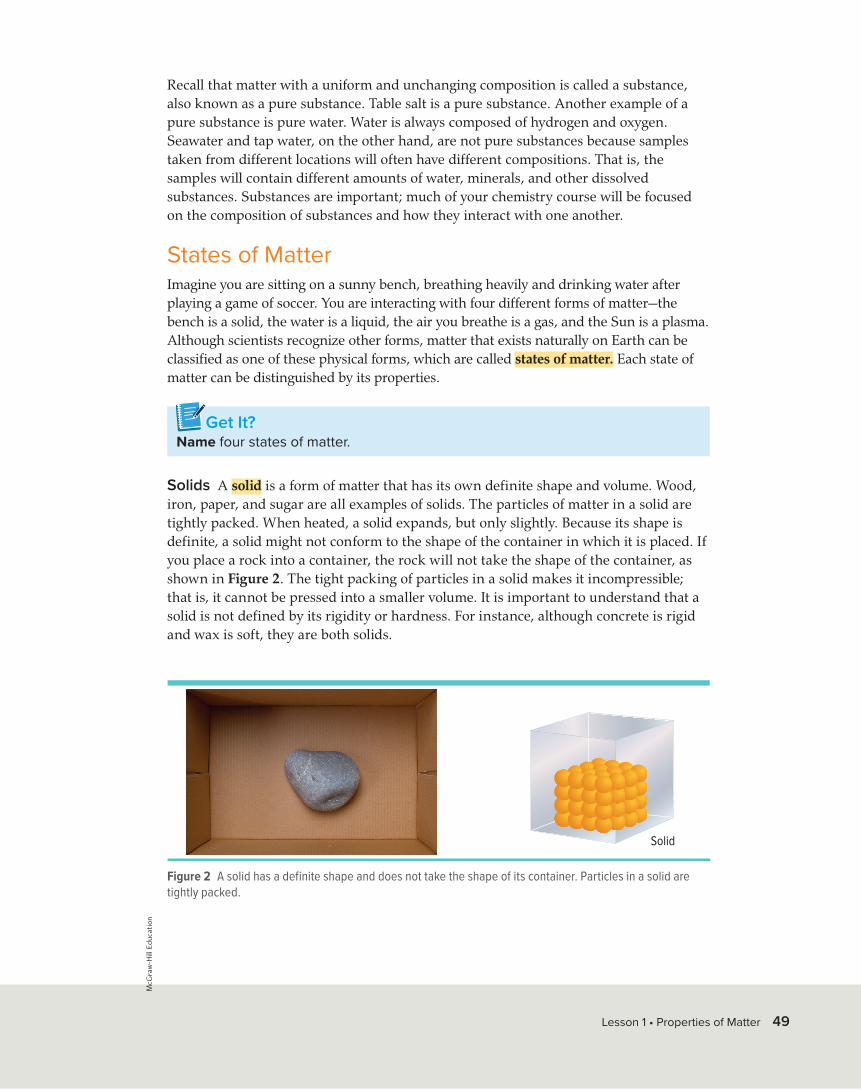
C03_006A
Solid
McG
raw
-Hill
Edu
cati
on
0048-0054_CHEM_CA_S_CH02_L01_138115.indd 21/05/18 09:33AM0048-0054_CHEM_CA_S_CH02_L01_138115.indd 21/05/18 09:33AM
Figure 2 A solid has a definite shape and does not take the shape of its container. Particles in a solid are tightly packed.
Recall that matter with a uniform and unchanging composition is called a substance, also known as a pure substance. Table salt is a pure substance. Another example of a pure substance is pure water. Water is always composed of hydrogen and oxygen. Seawater and tap water, on the other hand, are not pure substances because samples taken from different locations will often have different compositions. That is, the samples will contain different amounts of water, minerals, and other dissolved substances. Substances are important; much of your chemistry course will be focused on the composition of substances and how they interact with one another.
States of MatterImagine you are sitting on a sunny bench, breathing heavily and drinking water after playing a game of soccer. You are interacting with four different forms of matter—the bench is a solid, the water is a liquid, the air you breathe is a gas, and the Sun is a plasma. Although scientists recognize other forms, matter that exists naturally on Earth can be classified as one of these physical forms, which are called states of matter. Each state of matter can be distinguished by its properties.
Solids A solid is a form of matter that has its own definite shape and volume. Wood, iron, paper, and sugar are all examples of solids. The particles of matter in a solid are tightly packed. When heated, a solid expands, but only slightly. Because its shape is definite, a solid might not conform to the shape of the container in which it is placed. If you place a rock into a container, the rock will not take the shape of the container, as shown in Figure 2. The tight packing of particles in a solid makes it incompressible; that is, it cannot be pressed into a smaller volume. It is important to understand that a solid is not defined by its rigidity or hardness. For instance, although concrete is rigid and wax is soft, they are both solids.
Get It?Name four states of matter.
Lesson 1 • Properties of Matter 49
Program: HSS_NA Component: LessonPDF Pass
Vendor: Lumina Chapter: 02
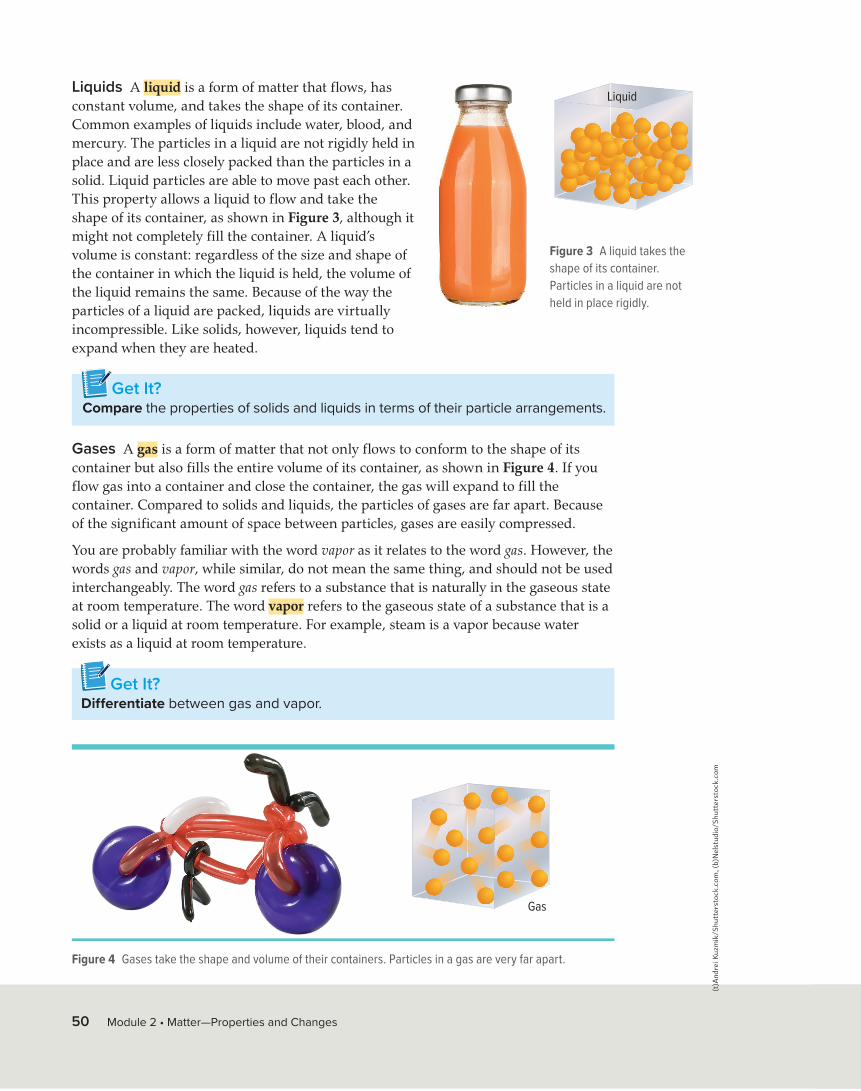
C03_010A
Gas
C03_008A
Liquid
(t)A
ndre
i Kuz
mik
/Shu
tter
stoc
k.co
m, (
b)N
elst
udio
/Shu
tter
stoc
k.co
m
0048-0054_CHEM_CA_S_CH02_L01_138115.indd 21/05/18 09:33AM 0048-0054_CHEM_CA_S_CH02_L01_138115.indd 0048-0054_CHEM_CA_S_CH02_L01_138115.indd 21/05/18 09:33AM 0048-0054_CHEM_CA_S_CH02_L01_138115.indd
Figure 4 Gases take the shape and volume of their containers. Particles in a gas are very far apart.
Liquids A liquid is a form of matter that flows, has constant volume, and takes the shape of its container. Common examples of liquids include water, blood, and mercury. The particles in a liquid are not rigidly held in place and are less closely packed than the particles in a solid. Liquid particles are able to move past each other. This property allows a liquid to flow and take the shape of its container, as shown in Figure 3, although it might not completely fill the container. A liquid’s volume is constant: regardless of the size and shape of the container in which the liquid is held, the volume of the liquid remains the same. Because of the way the particles of a liquid are packed, liquids are virtually incompressible. Like solids, however, liquids tend to expand when they are heated.
Gases A gas is a form of matter that not only flows to conform to the shape of its container but also fills the entire volume of its container, as shown in Figure 4. If you flow gas into a container and close the container, the gas will expand to fill the container. Compared to solids and liquids, the particles of gases are far apart. Because of the significant amount of space between particles, gases are easily compressed.
You are probably familiar with the word vapor as it relates to the word gas. However, the words gas and vapor, while similar, do not mean the same thing, and should not be used interchangeably. The word gas refers to a substance that is naturally in the gaseous state at room temperature. The word vapor refers to the gaseous state of a substance that is a solid or a liquid at room temperature. For example, steam is a vapor because water exists as a liquid at room temperature.
Figure 3 A liquid takes the shape of its container. Particles in a liquid are not held in place rigidly.
Get It?Differentiate between gas and vapor.
Get It?Compare the properties of solids and liquids in terms of their particle arrangements.
50 Module 2 • Matter—Properties and Changes
Program: HSS_NA Component: LessonPDF Pass
Vendor: Lumina Chapter: 02

(t)G
low
Imag
es, (
b)A
lber
t R
uss/
Shut
ters
tock
.com
17/12/18 06:00PM 0048-0054_CHEM_CA_S_CH02_L01_674695.indd 17/12/18 06:00PM17/12/18 06:00PM 0048-0054_CHEM_CA_S_CH02_L01_674695.indd 17/12/18 06:00PM
Plasmas The fluorescent lights in a classroom or the bright, colorful lights in the sign in Figure 5 involve matter as a plasma. A plasma is a form of matter that results when the particles of a gas become ionized and are broken apart into smaller charged particles. Ionization requires energy, such as that provided by an electric current in a neon or fluorescent bulb or the high temperatures of lightning or a star. Although plasmas can behave like gases in many ways, ionization causes plasmas to exhibit a strong response to electric and magnetic fields.
Real-World ChemistryPhysical Properties
MINERALS Scientists use physical properties such as color and hardness to identify minerals. For instance, malachite is always green and relatively soft. Malachite was used as a pigment in paint and is now mainly used to make jewelry.
Physical Properties of MatterYou are probably used to identifying objects by their proper-ties—their characteristics and behavior. For example, you can easily identify a pencil in your backpack because you recog-nize its shape, color, weight, or some other property. These characteristics are all physical properties of the pencil. A physical property is a characteristic of matter that can be observed or measured without changing the sample’s compo-sition. Physical properties also describe pure substances. Because substances have uniform and unchanging composi-tions, they also have consistent and unchanging physical properties. Density, color, odor, hardness, melting point, and boiling point are common physical properties that scientists record as identifying characteristics of a substance.
Get It?Define physical property and provide examples.
Figure 5 Plasmas are ionized gases.
Lesson 1 • Properties of Matter 51
Program: HSS_NA Component: LessonPDF Pass
Vendor: Lumina Chapter: 02

Eric
k Ts
eng
(vis
iglo
w.co
m)/
Mom
ent/
Get
ty Im
ages
0048-0054_CHEM_CA_S_CH02_L01_674695.indd 17/12/18 06:00PM 0048-0054_CHEM_CA_S_CH02_L01_674695.indd 0048-0054_CHEM_CA_S_CH02_L01_674695.indd 17/12/18 06:00PM 0048-0054_CHEM_CA_S_CH02_L01_674695.indd
Table 1 Physical Properties of Common Substances Substance Color State at 25°C Melting Point
(°C)Boiling Point
(°C)Density (g/cm3)
at 25°COxygen colorless gas –219 –183 0.0013Mercury silver liquid –39 357 13.5Water colorless liquid 0 100 0.997Sucrose white solid 186 decomposes 1.58Sodium chloride white solid 801 1465 2.17
Extensive and intensive properties Table 1 lists several common substances and their physical properties. Physical properties can be further described as being one of two types. Extensive properties are dependent on the amount of substance present. For example, mass is an extensive property. Length and volume are also extensive properties. Density, on the other hand, is an example of an intensive property of matter. Intensive properties are independent of the amount of substance present. For example, the density of a substance (at constant temperature and pressure) is the same no matter how much substance is present.
A substance can often be identified by its intensive properties. In some cases, a single intensive property is unique enough for identification. For instance, most of the spices shown in Figure 6 can be identified by their scent.
Chemical Properties of MatterSome properties of a substance are not obvious unless the substance has changed composition as a result of its contact with other substances or the application of thermal or electric energy. The ability or inability of a substance to combine with or change into one or more other substances is called a chemical property.
Iron forming rust when combined with the oxygen in air is an example of a chemical property of iron. Similarly, the inability of a substance to change into another substance is also a chemical property. For example, when iron is placed in nitrogen gas at room temperature, no chemical change occurs.
Get It?Compare physical and chemical properties.
Figure 6 Many spices can be identified by their scent, which is an intensive property.Infer Name an extensive property of one of the spices pictured in this figure.
52 Module 2 • Matter—Properties and Changes
Program: HSS_NA Component: LessonPDF Pass
Vendor: Lumina Chapter: 02

(l)G
low
Imag
es, (
r)W
lad7
4/Sh
utte
rsto
ck.c
om
21/05/18 09:33AM 0048-0054_CHEM_CA_S_CH02_L01_138115.indd 21/05/18 09:33AM21/05/18 09:33AM 0048-0054_CHEM_CA_S_CH02_L01_138115.indd 21/05/18 09:33AM
Copper wires
Figure 7 One of the physical properties of copper is that it can be shaped into different forms, such as the wires on circuit boards. The fact that copper turns from reddish to green when reacting with substances in the air is a chemical property.
Observing Properties of MatterEvery substance has its own unique set of physical and chemical properties. Figure 7 shows physical and chemical properties of copper. Copper can be shaped into different forms, which is a physical property. When copper is in contact with air for a long time, it reacts with the substances in the air and turns green. This is a chemical property. Table 2 lists several physical and chemical properties of copper.
Properties and states of matterThe properties of copper listed in Table 2 might vary depending on the conditions under which they are observed. Because the particular form, or state, of a substance is a physical property, changing the state introduces or adds another physical property to its characteristics. It is important to state the specific conditions, such as temperature and pressure, under which observations are made because both physical and chemical properties depend on these conditions. Resources that provide tables of physical and chemical properties of substances, such as the CRC Handbook of Chemistry and Physics, generally include the physical properties of substances in all of the states in which they can exist.
Table 2 Properties of CopperPhysical Properties Chemical Properties
• reddish brown, shiny
• easily shaped into sheets (malleable) and drawn into wires (ductile)
• a good conductor of heat and electricity
• density = 8.96 g/cm3
• melting point = 1085°C
• boiling point = 2562°C
• forms green copper carbonate compound when in contact with moist air
• reacts with nitric acid and sulfuric acid, forming new substances
• one type of compound forms a deep-blue solution when in contact with ammonia
Copper roof
Lesson 1 • Properties of Matter 53
Program: HSS_NA Component: LessonPDF Pass
Vendor: Lumina Chapter: 02

©In
gram
Pub
lishi
ng/a
ge fo
tost
ock
0048-0054_CHEM_CA_S_CH02_L01_674695.indd 17/12/18 06:00PM0048-0054_CHEM_CA_S_CH02_L01_674695.indd 17/12/18 06:00PM
Figure 8 Because the density of ice is lower than the density of water, icebergs float on the ocean.
Consider the properties of water, for example. You might think of water as a liquid (physical property) which is not particularly chemically reactive (chemical property). You might also find that water has a density of 1.00 g/cm3 (physical property). These properties, however, apply only to water at standard temperature and pressure. At temperatures greater than 100°C, water is a gas (physical property) with a density of about 0.0006 g/cm3 (physical property) that reacts rapidly with many different sub-stances (chemical property). Below 0°C, water is a solid (physical property) with a density of about 0.92 g/cm3 (physical property). The lower density of ice accounts for the fact that icebergs float on the ocean, as shown in Figure 8. Clearly, the properties of water are dramatically different under different conditions.
Go online to follow your personalized learning path to review, practice, and reinforce your understanding.
Check Your ProgressSummary• Four states of matter are solid,
liquid, gas, and plasma.• Physical properties can be
observed without altering a substance’s composition.
• Chemical properties describe a substance’s ability to combine with or change into one or more new substances.
• External conditions can affect both physical and chemical properties.
Demonstrate Understanding1. Create a table that describes four states of matter in
terms of their properties.2. Describe the characteristics that identify a sample of
matter as a substance.3. Classify each of the following as a physical or a
chemical property. a. Iron and oxygen form rust. b. Iron is more dense than aluminum. c. Magnesium burns brightly when ignited. d. Oil and water do not mix. e. Mercury melts at −39°C.4. Organize Create a chart that compares physical and
chemical properties. Give two examples for each type of property.
54 Module 2 • Matter—Properties and Changes
Program: HSS_NA Component: LessonPDF Pass
Vendor: Lumina Chapter: 02

0055-0059_CHEM_CA_S_CH02_L02_674695.indd 17/12/18 06:00PM0055-0059_CHEM_CA_S_CH02_L02_674695.indd 17/12/18 06:00PM
Physical ChangesImagine crumpling aluminum foil from a smooth, flat, mirrorlike sheet to a round, compact ball. The substance looks very different, but its composition is unchanged—it is still aluminum. A change such as this, which alters a substance without changing its composition, is a physical change.
Phase change As with other physical properties, the state of matter depends on the temperature and pressure of the surroundings. As temperature and pressure change, most substances undergo a change from one state (or phase) to another. A phase change is a transition of matter from one state to another. Figure 9 shows two common phase changes.
Figure 9 Condensation can occur when a gas is in contact with a cool surface, causing droplets to form. Solidification occurs when a liquid cools. Water dripping from the roof forms icicles as it cools.
Condensation Solidification
LESSON 2CHANGES IN MATTER
FOCUS QUESTION
How does a substance change when it burns?
Disciplinary Core Ideas Crosscutting Concepts Science & Engineering Practices3D THINKINGC C C
SEP DCI
COLLECT EVIDENCEUse your Science Journal to
record the evidence you collect as you complete the readings and activities in this lesson.
INVESTIGATE GO ONLINE to find these activities and more resources.
Laboratory: Properties of WaterObtain, evaluate, and communicate information to determine the structure and function of water in Earth’s surface processes.
Identify Crosscutting ConceptsCreate a table of the crosscutting concepts and fill in examples you find as you read.
Lesson 2 • Changes in Matter 55
Program: HSS_NA Component: LessonPDF Pass
Vendor: Lumina Chapter: 02
(l)A
ndre
i Kuz
mik
/Shu
tter
stoc
k.co
m, (
r)St
ephe
n B
edte
lyon
/Shu
tter
stoc
k.co
m

0055-0059_CHEM_CA_S_CH02_L02_138115.indd 21/05/18 09:33AM 0055-0059_CHEM_CA_S_CH02_L02_138115.indd 0055-0059_CHEM_CA_S_CH02_L02_138115.indd 0055-0059_CHEM_CA_S_CH02_L02_138115.indd 21/05/18 09:33AM
Figure 10 When iron rusts, new substances are formed due to chemical change.Identify the reactants and products in the formation of rust.
Get It?Define chemical change.
EARTH SCIENCE Connection The water cycle Phase changes associated with water make up the water cycle, which allows life to exist on Earth. At atmospheric pressure and at temperatures of 0°C and below, water is in its solid state, which is known as ice. As heat is added to the ice, it melts and becomes liquid water. This change of state is a physical change because even though ice and water have different appearances, they have the same composition. If the temperature of the water increases to 100°C, the water begins to boil, and liquid water is converted to steam. Melting and formation of a gas are both physical changes and phase changes. Terms such as boil, freeze, condense, vaporize, or melt in chemistry generally refer to a phase change in matter.
The temperature and pressure at which a substance undergoes a phase change are important physical properties. These properties are called the melting and boiling points of the substance. Look again at Table 1 to see this information for several common substances. Like density, the melting and boiling points are intensive physi-cal properties. Tables of intensive properties, such as those given at the end of this textbook or in the CRC Handbook of Chemistry and Physics, are useful tools in identify-ing unknown substances from experimental data.
Chemical ChangesA process that involves one or more substances changing into new substances is called a chemical change, commonly referred to as a chemical reaction. The new substances formed in the reaction have different compositions and different properties from the substances present before the reaction occurred. For example, the formation of rust when iron reacts with oxygen in moist air is a chemical change. Rust, shown in Figure 10, is a chemical combination of iron and oxygen.
In chemical reactions, the starting substances are called reactants, and the new substances that are formed are called products. Terms such as decompose, explode, rust, oxidize, corrode, tarnish, ferment, burn, or rot generally refer to chemical reactions.
56 Module 2 • Matter—Properties and Changes
Program: HSS_NA Component: LessonPDF Pass
Vendor: Lumina Chapter: 02
Ant
hony
Gro
te/G
allo
Imag
es R
OO
TS R
F/G
etty
Imag
es

21/05/18 09:33AM 0055-0059_CHEM_CA_S_CH02_L02_138115.indd 21/05/18 09:33AM0055-0059_CHEM_CA_S_CH02_L02_138115.indd 21/05/18 09:33AM21/05/18 09:33AM
Evidence of a chemical reaction Take another look at Figure 10. As shown, rust is a brownish-orange powdery sub-stance. It looks very different from the elements iron and oxygen that compose it. Rust is not attracted to a magnet, whereas iron is. The observation that the product (rust) has different properties than the reactants (iron and oxygen) is evidence that a chemical reaction has taken place. A chemical reaction always produces a change in properties.
Spoiled food, such as rotten fruit and bread, is another example of chemical reactions. The properties of spoiled food differ from the properties of fresh food. How the food tastes, how it smells, and its digestibility might all change as food rots. Examples of food that have undergone chemical reactions are shown in Figure 11.
Conservation of MassIt was only in the late eighteenth century that scientists began to use quantitative tools to study and monitor chemical changes. The analytical balance, which was capable of measuring small changes in mass, was developed at that time. By carefully measuring mass before and after many chemical reactions, it was observed that, although chemical changes occurred, the total mass involved in the reaction remained constant. Assuming this was true for all reactions, chemists summarized this observation in a scientific law.
The law of conservation of mass states that mass is neither created nor destroyed during a chemical reaction—it is conserved. In other words, the mass of the reactants equals the mass of the products. The equation form of the law of conservation of mass is as follows:
The Law of Conservation of Massmassreactants = massproducts
Mass is conserved in a chemical reaction; products have the same mass as reactants.
Figure 11 When food rots, new substances are formed due to chemical change.
Lesson 2 • Changes in Matter 57
Program: HSS_NA Component: LessonPDF Pass
Vendor: Lumina Chapter: 02
©j k
/Ala
my
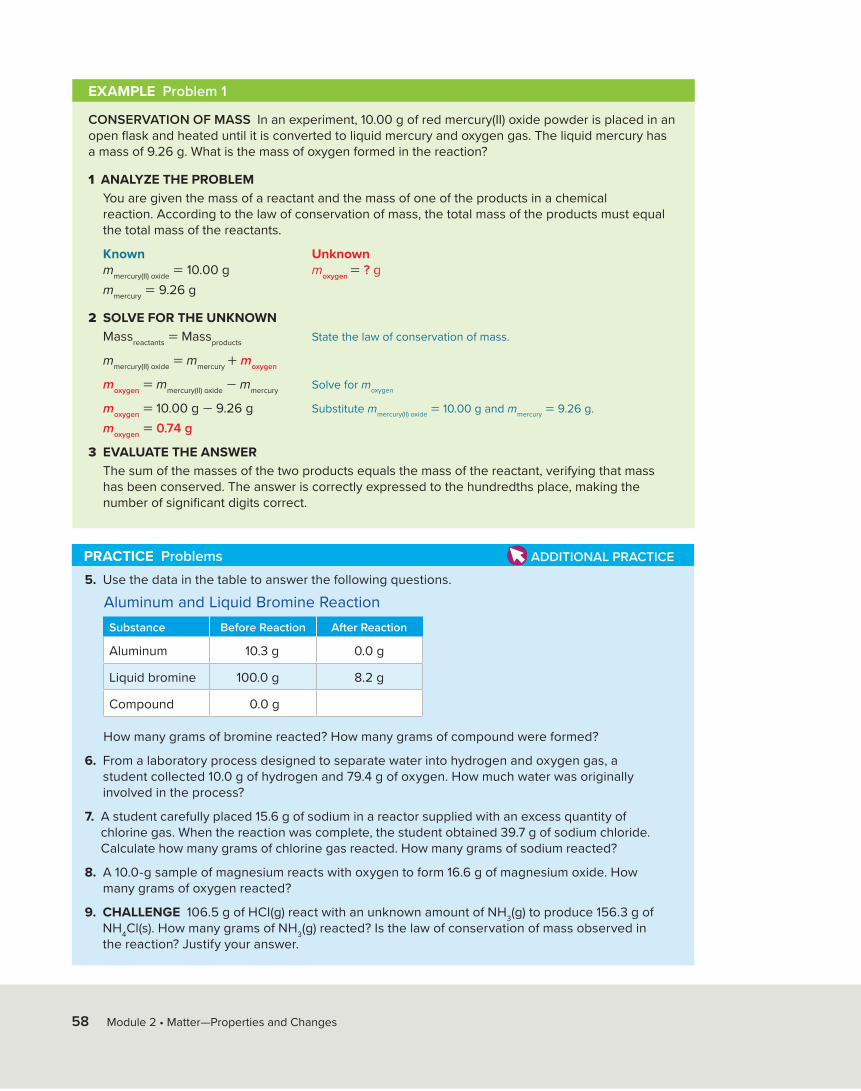
0055-0059_CHEM_CA_S_CH02_L02_674695.indd 17/12/18 06:00PM0055-0059_CHEM_CA_S_CH02_L02_674695.indd 17/12/18 06:00PM
PRACTICE Problems 5. Use the data in the table to answer the following questions.
Aluminum and Liquid Bromine ReactionSubstance Before Reaction After Reaction
Aluminum 10.3 g 0.0 g
Liquid bromine 100.0 g 8.2 g
Compound 0.0 g
How many grams of bromine reacted? How many grams of compound were formed?
6. From a laboratory process designed to separate water into hydrogen and oxygen gas, a student collected 10.0 g of hydrogen and 79.4 g of oxygen. How much water was originally involved in the process?
7. A student carefully placed 15.6 g of sodium in a reactor supplied with an excess quantity of chlorine gas. When the reaction was complete, the student obtained 39.7 g of sodium chloride. Calculate how many grams of chlorine gas reacted. How many grams of sodium reacted?
8. A 10.0-g sample of magnesium reacts with oxygen to form 16.6 g of magnesium oxide. How many grams of oxygen reacted?
9. CHALLENGE 106.5 g of HCI(g) react with an unknown amount of NH3(g) to produce 156.3 g of NH4Cl(s). How many grams of NH3(g) reacted? Is the law of conservation of mass observed in the reaction? Justify your answer.
ADDITIONAL PRACTICE
EXAMPLE Problem 1
CONSERVATION OF MASS In an experiment, 10.00 g of red mercury(II) oxide powder is placed in an open flask and heated until it is converted to liquid mercury and oxygen gas. The liquid mercury has a mass of 9.26 g. What is the mass of oxygen formed in the reaction?
1 ANALYZE THE PROBLEMYou are given the mass of a reactant and the mass of one of the products in a chemical reaction. According to the law of conservation of mass, the total mass of the products must equal the total mass of the reactants.
Known Unknownmmercury(II) oxide = 10.00 g moxygen = ? gmmercury = 9.26 g
2 SOLVE FOR THE UNKNOWNMassreactants = Massproducts State the law of conservation of mass.
mmercury(II) oxide = mmercury + moxygen
moxygen = mmercury(II) oxide - mmercury Solve for moxygen
moxygen = 10.00 g - 9.26 g Substitute mmercury(II) oxide = 10.00 g and mmercury = 9.26 g.moxygen = 0.74 g
3 EVALUATE THE ANSWERThe sum of the masses of the two products equals the mass of the reactant, verifying that mass has been conserved. The answer is correctly expressed to the hundredths place, making the number of significant digits correct.
58 Module 2 • Matter—Properties and Changes
Program: HSS_NA Component: LessonPDF Pass
Vendor: Lumina Chapter: 02

0055-0059_CHEM_CA_S_CH02_L02_674695.indd 17/12/18 06:00PM0055-0059_CHEM_CA_S_CH02_L02_674695.indd 17/12/18 06:00PM
Figure 12 When mercury(II) oxide is heated, the powdery red solid reacts to form silvery liquid mercury and colorless oxygen gas. The sum of the masses of mercury and oxygen produced during the reaction equals the mass of mercury(II) oxide.
Go online to follow your personalized learning path to review, practice, and reinforce your understanding.
Summary• A physical change alters the
physical properties of a sub-stance without changing its composition.
• A chemical change, also known as a chemical reaction, involves a change in a substance’s composition.
• In a chemical reaction, reactants form products.
• The law of conservation of mass states that mass is neither created nor destroyed during a chemical reaction; it is conserved.
Check Your ProgressDemonstrate Understanding10. Classify each change as physical or chemical. a. crushing an aluminum can b. recycling used aluminum cans to make new ones c. aluminum combining with oxygen to form
aluminum oxide11. Describe the results of a physical change and list three
examples of physical change.12. Describe the results of a chemical change. List four
indicators of chemical change.13. Calculate Solve each of the following. a. If 22.99 g of sodium and 35.45 g of chlorine fully
react, how much sodium chloride forms? b. A 12.2-g sample of X reacts with a sample of Y to
form 78.9 g of XY. What mass of Y reacted?14. Evaluate A friend tells you, “Because composition
does not change during a physical change, the appearance of a substance does not change.” Is your friend correct? Explain.
French scientist Antoine Lavoisier (1743–1794) was one of the first to use an analytical balance to monitor chemical reactions. He studied the thermal decomposition of mercury(II) oxide, shown in Figure 12. The color change and production of a gas are indicators of a chemical reaction. In a closed container, the oxygen gas cannot escape and the mass before and after the reaction can be measured. The masses are the same. The law of conservation of mass is one of the most fundamental concepts in the study of chemistry and chemical reactions.
Lesson 2 • Changes in Matter 59
Program: HSS_NA Component: LessonPDF Pass
Vendor: Lumina Chapter: 02
Step
hen
Fris
ch/M
cGra
w-H
ill E
duca
tion

0060-0067_CHEM_CA_S_CH02_L03_674695.indd 17/12/18 06:00PM0060-0067_CHEM_CA_S_CH02_L03_674695.indd 17/12/18 06:00PM
ElementsEarlier in this module, you considered the diversity of your surroundings in terms of matter. Although matter can take many different forms, all matter can be broken down into a relatively small number of basic building blocks called elements. An element is a pure substance that cannot be separated into simpler substances by physical or chemical means. On Earth, over 90 elements occur naturally. Copper, oxygen, and gold are examples of naturally-occurring elements. Elements are found in different physical states in normal conditions, as shown in Figure 13. There are also several elements that do not exist naturally but have been developed by scientists.
Each element has a unique chemical name and chemical symbol. The chemical symbol consists of one, two, or three letters; the first letter is always capitalized, and the remaining letter(s) are always lowercase. The names and symbols of the elements are universally accepted by scientists world-wide in order to make the communication of chemical information possible.
Copper pot—solid Helium balloon—gasMercury switch—liquid
Figure 13 In normal conditions, elements exist in different states.
Disciplinary Core Ideas Crosscutting Concepts Science & Engineering Practices3D THINKINGC C C
SEP DCI
COLLECT EVIDENCEUse your Science Journal to
record the evidence you collect as you complete the readings and activities in this lesson.
INVESTIGATE
GO ONLINE to find these activities and more resources. ChemLAB: Identify the Products of a Chemical ReactionObtain, evaluate, and communicate information to determine the cause and effect of a chemical reaction.
Inquiry into Chemistry: Is it gold or fool’s gold?Construct an explanation for the importance of examining the structure of an unknown material.
FOCUS QUESTION
What are elements and compounds?
LESSON 3ELEMENTS AND COMPOUNDS
60 Module 2 • Matter—Properties and Changes
Program: HSS_NA Component: LessonPDF Pass
Vendor: Lumina Chapter: 02
(l t
o r)
Pabk
ov/S
hutt
erst
ock.
com
, dcw
crea
tion
s/Sh
utte
rsto
ck.c
om, T
ong2
530/
Shut
ters
tock
.com
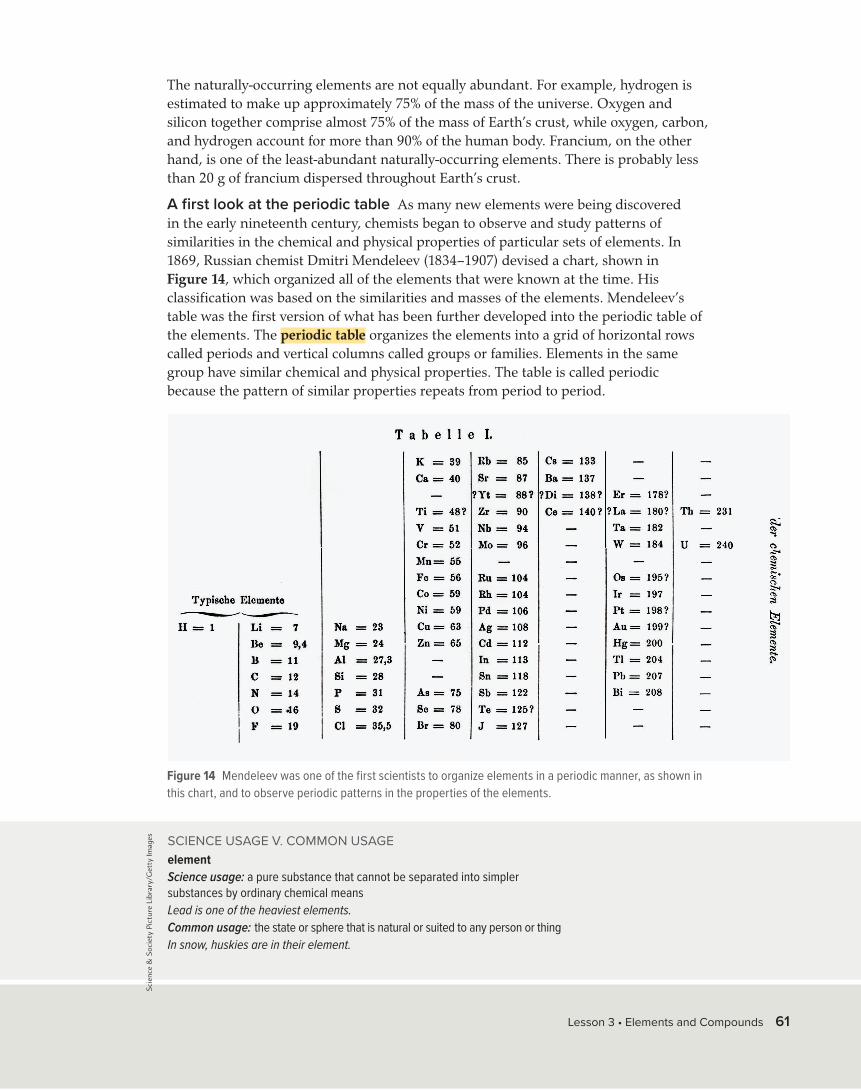
0060-0067_CHEM_CA_S_CH02_L03_674695.indd 21/12/18 12:02PM0060-0067_CHEM_CA_S_CH02_L03_674695.indd 21/12/18 12:02PM
The naturally-occurring elements are not equally abundant. For example, hydrogen is estimated to make up approximately 75% of the mass of the universe. Oxygen and silicon together comprise almost 75% of the mass of Earth’s crust, while oxygen, carbon, and hydrogen account for more than 90% of the human body. Francium, on the other hand, is one of the least-abundant naturally-occurring elements. There is probably less than 20 g of francium dispersed throughout Earth’s crust.
A first look at the periodic table As many new elements were being discovered in the early nineteenth century, chemists began to observe and study patterns of similarities in the chemical and physical properties of particular sets of elements. In 1869, Russian chemist Dmitri Mendeleev (1834–1907) devised a chart, shown in Figure 14, which organized all of the elements that were known at the time. His classification was based on the similarities and masses of the elements. Mendeleev’s table was the first version of what has been further developed into the periodic table of the elements. The periodic table organizes the elements into a grid of horizontal rows called periods and vertical columns called groups or families. Elements in the same group have similar chemical and physical properties. The table is called periodic because the pattern of similar properties repeats from period to period.
Figure 14 Mendeleev was one of the first scientists to organize elements in a periodic manner, as shown in this chart, and to observe periodic patterns in the properties of the elements.
SCIENCE USAGE V. COMMON USAGEelementScience usage: a pure substance that cannot be separated into simpler substances by ordinary chemical means Lead is one of the heaviest elements.Common usage: the state or sphere that is natural or suited to any person or thingIn snow, huskies are in their element.
Lesson 3 • Elements and Compounds 61
Program: HSS_NA Component: LessonPDF Pass
Vendor: Lumina Chapter: 02
Scie
nce
& S
ocie
ty P
ictu
re L
ibra
ry/G
etty
Imag
es

C03_032A
Cathode (-)Anode (+)
Hydrogenbubbles
Oxygenbubbles
Oxygen gas Hydrogen gas
Power supply
0060-0067_CHEM_CA_S_CH02_L03_138115.indd 21/05/18 09:33AM0060-0067_CHEM_CA_S_CH02_L03_138115.indd 21/05/18 09:33AM
Get It?Define element and compound.
Get It?Explain the process of electrolysis.
CompoundsMany pure substances can be classified as compounds. A compound is made up of two or more different elements that are combined chemically in a fixed ratio. Most matter in the universe exists in the form of compounds. Today, there are more than 50 million known compounds, and new compounds continue to be developed and discovered at the rate of about 100,000 per year. There appears to be no limit to the number of com-pounds that can be made or that will be discovered. Considering this virtually limitless potential, several organizations have assumed the task of collecting data and indexing the known chemical compounds. The information is stored in databases.
Separating compounds into components As you have read earlier in this module, elements can never be separated into simpler substances. However, compounds can be broken down into simpler substances by chemical means. In general, compounds that occur naturally are more stable than the individual component elements. Separating a compound into its elements often requires external energy, such as heat or electricity. Figure 15 shows the setup used to produce the chemical change of water into its component elements—hydrogen and oxygen—through a process called electrolysis. During electrolysis, one end of a long platinum electrode is exposed to the water in a tube and the other end is attached to a power source. An electric current splits water into hydrogen gas in the compartment on the right and oxygen gas in the compartment on the left. Because water is composed of two parts hydrogen and one part oxygen, there is twice as much hydrogen gas as there is oxygen gas.
The chemical symbols of the periodic table make it easy to write the formulas for chemical com-pounds. For example, table salt, which is called sodium chloride, is composed of one part sodium (Na) and one part chlorine (Cl), and its chemical formula is NaCl. Water is composed of two parts hydrogen (H) and one part oxygen (O), and its chemical formula is H2O. The subscript 2 indicates that two hydrogen atoms combine with one oxygen atom to form water.
Figure 15 An electric current breaks down water into its components, oxygen and hydrogen.Determine What is the ratio between the amount of hydrogen and the amount of oxygen released during electrolysis?
62 Module 2 • Matter—Properties and Changes
Program: HSS_NA Component: LessonPDF Pass
Vendor: Lumina Chapter: 02

0060-0067_CHEM_CA_S_CH02_L03_138115.indd 21/05/18 09:33AM0060-0067_CHEM_CA_S_CH02_L03_138115.indd 21/05/18 09:33AM
Properties of compounds The properties of a compound are different from those of its component elements. The example of water in Figure 15 illustrates this fact. Water is a stable compound that is liquid at room temperature. When water is broken down, its components, hydrogen and oxygen, are dramatically different than the liquid they form when combined. Oxygen and hydrogen are colorless, odorless gases that undergo vigorous chemical reactions with many elements. This difference in properties is a result of a chemical reaction between the elements.
Figure 16 shows the component elements—potassium and iodine—of the compound called potassium iodide. Note how different the properties of potassium iodide are from its component elements. Potassium is a light silvery metal that reacts with water. Iodine is a black solid that changes into a purple gas at room temperature. Potassium iodide is a white salt.
Potassium
Potassium Iodide
Iodine
Figure 16 When potassium and iodine react, they form potassium iodide, a compound with different properties.
Get It?Summarize how the properties of a compound and the properties of its component elements compare.
Lesson 3 • Elements and Compounds 63
Program: HSS_NA Component: LessonPDF Pass
Vendor: Lumina Chapter: 02
(t)A
ndre
w L
ambe
rt P
hoto
grap
hy/S
cien
ce S
ourc
e, (
b)C
harl
es D
. Win
ters
/Sci
ence
Sou
rce,
(r)M
arty
n F.
Chi
llmai
d/Sc
ienc
e So
urce

0060-0067_CHEM_CA_S_CH02_L03_138115.indd 21/05/18 09:33AM 0060-0067_CHEM_CA_S_CH02_L03_138115.indd 0060-0067_CHEM_CA_S_CH02_L03_138115.indd 21/05/18 09:33AM 0060-0067_CHEM_CA_S_CH02_L03_138115.indd
Law of Definite ProportionsAn important characteristic of compounds is that the elements comprising them always combine in definite proportions by mass. This observation is so fundamental that it is summarized as the law of definite proportions. The law of definite proportions states that a compound is always composed of the same elements in the same proportion by mass, no matter how large or small the sample. The mass of the compound is equal to the sum of the masses of the elements that make up the compound.
The relative amounts of the elements in a compound can be expressed as percent by mass. The percent by mass is the ratio of the mass of each element to the total mass of the compound expressed as a percentage.
For example, consider the compound granulated sugar (sucrose). This compound is composed of three elements—carbon, hydrogen, and oxygen. The analysis of 20.00 g of sucrose from a bag of granulated sugar is given in Table 3. Note that the sum of the individual masses of the elements found in the sugar equals 20.00 g, which is the amount of the granulated sugar sample that was analyzed. This demonstrates the law of conservation of mass as applied to compounds: the mass of a compound is equal to the sum of the masses of the elements that make up the compound.
Get It?State the law of definite proportions.
Percent by Mass
percent by mass (%) = mass of element ______________ mass of compound
× 100
Percent by mass is obtained by dividing the mass of the element by the mass of the compound and then by multiplying this ratio by 100 to express it as a percentage.
Table 3 Sucrose Analysis20.00 g of Granulated Sugar 500.0 g of Sugarcane
Element Analysis by Mass
(g)
Percent by Mass (%) Analysis by Mass
(g)
Percent by Mass (%)
Carbon 8.44 8.44 g C ___________ 20.00 g sucrose × 100 = 42.20% 211.0
211.0 g C ___________ 500.0 g sucrose × 100 = 42.20%
Hydrogen 1.30 1.30 g H ___________ 20.00 g sucrose × 100 = 6.50% 32.5
32.50 g H ___________ 500.0 g sucrose × 100 = 6.500%
Oxygen 10.26 10.26 g O
___________ 20.00 g sucrose × 100 = 51.30% 256.5 256.5 g O
___________ 500.0 g sucrose × 100 = 51.30%
Total 20.00 100% 500.0 100%
64 Module 2 • Matter—Properties and Changes
Program: HSS_NA Component: LessonPDF Pass
Vendor: Lumina Chapter: 02

21/05/18 09:33AM 0060-0067_CHEM_CA_S_CH02_L03_138115.indd 21/05/18 09:33AM21/05/18 09:33AM 0060-0067_CHEM_CA_S_CH02_L03_138115.indd 21/05/18 09:33AM
Suppose you analyzed 500.0 g of sucrose from a sample of sugarcane. The analysis is shown in Table 3. The percent-by-mass values for the sugarcane are equal to the values obtained for the granulated sugar. According to the law of definite proportions, samples of a compound from any source must have the same mass proportions. Conversely, compounds with different mass proportions must be different compounds. Thus, you can conclude that samples of sucrose will always be composed of 42.20% carbon, 6.50% hydrogen, and 51.30% oxygen, no matter their sources.
Law of Multiple ProportionsCompounds composed of different elements are obviously different compounds. However, different compounds can also be composed of the same elements. This happens when those different compounds have different mass compositions. The law of multiple proportions states that when different compounds are formed by a combination of the same elements, different masses of one element combine with the same fixed mass of the other element in a ratio of small whole numbers. Ratios compare the relative amounts of any items or substances. The comparison can be expressed using numbers separated by a colon or as a fraction. With regard to the law of multiple proportions, ratios express the relationship of elements in a compound.
Water and hydrogen peroxide The two distinct compounds water (H2O) and hydrogen peroxide (H2O2) illustrate the law of multiple proportions. Each compound contains the same elements (hydrogen and oxygen). Water is composed of two parts hydrogen and one part oxygen. Hydrogen peroxide is composed of two parts hydrogen and two parts oxygen. Hydrogen peroxide differs from water in that it has twice as much oxygen. When you compare the mass of oxygen in hydrogen peroxide to the mass of oxygen in water, you get the ratio 2:1.
PRACTICE Problems 15. A 78.0-g sample of an unknown compound contains 12.4 g of hydrogen. What is the percent by
mass of hydrogen in the compound?
16. 1.0 g of hydrogen reacts completely with 19.0 g of fluorine. What is the percent by mass of hydrogen in the compound that is formed?
17. If 3.5 g of element X reacts with 10.5 g of element Y to form the compound XY, what is the percent by mass of element X in the compound? The percent by mass of element Y?
18. Two unknown compounds are tested. Compound I contains 15.0 g of hydrogen and 120.0 g of oxygen. Compound II contains 2.0 g of hydrogen and 32.0 g of oxygen. Are the compounds the same? Explain your answer.
19. CHALLENGE All you know about two unknown compounds is that they have the same percent by mass of carbon. With only this information, can you be sure the two compounds are the same? Explain.
Get It?State the law of multiple proportions in your own words.
ADDITIONAL PRACTICE
Lesson 3 • Elements and Compounds 65
Program: HSS_NA Component: LessonPDF Pass
Vendor: Lumina Chapter: 02

C03_037A
1.000
2.000
Mas
s (g
)
1.000
2.000
Mas
s (g
)
1.000
2.000
Mas
s (g
)
Cu
CI
Cu CI
I
II
Compound I
Compound II
Mass RatioComparison C03_037A
1.000
2.000
Mas
s (g
)
1.000
2.000
Mas
s (g
)
1.000
2.000
Mas
s (g
)
Cu
CI
Cu CI
I
II
Compound I
Compound II
Mass RatioComparison
C03_037A
1.000
2.000
Mas
s (g
)
1.000
2.000
Mas
s (g
)
1.000
2.000
Mas
s (g
)
Cu
CI
Cu CI
I
II
Compound I
Compound II
Mass RatioComparison
0060-0067_CHEM_CA_S_CH02_L03_138115.indd 21/05/18 09:33AM0060-0067_CHEM_CA_S_CH02_L03_138115.indd 21/05/18 09:33AM
Table 4 Analysis Data of Two Copper Compounds
Compound % Cu % ClMass Cu (g) in
100.0 g of Compound
Mass Cl (g) in 100.0 g of
Compound
Mass Ratio
I 64.20 35.80 64.20 35.80
II 47.27 52.73 47.27 52.73
ba c
Figure 17 Copper and chlorine can form different compounds.
Bar graph a compares the relative masses of copper and chlorine in Compound I.
Bar graph b compares the relative masses of copper and chlorine in Compound II.
Bar graph c shows a compari-son between the relative masses of copper in both compounds. The ratio is 2:1.
Compounds made of copper and chlorine In another example, copper (Cu) reacts with chlorine (Cl) under different sets of conditions to form two different compounds. Table 4 provides an analysis of their compositions. How can you tell that the compounds are different?
The two copper compounds must be different because they have different percents by mass. Compound I is composed of 64.20% copper, but Compound II contains only 47.27% copper. Compound I contains 35.80% chlorine, but Compound II contains 52.73% chlorine.
Using Figure 17 and Table 4, compare the ratio of the mass of copper to the mass of chlorine for each compound. Notice that the mass ratio of copper to chlorine in Compound I (1.793) is exactly 2 times the mass ratio of copper to chlorine in Compound II (0.8964).
Get It?Explain why the ratio of relative masses of copper in both compounds is 2:1.
1.793 g Cu _______ 1 g Cl
0.8964 g Cu _________ 1 g Cl
mass ratio of Compound I
______________________ mass ratio of Compound II = 1.793 g Cu/g Cl
_________________ 0.8964 g Cu/g Cl = 2.000
( mass Cu ______ mass Cl )
66 Module 2 • Matter—Properties and Changes
Program: HSS_NA Component: LessonPDF Pass
Vendor: Lumina Chapter: 02

0060-0067_CHEM_CA_S_CH02_L03_674695.indd 17/12/18 06:00PM0060-0067_CHEM_CA_S_CH02_L03_674695.indd 17/12/18 06:00PM
Figure 18 Different compounds are formed when different relative masses of each element are combined. Although they are both made of copper and chlorine, Compound I has a greenish color, whereas Compound II has a bluish color.
Figure 18 shows the two compounds formed by the combination of copper and chlorine and presented in Table 4 and Figure 17. These compounds are called copper(I) chloride and copper(II) chloride. As the law of multiple proportions states, the different masses of copper that combine with a fixed mass of chlorine in the two different copper compounds can be expressed as a small whole-number ratio. In this case, the ratio is 2:1. Considering that there is a finite number of elements that exist today and an exponentially greater number of compounds that are composed of these elements under various conditions, it becomes clear how important the law of multiple proportions is in chemistry.
Compound I—copper(I) chloride Compound II—copper(II) chloride
Go online to follow your personalized learning path to review, practice, and reinforce your understanding.
Summary• Elements cannot be broken
down into simpler substances.• Elements are organized in the
periodic table of the elements.• Compounds are chemical
combinations of two or more elements, and their properties differ from the properties of their component elements.
• The law of definite proportions states that a compound is always composed of the same elements in the same proportions.
• The law of multiple proportions states that if elements form more than one compound, those compounds will have compositions that are whole-number multiples of each other.
Demonstrate Understanding20. Compare and contrast elements and compounds.21. Describe the basic organizational feature of the
periodic table of the elements.22. Explain how the law of definite proportions applies to
compounds.23. State the type of compounds that are compared in
the law of multiple proportions.24. Complete the table. Then analyze the data to deter-
mine if Compounds I and II are the same compound. If the compounds are different, use the law of multiple proportions to show the relationship between them.
Check Your Progress
ANALYSIS DATA OF TWO IRON COMPOUNDS
Compound Total Mass (g)
Mass Fe (g)
Mass O (g)
Mass Percent
Fe
Mass Percent
O
I 75.00 52.46 22.54II 56.00 43.53 12.47
25. Calculate the mass percent of each element in water. 26. Graph Create a graph that illustrates the law of
multiple proportions.
Lesson 3 • Elements and Compounds 67
Program: HSS_NA Component: LessonPDF Pass
Vendor: Lumina Chapter: 02
Mat
t M
eado
ws/
McG
raw
-Hill
Edu
cati
on

(t)M
cGra
w-H
ill E
duca
tion
, (b)
Sza
sz-F
abia
n Jo
zsef
/Shu
tter
stoc
k.co
m
0068-0072_CHEM_CA_S_CH02_L04_674695.indd 17/12/18 06:00PM0068-0072_CHEM_CA_S_CH02_L04_674695.indd 17/12/18 06:00PM
MixturesYou have already read that a pure substance has a uniform and unchanging composition. What happens when two or more substances are combined? A mixture is a combination of two or more pure substances in which each pure substance retains its individual chemical properties. The composition of mixtures is variable, and the number of mixtures that can be created by combining substances is infinite. Although much of the focus of chemistry is the behavior of substances, it is important to remember that most everyday matter occurs as mixtures. Substances tend to mix naturally; it is difficult to keep any substance pure.
Examine the mixtures in Figure 19. When oil, seasonings, and vinegar are mixed, you can still distinguish all of the compo-nents. If the mixture remains undisturbed long enough, the oil will form a layer on top of the vinegar. On the other hand, you cannot distinguish between the components of the mercury- silver mixture. You could, however, separate them by heating the mixture. The mercury will evaporate before the silver does, and you will obtain two separate substances: mercury vapor and solid silver. The mercury and silver physically mixed to form the mixture but did not chemically react with each other. They could be separated by the physical method of boiling. The vapor can be collected and condensed into liquid mercury.
Figure 19 There are different types of mixtures. The components of some mixtures, like this salad dressing, are visible. It is not possible to see the different components of some mixtures, such as this mercury-silver filling.
FOCUS QUESTION
Would the substance still burn blue if it were mixed with another substance?
LESSON 4MIXTURES OF MATTER
Disciplinary Core Ideas Crosscutting Concepts Science & Engineering Practices3D THINKINGC C C
SEP DCI
COLLECT EVIDENCEUse your Science Journal to
record the evidence you collect as you complete the readings and activities in this lesson.
INVESTIGATE
GO ONLINE to find these activities and more resources. Small-Scale Lab: Separation of AspirinCarry out an investigation to determine the scale, proportion, and quantity of the components of a common medication.
Identify Crosscutting Concepts Create a table of the crosscutting concepts and fill in examples you find as you read.
68 Module 2 • Matter—Properties and Changes
Program: HSS_NA Component: LessonPDF Pass
Vendor: Lumina Chapter: 02
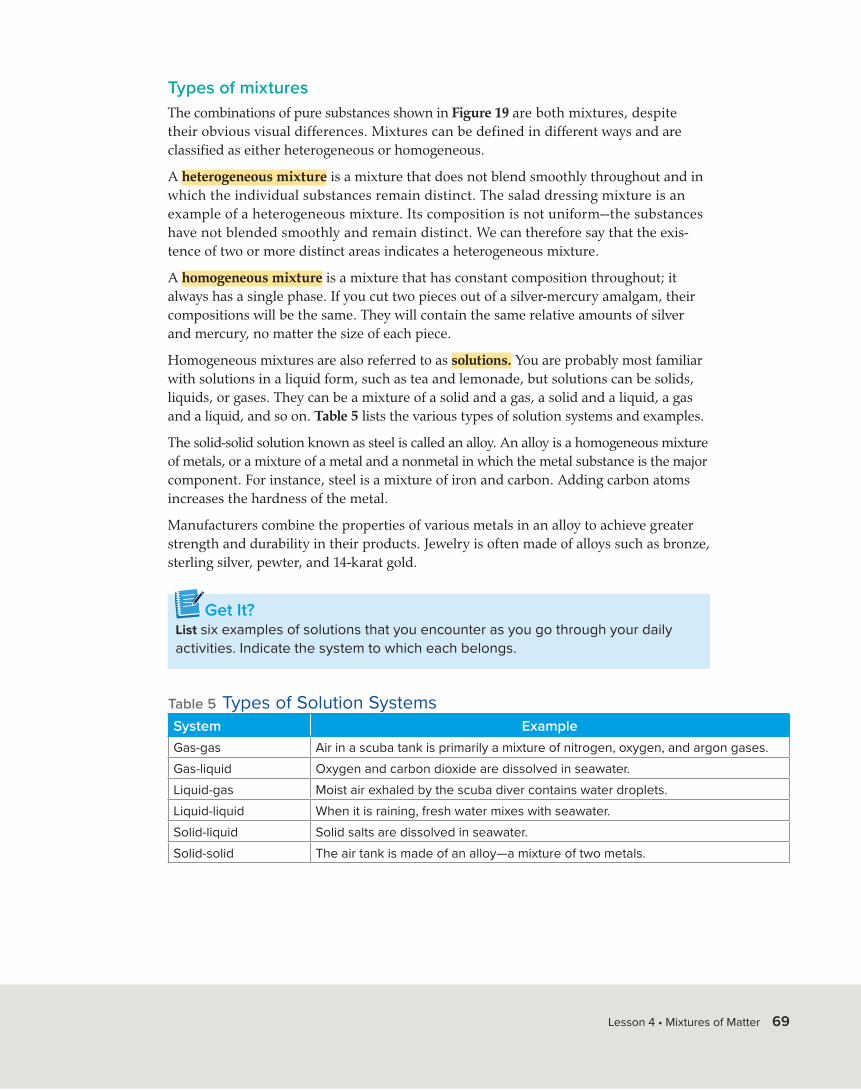
0068-0072_CHEM_CA_S_CH02_L04_674695_33340.indd 01/06/18 10:01AM0068-0072_CHEM_CA_S_CH02_L04_674695_33340.indd 01/06/18 10:01AM
Types of mixtures The combinations of pure substances shown in Figure 19 are both mixtures, despite their obvious visual differences. Mixtures can be defined in different ways and are classified as either heterogeneous or homogeneous.
A heterogeneous mixture is a mixture that does not blend smoothly throughout and in which the individual substances remain distinct. The salad dressing mixture is an example of a heterogeneous mixture. Its composition is not uniform—the substances have not blended smoothly and remain distinct. We can therefore say that the exis-tence of two or more distinct areas indicates a heterogeneous mixture.
A homogeneous mixture is a mixture that has constant composition throughout; it always has a single phase. If you cut two pieces out of a silver-mercury amalgam, their compositions will be the same. They will contain the same relative amounts of silver and mercury, no matter the size of each piece.
Homogeneous mixtures are also referred to as solutions. You are probably most familiar with solutions in a liquid form, such as tea and lemonade, but solutions can be solids, liquids, or gases. They can be a mixture of a solid and a gas, a solid and a liquid, a gas and a liquid, and so on. Table 5 lists the various types of solution systems and examples.
The solid-solid solution known as steel is called an alloy. An alloy is a homogeneous mixture of metals, or a mixture of a metal and a nonmetal in which the metal substance is the major component. For instance, steel is a mixture of iron and carbon. Adding carbon atoms increases the hardness of the metal.
Manufacturers combine the properties of various metals in an alloy to achieve greater strength and durability in their products. Jewelry is often made of alloys such as bronze, sterling silver, pewter, and 14-karat gold.
Table 5 Types of Solution SystemsSystem ExampleGas-gas Air in a scuba tank is primarily a mixture of nitrogen, oxygen, and argon gases.Gas-liquid Oxygen and carbon dioxide are dissolved in seawater.Liquid-gas Moist air exhaled by the scuba diver contains water droplets.Liquid-liquid When it is raining, fresh water mixes with seawater.Solid-liquid Solid salts are dissolved in seawater.Solid-solid The air tank is made of an alloy—a mixture of two metals.
Get It?List six examples of solutions that you encounter as you go through your daily activities. Indicate the system to which each belongs.
Lesson 4 • Mixtures of Matter 69
Program: HSS_NA Component: LessonPDF Pass
Vendor: Lumina Chapter: 02

C03_036A
Heterogeneousmixtures
dirt, blood,milk
lemonade,gasoline, steel
oxygen, gold,iron
salt, baking soda,sugar
Homogeneousmixtures Elements Compounds
Physicalchanges
Pure substancesMixtures
Matter
Chemicalchanges
0068-0072_CHEM_CA_S_CH02_L04_674695.indd 07/01/19 12:52PM0068-0072_CHEM_CA_S_CH02_L04_674695.indd 07/01/19 12:52PM
Figure 20 Matter can be classified into different categories that have defined properties.Examine How are mixtures and substances related? Elements and compounds?
Recall what you have learned about the organization of matter. Matter is classified as pure substances and mixtures. An element is a pure substance that cannot be separated into simpler substances, whereas a compound is a chemical combination of two or more elements and can be separated into its components. A mixture can be homogeneous or heterogeneous. Figure 20 summarizes the classification of matter and how these com-ponents are related to one another.
Separating MixturesMost matter exists naturally in the form of mixtures. To gain a thorough understanding of matter, it is important to be able to separate mixtures into their component substances. Because the substances in a mixture are physically combined, the processes used to separate a mixture are physical processes that are based on differences in the physical properties of the substances. For instance, a mixture of iron and sand can be separated into its components with a magnet because a magnet will attract iron but not sand. Numerous techniques have been developed that take advantage of different physical properties in order to separate various mixtures.
Get It?Summarize the different types of matter and how they are related to each other.
STEM CAREER Connection High School Chemistry Teacher Do you enjoy helping others? Do you like chemistry? Are you able to effectively explain yourself when talking to others? You may wish to consider a career teaching high school chemistry. High school teachers prepare students for life after high school. They prepare students to be valuable members of society by teaching lessons and skills needed to be successful in post-secondary education or to enter the workforce.
WORD ORIGINmixturefrom the Latin word misceo, meaning to mix or blend
70 Module 2 • Matter—Properties and Changes
Program: HSS_NA Component: LessonPDF Pass
Vendor: Lumina Chapter: 02

Mar
tyn
F. C
hillm
aid/
Scie
nce
Sour
ce
0068-0072_CHEM_CA_S_CH02_L04_674695_33340.indd 01/06/18 10:02AM0068-0072_CHEM_CA_S_CH02_L04_674695_33340.indd 01/06/18 10:02AM
Filtration Heterogeneous mixtures composed of solids and liquids are easily separated by filtration. Filtration is a technique that uses a porous barrier to separate a solid from a liquid. As Figure 21 shows, the mixture is poured through a piece of filter paper that has been folded into a cone shape. The liquid passes through, leaving the solids trapped in the filter paper.
Distillation Most homogeneous mixtures can be separated by distillation. Distillation is a physical separation technique that is based on differences in the boiling points of the substances involved. In distillation, a mixture is heated until the substance with the lowest boiling point boils to a vapor that can then be condensed into a liquid and collected. When precisely controlled, distillation can separate substances that have boiling points differing by only a few degrees.
Sublimation Mixtures can also be separated by sublimation, which is the process during which a solid changes to vapor without melting, i.e., without going through the liquid phase. Sublimation can be used to separate two solids present in a mixture when one of the solids sublimates but not the other.
Chromatography Chromatography is a technique that separates the components of a mixture dissolved in either a gas or a liquid (called the mobile phase) based on the ability of each component to travel or to be drawn across the surface of a fixed substrate (called the stationary phase).
For example, chromatography paper is a stationary phase with a solid substrate. During paper chromatography, the separation occurs because the various components of the mixture in the liquid mobile phase spread through the paper at different rates. Compo-nents with the strongest attraction for the paper travel slower.
Figure 21 As the mixture passes through the filter, the solids remain in the filter, while the filtrate (the remaining liquid) is collected in the beaker.
Get It?Compare and contrast the mobile phase with the stationary phase in chromatography.
Get It?Predict the result of trying to use filtration to separate the components of salad dressing. Imagine using salad dressing that is a mixture of oil, vinegar, and spices and a paper filter for the procedure.
Lesson 4 • Mixtures of Matter 71
Program: HSS_NA Component: LessonPDF Pass
Vendor: Lumina Chapter: 02

Ted
Kin
sman
/Sci
ence
Sou
rce
0068-0072_CHEM_CA_S_CH02_L04_674695.indd 17/12/18 06:01PM0068-0072_CHEM_CA_S_CH02_L04_674695.indd 17/12/18 06:01PM
Go online to follow your personalized learning path to review, practice, and reinforce your understanding.
Check Your Progress Summary• A mixture is a physical blend of
two or more pure substances in any proportion.
• Solutions are homogeneous mixtures.
• Mixtures can be separated by physical means. Common separation techniques include filtration, distillation, sublima-tion, chromatography, and crystallization.
Demonstrate Understanding27. Classify each of the following as either
a heterogeneous or a homogeneous mixture. a. tap water b. air c. raisin muffin28. Compare mixtures and substances.29. Describe the separation technique that could be used
to separate each of the following mixtures. a. two colorless liquids b. a nondissolving solid mixed with a liquid c. red and blue marbles of the same size and mass30. Design a concept map that summarizes the relation-
ships among the categories of matter, elements, mixtures, compounds, pure substances, and homoge-neous and heterogeneous mixtures.
Crystallization Making rock candy from a sugar solution is an example of separating a mixture by crystallization. Crystallization is a separation technique that results in the formation of pure solid particles of a substance from a solution containing the dissolved substance. When the solution contains as much dissolved substance as it can possibly hold, the addition of even a tiny amount more often causes the dissolved substance to come out of solution and collect as crystals on any available surface.
In the rock candy example, as water evaporates from the sugar-water solution, the solution becomes more concentrated. This is equivalent to adding more of the dissolved substance to the solution. As more water evaporates, the sugar forms a solid crystal on the string, as shown in Figure 22. Crystallization produces highly pure solids.
Figure 22 As the water evaporates from the water-sugar solution, the sugar crystals form on the string.
Get It?Classify which techniques for separating mixtures depend on phase changes and identify the change used by each.
72 Module 2 • Matter—Properties and Changes
Program: HSS_NA Component: LessonPDF Pass
Vendor: Lumina Chapter: 02
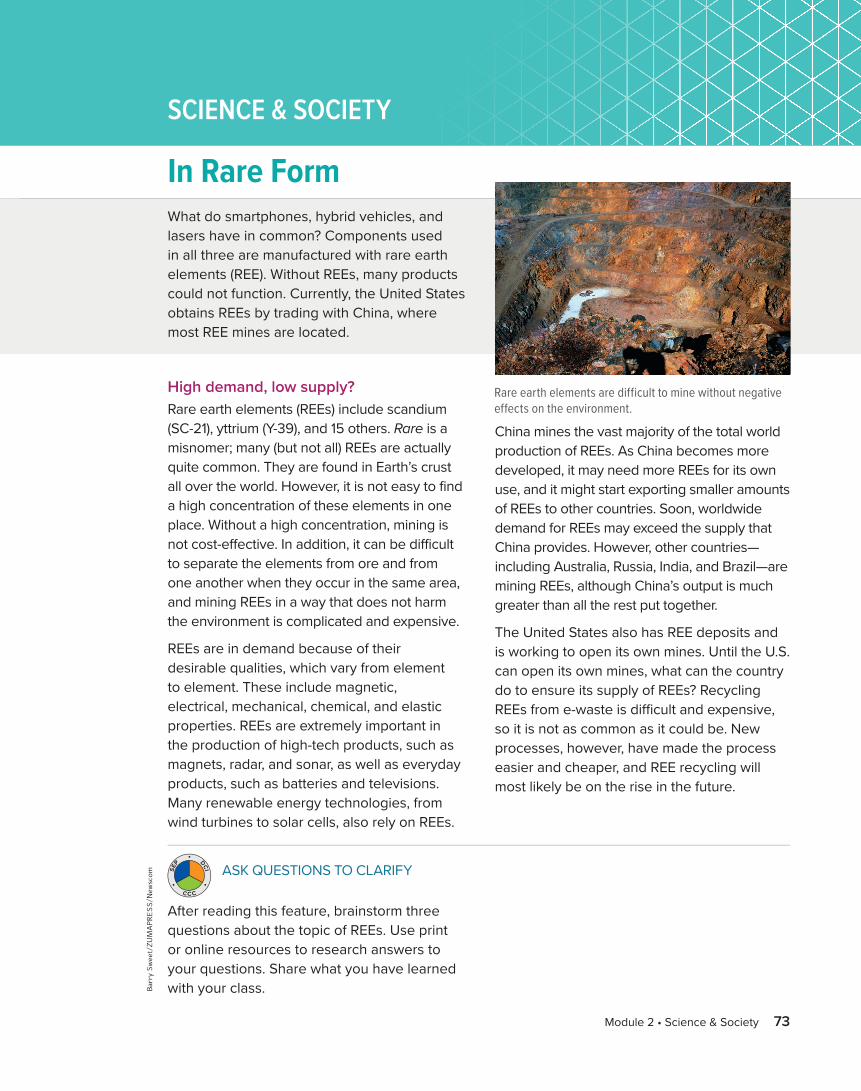
Bar
ry S
wee
t/ZU
MA
PRES
S/N
ewsc
om ASK QUESTIONS TO CLARIFY
After reading this feature, brainstorm three questions about the topic of REEs. Use print or online resources to research answers to your questions. Share what you have learned with your class.
C C C
SEP DCI
0073-0073_CHEM_CA_S_CH02_Feature_674695.indd 17/12/18 06:01PM
In Rare Form
High demand, low supply? Rare earth elements (REEs) include scandium (SC-21), yttrium (Y-39), and 15 others. Rare is a misnomer; many (but not all) REEs are actually quite common. They are found in Earth’s crust all over the world. However, it is not easy to find a high concentration of these elements in one place. Without a high concentration, mining is not cost-effective. In addition, it can be difficult to separate the elements from ore and from one another when they occur in the same area, and mining REEs in a way that does not harm the environment is complicated and expensive.
REEs are in demand because of their desirable qualities, which vary from element to element. These include magnetic, electrical, mechanical, chemical, and elastic properties. REEs are extremely important in the production of high-tech products, such as magnets, radar, and sonar, as well as everyday products, such as batteries and televisions. Many renewable energy technologies, from wind turbines to solar cells, also rely on REEs.
China mines the vast majority of the total world production of REEs. As China becomes more developed, it may need more REEs for its own use, and it might start exporting smaller amounts of REEs to other countries. Soon, worldwide demand for REEs may exceed the supply that China provides. However, other countries—including Australia, Russia, India, and Brazil—are mining REEs, although China’s output is much greater than all the rest put together.
The United States also has REE deposits and is working to open its own mines. Until the U.S. can open its own mines, what can the country do to ensure its supply of REEs? Recycling REEs from e-waste is difficult and expensive, so it is not as common as it could be. New processes, however, have made the process easier and cheaper, and REE recycling will most likely be on the rise in the future.
What do smartphones, hybrid vehicles, and lasers have in common? Components used in all three are manufactured with rare earth elements (REE). Without REEs, many products could not function. Currently, the United States obtains REEs by trading with China, where most REE mines are located.
Rare earth elements are difficult to mine without negative effects on the environment.
SCIENCE & SOCIETY
Module 2 • Science & Society 73
Program: HSS_NA Component: FeaturePDF Pass
Vendor: Lumina Chapter: 02

0074-0074_CHEM_CA_S_CH02_SG_674695.indd 17/12/18 06:01PM
Lesson 1 PROPERTIES OF MATTER • states of matter• solid• liquid• gas• vapor• physical property• extensive property• intensive property• chemical property
• Four states of matter are solid, liquid, gas, and plasma.• Physical properties can be observed without altering a
substance’s composition.• Chemical properties describe a substance’s ability to combine
with or change into one or more new substances.• External conditions can affect both physical and chemical properties.
Lesson 2 CHANGES IN MATTER • physical change• phase change• chemical change• law of conservation of mass
• A physical change alters the physical properties of a substance without changing its composition.
• A chemical change, also known as a chemical reaction, involves a change in a substance’s composition.
• In a chemical reaction, reactants form products.• The law of conservation of mass states that mass is neither
created nor destroyed during a chemical reaction; it is conserved.
Lesson 3 ELEMENTS AND COMPOUNDS • element• periodic table• compound• law of definite proportions• percent by mass• law of multiple proportions
• Elements cannot be broken down into simpler substances.• Elements are organized in the periodic table of the elements.• Compounds are chemical combinations of two or more elements,
and their properties differ from the properties of their compo-nent elements.
• The law of definite proportions states that a compound is always composed of the same elements in the same proportions.
• The law of multiple proportions states that if elements form more than one compound, those compounds will have composi-tions that are whole-number multiples of each other.
Lesson 4 MIXTURES OF MATTER • mixture• heterogeneous mixture• homogeneous mixture• solution• filtration• distillation• sublimation• chromatography• crystallization
• A mixture is a physical blend of two or more pure substances in any proportion.
• Solutions are homogeneous mixtures.• Mixtures can be separated by physical means. Common separa-
tion techniques include filtration, distillation, sublimation, chromatography, and crystallization.
massreactants = massproducts
percent by mass = mass of the element ________________ mass of the compound × 100
GO ONLINE to study with your Science Notebook.
MODULE 2STUDY GUIDE
74 Module 2 • Study Guide
Program: HSS_NA Component: SGPDF Pass
Vendor: Lumina Chapter: 02

Sopo
n C
hien
wit
taya
kun/
Mom
ent/
Get
ty Im
ages
0075-0075_CHEM_CA_S_CH02_MC_674695.indd 17/12/18 06:01PM
REVISIT THE PHENOMENON
Why is this volcano spewing bright blue flames?CER Claim, Evidence, ReasoningExplain Your Reasoning Revisit the claim you made when you encountered the phenomenon. Summarize the evidence you gathered from your investigations and research and finalize your Summary Table. Does your evidence support your claim? If not, revise your claim. Explain why your evidence supports your claim.
STEM UNIT PROJECTNow that you’ve completed the module, revisit your STEM unit project. You will summarize your evidence and apply it to the project.
Module Wrap-UpC C CSE
P DCI THREE-DIMENSIONAL THINKING
GO FURTHER Data Analysis Lab
How is compressed gas released?
Tanks of compressed gases are common in chemistry laboratories. For example, nitrogen is often flowed over a reaction in progress to displace other gases that might interfere with the experiment. Given what you know about gases, explain how the release of compressed nitrogen is controlled.
CER Analyze and Interpret Data
The particles of gases are far apart, and gases tend to fill their containers—even if the container is a laboratory room. Tanks of compressed gas come from the supplier capped to prevent the gas from escaping. In the lab, a chemist or technician attaches a regulator to the tank and secures the tank to a stable fixture. 1. Claim Explain why the flow of a compressed gas must be
controlled for practical and safe use.2. Evidence, Reasoning Predict what would happen if the valve on a
full tank of compressed gas were suddenly opened all the way or if the tank were accidentally punctured. Explain your prediction.
Module 2 • Matter—Properties and Changes 75
Program: HSS_NA Component: MCPDF Pass
Vendor: Lumina Chapter: 02

0076-0076_CHEM_CA_S_CH03_MO_674695.indd 17/12/18 06:01PM
Mon
ty R
akus
en/C
ultu
ra/G
etty
Imag
es
76 Module 3 • The Structure of the Atom
Program: HSS_NA Component: COPDF PASS
Vendor: Lumina Chapter: 03

MODULE 3THE STRUCTURE OF THE ATOM
ENCOUNTER THE PHENOMENON
What is matter made of?
GO ONLINE to play a video about the size of an atom.
Ask QuestionsDo you have other questions about the phenomenon? If so, add them to the driving question board.
CER Claim, Evidence, ReasoningMake Your Claim Use your CER chart to make a claim about what matter is made of.
Collect Evidence Use the lessons in this module to collect evidence to support your claim. Record your evidence as you move through the module.
Explain Your Reasoning You will revisit your claim and explain your reasoning at the end of the module.
GO ONLINE to access your CER chart and explore resources that can help you collect evidence.
LESSON 2: Explore & Explain: The Modern Model of the Atom
LESSON 1: Explore & Explain: Origins of Atomic Theory
Additional Resources
0077-0077_CHEM_NA_S_CH03_Investigate_Phenom_138115.indd 03/05/19 03:59PM
(l t
o r,
t to
b)V
ideo
Sup
plie
d by
BB
C W
orld
wid
e Le
arni
ng; W
eepi
ng W
illow
Pho
togr
aphy
/Mom
ent/
Get
ty Im
ages
; McG
raw
-Hill
Edu
cati
on; T
inke
Ham
min
g/In
gram
Pub
lishi
ng; M
cGra
w-H
ill E
duca
tion
Module 3 • Encounter the Phenomenon 77
Program: HSS_NA Component: IPPDF Pass
Vendor: Aptara Chapter: 03
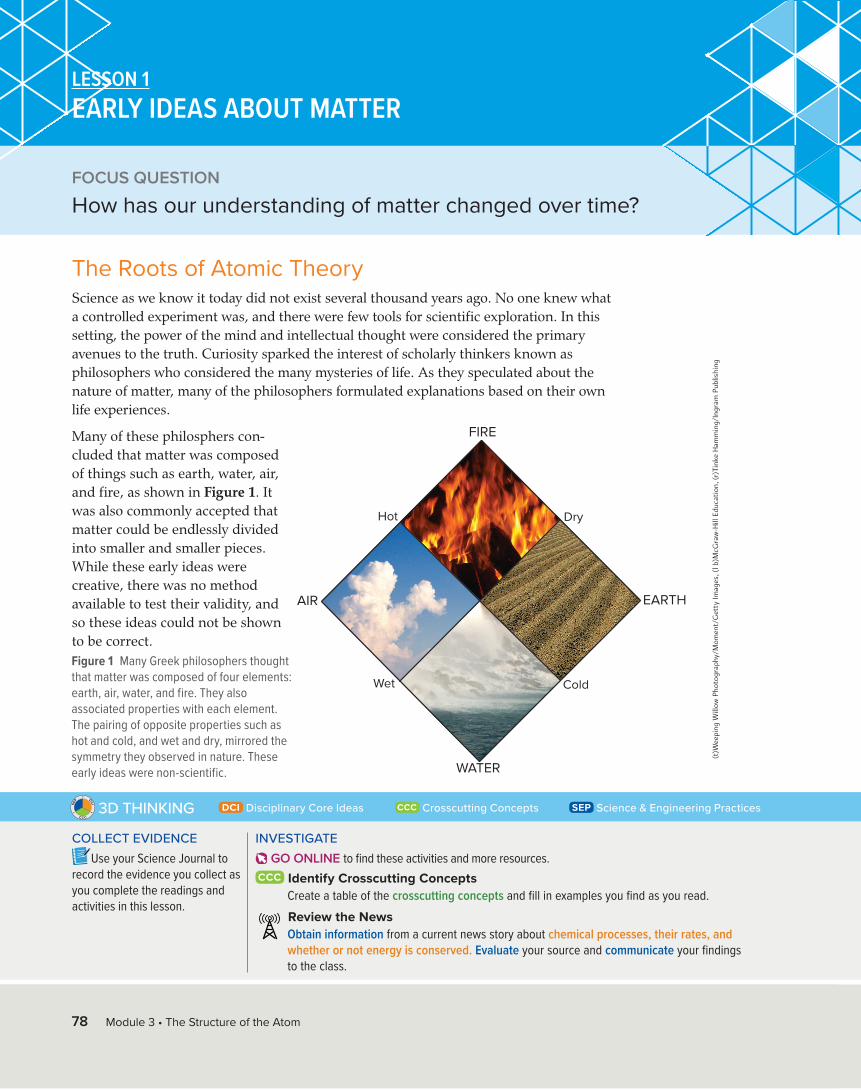
WATER
FIRE
EARTHAIR
Dry
Cold
Hot
Wet
(t)W
eepi
ng W
illow
Pho
togr
aphy
/Mom
ent/
Get
ty Im
ages
, (l b
)McG
raw
-Hill
Edu
cati
on, (
r)Ti
nke
Ham
min
g/In
gram
Pub
lishi
ng
0078-0081_CHEM_CA_S_CH03_L01_674695.indd 17/12/18 06:01PM0078-0081_CHEM_CA_S_CH03_L01_674695.indd 17/12/18 06:01PM
The Roots of Atomic TheoryScience as we know it today did not exist several thousand years ago. No one knew what a controlled experiment was, and there were few tools for scientific exploration. In this setting, the power of the mind and intellectual thought were considered the primary avenues to the truth. Curiosity sparked the interest of scholarly thinkers known as philosophers who considered the many mysteries of life. As they speculated about the nature of matter, many of the philosophers formulated explanations based on their own life experiences.
Many of these philosphers con-cluded that matter was composed of things such as earth, water, air, and fire, as shown in Figure 1. It was also commonly accepted that matter could be endlessly divided into smaller and smaller pieces. While these early ideas were creative, there was no method available to test their validity, and so these ideas could not be shown to be correct.Figure 1 Many Greek philosophers thought that matter was composed of four elements: earth, air, water, and fire. They also associated properties with each element. The pairing of opposite properties such as hot and cold, and wet and dry, mirrored the symmetry they observed in nature. These early ideas were non-scientific.
FOCUS QUESTION
How has our understanding of matter changed over time?
LESSON 1EARLY IDEAS ABOUT MATTER
Disciplinary Core Ideas Crosscutting Concepts Science & Engineering Practices3D THINKINGC C C
SEP DCI
COLLECT EVIDENCEUse your Science Journal to
record the evidence you collect as you complete the readings and activities in this lesson.
INVESTIGATE GO ONLINE to find these activities and more resources.
Identify Crosscutting ConceptsCreate a table of the crosscutting concepts and fill in examples you find as you read. Review the NewsObtain information from a current news story about chemical processes, their rates, and whether or not energy is conserved. Evaluate your source and communicate your findings to the class.
78 Module 3 • The Structure of the Atom
Program: HSS_NA Component: Lesson 1PDF Pass
Vendor: Lumina Chapter: 03

0078-0081_CHEM_CA_S_CH03_L01_674695.indd 07/01/19 12:53PM0078-0081_CHEM_CA_S_CH03_L01_674695.indd 07/01/19 12:53PM
Table 1 Ancient Greek Ideas About MatterPhilosopher Ideas
Democritus(460–370 b.c.)
• Matter is composed of atoms, which move through empty space.• Atoms are solid, homogeneous, indestructible, and indivisible.• Different kinds of atoms have different sizes and shapes.• Size, shape, and movement of atoms determine the properties of matter.
Aristotle(384–322 b.c.)
• Empty space cannot exist.• Matter is made of earth, fire, and water.
DemocritusThe Greek philosopher Democritus (460–370 b.c.) was the first person to propose the idea that matter was not infinitely divisible. He believed matter was made up of tiny particles called atomos, from which the English word atom is derived. Democritus believed that atoms could not be created, destroyed, or further divided. Democritus and a summary of his ideas are shown in Table 1.
While a number of Democritus’s ideas do not agree with modern atomic theory, his belief in the existence of atoms was amazingly ahead of his time. However his ideas were met with criticism from other philosophers who asked, “What holds the atoms together?” Democritus could not answer this question.
Aristotle Other criticisms came from Aristotle (384–322 b.c.), one of the most influential Greek philosophers. He rejected the notion of atoms because it did not agree with his own ideas about nature. One of Aristotle’s major criticisms concerned the idea that atoms moved through empty space. He did not believe that empty space could exist. His ideas are also presented in Table 1. Because Aristotle was one of the most influential philoso-phers of his time, Democritus’s atomic theory was eventually rejected.
In fairness to Democritus, it was impossible for him or anyone else of his time to deter-mine what held atoms together. More than two thousand years would pass before scientists would know the answer. However, it is important to realize that Democritus’s ideas were just that—ideas, not science. Without the ability to conduct controlled experiments, Democritus could not identify patterns, test the validity of his ideas, and collect evidence to support his hypotheses.
Unfortunately for the advancement of science, Aristotle was able to gain wide accep-tance for his ideas on nature—ideas that denied the existence of atoms. Incredibly, the influence of Aristotle was so great and the development of science so primitive that his denial of the existence of atoms went largely unchallenged for two thousand years!
STEM CAREER Connection Chemistry ProfessorIf you like spending time with people and have a passion for chemistry and research, professors spend their time instructing students at a wide variety of colleges, universities, and community colleges. In addition, they conduct research and publish scholarly papers and books. You will need a master’s degree or Ph.D. depending on the institution’s requirements.
CROSSCUTTING CONCEPTSPatterns Examine the contributions of Democritus, Aristotle, and Dalton. In groups of two, make a poster that compares and contrasts any methods that were used or patterns that were identified that provided evidence in explaining the nature of matter and the atom.
Lesson 1 • Early Ideas About Matter 79
Program: HSS_NA Component: Lesson 1PDF Pass
Vendor: Lumina Chapter: 03

Scie
nce
Sour
ce
0078-0081_CHEM_CA_S_CH03_L01_674695.indd 17/12/18 06:01PM0078-0081_CHEM_CA_S_CH03_L01_674695.indd 17/12/18 06:01PM
Table 2 Dalton’s Atomic TheoryScientist Ideas
Dalton(1766–1844)
• Matter is composed of extremely small particles called atoms.• Atoms are indivisible and indestructible.• Atoms of a given element are identical in size, mass, and chemical properties.• Atoms of a specific element are different from those of another element.• Different atoms combine in simple whole-number ratios to form compounds.• In a chemical reaction, atoms are separated, combined, or rearranged.
John Dalton Although the concept of the atom was revived in the eighteenth century, it took another hundred years before significant progress was made. The work done in the nineteenth century by John Dalton (1766–1844), a schoolteacher in England, marks the beginning of the development of modern atomic theory. Dalton revived and revised Democritus’s ideas based on the results of scientific research he conducted. In many ways, Democri-tus’s and Dalton’s ideas are similar.
Thanks to advancements in science since Democritus’s day, Dalton was able to perform experiments that allowed him to identify patterns that refined previous understandings and developed new explanations that were supported by his research. He studied numerous chemical reactions, making careful observations and measurements along the way. He was able to determine the mass ratios of the elements involved in those reactions. The mass ratio describes how many atoms of each element make up a com-pound. The results of his research are known as Dalton’s atomic theory, which he proposed in 1803. The main points of his theory are summarized in Table 2. Dalton published his ideas in a book, an extract of which is shown in Figure 2.
Get It?Explain how Dalton built upon the ideas that Democritus had about matter.
Figure 2 In his book, A New System of Chemical Philosophy, John Dalton presented his symbols for the elements known at that time and their possible combinations.
80 Module 3 • The Structure of the Atom
Program: HSS_NA Component: Lesson 1PDF Pass
Vendor: Lumina Chapter: 03

C04_008A
Atoms of Element ATotal mass = 4(Mass A)
Atoms of Element BTotal mass = 8(Mass B)
Compound composedof Elements A and B
Total mass = 4(Mass A) + 8(Mass B)
+
0078-0081_CHEM_CA_S_CH03_L01_674695.indd 17/12/18 06:01PM0078-0081_CHEM_CA_S_CH03_L01_674695.indd 17/12/18 06:01PM
Figure 3 When atoms of two or more elements combine to form a compound, the number of atoms of each element is conserved. Thus, the mass is conserved as well.
Conservation of massThe law of conservation of mass states that mass is conserved in any process. Dalton’s atomic theory explains that the conservation of mass in chemical reactions is the result of the rearrangement of atoms during the reaction. They are not created or destroyed. The formation of a compound by combining elements is shown in Figure 3. Notice that the mass ratio for the compound consists of 1 atom of element A and 2 atoms of element B, a 1:2 ratio. The total number of atoms of each element is the same before and after the reaction.
Dalton’s convincing experimental evidence and clear explanation of the composition of compounds, and conservation of mass, led to the general acceptance of his atomic theory. However, not all of Dalton’s theory was accurate. As our undertanding of atoms evolved, new information was learned, leading to the revision and improvement of Dalton’s atomic theory by later scientists.
Check Your ProgressSummary• Democritus was the first person to
propose the existence of atoms.• According to Democritus, atoms
are solid, homogeneous, and indivisible.
• Aristotle did not believe in the existence of atoms.
• Dalton revised the ideas of Democritus based on the results of scientific research.
Demonstrate Understanding 1 . Summarize how matter was described by many early
Greek philosophers.2. Define atom using your own words.3. Summarize Dalton’s atomic theory.4. Explain the relationship between Dalton’s atomic theory
and the conservation of mass in chemical reactions.5. Design a concept map that compares and contrasts
how Democritus, Aristotle, and Dalton viewed matter.
Go online to follow your personalized learning path to review, practice, and reinforce your understanding.
Lesson 1 • Early Ideas About Matter 81
Program: HSS_NA Component: Lesson 1PDF Pass
Vendor: Lumina Chapter: 03

(t)ly
nx/i
cono
tec.
com
/Glo
w Im
ages
, (b)
NA
SA
0082-0090_CHEM_CA_S_CH03_L02_674695.indd 07/01/19 12:54PM0082-0090_CHEM_CA_S_CH03_L02_674695.indd 07/01/19 12:54PM
The AtomMany experiments since Dalton’s time have proven that atoms do exist. So what exactly is the definition of an atom? To answer this question, consider a gold ring. Suppose you decide to grind the ring down into a pile of gold dust. Each fragment of gold dust still retains all of the properties of gold. If it were possible—which it is not without special equipment—you could continue to divide the gold dust particles into still smaller particles. Eventually, you would encounter a particle that could not be divided any further and still retain the properties of gold. This smallest particle of matter that retains the properties of the element is called an atom.
To get an idea of its size, consider the population of the world, which was about 6.5 × 10⁹ in 2006. By comparison, a typical solid-copper penny contains 2.9 × 10²² atoms, almost five trillion times the world population! The diameter of a single copper atom is 1.28 × 10⁻¹⁰ m. Placing 6.5 × 10⁹ copper atoms side by side would result in a line of copper atoms less than 1 m long. Figure 4 illustrates another way to visualize the size of an atom. Imagine that you increase the size of an atom to be as big as an orange. To keep the propor-tions between the real sizes of the atom and the orange, you would have to increase the size of the orange and make it as big as Earth. This illustrates how small atoms are. It was because of this that scientists could not see the atom they were attempting to model.
Figure 4 Imagine that you could increase the size of an atom to make it as big as an orange. At this new scale, an orange would be as big as Earth.
Disciplinary Core Ideas Crosscutting Concepts Science & Engineering Practices3D THINKINGC C C
SEP DCI
COLLECT EVIDENCEUse your Science Journal to
record the evidence you collect as you complete the readings and activities in this lesson.
INVESTIGATE GO ONLINE to find these activities and more resources.
Applying Practices: Modeling Electrostatic Forces–The Early Atom HS-PS2-4. Use mathematical representations of Newton’s Law of Gravitation and Coulomb’s Law to describe and predict the gravitational and electrostatic forces between objects. Revisit the Encounter the Phenomenon QuestionWhat information from this lesson can help you answer the module question?
FOCUS QUESTION
What does an atom look like?
LESSON 2DEFINING THE ATOM
82 Module 3 • The Structure of the Atom
Program: HSS_NA Component: Lesson 2PDF Pass
Vendor: Lumina Chapter: 03

C04_012A
Voltage source
Openingconnected toa vacuum pump
Anode (+)
Tube
Cathode (-)
- +
© A
ndre
w D
unn/
Ala
my
0082-0090_CHEM_CA_S_CH03_L02_138115.indd 21/05/18 10:44AM0082-0090_CHEM_CA_S_CH03_L02_138115.indd 21/05/18 10:44AM
You might think that because atoms are so small, there would be no way to see them. However, an instrument called the scanning tunneling microscope (STM) allows individual atoms to be seen. An STM works as follows: a fine point is moved above a sample and the interaction of the point with the superficial atoms is recorded electronically. Figure 5 illustrates how individual atoms look when observed with an STM. Scientists are now able to move individual atoms around to form shapes, patterns, and even simple machines. This capability has led to the exciting new field of nanotechnology. The promise of nanotechnology is molecular manufacturing—the atom-by-atom building of machines the size of molecules.
The ElectronOnce scientists were convinced of the existence of atoms, a new set of questions emerged. What is an atom like? Is the composition of an atom uniform throughout, or is it composed of still-smaller particles? Although many scientists researched the atom in the 1800s, it was not until almost 1900 that some of these questions were answered. The development of new technologies allowed scientists to develop models that were used to simulate systems to determine interactions within and between systems at different scales.
The cathode-ray tubeAs scientists tried to unravel the atom, they began to make connections between matter and electric charge. Scientist learned, through experimentation, using models to simu-late systems, that the structure and interactions of matter are determined by electrical forces. With the help of the newly invented vacuum pump, they passed electricity through glass tubes from which most of the air had been removed. Such tubes are called cathode-ray tubes and were invented and investigated by scientists from 1869–1875.
A typical cathode-ray tube used by researchers for studying the relationship between mass and charge is illustrated in Figure 6. Note that metal electrodes are located at opposite ends of the tube. The electrode connected to the negative terminal of the battery is called the cathode, and the electrode connected to the positive terminal is called the anode.
Figure 6 A cathode-ray tube is a tube with an anode at one end and a cathode at the other end. When a voltage is applied, electricity travels from the cathode to the anode.
Figure 5 This image, recorded with an STM, shows the individual atoms of a fatty acid on a graphite surface. The false colors were added later on to improve the contrast between each atom.
Lesson 2 • Defining the Atom 83
Program: HSS_NA Component: Lesson 2PDF Pass
Vendor: Lumina Chapter: 03

C04_013A
Magnet
S
N+
a
-
C04_013A-A
+
Electricallycharged plates
b
-
+-
0082-0090_CHEM_CA_S_CH03_L02_138115.indd 21/05/18 10:44AM 0082-0090_CHEM_CA_S_CH03_L02_138115.indd 0082-0090_CHEM_CA_S_CH03_L02_138115.indd 21/05/18 10:44AM 0082-0090_CHEM_CA_S_CH03_L02_138115.indd
Sir William Crookes While working in a darkened laboratory, English physicist Sir William Crookes noticed a flash of light within one of the cathode-ray tubes. A green flash was produced by some form of radiation striking a zinc-sulfide coating that had been applied to the end of the tube. Further work showed that there was a ray (radiation) going through the tube. This ray, originating from the cathode and traveling to the anode, was called a cathode ray. The accidental discovery of the cathode ray led to the invention of television, which is nothing more than a cathode-ray tube. Scientists continued their research using cathode-ray tubes, and they were fairly convinced by the end of the 1800s that cathode rays were a stream of charged particles and that these particles carried a negative charge. The exact value of the negative charge was not yet known.
Because changing the metal that makes up the electrodes or varying the gas (at very low pressure) in the cathode-ray tube did not affect the cathode ray produced, researchers concluded that the ray’s negative particles were found in all forms of matter. These negatively charged particles that are part of all forms of matter are now known as electrons. Some of the experiments used to determine the properties of the cathode ray are shown in Figure 7.
Mass and charge of the electronIn spite of the progress made from all of the cathode-ray tube experiments, no one succeeded in determining the mass of a single cathode-ray particle. Unable to measure the particle’s mass directly, English physicist J. J. Thomson (1856–1940) began a series of cathode-ray tube experiments at Cambridge University in the late 1890s to determine the ratio of its charge to its mass.
Charge-to-mass ratio By carefully measuring the effects of both magnetic and electric fields on a cathode ray, Thomson was able to determine the charge-to-mass ratio of the charged particle. He then compared that ratio to other known ratios.
Figure 7 A tiny hole located at the center of the anode produces a thin beam of electrons. A phosphor coating allows the position of the beam to be determined as it strikes the end of the tube.
Because the cathode ray is deflected in a magnetic field, the particles in the ray must be charged.
Because the cathode ray is deflected toward the positively charged plate by an electric field, the particles in the ray must have a negative charge.
84 Module 3 • The Structure of the Atom
Program: HSS_NA Component: Lesson 2PDF Pass
Vendor: Lumina Chapter: 03

C04_015A
AtomizerSource ofionizingradiation
Positivelycharged plate
Telescope
Negativelycharged plate
(+)
(-)
17/12/18 06:01PM 0082-0090_CHEM_CA_S_CH03_L02_674695.indd 17/12/18 06:01PM17/12/18 06:01PM 0082-0090_CHEM_CA_S_CH03_L02_674695.indd 17/12/18 06:01PM
Figure 8 The motion of oil droplets within Millikan’s apparatus depends on the charge of droplets on the electric field. Millikan observed the droplets with the telescope. He could make droplets fall more slowly, rise, or pause has he varied the strength of the electric field. From his observations, he calculated the charge on each droplet.
Thomson concluded that the mass of the charged particle was much less than that of a hydrogen atom, the lightest known atom. The conclusion was shocking because it meant there were particles smaller than the atom. In other words, Dalton had been incorrect—atoms were divisible into smaller subatomic particles. Because Dalton’s atomic theory had become so widely accepted and Thomson’s conclusion was so revolutionary, many other scientists found it hard to accept this new discovery. But Thomson was correct. He had identified the first subatomic particle—the electron. He received a Nobel Prize in 1906 for this discovery.
The oil-drop experiment and the charge of an electron The next significant development came in the early 1910s, when the American physicist Robert Millikan (1868–1953) determined the charge of an electron using the oil-drop apparatus shown in Figure 8. In this apparatus, oil is sprayed into the chamber above the two parallel charged plates. The top plate has a small hole through which the oil drops. X-rays knock out electrons from the air particles between the plates and the electrons stick to the droplets, giving them a negative charge. By varying the intensity of the electric field, Millikan could control the rate of a droplet’s fall. He determined that the magnitude of the charge on each drop increased in discrete amounts and determined that the smallest common denominator was 1.602 × 10⁻¹⁹ coulombs. He identified this number as the charge of the electron. This charge was later equated to a single unit of negative charge noted 1–; in other words, a single electron carries a charge of 1–. So good was Millikan’s experimental setup and technique that the charge he measured almost one hundred years ago is within 1% of the currently accepted value.
Mass of an electron Knowing the electron’s charge and using the known charge-to-mass ratio, Millikan calculated the mass of an electron. The equation below shows how small the mass of an electron is.
Mass of an electron = 9.1 × 10⁻²⁸ g = 1 ____ 1840 the mass of a hydrogen atom
Get It?Summarize how Crookes and Thomson contributed to our understanding of the nature of the electron.
Lesson 2 • Defining the Atom 85
Program: HSS_NA Component: Lesson 2PDF Pass
Vendor: Lumina Chapter: 03

C04_016A
ElectronsMatter containingevenly distributedpositive charge
0082-0090_CHEM_CA_S_CH03_L02_674695.indd 17/12/18 06:01PM 0082-0090_CHEM_CA_S_CH03_L02_674695.indd 0082-0090_CHEM_CA_S_CH03_L02_674695.indd 17/12/18 06:01PM 0082-0090_CHEM_CA_S_CH03_L02_674695.indd
Figure 9 J.J. Thomson’s plum pudding model of the atom states that the atom is a uniform, positively charged sphere containing electrons.
The plum pudding model The existence of the electron and the knowledge of some of its properties raised some interesting new questions about the nature of atoms. It was known that matter is neutral—it has no electric charge. You know that matter is neutral from everyday experi-ence: you do not receive an electric shock (except under certain conditions) when you touch an object. If electrons are part of all matter and they possess a negative charge, how can all matter be neutral? Also, if the mass of an electron is so small, what accounts for the rest of the mass in a typical atom?
In an attempt to answer these questions, J. J. Thomson proposed a model of the atom that became known as the plum pudding model. As you can see in Figure 9, Thomson’s model consisted of a spherically shaped atom composed of a uniformly distributed positive charge in which the individual negatively charged electrons resided. However, as you are about to read, Thomson’s plum pudding model of the atom did not last for very long.
The NucleusIn 1911, Ernest Rutherford (1871–1937) began to study how positively charged alpha particles (radioactive particles you will read more about later in this module) interacted with solid matter. With a small group of scientists, Rutherford conducted an experiment to see if alpha particles would be deflected as they passed through a thin gold foil. If they were deflected, by how much would they deflect?
Rutherford’s experimentIn the experiment, a narrow beam of alpha particles was aimed at a thin sheet of gold foil. A zinc-sulfide coated screen surrounding the gold foil produced a flash of light when struck by an alpha particle. By noting where the flashes occurred, the scientists could determine if the atoms in the gold foil deflected the alpha particles. As with any good experimental design, the procedure was repeated over and over again to ensure that all observations were taken and that all results observed were repeated in each trial. As the number of times an experiment is repeated increases, and the same results are obtained, the results are easier for scientists to accept.
86 Module 3 • The Structure of the Atom
Program: HSS_NA Component: Lesson 2PDF Pass
Vendor: Lumina Chapter: 03
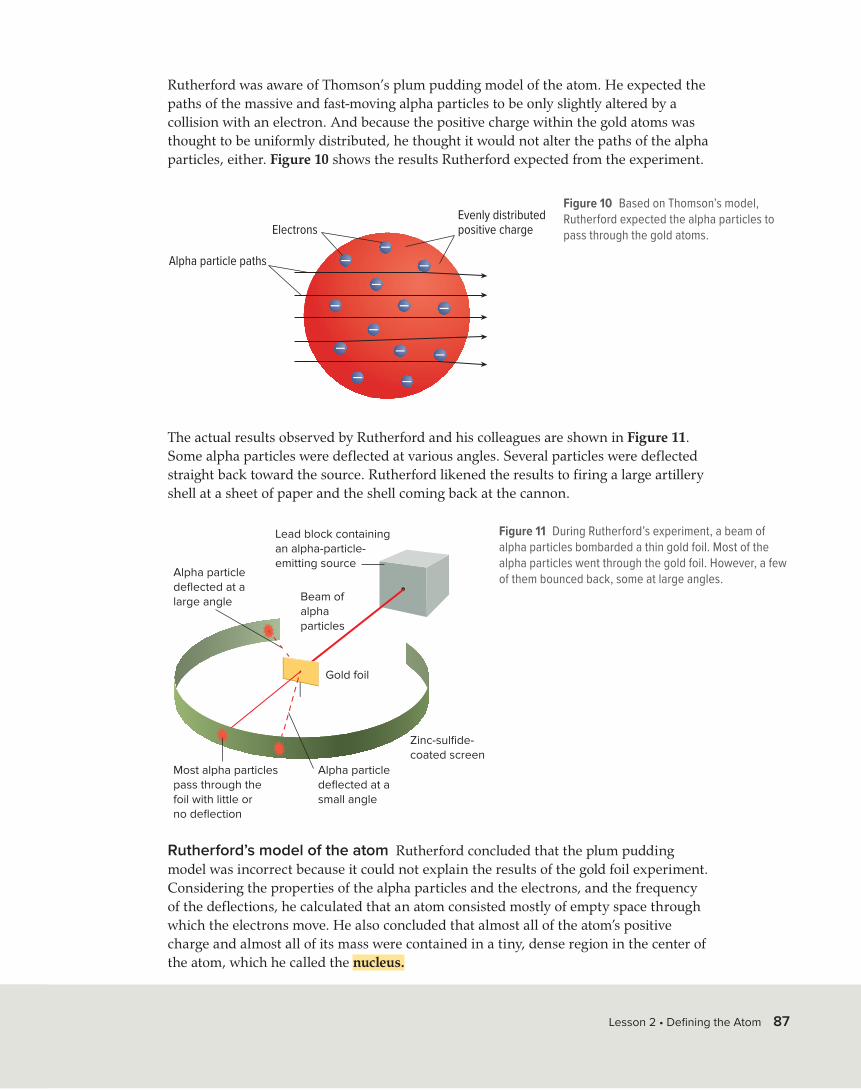
C04_018A
Electrons
Alpha particle paths
Evenly distributedpositive charge
--
-
-
-
- -
- -
--
--
C04_019A
Gold foil
Beam ofalphaparticles
Most alpha particlespass through thefoil with little orno deflection
Lead block containingan alpha-particle-emitting source
Zinc-sulfide-coated screen
Alpha particledeflected at asmall angle
Alpha particledeflected at alarge angle
17/12/18 06:01PM 0082-0090_CHEM_CA_S_CH03_L02_674695.indd 17/12/18 06:01PM17/12/18 06:01PM 0082-0090_CHEM_CA_S_CH03_L02_674695.indd 17/12/18 06:01PM
Rutherford was aware of Thomson’s plum pudding model of the atom. He expected the paths of the massive and fast-moving alpha particles to be only slightly altered by a collision with an electron. And because the positive charge within the gold atoms was thought to be uniformly distributed, he thought it would not alter the paths of the alpha particles, either. Figure 10 shows the results Rutherford expected from the experiment.
Figure 10 Based on Thomson’s model, Rutherford expected the alpha particles to pass through the gold atoms.
The actual results observed by Rutherford and his colleagues are shown in Figure 11. Some alpha particles were deflected at various angles. Several particles were deflected straight back toward the source. Rutherford likened the results to firing a large artillery shell at a sheet of paper and the shell coming back at the cannon.
Figure 11 During Rutherford’s experiment, a beam of alpha particles bombarded a thin gold foil. Most of the alpha particles went through the gold foil. However, a few of them bounced back, some at large angles.
Rutherford’s model of the atom Rutherford concluded that the plum pudding model was incorrect because it could not explain the results of the gold foil experiment. Considering the properties of the alpha particles and the electrons, and the frequency of the deflections, he calculated that an atom consisted mostly of empty space through which the electrons move. He also concluded that almost all of the atom’s positive charge and almost all of its mass were contained in a tiny, dense region in the center of the atom, which he called the nucleus.
Lesson 2 • Defining the Atom 87
Program: HSS_NA Component: Lesson 2PDF Pass
Vendor: Lumina Chapter: 03

C04_020A
Nucleus
Alpha particlepaths
Electrons
--
-
-
-
- -
-
-
+ -
--
-
0082-0090_CHEM_CA_S_CH03_L02_674695.indd 17/12/18 06:01PM0082-0090_CHEM_CA_S_CH03_L02_674695.indd 17/12/18 06:01PM
Figure 12 In Rutherford’s nuclear model, the atom is composed of a dense, positively charged nucleus that is surrounded by negative electrons. Alpha particles passing far from the nucleus are only slightly deflected, if at all. Those passing closer to the nucleus are deflected more. Alpha particles directly approaching the nucleus are deflected at large angles.
The negatively charged electrons are held within the atom by their attraction to the positively charged nucleus. Rutherford’s nuclear atomic model is shown in Figure 12.
Because the nucleus occupies such a small space and contains most of an atom’s mass, it is incredibly dense. If a nucleus were the size of the dot in an exclamation point, its mass would be amost as much as 70 automobiles! The volume of space through which the electrons move is huge compared to the volume of the nucleus. If an atom had a diameter of two football fields, the nucleus would be the size of a nickel.
The repulsive force produced between the positive nucleus and the positive alpha parti-cles causes the deflections. Figure 12 illustrates how Rutherford’s nuclear atomic model explained the results of the gold foil experiment. The nuclear model also explains the neutral nature of matter: the positive charge of the nucleus balances the negative charge of the electrons. However, the model still could not account for all of the atom’s mass.
The proton and the neutronBy 1920, Rutherford concluded that the nucleus contained positively charged particles called protons. A proton is a subatomic particle carrying a charge equal to but opposite that of an electron. In 1932, Rutherford’s coworker, James Chadwick (1891–1974), showed that the nucleus also contained another subatomic neutral particle, called the neutron. A neutron is a subatomic particle that has a mass nearly equal to that of a proton, but carries no electric charge.
Completing the model of the atom All atoms have a charged substructure consisting of a small, dense nucleus, which is made of protons and neutrons, surrounded by one or more electrons. Figure 13, on the next page, summarizes the history and development of modern atomic theory.
Get It?Describe how the photograph at the beginning of the module is related to Rutherford’s ideas about what atoms are made of.
SCIENCE USAGE V. COMMON USAGEneutralScience usage: to have no electric charge Neutrons have a charge of zero. They are neutral particles.Common usage: not engaged in either side Switzerland remained neutral during World War II.
CROSSCUTTING CONCEPTSSystem and System Models Review the system models used by Crookes, Thomson, Millikan, Rutherford, and Chadwick that led to the development of the completed model of the atom. Develop a time line describing their model simulations, instruments, and contributions to atomic theory.
88 Module 3 • The Structure of the Atom
Program: HSS_NA Component: Lesson 2PDF Pass
Vendor: Lumina Chapter: 03

1 23
4
6
5
7
8
6 1954 CERN, the world’s largest nuclear physics research center, located in Switzerland, is founded to study particle physics.
7 1968 Scientists provide the first experimental evidence for subatomic particles known as quarks.
5 1938 Lise Meitner, Otto Hahn, and Fritz Straussman split uranium atoms in a process they called fission.
4 1932 James Chadwick proves the existence of neutrons.
1 1897 Using cathode-ray tubes, J.J. Thomson identifies the electron and determines the ratio of the mass of an electron to its electric charge.
2 1911 With the gold foil experiment, Ernest Rutherford determines properties of the nucleus, including charge, relative size, and density.
3 1913 Niels Bohr publishes a theory of atomic structure relating the electron arrangement in atoms to atomic chemical properties.
8 2010–2013 The Large Hadron Collider at CERN smashes beams of protons at the highest energy ever, allowing scientists to find a particle consistent with the predicted properties of the Higgs boson.
Development of Modern Atomic Theory
Current understanding of the properties and behavior of atoms and subatomic particles is based on the work of scientists worldwide during the past two centuries.
0082-0090_CHEM_CA_S_CH03_L02_138115.indd 21/05/18 10:45AM0082-0090_CHEM_CA_S_CH03_L02_138115.indd 21/05/18 10:45AM
Figure 13
Lesson 2 • Defining the Atom 89
Program: HSS_NA Component: Lesson 2PDF Pass
Vendor: Lumina Chapter: 03

C04_022A
Electron cloud Nucleus containing protons and neutrons
0082-0090_CHEM_CA_S_CH03_L02_674695.indd 17/12/18 06:01PM0082-0090_CHEM_CA_S_CH03_L02_674695.indd 17/12/18 06:01PM
Summary• An atom is the smallest particle
of an element that maintains the properties of that element.
• Electrons have a 1- charge, protons have a 1+ charge, and neutrons have no charge.
• An atom consists mostly of empty space surrounding the nucleus.
Check Your ProgressDemonstrate Understanding6. Describe the structure of a typical atom. Identify the
location and charge of each subatomic particle. 7. Compare and contrast Thomson’s plum pudding
atomic model with Rutherford’s nuclear atomic model.8. Describe the research, including instrumentation,
which led to the conclusion that electrons are nega-tively charged particles found in all matter.
9. Compare the relative charge and mass of each subatomic particle.
10. Calculate What is the difference expressed in kilograms between the mass of a proton and the mass of an electron?
Go online to follow your personalized learning path to review, practice, and reinforce your understanding.
Most of an atom consists of fast-moving electrons traveling through empty space around the nucleus. The electrons are held within the atom by their attraction to the positively charged nucleus. The nucleus, which is composed of neutral neutrons (hydrogen’s single-proton nucleus is an exception) and positively charged protons, contains more than 99.97% of an atom’s mass. It occupies only about one ten-thousandth of the volume of the atom. Because an atom is electrically neutral, the number of protons in the nucleus equals the number of electrons around the nucleus. The typical atom is shown in Figure 14, and the properties of the subatomic particles are summarized in Table 3.
Scientists have determined that protons and neutrons have their own structures. They are composed of subatomic particles called quarks. These particles will not be covered in this textbook because scientists do not yet understand if or how they affect chemical behavior. Chemical behavior can be explained by considering only an atom’s electrons.
Figure 14 Atoms are composed of a nucleus containing protons and neutrons, and surrounded by a cloud of electrons.
Table 3 Properties of Subatomic Particles
Particle SymbolRelative Electric Charge
Relative Mass
Actual Mass (g)
Electron e- 1- 1 ____ 1840 9.11 × 10⁻²⁸
Proton p 1+ 1 1.673 × 10⁻²⁴
Neutron n 0 1 1.675 × 10⁻²⁴
90 Module 3 • The Structure of the Atom
Program: HSS_NA Component: Lesson 2PDF Pass
Vendor: Lumina Chapter: 03

C04_023A
Hydrogen1.008
Atomicnumber
Averageatomic mass
Chemicalsymbol
Chemicalname
1 H
0091-0097_CHEM_CA_S_CH03_L03_674695.indd 17/12/18 06:02PM0091-0097_CHEM_CA_S_CH03_L03_674695.indd 17/12/18 06:02PM
Atomic NumberThere are more than 110 different elements on the periodic table of the elements. What makes an atom of one element different from an atom of another element? After Ruther-ford’s gold foil experiment, the English scientist Henry Moseley (1887–1915) discovered that an element contains a unique positive charge in its nucleus. Thus, the number of protons in an atom identifies it as an atom of a particular element. The number of protons in an atom is referred to as the atomic number. Hydrogen’s square on the periodic table is shown in Figure 15. The number 1 to the left of the symbol is the atomic number. Moving across the periodic table to the right, you will next come to helium (He). It has two protons in its nucleus; thus, it has an atomic number of 2. The next row begins with lithium (Li), atomic number 3, and so on. The periodic table is organized left-to-right and top-to-bottom by increasing atomic number. The pattern of repeating order is called periodicity, which accounts for the name given to this table.
Elements are listed in their neutral state on the periodic table. Therefore, once you know the atomic number of an element, you know the number of protons and electrons it contains. Lithium, with an atomic number of 3, has three protons and three electrons. Thus, the periodicity of the elements in the periodic table provides a clue as to how the structure of each element differs.
Figure 15 In the periodic table, each element is represented by its chemical name, atomic number, chemical symbol, and average atomic mass.
Atomic numberatomic number = number of protons
= number of electronsThe atomic number of an atom equals its number of protons and its number of electrons.
LESSON 3HOW ATOMS DIFFER
FOCUS QUESTION
Are all atoms identical?
Disciplinary Core Ideas Crosscutting Concepts Science & Engineering Practices3D THINKINGC C C
SEP DCI
COLLECT EVIDENCEUse your Science Journal to
record the evidence you collect as you complete the readings and activities in this lesson.
INVESTIGATE GO ONLINE to find these activities and more resources.
Virtual Investigation: Decoding the Periodic TableAnalyze and interpret data to identify the patterns in the structure and properties of matter.
Quick Investigation: Model IsotopesPlan and carry out an investigation to create a model of stable forms of matter.
Lesson 3 • How Atoms Differ 91
Program: HSS_NA Component: Lesson 3PDF Pass
Vendor: Lumina Chapter: 03

0091-0097_CHEM_CA_S_CH03_L03_138115.indd 21/05/18 10:45AM 0091-0097_CHEM_CA_S_CH03_L03_138115.indd 0091-0097_CHEM_CA_S_CH03_L03_138115.indd 21/05/18 10:45AM 0091-0097_CHEM_CA_S_CH03_L03_138115.indd
EXAMPLE Problem 1
ATOMIC NUMBER Complete the following table.Composition of Several Elements
Element Atomic Number Protons Electrons
a. Pb 82
b. 8
c. 30
1 ANALYZE THE PROBLEMApply the relationship among atomic number, number of protons, and number of electrons to complete most of the table. Then, use the periodic table to identify the element.Known Unknowna. element = Pb, atomic number = 82 a. number of protons (Np), number of electrons (Ne) = ?b. number of protons = 8 b. element, atomic number (Z), Ne = ?c. number of electrons = 30 c. element, Z, Np = ?
2 SOLVE FOR THE UNKNOWNa. number of protons = atomic number Apply the atomic-number relationship.
Np = 82 Substitute atomic number = 82.number of electrons = number of protons Ne = 82The number of protons and the number of electrons is 82.
b. atomic number = number of protons Apply the atomic-number relationship.Z = 8 Substitute number of protons = 8.number of electrons = number of protons Ne = 8The atomic number and the number of electrons is 8. Consult the periodic table to identify The element is oxygen (0). the element.
c. number of protons = number of electrons Apply the atomic-number relationship.Np = 30 Substitute number of electrons = 30.atomic number = number of protons Z = 30The atomic number and the number of protons is 30. Consult the periodic table to identify The element is zinc (Zn). the element.
3 EVALUATE THE ANSWERThe answers agree with atomic numbers and element symbols given in the periodic table.
PRACTICE Problems 11. How many protons and electrons are in each atom?
a. radonb. magnesium
12. An atom of an element contains 66 electrons. Which element is it?13. An atom of an element contains 14 protons. Which element is it?14. CHALLENGE Do the atoms shown in the figure to the right have
the same atomic number?
C04_024A
10n 9p9n
9e-
ADDITIONAL PRACTICE
92 Module 3 • The Structure of the Atom
Program: HSS_NA Component: Lesson 3PDF Pass
Vendor: Lumina Chapter: 03

C04_026A
6329Cu 65
29Cu
Mass number
Atomic number
C04_027A
ProtonsNeutronsElectrons
Potassium-39192019
Potassium-40192119
Potassium-41192219
19e- 19e- 19e-
19p20n
19p21n
19p22n
K3919 K40
19 K4119
© M
arti
n W
ieri
nk/A
lam
y
17/12/18 06:02PM 0091-0097_CHEM_CA_S_CH03_L03_674695.indd 17/12/18 06:02PM17/12/18 06:02PM 0091-0097_CHEM_CA_S_CH03_L03_674695.indd 17/12/18 06:02PM
Isotopes and Mass NumberAll atoms of an element have the same number of protons and electrons, but the number of neutrons might differ. For example, there are three types of potassium atoms that occur naturally and all three types contain 19 protons and 19 electrons. However, one type of potassium atom contains 20 neutrons, another 21 neutrons, and still another 22 neutrons. Atoms with the same number of protons but different numbers of neu-trons are called isotopes.
Mass of isotopes While isotopes that contain more neutrons have a greater mass, all isotopes of an atom have the same chemical behavior. The mass number identifies each isotope of an element and is the sum of the atomic number (or number of protons) and neutrons in the nucleus.
For example, copper has two isotopes. The isotope with 29 protons and 34 neutrons has a mass number of 63 (29 + 34 = 63), and is called copper-63 (also written 63Cu or Cu-63). The isotope with 29 protons and 36 neutrons is called copper-65. Chemists often write out isotopes using a notation shown in Figure 16.
Natural abundance of isotopes In nature, most elements are found as mixtures of isotopes. Usually, the relative abundance of each isotope is constant. Different sources containing atoms of potassium would have the same percent composition of potassium isotopes. The three potassium isotopes are summarized in Figure 17.
Mass number
mass number = atomic number + number of neutronsThe mass number of an atom is the sum of its atomic number and its number of neutrons.
Figure 16 Cu is the chemical symbol for copper. Copper, which was used to make this Chinese gong, is composed of 69.2% copper-63 and 30.8% copper-65.
Figure 17 Potassium has three naturally occurring isotopes, potassium-39, potassium-40, and potassium 41. The table lists the number of protons, neutrons, and electrons in each potassium isotope.
Lesson 3 • How Atoms Differ 93
Program: HSS_NA Component: Lesson 3PDF Pass
Vendor: Lumina Chapter: 03

0091-0097_CHEM_CA_S_CH03_L03_138115.indd 21/05/18 10:45AM0091-0097_CHEM_CA_S_CH03_L03_138115.indd 21/05/18 10:45AM
EXAMPLE Problem 2
USE ATOMIC NUMBER AND MASS NUMBER A chemistry laboratory has analyzed the composition of isotopes of several elements. The composition data is given in the table below. Determine the number of protons, electrons, and neutrons in the isotope of neon. Name the isotope and give its symbol.
Isotope Composition DataElement Atomic Number Mass Number
a. Neon 10 22
b. Calcium 20 46
c. Oxygen 8 17
d. Iron 26 57
e. Zinc 30 64
f. Mercury 80 204
1 ANALYZE THE PROBLEMYou are given some data for neon in the table. The symbol for neon can be found on the periodic table. From the atomic number, the number of protons and electrons in the isotope are known. The number of neutrons in the isotope can be found by subtracting the atomic number from the mass number.
Known Unknownelement: neon number of protons (Np), electrons (Ne), and neutrons (Nn) = ?atomic number = 10 name of isotope = ?mass number = 22 symbol for isotope = ?
2 SOLVE FOR THE UNKNOWNnumber of protons = atomic number = 10number of electrons = atomic number = 10number of neutrons = mass number - atomic number
Nn = 22 - 10 = 12
The name of the isotope is neon-22.
The symbol for the isotope is 2210Ne.
3 EVALUATE THE ANSWERThe relationships among number of electrons, protons, and neutrons have been applied correctly. The isotope’s name and symbol are in the correct format. Refer to the Elements Handbook to learn more about neon.
Apply the atomic number relationship.
Use the atomic number and the mass number to calculate the number of neutrons. Substitute mass number = 22 and atomic number = 10
Use the element name and mass number to write the isotope’s name.Use the chemical symbol, mass number, and atomic number to write out the isotope in symbolic notation form.
PRACTICE Problems 15. Determine the number of protons, electrons, and neutrons for isotopes b.—f. in the table above.
Name each isotope, and write its symbol.16. CHALLENGE An atom has a mass number of 55. Its number of neutrons is the sum of its atomic
number and five. How many protons, neutrons, and electrons does this atom have? What is the identity of this atom?
ADDITIONAL PRACTICE
94 Module 3 • The Structure of the Atom
Program: HSS_NA Component: Lesson 3PDF Pass
Vendor: Lumina Chapter: 03

C04_028A
17e- CI3517 17e- CI37
17
Calculate the Weighted Average Atomic Mass of Chlorine
17p18n
Atomic mass: 34.969 amuPercent abundance: 75.78%Mass contribution: (34.969 amu)(75.78%) = 26.50 amu
Weighted average atomic mass of chlorine = (26.50 amu + 8.953 amu) = 35.45 amu
17p20n
Atomic mass: 36.966 amuPercent abundance: 24.22%Mass contribution:(36.966 amu)(24.22%) = 8.953 amu
0091-0097_CHEM_CA_S_CH03_L03_674695.indd 17/12/18 06:02PM0091-0097_CHEM_CA_S_CH03_L03_674695.indd 17/12/18 06:02PM
Table 4 Masses of Subatomic ParticlesParticle Mass (amu)
Electron 0.000549Proton 1.007276Neutron 1.008665
Mass of AtomsRecall from Table 3 that the masses of both protons and neutrons are approximately 1.67 × 10⁻²⁴ g. While this is a small mass, the mass of an electron is even smaller—only about 1/1840 that of a proton or a neutron.
Atomic mass unit Because these extremely small masses expressed in scientific notation are difficult to work with, chemists have developed a method of measuring the mass of an atom relative to the mass of a specific atomic standard. That standard is the carbon-12 atom. Scientists assigned the carbon-12 atom a mass of exactly 12 atomic mass units. Thus, one atomic mass unit (amu) is defined as one-twelfth the mass of a carbon-12 atom. Although a mass of 1 amu is nearly equal to the mass of a single proton or a single neutron, it is important to realize that the values are slightly different. Table 4 gives the masses of the subatomic particles in terms of amu.
Atomic mass Because an atom’s mass depends mainly on the number of protons and neutrons it contains, and because protons and neutrons have masses close to 1 amu, you might expect the atomic mass of an element to always be nearly a whole number. However, this is often not the case. The explanation involves how atomic mass is defined. The atomic mass of an element is the weighted average mass of the isotopes of that element. Because isotopes have different masses, the weighted average is not a whole number. The calculation of the atomic mass of chlorine is illustrated in Figure 18.
Figure 18 To calculate the weighted average atomic mass of chlorine, you first need to calculate the mass contribution of each isotope.
ACADEMIC VOCABULARYspecificcharacterized by a precise formulation or accurate restriction; Some diseases have specific symptoms.
CROSSCUTTING CONCEPTSPatterns Identify the pattern found in the periodic table as you move horizontally across the table from potassium to iron by plotting the atomic number (x-axis) vs. the atomic mass (y-axis). Describe the trend in your graph, including an explanation of how the pattern of electrons, neutrons, and protons accounts for this trend.
Lesson 3 • How Atoms Differ 95
Program: HSS_NA Component: Lesson 3PDF Pass
Vendor: Lumina Chapter: 03

Ole
g Lo
patk
in/i
Stoc
k/G
etty
Imag
es
0091-0097_CHEM_CA_S_CH03_L03_674695.indd 17/12/18 06:02PM0091-0097_CHEM_CA_S_CH03_L03_674695.indd 17/12/18 06:02PM
Chlorine exists naturally as a mixture of about 76% chlorine-35 and 24% chlorine-37. It has an atomic mass of 35.453 amu. Because atomic mass is a weighted average, the chlorine-35 atoms, which exist in greater abundance than the chlorine-37 atoms, have a greater effect in determining the atomic mass. The atomic mass of chlorine is calculated by multiplying each isotope’s percent abundance by its atomic mass and then adding the products. The process is similar to calculating an average grade. You can calculate the atomic mass of any element if you know the number of naturally occurring isotopes, their masses, and their percent abundances.
Isotope abundances Analyzing an element’s mass can indicate the most abundant isotope for that element. For example, fluorine (F) has an atomic mass that is extremely close to 19 amu. If fluorine had several fairly abundant isotopes, its atomic mass would not likely be so close to a whole number. Thus, you might conclude that all naturally occurring fluorine is probably in the form of fluorine-19 ( 19 9 F) . Indeed, 100% of naturally occurring fluorine is in the form of fluorine-19. While this type of reasoning generally works well, it is not foolproof. Consider bromine (Br). It has an atomic mass of 79.904 amu. With a mass so close to 80 amu, it seems likely that the most common bromine isotope would be bromine-80. However, bromine’s two isotopes are bromine-79 (78.918 amu, 50.69%) and bromine-81 (80.917 amu, 49.31%). There is no bromine-80 isotope.
Figure 19 shows one of the major production sites of bromine, located in the Dead Sea area.
Figure 19 Bromine is extracted from sea water and salt lakes. The Dead Sea area of Israel is one of the major bromine production sites in the world. Applications of bromine include microbe and algae control in swimming pools. It is also used in medicines, oils, paints, pesticides, and flame retardants.
Get It?Infer how atomic mass changes from element to element as you move horizontally across the periodic table.
EXAMPLE Problem 3
CALCULATE ATOMIC MASS Given the data in the table, calculate the atomic mass of unknown Element X. Then, identify the unknown element, which is used medically to treat some mental disorders.
1 ANALYZE THE PROBLEMCalculate the atomic mass and use the periodic table to confirm.
Known Unknown6X: mass = 6.015 amu atomic mass of X = ? amuabundance = 7.59% = 0.07597X: mass = 7.016 amu element X = ?abundance = 92.41% = 0.9241
Isotope Abundance for Element X
Isotope Mass (amu) Percent Abundance
6X 6.015 7.59%7X 7.016 92.41%
96 Module 3 • The Structure of the Atom
Program: HSS_NA Component: Lesson 3PDF Pass
Vendor: Lumina Chapter: 03

0091-0097_CHEM_CA_S_CH03_L03_674695.indd 17/12/18 06:02PM0091-0097_CHEM_CA_S_CH03_L03_674695.indd 17/12/18 06:02PM
EXAMPLE Problem 3 (Continued)
2 SOLVE FOR THE UNKNOWN6X: mass contribution = (mass)(percent abundance) Calculate 6X’s contribution.
mass contribution = (6.015 amu)(0.0759) = 0.4565 amu Substitute mass = 6.015 amu and abundance = 0.0759.
7X: mass contribution = (mass)(percent abundance) Calculate 7X’s contribution. mass contribution = (7.016 amu)(0.9241) = 6.483 amu Substitute mass = 7.016 amu
and abundance = 0.9241. atomic mass of X = (0.4565 amu + 6.483 amu) = 6.939 amu Total the mass contributions to
find the atomic mass.The element with a mass nearest 6.939 amu is lithium (Li). Identify the element using the
periodic table.3 EVALUATE THE ANSWER
The result agrees with the atomic mass given in the periodic table. The isotope masses have four significant figures, so the atomic mass needs to have four significant figures.
PRACTICE Problems 17. Boron (B) has two naturally occurring isotopes: boron-10 (abundance = 19.8%, mass = 10.013 amu)
and boron-11 (abundance = 80.2%, mass = 11.009 amu). Calculate the atomic mass of boron. 18. CHALLENGE Nitrogen has two naturally occurring isotopes, N-14 and N-15. Its atomic mass is
14.007. Which isotope is more abundant? Explain your answer.
Go online to follow your personalized learning path to review, practice, and reinforce your understanding.
Summary• The atomic number of an atom
is given by its number of protons. The mass number of an atom is the sum of its neutrons and protons.
• Atoms of the same element with different numbers of neutrons are called isotopes.
• The atomic mass of an element is a weighted average of the masses of all of its naturally occurring isotopes.
Demonstrate Understanding 19. Recall Which subatomic particle identifies an atom
as belonging to a particular element?20. Describe the difference between atomic number
and mass number. 21. Explain how isotopes are related to why atomic
masses are not whole numbers.22. Calculate Copper has two isotopes Cu-63
(abundance = 69.2%, mass = 62.930 amu) and Cu-65 (abundance = 30.8%, mass = 64.928 amu). Calculate the atomic mass of copper.
23. Explain how patterns in the periodic table can provide evidence as to how the structures of elements differ.
Check Your Progress
ADDITIONAL PRACTICE
Lesson 3 • How Atoms Differ 97
Program: HSS_NA Component: Lesson 3PDF Pass
Vendor: Lumina Chapter: 03

Tinn
aPon
g/Sh
utte
rsto
ck.c
om
0098-0100_CHEM_CA_S_CH03_L04_674695.indd 17/12/18 06:02PM0098-0100_CHEM_CA_S_CH03_L04_674695.indd 17/12/18 06:02PM
RadioactivityNuclear reactions In the late 1890s, scientists noticed that some substances spontaneously emitted radiation in a process they named radioactivity. The rays and particles emitted by the radioactive material were called radiation. Scientists discovered that radioactive atoms undergo changes that can alter their identities. A reaction that involves a change in an atom’s nucleus is called a nuclear reaction. Prior to this discovery, it was not known that a reaction could result in the formation of a new element. Radioactive atoms emit radiation because their nuclei are unstable. Unstable systems, whether they are atoms or people doing handstands, as shown in Figure 20, gain stability by losing energy.
Radioactive decay Unstable nuclei lose energy by emitting radiation in a spontaneous process called radioactive decay. Unstable atoms undergo radioactive decay until they form stable atoms, often of a different element. An atom can lose energy and reach a stable state when emitting radiation.
Figure 20 Being in a handstand position is an unstable state. Like unstable atoms, people doing handstands eventually return to a more stable state – standing on their feet – by losing potential energy.
FOCUS QUESTION
How can atoms change?
LESSON 4UNSTABLE NUCLEI AND RADIOACTIVE DECAY
Disciplinary Core Ideas Crosscutting Concepts Science & Engineering Practices3D THINKINGC C C
SEP DCI
COLLECT EVIDENCEUse your Science Journal to
record the evidence you collect as you complete the readings and activities in this lesson.
INVESTIGATE GO ONLINE to find these activities and more resources.
Laboratory: Half-Life of Barium-137mConstruct an explanation to determine the stability and change of an atom experiencing spontaneous radioactive decay. Identify Crosscutting ConceptsCreate a table of the crosscutting concepts and fill in examples you find as you read.
98 Module 3 • The Structure of the Atom
Program: HSS_NA Component: Lesson 4PDF Pass
Vendor: Lumina Chapter: 03
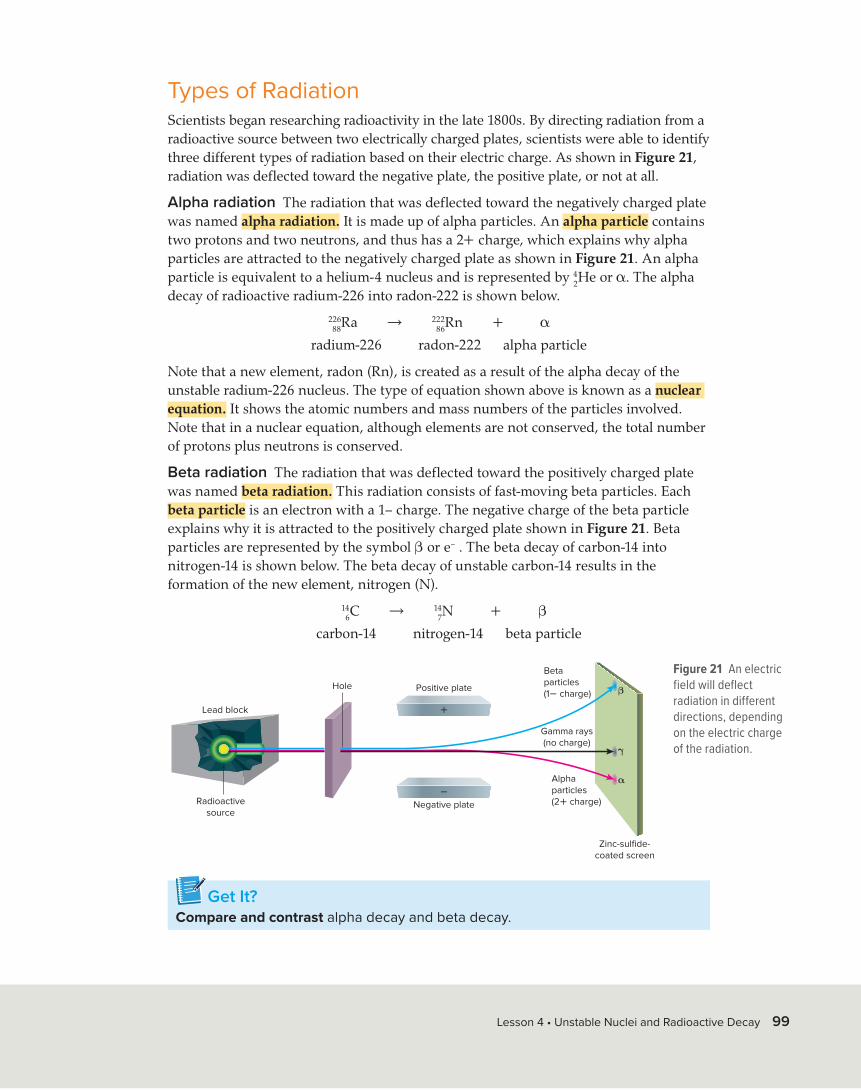
C04_032A
Lead block
Radioactivesource
Hole Positive plate
Betaparticles(1- charge)
Alphaparticles(2+ charge)
Zinc-sulfide-coated screen
Gamma rays(no charge)
Negative plate
+
-
β
γ
α
0098-0100_CHEM_CA_S_CH03_L04_674695.indd 17/12/18 06:02PM0098-0100_CHEM_CA_S_CH03_L04_674695.indd 17/12/18 06:02PM
Types of RadiationScientists began researching radioactivity in the late 1800s. By directing radiation from a radioactive source between two electrically charged plates, scientists were able to identify three different types of radiation based on their electric charge. As shown in Figure 21, radiation was deflected toward the negative plate, the positive plate, or not at all.
Alpha radiation The radiation that was deflected toward the negatively charged plate was named alpha radiation. It is made up of alpha particles. An alpha particle contains two protons and two neutrons, and thus has a 2+ charge, which explains why alpha particles are attracted to the negatively charged plate as shown in Figure 21. An alpha particle is equivalent to a helium-4 nucleus and is represented by 4
2He or α. The alpha decay of radioactive radium-226 into radon-222 is shown below.
22688Ra → 222
86Rn + α
radium-226 radon-222 alpha particle
Note that a new element, radon (Rn), is created as a result of the alpha decay of the unstable radium-226 nucleus. The type of equation shown above is known as a nuclear equation. It shows the atomic numbers and mass numbers of the particles involved. Note that in a nuclear equation, although elements are not conserved, the total number of protons plus neutrons is conserved.
Beta radiation The radiation that was deflected toward the positively charged plate was named beta radiation. This radiation consists of fast-moving beta particles. Each beta particle is an electron with a 1– charge. The negative charge of the beta particle explains why it is attracted to the positively charged plate shown in Figure 21. Beta particles are represented by the symbol β or e– . The beta decay of carbon-14 into nitrogen-14 is shown below. The beta decay of unstable carbon-14 results in the formation of the new element, nitrogen (N).
146C → 14
7N + β
carbon-14 nitrogen-14 beta particle
Figure 21 An electric field will deflect radiation in different directions, depending on the electric charge of the radiation.
Get It?Compare and contrast alpha decay and beta decay.
Lesson 4 • Unstable Nuclei and Radioactive Decay 99
Program: HSS_NA Component: Lesson 4PDF Pass
Vendor: Lumina Chapter: 03

0098-0100_CHEM_NA_S_CH03_L04_138115.indd 08/04/19 08:10PM0098-0100_CHEM_NA_S_CH03_L04_138115.indd 08/04/19 08:10PM
Go online to follow your personalized learning path to review, practice, and reinforce your understanding.
Summary• The radioactive decay of
unstable nuclei involves the release of energy.
• There are three types of radiation: alpha (charge of 2+), beta (charge of 1-) and gamma (no charge).
• The neutron-to-proton ratio of an atom’s nucleus determines its stability.
Demonstrate Understanding24. Describe the difference between radioactivity and
radioactive decay.25. State what quantities are conserved and which are
not conserved in a nuclear reaction.26. Explain why beta particles are deflected towards a
positive plate, alpha particles are deflected towards a negative plate, and gamma rays are not deflected.
27. Calculate How much more mass does an alpha particle have compared to an electron?
28. Create a table showing how each type of radiation affects the atomic number and mass number of an atom.
Check Your Progress
Gamma radiation The third common type of radiation is called gamma radiation, or gamma rays. A gamma ray is high-energy radiation that has no mass and is denoted by the symbol γ. Gamma rays are neutral, and so are not deflected by electric or magnetic fields. They often accompany alpha and beta radiation, and account for most of the energy lost during radioactive decay. For example, gamma rays accompany the decay of uranium-238.
23892U → 234
90Th + α + 2γ
uranium-238 thorium-234 alpha particle gamma rays
Because gamma rays are massless, the emission of gamma rays by themselves cannot result in the formation of a new element. Table 5 summarizes the characteristics of alpha, beta, and gamma radiation.
Nuclear stability Much of science deals with understanding how things change and how they remain stable. An atom’s stability is governed by its ratio of neutrons to protons. Atoms that contain either too many or too few neutrons are unstable and lose energy as they decay to form a stable nucleus. They emit alpha and beta particles, which affect the neutron-to-proton ratio of the newly created nucleus. Eventually, radioactive atoms undergo enough radioactive decay to form stable, nonradioactive atoms.
Table 5 Characteristics of RadiationAlpha Beta Gamma
Symbol 4 2 He or α e- or β γ
Mass (amu) 4 1 ____ 1840 0
Mass (kg) 6.65 × 10⁻²⁷ 9.11 × 10⁻³¹ 0
Charge 2+ 1- 0
100 Module 3 • The Structure of the Atom
Program: HSS_NA Component: Lesson 4PDF Pass
Vendor: Aptara Chapter: 03

AM
MR
F, U
nive
rsit
y of
Syd
ney/
Scie
nce
Sour
ce
MAKE AND DEFEND A CLAIM
With a small group, write a short informational statement to explain to individuals who do not have a background in chemistry how scientists map materials at the atomic level.
C C C
SEP DCI
0101-0101_CHEM_CA_S_CH03_Feature_674695.indd 18/12/18 01:23AM
Mapping the Mysteries of MaterialsVisualizing and mapping the arrangement and bonding of atoms in a material provides scien-tists with a vast amount of information about its structure, properties, and potential uses.
Atoms and PropertiesEverything on Earth is composed of atoms. The differences among atoms and how they are combined result in the great variety of materials and substances on Earth. The properties of any material, such as flexibility and strength, are determined by the types of atoms it contains and how they are combined.
How Atoms Are Mapped Recent advances have enabled mapping the precise positions of billions of individual atoms in a material. Scanning transmission electron microscopy scans samples with a beam of electrons and gathers information about the interactions of the electrons at many different angles to produce two-dimensional images. The two-dimensional images are then combined using advanced computer programs, resulting in a detailed three-dimensional atomic “map”.
Real-World ApplicationsThe applications of this advanced technology are virtually limitless. Using this technique,
scientists can detect defects at specific locations in materials—places where the “wrong” atom was inserted, or an atom was missing. These atomic-level defects can cause large scale problems that could lead to catastrophic damage. For example, if the material used in a bridge had defects at the atomic level that reduced its strength, it would compromise the safety of the bridge.
Scientists have mapped the atoms in this copper-cobalt- manganese catalyst. Cobalt atoms are blue, copper atoms are orange, and manganese atoms are green.
SCIENTIFIC BREAKTHROUGHS
A tiny sample of aluminum (the blue rod) is being prepared for analysis to map its atomic structure.
Module 3 • Scientific Breakthroughs 101
Program: HSS_NA Component: FeaturePDF PASS
Vendor: Lumina Chapter: 3

GO ONLINE to study with your Science Notebook.
MODULE 3STUDY GUIDE
0102-0102_CHEM_CA_S_CH03_SG_674695.indd 17/12/18 06:02PM0102-0102_CHEM_CA_S_CH03_SG_674695.indd 17/12/18 06:02PM
Lesson 1 EARLY IDEAS ABOUT MATTER • Dalton’s atomic theory
• Democritus was the first person to propose the existence of atoms.• According to Democritus, atoms are solid, homogeneous, and
indivisible.• Aristotle did not believe in the existence of atoms.• Dalton revised the ideas of Democritus based on the results of
scientific research.
Lesson 2 DEFINING THE ATOM • atom• cathode ray• electron• nucleus• proton• neutron
• An atom is the smallest particle of an element that maintains the properties of that element.
• Electrons have a 1- charge, protons have a 1+ charge, and neutrons have no charge.
• An atom consists mostly of empty space surrounding the nucleus.
Lesson 3 HOW ATOMS DIFFER • atomic number• isotope• mass number• atomic mass unit (amu)• atomic mass
• The atomic number of an atom is given by its number of protons. The mass number of an atom is the sum of its neutrons and protons.
• Atoms of the same element with different numbers of neutrons are called isotopes.
• The atomic mass of an element is a weighted average of the masses of all of its naturally occurring isotopes.
Lesson 4 UNSTABLE NUCLEI AND RADIOACTIVE DECAY • radioactivity• radiation• nuclear reaction• radioactive decay• alpha radiation• alpha particle• nuclear equation• beta radiation• beta particle• gamma ray
• The radioactive decay of unstable nuclei involves the release of energy.
• There are three types of radiation: alpha (charge of 2+), beta (charge of 1-) and gamma (no charge).
• The neutron-to-proton ratio of an atom’s nucleus determines its stability.
atomic number = number of protons = number of electrons
mass number = atomic number + number of neutrons
102 Module 3 • Study Guide
Program: HSS_NA Component: SGPDF Pass
Vendor: Lumina Chapter: 03

190 192 196 200 202 204194 198 206 208 210
50
1015
20
2530
Perc
ent a
bund
ance
Atomic mass (amu)
Mon
ty R
akus
en/C
ultu
ra/G
etty
Imag
es
0103-0103_CHEM_CA_S_CH03_MC_674695.indd 18/12/18 01:25AM
REVISIT THE PHENOMENON
What is matter made of?
CER Claim, Evidence, ReasoningExplain Your Reasoning Revisit the claim you made when you encountered the phenomenon. Summarize the evidence you gathered from your investigations and research and finalize your Summary Table. Does your evidence support your claim? If not, revise your claim. Explain why your evidence supports your claim.
STEM UNIT PROJECTNow that you’ve completed the module, revisit your STEM unit project. You will summarize your evidence and apply it to the project.
Module Wrap-UpC C CSE
P DCI THREE-DIMENSIONAL THINKING
GO FURTHER Data Analysis Lab
How can you identify an element from mass spectrometer data?
A mass spectrometer separates atoms and molecules according to their masses. A substance is heated in a vacuum and then ionized. The ions are accelerated through a magnetic field, which separates ions of different masses.
CER Analyze and Interpret Data 1. Claim, Evidence, Reasoning Without performing any
calculations, predict the approximate atomic mass of element X. Explain the reasoning behind your prediction.
2. Evidence, Reasoning Calculate the weighted average mass of the isotopes of element X. Then, use the periodic table to identify the element.
Module 3 • The Structure of the Atom 103
Program: HSS_NA Component: MCPDF Pass
Vendor: Lumina Chapter: 03

0104-0104_CHEM_CA_S_CH04_MO_674695.indd 17/12/18 06:02PM
Eric
Low
enba
ch/M
omen
t/G
etty
Imag
es
104 Module 4 • Electrons in Atoms
Program: HSS_NA Component: COPDF Pass
Vendor: Lumina Chapter: 04

MODULE 4ELECTRONS IN ATOMS
ENCOUNTER THE PHENOMENON
How do we know what stars are made of?
GO ONLINE to play a video about how scientists analyze the light from stars.
Ask QuestionsDo you have other questions about the phenomenon? If so, add them to the driving question board.
CER Claim, Evidence, ReasoningMake Your Claim Use your CER chart to make a claim about how we know what stars are made of.
Collect Evidence Use the lessons in this module to collect evidence to support your claim. Record your evidence as you move through the module.
Explain Your Reasoning You will revisit your claim and explain your reasoning at the end of the module.
GO ONLINE to access your CER chart and explore resources that can help you collect evidence.
LESSON 2: Explore & Explain: Bohr’s Atomic Model
LESSON 1: Explore & Explain: Failures of the Wave Model
Additional Resources
0105-0105_CHEM_NA_S_CH04_Investigate_Phenom_138115.indd 03/05/19 04:00PM
(t)V
ideo
Sup
plie
d by
BB
C W
orld
wid
e Le
arni
ng; (
bl)S
PL/S
cien
ce S
ourc
e; (
br)N
AS
A, E
SA
, and
M. L
ivio
and
the
Hub
ble
20th
Ann
iver
sary
Tea
m (S
TScI
)
Module 4 • Encounter the Phenomenon 105
Program: HSS_NA Component: IPPDF Pass
Vendor: Aptara Chapter: 04

COLLECT EVIDENCEUse your Science Journal to
record the evidence you collect as you complete the readings and activities in this lesson.
INVESTIGATE GO ONLINE to find these activities and more resources.
Applying Practice: Wave CharacteristicsHS-PS4-1. Use mathematical representations to support a claim regarding relationships among the frequency, wavelength, and speed of waves traveling in various media. Identify Crosscutting ConceptsCreate a table of the crosscutting concepts and fill in examples you find as you read.
0106-0115_CHEM_CA_S_CH04_L01_674695.indd 07/01/19 12:57PM
Disciplinary Core Ideas Crosscutting Concepts Science & Engineering Practices3D THINKINGC C C
SEP DCI
The Atom and Unanswered QuestionsAfter discovering three subatomic particles in the early 1900s, scientists continued their quest to understand atomic structure and the arrangement of electrons within atoms.
Rutherford proposed that all of an atom’s positive charge and virtually all of its mass are concentrated in a nucleus that is surrounded by fast-moving electrons. The model did not explain how the atom’s electrons are arranged in the space around the nucleus. Nor did it address the question of why the negatively charged electrons are not pulled into the atom’s positively charged nucleus. Rutherford’s nuclear model did not begin to account for the differences and similarities in chemical behavior among the various elements.
For example, consider the elements lithium, sodium, and potassium, which are found in different periods on the periodic table but have similar chemical behaviors. All three elements appear metallic in nature, and their atoms react vigorously with water to liberate hydrogen gas. In fact, as shown in Figure 1, both sodium and potassium react so violently that the hydrogen gas can ignite and even explode.
Sodium PotassiumLithium
Figure 1 Different elements can have similar reactions with water.
FOCUS QUESTION
What is light made of?
LESSON 1LIGHT AND QUANTIZED ENERGY
106 Module 4 • Electrons in Atoms
Program: HSS_NA Component: LessonPDF Pass
Vendor: Lumina Chapter: 04
Mat
t M
eado
ws/
McG
raw
-Hill
Edu
cati
on

C05_007A
Wavelength (λ)
Wavelength (λ)
Crest
Amplitude
Trough
Origin
ba
0106-0115_CHEM_CA_S_CH04_L01_674695.indd 24/05/18 07:28AM0106-0115_CHEM_CA_S_CH04_L01_674695.indd 24/05/18 07:28AM
In the early 1900s, scientists began to unravel the puzzle of chemical behavior. They observed that certain elements emitted visible light when heated in a flame. Analysis of the emitted light revealed that an element’s chemical behavior is related to the arrangement of the electrons in its atoms. To understand this relationship and the nature of atomic structure, it will be helpful to first understand the nature of light.
The Wave Nature of LightVisible light is a type of electromagnetic radiation—a form of energy that exhibits wavelike behavior as it travels through space. It can be modeled as a wave of changing electric and magnetic fields. Other examples of electromagnetic radiation include microwaves, X rays, and television and radio waves.
Characteristics of wavesAll waves can be described by several characteristics, a few of which might be familiar to you from everyday experience. You might have seen concentric waves when dropping an object into water, as shown in Figure 2a.
The wavelength (represented by λ, the Greek letter lambda) is the shortest distance between equivalent points on a continuous wave. For example, in Figure 2b, the wavelength is measured from crest to crest or from trough to trough. Wavelength is usually expressed in meters, centimeters, or nanometers (1 nm = 1 × 10⁻⁹ m).
The frequency (represented by ν, the Greek letter nu) is the number of waves that pass a given point per second. One hertz (Hz), the SI unit of frequency, equals one wave per second. In calculations, frequency is expressed with units of waves per second, (1/s) or (s-1); the term waves is understood. A particular frequency can be expressed in the following ways: 652 Hz = 652 waves/second = 652/s = 652 s-1.
The amplitude of a wave is the wave’s height from the origin to a crest, or from the origin to a trough, as illustrated in Figure 2b. Wavelength and frequency do not affect the amplitude of a wave.
Figure 2 a. The concentric waves in the water show the characteristic properties of all waves. b. Amplitude, wavelength, and frequency are the main characteristics of waves.Identify a crest, a trough, and one wavelength in the photo.
Lesson 1 • Light and Quantized Energy 107
Program: HSS_NA Component: Lesson 1PDF Pass
Vendor: Lumina Chapter: 04
Mat
t M
eado
ws/
McG
raw
-Hill
Edu
cati
on

C05_008A
Shorterwavelength
Lower frequency
Higher frequency
Longerwavelength
0106-0115_CHEM_CA_S_CH04_L01_674695.indd 24/05/18 07:29AM 0106-0115_CHEM_CA_S_CH04_L01_674695.indd 0106-0115_CHEM_CA_S_CH04_L01_674695.indd 24/05/18 07:29AM 0106-0115_CHEM_CA_S_CH04_L01_674695.indd
All electromagnetic waves, including visible light, travel at a speed of 3.00 × 10⁸ m/s in a vacuum. Because the speed of light is such an important and universal value, it is given its own symbol, c. The speed of light is the product of its wavelength (λ) and its frequency (ν).
Electromagnetic Wave Relationship
c = λνc is the speed of light in a vacuum. λ is the wavelength. ν is the frequency.
The speed of light in a vacuum is equal to the product of the wavelength and the frequency.
Although the speed of all electromagnetic waves in a vacuum is the same, waves can have different wavelengths and frequencies. As you can see from the equation above, wavelength and frequency are inversely related; in other words, as one quantity increases, the other decreases. To better understand this relationship, examine the two waves illustrated in Figure 3. Although both waves travel at the speed of light, you can see that the red wave has a longer wavelength and lower frequency than the violet wave.
Electromagnetic spectrumSunlight, which is one example of white light, contains a nearly continuous range of wavelengths and frequencies. White light passing through a prism separates into a continuous spectrum of colors similar to the spectrum in Figure 4. These are the colors of the visible spectrum. The spectrum is called continuous because each point of it corresponds to a unique wavelength and frequency.
Figure 3 These waves illustrate the relationship between wavelength and frequency. As frequency increases, wavelength decreases.Infer Does frequency or wavelength affect amplitude?
Figure 4 When white light passes through a prism, it is separated into a continuous spectrum of its different components—red, orange, yellow, green, blue, indigo, and violet light.
108 Module 4 • Electrons in Atoms
Program: HSS_NA Component: Lesson 1PDF Pass
Vendor: Lumina Chapter: 04
And
rzej
Woj
cick
i/Sc
ienc
e Ph
oto
Libr
ary/
Ala
my

C05_010A
104
3 × 10⁴ 3 × 10² 3 3 × 10⁻² 3 × 10⁻⁴ 3 × 10⁻⁶ 3 × 10⁻⁸ 3 × 10⁻¹⁰ 3 × 10-12 3 × 10-14
106 108 1010 1012 1014 1016 1018 1020 1022
Frequency (ν) in hertz
Gamma raysUltravioletInfraredRadio
Electromagnetic Spectrum
Wavelength (λ) in meters
Visible light
Microwaves X rays
Energy/frequency increases
Wavelength increases
24/05/18 07:29AM 0106-0115_CHEM_CA_S_CH04_L01_674695.indd 24/05/18 07:29AM24/05/18 07:29AM 0106-0115_CHEM_CA_S_CH04_L01_674695.indd 24/05/18 07:29AM
Get It?Explain how wavelength and frequency of a wave are related.
The visible spectrum of light, shown in Figure 4, comprises only a small portion of the complete electromagnetic spectrum. The complete electromagnetic spectrum is illus-trated in Figure 5. The electromagnetic spectrum, also called the EM spectrum, includes all forms of electromagnetic radiation, with the only differences in the types of radiation being their frequencies and wavelengths.
Note in Figure 4 that the bend varies with the wavelengths as they pass through the prism, resulting in the sequence of the colors red, orange, yellow, green, blue, indigo, and violet. In examining the energy of the radiation shown in Figure 5, note that energy increases with increasing frequency. Thus, looking back at Figure 3, the violet light, with its greater frequency, has more energy than the red light. This relationship between frequency and energy will be explained in the next lesson. The wavelength and frequency of a wave are related to one another by the speed of travel of the wave, which depends on the type of wave and the medium through which it is passing. For light waves, you can use the formula c = λν to calculate the wavelength or frequency of any wave.
PHYSICS Connection Electromagnetic radiation from diverse origins constantly bombards us. In addition to the radiation from the Sun, technology such as radio and TV signals, phone relay stations, lightbulbs, medical X-ray equipment, and particle accelerators also produce radiation. Natural sources on Earth, such as lightning, natural radioactivity, and even the glow of fireflies, also contribute. Our knowledge of the universe is based on electromagnetic radiation emitted by distant objects and detected with instruments on Earth.
Figure 5 The electromagnetic spectrum covers a wide range of frequencies. The visible-light section of the spectrum is very narrow. As frequency and energy increase, wavelength decreases.
Lesson 1 • Light and Quantized Energy 109
Program: HSS_NA Component: Lesson 1PDF Pass
Vendor: Lumina Chapter: 04

0106-0115_CHEM_CA_S_CH04_L01_674695.indd 24/05/18 07:29AM 0106-0115_CHEM_CA_S_CH04_L01_674695.indd 0106-0115_CHEM_CA_S_CH04_L01_674695.indd 24/05/18 07:29AM 0106-0115_CHEM_CA_S_CH04_L01_674695.indd
PRACTICE Problems1. Objects get their colors from reflecting only certain wavelengths when hit with white light.
Light reflected from a green leaf is found to have a wavelength of 4.90 × 10⁻⁷ m. What is the frequency of the light?
2. When light or longer wavelength electromagnetic radiation is absorbed in matter, it is generally converted into thermal energy (heat). Shorter wavelength electromagnetic radiation (ultraviolet, X-rays, gamma rays) can ionize atoms and cause damage to living cells. X-rays can penetrate body tissues and are widely used to diagnose and treat disorders of internal body structures. What is the frequency of an X-ray with a wavelength of 1.15 × 10⁻¹⁰ m?
3. After careful analysis, an electromagnetic wave is found to have a frequency of 7.8 × 10⁶ Hz. What is the speed of the wave?
4. CHALLENGE While an FM radio station broadcasts at a frequency of 94.7 MHz, an AM station broadcasts at a frequency of 820 kHz. What are the wavelengths of the two broadcasts? Which of the drawings on the right corresponds to the FM station? To the AM station?
C05_011A
a b
C05_011A
a b
EXAMPLE Problem 1
CALCULATING WAVELENGTH OF AN EM WAVE Microwaves are used to cook food and transmit information. What is the wavelength of a microwave that has a frequency of 3.44 × 10⁹ Hz?
1 ANALYZE THE PROBLEMYou are given the frequency of a microwave. You also know that because microwaves are part of the electromagnetic spectrum, their speeds, frequencies, and wavelengths are related by the formula c = λν. The value of c is a known constant. First, solve the equation for wavelength, then substitute the known values and solve.
Known Unknownν = 3.44 × 10⁹Hz λ = ? mc = 3.00 × 10⁸ m/s
2 SOLVE FOR THE UNKNOWNSolve the equation relating the speed, frequency, and wavelength of an electromagnetic wave for wavelength (λ).
c = λν State the electromagnetic wave relationship.
λ = c/ν Solve for λ.
λ = 3.00 × 10⁸ m/s __ 3.44 × 10⁹ Hz Substitute c = 3.00 × 10⁸ m/s and ν = 3.44 × 10⁹ Hz.
Note that hertz is equivalent to 1/s or s-1.
λ = 3.00 × 10⁸ m/s __ 3.44 × 10⁹ s-1 Divide numbers and units.
λ = 8.72 × 10⁻²m
3 EVALUATE THE ANSWERThe answer is correctly expressed in a unit of wavelength (m). Both of the known values in the problem are expressed with three significant figures, so the answer should have three significant figures, which it does. The value for the wavelength is within the wavelength range for microwaves shown in Figure 5.
ADDITIONAL PRACTICE
110 Module 4 • Electrons in Atoms
Program: HSS_NA Component: Lesson 1PDF Pass
Vendor: Lumina Chapter: 04

24/05/18 07:29AM 0106-0115_CHEM_CA_S_CH04_L01_674695.indd 24/05/18 07:29AM24/05/18 07:29AM 0106-0115_CHEM_CA_S_CH04_L01_674695.indd 24/05/18 07:29AM
The Particle Nature of LightWhile considering light as a wave explains much of its everyday behavior, it fails to adequately describe important aspects of light’s interactions with matter. The wave model of light cannot explain why heated objects emit only certain frequencies of light at a given temperature, or why some metals emit electrons when light of a specific frequency shines on them. Scientists realized that a new model or a revision of the wave model of light was needed to address these phenomena.
The quantum conceptWhen objects are heated, they emit glowing light. Figure 6 illustrates this phenomenon with iron. A piece of iron appears dark gray at room temperature, glows red when heated sufficiently, and turns orange, then bluish in color at even higher temperatures. As the iron gets hotter, it has more energy and emits different colors of light. These different colors correspond to different frequencies and wavelengths.
The wave model could not explain the emission of these different wavelengths. In 1900, German physicist Max Planck (1858–1947) began searching for an explana-tion of this phenomenon. His study led him to a startling conclusion: matter can gain or lose energy only in small, specific amounts called quanta. A quantum is the minimum amount of energy that can be gained or lost by an atom.
Planck proposed that the energy emitted by hot objects was quan-tized. He also showed that there is a direct relationship between the energy of a quantum and the frequency of emitted radiation.
Energy of a Quantum
Equantum = hνEquantum represents energy. h is Planck’s constant. ν represents frequency.
The energy of a quantum is given by the product of Planck’s constant and the frequency.
Planck’s constant, h, has a value of 6.626 × 10⁻³⁴ J⋅s, where J is the symbol for joule, the SI unit of energy. The equation shows that the energy of radiation increases as the radiation’s frequency, ν, increases. According to Planck’s theory, for a given frequency, ν, matter can emit or absorb energy only in whole-number multiples of hν; that is, 1hν, 2hν, 3hν, and so on.
Figure 6 The wavelength of the light emitted by heated metal, such as the iron above, depends on the temperature. At room temperature, iron is gray. When heated, it first turns red, then glowing orange.Identify the color of the piece of iron with the greatest kinetic energy.
Lesson 1 • Light and Quantized Energy 111
Program: HSS_NA Component: Lesson 1PDF Pass
Vendor: Lumina Chapter: 04
©Ja
ck S
ulliv
an/A
lam
y

0106-0115_CHEM_CA_S_CH04_L01_674695.indd 17/12/18 06:03PM 0106-0115_CHEM_CA_S_CH04_L01_674695.indd 17/12/18 06:03PM
C05_014A
Electrons
Electron ejectedfrom surface
Metal surface
Incident beam of light
A useful analogy is that of a child building a wall with wooden blocks. The child can add to or take away from the wall only in increments of whole numbers of blocks. Similarly, matter can have only certain amounts of energy—quantities of energy between these values do not exist.
Planck and other physicists of the time thought the concept of quantized energy was revolutionary, and some found it disturbing. Prior experience had led scientists to think that energy could be absorbed and emitted in continually varying quantities, with no minimum limit to the amount. For example, think about heating a cup of water in a microwave oven. It seems that you can add any amount of thermal energy to the water by regulating the power and duration of the microwaves. Instead, the water’s temperature increases in infinitesimal steps as its molecules absorb quanta of energy. Because these steps are so small, the temperature seems to rise in a continuous, rather than a stepwise, manner.
The photoelectric effectScientists also knew that the wave model of light could not explain a phenomenon called the photoelectric effect. In the photoelectric effect, electrons, called photoelectrons, are emitted from a metal’s surface when light at or above a certain frequency shines on the surface, as shown in Figure 7.
The wave model predicts that given enough time, even low- energy, low-frequency light would accumulate and supply enough energy to eject photoelectrons from a metal. In reality, a metal will not eject photoelectrons below a specific frequency of incident light. For example, no matter how intensely or how long it shines, light with a frequency less than 1.14 × 10¹⁵ Hz does not eject photoelectrons from silver. But even dim light with a frequency equal to or greater than 1.14 × 10¹⁵ Hz ejects photoelectrons from silver.
Get It?Describe the photoelectric effect.
Real-World ChemistryThe Photoelectric Effect
SOLAR ENERGY is sometimes used to power road signs. Photovoltaic cells use the photoelectric effect to convert the energy of light into electric energy.
Figure 7 The photoelectric effect occurs when light of a certain frequency strikes a metal surface and ejects electrons. When the intensity of the light increases, the number of electrons ejected increases. When the frequency (energy) of the light increases, the energy of the ejected electrons increases.
112 Module 4 • Electrons in Atoms
Program: HSS_NA Component: LessonPDF Pass
Vendor: Lumina Chapter: 04
And
rew
Fox
/Cor
bis/
Get
ty Im
ages

24/05/18 07:29AM 0106-0115_CHEM_CA_S_CH04_L01_674695.indd 24/05/18 07:29AM24/05/18 07:29AM 0106-0115_CHEM_CA_S_CH04_L01_674695.indd 24/05/18 07:29AM
Light’s dual nature To explain the photoelectric effect, Albert Einstein proposed in 1905 that light has a dual nature. A beam of light has wavelike and particlelike properties. It can be thought of, or modeled, as a beam of bundles of energy called photons. A photon is a massless particle that carries a quantum of energy. Extending Planck’s idea of quantized energy, Einstein calculated that a photon’s energy depends on its frequency.
Energy of a Photon
Ephoton = hνEphoton represents energy. h is Planck’s constant. ν represents frequency.
The energy of a photon is given by the product of Planck’s constant and the frequency.
Einstein also proposed that the energy of a photon must have a certain threshold value to cause the ejection of a photoelectron from the surface of the metal. Thus, even small numbers of photons with energy above the threshold value will cause the photoelectric effect. Einstein won the Nobel Prize in Physics in 1921 for this work.
ADDITIONAL PRACTICE
EXAMPLE Problem 2
CALCULATE THE ENERGY OF A PHOTON Every object gets its color by reflecting a certain portion of incident light. The color is determined by the wavelength of the reflected photons, thus by their energy. What is the energy of a photon from the violet portion of the Sun’s light if it has a frequency of 7.230 × 10¹⁴ s-1?
1 ANALYZE THE PROBLEMKnown Unknown
ν = 7.230 × 10¹⁴ s-1 Ephoton = ? J
h = 6.626 × 10⁻³⁴ J ⋅ s
2 SOLVE FOR THE UNKNOWNEphoton = hν State the equation for the energy of a photon.
Ephoton = (6.626 × 10⁻³⁴ J ⋅ s)(7.230 × 10¹⁴ s-1) Substitute h = 6.626 × 10⁻³⁴ J⋅s and ν = 7.230 × 10¹⁴ s-1.
Ephoton = 4.791 × 10⁻¹⁹ J Multiply and divide numbers and units.
3 EVALUATE THE ANSWERAs expected, the energy of a single photon of light is extremely small. The unit is joules, an energy unit, and there are four significant figures.
PRACTICE Problems5. Calculate the energy possessed by a single photon of each of the following types of
electromagnetic radiation. a. 6.32 × 10²⁰ s-1 b. 9.50 × 10¹³ Hz c. 1.05 × 10¹⁶ s-1
6. The blue color in some fireworks occurs when copper(l) chloride is heated to approximately 1500 K and emits blue light of wavelength 4.50 × 10² nm. How much energy does one photon of this light carry?
7. CHALLENGE The microwaves used to heat food have a wavelength of 0.125 m. What is the energy of one photon of the microwave radiation?
ADDITIONAL PRACTICE
Lesson 1 • Light and Quantized Energy 113
Program: HSS_NA Component: Lesson 1PDF Pass
Vendor: Lumina Chapter: 04

0106-0115_CHEM_CA_S_CH04_L01_674695.indd 17/12/18 06:03PM
STEM CAREER Connection Astrochemist Do you like chemistry, planetary science, chemical biology, physics, astronomy, and computational science? A career in astrochemisty may be the career for you. Astrochemists use telescopes, satellites, and space vehicles to collect spectro-scopic data and analyze it. In this career, knowledge from several scientific disciplines is used to analyze and model the data collected.
ACADEMIC VOCABULARYphenomenonan observable fact or event During rainstorms, electric currents often pass from the sky to Earth—a phenomenon called lightning.
114 Module 4 • Electrons in Atoms
C05_015A
400λ (nm)
434nm
486nm
656nm
Prism separates lightinto its components.
Hydrogen gasdischarge tubeemits light.
410nm
450
Hydrogen’s Atomic Emission Spectrum750500 550 600 650 700
Slit
Atomic Emission SpectraHave you ever wondered how light is produced in the glowing tubes of neon signs? This is another phenomenon that cannot be explained by the wave model of light. The light of a neon sign is produced by passing electricity through a tube filled with neon gas. Neon atoms in the tube absorb energy and become excited. These excited atoms return to their stable state by emitting light to release that energy. If the light emitted by the neon is passed through a glass prism, neon’s atomic emission spectrum is produced.
The atomic emission spectrum of an element is the set of frequencies of the electromagnetic waves emitted by atoms of the element. Figure 8 shows the purple-pink glow produced by excited hydrogen atoms and the visible portion of hydrogen’s emission spectrum responsible for producing the glow. Note that an atomic emission spectrum is not a continuous spectrum. Rather, it consists of several individual lines of color corresponding to the frequencies of radiation emitted by the atoms.
Each element’s atomic emission spectrum is unique and can be used to identify an element. For example, when a platinum wire is dipped into a strontium nitrate solution and then held in a burner flame, the strontium atoms emit a characteristic red color.
Get It?Explain how an emission spectrum is produced.
Figure 8 The purple light emitted by hydrogen can be separated into its different components using a prism. Hydrogen has an atomic emission spectrum that comprises four lines of different wavelengths. Determine Which line has the highest energy?
Program: HSS_NA Component: LessonPDF Pass
Vendor: Lumina Chapter: 04

0106-0115_CHEM_CA_S_CH04_L01_674695.indd 17/12/18 06:03PM
C05_016A
400 nm
400 nm
700 nm
700 nm
Sodium absorption spectrum
Sodium emission spectrum
Figure 9 When excited sodium atoms return to a less excited state, they emit light at certain frequencies, producing an emission spectrum. When a continuous spectrum of light passes through sodium gas, atoms in the gas absorb light at those same frequencies, producing an absorption spectrum with dark spectral lines.
Go online to follow your personalized learning path to review, practice, and reinforce your understanding.
Summary• All waves are defined by their
wavelengths, frequencies, amplitudes, and speeds.
• In a vacuum, all electromag-netic waves travel at the speed of light.
• All electromagnetic waves have both wave and particle properties.
• Matter emits and absorbs energy in quanta.
• White light produces a continu-ous spectrum. An element’s emission spectrum consists of a series of lines of individual colors.
Check Your Progress
ASTRONOMY Connection Astronomers use atomic spectra to determine the composition of the outer layers of stars. When a continuous spectrum of light from within a star passes through the outer layers of the star, atoms in the outer layers absorb light at certain frequencies, producing an absorption spectrum. The lines in the absorp-tion spectrum reveal what elements are in the outer layers of the star because the frequencies absorbed in an element’s absorption spectrum are the same as those emitted in the element’s emission spectrum, as shown for sodium in Figure 9.
Demonstrate Understanding 8. Describe the relationship between changing electric
and magnetic fields and particles. 9. Compare and contrast continuous spectrum and
emission spectrum.10. Discuss the way in which Einstein utilized Planck’s
quantum concept to explain the photoelectric effect. 11. Calculate Heating 235 g of water from 22.6°C to 94.4°C
in a microwave oven requires 7.06 × 10⁴ J of energy. If the microwave frequency is 2.88 × 10¹⁰ s-1, how many quanta are required to supply the 7.06 × 10⁴ J?
12. Interpret Scientific Illustrations Use Figure 5 and your knowledge of electromagnetic radiation to match the numbered items with the lettered items. The numbered items may be used more than once or not at all.
a. longest wavelength 1. gamma rays b. highest frequency 2. ultraviolet light c. greatest energy 3. radio waves
Lesson 1 • Light and Quantized Energy 115
Program: HSS_NA Component: LessonPDF Pass
Vendor: Lumina Chapter: 04

COLLECT EVIDENCEUse your Science Journal to
record the evidence you collect as you complete the readings and activities in this lesson.
INVESTIGATE GO ONLINE to find these activities and more resources.
Laboratory: The Photoelectric EffectUse mathematical and computational thinking to observe patterns in the stability and instability of physical systems.
Inquiry into Chemistry: Design Atomic ModelsPlan and carry out an investigation to create a model of the charged subsections of an atom.
0116-0125_CHEM_CA_S_CH04_L02_674695.indd 17/12/18 06:03PM
Disciplinary Core Ideas Crosscutting Concepts Science & Engineering Practices3D THINKINGC C C
SEP DCI
Bohr’s Model of the AtomThe dual wave-particle model of light accounted for several previously unexplainable phenomena, but scientists still did not understand the relationships among atomic structure, electrons, and atomic emission spectra. Recall that hydrogen’s atomic emission spectrum is discontinuous; that is, it is made up of only certain frequencies of light. Why are the atomic emission spectra of elements discontinuous rather than continuous? Niels Bohr, a Danish physicist working in Rutherford’s laboratory in 1913, proposed a quantum model for the hydrogen atom that seemed to answer this question. Bohr’s model also correctly predicted the frequencies of the lines in hydrogen’s atomic emission spectrum.
Energy states of hydrogenBuilding on Planck’s and Einstein’s concepts of quantized energy, Bohr proposed that the hydrogen atom has only certain allowable energy states, as illustrated in Figure 10. The lowest allowable energy state of an atom is called its ground state. When an atom gains energy, it is said to be in an excited state.
FOCUS QUESTION
Why does every element produce a unique atomic emission spectrum?
LESSON 2QUANTUM THEORY AND THE ATOM
C05_017A
Nucleus
Ground state Excited state
Electron
Nucleus
Electron
Figure 10 The figure shows an atom that has one electron. Note that the illustration is not to scale. In its ground state, the electron is associated with the lowest energy level. When the atom is in an excited state, the electron is associated with a higher energy level.
116 Module 4 • Electrons in Atoms
Program: HSS_NA Component: LessonPDF Pass
Vendor: Lumina Chapter: 04

C05_018A
Ultravioletseries(Lyman)
Visible series(Balmer)
n = 7
n = 6Infraredseries(Paschen)
n = 5
n = 4
n = 3n = 1 + n = 2
0116-0125_CHEM_CA_S_CH04_L02_674695.indd 24/05/18 07:29AM0116-0125_CHEM_CA_S_CH04_L02_674695.indd 24/05/18 07:29AM
Bohr suggested that the electron in a hydrogen atom moves around the nucleus in only certain allowed circular orbits. The smaller the electron’s orbit, the lower the atom’s energy state, or energy level. Conversely, the larger the electron’s orbit, the higher the atom’s energy state, or energy level. Bohr assigned a number, n, called a quantum number, to each orbit. He also calculated the radius of each orbit. Table 1 shows data for the first seven energy levels of a hydrogen atom according to Bohr’s model.
The hydrogen line spectrumBohr suggested that a hydrogen atom is in the ground state when its single electron is in the n = 1 orbit, also called the first energy level. In the ground state, the atom does not radiate energy. When energy is added from an outside source, the electron moves to a higher-energy orbit, putting the atom in an excited state. When the atom is in an excited state, the electron can drop from the higher-energy orbit to a lower-energy orbit, as shown in Figure 11.
Table 1 Bohr’s Description of the Hydrogen AtomBohr’s Atomic Orbit
Quantum Number
Orbit Radius (nm)
Corresponding Atomic Energy
LevelRelative Energy
First n = 1 0.0529 1 E1
Second n = 2 0.212 2 E2 = 4E1
Third n = 3 0.476 3 E3 = 9E1
Fourth n = 4 0.846 4 E4 = 16E1
Fifth n = 5 1.32 5 E5 = 25E1
Sixth n = 6 1.90 6 E6 = 36E1
Seventh n = 7 2.59 7 E7 = 49E1
Figure 11 When an electron drops from a higher-energy orbit to a lower-energy orbit, a photon is emitted. The ultraviolet (Lyman), visible (Balmer), and infrared (Paschen) series correspond to electrons dropping to n = 1, n = 2, and n = 3, respectively.
Lesson 2 • Quantum Theory and the Atom 117
Program: HSS_NA Component: Lesson 2PDF Pass
Vendor: Lumina Chapter: 04

C05_019A C05_020A
Ener
gy o
f hyd
roge
n at
om
1
2
3
4
56
∞n
0116-0125_CHEM_CA_S_CH04_L02_674695.indd 24/05/18 07:29AM 0116-0125_CHEM_CA_S_CH04_L02_674695.indd 0116-0125_CHEM_CA_S_CH04_L02_674695.indd 24/05/18 07:29AM 0116-0125_CHEM_CA_S_CH04_L02_674695.indd
As a result of this transition, the atom emits a photon corresponding to the energy difference between the two levels.
∆E = Ehigher-energy orbit - Elower-energy orbit = Ephoton = hν
Because only certain atomic energies are possible, only certain frequencies of electromag-netic radiation can be emitted.
You might compare hydrogen’s atomic energy states to rungs on a ladder, as shown in Figure 12. A person can climb up or down the ladder only from rung to rung. Similarly, the hydrogen atom’s electron can move only from one allowable orbit to another, and therefore, can emit or absorb only certain amounts of energy, corresponding to the energy difference between the two orbits. Unlike rungs on a ladder, however, the hydrogen atom’s energy levels are not evenly spaced.
Figure 12 also illustrates the four electron transitions that account for visible lines in hydrogen’s atomic emission spectrum, shown in Figure 8. Electron transitions from higher-energy orbits to the second orbit account for all of hydrogen’s visible lines, which form the Balmer series. Other electron transitions have been measured that are not visible, such as the Lyman series (ultraviolet), in which electrons drop into the n = 1 orbit, and the Paschen series (infrared), in which electrons drop into the n = 3 orbit.
Figure 12 Only certain energy levels are allowed. The energy levels are similar to the rungs of a ladder. The four visible lines correspond to electrons dropping from a higher n to the orbit n = 2. As n increases, the hydrogen atom’s energy levels are closer to each other.
Get It?Explain why different colors of light result from electron behavior in the atom.
118 Module 4 • Electrons in Atoms
Program: HSS_NA Component: Lesson 2PDF Pass
Vendor: Lumina Chapter: 04

C05_022A
1 half–wavelength n = 3 wavelengths
n ≠ whole number (not allowed)
n = 5 wavelengths2 half–wavelengths
3 half–wavelengths
Vibrating harp string Orbiting electroncb
n = 1
n = 2
n = 3
BA
BA
BA
C05_022A
1 half–wavelength n = 3 wavelengths
n ≠ whole number (not allowed)
n = 5 wavelengths2 half–wavelengths
3 half–wavelengths
Vibrating harp string Orbiting electroncb
n = 1
n = 2
n = 3
BA
BA
BA
a
Bri
an K
anof
/McG
raw
-Hill
Edu
cati
on
24/05/18 07:29AM 0116-0125_CHEM_CA_S_CH04_L02_674695.indd 24/05/18 07:29AM24/05/18 07:29AM 0116-0125_CHEM_CA_S_CH04_L02_674695.indd 24/05/18 07:29AM
The limits of Bohr’s modelBohr’s model explained hydrogen’s observed spectral lines. However, the model failed to explain the spectrum of any other element. Moreover, Bohr’s model did not fully account for the chemical behavior of atoms. In fact, although Bohr’s idea of quantized energy levels laid the groundwork for atomic models to come, later experiments demonstrated that the Bohr model was fundamentally incorrect. The movements of electrons in atoms are not completely understood even now; however, substantial evidence indicates that electrons do not move around the nucleus in circular orbits.
The Quantum Mechanical Model of the AtomScientists in the mid-1920s, convinced that the Bohr atomic model was incorrect, formulated new and innovative explanations of how electrons are arranged in atoms. In 1924, a French graduate student in physics named Louis de Broglie (1892–1987) proposed a new idea, shown in Figure 13 and discussed on the following page.
Figure 13 a. The string on the harp vibrates between two fixed endpoints. b. The vibrations of a string between the two fixed endpoints labeled A and B are limited to multiples of half- wavelengths. c. Electrons on circular orbits can only have whole numbers of wavelengths.
Lesson 2 • Quantum Theory and the Atom 119
Program: HSS_NA Component: Lesson 2PDF Pass
Vendor: Lumina Chapter: 04

0116-0125_CHEM_CA_S_CH04_L02_674695.indd 24/05/18 07:29AM0116-0125_CHEM_CA_S_CH04_L02_674695.indd 24/05/18 07:29AM
Electrons as wavesDe Broglie had been thinking that Bohr’s quantized electron orbits had characteristics similar to those of waves. For example, as Figures 13a and 13b show, only multiples of half-wavelengths are possible on a plucked harp string because the string is fixed at both ends. Similarly, de Broglie saw that only whole numbers of wavelengths are allowed in a circular orbit of fixed radius, as shown in Figure 13c.
De Broglie also reflected on the fact that light—at one time thought to be strictly a wave phenomenon—has both wave and particle characteristics. These thoughts led de Broglie to pose a new question: If waves can have particlelike behavior, could the opposite also be true? That is, can particles of matter, including electrons, behave like waves?
De Broglie knew that if an electron has wavelike motion and is restricted to circular orbits of fixed radius, only certain wavelengths, frequencies, and energies are possible. Develop-ing his idea, de Broglie derived the following equation, called the de Broglie equation.
The de Broglie equation predicts that all moving particles have wave characteristics. Note that the equation includes Planck’s constant. Planck’s constant is an exceedingly small number, 6.626 × 10⁻³⁴ J⋅s, which helps explain why it is difficult or impossible to observe the wave characteristics of objects at the scale of everyday experience. For example, an automobile moving at 25 m/s and having a mass of 910 kg has a wavelength of 2.9 × 10-38 m, far too small to be seen or detected. By comparison, an electron moving at the same speed has the easily measured wavelength of 2.9 × 10⁻⁵ m. Subsequent experiments have proven that electrons and other moving particles do indeed have wave characteristics.
The Heisenberg uncertainty principleStep by step, scientists such as Rutherford, Bohr, and de Broglie had been unraveling the mysteries of the atom. However, a conclusion reached by the German theoretical physicist Werner Heisenberg (1901–1976) proved to have profound implications for atomic models.
Heisenberg showed that it is impossible to take any measurement of an object without disturbing the object. Imagine trying to locate a hovering, helium-filled balloon in a darkened room. If you wave your hand about, you can locate the balloon’s position when you touch it. However, when you touch the balloon, you transfer energy to it and change its position. You could also detect the balloon’s position by turning on a flashlight. Using this method, photons of light reflected from the balloon would reach your eyes and reveal the balloon’s location. Because the balloon is a macroscopic object, the effect of the rebounding photons on its position is very small and not observable.
Get It?Identify which variables in the de Broglie equation represent wavelike properties.
Particle Electromagnetic-Wave Relationship
λ = h ___ mν
λ represents wavelength. h is Planck’s constant. m represents mass of the particle. ν represents velocity.
The wavelength of a particle is the ratio of Planck’s constant and the product of the particle’s mass and its velocity.
120 Module 4 • Electrons in Atoms
Program: HSS_NA Component: Lesson 2PDF Pass
Vendor: Lumina Chapter: 04

0116-0125_CHEM_CA_S_CH04_L02_674695.indd 17/12/18 06:03PM
C05_024A
y y
x x
Before collision
Electron
Speed = 0
Photon
λ
After collision
Electron’s speedincreases.
Photon’swavelengthincreases.
λ'
Now imagine trying to determine an electron’s location by “bumping” it with a high- energy photon. Because such a photon has about the same energy as an electron, the interaction between the two particles changes both the wavelength of the photon and the position and velocity of the electron, as shown in Figure 14. In other words, the act of observing the electron produces a significant, unavoidable uncertainty in the position and motion of the electron. Heisenberg’s analysis of interactions, such as those between photons and electrons, led him to his historic conclusion. The Heisenberg uncertainty principle states that it is fundamentally impossible to know precisely both the velocity and position of a particle at the same time.
Although scientists of the time found Heisenberg’s principle difficult to accept, it has been proven to describe the fundamental limitations of what can be observed. The interaction of a photon with a macroscopic object such as a helium-filled balloon has so little effect on the balloon that the uncertainty in its position is too small to measure. But that is not the case with an electron moving at 6 × 10⁶ m/s near an atomic nucleus. The uncertainty of the electron’s position is at least 10-9 m, about 10 times greater than the diameter of the entire atom.
The Heisenberg uncertainty principle also means that it is impossible to assign fixed paths for electrons like the circular orbits in Bohr’s model. The only quantity that can be known is the probability for an electron to occupy a certain region around the nucleus.
Figure 14 When a photon interacts with an electron at rest, both the velocity and the position of the electron are modified. This illustrates the Heisenberg uncertainty principle. It is impossible to know at the same time the position and the velocity of a particle.Explain Why has the photon’s energy changed?
Get It?Identify the only quantity of an electron’s orbit that can be determined.
CROSSCUTTING CONCEPTSCause and Effect What empirical evidence did scientists have that supports the claim that electrons have both particle and wave properties?
Lesson 2 • Quantum Theory and the Atom 121
Program: HSS_NA Component: LessonPDF Pass
Vendor: Lumina Chapter: 04

C05_025A
Nucleus
Boundary
Density Maps
a b
0116-0125_CHEM_CA_S_CH04_L02_674695.indd 24/05/18 07:29AM 0116-0125_CHEM_CA_S_CH04_L02_674695.indd 0116-0125_CHEM_CA_S_CH04_L02_674695.indd 24/05/18 07:29AM 0116-0125_CHEM_CA_S_CH04_L02_674695.indd
Figure 15 The density map represents the probability of finding an electron at a given position around the nucleus. a. The higher density of points near the nucleus shows that the electron is more likely to be found close to the nucleus. b. At any given time, there is a 90% probability of finding the electron within the circular region shown. This surface is sometimes chosen to represent the boundary of the atom. In this illustration, the circle corresponds to a projection of the 3-dimensional sphere that contains the electrons.
The Schrödinger wave equationIn 1926, Austrian physicist Erwin Schrödinger (1887–1961) furthered the wave-particle theory proposed by de Broglie. Schrödinger derived an equation that treated the hydrogen atom’s electron as a wave. Schrödinger’s new model for the hydrogen atom seemed to apply equally well to atoms of other elements—an area in which Bohr’s model failed. The atomic model in which electrons are treated as waves is called the wave mechanical model of the atom or the quantum mechanical model of the atom. Like Bohr’s model, the quantum mechanical model limits an electron’s energy to certain values. However, unlike Bohr’s model, the quantum mechanical model makes no attempt to describe the electron’s path around the nucleus.
Electron’s probable locationThe Schrödinger wave equation is too complex to be considered here. However, each solution to the equation is known as a wave function, which is related to the probability of finding the electron within a particular volume of space around the nucleus. The wave function predicts a three-dimensional region around the nucleus, called an atomic orbital, which describes the electron’s probable location. An atomic orbital is like a fuzzy cloud in which the density at a given point is proportional to the probability of finding the electron at that point.
Figure 15a illustrates the probability map that describes the electron in the atom’s lowest energy state. The probability map can be thought of as a time-exposure photograph of the electron moving around the nucleus, in which each dot represents the electron’s location at an instant in time. The high density of dots near the nucleus indicates the electron’s most probable location. However, it is also possible that the electron might be found at a considerable distance from the nucleus.
Get It?Compare and contrast Bohr’s model and the quantum mechanical model.
Get It?Describe where electrons are located in an atom.
122 Module 4 • Electrons in Atoms
Program: HSS_NA Component: Lesson 2PDF Pass
Vendor: Lumina Chapter: 04

C05_026A
n = 4 (4 sublevels)
n = 3 (3 sublevels)
n = 2 (2 sublevels)
n = 1 (1 sublevel)
Jose
Ant
onio
Mor
eno/
age
foto
stoc
k Sp
ain,
S.L
./A
lam
y
24/05/18 07:29AM 0116-0125_CHEM_CA_S_CH04_L02_674695.indd 24/05/18 07:29AM24/05/18 07:29AM 0116-0125_CHEM_CA_S_CH04_L02_674695.indd 24/05/18 07:29AM
Figure 16 Energy levels can be thought of as rows of seats in a theater. The rows that are higher up and farther from the stage contain more seats. Similarly, energy levels related to orbitals farther from the nucleus contain more sublevels.
Hydrogen’s Atomic OrbitalsBecause the boundary of an atomic orbital is fuzzy, the orbital does not have an exact defined size. To overcome the inherent uncertainty about the electron’s location, chemists arbitrarily draw an orbital’s surface to contain 90% of the electron’s total probability distribution. This means that the probability of finding the electron within the boundary is 0.9 and the probability of finding it outside the boundary is 0.1. In other words, it is more likely to find the electron close to the nucleus and within the volume defined by the boundary, than to find it outside the volume. The circle shown in Figure 15b encloses 90% of the lowest-energy orbital of hydrogen.
Principal quantum numberRecall that the Bohr atomic model assigns quantum numbers to electron orbits. Similarly, the quantum mechanical model assigns four quantum numbers to atomic orbitals. The first one is the principal quantum number (n) and indicates the relative size and energy of atomic orbitals. As n increases, the orbital becomes larger, the electron spends more time farther from the nucleus, and the atom’s energy increases. Therefore, n specifies the atom’s major energy levels. Each major energy level is called a principal energy level. An atom’s lowest principal energy level is assigned a principal quantum number of 1. When the hydrogen atom’s single electron occupies an orbital with n = 1, the atom is in its ground state. Up to 7 energy levels have been detected for the hydrogen atom, giving n values ranging from 1 to 7.
Energy sublevelsPrincipal energy levels contain energy sublevels. Principal energy level 1 consists of a single sublevel, principal energy level 2 consists of two sublevels, principal energy level 3 consists of three sublevels, and so on. To better understand the relationship between the atom’s energy levels and sublevels, picture the seats in a wedge-shaped section of a theater, as shown in Figure 16. As you move away from the stage, the rows become higher and contain more seats. Similarly, the number of energy sublevels in a principal energy level increases as n increases.
Get It?Explain the relationship between energy levels and sublevels.
Lesson 2 • Quantum Theory and the Atom 123
Program: HSS_NA Component: Lesson 2PDF Pass
Vendor: Lumina Chapter: 04

C05_028A
z
xx
yy
1s orbital
z
2s orbital
z
xx
yy
z
px
y
py
z
x
pz
C05_029A
y yy
y
x
z
y
z
x
x xx
z
dxzdxy
z
dyz dx2-y2 dz2
z
c
ba
0116-0125_CHEM_CA_S_CH04_L02_674695.indd 24/05/18 07:29AM0116-0125_CHEM_CA_S_CH04_L02_674695.indd 24/05/18 07:29AM
Shapes of orbitals Sublevels are labeled s, p, d, or f according to the shapes of the atom’s orbitals. All s orbitals are spherical, and all p orbitals are dumbbell-shaped; however, not all d or f orbitals have the same shape. Each orbital can contain, at most, two electrons. The single sublevel in principal energy level 1 corresponds to a spherical orbital called the 1s orbital. The two sublevels in principal energy level 2 are designated 2s and 2p. The 2s sublevel corresponds to the 2s orbital, which is spherical like the 1s orbital but larger in size, as shown in Figure 17a. The 2p sublevel corresponds to three dumbbell-shaped p orbitals designated 2 p x , 2 p y , and 2 p z . The subscripts x, y, and z merely designate the orientations of p orbitals along the x, y, and z coordinate axes, as shown in Figure 17b. Each of the p orbitals related to an energy sublevel has the same energy.
Get It?Describe the shapes of s and p orbitals.
Principal energy level 3 consists of three sublevels designated 3s, 3p, and 3d. Each d sublevel relates to five orbitals of equal energy. Four of the d orbitals have identical shapes but different orientations along the x, y, and z coordinate axes. However, the fifth orbital, dz, is shaped and oriented differently than the other four. The shapes and orientations of the five d orbitals are illustrated in Figure 17c. The fourth principal energy level (n = 4) contains a fourth sublevel, called the 4f sublevel, which relates to seven f orbitals of equal energy. The f orbitals have complex, multilobed shapes.
Figure 17 The shapes of atomic orbitals describe the probable distribution of electrons in energy sublevels. a. All s orbitals are spherical, and their size increases with increasing principal quantum number. b. The three p orbitals are dumbbell-shaped and are oriented along the three perpendicular x, y, and z axes. c. Four of the five d orbitals have the same shape but lie in different planes. The d z 2 orbital has its own unique shape.
124 Module 4 • Electrons in Atoms
Program: HSS_NA Component: Lesson 2PDF Pass
Vendor: Lumina Chapter: 04

Hydrogen’s first four principal energy levels, sublevels, and related atomic orbitals are summarized in Table 2. Note that the number of orbitals related to each sublevel is always an odd number, and that the maximum number of orbitals related to each principal energy level equals n2.
At any given time, the electron in a hydrogen atom can occupy just one orbital. You can think of the other orbitals as unoccupied spaces—spaces available should the atom’s energy increase or decrease.
Summary• Bohr’s atomic model attributes
hydrogen’s emission spectrum to electrons dropping from higher-energy to lower-energy orbits.
• The de Broglie equation relates a particle’s wavelength to its mass, its velocity, and Planck’s constant.
• The quantum mechanical model assumes that electrons have wave properties.
• Electrons occupy three- dimensional regions of space called atomic orbitals.
Check Your ProgressDemonstrate Understanding13. Explain the reason, according to Bohr’s atomic
model, why atomic emission spectra contain only certain frequencies of light.
14. Differentiate between the wavelength of visible light and the wavelength of a moving soccer ball.
15. Explain why the location of an electron in an atom is uncertain using the Heisenberg uncertainty principle. How is the location of electrons in atoms defined?
16. Compare and contrast Bohr’s model and the quantum mechanical model of the atom.
17. Enumerate the sublevels contained in the hydrogen atom’s first four energy levels. What orbitals are related to each s sublevel and each p sublevel?
18. Calculate Use the information in Table 1 to calculate how many times larger the hydrogen atom’s seventh Bohr radius is than its first Bohr radius.
Table 2 Hydrogen’s First Four Principal Energy Levels
Principal Quantum
Number (n)
Sublevels (Types of Orbitals)
Present
Number of Orbitals Related
to Sublevel
Total Number of Orbitals Related to
Principal Energy Level (n 2)
1 s 1 1
2 sp
13 4
3spd
135
9
4
spdf
1357
16
Go online to follow your personalized learning path to review, practice, and reinforce your understanding.
Lesson 2 • Quantum Theory and the Atom 125
Program: HSS_NA Component: LessonPDF Pass
Vendor: Lumina Chapter: 04
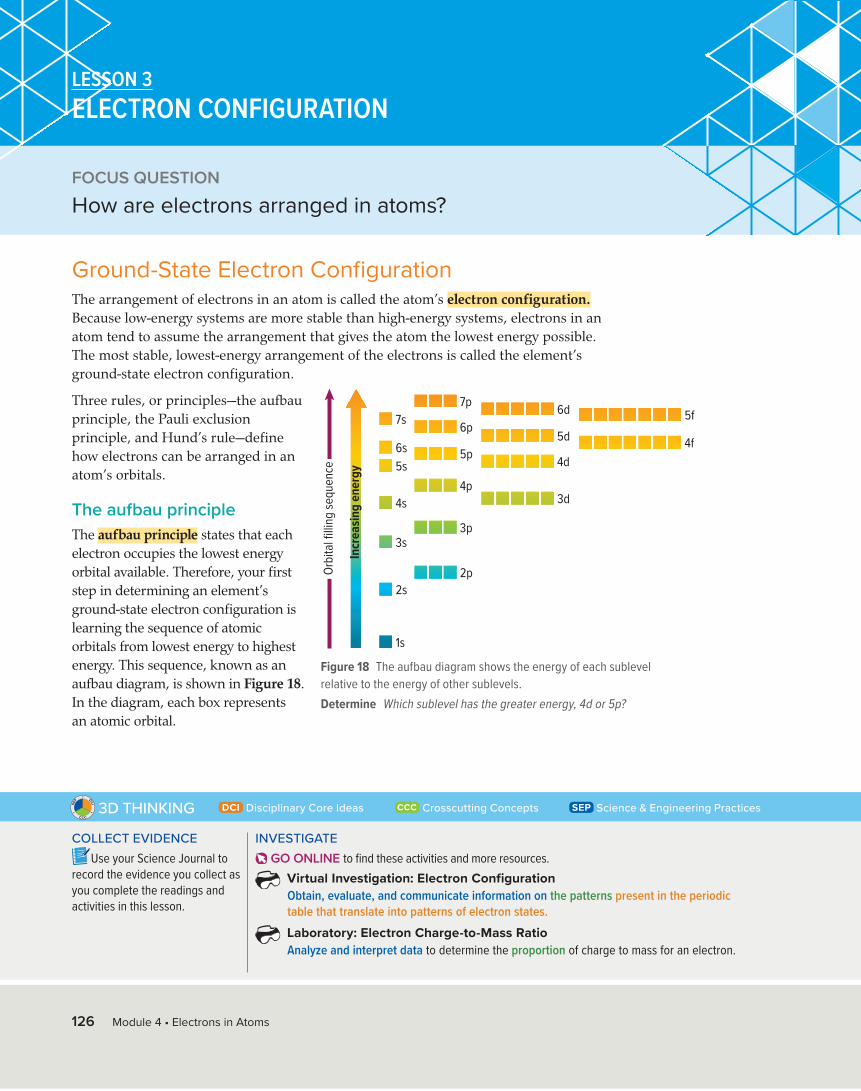
COLLECT EVIDENCEUse your Science Journal to
record the evidence you collect as you complete the readings and activities in this lesson.
INVESTIGATE GO ONLINE to find these activities and more resources.
Virtual Investigation: Electron ConfigurationObtain, evaluate, and communicate information on the patterns present in the periodic table that translate into patterns of electron states.
Laboratory: Electron Charge-to-Mass RatioAnalyze and interpret data to determine the proportion of charge to mass for an electron.
0126-0132_CHEM_CA_S_CH04_L03_674695.indd 18/12/18 01:28AM0126-0132_CHEM_CA_S_CH04_L03_674695.indd 18/12/18 01:28AM
Disciplinary Core Ideas Crosscutting Concepts Science & Engineering Practices3D THINKINGC C C
SEP DCI
Ground-State Electron ConfigurationThe arrangement of electrons in an atom is called the atom’s electron configuration. Because low-energy systems are more stable than high-energy systems, electrons in an atom tend to assume the arrangement that gives the atom the lowest energy possible. The most stable, lowest-energy arrangement of the electrons is called the element’s ground-state electron configuration.
Three rules, or principles—the aufbau principle, the Pauli exclusion principle, and Hund’s rule—define how electrons can be arranged in an atom’s orbitals.
The aufbau principleThe aufbau principle states that each electron occupies the lowest energy orbital available. Therefore, your first step in determining an element’s ground-state electron configuration is learning the sequence of atomic orbitals from lowest energy to highest energy. This sequence, known as an aufbau diagram, is shown in Figure 18. In the diagram, each box represents an atomic orbital.
FOCUS QUESTION
How are electrons arranged in atoms?
LESSON 3ELECTRON CONFIGURATION
C05_030A
Orbi
tal fi
lling
sequ
ence
Incr
easin
g en
ergy
3d
5d
6d
4d
5f
4f
2p
4p
3p
6p
7p
5p
1s
4s
3s
6s
7s
5s
2s
Figure 18 The aufbau diagram shows the energy of each sublevel relative to the energy of other sublevels.Determine Which sublevel has the greater energy, 4d or 5p?
126 Module 4 • Electrons in Atoms
Program: HSS_NA Component: LessonPDF Pass
Vendor: Lumina Chapter: 04

C05_031A
→
→ →
→
→
→ → → →
→
→
→→
→
→
→
→
→
→
→
→
1.
4.
2.
5.
3.
6.
0126-0132_CHEM_CA_S_CH04_L03_674695.indd 24/05/18 07:29AM0126-0132_CHEM_CA_S_CH04_L03_674695.indd 24/05/18 07:29AM
Table 3 summarizes several features of the aufbau diagram. Although the aufbau principle describes the sequence in which orbitals are filled with electrons, it is important to know that atoms are not built up electron by electron.
The Pauli exclusion principleEvery electron has an associated spin, similar to the way a top spins on its point. Like a top, an electron is able to spin in only one of two directions. The Pauli exclusion principle, proposed by Austrian physicist Wolfgang Pauli (1900–1958), states that a maximum of two electrons can occupy a single atomic orbital, but only if the electrons have opposite spins.
Electrons in orbitals can be represented by arrows in boxes. An arrow pointing up ↑ represents the electron spinning in one direction, and an arrow pointing down ↓ represents the electron spinning in the opposite direction. An empty box represents an unoccupied orbital, a box containing a single up arrow ↑ represents an orbital with one electron, and a box containing both up and down arrows ↑↓ represents a filled orbital containing a pair of electrons with opposite spins.
Hund’s ruleThe fact that negatively charged electrons repel each other affects the distribution of electrons in equal-energy orbitals. Hund’s rule states that single electrons with the same spin must occupy each equal-energy orbital before additional electrons with opposite spins can occupy the same orbitals. For example, the boxes below show the sequence in which six electrons occupy the three 2p orbitals. One electron enters each of the orbitals before a second electron enters any of the orbitals.
Get It?State the three rules that define how electrons are arranged in atoms.
Table 3 Features of the Aufbau DiagramFeature Example
All orbitals related to an energy sublevel are of equal energy.
All three 2p orbitals are of equal energy.
In a multi-electron atom, the energy sublevels within a principal energy level have different energies.
The three 2p orbitals are of higher energy than the 2s orbital.
In order of increasing energy, the sequence of energy sublevels within a principal energy level is s, p, d, and f.
If n = 4, then the sequence of energy sublevels is 4s, 4p, 4d, and 4f.
Orbitals related to energy sublevels within one principal energy level can overlap orbitals related to energy sublevels within another principal level.
The orbital related to the atom’s 4s sublevel has a lower energy than the five orbitals related to the 3d sublevel.
Lesson 3 • Electron Configuration 127
Program: HSS_NA Component: Lesson 3PDF Pass
Vendor: Lumina Chapter: 04

C05_033A
2px
2py2pz
2s1s
→
→
→
→
→
→
→
→
→
→
1s 2s 2p
Neon atom
0126-0132_CHEM_CA_S_CH04_L03_674695.indd 24/05/18 07:29AM0126-0132_CHEM_CA_S_CH04_L03_674695.indd 24/05/18 07:29AM
Electron ArrangementYou can represent an atom’s electron configuration using one of two convenient methods: orbital diagrams or electron configuration notation.
Orbital diagramsAs mentioned earlier, electrons in orbitals can be represented by arrows in boxes. Each box is labeled with the principal quantum number and sublevel associated with the orbital. For example, the orbital diagram for a ground-state carbon atom, shown below, contains two electrons in the 1s orbital, two electrons in the 2s orbital, and one electron in two of three separate 2p orbitals. The third 2p orbital remains unoccupied.
C05_032A
2s
→ → →
→
1s
→
→
2p
Electron configuration notationThe electron configuration notation designates the principal energy level and energy sublevel associated with each of the atom’s orbitals and includes a superscript representing the number of electrons in the orbital. For example, the electron configuration notation of a ground-state carbon atom is written 1s22s22p2.
Orbital diagrams and electron configuration notations for the elements in periods one and two of the periodic table are shown in Table 4. Figure 19 illustrates how the 1s, 2s, 2p x , 2p y , and 2p z orbitals illustrated earlier in Figure 17 overlap in the neon atom.
Table 4 Electron Configurations and Orbital Diagrams for Elements 1–10
Element Atomic Number
Orbital Diagram 1s 2s 2px 2py 2pz
Electron Configuration Notation
Hydrogen 1
C05_032A
2s
→ → →
→
1s
→
→
2p1s1
Helium 2
C05_032A
2s
→ → →
→
1s
→
→
2p1s2
Lithium 3
C05_032A
2s
→ → →
→
1s
→
→
2p
C05_032A
2s
→ → →
→
1s
→
→
2p1s2 2s1
Beryllium 4
C05_032A
2s
→ → →
→
1s
→
→
2p
C05_032A
2s
→ → →
→
1s
→
→
2p1s2 2s2
Boron 5
C05_032A
2s
→ → →
→
1s
→
→
2p
C05_032A
2s
→ → →
→
1s
→
→
2p
C05_032A
2s
→ → →
→
1s
→
→
2p1s2 2s2 2p1
Carbon 6
C05_032A
2s
→ → →
→
1s
→
→
2p
C05_032A
2s
→ → →
→
1s
→
→
2p
C05_032A
2s
→ → →
→
1s
→
→
2p
C05_032A
2s
→ → →
→
1s
→
→
2p1s2 2s2 2p2
Nitrogen 7
C05_032A
2s
→ → →
→
1s
→
→
2p
C05_032A
2s
→ → →
→
1s
→
→
2p
C05_032A
2s
→ → →
→
1s
→
→
2p
C05_032A
2s
→ → →
→
1s
→
→
2p
C05_032A
2s
→ → →
→
1s
→
→
2p1s2 2s2 2p3
Oxygen 8
C05_032A
2s
→ → →
→
1s
→
→
2p
C05_032A
2s
→ → →
→
1s
→
→
2p
C05_032A
2s
→ → →
→
1s
→
→
2p
C05_032A
2s
→ → →
→
1s
→
→
2p
C05_032A
2s
→ → →
→
1s
→
→
2p1s2 2s2 2p4
Fluorine 9
C05_032A
2s
→ → →
→
1s
→
→
2p
C05_032A
2s
→ → →
→
1s
→
→
2p
C05_032A
2s
→ → →
→
1s
→
→
2p
C05_032A
2s
→ → →→
1s
→
→
2p
C05_032A
2s
→ → →
→
1s
→
→
2p1s2 2s2 2p5
Neon 10
C05_032A
2s
→ → →
→
1s
→
→
2p
C05_032A
2s
→ → →
→
1s
→
→
2p
C05_032A
2s
→ → →
→
1s
→
→
2p
C05_032A
2s
→ → →→
1s
→
→
2p
C05_032A
2s
→ → →
→
1s
→
→
2p1s2 2s2 2p6
Figure 19 The 1s, 2s, and 2p orbitals of a neon atom overlap.Determine how many electrons a neon atom has.
128 Module 4 • Electrons in Atoms
Program: HSS_NA Component: Lesson 3PDF Pass
Vendor: Lumina Chapter: 04

0126-0132_CHEM_CA_S_CH04_L03_674695.indd 17/12/18 06:04PM0126-0132_CHEM_CA_S_CH04_L03_674695.indd 17/12/18 06:04PM
Note that the electron configuration notation does not usually show the orbital distributions of electrons related to a sublevel. It is understood that a designation such as nitrogen’s 2p3 represents the orbital occupancy 2px
12py12pz
1.
For sodium, the first ten electrons occupy 1s, 2s, and 2p orbitals. Then, according to the aufbau sequence, the eleventh electron occupies the 3s orbital. The electron configuration notation and orbital diagram for sodium are written as follows.
C05_034A
2s
→
→
3s1s
→
→
2p
→→
→
→
→ →
→
1s22s22p63s1
Noble-gas notation Noble gases are the elements in the last column of the periodic table. Their outermost energy levels are full, and they are unusually stable. Noble-gas notation uses bracketed symbols to represent the electron configurations of noble gases. For example, [He] represents the electron configuration for helium, 1s2, and [Ne] represents the electron configuration for neon, 1s22s22p6.
Compare the electron configura-tion for neon with sodium’s configuration above. Note that the inner-level configuration for sodium is identical to the elec-tron configuration for neon. Using noble-gas notation, sodi-um’s electron configuration can be shortened to the form [Ne]3s1. The electron configuration for an element can be represented using the noble-gas notation for the noble gas in the previous period and the electron configuration for the additional orbitals being filled. The complete and abbrevi-ated (using noble-gas notation) electron configurations of the period 3 elements are shown in Table 5.
Get It?Explain how to write the noble-gas notation for an element. What is the noble-gas notation for calcium?
Table 5 Electron Configurations for Elements 11–18
Element Atomic Number
Complete Electron
Configuration
Electron Configuration
Using Noble Gas
Sodium 11 1s22s22p63s1 [Ne]3s1
Magnesium 12 1s22s22p63s2 [Ne]3s2
Aluminum 13 1s22s22p63s23p1 [Ne]3s23p1
Silicon 14 1s22s22p63s23p2 [Ne]3s23p2
Phosphorus 15 1s22s22p63s23p3 [Ne]3s23p3
Sulfur 16 1s22s22p63s23p4 [Ne]3s23p4
Chlorine 17 1s22s22p63s23p5 [Ne]3s23p5
Argon 18 1s22s22p63s23p6 [Ne]3s23p6 or [Ar]
SCIENCE USAGE V. COMMON USAGEperiodScience usage: a horizontal row of elements in the current periodic tableThere are seven periods in the current periodic table.Common usage: an interval of time determined by some recurring phenomenonThe period of Earth’s orbit is one year.
WORD ORIGINaufbau comes from the German word aufbauen, which means to build up or arrange
Lesson 3 • Electron Configuration 129
Program: HSS_NA Component: LessonPDF Pass
Vendor: Lumina Chapter: 04

0126-0132_CHEM_CA_S_CH04_L03_674695.indd 24/05/18 07:29AM 0126-0132_CHEM_CA_S_CH04_L03_674695.indd 0126-0132_CHEM_CA_S_CH04_L03_674695.indd 24/05/18 07:29AM 0126-0132_CHEM_CA_S_CH04_L03_674695.indd
ADDITIONAL PRACTICEPRACTICE Problems19. Write ground-state electron configurations for the following elements.
a. bromine (Br) c. antimony (Sb) e. terbium (Tb)b. strontium (Sr) d. rhenium (Re) f. titanium (Ti)
20. A chlorine atom in its ground state has a total of seven electrons in orbitals related to the atom’s third energy level. How many of the seven electrons occupy p orbitals? How many of the 17 electrons in a chlorine atom occupy p orbitals?
21. When a sulfur atom reacts with other atoms, electrons in the atom’s third energy level are involved. How many such electrons does a sulfur atom have?
22. An element has the ground-state electron configuration [Kr]5s24d105p1. It is part of some semiconductors and used in various alloys. What element is it?
23. CHALLENGE In its ground state, an atom of an element has two electrons in all orbitals related to the atom’s highest energy level for which n = 6. Using noble-gas notation, write the electron configuration for this element, and identify the element.
Exceptions to predicted configurationsYou can use the aufbau diagram to write correct ground-state electron configurations for all elements up to and including vanadium, atomic number 23. However, if you were to proceed in this manner, your configurations for chromium, [Ar]4s23d4, and copper, [Ar]4s23d9, would be incorrect. The correct configurations for these two elements are [Ar]4s13d5 for chromium and [Ar]4s13d10 for copper. The electron configurations for these two elements, as well as those of several other elements, illustrate the increased stability of half-filled and filled sets of s and d orbitals.
PROBLEM-SOLVING STRATEGY
The sublevel diagram shows the order in which the orbitals are usually filled.
C05_035A
1s
2s
3s
4s
5s
6s
7s
2p
3p
4p
5p
6p
7p
3d
4d
5d
6d
4f
5f
Filling Atomic OrbitalsBy drawing a sublevel diagram and following the arrows, you can write the ground-state electron configuration for any element.1. Sketch the sublevel diagram on a blank piece of paper.2. Determine the number of electrons in one atom of the element for
which you are writing the electron configuration. The number of electrons in a neutral atom equals the element’s atomic number.
3. Starting with 1s, write the aufbau sequence of atomic orbitals by following the diagonal arrows from the top of the sublevel diagram to the bottom. When you complete one line of arrows, move to the right, to the beginning of the next line of arrows. As you proceed, add superscripts indicating the numbers of electrons in each set of atomic orbitals. Continue only until you have sufficient atomic orbitals to accommodate the total number of electrons in one atom of the element.
4. Apply noble-gas notation.
Apply the StrategyWrite the ground-state electron configuration for zirconium.
ADDITIONAL PRACTICE
130 Module 4 • Electrons in Atoms
Program: HSS_NA Component: Lesson 3PDF Pass
Vendor: Lumina Chapter: 04

24/05/18 07:29AM 0126-0132_CHEM_CA_S_CH04_L03_674695.indd 24/05/18 07:29AM24/05/18 07:29AM 0126-0132_CHEM_CA_S_CH04_L03_674695.indd 24/05/18 07:29AM
Valence ElectronsOnly certain electrons, called valence electrons, determine the chemical properties of an element. Valence electrons are defined as electrons in the atom’s outermost orbitals—generally those orbitals associated with the atom’s highest principal energy level. For example, a sulfur atom contains 16 electrons, only six of which occupy the outermost 3s and 3p orbitals, as shown by sulfur’s electron configuration, [Ne]3s23p4. Sulfur has six valence electrons. Similarly, although a cesium atom has 55 electrons, it has just one valence electron, the 6s electron shown in cesium’s electron configuration, [Xe]6s1.
Electron-dot structuresBecause valence electrons are involved in forming chemical bonds, chemists often represent them visually using a simple shorthand method, called electron-dot structure. An atom’s electron-dot structure consists of the element’s symbol, which represents the atomic nucleus and inner-level electrons, surrounded by dots representing all of the atom’s valence electrons. In writing an atom’s electron-dot structure, dots repre-senting valence electrons are placed one at a time on the four sides of the symbol (they may be placed in any sequence) and then paired up until all are shown. Table 6 shows exam-ples for the second period.
Table 6 Electron Configurations and Dot Structures
Element Atomic Number
Electron Configuration
Electron-Dot Structure
Lithium 3 1s22s1
Beryllium 4 1s22s2
Boron 5 1s22s22p1
Carbon 6 1s22s22p2
Nitrogen 7 1s22s22p3
Oxygen 8 1s22s22p4
Fluorine 9 1s22s22p5
Neon 10 1s22s22p6
C05_036A
Li
Be
B
C
N
O
F
Ne
C05_036A
Li
Be
B
C
N
O
F
Ne
C05_036A
Li
Be
B
C
N
O
F
Ne
C05_036A
Li
Be
B
C
N
O
F
Ne
C05_036A
Li
Be
B
C
N
O
F
Ne
C05_036A
Li
Be
B
C
N
O
F
Ne
C05_036A
Li
Be
B
C
N
O
F
Ne
C05_036A
Li
Be
B
C
N
O
F
Ne
EXAMPLE Problem 3
ELECTRON-DOT STRUCTURES Some toothpastes contain stannous fluoride, a compound of tin and fluorine. What is tin’s electron-dot structure?
1 ANALYZE THE PROBLEMConsult the periodic table to determine the total number of electrons in a tin atom. Write out tin’s electron configuration, and determine its number of valence electrons. Then use the rules for electron-dot structures to draw the electron-dot structure for tin.
2 SOLVE FOR THE UNKNOWNTin has an atomic number of 50. Thus, a tin atom has 50 electrons.
[Kr]5s24d105p2
The two 5s and the two 5p electrons (the electrons in the orbitals related to the atom’s highest principal energy level) represent tin’s four valence electrons. Draw the four valence electrons around tin’s chemical symbol (Sn) to show tin’s electron-dot structure.
Write out tin’s electron configuration using noble-gas notation. The closest noble gas is Kr.
C05_037A
Sn
Get It?Cite Evidence How do the properties of electrons influence the properties of elements?
Lesson 3 • Electron Configuration 131
Program: HSS_NA Component: Lesson 3PDF Pass
Vendor: Lumina Chapter: 04

0126-0132_CHEM_CA_S_CH04_L03_674695.indd 17/12/18 06:04PM0126-0132_CHEM_CA_S_CH04_L03_674695.indd 17/12/18 06:04PM
Summary• The arrangement of electrons
in an atom is called the atom’s electron configuration.
• Electron configurations are defined by the aufbau princi-ple, the Pauli exclusion princi-ple, and Hund’s rule.
• An element’s valence electrons determine the chemical proper-ties of the element.
• Electron configurations can be represented using orbital diagrams, electron configura-tion notation, and electron-dot structures.
Demonstrate Understanding27. Apply the Pauli exclusion principle, the aufbau
principle, and Hund’s rule to write the electron configuration and draw the orbital diagram for each of the following elements.
a. silicon b. fluorine c. calcium d. krypton28. Define valence electron.29. Illustrate and describe the sequence in which ten
electrons occupy the five orbitals related to an atom’s d sublevel.
30. Extend the aufbau sequence through an element that has not yet been identified, but whose atoms would completely fill 7p orbitals. How many electrons would such an atom have? Write its electron configuration using noble-gas notation for the previous noble gas, radon.
31. Interpret Scientific Illustrations Which is the correct electron-dot structure for an atom of selenium? Explain.
a. b. c. d.
Check Your Progress
PRACTICE Problems
24. Draw electron-dot structures for atoms of the following elements.a. magnesium b. thallium c. xenon
25. An atom of an element has a total of 13 electrons. What is the element, and how many electrons are shown in its electron-dot structure?
26. CHALLENGE This element exists in the solid state at room temperature and at normal atmospheric pressure and is found in emerald gemstones. It is known to be one of the following elements: carbon, germanium, sulfur, cesium, beryllium, or argon. Identify the element based on the electron-dot structure at right.
C05_038A
X
EXAMPLE Problem 3 (continued)
3 EVALUATE THE ANSWERThe correct symbol for tin (Sn) has been used, and the rules for drawing electron-dot structures have been correctly applied.
C05_039A
Se Se Se S
Go online to follow your personalized learning path to review, practice, and reinforce your understanding.
ADDITIONAL PRACTICE
132 Module 4 • Electrons in Atoms
Program: HSS_NA Component: LessonPDF Pass
Vendor: Lumina Chapter: 04

ZOO
NA
R G
MBH
LB
RF/
age
foto
stoc
k
MAKE AND DEFEND A CLAIM
Research one type of battery described in this feature. Write a report summarizing why you think this battery will or will not be successful in the marketplace.
C C C
SEP DCI
0133-0133_CHEM_CA_S_CH04_Feature_674695.indd 17/12/18 06:04PM
Batteries of the Future: Super Charged!Batteries are fundamental to modern technology. Since the invention of the lithium ion battery, researchers have been looking for a better energy source for cars, smart phones, and computers.
The New Wave of Battery PowerIn most batteries available in devices today, the electrolyte is liquid. However, some researchers are working to develop safer batteries with water-based, air, or solid electrolytes.
The U.S. Army Research Laboratory, in collaboration with the University of Maryland, is shaking things up with new technology that uses a saltwater electrolyte. The researchers say this eliminates the fire and explosion risk associated with some non-aqueous lithium ion batteries, which is especially a concern for military personnel in combat situations. The technology needs to be perfected before it is made commercially available, but so far, it is the first battery of its kind to reach the 4.0 volt mark essential for many electronics.
Lithium-air batteries are another promising possibility for the future. It is projected they
could provide three times as much power for a given weight compared with lithium-ion batteries. Researchers across the country are working to determine which electrolyte material, such as lithium iodide, will be most efficient in these batteries to make them cheaper and more powerful.
Solid state batteries use polymer electrolytes to eliminate the liquid electrolyte entirely. This creates a safer, fire-resistant, more powerful, and rechargeable energy source. Solid state batteries are an important advancement to the electric automotive industry, which is currently limited by the range of the best lithium ion batteries.
Given the pervasiveness of battery-powered electronics, new faster, stronger, and safer options could be the catalyst for the next big breakthrough in battery technology.
Lithium ion batteries are used in electronics.
SCIENTIFIC BREAKTHROUGHS
Module 4 • Scientific Breakthroughs 133
Program: HSS_NA Component: FeaturePDF Pass
Vendor: Lumina Chapter: 04

0134-0134_CHEM_CA_S_CH04_SG_674695.indd 17/12/18 06:04PM
GO ONLINE to study with your Science Notebook
Lesson 1 LIGHT AND QUANTIZED ENERGY • electromagnetic radiation• wavelength• frequency• amplitude• electromagnetic spectrum• quantum• Planck’s constant• photoelectric effect• photon• atomic emission spectrum
• All waves are defined by their wavelengths, frequencies, amplitudes, and speeds.
c = λν• In a vacuum, all electromagnetic waves travel at the speed of light.• All electromagnetic waves have both wave and particle properties.• Matter emits and absorbs energy in quanta.
Equantum = hν
• White light produces a continuous spectrum. An element’s emission spectrum consists of a series of lines of individual colors.
Lesson 2 QUANTUM THEORY AND THE ATOM • ground state• quantum number• de Broglie equation• Heisenberg uncertainty principle• quantum mechanical model of
the atom• atomic orbital• principal quantum number• principal energy level• energy sublevel
• Bohr’s atomic model attributes hydrogen’s emission spectrum to electrons dropping from higher-energy to lower-energy orbits.
∆E = Ehigher-energy orbit - Elower-energy orbit = Ephoton = hν
• The de Broglie equation relates a particle’s wavelength to its mass, its velocity, and Planck’s constant.
λ = h/mν• The quantum mechanical model assumes that electrons have
wave properties.• Electrons occupy three-dimensional regions of space called
atomic orbitals.
Lesson 3 ELECTRON CONFIGURATION • electron configuration• aufbau principle• Pauli exclusion principle• Hund’s rule• valence electron• electron-dot structure
• The arrangement of electrons in an atom is called the atom’s electron configuration.
• Electron configurations are defined by the aufbau principle, the Pauli exclusion principle, and Hund’s rule.
• An element’s valence electrons determine the chemical properties of the element.
• Electron configurations can be represented using orbital diagrams, electron configuration notation, and electron-dot structures.
MODULE 4STUDY GUIDE
134 Module 4 • Study Guide
Program: HSS_NA Component: SGPDF Pass
Vendor: Lumina Chapter: 04

Eric
Low
enba
ch/M
omen
t/G
etty
Imag
es
0135-0135_CHEM_CA_S_CH04_MC_674695.indd 17/12/18 06:04PM
REVISIT THE PHENOMENON
How do we know what stars are made of?CER Claim, Evidence, ReasoningExplain Your Reasoning Revisit the claim you made when you encountered the phenomenon. Summarize the evidence you gathered from your investigations and research and finalize your Summary Table. Does your evidence support your claim? If not, revise your claim. Explain why your evidence supports your claim.
STEM UNIT PROJECTNow that you’ve completed the module, revisit your STEM unit project. You will summarize your evidence and apply it to the project.
Module Wrap-UpC C CSE
P DCI THREE-DIMENSIONAL THINKING
GO FURTHER Data Analysis Lab
What electron transitions account for the Balmer series?
Hydrogen’s emission spectrum comprises three series of lines. Some wavelengths are ultraviolet (Lyman series) and infrared (Paschen series). Visible wavelengths comprise the Balmer series. The Bohr atomic model attributes these spectral lines to transitions from higher-energy states with electron orbits in which n = ni to lower-energy states with smaller electron orbits in which n = nf .
CER Analyze and Interpret DataSome hydrogen balmer lines are designated Hα (6562 Å), Hβ (4861 Å), Hγ (4340 Å), and Hδ (4101 Å). Each wavelength (λ) is related to an electron transition within a hydrogen atom by the following equation, in which 1.09678 × 10⁷ m–1 is known as the Rydberg constant.
1 __ λ = 1.09678 × 10⁷ ( 1 __ nf2 - 1 __ ni
2 ) m-1
For hydrogen’s Balmer series, electron orbit transitions occur from larger orbits to the n = 2 orbit; that is, nf = 2.
CER Analyze and Interpret Data 1. Calculate the wavelengths for the
following electron orbit transitions. a. ni = 3; nf = 2 c. ni = 5; nf = 2
b. ni = 4; nf = 2 d. ni = 6; nf = 22. Claim, Evidence, Reasoning Relate
the Balmer-series wavelengths you calculated in Question 1 to those determined experimentally. Allowing for experimental error and calculation uncertainty, do the wavelengths match? Explain your answer. One angstrom (Å) equals 10–10 m.
3. Apply the formula E = hc/λ to determine the energy per quantum for each of the orbit transitions in Question 1.
Module 4 • Electrons in Atoms 135
Program: HSS_NA Component: MCPDF Pass
Vendor: Lumina Chapter: 04

0136-0136_CHEM_CA_S_CH05_MO_674695.indd 07/01/19 08:31PM
Will
& D
eni M
cInt
yre/
Scie
nce
Sour
ce
136 Module 5 • The Periodic Table and Periodic Law
Program: HSS_NA Component: COPDF Pass
Vendor: Lumina Chapter: 05

MODULE 5THE PERIODIC TABLE AND PERIODIC LAW
ENCOUNTER THE PHENOMENON
What can we learn from the periodic table?
GO ONLINE to play a video about Mendeleev’s approach to organizing the elements.
Ask QuestionsDo you have other questions about the phenomenon? If so, add them to the driving question board.
CER Claim, Evidence, ReasoningMake Your Claim Use your CER chart to make a claim about what we can learn from the periodic table.
Collect Evidence Use the lessons in this module to collect evidence to support your claim. Record your evidence as you move through the module.
Explain Your Reasoning You will revisit your claim and explain your reasoning at the end of the module.
GO ONLINE to access your CER chart and explore resources that can help you collect evidence.
LESSON 2: Explore & Explain: Electron Configuration and the Periodic Table
LESSON 1: Explore & Explain: Groups and Periods
Additional Resources
0137-0137_CHEM_NA_S_CH05_Investigate_Phenom_138115.indd 03/05/19 04:56PM
Vid
eo S
uppl
ied
by B
BC
Wor
ldw
ide
Lear
ning
Module 5 • Encounter the Phenomenon 137
Program: HSS_NA Component: IPPDF Pass
Vendor: Aptara Chapter: 05

0138-0145_CHEM_CA_S_CH05_L01_674695.indd 17/12/18 06:05PM
Table 1 Lavoisier’s Table of Simple Substances (Old English Names)Gases light, heat, dephlogisticated air, phlogisticated gas, inflammable air
Metals antimony, silver, arsenic, bismuth, cobalt, copper, tin, iron, manganese, mercury, molybdena, nickel, gold, platina, lead, tungsten, zinc
Nonmetals sulphur, phosphorus, pure charcoal, radical muriatique*, radical fluorique*, radical boracique*
Earths chalk, magnesia, barote, clay, siliceous earth
*no English name
Development of the Periodic TableIn the late 1700s, French scientist Antoine Lavoisier (1743–1794) compiled a list of all elements that were known at the time. The list, shown in Table 1, contained 33 elements organized in four categories. Many of these elements, such as silver, gold, carbon, and oxygen, have been known since prehistoric times.
The 1800s brought a large increase in the number of known elements. The advent of electricity, which was used to break down compounds into their components, and the development of the spectrometer, which was used to identify the newly isolated elements, played major roles in the advancement of chemistry. The industrial revolution of the mid-1800s also played a major role, which led to the development of many new chemistry-based industries, such as the manufacture of petrochemicals, soaps, dyes, and fertilizers. By 1870, there were over 60 known elements.
Along with the discovery of new elements came volumes of new scientific data related to the elements and their compounds. Chemists of the time were overwhelmed with learning the properties of so many new elements and compounds. What chemists needed was a tool for organizing the many facts associated with the elements.
FOCUS QUESTION
How are elements organized in the periodic table?
LESSON 1DEVELOPMENT OF THE MODERN PERIODIC TABLE
Disciplinary Core Ideas Crosscutting Concepts Science & Engineering Practices3D THINKINGC C C
SEP DCI
COLLECT EVIDENCEUse your Science Journal to
record the evidence you collect as you complete the readings and activities in this lesson.
INVESTIGATE GO ONLINE to find these activities and more resources.
Virtual Investigation: Periodic PropertiesAnalyze and interpret the data in the periodic table of elements for patterns of organization and the properties of matter.
ChemLAB: Investigate Descriptive ChemistryAnalyze and interpret data to determine patterns of properties in representative elements.
138 Module 5 • The Periodic Table and Periodic Law
Program: HSS_NA Component: Lesson 1PDF Pass
Vendor: Lumina Chapter: 05

C06_003A
HA 1 FA 8
LiB 2 NaB 9
GC 3 MgC 10
BoD 4 AlD 11
CE 5 SiE 12
NF 6 PF 13
OG 7 SG 14
1 oct
ave
Elements with similar propertiesare in the same row.
and so on
0138-0145_CHEM_CA_S_CH05_L01_674695.indd 24/05/18 07:40AM0138-0145_CHEM_CA_S_CH05_L01_674695.indd 24/05/18 07:40AM
Figure 1 John Newlands noticed that the properties of elements repeated every eighth element in the same way musical notes repeat every eighth note and form octaves.
Get It?Describe the pattern that both Newlands and Mendeleev noticed about the properties of the elements.
Organizing the elements A significant step toward developing a tool for organizing the elements and the large amount of data about their properties came in 1860, when chemists agreed upon a method for accurately determining the atomic masses of the elements. Until this time, different chemists used different mass values in their work, making the results of one chemist’s work hard to reproduce by another.
With newly agreed-upon atomic masses for the elements, the search for relationships between atomic mass and elemental properties, and a way to organize the elements, began in earnest.
John NewlandsIn 1864, English chemist John Newlands (1837–1898) proposed an organizational scheme for the elements. He noticed that when the elements were arranged by increas-ing atomic mass, their properties repeated every eighth element. A pattern such as this is called periodic because it repeats in a specific manner. Newlands named the periodic relationship that he observed in chemical properties the law of octaves, after the musi-cal octave in which notes repeat every eighth tone.
Figure 1 shows how Newlands organized 14 of the elements known in the mid-1860s. Accep-tance of the law of octaves was hampered because the law did not work for all of the known ele-ments. Also, the use of the word octave was harshly criticized by fellow scientists, who thought that the musical analogy was unscientific. While his law was not generally accepted, the passage of a few years would show that Newlands was basically correct: the properties of elements do repeat in a periodic way.
Meyer and MendeleevIn 1869, German chemist Lothar Meyer (1830–1895) and Russian chemist Dmitri Mendeleev (1834–1907) each demonstrated a connection between atomic mass and the properties of elements. Mendeleev, however, is generally given more credit than Meyer because he published his organizational scheme first.
Like Newlands several years earlier, Mendeleev noticed that when the elements were ordered by increasing atomic mass, there was a periodic pattern in their properties.
Lesson 1 • Development of the Modern Periodic Table 139
Program: HSS_NA Component: Lesson 1PDF Pass
Vendor: Lumina Chapter: 05

Scie
nce
& S
ocie
ty P
ictu
re L
ibra
ry/G
etty
Imag
es
0138-0145_CHEM_CA_S_CH05_L01_674695.indd 24/05/18 07:40AM0138-0145_CHEM_CA_S_CH05_L01_674695.indd 24/05/18 07:40AM
Figure 2 In the first version of his table, published in 1869, Mendeleev arranged elements with similar chemical properties horizontally. He left empty spaces for elements that were not yet discovered.
Get It?Compare and contrast the ways in which Mendeleev and Moseley organized the elements.
By arranging the elements in order of increasing atomic mass into columns with similar properties, Mendeleev organized the elements into a periodic table.
Mendeleev’s table, shown in Figure 2, became widely accepted because he predicted the existence and properties of undiscovered elements that were later found. Mendeleev left blank spaces in the table where he thought the undiscovered elements should go. By noting trends in the properties of known elements, he was able to predict the properties of the yet-to-be-discovered elements scandium, gallium, and germanium.
MoseleyMendeleev’s table, however, was not completely correct. After several new elements were discovered and the atomic masses of the known elements were more accurately determined, it became apparent that several elements in his table were not in the correct order. Arranging the elements by mass resulted in several elements being placed in groups of elements with differing properties. The reason for this problem was deter-mined in 1913 by English chemist Henry Moseley (1887–1915). Moseley discovered that atoms of each element contain a unique number of protons in their nuclei—the number of protons being equal to the atom’s atomic number. By arranging the elements in order of increasing atomic number, the problems with the order of the elements in the peri-odic table were solved and a clear periodic pattern of properties resulted.
The statement that there is a periodic repetition of chemical and physical properties of the elements when they are arranged by increasing atomic number is called the periodic law.
140 Module 5 • The Periodic Table and Periodic Law
Program: HSS_NA Component: Lesson 1PDF Pass
Vendor: Lumina Chapter: 05

C06_005A
Atomicnumber
ElementOxygen15.999Atomic
mass
Symbol8 O
0138-0145_CHEM_CA_S_CH05_L01_674695.indd 17/12/18 06:05PM
Figure 3 A typical box from the periodic table contains the ele-ment’s name, its chemical symbol, its atomic number, and its atomic mass.
Table 2 summarizes the contributions of Newlands, Meyer, Mendeleev, and Moseley to the development of the periodic table.
The periodic table brought order to seemingly unrelated facts and became a significant tool for chemists. It is a useful reference for understanding and predicting the proper-ties of elements and for organizing knowledge of atomic structure.
Table 2 Contributions to the Classification of ElementsJohn Newlands (1837–1898)
• arranged elements by increasing atomic mass• noticed the repetition of properties every eighth element• created the law of octaves
Lothar Meyer (1830–1895)
• demonstrated a connection between atomic mass and elements’ properties• arranged the elements in order of increasing atomic mass
Dmitri Mendeleev (1834–1907)
• demonstrated a connection between atomic mass and elements’ properties• arranged the elements in order of increasing atomic mass• predicted the existence and properties of undiscovered elements
Henry Moseley (1887–1915)
• discovered that atoms contain a unique number of protons called the atomic number• arranged elements in order of increasing atomic number, which resulted in a
periodic pattern of properties
The Modern Periodic TableThe modern periodic table consists of boxes, each containing an element name, symbol, atomic number, and atomic mass. A typical box from the table is shown in Figure 3.
The table orders elements horizontally by the number of protons in an atom’s nucleus, and places those with similar chemical proper-ties in columns. The columns are called groups or families. The rows are called periods.
The periodic table is shown in Figure 4 on the next page and on the inside back cover of your textbook. Becoming familiar with the periodic table will help you understand how the properties of different elements relate to one another.
CROSSCUTTING CONCEPTSPatterns Different patterns can be observed in the periodic table. The patterns organize and can predict the properties of elements. Compare and contrast the periods and groups of the table, shown in Figure 4, based on their atomic number and atomic mass. Create a graphic organizer or other simple visual that will help you and your classmates remember the patterns.
WORD ORIGINperiodiccomes from the Greek word periodos, meaning way around, circuit
Lesson 1 • Development of the Modern Periodic Table 141
Program: HSS_NA Component: Lesson 1PDF Pass
Vendor: Lumina Chapter: 05

(293
)Liv
erm
oriu
m
*(2
89)
Mos
coviu
m
*(2
89)
Flero
vium
*(2
86)
Niho
nium
* (252
)Ein
stein
ium
*164.
930
Holm
ium
(257
)Fe
rmiu
m
*167.
259
Erbi
um
(258
)Me
ndele
vium
*168.
934
Thul
ium
(259
)No
beliu
m
*173.
04Yt
terb
ium
(262
)La
wren
cium
*174.
967
Lute
tium
(285
)Co
pern
icium
*(2
81)
Roen
tgen
ium
*(2
81)
Darm
stadt
ium
*(2
78)
Mei
tner
ium
*(2
77)
Hass
ium
*
(98)
Tech
netiu
m95
.95
Mol
ybde
num
92.9
06Ni
obiu
m91
.224
Zirco
nium
88.9
06Yt
trium
87.6
2St
ront
ium
85.4
68Ru
bidi
um
39.0
98Po
tass
ium
40.0
78Ca
lcium
22.9
90So
dium
24.3
05M
agne
sium
6.94
1Lit
hium
1.008
Hydr
ogen
1.008
Hydr
ogen
1H
9.01
2Be
rylliu
m
44.9
56Sc
andi
um47
.867
Titan
ium
50.9
42Va
nadi
um51
.996
Chro
miu
m54
.938
Man
gane
se55
.847
Iron
58.9
33Co
balt
58.6
93Ni
ckel
63.5
46Co
pper
65.3
9Zin
c69
.723
Galliu
m
26.9
82Al
umin
um
13
28.0
86Si
licon
14
30.9
74Ph
osph
orus
15
32.0
66Su
lfur
16
35.4
53Ch
lorin
e
17
10.8
11Bo
ron
12.0
11Ca
rbon
14.0
07Ni
troge
n15
.999
Oxyg
en18
.998
Fluor
ine
20.18
0Ne
on
4.00
3He
lium
39.9
48Ar
gon
18
72.6
1Ge
rman
ium
74.9
22Ar
seni
c78
.971
Sele
nium
79.9
04Br
omin
e83
.80
Kryp
ton
(270
)Bo
hriu
m
*(2
69)
Seab
orgi
um
*(2
70)
Dubn
ium
*(2
27)
Actin
ium
140.
115Ce
rium
232.
038
Thor
ium
140.
908
Prase
odym
ium
231.0
36Pr
otac
tiniu
m
144.
242
Neod
ymiu
m
238.
029
Uran
ium
(145)
Prom
ethi
um
(237
)Ne
ptun
ium
150.
36Sa
mar
ium
(244
)Pl
uton
ium
151.9
65Eu
ropi
um
(243
)Am
erici
um
157.
25Ga
dolin
ium
(247
)Cu
rium
158.
925
Terb
ium
(247
)Be
rkel
ium
162.
50Dy
spro
sium
(251
)Ca
liforn
ium
138.
905
Lant
hanu
m17
8.49
Hafn
ium
(226
)Ra
dium
(223
)Fr
anciu
m
132.
905
Cesiu
m18
0.94
8Ta
ntalu
m18
3.84
Tung
sten
186.
207
Rhen
ium
190.
23Os
miu
m19
2.21
7Iri
dium
195.
08Pl
atin
um19
6.96
7Go
ld20
0.59
Mer
cury
204.
383
Thall
ium
207.
2Le
ad20
8.98
0Bi
smut
h20
8.98
2Po
loni
um20
9.98
7As
tatin
e22
2.01
8Ra
don
131.2
90Xe
non
127.
60Te
lluriu
m12
1.757
Antim
ony
118.7
10Tin
112.4
11Ca
dmiu
m10
7.86
8Si
lver
106.
42Pa
lladi
um10
2.90
6Rh
odiu
m10
1.07
Ruth
eniu
m
137.
327
Bariu
m
(267
)Ru
therfo
rdium
*(2
94)
Tenn
essin
e
*(2
94)
Ogan
esso
n
*
114.8
2In
dium
126.
904
Iodi
ne
116115
114113 9967
10068
101
69
10270
10371
112111
11010
910
8
4342
4140
3938
371920
1112
31
4
2122
2324
2526
2728
2930
3156
78
9102
3233
3435
36
107
106
105
89
58 90
59 91
60 92
61 93
62 94
63 95
64 96
65 97
66 98
5772
888755
7374
7576
7778
7980
8182
8384
858654
5251
5048
4746
4544
56
104
117118
4953
YSr
RbKCa
NaMg
LiH
Be
Sc AcLa
RaFrCs
Ba
FlNh
CnRg
DsMt
Hs
TcMo
NbZrTi
VCr
Mn
FeCo
NiCu
ZnGaAl
Si
BC
NO
FNeHe
Ge
BhSg
Db
HfTa
WRe
OsPt
AuHg
TlPbSn
CdAg
PdRh
Ru
r
Rf
n
LvMcP
SCl
Ar
AsSe
BrKr
BiPo
AtRnXe
TeSb
TsOg
EsHo
FmEr
Md
Tm
NoYb
LrLuCe Th
Pr Pa
Nd U
Pm Np
Sm Pu
Eu Am
Gd Cm
Tb Bk
Dy Cf
1
1
2
765432
93
45
67
8
Synt
hetic
Met
al
Met
allo
id
Non
met
al
1011
12
1314
1516
17
18
Lant
hani
de s
erie
s
Act
inid
e se
ries
*Prop
ertie
s ar
e la
rgel
y pr
edic
ted.
Atom
ic n
umbe
rSy
mbo
l
Elem
ent
Atom
ic m
ass
The
num
ber i
n pa
rent
hese
s is
the
mas
s nu
mbe
r of t
he lo
nges
t-liv
ed is
otop
e fo
r tha
t ele
men
t.
0138-0145_CHEM_CA_S_CH05_L01_674695.indd 24/05/18 07:40AM0138-0145_CHEM_CA_S_CH05_L01_674695.indd 24/05/18 07:40AM
Figu
re 4
Per
iodi
c Ta
ble
of th
e El
emen
ts
142 Module 5 • The Periodic Table and Periodic Law
Program: HSS_NA Component: Lesson 1PDF Pass
Vendor: Lumina Chapter: 05

ulka
n/iS
tock
/Get
ty Im
ages
0138-0145_CHEM_CA_S_CH05_L01_674695.indd 17/12/18 06:05PM
Figure 5 Copper, like most metals, is ductile and conducts electricity well. For these reasons copper is used for electrical wiring.
Groups and periodsBeginning with hydrogen in period 1, there are a total of seven periods. Each group is numbered 1 through 18. For example, period 4 contains potassium and calcium. Oxy-gen is in group 16. The elements in groups 1, 2, and 13 to 18 possess a wide range of chemical and physical properties. For this reason, they are often referred to as the main group, or representative elements. The elements in groups 3 to 12 are referred to as the transition elements. Elements are also classified as metals, nonmetals, and metalloids.
MetalsElements that are generally shiny when smooth and clean, solid at room temperature, and good conductors of heat and electricity are called metals. Most metals are also malleable and ductile, meaning that they can be pounded into thin sheets and drawn into wires, respectively, as shown in Figure 5.
Most representative elements and all transition elements are metals. If you look at boron (B) in column 13, you will see a heavy stairstep line that zigzags down to astatine (At) at the bottom of group 17. This stairstep line is a visual divider between the metals and the nonmetals on the table. In the periodic table shown in Figure 4 metals are represented by the blue boxes.
Alkali Metals Except for hydrogen, all of the elements on the left side of the table are metals. The group 1 elements (except for hydrogen) are known as the alkali metals. Because they are so reactive, alkali metals usually exist as compounds with other elements. Two familiar alkali metals are sodium (Na), one of the components of salt, and lithium (Li), often used in batteries.
SCIENCE USAGE V. COMMON USAGEconductorScience usage: a substance or body capable of transmitting electricity, heat, or soundCopper is a good conductor of heat.Common usage: a person who conducts an orchestra, chorus, or other group of musical performersThe new conductor helped the orchestra perform at its best.
Lesson 1 • Development of the Modern Periodic Table 143
Program: HSS_NA Component: Lesson 1PDF Pass
Vendor: Lumina Chapter: 05

Cuc
u R
emus
/iSt
ock/
Get
ty Im
ages
0138-0145_CHEM_CA_S_CH05_L01_674695.indd 24/05/18 07:40AM0138-0145_CHEM_CA_S_CH05_L01_674695.indd 24/05/18 07:40AM
Figure 6 Because magnesium is light and strong, it is often used in the production of safety devices such as these caribiners used by climbers.
Alkaline Earth Metals The alkaline earth metals are in group 2. They are also highly reactive. Calcium (Ca) and magnesium (Mg), two minerals important for your health, are examples of alkaline earth metals. Because magnesium is strong and relatively light, it is used in applications in which strength and low mass are important, as shown in Figure 6.
Transition and Inner Transition Metals The transition elements are divided into transition metals and inner transition metals. The two sets of inner transition metals, known as the lanthanide series and actinide series, are located along the bottom of the periodic table. The rest of the elements in groups 3 to 12 make up the transition metals. Elements from the lanthanide series are used extensively as phosphors, substances that emit light when struck by electrons. Because it is strong and light, the transition metal titanium is used to make frames for bicycles and eyeglasses.
NonmetalsBIOLOGY Connection Nonmetals occupy the upper-right side of the periodic
table. They are represented by the yellow boxes in Figure 4. Nonmetals are elements that are generally gases or brittle, dull-looking solids. They are poor conductors of heat and electricity. The only nonmetal that is a liquid at room temperature is bromine (Br). The most abundant element in the human body is the nonmetal oxygen, which consti-tutes 65% of the body mass.
Group 17 comprises highly reactive elements that are known as halogens. Like the group 1 and group 2 elements, the halogens are often part of compounds. Compounds made with the halogen fluorine (F) are commonly added to toothpaste and drinking water to prevent tooth decay. The extremely unreactive group 18 elements are com-monly called the noble gases. They are used in applications where their unreactivity is an advantage, such as in lasers, a variety of light bulbs, and neon signs.
144 Module 5 • The Periodic Table and Periodic Law
Program: HSS_NA Component: Lesson 1PDF Pass
Vendor: Lumina Chapter: 05

Nob
oru
Has
him
oto/
Cor
bis
His
tori
cal/
Get
ty Im
ages
0138-0145_CHEM_CA_S_CH05_L01_674695.indd 17/12/18 06:05PM
Go online to follow your personalized learning path to review, practice, and reinforce your understanding.
Check Your ProgressSummary• The elements were first orga-
nized by increasing atomic mass, which led to inconsisten-cies. Later, they were organized by increasing atomic number.
• The periodic law states that when the elements are arranged by increasing atomic number, there is a periodic repetition of their chemical and physical properties.
• The periodic table organizes the elements into periods (rows) and groups or families (columns); elements with similar properties are in the same group.
• Elements are classified as metals, nonmetals, or metalloids.
Demonstrate Understanding 1. Describe the development of the periodic table. 2. Sketch a simplified version of the periodic table, and
indicate the location of metals, nonmetals, and metalloids.3. Describe the general characteristics of metals, non-
metals, and metalloids.4. Identify each of the following as a representative
element or a transition element. a. lithium (Li) c. promethium (Pm) b. platinum (Pt) d. carbon (C)5. Compare For each of the given elements, list two
other elements with similar chemical properties. a. iodine (I) b. barium (Ba) c. iron (Fe)6. Compare According to the periodic table, which two
elements have an atomic mass less than twice their atomic number?
7. Interpret Data A company plans to make an electronic device. They need to use an element that has chemical behavior similar to that of silicon (Si) and lead (Pb). The element must have an atomic mass greater than that of sulfur (S) but less than that of cadmium (Cd). Use the periodic table to predict which element the company will use.
Figure 7 Scientists developing submarine technology created this robot that looks and swims like a real fish. Its body is made of a silicon resin that softens in water.
MetalloidsThe elements in the green boxes bordering the stairstep line in Figure 4 are called metalloids, or semimetals.
Metalloids have physical and chemical properties of both metals and nonmetals. Silicon (Si) and germanium (Ge) are two important metalloids used extensively in computer chips and solar cells. Silicon is also used to make prosthetics or in lifelike applications, as shown in Figure 7.
This introduction to the periodic table touches only the surface of its durable explanatory power. You can refer to the Elements Hand-book at the end of your textbook to learn more about the elements and their various groups.
Lesson 1 • Development of the Modern Periodic Table 145
Program: HSS_NA Component: Lesson 1PDF Pass
Vendor: Lumina Chapter: 05

0146-0151_CHEM_CA_S_CH05_L02_674695.indd 17/12/18 06:05PM
Organizing the Elements by Electron ConfigurationAs you learned previously, electron configuration determines the chemical properties of an element. Writing out electron configurations using the aufbau diagram can be tedious. Fortunately, you can determine an atom’s electron configuration and its num-ber of valence (outermost) electrons from its position on the periodic table. The repeating patterns of the table reflect patterns of outer electron states. The electron configurations for some of the group 1 elements are listed in Table 3. All four configurations have a single electron in their outermost orbitals.
Valence electronsRecall that electrons in the highest principal energy level of an atom are called valence electrons. Each of the group 1 elements has one valence electron. The group 1 elements have similar chemical properties because they have the same number of valence elec-trons. This is one of the most important relationships in chemistry: atoms in the same group have similar chemical properties because they have the same number of valence electrons. Each group 1 element has a valence electron configuration of s1. Each group 2 element has a valence electron configuration of s2. Groups 1, 2, and 13 to 18 all have their own valence electron configurations.
Table 3 Electron Configuration for the Group 1 ElementsPeriod 1 hydrogen 1s1 1s1
Period 2 lithium 1s2s1 [He]2s1
Period 3 sodium 1s22s22p63s1 [Ne]3s1
Period 4 potassium 1s22s22p63s23p64s1 [Ar]4s1
FOCUS QUESTION
Why do elements in the same group have similar properties?
LESSON 2CLASSIFICATION OF THE ELEMENTS
Disciplinary Core Ideas Crosscutting Concepts Science & Engineering Practices3D THINKINGC C C
SEP DCI
COLLECT EVIDENCEUse your Science Journal to
record the evidence you collect as you complete the readings and activities in this lesson.
INVESTIGATE GO ONLINE to find these activities and more resources.
Identify Crosscutting ConceptsCreate a table of the crosscutting concepts and fill in examples you find as you read. Revisit the Encounter the Phenomenon QuestionWhat information from this lesson can help you answer the module question?
146 Module 5 • The Periodic Table and Periodic Law
Program: HSS_NA Component: Lesson 2PDF Pass
Vendor: Lumina Chapter: 05

C06_009A
6
5
4
3
2
2 13 14 15 16 17
1
H
BLi
Na
Rb
Cs
Be
Mg Al
Ga
Tl
Si Cl
Ge
Sn
Pb
As
Sb
Bi
Se
Te
Po
Br
Rn
Xe
Kr
Ar
Ne
He
Ca
Sr
Ba
C N O
P S
F
K
18
1
Na Mg Al
In I
Si Cl ArP S3
0146-0151_CHEM_CA_S_CH05_L02_674695.indd 24/05/18 07:40AM0146-0151_CHEM_CA_S_CH05_L02_674695.indd 24/05/18 07:40AM
Figure 8 The figure shows the electron-dot structure of most representative elements.Observe How does the number of valence electrons vary within a group?
Valence electrons and periodThe energy level of an element’s valence electrons indicates the period on the periodic table in which it is found. For example, lithium’s valence electron is in the second energy level and lithium is found in period 2. Now look at gallium, with its electron configuration of [Ar]4s23d104p1. Gallium’s valence electrons are in the fourth energy level, and gallium is found in the fourth period.
Valence electrons of the representative elementsElements in group 1 have one valence electron; group 2 elements have two valence electrons. Group 13 elements have three valence electrons, group 14 elements have four, and so on. The noble gases in group 18 each have eight valence electrons, with the exception of helium, which has only two valence electrons. Figure 8 shows how the electron-dot structures you studied previously illustrate the connection between group number and number of valence electrons. Notice that the number of valence electrons for the elements in groups 13 to 18 is ten less than their group number.
The s-, p-, d-, and f-Block ElementsThe periodic table has columns and rows of varying sizes. The reason behind the table’s odd shape becomes clear if it is divided into sections, or blocks, representing the atom’s energy sublevel being filled with valence electrons. Because there are four different energy sublevels (s, p, d, and f), the periodic table is divided into four distinct blocks, as shown in Figure 9 on the next page.
s-Block elementsThe s-block consists of groups 1 and 2, and the element helium. Group 1 elements have partially filled s orbitals containing one valence electron and electron configurations ending in s1. Group 2 elements have completely filled s orbitals containing two valence electrons and electron configurations ending in s2. Because s orbitals hold two electrons at most, the s-block spans two groups.
Lesson 2 • Classification of the Elements 147
Program: HSS_NA Component: Lesson 2PDF Pass
Vendor: Lumina Chapter: 05

C06_010A
s block
p block
d block
f block
0146-0151_CHEM_CA_S_CH05_L02_674695.indd 17/12/18 06:05PM
Figure 9 The periodic table is divided into four blocks—s, p, d, and f.Analyze What is the relationship between the maximum number of electrons an energy sublevel can hold and the number of columns in that block on the diagram?
Table 4 Noble Gas Electron ConfigurationPeriod Principal Energy Level Element Electron
Configuration1 n = 1 helium 1s2
2 n = 2 neon [He]2s22p6
3 n = 3 argon [Ne]3s23p6
4 n = 4 krypton [Ar]4s23d104p6
p-Block elementsAfter the s sublevel is filled, the valence electrons next occupy the p sublevel. The p-block is comprised of groups 13 through 18 and contains elements with filled or partially filled p orbitals. There are no p-block elements in period 1 because the p sublevel does not exist for the first principal energy level (n = 1). The first p-block element is boron (B), which is in the second period. The p-block spans six groups because the three p orbitals can hold a maxi-mum of six electrons.
The group 18 elements, which are called the noble gases, are unique members of the p-block. The atoms of these elements are so stable that they undergo virtually no chemical reactions. The electron configurations of the first four noble gas elements are shown in Table 4. Here, both the s and p orbitals corresponding to the period’s principal energy level are completely filled. This arrangement of electrons results in an unusually stable atomic structure. Together, the s- and p-blocks comprise the representative elements.
d-Block elementsThe d-block contains the transition metals and is the largest of the blocks. With some exceptions, d-block elements are characterized by a filled outermost s orbital of energy level n, and filled or partially filled d orbitals of energy level n −1.
ACADEMIC VOCABULARYstructuresomething made up of more-or-less interdependent elements or partsMany scientists were involved in the discovery of the structure of the atom.
148 Module 5 • The Periodic Table and Periodic Law
Program: HSS_NA Component: Lesson 2PDF Pass
Vendor: Lumina Chapter: 05

0146-0151_CHEM_CA_S_CH05_L02_674695.indd 17/12/18 06:05PM
EXAMPLE Problem 1
ELECTRON CONFIGURATION AND THE PERIODIC TABLE Strontium, which is used to produce red fireworks, has an electron configuration of [Kr]5s2. Without using the periodic table, determine the group, period, and block of strontium.
1 ANALYZE THE PROBLEMYou are given the electron configuration of strontium.
Known Unknown
Electron configuration = [Kr]5s2 Group = ?
Period = ?
Block = ?
2 SOLVE FOR THE UNKNOWNThe s2 indicates that strontium’s valence electrons fill the s sublevel. Thus, strontium is in group 2 of the s-block.
The 5 in 5s2 indicates that strontium is in period 5.
3 EVALUATE THE ANSWERThe relationships between electron configuration and position on the periodic table have been correctly applied.
For representative elements, the number of valence electrons can indicate the group number.
The number of the highest energy level indicates the period number.
As you move across a period, electrons fill the d orbitals. For example, scandium (Sc), the first d-block element, has an electron configuration of [Ar]4s23d1. Titanium (Ti), the next element on the table, has an electron configuration of [Ar]4s23d2. Note that titani-um’s filled outermost s orbital has an energy level of n = 4, while the d orbital, which is partially filled, has an energy level of n = 3.
As you learned previously, the aufbau principle states that the 4s orbital has a lower energy level than the 3d orbital. Therefore, the 4s orbital is filled before the 3d orbital. The five d orbitals can hold a total of 10 electrons; thus, the d-block spans 10 groups on the periodic table.
f-Block elementsThe f-block contains the inner transition metals. Its elements are characterized by a filled, or partially filled outermost s orbital, and filled or partially filled 4f and 5f orbitals.
The electrons of the f sublevel do not fill their orbitals in a predictable manner. Because there are seven f orbitals holding up to a maximum of 14 electrons, the f-block spans 14 columns of the periodic table.
STEM CAREER Connection Physical Chemist Does the idea of using computers and sophisticated laboratory instruments to model, simulate, and analyze experimental results appeal to you? Are you someone who enjoys developing new theories? Physical chemists are interested in how matter behaves at the molecular and atomic level. They have a strong interest and background in chemistry, physics, and math.
Lesson 2 • Classification of the Elements 149
Program: HSS_NA Component: Lesson 2PDF Pass
Vendor: Lumina Chapter: 05

12
3
6
5
8
7
4
History of the Periodic Table
The modern periodic table is the result of the work of many scientists over the centuries who studied elements and discovered periodic patterns in their properties.
6 1940 Synthesized elements with an atomic number larger than 92 become part of a new block of the periodic table called the actinides.
5 1913 Henry Moseley determines the atomic number of known elements and establishes that element properties vary periodically with atomic number.
4 1894-1900 The noble gases— argon, helium, krypton, neon, xenon, and radon—become a new group in the periodic table.
1 1789 Antoine Lavoisier defines the chemical element, develops a list of all known elements, and distinguishes between metals and nonmetals.
2 1814 An academic journal publishes Jons Jacob Berzelius's paper proposing letter symbols for the known elements.
3 1869 Lothar Meyer and Dmitri Mendeleev independently develop tables based on element characteristics and predict the properties of unknown elements.
7 1969 Researchers at the University of California, Berkeley synthesize the first element heavier than the actinides. It has a half-life of 4.7 seconds and is named rutherfordium.
8 2016 The syntheses of elements 113, 115, 117, and 118 are confirmed. This completes the seventh period of the periodic table.
0146-0151_CHEM_CA_S_CH05_L02_674695.indd 24/05/18 07:40AM0146-0151_CHEM_CA_S_CH05_L02_674695.indd 24/05/18 07:40AM
Figure 10
150 Module 5 • The Periodic Table and Periodic Law
Program: HSS_NA Component: Lesson 2PDF Pass
Vendor: Lumina Chapter: 05

0146-0151_CHEM_CA_S_CH05_L02_674695.indd 17/12/18 06:05PM
PRACTICE Problems 8. Without using the periodic table, determine the group, period, and block of an atom with the
following electron configurations. a. [Ne]3s2 b. [He]2s2 c. [Kr]5s24d105p5
9. What are the symbols for the elements with the following valence electron configurations? a. s2d1 b. s2p3 c. s2p6
10. CHALLENGE Write the electron configuration of the following elements. a. the group 2 element in the fourth period b. the group 12 element in the fourth period c. the noble gas in the fifth period d. the group 16 element in the second period
The development of the periodic table took many years, but like all scientific knowl-edge, it is open to change. As new elements are synthetized, identified, and named, and as new data about elements arise from experimentation, the periodic table is updated.
Refer to Figure 10 on the previous page to learn more about the history of the periodic table and the work of the many scientists who contributed to its development. The periodic table is an essential tool in understanding and exploring chemistry and you will use it throughout your study of the subject.
Go online to follow your personalized learning path to review, practice, and reinforce your understanding.
Check Your ProgressSummary• The periodic table has four
blocks (s, p, d, f).• Elements within a group have
similar chemical properties.• The group number for
elements in groups 1 and 2 equals the element’s number of valence electrons.
• The energy level of an atom’s valence electrons equals its period number.
Demonstrate Understanding 11. Explain what determines the blocks in the periodic
table. 12. Determine in which block of the periodic table are the
elements having the following valence electron configurations.
a. s2p4 c. s2d1
b. s1 d. s2p1
13. Infer Xenon, a nonreactive gas used in strobe lights, is a poor conductor of heat and electricity. Would you expect xenon to be a metal, a nonmetal, or a metal-loid? Where would you expect it to be on the periodic table? Explain.
14. Explain why elements within a group have similar chemical properties.
15. Model Make a simplified sketch of the periodic table, and label the s-, p-, d-, and f-blocks.
ADDITIONAL PRACTICE
Lesson 2 • Classification of the Elements 151
Program: HSS_NA Component: Lesson 2PDF Pass
Vendor: Lumina Chapter: 05

C06_012A
Bonded nonmetal hydrogenatoms in a molecule
Radius
Radius
Bonded metallicsodium atoms ina crystal lattice
186 pm
372 pm
74 pm
37 pm
The radius of a metal atom is one-halfthe distance between two adjacentatoms in the crystal.
The radius of a nonmetal atom is oftendetermined from a molecule of twoidentical atoms.
0152-0160_CHEM_CA_S_CH05_L03_674695.indd 21/12/18 12:08PM
Atomic RadiusMany properties of the elements tend to change in a predictable way, known as a trend, as you move across a period or down a group. Atomic size is one such periodic trend. The sizes of atoms are influenced by electron configuration.
Recall that the electron cloud surrounding a nucleus does not have a clearly defined edge. The outer limit of an electron cloud is defined as the spherical surface within which there is a 90% probability of finding an electron. However, this surface does not exist in a physical way, as the outer surface of a golf ball does. Atomic size is defined by how closely an atom lies to a neighboring atom. Because the nature of the neighboring atom can vary from one substance to another, the size of the atom itself also tends to vary somewhat from substance to substance.
For metals such as sodium, the atomic radius is defined as half the distance between adja-cent nuclei in a crystal of the element, as shown in Figure 11. For elements that commonly occur as molecules, such as many nonmetals, the atomic radius is defined as half the distance between nuclei of identical atoms that are chemically bonded together. The atomic radius of a nonmetal diatomic hydrogen molecule (H2) is shown in Figure 11.
Figure 11 Atomic radii depend on the type of bonds that atoms form.
FOCUS QUESTION
How can you use the periodic table to predict an element’s properties?
LESSON 3PERIODIC TRENDS
Disciplinary Core Ideas Crosscutting Concepts Science & Engineering Practices3D THINKINGC C C
SEP DCI
COLLECT EVIDENCEUse your Science Journal to
record the evidence you collect as you complete the readings and activities in this lesson.
INVESTIGATE GO ONLINE to find these activities and more resources.
Applying Practice: Electron Patterns of AtomsHS-PS1-1. Use the periodic table as a model to predict the relative properties of elements based on patterns of electrons in the outermost energy level of atoms.
152 Module 5 • The Periodic Table and Periodic Law
Program: HSS_NA Component: Lesson 3PDF Pass
Vendor: Lumina Chapter: 05

C06_013A
H 37 He 31
Li 152
Na 186
K 227
Rb 248
Cs 265
Be 112
Mg 160
Ca 197
Sr 215
Ba 222
B 85
Al 143
Ga 135
n 167
Tl 170
C 77
Si 118
Ge 122
Sn 140
Pb 146
N 75
P 110
As 120
Sb 140
Bi 150
O 73
S 103
Se 119
Te 142
Po 168
F 72
Cl 100
Br 114
133
At 140
Ne 71
Ar 98
Kr 112
Xe 131
Rn 140
1
1
2
3
4
5
6
2 13 14 15 16 17
18Chemical symbolAtomic radius
Relative size
K 227
0152-0160_CHEM_CA_S_CH05_L03_674695.indd 18/12/18 01:34AM
Figure 12 The atomic radii of the representative elements, given in picometers (10–12 m), vary as you move from left to right within a period and down a group.Infer why the atomic radii increase as you move down a group.
Get It?Discuss how the fact that the principal energy level remains the same within a period explains the decrease in the atomic radii across a period.
Trends within periodsIn general, there is a decrease in atomic radii as you move from left to right across a period. This trend is illustrated in Figure 12. It is caused by the increasing positive charge in the nucleus and the fact that the principal energy level within a period remains the same. Each successive element has one additional proton and electron, and each additional electron is added to orbitals corresponding to the same princi-pal energy level. Moving across a period, no additional electrons come between the valence electrons and the nucleus. Thus, the valence electrons are not shielded from the increased nuclear charge, which pulls the outermost electrons closer to the nucleus.
Trends within groupsAtomic radii generally increase as you move down a group on the periodic table. The nuclear charge increases, and electrons are added to orbitals corresponding to successively higher principal energy levels. However, the increased nuclear charge does not pull the outer electrons toward the nucleus to make the atom smaller as you might expect. Why does the increased nuclear charge not make the atom smaller?
Lesson 3 • Periodic Trends 153
Program: HSS_NA Component: Lesson 3PDF Pass
Vendor: Lumina Chapter: 05

C06_014A
Trends in Atomic Radii
Generally decreasesGe
nera
lly in
crea
ses
0152-0160_CHEM_CA_S_CH05_L03_674695.indd 18/12/18 02:09AM 0152-0160_CHEM_CA_S_CH05_L03_674695.indd
Figure 13 Atomic radii generally decrease from left to right in a period and generally increase as you move down a group.
EXAMPLE Problem 2
ELECTRON CONFIGURATION AND THE PERIODIC TABLE Which has the largest atomic radius: carbon (C), fluorine (F), beryllium (Be), or lithium (Li)? Answer without referring to Figure 12. Explain your answer in terms of trends in atomic radii.
1 ANALYZE THE PROBLEMYou are given four elements. First, determine the groups and periods the elements occupy. Then apply the general trends in atomic radii to determine which has the largest atomic radius.
2 SOLVE FOR THE UNKNOWNFrom the periodic table, all the elements are found to be in period 2.
Ordering the elements from left-to-right across the period yields: Li, Be, C, and F.
The first element in period 2, lithium, has the largest radius.
3 EVALUATE THE ANSWERThe period trend in atomic radii has been correctly applied. Checking radii values in Figure 12 verifies the answer.
Determine the periods.
Apply the trend of decreasing radii across a period.
PRACTICE Problems Answer the following questions using your knowledge of group and period trends in atomic radii. Do not use the atomic radii values in Figure 12 to answer the questions.16. Which has the largest atomic radius: magnesium (Mg), silicon (Si), sulfur (S),
or sodium (Na)? The smallest?17. The figure on the right shows helium, krypton, and radon. Which
one is krypton? How can you tell?18. Can you determine which of two unknown elements has the larger
radius if the only known information is that the atomic number of one of the elements is 20 greater than the other? Explain.
19. CHALLENGE Determine which element in each pair has the largest atomic radius: a. the element in period 2, group 1; or the element in period 3, group 18 b. the element in period 5, group 2; or the element in period 3, group 16 c. the element in period 3, group 14; or the element in period 6, group 15 d. the element in period 4, group 18; or the element in period 2, group 16
A B C
C06_015A
ADDITIONAL PRACTICE
Moving down a group, the outermost orbital increases in size along with the increasing principal energy level; thus, the atom becomes larger. The larger orbital means that the outer electrons are farther from the nucleus. This increased distance offsets the pull of the increased nuclear charge. Also, as additional orbitals between the nucleus and the outer electrons are occupied, these electrons shield the outer electrons from the nucleus. Figure 13 summarizes the group and period trends.
154 Module 5 • The Periodic Table and Periodic Law
Program: HSS_NA Component: Lesson 3PDF Pass
Vendor: Lumina Chapter: 05

C06_016A
186 pm 102 pm 181 pm100 pm
Sodium atom (Na)[Ne]3s1
Sodium ion (Na+)[Ne]
Chlorine atom (Cl)[Ne]3s23p5
Chlorine ion (Cl-)[Ne]3s23p6or [Ar]
a b
C06_016A
186 pm 102 pm 181 pm100 pm
Sodium atom (Na)[Ne]3s1
Sodium ion (Na+)[Ne]
Chlorine atom (Cl)[Ne]3s23p5
Chlorine ion (Cl-)[Ne]3s23p6or [Ar]
a b
18/12/18 02:09AM 0152-0160_CHEM_CA_S_CH05_L03_674695.indd 18/12/18 02:09AM
Ionic RadiusAtoms can gain or lose one or more elec-trons to form ions. Because electrons are negatively charged, atoms that gain or lose electrons acquire a net charge. Thus, an ion is an atom or a bonded group of atoms that has a positive or negative charge.
You will learn more about ions later, but for now, consider how the formation of an ion affects the size of an atom.
Losing electronsWhen atoms lose electrons and form positively charged ions, they always become smaller. The reason is twofold. The electron lost from the atom will almost always be a valence electron. The loss of a valence electron can leave a completely empty outer orbital, which results in a smaller radius. Furthermore, the electro-static repulsion between the now-fewer number of remaining electrons decreases. As a result, they experience a greater nuclear charge allowing these remaining electrons to be pulled closer to the positively charged nucleus.
Figure 14a illustrates how the radius of sodium decreases when sodium atoms form positive ions. The outer orbital of the sodium atom is unoccupied in the sodium ion, so the sodium ion is much smaller than the sodium atom.
Gaining electronsWhen atoms gain electrons and form negatively charged ions, they become larger. The addition of an electron to an atom increases the electrostatic repulsion between the atom’s outer electrons, forcing them to move farther apart. The increased distance between the outer electrons results in a larger radius.
Figure 14b shows how the radius of chlorine increases when chlorine atoms form negative ions. Adding an electron to a chlorine atom increases the electrostatic repul-sion among its valence electrons. The increased repulsion causes the electrons to move farther apart and results in the radius of a chloride ion being almost twice as large as that of a chlorine atom.
Figure 14 The size of atoms varies greatly when they form ions.a. Positive ions are smaller than the neutral atoms from which
they form.b. Negative ions are larger than the neutral atoms from which
they form.
Get It?Explain why a lithium ion is smaller than a lithium atom.
Lesson 3 • Periodic Trends 155
Program: HSS_NA Component: Lesson 3PDF Pass
Vendor: Lumina Chapter: 05

C06_017A
Li 76
Na 102
K 138
Rb 152
Cs 167
Be 31
Mg 72
Ca 100
Sr 118
Ba 135
B 20
Al 54
Ga 62
n 81
Tl 95
C 15
Si 41
Ge 53
Sn 71
Pb 84
N 146
P 212
As 222
Sb 62
Bi 74
O 140
S 184
Se 198
Te 221
F 133
Cl 181
Br 196
220
K 138
1+
1
Chemical symbol
Charge
Relative size
Ionic radius
2
3
4
5
6
1+
1+
1+
1+
1+
2
Perio
d
13 14 15 16 17
2+
2+
2+
2+
2 +
3+
3+
3+
3+
3+
4+
4+
4+
4+
4+
3
3
3
5+
5+
2
2
2
2
1
1
1
1
C06_018A
Trends in Ionic Radii
Positive ions decreaseNegativeionsdecrease
Gene
rally
incr
ease
s
0152-0160_CHEM_CA_S_CH05_L03_674695.indd 18/12/18 02:10AM 0152-0160_CHEM_CA_S_CH05_L03_674695.indd
Figure 15 The ionic radii of most of the representative elements are shown in picometers (10−12 m).Explain why the ionic radii increase for both positive and negative ions as you move down a group.
Figure 16 The diagram summarizes the general trends in ionic radii.
Get It?Explain why calcium has a greater atomic radius than magnesium.
Trends within periodsThe ionic radii of most of the representative elements are shown in Figure 15. Note that elements on the left side of the table form smaller positive ions, and elements on the right side of the table form larger negative ions.
In general, as you move from left to right across a period, the size of the positive ions gradually decreases. Then, beginning in group 15 or 16, the size of the much-larger negative ions also gradually decreases.
Trends within groupsAs you move down a group, an ion’s outer electrons are in orbitals corresponding to higher principal energy levels, resulting in a gradual increase in ionic size. Thus, the ionic radii of both positive and negative ions increase as you move down a group. The group and period trends in ionic radii are summarized in Figure 16.
156 Module 5 • The Periodic Table and Periodic Law
Program: HSS_NA Component: Lesson 3PDF Pass
Vendor: Lumina Chapter: 05

C06_019A
0 10 20 30 40 50 60
Firs
t ion
izat
ion
ener
gy (k
J/m
ol)
2500
2000
1500
1000
500
0
Atomic number
First Ionization Energy of Elements in Periods 1–5Period 4 Period 5Period 3Period 2
LiK
H
NaRb
HeNe
ArKr Xe
24/05/18 07:40AM 0152-0160_CHEM_CA_S_CH05_L03_674695.indd 24/05/18 07:40AM24/05/18 07:40AM 0152-0160_CHEM_CA_S_CH05_L03_674695.indd 24/05/18 07:40AM
Get It?Define ionization energy.
Figure 17 The first ionization energies for elements in periods 1 through 5 are shown as a function of the atomic number.Describe how ionization energy and atomic number are related as shown on this scatter plot.
Ionization EnergyTo form a positive ion, an electron must be removed from a neutral atom. This requires energy. The energy is needed to overcome the attraction between the positive charge of the nucleus and the negative charge of the electron.
Ionization energy is defined as the energy required to remove an electron from a gaseous atom. For example, 8.64 × 10⁻¹⁹ J is required to remove an electron from a gaseous lithium atom. The energy required to remove the first outermost electron from an atom is called the first ionization energy. The first ionization energy of lithium equals 8.64 × 10⁻¹⁹ J. The loss of the electron results in the formation of a Li+ ion. The first ionization energies of the elements in periods 1 through 5 are plotted on the graph in Figure 17.
Think of ionization energy as an indication of how strongly an atom’s nucleus holds onto its valence electrons. A high ionization energy value indicates the atom has a strong hold on its electrons. Atoms with large ionization energy values are less likely to form positive ions. Likewise, a low ionization energy value indicates an atom loses an outer electron easily. Such atoms are likely to form positive ions. Lithium’s low ioniza-tion energy, for example, is important for its use in lithium-ion computer backup batteries, where the ability to lose electrons easily makes a battery that can quickly provide a large amount of electrical power.
Lesson 3 • Periodic Trends 157
Program: HSS_NA Component: Lesson 3PDF Pass
Vendor: Lumina Chapter: 05

0152-0160_CHEM_CA_S_CH05_L03_674695.indd 24/05/18 07:40AM 0152-0160_CHEM_CA_S_CH05_L03_674695.indd 0152-0160_CHEM_CA_S_CH05_L03_674695.indd 24/05/18 07:40AM 0152-0160_CHEM_CA_S_CH05_L03_674695.indd
Each set of connected points on the graph in Figure 17 represents the elements in a period. The group 1 metals have low ionization energies. Thus, group 1 metals (Li, Na, K, Rb) are likely to form positive ions. The group 18 elements (He, Ne, Ar, Kr, Xe) have high ionization energies and are unlikely to form ions. The stable electron configuration of gases of group 18 greatly limits their reactivity.
Removing more than one electronAfter removing the first electron from an atom, it is possible to remove additional electrons. The amount of energy required to remove a second electron from a 1+ ion is called the second ionization energy, the amount of energy required to remove a third electron from a 2+ ion is called the third ionization energy, and so on. Table 5 lists the first through ninth ionization energies for elements in period 2.
Reading across Table 5 from left to right, you will see that the energy required for each successive ionization always increases. However, the increase in energy does not occur smoothly. Note that for each element there is an ionization for which the required energy increases dramatically. For example, the second ionization energy of lithium (7300 kJ/mol) is much greater than its first ionization energy (520 kJ/mol). This means that a lithium atom is likely to lose its first valence electron but extremely unlikely to lose its second.
If you examine the Table 5, you will notice that the ionization at which the large increase in energy occurs is related to the atom’s number of valence electrons. The element lithium has one valence electron and the increase occurs after the first ioniza-tion energy. Lithium easily forms the common lithium 1+ ion but is unlikely to form a lithium 2+ ion. The increase in ionization energy shows that atoms hold onto their inner core electrons much more strongly than they hold onto their valence (outermost) electrons.
Get It?Infer how many electrons carbon is likely to lose.
Table 5 Successive Ionization Energies for the Period 2 Elements
Element Valence Electrons
Ionization Energy (kJ/mol)*1st 2nd 3rd 4th 5th 6th 7th 8th 9th
Li 1 520 7300 11,810Be 2 900 1760 14,850 21,010B 3 800 2430 3660 25,020 32,820C 4 1090 2350 4620 6220 37,830 47,280N 5 1400 2860 4580 7480 9440 53,270 64,360O 6 1310 3390 5300 7470 10,980 13,330 71,870 84,080F 7 1680 3370 6050 8410 11,020 15,160 17,870 92,040 106,430
Ne 8 2080 3950 6120 9370 12,180 15,240 20,000 23,070 115,380*mol is an abbreviation for mole, a quantity of matter
158 Module 5 • The Periodic Table and Periodic Law
Program: HSS_NA Component: Lesson 3PDF Pass
Vendor: Lumina Chapter: 05

C06_021A
Trends in First Ionization Energies
Generally increases
Gene
rally
dec
reas
es
Jag_
cz/S
hutt
erst
ock.
com
18/12/18 02:11AM 0152-0160_CHEM_CA_S_CH05_L03_674695.indd 18/12/18 02:11AM
Trends within periodsAs shown in Figure 17 and by the values in Table 5, first ionization energies generally increase as you move from left to right across a period. The increased nuclear charge of each successive element produces an increased hold on the valence electrons.
Trends within groupsFirst ionization energies generally decrease as you move down a group. This decrease in energy occurs because atomic size increases as you move down the group. Less energy is required to remove the valence electrons farther from the nucleus. Figure 18 summarizes the group and period trends in first ionization energies.
Octet ruleWhen a sodium atom loses its single valence electron to form a 1+ sodium ion, its electron configuration changes as shown below.
Sodium atom 1s22s22p63s1 Sodium ion 1s22s22p6
Note that the sodium ion has the same electron configuration as neon (1s22s22p6), a noble gas. This observation leads to one of the most important principles in chemistry, the octet rule. The octet rule states that atoms tend to gain, lose, or share electrons in order to acquire a full set of eight valence electrons. This reinforces what you learned earlier, that the electron configuration of filled s and p orbitals of the same energy level (consisting of eight valence electrons) is unusually stable. Note that the first-period elements are an exception to the rule, as they are complete with only two valence electrons.
ElectronegativityThe electronegativity of an element indicates the relative ability of its atoms to attract electrons in a chemical bond. As shown in Figure 19, on the next page, electronegativity generally decreases as you move down a group. Figure 19 also indicates that electronegativity generally increases as you move from left to right across a period. Fluorine is the most electronegative element, with a value of 3.98, meaning it attracts electrons more strongly than any other element in a chemical bond. Cesium and francium are the least electronegative elements, with values of 0.79 and 0.70, repectively. In a chemical bond, the atom with the greater electronegativity more strongly attracts the bond’s elec-trons. Note that because the noble gases form very few compounds, they do not have electronegativity values.
Figure 18 Ionization energies generally increase from left to right in a period and generally decrease as you move down a group.
Real-World ChemistryIonization Energy
SCUBA DIVING The increased pressure that scuba divers experience far below the water’s surface can cause too much oxygen to enter their blood, which would result in confusion and nausea. To avoid this, divers sometimes use a gas mixture called heliox—oxygen diluted with helium. Helium’s high ionization energy ensures that it will not react chemically in the bloodstream.
Lesson 3 • Periodic Trends 159
Program: HSS_NA Component: Lesson 3PDF Pass
Vendor: Lumina Chapter: 05

C06_023A
1
1
2
2
33 4
4
5
5
6
6
7
7
2
3
4
5
6
8 9 10 1112
1314
1516
17F
3.98
Cl3.16
Br2.96
I2.66
At2.2
Zn1.65Cd
1.69
Al1.61
V1.63
Cr1.66
Mn1.55
Fe1.83
Co1.88
Ni1.91
Ag1.93
H2.20
Li0.98
Be1.57
Na 0.93
Mg1.31
K0.82
Ca1.00
Sc1.36
Ti1.54
Rb0.82
Cs0.79
Fr0.70
Ra0.90
Ac1.1
Ba0.89
La1.1
Sr0.95
Y1.22
Zr1.33
Hf1.3
Nb1.6
Ta1.5
Mo2.16
W1.7
Tc2.10
Ru2.2
Re1.9
Rh2.28
Cu1.90
Pd2.20
Os2.2
Ir2.2
Pt2.2 Hg
1.9
Au2.4 Tl
1.8
In1.78
Ga1.81
B2.04
C2.55
N3.04
O3.44
S2.58P
2.19Si1.90
Ge2.01
As2.18
Sb2.05
Sn1.96
Se2.55
Te2.1
Po2.0
Bi1.9
Pb1.8
Increasing electronegativity
Electronegativity Values in Paulings
Decr
easin
g el
ectro
nega
tivity
0152-0160_CHEM_NA_S_CH05_L03_138115.indd 03/05/19 07:02PM
Figure 19 The electronegativ-ity values for most of the elements are shown. The values are given in Paulings, a unit named after American scientist Linus Pauling (1901–1994). Infer why electronegativity values are not listed for the noble gases.
Go online to follow your personalized learning path to review, practice, and reinforce your understanding.
Check Your ProgressSummary• Atomic and ionic radii decrease
from left to right across a period, and increase as you move down a group.
• Ionization energies generally increase from left to right across a period, and decrease down a group.
• The octet rule states that atoms gain, lose, or share electrons to acquire a full set of eight valence electrons.
• Electronegativity generally increases from left to right across a period, and decreases down a group.
Demonstrate Understanding20. Explain how the period and group trends in atomic
radii are related to electron configuration. 2 1 . Indicate whether fluorine or bromine has a larger
value for each of the following properties. a. electronegativity c. atomic radius b. ionic radius d. ionization energy
22. Explain why it takes more energy to remove the second electron from a lithium atom than it does to remove the fourth electron from a carbon atom.
23. Calculate Determine the differences in electronega-tivity, ionic radius, atomic radius, and first ionization energy for oxygen and beryllium.
24. Make and Use Graphs Graph the atomic radii of the representative elements in periods 2, 3, and 4 versus their atomic numbers. Connect the points of elements in each period, so that there are three separate curves on the graph. Summarize the trends in atomic radii shown on your graph. Explain.
160 Module 5 • The Periodic Table and Periodic Law
Program: HSS_NA Component: Lesson 3PDF Pass
Vendor: Aptara Chapter: 05

Ban
anaS
tock
/Get
ty Im
ages APPLY SCIENTIFIC PRINCIPLES
AND EVIDENCEExplain how a discovery about an element or elements was incorporated into the modern periodic table.
C C C
SEP DCI
0161-0161_CHEM_NA_S_CH05_Feature_138115.indd 13/04/19 06:42PM
The Evolving Periodic Table
The Adaptable Periodic TableThe design of the periodic table that we use today was developed in the 19th century, before the discovery of all of the naturally occurring elements, including the noble gases, and before the synthesis of elements. Initially, the elements were organized on the periodic table by atomic mass. This caused some inconsistencies. Once the atomic number was used to align the elements into rows and properties were used to organize the elements into columns, the mod-ern periodic table was born.
The modern periodic table demonstrates the elegance of the nature of science. The early periodic table evolved to incorporate new information. For example, a new column was added when the noble gases were discovered. Period 7 is now completely filled after the recently discovered elements 113, 115, 117, and 118 were added.
Newly synthesized elements must now be added to another row. If and when these new elements are discovered, period 8 will be added to the periodic table.
When the periodic table was being developed chemists did not understand why these groups
of elements had similar properties, but they recognized the periodic trend in these proper-ties. Today, students and chemists understand that elements in a group have similar properties and the same number of valence electrons. Our understanding of the atom evolved along with our understanding of what elements in a group on the periodic table have in common in terms of valence electrons, reactivity, and properties.
While the nature of atoms and elements were not understood at the time of the periodic table’s development, the original table was well designed. As new information was discovered about atoms and elements, the periodic table evolved and incorporated the new information resulting in a table that is just as useful today as it was when it was first developed.
Chemists have used the periodic table since its development in the late 1860s, but it has evolved over the years, and it is still evolving today.
This Russian stamp commemorates Dmitri Mendeleev, who first published the periodic table in 1869.
NATURE OF SCIENCE
Module 5 • Nature of Science 161
Program: HSS_NA Component: FTPDF Pass
Vendor: Aptara Chapter: 05

0162-0162_CHEM_CA_S_CH05_SG_674695.indd 17/12/18 06:05PM
GO ONLINE to study with your Science Notebook.
Lesson 1 DEVELOPMENT OF THE MODERN PERIODIC TABLE • periodic law• group• period• representative element• transition element • metal• alkali metal• alkaline earth metal • transition metal• inner transition metal• lanthanide series • actinide series• nonmetal• halogen• noble gas• metalloid
• The elements were first organized by increasing atomic mass, which led to inconsistencies. Later, they were organized by increasing atomic number.
• The periodic law states that when the elements are arranged by increasing atomic number, there is a periodic repetition of their chemical and physical properties.
• The periodic table organizes the elements into periods (rows) and groups or families (columns); elements with similar properties are in the same group.
• Elements are classified as metals, nonmetals, or metalloids.
C06_005A
Atomicnumber
ElementOxygen15.999Atomic
mass
Symbol8 O
Lesson 2 CLASSIFICATION OF THE ELEMENTS• The periodic table has four blocks (s, p, d, f).• Elements within a group have similar chemical properties.• The group number for elements in groups 1 and 2 equals the
element’s number of valence electrons.• The energy level of an atom’s valence electrons equals its period
number.
Lesson 3 PERIODIC TRENDS • ion• ionization energy• octet rule• electronegativity
• Atomic and ionic radii decrease from left to right across a period, and increase as you move down a group.
• Ionization energies generally increase from left to right across a period, and decrease down a group.
• The octet rule states that atoms gain, lose, or share electrons to acquire a full set of eight valence electrons.
• Electronegativity generally increases from left to right across a period, and decreases down a group.
MODULE 5STUDY GUIDE
162 Module 5 • Study Guide
Program: HSS_NA Component: SGPDF Pass
Vendor: Lumina Chapter: 05

Will
& D
eni M
cInt
yre/
Scie
nce
Sour
ce
0163-0163_CHEM_CA_S_CH05_MC_674695.indd 17/12/18 06:06PM
REVISIT THE PHENOMENON
What can we learn from the periodic table?CER Claim, Evidence, ReasoningExplain Your Reasoning Revisit the claim you made when you encountered the phenomenon. Summarize the evidence you gathered from your investigations and research and finalize your Summary Table. Does your evidence support your claim? If not, revise your claim. Explain why your evidence supports your claim.
STEM UNIT PROJECTNow that you’ve completed the module, revisit your STEM unit project. You will apply your evidence from this module and complete your project.
Module Wrap-UpC C CSE
P DCI THREE-DIMENSIONAL THINKING
GO FURTHER Data Analysis Lab
Can you predict the properties of an element?
Francium was discovered in 1939, but its existence was pre-dicted by Mendeleev in the 1870s. It is the least stable of the first 101 elements, with a half-life of just 22 minutes for its most stable isotope. Use the properties of other alkali metals, shown in the table, to predict some of francium’s properties.CER Analyze and Interpret DataUse the given information about the known properties of the alkali metals to devise a method for predicting the corresponding properties of francium. 1. Claim, Evidence, Reasoning Devise an approach that clearly
displays the trends for each of the properties given in the table and allows you to extrapolate a value for francium. Use the periodic law as a guide.
2. Claim, Evidence, Reasoning Predict whether francium is a solid, a liquid, or a gas. How can you support your prediction?
3. Infer which column of data presents the greatest possible error in making a prediction. Explain.
4. Determine why producing 1 million francium atoms per second is not enough to make measurements, such as density or melting point.
Alkali Metals DataElement Melting
Point (°C)Boiling
Point (°C)Radius
(pm)
Lithium 180.5 1342 152Sodium 97.8 883 186
Potassium 63.4 759 227Rubidium 39.3 688 248Cesium 28.4 671 265
Francium ? ? ?
Module 5 • The Periodic Table and Periodic Law 163
Program: HSS_NA Component: MCPDF Pass
Vendor: Lumina Chapter: 05