Influence of calcination conditions on carrying capacity of CaO-based sorbent in CO2 looping cycles
8
Influence of calcination conditions on carrying capacity of CaO-based sorbent in CO 2 looping cycles Vasilije Manovic a , Jean-Pierre Charland a , John Blamey b , Paul S. Fennell b , Dennis Y. Lu a , Edward J. Anthony a, * a CanmetENERGY, Natural Resources Canada, 1 Haanel Drive, Ottawa, Ontario, Canada K1A 1M1 b Department of Chemical Engineering, Imperial College, London SW7 2AZ, United Kingdom article info Article history: Received 8 December 2008 Received in revised form 30 March 2009 Accepted 14 April 2009 Available online 3 May 2009 Keywords: CO 2 capture CaO looping cycle Sintering Densification abstract This study examines the loss of sorbent activity caused by sintering under realistic CO 2 capture cycle conditions. The samples tested here included two limestones: Havelock limestone from Canada (New Brunswick) and a Polish (Upper Silesia) limestone (Katowice). Samples were prepared both in a thermo- gravimetric analyzer (TGA) and a tube furnace (TF). Two calcination conditions were employed: in N 2 at lower temperature; and in CO 2 at high temperature. The samples obtained were observed with a scan- ning electron microscope (SEM) and surface compositions of the resulting materials were analyzed by the energy dispersive X-ray (EDX) method. The quantitative influence of calcination conditions was examined by nitrogen adsorption/desorption tests, gas displacement pycnometry and powder displace- ment pycnometry; BET surface areas, BJH pore volume distributions, skeletal densities and envelope den- sities were determined. The SEM images showed noticeably larger CaO sub-grains were produced by calcination in CO 2 during numerous cycles than those seen with calcination in nitrogen. The EDX elemen- tal analyses showed a strong influence of impurities on local melting at the sorbent particle surface, which became more pronounced at higher temperature. Results of BET/BJH testing clearly support these findings on the effect of calcination/cycling conditions on sorbent morphology. Envelope density mea- surements showed that particles displayed densification upon cycling and that particles calcined under CO 2 showed greater densification than those calcined under N 2 . Interestingly, the Katowice limestone cal- cined/cycled at higher temperature in CO 2 showed an increase of activity for cycles involving calcination under N 2 in the TGA. These results clearly demonstrate that, in future development of CaO-based CO 2 looping cycle technology, more attention should be paid to loss of sorbent activity caused by realistic cal- cination conditions and the presence of impurities originating from fuel ash and/or limestone. Ó 2009 Elsevier Ltd. All rights reserved. 1. Introduction Natural calcium-based sorbents, namely limestone and dolo- mite, have been used extensively for SO 2 retention in fluidized bed combustion (FBC) systems [1]. More recently, research indi- cates that CaO-based sorbents are potentially very attractive as sorbents in solid looping cycles for CO 2 capture [2–4]. They have favorable thermodynamic and chemical properties for cyclic CO 2 capture in comparison with those of other metal oxides that might be used for such cycles [5]. Given their natural abundance and relatively low cost, they appear to be suitable for use as solid CO 2 carriers in FBC systems, and the CaO-based process could be commercially competitive with various alternatives [6–8]. One possible scheme is based on a dual FBC reactor, which con- tains both carbonator and calciner [9–11]. The main chemical reac- tion is the reversible exothermic gas–solid reaction, carbonation: CaO ðsÞ þ CO 2ðgÞ ¼ CaCO 3ðsÞ ð1Þ with appropriate conditions based on the equilibrium equation [12]: log 10 P CO2 atm ½ ¼ 7:079 8308 TK ½ ð2Þ The atmospheric pressure version of the technology has carbon- ation occurring in a dedicated vessel, the ‘‘carbonator”, at temper- atures of 650–700 °C. Lower temperatures are impractical because the resulting decrease in reaction rate necessitates excessively long contact of CaO and CO 2 and/or larger amounts of sorbent cir- culating in the carbonator. The reverse reaction, calcination, achieves sorbent regeneration in a ‘‘calciner”. This produces an almost pure stream of CO 2 and for this step the minimum 0016-2361/$ - see front matter Ó 2009 Elsevier Ltd. All rights reserved. doi:10.1016/j.fuel.2009.04.012 * Corresponding author. Tel.: +1 613 996 2868; fax: +1 613 992 9335. E-mail address: [email protected] (E.J. Anthony). Fuel 88 (2009) 1893–1900 Contents lists available at ScienceDirect Fuel journal homepage: www.elsevier.com/locate/fuel
Transcript of Influence of calcination conditions on carrying capacity of CaO-based sorbent in CO2 looping cycles

Fuel 88 (2009) 1893–1900
Contents lists available at ScienceDirect
Fuel
journal homepage: www.elsevier .com/locate / fuel
Influence of calcination conditions on carrying capacity of CaO-basedsorbent in CO2 looping cycles
Vasilije Manovic a, Jean-Pierre Charland a, John Blamey b, Paul S. Fennell b, Dennis Y. Lu a,Edward J. Anthony a,*
a CanmetENERGY, Natural Resources Canada, 1 Haanel Drive, Ottawa, Ontario, Canada K1A 1M1b Department of Chemical Engineering, Imperial College, London SW7 2AZ, United Kingdom
a r t i c l e i n f o
Article history:Received 8 December 2008Received in revised form 30 March 2009Accepted 14 April 2009Available online 3 May 2009
Keywords:CO2 captureCaO looping cycleSinteringDensification
0016-2361/$ - see front matter � 2009 Elsevier Ltd. Adoi:10.1016/j.fuel.2009.04.012
* Corresponding author. Tel.: +1 613 996 2868; faxE-mail address: [email protected] (E.J. Anthon
a b s t r a c t
This study examines the loss of sorbent activity caused by sintering under realistic CO2 capture cycleconditions. The samples tested here included two limestones: Havelock limestone from Canada (NewBrunswick) and a Polish (Upper Silesia) limestone (Katowice). Samples were prepared both in a thermo-gravimetric analyzer (TGA) and a tube furnace (TF). Two calcination conditions were employed: in N2 atlower temperature; and in CO2 at high temperature. The samples obtained were observed with a scan-ning electron microscope (SEM) and surface compositions of the resulting materials were analyzed bythe energy dispersive X-ray (EDX) method. The quantitative influence of calcination conditions wasexamined by nitrogen adsorption/desorption tests, gas displacement pycnometry and powder displace-ment pycnometry; BET surface areas, BJH pore volume distributions, skeletal densities and envelope den-sities were determined. The SEM images showed noticeably larger CaO sub-grains were produced bycalcination in CO2 during numerous cycles than those seen with calcination in nitrogen. The EDX elemen-tal analyses showed a strong influence of impurities on local melting at the sorbent particle surface,which became more pronounced at higher temperature. Results of BET/BJH testing clearly support thesefindings on the effect of calcination/cycling conditions on sorbent morphology. Envelope density mea-surements showed that particles displayed densification upon cycling and that particles calcined underCO2 showed greater densification than those calcined under N2. Interestingly, the Katowice limestone cal-cined/cycled at higher temperature in CO2 showed an increase of activity for cycles involving calcinationunder N2 in the TGA. These results clearly demonstrate that, in future development of CaO-based CO2
looping cycle technology, more attention should be paid to loss of sorbent activity caused by realistic cal-cination conditions and the presence of impurities originating from fuel ash and/or limestone.
� 2009 Elsevier Ltd. All rights reserved.
1. Introduction
Natural calcium-based sorbents, namely limestone and dolo-mite, have been used extensively for SO2 retention in fluidizedbed combustion (FBC) systems [1]. More recently, research indi-cates that CaO-based sorbents are potentially very attractive assorbents in solid looping cycles for CO2 capture [2–4]. They havefavorable thermodynamic and chemical properties for cyclic CO2
capture in comparison with those of other metal oxides that mightbe used for such cycles [5]. Given their natural abundance andrelatively low cost, they appear to be suitable for use as solidCO2 carriers in FBC systems, and the CaO-based process could becommercially competitive with various alternatives [6–8].
ll rights reserved.
: +1 613 992 9335.y).
One possible scheme is based on a dual FBC reactor, which con-tains both carbonator and calciner [9–11]. The main chemical reac-tion is the reversible exothermic gas–solid reaction, carbonation:
CaOðsÞ þ CO2ðgÞ ¼ CaCO3ðsÞ ð1Þ
with appropriate conditions based on the equilibrium equation[12]:
log10PCO2 atm½ � ¼ 7:079� 8308T K½ � ð2Þ
The atmospheric pressure version of the technology has carbon-ation occurring in a dedicated vessel, the ‘‘carbonator”, at temper-atures of 650–700 �C. Lower temperatures are impractical becausethe resulting decrease in reaction rate necessitates excessivelylong contact of CaO and CO2 and/or larger amounts of sorbent cir-culating in the carbonator. The reverse reaction, calcination,achieves sorbent regeneration in a ‘‘calciner”. This produces analmost pure stream of CO2 and for this step the minimum
900
1000
ure
[o C]
100
[%]Carbonation Conditions
Calcination Conditionsa
1894 V. Manovic et al. / Fuel 88 (2009) 1893–1900
equilibrium temperature in the calciner should be �900 �C atatmospheric pressure, though in general a slightly higher averagetemperature of �950 �C would be used to ensure a high reactionrate. This temperature may be decreased by diluting the CO2
stream in the carbonator with gases that may be easily separated,for example steam [13]. A concentrated stream of CO2 is requiredbecause its transport, storage and sequestration in geological for-mations are only economic for concentrated and liquefied CO2
[14–16].Recently, CaO-based CO2 capture technology has been demon-
strated at the small pilot scale [17]; however, some importantchallenges remain. Probably the best investigated problem is lossof sorbent activity with increasing reaction cycles [18–20]. This istypically explained by sorbent sintering and various formulaerelating sorbent conversion with cycle number can be found inthe literature [18,21–23]. Sorbent activity decay strongly influ-ences the efficiency and economics of the overall process [6–8]and it is imperative that this problem be resolved or alleviated.Promising methods published in the literature are steam hydration[24–26] and sorbent doping, in particular by Al2O3 [27,28], andthermal pretreatment of the sorbent [29,30].
Sintering of CaO, which affects sorbent conversion as a functionof reaction cycles, is enhanced by increasing temperature [31–33]and CO2 partial pressure [34,35], as well as by the presence of ionsof impurities in the crystal structure of CaO [31]. This has also beenconfirmed by parametric studies of CO2 capture performance as afunction of numbers of reaction cycles [23,36,37]. However, mostprevious studies on CO2 capture cycles were performed under low-er calcination temperatures than those required to produce a con-centrated CO2 stream. Furthermore, such experiments are oftenperformed under isothermal carbonation/calcination conditions.To enable calcination at lower temperatures, tests are frequentlyconducted under an atmosphere of pure nitrogen or with a nomi-nal 15% CO2 in nitrogen (to simulate flue gas). These simplificationsare usually adopted because performance of the experimentalapparatus, a thermogravimetric analyzer (TGA), for example, doesnot allow rapid temperature changes (such as ones in a dual FBCsystem) to shift carbonation to calcination conditions and vice ver-sa. Recently we showed [38] that calcination under realistic condi-tions led to a much faster loss of sorbent activity than that in thecase of calcination under lower temperatures in nitrogen, as usu-ally investigated.
In this study we examined sorbent morphology changes duringcalcination/carbonation cycling under different conditions and
Table 1XRF Elemental analyses (in oxide form) of limestone samples used.
Component Havelock (HV) Katowice (KT)
SiO2, wt% 1.07 0.85Al2O3, wt% 0.34 0.24Fe2O3, wt% 0.10 0.09TiO2, wt% <0.03 <0.03P2O5, wt% <0.03 <0.03CaO, wt% 51.51 54.10MgO, wt% 3.09 0.89SO3, wt% <0.10 <0.10Na2O, wt% <0.20 <0.20K2O, wt% 0.12 0.06Ba, ppm <250 <250Sr, ppm 259 287V, ppm <50 <50Ni, ppm <50 <50Mn, ppm 52 72Cr, ppm <50 <50Cu, ppm <30 <30Zn, ppm <30 45Loss on fusion, wt% 43.68 43.64Sum, wt% 99.96 99.96
explored their implications on the decay of activity as a functionof reaction cycle number. The morphologies of sorbent obtainedunder different calcination conditions were examined by scanningelectron microscopy (SEM). Elemental compositions at the sorbentparticle surface were analyzed by the energy dispersive X-ray(EDX) method. The influence of calcination conditions on sorbentsurface area, skeletal densities and envelope densities were quan-tified by nitrogen adsorption/desorption measurements (BET andBJH), gas displacement pycnometry and powder displacement pyc-nometry, respectively.
2. Experimental
Havelock limestone (HV), particle size 0.45–1.0 mm, from Can-ada (New Brunswick) and Katowice limestone (KT), particle size0.4–0.8 mm, from Poland (Upper Silesia), were investigated here.The X-ray fluorescence (XRF) elemental analyses of samples inves-tigated are given in Table 1. KT is a relatively pure limestone with98% CaCO3, while HV limestone tends to have more significantdolomitic characteristics, containing 3% MgO.
The samples for SEM and SEM-EDX analyses were calcined in aTGA at 950 �C in 100% CO2 (realistic conditions in a calciner) and at800 �C in 100% N2 (typically investigated laboratory-scale condi-tions). A Perkin Elmer TGA-7 thermogravimetric analyzer was usedfor these experiments to avoid reactive gas (CO2) dilution by pro-tective gas (N2), i.e., to enable calcination in an atmosphere of100% CO2. Another TGA instrument, Mettler Toledo TGA/SDTA851e/LF/1100 �C was used for CO2 cycling of samples pre-pared in a tube furnace (TF) under different conditions. The reac-tive gas flow rates in each TGA apparatus were controlled byflow meters, at a flow rate of 0.04 dm3/min. Calcination/carbon-ation cycles in the TGA were done under isothermal conditionsat 800 �C, calcination in 100% N2 and carbonation in 50% CO2 (N2
balance). The sample masses in the TGA experiments were equiv-alent to �15 mg CaO.
Sample morphology was observed with a Hitachi S3400 SEMwith 20 kV of accelerating voltage under high vacuum. The
600
700
800
0 50 100 150 200 250 300 350Time [min]
Tem
pera
t
0
50 CO
2
TemperatureCO Concentration
1 2 3 4 5 6 7 8 9 10Cycle Number
2
0
50
100
0 50 100 150 200 250 300 350
Time [min]
CO
2 [%
]
600
700
800
900
1000
Tem
pera
ture
[o C]
CO ConcentrationTemperature
2Carbonation Conditions
Calcination Conditions
1 2 3 4 5 6 7 8 9 10Cycle Number
b
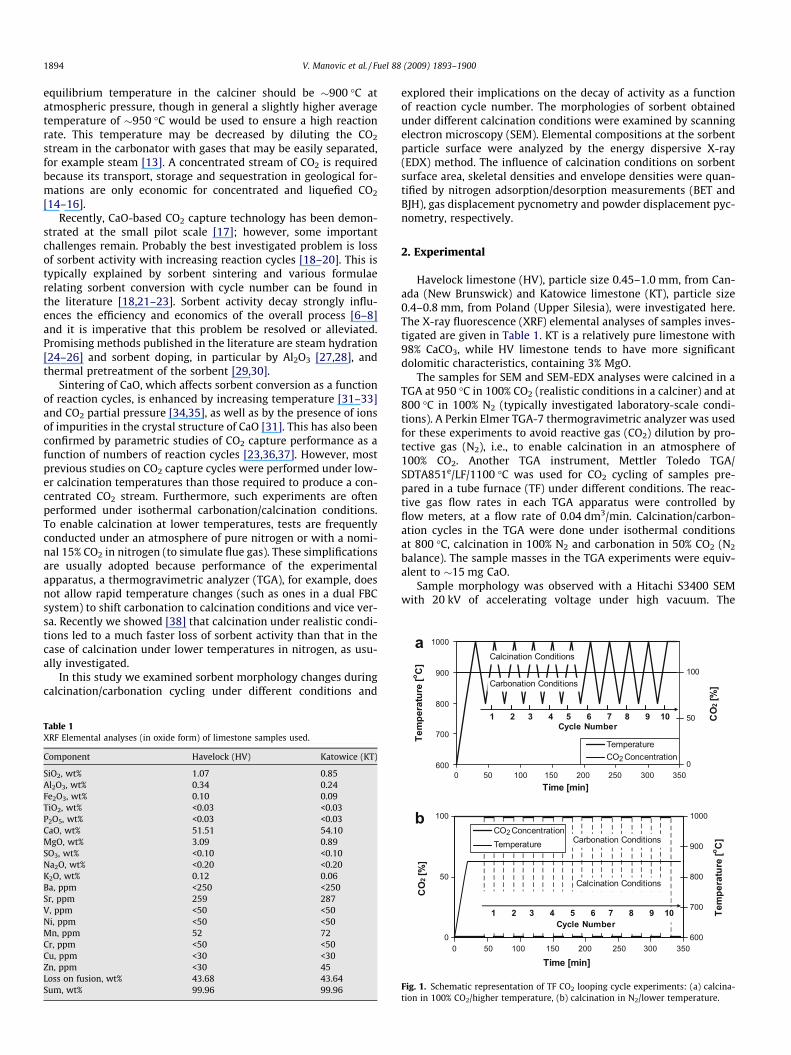
Fig. 1. Schematic representation of TF CO2 looping cycle experiments: (a) calcina-tion in 100% CO2/higher temperature, (b) calcination in N2/lower temperature.

V. Manovic et al. / Fuel 88 (2009) 1893–1900 1895
samples calcined under different conditions were coated with gold/palladium before SEM examination and images obtained by second-ary electrons are presented here. The microscope was equippedwith EDX analyzers, which enabled the determination of elementalcomposition at points of interest on the sample surface.
Larger sample masses necessary for quantification of the influ-ence of calcination conditions during CO2 cycles (BET/BJH tests)were prepared in a TF. In total, eight samples were prepared fromthe two limestones. Two samples from each limestone were ob-tained after ten cycles under two different cycling conditions (cal-cination in 100% CO2/higher temperature, or calcination in 100%N2/lower temperature) and two samples were obtained from eachlimestone after the first calcination under different conditions.
A schematic representation of the CO2 cycling experiments per-formed at higher calcination temperature and CO2 concentration isshown in Fig. 1a. The TF was preheated to 600 �C, and the samplesintroduced. The TF can achieve a heating rate of 200 �C/15 min, i.e.,raising sample temperature to 1000 �C in 30 min of heating. Thecooling rate was the same, 200 �C/15 min, and heating and coolingsteps were repeated ten times. After the eleventh calcination at1000 �C, the tube was flushed with nitrogen to prevent carbonationof the sample during cooling in CO2. During the complete 10-cycleexperiment, samples were continuously flushed with 100% CO2,i.e., the cycling was effected solely by temperature change. Whenthe temperature during heating exceeded 900 �C, calcination com-menced in pure CO2 and did not stop until the next cooling stagewhen the temperature again fell below 900 �C. Carbonation oc-curred in the temperature window 900–800–900 �C and both cal-cination and carbonation were carried out for 15 min.
The CO2 cycles at lower temperature and calcination in nitrogenwere done under isothermal conditions at 850 �C as schematicallypresented in Fig. 1b. After heating and the first calcination, 100%CO2 and 100% N2 were introduced alternately, with a switchoverevery 15 min, for 10 cycles. Here, the reaction cycles wereproduced by changing gas composition.
0102030405060708090
100
0 50 100 150 200 250
Time [min]
Con
vers
ion
[%]
0
200
400
600
800
1000
Tem
pera
ture
[o C]
HV - conversionKT - conversionTemperature
Fig. 2. TGA calcination curves of investigated limestones in 100% CO2 at 925 �C.
0102030405060708090
100
15 20 25 30 35
Time [min]
Con
vers
ion
[%]
0
200
400
600
800
1000
Tem
pera
ture
[o C]
HV - conversionKT - conversionTemperature
Fig. 3. TGA calcination curves of investigated limestones in 100% N2 at 850 �C.
For comparison, two samples were obtained after the first calci-nation under CO2 or N2 atmosphere. For all of these experiments4 g of sample in two ceramic dishes (2 � 2 g) was placed in theTF and the gas flow employed was 0.5 dm3/min.
The samples obtained from TF experiments were submitted tonitrogen adsorption/desorption analysis of pore surface area, withfurther analysis of skeletal and envelope densities. Pore surfaceareas (BET) and pore volume distributions (BJH) were determinedusing a Micromeritics Tristar 3000 N2 sorption analyzer. Skeletaldensity was determined using a Micromeritics AccuPyc 1330 Pyc-nometer, while envelope density was determined using a Microm-eritics GeoPyc 1360 Envelope Density Analyzer. The extent ofcalcination of all samples tested was checked using X-ray diffrac-tion analysis (PANalytical X’Pert Pro Diffractometer), which con-firmed that calcination had proceeded to completion.
Fig. 4. SEM images of HV limestone calcined: (a) at 950 �C in 100% CO2 and (b andc) at 800 �C in 100% N2.
1896 V. Manovic et al. / Fuel 88 (2009) 1893–1900
3. Results and discussion
The samples for SEM-EDX analysis were obtained from thePerkin Elmer TGA-7. Calcination in pure CO2 at 925 �C caused aninteresting difference in the kinetics of decomposition (seeFig. 2). It can be seen that decomposition of both limestonesstarted at �900 �C, with the initial reaction being relatively fast.However, the reaction rate for HV, after the initial 10% of decompo-sition, decreased more markedly such that after 2.5 h there wasstill >10% non-calcined residue. After the temperature increasedto 950 �C the decomposition reaction again became rapid. On theother hand, for KT limestone, the total calcination occurred in<1 h when a temperature of 925 �C was achieved. The need forelevated calcination temperatures to achieve reasonable calcina-tion rates has also been shown in a recent study using a smallfluidized bed reactor [39].
Calcination of these two limestones in nitrogen at 850 �C (pre-sented in Fig. 3) shows quite different behavior than seen inFig. 2. Calcination rates are very similar here and the time neededfor full decomposition differs by only �2 min. Moreover, it is inter-esting that decomposition of HV limestone is slightly faster, whichis the reverse of what was seen for decomposition in CO2. These re-sults clearly indicate that changing calcination conditions have dif-ferent effects for these two limestones. The behavior of limestonesduring their calcination has been widely investigated and a reviewcan be seen in the work of Stanmore and Gilot [3]. It has beenshown that calcination kinetics depend on concentration of sur-rounding gases (CO2, H2O), particle size and limestone propertiesincluding presence of impurities. Different activation energies areobtained for different temperature ranges and limestones (usingdifferent calcination models) starting from zero to �100 kJ/mol.
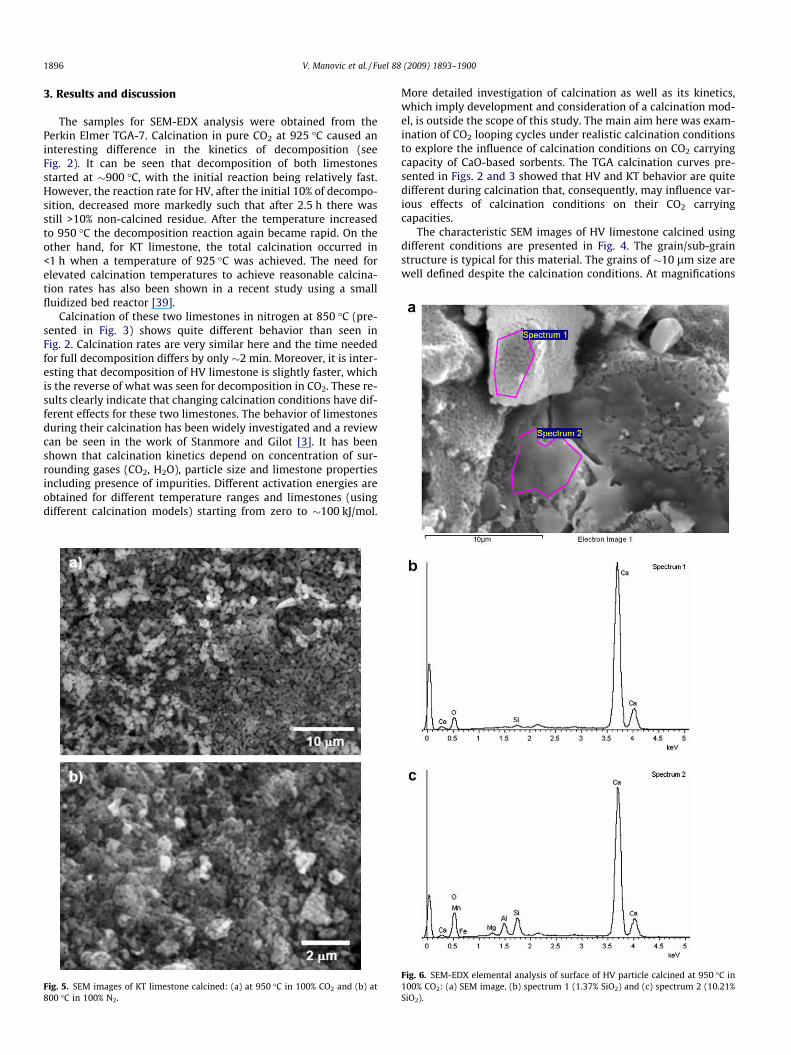
Fig. 5. SEM images of KT limestone calcined: (a) at 950 �C in 100% CO2 and (b) at800 �C in 100% N2.
More detailed investigation of calcination as well as its kinetics,which imply development and consideration of a calcination mod-el, is outside the scope of this study. The main aim here was exam-ination of CO2 looping cycles under realistic calcination conditionsto explore the influence of calcination conditions on CO2 carryingcapacity of CaO-based sorbents. The TGA calcination curves pre-sented in Figs. 2 and 3 showed that HV and KT behavior are quitedifferent during calcination that, consequently, may influence var-ious effects of calcination conditions on their CO2 carryingcapacities.
The characteristic SEM images of HV limestone calcined usingdifferent conditions are presented in Fig. 4. The grain/sub-grainstructure is typical for this material. The grains of �10 lm size arewell defined despite the calcination conditions. At magnifications
Fig. 6. SEM-EDX elemental analysis of surface of HV particle calcined at 950 �C in100% CO2: (a) SEM image, (b) spectrum 1 (1.37% SiO2) and (c) spectrum 2 (10.21%SiO2).

V. Manovic et al. / Fuel 88 (2009) 1893–1900 1897
of the order of several thousands, sub-grains can be seen only inthe sample calcined in CO2. It is expected that the surface morphol-ogy of the sample calcined in CO2 is less developed, because moresintering is expected at higher temperature and calcination in CO2
[31,34,35]. This is confirmed at higher magnifications (Fig. 4c)where very small sub-grains can be seen in the sample calcinedat lower temperature in N2. The differences between SEM imagesin Fig. 4a and c clearly show the influence of calcination conditionson produced lime morphology.
KT limestone has quite different morphology than that of HVand large grains cannot be seen here (Fig. 5). However, clear differ-ences between micro-grains in samples obtained under differentconditions are noticeable, which again confirms the influence ofcalcination conditions on sample morphology. Smaller grains canbe seen in the case where the sample is calcined in N2 at lowertemperature and higher reactivity, as expected.
Elemental SEM-EDX analysis of the surface shows the influenceof chemical composition on particle morphology after cycling. Thisis especially visible in the case of HV limestone. Fig. 6a shows thesurface of an HV particle calcined at 950 �C in 100% CO2. There aretwo different surface morphologies, one with clearly defined CaOgrains (spectrum 1) and another where melting has clearly oc-curred (spectrum 2). Elemental analysis of the surface, presentedin the spectra in Fig. 6b and c show that the melted area containsa significant content of SiO2, 10.21%. On the other hand, the surfacerepresented by grains contains 1.37% SiO2. The influence of impu-rities in CaCO3 on local melting and sintering is in agreement withthe influence of impurities on loss of surface area [31].
Fig. 7 represents the SiO2 content at the surface of differentmorphological areas of the HV sample calcined at 950 �C in 100%CO2. According to the SEM image, the content of SiO2 is lower thanthat needed for noticeable melting. However, there is a correlationbetween SiO2 content and surface morphology. Greater SiO2 con-tent correlates with a smoother appearance, suggesting that thisimpurity unfavorably affects surface area during the calcinationconditions employed for CO2 cycles. This is in agreement withour previous work on the influence of impurities on sorbent activ-ity upon repeated CO2 cycling [36].
SEM-EDX analysis was also carried out on an HV sample cal-cined at lower temperature (800 �C) in 100% N2. The results pre-sented in Fig. 8 are similar to those in Fig. 6 and show that, inthe presence of impurities, melting and change in particle mor-phology can be seen even under these relatively mild conditions.It is expected that, with an increase in temperature and CO2
Fig. 7. SiO2 content (by EDX) at different areas of HV particle calcined at 950 �C in100% CO2.
concentration, melting and change in particle morphology will be-come more pronounced. However, on the basis of SEM and SEM-EDX examinations, it was not possible to clearly quantify thisbehavior since these methods depend on the particle and areaselections during analysis. The use of computer-controlled scan-ning electron microscopy, combined with automated image analy-sis, such as is done in agglomeration studies [40], would increasethe accuracy of this approach.
Another way around this shortcoming, which we employed inthis study, was the use of larger sample masses, calcined and
Fig. 8. SEM-EDX elemental analysis of surface of HV particle calcined at 800 �C in100% N2: (a) SEM image, (b) spectrum 1 (8.63% SiO2), (c) spectrum 2 (0.73% SiO2).

Table 2Results of nitrogen adsorption/desorption tests.
Sample no. Designationa BET surfacearea (m2/g)
BJH cumulativepore volume(cm3/g)
BJH desorptionaverage porediameter (nm)
2 HV-cyc-CO2 2.46 0.016 21.363 HV-cyc-N2 9.87 0.109 34.954 HV-cal-CO2 7.95 0.069 30.385 HV-cal-N2 21.26 0.223 34.887 KT-cyc-CO2 4.48 0.035 24.668 KT-cyc-N2 5.29 0.045 28.909 KT-cal-CO2 3.04 0.010 15.4810 KT-cal-N2 11.65 0.099 31.54
a HV – Havelock limestone, KT – Katowice limestone, cyc – sample after 10cycles, cal – sample after the 1st calcination, CO2 – calcination(s) in 100% CO2 (seeFig. 1a), N2 – calcination(s) in 100% N2 (see Fig. 1b).
0
0.0002
0.0004
0.0006
0.0008
0.001
0.0012
0.0014
1 10 100 1000
Pore Diameter, D [nm]
Pore
Vol
ume,
dV/
dD [c
m3 /g n
m]
KT-cyc-COKT-cyc-NKT-cal-COKT-cal-N
2 2 22
0
0.001
0.002
0.003
0.004
0.005
0.006
0.007
1 10 100 1000
Pore Diameter, D [nm]
Pore
Vol
ume,
dV/
dD [c
m3 /g
nm
]
HV-cyc-COHV-cyc-NHV-cal-COHV-cal-N
2 2 22
a
b
Fig. 9. BJH pore volume distributions of samples calcined/cycled under differentconditions: (a) HV limestone, and (b) KT limestone (same designations as inTable 2).
Table 3Densities of original limestones and calcined samples obtained under different calcination
Sample no. Designationa Skeletal densityb (g/cm3) Speci
1 HV-original 2.77 0.0682 HV-cyc-CO2 3.17 0.2923 HV-cyc-N2 3.22 0.5244 HV-cal-CO2 3.05 0.4775 HV-cal-N2 3.22 0.6166 KT-original 2.78 0.0487 KT-cyc-CO2 3.20 0.3908 KT-cyc-N2 3.06 0.4329 KT-cal-CO2 3.27 0.52810 KT-cal-N2 3.21 0.655
a HV – Havelock limestone, KT – Katowice limestone, original – original limestone, cyc100% CO2 (see Fig. 1a), N2 – calcination(s) in 100% N2 (see Fig. 1b).
b For reference: 3.30 and 2.70 g/cm3 are skeletal densities for pure CaO and CaCO3, re
1898 V. Manovic et al. / Fuel 88 (2009) 1893–1900
cycled under different calcination conditions in a TF, followed byBET/BJH analysis to quantify the influence of calcination conditionson sorbent surface area and consequent activity in successive CO2
cycles. The results of nitrogen adsorption/desorption tests of sam-ples cycled in the TF (see Fig. 1) are presented in Table 2. It can beseen that the largest BET surface areas are those for samples afterthe first calcination in N2, 21.26 and 11.65 m2/g, respectively, forHV and KT. The greatest loss of surface area occurred in the caseof calcination in CO2 at high temperature: to 7.95 and 3.04 m2/g,respectively, for HV and KT. The differences between samplescycled under different calcination conditions also show the unfa-vorable influence of calcination in CO2 at higher temperatures,which is especially pronounced for HV limestone (2.46:9.87). Sim-ilar conclusions can be derived from the BJH cumulative pore vol-ume data in Table 2.
The BJH pore volume distributions, presented in Fig. 9, showtwo peaks, �3 and �30 nm. The influence of calcination/cyclingconditions on small pores (�3 nm) is more pronounced for KT(Fig. 9b). The peak is smaller in the case of calcination in CO2 incomparison with that for N2 as well as in the case of CO2 cycleswhen the calcination steps were performed in N2. This dependencycan also be seen for HV and it is expected, because sintering is en-hanced at higher calcination temperature and CO2 partial pressure[31,34,35]; this is also confirmed by loss of activity along CO2 cy-cles under realistic calcination conditions [38]. Similar analysiscan also be performed for the �30 nm peak, but it should bepointed out that smaller pores influence carbonation conversionswith increasing reaction cycles more than do larger pores [18].
Table 3 shows the results of investigations of the skeletal andenvelope densities of the original limestones and samples obtainedafter cycling. Taking the envelope densities obtained for the origi-nal limestones and a skeletal density of 3.3 g/cm3 for CaO, the ex-pected envelope densities of calcined samples can be estimated at1.33 g/cm3 for HV- and 1.38 g/cm3 for KT-derived samples. It isclear from Table 3 that the densities measured are, in general, a lit-tle lower than these values. This can be explained by consideringhow envelope density is measured, which is by packing a fine pow-der around a sample. If particles are irregular in shape, which onewould expect of calcined limestone, packing efficiency might be re-duced and a lower density than the ‘‘true” envelope density ob-served. However, it is the trends that are most important, not theexact values of this parameter.
Table 3 shows that calcination in N2 leads to an open structurewith a low density and high envelope porosity. Calcination in CO2
yields denser particles. Whether the cycling is conducted in N2 orin CO2, Table 3 shows that significant densification of the particles(by between 10% and 30%) is observed as they are repeatedlyreacted. In fact, even though the measurements are biasedtowards yielding a low density, after cycling the particles have a
/cycling conditions.a
fic pore volume (cm3/g) Porosity (%) Envelope density (g/cm3)
15.90 2.3248.12 1.6562.82 1.2059.23 1.2466.49 1.0811.89 2.4555.51 1.4256.96 1.3263.35 1.2067.79 1.03
– sample after 10 cycles, cal – sample after the 1st calcination, CO2 – calcination(s) in
spectively.
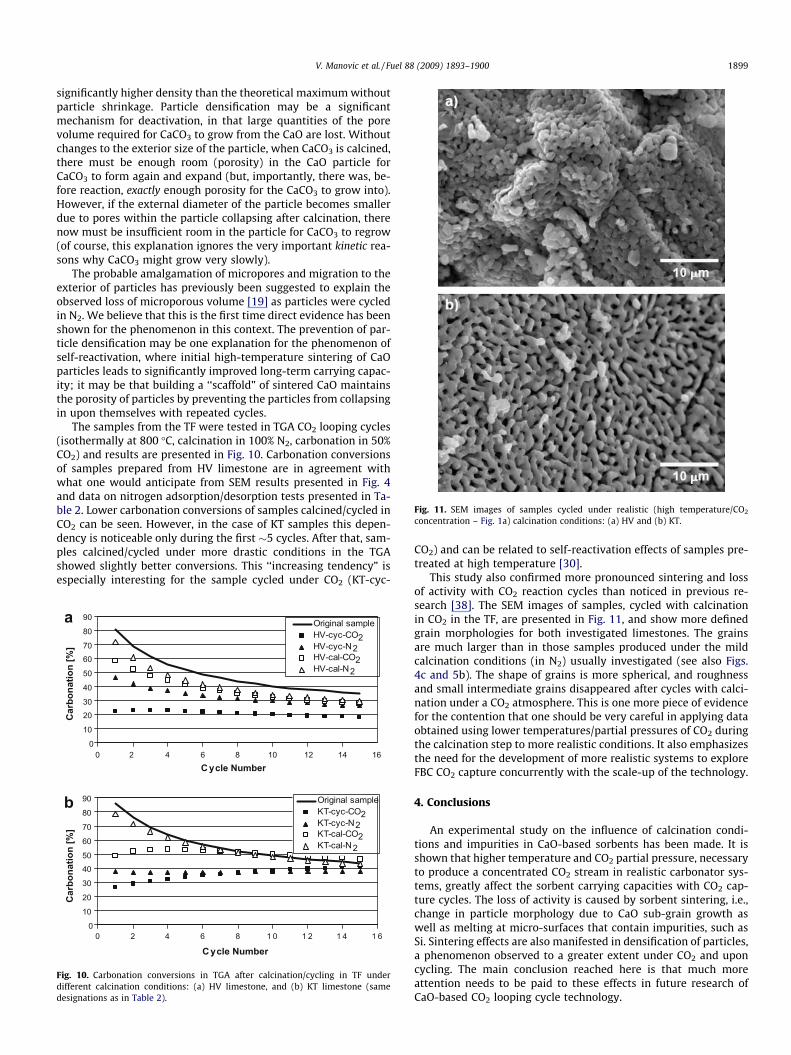
Fig. 11. SEM images of samples cycled under realistic (high temperature/CO2
concentration – Fig. 1a) calcination conditions: (a) HV and (b) KT.
V. Manovic et al. / Fuel 88 (2009) 1893–1900 1899
significantly higher density than the theoretical maximum withoutparticle shrinkage. Particle densification may be a significantmechanism for deactivation, in that large quantities of the porevolume required for CaCO3 to grow from the CaO are lost. Withoutchanges to the exterior size of the particle, when CaCO3 is calcined,there must be enough room (porosity) in the CaO particle forCaCO3 to form again and expand (but, importantly, there was, be-fore reaction, exactly enough porosity for the CaCO3 to grow into).However, if the external diameter of the particle becomes smallerdue to pores within the particle collapsing after calcination, therenow must be insufficient room in the particle for CaCO3 to regrow(of course, this explanation ignores the very important kinetic rea-sons why CaCO3 might grow very slowly).
The probable amalgamation of micropores and migration to theexterior of particles has previously been suggested to explain theobserved loss of microporous volume [19] as particles were cycledin N2. We believe that this is the first time direct evidence has beenshown for the phenomenon in this context. The prevention of par-ticle densification may be one explanation for the phenomenon ofself-reactivation, where initial high-temperature sintering of CaOparticles leads to significantly improved long-term carrying capac-ity; it may be that building a ‘‘scaffold” of sintered CaO maintainsthe porosity of particles by preventing the particles from collapsingin upon themselves with repeated cycles.
The samples from the TF were tested in TGA CO2 looping cycles(isothermally at 800 �C, calcination in 100% N2, carbonation in 50%CO2) and results are presented in Fig. 10. Carbonation conversionsof samples prepared from HV limestone are in agreement withwhat one would anticipate from SEM results presented in Fig. 4and data on nitrogen adsorption/desorption tests presented in Ta-ble 2. Lower carbonation conversions of samples calcined/cycled inCO2 can be seen. However, in the case of KT samples this depen-dency is noticeable only during the first �5 cycles. After that, sam-ples calcined/cycled under more drastic conditions in the TGAshowed slightly better conversions. This ‘‘increasing tendency” isespecially interesting for the sample cycled under CO2 (KT-cyc-
0
10
2030
40
50
6070
80
90
0 2 4 6 8 10 12 14 16C ycle Number
Car
bona
tion
[%]
Original sampleHV-cyc-COHV-cyc-NHV-cal-COHV-cal-N
2 2 22
0
10
20
30
4050
60
70
80
90
0 2 4 6 8 1 0 1 2 1 4 1 6
Cycle Number
Car
bona
tion
[%]
Original sampleKT-cyc-COKT-cyc-NKT-cal-COKT-cal-N
2 2 22
Fig. 10. Carbonation conversions in TGA after calcination/cycling in TF underdifferent calcination conditions: (a) HV limestone, and (b) KT limestone (samedesignations as in Table 2).
CO2) and can be related to self-reactivation effects of samples pre-treated at high temperature [30].
This study also confirmed more pronounced sintering and lossof activity with CO2 reaction cycles than noticed in previous re-search [38]. The SEM images of samples, cycled with calcinationin CO2 in the TF, are presented in Fig. 11, and show more definedgrain morphologies for both investigated limestones. The grainsare much larger than in those samples produced under the mildcalcination conditions (in N2) usually investigated (see also Figs.4c and 5b). The shape of grains is more spherical, and roughnessand small intermediate grains disappeared after cycles with calci-nation under a CO2 atmosphere. This is one more piece of evidencefor the contention that one should be very careful in applying dataobtained using lower temperatures/partial pressures of CO2 duringthe calcination step to more realistic conditions. It also emphasizesthe need for the development of more realistic systems to exploreFBC CO2 capture concurrently with the scale-up of the technology.
4. Conclusions
An experimental study on the influence of calcination condi-tions and impurities in CaO-based sorbents has been made. It isshown that higher temperature and CO2 partial pressure, necessaryto produce a concentrated CO2 stream in realistic carbonator sys-tems, greatly affect the sorbent carrying capacities with CO2 cap-ture cycles. The loss of activity is caused by sorbent sintering, i.e.,change in particle morphology due to CaO sub-grain growth aswell as melting at micro-surfaces that contain impurities, such asSi. Sintering effects are also manifested in densification of particles,a phenomenon observed to a greater extent under CO2 and uponcycling. The main conclusion reached here is that much moreattention needs to be paid to these effects in future research ofCaO-based CO2 looping cycle technology.

1900 V. Manovic et al. / Fuel 88 (2009) 1893–1900
References
[1] Anthony EJ, Granatstein DL. Sulfation phenomena in fluidized bed combustionsystems. Prog Energy Combust Sci 2001;27:215–36.
[2] Anthony EJ. Solid looping cycles: a new technology for coal conversion. Ind EngChem Res 2008;47:1747–54.
[3] Stanmore BR, Gilot P. Review – calcination and carbonation of limestoneduring thermal cycling for CO2 sequestration. Fuel Process Technol2005;86:1707–43.
[4] Florin NH, Harris AT. Enhanced hydrogen production from biomass with in situcarbon dioxide capture using calcium oxide sorbents. Chem Eng Sci2008;63:287–316.
[5] Feng B, An H, Tan E. Screening of CO2 adsorbing materials for zero emissionpower generation systems. Energy Fuel 2007;21:426–34.
[6] Abanades JC, Grasa G, Alonso M, Rodriguez N, Anthony EJ, Romeo LM. Coststructure of a postcombustion CO2 capture system using CaO. Environ SciTechnol 2007;41:5523–7.
[7] MacKenzie A, Granatstein DL, Anthony EJ, Abanades JC. Economics of CO2
capture using the calcium cycle with a pressurized fluidized bed combustor.Energy Fuel 2007;21:920–6.
[8] Abanades JC, Rubin ES, Anthony EJ. Sorbent cost and performance in CO2
capture systems. Ind Eng Chem Res 2004;43:3462–6.[9] Shimizu T, Hirama T, Hosoda H, Kitano K, Inagaki M, Tejima K. A twin fluid-bed
reactor for removal of CO2 from combustion processes. Trans IChemE1999;77(part A):62–8.
[10] Salvador C, Lu D, Anthony EJ, Abanades JC. Enhancement of CaO for CO2
capture in an FBC environment. Chem Eng J 2003;96:187–95.[11] Abanades JC, Anthony EJ, Alvarez D, Lu D, Salvador C. Capture of CO2 from
combustion gases in a fluidized bed of CaO. AIChE J 2004;50:1614–22.[12] Baker EH. The calcium oxide-carbon dioxide system in the pressure range 1–
300 atmospheres. J Chem Soc 1962;70:464–70.[13] Sakadjian BB, Iyer MV, Gupta H, Fan L-S. Kinetics and structural
characterisation of calcium-based sorbents calcined under subatmosphericconditions for the high-temperature CO2 capture process. Ind Eng Chem Res2007;46:35–42.
[14] Herzog H. What future for carbon capture and sequestration? Environ SciTechnol 2001;35:148A–53A.
[15] Metz B, Davidson O, de Coninck H, Loos M, Meyer L, editors. Special report oncarbon dioxide capture and storage. Intergovernmental panel on climatechange. Cambridge University Press; 2005.
[16] Bachu S. CO2 storage in geological media: role, means, status and barriers todeployment. Prog Energy Combust Sci 2008;34:254–73.
[17] Lu DY, Hughes RW, Anthony EJ. Ca-based sorbent looping combustion for CO2
capture in pilot-scale dual fluidized beds. Fuel Process Technol2008;89:1386–95.
[18] Abanades JC, Alvarez D. Conversion limits in the reaction of CO2 with lime.Energy Fuel 2003;17:308–15.
[19] Fennell PS, Pacciani R, Dennis JS, Davidson JF, Hayhurst AN. The effects ofrepeated cycles of calcination and carbonation on a variety of differentlimestones, as measured in a hot fluidized bed of sand. Energy Fuel2007;21:2072–81.
[20] Sun P, Grace JR, Lim CJ, Anthony EJ. The effect of CaO sintering on cyclic CO2
capture in energy systems. AIChE J 2007;53:2432–42.[21] Abanades JC. The maximum capture efficiency of CO2 using a calcination/
carbonation cycle of CaO/CaCO3. Chem Eng J 2002;90:303–6.[22] Wang JS, Anthony EJ. On the decay behavior of the CO2 absorption capacity of
CaO-based sorbents. Ind Eng Chem Res 2005;44:627–9.[23] Grasa GS, Abanades JC. CO2 capture capacity of CaO in long series of
carbonation/calcination cycles. Ind Eng Chem Res 2006;45:8846–51.[24] Manovic V, Anthony EJ. Steam reactivation of spent CaO-based sorbent for
multiple CO2 capture cycles. Environ Sci Technol 2007;41:1420–5.[25] Manovic V, Lu DY, Anthony EJ. Steam hydration of sorbents from a dual
fluidized bed CO2 looping cycle reactor. Fuel 2008;87:3344–52.[26] Fennell PS, Davidson JF, Dennis JS, Hayhurst AN. Regeneration of sintered
limestone sorbents for the sequestration of CO2 from combustion and othersystems. J Energy Inst 2007;80:116–9.
[27] Li ZS, Cai NS, Huang YY, Han HJ. Synthesis, experimental studies, and analysisof a new calcium-based carbon dioxide absorbent. Energy Fuel2005;19:1447–52.
[28] Manovic V, Anthony EJ, Grasa GS, Abanades J. CO2 looping cycle performanceof a high-purity limestone after thermal activation/doping. Energy Fuel2008;22:3258–64.
[29] Lysikov AI, Salanov AN, Okunev AG. Change of CO2 carrying capacity of CaO inisothermal recarbonation–decomposition cycles. Ind Eng Chem Res2007;46:4633–8.
[30] Manovic V, Anthony EJ. Thermal activation of CaO-based sorbent and self-reactivation during CO2 capture looping cycles. Environ Sci Technol2008;42:4170–4.
[31] Borgwardt RH. Sintering of nascent calcium oxide. Chem Eng Sci1989;44:53–60.
[32] Deutsch Y, Heller-Kallai L. Decarbonation and recarbonation of calcites heatedin CO2. Part 1. Effect of the thermal regime. Thermochim Acta1991;182:77–89.
[33] Gonzalez GS, Alonso M, Abanades JC. Modeling of the deactivation of CaO in acarbonate loop at high temperatures of calcination. Ind Eng Chem Res2008;47:9256–62.
[34] Borgwardt RH. Calcination kinetics and surface area of dispersed limestoneparticles. AIChE J 1985;31:103–11.
[35] Mai MC, Edgar TF. Surface area evolution of calcium hydroxide duringcalcination and sintering. AIChE J 1989;35:30–6.
[36] Manovic V, Anthony EJ. Parametric study on the CO2 capture capacity of CaO-based sorbents in looping cycles. Energy Fuel 2008;22:1851–7.
[37] Florin NH, Harris AT. Screening CaO-based sorbents for CO2 capture in biomassgasifiers. Energy Fuel 2008;22:2734–42.
[38] Lu D, Hughes R, Anthony EJ, Manovic V. Sintering and reactivity of CaCO3-based sorbents for in-situ CO2 capture in fluidized beds under realisticcalcination conditions. J Environ Eng, in press.
[39] Wang Y, Lin S, Suzuki Y. Study of limestone calcination with CO2 capture:decomposition behavior in a CO2 atmosphere. Energy Fuel 2008;21:3317–21.
[40] Benson SA, Jones ML, Harb JN. Ash formation and deposition. In: Smoot LD,editor. Fundamentals of coal combustion: for clean and efficient use. Elsevier;1993.