Plateau and Transpulmonary Pressure With Elevated Intra-Abdominal Pressure or Atelectasis
Upload
khangminh22Category
view
4download
0
1
High-Pressure Natural Gas to Syngas Chemical Looping: Thermodynamic Modeling,
Gas-to-Liquid Plant Integration, and Variable Reducer-Combustor Operating Pressure
Thesis
Presented in Partial Fulfillment of the Requirements for the Degree Master of Science in
the Graduate School of The Ohio State University
By
Peter Sandvik
Graduate Program in Chemical Engineering
The Ohio State University
2019
Thesis Committee
Professor Liang-Shih Fan, Advisor
Professor Shang-Tian Yang

2
Copyrighted by
Peter Sandvik
2019

ii
Abstract
Chemical looping technologies can be used as an advanced reforming technology, capable
of efficiently generating syngas to serve as a feedstock in a variety of important chemical
industries. The pressure of the syngas feedstock to downstream chemical synthesis reactors
is an important characteristic that can dictate the products and overall plant economics.
While most chemical synthesis reactors, such as Fischer-Tropsch and methanol synthesis
reactors, operate at high pressures, most chemical looping reforming studies have been
conducted under atmospheric conditions. The high thermodynamic yields from the
atmospheric chemical looping reformer run counter to the high conversion of the
pressurized downstream reactors. Therefore, this study seeks to quantify the impact of the
operating conditions of the chemical looping reformer on the overall system yields.
Specifically, The Ohio State University methane to syngas process is analyzed, which uses
a cocurrent moving bed fuel/reducer reactor and a fluidized bed air/combustor reactor. The
syngas generation results are compared under a variety of operating conditions with the
pressure varied between 1 and 30 atm. Initial studies are compared in an isothermal analysis
to study the effect of variables, independent of operating temperature. The resulting
isothermal analysis is used to guide an adiabatic reactor configuration in an attempt to
develop an autothermal chemical looping system. The gas feedstocks, solid feedstocks,
operating temperature, feedstock preheating conditions, and system pressure are all
analyzed. The results of the autothermal chemical looping system are then integrated into
a ~5000 MWth natural gas to liquid fuels plant, in which a chemical looping reformer
replaces an autothermal reformer reactor. The study shows that operation of the chemical
looping process allows for equivalent syngas yield compared to the autothermal reformer
with a 7-13% reduction in natural gas feedstock. Lastly, a novel operating strategy is
described in which the chemical looping reducer operates at higher pressure and the

iii
chemical looping combustor operates at atmospheric conditions. Such an operating
strategy takes advantage of the air and natural gas feedstock pressures to the chemical
looping system and is able to eliminate a significant amount of compression energy and
equipment. Using the differential operating strategy allows equivalent syngas production
to the baseline with a 7% decrease in natural gas usage and ~200 MWe increase in
electricity production. A capital cost comparison of the equivalent pressure and differential
pressure chemical looping systems indicate a 29% reduction in capital costs when using
the differential pressure chemical looping system.

iv
Dedication
Dedicated to my family and friends
v
Acknowledgments
I would like to express how thankful I am to all those who have helped and impacted
me throughout the process of completing this thesis. I would like to express my gratitude
to my advisor, Dr. Liang-Shih Fan, for investing his time in me from the time I started in
the group as an undergraduate researcher and throughout graduate school. Dr. Fan’s
encouragement to pursue new ideas, publications, and a wide array of projects were
undoubtedly the driving force in all that I was able to accomplish throughout my time in
his lab. I am grateful to all the faculty and staff associated with the CBE program who have
served as great resources and educators. I am especially grateful to Dr. Andrew Tong for
his incredible guidance on so many projects and Dr. S.-T. Yang for serving on my master’s
examination committee.
I am incredibly grateful for the mentorship provided by Dr. Mandar Kathe. I would
undoubtedly be in a very different place in life had he not taken me on as an undergraduate
researcher back in 2016 and taught me what it means to be researcher. I have thoroughly
enjoyed the hundreds of hours we have spent over the years working on various projects
and publications and the countless coffee trips. I also need to thank the many graduate and
undergraduate researchers who have been a part of the process simulations team over the
years and taught me so much including: William Wang, Frank Kong, Abbey Empfield,
Elena Blair, Charlie Fryer, Kate Clelland, Tyler Christenson, and Mike Petrecca.

vi
I am very grateful for the great research team that has been assembled in Dr. Fan’s
lab. I want to thank all of the researchers I had the good fortune of working with in some
form or another, including: Deven Baser, Yaswanth Pottimurthy, Pengfei He, Yitao Zhang,
Sourabh Nadgouda, Mengqing Guo, Dawei Wang, Dikai Xu, Tien-Lin Hsieh, Cheng
Chung, Cody Park, Vedant Shah, Qiaochu Zhang, Qichang Meng, Eric Falascino, and Yu-
Yen Chen.
I am thankful to Ryan Buck and Sean Stacho for being great roommates for so much
of my time at OSU and for being great friends for as long as I can remember. I considered
myself incredibly blessed to have Leah Uhrig as my partner going through this life. Every
day she supports, encourages, challenges, and makes me want to be a better person. I am
also grateful to my dog, Tilly, who always greets me at the door with a tail wag.
Lastly, I would like to thank my parents, Emily and Thor Sandvik, and my sisters,
Linda, Heather, and Haley Sandvik, for being supportive and encouraging all my life.
vii
Vita
August 2013 - May 2017….…. B.S. Chemical Engineering, The Ohio State University
May 2017 to present…………. Graduate Research Associate, The Ohio State University
Publications
Park, A.-H., Zhu, C., Fan, L.-S., & Sandvik, P., “Particle Technology,” In Kirk-Othmer
Encyclopedia of Chemical Technology, Accepted for Publication, (2019).
Sandvik, P., Wang, W., Kathe, M., Kong, F., & Fan, L.-S., “Operating Strategy of
Chemical Looping Systems with Varied Reducer and Combustor Pressures,” Industrial &
Engineering Chemistry Research., Article ASAP, (2019).
Sandvik, P., Kathe, M., Wang, W., Kong, F., & Fan, L.-S. “High-Pressure Chemical
Looping Reforming Processes: System Analysis for Syngas Generation from Natural Gas
and Reducing Tail Gases,” Energy & Fuels 32, 10408-10420 (2018).
Kathe, M., Sandvik, P., Fryer, C., Kong, F., Grigonis, G., & Fan, L.-S. “Coal Refining
Chemical Looping Systems with CO2 as a Co-Feedstock for Chemical Syntheses,” Energy
& Fuels 32, 1139-1154 (2018).
viii
Kathe, M., Fryer, C., Sandvik, P., Kong, F., Zhang, Y., Empfield, A., & Fan, L.-S.
“Modularization strategy for syngas generation in chemical looping methane reforming
systems with CO2 as feedstock,” AIChE J. 63, 3343-3360 (2017).
Kathe, M., Empfield, A., Sandvik, P., Fryer, C., Zhang, Y., Blair, E., & Fan, L.-S.
“Utilization of CO2 as a partial substitute for methane feedstock in chemical looping
methane-steam redox processes for syngas production,” Energy & Environ. Sci. 10, 1345-
1349 (2017).
Fields of Study
Major Field: Chemical Engineering
ix
Table of Contents
Abstract ............................................................................................................................... ii
Dedication .......................................................................................................................... iv
Acknowledgments............................................................................................................... v
Vita .................................................................................................................................... vii
List of Tables ................................................................................................................... xiii
List of Figures .................................................................................................................. xiv
Chapter 1. Background and Motivation .............................................................................. 1
1.1. Traditional Syngas Production ................................................................................. 2
1.1.a. Steam-Methane Reforming ............................................................................... 2
1.1.b. Partial Oxidation ............................................................................................... 3
1.1.c. Auto-Thermal Reforming.................................................................................. 4
1.2 Chemical Looping Technology Platform.................................................................. 5
1.2.a. Chemical Looping Overview ............................................................................ 5
1.3. The Ohio State University Methane to Syngas Process........................................... 7
x
1.3.a. Chemical Looping Reforming........................................................................... 7
1.3.b. Iron-Titanium Particle ....................................................................................... 9
1.3.c. Cocurrent Moving Bed Reducer ..................................................................... 10
1.4 High-Pressure Chemical Looping Reforming ........................................................ 11
1.4.a. High-Pressure Syngas ..................................................................................... 11
1.4.b. Historical High-Pressure Gas-Solid Studies ................................................... 13
1.4.c. High-Pressure OSU MTS Process .................................................................. 14
Chapter 2: Simulation Design and Set-up ......................................................................... 15
2.1. Simulation Basis .................................................................................................... 15
2.1.a. Gas-to-Liquids Plant ....................................................................................... 15
2.1.b. Syngas Evaluation ........................................................................................... 16
2.1.c. Baseline Power Production ............................................................................. 17
2.2. ASPEN Model ....................................................................................................... 19
2.2.a. Reactor Models ............................................................................................... 19
2.2.b. Compressor Models ........................................................................................ 20
2.2.c. Feedstock Condition........................................................................................ 21
2.2.d. Heat Exchangers ............................................................................................. 22
2.2.e. Steam Cycle .................................................................................................... 23
Chapter 3: Chemical Looping Simulations ....................................................................... 25
xi
3.1. Isothermal Simulations .......................................................................................... 25
3.1.a. Effect of Solids Flow ...................................................................................... 25
3.1.b. Steam and CO2 Input ...................................................................................... 33
3.2 Autothermal Simulations ........................................................................................ 35
3.2.a. Solids Support Percentage............................................................................... 37
3.2.b. Solids Inlet Temperature ................................................................................. 39
3.2.c. Methane Conversion with Steam Input ........................................................... 40
3.2.d. Feedstock Preheating ...................................................................................... 42
Chapter 4: Full Plant Simulations ..................................................................................... 46
4.1. 1 atm Chemical Looping System ........................................................................... 46
4.1.a. Syngas Yields of 1 atm Chemical Looping System ........................................ 46
4.1.b. Energy Balance of 1 atm Chemical Looping System ..................................... 47
4.2. 10 atm Chemical Looping System ......................................................................... 48
4.2.a. Syngas Yields of 10 atm Chemical Looping System ...................................... 48
4.2.b. Energy Balance of 10 atm Chemical Looping System ................................... 50
Chapter 5: Differential Pressure Operating Condition ...................................................... 52
5.1. Differential Pressure Modeling and Operation Principles ..................................... 53
5.1.a. Operating Principles ........................................................................................ 53
5.1.b. Modeling ......................................................................................................... 54

xii
5.2. System Impact ........................................................................................................ 55
5.1.a. 10 atm reducer-1 atm combustor chemical looping system yields ................. 55
5.3. Economic Implications .......................................................................................... 56
5.3.a. Compressor Economic Assumptions .............................................................. 57
5.3.b. Full Chemical Looping Module Case Study ................................................... 58
5.3.c. Full Chemical Looping Module Economic Assumptions ............................... 59
5.3.d. Full Chemical Looping Module Costing Results............................................ 59
Chapter 6: Concluding Remarks ....................................................................................... 61
6.1. Effect of Pressure on Chemical Looping Reducer ................................................. 61
6.2. Full Plant Chemical Looping Evaluations ............................................................. 62
6.3. Varied Reducer-Combustor Operating Pressure .................................................... 63
6.4. Future Research ..................................................................................................... 63
Bibliography ..................................................................................................................... 65
xiii
List of Tables
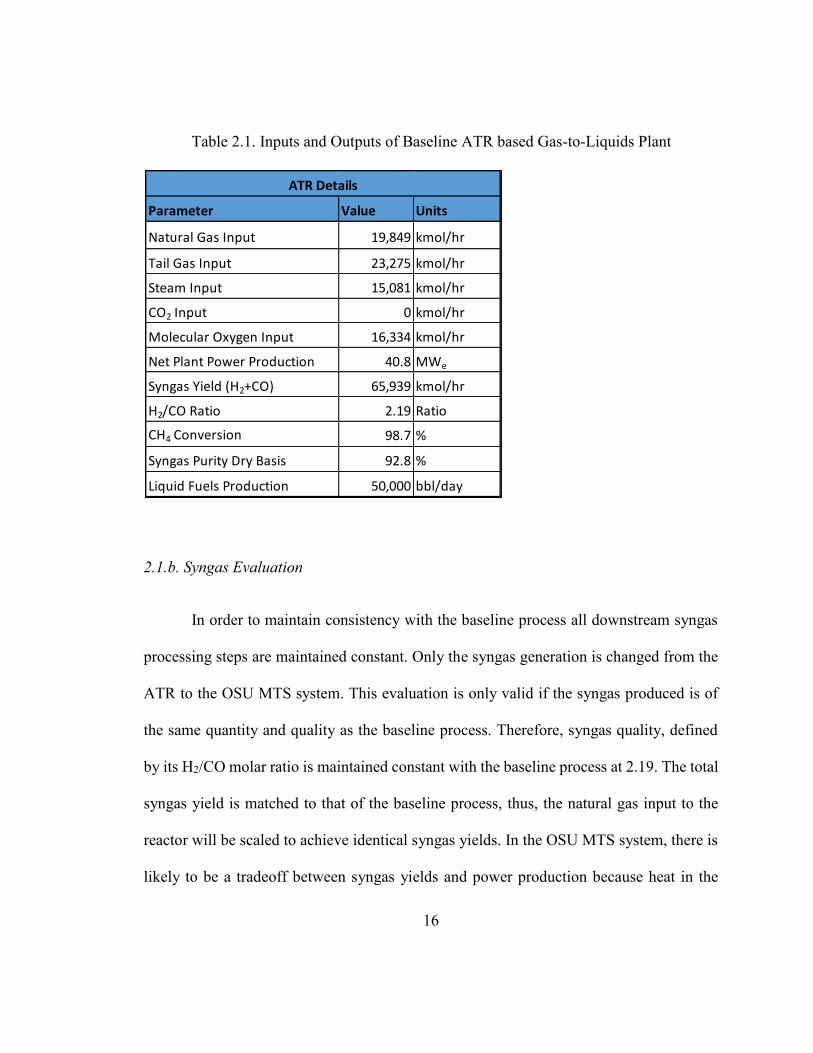
Table 2.1. Inputs and Outputs of Baseline ATR based Gas-to-Liquids Plant .................. 16
Table 2.2. Autothermal reforming gas-to-liquids energy balance .................................... 18
Table 2.3. ASPEN Plus simulation properties and databanks .......................................... 19
Table 2.4. Natural Gas and Tail Gas Composition ........................................................... 22
Table 2.5. Steam cycle information from ATR syngas to liquid fuels plant..................... 23
Table 2.6. Steam cycle information from chemical looping reforming syngas to liquid
fuels plant .......................................................................................................................... 24
Table 4.1. 1 atm Chemical looping reforming operating conditions and syngas yields. .. 47
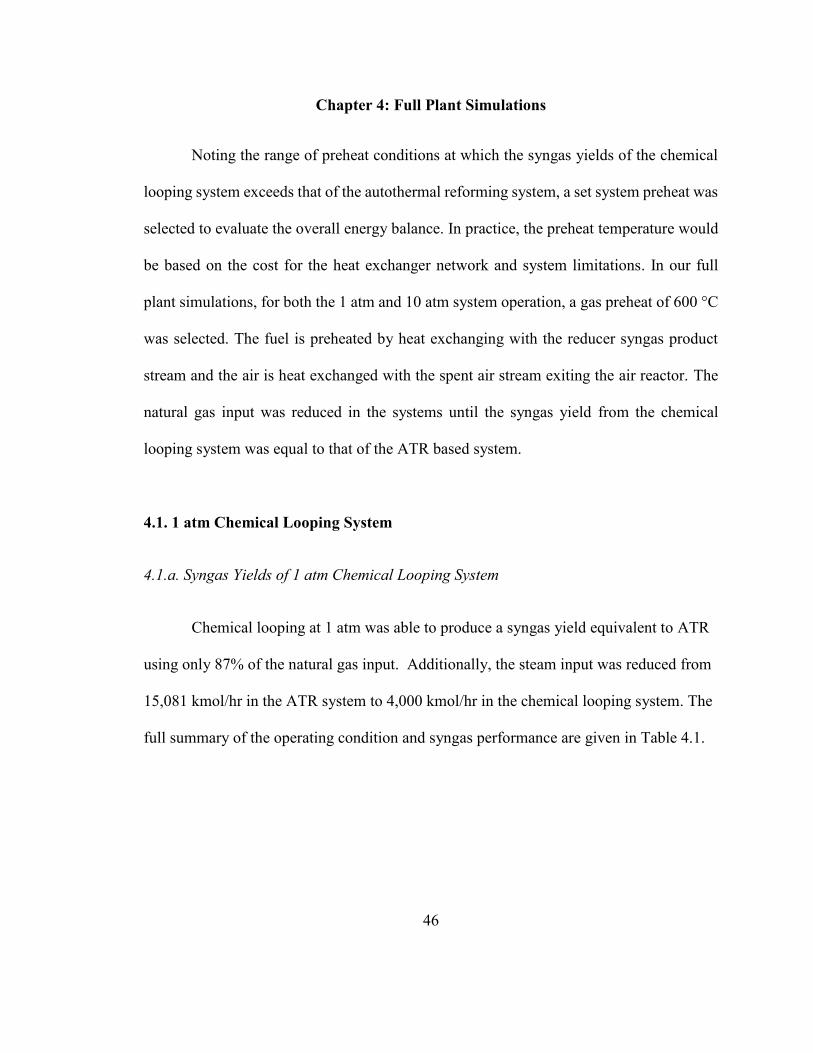
Table 4.2 Full plant energy balance of a 1 atm chemical looping reformer integrated into
a gas to liquids plant ......................................................................................................... 48
Table 4.3. 10 atm Chemical Looping reforming operating conditions and syngas yields.49
Table 4.4. Full plant energy balance of a 10 atm chemical looping reformer integrated
into a gas to liquids plant .................................................................................................. 51
Table 5.1. Full plant energy balance of a 10 atm reducer and 1 atm combustor chemical
looping reformer integrated into a gas to liquids plant ..................................................... 56
xiv
List of Figures
Figure 1.1 Basic schematic of a chemical looping combustion system .............................. 7
Figure 1.2 Syngas Yield vs Fe2O3 Input at 900 °C ........................................................... 10
Figure 3.1. Syngas yield versus Fe2O3 flow at 1 atm and 850 °C-1150 °C ...................... 27
Figure 3.2. Syngas yield versus Fe2O3 flow at 10 atm and 850 °C-1150 °C .................... 28
Figure 3.3. Syngas yield versus Fe2O3 flow at 24 atm and 850 °C-1150 °C .................... 29
Figure 3.4. Syngas yield versus Fe2O3 flow at 30 atm and 850 °C-1150 °C .................... 30
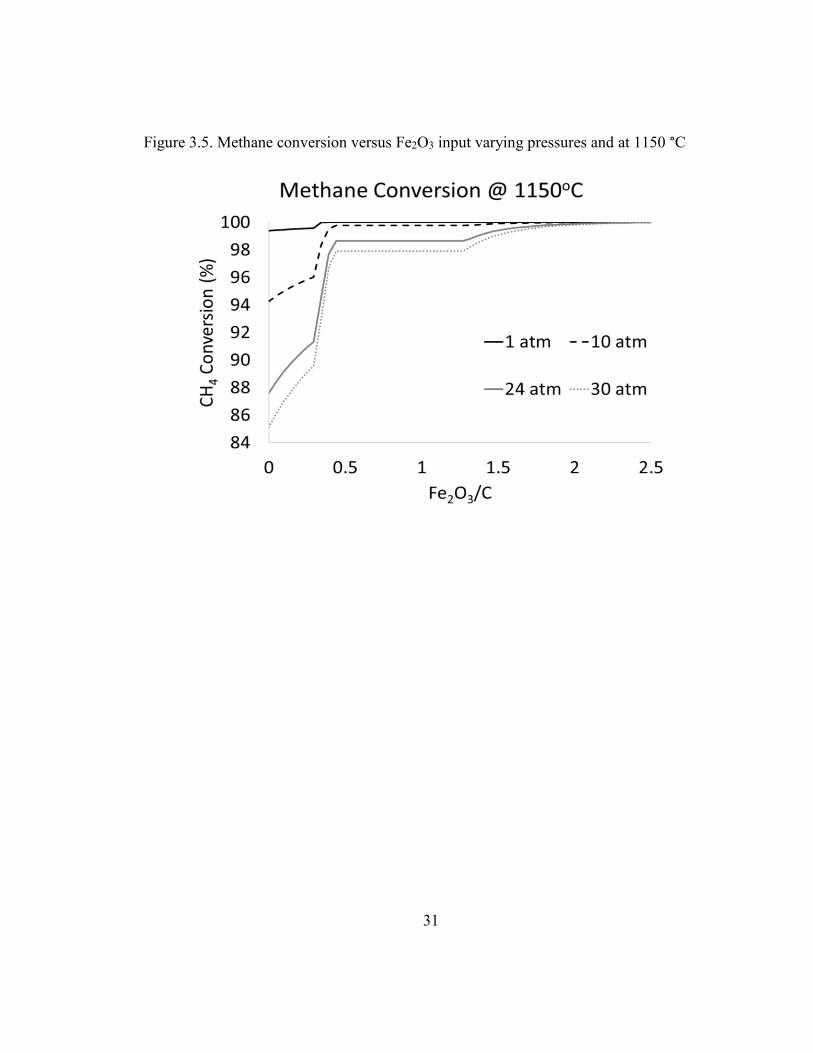
Figure 3.5. Methane conversion versus Fe2O3 input varying pressures and at 1150 °C .. 31
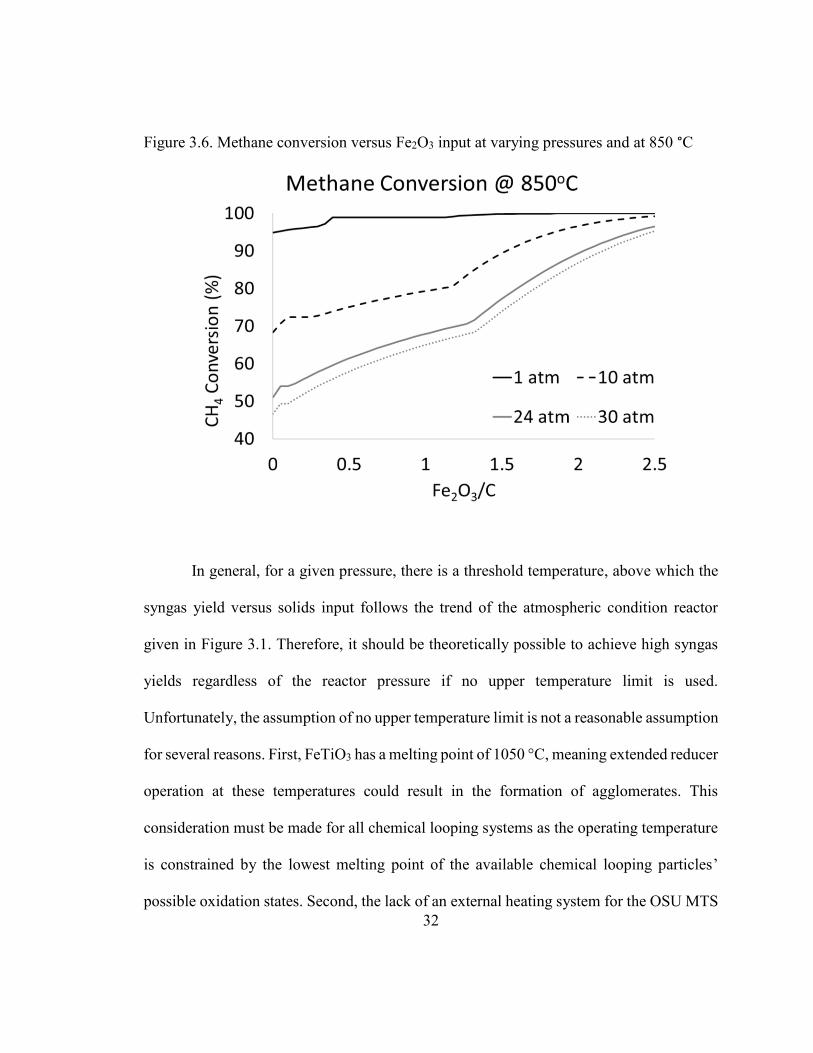
Figure 3.6. Methane conversion versus Fe2O3 input at varying pressures and at 850 °C . 32
Figure 3.7. Total compression energy versus Fe2O3 flow rate for varied pressure system
........................................................................................................................................... 35
Figure 3.8. Positions of solids in chemical looping reactor .............................................. 36
Figure 3.9. Temperature at corresponding reactor position in OSU MTS System ........... 37
Figure 3.10. Syngas Yield vs TiO2 Weight Support Percentage ...................................... 38
Figure 3.11. Syngas yields versus Fe2O3 input as a function of varying solids inlet
temperatures. ..................................................................................................................... 40
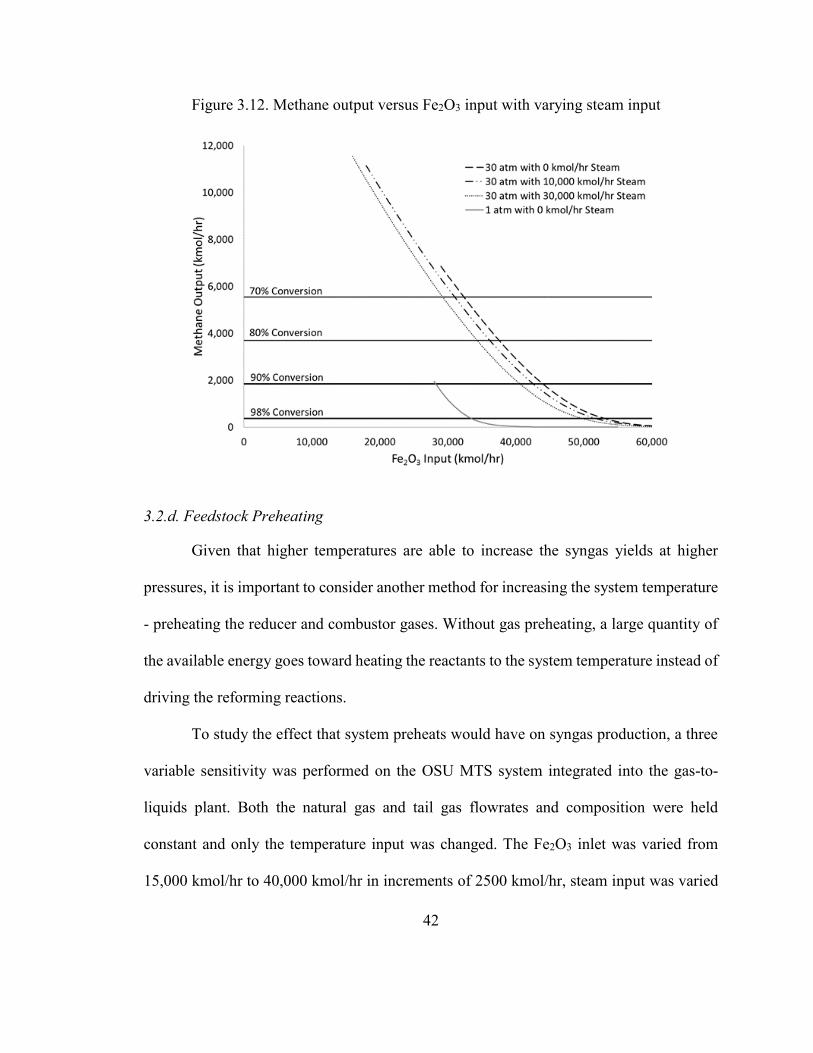
Figure 3.12. Methane output versus Fe2O3 input with varying steam input ..................... 42
Figure 3.13. Maximum syngas yields versus reducer preheat temperatures at 1 atm ...... 44
Figure 3.14. Maximum syngas yields versus reducer preheat temperatures at 10 atm .... 44
Figure 3.15. Maximum syngas yields versus reducer preheat temperatures at 30 atm .... 45
Figure 5.1. Simplified schematic of the differential pressure operating mode. ................ 54
xv
Figure 5.2. Normalized capital cost of compressors for 1 atm, 10 atm, and differential
pressure operation. ............................................................................................................ 58
Figure 5.3. Capital cost breakdown of equal pressure and differential pressure chemical
looping systems, normalized based on the cost of the equal pressure case ...................... 60
1
Chapter 1. Background and Motivation
Reproduced (adapted) with permission from:
[Sandvik, P., Kathe, M., Wang, W., Kong, F., & Fan, L.-S. “High-Pressure Chemical
Looping Reforming Processes: System Analysis for Syngas Generation from Natural Gas
and Reducing Tail Gases,” Energy & Fuels 32, 10408-10420 (2018).].
Copyright 2018 American Chemical Society
[Sandvik, P., Wang, W., Kathe, M., Kong, F., & Fan, L.-S., “Operating Strategy of
Chemical Looping Systems with Varied Reducer and Combustor Pressures,” Industrial &
Engineering Chemistry Research., Article ASAP, 2019.].
Unpublished work copyright 2019 American Chemical Society
Historically, there has been a direct relationship between a countries energy
consumption and its residents well-being1. Increased energy consumption offers citizens
better medical care, increased access to food and water, increased transportation options,
and increased opportunities2,3. As more of the global population seeks to enter into the
developed world, there is a corresponding increase in energy and chemical consumption4,5.
In order to sustain the global thirst for energy and chemicals, it is important to have
2
methods for efficient production of methanol, propylene, diesel, and other chemical
products essential to humans’ daily lives.
Traditionally, conversion of fossil fuels, like natural gas and coal, to chemicals
occurs indirectly through an intermediate known as syngas6–10. Syngas is primarily a
mixture of hydrogen (H2) and carbon monoxide (CO), which serves as the feedstock and
building block for many chemical products. The dominant methods for syngas production
include steam-methane reforming (SMR)11,12, partial oxidation (POX)8,13, and autothermal
reforming (ATR)6,7.
1.1. Traditional Syngas Production
1.1.a. Steam-Methane Reforming
The SMR reaction is a very mature technology and the most widely used in industry
for producing syngas. SMR reacts steam and natural gas in a reactor as shown in Equation
1.112. The reaction occurs at high temperatures, typically between 700-1100 °C, over a
nickel-catalyst with reactors operated at pressures between 3-35 atm6,11,14. The product
syngas can be used directly, however, because the inherent H2/CO ratio of the syngas is
high, more often the syngas is shifted in a water-gas shift reactor and separated in a
pressure-swing adsorber (PSA) to produce pure hydrogen7. In practice SMR requires a
steam to carbon (S/C) input ratio of approximately 3, significantly greater than the
stoichiometric ratio of 112. The higher S/C ratio both increases conversion of natural gas
and suppresses coke formation during the reaction. It does require additional supplemental

3
energy to produce the high temperature steam used in the process which can decrease the
overall process efficiency.
𝐶𝐻4(𝑔) + 𝐻2𝑂(𝑔) → 𝐶𝑂(𝑔) + 3 𝐻2(𝑔) ∆𝐻298 𝐾 = +206 𝑘𝐽 𝑚𝑜𝑙−1 (Equation 1.1)
Despite the mature nature of SMR, various areas of improvement have been
identified. The high S/C ratios used in SMR result in large quantities of unreacted steam
which are heated for injection into the SMR only to be cooled in the syngas drying stages,
ultimately hurting efficiencies11,12,14. The endothermic nature of the steam-methane
reaction requires a portion of the natural gas to be combusted in a supplemental burner to
provide the required reactor heat. As governments and regulatory bodies begin charging
industries for carbon emissions, the supplemental natural gas burner results in two carbon
containing streams, the syngas outlet and the supplemental burner outlet, which would each
require their own CO2 scrubber, significantly increasing the cost for CO2 capture2.
1.1.b. Partial Oxidation
The partial oxidation reaction occurs when natural gas reacts with a less than the
stoichiometric quantity of oxygen, limiting the combustion products to H2 and CO rather
than the full combustion products of H2O and CO2 as shown in Equation 1.29,15. The POX
reaction can be conducted with or without a catalyst and is typically conducted at pressures
between 5-40 atm9. Non-catalytic POX operates at very high temperatures, typically
between 1200-1400 °C16,17. The high temperatures offer the ability to process heavier
hydrocarbons or high sulfur feedstocks that could poison catalysts. Catalytic POX on the
4
other hand, operates at notably lower temperatures, between 700-900 °C9,15,18. Many
catalysts have been explored and used including Nickel, Rhodium, Ruthenium, amongst
others15,18. The addition of the catalyst allows drastically smaller reactor sizes and allows
the POX reactors to scale down in a manner that is often difficult for SMR reactors.
𝐶𝐻4(𝑔) +1
2𝑂2(𝑔) → 𝐶𝑂(𝑔) + 2 𝐻2(𝑔) ∆𝐻298 𝐾 = −38 𝑘𝐽 𝑚𝑜𝑙−1 (Equation 1.2)
POX is an exothermic process that produces a significant amount of heat, allowing
much of the energy in the fuel to be converted to heat rather than syngas product. The
syngas produced via the POX process typically has an H2/CO ratio between ~1.7 and 2,
sufficient for methanol production and Fisher-Tropsch synthesis15,18. One major drawback
to POX is the requirement for pure oxygen, in order to avoid diluting the syngas product
with the nitrogen in air. This requires either purchasing oxygen, which can be a very
significant cost, or using an air separation unit (ASU) which requires large capital
investment and has a large energy requirement7,19.
1.1.c. Auto-Thermal Reforming
ATR mixes natural gas, oxygen, and steam in a single reactor over a catalyst such
that the exothermic reaction of natural gas with oxygen provides the endothermic heat for
steam-methane reforming7. In cases where a specific H2/CO ratio is desired, some quantity
of CO2 may also be added to participate in a dry reforming reaction with the natural gas20.
ATR reactors are typically operated at moderate temperature, between 950-1100 °C, and
5
can operate between 20-35 atm, although pressures up to 100 atm have been reported21,22.
ATR is currently the preferred method for syngas production for chemicals, as it uses less
O2 than POX and a lower S/C than SMR while offering greater control over the H2/CO
ratio6,7,19,21.
However, ATR is not without flaw. Maintaining a flammable gas atmosphere in the
reactor can be difficult as insufficiently mixed pockets of gas can lead to incomplete
reactions23. Catalyst deactivation is another issue that can occur over time due to the high
temperatures and impurities present in the feedstocks7,24. Similar to the POX process, the
requirement of an ASU can significantly add to the capital cost of the system and be a
major energy drain19.
1.2 Chemical Looping Technology Platform
1.2.a. Chemical Looping Overview
Chemical looping is a next generation reactor which separates a primary reaction
into several sub-reactions that occur in separate reactors and are intermediated by metal-
derivative particles that are transported between the reactors25–29. Such a reactor
configuration allows reactor products to be in the gas-solid phase rather than the gas-gas
phase, making for easy gaseous product purification. While the term chemical looping is a
relatively new term, having first been used by Ishida et al in 1987, the concept of using
metal-derivatives to increase efficiencies and minimize process separation has been
investigated in some form or another for more than a century25,27,30.

6
The most commonly understood manifestation of chemical looping is in the
chemical looping combustion process25,29,31,32. In the chemical looping combustion
process, the traditional fossil fuel reaction is broken down into two separate reactors as
shown in Figure 1. In the fuel/reducer reactor, the fossil fuel feedstock reacts with a metal-
oxide particle to produce combustion gases (CO2 and H2O) along with a reduced metal-
oxide particle, shown in Equation 1.331,32. A second reactor, the air/combustor reactor,
regenerates the metal-oxide particle with gaseous oxygen from air, shown in Equation 1.4.
The overall net reaction is the same as traditional combustion, however, by separating the
reaction into different reactors, there is inherent gas separation. Because the reducer
product is without nitrogen pollution that occurs in traditional combustion, CO2 can easily
be captured without additional separation steps. In light of the well-known issues related
to anthropogenic CO2 emissions, chemical looping combustion is seen as one of the most
promising and cost effective methods for point source carbon capture, utilization, and
sequestration33,34.
𝐶𝑦𝐻𝑧(𝑔) + 𝑀𝑂𝑥(𝑠) → 𝑦 𝐶𝑂2(𝑔) +𝑧
2 𝐻2𝑂(𝑔) + 𝑀𝑂𝑥−𝛿(𝑠) (Equation 1.3)
𝐴𝑖𝑟 + 𝑀𝑂𝑥−𝛿(𝑠) → 𝑂2 𝑑𝑒𝑝𝑙𝑒𝑡𝑒𝑑 𝑎𝑖𝑟 + 𝑀𝑂𝑥(𝑠) (Equation 1.4)

7
Figure 1.1 Basic schematic of a chemical looping combustion system
The potential for reducing and eliminating many of the process separation
equipment and steps has invited many additional configurations of chemical looping
systems. These systems include methods for power production from coal, natural gas,
biomass, waste, and many other carbonaceous fuels, along with systems designed for
chemical production from both carbon feedstocks and renewable energy sources including,
ammonia and hydrogen producing systems, amongst others27,35–42.
1.3. The Ohio State University Methane to Syngas Process
1.3.a. Chemical Looping Reforming
One application of the chemical looping technology that has become increasingly
popular in the last decade is chemical looping as a natural gas reforming technology27. In
chemical looping reforming, natural gas is initially partially oxidized in the reducer reactor
8
to produce syngas43,44. This reaction is endothermic, however, unlike SMR, it does not
require an external heat source as the metal-oxide particles are able to function as heat
carriers and provide the endothermic heat of reaction. The reducer reactor equation is given
in Equation 1.5, using methane as a simplification of natural gas37,38. The second reactor,
the combustor reactor, regenerates the metal-oxide particles with oxygen from air and is
exothermic as shown in Equation 1.6. The inherent separation of the air and fuel inputs
allows for a high purity syngas product without the need for the ASU that is required for
POX and ATR27. The co-feeding of CO2 and H2O can also be used to produce a highly
flexible H2/CO ratio, capable of eliminating the need for a downstream water-gas shift
reactor in most cases45. The process intensification associated with eliminating the air-
separation unit, shift reactor, and supplemental burner as a heat source have made chemical
looping reforming a promising alternative to the conventional reforming technologies.
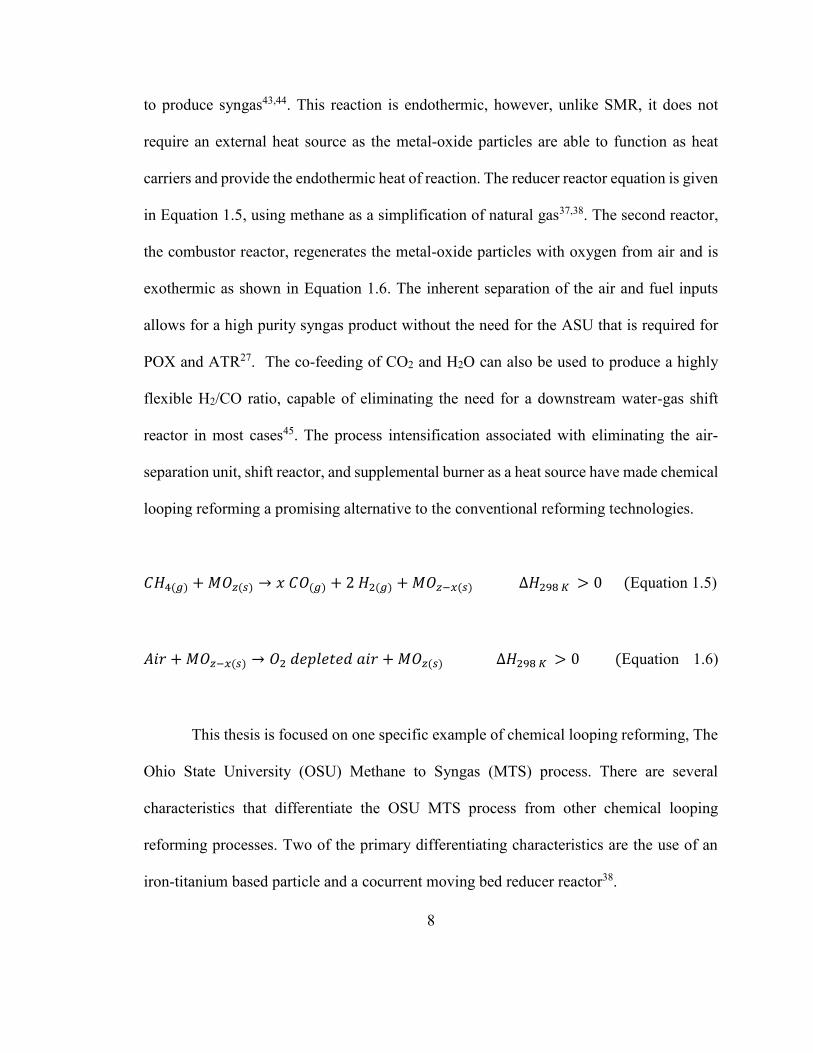
𝐶𝐻4(𝑔) + 𝑀𝑂𝑧(𝑠) → 𝑥 𝐶𝑂(𝑔) + 2 𝐻2(𝑔) + 𝑀𝑂𝑧−𝑥(𝑠) ∆𝐻298 𝐾 > 0 (Equation 1.5)
𝐴𝑖𝑟 + 𝑀𝑂𝑧−𝑥(𝑠) → 𝑂2 𝑑𝑒𝑝𝑙𝑒𝑡𝑒𝑑 𝑎𝑖𝑟 + 𝑀𝑂𝑧(𝑠) ∆𝐻298 𝐾 > 0 (Equation 1.6)
This thesis is focused on one specific example of chemical looping reforming, The
Ohio State University (OSU) Methane to Syngas (MTS) process. There are several
characteristics that differentiate the OSU MTS process from other chemical looping
reforming processes. Two of the primary differentiating characteristics are the use of an
iron-titanium based particle and a cocurrent moving bed reducer reactor38.
9
1.3.b. Iron-Titanium Particle
In order for chemical looping particles to be feasible in industrial applications, they
must meet certain prerequisites along with several additional desirable parameters. The
particle should offer fast reaction kinetics in both the reducer reactor and the combustor
reactor and be able to sustain that reactivity for months to years of operation. They need to
be durable and have a sufficiently high melting point to resist particle abrasion,
fragmentation, or melting27. The materials used in particles should be low cost and the
particles synthesis techniques should be inexpensive and easy to scale-up. The quantity of
particles used in chemical looping is significantly greater than in catalyst based processes
and therefore the chemical looping particles need to be significantly cheaper than
reforming catalysts. Lastly, the particles should not pose any major human health or
environmental hazards27. Due to the large quantities of particles used, some amount of
particles will have to be disposed of, therefore toxic materials should be avoided.
The iron-titanium composite metal-oxide (ITCMO) based particle developed at
OSU meets all of the aforementioned requirements46. The existence of four oxidation
states, Fe2O3/Fe3O4/FeTiO3/Fe, allows for a wide range of operating condition under which
near maximal syngas is produced27,38. As the oxygen to reactive carbon in natural gas
([O]/Cin) is increased, the particle exhibits a thermodynamic preference for excess oxygen
to remain in the FeTiO3 state rather than react with the syngas to form full combustion
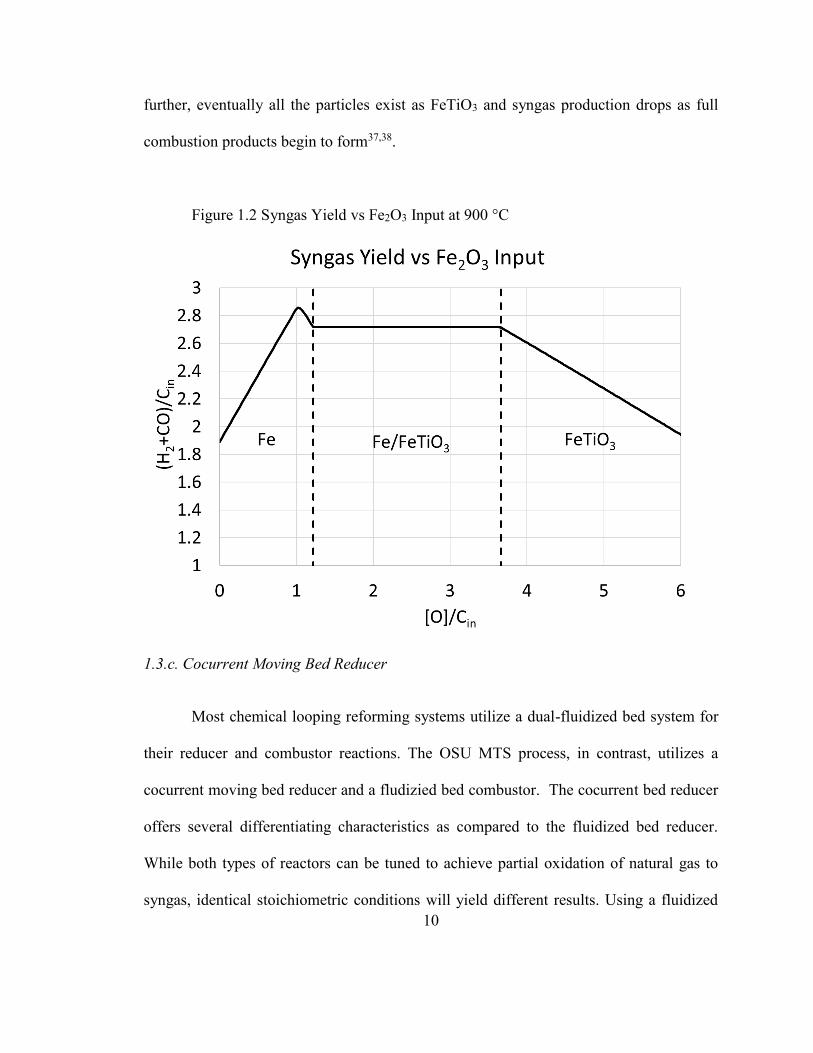
products. This preference is shown in Figure 2, where the flat portion corresponds to high
syngas yield and the metal-oxide in the FeTiO3/Fe state. As the [O]/Cin ratio is increased
10
further, eventually all the particles exist as FeTiO3 and syngas production drops as full
combustion products begin to form37,38.
Figure 1.2 Syngas Yield vs Fe2O3 Input at 900 °C
1.3.c. Cocurrent Moving Bed Reducer
Most chemical looping reforming systems utilize a dual-fluidized bed system for
their reducer and combustor reactions. The OSU MTS process, in contrast, utilizes a
cocurrent moving bed reducer and a fludizied bed combustor. The cocurrent bed reducer
offers several differentiating characteristics as compared to the fluidized bed reducer.
While both types of reactors can be tuned to achieve partial oxidation of natural gas to
syngas, identical stoichiometric conditions will yield different results. Using a fluidized
11
bed results in a varied residence time for solid particles and therefore mixed solid oxidation
states at the reducer outlet. Additionally, fluidized bed reactors result in bubble formation
which can allow some natural gas feedstock to pass through unreacted.
The cocurrent moving bed reducer by contrast, has a singular and constant solids
residence time25,27,38. This allows the outlet of the gas and solid products to be well
controlled. Several experimental demonstrations of the cocurrent moving bed reducer have
shown that given a sufficient reducer length, the cocurrent moving bed is able to produce
a product consistent with thermodynamic yields. Therefore, operating conditions can be
tuned to achieve their thermodynamic maximum.
1.4 High-Pressure Chemical Looping Reforming
1.4.a. High-Pressure Syngas
Traditionally, chemical looping reforming studies have been conducted at near
atmospheric conditions. This is because operating at elevated pressures can decrease the
thermodynamic yields of chemical looping reforming as a result of the inherent volume
expansion that occurs during the chemical looping reforming reaction. Stoichiometric
analysis of Equation 1.5 indicates one mole of methane can become three moles of syngas,
however, in accordance with Le Chatelier’s principle, increasing the reaction pressure
drives the equilibrium condition toward the reactants47. Therefore, it is easiest to achieve
high thermodynamic yields when chemical looping reforming is operated at atmospheric
conditions.

12
In the context of an overall chemical plant, operating at atmospheric conditions is
likely not the preferred operating condition. This is because many of the downstream
processes for converting syngas to chemicals operate at elevated pressures. For example,
Fischer-Tropsch synthesis, designed for converting syngas to liquid fuels, is typically
operated at pressures between 10 and 35 atm48–51. Methanol synthesis is often operated at
pressures between 40 and 100 atm19,48,52–54. Therefore, numerous compressors are required
to prepare the atmospheric syngas exiting the chemical looping reducer for input into a
Fisher-Tropsch or methanol synthesis reactor. This can reduce the efficiency of the
processes and increase capital costs.
Before operating a chemical looping system at pressure, it is important to have an
understanding of how pressure impacts the chemical looping system. Ideally, the chemical
looping reforming process would require little compression of feedstocks and products.
The OSU MTS process has two gaseous feedstocks available at drastically different
pressures51. Natural gas is typically available via pipeline at pressures around 30 atm for
input to the reducer reactor. Air is available from the atmosphere. In order to maximize the
performance of the chemical looping reforming process, a system operation must be
determined that considers the high pressure feedstock and syngas requirement from the
reducer reactor, along with the thermodynamic performance of the reducer reactor and the
atmospheric availability of air for the combustor reactor.

13
1.4.b. Historical High-Pressure Gas-Solid Studies
There are a few examples of attempts to scale-up high-pressure gas-solid systems,
sharing some overlapping characteristics to the OSU MTS. In the 1960’s and 1970’s, the
Institute of Gas Technology developed the HYGAS process. This process used coal derived
syngas to reduce iron-oxide particles. The iron-oxide particles were regenerated with steam
to produce a stream of pure H2. The HYGAS process was operated at pressures greater
than 70 atm. The HYGAS was eventually not able to compete with SMR as a method for
hydrogen production55,56.
More recently, OSU demonstrated a 250 kWth three-reactor syngas chemical
looping (SCL) process for hydrogen production at the National Carbon Capture Center
(NCCC). The pilot sized reactor was operated at 10 atm and consisted of counter-current
reducer and oxidizer reactors and a fluidized bed combustor reactor. The reducer reactor
processed coal derived syngas to produce a reduced metal-oxide particle and capture ready
CO2. The reducer metal-oxide particle was then partially regenerated in the oxidizer reactor
to produce a pure hydrogen product. Finally, the metal-oxide particle was fully regenerated
in the combustor reactor with air42.
A separate study on the reaction kinetics of iron-based chemical looping particles
published by Fan et al, in 2015, indicated that increasing the reaction pressure under a
constant gas-hourly space velocity in thermo-gravimetric analyzer experiments led to faster
kinetics. This indicated greater pressures could lead to faster kinetics in chemical looping
systems and could result in a small reducer reactor57.
14
1.4.c. High-Pressure OSU MTS Process
While much reporting has been conducted on chemical looping reforming at
atmospheric conditions, little has been research has been conducted related to chemical
looping reforming at elevated pressures. This study seeks to use ASPEN Plus software to
conduct a thorough evaluation of the OSU MTS process for syngas generation from natural
gas. Further, the study seeks to integrate the OSU MTS process into a cobalt-based Fischer-
Tropsch gas-to-liquids plant51. The trade-offs between energy consumption and syngas
yields will be discussed over a range of operating pressure and temperatures for the process.
Process variables to be evaluated will include the metal-oxide flow rates, feedstock
preheating temperatures, steam input, CO2 input, inert-solids support percentage, amongst
others. Lastly, a novel operating strategy for the OSU MTS process will be described and
evaluated which is capable of operating at differing pressures between the reducer and
combustor reactors.
15
Chapter 2: Simulation Design and Set-up
2.1. Simulation Basis
2.1.a. Gas-to-Liquids Plant
The advantages of operating a chemical looping system at elevated pressures must
be evaluated within the context of an entire chemical production process and compared to
what is achievable via conventional processes. For the purpose of this study, the OSU MTS
system is integrated into a 50,000 barrel per day natural gas to liquid fuels plant. The report,
published by the Department of Energy (DOE) and National Energy Technology Lab
(NETL) titled “Analysis of Natural Gas-to Liquid Transportation Fuels via Fischer-
Tropsch,” is used as a baseline report on which to compare the chemical looping system.
The baseline report uses an ATR to convert natural gas, steam, and a downstream
tail gas into syngas. The syngas is then reacted in a Fischer-Tropsch reactor and the CO2 is
scrubbed from the products followed by a product separation and hydrogenation step to
give the desired liquid fuel products. A steam cycle is used to recover excess heat from the
system and generate electricity. A summary of the main inputs and output to the ATR
system is given in Table 2.1. The syngas dry purity can be calculated by Equation 2.1.
Syngas Purity Dry Basis = (H2+CO)
(H2+CO+CO2+CH4)× 100 (Equation 2.1)
16
Table 2.1. Inputs and Outputs of Baseline ATR based Gas-to-Liquids Plant
2.1.b. Syngas Evaluation
In order to maintain consistency with the baseline process all downstream syngas
processing steps are maintained constant. Only the syngas generation is changed from the
ATR to the OSU MTS system. This evaluation is only valid if the syngas produced is of
the same quantity and quality as the baseline process. Therefore, syngas quality, defined
by its H2/CO molar ratio is maintained constant with the baseline process at 2.19. The total
syngas yield is matched to that of the baseline process, thus, the natural gas input to the
reactor will be scaled to achieve identical syngas yields. In the OSU MTS system, there is
likely to be a tradeoff between syngas yields and power production because heat in the
Parameter Value Units
Natural Gas Input 19,849 kmol/hr
Tail Gas Input 23,275 kmol/hr
Steam Input 15,081 kmol/hr
CO2 Input 0 kmol/hr
Molecular Oxygen Input 16,334 kmol/hr
Net Plant Power Production 40.8 MWe
Syngas Yield (H2+CO) 65,939 kmol/hr
H2/CO Ratio 2.19 Ratio
CH4 Conversion 98.7 %
Syngas Purity Dry Basis 92.8 %
Liquid Fuels Production 50,000 bbl/day
ATR Details
17
system can either be used to drive chemical reactions or for electrical power. Chemicals
are generally viewed as high value products relative to power and therefore the target will
be to maximize syngas yields relative to natural gas inputs so long as the plant does not
require additional electrical power from the grid.
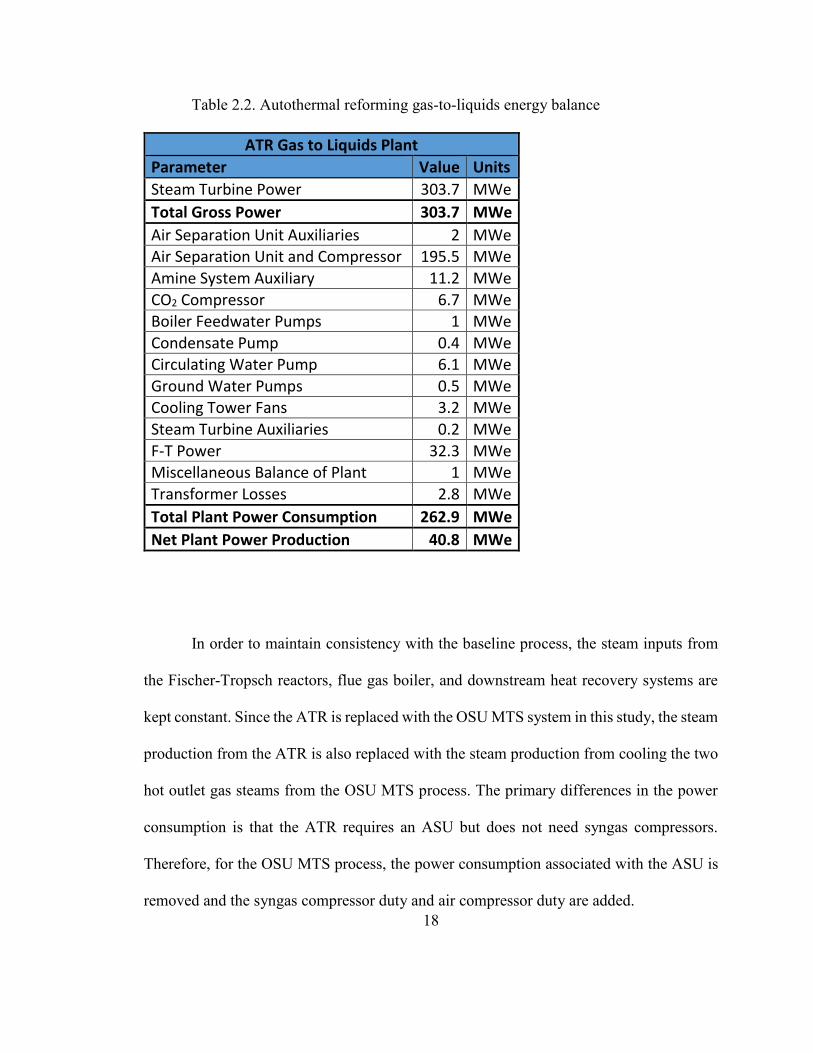
2.1.c. Baseline Power Production
The baseline report generates power from several different steam generating units
including the ATR, Fischer-Tropsch reactors, a flue gas boiler, and several additional
downstream heat recovery systems. In total the baseline produces 303.7 MWe of power.
Various auxiliary equipment consumes 262.9 MWe of the available power, leaving the
plant with a net export of 40.8 MWe. A full breakdown of the baseline power consumption
is given in Table 2.2.
18
Table 2.2. Autothermal reforming gas-to-liquids energy balance
In order to maintain consistency with the baseline process, the steam inputs from
the Fischer-Tropsch reactors, flue gas boiler, and downstream heat recovery systems are
kept constant. Since the ATR is replaced with the OSU MTS system in this study, the steam
production from the ATR is also replaced with the steam production from cooling the two
hot outlet gas steams from the OSU MTS process. The primary differences in the power
consumption is that the ATR requires an ASU but does not need syngas compressors.
Therefore, for the OSU MTS process, the power consumption associated with the ASU is
removed and the syngas compressor duty and air compressor duty are added.
ATR Gas to Liquids Plant
Parameter Value Units
Steam Turbine Power 303.7 MWe
Total Gross Power 303.7 MWe
Air Separation Unit Auxiliaries 2 MWe Air Separation Unit and Compressor 195.5 MWe
Amine System Auxiliary 11.2 MWe
CO2 Compressor 6.7 MWe Boiler Feedwater Pumps 1 MWe
Condensate Pump 0.4 MWe Circulating Water Pump 6.1 MWe
Ground Water Pumps 0.5 MWe Cooling Tower Fans 3.2 MWe
Steam Turbine Auxiliaries 0.2 MWe
F-T Power 32.3 MWe Miscellaneous Balance of Plant 1 MWe
Transformer Losses 2.8 MWe
Total Plant Power Consumption 262.9 MWe
Net Plant Power Production 40.8 MWe
19
2.2. ASPEN Model
2.2.a. Reactor Models
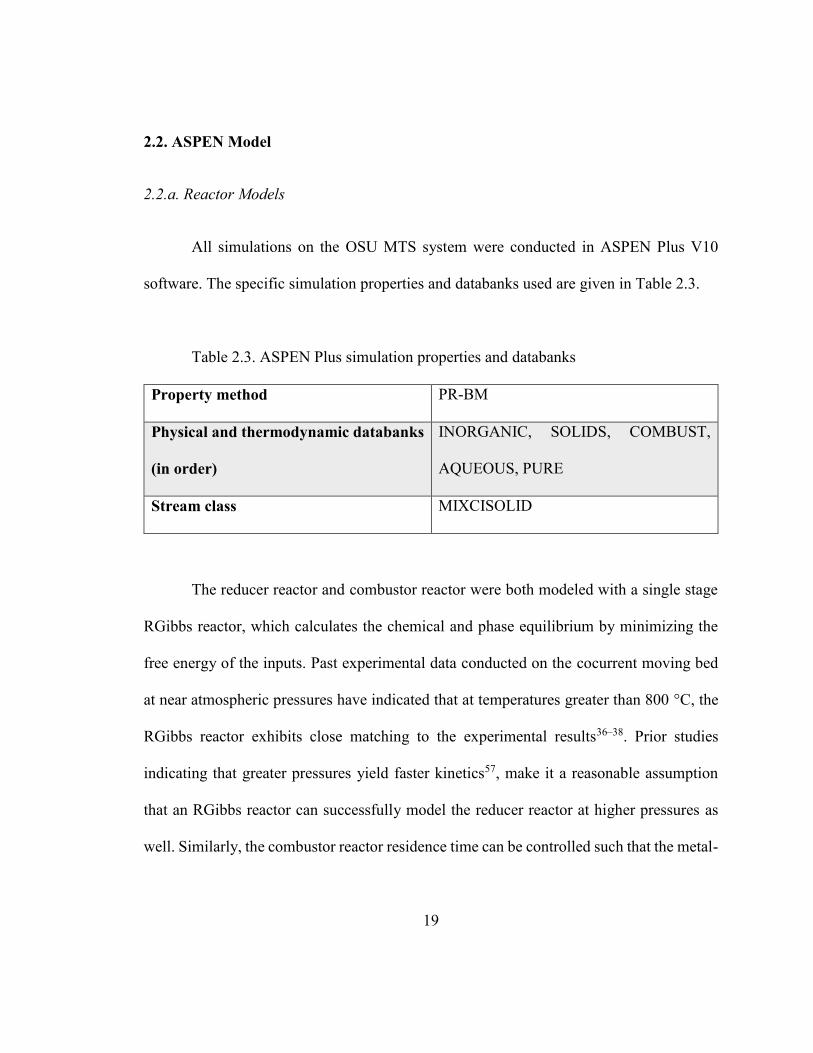
All simulations on the OSU MTS system were conducted in ASPEN Plus V10
software. The specific simulation properties and databanks used are given in Table 2.3.
Table 2.3. ASPEN Plus simulation properties and databanks
Property method PR-BM
Physical and thermodynamic databanks
(in order)
INORGANIC, SOLIDS, COMBUST,
AQUEOUS, PURE
Stream class MIXCISOLID
The reducer reactor and combustor reactor were both modeled with a single stage
RGibbs reactor, which calculates the chemical and phase equilibrium by minimizing the
free energy of the inputs. Past experimental data conducted on the cocurrent moving bed
at near atmospheric pressures have indicated that at temperatures greater than 800 °C, the
RGibbs reactor exhibits close matching to the experimental results36–38. Prior studies
indicating that greater pressures yield faster kinetics57, make it a reasonable assumption
that an RGibbs reactor can successfully model the reducer reactor at higher pressures as
well. Similarly, the combustor reactor residence time can be controlled such that the metal-
20
oxide particles are fully oxidized, given sufficient temperatures and air input. Therefore, a
single RGibbs reactor is also used to model the combustor reactor.
Throughout the process of evaluating the OSU MTS system at varying pressures, a
combination of isothermal and adiabatic analyses were used. The Gibbs free energy
minimization is always conducted with two of the following three variables specified:
pressure, temperature, and heat duty. In this study the pressure was the control variable,
meaning the system was always set as isobaric. Isothermal analyses were conducted by
setting the system temperature. The isothermal studies were conducted to isolate the impact
of individual variables, regardless of temperature. The overall chemical looping system is
designed to be autothermal, where the heat from the exothermic combustor reaction is used
to drive the endothermic reducer reaction. In order to model the autothermal system, the
net duty was set to zero for both the reducer and combustor, simulating an adiabatic reactor.
2.2.b. Compressor Models
In order to be integrated into the gas-to-liquids system, the syngas must be
compressed from the reducer outlet pressure to the required downstream pressure of 30
atm. If the system is operated at elevated pressures, the air must be compressed from
atmospheric conditions to the system pressure. The optimization tool in ASPEN was set to
minimize the total compression energy required under certain prerequisites. Specifically,
the pressure ratio for each compressor was set to be between 1.5 and 2.5 with interstage
cooling of the gas to 40 °C and with corresponding liquid knockout. The polytropic
efficiency of each compressor was set to 86% with a mechanical efficiency of 98%.
21
2.2.c. Feedstock Condition
The chemical looping system natural gas, tail gas, and recycle CO2 gas are assumed
to be available at the reducer operating pressure. Given that the highest pressure evaluated
is 30 atm, this corresponds well with pipeline pressure of natural gas. Steam injection is
assumed to be available as liquid water that must first be pumped to system pressure and
can either be injected as liquid water or preheated to generate steam and injected as steam.
All reducer feedstocks are assumed to be available at 25 °C and are each uniformly
preheated to the specified reducer preheat temperature. The specific composition of the
natural gas and tail gas are given in Table 2.4. The combustor air feedstock is assumed to
be available at 25 °C and 1 atm. When compressing the air feedstock to the system pressure,
interstage cooling to 40 °C is used between stages with the exception of the final stage.
The combustor air input is specified to be 5% excess of the stoichiometric requirement for
complete solids regeneration.

22
Table 2.4. Natural Gas and Tail Gas Composition
2.2.d. Heat Exchangers
In the full plant evaluations conducted in this study, there are two primary hot gas
streams that can be heat exchanged, the syngas stream and the spent air stream. In order to
avoid the safety concerns associated with heat exchanging reducing gases with oxidizing
gases, the spent air is only heat exchanged with the incoming air stream while the syngas
stream is only heat exchanged with the incoming reducer feedstocks. Additionally, excess
heat is used for intermediate pressure steam generation at 325 psia and 521 °C. A minimum
approach temperature of 28 °C is specified for all gas-gas heat exchangers.
23
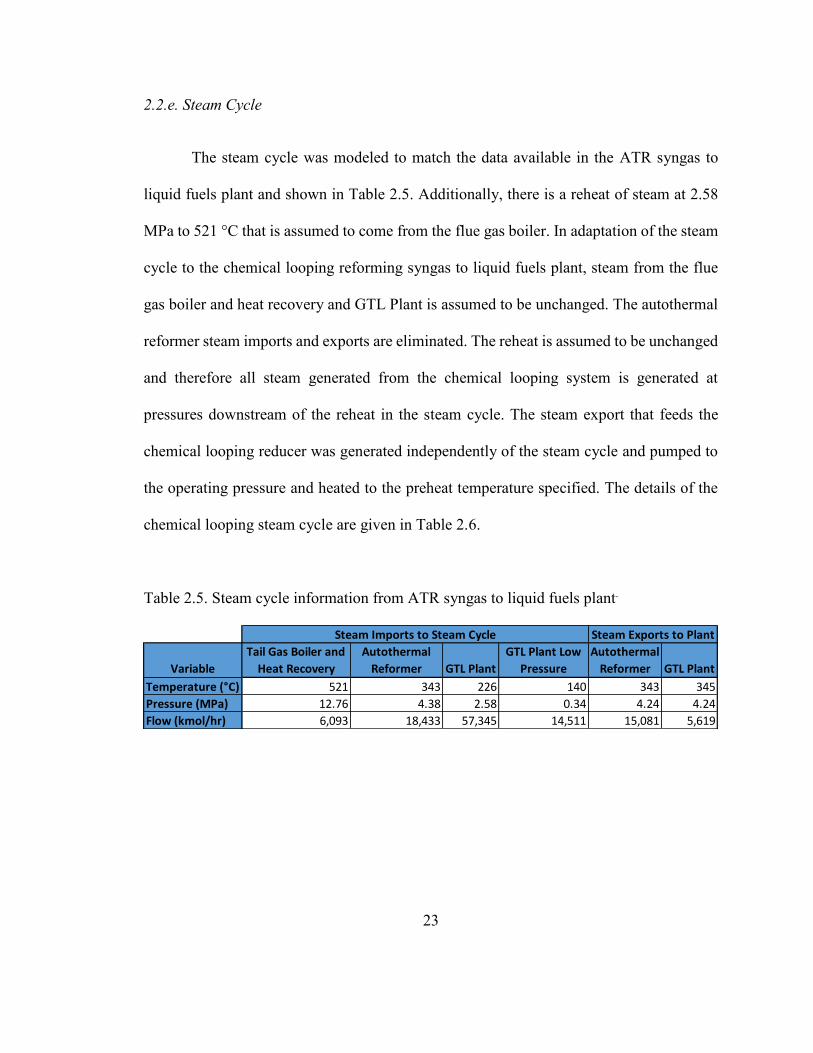
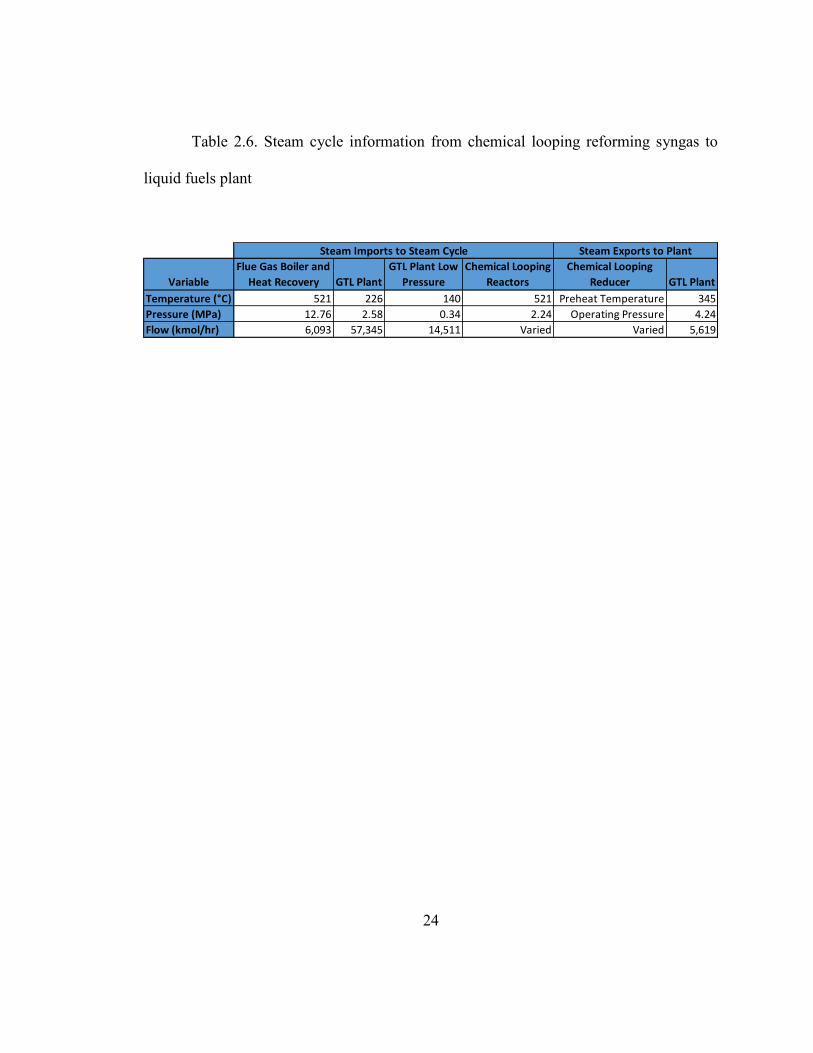
2.2.e. Steam Cycle
The steam cycle was modeled to match the data available in the ATR syngas to
liquid fuels plant and shown in Table 2.5. Additionally, there is a reheat of steam at 2.58
MPa to 521 °C that is assumed to come from the flue gas boiler. In adaptation of the steam
cycle to the chemical looping reforming syngas to liquid fuels plant, steam from the flue
gas boiler and heat recovery and GTL Plant is assumed to be unchanged. The autothermal
reformer steam imports and exports are eliminated. The reheat is assumed to be unchanged
and therefore all steam generated from the chemical looping system is generated at
pressures downstream of the reheat in the steam cycle. The steam export that feeds the
chemical looping reducer was generated independently of the steam cycle and pumped to
the operating pressure and heated to the preheat temperature specified. The details of the
chemical looping steam cycle are given in Table 2.6.
Table 2.5. Steam cycle information from ATR syngas to liquid fuels plant.
Variable
Tail Gas Boiler and
Heat Recovery
Autothermal
Reformer GTL Plant
GTL Plant Low
Pressure
Autothermal
Reformer GTL Plant
Temperature (°C) 521 343 226 140 343 345
Pressure (MPa) 12.76 4.38 2.58 0.34 4.24 4.24
Flow (kmol/hr) 6,093 18,433 57,345 14,511 15,081 5,619
Steam Imports to Steam Cycle Steam Exports to Plant
24
Table 2.6. Steam cycle information from chemical looping reforming syngas to
liquid fuels plant
Variable
Flue Gas Boiler and
Heat Recovery GTL Plant
GTL Plant Low
Pressure
Chemical Looping
Reactors
Chemical Looping
Reducer GTL Plant
Temperature (°C) 521 226 140 521 Preheat Temperature 345
Pressure (MPa) 12.76 2.58 0.34 2.24 Operating Pressure 4.24
Flow (kmol/hr) 6,093 57,345 14,511 Varied Varied 5,619
Steam Imports to Steam Cycle Steam Exports to Plant

25
Chapter 3: Chemical Looping Simulations
3.1. Isothermal Simulations
Initial isothermal simulations sought to test the effect that pressure, temperature,
steam input, CO2 input, and solids input have on syngas yield and methane conversion. In
order to easily evaluate these trends, only natural gas injection was studied, separate from
the full plant configuration.
3.1.a. Effect of Solids Flow
Considering only the gaseous species of the stoichiometric reaction, wherein one
mole of CH4 becomes two moles of H2 and one mole of CO, it is expected that increasing
pressure decreases the amount of syngas produced due to volume expansion of the reaction.
The trends for syngas generation using iron-titanium particles only are compared for their
syngas yields and methane conversion.
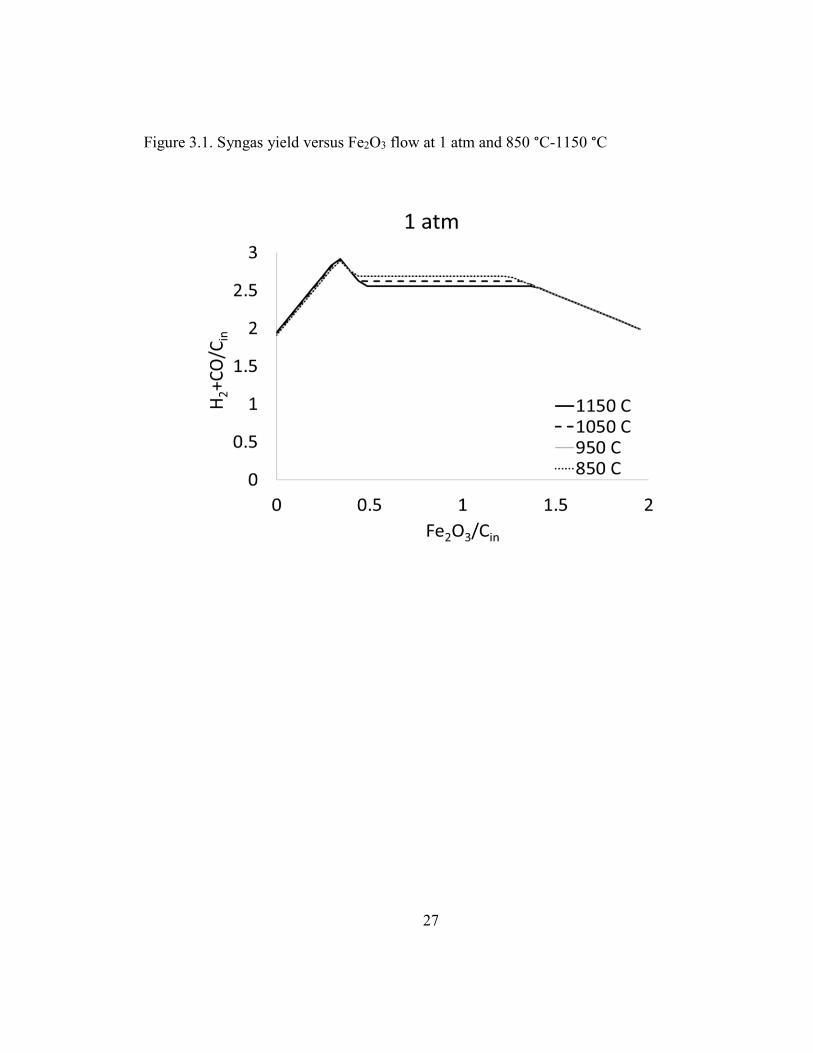
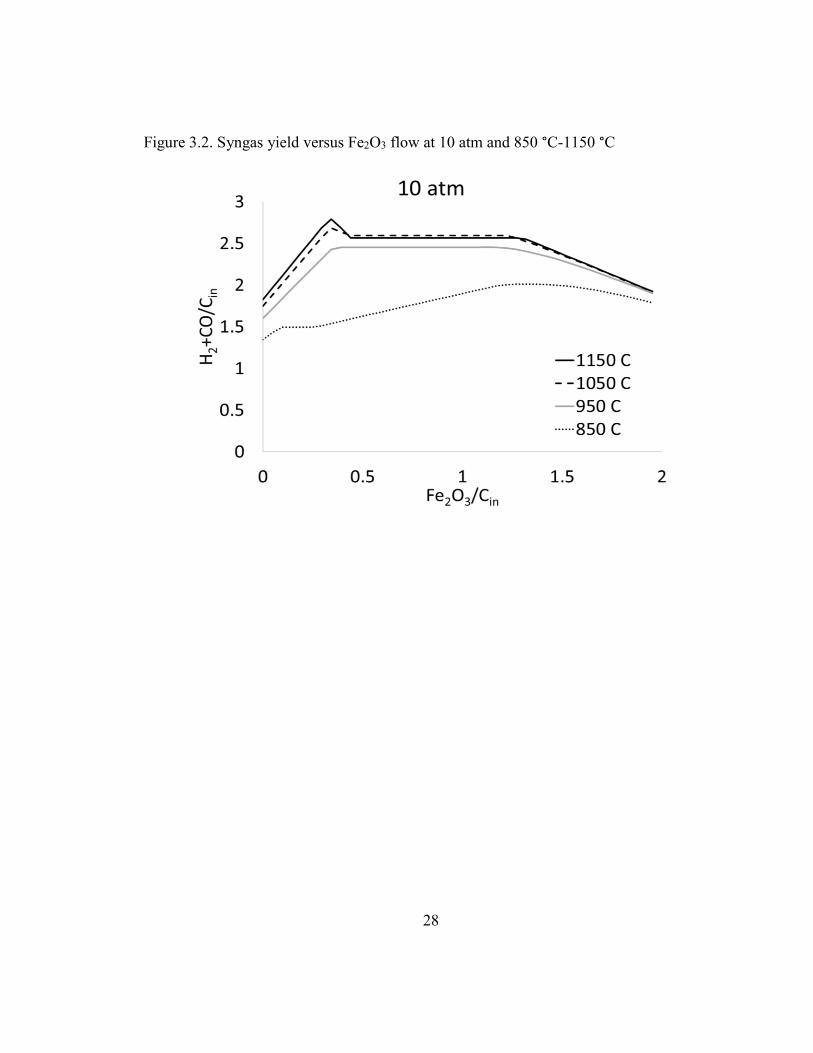
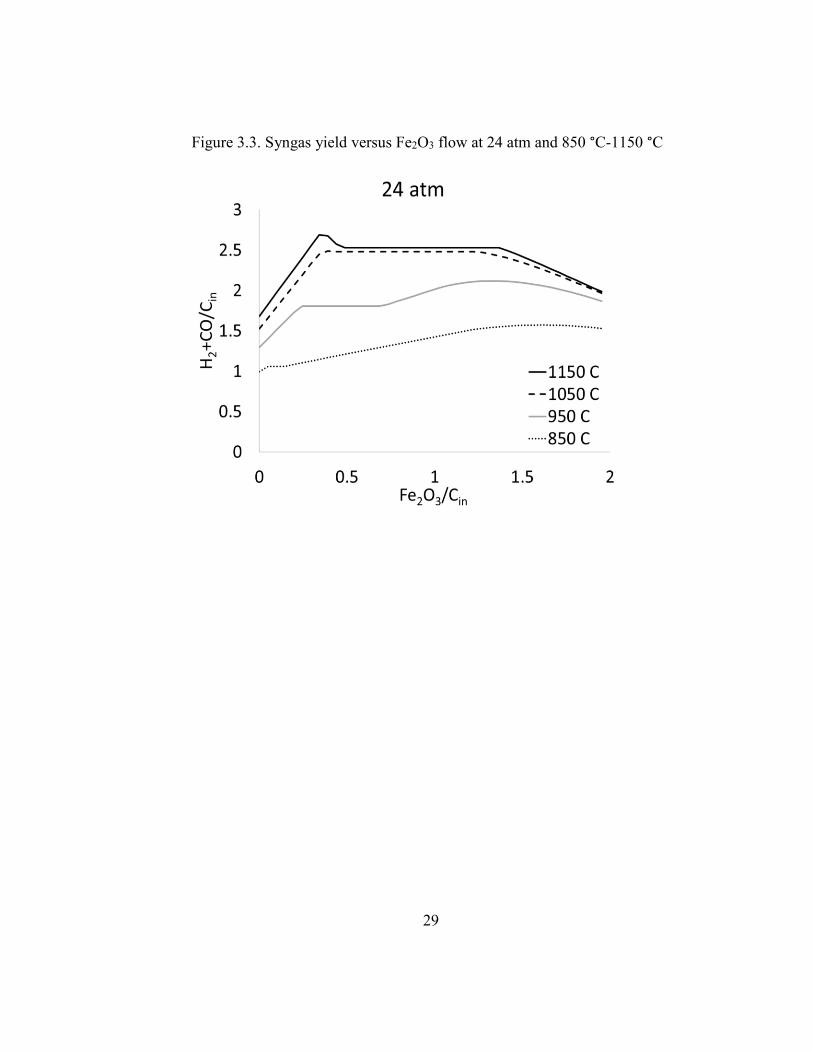
Figures 3.1 through 3.4 show the effect of reducer temperature and solids flow on
syngas yield (H2+CO/Carbonin) at 1, 10, 24 and 30 atm respectively. There is a clear
decrease in syngas yield as the pressure is increased. As the temperature is increased, the
degree to which the syngas yield is reduced from the 1 atm operating condition is reduced.
For example, in the range of constant syngas production (corresponding to Fe/FeTiO3
26
equilibrium), comparing between a pressure of 1 and 30 atm there is a 1.5% decrease in
syngas yield at a reducer temperature of 1150 °C, but a 46% decrease in syngas yield at
850 °C.
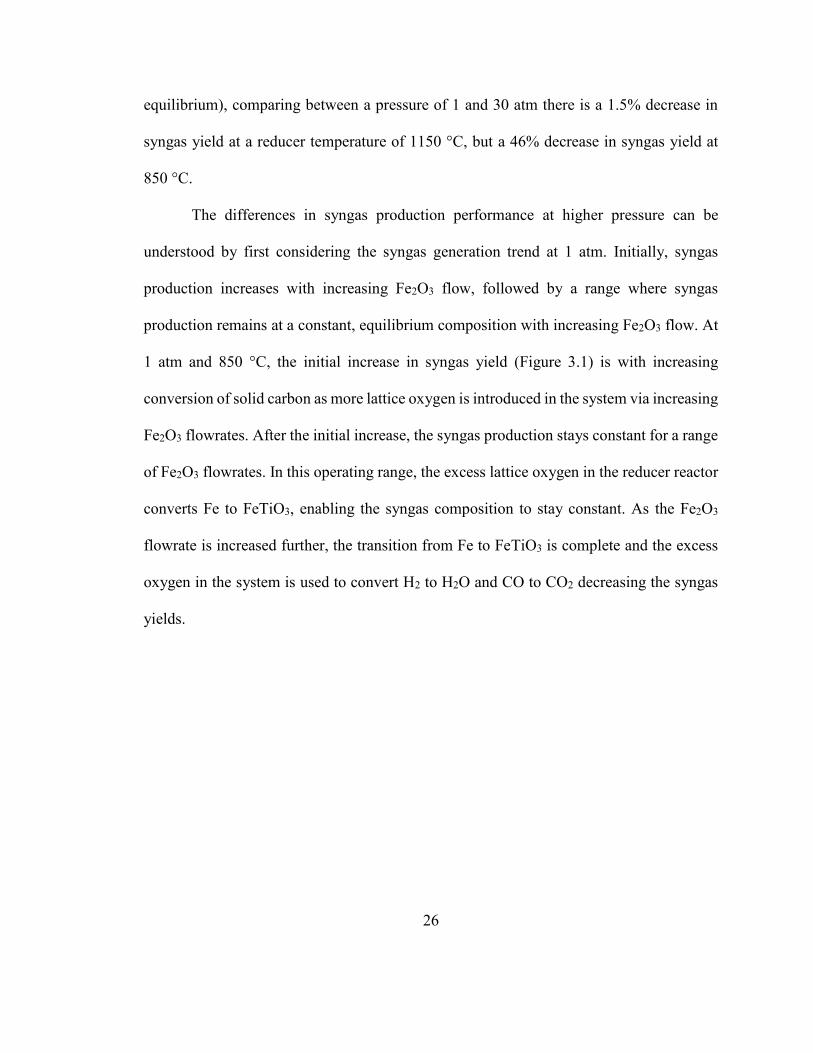
The differences in syngas production performance at higher pressure can be
understood by first considering the syngas generation trend at 1 atm. Initially, syngas
production increases with increasing Fe2O3 flow, followed by a range where syngas
production remains at a constant, equilibrium composition with increasing Fe2O3 flow. At
1 atm and 850 °C, the initial increase in syngas yield (Figure 3.1) is with increasing
conversion of solid carbon as more lattice oxygen is introduced in the system via increasing
Fe2O3 flowrates. After the initial increase, the syngas production stays constant for a range
of Fe2O3 flowrates. In this operating range, the excess lattice oxygen in the reducer reactor
converts Fe to FeTiO3, enabling the syngas composition to stay constant. As the Fe2O3
flowrate is increased further, the transition from Fe to FeTiO3 is complete and the excess
oxygen in the system is used to convert H2 to H2O and CO to CO2 decreasing the syngas
yields.
27
Figure 3.1. Syngas yield versus Fe2O3 flow at 1 atm and 850 °C-1150 °C
28
Figure 3.2. Syngas yield versus Fe2O3 flow at 10 atm and 850 °C-1150 °C
29
Figure 3.3. Syngas yield versus Fe2O3 flow at 24 atm and 850 °C-1150 °C
30
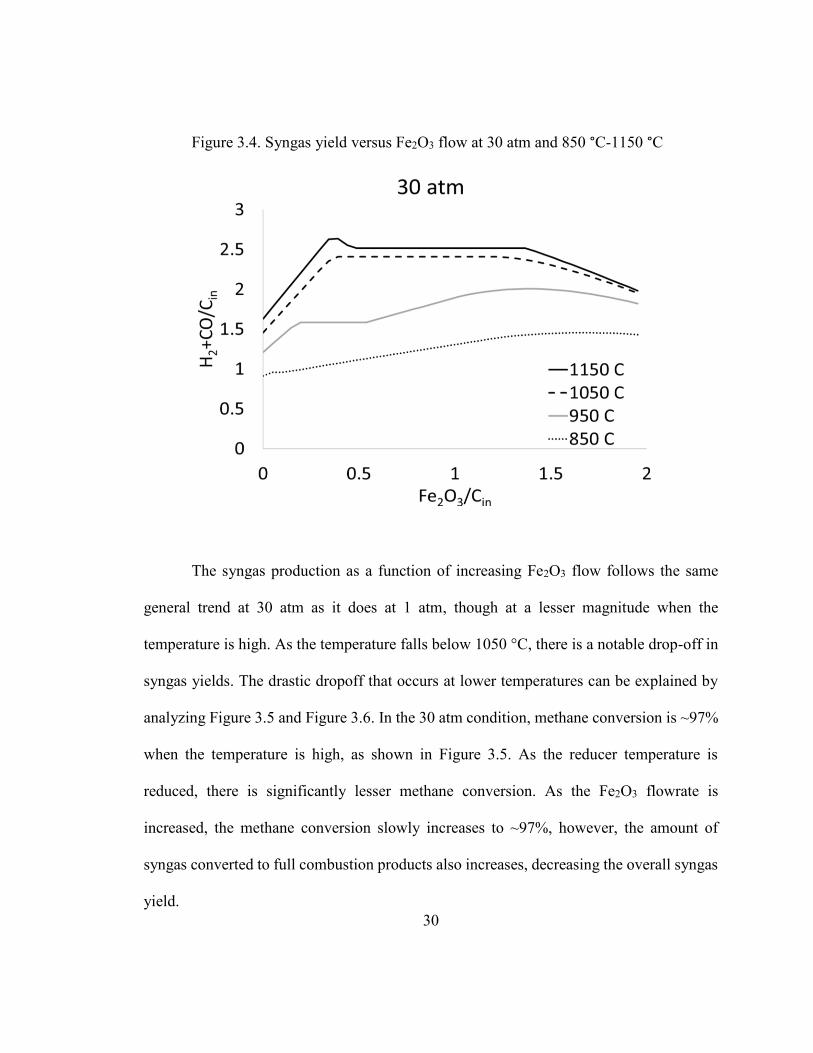
Figure 3.4. Syngas yield versus Fe2O3 flow at 30 atm and 850 °C-1150 °C
The syngas production as a function of increasing Fe2O3 flow follows the same
general trend at 30 atm as it does at 1 atm, though at a lesser magnitude when the
temperature is high. As the temperature falls below 1050 °C, there is a notable drop-off in
syngas yields. The drastic dropoff that occurs at lower temperatures can be explained by
analyzing Figure 3.5 and Figure 3.6. In the 30 atm condition, methane conversion is ~97%
when the temperature is high, as shown in Figure 3.5. As the reducer temperature is
reduced, there is significantly lesser methane conversion. As the Fe2O3 flowrate is
increased, the methane conversion slowly increases to ~97%, however, the amount of
syngas converted to full combustion products also increases, decreasing the overall syngas
yield.
31
Figure 3.5. Methane conversion versus Fe2O3 input varying pressures and at 1150 °C
32
Figure 3.6. Methane conversion versus Fe2O3 input at varying pressures and at 850 °C
In general, for a given pressure, there is a threshold temperature, above which the
syngas yield versus solids input follows the trend of the atmospheric condition reactor
given in Figure 3.1. Therefore, it should be theoretically possible to achieve high syngas
yields regardless of the reactor pressure if no upper temperature limit is used.
Unfortunately, the assumption of no upper temperature limit is not a reasonable assumption
for several reasons. First, FeTiO3 has a melting point of 1050 °C, meaning extended reducer
operation at these temperatures could result in the formation of agglomerates. This
consideration must be made for all chemical looping systems as the operating temperature
is constrained by the lowest melting point of the available chemical looping particles’
possible oxidation states. Second, the lack of an external heating system for the OSU MTS
33
system requires overall autothermal operation of the process. This can be difficult to
achieve with high temperatures as there is increased heat loss as gaseous products pull
more heat from the system.
3.1.b. Steam and CO2 Input
In theory, the stoichiometric maximum possible syngas yield from a methane
feedstock would be three moles of syngas per mole of methane, as a result of methane
reacting to form one mole of CO and two moles of H2. In the isothermal thermodynamic
simulations given above, the actual peak syngas yields are slightly less than three, as some
methane is unreacted and some H2O and CO2 are formed. In order to produce more syngas,
some quantity of steam and CO2 can be added to increase methane conversion and to serve
as another source of carbon and hydrogen. This is common in conventional syngas
producing processes, however, the reaction of steam and CO2 with methane is endothermic
and requires a driving heat source. As mentioned in Chapter 1, this reaction requires either
an external heat source or combustion with oxygen, both of which have disadvantages.
The OSU MTS process offers an alternative to both external heat sources and
oxygen combustion. These reactions are driven by the heat carried over from the
exothermic regeneration of Fe2O3 from Fe and FeTiO3. The addition of steam and CO2 to
the reducer reactor can then react with the methane. Alternatively, steam and CO2 can react
with the reduced Fe particles to form FeTiO3 and H2 or CO. Additionally, steam and CO2
can be used to control the H2/CO ratio of the syngas from the OSU MTS system,
minimizing downstream processing steps. Ultimately, steam and CO2 input can increase
34
the syngas yields and offer control of the H2/CO ratio, however, this must be balanced with
the overall heat balance of the system to ensure autothermal performance.
3.1.c. Compressor Energy Requirements
The effect of Fe2O3 flow on compression energy and syngas yield was also
analyzed. The Fe2O3 was input at 1100 °C with a constant 85% weight support TiO2
without steam and CO2 injection or any feedstock preheating. Figure 3.7 shows the total
compression energy of the system versus Fe2O3 flow at 1, 10, and 30 atm. In this figure,
the 1 atm condition corresponds to 100% of the compression energy coming from
compression of the syngas product from 1 atm to 30 atm. Similarly, the 30 atm case
corresponds to 100% of the compression energy coming from compression of air from 1
atm to the reactor pressure of 30 atm. Analysis of the figure shows that at low Fe2O3 flow
rates, the 10 atm and 30 atm reactors require less compression energy, however, as the
Fe2O3 flow rate increases beyond ~32,500 kmol/hr the compression energy requirement
increases beyond that of the 1 atm scenario. Analysis of the solid state shows that the solids
exiting the reducer reactor exit in the FeTiO3 state for the entire range of Fe2O3 inputs with
the exception of values less than 25,000 kmol/hr at 1 atm. This indicates that lattice oxygen
in the metal oxide will preferentially react with the gas products and feedstocks until the
FeTiO3 state is reached. Therefore, for low Fe2O3 flows, the Fe2O3 will react with natural
gas to produce syngas and FeTiO3 and as the Fe2O3 input increases to higher values, it will
react with some of that syngas to produce full combustion products such that the outlet
solid state is still FeTiO3. This explains how as the Fe2O3 flow rate is increased, more
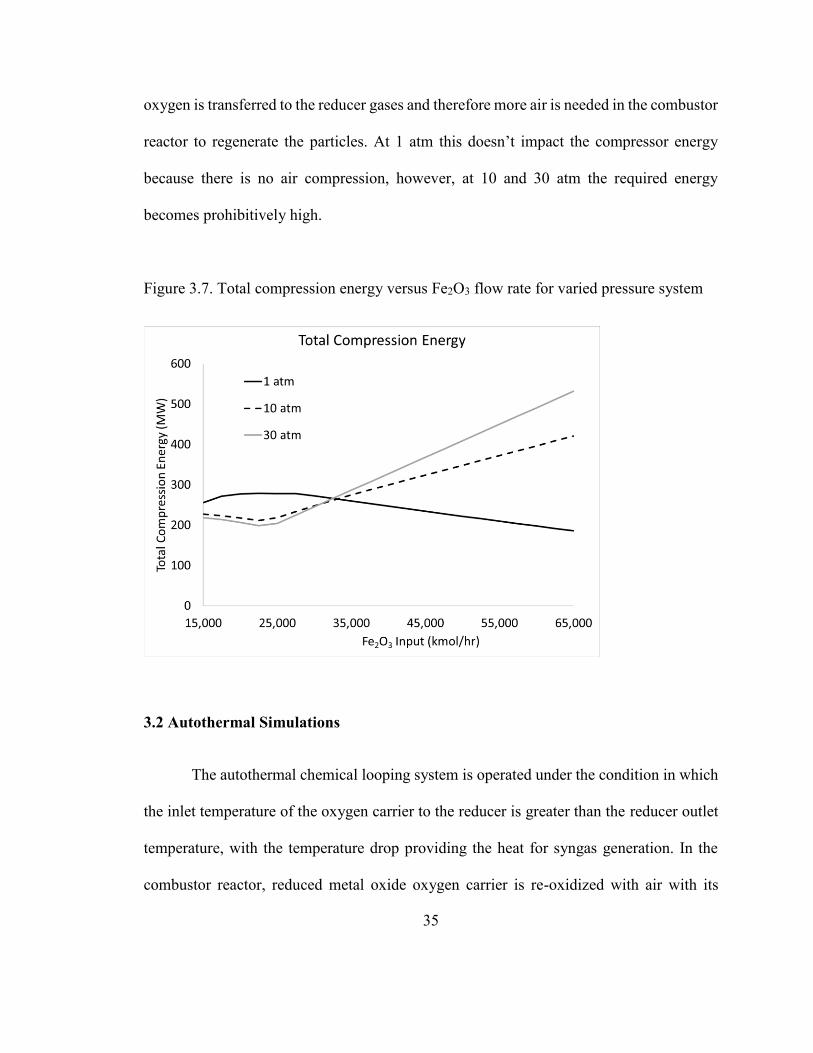
35
oxygen is transferred to the reducer gases and therefore more air is needed in the combustor
reactor to regenerate the particles. At 1 atm this doesn’t impact the compressor energy
because there is no air compression, however, at 10 and 30 atm the required energy
becomes prohibitively high.
Figure 3.7. Total compression energy versus Fe2O3 flow rate for varied pressure system
3.2 Autothermal Simulations
The autothermal chemical looping system is operated under the condition in which
the inlet temperature of the oxygen carrier to the reducer is greater than the reducer outlet
temperature, with the temperature drop providing the heat for syngas generation. In the
combustor reactor, reduced metal oxide oxygen carrier is re-oxidized with air with its

36
temperature raised to regenerate the heat lost. For the autothermal analyses, the excess air
in the combustor was set at 5%. The re-oxidation reaction is exothermic, and a portion of
the heat goes to increasing the temperature of the metal oxide to a temperature greater than
the reducer outlet. An example of this temperature swing is shown in Figure 3.8 and Figure
3.9 where solids enters at 1100 °C (position 1), exist the reducer (position 2) at ~950 °C,
and exits the combustor at ~1110 °C (position 3). The exact temperatures vary depending
on the inlet conditions used for all variables. The temperature of the oxygen carrier at
position 3 being greater than or equal to position 1 allows for the OSU MTS process to
operate as autothermal. Those conditions that satisfy the temperature swing condition are
a solution set for operation of the process.
Figure 3.8. Positions of solids in chemical looping reactor

37
Figure 3.9. Temperature at corresponding reactor position in OSU MTS System
3.2.a. Solids Support Percentage
Syngas yields decrease with increasing pressure; however, the yields at higher
pressure can be increased by increasing the temperature of the fuel reactor. To achieve
autothermal operations in the chemical looping reactors requires heat be provided via the
reactants for the endothermic reforming reactions in the fuel reactor. One possibility is to
increase the temperature of the solids entering the fuel reactor to provide this heat. This
method changes the amount of reactive oxygen input to the fuel reactor and therefore can
increase the amount of undesirable full combustion products.
Alternatively, in the iron-titanium particles, iron serves as the primary reactive
material while the excess titanium dioxide serves as an inert weight support, offering

38
stability to the particle and serving as an inert heat carrier. Therefore, increasing the TiO2
weight support can serve as a method for increasing the overall thermal energy provided
to the reducer reactor without increasing the total reactive oxygen input to the reactor.
Figure 3.10 demonstrates how the maximum syngas yield changes as the TiO2 weight
support is increased from 50% to 85% under the conditions of chemical looping reactors
operated at 10 atm with a constant Fe2O3 input of 45,000 kmol/hr and solids input to the
reducer at 1100 °C with an H2/CO ratio of 2.19,
Figure 3.10. Syngas Yield vs TiO2 Weight Support Percentage
39
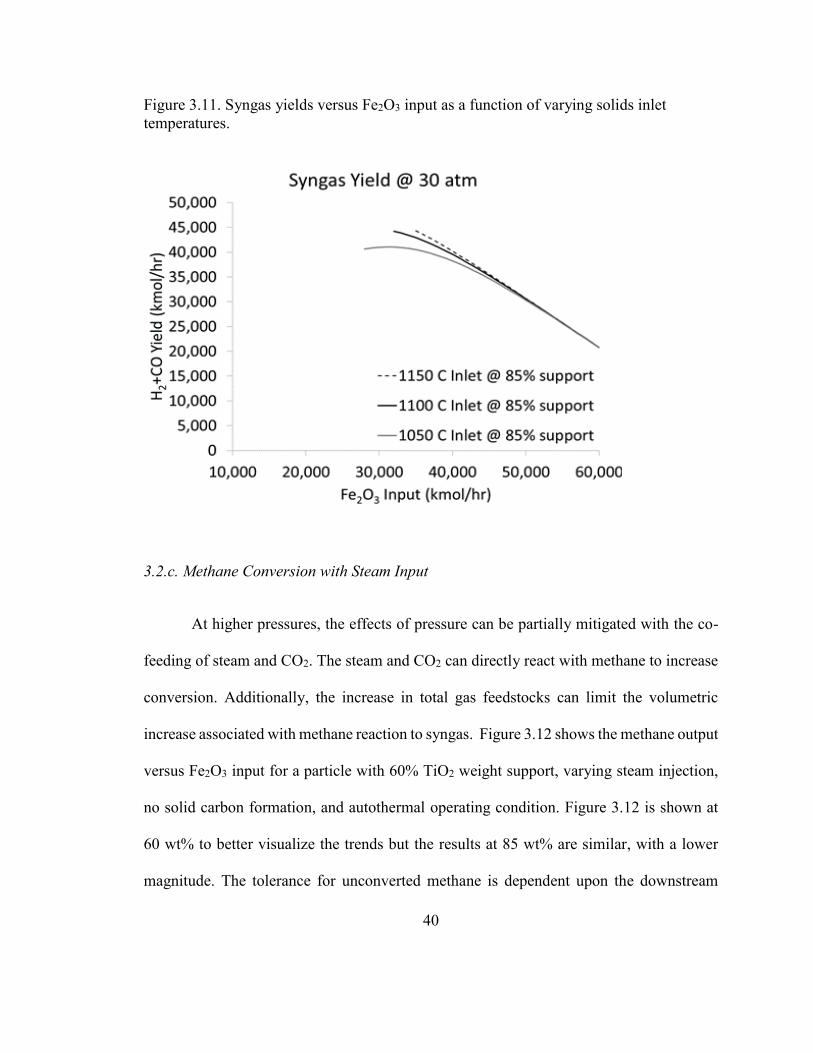
3.2.b. Solids Inlet Temperature
An alternative method to increasing the system temperature, and correspondingly
the syngas yields at pressure, is to increase the solids temperature exiting the combustor
and entering the reducer reactor. A higher temperature can increase the syngas yields,
however, it can become more difficult to achieve that autothermal reaction. This effect is
demonstrated in Figure 3.11 where syngas yield as a function of Fe2O3 flow is shown with
a steam input of 10,000 kmol/hr, no solid carbon formation, and variable H2/CO ratio. For
a given TiO2 weight support percentage, a higher solids inlet temperature results in a higher
peak syngas production. But the autothermal operating condition can be satisfied at a lower
solids flux at lower temperatures. This leads to a tradeoff between syngas production and
ITCMO flow that must be balanced. This can be seen in Figure 3.11where only ITCMO
flow rates that satisfy the autothermal condition are shown.
40
Figure 3.11. Syngas yields versus Fe2O3 input as a function of varying solids inlet
temperatures.
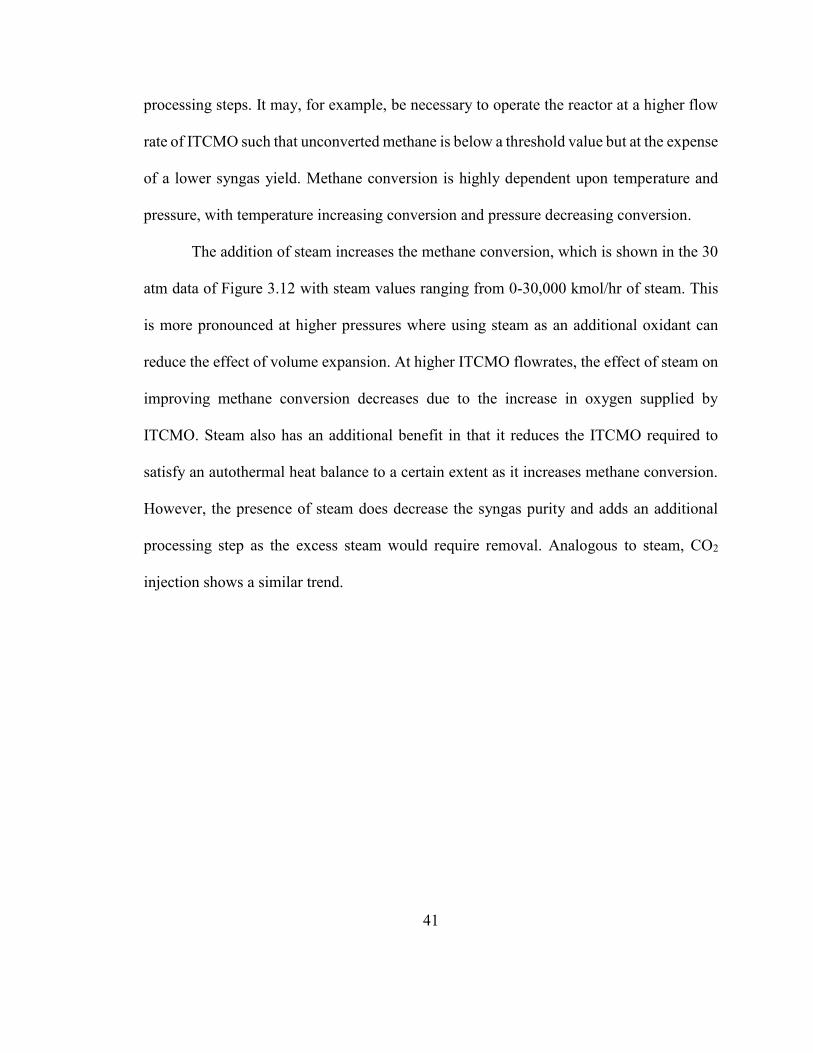
3.2.c. Methane Conversion with Steam Input
At higher pressures, the effects of pressure can be partially mitigated with the co-
feeding of steam and CO2. The steam and CO2 can directly react with methane to increase
conversion. Additionally, the increase in total gas feedstocks can limit the volumetric
increase associated with methane reaction to syngas. Figure 3.12 shows the methane output
versus Fe2O3 input for a particle with 60% TiO2 weight support, varying steam injection,
no solid carbon formation, and autothermal operating condition. Figure 3.12 is shown at
60 wt% to better visualize the trends but the results at 85 wt% are similar, with a lower
magnitude. The tolerance for unconverted methane is dependent upon the downstream
41
processing steps. It may, for example, be necessary to operate the reactor at a higher flow
rate of ITCMO such that unconverted methane is below a threshold value but at the expense
of a lower syngas yield. Methane conversion is highly dependent upon temperature and
pressure, with temperature increasing conversion and pressure decreasing conversion.
The addition of steam increases the methane conversion, which is shown in the 30
atm data of Figure 3.12 with steam values ranging from 0-30,000 kmol/hr of steam. This
is more pronounced at higher pressures where using steam as an additional oxidant can
reduce the effect of volume expansion. At higher ITCMO flowrates, the effect of steam on
improving methane conversion decreases due to the increase in oxygen supplied by
ITCMO. Steam also has an additional benefit in that it reduces the ITCMO required to
satisfy an autothermal heat balance to a certain extent as it increases methane conversion.
However, the presence of steam does decrease the syngas purity and adds an additional
processing step as the excess steam would require removal. Analogous to steam, CO2
injection shows a similar trend.
42
Figure 3.12. Methane output versus Fe2O3 input with varying steam input
3.2.d. Feedstock Preheating
Given that higher temperatures are able to increase the syngas yields at higher
pressures, it is important to consider another method for increasing the system temperature
- preheating the reducer and combustor gases. Without gas preheating, a large quantity of
the available energy goes toward heating the reactants to the system temperature instead of
driving the reforming reactions.
To study the effect that system preheats would have on syngas production, a three
variable sensitivity was performed on the OSU MTS system integrated into the gas-to-
liquids plant. Both the natural gas and tail gas flowrates and composition were held
constant and only the temperature input was changed. The Fe2O3 inlet was varied from
15,000 kmol/hr to 40,000 kmol/hr in increments of 2500 kmol/hr, steam input was varied
43
from 0 to 15,000 kmol/hr in increments of 1000 kmol/hr, and the solids inlet temperature
was varied from 1000 °C to 1150 °C in increments of 10 °C. Additionally, the CO2 input
to the system was calculated using a design specification block in ASPEN such that the
H2/CO ratio was equal to 2.19. The reducer gas preheats (steam, CO2, natural gas, and tail
gas) and air preheats were then varied from 25 °C to 900 °C. The resulting data was then
screened for operating points that satisfy the autothermal operating condition,
corresponding to the combustor outlet temperature being greater than the reducer inlet
temperature. The screened data was sorted based on syngas yield to determine the condition
with the maximum syngas yield under those preheats.
Figure 3.13, Figure 3.14, and Figure 3.15 show the maximal syngas yield vs fuel
reactor gas preheat temperature while increasing the combustor gas preheat temperatures
at 1 atm, 10 atm, and 30 atm, respectively. The shaded region represents the operating
region where a combination of fuel and air reactor gas preheating allows the system to
exceed the syngas yield of the ATR, approximately 66,000 kmols/hr of syngas.
Comparison of the figures indicate that for identical preheats, the 1 atm syngas yield is
always higher. In all cases it is possible to achieve higher performance than the ATR given
sufficient energy is available for feedstock preheating. Additionally, we can conclude that
higher preheating increase syngas production, regardless if it is the fuel or air reactor gas
being heated.

44
Figure 3.13. Maximum syngas yields versus reducer preheat temperatures at 1 atm
Figure 3.14. Maximum syngas yields versus reducer preheat temperatures at 10 atm

45
Figure 3.15. Maximum syngas yields versus reducer preheat temperatures at 30 atm
Operation at pressures significantly greater than 10 atm encounters one potential
problem. In order for the syngas yields to approach that of the baseline, the temperature of
the reducer must be kept at temperatures greater than 1000 °C; however, the solids exiting
the reducer reactor exit in the FeTiO3 oxidation state, which has a melting temperature of
1050 °C. Therefore, there could be significant issues due to softening and phase changes
in a moving bed operating near the melting point, while lower temperatures would result
in significantly reduced syngas yields and poor methane conversion. Therefore, the 30 atm
operating condition was not evaluated in the full plant simulations.
46
Chapter 4: Full Plant Simulations
Noting the range of preheat conditions at which the syngas yields of the chemical
looping system exceeds that of the autothermal reforming system, a set system preheat was
selected to evaluate the overall energy balance. In practice, the preheat temperature would
be based on the cost for the heat exchanger network and system limitations. In our full
plant simulations, for both the 1 atm and 10 atm system operation, a gas preheat of 600 °C
was selected. The fuel is preheated by heat exchanging with the reducer syngas product
stream and the air is heat exchanged with the spent air stream exiting the air reactor. The
natural gas input was reduced in the systems until the syngas yield from the chemical
looping system was equal to that of the ATR based system.
4.1. 1 atm Chemical Looping System
4.1.a. Syngas Yields of 1 atm Chemical Looping System
Chemical looping at 1 atm was able to produce a syngas yield equivalent to ATR
using only 87% of the natural gas input. Additionally, the steam input was reduced from
15,081 kmol/hr in the ATR system to 4,000 kmol/hr in the chemical looping system. The
full summary of the operating condition and syngas performance are given in Table 4.1.

47
Table 4.1. 1 atm Chemical looping reforming operating conditions and syngas yields.
4.1.b. Energy Balance of 1 atm Chemical Looping System
A five-stage syngas compressor with a net syngas compression duty of 264.1 MWe
compressed the syngas to 30 atm. Intermediate pressure steam can be generated from the
chemical looping hot gas outlets and provides a slight increase in power production,
resulting in a net power export of 16.4 MWe. The total system energy balance for the 1 atm
case is given in Table 4.2.
Parameter Value Units
Natural Gas Input 17,269 kmol/hr
Fe2O3 Input 21,500 kmol/hr
TiO2 Support 85 wt %
Reducer Steam Input 4,600 kmol/hr
CO2 Input 436 kmol/hr
Air Input 54,424 kmol/hr
Solids Inlet Temperature 1,010 °C
Reducer Gas Preheat 600 °C
Combustor Gas Preheat 600 °C
CH4 Conversion 98.7 %
Syngas Purity Dry Basis 96.2 %
H2/CO Ratio 2.19 Ratio
Parameter ATR CL
Normalized Natural Gas Usage 1 0.87
Normalized Syngas Yield 1 1
ATR Plant Comparison
Chemical Looping Plant Details
Syngas Yield
48
Table 4.2 Full plant energy balance of a 1 atm chemical looping reformer integrated into
a gas to liquids plant
1 atm Energy Balance
Parameter Value Units
Steam Turbine Power 337.1 MWe
Total Gross Power 337.1 MWe
Syngas Compression 264.1 MWe
Air Compression 0.0 MWe
Amine System Auxiliary 5.6 MWe
CO2 Compressor 3.4 MWe
Boiler Feedwater Pumps 1.0 MWe
Condensate Pump 0.4 MWe
Circulating Water Pump 6.1 MWe
Ground Water Pumps 0.5 MWe
Cooling Tower Fans 3.2 MWe
Steam Turbine Auxiliaries 0.2 MWe
F-T Power 32.3 MWe
Miscellaneous Balance of Plant 1.0 MWe
Transformer Losses 2.8 MWe
Remaining Plant Power Consumption 320.7 MWe
Net Plant Power Production 16.4 MWe
4.2. 10 atm Chemical Looping System
4.2.a. Syngas Yields of 10 atm Chemical Looping System
When the chemical looping reformer operating pressure is increased from 1 atm
to 10 atm, there are a few notable differences in the operating conditions. First, the
overall temperature of the system, including the solids inlet temperature and solids inlet
flow are increased to provide more heat to the fuel reactor. At 1 atm, the solids
temperature entering the reducer was 1010 °C but increases to 1140 °C at 10 atm. This is

49
because the reduction in syngas production associated with higher pressures can be
partially offset by increasing the temperature of the fuel reactor. The overall system
operating conditions and syngas yields are shown in Table 4.3. When the fuel reactor
operates at 10 atm, it is able to produce syngas equal to autothermal reforming using only
93% of the natural gas input.
Table 4.3. 10 atm Chemical Looping reforming operating conditions and syngas yields.
Parameter Value Units
Natural Gas Input 18,460 kmol/hr
Fe2O3 Input 25,900 kmol/hr
TiO2 Support 85 wt %
Steam Input 9,500 kmol/hr
CO2 Input 540 kmol/hr
Air Input 65,562 kmol/hr
Solids Inlet Temperature 1,140 °C
Reducer Gas Preheat 600 °C
Combustor Gas Preheat 600 °C
CH4 Conversion 97.7 %
Syngas Purity Dry Basis 94.1 %
H2/CO Ratio 2.19 Ratio
Parameter ATR CL
Normalized Natural Gas Usage 1 0.93
Normalized Syngas Yield 1 1
ATR Plant Comparison
Chemical Looping Plant Details
Syngas Yield

50
4.2.b. Energy Balance of 10 atm Chemical Looping System
Syngas compression uses a two-stage syngas compressor with a net syngas
compression duty of 83.1 MWe. The air compression train uses a three-stage air compressor
with a net air compression duty of 145.1 MWe. The net compression duty, air and syngas
combined, is 35.9 MWe less than the 1 atm operating condition alone. Additionally, the
higher reactor temperatures allow for additional power production at the 10 atm case as
compared to the 1 atm case, yielding a net power export of 95.4 MWe. The full system
energy balance is shown in Table 4.4 and shows a net power export of 95.4 MWe.

51
Table 4.4. Full plant energy balance of a 10 atm chemical looping reformer
integrated into a gas to liquids plant
10 atm Energy Balance
Parameter Value Units
Steam Turbine Power 384.8 MWe
Total Gross Power 384.8 MWe
Syngas Compression 83.1 MWe
Air Compression 145.1 MWe
Amine System Auxiliary 8.6 MWe
CO2 Compressor 5.1 MWe
Boiler Feedwater Pumps 1.0 MWe
Condensate Pump 0.4 MWe
Circulating Water Pump 6.1 MWe
Ground Water Pumps 0.5 MWe
Cooling Tower Fans 3.2 MWe
Steam Turbine Auxiliaries 0.2 MWe
F-T Power 32.3 MWe
Miscellaneous Balance of Plant 1.0 MWe
Transformer Losses 2.8 MWe
Remaining Plant Power Consumption 289.4 MWe
Net Plant Power Production 95.4 MWe
52
Chapter 5: Differential Pressure Operating Condition
Analysis of the chemical looping plants net energy consumption at 1 atm and 10 atm
show that the dominant energy consumers are the compressors. At 1 atm, the syngas
compressors use ~82% of the total electrical power consumption, while at 10 atm, the air
compressors use ~50% of the total electrical power. It would in theory be preferential to
operate the reducer reactor at 10 atm, significantly reducing the syngas compression, while
operating the combustor reactor at atmospheric conditions, eliminating the air
compression. Historically, pressurized solids circulation systems have operated with all
equipment operating at an equivalent pressure.
Through exploitation of the gas-solid flow characteristics, a device can be introduced
to perform the pressurization and the depressurization functions between reactors in the
continuous solids circulating loop. This reactor pressure variation concept, earmarking a
new type of chemical looping operating conditions has been successfully demonstrated
experimentally at The Ohio State University58. This system can reduce the compression
energy requirements significantly by operating the fuel reactor at high pressures thereby
minimizing the syngas compression, while maintained near atmospheric conditions in the
combustor reactor, eliminating the air compressors.
53
5.1. Differential Pressure Modeling and Operation Principles
5.1.a. Operating Principles
Lock hoppers are the traditional device for feeding solids from low to high
pressures, where solids in a batch mode are fed into a continuously flowing system. Lock
hoppers rely on direct contact of solids with mechanical valves which are then opened and
closed to let gravity carry solids into the flowing system. The direct use of lock hoppers in
a chemical looping mode to sustain a continuous operation would result in significant
particle attrition and clogging of the operating devices. There would also likely be
additional wear on the valves resulting from hot particles sitting directly on mechanical
valves.
The device developed for this chemical looping system conducts the pressurization
and depressurization of solids via a combination of non-mechanical valves and mechanical
valves. This unique valve design allows the chemical looping system to operate in a
continuous mode without the issues of attrition, clogging, and wear on the mechanical
valves. Specifically, these valves are used in series with a small pressurization or
depressurization chamber in between to allow for continuous flow of solids at unequal
pressures. The mechanical valves allow for gas sealing and equalization of the pressure
before opening the mechanical valves and feeding solids. The non-mechanical valves are
used to control the continuous solids flow and prevent particle attrition, valve clogging,
and valve wear resulting from direct solids contact with the mechanical valves. Such an
operating strategy has wide reaching process system applications including reaction-

54
regeneration and adsorption-desorption processes where pressure variations are a key part
of the optimum operation considerations. A simplified schematic of the operating system
is given in Figure 5.1.
Figure 5.1. Simplified schematic of the differential pressure operating mode.
5.1.b. Modeling
When conducting full plant simulations with an unequal operating pressure
between the reducer and combustor, two pressure changers were used to model the solids
pressurization and depressurization devices. The solid pressure change is executed via a
55
combination of the non-mechanical valve and the mechanical valve. These valves are used
in series with a small pressurization or depressurization chamber in between to allow for
continuous flow of solids at unequal pressures. A depressurization device was used
between the reducer outlet and combustor inlet while a pressurization device was used
between the combustor outlet and reducer inlet. Both devices were assumed to have a
negligible net duty, as the pressurization and depressurization of solids in the vessel
involves negligible voidage changes and the associated gas volume in the vessel is
insignificant relative to the gas volumes used elsewhere38.
5.2. System Impact
5.1.a. 10 atm reducer-1 atm combustor chemical looping system yields
Under a differential pressure operating strategy, the fuel reactor is equivalent to that
of the 10 atm case, capable of achieving equivalent syngas production to ATR with only
93% of the natural gas input. The major advantage to the differential operating pressure
strategy can be attributed to the compression duty. The largest source of energy
consumption in the 10 atm chemical looping case was for air compression. Of the net 289.4
MWe required, 145 MWe could be attributed to air compression from atmospheric air to
the combustor operating pressure of 10 atm. By operating the combustor at 1 atm, the
entirety of the 145 MWe can be replaced by a blower with comparatively negligible power
consumption. As such, the plant power export increases from 95.4 MWe to 240.4 MWe
while maintain identical syngas production, as shown in Table 5.1.
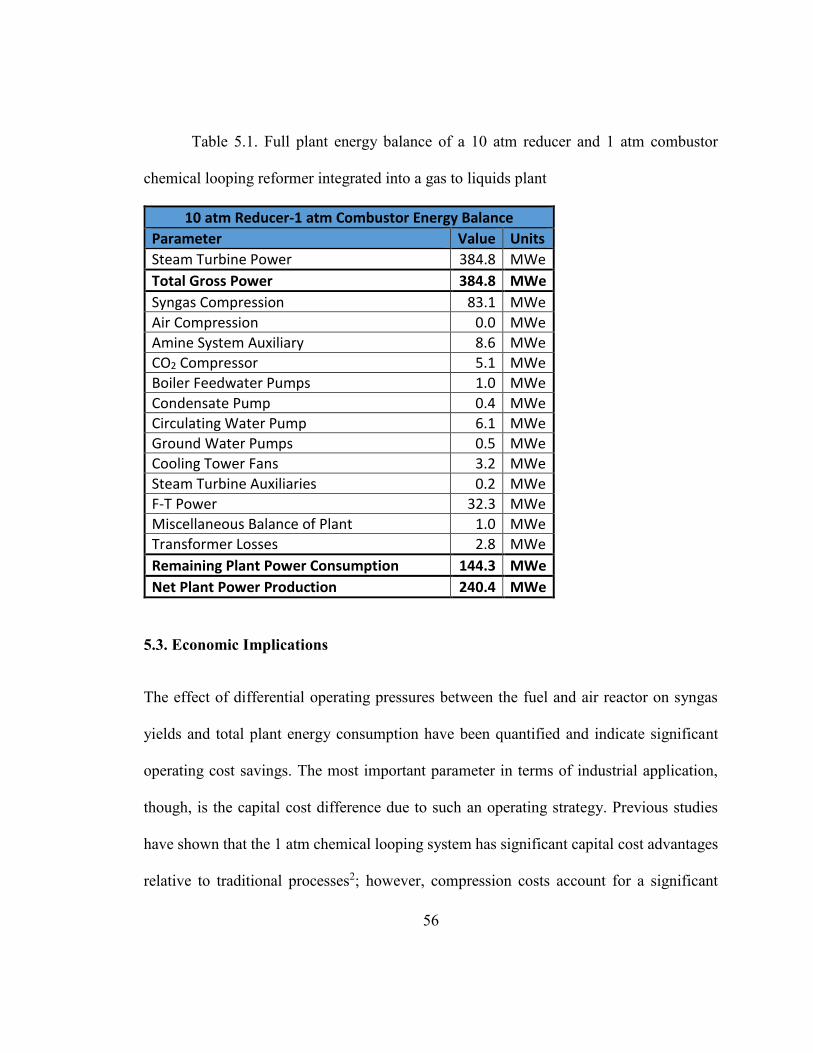
56
Table 5.1. Full plant energy balance of a 10 atm reducer and 1 atm combustor
chemical looping reformer integrated into a gas to liquids plant
10 atm Reducer-1 atm Combustor Energy Balance
Parameter Value Units
Steam Turbine Power 384.8 MWe
Total Gross Power 384.8 MWe
Syngas Compression 83.1 MWe
Air Compression 0.0 MWe
Amine System Auxiliary 8.6 MWe
CO2 Compressor 5.1 MWe
Boiler Feedwater Pumps 1.0 MWe
Condensate Pump 0.4 MWe
Circulating Water Pump 6.1 MWe
Ground Water Pumps 0.5 MWe
Cooling Tower Fans 3.2 MWe
Steam Turbine Auxiliaries 0.2 MWe
F-T Power 32.3 MWe
Miscellaneous Balance of Plant 1.0 MWe
Transformer Losses 2.8 MWe
Remaining Plant Power Consumption 144.3 MWe
Net Plant Power Production 240.4 MWe
5.3. Economic Implications
The effect of differential operating pressures between the fuel and air reactor on syngas
yields and total plant energy consumption have been quantified and indicate significant
operating cost savings. The most important parameter in terms of industrial application,
though, is the capital cost difference due to such an operating strategy. Previous studies
have shown that the 1 atm chemical looping system has significant capital cost advantages
relative to traditional processes2; however, compression costs account for a significant

57
portion of the overall capital costs in chemical looping systems, and therefore the economic
implications of varied operating pressures must be considered.
5.3.a. Compressor Economic Assumptions
Initially, only the compressor capital costs are compared for the three
configurations: atmospheric operation, 10 atm reducer and combustor operation, and 10
atm reducer with atmospheric combustor operation. The bare erected costs (BEC) for all
configurations are estimated using an industrial cost analysis conducted by WorleyParsons
on the chemical looping coal to methanol process as a basis for compressor costs59. The
compressors are scaled based on the number of stages and gas flows. The numbers are
normalized to the compressor costs of the atmospheric condition. As the pressure increases
from 1 atm to 10 atm, the volume of syngas is reduced, lowering the syngas compressor
costs by 60%. However, the large volume of air required to be compressed to the 10 atm
condition, increases the overall compressor costs to 150%. By integrating the differential
pressure operation, the air compressor cost can be eliminated, resulting in an overall
compressor cost reduction of 60% as compared with the 1 atm condition.
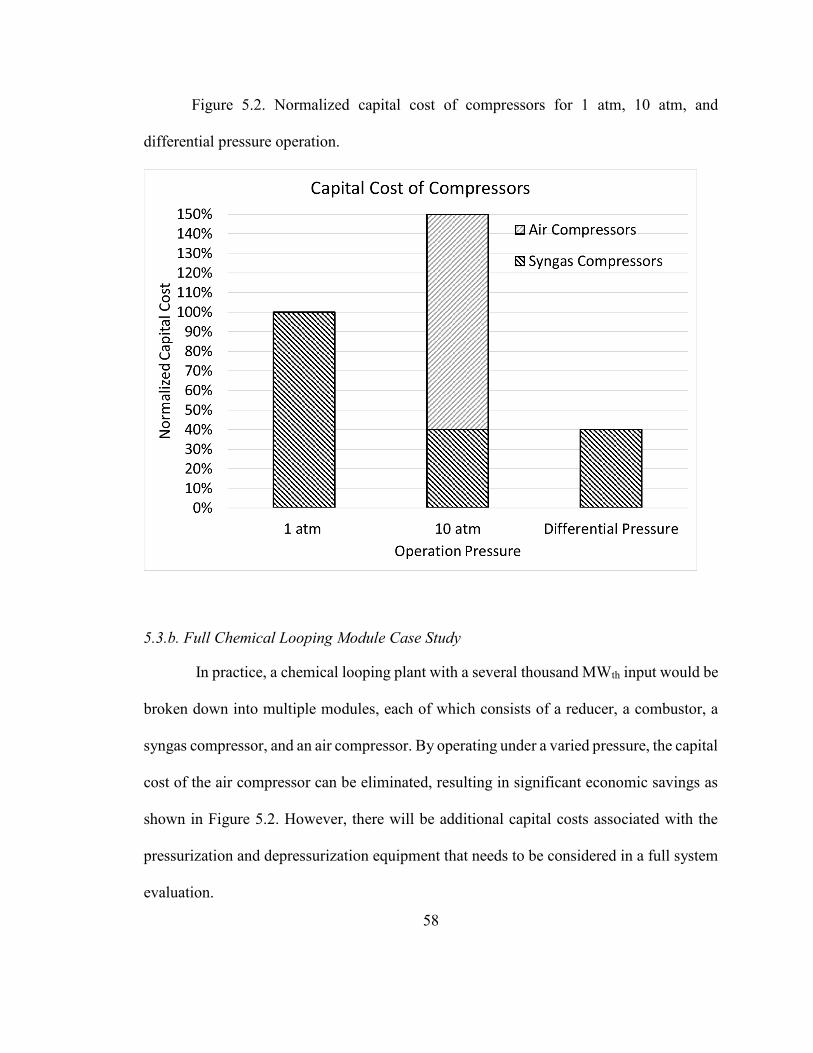
58
Figure 5.2. Normalized capital cost of compressors for 1 atm, 10 atm, and
differential pressure operation.
5.3.b. Full Chemical Looping Module Case Study
In practice, a chemical looping plant with a several thousand MWth input would be
broken down into multiple modules, each of which consists of a reducer, a combustor, a
syngas compressor, and an air compressor. By operating under a varied pressure, the capital
cost of the air compressor can be eliminated, resulting in significant economic savings as
shown in Figure 5.2. However, there will be additional capital costs associated with the
pressurization and depressurization equipment that needs to be considered in a full system
evaluation.
59
5.3.c. Full Chemical Looping Module Economic Assumptions
In the following case study, a single module with a 250 MWth capacity is used as
an example to compare two chemical looping configurations. In configuration one, both
the fuel and air reactors operate at 10 atm. In configuration two, the fuel reactor operates
at 10 atm while the air reactor operates at 1 atm. The bare erected costs (BEC) of both
configurations are estimated using the same WorleyParsons report as before as the basis
for both the reactor and compressor costs59. In the equivalent pressure configuration, initial
reactor and compressor sizing is conducted based on the solid circulation rate and gas flow
rates, respectively.
The additional equipment for pressurization and depressurization consists of two
parts: the pressurization and depressurization chambers and the valves which can operate
under high-pressure and high-temperature conditions. The pressurization and
depressurization chambers can be evaluated as a 30% increase in the overall chemical
looping reactor volume. The increased reactor volume is evaluated using the power rule
with a 0.7 exponential factor. The mechanical valves are estimated to be 40% of the total
cost of the reducer and combustor, based on the upper value of suitable industrial valves
with an added contingency60.
5.3.d. Full Chemical Looping Module Costing Results
As shown in Figure 5.3, in the equal pressure case, air compressors accounts for
half of the capital cost of the total chemical looping system. Although additional costs are
associated with implementing the differential pressure design, including the increased

60
reactor cost due to the increase in reactor volume and the cost of additional valves, the
economic benefit of eliminating the air compressor still significantly outweighs those
additional costs. By implementing the differential pressure design, the capital cost of the
whole chemical looping section can be reduced by 29%.
Figure 5.3. Capital cost breakdown of equal pressure and differential pressure
chemical looping systems, normalized based on the cost of the equal pressure case

61
Chapter 6: Concluding Remarks
6.1. Effect of Pressure on Chemical Looping Reducer
This study initially investigated the thermodynamic design conditions for high
pressure chemical looping reforming systems using iron-based oxygen carriers for syngas
generation. While increasing the pressure of the chemical looping reducer results in lower
syngas production, the decrease in syngas yield at pressure can be mitigated by controlling
certain variables. Increasing the CO2 and steam input to the reducer reactor can help
increase methane conversion and reduce the volume expansion effect in the reaction of
natural gas to syngas. Varying the solids flowrates, TiO2 support percentage, reactor pre-
heat temperature and solids inlet temperatures can be used to increase the reducer
temperature, which has the largest effect on overall syngas yields at pressure. The exact
method for increasing the temperature in the reducer can be done through varying any one
of these variables or through a combination of these variables. There are benefits and
drawbacks to each of the changes in these variables and therefore new systems must be
evaluated within the constraints of the specific plant being evaluated and available
equipment.
In general, there exist numerous conditions at high pressures capable of exceeding
the performance of ATR. Because the reforming reactions are endothermic, when
additional heat is provided into the looping reactors, the syngas yields can drastically
62
increase. When the fuel reactor operates at 1 atm, increasing the gaseous preheats from
room temperature to 900 °C results in the syngas yield increasing from 59,195 kmol/hr to
79,055 kmol/hr. Similarly, when the reducer operates at 10 atm, increasing the gaseous
preheats from room temperature to 900 °C increases the syngas yield from 57,537 kmol/hr
to 74,791 kmol/hr. For each reducer pressure evaluated, an operating range of gaseous
preheats was established, where selection of an operating point should be based on the heat
available and limitations of system heat exchangers and preheaters to maximize internal
heat integration.
6.2. Full Plant Chemical Looping Evaluations
Taking the results of the initial thermodynamic evaluation as a guide, a full plant
evaluation was conducted on the OSU MTS process. In order to balance the effects of
pressure on syngas yield and operating energy, a full plant integration was conducted on a
natural gas to liquid fuels plant in which the ATR was replaced with a chemical looping
reformer, and the chemical looping system was operated at 1 and 10 atm. At 1 atm, 13%
less natural gas is necessary to produce syngas equivalent to the baseline. At 10 atm, 7%
less natural gas is necessary to produce syngas equivalent to the baseline. Operating at
pressures significantly higher than 10 atm required reducer temperatures too close to the
particle melting points in order to achieve syngas yields on par with the baseline process
and therefore 10 atm was the highest pressure evaluated.

63
6.3. Varied Reducer-Combustor Operating Pressure
Lastly, a novel operating strategy was presented in which the chemical looping
reducer was operated at 10 atm and the combustor was operated at 1 atm. Such an operating
strategy showed that the 7% reduction in natural gas associated with the 10 atm operating
condition could be maintained. Meanwhile, elimination of the air compressors increased
the power export from 95.4 MWe with equal, 10 atm operating pressure to 240.4 MWe with
varied operating pressure. An economic evaluation of the 10 atm chemical looping
systems, indicated that implementation of the differential pressure operating system,
wherein the combustor is at atmospheric conditions, yields a 29% reduction in capital cost.
Overall, selection of an operating pressure for a chemical looping system must consider
the capacity for internal heat integration, value of product, value of exported power, and
capital cost associated with compression. The economic savings of the varied operating
pressure strategy, in terms of both operating costs and capital costs, are so great that upon
scaled demonstration, it would be the preferred operating strategy for chemical looping
systems for syngas generation.
6.4. Future Research
While this work provides a detailed thermodynamic and economic motivation in
support of high pressure chemical looping reforming, additional experimental work is
needed to verify the high pressure simulations at larger scales. Bench and sub-pilot scale
demonstrations of the OSU MTS process at 10 atm would provide verification of the
simulation results. Additionally, while a fully automated differential pressure flow reactor
64
has been demonstrated at OSU, a large scale demonstration would remove many of the
economic uncertainties. Given, the savings shown in this study, the future commercial
potential of the OSU MTS process in both gas-to-liquid processes along with any other
syngas to chemical process appear to be widespread, with clear benefits over conventional
syngas generation methods.
65
Bibliography
1. Nakicenovic, N. & Swart, R. Special Report on Emisson Scenarios: A Special
Report of Working Group III of the Intergovernmental Panel on Climate Change.
(2000).
2. International Energy Agency. World Energy Outlook 2016. (2016).
3. Steinberger, J. K. & Roberts, J. T. "From constraint to sufficiency: The decoupling
of energy and carbon from human needs, 1975–2005." Ecol. Econ. 70, 425–433
(2010).
4. U.S. Energy Information Administration. Short-Term Energy Outlook,. (2019).
5. UN Environment. Global Chemicals Outlook. (2013).
6. Ciferno, J., & Marano, J., "Benchmarking Biomass Gasification Technologies for
Fuels, Chemicals and Hydrogen Production," National Energy Technology Lab,
(2002).
7. Noelker, K. & Johanning, J. "Authothermal reforming: a flexible syngas route with
future potential." in Nitrogen & Syngas 2010 International Conference (2010).
8. Abatzoglou, N. & Fauteux-Lefebvre, C. "Review of catalytic syngas production
through steam or dry reforming and partial oxidation of studied liquid compounds."
Wiley Interdiscip. Rev. Energy Environ. 5, 169–187 (2016).
9. Lyubovsky, M., Roychoudhury, S. & LaPierre, R. "Catalytic partial 'oxidation of
methane to syngas' at elevated pressures." Catal. Letters 99, 113–117 (2005).
10. Rostrup-Nielsen, J. R. "Syngas in perspective." Catal. Today 71, 243–247 (2002).
11. Ogden, J. "Review of Small Stationary Reformers for Hydrogen Production." in IEA
Agreement on the Production and Utilization of Hydrogen Task 16, Hydrogen from
Carbon-Containing Materials (2002).
12. Abbas, S. Z., Dupont, V. & Mahmud, T. "Kinetics study and modelling of steam
methane reforming process over a NiO/Al2O3 catalyst in an adiabatic packed bed
reactor." Int. J. Hydrogen Energy 42, 2889–2903 (2017).
13. Tsang, S. C., Claridge, J. B. & Green, M. L. H. "Recent advances in the conversion
of methane to synthesis gas." Catal. Today 23, 3–15 (1995).
14. "Steam Reforming of Natural Gas and Other Hydrocarbons." in Ullmann’s energy :
resources, processes, products. (Wiley-VCH, 2015).
15. Velasco, J. et al. "Catalytic partial oxidation of methane over nickel and ruthenium
based catalysts for GTL applications." Fuel 153, 192–201 (2015).
16. Wang, F. et al. "Process analysis of syngas production by non-catalytic POX of oven
gas." Front. Energy Power Eng. China 3, 117–122 (2009).
17. Seifert, P., Compart, F. & Tischer, P. "A large-scale benchmark for the CFD
66
modeling of non-catalytic reforming of natural gas based on the Freiberg test plant
HP POX." Fuel 152, 110–121 (2015).
18. Enger, B., Lødeng, R. & Holmen, A. "A review of catalytic partial oxidation of
methane to synthesis gas with emphasis on reaction mechanisms over transition
metal catalysts." Appl. Catal. A Gen. 346, 1–27 (2008).
19. Goellner, J., Kuehn, N., Shah, V., White, C. & Woods, M. "Baseline Analysis of
Crude Methanol Production from Coal and Natural Gas." National Energy
Technology Lab (2014).
20. Lavoie, J.-M. "Review on dry reforming of methane, a potentially more
environmentally-friendly approach to the increasing natural gas exploitation."
Front. Chem. 2, 81 (2014).
21. Zahedi nezhad, M., Rowshanzamir, S. & Eikani, M. H. "Autothermal reforming of
methane to synthesis gas: Modeling and simulation." Int. J. Hydrogen Energy 34,
1292–1300 (2009).
22. Olsvik, O. & Hansen, R. "High Pressure Autothermal Reforming (HP ATR)." Stud.
Surf. Sci. Catal. 119, 875–882 (1998).
23. Johanning, J., Poschlad, K. & Potthoff, C. "Development of equipment design tools
form experimental data using the example of autothermal reforming." in
International Conference & Exhibition Nitrogen + Syngas 2013 (2013).
24. Lerou, J. "Methane to Syngas." in The Changing Landscape of Hydrocarbon
Feedstocks for Chemical Production Implications for Catalysis: A Workshop
(2016).
25. Fan, L.-S. Chemical looping systems for fossil energy conversions. (Wiley-AIChE,
2010).
26. Fan, L.-S., Zeng, L. & Luo, S. "Chemical-looping technology platform." AIChE J.
61, 2–22 (2015).
27. Fan, L.-S. Chemical Looping Partial Oxidation: Gasification, Reforming, and
Chemical Syntheses. (Cambridge University Press, 2017).
28. Michalsky, R., Avram, A. M., Peterson, B. A., Pfromm, P. H. & Peterson, A. A.
"Chemical looping of metal nitride catalysts: low-pressure ammonia synthesis for
energy storage." Chem. Sci. 6, 3965–3974 (2015).
29. Adanez, J., Abad, A., Garcia-Labiano, F., Gayan, P. & de Diego, L. F. "Progress in
Chemical-Looping Combustion and Reforming Technologies." Prog. Energy
Combust. Sci. 38, 215–282 (2012).
30. Ishida, M., Zheng, D. & Akehata, T. "Evaluation of a chemical-looping-combustion
power-generation system by graphic exergy analysis." Energy 12, 147–154 (1987).
31. Lyngfelt, A., Leckner, B. & Mattisson, T. "A fluidized-bed combustion process with
inherent CO2 separation; application of chemical-looping combustion." Chem. Eng.
Sci. 56, 3101–3113 (2001).
32. Hossain, M. M. & de Lasa, H. I. "Chemical-looping combustion (CLC) for inherent
CO2 separations - a review." Chem. Eng. Sci. 63, 4433–4451 (2008).
33. Figueroa, J. D., Fout, T., Plasynski, S., McIlvried, H. & Srivastava, R. D. "Advances
in CO2 capture technology—The U.S. Department of Energy’s Carbon
Sequestration Program." Int. J. Greenh. Gas Control 2, 9–20 (2008).
67
34. Boot-Handford, M. E. et al. "Carbon capture and storage update." Energy Environ.
Sci. 7, 130–189 (2014).
35. Gao, W. et al. "Production of ammonia via a chemical looping process based on
metal imides as nitrogen carriers." Nat. Energy 3, 1067–1075 (2018).
36. Kathe, M. et al. "Coal Refining Chemical Looping Systems with CO2 as a Co-
Feedstock for Chemical Syntheses." Energy & Fuels 32, 1139–1154 (2018).
37. Kathe, M. et al. "Modularization strategy for syngas generation in chemical looping
methane reforming systems with CO2 as feedstock." AIChE J. 63, 3343–3360
(2017).
38. Kathe, M. et al. "Utilization of CO2 as a partial substitute for methane feedstock in
chemical looping methane–steam redox processes for syngas production." Energy
Environ. Sci. 10, 1345–1349 (2017).
39. Mendiara, T. et al. "Negative CO2 emissions through the use of biofuels in chemical
looping technology: A review." Appl. Energy 232, 657–684 (2018).
40. Luo, M. et al. Review of hydrogen production using chemical-looping technology.
Renew. Sustain. Energy Rev. 81, 3186–3214 (2018).
41. Kathe, M. V., Empfield, A., Na, J., Blair, E. & Fan, L.-S. "Hydrogen production
from natural gas using an iron-based chemical looping technology: Thermodynamic
simulations and process system analysis." Appl. Energy 165, 183–201 (2016).
42. Hsieh, T.-L. et al. "250 kWth high pressure pilot demonstration of the syngas
chemical looping system for high purity H2 production with CO2 capture." Appl.
Energy 230, 1660–1672 (2018).
43. Ryden, M., Lyngfelt, A. & Mattison, T. "Synthesis gas generation by chemical-
looping reforming in a continuously operating laboratory reactor." Fuel 85, 1631–
1641 (2006).
44. Karimi, E., Forutan, H. R., Saidi, M., Rahimpour, M. R. & Shariati, A.
"Experimental Study of Chemical-Looping Reforming in a Fixed-Bed Reactor:
Performance Investigation of Different Oxygen Carriers on Al2O3 and TiO2
Support." Energy & Fuels 28, 2811–2820 (2014).
45. Luo, S. et al. "Shale gas-to-syngas chemical looping process for stable shale gas
conversion to high purity syngas with a H2:CO ratio of 2:1." Energy Environ. Sci. 7,
4104–4117 (2014).
46. Chung, C., Qin, L., Shah, V. & Fan, L.-S. "Chemically and physically robust,
commercially-viable iron-based composite oxygen carriers sustainable over 3000
redox cycles at high temperatures for chemical looping applications." Energy
Environ. Sci. 10, 2318–2323 (2017).
47. Buelens, L. C., Galvita, V. V, Poelman, H., Detavernier, C. & Marin, G. B. "Super-
dry reforming of methane intensifies CO2 utilization via Le Chatelier’s principle."
Science 354, 449–452 (2016).
48. De Klerk, A. "Gas-to-liquids Conversion." in Presentation at ARPA-E, US
Department of Energy (2012).
49. Wood, D. A., Nwaoha, C. & Towler, B. F. "Gas-to-liquids (GTL): A review of an
industry offering several routes for monetizing natural gas." J. Nat. Gas Sci. Eng. 9,
196–208 (2012).

68
50. Mallik, A. & Mantri, V. "Gas-to-liquids plants face challenges in the U.S. market."
U.S. Energy Information Administration (EIA) (2014).
51. Goellner, J. et al. "Analysis of Natural Gas-to-Liquid Transportation Fuels via
Fischer-Tropsch." National Energy Technology Lab (2013).
52. Chmielniak, T. & Sciazko, M. "Co-gasification of biomass and coal for methanol
synthesis." Appl. Energy 74, 393–403 (2003).
53. Yoon, H. C. & Erickson, P. A. "Hydrogen from coal-derived methanol via
autothermal reforming processes." Int. J. Hydrogen Energy 33, 57–63 (2008).
54. Lin, H., Jin, H., Gao, L. & Han, W. "Economic analysis of coal-based
polygeneration system for methanol and power production." Energy 35, 858–863
(2010).
55. U.S. Department of Energy. Coal Conversion: Steam-Iron System for Production of
Hydrogen. (1977).
56. Bair, W., Leppin, D. & Lee, A. "Design and Operation of Catalytic Methanation in
the HYGAS Pilot Plant." in Methanation of Synthesisi Gas 123–137 (American
Chemcial Society, 1975).
57. Deshpande, N., Majumder, A., Qin, L. & Fan, L.-S. "High-Pressure Redox Behavior
of Iron-Oxide-Based Oxygen Carriers for Syngas Generation from Methane."
Energy & Fuels 29, 1469–1478 (2015).
58. Fan, L.-S., Wang, D. & Kathe, M. "Integrated chemical looping reactor system
configured with unequal reactor operating pressure." (2017).
59. Kathe, M. et al. Chemical Looping Gasification for Hydrogen Enhanced Syngas
Production with In-Situ CO2 Capture. (2015).
60. Dezurick Inc. "Hilton Fabricated & Custom Valves: Large Diameter Knife Gate
Valves, Hydro Guard, Jet Flow and Control Valves, Wege Gate, Check and
Specialty Valves." (2012).
Copyright © 2022 FDOKUMEN