
Blue Hydrogen Solutions - Global Syngas Technologies Council
Upload
independentCategory
view
2download
0
DOI: 10.1002/cphc.201200046
Photocatalytic Generation of Syngas Using Combustion-Synthesized Silver Bismuth TungstateNorma R. de Tacconi,*[a, b] Hari Krishna Timmaji,[c] Wilaiwan Chanmanee,[a, b]
Muhammad N. Huda,[d] Pranab Sarker,[d] Csaba Jan�ky,[b, e] and Krishnan Rajeshwar*[a, b]
1. Introduction
Syngas (or “synthesis gas”) is the name given to a gas mixturethat contains varying amounts of CO and H2. It is an importantprecursor to the synthesis of liquid fuels (hence its name).Common examples of producing syngas include the steam re-forming of methane or liquid hydrocarbons, and the gasifica-tion of coal or biomass. Thermally mild (i.e. , low temperature)alternatives for producing this transportable chemical fuel mix-ture obviously would be significant from an energy perspec-tive. Value is even further added if the production process canbe driven via a renewable solar energy source from a sourcegreenhouse gas material such as CO2.[1] However the first stepof converting a very stable molecule of CO2 to CO is theenergy hog in the overall process and requires a minimum of1.33 eV. For electrochemical conversion of CO2, this means thatthe cathode must be run at very negative potentials for this re-action to occur.[2, 3] Photocatalysis using inorganic oxide semi-conductors and ideally, solar excitation, would be an attractivestrategy to circumvent this energy bottleneck. Consequently,photocatalytic generation of syngas has begun to attract con-siderable attention.[4] Thus, a primary objective of this study isto show that Pt-modified AgBiW2O8 can generate syngas undermild conditions involving only band-gap irradiation of the pho-tocatalyst particle suspensions.
A key parameter in the life-cycle analyses of solar energymaterials and devices is the energy payback time, that is, thetime it takes for the energy needed for material synthesis tobe recovered. The energy payback time can be effectivelyshrunk by deploying “mild” (low-temperature) synthesis routes.Such candidates include electrodeposition, chemical bath dep-osition, and sol–gel chemistry. Another strategy for reducingthe energy payback time is to make the synthesis efficient,
both in terms of energy requirement and time duration. In thisregard, all the synthesis methodologies listed above sufferfrom requiring rather long reaction times ranging from severalminutes to hours.
Self-propagating high-temperature synthesis—or combus-tion synthesis—is both energy- and time-efficient. In one typeof combustion synthesis,[5, 6] a solution mixture of metal precur-sor and an organic fuel such as urea is first dehydrated, thenignited and finally brought to combustion (see Figure 1 inref. [6]). This process variant, termed here as solution combus-tion synthesis (SCS), was employed for this study. Importantly,the exothermicity of the combustion reaction provides theenergy requirement for the synthesis in this scheme. As anadded bonus to the reduction in external energy input are thefollowing features: a) The reaction times are very short for the
[a] Dr. N. R. de Tacconi, Dr. W. Chanmanee, Prof. K. RajeshwarCenter for Renewable Energy Science & Technology (CREST)University of Texas at Arlington, Arlington, TX 76019 (USA)E-mail : [email protected]
[b] Dr. N. R. de Tacconi, Dr. W. Chanmanee, Dr. C. Jan�ky, Prof. K. RajeshwarDepartment of Chemistry & BiochemistryUniversity of Texas at Arlington, Arlington, TX 76019 (USA)
[c] Dr. H. K. TimmajiEnvironmental & Earth Sciences ProgramUniversity of Texas at Arlington, Arlington, TX 76019 (USA)
[d] Dr. M. N. Huda, P. SarkerDepartment of Physics, University of Texas at ArlingtonArlington, TX 76019 (USA)
[e] Dr. C. Jan�kyDepartment of Physical Chemistry and Materials ScienceUniversity of Szeged, Szeged, Aradi Sq. 1, H6720 (Hungary)
Silver bismuth tungstate (AgBiW2O8) nanoparticles were pre-pared for the first time by solution combustion synthesis byusing the corresponding metal nitrates as the precursor andurea as the fuel. These nanoparticles were subsequently modi-fied with Pt catalyst islands using a photocatalytic procedureand used for the photogeneration of syngas (CO + H2). Formicacid was used for this purpose for the in situ generation ofCO2 and its subsequent reduction to CO. In the absence of Ptmodification, H2 was not obtained in the gas products evolved.These results were compared with those obtained with aceticacid in place of formic acid. The combustion process was simu-
lated by thermogravimetry and the synthesized powder wascharacterized using transmission electron microscopy, diffusereflectance UV/Vis spectroscopy, X-ray diffraction, surface areameasurements, and X-ray photoelectron spectroscopy. Taucplots derived from the diffuse reflectance data yielded an opti-cal band gap of 2.74 eV. The photocatalytic activity of thesenanoparticles was superior to a sample prepared by solid-statesynthesis. Mechanistic aspects are finally presented, as arestructural models and electronic calculations, using densityfunctional theory (DFT).
ChemPhysChem 0000, 00, 1 – 12 � 2012 Wiley-VCH Verlag GmbH & Co. KGaA, Weinheim &1&
These are not the final page numbers! ��

synthesis (typically only a few minutes). b) The high reactiontemperatures result in a finely dispersed and porous morphol-ogy for the synthesized product. c) The equipment needed issimple and cost-effective. d) Environmentally benign precursorchemicals can be used (unlike, for example, in chemical vapordeposition or molecular beam epitaxy).
There is only one study that we are aware of on the prepara-tion and photocatalytic attributes of AgBiW2O8. In this study,this complex oxide was prepared by a high-temperature (973 Kfor 18 h) solid-state reaction (SSR) from the correspondingmetal oxide mixture.[7] However, we show below that the com-bustion-synthesized material has superior photocatalytic activi-ty compared to the solid-state synthesized counterpart.
In a second study,[8] Bi2W2O6 “superstructures” were preparedby hydrothermal synthesis and then modified with Ag (andAgBr) using a deposition-precipitation procedure. Thus the Agcomponent in this case is not intrinsic to the compound struc-ture as in the (single-phase) AgBiW2O8 compound germane tothe present study. A report on the photophysical and photoca-talytic properties of a related material, namely, AgInW2O8 (alsoprepared via solid-state reaction route) is noted.[9] Structuralmodels and electronic calculations on AgBiW2O8 using densityfunctional theory (DFT) are presented below.
2. Results and Discussion
2.1. Theory and Modeling
2.1.1. Crystal-Structure Modeling Considerations for AgBiW2O8
Double tungstates of mono- and trivalent metals with compo-sition: AB(WO4)2 are known to have structural polymorphism.[10]
Here, A is a monovalent alkali metal (or Ag, Tl) and B repre-sents a trivalent element such as Bi, In, Sc, Ga, Al, Fe, or Cr. Todate, very little is known on the exact crystal structure ofAgBiW2O8. As the monoclinic structure has been experimental-ly identified for AgBiW2O8 (see below and also ref. [7]), we haveconsidered three possible monoclinic mineral structures forfurther calculations (energy minimization): woframite, scheeliteand fergusonite. Figure 1 shows the atomic arrangements forthese three crystal configurations. Several possible relativesites for Ag and Bi were considered and the lowest energyones were chosen for the final calculations. Although thescheelite structure usually is characterized by a tetragonal unitcell, the monoclinic CaWO4-d structure which is distorted fromtetragonal symmetry appears to be energetically favored. Thewolframite and scheelite structures are closely related andtransform into one another depending on the cationic (R3 +)radii.[10] On the other hand, fergusonite, another distortedscheelite structure,[11, 12] also has a monoclinic unit cell lattice.Both the fergusonite and wolframite supercells contain 24atoms (two formula units) each, whereas the scheelite super-cell contains a total of 48 atoms (four formula units).
With our total-energy DFT calculations, the wolframite struc-ture in Figure 1 was found to be the most stable, while thescheelite and fergusonite structures were 0.69 and 0.28 eVhigher in energy, respectively. This finding contradicts an earli-er published result,[7] which predicted a monoclinic I2/m sym-
metry for AgBiW2O8.In fact, the relevant mineral structure thatcan be used for symmetry I2/m (a sub-group of group #12) hasa hollendite structure. This structure cannot accommodatea layered Ag-Bi-W-O framework. In fact, the bonding coordina-tion in this case will not even accommodate a W atom in thestructure. Another group #12 structure is aluminum tungstate,but it has subgroup C2/m. This structure was indeed evaluat-ed; however, it was not as stable as wolframite. Thus, no otherstructure was found with I2/m symmetry that can accommo-date a Ag�Bi�W�O bonding network.
Therefore, the following discussion is based on the wolf-ramite structure. Wolframite belongs to the monoclinic spacegroup P2=c (No. 13, Z = 2)[13] as in the AWO4 (A = Cd, Mn, Fe)family. In this structure, each W atom is coordinated to six Oatoms, forming octahedral WO6 structural units (Figure 1). Twodistinct oxygen atoms (referred to as O1 and O2) occupy twodifferent sites in this structure: type O1 is connected to onetungsten atom with a shorter bond length and to two Aatoms with larger bond lengths. On the other hand, Type O2 isbonded to two different W atoms and to one A atom. Thus,the overall structure is made up of hexagonally close-packedoxygens with certain octahedral sites occupied by A and Wcations.[14] For our present calculations, a double unit cell ofwolframite was used where the A-sites were replaced by Ag+
and Bi3 + selectively.
2.1.2. Electronic-Structure Calculations
Figure 2 shows the band structure of the wolframite AgBiW2O8
structure calculated along the special symmetry points in theBrillouin zone. Several aspects of this band structure are noted.Firstly, from the band structure in Figure 2, the fundamentalband gap of AgBiW2O8 was found to be an indirect gap of1.96 eV, where the conduction band minimum occurs betweenthe D and Z points. The long tails of absorption curves forboth SCS and SSR samples (see below) indicate the existence
Figure 1. Structures of three possible lattices for AgBiW2O8 and their relativeenergy differences with respect to the wolframite structure. The higheratomic density in the scheelite structure is due to the fact that the size ofthe supercell is two times that of the other two structures. The purple, gray,yellow and red atoms are Bi, Ag, W and O, respectively.
&2& www.chemphyschem.org � 2012 Wiley-VCH Verlag GmbH & Co. KGaA, Weinheim ChemPhysChem 0000, 00, 1 – 12
�� These are not the final page numbers!
K. Rajeshwar et al.

of an indirect band gap in addition to the main optical transi-tion. Due to the lack of symmetry about the Brillouin zonecenter, the G-point does not contribute either to the valenceband maximum or to the conduction band minimum. The min-imum direct gap of 2.02 eV occurs in between the Y and Epoints. Both of these gaps are smaller than the experimentallymeasured band gaps of ~2.75 eV (see below). However, thisunderestimation of energy band gaps is generally a typical fea-ture of DFT calculations.
Secondly, the valence band here is clearly divided into tworegions. The upper region is from the Fermi level (the highestoccupied level) to 0.5 eV, and the second region starts from0.8 eV. There is a gap of around 0.3 eV between these two re-gions. The orbital compositions of this feature will be dis-cussed in more detail in what follows. Thirdly, the less disper-sive bands along the Z to C points near the band gap indicatethat electron or hole transport across the oxygen layers (alongthe vertical direction in Figure 2) is not very likely due to thehigher electron effective mass in that direction. Hence, elec-tronic conduction is more likely to happen along the 2D hori-zontal planes. The two relatively higher dispersion regions (Yto E and D to Z in Figure 2) in the conduction-band minimaare due to the presence of Bi-p levels, which will also be re-sponsible for higher electron mobility relative to that of theholes in this material.
Figure 3 shows the partial density-of-states (p-DOS) plot forAgBiW2O8. From this plot, it is clearly seen that the upper partof the valence band is dominated by contribution from Ag 4d.Even at the topmost part of the valence band the contribution
from O-p is not significant. Bi-s, which was found as an anti-bonding contribution at the top of the valence band forBiVO4,[15] does not contribute here at all in the upper region ofthe valence band. The contributions of O-p and W-d aroundthe band edges are similar to that of the monoclinic WO3
parent structure.[16] Further, in AgBiW2O8, the valence band is“modulated” by presence of the Ag-d level. This is also respon-sible for the uplift of the valence band edge compared to theWO3 case. As for the conduction band, Bi-p was found at theconduction band minimum, though the lower part of the con-duction band is dominated by W-d levels. Even though the O2p and Bi 6p orbital contributions are small around both theband edges, their presence would facilitate favorable p-d opti-cal transitions.
2.2. Thermogravimetric Simulation of the SolutionCombustion Synthesis of AgBiW2O8
To simulate the combustion reaction via thermogravimetry(TG), an aliquot of the freshly prepared solution precursor mix-ture was placed in the alumina crucible of the instrument. Thishomogenized mixture contained stoichiometric amounts ofthe metal precursors and the fuel (urea) dissolved in 1 m HNO3
(5 mL total volume). The TG trace (sample mass %) as a functionof time (Figure 4) indicates that a mass loss of about 70 %from its initial mass occurs in a time range of 5–6 min fora temperature–time profile comprising stabilization at 30 8Cfollowed by a ramp at 25 8C min�1. This thermal program wasexactly the one used to trigger the combustion reaction in thesynthesis furnace. At about 6 min, the temperature reached180 8C and promoted dehydration of the mixture (Figure 4),thus triggering subsequent combustion reaction involving the
Figure 2. Calculated band structure of wolframite AgBiW2O8 (0 eV refers tothe highest occupied band, Fermi energy).
Figure 3. Calculated partial density of states for wolframite AgBiW2O8 (0 eVrefers to the highest occupied band, Fermi energy).
ChemPhysChem 0000, 00, 1 – 12 � 2012 Wiley-VCH Verlag GmbH & Co. KGaA, Weinheim www.chemphyschem.org &3&
These are not the final page numbers! ��
Photocatalytic Generation of Syngas

precursors and the fuel. The 70 % mass loss accounts for thewater and nitric acid elimination plus the removal of urea asCO2 gas. These data clearly show the short time and the lowtemperature needed to trigger the combustion reaction. Fur-ther, the synthesized powder was found to have an excellentthermal stability in an extensive temperature range (50–800 8C)in both N2 and air as flowing gas (Figure 4 inset).
2.3. Crystal Structure and Morphology
Powder XRD patterns of the SCS and SSR samples are present-ed in Figure 5 and show a reasonable match between bothsamples. Figure 5 also contains the assignment of the XRDpeaks to the corresponding space groups (as provided by theanalysis software) since only one XRD pattern is reported inthe literature[7] and most likely belongs to a multiphase com-pound. Note that the vast majority of the XRD peaks are in-dexed to space group P2/c (group 13) in agreement with the
theoretical prediction (see above) while only few peaks are re-lated to the monoclinic space groups P2/m and P21/n.
The diffraction peaks for the SCS sample are appreciablybroadened relative to the SSR counterpart. This trend is mainlyattributable to the variant particle size in the two cases (seebelow). Accordingly, the average particle size was found to be~6 nm for the SCS powder, and ~30 nm for the SSR powder,as calculated by the Scherrer equation [Eq. (1)]:[17]
D ¼ Kl
bcosqð1Þ
where D is the particle size, K is a constant (0.89), l is the CuKa
wavelength (1.5405 �), b is the full-width-at-half-maximum(FWHM) in radians of a selected diffraction peak, and q is thediffraction angle.
Consistent with the smaller particle size, the SCS samplesalso have a higher surface area (by an order of magnitude) rel-ative to the SSR counterpart, see Table 1. As is also evidentfrom these tabulated data, the SSR sample in our hands has
a somewhat higher surface area than that quoted in a previousstudy. The superior dispersion of the SCS sample relative tothe SSR counterpart, is entirely consistent with the featurementioned in an introductory paragraph, namely that the highreaction temperatures attained in solution combustion synthe-sis,[5, 6] result in a finely dispersed and porous morphology forthe synthesized product. This is all the more desirable giventhat solution combustion synthesis yields the product in mi-nutes as opposed to the several hours-long synthesis timesspanned in solid-state reaction routes.
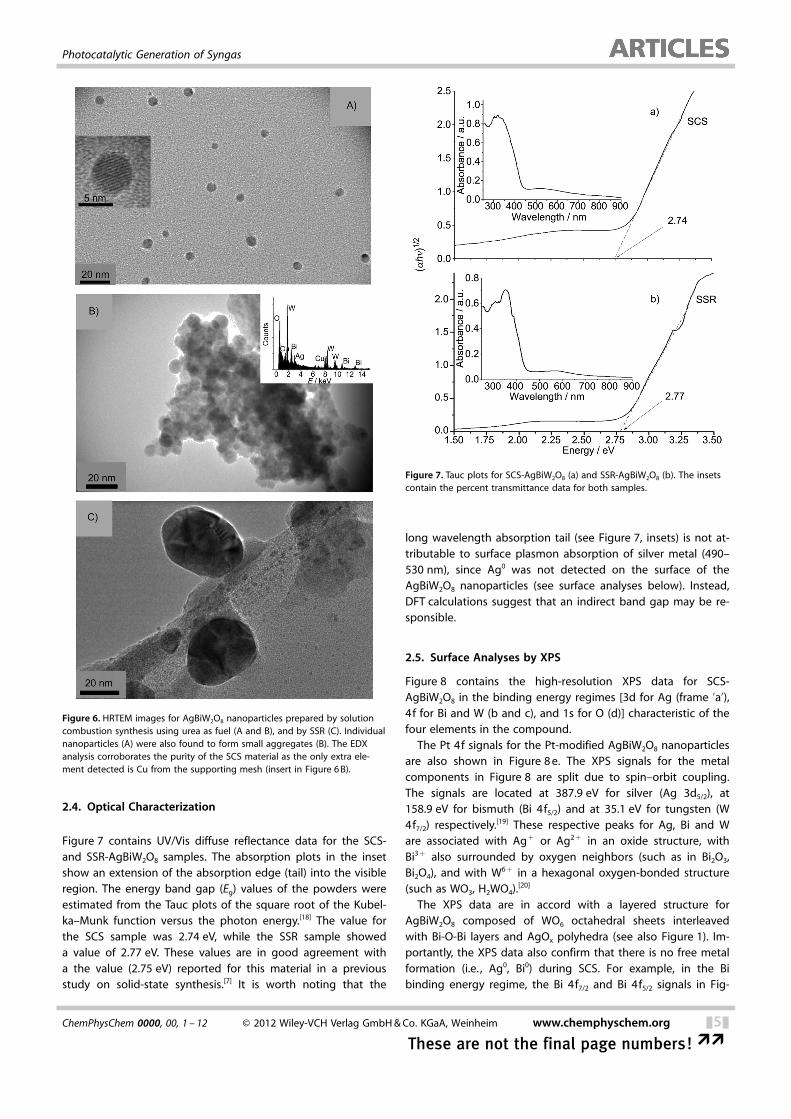
Representative HR-TEM images of both SCS- and SSR-AgBiW2O8 are contained in Figure 6. The HRTEM images depictboth individual spherical nanoparticles with a mean averagesize of 6.6�1.0 nm (Figure 6 A), which are in accord with theparticle size calculated by the Scherrer equation (see above),and small aggregates (Figure 6 B) as a result of partial sinteringoccurring during the CS process. Besides, EDX analysis of a SCSsample (Figure 6 B, inset) corroborates that the nanoparticlescontain Ag, Bi, W and O with stoichiometric ratios as expectedfor AgBiW2O8. It is worth noting that even without a post-syn-thesis thermal anneal step, partially crystalline samples wereobtained from solution combustion synthesis which underlinesthe advantage with this synthesis approach from an energyinput perspective to add to its high time efficiency as notedabove.
Figure 4. TG trace as a function of time (min) of a homogenized mixture ofthe reaction precursors and urea in 1 m HNO3. Experiment run in air andwith a temperature ramp of 25 8C min�1. Inset : TG traces vversus tempera-ture for SCS- AgBiW2O8 in the 50–800 8C range in air and N2, respectively.Temperature ramp = 10 8C min�1.
Figure 5. XRD patterns for SCS- and SSR-AgBiW2O8 samples, along with thepeak indices of the corresponding space groups.
Table 1. Comparison of the surface area of AgBiW2O8 nanoparticles pre-pared by solution synthesis and solid-state reaction.
Photocatalyst Microporearea [cm2]
Externalsurfacearea [cm2]
BETsurfacearea [m2 g�1]
Comment
SCS-AgBiW2O8 5.488 28.938 34.436 this workSSR-AgBiW2O8 0.136 0.406 0.542 this workSSR-AgBiW2O8 - - 0.29 ref. [7]
&4& www.chemphyschem.org � 2012 Wiley-VCH Verlag GmbH & Co. KGaA, Weinheim ChemPhysChem 0000, 00, 1 – 12
�� These are not the final page numbers!
K. Rajeshwar et al.
2.4. Optical Characterization
Figure 7 contains UV/Vis diffuse reflectance data for the SCS-and SSR-AgBiW2O8 samples. The absorption plots in the insetshow an extension of the absorption edge (tail) into the visibleregion. The energy band gap (Eg) values of the powders wereestimated from the Tauc plots of the square root of the Kubel-ka–Munk function versus the photon energy.[18] The value forthe SCS sample was 2.74 eV, while the SSR sample showeda value of 2.77 eV. These values are in good agreement witha the value (2.75 eV) reported for this material in a previousstudy on solid-state synthesis.[7] It is worth noting that the
long wavelength absorption tail (see Figure 7, insets) is not at-tributable to surface plasmon absorption of silver metal (490–530 nm), since Ag0 was not detected on the surface of theAgBiW2O8 nanoparticles (see surface analyses below). Instead,DFT calculations suggest that an indirect band gap may be re-sponsible.
2.5. Surface Analyses by XPS
Figure 8 contains the high-resolution XPS data for SCS-AgBiW2O8 in the binding energy regimes [3d for Ag (frame ’a’),4f for Bi and W (b and c), and 1s for O (d)] characteristic of thefour elements in the compound.
The Pt 4f signals for the Pt-modified AgBiW2O8 nanoparticlesare also shown in Figure 8 e. The XPS signals for the metalcomponents in Figure 8 are split due to spin–orbit coupling.The signals are located at 387.9 eV for silver (Ag 3d5/2), at158.9 eV for bismuth (Bi 4f5/2) and at 35.1 eV for tungsten (W4f7/2) respectively.[19] These respective peaks for Ag, Bi and Ware associated with Ag+ or Ag2+ in an oxide structure, withBi3 + also surrounded by oxygen neighbors (such as in Bi2O3,Bi2O4), and with W6+ in a hexagonal oxygen-bonded structure(such as WO3, H2WO4).[20]
The XPS data are in accord with a layered structure forAgBiW2O8 composed of WO6 octahedral sheets interleavedwith Bi-O-Bi layers and AgOx polyhedra (see also Figure 1). Im-portantly, the XPS data also confirm that there is no free metalformation (i.e. , Ag0, Bi0) during SCS. For example, in the Bibinding energy regime, the Bi 4f7/2 and Bi 4f5/2 signals in Fig-
Figure 6. HRTEM images for AgBiW2O8 nanoparticles prepared by solutioncombustion synthesis using urea as fuel (A and B), and by SSR (C). Individualnanoparticles (A) were also found to form small aggregates (B). The EDXanalysis corroborates the purity of the SCS material as the only extra ele-ment detected is Cu from the supporting mesh (insert in Figure 6 B).
Figure 7. Tauc plots for SCS-AgBiW2O8 (a) and SSR-AgBiW2O8 (b). The insetscontain the percent transmittance data for both samples.
ChemPhysChem 0000, 00, 1 – 12 � 2012 Wiley-VCH Verlag GmbH & Co. KGaA, Weinheim www.chemphyschem.org &5&
These are not the final page numbers! ��
Photocatalytic Generation of Syngas
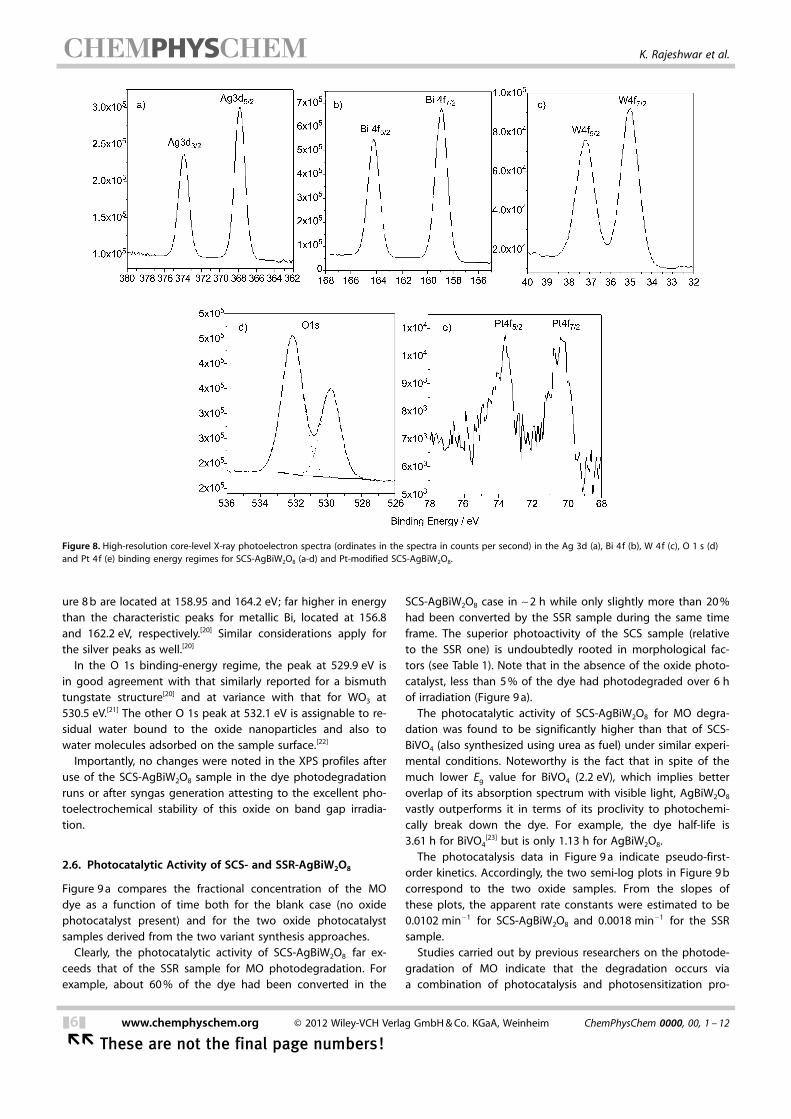
ure 8 b are located at 158.95 and 164.2 eV; far higher in energythan the characteristic peaks for metallic Bi, located at 156.8and 162.2 eV, respectively.[20] Similar considerations apply forthe silver peaks as well.[20]
In the O 1s binding-energy regime, the peak at 529.9 eV isin good agreement with that similarly reported for a bismuthtungstate structure[20] and at variance with that for WO3 at530.5 eV.[21] The other O 1s peak at 532.1 eV is assignable to re-sidual water bound to the oxide nanoparticles and also towater molecules adsorbed on the sample surface.[22]
Importantly, no changes were noted in the XPS profiles afteruse of the SCS-AgBiW2O8 sample in the dye photodegradationruns or after syngas generation attesting to the excellent pho-toelectrochemical stability of this oxide on band gap irradia-tion.
2.6. Photocatalytic Activity of SCS- and SSR-AgBiW2O8
Figure 9 a compares the fractional concentration of the MOdye as a function of time both for the blank case (no oxidephotocatalyst present) and for the two oxide photocatalystsamples derived from the two variant synthesis approaches.
Clearly, the photocatalytic activity of SCS-AgBiW2O8 far ex-ceeds that of the SSR sample for MO photodegradation. Forexample, about 60 % of the dye had been converted in the
SCS-AgBiW2O8 case in ~2 h while only slightly more than 20 %had been converted by the SSR sample during the same timeframe. The superior photoactivity of the SCS sample (relativeto the SSR one) is undoubtedly rooted in morphological fac-tors (see Table 1). Note that in the absence of the oxide photo-catalyst, less than 5 % of the dye had photodegraded over 6 hof irradiation (Figure 9 a).
The photocatalytic activity of SCS-AgBiW2O8 for MO degra-dation was found to be significantly higher than that of SCS-BiVO4 (also synthesized using urea as fuel) under similar experi-mental conditions. Noteworthy is the fact that in spite of themuch lower Eg value for BiVO4 (2.2 eV), which implies betteroverlap of its absorption spectrum with visible light, AgBiW2O8
vastly outperforms it in terms of its proclivity to photochemi-cally break down the dye. For example, the dye half-life is3.61 h for BiVO4
[23] but is only 1.13 h for AgBiW2O8.The photocatalysis data in Figure 9 a indicate pseudo-first-
order kinetics. Accordingly, the two semi-log plots in Figure 9 bcorrespond to the two oxide samples. From the slopes ofthese plots, the apparent rate constants were estimated to be0.0102 min�1 for SCS-AgBiW2O8 and 0.0018 min�1 for the SSRsample.
Studies carried out by previous researchers on the photode-gradation of MO indicate that the degradation occurs viaa combination of photocatalysis and photosensitization pro-
Figure 8. High-resolution core-level X-ray photoelectron spectra (ordinates in the spectra in counts per second) in the Ag 3d (a), Bi 4f (b), W 4f (c), O 1 s (d)and Pt 4f (e) binding energy regimes for SCS-AgBiW2O8 (a-d) and Pt-modified SCS-AgBiW2O8.
&6& www.chemphyschem.org � 2012 Wiley-VCH Verlag GmbH & Co. KGaA, Weinheim ChemPhysChem 0000, 00, 1 – 12
�� These are not the final page numbers!
K. Rajeshwar et al.

cesses in parallel pathways.[24] We have no reason to presumethat a similar mechanistic situation does not apply in the pres-ent case as well.
2.7. Photogeneration of Syngas (H2 + CO) and Methane onPt-Modified AgBiW2O8
Figure 10 compares the temporal evolution (as assayed by GC)of the gaseous products for formic acid (Figure 10 a) and aceticacid (Figure 10 b) as the electron donor. A control with no ini-tial Pt modification of the AgBiW2O8 powder is also included inthe latter case. Control experiments conducted without theoxide semiconductor did not yield any of the products shownin Figure 10, signaling that photolysis of the organic acid is nota factor here. It is also worth noticing that HCOOH performs asan in situ precursor for CO2 generation (Figure 10 a). In fact,the direct electrochemical reduction of CO2 in aqueous mediais hampered both by the low partial pressure of CO2 in the at-mosphere (3.9 � 10�4 atm) and by its low solubility in water(1.5 g L�1 at 298 K).[25] On the other hand, formate species havehigh solubility in water (945 g L�1 at 298 K).[26] Further, theyhave high proclivity for being adsorbed on oxide semiconduc-tor surfaces[27] and are easily oxidized by the photogeneratedholes in the oxide.
In both cases (Figures 10 a,b), the photoreaction is initiatedby photo-oxidation of the respective carboxylic acid (photo-Kolbe reaction) on the oxide photocatalyst surface. Competi-tion by water photo-oxidation is expected only as a minor con-
tribution and the ·OH radicals, generated from initial holeattack on adsorbed water molecules, are most likely involvedin oxidation of the carboxylic acid than in O2 generation. H2
photogeneration on Pt sites occurs in both cases although ini-tial Pt modification of the oxide surface has different conse-quences. In the case of formic acid as the electron donor, H2
photogeneration is completely quenched in the absence of Ptwhile for acetic acid (Figure 10 b), the extent of methane pho-togeneration is influenced by the presence of Pt islands on theoxide surface.
The above observations can be rationalized by invoking radi-cal intermediates that are generated on initial photo-oxidationof the organic acid. The intermediate HCOO· radical generatedin the first case (formic acid) by reaction with a photogeneratedhole (in the oxide) then injects an electron into the AgBiW2O8
conduction band via the well-established current-doublingmechanism (see Figure 11 a).[28] The net result is the formationof hydrogen atoms (on Pt sites followed by subsequent H2 for-mation) and CO2. In the second case for acetic acid, the corre-sponding H3CCOO· photogenerated radical (formed from initialhole attack on acetate) rapidly decomposes to H3CC+ CO2, andthen the H3CC radicals use the hydrogen atoms stored on Pt is-lands to get ultimately converted into CH4 (Figure 11 b). If thePt sites are absent, the surface reaction involving the methylradicals and hydrogen atoms would be inhibited.
What about trends in product evolution in the (dark) electro-chemical cases for the two acids considered here? The electro-chemical oxidation of carboxylic acids (Kolbe reaction) pro-ceeds through different paths depending on the anode materi-al.[29] On a platinum electrode and with simple carboxylic acidssuch as H3CCOOH, the Kolbe reaction (induced, for example,
Figure 9. a) Comparison of methyl orange photodegradation profiles (frac-tional concentration versus irradiation time) for the blank case (no oxidephotocatalyst present) and for the two photocatalyst SCS- and SSR-AgBiW2O8 powders. b) Pseudo-first-order plots corresponding to the twooxide samples (from the data in Figure 9 a).
Figure 10. Temporal evolution (as assayed by GC) of the gaseous productsformed in the photocatalytic reaction of AgBiW2O8-Pt from formic acid (a)and acetic acid (b) as the electron donors. Both systems were saturated withN2.
ChemPhysChem 0000, 00, 1 – 12 � 2012 Wiley-VCH Verlag GmbH & Co. KGaA, Weinheim www.chemphyschem.org &7&
These are not the final page numbers! ��
Photocatalytic Generation of Syngas

by galvanostatic polarization) generates hydrocarbons througha free radical sequence as follows: H3CCOO�!H3CCOO·!H3C· + CO2, 2 H3C·!CH3-CH3. Thus, the normal Kolbe reaction in-volves radical–radical coupling (H3C· coupling) as the predomi-nant mechanism at platinum anodes while an abnormal Kolbereaction almost exclusively occurs at carbon electrodes eitherin organic or in aqueous media generating CH3COOCH3.[29]
With a-substituted carboxylic acids, more complex mecha-nisms involving radicals and/or carbonium ion intermediatesgive rise to the formation of other products such as olefins, al-cohols, ethers, and esters.[30]
Interesting contrasts have been reported in product evolu-tion for similar electrode surfaces with and without illumina-tion.[31–34] Thus, ethane was observed as the dominant producton a TiO2 photoanode in organic media (acetonitrile) with0.1 m tetrabutyl ammonium perchlorate as supporting electro-lyte and 0.08 m of tetrabutyl ammonium acetate as source ofacetate ions.[31] On the other hand, methane (rather thanethane) was reported on photoirradiated TiO2–Pt nanoparticlesin contact with acetic acid very similar to the observations inthis study (Figure 9 b). Methyl radical coupling (leading toethane) is clearly favored on the massive electrode surface be-cause of the site proximity effect.
The quantum yields for the formation of syngas (H2 + CO)and CO2 in the formic acid solution were as follows: H2 = 3.0 %,CO = 0.8 % and CO2 = 4.5 %. [Chemical actinometry using anaqueous solution of 6 mm K3Fe(C2O4)3.3H2O in 1.0 N H2SO4 pro-vided a calculated photon flux of 3.2 � 10�2 moles and thus thereported quantum yield was calculated as the percent ratio ofthe number of moles of product divided by the moles of pho-tons] . The H2:CO2 ratio was seen to be ~1:1.5 for reaction
times up to 1 h, whereas it reached a ratio of 1:2.8 for reactiontimes higher than 3 h. Product amounts at the end of the pho-tocatalytic runs were as follows: H2 = 1.0 � 10�2 mol g�1. L, CO =
3.0 � 10�3 mol g�1. L and CO2 = 2.8 � 10�2 mol g�1. L. These dataare reported as the number of moles of product divided bythe photocatalyst mass and liquid volume in the photoreactor.The turnover number (TON = molar amount of reacted elec-trons divided by molar amount of catalyst) for the photocata-lytic formation of H2 + CO (using a factor 2 to represent thenumber of electrons per H2 and CO respectively) on the Pt-modified SCS-AgBiW2O8 nano- particles reached a value of ca.4.3 after 4 h irradiation, producing 1.0 mmol of H2 and0.3 mmol of CO.
It is worth noticing that CO generated by photodissociationof HCOOH into CO + H2O is precluded in our experiments (l�400 nm) because of the extensive UV light (230–244 nm) re-quired.[35] Besides, CO originating thermally from the hydroge-nation of CO2 reverse water gas shift reaction is equally unlike-ly to occur in the present system because temperatures higherthan 500 8C and a copper-containing catalyst are required forthis latter reaction.[36]
Finally, and in relation to syngas photogeneration, a controlexperiment was carried out in which Pt-modified TiO2 (Degus-sa, P25) was used under otherwise identical experimental con-ditions to those employed for Pt-modified AgBiW2O8. Theturrnover number (TON) for (H2 + CO) photogeneration on Pt–TiO2 after 4 h irradiation was only 0.7; which is almost six timessmaller than with AgBiW2O8. The contrasting performanceseems to be rooted in the facts that : a) AgBiW2O8 is superior(relative to TiO2) in terms of better overlap with visible lightand b) a 0.5 g dose of catalyst implies 6.26 � 10�3 mol for TiO2
but only 6.15 � 10�4 mol in the case of AgBiW2O8. Thus, thehigher molar amount of TiO2 then goes toward detriment ofits TON value.
For the photocatalytic synthesis of CH4 from acetic acid onPt-modified SCS-AgBiW2O8 nanoparticles, the amount of gasesgenerated at the end of the runs was: CH4 = 1.45 � 10�2
mol g�1. L, CO2 = 0.92 � 10�2 mol g�1. L and H2 = 0.24 � 10�2 mol/g. L, with the quantum yields as follows: CH4 = 1.7 %, CO2 =
1.2 % and H2 = 0.3 %. The experimental CH4 :CO2 ratio wasfound to be ~1.5:1 at reaction times up to 1 h, increasingslightly afterwards to 1.6:1.
Figure 11 summarizes the mechanistic paths for the photo-catalytic Kolbe reaction plus other reactions occurring on irra-diation of Pt-modified SCS-AgBiW2O8 nanoparticles in contactwith HCOOH (Figure 11 a) and H3CCOOH (Figure 11 b), respec-tively. The rate constants of the reactions associated with thephotogenerated electrons are indicated as k(x) (with x = 1 to4). The reaction-product profiles are consistent with an order-ing of these rate constants: k(1)>k(2)~k(4)>k(3). The very lowamount of H2 formed in the case of acetic acid is consistentwith k(1)>k(4), which means that the photoelectrons aremainly consumed in the generation of CH4 from the methylradical. Importantly, no C2H6 was found in our experiments in-dicating that the conduction-band electrons are transferred toH3CC, thus cancelling out the radical–radical coupling. Theuptake of e�cb from Pt-modified SCS-AgBiW2O8 is much higher
Figure 11. Mechanistic pathways for the photocatalytic Kolbe reaction alongwith other reactions occurring on irradiation of Pt-modified SCS-AgBiW2O8
nanoparticles in contact with formic acid (a) and acetic acid (b).
&8& www.chemphyschem.org � 2012 Wiley-VCH Verlag GmbH & Co. KGaA, Weinheim ChemPhysChem 0000, 00, 1 – 12
�� These are not the final page numbers!
K. Rajeshwar et al.

by H3CC than by CO2 [k(1)>k(3)] and therefore no CO is ob-served in the data for CH3COOH (Figure 10 b). Further, k(2)>k(3), which would be consistent with the ratio, H2:CO~3: 1,measured for formic acid as the electron donor.
3. Conclusions
In the ongoing search for new oxide photocatalysts and ex-tending beyond the TiO2 prototype, this study has focused onAgBiW2O8 as a promising new member of the Bi�M�O (M = Vor W) family of compounds for mild syngas photogeneration.The combination of theory (DFT) and experiment, as deployedin this study, has enabled a self-consistent formulation of thecrystal structure and bonding framework in this compound.The electronic-structure calculations are also consistent withthe experimental optical data. Most importantly, solution com-bustion synthesis has been shown to be a time- and energy-ef-ficient method to synthesize this compound. When bench-marked against a sample prepared by a solid-state reactionroute, the combustion synthesized sample showed superiorphotocatalytic activity that could be rationalized on morpho-logical grounds. The conduction-band edge of AgBiW2O8 is lo-cated at a potential negative enough for CO2 to be photore-duced. From a practical standpoint, however, the opticalbandgap of this compound (~2.74 eV) is too high for efficientsolar energy conversion. Attempts to sensitize it to visible-lightabsorption are ongoing.
4. Experimental Section
4.1. Chemicals
Silver nitrate, AgNO3 (Fischer, 99.8–100.5 % pure), bismuth nitratepentahydrate, Bi(NO3)3.5H2O (Alfa Aesar, 99 % pure), sodium tung-sten oxide Na2WO4.2H2O (Alfa Aesar, 99.0–101.0 % pure) were usedas precursor materials. Urea was used as the fuel in the combus-tion synthesis process. All chemicals were used as received. Doubledistilled water (Corning Megapure) was used to prepare the solu-tions.
4.2. Solution Combustion Synthesis of AgBiW2O8
Stoichiometric mixtures of AgNO3 and Bi(NO3)3.5H2O were taken ina ceramic crucible and homogenized in 1 m HNO3 medium. Theacid serves to dissolve Bi(NO3)3.5H2O and ensures that the precur-sor species are homogeneously dispersed. In another beaker, stoi-chiometric mixtures of Na2WO4.2H2O and urea were taken, homo-genized in water, and transferred to the crucible containing the Agand Bi precursor mixture where an incipient creamy suspension isformed. The crucible was then placed in a furnace that was heatedat 25 8C min�1 from room temperature to 190 8C and then kept atthat temperature for 3 min for the combustion reaction to takeplace. Once the solution was dehydrated, spontaneous combustionset in with the release of large amount of fumes, and a pale yellowflaky powder was obtained as the final product. The powder wasthen taken out, finely ground in an agate mortar and pestle andwashed several times with distilled water to remove any solubleresidues coming from the precursor species, and finally dried over-night in an oven at 80 8C.
4.3. Solid-State Synthesis of AgBiW2O8
For benchmarking the performance of the combustion-synthesizedsamples, the oxide powder was also synthesized by a solid-statereaction route, as described by previous authors[7] (see also intro-ductory paragraph above). Herein, the solution combustion synthe-sis-derived samples are denoted by the prefix: “SCS” and the solid-state reaction-derived samples are denoted by “SSR’’.
4.4. Physical Characterization of SCS- and SSR-AgBiW2O8
Thermogravimetry (TG) experiments were carried out on a TA In-strument Model Q600 at a heating rate of 25 8C min�1 or10 8C min�1. Precursor mixtures for the combustion synthesis wereplaced in an open alumina crucible either in flowing air or nitro-gen. The samples consisted of a homogenized mixture (in 1 m
HNO3) of stoichiometric precursor amounts and the fuel. The tem-perature ramp was 25 8C min�1 to emulate the preparation protocolin the furnace (see above) while a ramp of 10 8C min�1 was used todetermine the thermal stability of SCS-AgBiW2O8 in an ample tem-perature (up to 800 8C).
Powder X-ray diffraction (XRD) was performed on a Bruker D8 dif-fractometer using CuKa radiation. Diffractograms were acquiredusing a 2q step size of 0.028 and a dwell time of 1.25 s. Furtheranalyses of the XRD patterns used the Philips X-Pert HighScoresoftware. Transmission electron microscopy (TEM) measurementswere performed on a Hitachi H-9500 instrument. For surface-areaand pore-volume measurements, a Micromeritics (Gemini VI) instru-ment was used. Diffuse reflectance spectra were obtained ona Perkin–Elmer Lambda 35 spectrophotometer equipped with anintegrating sphere. The instrumentation used for X-ray photoelec-tron spectroscopy (XPS) is described elsewhere.[37]
4.5. Measurement of the Photocatalytic Activity
The oxidative photocatalytic activity of SCS- and SSR-AgBiW2O8
was evaluated by using the photodegradation of methyl orange(MO) dye as a probe. The custom-designed UV photoreactor forthis purpose consisted of an inner and an outer cylindrical Pyrexglass vessel (400–700 nm transmittance).[38] The light source (400 Wmedium-pressure Hg arc) was placed in the inner vessel, whichhad a provision for water circulation to maintain a uniform reactortemperature, and also to filter out IR radiation. The incidentphoton flux estimated by potassium ferrioxalate actinometry[39]
was 5.21 � 10�4 einsteins per minute. The photocatalytic activity as-sessment was made with the glass inner vessel in place such thatthe UV portion of the lamp output was filtered out. The outer reac-tion vessel was equipped with a sample collection port, in additionto a gas purge connection and a stirrer to ensure dispersion of themixture and to prevent it from settling.
The reaction mixture consisted of an aqueous suspension of250 mL MO solution (concentration: 50 mm) and the photocatalystpowder (dose: 2 g L�1). The pH of the MO solution was adjusted inthe range 3.0–3.2, as it was found from initial experiments that theoptimum pH for the photocatalytic reaction is around 3.0. Thisresult is also in agreement with previous studies on heterogeneousphotocatalytic MO degradation.[24] Preliminary runs were made toassess the influence of purge gas (N2 or O2) on the MO degrada-tion rate and it was found that O2 purge better facilitated the pho-tocatalytic reaction. Blank runs were performed under identical ex-perimental conditions without the photocatalyst.
The reaction mixture was initially stirred in the dark for 30 min toattain adsorption equilibrium.[40] After 30 min, the light was turned
ChemPhysChem 0000, 00, 1 – 12 � 2012 Wiley-VCH Verlag GmbH & Co. KGaA, Weinheim www.chemphyschem.org &9&
These are not the final page numbers! ��
Photocatalytic Generation of Syngas

on and sample aliquots were drawn out at periodic intervals (inthis case, every 1 h). The samples were centrifuged, and filteredusing a 0.45 mm membrane filter to remove residual photocatalystparticles from the solution. The extent of MO degradation was esti-mated by measuring the absorbance of the solution at an analyti-cal wavelength of 502 nm, using an Agilent 8453 UV-visible spec-trophotometer.
4.6. Reaction Product Analyses
For the photogeneration of syngas (CO + H2) from formic acid andmethane from acetic acid, the SCS-AgBiW2O8 nanoparticles werepremodified with Pt-catalyst islands using a photocatalytic proce-dure detailed elsewhere.[41] The nominal Pt dose on the sampleswas 1 % (m/m basis), and they visibly changed color from paleyellow to a dark hue on Pt modification. The reaction mixture forphotocatalysis runs with formic acid and acetic acid subsequentlyconsisted of 0.5 g Pt-modified SCS-AgBiW2O8 in 200 mL of 0.1 m
carboxylic acid solutions saturated with N2. The photoreactor wassealed and gas analysis was performed in a gas chromatographequipped with a Shin Carbon column and a thermal conductivitydetector, using an isothermal program at 70 8C. The instrumentwas initially optimized for detection of CO, CH4, CO2, H2 and O2.
4.7. DFT Methodology
For electronic-structure calculations of AgBiW2O8, the generalizedgradient approximation (PBE-GGA functional)[42, 43] was employed.The PBE functional does not contain any empirically optimized pa-rameters, and hence works better on a wide range of elements.These calculations were performed using DFT as implemented inthe Vienna ab initio simulation package (VASP)[44, 45] code using thestandard frozen-core projector augmented-wave (PAW)[46, 47]
method. In the PAW method, a nonlinear core correction is notnecessary because it is an all-electron-like method. The basis setswere expanded with plane waves with a kinetic energy cutoff of400 eV, and the BZ integrations were performed using the second-order Methfessel–Paxton method.[48] However, density-of-states(DOS) plots were generated with the tetrahedron method.[49] Theion positions and volumes were always relaxed without any sym-metry constraint to allow the internal geometry and the shape ofthe lattice to change freely, and until the force on each of the ionwas 0.01 eV ��1 or less. All computations were performed usingthe High Performance Computing Facility (HPCF) at the Universityof Texas at Arlington. The current facilities at HPCF consist of 856Xeon processors enabling both serial and parallel computing. Forvisualization of the crystal structures, Crystal Maker software wasused.
Acknowledgements
This study was funded in part by a grant from the U.S. Depart-ment of Energy. The authors thank Dr. Wen-Yuan (Willy) Lin (SidRichardson Carbon & Energy Co) for surface area data. MNH andPS are supported by the National Renewable Energy Laboratorysub-contract No. XEJ-9–99042–01, and by UT Arlington’s ResearchEnhancement Program grant. CJ gratefully acknowledges fundingsupport of the European Union under FP7-PEOPLE-2010-IOF,Grant Number: 274046.
Keywords: combustion synthesis · CO2 remediation ·heterogeneous catalysis · silver · titanium dioxide
[1] W. C. Chueh, C. Falter, M. Abbott, D. Scipio, P. Furler, S. M. Haile, A.Steinfeld, Science 2010, 330, 1797 – 1801.
[2] J. O’M Bockris, J. C. Wass, J. Electrochem. Soc. 1989, 136, 2521 – 2528.[3] B. A. Rosen, A. Salehi-Khojin, M. R. Thorson, W. Zhu, D. T. Whipple,
P. J. A. Kenis, R. I. Masel, Science 2011, 334, 643 – 644.[4] B. Kumar, J. M. Smieja, A. F. Sasayama, C. P. Kubiak, Chem. Commun.
2011, 48, 272 – 274.[5] S. T. Aruna, A. S. Mukasyan, Curr. Opin. Solid St. M. 2008, 12, 44 – 50.[6] K. Rajeshwar, N. R. de Tacconi, Chem. Soc. Rev. 2009, 38, 1984 – 1998.[7] J. W. Tang, J. H. Ye, J. Mater. Chem. 2005, 15, 4246 – 4251.[8] L. S. Zhang, K. H. Wong, Z. G. Chen, J. C. Yu, J. C. Zhao, C. Hu, C. Y. Chan,
P. K. Wong, Appl. Catal. A 2009, 363, 221 – 229.[9] J. Tang, Z. Zou, J. Ye, J. Phys. Chem. B 2003, 107, 14265 – 69.
[10] P. V. Klevtsov, R. F. Klevtsova, J. Struct. Chem. 1977, 18, 339-355.[11] K. Ishii, N. Morita, H. Nakayama, S. Tsunekawa, T. Fukuda, Phys. Status
Solidi A 1989, 112, 207 – 214.[12] W. I. F. David, Mater. Res. Bull. 1983, 18, 749 – 756.[13] Y. Abraham, N. A. W. Holzwarth, R. T. Williams, Phys. Rev. B 2000, 62,
1733 – 1741.[14] A. W. Sleight, Acta Crystallogr. B 1972, 28, 2899.[15] A. Walsh, Y. Yan, M. N. Huda, M. M. Al-Jassim, S. H. Wei, Chem. Mater.
2009, 21, 547 – 551.[16] M. N. Huda, Y. F. Yan, C. Y. Moon, S. H. Wei, M. M. Al-Jassim, Phys. Rev. B
2008, 77, 195102 – 1.[17] B. D. Cullity, Elements of X-Ray Diffraction, Addison-Wesley: Reading,
MA, 1967.[18] A. P. Finlayson, V. N. Tsaneva, L. Lyons, M. Clark, B. A. Glowacki, Phys.
Status Solidi A 2006, 203, 327 – 335.[19] C. D. Wagner, W. M. Riggs, L. E. Davis, J. F. Moulder, G. E. Mullenberg,
Handbook of X-ray Photoelectron Spectroscopy, Perkin – Elmer Corp. EdenPrairie, MN, 1979.
[20] G. S. Li, D. Q. Zhang, J. C. Yu, M. K. H. Leung, Environ. Sci. Technol. 2010,44, 4276 – 4281.
[21] C. Cantalini, H. T. Sun, M. Faccio, M. Pelino, S. Santucci, L. Lozzi, M. Pas-sacantando, Sens. Actuators B 1996, 31, 81 – 87.
[22] G. Leftheriotis, S. Papaefthimiou, P. Yianoulis, A. Siokou, Thin Solid Films2001, 384, 298 – 306.
[23] H. K. Timmaji, W. Chanmanee, N. R. de Tacconi, K. Rajeshwar, J. Adv.Oxid. Technol. 2011, 14, 93 – 105.
[24] L. Ge, J. Mol. Catal. A Chem. 2008, 282, 62 – 66.[25] D. A. Palmer, R. Vaneldik, Chem. Rev. 1983, 83, 651 – 731.[26] CRC Handbook of Chemistry and Physics, 82nd ed. , CRC Press Boca
Raton, FL, 2001.[27] C. R. Chenthamarakshan, K. Rajeshwar, Electrochem. Commun. 2000, 2,
527 – 530.[28] S. R. Morrison, The Chemical Physics of Surfaces, Plenum Press, New York
and London 1977, pp. 280 – 283.[29] W. H. Koehl, J. Am. Chem. Soc. 1964, 86, 4686 – 4690.[30] B. C. I. Weedon in Advances in Organic Chemistry, Vol. I (Eds. I. A. Ra-
phael, R. C. Taylor, H.Wynberg, Interscience Publishers Inc. , New York1960, pp. 1 – 34,.
[31] B. Kraeutler, A. J. Bard, J. Am. Chem. Soc. 1977, 99, 7729 – 7731.[32] B. Kraeutler, C. D. Jaeger, A. J. Bard, J. Am. Chem. Soc. 1978, 100, 4903 –
4905.[33] B. Kraeutler, A. J. Bard, J. Am. Chem. Soc. 1978, 100, 2239 – 2240.[34] B. Kraeutler, A. J. Bard, J. Am. Chem. Soc. 1978, 100, 5985 – 5992.[35] H. Cunshun, C. Zhang, X. Yang, J. Chem. Phys. 2010, 132, 154306.[36] C-S. Chen, W-H Cheng, S-S. Lin, Appl. Catal. A 2003, 238, 55 – 67.[37] X. Chen, K. Rajeshwar, R. B. Timmons, J. J. Chen, O. M. R. Chyan, Chem.
Mater. 1996, 8, 1067 – 1077.[38] W. Y. Lin, C. Wei, K. Rajeshwar, J. Electrochem. Soc. 1993, 140, 2477 –
2482.[39] S. L. Murov, I. Carmichael, G. L. Hug, Handbook of Photochemistry, 2nd
Ed. , Marcel Dekker Inc. , New York, 1993.[40] C. R. Chenthamarakshan, K. Rajeshwar, Langmuir 2000, 16, 2715 – 2721.
&10& www.chemphyschem.org � 2012 Wiley-VCH Verlag GmbH & Co. KGaA, Weinheim ChemPhysChem 0000, 00, 1 – 12
�� These are not the final page numbers!
K. Rajeshwar et al.

[41] N. R. de Tacconi, C. R. Chenthamarakshan, K. Rajeshwar, W. Y. Lin, T. F.Carlson, L. Nikiel, W. A. Wampler, S. Sambandam, V. Ramani, J. Electro-chem. Soc. 2008, 155, B1102.
[42] J. P. Perdew, J. A. Chevary, S. H. Vosko, K. A. Jackson, M. R. Pederson,D. J. Singh, C. Fiolhais, Phys. Rev. B 1992, 46, 6671 – 6687.
[43] J. P. Perdew, K. Burke, M. Ernzerhof, Phys. Rev. Lett. 1996, 77, 3865 –3568.
[44] G. Kresse, J. Furthm�ller, Phys. Rev. B 1996, 54, 11169 – 11186.[45] G. Kresse, J. Furthm�ller, Comput. Mater. Sci. 1996, 6, 15 – 50.
[46] G. Kresse, D. Joubert, Phys. Rev. B 1999, 59, 1758 – 1775.[47] P. E. Blochl, Phys. Rev. B 1994, 50, 17953 – 17979.[48] M. Methfessel, A. T. Paxton, Phys. Rev. B 1989, 40, 3616 – 3621.[49] P. E. Blochl, O. Jepsen, O. K. Andersen, Phys. Rev. B 1994, 49, 16223 –
16233.
Received: January 17, 2012Published online on && &&, 2012
ChemPhysChem 0000, 00, 1 – 12 � 2012 Wiley-VCH Verlag GmbH & Co. KGaA, Weinheim www.chemphyschem.org &11&
These are not the final page numbers! ��
Photocatalytic Generation of Syngas

ARTICLES
N. R. de Tacconi,* H. K. Timmaji,W. Chanmanee, M. N. Huda, P. Sarker,C. Jan�ky, K. Rajeshwar*
&& –&&
Photocatalytic Generation of SyngasUsing Combustion-Synthesized SilverBismuth Tungstate
Silver bismuth tungstate nanoparticlesare prepared by solution combustionsynthesis, modified with a Pt co-catalyst,and finally used for the photogenera-tion of syngas (CO + H2). Formic acid isused to produce CO2 in situ and subse-quently reduce it to CO. The photocata-lytic activity of these nanoparticles is su-perior to that of nanoparticles preparedby solid-state synthesis.
&12& www.chemphyschem.org � 2012 Wiley-VCH Verlag GmbH & Co. KGaA, Weinheim ChemPhysChem 0000, 00, 1 – 12
�� These are not the final page numbers!
Copyright © 2022 FDOKUMEN