
CALCIUM LOOPING FOR POST-COMBUSTION CO2 ...
197
CALCIUM LOOPING FOR POST-COMBUSTION CO2 CAPTURE IN THERMAL POWER PLANTS Sudá de Andrade Neto Dissertação de Mestrado apresentada ao Programa de Pós-graduação em Planejamento Energético, COPPE, da Universidade Federal do Rio de Janeiro, como parte dos requisitos necessários à obtenção do título de Mestre em Planejamento Energético Orientador(es): Alexandre Salem Szklo Pedro Rua Rodriguez Rochedo Rio de Janeiro Março de 2020
-
Upload
khangminh22 -
Category
Documents
-
view
0 -
download
0
Transcript of CALCIUM LOOPING FOR POST-COMBUSTION CO2 ...

CALCIUM LOOPING FOR POST-COMBUSTION CO2 CAPTURE IN THERMAL
POWER PLANTS
Sudá de Andrade Neto
Dissertação de Mestrado apresentada ao Programa
de Pós-graduação em Planejamento Energético,
COPPE, da Universidade Federal do Rio de
Janeiro, como parte dos requisitos necessários à
obtenção do título de Mestre em Planejamento
Energético
Orientador(es): Alexandre Salem Szklo
Pedro Rua Rodriguez Rochedo
Rio de Janeiro
Março de 2020

CALCIUM LOOPING FOR POST-COMBUSTION CO2 CAPTURE IN THERMAL
POWER PLANTS
Sudá de Andrade Neto
DISSERTAÇÃO SUBMETIDA AO CORPO DOCENTE DO INSTITUTO ALBERTO
LUIZ COIMBRA DE PÓS-GRADUAÇÃO E PESQUISA DE ENGENHARIA DA
UNIVERSIDADE FEDERAL DO RIO DE JANEIRO COMO PARTE DOS
REQUISITOS NECESSÁRIOS PARA A OBTENÇÃO DO GRAU DE MESTRE EM
CIÊNCIAS EM PLANEJAMENTO ENERGÉTICO
Orientadores: Alexandre Salem Szklo
Pedro Rua Rodriguez Rochedo
Aprovada por: Prof. Alexandre Salem Szklo
Prof. Pedro Rua Rodriguez Rochedo
Prof. Bettina Susanne Hoffmann
Prof. Thiago Fernandes de Aquino
RIO DE JANEIRO, RJ - BRASIL
MARÇO DE 2020

iii
Neto, Sudá de Andrade
Calcium Looping for post-combustion CO2
capture in thermal power plants / Sudá de Andrade
Neto – Rio de Janeiro: UFRJ/COPPE, 2020.
XIV, 183 p.: il.; 29,7 cm.
Orientadores: Alexandre Salem Szklo
Pedro Rua Rodriguez Rochedo
Dissertação (mestrado) – UFRJ/ COPPE/
Programa de Planejamento Energético, 2020.
Referências Bibliográficas: p. 153-183.
1. Captura de Carbono. 2. Looping de Cálcio. 3.
CCS. I. Szklo, Alexandre Salem et al. II.
Universidade Federal do Rio de Janeiro, COPPE,
Programa de Planejamento Energético. III. Título.

iv
Agradecimentos
Aos meus orientadores Alexandre Szklo e Pedro Rochedo. Alexandre, além de ser
uma das pessoas mais geniais que já tive o prazer de conhecer, foi quem me incentivou a
abordar este tema e me orientou com imenso profissionalismo, paciência e dedicação.
Não bastasse o brilhantismo como professor, é alguém que possui um grande coração e
que tem a rara capacidade de saber dosar firmeza e afabilidade com seus alunos. Pedro,
mesmo ainda sendo um jovem engenheiro e professor, possui uma bagagem técnica
impressionante e teve um papel fundamental não somente na elaboração deste trabalho,
mas também em minha trajetória ao longo do mestrado. Em suma, ambos são para mim
fonte de inspiração e admiração, e me traz alegria pensar na escolha acertada que fiz ao
pedir para que me orientassem. Sem a ajuda deles, não seria possível a realização deste
trabalho.
Ao professor Thiago Fernandes de Aquino e à professora Bettina Susanne
Hoffmann por aceitarem fazer parte da banca examinadora e pelas sugestões e
contribuições que fizeram a este trabalho.
Aos professores do PPE, André Lucena, Roberto Schaeffer, Mauricio
Tolmasquim, Marcos Freitas, David Castelo Branco e Emílio La Rovere, que
contribuíram muito para minha formação neste período. Também à equipe administrativa
do PPE, em particular à Sandrinha, mas também ao Paulo, Fernando e Queila, que sempre
estiveram dispostos a atender às minhas demandas e questionamentos com agilidade e
boa vontade.
À minha mãe, por tudo. Seu amor e suporte incondicionais me deram a base e a
tranquilidade para que eu pudesse cursar o mestrado. À minha irmã, por dividir comigo a
aptidão acadêmica e, com isso, por compreender como ninguém minhas dúvidas,
angústias e dificuldades. O convívio familiar harmonioso com as duas tornou tudo mais
fácil. Ao meu tio Jorge, por sempre torcer por mim. Ao meu pai (in memoriam), por
estimular minha curiosidade e amor pelo conhecimento.
Aos meus amigos, em especial ao José Ururahy, Igor Cardoso, Carlos Eduardo
Arraes, Vinicius Damous, Anna Metne, Livia Vreuls, Fernanda Romano, Gabriel
Saramago, Débora Ladeira, Matheus Poggio, Marcos Magnus, Gilberto De Martin,

v
George Hambling e Julian Aurelle por sempre acreditarem no meu potencial e me
apoiarem em todos os momentos.
À Fundação de Amparo à Pesquisa do Estado do Rio de Janeiro (FAPERJ) pelo
apoio financeiro em forma de bolsa de estudo e ao IVIG/COPPE pela oportunidade de
trabalho que me proporcionou experiência profissional e suporte financeiro.

vi
Resumo da Dissertação apresentada à COPPE/UFRJ como parte dos requisitos
necessários para a obtenção do grau de Mestre em Ciências (M.Sc.)
LOOPING DE CÁLCIO PARA CAPTURA DE CO2 VIA PÓS-COMBUSTÃO EM
PLANTAS TERMOELÉTRICAS
Sudá de Andrade Neto
Março/2020
Orientadores: Alexandre Salem Szklo
Pedro Rua Rodriguez Rochedo
Programa: Planejamento Energético
A captura de carbono é uma alternativa importante para reduzir as emissões de
CO2 no setor energético. O looping de cálcio (CaL) é um promissor processo de captura
que pode ser aplicado em usinas térmicas a combustível sólido existentes, novas e/ou
capture-ready. Este trabalho investiga o desempenho técnico-econômico de sistemas CaL
integrados a usinas térmicas alimentadas com carvão mineral e bagaço de cana-de-açúcar.
Estes sistemas foram simulados e comparados com usinas de referência sem captura e
com usinas com absorção química usando solvente à base de aminas, atual referência para
a rota de pós-combustão. Parâmetros-chave como potencial de remoção de CO2, redução
de custos devido ao aprendizado tecnológico, uso de água, espaço físico necessário e
custo nivelado de energia (LCOE) foram analisados. O software IECM foi usado para
conduzir as simulações das plantas. Os resultados demonstram que o CaL tem um custo
maior, considerando os níveis atuais de maturidade tecnológica, em comparação com as
rotas de absorção química. Porém, apresenta vantagens em eficiência térmica, energia
extra gerada, emissões específicas e eficiência no uso de água. Além disso, esses sistemas
têm potencial para serem mais econômicos no longo prazo, e investimentos em plantas
piloto devem ser estimulados para promover o seu aprendizado e permitir a
implementação de plantas de grande porte. Estas devem operar com maior flexibilidade
operacional e eficiência térmica do que tecnologias mais maduras de captura de CO2.

vii
Abstract of Dissertation presented to COPPE/UFRJ as a partial fulfillment of the
requirements for the degree of Master of Science (M.Sc.)
CALCIUM LOOPING FOR POST-COMBUSTION CO2 CAPTURE IN THERMAL
POWER PLANTS
Sudá de Andrade Neto
March/2020
Advisors: Alexandre Salem Szklo
Pedro Rua Rodriguez Rochedo
Department: Energy Planning
Carbon capture and storage is an important alternative to reduce emissions of
carbon dioxide in the energy sector. Calcium looping (CaL) is a promising carbon capture
process to be applied to existing, greenfield, and/or capture-ready solid fuel combustion
plants. This work investigates the technical and economic performance of CaL systems
added to thermal power plants fuelled with coal and sugarcane bagasse. Power plants
integrated with CaL were simulated and compared with their correspondent base plant
without CO2 capture and with chemical absorption using amine-based solvent, the
benchmark for post-combustion CO2 capture, as of today. Key parameters such as CO2
removal potential, cost reduction due to technology learning, water use, added plant
footprint, and levelized cost of energy (LCOE) were analyzed. The software IECM was
utilized to conduct the plant simulations. Results demonstrate calcium looping is more
costly in comparison to the chemical absorption route considering current technology
maturity levels, but the assessed system presents competitive advantages in
thermodynamic efficiency, electricity surplus, plant-specific emissions, and water use
efficiency. Furthermore, CaL systems could be more economical in the future and
investments in pilot-size units should be stimulated in the near term to promote learning
and allow the implementation of large-scale plants. These plants will likely operate with
greater operational flexibility and thermal efficiency than more mature CO2 capture
technologies.

viii
Table of Contents
1. Introduction ......................................................................................................................... 1
1.1 Motivation and structure ..................................................................................................... 1
1.2 Objectives ............................................................................................................................ 8
2. Technical background....................................................................................................... 10
2.1 Carbon capture and storage (CCS) .............................................................................. 10
2.1.1 Technology options for CO2 capture .......................................................................... 12
2.1.2 Pre-combustion........................................................................................................... 15
2.1.3 Oxy-combustion ......................................................................................................... 16
2.1.4 Post-combustion ......................................................................................................... 16
2.1.5 High-temperature solid looping cycles ....................................................................... 19
2.2 Chemical looping techniques overview ............................................................................ 22
2.3 Chemical Looping with oxygen carriers ..................................................................... 25
2.4 Calcium looping (CaL) for post-combustion CO2 capture ................................................ 29
2.4.1 Review on similar work ............................................................................................. 35
2.4.2 Integration and operational challenges ....................................................................... 40
2.4.3 Pilot plant experience with CaL systems ................................................................... 47
2.4.4 Relevant feedstock properties .................................................................................... 53
3. Modelling of Calcium Looping cycles for post-combustion CO2 capture..................... 61
3.1 Performance models .......................................................................................................... 61
3.1.1 Solid sorbent activity .................................................................................................. 62
3.1.2 Solids mass balance .................................................................................................... 70
3.1.3 Heat (Energy) balance ................................................................................................ 76
3.1.4 Gases mass balance ............................................................................................. 80
3.1.5 Heat recovery from CaL process ......................................................................... 81
3.2 Carbonator and calciner reactor design for fluidized-bed systems ................................... 83
3.2.1 Carbonator design ............................................................................................... 83
3.2.2 Calciner design .................................................................................................... 87
3.2.3 Reactors dimensions ............................................................................................ 92
4. Methods and Data ............................................................................................................. 96
4.1 Methodological Procedure .......................................................................................... 96
4.2 Feedstock selection criteria ......................................................................................... 98
4.3 System simulation with software Integrated Environmental Control Model (IECM) .... 103
4.4 Economic performance and cost model for CaL systems ............................................... 105
4.4.1 Technology readiness level and contingency costs .................................................. 109

ix
4.4.2 Cost structure of the post-combustion CaL system .................................................. 113
4.4.3 Summary of financial assumptions .......................................................................... 115
4.5 Case study assumptions ............................................................................................. 118
4.5.1 Configuration 1 – Reference plant (without CCS) ................................................... 118
4.5.2 Configuration 2 - Large-scale calcium looping carbon capture unit ........................ 120
4.5.3 Configuration 3 - Large-scale chemical absorption amine-based carbon capture unit ........................................................................................................................................... 122
5. Results Analysis ................................................................................................................... 124
5.1 Supercritical CFPP .................................................................................................... 124
5.1.1 Technical results ................................................................................................ 124
5.1.2 Economic results ............................................................................................... 128
5.1.3 Water use analysis ............................................................................................. 131
5.1.4 Plant footprint analysis ...................................................................................... 134
5.2 Comparative analysis for subcritical BFPP ............................................................... 137
5.3 Comparative analysis for subcritical CFPP ............................................................... 140
5.4 Sensitivity analysis .................................................................................................... 142
5.4.1 Fuel price ........................................................................................................... 142
5.4.2 Size .................................................................................................................... 143
5.4.3 Capacity factor .................................................................................................. 144
5.4.4 Contingency factor ............................................................................................ 145
6. Conclusions ...................................................................................................................... 147
References ................................................................................................................................ 153

x
List of Figures
Figure 2.1 CCS represents 7% of emissions reductions in the SDS (IEA, 2019a). ................... 10 Figure 2.2 CCS initiatives worldwide by type of separation process. Elaborated by the author based on data obtained from The US Department of Energy (2019c). ....................................... 13 Figure 2.3 Post-combustion CO2 capture general scheme (US NETL, 2019) ............................ 17 Figure 2.4. CL processes possible classifications. Elaborated by the author. ............................. 21 Figure 2.5. A general scheme for the CLC process. Adapted from Sai et al. (2018) .................. 25 Figure 2.6 Simplified block diagram for coal direct chemical looping combustion (CLC) process. Obtained from (MUKHERJEE, KUMAR, et al., 2015)................................................ 27 Figure 2.7. Conceptual scheme for the Calcium Looping process used in post-combustion carbon dioxide capture of a PC plant. Obtained from (MANTRIPRAGADA, RUBIN, 2017a). 21 Figure 2.8. Conceptual scheme for of CaL-based post-combustion CO2 capture system for a pulverized coal (PC) powerplant. Obtained from (MANTRIPRAGADA, RUBIN, 2017a) ....... 34 Figure 2.9. Scheme for the integration of a secondary steam cycle into an existing coal-fired plant. Obtained from (ROMANO et al. 2012). ........................................................................... 41 Figure 2.10 (Left) Particle size distribution of the circulating sorbent (experimentally measured and simulated) and the fresh limestone during test campaigns at Technische Universität Darmstadt. Obtained from (Haaf et al., 2017). (Right) Cumulative particle size of raw limestone and calciner bed material in steady-state. Obtained from (Dieter et al., 2012) ........................... 45 Figure 2.11 A) Front view of La Pereda pilot plant B) Scheme of the interconnected fluidized reactors. Obtained from (Arias et al., 2017b). ............................................................................. 49 Figure 3.1. A cycle of carbonation and calcination observed by a TGA. Obtained from OZCAN et al. (2013) ................................................................................................................................. 68 Figure 3.2 Equilibrium of the calcination and carbonation reactions based on CO2 partial pressure. Obtained from Mantripragada and Rubin (2017a). ...................................................... 69 Figure 4.1. Configuration screen of the IECM with alternatives for user-defined pollutants control technologies. Obtained from IECM version 11.2 ......................................................... 103 Figure 4.2. Development of Post-Combustion Capture Processes and relationship with TRL index. Obtained from (Bhown, 2014). ...................................................................................... 110 Figure 4.3 Calcium Looping Diagram for Post-combustion carbon dioxide capture. Obtained from IECM version 11.2. .......................................................................................................... 120 Figure 4.4 Configuration 3 proposed for amine-based post-combustion capture. Adapted from (Mantripragada et al., 2019b) .................................................................................................... 122 Figure 5.1. Net plant efficiency (HHV basis) on the left-axis and plant specific CO2 emissions on the right-axis (kgCO2/MWh) ................................................................................................ 125 Figure 5.2 Results diagram for CaL plant added to supercritical coal plant (300 MW gross power). Obtained from IECM. .................................................................................................. 127 Figure 5.3 Capital cost distribution for a FOAK CaL system capture plant ($/kW-net) .......... 129 Figure 5.4 Breakdown costs of CaL capture system process facilities capital .......................... 130 Figure 5.5 Water use analysis of carbon capture systems - wet cooling tower ......................... 132 Figure 5.6 Effect of fuel price on plant LCOE .......................................................................... 143 Figure 5.7 (Left) LCOE for different plant sizes for config. 2 and 3. (Right) Total capital requirement with different plant sizes for config. 2 and 3. ....................................................... 144

xi
List of Tables
Table 2.1. Technology Readiness Level (TRL)a ......................................................................... 14 Table 4.1 Coal properties .......................................................................................................... 100 Table 4.2 Biomass properties .................................................................................................... 102 Table 4.3. Process contingency costs and TRL a. ...................................................................... 111 Table 4.4. Project contingency costs and TRLa......................................................................... 112 Table 4.5. Selected values for contingency costs for the proposed carbon capture units. Elaborated by the author. .......................................................................................................... 113 Table 4.6. Summary of financial assumptions. ......................................................................... 117 Table 4.7 Reference plant (no CCS) configuration parameters ................................................ 119 Table 4.8 Parameters used in the CaL carbon capture unit simulations .................................... 121 Table 4.9 Amine-based carbon capture unit configurations ..................................................... 123 Table 5.1. Technical evaluation summary ................................................................................ 124 Table 5.2. Config. 2 operational results .................................................................................... 127 Table 5.3. Cost results summary (FOAK plants) ...................................................................... 128 Table 5.4. Water use results of power plants for wet cooling tower system* ........................... 131 Table 5.5. Water use results of power plants for a once-through cooling system ..................... 133 Table 5.6 Performance and cost results for subcritical bagasse-fired power plants with and w/o CCS ........................................................................................................................................... 137 Table 5.7 Operational results for config. 2A (Bio-CaL) ........................................................... 139 Table 5.8 Performance and cost results for subcritical coal-fired power plants with and w/o CCS ................................................................................................................................................... 140 Table 5.9 Parameters and values assumed for sensitivity analysis ........................................... 142 Table 5.10 Cost sensitivity analysis for fuel price .................................................................... 142 Table 5.11 Cost sensitivity analysis for plant size .................................................................... 143 Table 5.12 Cost sensitivity analysis for capacity factor ............................................................ 145 Table 5.13 Cost results for NOAK CCS plants ......................................................................... 146
xii
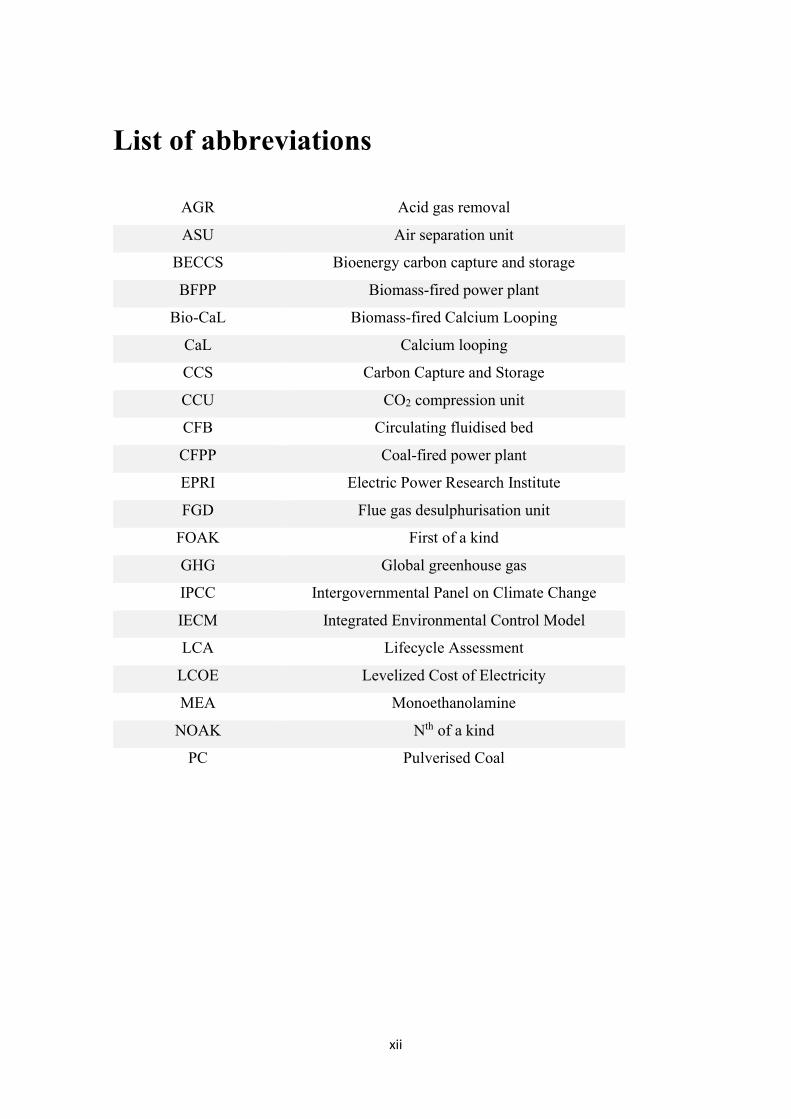
List of abbreviations
AGR Acid gas removal
ASU Air separation unit
BECCS Bioenergy carbon capture and storage
BFPP Biomass-fired power plant
Bio-CaL Biomass-fired Calcium Looping
CaL Calcium looping
CCS Carbon Capture and Storage
CCU CO2 compression unit
CFB Circulating fluidised bed
CFPP Coal-fired power plant
EPRI Electric Power Research Institute
FGD Flue gas desulphurisation unit
FOAK First of a kind
GHG Global greenhouse gas
IPCC Intergovernmental Panel on Climate Change
IECM Integrated Environmental Control Model
LCA Lifecycle Assessment
LCOE Levelized Cost of Electricity
MEA Monoethanolamine
NOAK Nth of a kind
PC Pulverised Coal

xiii
Nomenclature
a1 sorbent deactivation constant/model fitting parameter - a2 sorbent deactivation constant/model fitting parameter -
𝒂𝒔𝒐𝒓𝒃𝒆𝒏𝒕 limestone purity % 𝑨𝒄𝒂𝒓𝒃 cross-section area of the carbonator m2
𝑨𝒄𝒂𝒍𝒄 cross-section area of the calciner m2 𝒃 residual carrying capacity -
𝑪𝑪𝑶𝟐,𝒆𝒒 equilibrium CO2 molar concentration mol/m3 𝑪𝑪𝑶𝟐 actual CO2 molar concentration mol/m3
𝑪𝒑 solid heat capacity J/mol 𝑫 diameter of the reactor M f1 sorbent deactivation constant/model fitting parameter - f2 sorbent deactivation constant/model fitting parameter -
𝒇𝒂 fraction of particles in the calciner with a residence time lower than required for complete calcination
-
𝒇𝒄𝒂𝒓𝒃 carbonated sorbent fraction or mean carbonation extent of the particles
-
𝒇𝒄𝒂𝒍𝒄 calcined sorbent fraction or mean calcination extent of the particles
-
𝑭𝟎 molar flow of fresh limestone introduced into the calciner kmol/s
𝑭𝑹 molar flow of CaO-based particles from calciner to carbonator
kmol/s
𝑭𝒙,𝟏 carbonator inlet molar flow stream of component “x” kmol/s 𝑭𝒙,𝟐 carbonator outlet molar flow stream of component “x” kmol/s 𝑭𝒙,𝟑 calciner outlet molar flow stream of component “x” kmol/s
𝑭𝒙,𝒇𝒍𝒖𝒆𝒈𝒂𝒔 molar flow of “x” component in the flue gas entering the carbonator
kmol/s
𝑭𝒙,𝒊𝒏𝒍𝒆𝒕 molar flow of “x” ASU or fuel component entering the calciner
kmol/s
𝑭𝒙,𝒎𝒂𝒌𝒆𝒖𝒑 molar flow of “x” component in fresh limestone entering the calciner
kmol/s
𝑭𝒙,𝒑𝒖𝒓𝒈𝒆 molar flow of “x” purge component leaving the calciner kmol/s
𝑭𝒙,𝒑𝒓𝒐𝒅𝒖𝒄𝒕 molar flow of “x” component in gaseous products components from the calciner before recycling
kmol/s
𝑭𝒙,𝒓 molar flow of “x” recycled gaseous products from the calciner
kmol/s
𝑭𝒙,𝒄𝒂𝒍𝒄𝒊𝒏𝒆𝒓,𝒐𝒖𝒕 molar flow of “x” component in gaseous products components leaving the calciner
kmol/s
𝑯𝒄𝒂𝒍𝒄 heat requirement in the calciner kJ/s
𝑯𝒄𝒂𝒓𝒃 heat recovered in the carbonator kJ/s 𝑯𝒇𝒍𝒖𝒆𝒈𝒂𝒔 heat recovered in the carbonator flue gas kJ/s 𝑯𝑪𝑶𝟐,𝒄𝒐𝒐𝒍 heat recovered in the calciner output gasses kJ/s
𝑯𝒍 height of the lean zone meters 𝑯𝒕 total height of the reactor meters

xiv
𝑯𝒅 height of the dense zone meters 𝒌𝒄𝒂𝒍𝒄 kinetic constant for the calcination reaction m3/mol.s 𝒎𝒇𝒖𝒆𝒍 mass flow rate of fuel (as-burnt in wet basis) kg/s
𝒎𝒔𝒐𝒍𝒊𝒅𝒔 solids inventory Kg 𝑴𝑾𝒊 molecular weight of the “i” component G
𝑵𝑪𝒂,𝒄𝒂𝒓𝒃 total number of moles of Ca-based solids in the carbonator kmol
𝑵𝑪𝒂,𝒄𝒂𝒍𝒄 total number of moles of Ca-based solids in the calciner kmol
𝑵𝒔𝒐𝒍𝒊𝒅𝒔,𝒄𝒂𝒓𝒃 total moles of solids in the carbonator or carbonator solids inventory
kmol
𝑵𝒔𝒐𝒍𝒊𝒅𝒔,𝒄𝒂𝒍𝒄 total moles of solids in the calciner or calciner solids inventory
kmol
𝒓𝟎 fraction of uncalcined particles %
𝒓𝒄𝒂𝒍𝒄 calcination kinetic rate of CaCO3 particles in solid bed 1/s
𝒓𝒂𝒗𝒆,𝒄𝒂𝒍𝒄 average calcination rate 1/s
𝒘𝒊 weight fraction of the component in fuel %
𝒕𝒄𝒂𝒍𝒄∗ time required to achieve complete calcination of CaCO3 S 𝑼𝒈 superficial gas velocity m/s
𝑽 volume of the reactor m3
𝑿𝒂𝒗𝒆 average maximum carbonation conversion at the carbonator -
𝑿𝒄𝒂𝒓𝒃 actual carbonation conversion at the carbonator -
𝑿𝒄𝒂𝒍𝒄 average molar content of CaCO3 conversions in the calciner -
𝑿𝒂𝒄𝒕𝒊𝒗𝒆 fraction of CaO available for CO2 capture -
𝒚𝑪𝑶𝟐 molar fraction of CO2 at the exit of the calciner - 𝒚𝑪𝑶𝟐,𝒆𝒒 equilibrium molar fraction of CO2 - 𝒚𝑪𝑶𝟐,𝒐𝒖𝒕 carbonator outlet molar fraction of CO2 -
𝒚𝑪𝑶𝟐,𝒊𝒏𝒍𝒆𝒕 carbonator inlet molar fraction of CO2 -
𝒚𝒙,𝟑 outlet molar fraction of “x” component at the exit of the calciner
-
𝒙𝒓 fraction of recycled gases to the calciner % 𝜶 decay constant for solid fractions 1/s
𝜼𝑪𝑶𝟐 CO2 capture efficiency in the carbonator % 𝜼𝑪𝑶𝟐,𝒆𝒒 CO2 capture equilibrium efficiency in the carbonator % 𝝆𝒔𝒐𝒍𝒊𝒅𝒔 solids density kg/m3
𝝉𝒂 active space-time S 𝝉𝒓𝒆𝒔,𝒄𝒂𝒓𝒃 solids residence time in the carbonator S
𝝉 average particle residence time in the calciner S 𝜺𝒔,𝒅 solids fraction in the dense zone at the bottom of the reactor - 𝜺𝒔,𝒍 solids fraction in the lean zone -
𝜺𝒔∗ asymptotic value of solids fraction in the lean zone -
∆𝒑 pressure drop in the reactor Pa

1
1. Introduction
1.1 Motivation and structure
Global greenhouse gas (GHG) emissions still have not shown significant signs of
reduction to stay on track with internationally defined targets to combat climate change
(IEA, 2019e, IPCC, 2018b). In 2017, total anthropogenic or man-made annual greenhouse
emissions, including those from land-use change, reached a record of 53.5 Gt of CO2
(OLHOFF, 2018). If only energy-related emissions are considered, the number rose to a
historic high of 33.1 Gt CO2 in 2018 (IEA, 2019e). As emissions accumulate,
concentration of CO2 in atmosphere has reached 407.4 ppm in 2018, representing a major
increase since pre-industrial levels, when the value ranged between 180 and 280 ppm
(IEA, 2019e).
While discussions among mitigation and adaptation actions take a major role in
international political debate (THE ECONOMIST, 2019), the least-cost scenario
indicated by the Intergovernmental Panel on Climate Change (IPCC) reveals that GHG
emissions in 2030 must be around 25% or 55% lower than in 2017 to avoid, by the end
of the century, respectively, 2o C and 1.5o C global average temperature increase (ETC,
2019, IPCC, 2018b). Coal-combustion alone has contributed to over 30% of the 1o C
increase in global average annual surface temperature levels compared to around 200
years ago (IEA, 2019e). This makes coal the single largest historic source of global
temperature increase. Actually, its utilisation remains significant to the global energy
matrix and coal-fired plants exceeded 10 Gt of CO2 emitted for the first time in 2018
(IEA, 2019e).
Moreover, more than 200 GW in coal-fired power global installed capacity were
in construction or planning phase in 2018 (GLOBAL CCS INSTITUTE, 2018b).
Currently, the majority of existing plants are found in Asia where the average age is 12
years old. Those coal plants are decades younger than their average economic lifetime,
which is around 40 years (IEA, 2019e, SEKAR, PARSONS, et al., 2007). Not only they
have decades ahead of carbon emissions to be released in the atmosphere, but the
imposition of strong policy regulatory measures, such as carbon taxes, could make future

2
and existing plants stranded assets before planned return on investment (ROI) is achieved
(CALDECOTT, DERICKS, et al., 2015, KEITH, REINELT, 2009).
An important mitigation approach to reduce CO2 emission in large scale is carbon
dioxide capture and storage (CCS1) (IEA, 2016), which comprises a portfolio of
technologies capable of reducing CO2 emissions released in combustion processes from
stationary sources, usually in electricity generation or industrial facilities (GLOBAL CCS
INSTITUTE, 2018b). A basic CCS chain involves three steps: to capture or separate a
CO2 stream emitted during combustion or industrial chemical processes; to transport or
sequestrate the CO2 stream after compression, usually through pipelines; and to
permanently store it in an appropriate geologic formation (VERSTEEG, RUBIN, 2012).
Historically, captured carbon dioxide was applied to enhanced oil recovery (EOR)
(GLOBAL CCS INSTITUTE, 2018b, VERSTEEG, RUBIN, 2019), however, if
significant reductions in emissions are aimed, permanent geological storage of CO2 with
no economic value added to it should be further explored (IEA, 2017a).
Despite inherent economic and political challenges faced by CCS systems, several
international institutions and technical experts have acknowledged its potential,
recognizing it as a necessary part in the multiple efforts to low CO2 emissions (IEA,
2017b, 2019e, IPCC, 2018a, U.S. DEPARTMENT OF ENERGY/NETL, 2018). With
fossil fuel-fired systems expected to remain in the energy mix for the foreseeable future,
the importance of CSS will likely increase in the incoming years (HANAK;
MICHALSKI, et al., 2018, VERSTEEG, RUBIN, 2012). In addition, if negative
emissions need to be reached (WOOLF, LEHMANN, et al., 2016), CCS combined with
net negative emissions technologies, such as bioenergy carbon capture and storage
(BECCS), or direct air capture (DAC) will also need to be further developed and deployed
(ACKIEWICZ, LITYNSKI, et al., 2018, TAMARYN, HILLS, et al., 2017).
Furthermore, CCS systems are identified as an important pathway if more strict
constraints to local pollution from fossil-fuel plants remains a global priority (IEA,
2019f). Besides the energy sector, CCS is one of the few mitigation routes capable of
deeply decarbonising major industrial sectors, notably cement, steel, iron, fertiliser, and
1 Alternatively or more broadly called Carbon Capture Utilisation and Storage (CCUS) (FENNELL, ANTHONY, 2015, IEA, 2019d).

3
petrochemical industries (IEA, 2019c) – i.e., industrial sectors with relevant process
emissions.
Thus, in a context of delayed global actions towards climate change, CCS is one
of the few and least costly options that could help the global community to reach aimed
environmental targets while maintaining current and future combustion-based plants
operating (CUI, ZHAO, et al., 2018, KEITH, REINELT, 2009). Then, finding
economically feasible low-carbon alternatives to existing or planned power plants, which
includes retrofitting these plants with carbon capture units or planning future plants to
receive them, is essential in the short and medium-term.
While CO2 separation processes are considered well-established in the industry
and have been operational for decades in natural gas exploration and fertiliser industries
(FENNELL, ANTHONY, 2015), only more recently these technologies have also
become operational in large-scale facilities in the power sector (GLOBAL CCS
INSTITUTE, 2018a, MANTRIPRAGADA, ZHAI, et al., 2019a). Among the three major
approaches for carbon capture in power plants, namely post-combustion capture, pre-
combustion capture and oxy-combustion capture, the first is seen as the easier to
implement in existing plants, as it could be applied as an end-of-pipe process to current
or future capture-ready2 plants, without radical changes to the original plant configuration
(MERSCHMANN, VASQUEZ, et al., 2013, ROCHEDO, 2011, WANG, LAWAL, et al.,
2011b). Throughout the last decades, more individual attention has been given to post-
combustion via chemical absorption using amine scrubbing, considered a mature and
commercially available process (HANAK, BILIYOK, et al., 2015b, KANNICHE, LE
MOULLEC, et al., 2017, ROCHEDO, 2011, VERSTEEG, RUBIN, 2019).
This chemical separation process consists of using an amine-based liquid, usually
monoethanolamine (MEA), as a solvent to absorb carbon dioxide from flue gas at
relatively low temperatures, which is done using amine scrubber columns (MARX-
SCHUBACH, SCHMITZ, 2019, WANG, LAWAL, et al., 2011a). Then, carbon dioxide
is captured once the solvent is regenerated with low temperature steam in a separate
reactor, and the two stages are repeatedly cycled. Sorbent regeneration demands an
2 Capture-readiness defines the attribute of thermal power plants whose design already provides for the possibility of installing a future carbon capture unit during the plant useful life. The “degree” of capture-readiness may differ from existing and planned plants (MERSCHMANN, VASQUEZ, et al., 2013, ROCHEDO, 2011).

4
appropriate amount of thermal energy, which is generally attended using a slip stream
from the power plant, significantly reducing its net power output and efficiency
(CLARENS, ESPÍ, et al., 2016). Amine scrubbing post-combustion has been recently
demonstrated in large-scale coal-fired power plants (MANTRIPRAGADA, ZHAI, et al.,
2019b).
Regardless of its technology maturity, conventional post-combustion amine-based
CO2 capture still presents important drawbacks and key challenges to overcome,
especially regarding the high energy and efficiency penalties imposed to the base plant,
the increase in water consumption and withdraw, and the solvent toxicity and degradation
(CLARENS, ESPÍ, et al., 2016, FENNELL, ANTHONY, 2015, KANNICHE, LE
MOULLEC, et al., 2017, THITAKAMOL, VEAWAB, et al., 2007). On the other hand,
the calcium looping process (CaL), also known as calcium carbonate Looping (CCL)3,
appears as a promising alternative to amine-based processes as a post-combustion carbon
capture system for retrofitting combustion-plants, both in terms of performance and cost
(MANTRIPRAGADA, RUBIN, 2014, MARTÍNEZ, I., GRASA, et al., 2013, ROLFE,
HUANG, et al., 2018).
Calcium looping (CaL) post-combustion capture is a second-generation
technology based on the reversible carbonation reaction of the solid sorbent lime (CaO)
with the CO2 diluted in the flue gas, which is diverted from the stack of a thermal power
plant. The solid looping cycle occurs at high temperatures between two main
interconnected fluidized bed reactors, the carbonator, where CO2 has an exothermic
reaction with the solid sorbent and is separated from the flue gas stream; and the calciner,
where the spent sorbent is regenerated in an endothermic reaction with the aid of external
energy provided. The endothermic reaction releases a highly concentrated CO2 stream,
which requires minor post-treatment before it can be compressed and transported
(HANAK, BILIYOK, et al., 2015a, ROMANO, MARTÍNEZ, et al., 2013).
Some research has been developed so far in modelling, simulating and
experimental testing CaL systems at laboratory and demonstration scales (> 1 MWth) and
the solution is considered ready to be scaled-up (FENNELL, ANTHONY, 2015, HILZ,
HAAF, et al., 2019, ROMANO, MARTÍNEZ, et al., 2012). CaL technological maturity
is not in the same stage as conventional amine-based chemical absorption (ZEP, 2017),
3 In this work, the abbreviation CaL is mostly used.

5
still, such systems could in theory present several benefits over first-generation capture
technologies in terms of plant efficiency penalty, lower toxicity, lower sorbent cost,
operational flexibility and integration complexity (FENNELL, ANTHONY, 2015,
ROLFE, HUANG, et al., 2018).
One of the main advantages of CaL arises from the high-temperature operation of
its capture system, between 600oC and 900oC (ROMANO, MARTÍNEZ, et al., 2012).
Unlike conventional pre-combustion, post-combustion and oxy-combustion approaches,
the high-temperature operation enables a large amount of high-grade heat to be used for
additional power generation in a secondary steam cycle (HANAK, BILIYOK, et al.,
2015b). Thus, retrofit of combustion-based plants with CaL systems could re-power plant
capacity and the generation fleet, while still reducing emissions (FENNELL,
ANTHONY, 2015). Potential increase in net power output is reported in the literature to
be around 50–80% higher compared to the base plant without CO2 capture (HANAK,
MANOVIC, 2017).
Although CaL systems seem promising in several aspects such as plant integration
and energy and water use efficiency (HANAK, BILIYOK, et al., 2015b,
MANTRIPRAGADA, RUBIN, 2017b), more systematic comparative analyses with
conventional capture processes are needed, combining detailed techno-economic
assessment of the capture unit and key impacts on the original plant
(MANTRIPRAGADA, RUBIN, 2014). Plant performance in large-scale systems,
potential capture and energy costs, water consumption and withdraw, capture plant
footprint, and operational flexibility and complexity are some of the aspects regarding
CaL systems that have not yet been fully investigated (FENNELL, ANTHONY, 2015,
HANAK, MICHALSKI, et al., 2018, MICHALSKI, HANAK, et al., 2019). This is
especially valid in Brazil, where only a few studies over CaL systems have been published
so far (ÁVILA, MORTARI, et al., 2013, MOORE, KULAY, 2019, SILVA, Juliana Alves
da, CHIMENTÃO, et al., 2019).
Therefore, through a technical-economical approach, this work analyses CaL
capture unit integration to combustion-based power plants. Results are then compared to
post-combustion amine-based capture, seen as the benchmark technology for post-
combustion retrofitting. The comparative analysis is done according to pre-determined
criteria defined by a proposed methodology, and coal and sugarcane bagasse are
considered as feedstocks. The first, due to its still significant relevance in the current

6
global generation fleet (BP, 2019). The second, due to the foreseeing demand for net
negative emissions technologies4 (IPCC, 2019, VAN VUUREN, STEHFEST, et al.,
2018). Reference combustion-plants are represented by a set of assumptions of typical
supercritical and sub-critical steam power cycles.
The work is divided into six chapters. Chapter 1 continues in the next section
summarizing the main work objectives. Chapter 2 briefly discusses the demand and
general status of CCS worldwide. Next, CO2 capture methods are presented, classified in
pre-combustion, post-combustion, oxy-combustion, or high-temperature solid looping
cycles. Suitability of capture methods to new power plants (in greenfield/new-built
market applications) or add-on to existing plants (in retrofit market applications) is also
introduced, followed by a discussion over technology maturity of the main capture
technologies. The chapter also defines chemical looping technologies and introduces the
scientific literature on calcium looping systems, describing the technology, its main
challenges, and potential benefits. Then, similar work comparing CaL with amine-based
capture is reviewed to help identify knowledge gaps in the subject. CaL integration with
an original base plant and current pilot plant experience is explored. Other potential
applications of CaL and end-use for the purged sorbent are also investigated. Finally,
relevant feedstock properties related to CaL systems are introduced.
Chapter 3 explores available and experimentally validated performance models
for mass and energy balance in CaL systems for post-combustion applications. Then,
reactors' design is presented. The chapter also discusses optimal operational parameters
of a standard CaL plant.
Chapter 4 presents the methodology and data applied in this work. The Integrated
Environmental Control Model (IECM)5 was used to simulate plants with and without
capture. The chapter reviews available economic models before setting performance and
economic parameters for reference plants with and without carbon capture. The optimal
operational parameters for the CaL capture units are selected based on the available
4 Also, the important role in the electricity mix played by bagasse sugarcane fired-thermal power plants in Brazil (ANEEL, 2020, EPE, 2019). 5 The Integrated Environmental Control Model (IECM) is a simulation software developed by Carnegie Mellon University for the U.S. Department of Energy’s National Energy Technology Laboratory (USDOE/NETL). IECM is a well-documented and publicly available model that provides systematic estimates of performance, emissions, cost and uncertainties for preliminary design of thermal power plants with or without CO2 capture and storage (ZHAI, RUBIN, 2011).

7
literature discussed in chapters 2 and 3. A method for cost estimation is developed
establishing a relation between contingency costs and technology maturity for large-scale
carbon capture plants.
Chapter 5 presents the results of the analysis of CaL systems as an option for post-
combustion CO2 capture. Parameters regarding energy penalty, technology readiness
level, plant footprint, cost of CO2 captured and avoided, water consumption and
withdrawal, solid residues production, levelized cost of energy, fuel suitability and
operational flexibility, among other indicators are discussed. The results for CaL systems
are compared with simulated configurations for an amine-scrubbing capture plant and a
reference base plant without capture. Sensitive analyses are performed for key parameters
such as plant size, fuel cost, cooling system, capacity factor, and contingency costs.
Furthermore, qualitative aspects of the integration of CaL to current plants and scale-up
challenges are discussed. Finally, chapter 6 presents main research conclusions and
findings, and potential future work is proposed.
8
1.2 Objectives
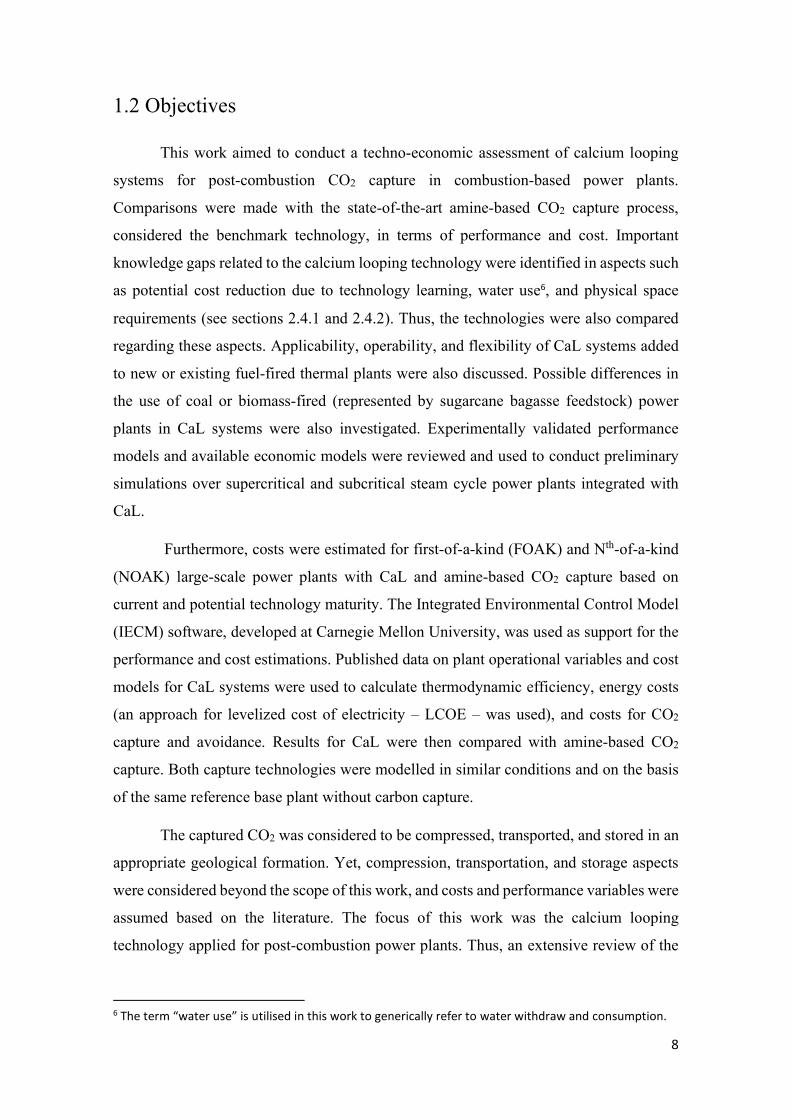
This work aimed to conduct a techno-economic assessment of calcium looping
systems for post-combustion CO2 capture in combustion-based power plants.
Comparisons were made with the state-of-the-art amine-based CO2 capture process,
considered the benchmark technology, in terms of performance and cost. Important
knowledge gaps related to the calcium looping technology were identified in aspects such
as potential cost reduction due to technology learning, water use6, and physical space
requirements (see sections 2.4.1 and 2.4.2). Thus, the technologies were also compared
regarding these aspects. Applicability, operability, and flexibility of CaL systems added
to new or existing fuel-fired thermal plants were also discussed. Possible differences in
the use of coal or biomass-fired (represented by sugarcane bagasse feedstock) power
plants in CaL systems were also investigated. Experimentally validated performance
models and available economic models were reviewed and used to conduct preliminary
simulations over supercritical and subcritical steam cycle power plants integrated with
CaL.
Furthermore, costs were estimated for first-of-a-kind (FOAK) and Nth-of-a-kind
(NOAK) large-scale power plants with CaL and amine-based CO2 capture based on
current and potential technology maturity. The Integrated Environmental Control Model
(IECM) software, developed at Carnegie Mellon University, was used as support for the
performance and cost estimations. Published data on plant operational variables and cost
models for CaL systems were used to calculate thermodynamic efficiency, energy costs
(an approach for levelized cost of electricity – LCOE – was used), and costs for CO2
capture and avoidance. Results for CaL were then compared with amine-based CO2
capture. Both capture technologies were modelled in similar conditions and on the basis
of the same reference base plant without carbon capture.
The captured CO2 was considered to be compressed, transported, and stored in an
appropriate geological formation. Yet, compression, transportation, and storage aspects
were considered beyond the scope of this work, and costs and performance variables were
assumed based on the literature. The focus of this work was the calcium looping
technology applied for post-combustion power plants. Thus, an extensive review of the
6 The term “water use” is utilised in this work to generically refer to water withdraw and consumption.

9
state-of-the-art technology for calcium looping was conducted prior to its evaluation and
comparison with amine-based capture.
At the end of this work, the answers for the following questions should be closer
to a clarification:
Is it calcium looping a feasible alternative to CO2 capture in combustion-
power plants compared to benchmark amine-based technology?
Is it worth to continue with investments, research and development, and
construction of calcium looping plants, until the emerging technology
reaches a similar technology maturity to current amine-based technology?
Regarding water use, space, and integration constraints, is the option for
calcium looping suitable for retrofitting existing plants and/or for future
capture-ready plants?

10
2. Technical background
This chapter starts by presenting a technical background of CO2 capture
technologies in section 2.1. Then, section 2.2 introduces chemical looping techniques and
the differences between calcium looping, which is a specific type of chemical looping,
and other chemical looping processes are discussed. Next, section 2.3 briefly describes
chemical looping processes that use oxygen carriers. Lastly, section 2.4 introduces and
describes the loop cycle of CaO-based systems and reviews similar work. Also, the
section discusses calcium looping systems integration with existing power plants,
operational challenges, pilot plant experience, and relevant feedstock properties.
2.1 Carbon capture and storage (CCS)
The Paris Agreement provided a framework for stronger international climate
action, which will probably increase the application of carbon capture and storage (CCS)
(IEA, 2016). In the global effort to provide modern energy services to a growing world
population, the Sustainable Development Scenario (SDS)7 predicts CCS technologies will
play an important role in the incoming future, accounting for 7% of the cumulative
emissions reductions globally required until 2040 (see Figure 2.1) (IEA, 2019a). This
implies a rapid scale-up of CCS deployment, from around 30 Mt of CO2 currently
captured each year to 2 300 Mt per year by 2040 (IEA, 2019a).
7 The Sustainable Development Scenario (SDS) offers a pathway for the global energy system to reach three strategic goals: the Paris Agreement’s well below 2°C climate goal, universal energy access and substantial reduction of air pollution (IEA, 2019a).
Figure 2.1 CCS represents 7% of emissions reductions in the SDS (IEA, 2019a).

11
Even with intense action towards other emissions reduction strategies, such as
energy efficiency, reforestation, and wide deployment of renewables (mostly wind and
solar), environmental targets might not be reached without the use of CCS technologies
(BEN ANTHONY, 2018, IPCC, 2018b). In electric grids, higher penetration of
intermittent renewables will eventually require back-up and storage systems to ensure
reliability and resilience (GLOBAL CCS INSTITUTE, 2017). Thus, a synergy between
renewable energy sources, fossil fuel power and energy storage will be demanded in order
of low emission, stable, flexible, and dispatchable generation (HANAK, BILIYOK,
MANOVIC, 2016).
Although its meaning encompasses a wide portfolio of technologies, CCS
commonly involves three main processes: production of a CO2 stream of high purity,
compression of this stream, and its transportation to a storage site, where CO2 is usually
injected into a stable geological site or utilised for value-added products. Compression,
transportation and injection steps present less technical challenges compared to the
capture/separation step, which generally represents most of the cost of CO2 avoided
(HOFFMANN, 2010, MANTRIPRAGADA, RUBIN, 2017a, MERSCHMANN,
SZKLO, et al., 2016). Transportation is typically assumed to be done via pipeline, but in
case of retrofit applications, where construction of pipelines to storage sites might be
prohibitively expensive and questionable in terms of public acceptance, transportation via
tankers may be considered (VERSTEEG, RUBIN, 2019). While technical barriers of CO2
transportation and storage appear to be low, its social and political acceptability is not yet
clear (INTERCEPT, 2019).
In the capture step, innovation in CCS should target thermal efficiency increase
and cost reductions, also expanding the portfolio of available technologies (IEA, 2019f).
As CCS becomes internationally seen as a solution to reduce carbon dioxide emissions in
stationary sources, its large deployment could also represent a new range of opportunities
for an energy sector in transition, as CCS’s ability to retrofit plants could help to maintain
jobs and economies active while the world changes to a low-carbon future (GLOBAL
CCS INSTITUTE, 2018b).
If CCS systems were first applied to natural gas processing facilities, mainly in
enhanced oil recovery (EOR) applications (VERSTEEG, RUBIN, 2019), nowadays they
are considered for decarbonising not only the power sector but also several other

12
industries, including cement, iron, steel, fertiliser and paper. In specific industries, such
as cement manufacturing, CCS could produce CO2 capture yields of up to 95% and reduce
clinker production process emissions, for which other reduction alternatives are limited
(IEA, 2019c). Other low-emission strategies involving CCS include net-negative
emissions with bioenergy (BECCS), direct air capture (DAC), and carbon to value
projects (C2V) (GLOBAL CCS INSTITUTE, 2018a, HEPBURN, ADLEN, et al., 2019).
New large-scale facilities are starting operation worldwide and the exact number
of CCS registered initiatives is dynamic. Thus, databases with frequent updates are the
best alternative to track these projects. Some of the open-access global databases with
CCS projects are the US NETL database, the Global CCS institute database, the IEA
database (only for large-scale facilities), and the MIT-Project (MIT-project was cancelled
in 2016 but its database for large-scale CCS projects remains available online) (GLOBAL
CCS INSTITUTE, 2020, IEA, 2019a, MIT, 2009, U.S. DEPARTMENT OF
ENERGY/NETL, 2019a). In China, a new unit of natural gas processing for use in
enhanced oil recovery (EOR) started in 2018, and five new projects are under
development in Europe (IEA, 2019e). In other countries where CCS is already stimulated,
such as Canada and the US, expansion of carbon tax or credits for CO2 use and storage
are expected to support a new round of investments in the coming years (BENNETT,
STANLEY, 2019, GLOBAL CCS INSTITUTE, 2018b).
2.1.1 Technology options for CO2 capture
The wide range of existing technologies for CO2 separation and capture from gas
streams can be classified according to their gas separation principle. Current main
available alternatives are chemical or physical absorption, chemical adsorption, calcium
and chemical reversible loops, membranes, and cryogenic separation (VERSTEEG,
RUBIN, 2019, ZEP, 2017). These gas separation principles may be applied in different
phases of combustion processes (i.e. pre-combustion, post-combustion, and oxy-
combustion). Selection of suitable technology and separation phase primarily relies on
the type of power or industrial plant and on properties of the gas stream from which CO2
needs to be separated, especially its volume concentration (vol%), partial pressure, and
temperature. While post-combustion capture can be applied as an end-of-pipe technology

13
and is the most common approach (see Figure 2.2.8) (U.S. DEPARTMENT OF
ENERGY/NETL, 2019a), CO2 can also be separated from fuel before combustion,
usually through a gasification process combined with a pre-combustion capture system,
based on physical absorption. Another common approach is to employ a high purity
oxygen stream instead of air for combustion, so an already concentrated CO2 stream is
obtained for later treatment, a process known as oxy-combustion capture (VERSTEEG,
RUBIN, 2019).
Although most of the equipment and auxiliary systems required for CCS
deployment in power plants are readily available in the energy sector or other industries,
power plants with CO2 capture still struggle to be cost effective at commercial scale,
which delays its development. This can be partially explained by the high capital costs of
these systems, due to the size of units required to accommodate the flue gas volume, and
the efficiency penalty imposed to the base plant, which also affects the levelized cost of
energy (LCOE) (HANAK et al., 2015b).
Currently available carbon capture technologies have different maturity stages.
They can be broadly labelled as 1st, 2nd, and 3rd generation technologies (IEAGHG,
8 Fig 2.2 shows worldwide CCS initiatives among lab, demonstration, pilot and large-scale facilities. Therefore, great part of those initiatives is in preliminary development phases and could not be classified amid the main separation processes, remaining as unidentified. The other databases mentioned do not display CCS facilities by their separation principle consistently.
Figure 2.2 CCS initiatives worldwide by type of separation process. Elaborated by the
author based on data obtained from The US Department of Energy (2019c).
10
11
22
62
86
110
0 20 40 60 80 100 120
Industrial
Oxy-Combustion
Separation
Pre-Combustion
Unidentified
Post-Combustion
CCS initiatives Worldwide
Industrial
Oxy-Combustion
Separation
Pre-Combustion
Unidentified
Post-Combustion

14
2014a). Generally, 1st-generation CCS technologies can be considered as technically
ready for widespread deployment in the immediate future, although remains scope for
improvement in cost, performance, and flexibility (ZEP, 2017). Emerging technologies
(2nd and 3rd generation) on the other hand offer significant potential for cost reduction and
increased efficiency. Typically, 2nd generation CCS technologies can be considered as
late-stage emerging technologies, whilst 3rd generation CCS technologies are usually
early-stage emerging technologies (ZEP, 2017).
Another common form of ranking technologies is evaluating its technology
readiness level (TRL). TRL is a globally accepted benchmarking tool and has already
been used to evaluate CO2 capture technologies' maturity (IEAGHG, 2014a, ZEP, 2017).
The state of development of technologies in TRL is assessed according to a nine-point
numeric scale, with nine being the most developed and one the less developed. Table 2.1
displays TRL definitions as applied by The Electric Power Research Institute (EPRI) for
use with CO2 capture processes (FREEMAN, BHOWN, 2011, IEAGHG, 2014a). The
following sections further investigate the main capture methods for power generation
plants.
Table 2.1. Technology Readiness Level (TRL)a
Technology Readiness Level (TRL)
Demonstration
9 Normal commercial service
8 Commercial demonstration, full-scale deployment in
final form
7 Sub-scale demonstration, fully functional prototype
Development
6 Fully integrated pilot tested in a relevant environment
5 Sub-system validation in a relevant environment
4 System validation in a laboratory environment
Research
3 Proof-of-concept tests, component level
2 Formulation of the application
1 Basic principles observed, initial concept
a Based on the Electric Power Research Institute (EPRI) for use with CO2 capture processes (FREEMAN,
BHOWN, 2011, IEAGHG, 2014a).

15
2.1.2 Pre-combustion
In power generation, pre-combustion CO2 capture is generally combined with
Integrated Gasification Combined Cycle (IGCC) plants. In such a system, a solid fuel
such as coal or biomass undertakes a gasification or reforming process at relatively high
pressure, which splits the fuel to form, after a series of intermediate processes, a final gas
mixture known as syngas, composed mainly by H2 and CO (FENNELL, ANTHONY,
2015, VERSTEEG, RUBIN, 2019).
The CO2 also contained in the final mixture is then separated by a physical solvent
(currently Selexol and Rectisol are the main options)(IEAGHG, 2014a, LUIS, 2016), and
the H2-rich stream is used as fuel. The intermediate processes that correspond to CO2
capture integration in an IGCC plant basically involve two steps: conversion of CO to
CO2 in the water-gas shift reactor; and separation of the CO2 from the syngas in the acid
gas removal unit (AGR).
In recent years, several pilot plants with pre-combustion have been implemented
to validate the concept, but crucial developments are still required, especially in the
improvement of gasification and oxygen production processes, better integration of
water-gas shift reactor, and further development of AGR unit and gas turbine (as gas
turbines employed should be suitable for firing H2 rich syngas) (VERSTEEG, RUBIN,
2019). The performance of pre-combustion CO2 capture depends on the cumulative
performance of all integrated units inside the IGCC plant (from gasification to gas turbine
operation) and so it is not limited to the performance of the separation AGR unit alone.
Moreover, pre-combustion capture currently faces barriers in its overall capital
expenditure (CAPEX), which is still high mainly due to requirements of a pressurised
operation (FENNELL, ANTHONY, 2015). Nevertheless, the conventional pre-
combustion CO2 removal process could be considered as the 1st-generation technology
with a TRL close to 9 (IEAGHG, 2014a). Finally, this capture approach is more often
seen as an alternative to greenfield plants instead of brownfield/retrofit ones, due to the
number of technical changes and replacements needed to adapt and equip an existing
plant (ROCHEDO, 2011).

16
2.1.3 Oxy-combustion
In oxy-combustion or oxyfuel combustion method, solid fuel is burned in a
modified burner with almost pure oxygen, previously separated from nitrogen in an air
separation unit (ASU). The oxygen used in combustion acts as an oxidant and results in
exhaust gases mainly consisting of CO2 and water, which produces a relatively pure CO2
stream after condensation, enabling an easier purification of the CO2 product stream and
a lower efficiency penalty compared to amine scrubbing post-combustion (HANAK et
al., 2015b; ROLFE et al., 2017).
Part of the exhaust gases is usually recycled in the burner inlet to dilute the oxygen
stream, preventing excessive flame temperatures from damaging the burner with local
hotspots (FENNELL, ANTHONY, 2015). Several key areas of development exist within
the technology and include, besides reducing its high capital costs, further development
of the boiler, gas turbine, and burner, as well as achieving a lower efficiency penalty,
particularly in the ASU (VERSTEEG, RUBIN, 2019).
The technology is considered of 1st generation but with a lower TRL than pre-
combustion benchmarking IGCC with Selexol, reaching a TRL between 6 and 7 points
(IEAGHG, 2014a, KANNICHE, LE MOULLEC, et al., 2017). Regarding capture-
readiness, the oxy-combustion approach is more often seen as a CO2 capture process for
new combustion-based plants, as the modification of the burner imposes technical and
economic challenges to adapt existing plants (ROCHEDO, 2011).
2.1.4 Post-combustion
Post-combustion capture usually offers some advantages, as existing combustion
power systems can still be used without drastically changing the original plant, which
generally makes it easier for such systems to be implemented as a retrofit option or add-
on to current plants (KANNICHE, LE MOULLEC, et al., 2017, WANG, LAWAL, et al.,
2011b). The main goal in post-combustion is to concentrate the CO2 stream after it is
generated during combustion, when large amounts of nitrogen originally from the air are
found in the flue gas, as shown in the scheme in Fig. 2.3 (U.S. DEPARTMENT OF
ENERGY/NETL, 2019b).

17
The conventional approach is to use a liquid chemical solvent, usually amine-
based, and chemically absorb the CO2 from flue gas into the liquid carrier in a continuous
scrubbing system. The absorption solvent is regenerated by increasing its temperature or
reducing its pressure to break the absorbent-CO2 bond. High capture rates, around 90%
of the flue gas, are possible with commercially-available chemical absorption systems,
mainly configured with amine and ammonia-based carriers. Chemical absorption post-
combustion capture with amines is considered a first-generation technology with
operating demonstration/first-of-a-kind (FOAK) commercial systems, with a TRL close
to 9 (IEA, 2019c, IEAGHG, 2014a).
In the US NETL CCS database, among 67 active projects worldwide (or on-going
facilities) reported for carbon dioxide capture and storage, 21 of them, which represents
32%, use post-combustion with amine-based capture, more than any other capture
technology (U.S. DEPARTMENT OF ENERGY/NETL, 2019a). Regarding large-scale
active plants (> 50 MW), amine-based post-combustion systems contribute with two of
the most representative coal-fired power plants: the Petra Nova plant, in Texas, US, with
a 240 MW slip stream from a 610 MW unit; and Boundary Dam, in Saskatchewan,
Canada, capturing CO2 from a 115 MW power plant (MANTRIPRAGADA, ZHAI, et al.,
2019a). If potential projects are considered (under planning, in development, or
construction phase), post-combustion with amines represents at least 20% of future units
(U.S. DEPARTMENT OF ENERGY/NETL, 2019a).
Figure 2.3 Post-combustion CO2 capture general scheme (US NETL, 2019)

18
Therefore, also in accordance with the available literature (CLARENS et al.,
2016; FENNELL AND ANTHONY, 2015; HANAK et al., 2015b; IEAGHG, 2014b;
KANNICHE et al., 2017; VERSTEEG AND RUBIN, 2019), amine-based chemical
absorption systems can be seen as the most mature and benchmarking capture technology.
Already tested in commercial scale (MANTRIPRAGADA, ZHAI, et al., 2019b), is the
conventional option for retrofitting current combustion-based power plants or future
capture-ready plants (KRZEMIEŃ, WIĘCKOL-RYK, et al., 2013, ROCHEDO, COSTA,
et al., 2016, ROCHEDO, 2011).
The selection for amine-based technologies might be explained due to its
effectiveness compared to other alternatives for dilute CO2 streams, typical of coal
combustion flue gas, which ranges from 10-15%vol of CO2 (U.S. DEPARTMENT OF
ENERGY/NETL, 2019b, VERSTEEG, RUBIN, 2019). Additionally, those systems are
similar to other end-of-pipe environmental control units already operational in power
plants and the process requires low temperatures and pressures. Major efforts are being
made worldwide to improve this process due to its potential role in global CO2 abatement
(LUIS, 2016). Recent research has focused on optimizing the process of amine-absorption
using either the conventional solvent MEA (Econamine process) or more advanced amine
processes such as Econamine FG+ or Cansolv (CLARENS, ESPÍ, et al., 2016, HANAK,
ANTHONY, et al., 2015, LUIS, 2016, ROCHEDO, COSTA, et al., 2016).
However, some problems might occur while linking the technology to an
operational power plant (HANAK et al., 2015a; KRZEMIEŃ et al., 2013). Firstly, the
process is energy-intensive and the energy, usually in the thermal form, is required mainly
for solvent regeneration. Overall energy requirements (or parasitic loads) causes a
substantial efficiency penalty to the base plant that varies from 7% to 15%, depending on
the original plant cycle and the solvent applied (CLARENS, ESPÍ, et al., 2016, HANAK,
ANTHONY, et al., 2015, HANAK, BILIYOK, et al., 2015b, KANNICHE, LE
MOULLEC, et al., 2017). Then it reduces net power output and increases the levelized
costs of energy. The chemical absorption cycle also faces significant solvent losses due
to acidic impurities in the gas stream, so a solvent make-up stream is needed and disposal
of degraded products may cause environmental and health issues (HANAK et al., 2015b;
U.S. DEPARTMENT OF ENERGY/NETL, 2019c; VERSTEEG; RUBIN, 2019).
In addition, power plants with amine-based capture require large water volumes,
mainly in steam form. This extra water requirement could cause an increase in the original

19
plant consumption of up to 120% (MERSCHMANN, VASQUEZ, et al., 2013), which
could be a constraint to implement amine-based plants in some regions where access to
water resources is limited. Operational flexibility of the base plant once the amine-based
system is added is another concern (U.S. DEPARTMENT OF ENERGY/NETL, 2019b,
ZEP, 2017), as this feature is increasingly required by thermal power plants (CRIADO,
ARIAS, et al., 2017).
When the amine-based process is analysed from a lifecycle perspective, its
adoption results in extra environmental effects related to solvent production, use, and
regeneration. Solvent production, for example, includes extra CO2 emissions during the
Haber–Bosch process (AZZI, WHITE, 2016, CASTELO BRANCO, MOURA, et al.,
2013, HURST, COCKERILL, et al., 2012, LUIS, 2016). Solvent regeneration after
absorption is also an indirect source of emissions, as a combustion process is typically
needed to provide the extra energy supply. Finally, the environmental impacts associated
with the toxicity and waste disposal of the solvent have to be considered (LUIS, 2016).
Therefore, the generalized use of amine-based chemical absorption for CO2 capture
should be a point of concern if its global application happens to be the main strategy
(LUIS, 2016). According to the US. Department of Energy, research and development of
amine-based systems should focus on advanced solvents, resistant to flue gas impurities
(U.S. DEPARTMENT OF ENERGY/NETL, 2019b), as well as novel concepts, such as
hybrid technologies that incorporate the key attributes required for retrofit applications.
Ultimately, research and development of other CO2 capture processes for retrofit
into existing and future capture-ready plants is still worthwhile, and efforts should be
aimed at lowering the energy and efficiency penalties while dealing with operational
flexibility and water and space restraints, without incurring in significant additional cost
(ZEP, 2017).
2.1.5 High-temperature solid looping cycles
Among emerging 2nd-generation technologies for CO2 capture, high-temperature
solid looping systems are promising alternatives for large emissions sources. Even if these
technologies are in an earlier stage of development compared with the systems previously
mentioned (IEAGHG, 2014b), they are moving fast towards large scale demonstrations
and could represent a solution for the efficiency penalties and high costs of CCS systems

20
based on amines (DIEGO, M. E., ARIAS, et al., 2017, FAN, ZENG, et al., 2012,
FENNELL, ANTHONY, 2015, HILZ, HAAF, et al., 2019).
These systems operate in high-temperature levels, leaving significant fractions of
the provided energy available for heat integrations to be applied with the power plant,
under several possible configurations (HANAK, MICHALSKI, et al., 2018). Heat
integration can lead to better thermodynamic performance and higher overall efficiencies
than more mature capture technologies. Specifically, in power plants retrofitted with
carbonate calcium looping cycles for post-combustion configurations, a secondary steam
cycle can be used to increase power output of the existing plant. This permits reducing
energy-related emissions significantly while increasing the generation fleet (FENNELL,
ANTHONY, 2015).
Capture technologies such as the CaL system belong to a broader group of
emerging technologies generally called Chemical Looping (CL) (FAN, ZENG, et al.,
2012, MANTRIPRAGADA, RUBIN, 2017a). This group of technologies uses high-
temperature solids sorbents to transfer either oxygen (in case of conventional chemical
looping) or CO2 (in case of calcium looping) between two main interconnected reactors
operating through repeated looping cycles (FENNELL, ANTHONY, 2015).
Chemical and calcium looping cycles exploit the degree of reversibility and the
high reaction rates of certain gas-solid reactions occurring from 600o C to over 1000 o C.
The operational temperature depends on the type of reactor, carrier, and process. In the
most developed versions, with TRL close to 6 (IEAGHG, 2014a), the main reactors use
circulating fluidised beds (CFB), a process that closely resembles thermal and mechanical
characteristics of mature CFB reactor systems already available at large scale (> 500
MWth) in power and refining sectors (FENNELL, ANTHONY, 2015, ZEP, 2017).
These systems may be incorporated as an add-on to existing plants in tail-end
configurations, which is the conventional approach for calcium looping post-combustion
systems for pulverized fuel-fired and natural gas combined cycle (NGCC) plants
(BERSTAD, ANANTHARAMAN, et al., 2012, HANAK, Dawid P., MICHALSKI, et
al., 2018). Likewise, they can be designed as a newly-built/greenfield plants, which is the
case of most chemical looping combustion (CLC) configurations. Additionally,
integrated gasification combined cycle with chemical looping (IGCC-CL) is usually
thought of as a greenfield plant (FENNELL, ANTHONY, 2015, HANAK, MICHALSKI,

21
et al., 2018). Figure 2.4 bellow resume market-related classifications of high-temperature
looping cycles. In the following sections of chapter 2, more of CL systems are discussed,
with a focus on CaL systems for brownfield or capture-ready plants.
Figure 2.4. CL processes possible classifications. Elaborated by the author.
LEGEND:

22
2.2 Chemical looping techniques overview
Chemical looping techniques are reactions schemes designed for a given reaction
in a process system to be decomposed in multiple sub reactions, which are controlled in
loops using suitable chemical intermediates. These chemical intermediates react and are
regenerated in a self-sustaining medium through the progress of the sub reactions (FAN,
ZENG, et al., 2012, MOGHTADERI, 2012). An ideal chemical looping should be
capable of minimizing exergy9 loss of the overall process, while products generated in
the scheme can be separated and handled with greater ease (FAN, 2010, FAN, ZENG, et
al., 2012).
Combined with traditional fuels, chemical looping (CL) schemes can be applied
in energy conversion systems for power generation with low CO2 emissions (CAO, PAN,
2006, FAN, LI, et al., 2008, FAN, ZENG, et al., 2012, HU, GALVITA, et al., 2018).
Instead of directly converting feedstock, or reactants, into end products - thermal energy,
CO2, and H2O - a series of cycled chemical reactions are used to generate and separate
these same end products (FAN, 2010, MOGHTADERI, 2012). Even if recognized as a
potential approach for fuel conversion for over 100 years (FAN, ZENG, et al., 2012),
looping materials ineffective reactivity and recyclability have delayed the application of
chemical looping processes in a commercial scale. Yet, developments in the last decades
have made CL evolve into a promising technique for CO2 capture (MOGHTADERI,
2012). According to several authors, chemical loops could be more efficient and cost-
effective than current commercial capture technologies (FAN, ZENG, et al., 2012,
KANNICHE, LE MOULLEC, et al., 2017, MANTRIPRAGADA, RUBIN, 2017a).
For economical operation, some of the key attributes required in CL are: high
reactivity at specified temperature and pressure, chemical and physical stability of the
looping particles, and favourable equilibrium towards desired products formation (FAN,
2010, MOGHTADERI, 2012). Other requested features include intermediate reactions
spontaneity, easy product separation, efficient heat integration, and maximum simplicity
9 Exergy can be defined as the maximum amount of usable work extractable from a system during a desired process, leading the system into equilibrium when a reference state is considered. Thermodynamics second law indicates that exergy loss occurs in any given non-ideal process. Although it is not possible to completely eliminate energy degradation, the exergy loss can be minimized using strategic energy management. Then, overall energy conversion efficiency of a given process can be maximized once the largest irreversibility steps are identified (FAN , 2010).

23
in the chemical looping scheme. Finally, a CL system must employ a low-cost, highly
available and efficient chemical carrier to conduct the reactions (FAN, 2010, FAN,
ZENG, et al., 2012, FENNELL, ANTHONY, 2015).
These processes can be applied to convert multiple carbonaceous fuels, which can
be in solid, gas (CAO, PAN, 2006, ZHAO, ZHOU, et al., 2017), or even in the liquid
state (FENNELL, ANTHONY, 2015, RYDÉN, MOLDENHAUER, et al., 2013). In
addition to heat and electricity generation, CL systems are capable of processing fuels
into diversified products, such as H2 for fuel cell systems and syngas for posterior
chemical synthesis of liquid fuels (FAN, ZENG, et al., 2012, FENNELL, ANTHONY,
2015). CL systems can be classified by the type of looping material, either oxygen or CO2
carrier (FAN, ZENG, et al., 2012, FENNELL, ANTHONY, 2015). The first type is based
on cyclic redox reactions conducted in two or more reactors. At least an air reactor and a
fuel reactor are necessary (MUKHERJEE, KUMAR, et al., 2015). Systems with oxygen
carriers are generally divided into chemical looping combustion (CLC) process, chemical
looping gasification (CLG) process, and chemical looping for hydrogen production
process (CLH) (CORMOS, 2014, FAN, ZENG, et al., 2012). The second type of looping
system generally employs calcium oxide – CaO - as the CO2 carrier that conducts cyclic
carbonate and calcination reactions occurring in two different reactors, named the
carbonator and the calciner. This system is generally called calcium looping (CaL) or Ca-
looping process.
Systems using oxygen carriers (OCs) in redox cycles can be integrated into oxy-
combustion and pre-combustion CO2 capture processes, while systems using CO2 carriers
in carbonation cycles can be associated with pre-combustion and post-combustion
processes (FAN, ZENG, et al., 2012, PEREJÓN, ROMEO, et al., 2016). As a market
strategy, CL processes might be incorporated as an add-on to an existing plant, which is
generally the case for CaL post-combustion systems for coal, biomass, and natural gas
plants (HANAK, MICHALSKI, et al., 2018). In addition, retrofitting is an option for pre-
combustion CL capture in an integrated gasification combined cycle (IGCC-CL) plants
(HOFFMANN, 2010). However, IGCC plants are still not fully mature and remain more
capital intensive than conventional power generation systems, which can delay or hinder
wider deployment of this carbon capture route (FAN, ZENG, et al., 2012), even if the

24
retrofit itself is maybe simpler than other post-combustion options10 once the IGCC plants
are constructed (FENNELL, ANTHONY, 2015, MANTRIPRAGADA, RUBIN, 2017a,
TURNER, IYENGAR, et al., 2019). Lastly, CL systems using OCs are generally
conceptualized as greenfield plants, which is the case for most CLC and CLG processes.
10 This means some capture alternatives may have a greater level of capture-readiness once the base combustion plant is built (lower cost of added CCS and/or layout and operational advantages). Yet, if the combustion plant required for integration with those capture alternatives is significantly more expensive than conventional combustion plants, investors might not take the risk of building these plants in expectation of CCS to be mandatory or economically justifiable.

25
2.3 Chemical Looping with oxygen carriers
Chemical looping combustion (CLC) technologies for solid and gaseous fuels
using oxygen carriers (OCs) combine fuel indirect combustion (nitrogen-free), flexibility,
and a concentrated CO2 stream production with no active gas separation (CAO, PAN,
2006, LYNGFELT, LINDERHOLM, 2017). With the indirect combustion approach,
usual energy penalties in CO2 capture might be avoided, resulting in greater
thermodynamic efficiency in the overall energy conversion system (LI, ZENG, et al.,
2010, LYNGFELT, LINDERHOLM, 2017). As shown in Figure 2.5, adapted from (SAI,
PUNDLIK, et al., 2018), a general CLC process uses a solid metal (Me) or its reduced
metal oxide form (MexOy-1) as the OC.
Figure 2.5. A general scheme for the CLC process. Adapted from Sai et al. (2018)
The carrier circulates between two interconnected reactors, the reducer (or fuel
reactor) and the oxidizer (or air reactor). Within a redox loop, the solid metal (Me) or the
reduced metal oxide (MexOy-1) reacts with air to form a metal oxide (MexOy) in the
oxidizer. In the reducer, the metal oxide (MexOy) previously formed reacts with the
carbonaceous feedstock to generate heat and a gas stream of CO2 and H2O. The solid
metal (Me) is then separated from oxygen and returns to the air reactor to be regenerated
and restart the cycle. The gas stream at the exit of the reducer consists of a rich stream of

26
CO2, which is set ready for compression and sequestration. (CAO; PAN, 2006; SAI et al.,
2018). Typical reactions occurring are shown in equations (2-1) to (2-4).
(2n + m) MexOy + yCnH2m → (2n + m) xMe + my H2O + nyCO2 (2-1)
Or
(2n + m) MexOy + CnH2m → (2n + m) MexOy-1 + mH2O + nCO2 (2-2)
And
xMe + y/2 O2 → MexOy (2-3)
Or
MexOy-1 + 1/2 O2 → MexOy (2-4)
The OC particles are essential to carry both chemical and thermal energy (LI,
ZENG, et al., 2010, LYNGFELT, LINDERHOLM, 2017) and might be preheated in a
combustor before being sent to the fuel reactor along with the carbonaceous feedstock.
Once in the reducer, the OC reacts with the fuel generally in an endothermic reaction
while the reaction in the air reactor is highly exothermic in nature (CHENG, QIN, et al.,
2018, SAI, PUNDLIK, et al., 2018). Suitable OC is one of the key factors for the
successful implementation of CL technology and its performance will govern the
feasibility of the process (FAN, 2010). OC requires sufficient and stable oxygen transport
capacity over many cycles of oxidation and reduction and enough physical strength to
limit particle breakage and attrition. At present, transition metal oxides such as Fe2O3,
MnO2, CuO, and NiO are commonly used (RYDÉN, LYNGFELT, et al., 2017, TIAN,
NIU, et al., 2018).
In CLC systems, control of pollutants such as NOx, sulphur oxides and trace
metals can be conducted in a more efficient way since the nitrogen-free flue gas generated
in the reducer has low volume and CO2 is not mixed or diluted with nitrogen (CAO, PAN,
2006). Examples of typical reactions occurring in the interconnected reactors are
characterized bellow in equations (2-5) to (2-7) (RYDÉN, LYNGFELT, et al., 2017).
This example describes a CLC with methane (CH4) as the feedstock and manganese Mn
(II, III) as the OC:

27
(2-5)
[FR]: CH4(g) + 4Mn3O4(s) → 12MnO(s) + CO2(g) + 2H2O(g) ∆Ho 298 = 125 kJ/ molCH4
(2-6)
[AR]: 2O2(g) + 12MnO(s) → 4Mn3O4 (s) ∆Ho 298 = -927 kJ/ molCH4
(2-7)
[Sum]: CH4(g) + 2O2(g) → CO2(g) + 2H2O(g) ∆Ho 298 = -802 kJ/molCH4
Indeed, actual reactions taking place in CL systems rely on physical properties,
reaction thermodynamics, and kinetics of the selected feedstock and OCs (CAO, PAN,
2006). A simplified block diagram of a CLC system using coal as fuel and Fe as the OC
is shown in Figure 2.6:
Among the units represented in the block diagram above, only fuel and air reactors
are not readily available in the industry. However, current research proposes CLC utilises
circulating fluidized beds (CFBs), which are already available at a large scale
(FENNELL, ANTHONY, 2015). These systems usually aim full fuel energy conversion
to increase thermal efficiency and avoid unconverted solid fuels, which might
contaminate the reactor. Thus, almost all the carbon content in the feedstock should leave
Figure 2.6 Simplified block diagram for coal direct chemical looping combustion
(CLC) process. Obtained from (MUKHERJEE, KUMAR, et al., 2015)

28
the reducer in the form of CO2. Following gas clean up and heat recovery, the remaining
gaseous product can be directly vented into the atmosphere, with close to zero net CO2
emission. Primary technical concerns in the reducer are related to low reactivity between
fuel and OC, especially with solid fuels due to low solid-to-solid contact efficiency (CAO,
PAN, 2006).
In the air reactor or oxidizer is where the OC is regenerated during an exothermic
oxidation step that releases heat, further used for power generation (FAN, 2010). The
volume of gas flow in the oxidizer is significantly larger than in the reducer because in
the first a larger amount of nitrogen is carried in by air (CAO, PAN, 2006). Overall, the
net energy release of this system is similar to a conventional combustion system, with
reactors temperature in the range of 800-1050°C (RYDÉN, LYNGFELT, et al., 2017).

29
2.4 Calcium looping (CaL) for post-combustion CO2 capture
Calcium or Carbonate Looping (CaL) as a post-combustion capture technology
was originally proposed about a quart of a century ago by HIRAMA; HOSODA et al
(1994) and SHIMIZU, HIRAMA, et al. (1999). This chemical looping process is based
on the reversible chemical reaction between CO2 and calcium oxide (CaO). The calcium
oxide has the role of solid sorbent or CO2 carrier, and the cycle occurs by reacting the
CO2 present in the flue gas of an emission stream with solid CaO, forming calcium
carbonate (CaCO3) in a gas-solid reaction. This reaction is known as carbonation and is
processed in a reactor called carbonator. After appropriate residence time of particles in
the reactor, the partially carbonated CaO leaves the carbonator and is separated from the
flue gas with lower CO2 content by a hot cyclone and loop seals. The loop seals aid the
transportation of the solid stream to a regenerator reactor called calciner. At the calciner,
the CaCO3 formed in the carbonator undergoes a calcination reaction that regenerates the
CaO sorbent (CLARENS, ESPÍ, et al., 2016). While sorbent is regenerated, calcination
produces a relatively concentrated stream of CO2, suitable for cleaning and compression.
Then, after regeneration, the CaO solid rich stream is transferred back to the carbonator
to restart the cycle (FENNELL, ANTHONY, 2015, HANAK, MICHALSKI, et al., 2018,
MANTRIPRAGADA, RUBIN, 2014, ROLFE, HUANG, et al., 2018). The main intended
reversible chemical reaction within the CaL process is represented below in equation 2-
8:
(2-8)
Carbonation: CaO (s) + CO2 (g) → CaCO3 (s) ∆H25ºC = - 178.2 kJ mol-1
Calcination: CaCO3 (s) → CaO (s) + CO2 (g) ∆H25ºC = + 178.2 kJ mol-1
The most developed configuration operates under atmospheric pressure and uses
two interconnected circulating fluidized beds (CFBs) as the carbonator and the calciner
reactors (see Figure 2.7) (DIEGO, ARIAS, et al., 2017, MARTÍNEZ, GRASA, et al.,
2013). The carbonator operates at temperatures around 650 °C and its carbonation
reaction is exothermic, while the calciner operates with temperatures just above 900 °C
and its reaction is endothermic (CLARENS, ESPÍ, et al., 2016, MARTÍNEZ, I.,
MURILLO, et al., 2011b).

30
Figure 2.7. Conceptual scheme for the Calcium Looping process used in post-combustion carbon
dioxide capture of a PC plant. Obtained from (MANTRIPRAGADA, RUBIN, 2017a).
To maintain the desired operating temperature for the calcination reaction, thermal
energy is supplied to the calciner by burning additional fuel, generally coal or biomass at
oxy-fuel conditions (DIEGO, ARIAS, et al., 2017, FENNELL, ANTHONY, 2015). The
oxy-fuel conditions are necessary to avoid the presence of N2 in the CO2-rich environment
after the calcination reaction. A fraction of the CO2 stream leaving the calciner is
generally recirculated and reintroduced in the reactor together with the O2 stream. This is
done to ensure a proper volumetric gas flow to fluidize the oxy-combustor and to operate
the reactor with the proper fraction of O2 that avoids hot spots and sorbent sintering
(FENNELL, ANTHONY, 2015). The increase in generation capacity of the original plant
is done by incorporating a thermal recovery system to the reactors’ gas and solid streams
with an additional steam cycle, capable of providing supercritical steam at 600 °C and
280 bar (MARTÍNEZ, I., MURILLO, et al., 2011a).
In order to produce the O2/CO2 environment needed, an air separation unit (ASU)
is required. Although the size of the ASU in a CaL system is about a third of the demanded
by a typical oxy-combustion plant to produce the same amount of power (ROMEO,
ABANADES, et al., 2008, SHIMIZU, HIRAMA, et al., 1999), this is the main source of
parasitic load in CaL systems (FENNELL, ANTHONY, 2015, HANAK, MICHALSKI,

31
et al., 2018). The current state-of-the-art ASU technology uses cryogenics distillation
units in power plants, and in most cases, requires two to three parallel ASUs with specific
power consumption around 200 kWh/tonneO2 for a 95%vol O2 (METZ, DAVIDSON, et
al., 2005).
Due to the endothermic condition of the calcination reaction and the need to
achieve calciner operation high-temperatures for solids arriving from carbonator and
recirculated CO2 stream, there is a great amount of energy required in this reactor,
representing 35% to 50% of the total energy introduced in the system, including the
existing power plant (DIEGO, MARTÍNEZ, et al., 2015). This energy demand will
depend on few process assumptions, such as the type of fuel chosen to be burnt in the
reactor (the general assumption is coal) and the flows of fresh sorbent and solid
circulation rates considered to achieve a desired CO2 capture efficiency (ROMANO,
MARTÍNEZ, et al., 2012). A reasonable target for capture efficiency with this technology
is around 80%-90% (FENNELL, ANTHONY, 2015, ROMANO, MARTÍNEZ, et al.,
2012), similar to amine-based capture.
Nevertheless, the energy penalty associated to CaL systems for post-combustion
applications is reported to be lower than current amine-based CO2 capture methods
(CORMOS, PETRESCU, 2014, MANTRIPRAGADA, RUBIN, 2017a, MARTÍNEZ,
GRASA, et al., 2013). In CaL retrofits to existing plants, efficiency penalties imposed to
the base plant are estimated to be mainly between 6 and 8%, and lower values such as 3%
are possible (CLARENS, ESPÍ, et al., 2016, MANTRIPRAGADA, RUBIN, 2014, 2017a,
ZHANG, SONG, 2019). For greenfield plants, the efficiency penalty is estimated to be
even lower since greater heat-integration can be achieved (HANAK, MICHALSKI, et al.,
2018, ROMANO, MARTÍNEZ, et al., 2012). This efficient thermodynamic performance
is due to the high-grade heat that can be recovered from the exothermic carbonation
reaction occurring inside the carbonator and from the high-temperature gas and solid
streams leaving both reactors. This high-grade heat is generally used to produce
superheated and reheated steam, used to generate additional electricity in a secondary
steam cycle, increasing the power plant net output from 50% to almost 90% compared to
a base coal-fired power plant (CFPP) without CO2 capture (HANAK et al., 2015a;
HANAK, MANOVIC, 2017; MANTRIPRAGADA, RUBIN, 2014). Since a concentrated
and compressed CO2 stream is aimed prior to transportation, another important parasitic

32
load is due to the cleaning and compression unit (CCU), required following the exit of
the calciner.
Regarding the solid sorbent, natural limestone is the most conventionally used in
CaL systems (FENNELL, ANTHONY, 2015), due to the raw material relatively low-cost
and global availability (FAN, LI, et al., 2009, JUNK, KREMER, et al., 2014,
LASHERAS, STRÖHLE, et al., 2011). Another common option is dolomite, which can
be an advantageous alternative to limestone. Further investigation on dolomite is done in
the work by VALVERDE et al. (2015). However, as this work focus on the standard CaL
concept, limestone is considered as the applied solid sorbent. Limestone purity can vary
depending on the source, but a conventional value of 92.4% is generally used in models
and simulations (MANTRIPRAGADA, RUBIN, 2014).
For sorbents to be viable in such applications they must have high selectivity,
adequate absorption kinetics, adequate mechanical strength, and stable absorption level
over repeated cycles (BUTLER, 2014). Lime-based sorbents have all of these qualities,
except for stable absorption over multiple cycles. This is one of the CaL process key
issues, as the sorbent activity decays after a certain number of carbonation-calcination
cycles (FENNELL, ANTHONY, 2015). The reduction in sorbent carrying capacity after
multiple cycles is a result of sintering, attrition, and sulphation (formation of CaSO4).
Thus, to maintain steady sorbent conversion in the carbonator and compensate for inert
accumulation, elutriation of fines, and the gradual loss of sorbent capture capacity due to
the increasing number of carbonation/calcination cycles, spent sorbent needs to be
partially replaced by the make-up of fresh sorbent (DEAN, BLAMEY, et al., 2011,
FENNELL, ANTHONY, 2015, VALVERDE, SANCHEZ-JIMENEZ, et al., 2015).
Sorbent make-up stream is counter-balanced with a reasonable amount of spent
sorbent that is purged as waste disposal. Differently from the waste disposal of amine-
based components, at least a part of the purged sorbent in the CaL system may be reused
for cement production, steelmaking, and other industries (PEREJÓN, ROMEO, et al.,
2016). This synergy, mainly with cement manufacture where the purged sorbent can be
used as clinker, is considered another possible advantage of this process, increasing
profitability and enabling simultaneous decarbonisation of both cement and power sectors
(DEAN, BLAMEY, et al., 2011, MARTÍNEZ, I., GRASA, et al., 2013). Another
alternative for sorbent end-use is ocean liming, which can reduce lifecycle emissions of

33
the overall system (HURST, COCKERILL, et al., 2012). Alternative uses of spent
sorbent, including ocean liming, steelmaking, and flue gas desulphurization are further
explored by FENNELL and ANTHONY (2015).
The use of CaL systems to decarbonize the cement industry instead of power
plants is beyond the scope of this work, still, such application is promising as other
alternatives for decarbonizing the cement sector are restricted. The subject has recently
been investigated by various authors (ARIAS, ALONSO, et al., 2017,
GARDARSDOTTIR, DE LENA, et al., 2019, HORNBERGER, SPÖRL, et al., 2017,
OZCAN, BOCCIARDO, et al., 2013, SPINELLI, MARTÍNEZ, et al., 2017,
VOLDSUND, GARDARSDOTTIR, et al., 2019).
Apart from process heat and electricity, it is also possible to use CaL cycles to
produce hydrogen, by enhancing the water-gas shift reaction (DEAN, BLAMEY, et al.,
2011, FENNELL, ANTHONY, 2015). By using careful thermodynamic integration, parts
of the H2 production process can yield high efficiencies with integrated CaL CO2 capture
(FENNELL, ANTHONY, 2015). Application of the CaL cycle in pre-combustion to
generate hydrogen is discussed by DEAN et al. (2011) and HANAK et al. (2018b).
It is important to note that relevant developments have been made in the last
decade with CaL demonstrations on the MW scale (HANAK, MICHALSKI, et al.,
2018). Particularly, the 1.0 MWth unit in Darmstadt, the 1.7 MWth unit in Oviedo (La
Pereda power plant), and the 1.9 MWth unit at the Industrial Technology Research
Institute (ITRI), in Taiwan, are the most representative facilities. These pilot plants will
be further discussed in following sections. The CaL concept has been developing rapidly
not only due to the construction of new test facilities, but also because of new correlations
for process modelling and sorbent performance. The most studied configuration
integrates the CaL system as a retrofit to an existing coal-fired power plant (CFPP)

34
(HANAK, MICHALSKI, et al., 2018). Figure 2.8 shows the schematic of the CaL-based
post-combustion CO2 capture system integrated with a pulverized coal (PC) powerplant.
Recent developments in the research area focus on reducing the energy penalty,
particularly O2 consumption in the calciner. One of the alternatives to provide heat for
sorbent regeneration is by heating the solids leaving the carbonator with indirect heat
exchangers fed with the heat recovered from the solids and gas streams exiting the
calciner (MARTÍNEZ, I., GRASA, et al., 2013). This is known as the indirect calcination
process (OZCAN, D. C., BOCCIARDO, et al., 2013). Indirect heat can be supplied also
by a combustor via solid heat carriers, heat transfer walls, or heat pipes (HANAK,
MICHALSKI, et al., 2018). Other advanced designs propose eliminating the need of a
pure O2 stream, and by consequence of the ASU, by integrating the CaL with another
chemical loop combustion system, in order to use the exothermic reduction of the oxygen
carrier CuO with a fuel gas as the heat supply to regenerate the sorbent in the calciner
(MARTÍNEZ, I., GRASA, et al., 2013).
Indeed, further improvement in energy and efficiency penalty can be achieved via
increasing the degree of heat integration of the entire system, which can be done through
the application of a systematic heat exchanger network (HEN) analysis, considered an
industrial standard to optimise heat utilization within a system (HANAK, MICHALSKI,
et al., 2018). Another possibility is utilising a secondary power cycle of higher thermal
efficiency than a supercritical steam cycle. (HANAK., MANOVIC, 2017). A review of
Figure 2.8. Conceptual scheme for of CaL-based post-combustion CO2 capture system for a
pulverized coal (PC) powerplant. Obtained from (MANTRIPRAGADA, RUBIN, 2017a)

35
alternative configurations for efficiency improvement of CaL systems can be found in the
works by HANAK et al. (2018b), (2015a) and FENNELL and ANTHONY (2015).
2.4.1 Review on similar work
Few studies, to the authors’ knowledge, have been published so far dealing with
technical and economical comparisons between calcium looping and amine-based CO2
capture technologies for post-combustion configurations. One of the first analyses was
performed by HURST et al. (2012). Their work examines lifecycle greenhouse gas
emissions of a 500 MWe gross power output supercritical pulverised coal-fired power
plant (CFPP), retrofitted with post-combustion calcium looping (CaL) and off-shore
geological storage of the CO2 product stream. Results for the power plant with CaL, which
is boosted to 700 MWe net power output with the addition of the capture unit, were
compared with amine-based capture using MEA solvent and a pulverised-coal (PC) plant
with no capture. Both plants had the same net power output of the CaL integrated plant
and all three configurations followed the same lifecycle assessment (LCA) model.
Technical-modelling of the CaL integrated plant, including sorbent degradation and mass
and heat balances, is described to calculate material input and output flows. Modelling
was based on previous work by LI et al. (2008). CaL parameters were set to give the
highest net electrical output possible, whilst maintaining solids inventories and
circulation rates at sensible levels, similar to commercially operated circulating fluidized
bed combustors (CFBC) (HURST, COCKERILL, et al., 2012).
The CaL plant modelled had an overall CO2 capture rate of 89.4% for a carbonator
capture efficiency of 78%, resulting in an efficiency penalty of 6.4% points over a PC
plant with no capture (with the same net power output). In the case of a PC plant with a
90% CO2 capture rate using the MEA method, the efficiency penalty undergoes a de-
rating of 8.3%. Additionally, while CaL repowered the base plant by 40%, MEA de-rated
the base plant by 29% (HURST, COCKERILL, et al., 2012). The LCA conducted
demonstrated that the emission intensity of a CFPP with CaL is worthy of comparison
with chemical absorption using amine-based MEA-solvent (values of 229 gCO2e/kWh
and 225 gCO2e/kWh were found, respectively). The negative impact of increased coal
demand and transportation is outweighed by the effects of increased power and efficiency.
Moreover, there is still significant potential for specific emissions reduction in CaL
systems if re-carbonation of purged sorbent is considered. Lifecycle emission (LCE)

36
reductions when spent sorbent is disposed of in landfills, ocean, or used as a feedstock
for cement production were estimated. Results for some of these options exhibited
potential for zero LCEs in cases where the net plant output is still acceptable, and
efficiency is higher than an equivalent PC plant with MEA. The study concluded, from a
lifecycle perspective, that CaL systems can significantly outperform MEA-based carbon
capture. While the advantages of CaL regarding lower energy penalty, potential to
repower the power plant, and mitigated risks for technology scale-up11 are pointed out,
no economic comparison was conducted (HURST, COCKERILL, et al., 2012).
In the work by MANTRIPRAGADA and RUBIN (2014), a techno-economic
assessment of a CaL system for post-combustion CO2 capture at a PC power plant is
performed. The results for the CaL system were compared in terms of technical
performance and cost with a similar power plant with conventional amine-based (MEA
solvent) CO2 capture. Both plants were designed to capture 90% of the CO2 from the flue
gas for further transport and storage. The amine-based plant was modelled using the
IECM software, while the performance model for the CaL plant is described based on
previous studies12. Costs were calculated based on results of the performance model and
to reflect first-of-a-kind (FOAK) commercial estimates, using values for project and
process contingency factors following standard guidelines for cost estimation of emerging
technologies (RUBIN, SHORT, et al., 2013). The base PC plant had a gross power output
of 650 MWe and met all the new source performance standards (NSPS) for pollution
control. Gross power output of the integrated PC + CaL plant increased to 1,275 MWe
with a net power output of 1060 MWe. Net plant efficiency was 36% (HHV basis), against
39% of the base plant without CCS, which configures an efficiency penalty of around 3%
points. This value is compared to the efficiency penalty of 11% of the MEA-based process
imposed on the same base plant (28% HHV). Despite the superior performance and lower
efficiency penalty, the CaL-based CO2 capture process was more capital intensive and
led to significant increases in plant capital cost and levelized cost of electricity (LCOE)
over the base plant and the PC + MEA-based plant. However, it is suggested that
assumptions for a mature technology, with lower process contingency costs, would bring
capital costs and LCOE closer to the MEA-based process. Total capital cost and LCOE
11 Due to the utilization of circulating fluidized bed (CFB) boilers, for which significant industrial experience exists at the scales required (HURST, COCKERILL, et al., 2012, ZHENG, YAN, 2013). 12 However, the model proposed is similar to the one currently available for CaL post-combustion systems in IECM (MANTRIPRAGADA, RUBIN, 2017b).

37
of the integrated PC + CaL power plant was estimated as 5218 $/kW-net13 and 136
$/MWh, respectively. These values were significantly superior to those of the plant
without capture, which had a total cost and LCOE of 1922 $/kW-net and 57 $/MWh,
respectively. On the other hand, the MEA-based plant (considered with the same net
power output of 1060 MWe) exhibited values of 2961 $/kW-net and 92 $/MWh for total
capital cost and LCOE, respectively, with the same economic assumptions applied
(MANTRIPRAGADA, RUBIN, 2014).
HANAK et al. (2015b) developed a model for a CaL process integrated to a
reference 580 MWe gross output supercritical CFPP. A secondary steam cycle was also
modelled for thermal recovery of the high-grade heat originated from the CaL process.
The optimal fresh sorbent make-up rate14 and O2 content in the fluidising gas inside the
calciner are discussed and a parametric study is performed by varying these parameters
based on available data from the literature. The authors claim there is a trade-off between
the process thermodynamic performance and its economics regarding the optimisation of
the sorbent make-up rate. Results for the CaL systems were compared with plants using
amine scrubbing retrofits considering 90% total capture rate (for the overall plant15). The
efficiency penalty imposed on the base plant with the CaL retrofit was 6.7–7.9% and
compared favourably in relation to the MEA scrubbing retrofit, which had an efficiency
penalty of 9.5%. Scenarios for CaL systems using biomass, coal/biomass mixtures, and
natural gas to supply heat for the calciner were also evaluated. It was concluded that the
limestone make-up rate should be higher for high-ash fuels (such as coal) and lower for
low-ash fuels (biomass and natural gas) so the plants can have similar solid looping rates
and, therefore, reasonable sizes for the reactors.
When a biomass-fired calciner was used, the integrated system (CFPP + CaL)
became a negative emitter of CO2, as the ratio between the CO2 captured in the system
and the CO2 generated in the system was 155%. Due to the CO2-neutral character of the
woody biomass applied, the integrated system has potential to operate as a CO2-negative
system, regardless of the CO2 capture level of 71.1% in the carbonator/absorber.
13 Original costs were displayed in 2012 constant dollars and were brought to 2017 constant dollars based on the CEPCI (Chemical Engineering Plant Cost Index), available on Jenkins (2018). This calculation procedure is adopted throughout this work. 14The rate between fresh sorbent make-up and solid looping rate on a molar basis. 15 Total CO2 capture rate considers the amount of CO2 captured from the flue gas by the carbonator (79,6% mass basis) and the amount of CO2 captured from the calcination reaction in the calciner (100% of the oxy-combusted extra fuel in mass basis).

38
Moreover, the retrofit with CaL was found to be less complex than chemical absorption
as it does not require major changes to the layout and the operation of the existing CFPP.
Finally, the study concluded the CaL system would result in two times higher net power
output compared with chemical solvent scrubbing alternatives for the same base plant
(HANAK, BILIYOK, et al., 2015b). This is an important advantage of CaL over more
mature amine-based CO2 capture technologies, as power plant operators and energy
planners could focus on increasing the system capacity to meet growth in electricity
demand and, in parallel, reduce overall CO2 emissions.
CLARENS et al. (2016) also conducted a life cycle assessment (LCA) comparison
between CaL and amine-based chemical absorption technologies, both configured as
retrofit post-combustion units with a 90% capture rate of the overall system. A subcritical
coal-fired power plant was considered as the reference plant without capture, with a 500
MWe gross power output. The amine-based capture plants were modelled with two
solvents, namely: Econamine (conventional type of MEA solvent) and Econamine FG+
(advanced amine solvent). Amine-based solvents were selected for comparison with CaL
due to their well-established utilisation in industry. However, high energy costs, solvent
degradation and subsequent equipment corrosion were some of the difficulties reported
for the implementation of these systems in large-scale CCS systems. Then, the CaL
process was proposed as a CO2 capture alternative (CLARENS, ESPÍ, et al., 2016).
System boundaries covered the capture processes from the extraction of raw materials to
the production and delivery of electricity to the grid. CO2 capture and compression were
considered, while transportation and storage were not included within scope. The IECM
software v6.4.2 was used to model and simulate the coal power plant without capture and
the amine-based plants. The CaL plant, on the other hand, was modelled based on studies
reported in the available literature. The calciner and carbonator operational temperatures
were set at 950 °C and 650 °C, respectively. Deactivated CaO (or purged sorbent) was
considered as a recyclable product. Results for impact in several environmental categories
showed both technologies were responsible for reducing climate change impacts. Finally,
the study concluded that the CaL process is an environmentally viable option compared
to chemical absorption, though further optimization and analyses are needed, especially
when environmental credits from deactivated CaO are not considered. Economic
performance of the assessed alternatives was not investigated.

39
In a more recent paper by MANTRIPRAGADA and RUBIN (2017b), technical
and economic aspects were considered in the capture technology comparison. A
performance model was developed for the post-combustion CaL cycle applied to a PC
power plant. The CaL system was designed to capture 90% of the CO2 in the flue gas of
the base plant, with a total (base plant + CaL) net power output of 550 MWe. The system
was compared to a base plant integrated with an amine-based system (using Econamine
FG+ as solvent) with the same net power output of 550 MWe. For cost calculations, the
same contingency (indirect) cost factors were used for both CO2 capture technologies,
assuming a moderately mature process. Thus, study results were considered to represent
a future mature plant. It demonstrated CaL systems, even if thermodynamically more
efficient, are more capital-intensive, with the overall cost of plants (capital and LCOE)
greater than the amine-based technology. The efficiency penalty was around 3% against
11% of the amine-based system, while costs were 4265 $/kW-net for total plant capital
cost and 116 $/MWh for LCOE. Values for the amine-based system assuming the same
economic parameters were respectively 3418 $/kW-net and 104 $/MWh. In the same
work, a chemical looping16 system for a pre-combustion configuration was investigated
and compared to a conventional pre-combustion capture technology. While in this work
CaO-based sorbent was not considered for pre-combustion capture, a modified
configuration of the calcium looping process for pre-combustion undertakes a lifecycle
comparison against conventional pre-combustion in KURSUN et al. (2014).
Finally, a comparison review of CO2 capture technologies was presented by
KANNICHE et al. (2017). The review focused on the most mature technologies, which
were compared based on the following evaluation criteria: technology maturity; net
efficiency loss17; cost of CO2 avoided; operability, flexibility and risk levels (qualitative
analysis); market application (if the technology is suitable for retrofit and/or newly built
plants); technology advantages and gaps; and environmental issues. The study concludes
that amine-based post-combustion technology remains the best reference/benchmark for
the short and medium-term. Additionally, the study claims that innovative technologies
such as chemical looping have the potential to reduce capture costs in comparison to
amine-based plants, but may not have their development guaranteed up to industrial-scale
16 Calcium looping is considered a specific type of chemical looping, which is a more broader term (FAN, ZENG, et al., 2012). 17 The same as efficiency penalty, i.e. the difference between the power-plant net efficiency with and without CCS.

40
if are not suitable to retrofit. Nevertheless, the study did not evaluate CaL systems for
post-combustion configurations.
2.4.2 Integration and operational challenges
In retrofit applications, energy sources from a CaL system can be integrated into
an existing power cycle to produce additional power output (MARTÍNEZ, I., MURILLO,
et al., 2011b). Highly integrated systems, to minimize the energy penalty, can include
modifications in the operation conditions of the original plant (MARTÍNEZ, I.,
MURILLO, et al., 2011b). The option to produce extra steam for the existing primary
cycle requires a tight thermal integration that can limit operational flexibility (ROMANO,
MARTÍNEZ, et al., 2012, ROMEO, ABANADES, et al., 2008), and/or include
modifications in turbines and water heaters. Several studies on heat integrations of the
CaL system with the existing primary cycles heat are reviewed in HANAK et al. (2015a).
Instead of using the power cycle of the original plant, integration of the energy released
from the CaL system into a new steam cycle, decoupled from the existing power plant, is
the usual option considered (HANAK, MICHALSKI, et al., 2018, MARTÍNEZ,
MURILLO, et al., 2011b, ROMANO, MARTÍNEZ, et al., 2012). Without involving
major modifications on the original plant performance, the option for a CaL system with
a new efficient secondary steam cycle makes the system act as an extra oxy-fired plant
(see figure 2.9). In this configuration, the only integration between the existing power
plant and the CO2 capture plant is the flue gas exiting the boiler and diverted from the
stack, entering the carbonator with a temperature around 180 °C (LARA, ROMEO, 2017).
This integration allows the CaL cycle and integrated secondary steam cycle to operate
more independently of the primary steam cycle. Additionally, this integration can avoid
delays in terms of start-up and shutdown of the primary cycle, as reported for amine-
based technologies (MARX-SCHUBACH, SCHMITZ, 2019).
Among several configurations for CaL, the retrofit option is seen as the most
ready-to-use in the short to medium term (ABANADES, ARIAS, et al., 2015, ROMANO,
MARTÍNEZ, et al., 2012). Furthermore, the concept of repowering a power plant or a
generation fleet while strongly reducing its emissions, as CO2 capture rates of 90% are

41
possible, is an important advantage of this process considering the wide deployment of
large-scale plants.
Figure 2.9. Scheme for the integration of a secondary steam cycle into an existing coal-fired
plant. Obtained from (ROMANO et al. 2012).
Considering a supercritical pulverised coal (PC) as the existing plant, HANAK et
al. (2015b) investigated the integration of the CaL system as a retrofit. The study claims
the retrofit configuration does not require major adjustments to the layout and operation
of the existing plant. Compared to chemical scrubbing technologies, the authors
considered CaL systems retrofit as a less complex and more flexible capture method, as
it does not necessarily follow the operation of the original power plant with a steam
requirement like amine-based alternatives, which usually demand steam extraction for
solvent regeneration between the intermediate and the low-pressure turbine (IP/LP)
(FENNELL, ANTHONY, 2015; HANAK et al., 2015b; MARX-SCHUBACH,
SCHMITZ, 2019).
Capture technologies require the ability to adapt to scenarios with large load
changes, as in an energy mix with high share/penetration of renewables. In terms of
operational flexibility, CaL systems could take advantage of solids circulation at high
temperatures between reactors for storing thermal and chemical energy. Concepts for
flexible operation of the full CCS with CaL plant in scenarios of variable loads have been
studied and proposed (CORMOS, SIMON, 2015, HANAK, BILIYOK, MANOVIC,
2016, LARA, ROMEO, 2017). CaL system offers potential to be scaled up with the
flexibility currently required, using alternatives such as calcining during low demand
periods and carbonating during high power demand periods (ARIAS, CRIADO, et al.,
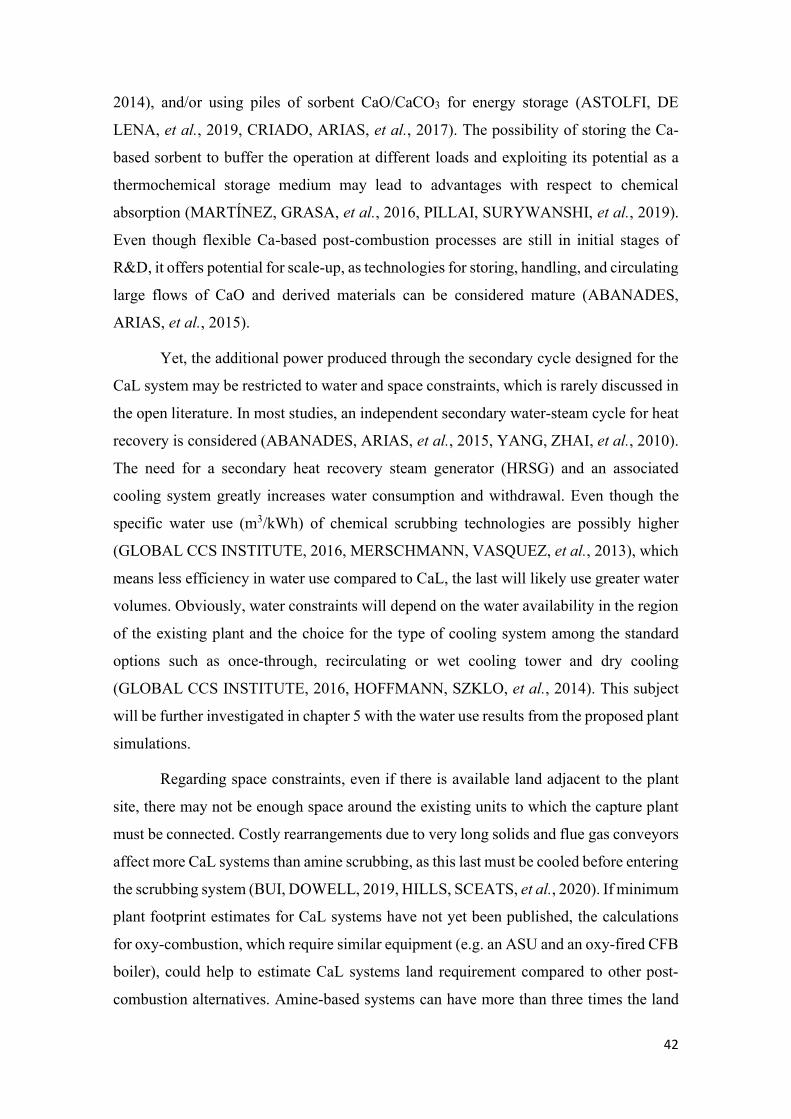
42
2014), and/or using piles of sorbent CaO/CaCO3 for energy storage (ASTOLFI, DE
LENA, et al., 2019, CRIADO, ARIAS, et al., 2017). The possibility of storing the Ca-
based sorbent to buffer the operation at different loads and exploiting its potential as a
thermochemical storage medium may lead to advantages with respect to chemical
absorption (MARTÍNEZ, GRASA, et al., 2016, PILLAI, SURYWANSHI, et al., 2019).
Even though flexible Ca-based post-combustion processes are still in initial stages of
R&D, it offers potential for scale-up, as technologies for storing, handling, and circulating
large flows of CaO and derived materials can be considered mature (ABANADES,
ARIAS, et al., 2015).
Yet, the additional power produced through the secondary cycle designed for the
CaL system may be restricted to water and space constraints, which is rarely discussed in
the open literature. In most studies, an independent secondary water-steam cycle for heat
recovery is considered (ABANADES, ARIAS, et al., 2015, YANG, ZHAI, et al., 2010).
The need for a secondary heat recovery steam generator (HRSG) and an associated
cooling system greatly increases water consumption and withdrawal. Even though the
specific water use (m3/kWh) of chemical scrubbing technologies are possibly higher
(GLOBAL CCS INSTITUTE, 2016, MERSCHMANN, VASQUEZ, et al., 2013), which
means less efficiency in water use compared to CaL, the last will likely use greater water
volumes. Obviously, water constraints will depend on the water availability in the region
of the existing plant and the choice for the type of cooling system among the standard
options such as once-through, recirculating or wet cooling tower and dry cooling
(GLOBAL CCS INSTITUTE, 2016, HOFFMANN, SZKLO, et al., 2014). This subject
will be further investigated in chapter 5 with the water use results from the proposed plant
simulations.
Regarding space constraints, even if there is available land adjacent to the plant
site, there may not be enough space around the existing units to which the capture plant
must be connected. Costly rearrangements due to very long solids and flue gas conveyors
affect more CaL systems than amine scrubbing, as this last must be cooled before entering
the scrubbing system (BUI, DOWELL, 2019, HILLS, SCEATS, et al., 2020). If minimum
plant footprint estimates for CaL systems have not yet been published, the calculations
for oxy-combustion, which require similar equipment (e.g. an ASU and an oxy-fired CFB
boiler), could help to estimate CaL systems land requirement compared to other post-
combustion alternatives. Amine-based systems can have more than three times the land

43
requirement of oxy-fuel plants for power plants over 700 MWe net output (FLORIN,
FENNELL, 2011). The work by FLORIN; FENNELL (2011) reviewed the available
literature on space requirements of carbon capture plants. In the work by HILZ et al.
(2019), where the space of a 20 MWth demonstration CaL plant is calculated, the area
occupied by the interconnected reactors is about half of the area of oxygen supply, coal
delivery, and CO2 purification unit. This subject is further investigated in chapter 5 where
a plant footprint analysis of the CaL plant is conducted based on reactors cross-section
area and literature values from (FLORIN, FENNELL, 2011).
ROMEO et al. (2008) emphasises the lack of exotic material requirements in CaL
systems, and the strong knowledge background for analogous key processes and units
involved, such as CFB boilers, advanced steam cycles, and ASU. These components have
their own development path, which can facilitate CaL plants to gain maturity compared
to other emerging capture technologies. Still, other technical aspects about the operation
of the interconnected circulating fluidized bed (CFB) with the solid looping circulation
of Ca-based particles must be addressed. A CFB is a fluidized bed system that includes a
riser and a down-comer with the solid particles circulating between them (GRACE,
CHAOUKI, et al., 2016). As will be further seen in chapter 3, in CaL systems the riser is
operated in a fast fluidization regime, with solids carried over from the top and returned
to the bottom of the riser through a standpipe, via feeding or control device. Important
operating variables include both gas and solids circulation flow rate.
CFB systems have been widely used in the petrochemical industry with fluid
catalytic cracking (FCC) units and in the power industry with coal combustion.
Depending on the process application, the operating conditions can be significantly
different. In coal combustion, superficial gas velocity and solids flow rates are typically
5–8 m/s and less than 40 kg/m2·s, respectively (GRACE, CHAOUKI, et al., 2016). On
the other hand, FCC uses gas velocities of 15-20 m/s and solids flow rates above 300
kg/m2·s (GRACE, CHAOUKI, et al., 2016). Common disadvantages and challenges of
operating CFBs are: backmixing of solid particles; losses of particles due to entrainment,
very tall vessels required, nonuniform gas distribution and by-pass, and particle attrition.
As fluidized bed reactors should provide a good mixture and large surface area,
particle attrition is seen as an important parameter that affects the performance of the
reactor due to the elutriation of particles and change in particle size distribution (HAAF,
M., STROH, et al., 2017). The attrition phenomena can be defined as the degradation of

44
bed material that leads to change in size and number of particles in the system as a result
of mechanical, thermal, and chemical stresses that emerge in and between the particles
during operation (HAAF, M., STROH, et al., 2017, SCALA, CHIRONE, et al., 2013).
Sorbent attrition is influenced by factors like particle porosity, particle size of fresh
sorbent, material hardness, particle velocity, and exposure time. The attrition rate peaks
when fresh sorbent is introduced and decays to a stationary attrition rate level when
steady-state is achieved (HAAF, M., STROH, et al., 2017). Sorbent attrition of limestone
in fluidized bed reactors has been researched in numerous works and is further discussed
by SCALA et al (2013), MONTAGNARO et al. (2010), ALONSO et al. (2018),
COPPOLA et al. (2012), and DIETER et al. (2014). Natural limestone generally exhibits
high porosity and relatively low hardness compared to other materials generally used in
fluidized bed systems (DIETER, BIDWE, et al., 2014). Thus, experimental campaigns
are essential to address this potential bottleneck.
In the experiments conducted in La Pereda 1.7 MWth pilot plant, attrition problems
and malfunctioning of cyclones during certain experiments were reported in continuous
operation (DIEGO, ARIAS, et al., 2017). Sorbent attrition was also addressed in the work
by HAAF et al. (2017), where a model for a steady-state of the CaL process, developed
using ASPEN PLUSTM, incorporates particle attrition in an empirical approach, as well
as the loss of fine particles as entrained throughout the cyclones (HAAF, M., STROH, et
al., 2017). The values simulated for particle size distribution (PSD) and attrition effects
were in good agreement with experimental data obtained in long-term testing at the 1
MWth pilot plant at Technische Universität Darmstadt (see Figure 2.10). At the 200 kWth
Stuttgart pilot plant, attrition was also monitored in several experimental campaigns.
After two days of operation, the sorbent is considered to be in a steady-state as the whole
bed inventory has been exchanged several times (DIETER, BIDWE, et al., 2014). A
particle size average reduction of 70 µm in the mean diameter d50 of the fresh limestone
particles was measured, reducing from 420 to 350 µm (see Figure 2.10) (DIETER,
HAWTHORNE, et al., 2012). Results based on the dust filtered from both flue gas
streams over the experimental campaign exhibited an average sorbent loss of less than 3
wt.% (and during several hours of less than 2 wt.%) of the total solid inventory per hour.
These values are lower than the required make-up ratios to maintain sorbent activity, so
attrition and bed material loss were not considered critical for CaL operation with the
specific limestone tested (Swabian Alb A) (DIETER, BIDWE, et al., 2014). Limestones

45
with lower hardness will show higher attrition tendencies. However, preliminary results
with weaker limestones have shown that CaL operation is possible if proper attention to
plant operation is given, specially through reduction of thermal and mechanical stresses
using lower fluidization velocities and minimum calcination temperatures (DIETER,
BIDWE, et al., 2014, FENNELL, ANTHONY, 2015).
The majority of the fine material is found in the calciner flue gas, which indicates
that the thermal stress of calcination and the mechanical stress in the cyclones are the
main sources of attrition. The initial calcination of the fresh limestone is responsible for
a significant part of the overall amount of attrition. Therefore, in order to limit attrition
and avoid operational issues such as fines deposition in the system, cyclones, and
fluidization nozzles should be carefully designed (DIETER, BIDWE, et al., 2014,
FENNELL, ANTHONY, 2015).
According to KNOWLTON (2000), process plants which involve the reaction of
gases and solids are difficult to operate. Among the more complex of these processes are
the ones incorporating a fluidized bed reactor and/or a solid recycle transport system,
which is the case for CaL systems. Operational problems occur both in starting up and
maintaining the plant operating continuously (KNOWLTON, 2000). Difficulties of
operating those plants have been surveyed by MERROW (1984), who discovered in his
study with 37 solids processing plants that the majority of performance problems
Figure 2.10 (Left) Particle size distribution of the circulating sorbent (experimentally
measured and simulated) and the fresh limestone during test campaigns at Technische
Universität Darmstadt. Obtained from (Haaf et al., 2017). (Right) Cumulative particle size of
raw limestone and calciner bed material in steady-state. Obtained from (Dieter et al., 2012)

46
(characterized as problems that caused the plant to be off-line for one week or more) were
caused by non-chemical problems. The study also found that 94% of the plants had
experienced some kind of performance problem (MERROW, 1984). The most common
problems reported were solids transfer failures, followed by mechanical equipment
failures, plugging of reactors by solids, and handling of fines and dust. Solids processing
plants operated on average at 64% of the design capacity in the first year of operation,
while the industry average for non-solids operating plants was between 90% and 95%. It
was also reported that solids processing plants take a longer time to start-up than plants
not using solids. If 2.5 months was the actual start-up time for liquid/gas plants, the start-
up time for plants processing raw solid material was 18 months (KNOWLTON, 2000).
Start-up planning was also considered a problem for solids processing plants, as actual
start-up times were over two to three times longer than what was originally agreed
(KNOWLTON, 2000).
Several techniques have been developed to help reducing start-up and operation
problems in fluidized-solids recycle systems reacting and transporting solids. According
to KNOWLTON (2000), two of the most important alternatives to verify potential
problems in commercial large-scale systems processing solids are cold models and pilot
plants. Cold models are built models (of the entire plant or just a section of it) based on a
commercial plant and operated at ambient temperature. Cold models can be used to
simulate a plant on large-scale and help to solve problems occurring in the actual high-
temperature unit. They are useful as can be constructed of clear plastic material that
allows for visual observation of solids movement in the flow system, helping to identify
solids flow patterns and stagnant regions. They are also relatively inexpensive and can be
constructed in a relatively short time (KNOWLTON, 2000).
Pilot plants, on the other hand, are useful tools used for scaling up a process to a
larger unit. Pilot plants also help to solve performance problems and improve the
operation of an existing unit and are relevant when operation at exact process conditions
is required. Pilot plant size is an important aspect of its design, since if the plant is too
small, problems may arise from wall effects (slugging, excess friction, etc.) and if the
pilot plant is too large, costs may be prohibitive (KNOWLTON, 2000).

47
2.4.3 Pilot plant experience with CaL systems
Pilot-scale demonstrations are essential to collect parameters required for the
design, operation, and techno-economic analysis of CaL systems at commercial scale
(FAN, ZENG, et al., 2012). Through the successful operation of various pilot plants at
the MWth scale, sustained by long-term tests in recent years, the feasibility of the CaL
process and its readiness for further scale-up has been confirmed (HAAF, STROH, et al.,
2017, HAAF, HILZ, et al., 2018). This section focuses on the progress of CaL process
testing at pilot-scale, to gather valuable data of design and operational development for
validation of performance models. Lab-scale plants differentiate from pilot-scale plants
usually by the size and heating source, with the former in the low kilowatt range and using
external heating sources such as electrical heating systems. Pilot-scale facilities, on the
other hand, are larger in scale (around the 1 MWe range) and the process heat is usually
generated by the combustion of fuel inside the calciner/regenerator (BHOWN, 2014,
FENNELL, ANTHONY, 2015).
CaL systems lab-scale facilities were fundamental to develop the basis for the
pilot-scale plants and a review of these facilities can be found in several works
(FENNELL, ANTHONY, 2015; HANAK et al., 2014; HANAK et al., 2015a). In
particular, important lab-scale facilities worldwide are: the 30 kWth in Oviedo, Spain, at
The Instituto Nacional del Carbón –Consejo Superior de Investigaciones Científicas
(INCAR-CSIC) (ALONSO, ARIAS, et al., 2018); the 75 kWth in Ottawa, Canada, at
CANMET (FAN, ZENG, et al., 2012); the 10 kWth in Stuttgart, Germany, at the IFK in
University of Stuttgart (DIETER, BIDWE, et al., 2014); and the 25 kWth in Cranfield,
UK, at the Combustion and CCS Centre in Cranfield University (ERANS, JEREMIAS,
et al., 2017). These facilities use two interconnected CFBs or a CFB with a bubbling
fluidized bed (BFB) as reactors and loop seals and/or cone valves to control sorbent
circulation. Other two important lab-facilities are: the 120 KWth, in Ohio, United States,
at Ohio State University; and the 3 KWth, in Hsinchu, Taiwan, at ITRI. These two follow
a different calciner principle and use a rotary kiln, as commonly applied in cement
applications for clinker production (FENNELL, ANTHONY, 2015; HANAK et al., 2014;
HANAK et al., 2015a). The most representative pilot-scale plants are further described.

48
2.4.3.1 INCAR-CSIC – La Pereda 1.7 MWth pilot plant
Using the experience gained through operating the 30 kWth unit, as well as the
industrial expertise for large-scale CFB combustors, INCAR-CSIC decided to build the
1.7 MWth pilot-plant in 2009 in agreement with several partners: ENDESA (which
coordinated the project), Foster Wheeler, and HUNOSA (owner of the CFPP linked to
the pilot plant). They had R&D support from University of Stuttgart (IFK), Lappeenranta
University, Imperial College, and the University of Ottawa and CANMET-ENERGY.
The plant was commissioned in 2011 and entered operation in 2012 under the scope of
the project called CaOling, partly funded by the European Union 7th Framework
Programme (ENDESA, 2013; HANAK et al., 2015a; SACRISTÁN, 2014). In 2017, the
plant had more than 3100 hours of stable operation in fulfilment of three European
projects (ARIAS, DIEGO, et al., 2017).
La Pereda demonstration facility receives a small fraction or slip stream (about
1%) of the flue gas generated from a nearby 50 MWe CFB boiler at the HUNOSA power
plant, located in Asturias, northern Spain. Flue gas from the power plant is blown to the
carbonator with a fan. The test rig consists of two main reactors designed as CFBs and
interconnected by loop seals, which are designed in order to control internal solids
circulation and exchange among reactors (see figure 2.11). The carbonator operates
around 650 °C with recorded CO2 removals between 40% and 95% (ARIAS, DIEGO, et
al., 2017, FENNELL, ANTHONY, 2015). To achieve near full sorbent conversion, the
calciner operates with calcination temperatures of 20 to 30 °C above the equilibrium
concentration temperature of the calcination reaction. In oxy-combustion conditions, the
plant is operated with O2 over 5%.vol at the exit of the calciner for high coal combustion
efficiency. Retractable heat exchangers or water-cooled bayonet tubes allow for heat
removal and temperature control in the carbonator, with an adjustable cooling area
(DIEGO, ARIAS, et al., 2017, FENNELL, ANTHONY, 2015, HANAK, ANTHONY, et
al., 2015). The range of operating conditions and the main variables involved during test
campaigns are available in ARIAS et al. (2013).

49
Figure 2.11 A) Front view of La Pereda pilot plant B) Scheme of the interconnected fluidized reactors. Obtained from (Arias et al., 2017b).
The two interconnected CFB reactors have both heights of 15 m and internal
diameters of 0.65 and 0.75 m for the carbonator and the calciner, respectively. The
diameters were selected to achieve gas velocities between 3 m/s and 6 m/s, which are
similar to those encountered in industrial CFBs (SÁNCHEZ-BIEZMA,
BALLESTEROS, et al., 2011). While the carbonator is fluidized using the flue gas from
the power plant, coal and limestone are fed to the calciner from two independent silos by
a feeding system. They are mixed before entering the calciner reactor, which can operate
under air or oxy-firing conditions, using a mixture of O2 and CO2 from gas storage tanks
(DIEGO, ARIAS, et al., 2017, FAN, ZENG, et al., 2012). With CO2 entering the calciner
from storage tanks, no recirculation of the flue gas in this reactor is used. Both reactor
exits are equipped with high-efficiency cyclones. The carbonator cyclone separates the
flue gas from the partially carbonated solids while the calciner cyclone separates the
concentrated CO2 stream from the calcined sorbent at the oxy-fired CFB combustor. The
solids fall into double loop seals which are operated with BFBs to enable control of solid
circulation. Part of the solids in each loop seal is circulated internally to maintain desired
operational conditions and stability of the CFB system, while the rest of the solids are
transported towards the other reactor. Results of the test facility confirm the feasibility of
the process for further scale up to a 30 MWth plant if the system is operated with proper
sorbent inventory and activity. Actual CO2 capture in the carbonator was achieved close
to the equilibrium value at a given temperature, e.g above 90% at 660 °C. Moreover, an

50
SO2 capture rate of more than 95% was achieved (HANAK, ANTHONY, et al., 2015).
More results from the 1.7 MWth test facility can be found in ARIAS et al. (2017b, 2013)
and SÁNCHEZ-BIEZMA et al. (2013).
2.4.3.2 Institute of Energy Systems and Technology at Technische Universität (TU) Darmstadt – 1 MWth pilot plant
The 1 MWth TU Darmstadt pilot plant was erected and commissioned in 2011 at
Darmstadt University of Technology, Germany. The pilot plant comprises two
interconnected CFB reactors with a screw conveyor (for transport from carbonator to
calciner) and loop seal (from calciner to carbonator) in the solid looping mechanism
(FENNELL, ANTHONY, 2015, STRÖHLE, JUNK, et al., 2014). The solids transfer
between the CFBs by a screw conveyor differs from other pilot plants. In a commercial-
scale unit, as large volumes of solids and variant loads will be transferred between the
reactors due to changes in the power plant load, screw conveyors will not be a
mechanically efficient alternative (HANAK, ANTHONY, et al., 2015). The carbonator
is 8.66 m in height and 0.6 m in internal diameter and it is equipped with internal bayonet
cooling tubes at the top of the reactor for temperature control. The calciner is 11.35 m in
height and has an internal diameter of 0.4 m. The entire system, including circulation
ducts, has a refractory lining to minimise heat loss (HANAK, ANTHONY, et al., 2015,
STRÖHLE, JUNK, et al., 2014). Both reactors are equipped with components of
industrial CFB systems at a semi-industrial scale, including start-up burners, heat
exchangers, and bag filters (HILZ, HAAF, et al., 2019). The sorbent dosing system adds
continuous fresh limestone to the carbonator, instead of the calciner as in other pilot
plants. This configuration is claimed to reduce fuel and O2 consumption in the calciner
(STRÖHLE, JUNK, et al., 2014). A combustion chamber provides the coal flue gas for
the carbonator. Coal is fired with the oxygen-enriched recirculated flue gas (a
recirculation unit is attached to the calciner) under oxy-fuel conditions. The fuel is
continuously fed to the calciner by a gravimetric dosing system (HELBIG, HILZ, et al.,
2017). The flue gas and the CO2 product stream are subsequently cooled down in the heat
exchangers, and then cleaned from fly ash in fabric filters (HANAK, ANTHONY, et al.,
2015).
First test campaigns had no internal recirculation, which was changed in a second
configuration where the lower loop seal was replaced by a cone valve. In 2019, the pilot
plant had successfully been operated for more than 3,900 hours in a wide range of

51
operating conditions, achieving steady-state operation in gas and sorbent phases (HILZ,
HAAF, et al., 2019). Investigation on fuel influence has shown that the amount of ash in
the circulating sorbent stream is significantly affected by the particle size of the coal fired
in the calciner (HILZ et al., 2018). The industrial size feasibility of the CaL process was
considered proven after over 1219 hours of steady-state CO2 capture with capture rates
up to 94 % (HELBIG, HILZ, et al., 2017). The experience with this plant is serving as
basis to a planned scale-up to a 20 MWth plant. The facility is also used for chemical
looping combustion tests (HAAF, HILZ, et al., 2018, HILZ, HAAF, et al., 2019, JUNK,
KREMER, et al., 2014).
2.4.3.3 Institute of Combustion and Power Plant Technology at University of Stuttgart
(IFK) – 200 kWth pilot plant
The 200 kWth pilot plant was commissioned in 2010 and designed for maximum
operating flexibility to enable experiments with different concepts for solid circulation
and fluidization regimes. The plant includes a CFB calciner operating in the fast
fluidisation regime interconnected with two CFB carbonators, one operating under a fast
fluidisation regime and the other in a turbulent regime (DIETER, BIDWE, et al., 2014).
The turbulent carbonator presence is justified to enable a more flexible flue gas load.
Operational velocities are between 4-6 m/s for the two reactors in the fast regime and
between 1-4 m/s for the carbonator reactor in the bubbling/turbulent regime (FENNELL,
ANTHONY, 2015). The design involving two symmetric CFBs in the fast fluidisation
regime has two loop seals with cone valves in the solid circulation system for independent
control of the looping ratios (DIETER, HAWTHORNE, et al., 2012, DIETER, BIDWE,
et al., 2014, HANAK, ANTHONY, et al., 2015). The calciner is 10 m in height and 0.021
min internal diameter and is equipped with a staged oxidant supply for oxy-combustion
of solid fuel. The staged oxidant supply allows for a uniform temperature profile in the
reactor and operations with wood pellets reached 50%vol of O2 without the presence of
hot spots. Flue gas recirculation in the calciner is implemented to simulate realistic
conditions, even if the firing system is designed to support operations with up to 70%vol
of O2. The fast-fluidised CFB carbonator has 10 m in height and 0.023 m in internal
diameter, while the turbulent carbonator has 6 m in height and 0.033 m in internal
diameter. The temperature in the carbonator fluctuates between 620-650°C with the
designed temperature of 650°C only observed in the bottom dense region. Still,
temperature reduction in the upper part had a minor effect on the carbonator efficiency,

52
indicating most of the reaction occurs in the dense region (HANAK, ANTHONY, et al.,
2015, HANAK, MANOVIC, et al., 2014). Up to 2015, the pilot plant had operated for
1400 h, of which 700 h in carbon capture mode (FENNELL, ANTHONY, 2015).
2.4.3.4 Industrial Technology Research Institute (ITRI) – 1,9 MWth pilot plant
Based on experience with the 3 kWth unit, a 1,9 MWth pilot plant was fully
constructed in 2013 at the ITRI, Taiwan, for CO2 capture from cement plants flue gases.
In contrast to most of the CaL pilots in operation, which are based on CFB or BFB reactor
systems, this pilot plant is the attempt to design and operate the calciner as a rotary kiln
unit. This configuration is beneficial for investigating integration opportunities between
the power and cement industries (CHANG, CHEN, et al., 2014b, HANAK, ANTHONY,
et al., 2015).
The pilot plant removes a tonne of CO2 per hour from the Hualien cement plant
flue gas, whose concentration is more than 15 vol. % of CO2. The solids transportation is
done via a pneumatic conveying link. The carbonator is a bubbling fluidized bed and has
a diameter of 3.3 m and a height of 4.2 m. The rotary kiln calciner has a diameter of 0.9
m and a length of 5m. The system was designed for and has operated with CO2 capture
levels higher than 85%. Heat for calcination is provided through direct oxy-combustion
of diesel oil in the rotary kiln calciner, which requires flue gas recirculation for
temperature control. The accumulated time of unit operation in a fully-continuous looping
test is more than 300 hours. The plant is considered an important milestone for the future
construction of a 30 MWth demonstration plant (CHANG, CHEN, et al., 2014a,
FENNELL, ANTHONY, 2015, HANAK, ANTHONY, et al., 2015).

53
2.4.4 Relevant feedstock properties
The scientific literature usually focuses on evaluating CaL systems added to coal-
fired plants (ARIAS, B., DIEGO, et al., 2013, ARIAS, Borja, DIEGO, et al., 2017,
SÁNCHEZ-BIEZMA, PANIAGUA, et al., 2013, STRÖHLE, JUNK, et al., 2014). There
are important differences between using solid fossil fuels and biomass for electricity and
heat generation. Among chemical and physical-mechanical fuel properties, the more
relevant for combustion in boiler or oxy-combustor reactors are: heating value, moisture
content, ash content, contaminant content (mainly nitrogen, sulphur, and chlorine
contents), material grindability, and bulk density. A proximate analysis can be used in a
preliminary evaluation of fuel chemical properties. Proximate analysis is composed of
fixed carbon, volatile matter, ashes, and moisture. The fixed carbon content represents
the amount of material left over after the removal of the volatile matter. The volatile
matter content, which is primarily represented by combustible gases, represents the
tendency for fuel ignition (HOFFMANN, 2010) and is usually greater in biomass than
coal (CENTENO-GONZÁLEZ, LORA, et al., 2017). Ash content represents the
inorganic material that forms ashes when burned, which needs to be ultimately removed
from the system. Relevant characteristics of ashes are its melting temperature and fouling
properties. The temperature and melting behaviour of ashes depend on their composition,
which greatly differs for biomass and coal, and is also different intra fuels – i.e. between
different coals and biomasses (HOFFMANN, 2010). High moisture content affects the
net yield of the process and the fuel heating value, with more heat required for water
evaporation. Depending on the boiler and fuel, moisture content limits need to be
specified to ensure satisfactory fuel conversion (HOFFMANN, 2010).
The heating value determines how much heat can be generated by a given amount
of fuel. In the case of a calciner or boiler, the heating value influences the amount of fuel
that needs to be fed into the system to obtain the desired operating temperature. Therefore,
it impacts the design and size of the combustion system. High carbon and hydrogen
contents contribute to an increase in the heating value, while high oxygen content
decreases it (HOFFMANN, 2010). Biomass generally has a lower heating value relative
to coal as it has less carbon and more oxygen in its composition (KHAN, DE JONG, et
al., 2009).
Fuel contaminants content is an important parameter to measure how flue gases
and solid waste (ashes) needs to be treated. Flue gas and solid waste can be reused and/or

54
discharged (HOFFMANN, 2010). Some fuel contaminants cause unwanted emissions or
make the combustion process more difficult by damaging the system. The nitrogen
content has a direct effect on the formation of HCN and N2O, compounds that form NOx
in combustion conditions, one of the main causes of acid rain. Sulphur can form SOx
compounds and needs to be removed for the same reasons as NOx. Sulphur content is
lower in biomass compared to most coals. Besides, chlorine compounds, can cause
fouling, participate in corrosion processes, and lead to HCl emissions (JANTTI, 2012).
Chlorine corrosion is often accelerated by alkaline components in the fuel (BASU, 2015).
This contaminant participates in different combustion-related problems and is one of the
most important elements with regard to feedstock behaviour (BASU, 2015, KHAN, DE
JONG, et al., 2009).
Physical-mechanical properties define how the fuel can or should be prepared for
the combustion process. One of the most important physical-mechanical properties for
combustion is grindability. The grindability describes material behaviour in the mill
process. A relatively good grindability means that the material fragments with low energy
consumption and presents a uniform grain size. Fibrous materials such as biomass
typically consume more energy than porous materials such as coal (HOFFMANN, 2010).
The advantage of using pulverised fuel is the increase in specific surface area, increasing
combustion efficiency. Thus, reactors that work with pulverized material achieve a higher
load capacity with smaller installations. Grain size uniformity is also important in reactors
that operate with bulk material in order to obtain homogeneous operating conditions. A
heterogeneous distribution in bed material could cause failures in aeration, which leads
to problems in temperature control (HOFFMANN, 2010). Bulk density is also important
considering heating value and transportation of biomass.
In relation to coal, fuel properties depend on formation conditions of incomplete
decomposed organic matter, including: temperature, pressure, original biomass, and
formation time. Coal is generally classified into four coal classes: anthracite, bituminous,
sub-bituminous, and lignite (HOFFMANN, 2010). Fixed carbon content and heating
value tend to decrease from anthracite to lignite, while the volatile material and moisture
contents increase. Based on these characteristics, anthracite and bituminous coal are
considered nobler classes or high-rank, and sub-bituminous and lignite coal are
considered low-rank. Low-rank coal generally has a higher content of ash, sulphur, and
contaminants. A CaL system equipped with oxy-fired CFB calciner can process a wide

55
variety of fuels of different qualities, however, differences mainly in the sulphur content
can change sorbent activity. This is due to the sulphation reaction that occurs with priority
in the reactor, altering sorbent make-up and looping rates. The influence of inert solids
and sulphur content on the design of CaL systems fuelled with coal was investigated by
(DIEGO, ARIAS, et al., 2013). It was found that the impact on CaL performance is
greater due to the sulphur inlet rather than the ash or inert inlet. The work confirmed that
when operating with low make-up flows, the carbonator efficiency shows high sensitivity
to the composition of the coal added to the calciner and the SO2 content in the flue gas
(DIEGO, ARIAS, et al., 2013). The work by (HE, QIN, et al., 2017) particularly
investigated the influence of coal-derived ash in the CaL process. The findings point out
that the impact of ash are of concern even though the inhibition of the CO2 sorption could
be minimised by careful selection of the coal used (HE, QIN, et al., 2017). Therefore, it
can be derived that it could be a limiting factor for the application of CaL systems to use
certain coals with high sulphur and ash content. This is especially relevant considering
the Brazilian coal, which has high ash and sulphur content (EPE, 2017). Co-combustion
with biomass could be an alternative to deal with the high sulphur content of some coals.
At the same time, the CaL system could also work as an SO2 capture plant, as is
possible to capture high rates of the sulphur present in the fuel, at the expense of an
increase in limestone consumption, avoiding SOx emissions (ABANADES, ARIAS, et
al., 2015). On the other hand, amine-based systems require an FGD unit downstream of
the process (and possibly an SO2 polisher set to 10 ppm downstream of the scrubber), to
keep solvent consumption and cost at reasonable values (METZ, DAVIDSON, et al.,
2005), as the cost of the amine-based solvent is comparatively high.
Volatile matter influences coal reactivity and sub-bituminous and lignite have
higher reactivity than nobler coals. Typical moisture content is below 20 wt% for
bituminous coal, between 20 and 30 wt% in sub-bituminous coal, and up to 45 wt% for
lignite (HOFFMANN, 2010). Regarding grindability, high-rank coal is generally harder
than sub-bituminous coal or lignite. Considered a high-value material, anthracite is not
normally used in power generation systems. Bituminous coal is generally used for coal-
fired plants, followed by sub-bituminous and lignite (FOUT, ZOELLE, et al., 2015,
MANTRIPRAGADA, ZHAI, et al., 2019b).

56
On the other hand, biomass presents lower energy density (heating value) and
greater moisture content and material heterogeneity (IEAGHG, 2011, ZHAO, ZHOU, et
al., 2017). These differences can lead to modifications particularly in the feeding system,
boiler design, burner configuration, and pre-treatment stages (IEAGHG, 2011). The main
options for pre-treatment stages for biomass include sizing, drying, washing, palletisation,
and torrefaction, as well as combinations of some of them (CARBO, ABELHA, et al.,
2016, MACIEJEWSKA, VERINGA, et al., 2006). The costs of pre-treatment may be
compensated by the ease in operating the fuel during handling, storage, transportation,
feeding, and controlled combustion (BAHADORI, ZAHEDI, et al., 2014,
MACIEJEWSKA, VERINGA, et al., 2006).
The common disadvantages of biomass for combustion processes include: the
heterogeneity concerning ash content; seasonal feedstock availability; high alkaline
content; low ash melting point; low bulk density; and uncertain transportation and pre-
treatment costs (ZHAO, ZHOU, et al., 2017). The low ash melting point is due to greater
levels of alkali compounds such as potassium (K) and sodium (Na), which react with flue
gases and bed material (silica or sand) by forming eutectics compounds. This leads to less
efficient thermal systems since steam cycle temperature must be limited or the eutectic
compounds will contribute to operational problems such as bed agglomeration, corrosion,
and fouling in boilers and circulating fluidized bed combustors (CFBCs) (AMEC
FOSTER WHEELER ENERGIA OY, 2015, ARJUNWADKAR, BASU, et al., 2016,
KHAN, DE JONG, et al., 2009). Other components such as Mg and Ca can increase ash
melting temperature (KHAN, DE JONG, et al., 2009). These and other ash-related
problems of biomass such as alkali-induced slagging (ash fusion) are further investigated
in the work by NIU et al. (2016).
In addition, pulverising solid biomass to feed the boiler is more difficult due to its
fibrous character, which makes disintegration an energy-intensive process. The
pulverised biomass material is often more cohesive, leading to conveying problems in
pneumatic systems and, therefore, additional costs caused by the need for a more specified
feeding system (BERGMAN, BOERRIGTER, et al., 2002, HOFFMANN, 2010). In
short, the pulverised untreated biomass requires higher gas velocity in its pneumatic
conveying system to achieve the same mass loading as coal (CARBO, ABELHA, et al.,
2016). Finally, to guarantee a more steady fuel supply on a year-round basis, fuel storage
is necessary and should also have a different approach for biomass compared to coal,

57
since the first is more susceptible to water-induced and mechanical degradation, being
able to change its moisture content, energy value and dry matter content due to its
microbiological activity and degradation processes (RENTIZELAS, 2016). Biomass
should be stored protected from water exposure, typically below 12 wt% of moisture
content so that the risk of biological decay is diminished (CARBO, ABELHA, et al.,
2016). At the same time, a moisture content below 2 wt%, increases the risk of self-
heating, fire, and/or explosion (CARBO, ABELHA, et al., 2016). The most suitable
biomass storage method depends on key factors such as the type of biomass, its shape and
size, quantity and volume, regional weather conditions, end-use, transportation distance,
etc (RENTIZELAS, 2016). Open-air storage, covered with and without climate control,
and steel or concrete bins and silos are some of the available methods (RENTIZELAS,
2016).
Due to economic reasons associated with its supply chain, storage, and operational
processes, large scale dedicated biomass thermal plants (over 100 MWe) have not been
extensively deployed18 in the past, with most of the proposed solutions aimed at
significantly introducing biomass in the electricity sector focused in co-firing it with coal
in existing power plants (DAI, SOKHANSANJ, et al., 2008, LIVINGSTON,
MIDDLEKAMP, et al., 2016, OZCAN, ALONSO, et al., 2014). Co-firing up to 20%
biomass with coal is technically feasible with relatively modest modifications on the
existing system (DAI, SOKHANSANJ, et al., 2008). Higher mixing ratios, in turn, can
cause more difficulties in fuel preparation, milling stages, boiler capacity, and ash
utilization, which can reveal a need for a dedicated biomass infrastructure
(MACIEJEWSKA, VERINGA, et al., 2006, OZCAN, ALONSO, et al., 2014). Generally,
the feedstock price and the high operational costs associated (fuel collection, storage,
transportation, and pre-treatment) are important drawbacks for the wide deployment of
large-scale dedicated biomass-fired power plants (BFPPs) (XU, YANG, et al., 2020). In
short, large-scale dedicated biopower units impose inherent logistical challenges and are
roughly viable in a range from 25 to 100 MWe (HETLAND, YOWARGANA, et al.,
2016). Thus, dedicated biomass-fired thermal plants are typically smaller and more
dispersed than thermal plants fuelled with coal (XU, YANG, et al., 2020), which implies
18 One of the largest operating biomass-fired fluidised bed system is located in Polaniec, Poland and delivers 205 MWe (447 MWth) to the grid (ERIKSSON, TIMO, et al., 2015).

58
on a negative effect on the economies of scale of these systems, especially if the
application of CCS is considered (IEAGHG, 2011).
On the other hand, aside from being a carbon-neutral fuel and reducing net
emission of greenhouse gases compared to coal (SAIKAEW, SUPUDOMMAK, et al.,
2012, XU, YANG, et al., 2020), biomass direct combustion usually generates lower
content of certain pollutants, such as sulphur and mercury, and has lower ash content than
coal (ZHAO, ZHOU, et al., 2017). When co-fired with high-sulphur coal, reductions in
NOx and SOx emissions can be achieved (OZCAN, ALONSO, et al., 2014,
SCHOLARSARCHIVE, LIN BAXTER, et al., 2005).
Regarding fuel properties influence in CaL systems, the ash content of a given
feedstock is of great importance to the complexity of the removal facilities and can also
be responsible for modifying design parameters in order to maintain reasonable solid
looping circulation rates (HANAK, BILIYOK, et al., 2015b). In CaL systems, feedstock
ashes will arguably be removed in solid-state after incomplete burn in the calciner, most
likely using dry ash reactors and specified particle removal facilities.
In terms of the reported experiences with CaL and biomass, solid biomass direct
combustion with in situ CO2 capture by CaO in a 300 kWth circulating fluidized bed
facility was experimentally validated in continuous mode (ALONSO, DIEGO, et al.,
2014). The system concept relies on the higher reactivity of biomass over coal, which
allows for effective combustion around 700 °C in air at atmospheric pressure. In such
conditions, CaO particles are fed into the fluidized bed combustor (which plays the role
of carbonator combustor), and react with the CO2 generated during biomass combustion
(ALONSO, DIEGO, et al., 2014). Wood pellets are used as biofuel (ALONSO, DIEGO,
et al., 2014, OZCAN, ALONSO, et al., 2014). A dedicated large-scale (>100 MWe)
similar version of this system was proposed and modelled by (OZCAN, 2014). The
process is compared to conventional biomass-air-fired and biomass-oxy-fired power
plants. It has demonstrated to be capable of achieving 84% overall CO2 capture rate with
an energy penalty of 5% when a proper heat exchanger network (HEN) is designed with
the support of a pinch analysis (OZCAN, 2014, OZCAN, ALONSO, et al., 2014).
OZCAN et al. (2014) point out the similarity of a biomass-fired CaL system with
commercial coal-based CFB power plants, which enables one to evaluate in detail the
costs of electricity and CO2 avoided. Considering carbonator and calciner interconnected

59
reactors are erected as CFBs, following (HAAF, HILZ, et al., 2018, HILZ, HAAF, et al.,
2019), is useful, as CFB fuelled with biomass has already achieved commercial level
(AMEC FOSTER WHEELER ENERGIA OY, 2015, JANTTI, 2012, NUORTIMO,
ERIKSSON, et al., 2017). However, there is still continuous effort to deal with specific
biomass-related problems. Typical problems while operating CFBs with biomass are
fouling on furnace walls and convection surfaces, combined or not with corrosion, bed
agglomeration, slagging, and chlorine emissions (AMEC FOSTER WHEELER
ENERGIA OY, 2015, KHAN, DE JONG, et al., 2009). As previously mentioned for
conventional energy conversion systems, the presence in the feedstock of elements such
as Si, K and Na, and also Cl, is specifically responsible for causing ash fouling, slagging
and other problems in CFBs systems (NIU, TAN, et al., 2016).
In the work by MARTÍNEZ et al. (2018), the calciner of a CaL system retrofitted
in an existing subcritical coal-fired power plant is fired with woody biomass so that the
full system achieves a negative emission factor – i.e. the entire system becomes carbon-
negative including the existing coal power plant retrofitted with the CaL capture system
(MARTÍNEZ, ARIAS, et al., 2018). This carbon-negative potential for existing coal-
fired plants using a biomass-fired calciner is also defended by HANAK et al. (2015)
(HANAK, BILIYOK, et al., 2015b).
The use of a pure oxygen environment in a CFB biomass boiler could bring
problems associated with the high fuel reactivity, and extremely high temperatures could
be reached close to the oxidant injection ports, creating hot spots (MARTÍNEZ, ARIAS,
et al., 2018). The high temperatures may also cause melting and vaporization issues
associated with the biomass ashes, leading to bed agglomeration (MARTÍNEZ, ARIAS,
et al., 2018). However, the oxy-fired calciner of a CaL system could reduce some of these
problems due to the absence of heat transfer surfaces within the reactor (only the
carbonator has an integrated heat exchanger in a CaL standard configuration), which
would ultimately avoid the corrosion problems in the heat exchanger tubes (KHAN, DE
JONG, et al., 2009, MARTÍNEZ, I., ARIAS, et al., 2018). Additionally, large circulation
of CaO as the bed material within the reactor may greatly reduce agglomeration problems
caused by the high alkali content in biomass ashes (MARTÍNEZ, I., ARIAS, et al., 2018).
Results reported in the work by HANAK et al. (2015) (HANAK, BILIYOK, et
al., 2015b), simulating coal and biomass-fired calciners for post-combustion CaL plants,

60
have shown that the increase in net power output is higher for high-ash fuels like coal in
typical sorbent make-up rates (lower than 5%) and calciner higher oxygen content (higher
than 30%vol in wet basis). The opposite is true for higher sorbent make-up rates,
favouring low-ash fuels (biomass feedstock), though, under such conditions, high solid
circulation and larger equipment would increase the costs and make the system design
unattractive. For optimized performance parameters, a value of 2% for the make-up ratio
was used for the biomass-fired calciner, and 4% for the coal-fired. The distinct values for
make-up rate were selected so the systems would result in similar total solid looping rates
considering the different ash and sulphur contents, ensuring reasonable sizes for the
reactors (HANAK, BILIYOK, et al., 2015b). Thus, one can derive those biomass-fired
calciners or Bio-CaL systems, when compared to coal Cal systems, will likely require
reduced circulation of solids between the reactors, which translates into reduced thermal
input and lower temperatures to achieve the same calcination efficiency (HANAK,
BILIYOK, et al., 2015b, MARTÍNEZ, I., ARIAS, et al., 2018).
PILLAI et al. (2019) (PILLAI, SURYWANSHI, et al., 2019) evaluated dedicated
biomass-fired power plants using organic Rankine cycles (ORC) integrated with CaL
carbon capture and supplied by sugarcane bagasse in both the calciner and base plant.
Two CaL configurations, including the conventional single loop and a second-generation
double loop, were analysed due to the abundant availability of limestone in countries like
India and China. The study indicated that for the same energy input from biomass
combustion, the energy and exergy penalties of the conventional CaL were less than 2%,
compared to the stand-alone system without carbon capture (without compression, that
accounted for around more 4%) while of the double CaL, more thermally efficient, was
around 0.1% (PILLAI, SURYWANSHI, et al., 2019).
Therefore, as the use of CFBs for CaL systems enables more flexibility in
feedstock selection, the main differences between a conventional CaL using coal and a
Bio-CaL system are more evident in pre-treatment stages, including more plant footprint
for pre-treatment equipment. Thus, minor modifications in the interconnected reactors
that compose the CaL system are required in a Bio-CaL system if lower thermal
efficiencies and capture rates, compared to the standard coal case, are considered
acceptable.

61
3. Modelling of Calcium Looping cycles for post-combustion CO2 capture
In this chapter, values are discussed for key operational parameters based on
available models and experimental data. The chapter is mainly focused on the mass and
energy balances and fluidization regimes of a standard CaL system for post-combustion
CO2 capture. In section 3.1, performance models are presented and the subsections follow
detail sorbent activity mechanism and mass and energy balances. In section 3.2 reactor
design of the CaL system is investigated based on the literature review.
3.1 Performance models
A performance model for a CaL system should be able to calculate the amount of
limestone and fuel needed to achieve a desired CO2 capture efficiency under specified
operating conditions. Results from a performance model should include impacts on the
base power plant efficiency, emissions, and resource requirements
(MANTRIPRAGADA, RUBIN, 2014). Energy and mass balances of solids and gases
across all components, as well as requirements of main reactors and other equipment, are
also calculated. In addition, the potential heat recovered and extra power generated should
be estimated (MANTRIPRAGADA, RUBIN, 2014, 2017a). Usually, a dual CFB reactor
system is considered. In the last decade, several published works have attempted to model
the performance of CaL processes based on a dual CFB reactor system (HAAF, M.,
STROH, et al., 2017, MARTÍNEZ, GRASA, et al., 2013, ROMANO, 2012, STRÖHLE,
LASHERAS, et al., 2009). More recently, various authors developed models using
ASPEN PLUSTM software (HAAF, M., STROH, et al., 2017, HAAF, HILZ, et al., 2018,
HANAK, BILIYOK, et al., 2015a, MOORE, KULAY, 2019) or Aspen Hysys ®
(MARTÍNEZ, I., ARIAS, et al., 2018, MARTÍNEZ, I., MURILLO, et al., 2011b).
The performance models presented in the following sections are a review of the
work of several authors. Yet, most of the equations described are essentially based in the
technical document by MANTIPRAGADA, RUBIN (2017a), as this report follows the
calculation procedure of the Integrated Environmental Control Model (IECM) software,
which is used in this study for plant simulations in chapter 4. The software simulates a
power plant with an integrated CaL cycle for post-combustion CO2 capture

62
(MANTRIPRAGADA, RUBIN, 2017b). The software is introduced and its utilization is
justified in chapter 4. Some of the design parameters (or input variables) considered in
the model are: CO2 capture efficiency in the carbonator, degree of carbonation and
calcination, limestone purity, ratio of make-up CaCO3 molar flow, recirculating sorbent
molar flow, among others.
3.1.1 Solid sorbent activity
The use of solid sorbents for post-combustion CO2 capture can offer some
advantages over conventional aqueous solvent-based processes, including reduced
regeneration energy requirements, due to significantly lower heat capacity (U.S.
DEPARTMENT OF ENERGY/NETL, 2019b). Sorbents with the ideal properties will
provide relatively high absorption capacity (or reactivity), quantified by kg CO2
absorbed/kg sorbent, and the best kinetics for the CO2 absorption process. A high
absorption capacity for both forward and reverse reactions, along with faster kinetics,
allow for lower solids circulation, lower sorbent make-up, and smaller reactors, all of
which lead to lower capital and operational costs (FAN, ZENG, et al., 2012). Other
properties of an ideal sorbent include: low risk for health and safety, low sorbent attrition
and fragmentation, low tendency for agglomeration and sintering, low cost, and high-
availability (FENNELL, ANTHONY, 2015).
In CaL systems, the sorbent carrying activity is one of the most important
parameters to design and operate the cycle, as it sets limits on the calcium inventory and
solid circulation rates to achieve high CO2 capture efficiencies (DIEGO, ARIAS, et al.,
2017). It is known that the activity of a calcined natural limestone particle decreases with
the increasing number of cycles until it reaches a residual capacity (FENNELL,
ANTHONY, 2015, RODRÍGUEZ, ALONSO, et al., 2010). After multiple cycles, the
residual capacity of CaL systems remains between 7.5-10% mol CO2/mol CaO
(FENNELL, ANTHONY, 2015, GRASA, ABANADES, 2006).
Sorbent deactivation can be partially explained by a sintering-induced change in
the morphology of CaO derived from limestone that occurs after a few cycles.
Nanostructured grains turn into large micrometre-sized grains, accompanied by a
reduction in pore volume which diffusion-limits the carbonation reaction. Still,
predetermined average sorbent activity can be maintained by replacement of some of the

63
recirculating sorbent with fresh sorbent, as previously mentioned. Spent sorbent is purged
to avoid the accumulation of inert CaO, fines, ashes, and CaSO4 in the system (DIEGO
et al., 2013). Many sources of natural limestone worldwide have enough reactivity to
sustain large scale plants, maintaining large purge and make-up rates, of hundreds of
tonnes per hour (FENNELL, ANTHONY, 2015).
Several semi-empirical models have been proposed to express the maximum
sorbent conversion rate as a function of the number of carbonation/calcination cycles
(DIEGO, ARIAS, et al., 2017, GRASA, ABANADES, 2006, LI, CAI, et al., 2008). The
model proposed by GRASA, ABANADES (2006) is one of the most commonly used in
CaL process performance (HANAK, MANOVIC, 2016) and it is demonstrated by
equation 3-1:
(3-1)
𝑋 = 1
11 − 𝑋
+ 𝑘𝑁+ 𝑋
Where 𝑋 is CaO conversion in an Nth cycle, 𝑋 is the residual CaO conversion,
and 𝑘 a deactivation constant. The value of 0.52 for 𝑘 is representative for many
limestones and under many conditions, but can vary from 0.28 to 1.96. 𝑋 represents
residual conversion and is usually set to a realistic value of 0.075. (FENNELL,
ANTHONY, 2015, RODRÍGUEZ, ALONSO, et al., 2010). The predictions based on the
semi-empirical model presented in equation (3-1) have been relatively accurate for a wide
range of limestones, particle sizes, and CO2 partial pressures (HANAK, MANOVIC,
2016, HANAK, ANTHONY, et al., 2015).
As a result of multiple cycles in continuous operation, the CaL system solids
inventory is composed of a mixture of particles that have undergone a different number
of carbonation-calcination cycles. Therefore, sorbent particles have different CO2
carrying capacities and the activity of the inventory can be characterized by an average
CO2 carrying capacity known as Xave. The Xave in a continuous large-scale CaL plant
should adequately represent CaO particles lifetime (DIEGO, ARIAS, et al., 2017).
The methodology to represent 𝑋 proposed by RODRÍGUEZ et al. (2010) and
also used by DIEGO et al. (2017) takes into account the partial conversion of particles in
the carbonator-calciner cycles and assumes operating conditions for a typical CaL system,
which comprises: limited residence time in the reactors, low CO2 partial pressure in the

64
carbonator, high CO2 concentration in the calciner and moderate calcination temperature.
Under these assumptions, 𝑋 can be calculated as a function of the “age” of the sorbent
𝑁 , which means the actual number of full carbonation-calcination cycles that each
individual particle has undergone in the system (RODRÍGUEZ et al., 2010). Thus,
assuming the carbonator and calciner to be perfectly mixed reactors (ALONSO,
RODRÍGUEZ, et al., 2009), the Xave of the sorbent can be calculated utilizing the
following expression (RODRÍGUEZ et al., 2010):
(3-2)
𝑋 = 𝑟 𝑋
Where 𝑋 represents the maximum CO2 carrying capacity of the particles after
𝑁 complete carbonation-calcination cycles. To calculate 𝑟 , a mass balance of the
carbonator loop was carried out in the work by RODRÍGUEZ et al. (2010). The work
estimates the fraction of particles, 𝑟 , that have cycled the system N times. This mass
fraction is a function of the solids circulation rate 𝐹 , which is the molar flow of CaO-
based particles19 arriving at the carbonator from the calciner, and fresh limestone make-
up molar flow, 𝐹 , as described by equation 3-3 presented below (RODRÍGUEZ,
ALONSO, et al., 2010).
(3-3)
𝑟 = 𝐹 𝐹
(𝐹 + 𝐹 )
The 𝐹 /𝐹 ratio represents the make-up flow over the recirculating sorbent molar
flow and is often regarded as a key performance parameter (HANAK, MANOVIC, 2016,
HANAK, ANTHONY, et al., 2015, RODRÍGUEZ, ALONSO, et al., 2010). The value
for this parameter varies from 1-5% in the literature (CLARENS, ESPÍ, et al., 2016,
HANAK, BILIYOK, et al., 2015b, MARTÍNEZ, MURILLO, et al., 2011a, ROMANO,
MARTÍNEZ, et al., 2012, ROMEO, ABANADES, et al., 2008, YANG, ZHAI, et al.,
2010), and a realistic value is closer to 2% in more recent works considering coal-fired
plants (FENNELL, ANTHONY, 2015, HAAF, HILZ, et al., 2018, MARTÍNEZ, ARIAS,
et al., 2018). The analysis by HANAK et al. (2015) of the 𝐹 /𝐹 ratio in the 1-5% range,
19 In the form of CaO, CaCO3 and CaSO4 (MARTÍNEZ, I., ARIAS, et al., 2018)

65
revealed that the net thermal efficiency and net power output were the highest at low
𝐹 /𝐹 ratios. However, such operation requires larger equipment, and thus, a trade-off
between economic and thermodynamic performance of the sytem is required. For an
optimal design, balance between the capital costs and operational revenue has to be
considered (HANAK, BILIYOK, ANTHONY, et al., 2016, HANAK, BILIYOK, et al.,
2015a). Also, the selection of the fuel utilized in the calciner, due to different ash and
sulfur contents, influences the choice for the 𝐹 /𝐹 parameter and the size of the CaL
process units, and has considerable impact on the net thermal efficiency and the net power
output of the integrated system.
Then, 𝑟 is the fraction of particles that have experienced 𝑁 cycles and is
calculated as follows. For more details see RODRÍGUEZ et al. (2010):
(3-4)
𝑟 = (𝑟 + (𝐹 /𝐹 ))𝑓 𝑓
( 𝐹𝐹
+ 𝑓 𝑓 )
In the above equation 𝑟 depends on the fraction of uncalcined particles, 𝑟 ,
and the fractional carbonation and calcination conversions, 𝑓 and 𝑓 , respectively,
which can be defined by the following equations (RODRÍGUEZ et al., 2010):
(3-5)
𝑟 = 𝐹 (1 − 𝑓 )
𝐹 + 𝐹 𝑓
(3-6)
𝑓 = 𝑋 − 𝑋
𝑋 − 𝑋
(3-7)
𝑓 = 𝑋 − 𝑋
𝑋
Where 𝑋 and 𝑋 are the average molar content of CaCO3 conversions of
the solids leaving the carbonator and calciner reactors, respectively. Full conversions are
not achieved in the carbonator or the calciner (RODRÍGUEZ, ALONSO, et al., 2010),
and the degrees of calcination 𝑓 and carbonation 𝑓 in each reactor can be seen as
design parameters for an aimed capture efficiency and sorbent carrying capacity. For the

66
carbonated sorbent fraction 𝑓 , a value of 0.7 is commonly specified (HANAK,
BILIYOK, et al., 2015a, b, MICHALSKI, HANAK, et al., 2019), though a higher value
of 0.8 was used in MANTRIPRAGADA, RUBIN (2014). For the degree of calcination
or calcined sorbent fraction 𝑓 , a value of 0.95 is used in several works (HANAK,
BILIYOK, et al., 2015a, MANTRIPRAGADA, RUBIN, 2014, MICHALSKI, HANAK,
et al., 2019). YLATALO et al. (2013) claim that achieving almost full calcination at the
lowest possible temperature reduces costs by minimizing oxygen and fuel consumption
(YLÄTALO, PARKKINEN, et al., 2013).
As it is difficult to determine an explicit solution for the infinite sum in equation
(3-2) when using equation (3-1), the semi-empirical correlation proposed by LI et al.
(2008) in equation (3-8) can be used, since it approaches equation (3-1) as a geometric
progression (LI, CAI, et al., 2008).
(3-8)
𝑋 = 𝑎 𝑓 + 𝑎 𝑓 + 𝑏
Where 𝑎 , 𝑓 , 𝑎 , 𝑓 , and 𝑏 are sorbent fitting constants that can be calculated
using a 𝑋 x 𝑁 curve, obtained with thermogravimetric analysis (TGA) equipment.
The constants in equation (3-8) are determined for a particular sorbent and no particular
reference to their physical meaning was made (except for 𝑏, which represents the residual
carrying capacity 𝑋 in equation 3-1). This semi-empirical model was found to
successfully predict the decay in the conversion of limestone and other sorbents such as
dolomite, provided the fitting parameters were known (HANAK, ANTHONY, et al.,
2015).
For the limestone used during tests with TGA equipment reported in DIEGO et
al. (2017), the fitting constants are a1 = 0.1619, f1 = 0.9590, a2 = 0.8196, f2 = 0.7066
and b = 0.1075. In the work by Rodríguez et al. (2010), slightly different values for the
fitting constants are used: a1 = 0.1045, f1 = 0.9822, a2 = 0.7786, f2 =0.7905 and b=
0.07709. These last constants were applied and compared to equation (3-1), which found
a regression square coefficient higher than 0.99, meaning 𝑋 in equation (3-8)
represents virtually the same deactivation curve as the one expressed by equation (3-1).
Finally, by combining equations (3-2), (3-4) and (3-8), and calculating the limit
of the infinite sum of the geometric series, one can obtain an expression similar to
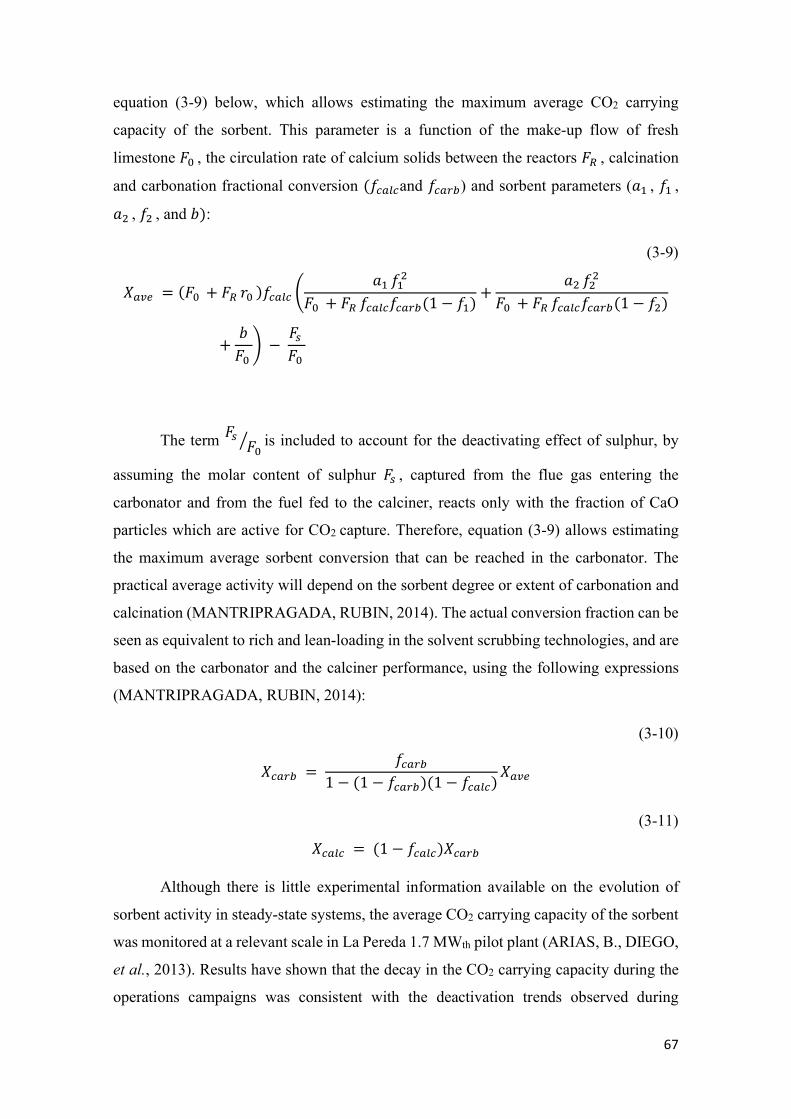
67
equation (3-9) below, which allows estimating the maximum average CO2 carrying
capacity of the sorbent. This parameter is a function of the make-up flow of fresh
limestone 𝐹 , the circulation rate of calcium solids between the reactors 𝐹 , calcination
and carbonation fractional conversion (𝑓 and 𝑓 ) and sorbent parameters (𝑎 , 𝑓 ,
𝑎 , 𝑓 , and 𝑏):
(3-9)
𝑋 = (𝐹 + 𝐹 𝑟 )𝑓𝑎 𝑓
𝐹 + 𝐹 𝑓 𝑓 (1 − 𝑓 )+
𝑎 𝑓
𝐹 + 𝐹 𝑓 𝑓 (1 − 𝑓 )
+𝑏
𝐹 −
𝐹
𝐹
The term 𝐹 𝐹
is included to account for the deactivating effect of sulphur, by
assuming the molar content of sulphur 𝐹 , captured from the flue gas entering the
carbonator and from the fuel fed to the calciner, reacts only with the fraction of CaO
particles which are active for CO2 capture. Therefore, equation (3-9) allows estimating
the maximum average sorbent conversion that can be reached in the carbonator. The
practical average activity will depend on the sorbent degree or extent of carbonation and
calcination (MANTRIPRAGADA, RUBIN, 2014). The actual conversion fraction can be
seen as equivalent to rich and lean-loading in the solvent scrubbing technologies, and are
based on the carbonator and the calciner performance, using the following expressions
(MANTRIPRAGADA, RUBIN, 2014):
(3-10)
𝑋 = 𝑓
1 − (1 − 𝑓 )(1 − 𝑓 )𝑋
(3-11)
𝑋 = (1 − 𝑓 )𝑋
Although there is little experimental information available on the evolution of
sorbent activity in steady-state systems, the average CO2 carrying capacity of the sorbent
was monitored at a relevant scale in La Pereda 1.7 MWth pilot plant (ARIAS, B., DIEGO,
et al., 2013). Results have shown that the decay in the CO2 carrying capacity during the
operations campaigns was consistent with the deactivation trends observed during

68
standard TGA tests, and the model described in this section can be used with reasonable
precision if the calciner is operated at conditions far from the equilibrium curve of CO2
on CaO, and residence time of particles in the reactor is kept to a minimum to reduce their
chance of experiencing multiple carbonation-calcination cycles. (ARIAS, DIEGO, et al.,
2013, DIEGO, ARIAS, et al., 2017)
The reaction between CaO and CO2 occurs in two distinct stages, an initial fast-
reaction stage and a slower-reaction stage, as illustrated in figure 3.1. First stage occurs
within a few minutes and is kinetically controlled. Second stage is slower and diffusion-
controlled by a CaCO3 product layer. The formation of a non-porous carbonate product
layer makes the inward diffusion of CO2 more difficult. Since CaCO3 has a higher molar
volume than CaO, plugging of pores is inevitable during reaction (FAN, ZENG, et al.,
2012).
Figure 3.1. A cycle of carbonation and calcination observed by a TGA. Obtained from OZCAN
et al. (2013)
Thus, the decrease in reactivity and cyclability of CaO can be attributed to the
deteriorating morphological properties due to sintering and surface porous structure
rearrangement. For those reasons, only the first stage of the reaction should be considered
for commercial application, which facilitates the use of more compact reactors. (FAN,
ZENG, et al., 2012).
As previously mentioned, the calcination reaction is endothermic and occurs at a
higher temperature than carbonation under typical conditions. Reactions temperatures are
dependent upon the partial pressure of CO2 and can be lowered through a dilute gas or

69
under sub-atmospheric conditions (FAN, ZENG, et al., 2012). As it can be seen in Figure
3.2 (MANTRIPRAGADA, RUBIN, 2017b), the carbonation reaction will only take place
below the temperature corresponding to the equilibrium partial pressure of CO2. It is
generally agreed that the ideal operating temperature is approximately 650 °C in the
carbonator reactor, considering carbonation reactions kinetics and equilibrium limitations
(HAAF, HILZ, et al., 2018). For calcination, reaction temperature also depends on CO2
partial pressure and type of sorbent fed to the calciner. In pure CO2 atmospheric pressure,
complete calcination occurs for temperatures above 900°C for dolomite and limestone.
Even though higher operating temperatures favours reaction kinetics, it starts inducing
greater sorbent sintering, decaying CO2 capture efficiency, and increasing the need for
fresh sorbent (HANAK, MICHALSKI, et al., 2018). Values just above the equilibrium
temperature of 900°C are ideal to ensure accelerate kinetics and almost full calcination in
the calciner (DIEGO, MARTÍNEZ, et al., 2015, JUNK, KREMER, et al., 2014).
Therefore, optimal operational window of CaL systems needs to counter-balance
reactions kinetics and mechanical constraints.
Figure 3.2 Equilibrium of the calcination and carbonation reactions based on CO2 partial
pressure. Obtained from Mantripragada and Rubin (2017a).
Synthetic and enhanced materials (mainly through doping, thermal and chemical
treatment) have been proposed as an alternative for natural limestone or dolomite, in order
to increase CO2 uptake during carbonation/calcination cycles (FENNELL, ANTHONY,
2015, MORENO, 2017). Additionally, CaO reactivation methods, aimed at effectively

70
recovering sorbents capture capacity, may also be a strategic improvement, with
hydration being one of the reactivation mechanisms that has shown promising results
(FAN, ZENG, et al., 2012, PAWLAK-KRUCZEK, BARANOWSKI, 2017). Another
reactivation mechanism is extended carbonation in a separate third reactor (FENNELL,
ANTHONY, 2015, MARTÍNEZ, I., ARIAS, et al., 2018). However, reactivation methods
and synthetic and enhanced materials usually present a higher cost and their development
is still in initial phases. For these reasons, this work focuses on the standard CaL cycle,
with the use of natural limestone as sorbent.
3.1.2 Solids mass balance
Important objectives of a mass balance in CaL cycles are to calculate the amount
of sorbent circulating between the reactors and the sorbent inventory required for
designed capture efficiency. In large-scale plants, inventory of solids circulating within
reactors is much higher than in loop seals (between reactors) (DIEGO, MARTÍNEZ, et
al., 2015). CaO reacts not only with CO2 in carbonation (equation 2-8), but also with any
residual SO2 (which was not captured in a previous flue gas desulphurisation (FGD) unit
in the existing plant) by forming CaSO4 in a sulphation reaction, as shown in equation (3-
12). In fact, SO2 reacts with CaO more readily than CO2. For this reason, a fraction of
sorbent equivalent to the amount of residual SO2 in flue gas and sulphur in the calciner
fuel is assumed to be unavailable for CO2 capture. Then, besides the unreacted CaO, both
CaCO3 and CaSO4 coexist in the recirculating solids streams. Another solid component
present in the recirculating sorbent is ash originated from the oxy-combustion of
carbonaceous fuel in the calciner (MANTRIPRAGADA, RUBIN, 2014).
CaO (s) + SO2 (g) + ½ O2 (g) ↔ CaSO4 (s) (3-12)
As CaSO4 is more stable and does not dissociate into CaO and SO2 under
calcination operating conditions, the solid it is usually treated as inert along with ash and
limestone impurities (MANTRIPRAGADA, RUBIN, 2014).
Carbonator solids inlet flows:
The inlet streams are identified with the subscript “1” and outlet streams with the
subscript “2”. Parameters with “F” represent molar flows. The inlet solid streams for the
carbonator contains CaO, uncalcined CaCO3, impurities in limestone (considered inert),

71
CaSO4, and ash. Molecular weight of sorbent impurities is assumed to be equal to that of
CaCO3 (MANTRIPRAGADA, RUBIN, 2014). As demonstrated in equation (3-12), one
mole of SO2 reacts with one mole of CaO. Thus, the molar flow of CaO available for
carbonation entering the carbonator might be represented by the following equation:
(3-13)
𝐹 , = 𝐹 , − 𝐹 ,
Maximum conversion of 𝐹 , is limited by 𝑋 , defined in equation (3-
9), and dependent upon the activity of recirculated sorbent and the amount of fresh sorbent
input. The actual conversion fraction of CaO in the carbonator, in turn, is represented by
𝑋 , defined in equation (3-10), and depends on the designed degrees of carbonation
and calcination. As presented in equation (2-8), one mole of CaO reacts with one mole of
CO2 to form one mole of CaCO3. Therefore, the amount of CaCO3 that is formed in the
carbonator is equal to the amount of CO2 captured, as presented below in equation (3-14):
(3-14)
𝐹 , = 𝜂 𝐹 , = 𝑋 𝐹 ,
= 𝑋 (𝐹 , − 𝐹 , )
Where 𝜂 represents the CO2 capture rate/efficiency in the carbonator and
𝐹 , represents the molar flow of CO2 in the flue gas entering the carbonator.
From equation (3-14), the inlet molar flow of CaO can be revealed in terms of the
following input variables:
(3-15)
𝐹 , = 𝜂 𝐹 ,
𝑋+ 𝐹 ,
Considering 𝑋 is the fraction of CaCO3 in the inlet sorbent flow, inlet molar
flow of CaCO3 can be expressed as:
(3-16)
𝐹 , = 𝑋
1 − 𝑋 𝐹 ,

72
Then, fresh sorbent molar flow (CaCO3 make-up) can be calculated as follows,
based on the input parameter 𝐹 /𝐹 :
(3-17)
𝐹 , =𝐹
𝐹 𝐹 , + 𝐹 , =
𝐹𝐹
1 − 𝑋 𝐹 ,
The equation (3-17) above considerers that 𝐹 = 𝐹 , and 𝐹 , +
𝐹 , = 𝐹 . Equations for molar flow inlets of CaSO4 and ash in the carbonator will
be found later. When limestone purity 𝑎 is taken into account, equations for inert
make-up and sorbent make-up develop as follows:
(3-18)
𝐹 , =1 − 𝑎
𝑎 𝐹 ,
(3-19)
𝐹 , =1
𝑎 𝐹 ,
Carbonator solids outlet flows or calciner solids inlet flows:
The molar flow of CaCO3 leaving the carbonator is composed by the uncalcined
molar flow that entered plus the molar flow of CaCO3 formed inside the carbonator:
(3-20)
𝐹 , = 𝐹 , + 𝐹 , = 𝐹 , + 𝜂 𝐹 ,
= 𝐹 , + 𝑋 (𝐹 , − 𝐹 , )
As one mole of SO2 in the flue gas forms one mole of CaSO4:
(3-21)
𝐹 , = 𝐹 , + 𝐹 ,
The other inert is ash from the calciner and sorbent impurities, and can be
represented as follows:
(3-22)
𝐹 , = 𝐹 ,

73
(3-23)
𝐹 , = 𝐹 ,
The last solid stream to be accounted for in the carbonator is the outlet stream of
CaO. As one mole of CaO in the inlet forms one mole of CaCO3 and one mole of SO2 in
the flue gas consumes one mole of CaO, the following equation, derived from equation
(3-20), represents this molar flow:
(3-24)
𝐹 , = 𝐹 , − 𝐹 , − 𝐹 , = 𝐹 , − 𝐹 , +
𝐹 , − 𝐹 , = (1 − 𝑋 ) (𝐹 , − 𝐹 , )
Calciner outlet solid flows:
The inlet streams are identified with the subscript “2” and outlet streams with the
subscript “3”. CaO is formed in the calciner by calcination of CaCO3 that comes from the
carbonator and the make-up flow. The SO2 from the oxy-combusted fuel also consumes
CaO. Thus, the molar flow of CaO that leaves the calciner can be represented with the
following equation:
(3-25)
𝐹 , = 𝐹 , + 𝐹 , − 𝐹 ,
= 𝐹 , + (𝐹 , + 𝐹 , − 𝐹 , ) − 𝐹 ,
By its definition, 𝑋 can be represented as:
(3-26)
𝑋 = 𝐹 ,
𝐹 , + 𝐹 ,=
𝐹 ,
𝐹 , + 𝐹 ,
Thus, 𝐹 , can be derived as:
(3-27)
𝐹 , = 𝐹 , + (1 − 𝑋 )(𝐹 , − 𝐹 , − 𝐹 , )

74
From equation (3-26) and (3-27):
(3-28)
𝐹 , = 𝑋
1 − 𝑋 𝐹 ,
= 𝑋
1 − 𝑋 𝐹 , + 𝑋 (𝐹 , − 𝐹 , − 𝐹 , )
As presented in equation (3-16) the term 𝐹 , is equal to 𝐹 , . Then,
if complete calcination occurs and 𝑋 = 0, there will be no flow of CaCO3 out of the
calciner and 𝐹 , will equal 0. To account for all components, flows for ash and
CaSO4 can be calculated as follows:
(3-29)
𝐹 , = 𝐹 , + 𝐹 , = 𝐹 , + 𝐹 , + 𝐹 ,
(3-30)
𝐹 , = 𝐹 , + 𝐹 , = 𝐹 , + 𝐹 ,
(3-31)
𝐹 , = 𝐹 , + 𝐹 , = 𝐹 , + 𝐹 ,
Purge solid flows:
As purge flows are usually taken from the calciner outlet streams, the molar flow
rates of purges will be the difference between flow rates of calciner outlet “3” and
carbonator inlet “1”. Thus:
(3-32)
𝐹 , = 𝐹 , − 𝐹 , = (1 − 𝑋 )(𝐹 , − 𝐹 , − 𝐹 , )
(3-33)
𝐹 , = 𝐹 , − 𝐹 , = 𝑋 (𝐹 , − 𝐹 , − 𝐹 , )
(3-34)
𝐹 , = 𝐹 , − 𝐹 , = 𝐹 , + 𝐹 ,
(3-35)
𝐹 , = 𝐹 , − 𝐹 , = 𝐹 ,

75
(3-36)
𝐹 , = 𝐹 , − 𝐹 , = 𝐹 ,
Purge molar flows equations for CaSO4 and ash confirm the mass balance of the
complete system, as sulphur from flue gas and oxy-combustion goes out through purge,
as well as ash coming from oxy-combustion. Considering purge is taken from calciner
outlet streams “3”, the fraction of different solid streams in the total flow will be equal
for streams “1”, “3” and “purge”, which means the following equation is valid:
(3-37)
𝐹 ,
𝐹 ,=
𝐹 ,
𝐹 ,
Thus, combining equations (3-16), (3-33) and (3-34), equation (3-37) can be
derived as:
(3-38)
𝐹 , = 𝐹 ,
1 − 𝑋
(𝐹 , + 𝐹 , )
(𝐹 , − 𝐹 , − 𝐹 , )
In a similar way, 𝐹 , and 𝐹 , can be expressed as:
(3-39)
𝐹 , = 𝐹 ,
1 − 𝑋
( 𝐹 , )
(𝐹 , − 𝐹 , − 𝐹 , )
(3-40)
𝐹 , = 𝐹 ,
1 − 𝑋
( 𝐹 , )
(𝐹 , − 𝐹 , − 𝐹 , )
Therefore, total flow of solids at the carbonator inlet can be calculated as follows:
(3-41)
𝐹 , = 𝐹 , + 𝐹 , + 𝐹 , + 𝐹 , + 𝐹 ,
= 𝐹 ,
1 − 𝑋 (1 +
𝐹 , + 𝐹 , + 𝐹 , + 𝐹 ,
𝐹 , − 𝐹 , − 𝐹 ,)
To solve this equation, the variables 𝐹 , and 𝐹 , have to be known.
However, these variables depend on the amount of fuel burnt in oxy-combustion, which

76
relies upon the heat requirement of the calciner, and, as a consequence, the heat balance
of the calciner needs to be solved. The next section calculates these variables.
3.1.3 Heat (Energy) balance
The energetic loop of the capture process for the proposed retrofit configuration
should consider the energy supplied to the calciner from the additional fuel and the
exothermic reaction occurring in the carbonator. Heat input to the calciner should be
sufficient to heat the inlet streams up to the calcination temperature - between 900 and
950 °C - and supply thermal energy for the calcination reaction. Calciner inlet streams
include the solid streams from the carbonator, the solid stream of sorbent make-up, and
recycled flue gases (MANTRIPRAGADA, RUBIN, 2014, 2017b). The recycled flue gas
is needed despite the endothermic calcination reaction taking place in the calciner because
high O2 contents can lead to local hot-spots20 and enhance sorbent sintering in the reactor
(HANAK, BILIYOK, et al., 2015b). Considering the reaction heat is supplied by oxy-
combustion of a fuel, the following equation can be used to account for this heat
requirement:
(3-42)
𝐻 = 𝑚 𝐻𝐻𝑉
𝜂
Where 𝐻 is the heat requirement of the calciner and can be represented in kJ/s,
𝑚 is the mass flow rate of fuel (kg/s as-burnt in wet basis), 𝐻𝐻𝑉 is the fuel higher
heating value and 𝜂 is the efficiency of the oxy-combustion. The variable 𝑚 can
be expressed in terms of the molar contents of its constituents, as follows:
(3-43)
𝑚 = 𝐹 ( 𝑀𝑊
𝑤)
20 The state-of-the-art CaL configuration assumes that, similarly to oxy-fuel combustion systems, the CO2-rich stream leaving the calciner needs to be recycled to moderate the temperatures inside calciner and avoid hot-spots, which ultimately leads to increased heat requirement in the system. Few studies have proposed steady state operation with no flue gas recirculation and/or 100%vol O2 concentration or minimum flue gas recycling, with O2 concentration higher than 75%vol in the gas stream entering the calciner (EUROPEAN COMMISSION, 2019; HANAK et al., 2018a). Results of these studies report temperatures within the calciner operation range and potential for significant reductions in specific capital cost and cost of energy, though further development is necessary.

77
Where 𝐹 is the inlet molar flow of a component ”i” (C, S, H2, ash, and others),
𝑀𝑊 is the molecular weight of the components and 𝑤 is the weight fraction of the
component in fuel21, obtained from the ultimate analysis data of the fuel in a wet basis.
Inlet molar flow rates of fuel components can be expressed in terms of equation (3-42),
as follows:
(3-44)
𝐹 , = ( 𝐻
𝐻𝐻𝑉) (
𝑤
12)
(3-45)
𝐹 , = ( 𝐻
𝐻𝐻𝑉) (
𝑤
32)
(3-46)
𝐹 , = ( 𝐻
𝐻𝐻𝑉) (
𝑤
2)
(3-47)
𝐹 , = ( 𝐻
𝐻𝐻𝑉) (
𝑤
𝑀𝑊)
The following main reactions, apart from calcination and sulphation reactions
already presented in equations (2-8) and (3-12), respectively, take place in the oxy-
combustion calciner:
(3-48)
𝐶 + 𝑂 → 𝐶𝑂
𝑆 + 𝑂 → 𝑆𝑂
𝐻 + 1/2𝑂 → 𝐻 𝑂
Accounting for the number of moles in those reactions, the amount of O2 that
needs to enter the calciner can be expressed as:
(3-49)
21 The fuel supplied to the calciner can be coal, biomass, natural gas, etc.

78
𝐹 , = (1 + 𝑥 ) (𝐹 , + 𝐹 , +1
2𝐹 , )
Where 𝑥 represents the excess oxygen for oxy-combustion. A value of 2 vol%
(dry basis) for 𝑥 is used in HILZ et al. (2019), while 2.5% is used in HANAK et al.
(2016a). A typical ASU will have an inlet molar flow of N2 dependent on the value of
𝐹 , , as the following equation express:
(3-50)
𝐹 , = (0.05
0.95)𝐹 ,
Considering the solid mass balance and the reactions in (3-48), the gaseous
products flow rates from the calciner can be expressed as the following equations,
assuming no NOx is formed:
(3-51)
𝐹 , = 𝐹 , + 𝐹 ,
𝐹 , = 𝐹 ,
𝐹 , = 𝐹 ,
𝐹 , = 0
𝐹 , = 𝐹 , − 𝐹 , +3 𝐹 ,
2+
1
2𝐹 ,
= 𝑥 𝐹 , +1
2𝐹 , + (𝑥 −
1
2) 𝐹 ,
A fraction of the gaseous products of the calciner is recycled, in order to moderate
the temperature in the oxy-combustion reactor. Thus, a part of the heat requirement goes
into heating the recycled stream, rich in CO2. First works on CaL systems accounted for
no recirculation (ROMANO et al. 2012) and a part of recent works also claim the
possibility of using a rich-oxygen environment in the calciner (above 75% vol)
(PARKKINEN, MYÖHÄNEN, et al., 2017) or even no recirculation (ERANS,
JEREMIAS, et al., 2017, HANAK, ERANS, et al., 2018). This is justified by the fact
CaL systems will have large amounts of relatively cold particles introduced to the calciner
as well as heat absorbed by the calcination reaction, which would permit higher oxygen

79
inlet concentrations than conventional oxy-combustion boilers (HAAF, HILZ, et al.,
2018).
However, the standard CaL concept currently defines values for the percentage of
gas fraction recirculated close to 60% at 900 °C, so the calciner environment will have an
oxygen concentration of 30 vol%, similar to oxy-combustion conditions. (HAAF, HILZ,
et al., 2018). Recycling of around 60% of the gas stream exiting the calciner is also
proposed by MARTÍNEZ et al. (2013) to achieve an oxygen inlet concentration of 25
vol%. The recycled stream is identified with the “r” subscript and 𝑥 is the fraction of
recycled gases. If values for 𝑥 and 𝑥 are assumed, all recycled gas flows can be
expressed in terms of known parameters and 𝐻 . Then, the molar flow rates of gases
in the recycled stream can be derived as the following equations:
(3-52)
𝐹 , =𝑥
1 − 𝑥 (𝐹 , +
𝐻
𝐻𝐻𝑉
𝑤
12)
𝐹 , =𝑥
1 − 𝑥 (
𝐻
𝐻𝐻𝑉
𝑤
2)
𝐹 , =𝑥
1 − 𝑥 (
𝐻
𝐻𝐻𝑉) (𝑥
𝑤
12+
𝑤
4 + (𝑥 −
1
2)
𝑤
32
𝐹 , =𝑥
1 − 𝑥 (
𝐻
𝐻𝐻𝑉) (1 + 𝑥 )
𝑤
12+
𝑤
4+
𝑤
32
The heat balance can be calculated by the specific heats of gases and solids
entering and leaving the calciner and the formation of CaO reaction enthalpy. The calciner
heat requirement, neglecting the flow of ash, can be expressed as (CLARENS, ESPÍ, et
al., 2016, MANTRIPRAGADA, RUBIN, 2017b):
(3-53)
𝐻 = 𝐹 , ℎ + 𝐹 , 𝐶 , + ( 𝐹 , + 𝐹 , 𝐶 ,
+ 𝐹 , 𝐶 , )∆T +𝐹 ,
𝑎𝐶 , ∆T
+ F , C , ∆T
Where 𝐶 stands for the solids heat capacity and can be expressed in J mol−1, 𝐹
represents the molar flow rates and can be expressed in mol/s, ∆Tcalc-carb is the temperature

80
difference between the calciner and the carbonator, ∆Tcalc-makeup is the temperature
difference between the calciner and the fresh sorbent and ∆Tcalc-r is the temperature
difference between the calciner and recycled stream. Finally, hCaCO3 is the calcination
reaction heat of CaCO3 at a specified temperature (which can also be expressed in J
mol−1).
From equation (3-53) above, 𝐹 , , 𝐹 , and 𝐹 , depend on
𝐹 , . However, 𝐹 , is the same as the term 𝐹 , defined in equation (3-45) and
can be written in terms of 𝐻 and 𝐻𝐻𝑉 . The same is true for 𝐹 , , which is
equal to 𝐹 , , defined in equation (3-47). Thus, all parameters in the above equation
are known and 𝐻 can be calculated (MANTRIPRAGADA, RUBIN, 2017b). Now, it
is possible to calculate the mass balance of gases in the CaL system.
3.1.4 Gases mass balance
Carbonator outlet:
For the carbonator outlet, the molar flow of CO2 depends on the design parameter
of capture efficiency in the carbonator, or 𝜂 . The molar flow of O2 is consumed by the
molar flow of SO2 in the flue gas, as the following equations express. All other gases
molar flows do not change:
(3-54)
𝐹 , = (1 − 𝜂 ) 𝐹 ,
𝐹 , = 𝐹 , − 𝐹 ,
Calciner outlet:
For the calciner outlet, assuming no NOx is formed, the molar flow of gases can
be derived from previous equations for recycled and inlet gases, as follows:
(3-55)
𝐹 , , =1
1 − 𝑥 (𝐹 , + 𝐹 , )
𝐹 , , =1
1 − 𝑥 𝐹 ,
𝐹 , , =1
1 − 𝑥 (𝑥 𝐹 , +
1
2 𝐹 , + 𝑥 −
1
2𝐹 , )

81
𝐹 , , = 1
1 − 𝑥 𝐹 ,
The CO2-rich product stream of the calciner is then the sum of the flow rates above
multiplied by 1 − 𝑥 and can be expressed as:
(3-56)
𝐹 ,
= (1 − 𝑥 ) (𝐹 , , + 𝐹 , , + 𝐹 , ,
+ 𝐹 , , )
3.1.5 Heat recovery from the CaL process
There is a large amount of high-grade heat recoverable in the CaL plant, and steam
can be generated in the heat recovery steam generator (HRSG) and sent to the secondary
steam cycle to increase the power output of the integrated CCS system (HANAK,
BILIYOK, ANTHONY, et al., 2016). The reaction heat from carbonation is usually
directly recovered from the carbonator with an integrated heat exchanger. The usual
design assumption is that water runs through the heat exchanger, which is placed inside
the carbonator, and helps maintain a steady carbonator temperature while producing
steam for power generation. Likewise, flue gas stream leaving the carbonator and CO2-
rich product stream leaving the calciner are at high-temperatures, and thus have latent
heat extracted by the cooling system (CLARENS, ESPÍ, et al., 2016, FENNELL,
ANTHONY, 2015).
These three high-grade heat streams can work as economizer, evaporator,
superheater, reheater, or feedwater heaters depending on their temperature levels
(ZHANG, SONG, 2019). Pinch method or exergy analysis can be used to achieve an
optimum configuration for heat integration (ROMEO, et al. 2010). There are also three
low-grade heat streams in the system that can be used: the purge flow, the heat from the
intercoolers in CO2 compression, and the heat from the intercoolers in the ASU
compression step (ZHANG, SONG, 2019).
In preliminary analyses, the amount of energy recovered might be obtained as a
fraction of the energy supplied to the calciner (CLARENS, ESPÍ, et al., 2016). More
specifically, the heat released in the carbonator 𝐻 is a combination of carbonation
reaction heat and solids and gas high-temperature streams entering and leaving the reactor

82
in steady-state. For this reason, the amount of heat from these three sources can be
calculated as follows:
(3-57)
𝐻 = 𝐹 , − 𝐹 , ℎ + 𝐹 , − 𝐹 , ℎ
+ 𝐹 , − 𝐹 , ℎ
+ 𝐹 , 𝐶 , + 𝐹 , 𝐶 , + 𝐹 , 𝐶 ,
+ 𝐹 , 𝐶 , ∆T
+ 𝐹 , 𝐶 , + 𝐹 , 𝐶 , + 𝐹 , 𝐶 ,
+ 𝐹 , 𝐶 , ∆T
+ 𝐹 , 𝐶 , + 𝐹 , 𝐶 , + 𝐹 , 𝐶 , + 𝐹 , 𝐶 ,
+ 𝐹 , 𝐶 , + 𝐹 , 𝐶 , + 𝐹 , 𝐶 ,
+ 𝐹 , 𝐶 , ∆T
In addition, assuming the flue gas is cooled up to 50°C in an external heat
exchanger, before being redirected to the stack, heat recovered in this stream can be
calculated as:
(3-58)
𝐻 = (𝐹 , 𝐶 , + 𝐹 , 𝐶 , + 𝐹 , 𝐶 , + 𝐹 , 𝐶 , )∆T
Finally, one can calculate the heat recovered from the cooling of the calciner
output gases up to a recycle steam temperature. The temperature of the recycled stream
can be assumed as 120°C (MANTRIPRAGADA, RUBIN, 2017b):
(3-59)
𝐻 , = (𝐹 , , 𝐶 , + 𝐹 , , 𝐶 , + 𝐹 , , 𝐶 ,
+ 𝐹 , , 𝐶 , )∆T
The steam power generated from the heat recovered depends on the steam cycle
heat rate 𝐻𝑅 . Assuming all heat streams presented above can be integrated into a
new steam cycle, the steam power generated can be calculated as the equation below:
(3-60)
𝑆𝑇 = (−𝐻 + 𝐻 + 𝐻 , )/𝐻𝑅

83
3.2 Carbonator and calciner reactor design for fluidized-bed systems
This section provides details for reactors' design and operation, which are further
used to calculate solids inventory and system costs. As seen in previous sections, CaL
systems should be designed and operated with the pair of reactors carbonator and calciner
and their interconnections. These interconnections should facilitate solids flow between
reactors and effective flue gas separation at atmospheric pressure. The reactors are usually
seen as CFBs, and the interconnections are generally designed as non-mechanical valves
known as loop-seals, while cyclones are responsible for the solid-gas separation.
Therefore, this section will discuss available reactor models including key parameters on
thermodynamics, deactivation mechanism, and kinetics.
3.2.1 Carbonator design
Several studies, including experimental and analytical, have dealt with the subject
of carbonator design, including the works by RODRIGUEZ et al. (2011), CORMOS
AND SIMON (2013), DIEGO et al. (2015), ORTIZ et al. (2015), ROMANO (2012),
HAAF et al. (2017) and LASHERAS et al. (2011). In the work by ROMANO et al.
(2012), previous studies are reviewed and carbonator models are compared based on the
following modelling steps: particle conversion, sorbent carrying capacity/decay,
hydrodynamic regime of the reactors, hydrodynamic model, particles size distribution,
criteria for reactor designing and inclusion of sulphur and ash effects (ROMANO et al.,
2012).
Particle conversion was briefly discussed in section 3.1.1. According to more
recent kinetic models, the carbonation reaction takes place in two stages with different
reaction rates. A first regime chemically-controlled, where the reaction occurs at the
highest velocity, and a second regime diffusion-controlled, limited by the CaCO3 product
layer thickness increase (ALONSO, RODRÍGUEZ, et al., 2009, ROMANO, 2012).
Equations for sorbent carrying decay were also discussed in section 3.1.1 and, for a
carbonator model to be accurate, must take into account the real age of the CaO particles
in the system Nage, which represents the number of cycles that particles require to achieve
a conversion equal to their carrying capacity. This parameter depends on particle
residence time in the reactors (ROMANO et al., 2012). In more recent works, the
hydrodynamic regime of the carbonator is based on CFBs. Although some of the first

84
studies considered the carbonator as a bubbling fluidized bed (BFB) (SHIMIZU,
HIRAMA, et al., 1999), it was found that the fast fluidization regime is more appropriate
considering needed reactions residence time (CORMOS, SIMON, 2013, RODRIGUEZ
et al., 2011, ROMANO, 2012).
Regarding hydrodynamic models, some works have used semi-predictive models
based on simple thermodynamics and have considered the carbonator to be perfectly and
instantaneously mixed for the solids, or a continuous stirred-tank reactor (CSTR) and
plug-flow for the gas phase (ALONSO, RODRÍGUEZ, et al., 2009, DIEGO.,
MARTÍNEZ, et al., 2015, RODRIGUEZ, ALONSO, ABANADES, 2011). These works
often consider the carbonator as a stoichiometric reactor, with all reactions in equilibrium
(HANAK, ANTHONY, et al., 2016). Other works have used a semi-predictive core-
annulus model with an upper lean and a lower dense region based on the approach for
CFBs (LASHERAS, STRÖHLE, et al., 2011, ROMANO, 2012). For particle size, an
uniform particle diameter is often considered, which is justified since non-uniformity
does not affect kinetics and absorption capacity (GRASA, ABANADES, 2006).
The review by HANAK et al. (2015a) also summarizes recent carbonator models
and points out the one developed by ROMANO (2012) as the most advanced currently
available. This semi-predictive model considers the effect of reaction kinetics, reactor
hydrodynamics, and the influence of sulphation and ash accumulation in the system. It
can also estimate the residence time of solids in the reactor, an important parameter in
reactor design along with residence-time-distribution (RTD) curves (HANAK,
ANTHONY, et al., 2015, ROMANO, 2012).
On the other hand, the work of RODRIGUEZ et al. (2011) presented the result of
several experimental campaigns and investigated carbonation efficiency and “active
space-time” 𝜏 , which can be roughly defined as the residence time of active CaO
particles in the carbonator, given by the following equation:
(3-61)
𝜏 =𝑁 , 𝑋
𝐹 , ,
Where, 𝑁 , is the total number of moles of Ca-based solids (CaO and CaCO3)
in the carbonator and 𝑋 = 𝑋 – 𝑋 , which is the fraction of CaO which is still
available for CO2 capture. The relationship between carbonator efficiency 𝜂

85
(normalized over equilibrium efficiency) and active space-time can be expressed in linear
form for 𝜏 , in seconds, as in the technical report by MANTRIPRAGADA, RUBIN
(2017a):
(3-62)
𝜂
𝜂 ,= 1 − 𝑒 .
To calculate the carbonator solids inventory, a perfectly mixed reactor is assumed
(MANTRIPRAGADA, RUBIN, 2017a), which means the composition everywhere in the
reactor is the same as the exit composition for both solids and gases. Then, carbonator
capture efficiency can be expressed in terms of inlet and outlet mole fractions of CO2 as
follows:
(3-63)
𝜂 = 𝑦 , − 𝑦 ,
𝑦 , (1 − 𝑦 , )
Equilibrium molar fraction of CO2 depends on operating temperature and pressure
and is given by the following equation proposed by BARKER (1973) and used in other
works (ALONSO, RODRÍGUEZ, et al., 2009, MARTÍNEZ, GRASA, et al., 2013):
(3-64)
𝑦 , = 10 .
𝑃
Where T is temperature (in K) and P is pressure (in atm). For CaL applications, P
= 1 atm. As pressure and temperature of the carbonator are known, the equilibrium CO2
mole fraction can be calculated. From this point, 𝜂 , can also be calculated (by
replacing the value of 𝑦 , in equation 3-63 by 𝑦 , ) and substituted in the equation
for active space-time. The actual capture efficiency is a design parameter. Hence, active
space-time required to achieve a desired CO2 capture at a particular temperature and
pressure is given by the following equation:
(3-65)
𝜏 (𝑠) = 14.04
ln (1 −𝜂
𝜂 ,)

86
From the equation above, the number of moles of CaO and CaCO3 inside the
carbonator 𝑁 can be calculated by reorganizing equation (3-61). The other solids
present in the reactor are CaSO4 and ash. With the assumption of a perfectly mixed
reactor, the mole fractions of these inside the carbonator are the mole fractions at the exit,
as follows:
(3-66)
𝑦 = 𝐹 , /𝐹 ,
𝑦 = 𝐹 , /𝐹 ,
Total moles of solids in the carbonator, or solids inventory, can then be calculated
as:
(3-67)
𝑁 , =𝜏 𝐹 , ,
𝑋 (1 − 𝑦 − 𝑦 )
Thus, solids residence time in the carbonator can be calculated as follows:
(3-68)
𝜏 , =𝑁 ,
𝐹 ,
Therefore, with the equations above, the total mass and volume of the solids
inventory can be calculated once the molecular weights and specific volumes of the
chemical components are known.
The operational experience and results in the 1 MWth scale at TU Darmstadt
showed the influence of solid looping ratio and active space-time in carbonator capture
efficiency (HILZ, HAAF, et al., 2019). In the work by HILZ et al. (2019), active space-
time is defined by the specific carbonator inventory (in kg/m2) and the make-up flow rate.
For 𝜏 , = 42𝑠, specific carbonator inventory was in the range of 400–500 kg/m2
and the make-up rate 𝐹 /𝐹 , was around 0.1 molCa/molCO2. For these values,
carbonator capture efficiency was below 80% even for high values of solid looping ratio
𝐹 /𝐹 , .
A higher active space-time of 68s was achieved with 600–700 kg/m2 and 0.17
molCa/molCO2, and capture efficiency surpassed 90% for higher solid looping ratios.

87
Even higher active space-time of 89s achieved 90% of capture efficiency even with low
solid looping ratios, by operating with 700–950 kg/m2 with 0.1-0.18 mol Ca/molCO2. The
results demonstrated the influence of solid looping ratio decrease with increasing active
space-time (HILZ, HAAF, et al., 2019).
3.2.2 Calciner design
The oxy-fired CFB combustion reactors are considered an enabling technology
for CaL, with its own developing path as a major oxy-fuel combustion capture technology
for power generation (MARTÍNEZ, I., GRASA, et al., 2013). The choice for this
technology in CaL systems has been dominant due to the need for a large supply of
thermal energy to the system and current commercial application of CFB oxy-combustors
in the industry up to the 400 MWe scale (FENNELL, ANTHONY, 2015). The thermal
power requirement in the calciner is between 30% and 50% of the total energy introduced
into the whole system, including the existing power plant (DIEGO, MARTÍNEZ, et al.,
2015, SHIMIZU, HIRAMA, et al., 1999).
Calciner design and its operational window influences not only the fraction of
CaCO3 regenerated and entering the carbonator, which is the amount of CaO newly
formed that will further react with CO2 in the carbonator, but also the degree of sorbent
deactivation, which affects sorbent CO2 carrying capacity (DIEGO, MARTÍNEZ, et al.,
2015, MARTÍNEZ, GRASA, et al., 2013). As reported by MARTÍNEZ et al. (2013),
large-scale CaL systems will have to deal with a trade-off between achieving the lowest
CaCO3 content in the solids leaving the calciner, which is equivalent to reach high
calcination conversion of CaCO3 at a concentrated CO2 atmosphere, and the requirements
of this high calcination conversion, such as greater heat demand, high temperatures and
low CO2 partial pressures (MARTÍNEZ, I., GRASA, et al., 2013). High temperatures in
a steady-state will need to be moderated with increased recirculation of the CO2 stream
to minimize sorbent deactivation by sintering and to avoid ash-related problems.
Therefore, substantial contributions to heat demand in the calciner are associated with
heating the recirculated CO2 stream and the inert solids flowing from the carbonator up
to calciner temperature. In the end, the energy consumption in the calciner will be higher
as the temperature set for the calciner increases (MARTÍNEZ, I., GRASA, et al., 2013)
Based on early investigations on sorbent performance (DIEGO, MARTÍNEZ, et
al., 2015, GRASA, ABANADES, 2006), an upper limit of 950 °C is pointed as reasonable

88
to avoid these problems, but lower values will have benefits such as a less energy-
demanding, more compact and lower-cost reactor (DIEGO, MARTÍNEZ, et al., 2015).
The works by DIEGO et al. (2015) and HANAK et al. (2015a) summarized
several attempts on modelling the calciner with different degrees of prediction.
YLÄTALO et al. (2013) proposed an elaborated 3-D oxy-fired calciner model using
computational fluidizing dynamics (CFD). The authors combined fundamental mass and
energy balance equations and empirical correlations for describing chemical reactions
and output solid flows. Still, they concluded that a simplified 1-D model produced similar
results to those obtained with the more detailed 3-D model regarding parameters such as
solids inventory. Unlike other calciner models, the model proposed by FANG et al.
(2009) accounted for the reactor hydrodynamics using the model K-L (the same presented
in the carbonator model section), which divides the reactor into two regions (FAN, LI, et
al., 2009, HANAK, ANTHONY, et al., 2015).
The semi-predictive model by MARTÍNEZ et al. (2013) is based on simple
hydrodynamics and a steady-state overall mass balance of the calciner. It is considered a
simplified model to calculate solids inventory (DIEGO, MARTÍNEZ, et al., 2015,
HAAF, STROH, et al., 2017, MANTRIPRAGADA, RUBIN, 2017b). It includes a
realistic kinetic description of the calcination reaction for highly cycled particles and can
be compared with more elaborate methods when necessary. The model is in line with the
one previously described for the carbonator, following the same simple fluid dynamic
assumptions for the solid and gas phases: instantaneous and perfectly mixed solids and
complete combustion of the fuel at the entrance of the reactor. With the relatively fast
combustion process taking place at the bottom of the reactor and a large impact of the
CO2 recycling, the perfectly mixed atmosphere is considered a reasonable assumption, as
concentration along the reactor will be close to the CO2 concentration at the exit of the
calciner (DIEGO, MARTÍNEZ, et al., 2015). This model was validated against
experimental results in the 1 MWth pilot testing plant at TU Darmstadt (HAAF, STROH,
et al., 2017).
Calciner solids inventory
In the conditions proposed in the work by MARTÍNEZ et al. (2013), the mass
balance in the calciner can be expressed as follows (DIEGO, MARTÍNEZ, et al., 2015,
HANAK, ANTHONY, et al., 2015, MARTÍNEZ, GRASA, et al., 2013):

89
(3-69)
𝐹 , = 𝑁 , 𝑟 = 𝐹 , + 𝐹 , + 𝐹 , (𝑋 − 𝑋 )
Where 𝐹 , is the molar flow of CO2 in the calciner as a result of the
calcination reaction (equal to 𝐹 , ), 𝑟 is the calcination kinetic rate and
𝑁 , is the number of moles of CaO and CaCO3 inside the calciner. To define the
calcination kinetic rate, the expression proposed by FAN et al. (2009), based on a grain
model and TGA experiments, can be applied to CaCO3 particles that have experienced
several calcination and carbonation cycles:
(3-70)
𝑟 =𝑑(𝑋 − 𝑋 )
𝑑𝑡= 𝑘 (1 −
𝑋 − 𝑋
𝑋) (𝐶 , − 𝐶 )
Where 𝑘 is the kinetic constant for the calcination reaction, which is calculated
by an Arrhenius approach (HAAF, STROH, et al., 2017), 𝐶 , is the equilibrium CO2
molar concentration and 𝐶 is the actual molar concentration of CO2. Calcination in
CaL systems is generally considered to be a fast chemically-controlled reaction if the
equilibrium conditions are met in the oxy-fuel CO2-rich atmosphere, with the particles
having an average diameter of less than 2 mm (YLÄTALO, PARKKINEN, et al., 2013).
By integrating equation (3-70), it is possible to obtain the time required to achieve
complete calcination of CaCO3 (HAAF, STROH, et al., 2017):
(3-71)
𝑡 ∗ =3(𝑋 )
𝑘 (𝐶 , − 𝐶 )
As a consequence of the calcination model validation through experimental trials,
MARTÍNEZ et al. (2013) determined that the calcination rate can be considered constant
and independent of the CaCO3 content of the particles (MARTÍNEZ, I., GRASA, et al.,
2013). Particles leaving the carbonator with modest CaCO3 content will tend to calcine
in much shorter times than fresh limestone particles entering the calciner from the make-
up flow 𝐹 , = 𝐹 . Given the majority of particles inside the calciner will
present a CaCO3 content close to 𝑋 , as the typical 𝐹 /𝐹 ratio of CaL systems is low,
the average calcination rate can be expressed as:
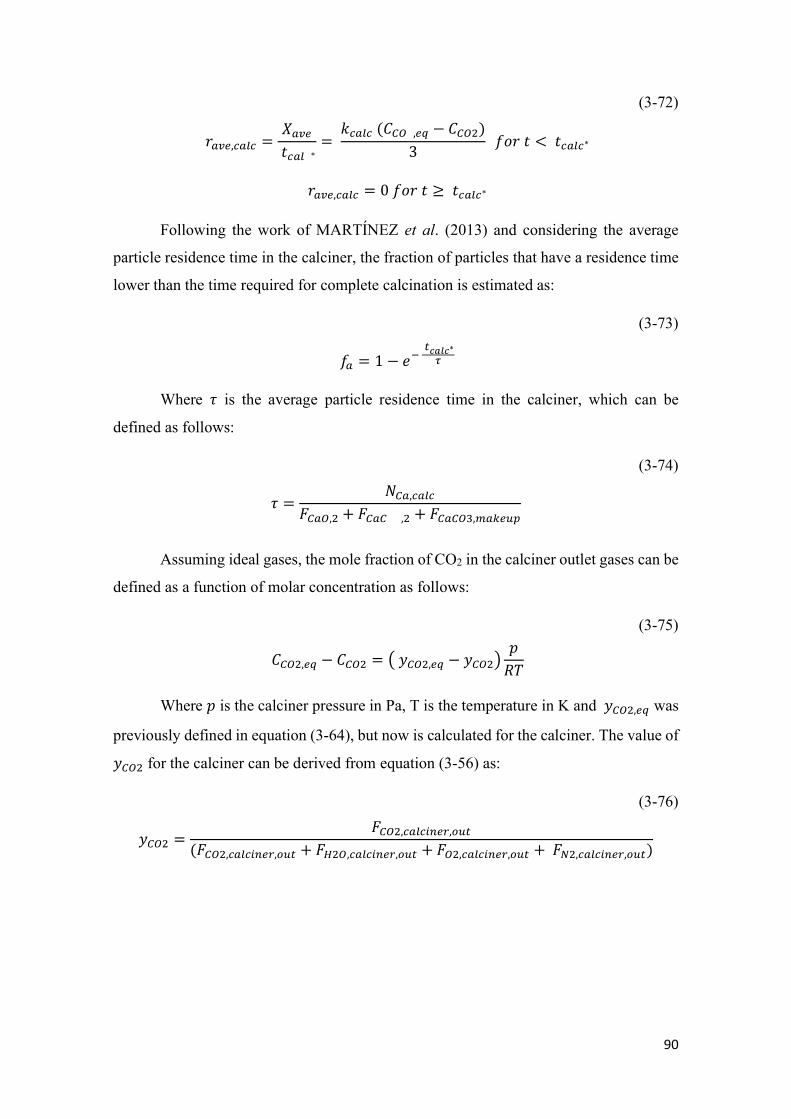
90
(3-72)
𝑟 , =𝑋
𝑡 ∗=
𝑘 (𝐶 , − 𝐶 )
3 𝑓𝑜𝑟 𝑡 < 𝑡 ∗
𝑟 , = 0 𝑓𝑜𝑟 𝑡 ≥ 𝑡 ∗
Following the work of MARTÍNEZ et al. (2013) and considering the average
particle residence time in the calciner, the fraction of particles that have a residence time
lower than the time required for complete calcination is estimated as:
(3-73)
𝑓 = 1 − 𝑒 ∗
Where 𝜏 is the average particle residence time in the calciner, which can be
defined as follows:
(3-74)
𝜏 =𝑁 ,
𝐹 , + 𝐹 , + 𝐹 ,
Assuming ideal gases, the mole fraction of CO2 in the calciner outlet gases can be
defined as a function of molar concentration as follows:
(3-75)
𝐶 , − 𝐶 = 𝑦 , − 𝑦𝑝
𝑅𝑇
Where 𝑝 is the calciner pressure in Pa, T is the temperature in K and 𝑦 , was
previously defined in equation (3-64), but now is calculated for the calciner. The value of
𝑦 for the calciner can be derived from equation (3-56) as:
(3-76)
𝑦 =𝐹 , ,
(𝐹 , , + 𝐹 , , + 𝐹 , , + 𝐹 , , )

91
According to the procedure detailed by MARTINEZ et al. (2013) and using the
definitions above, the extent of calcination 𝑓 , which was defined as the fraction of
CaCO3 calcined in the reactor and previously described in section 3.1.1, can finally be
expressed as follows:
(3-77)
𝑓 =𝑓
ln (1
1 − 𝑓)
=1 − 𝑒
∗
𝑡 ∗
𝜏
For different values of ∗
, 𝑓 was plotted and the exponential function that
fits the curve can be defined by the following expression (MANTRIPRAGADA, RUBIN,
2017b):
(3-78)
𝑡 ∗
𝜏= 2.179 ln (
0.9933
𝑓)
Considering 𝑓 is a design variable, ∗
can be calculated and substituted in
the following equation for estimation of the solid inventory of Ca-based particles:
(3-79)
𝑁 , =3(𝐹 , + 𝐹 , + 𝐹 , )
𝑘 𝑦 , − 𝑦 (𝑝
𝑅𝑇)
1
( 𝑡 ∗
𝜏)
Therefore, for a given calciner efficiency 𝑓 , the total solids inventory
necessary in the calciner can be calculated with a similar approach used in the carbonator,
considering the mole fractions of ash and CaSO4 at the exit of the calciner:
(3-80)
𝑁 , =𝑁 ,
1 − 𝑦 , − 𝑦 ,
Hence, for known values of molecular weight and density, total mass and volume
inside the calciner can be estimated similarly to what was done with the carbonator. As a
result of the equations above, for a given pressure and temperature, higher solid
inventories are needed for higher values of 𝑓 , which leads to a higher solid residence
92
time of the CaCO3 particles in the calciner. This implies working at temperatures of
around 900 °C with reasonable specific solid inventories around 600-800 kg/m2,
corresponding to 1-3 min of residence time. These conditions are enough to achieve a
calciner efficiency of 95% under a CO2 concentration close to 80 vol%, which is typical
of an oxy-fired boiler (DIEGO, M.E., MARTÍNEZ, et al., 2015).
Finally, working around 15-20 °C above the equilibrium temperature associated
with the CO2 partial pressure is enough to obtain calciner efficiencies as high as 95%
(DIEGO, M.E., MARTÍNEZ, et al., 2015). Experimental results obtained from the 1.7
MWth pilot plant in La Pereda have validated, with reasonable precision, the predictions
made by the presented model (ARIAS, B., DIEGO, et al., 2013).
3.2.3 Reactors dimensions
One of the aims of reactor design is to calculate the volume of reactors in order to
estimate capital costs and pressure drop. As assumed in the last sections, both carbonator
and calciner operate as a CFB reactor in a fast fluidization regime (CORMOS, SIMON,
2015, STRÖHLE, LASHERAS, et al., 2009). A typical CFB has a dense lower zone and
lean upper zone to account for the varying solid distribution within the riser (HAAF, M.,
STROH, et al., 2017, HANAK, ANTHONY, et al., 2015, KUNII, LEVENSPIEL, 1997).
The solids fraction in the dense zone at the bottom of the reactor is a fairly constant value
and can be identified as 𝜀 , , while the solids fraction in the lean zone , identified as 𝜀 , ,
undergoes an exponential decay with height towards an asymptotic value of 𝜀∗ as
described in the following equation (CORMOS, SIMON, 2013, LASHERAS,
STRÖHLE, et al., 2011, MANTRIPRAGADA, RUBIN, 2017b):
(3-81)
𝜀 , = 𝜀∗ + (𝜀 , − 𝜀∗)𝑒
Where 𝛼 is the decay constant and 𝐻 is the height of the lean zone. According to
experimental data, 𝛼 is determined by 𝛼Ug = constant, where Ug is the superficial gas
velocity. The value of 𝛼 is <1 and superficial gas velocities will range between 3-7 m/s,
with a realistic value close to 5 m/s (CORMOS, SIMON, 2015, HILZ, HAAF, et al.,
2019, LYNGFELT, LECKNER, 2015, STRÖHLE, LASHERAS, et al., 2009). Typical
values for 𝛼Ug are then between 2-4 s-1, but it can be assumed as 3.0 s−1

93
(MANTRIPRAGADA, RUBIN, 2017b, OZCAN, 2014, ROMANO, 2012, STRÖHLE,
LASHERAS, et al., 2009). Based on these assumptions, 𝛼 can be calculated.
The volume fraction of solids in the dense region 𝜀 , ranges from 0.06 to 0.22,
but can realistically be set to 0.15 (CORMOS, SIMON, 2015, KUNII, LEVENSPIEL,
1997, OZCAN, 2014, ROMANO, 2012), while 𝜀∗ can be set to 0.01 (ROMANO, 2012).
These values are typical of fast fluidization regimes (KUNII, LEVENSPIEL, 1997,
LASHERAS, STRÖHLE, et al., 2011). Then, the average volume of solids in the lean
zone can be estimated by (LASHERAS, STRÖHLE, et al., 2011):
(3-82)
𝜀 , = 𝜀∗ +(𝜀 , − 𝜀∗)
𝛼(𝐻 − 𝐻 )
Where 𝐻 is the total height of the reactor and 𝐻 is the height of the dense zone.
Thus, 𝐻 − 𝐻 = 𝐻 .
𝐻 is in the order of meters, probably more than 10 meters for large-scale applications
and up to 40 meters (EUROPEAN COMMISSION, 2019, ROMANO, 2012). The
average lean zone solids fraction 𝜀 , can be estimated as 0.015 (MANTRIPRAGADA,
RUBIN, 2017b). Hence, considering this model, total solids inventory of a reactor can be
estimated based on the following equation (ROMANO, 2012):
(3-83)
𝑚 = 𝜌 𝐴(𝜀 , 𝐻 + 𝜀 , (𝐻 − 𝐻 ))
Where 𝜌 is the solids density and 𝐴 is the reactor cross-section area.
ROMANO (2012) assumes a constant value for the ratio 𝐻 /𝐷 of 3, being 𝐷 the diameter
of the reactor in meters. However, considering the wide variation in 𝐻 /𝐷 for CFB
boilers, this constant is not assumed by MANTRIPRAGADA, RUBIN (2017a). Instead,
the authors assume that for solids flow rates in typical CFB applications, the ratio 𝐻 /𝐻
varies between 4 and 7, but is most likely around 5. Solids inventory can then be
expressed as:
(3-84)
𝑚 =𝜌 𝐴𝐻
(𝐻 /𝐻 )(𝜀 , + 𝜀 , (𝐻 /𝐻 − 1))

94
Where 𝐴𝐻 is the volume of the reactor 𝑉 , which can now be expressed as:
(3-85)
𝑉 =𝑚 (𝐻 /𝐻 )
𝜌 (𝜀 , + 𝜀 , (𝐻 /𝐻 − 1))
Also, the pressure drop in Pa in the reactors is calculated as:
(3-86)
∆𝑝 =𝑚 𝑥 9.81
𝐴
Cross-section area 𝐴 in m2 can be calculated from gas flow rates and superficial
gas velocity as follows (LYNGFELT, LECKNER, et al., 2001, MANTRIPRAGADA,
RUBIN, 2012):
(3-87)
𝐴 =𝐹 , 𝑥 22.4(𝑇 + 273.15)
(𝑃 𝑥 273.15 𝑥 𝑈 )
(3-88)
𝐴 =(𝐹 , + 𝐹 ) 𝑥 22.4(𝑇 + 273.15)
(𝑃 𝑥 273.15 𝑥 𝑈 )
With the above equations, reactor diameter 𝐷 can be estimated. Maximum reactor
inner diameter is set to 8 m by FAN (2010) since is a possible size for a CFB combustor
riser. If the calculated 𝐷 is greater than 8 meters, the gas flow is divided into multiple
reactors.
However, larger cross sections 𝐴 for the reactors are reported in several related
works. LYNGFELT, LECKNER (2015) estimates cross-sections areas up to 198 m2 for
CFB and CLC-CFB reactors for a 5.4 m/s gas velocity, corresponding to a reference 1000
MWth (around 400 MWe) CFB boiler based on the actual dimensions of the Lagisza 460
MWe plant (LYNGFELT, LECKNER, 2015). In LASHERAS et al. (2011), a 1052 MWe
reference plant is considered to be equipped with two carbonate looping units that divide
the flue gas into two cleaning paths to reach the top of the CFB carbonator with 1163 m3/s
of volume flow rate and 80% carbonator capture efficiency. The simulation supposes a
superficial gas velocity of 6 m/s at the top of the reactor and a cross-sectional area of 194

95
m2 for a reactor height set to 30 m (LASHERAS, STRÖHLE, et al., 2011, STRÖHLE,
LASHERAS, et al., 2009).
In ROMANO (2012), an example is given for a volumetric flow of 700 m3/s to be
treated in a single carbonator, which roughly corresponds to a flue gas flow rate from a
600 MWth air-blown boiler. The CFB carbonator operates at 650 °C with a superficial
velocity of 5m/s and would require 140m2 in cross-section area (or 𝐷 = 13.4 m) for a
height of 40 m (ROMANO, 2012). In the work of DIEGO et al. (2014), where a CFB
recarbonator is designed, cross-sections of the carbonator and calciner, operating with a
superficial gas velocity around 5 m/s, are considered to be in the order of 200 m2. This
value is comparable to the cross-section of a CFB combustor for a power plant of 1000
MWth (DIEGO, ARIAS, et al., 2014). In the work by MARTÍNEZ et al. (2018), a
standard post-combustion scheme is defined for a PC subcritical power plant of 365 MWe
(1014 MWth referred to the LHV of the thermal coal input) with 90% capture efficiency
in the carbonator. The cross-sections of the carbonator and calciner are respectively 175.6
m2 and 196.7 m2, assuming a superficial gas velocity of 5 m/s at the reactor outlet
(MARTÍNEZ, I., ARIAS, et al., 2018).
In the end, the cross-section area affects the investment cost, and the smallest
cross-section area is desired. However, this leads to a higher gas velocity, which, in turn,
is limited by entrainment of bed material and required residence time (LYNGFELT,
LECKNER, et al., 2001). At the same time, multiple parallel vessels operating at high
temperatures are also challenging to operate.

96
4. Methods and Data
This chapter is divided into five subsections. Section 4.1 describes methodological
procedure. Section 4.2 discusses feedstock selection criteria. Section 4.3 briefly describes
the software used to simulate the technical performance and costs of the power plants
with and without capture. In section 4.4, the economics of CaL is discussed and a cost
model is proposed for this system. Section 4.5 presents performance assumptions for each
configuration simulated -i.e. base power plants with and without capture units. The power
plants with capture units are integrated with CaL or amine-based post-combustion
systems.
4.1 Methodological Procedure
This study conducted the simulation of thermal power plants with carbon capture
units using the IECM (Integrated Environmental Control Model) tool. Simulations were
carried out for plants without carbon capture (for reference), named config. 1, and with
carbon capture applying calcium looping and amine-based chemical absorption
technology, named config. 2 and config. 3, respectively. The simulated base case for the
CFPP represents a thermal unit with 300 MW of gross output capacity. In terms of the
carbon sink for the captured CO2, a permanent geological storage route is assumed. The
specific location for storage and other aspects regarding the captured CO2 transportation,
which is assumed to be done via pipeline, are defined in general terms.
Although CO2 transportation and storage are not the focus of this work, the
selection of a carbon capture method involves the setting of a pressure at which the almost
pure CO2 stream is obtained. As pipeline transport is considered for distances close to
100-150 km, the output pressure of the capture stage should be set at around 120 atm (DA
SILVA, CARVALHO, et al., 2018, PAULO, SZKLO, et al., 2016, TAGOMORI,
CARVALHO, et al., 2018). In that case, CaL configurations will present an extra CO2
stream to be compressed because of the calcination emission.
To evaluate water use in consumption and withdraw, a wet cooling tower was
assumed for the base case. However, simulations with an open cooling system (once-
trough) were also performed to assess differences in water use caused by the selection of

97
the water system (ZHAI, RUBIN, et al., 2011). Water use analysis is made using the
Water Life Cycle Assessment tool of IECM, which accounts for plant water consumption
and withdrawal, including water use in chemical production (amine, limestone, and
ammonia), plant infrastructure, and operation.
For the type of analysis proposed, it is more important the differences in costs for
different capture technologies are accurately assessed, rather than the absolute value of
an expected project cost22 (RUBIN, DAVISON, et al., 2015). Thus, “technology-
levelling” assumptions are applied to maintain uniformity of basic power plant
assumptions (such as plant size, fuel type, capacity factor, and other variables). The main
goal is to highlight differences due only to the choice of capture technology configuration.
Recommended data to be presented in scientific publications for CCS technology
comparison is discussed in (RUBIN, SHORT, et al., 2013b) and it was used as guidance.
22 Therefore, no location factor is applied in this study, which also avoids introducing a source of uncertainty in the estimates.

98
4.2 Feedstock selection criteria
Among feedstocks with potential to be adopted in CaL systems, two types are
particularly investigated in this work: coal, as the most used feedstock in thermal power
plants (IEA, 2019g), and biomass, whose application does not yet occur in the same scale
as CFPPs23, but which is relevant in Brazil, especially using sugarcane bagasse (EPE,
2017), that accounts for about 80% of the biomass consumed in the country for electricity
generation purposes (ANEEL, 2020).
Biomass is also being supported given the need of achieving net negative CO2
emission technologies, including BECCS (CONSOLI, 2019, MOREIRA, ROMEIRO, et
al., 2016). Even though several types of biomass feedstocks can be used for solid
combustion processes, including wood, crop residues (from rice, soy, corn, etc.) or urban
and industrial waste, sugarcane bagasse has the further advantage of potential use in more
modern/efficient energy conversion systems, including supercritical steam cycles
(COELHO JUNIOR, DA SILVA SEGUNDO, et al., 2019, MOORE, KULAY, 2019,
PELLEGRINI, DE OLIVEIRA JÚNIOR, et al., 2010, RITTER, 2019). The option for
sugarcane bagasse conversion plants associated with CaL systems could also be favoured
due to their low alkali content, which makes this biomass residue more likely to stand
calcination temperatures above 900 °C without leading to bed agglomeration and fouling
problems in the interconnected reactors system (BASU, 2006, 2015).
In addition, sugarcane bagasse is already used in large-scale plants in Brazil, with
over 100 MWe of net output capacity (ANEEL, 2020), and present a seasonal
complementarity with the dry period of hydroelectric water tanks systems that supply the
country’s interconnected power system (UNICA, 2018). Therefore, sugarcane bagasse is
selected as the biomass feedstock.
For the case proposed, even though sugarcane bagasse does not impose, compared
to coal, important material restrictions for solid direct combustion and CaL applications,
some of its inherent challenges include the poor transport properties due to the bagasse
elongated shape, low bulk and energy density, biodegradation due to residual sugars and
spontaneous and unstable combustion (caused by high volatile and moisture content,
23 While the average size of a coal-fired plant is around 600 MWe in the U.S (FOUT, ZOELLE, et al., 2015) and is even larger for new power plants, only few dedicated biomass-fired power plants worldwide can deliver more than 100 MWe in net power output (NUORTIMO, ERIKSSON, et al., 2017).

99
respectively). Pre-treatment by torrefaction is proposed to help counter-measure these
issues (VALIX, KATYAL, et al., 2017).
Natural gas is another fuel addressed in some works for application with CaL
systems, especially considering NGCC plants (BERSTAD, ANANTHARAMAN, et al.,
2012, MOORE, KULAY, 2019). However, its utilization in CaL is often regarded as more
costly and with lower thermodynamic performance than amine-based systems
(BERSTAD, ANANTHARAMAN, et al., 2012, HANAK, MICHALSKI, et al., 2018).
Therefore, it is not considered in this work.
Moreover, the full post-combustion CaL system has two inputs of feedstock, one
for the base plant and another to fire the calciner. In this work, the same fuel is considered
for both feedstock inlets. Notwithstanding, co-firing or mixing of feedstocks in the
calciner could also be an advantageous option depending on the power plant location and
feedstock availability in the plant region24 (OZCAN, ALONSO, et al., 2014).
Bituminous coal is selected for the coal-fired cases and to fire the calciner in the
CFFP with CaL (config. 2) (FOUT, ZOELLE, et al., 2015). The coal source is
Appalachian medium Sulfur, as used in (MANTRIPRAGADA, RUBIN, 2014). See Table
4.1 for detailed coal properties. Price of fuel is defined as 49.87 $2017/tonne in accordance
with (MANTRIPRAGADA, RUBIN, 2014). Other input values are derived from IECM
(default coal properties for bituminous Appalachian medium sulfur). Sensitivity analyses
on the coal price for electricity generation are further performed based on values ranging
from 80 to 40$2017/tonne (IEA, 2019b).
24 For example, the co-firing alternative proposed by HANAK et al. (2015) (HANAK, BILIYOK, et al.,
2015b) uses a mix of 80% coal:20% biomass in the calciner.

100
Table 4.1 Coal properties
Coal rank Bituminous
Coal specification Appalachian Medium Sulphur
Fuel price ($2017/tonne) 49.87
HHV (MJ/kg) 30.84
Ultimate analysis Composition (weight % as-fired)
Moisture 5.05
Carbon 73.81
Hydrogen 4.88
Oxygen 5.41
Nitrogen 1.42
Chlorine 0.06
Sulphur 2.13
Ash 7.24
Ash properties (weight% as-fired)
SiO2 54.50
Al2O3 17.30
Fe2O3 4.50
CaO 10.70
MgO 2.40
Na2O 1.48
K2O 1.11
TiO2 0.70
P2O5 0.27
SO3 7.04
Other 0.00
The IECM software is primarily designed to work with thermal power plants using
coal or natural gas as feedstocks, so it was necessary to adapt the feedstock characteristics
inputs to run simulations using sugarcane bagasse. Ultimate analysis and ash composition
were obtained through the Phyllis2 database of the Energy Research Centre of
Netherlands (ECN) (ECN, 2013), and the values as-fired are given on a wet mass basis
in table 4.2. The price of sugarcane bagasse should include the costs of planting,
harvesting, transportation, storage, and pre-processing. In the Brazilian case considered,

101
however, the raw material is a by-product available in suitable conditions at the sugarcane
mill producing unit (KHATIWADA, LEDUC, et al., 2016, MARQUES, 2011). Thus, the
cost of a great part of the production chain, except for pre-processing, may be considered
null since the bagasse is a by-product of the process to produce ethanol and sugar from
sugarcane25. If the bagasse has to be transported to the production unit, its price could be
assumed to be equal to the transportation costs, which according to BASTOS (2011) is
around 7 US$/tonne (US$ 2017 constant dollars) (BASTOS, 2011).
The typical costs of pre-processing, including milling and drying from 50% to
about 10% of moisture content in mass basis were evaluated by (GERBASI, 2013) for a
thermochemical route (through gasification) to produce ethanol and higher alcohols from
the bagasse residue (GERBASI, 2013). The work was based in a 2011 NREL report
(HUMBIRD, DAVIS, et al., 2011), where drying costs for a woody material, from 50%
to 10% moisture, are reported altogether with costs of biomass reception, storage, and
pre-processing, accounting for a total of 7.27 US$/tonne (US$ 2017 constant dollars).
Thus, in accordance with (GERBASI, 2013) a conservative price for the bagasse is
assumed as 7.27 US$/tonne after drying or in ready to be burned condition.
25 Another approach to estimate the price of bagasse is suggested by (SILVA, , 2013) and it is based on the opportunity cost of the bagasse for bioelectricity production.

102
Table 4.2 Biomass properties
Biomass type Sugarcane Bagasse
Biomass specification #894
Fuel price ($2017/tonne) 7.27
HHV (MJ/kg) as-fired 17.02
LHV (MJ/kg) 15.62
Ultimate analysis composition (weight % as-fired)
Moisture 10.39
Carbon 43.59
Hydrogen 5.26
Oxygen 38.37
Nitrogen 0.14
Chlorine 0.02
Sulfur 0.04
Ash 2.19
Ash properties composition (weight% as-fired)
SiO2 46.61
Al2O3 17.69
Fe2O3 14.14
CaO 4.47
MgO 3.33
Na2O 0.79
K2O 4.15
TiO2 2.63
MnO2 0.00
P2O5 2.72
SO3 2.08
Other 1.39

103
4.3 System simulation with software Integrated Environmental Control Model (IECM)
The Integrated environmental control model (IECM) is a software program
developed by Carnegie Mellon University and mainly used to simulate operations of a
range of thermal power generation technologies, such as pulverized coal (PC), natural gas
combined cycle (NGCC), integrated gasification combined cycle (IGCC), and oxy-
combustion (CMU EPP, 2012). These thermal power plants may be configured with or
without CO2 capture, and several capture technologies can be chosen based on user-
defined parameters (MERSCHMANN, VASQUEZ, et al., 2013), as exemplified for the
power plant with post-combustion using CaL selected in the configuration screen of the
software in Figure 4.1.
The simulation tool is based on fundamental mass and energy balance equations
and is useful to run preliminary studies, which can indicate specific challenges associated
with a power plant and its capture system (such as energy penalties, water consumption
and demand, and capture costs) (MERSCHMANN, VASQUEZ, et al., 2013). IECM has
been used in recent years for several performance and cost comparison studies between
CO2 capture systems (BUI, FAJARDY, et al., 2017, CLARENS, ESPÍ, et al., 2016,
HOFFMANN, 2010, MANTRIPRAGADA, ZHAI, et al., 2019b, MERSCHMANN,
Figure 4.1. Configuration screen of the IECM with alternatives for user-defined
pollutants control technologies. Obtained from IECM version 11.2

104
VASQUEZ, et al., 2013, ROCHEDO, 2011, ZHAI, RUBIN, 2011, ZHAI, RUBIN, et al.,
2011), including post-combustion CaL systems (MANTRIPRAGADA, RUBIN, 2014,
2017a).
IECM input data includes location and meteorological data, detailed feedstock
input (ultimate analysis, HHV, and ash composition); selection of end-of-pipe control
technologies (for particulate, SOx, mercury, and NOx); and the basic configuration of the
thermal power plant, allowing the implementation and simulation of sub, super and ultra-
supercritical steam boilers. The simulation model also includes the input of financial
assumptions and economic parameters such as equipment costs, labour costs, discount
rate, taxes, and the economic lifetime of the plant.
Technical limitations of the input parameters are also indicated by the model, and
a reference value is usually displayed. A great advantage relies on the fact that the model
calculates not only the overall results of the plant (e.g. input of fuel, emissions, and
utilities’ consumption), but also the results per component (e.g. composition of the
exhaust flow, water consumption, temperature and pressure conditions). This
characteristic allows the user to analyse the results and impacts of individual components
in the performance, cost, and financial conditions.
The IECM also calculates fuel and other mass flow rates and with this data
estimates the size of the equipment needed to meet the designed gross power output.
Selected power plant configuration can be analysed to obtain parameters such as the
demand for resources (including water, fuel, and limestone), net plant efficiency, net CO2
emissions intensity (kg/ MWh), plant capital costs ($/kW-net), CO2 emissions avoided,
levelized cost of electricity ($/MWh) and costs of CO2 captured and avoided ($/tonne)
(MERSCHMANN, VASQUEZ, et al., 2013). Different plant configurations and
technologies can then be compared on a consistent basis. The IECM model for CaL allows
to use the equations defined previously in chapter 3, and then adjust the input data to run
user-defined simulations. For these reasons, the software may be considered suitable for
the purposes of this study. IECM version 11.2 was used to run the simulations in this
work (RUBIN, 2020).

105
4.4 Economic performance and cost model for CaL systems
Capturing CO2 always represent extra costs in comparison to conventional power
and industrial plants. Hence, large-scale CO2 capture technologies only make sense in a
context of climate change mitigation (FENNELL, ANTHONY, 2015). Yet, current CCS
technologies such as MEA scrubbing and oxy-combustion still need to strongly reduce
their associated costs as they represent an average increase of 60% to 80% in electricity
costs for PC power plants (RUBIN, DAVISON, et al., 2015, TURNER, IYENGAR, et
al., 2019). Among the CCS chain process, the capture step accounts for roughly 80% of
total CCS costs, which are higher for retrofit scenarios and first-of-a-kind (FOAK) plants
(RUBIN, DAVISON, et al., 2015). Regarding an emerging technology such as CaL
systems, the data supporting economic feasibility remains limited in the open literature
(MICHALSKI, HANAK, et al., 2019). The lack of data is even more evident considering
Bio-CaL applications.
Economics of CaL systems is usually assessed using the levelized cost of
electricity (LCOE) approach (MANTRIPRAGADA, RUBIN, 2014, MICHALSKI,
HANAK, et al., 2019), presented in equation (4-1). The LCOE depends on the following
parameters: total capital requirement (TCR), net power output of the power plant (MW),
capacity factor (CF), fixed charge factor (FCF), fixed operating and maintenance cost
(FOM), specific fuel cost (SFC), specific variable operating and maintenance cost (VOM)
and net power plant heat rate (HR). This method is simple to be implemented and is
broadly used to evaluate the economic performance of several clean energy systems.
(4-1)
𝐿𝐶𝑂𝐸 =(𝑇𝐶𝑅 𝑥 𝐹𝐶𝐹) + 𝐹𝑂𝑀
MW 𝑥 𝐶𝐹 𝑥 8760+ 𝑉𝑂𝑀 + (𝑆𝐹𝐶)𝑥(𝐻𝑅)
Recent review studies on the economics of CaL concepts indicate that CaL
retrofits to fossil-fuel-fired plants have most LCOEs values reported between 55 and 8526
USD2017/MWh, with the corresponding cost of CO2 avoided reported to be between 11
and 35 USD2017/tCO2, regardless if the CaL system is retrofitted into a CFPP or an NGCC
26 These values were originally reported in 2018 euros, which were assumed as current values. Then, costs were changed to 2018 USD current dollars using the annual average exchange rate between the two currencies (EUROPEAN CENTRAL BANK, 2019). Next, the obtained value was converted to 2017 constant dollars using the CEPCI index (CHEMENGONLINE, 2019). This calculation procedure was used for all other cost values that appear in the text obtained from the literature.
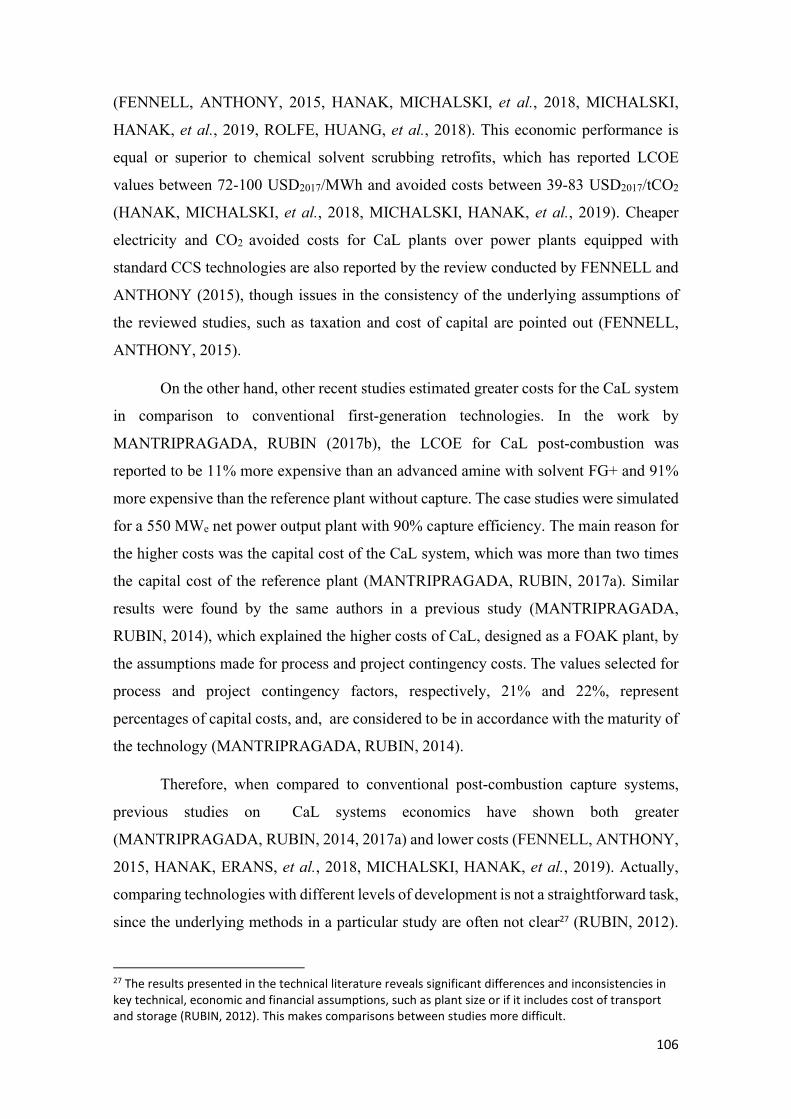
106
(FENNELL, ANTHONY, 2015, HANAK, MICHALSKI, et al., 2018, MICHALSKI,
HANAK, et al., 2019, ROLFE, HUANG, et al., 2018). This economic performance is
equal or superior to chemical solvent scrubbing retrofits, which has reported LCOE
values between 72-100 USD2017/MWh and avoided costs between 39-83 USD2017/tCO2
(HANAK, MICHALSKI, et al., 2018, MICHALSKI, HANAK, et al., 2019). Cheaper
electricity and CO2 avoided costs for CaL plants over power plants equipped with
standard CCS technologies are also reported by the review conducted by FENNELL and
ANTHONY (2015), though issues in the consistency of the underlying assumptions of
the reviewed studies, such as taxation and cost of capital are pointed out (FENNELL,
ANTHONY, 2015).
On the other hand, other recent studies estimated greater costs for the CaL system
in comparison to conventional first-generation technologies. In the work by
MANTRIPRAGADA, RUBIN (2017b), the LCOE for CaL post-combustion was
reported to be 11% more expensive than an advanced amine with solvent FG+ and 91%
more expensive than the reference plant without capture. The case studies were simulated
for a 550 MWe net power output plant with 90% capture efficiency. The main reason for
the higher costs was the capital cost of the CaL system, which was more than two times
the capital cost of the reference plant (MANTRIPRAGADA, RUBIN, 2017a). Similar
results were found by the same authors in a previous study (MANTRIPRAGADA,
RUBIN, 2014), which explained the higher costs of CaL, designed as a FOAK plant, by
the assumptions made for process and project contingency costs. The values selected for
process and project contingency factors, respectively, 21% and 22%, represent
percentages of capital costs, and, are considered to be in accordance with the maturity of
the technology (MANTRIPRAGADA, RUBIN, 2014).
Therefore, when compared to conventional post-combustion capture systems,
previous studies on CaL systems economics have shown both greater
(MANTRIPRAGADA, RUBIN, 2014, 2017a) and lower costs (FENNELL, ANTHONY,
2015, HANAK, ERANS, et al., 2018, MICHALSKI, HANAK, et al., 2019). Actually,
comparing technologies with different levels of development is not a straightforward task,
since the underlying methods in a particular study are often not clear27 (RUBIN, 2012).
27 The results presented in the technical literature reveals significant differences and inconsistencies in key technical, economic and financial assumptions, such as plant size or if it includes cost of transport and storage (RUBIN, 2012). This makes comparisons between studies more difficult.

107
In addition, the early estimates values for CaL might be overly optimistic, as it is common
for developers of emerging technologies (METZ, DAVIDSON, et al., 2005, RUBIN,
2017b). Obviously, two of the main goals of assessing advanced or second-generation
capture technologies such as CaL are to improve performance (such as lower energy
penalty, higher capture efficiency, and reduced lifecycle impacts28) and costs (capital
costs, costs of electricity, and avoided and captured CO2 costs). Still, apparent
improvements in costs for CCS technologies from a particular study could derive from
the set of assumptions of a certain model, such as higher power efficiency of the reference
plant, quality of the selected fuel and low fuel price, longer plant lifetime, higher capacity
factor, lower discount rate and lower contingency costs (HOFFMANN, 2010, RUBIN,
2017b). In the case of CaL systems, some studies also consider the potential integration
with the cement industry, seen as a potential opportunity for reducing CaL costs, as the
high volumes of sorbent purge used in the plant could be reused as a saleable by-product
for cement production (MANTRIPRAGADA, RUBIN, 2017a). In this work, such option
is not considered.
In an economic model for CaL large-scale systems, direct capital costs are
estimated essentially for carbonator, calciner, blowers, ASU, fuel and sorbent inventory,
solids handling equipment, CO2 compressors, and secondary steam cycle (including heat
recovery steam generator – HRSG). Estimating each component of the direct capital costs
is part of a “bottom-up” approach, which for technologies in early stages of development
such as CaL may involve high uncertainty to achieve realistic performance and cost
values for an Nth-of-a-kind (NOAK) large-scale plant, as some process design details for
large-scale systems are still incomplete (ABANADES, ARIAS, et al., 2015, RUBIN,
2017a). Yet, this work is based on the “bottom-up” costing method, as it is more useful
to assess the contribution of each component to the total cost, as well as to perform
sensitive analyses (or “what if” analysis) for specific components performance and cost.
A “top-down” approach, on the other hand, would be based on technological experience
and “learning curves” to estimate future NOAK plants as a function of accumulated
installed capacity (RUBIN, 2017a). The two approaches can be used together to estimate
the level of deployment needed to achieve NOAK cost goals (RUBIN, SHORT, et al.,
2013, RUBIN, YEH, et al., 2007, RUBIN, 2017a). However, there is a lack of plant
28 Compared to lifecycle impacts of amine-based systems, CaL systems have the potential to be present lower overall CO2 emissions (HURST, COCKERILL, et al., 2012).

108
experience with this technology to perform a consistent “top-down” approach (RUBIN,
2017a).
The capital cost of the carbonator might be estimated based on the costs of an
atmospheric pressure CFB boiler for oxy-combustion plants, using the volume flow rate
of the flue gas as the scaling variable along with a scaling factor (MANTRIPRAGADA,
RUBIN, 2017a, MATUSZEWSKI, 2010). In this case, the CFB boiler already accounts
for the integrated steam generating heat exchanger within the reactor. The capital cost of
the calciner, on the other hand, might be estimated based on costs for calciners used in
the cement industry (IEA, 2008, MANTRIPRAGADA, RUBIN, 2017a) or for biomass
CFB gasifiers (CRAIG, MANN, 1996, MANTRIPRAGADA, RUBIN, 2014).
In ABANADES et al. (2015), the cost of the interconnected carbonator-calciner
reactors system is assumed to be proportional to the cost of an oxy-fired CFB boiler
system with the same fuel input (ABANADES, ARIAS, et al., 2015). The cost value is
approximated from recent existing cost studies on oxyfuel combustion plants
(MATUSZEWSKI, 2010). Only the refractory combustion chamber of the calciner is
calculated separately based on large-scale precalciners of cement plants (including a five-
stage preheater) (IEA, 2008).
For most of the other equipment, existing cost models can be used, usually based
on other scaling variables such as steam power for the steam turbine and mass flow for
solids handling equipment. Costs for limestone handling equipment can be approximated
to coal handling (MANTRIPRAGADA, RUBIN, 2017b). Annual costs for fuel and
limestone, waste disposal, and labour costs are some of the O&M costs considered for
LCOE and capture unit costs. Costs for transportation and storage of CO2 can also be
treated as O&M costs (MANTRIPRAGADA, RUBIN, 2017a).
There is also a degree of confusion in definitions such as costs of CO2 avoided
and captured, which are both reported in the same units of $/tCO2. The cost of CO2
avoided is inversely proportional to the difference in CO2 emission rates between the
reference plant and the plant with the capture unit. The parameter is used as the minimum
required CO2 tax or carbon price needed to make the plant with CCS as economical as the
reference plant (MANTRIPRAGADA, ZHAI, et al., 2019b). The cost of CO2 captured is
inversely proportional to the amount of CO2 captured by the capture plant and is used to
assess the economic viability of a CO2 capture system relative to a market price for CO2

109
as an industrial commodity (RUBIN, 2012). To unveil the influence of CO2 capture on
the plant economics, CO2 capture and avoidance costs for the power plants with capture
are calculated (ROLFE, HUANG, et al., 2018). These costs are given by the following
equations:
(4-2)
𝐶𝑂 𝐶𝑎𝑝𝑡𝑢𝑟𝑒 𝐶𝑜𝑠𝑡 ($/𝑡𝐶𝑂 ) =𝐿𝐶𝑂𝐸 − 𝐿𝐶𝑂𝐸
(𝑡𝐶𝑂 /𝑀𝑊ℎ)
(4-3)
𝐶𝑂 𝐴𝑣𝑜𝑖𝑑𝑒𝑑 𝐶𝑜𝑠𝑡 ($/𝑡𝐶𝑂 ) =𝐿𝐶𝑂𝐸 − 𝐿𝐶𝑂𝐸
(𝑡𝐶𝑂 /𝑀𝑊ℎ) − (𝑡𝐶𝑂 /𝑀𝑊ℎ)
Hence, all of the above should be taken into consideration when analysing cost
estimates for CCS technologies. CCS comparative studies also commonly report costs in
dollars and in constant (or real) currency terms, instead of current (or nominal), which
excludes the effects of general inflation and interest rates (RUBIN, DAVISON, et al.,
2015). Therefore, costs in this work are reported in constant currency terms. Constant
dollars in 2017 (US$2017) is used as the standard currency. In the next sections, a
methodology for estimating CaL costs is proposed.
4.4.1 Technology readiness level and contingency costs
The concept of technology readiness level (TRL) was presented in section 2.1.1
and is a way of ranking technologies based on their level of maturity (ZEP, 2017). TRL
is a globally accepted benchmarking tool and has been used to assess the maturity of CO2
capture technologies (BHOWN, 2014, ZEP, 2017). According to the scale proposed in
the Zero Emissions Platform (ZEP, 2017), the CaL system is ranked as TRL 6, which
describes a development stage of “pilot plants in steady states at industrially relevant
environments: pilots in the MWth range” (ZEP, 2017). In fact, as seen in section 2.4.3,
CaL systems have rapidly developed from concept to development phase and the next
step to be considered is demonstration plants in the 20-30 MWth scale as suggested in
(HILZ, HAAF, et al., 2019). The paper by HILZ et al. (2019) defines the most mature
CaL system as a TRL 6 technology based on the work of (ABANADES, ARIAS, et al.,
2015). The study by ABANADES et al. (2015) investigated the maturity of several CaL

110
systems concepts and classified CaL for post-combustion as the most mature among them
(ABANADES, ARIAS, et al., 2015). The conventional CaL process has a TRL higher
than CLC and may become commercially available earlier than the last due to its use in
retrofit applications for existent and capture-ready power plants. Additionally, the post-
combustion Bio-CaL system proposed by (ALONSO, DIEGO, et al., 2014) was evaluated
and classified as TRL 4 (ABANADES, ARIAS, et al., 2015).
The pilot plants of 1.9 MWth La Pereda and 1 MWth TU Darmstadt are the main
reasons to consider the post-combustion CaL as TRL 6 (ARIAS, DIEGO, et al., 2013,
HELBIG, HILZ, et al., 2017). A TRL 6 for post-combustion CaL can be also supported
by the methodology proposed in (BHOWN, 2014) that ranks TRL of post-combustion
technologies based on the size of the existent units, as shown in figure 4.2 (BHOWN,
2014).
On the other hand, chemical absorption with amines is a mature process in the
industry. It is ranked with TRL 9 due to its use in refineries for the natural gas sweetening
(ABANADES, ARIAS, et al., 2015). In power plants, with the experience acquired with
the Boundary Dam and Petra Nova demonstrations (MANTRIPRAGADA, ZHAI, et al.,
2019b), the system is often considered a TRL 8 technology, but the index can vary from
Figure 4.2. Development of Post-Combustion Capture Processes and relationship with TRL index. Obtained from (Bhown, 2014).

111
7 to 9 depending on the type of amine applied (KANNICHE, LE MOULLEC, et al., 2017,
ZEP, 2017).
Other input parameters related to technological maturity include the process and
project contingency factors often used in capital cost estimates. TRLs can be associated
with the process contingency costs for different stages of development. Project
contingency costs, in turn, are less related to technical maturity since even a more mature
technology may have high project contingency costs in simplified and preliminary phases
of a project. However, an emerging technology will hardly have a detailed estimate of
project costs. Project costs are usually reported in the technical literature based on
“simplified” to “detailed” estimates, as “finalized” projects data are often not available
publicly (RUBIN, 2012). Process and project contingency cost adders were recommended
by The Electric Power Research Institute (EPRI) for technologies at different levels of
maturity and were used in works for post-combustion capture technologies (BHOWN,
2014, RUBIN, 2012, RUBIN, DAVISON, et al., 2015). Therefore, a lower level of TRL
may be translated as higher percentage values for contingency costs. Based on these
assumptions, the following tables present the proposed values for process and project
contingency costs and their respective TRL range:
Table 4.3. Process contingency costs and TRL a.
a Elaborated by the author based on the EPRI guidelines categories (Bhown, 2014; Rubin, 2012; Rubin et al., 2015).
Technology status Process contingency (% of
associated process capital) TRL range
New concept with limited data 40+ 1-3
Concept with bench-scale data 30-70 3-5
Small pilot plant data 20-35 5-6
Full-sized modules have been operated 5-20 7-8
Process is used commercially 0-10 9

112
Table 4.4. Project contingency costs and TRLa
a Elaborated by the author based on the EPRI guidelines categories (Bhown, 2014; Rubin, 2012;
Rubin et al., 2015).
According to Table 4.3, a TRL 6 technology like CaL will have high uncertainty
and an upper limit for process contingency factor that increases the capital cost by 35%.
This value is used to assess the cost values of a FOAK CaL plant29. For a NOAK plant, a
contingency factor of 10%, typical of a TRL 9 is applied. Regarding the project
contingency factor of a FOAK plant, a value of 30% is selected as it represents a
preliminary design effort.
Process contingency costs for the amine-based plant are presumed to be associated
with a TRL 8 as full-sized modules (up to 240 MW) have been operated. In that case, the
fact the flue gas comes from coal or biomass combustion is not considered relevant for
contingency factor purposes. Therefore, a 10% capital cost increase factor is applied. For
project contingency, a value of 20% is used as it defines a preliminary design effort. Table
4.5 summarizes the selected values for FOAK and NOAK plants.
29 A TRL 4 for the bagasse-fired Bio-CaL unit is assumed, with the process contingency factor increasing the capital cost by 40%. Even though the upper limit for process contingency is 70% for this TRL, it is presumed that the large-scale Bio-CaL unit will not greatly differ from a standard CaL unit fired with coal (TRL 6), as discussed in section 2.4.4. Therefore, this process contingency factor is used to assess costs of a FOAK Bio-CaL plant.
Design estimate effort Project contingency (%) TRL range
Simplified 30-50 1-9
Preliminary 15-30 4-9
Detailed 10-20 7-9
Finalized 5-10 8-9

113
Table 4.5. Selected values for contingency costs for the proposed carbon capture units. Elaborated by the author.
In IECM, contingency factors are also applied to the standard power generation
equipment of the capture unit, required to produce electricity from the additional energy
input to the CaL cycle. Thus, this will negatively impact the economics of CaL systems.
However, due to the uncertainty of the process technology and considering a conservative
analysis, no adaptation was made to the results obtained.
4.4.2 Cost structure of the post-combustion CaL system
As previously discussed, the actual cost of the post-combustion CaL system is still
highly uncertain because of the inherent gaps of knowledge about the design and
operational aspects of the system for application on large-scale. Accordingly, the
following paragraphs refer to the cost structure of a mature CaL system, focusing on a
NOAK plant assumed to be able to exploit more mature subsystems already applied in
the power sector.
Within the boundaries of the CaL system, excluding the air-fired base power plant,
the following main components should compose the cost structure of the capture unit:
Carbonator
Calciner
Air Separation Unit (ASU)
30 Applied over process facilities capital. 31 Applied over the sum of process facilities capital, engineering and home office fees, general facilities capital and process contingency.
Post-Combustion
Capture technology TRL
Process contingency
(%)30
Project contingency
(%)31
CaL (FOAK) 6 35 30
Amine-based (FOAK) 8 10 20
CaL (NOAK) 9 10 10
Amine-based (NOAK) 9 10 10

114
Blowers
CO2 Compression Unit (CCU)
CO2 Cryogenic Purification Unit (CPU)
Heat Recovery Steam Generator (HRSG)
Fuel and Ash Handling Equipment for ASU
Solids Handling Equipment (limestone and fuel)
Steam Turbine for Power Generation
Aside from the above equipment, added plant footprint and revamp of the cooling
system should also be considered in retrofit scenarios. Regarding O&M costs, sorbent
make-up, and fuel for the oxy-fired calciner have to be calculated. Limestone cost is
defined as 25 $/tonne, as used in (MANTRIPRAGADA, RUBIN, 2017a).
The carbonator capital cost is estimated based on an atmospheric CFB boiler for
oxy-combustion plants. The CFB boiler is modelled as in the case S22A of the NETL
baseline report on oxy-combustion plants (MATUSZEWSKI, 2010) and proposed in
(MANTRIPRAGADA, RUBIN, 2017b) as follows:
(4-4)
𝐶 (𝑀$) = 𝐶 , (𝐹 ,
𝐹 ,) .
Where 𝐶𝑐𝑎𝑟𝑏,𝑟𝑒𝑓 is a reference value for the carbonator cost as a function of a
reference molar flow rate 𝐹 , entering the carbonator, while 𝐹 , is the
actual molar flow rate of flue gas entering the reactor. Pressure and temperature were not
considered since the CFB boiler and carbonator have similar operating conditions
(MANTRIPRAGADA, RUBIN, 2017a).
The calciner cost, on the other hand, is estimated with the following equation,
based on an atmospheric CFB biomass gasifier, since there are no heat exchangers inside
this reactor (MANTRIPRAGADA, RUBIN, 2017a):

115
(4-5)
𝐶 (𝑀$) = 𝐶 (𝐹 , 𝑃 𝑇
𝐹 𝑃 𝑇) .
Where 𝐶 is a reference value for the calciner cost as a function of a reference
molar flow rate 𝐹 , reference pressure 𝑃 and reference temperature 𝑇 within the
reactor. 𝐹 , is the actual molar flow rate of oxidant from the ASU unit plus the
recycle stream and 𝑃 and 𝑇 are the actual pressure and temperature values within
the reactor (MANTRIPRAGADA, RUBIN, 2017a).
The costs of the other equipment follow the existing cost models in IECM. For
example, the cost of the HRSG and the steam turbines are calculated based on the thermal
power generated in the CaL system, calculated in section 3.1.5 (equation 3-60). Solids
handling equipment is calculated using the mass flow of solids as the scaling variable.
Costs for limestone handling equipment were approximated to that of coal handling
(MANTRIPRAGADA, RUBIN, 2017b). Initial limestone cost is estimated based on
solids inventory calculations demonstrated in section 3.2. Annual make-up cost of
limestone is calculated as a function of the molar flow rate of make-up (which accounts
for the loss in absorption capacity due to the sulphation reaction) and the capacity factor
of the CaL plant (assumed to be the same as the base plant). Costs for transportation and
geological storage of CO2 are kept as default, which means a CO2 product stream with
10.30 MPa after compression and transportation trough pipelines with a total length of
100 km (RUBIN, 2020).
4.4.3 Summary of financial assumptions
The same financial assumptions, except for the contingency costs32, are made for
all simulated cases, so they are compared on a consistent basis. The air-fired base power
base plant is considered as a greenfield plant and is constructed simultaneously with the
CCS system (construction period of 3 years33 is assumed for all cases). The capital cost
of a greenfield base plant and a capture-ready base plant for a CaL post-combustion
32 Discount rates may also be used to estimate costs of technologies with different levels of maturity as proposed in (MANTRIPRAGADA, RUBIN, 2014). Still, as contingency costs were already used for that aim, the discount rates were maintained equal in all cases to avoid double-count effects. 33 In fact, construction periods of 4 years or more could be considered for power plants with CaL.

116
application are probably similar, since adaptations on the base plant to receive the retrofit
of a CaL unit will consist of simple adjustments, such as pre-planning of the full plant
layout to accommodate the CCS system. Aside from the extra physical space and
optimized layout (e.g. fuel handling and feeding equipment for the base plant and future
calciner are set to be located in the same place), pre-planning may encompass
construction in sites where there is sufficient water source (and/or possibility for an
extended water permit) to supply for an increase in water use when the CaL plant is added.
This is also valid for limestone supply and it would be preferable if the source of CaOH2
is located near the power plant.
The amine-based plants simulated are also considered to be greenfield plants. In
the work by ROCHEDO (2011), the concept of capture-readiness was explored for
different chemical absorption post-combustion capture configurations. The base plant
configurations had different levels of capture-readiness and the capture unit was added in
different years of the plant lifetime. The main motivation for the construction of capture-
ready plants is to facilitate the introduction of CO2 capture in the power generation sector
in the near future, avoiding penalties and technological lock-ins, while promoting cost
reduction and technological development. The work by ROCHEDO (2011) has also
shown that in scenarios where capture units enter in the long term, the effect of the future
value of the capture plant will be counterbalanced with the lower investment at present
value, so investment decisions favour the cases without capture-ready modifications. In
fact, it was proven that the perspective of investment decisions favours post-combustion,
with the plant without capture-ready adjustments being dominant (a 15% discount rate
was assumed) (ROCHEDO, 2011). Therefore, if CCS does not prove to be viable in the
future, CaL has the advantage over other capture technologies, including amine-based
systems, that its pre-investments required are minimum, and so the risk for investors of
incurring in irreversible costs (or stranded assets) is lower.
The main financial assumptions proposed are summarized in Table 4.6. A
discount rate of 7.1% p.a is proposed, similar to values applied in comparable studies
(IEAGHG, 2014b, MICHALSKI, HANAK, et al., 2019, YANG, ZHAI, et al., 2010).
Project lifetime is 30 years but might be lower for specific equipment in the CaL system,
such as the calciner (IEA, 2010). Escalation rates were not applied (RUBIN, SHORT, et
al., 2013a).

117
Table 4.6. Summary of financial assumptions.
a Based on the values proposed by (IEAGHG, 2014b, MICHALSKI, HANAK, et al., 2019, YANG, ZHAI, et al., 2010).
b Calculated by IECM and derived from discount rate and project lifetime.
Parameter Value Unit
Year of costs reported 2017 Constant USD
Discount Rate a 7.1 %
Fixed Charge Factor (FCF) b 0.11 -
Project Lifetime 30 Years
Construction Period 3 Years

118
4.5 Case study assumptions
4.5.1 Configuration 1 – Reference plant (without CCS)
The reference case is a base plant (without CCS) with a designed gross power
output of 300MWg. It is assumed to be a new or greenfield pulverized fuel supercritical
steam cycle unit, equipped with standard pollution control devices. Pollution control
devices are designed to meet new source performance standards (NSPS) for air pollutants
and water pollutants criteria (except CO2 controls). The plant is modelled using the
“typical new plant” configuration in IECM. Fuels considered are coal and biomass
(further specified in section 4.2). A subcritical plant is also simulated for a coal
application as this steam cycle type represents most of the world’s current coal-fired
generation fleet (CALDECOTT, DERICKS, et al., 2015, IEA, 2019g). The choice for a
subcritical steam cycle for the biomass-fired case is justified by its representativity in the
current Brazilian cogeneration fleet (CNA, PECEGE- USP, 2015, DANTAS, LEGEY, et
al., 2013, DIAS, MODESTO, et al., 2011, NYKO, BRANDÃO, et al., 2011).
Plant size is proposed as an intermediate value between a large-scale coal plant
and a large-scale biomass plant. Also, sensitivity analyses on the full plant cost (capital
and LCOE) related to size are performed with 700MWg and 100MWg to account for
potential scale gains of the CCS technologies. The value for the capacity factor (CF) of
75% is selected based on similar studies for CaL systems (MANTRIPRAGADA, RUBIN,
2014, MANTRIPRAGADA, ZHAI, et al., 2019b). Still, other studies considered a CF of
85% or higher (CRIADO, ARIAS, et al., 2017). While new power plants might have to
deal with more flexible operations and lower CF values, the addition of capture units
might force plants to increase capacity factors to justify its capital investment (CRIADO,
ARIAS, et al., 2017). Therefore, sensitivity analyses are made for CF values of 40% and
85%.
As previously mentioned, the absolute cost values of the plants simulated are of
less importance than the relative values between the different configurations proposed.
Thus, no location factor is applied and the cost values are considered for the US Midwest
region, which is the IECM default. Other important performance data on the base plant
are summarized in table 4.7 below:

119
Table 4.7 Reference plant (no CCS) configuration parameters
Reference Plant Configuration 1 1A 1B
Fuel type Coal Biomass Coal
Boiler type Supercritical Subcritical Subcritical
Environment Temperature (oC) 22 22 22
Plant life (years) 30 30 30
Capacity Factor (%) 75 75 75
Steam pressure (bar) 243 164 164
Steam temperature (oC) 565 540 540
Plant gross capacity (MW) 300 300 300
Additionally, all plants configurations have the following pollutants control
technologies34:
In-Furnace NOx Controls
Hot-Side Selective Catalytic Reduction (SCR)
Cold-Side Electrostatic Precipitator (ESP)
Wet Flue Gas Desulfurization (FGD)
34 Except from the configurations fuelled with biomass, which have only the Cold-Side Electrostatic Precipitator (ESP) as pollutant control technology, as proposed in (IEAGHG, 2011).

120
4.5.2 Configuration 2 - Large-scale calcium looping carbon capture unit
Configurations for a standard post-combustion CaL capture unit were extensively
discussed in chapters 2 and 3. By using typical operational parameters examined in these
chapters, input parameters were adjusted for the lowest LCOE possible, respecting solid
looping rates limits. Figure 4.3 shows the basic diagram for the CaL system in IECM.
The following table displays the parameters assumed for the CaL capture unit
configurations. In terms of performance, these configurations can be considered both for
greenfield and retrofit plants. All configurations have FGD units downstream of the
process that sets SO2 to 10 ppm (the same is done for the amine-based system models).
Configuration 2 represents the capture unit for the reference plant of configuration 1.
Configuration 2A represents the Bio-CaL system for the reference plant of configuration
1A and configuration 2B represents the CaL system for configuration 1B.
Figure 4.3 Calcium Looping Diagram for Post-combustion carbon dioxide capture. Obtained from IECM version 11.2.

121
Table 4.8 Parameters used in the CaL carbon capture unit simulations
CaL carbon capture unit 2 2A 2B
Fuel supplied to the calciner a Coal Biomass Coal
Capture efficiency carbonator (%) 90 80 90
Steam cycle (secondary plant) b Supercritical Subcritical Subcritical
Make-up rate (mol/mol) 1.9 1.5 1.9
Limestone purity (%) 92.4 92.4 92.4
Carbonator Temperature (°C) 650 650 650
Degree of Carbonation (-) 0.7 0.7 0.7
Calciner Temperature (°C) 910 900 910
Degree of Calcination (-) 0.95 0.95 0.95
Fraction of Gas Recycling (fraction) 0.55 0.60 0.55
CO2 in flue gas at carbonator inlet (% vol) c 11.9 12.5 11.9
a Same fuel properties as the fuel used in the base plant. b The secondary steam cycle is calculated based on the same heat rate (HR) as the primary plant, thus, conditions for
steam temperature and pressure are considered to be equal to the base plant. c This value is an output from IECM reference plant configurations (1, 1A, and 1B).
As previously discussed, the configuration for a Bio-CaL system should be
slightly different than the optimal configuration for a coal-fired CaL system, assuming
plants with the same installed capacity. This is true regarding both carbonator capture
efficiency and calciner nominal temperature. The capture rate in the carbonator is set to
80%, as a capture level of 90%, more usual in similar simulation studies using amine-
based capture (TAGOMORI, CARVALHO, et al., 2018), results in higher heat demand
in the calciner, which would mean a greater supply of fuel and O2 stream in this reactor35.
A carbon capture efficiency of 80% for biomass-fired calciner was also proposed by
MARTÍNEZ et. al (2018) to reduce calciner heat demand (MARTÍNEZ, I., ARIAS, et
al., 2018). A lower capture level in the carbonator for biomass-fired calciner compared
to coal was also suggested in (HANAK, BILIYOK, et al., 2015b).
35 In addition, a capture level of 90% resulted in a heat demand in the calciner out of the limits proposed by the software, which is represented by a Calcium Looping Power Requirement higher than 30 (% MWg) of the gross power produced by the CaL system.

122
4.5.3 Configuration 3 - Large-scale chemical absorption amine-based carbon capture unit
The configuration for the chemical-absorption equipped plant is based on Fig 4.4.
The steam for the amine capture system is supplied from the primary steam cycle while
electricity is also provided by the base power plant (with no auxiliary boiler). Other
configurations for amine-based systems are proposed in (MANTRIPRAGADA, ZHAI,
et al., 2019b).
Shell Cansolv is selected as the amine solvent. Cansolv is a tertiary amine capable
of selective or sequential SOx, NOx, and CO2 removal. It was used in the Boundary Dam
plant, capturing CO2 from flue gas from a 110MWe lignite-fired power plant
(MANTRIPRAGADA, ZHAI, et al., 2019b, ZEP, 2017). The solvent has fast kinetics
and high absorption capacity compared to other conventional amines and is blended with
primary amines and additives (FERON, 2016). In recent reports by the NETL on power
plants with capture (CHOU, LYENGAR, et al., 2015, FOUT, ZOELLE, et al., 2015,
TURNER, IYENGAR, et al., 2019), Cansolv was selected as the base case both for PC
and NGCC post-combustion plants. The use of newer proprietary solvents in post-
combustion costs comparisons is also recommended in (RUBIN, DAVISON, et al.,
2015). Parameters for the amine-based process using the Cansolv solvent used in this
work are derived from IECM software default model (with proprietary values).
Simulations were also performed using Econamine FG+, another advanced amine
used in various comparable works (CLARENS, ESPÍ, et al., 2016, MANTRIPRAGADA,
Figure 4.4 Configuration 3 proposed for amine-based post-combustion capture. Adapted from (Mantripragada et al., 2019b)

123
ZHAI, et al., 2019b, ROCHEDO, 2011). This solvent was applied to the CFPP
configuration with the supercritical steam cycle, as shown in table 4.9. Simulation results
for cost values using Econamine FG+ in IECM are lower than Cansolv or conventional
amine MEA (considering the same base plant). Therefore, results for the FG+
configuration are considered as the minimum cost limit for current amine-based systems.
Cansolv, in turn, has higher absorption capacity and better thermodynamic performance
than Econamine FG+, which is represented by the values of lean CO2 loading and
regenerator heat requirement, respectively, shown in table 4.10. Input parameters
employed in this work for Cansolv and Econamine FG+ capture units are derived from
IECM software or based on the works by (CLARENS, ESPÍ, et al., 2016),
(MANTRIPRAGADA, ZHAI, et al., 2019b) and (HANAK, BILIYOK, et al., 2015b).
Table 4.9 Amine-based carbon capture unit configurations
Amine-based Plant Configuration 3 3FG+ 3A 3B
Fuel type (Primary plant) Coal Coal Biomass Coal
Amine system Cansolv Econamine FG+ Cansolv Cansolv
Steam cycle Supercritical Supercritical Subcritical Subcritical
Table 4.10 Parameters used in the amine-based carbon capture unit simulations
Solvent Proprietary Name Cansolva Econamine FG+
Absorber CO2 Removal Efficiency (%) b 90 90
Sorbent Concentration (wt %) - 30
Regenerator Heat Requirement (kJ/kg CO2) 2559 3553
Lean CO2 Loading (mol CO2/mol sorb) 0.16 0.19
Sorbent Losses (kg/t CO2) - 3
Sorbent Recovered (kg/t CO2) - 1.98
Liquid-to-Gas Ratio (ratio) - 3,.9
Makeup water for wash section (% raw flue gas) 0.8 0.8
a The values not displayed for Cansolv are proprietary and not publicly available. b Although config. 2A, applied for the Bio-CaL system, is designed with 80% capture efficiency in the carbonator, due
to the CO2 captured by the oxy-calciner after the calcination step, the overall capture rate is 90% for both plants. For all other configurations, CaL systems have a higher overall capture rate than amine-based systems.

124
5. Results Analysis
This chapter compares and discusses the results for the configurations presented
in chapter 4. Calcium looping and amine-based post-combustion carbon capture units
were modelled integrated to new-built pulverized fuel power plants. Results are compared
in technical and economic aspects. Results for water use and physical space requirements
are also discussed. Then, key configuration parameters are modified for a sensitivity
analysis.
5.1 Supercritical CFPP
5.1.1 Technical results
Configurations for the supercritical coal-fired power plants were introduced in
section 4.5. A summary of technical results for the selected 300MWg PC plants, with and
without carbon capture, is presented in Table 5.1. Config. 2, or the plant with CaL, has
the largest gross and net power output due to the additional power produced from the
secondary steam power plant. Config. 1 and 2 have the same coal input flow rate of 84
tonnes/hr supplied to the base plant, though config. 2 has an additional coal input of 74
tonnes/hr (an 88% increase) supplied to the oxy-calciner for the calcination process. The
heat recovery associated with the CaL unit is responsible for the secondary steam cycle,
which increases in 72% the net power output of the integrated plant (base plant + CaL)
compared with the reference plant (config. 1).
Table 5.1. Technical evaluation summary
Parameter Unit 1 2 3 3FG+
Gross Power Output MW 300 300 (+289)a 300 300
Net Power output MW 280 481 246 243
Auxiliary Power Consumption MW 20 108 54 57
Fuel input flow rate tonne/hr 84 84 (+74)b 98 102
Net plant efficiency HHV (%) 38.8 35.4 29.4 27.9
Efficiency Penalty % - 3.3 9.4 10.8
Plant specific CO2 emissions kgCO2/MWh 820 50 110 114
CO2 Captured tonne/hr - 470 240 250
a Config. 2 has additional gross power generated from the secondary steam cycle, represented in parentheses. b In parentheses, the fuel input rate to the calciner is displayed.

125
To achieve the same gross power output, the amine-based plants in configurations
3 and 3FG+incurs in an increase in the fuel supply of 16% and 21%, respectively. For an
existing plant, this level of fuel flow rate increase may be restrictive due to steam turbines
operational limits and fuel feeding system infrastructure, among other practical and
economic reasons. An auxiliary boiler could be used, but overall plant CO2 emissions
would be higher. Therefore, simulations were also performed for a variation of config. 3
and 3FG+, establishing the same fuel input value as configurations 1 and 2 while varying
the gross power output. This in theory represents what would be more similar to a
retrofitted36 plant regarding the reference configuration. In this case, config. 3 gross
output reduces to 259 MW and the net output decreases to 212 MW; a 24% de-rate
compared with the 280 MW of the reference plant. Additionally, config 3FG+ had a de-
rate of 28%, which indicates a better thermodynamic performance of the Cansolv solvent
used in config. 3. Other performance parameters such as net plant efficiency and CO2
emissions rate remained stabilized in this variation.
As shown by Figure 5.1 below, config. 2 has not only a higher net plant efficiency,
but also a lower plant-specific CO2 emission rate in comparison with the amine-based
cases (config. 3 and 3FG+). The lower CO2 emission rate of config. 2 is due to the
additional power supplied by the oxy-fired calciner.
36 These models should be seen as a simplification of a retrofit simulation, since the base plants of these cases have small differences in equipment size and cost compared with the reference case in config. 1.
Figure 5.1. Net plant efficiency (HHV basis) on the left-axis and plant specific CO2 emissions on the right-axis (kgCO2/MWh)

126
Thus, even if the same amount of CO2 is being emitted by the three CCS plants in
absolute terms, as a capture level of 90% from the base plant flue gas was established for
all CCS cases, the CaL plant produces more energy with lower overall emission rate.
This translates as a higher plant overall capture level in config 2. (base plant and
CaL unit), since almost 100% of the CO2 present in the coal supplied to the calciner is
captured. Then, carbon mass balance for config. 2 full system derives in a capture rate of
95.3%, against 90% from the amine-based system. Additionally, the extra fuel added to
the calciner in config. 2 results in significantly more CO2 captured by the power plant in
absolute terms (almost the double), capturing 470 tonnes/hour in config. 2 against 240
and 250 tonnes/hour in config. 3 and 3FG+, respectively.
Also, config 2 has a low efficiency penalty of 3.3% in relation to the reference
case, compared with 9.4% and 10.8% of the amine-based configurations. The net plant
efficiency of config. 2 is calculated over a larger primary energy input. Thus, the energy
penalty does not refer exclusively to the base plant, but the entire system. Still, auxiliary
power consumption in config 2. is two times larger than in configs. 3 and 3FG+. In config.
2, almost all power consumption is due to CO2 compression and air separation (CCU and
ASU), which are responsible for about 40 MW each. In configs. 3 and 3FG+, most part
of the parasitic load is due to steam extraction for solvent regeneration from the base plant
cycle, followed by the CCU. Although the CCU in config. 3 compresses 49% less CO2
(mass basis) than config 2, it consumes only 28% less energy. This indicates config. 2 is
more efficient in CO2 compression.
Finally, regarding exclusively config. 2, other technical results are displayed in
table 5.2. The solids residence time in the reactors is in agreement with the literature
values (between 1-3 min), with 156 seconds for the carbonator and 55 seconds for the
calciner. The average carrying capacity, described in equation (3-9) and presented in
chapter 3, resulted in a maximum carrying capacity of 0.2, with an actual carbonator
conversion of 0.14, both typical values. This means the solid circulation molar rate of Ca-
based entering the carbonator is about one order of magnitude greater than the number of
moles of CO2 coming from the flue gas. This is represented by a circulation ratio of
𝐹 /𝐹𝐶𝑂2,𝑓𝑙𝑢𝑒𝑔𝑎𝑠 = 8, calculated with the ratio of circulating sorbent entering the carbonator
over the CO2 flue gas. Additionally, the fresh sorbent make-up rate over the flue gas rate
𝐹 /𝐹𝐶𝑂2,𝑓𝑙𝑢𝑒𝑔𝑎𝑠 = 0.13 is also in agreement with typical circulating rates found in the
127
literature. These circulation rates were calculated using values from the IECM result
diagram shown in Figure 5.2, which illustrates the main solid and gas flow rates of the
capture plant, including sorbent make-up, sorbent purge, required oxidant and CO2
captured. The values displayed in the result diagram are based on the mass and gas
balance equations described in chapter 3. It shows the input of fresh limestone flow is in
the same order of magnitude as the coal flow. In addition, it shows the flow of rich-sorbent
(CaCO3) entering the calciner is greater than the flow of lean-sorbent (CaO) leaving the
calciner and entering the carbonator.
Table 5.2. Config. 2 operational results
Figure 5.2 Results diagram for CaL plant added to supercritical coal plant (300 MW gross power). Obtained from IECM.
CaL system operational results Unit Value
Solids residence time in the carbonator Seconds 156
Solids residence time in the calciner Seconds 55
Average carrying capacity 𝑿𝒂𝒗𝒆 (fraction) 0.20
Actual CaO Conversion 𝑿𝒄𝒂𝒓𝒃 (fraction) 0.14
𝑭𝟎/𝑭𝑪𝑶𝟐,𝒇𝒍𝒖𝒆𝒈𝒂𝒔 (mol/mol) 0.13
𝑭𝑹/𝑭𝑪𝑶𝟐,𝒇𝒍𝒖𝒆𝒈𝒂𝒔 (mol/mol) 8

128
5.1.2 Economic results
Cost results for the plants simulated are summarized in Table 5.3. The plants with
carbon capture are considered FOAK plants due to the contingency factors assumed, in
accordance with the technologies’ current maturity, as proposed in chapter 4. Plant capital
cost for the CaL configuration is higher than the amine-based cases, as an additional
generation plant is part of the CaL system, aside from the capture unit itself. While the
total capital requirement (TCR) of config. 2 (5829 $/kW-net) represents more than a two-
fold increase compared to the reference plant (2344 $/kW-net), config. 3FG+ is the least
costly with a 78% points increase in relation to the same reference (4174 $/kW-net). In
addition, the CCS system capital cost (2120 $M) in config. 2 is significantly higher than
the amine-based configurations (415 $M and 276 $M). These results show CaL systems
are highly intensive in capital and the contingency factors applied affected negatively the
economics of these systems. Therefore, as a FOAK plant, CaL is less competitive than
amine-based systems for post-combustion capture.
Table 5.3. Cost results summary (FOAK plants)
Parameter Unit 1 2 3 3FG+
Plant capital cost37 ($M) 657 2806 1142 1016
CSS system capital cost38 ($M) - 2120 415 276
Total Capital Requirement (TCR) $/kW-net 2344 5829 4639 4174
CO2 capture capital cost $/kW-net - 4404 1684 1133
Plant LCOE $/MWh 72.5 151.3 137.8 129.1
Plant LCOE w/o T&S $/MWh - 146.4 130.4 121.5
Cost of CO2 avoided $/tonne CO2 - 101.8 91.6 79.9
Cost of CO2 captured $/tonne CO2 - 75.6 59.2 47.6
Regarding the LCOE of the configurations, the CaL system more than doubles the
value of the reference plant and is about 10% more expensive than config. 3 and 17%
more expensive than config. 3FG+. The difference in transportation and storage costs, on
the other hand, favours config. 2 against the amine-based configurations, which can be
37 Same as overnight cost. 38 This cost does not account for adjustments in plant cooling system, SO2 control system or any equipment or subsystem of the base plant that may need revamp to potentially accommodate a capture unit. Since the plants are considered greenfield, the cost of the cooling system, for example, is included in Plant capital cost ($M) and is higher for the CCS configurations in comparison with config 1.

129
explained by the economies of scale that derive from capturing more CO2 from one single
emitting source in the case of the CaL system. Diseconomies of scale, contrarily, are
likely what explains the high LCOE values that resulted from all CCS cases, above typical
values reported in the literature (and discussed in section 4.4).
For costs of CO2 avoided and captured39 concerning the CaL-based plant, results
are around 30% and 60% points higher in config. 2, respectively, when compared to the
least costly amine-based configuration – config. 3FG+. The weight of the capture plant
in total capital cost is also higher for the CaL system. The CO2 capture capital cost in
config. 2 (4404 $/kW-net) accounts for 76% of the plant TCR, while for config 3FG+
(1133 $/kW-net) the capture cost accounts for 27% of the TCR. A more detailed
breakdown of the costs of the capture unit for the CaL configuration is presented in Figure
5.3, where the impact of the contingency costs can be better evaluated.
39 In order to calculate costs for CO2 captured and avoided, config. 1 was considered as the reference plant.
Figure 5.3 Capital cost distribution for a FOAK CaL system capture plant ($/kW-net)

130
Figure 5.3 demonstrates process facilities capital (2047 $/kW-net) is the main cost
component, but contingency costs combined correspond to 36% of the total cost.
Therefore, if contingency factors are reduced to lower values40, the cost of CaL systems
can significantly decrease. The effect of this potential reduction is further investigated in
section 5.4, where both capture technologies are considered mature NOAK plants. Figure
5.3 also demonstrates other cost components have a lower influence on the overall cost
of the capture unit. Still, it is worth noting that preproduction (start-up) costs of the CaL
system, even if representing 2% of the capture unit capital cost (100 $/kW-net), are more
than three times the value for start-up costs of the base plant (28 $/kW-net). On a
qualitative level, this is in agreement with what was discussed in section 2.4.2.
A breakdown of costs for the CaL unit process facilities capital (2047 $/kW-net)
is exhibited in Figure 5.4. Carbonator and calciner combined represent 50% of the cost.
Thus, cost reduction efforts should be aimed at these reactors. The carbonator is
responsible for 33% of the costs, as it handles a greater flow rate than the calciner
(resulting in a larger reactor). Other important cost components are the ASU unit (16%),
the HRSG (7%), solids (limestone) handling equipment (6%), and the steam turbines
(8%).
40 Through technology learning and/or construction of “N” plants.
33%
17%16%
5%3%
7%
5%
6%
8%
CaL system process facilicities capital cost ($/kW-net)
Carbonator
Calciner
ASU
Blowers
CO2 Product Compressor
CO2 Cryogenic Purification Unit
Heat Recovery Steam Generator
Coal Handling Equipment for ASU
Solids Handling Equipment
Steam Turbine for PowerGeneration
Figure 5.4 Breakdown costs of CaL capture system process facilities capital

131
5.1.3 Water use analysis
Results for water use with a wet tower cooling system are summarized in Table
5.4. Capture unit cooling duty (tH2O/tCO2) for CaL is significantly lower than the amine-
based configurations. This translates into more efficient water use (in m3/kWh) for config.
2. Table 5.4 demonstrates that while specific water consumption for config. 2 has a 16%
increase compared to config. 1, config. 3 has a 76% increase over the same reference. For
specific water withdraw, config. 2 increases 2% over the reference plant, while config. 3
has a 77% increase.
Table 5.4. Water use results of power plants for wet cooling tower system*
Wet Cooling Tower Unit 1 2 3 3FG+
Capture Cooling duty (tH2O/tCO2) - 12.4 87.4 90.8
Water withdraw m3/kWh (%) 2718 2779 (+2%) 4807 (+77%) 4660 (+71%)
Water consumption m3/kWh (%) 1894 2192 (+16%) 3341 (+76%) 3235 (+71%)
Water withdraw hm3/year (%) 5.0 8.8 (+76%) 7.8 (+55%) 7.5 (+48%)
Water consumption hm3/year (%) 3.5 6.9 (+99%) 5.4 (+55%) 5.2 (+48)
* Percentage value between parenthesis indicates the percentage difference in water use in relation to the reference plant (config. 1).
Regarding water use in absolute values, the implementation of CaL doubles the
volume of water consumed over the reference plant, and an increase in water withdrawal
is also significant (+76% points). Likewise, the amine-based system in config. 3FG+
increases the volume withdrawal and consumed by 48% points over config. 1. Even if
demand and consumption are smaller than in the CaL configuration, these are still
important increments, whereas this route does not provide additional energy like CaL.
Figure 5.5 illustrates the comparison in water use among all configurations. These results
call attention to possible limitations to implement a CaL system, resulting from
restrictions in water availability, since amine-based systems are already a concern
regarding water use in Brazilian water basins (MERSCHMANN, VASQUEZ, et al.,
2013). Amid the amine-based systems, config. 3FG+ performs better for water use over
config. 3.

132
Figure 5.5 Water use analysis of carbon capture systems - wet cooling tower
Table 5.5 summarizes the results obtained when once-through systems are applied
to configurations 1, 2, and 341. Water withdraw values are greater and water consumption
values are smaller compared with wet cooling systems, due to inherent characteristics of
these cooling systems. For once-through systems, qualitative results obtained for the wet
cooling tower systems are maintained, which means more efficient water use by the CaL
system in comparison with amine-based systems. Capture unit cooling duty decreases to
8.2 tH2O/tCO2 in config. 2 and remains the same in config. 3.
For water-specific consumption, the result for config. 2 is even lower than in
config. 1, with a decrease of 41% points over the reference plant, while the value for
config. 3 is 54% points greater than config. 1. In the case of specific water withdraw,
config. 2 has an increase of 24% points compared to config. 1, while config. 3 has a 120%
increment. Concerning absolute values, the CaL system more than doubles the volume of
water required by the plant (+115%), whereas config. 3 has an increase of 97% points. In
addition, config. 2 has an increase in water absolute consumption over config. 1 of 3%,
while config. 3 has an increase of +38% over the same reference.
41 Results for configuration 3FG+ are not displayed for the once-through system, since they are relatively similar to config. 3.
5
8,8
7,8 7,5
3,5
6,9
5,4 5,3
1 2 3 3FG+
Water Withdraw (hm3/year) Water Consumption (hm3/year)
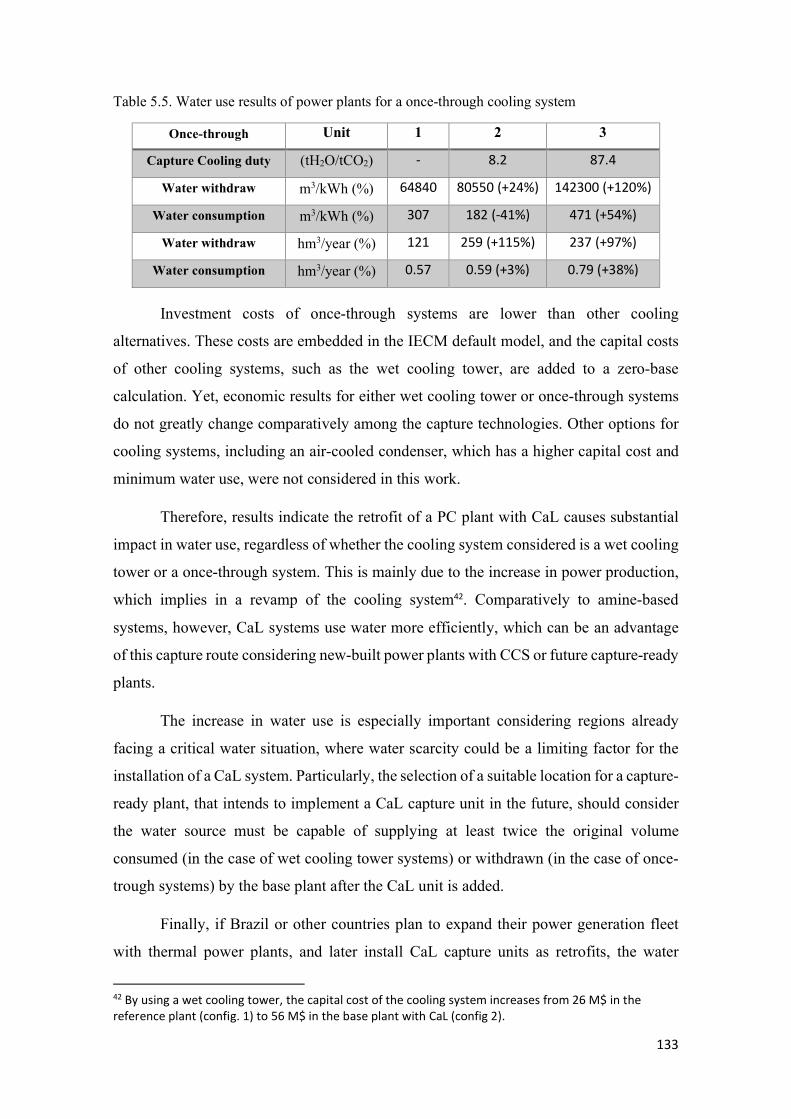
133
Table 5.5. Water use results of power plants for a once-through cooling system
Once-through Unit 1 2 3
Capture Cooling duty (tH2O/tCO2) - 8.2 87.4
Water withdraw m3/kWh (%) 64840 80550 (+24%) 142300 (+120%)
Water consumption m3/kWh (%) 307 182 (-41%) 471 (+54%)
Water withdraw hm3/year (%) 121 259 (+115%) 237 (+97%)
Water consumption hm3/year (%) 0.57 0.59 (+3%) 0.79 (+38%)
Investment costs of once-through systems are lower than other cooling
alternatives. These costs are embedded in the IECM default model, and the capital costs
of other cooling systems, such as the wet cooling tower, are added to a zero-base
calculation. Yet, economic results for either wet cooling tower or once-through systems
do not greatly change comparatively among the capture technologies. Other options for
cooling systems, including an air-cooled condenser, which has a higher capital cost and
minimum water use, were not considered in this work.
Therefore, results indicate the retrofit of a PC plant with CaL causes substantial
impact in water use, regardless of whether the cooling system considered is a wet cooling
tower or a once-through system. This is mainly due to the increase in power production,
which implies in a revamp of the cooling system42. Comparatively to amine-based
systems, however, CaL systems use water more efficiently, which can be an advantage
of this capture route considering new-built power plants with CCS or future capture-ready
plants.
The increase in water use is especially important considering regions already
facing a critical water situation, where water scarcity could be a limiting factor for the
installation of a CaL system. Particularly, the selection of a suitable location for a capture-
ready plant, that intends to implement a CaL capture unit in the future, should consider
the water source must be capable of supplying at least twice the original volume
consumed (in the case of wet cooling tower systems) or withdrawn (in the case of once-
trough systems) by the base plant after the CaL unit is added.
Finally, if Brazil or other countries plan to expand their power generation fleet
with thermal power plants, and later install CaL capture units as retrofits, the water
42 By using a wet cooling tower, the capital cost of the cooling system increases from 26 M$ in the reference plant (config. 1) to 56 M$ in the base plant with CaL (config 2).

134
balance should be considered a critical factor for selecting the sites for these plants.
Regarding water constraints, results obtained in this work can be used along with past
studies43, which evaluated water use in power plants associated with CCS. This would
make it possible to assess if existing plants would be suitable or not to receive a CaL
retrofit.
5.1.4 Plant footprint analysis
For a thermal plant integration with a capture unit, the minimum requirement is
the physical space at the plant site to accommodate the capture plant. The space required
for carbon capture equipment depends on a range of factors, including the capture
technology and some site-specific factors, which are difficult to generalize and not easily
scalable. The layout of a CCS plant will also vary whether it is a retrofit of an existing
plant or a capture-ready scenario44, as the capture-ready scenario can foresee layout
optimization for when the capture unit is added. Therefore, plant layouts should
ultimately be considered on a case-by-case basis rather than on the basis of a minimum
land footprint.
For planned capture-ready plants, the added space represents marginal capital
costs, but in non-planned retrofits of CCS, there is often limited space available for
expansion. Retrofit efforts then require a unique approach to utilize the space available.
Additional space requirements could make a retrofit considerably more expensive to carry
out (due to costly rearrangements) or, in a worst-case scenario, “lock-in” the plant if not
previously accounted for, i.e. making the retrofit unfeasible. Thus, it is important to
estimate the capture plant footprint of CaL even in a preliminary analysis.
To avoid ambiguity and facilitate comparison, land footprint estimates must
specify all of the assumed equipment. For a CaL system, these would include, among
others: both generation systems (steam turbines), CO2 capture equipment (including
sizing for calciner, carbonator, and the number of trains), cooling system, ASU, CO2
dehydration, and compression (number of compressors per train), additional flue gas
treatment if included, sorbent storage and handling, extra fuel (for the calciner) storage,
43 For example, the work by (MERSCHMANN, VASQUEZ, et al., 2013) 44 Considering that capture-ready plants and new built CCS plants would both have the same land footprint when the capture unit is added.

135
handling and feeding system, CO2 transport details, space for construction and
appropriate space for health and safety. However, a detailed land footprint analysis is
beyond the scope of this work and a simple estimation is conducted in the following
paragraphs.
The CaL capture unit land footprint (not directly calculated by the IECM model)
can be estimated based on a few simple assumptions. Equations (3-87) and (3-88), which
were presented in chapter 3, can be used to calculate the cross-sections in m2 of the
carbonator and calciner reactors. As previously mentioned, these equations are based on
the work by (LYNGFELT, LECKNER, et al., 2001) for CFB boilers. The other
subsystems that are part of the capture process area may be estimated based on values
available in the literature for oxy-combustion capture systems. The report by FLORIN
and FENNELL (2011) on pulverized coal plants, mentioned in section 2.4.2, is used as
guidance to estimate plant footprint of oxy-combustion and amine-based carbon
technologies.
According to FLORIN and FENNELL (2011), a typical land footprint for an
amine-based system of a 300 MWg plant would require between 8000 and 11500 m2,
based on linear relationships with the reported values and including area for compression
(areas for the existent generation plant and FGD unit were not included). A CaL system,
on the other hand, will arguably require the equivalent of an oxy-fired generation plant of
289 MWg (equal to the added gross power output of the oxy-fired calciner in config. 2)
and its associated CO2 capture system. Thus, no possible integration with the existing
plant is admitted. Also, the area for the carbonator, calciner45 , and limestone
handling/storage should be accounted for. For Bio-CaL plants, these areas should be
larger compared to coal-fired plants since the feedstock has lower energy density. The
CCU unit of the CaL plant will also have a larger area than a typical 289 MWg oxy-fired
plant, since there is an additional amount of CO2 captured from the carbonator.
Based on these assumptions, cross-sections areas for the carbonator and calciner
for a 300 MWg reference plant are respectively 170 m2 and 70 m2, using a gas superficial
velocity of 5 m/s46. In this case, one train of reactors is sufficient and the interconnected
45 In fact, the area required for the calciner would be already accounted for in the oxy-fired unit, but the cross section is calculated to assess the number of trains required. 46 Superficial gas velocity was previously discussed in section 3.2.3 and typical values range from 5-7 m/s.

136
dual CFB requires a footprint close to 500 m2, considering the necessary space for
interconnections, loop seals, cyclones, and equipment clearances. Based on reported
values for oxy-fired systems, the CaL capture system, primary and secondary generation
plants aside, results in a capture unit area of about 12 500 m2. The primary generation
plant alone requires about 96 000 m2. Using a linear scaling factor is clearly over-
simplistic and it would be more reasonable to undertake a bottom-up approach. However,
as a first estimate, results show the space requirement of a CaL system could possibly be
similar to an amine-based system, considering just capture unit area. This changes when
the secondary power cycle is included, although CaL technologies have significant
potential for utilisation of common utilities with the existing generation plant. Finally,
heat rejected from capture and compression units could be exploited with tight thermal
integrations if equipment is located in close proximity, which highlights the importance
of space being available in critical locations. Regarding thermal plants fuelled with
bagasse, which are often located in the same site as ethanol distilleries, physical space for
the capture unit might present an extra challenge, since those distilleries usually have crop
area around them.

137
5.2 Comparative analysis for subcritical BFPP
Table 5.6 shows the main performance and cost results for configurations 1A, 2A,
and 3A, obtained by replacing coal with sugarcane bagasse as feedstock. Qualitatively,
results do not differ from the ones using coal. Costs for the Bio-CaL system, or config.
2A, are greater than for the amine-based system, while the thermodynamic performance
favours config. 2A over config. 3A. The efficiency penalty for config. 2A over the
reference plant (config. 1A) is of 1.4%, while for config. 3A is of 8.9%. Comparatively
to the supercritical CFPP configurations, the smaller efficiency penalty in config. 2A
(1.4% against 3.3% of config. 2) is an effect of the lower capture rate assumed for the
carbonator (80%). This lower capture rate impacts heat demand in the calciner, leading
to a more efficient integrated system. The capture rate in the absorber of config. 3A was
maintained as 90%, so both CCS configurations have a similar overall (full system)
capture rate. Nevertheless, config. 2A emits more CO2 from the flue gas than config. 3A.
Table 5.6 Performance and cost results for subcritical bagasse-fired power plants with and w/o CCS
a Config. 2A has additional gross power generated from the secondary steam cycle, represented in parenthesis. b Percentage value between parenthesis indicates the percentage difference in water use in relation to the reference plant (config. 1A).
Parameter Unit 1A 2A 3A
Gross Power Output MW 300 300 (+335) a 300
Net Power output MW 279 508 246
Net plant efficiency % HHV 34.6 33.2 25.7
Efficiency Penalty % HHV - 1.4 8.9
Total Capital Requirement (TCR) $/kW-net 1897 6014 4311
CO2 capture capital cost $/kW-net - 4902 1893
Plant LCOE $/MWh 47.5 139.1 111.4
Plant specific CO2 emissions kgCO2/MWh 976 107 131
Cost of CO2 avoided $/tonne CO2 - 105.4 75.6
Cost of CO2 captured $/tonne CO2 - 78.0 47.1
Water withdraw (WTC) m3/kWh (%) 2776 3169 (+14%) b 5451 (+96%)
Water consumption (WTC) m3/kWh (%) 1895 2356 (+24%) 3827 (+102%)
Water withdraw (WTC) hm3/year (%) 5.1 10.5 (+108%) 8.8 (+73%)
Water consumption (WTC) hm3/year (%) 3.5 7.9 (+126%) 6.2 (+78%)

138
Regarding economics, LCOE in config 1A has a 34% decrease in relation to
config. 1. This is likely caused by the lower fuel price of bagasse in comparison to coal,
the absence of pollution control technologies that are present in the coal-fired plant, and
the fact the biomass-fired plant represents a subcritical steam cycle (opposed to a
supercritical steam cycle, with greater capital cost, in config. 1). In the CSS
configurations, however, these effects are partially compensated by the capital cost
impact of larger equipment47, which is required to handle twice the amount of fuel on a
mass basis48. Then, LCOE in config. 2A is reduced by 8% points over config. 2, while in
config. 3A the decrease is of 19% in comparison with config. 3. Thus, the difference in
LCOE between CCS configurations is larger for the biomass-fired plant. More
specifically, LCOE in config 2A is 25% points more expensive than 3A, while the
difference is 10% points between config. 2 and config. 3. Therefore, the use of biomass
favoured the amine-based system over the Bio-CaL system. Results for water use
remained similar to what was found for supercritical CFPP configurations, but the impact
in water use increment due to the CCS configurations was greater for the BFPP
configurations.
During simulation modelling, when high temperatures (above 900 °C) were
applied for the biomass-fired calciner, the residence time of solids in the reactor was
lower49 compared to a coal-fired calciner using the same temperature, which could impact
designed calcination efficiency. To avoid this, the calciner temperature was set to 900 °C.
The lower residence time for biomass feedstock compared to coal is likely due to higher
material reactivity of the former, as suggested in (ALONSO, DIEGO, et al., 2014).
Table 5.7 displays Bio-CaL operational results for reactors' residence time and
circulation rates through the interconnected system. These parameters change from
config. 2 due to differences in the fuel composition. Residence time in the carbonator in
config 2A. is shorter than in config. 2, while in the calciner is longer in config. 2A.
47 Additionally, the process contingency factor assumed for the Bio-CaL plant was greater than for the CFPP FOAK plant, while for the amine-based system the same factor was applied. Although Bio-CaL has not been tested at the same size as coal-fired CaL, previous discussions in this work point out that the technology learning accumulated for CaL could be, in some level, used for Bio-CaL. Therefore, even though Bio-CaL was ranked as TRL 4, the difference between process contingency costs applied for CaL and Bio-CaL is small. 48 As the heating value of bagasse is almost half of coal. 49 The value for residence time of solids was below 1 min, which is below the limit suggested by the literature and the software. Furthermore, low reaction time could impact the designed calcination efficiency.

139
Overall, bagasse reacted faster than coal in the CaL system. Circulation rates, in turn, are
lower for the bagasse-fired system, but results remain within the limits suggested by the
literature for CFB systems.
Finally, results indicate that, with few adaptations, the model proposed can be
used to assess a Bio-CaL system. Further investigation on system modifications and
possible cost differences, particularly in pre-treatment stages and feeding, handling and
storage systems, is recommended.
Table 5.7 Operational results for config. 2A (Bio-CaL)
Bio-CaL system operational results Unit Value
Solids residence time in the carbonator Seconds 80
Solids residence time in the calciner Seconds 63
𝑭𝟎/𝑭𝑪𝑶𝟐,𝒇𝒍𝒖𝒆𝒈𝒂𝒔 (mol/mol) 0.10
𝑭𝑹/𝑭𝑪𝑶𝟐,𝒇𝒍𝒖𝒆𝒈𝒂𝒔 (mol/mol) 7

140
5.3 Comparative analysis for subcritical CFPP
Considering most of the current global generation fleet is composed of subcritical
coal-fired plants (CALDECOTT, DERICKS, et al., 2015), simulations were also
conducted for this type of steam cycle. In general terms, results are similar to supercritical
plants. Table 5.8 demonstrates that the CaL system (config. 2B) outperforms the amine-
based system (config. 3B) in thermodynamics and plant emissions rate. Still, economic
parameters of config. 2B are not competitive with config. 3B, with the first presenting the
higher costs for FOAK plants.
In addition, the subcritical cycle is less efficient in water use compared with the
supercritical cycle, though, results for water use increment50, both in specific and absolute
terms, are proportional to the ones obtained for the supercritical steam cycle.
Comparatively to the supercritical configuration, the impact of CaL in the reference plant
cost is higher, with an LCOE increase of 120% over config. 1B, against a 108% increase
among the correspondent supercritical system. While LCOE in config. 2B is 13% points
higher than in config. 3B, the increase is 10% points for the supercritical configurations.
Similar results are found for TCR costs, favouring CaL supercritical configuration. Also,
the difference in efficient penalty between the CaL and amine-based capture is greater for
the supercritical plants. Therefore, it can be concluded that amid supercritical and
subcritical plants, the first is more suitable for the implementation of CaL systems.
Table 5.8 Performance and cost results for subcritical coal-fired power plants with and w/o CCS
Parameter Unit 1B 2B 3B
Gross Power Output MW 300 300 (+289) a 300
Net Power output MW 279 474 243
Net plant efficiency % HHV 36.4 33.0 27.3
Efficiency Penalty % HHV - 3.4 9.1
Total Capital Requirement (TCR) $/kW-net 2173 5944 4539
CO2 capture capital cost $/kW-net - 4602 1772
Plant LCOE $/MWh 70.4 155.8 138.2
Plant specific CO2 emissions kgCO2/MWh 870 50 120
Cost of CO2 avoided $/tonne CO2 - 103.7 89.5
Cost of CO2 captured $/tonne CO2 - 76.5 57.2
50 Water use increment caused by the addition of capture units and considering config. 1B as the reference plant.

141
Water withdraw (WTC) m3/kWh (%) 2984 3105 (+4%) b 5277 (+77%)
Water consumption (WTC) m3/kWh (%) 2096 2447 (+17%) 3690 (+76%)
Water withdraw (WTC) m3/year (%) 5.5 9.7 (+77%) 8.4 (+54%)
Water consumption (WTC) m3/year (%) 3.8 7.6 (+99%) 5.9 (+54%)
a Config. 2B has additional gross power generated from the secondary steam cycle, represented in parenthesis. b Percentage value between parenthesis indicates the percentage difference in water use in relation to the reference plant (config. 1B).

142
5.4 Sensitivity analysis
The previous sections indicated that the CaL-based configurations have better
thermodynamic performances (higher net plant efficiency and power output) but worse
economic ones (higher capital cost, LCOE, and costs of CO2 captured and avoided). In
this section, a sensitivity analysis was conducted to assess the effect of key variables –
fuel price, plant size, capacity factor, and contingency costs – on the costs of the compared
supercritical CFPP configurations – see Table 5.9.
Table 5.9 Parameters and values assumed for sensitivity analysis
Parameter Sensitivity values
Coal price $40 and 80$/tonne
Plant size (MWg) 100, 300 and 700
Capacity factor 40%, 75% and 85%
Contingency costs51 FOAK and NOAK plants
5.4.1 Fuel price
Fuel price is investigated to assess if variations on market conditions have a
different impact on CaL systems economics relative to amine-based systems, as the first
uses an additional amount of fuel to supply the oxy-fired calciner, but has a higher capital
cost. Table 5.10 summarizes the main cost results for configurations 2 and 3. Cost values
for TCR and CO2 captured show small variations between the two coal prices (in TCR,
variations are caused by differences in fuel inventory for pre-production costs) while
LCOE, as it includes O&M costs, is more affected.
Table 5.10 Cost sensitivity analysis for fuel price
51 Contingency costs were varied based on the values presented in Table 4.5, in chapter 4.
Low Fuel Price $40/tonne Unit Config. 2 Config. 3
Total Capital Requirement (TCR) $/kW 5827 4634
Plant LCOE $/MWh 148.1 133.9
Cost of CO2 captured $/tonne CO2 75.3 58.2
High Fuel Price $80/tonne Unit Config. 2 Config. 3
Total Capital Requirement (TCR) $/kW 5833 4647
Plant LCOE $/MWh 161.4 149.9
Cost of CO2 captured $/tonne CO2 76.5 62.14

143
The effect of fuel price on plant LCOE is more significant for the amine-based
plant compared to the CaL-based plant, as illustrated in Figure 5.6. The graph
demonstrates that while the LCOE in config. 2 has an increase of 9% points from low to
high fuel price, increase in config. 3 is of 12% points. This is due to the higher capital
cost of CaL and the lower influence of its O&M costs in LCOE.
Figure 5.6 Effect of fuel price on plant LCOE
5.4.2 Size
Plant size influence in costs - TCR and LCOE - is investigated for plants with 100
MW and 700 MW gross power output, aside from original configurations with 300 MWg.
Results are shown in Table 5.11 and Fig 5.7. The 100 MWg plant is coal-fired but
represents the typical size of a large-scale biomass-fired power plant.
Table 5.11 Cost sensitivity analysis for plant size
Both technologies are affected by economies of scale, although config. 3 remains
more economical. Still, results indicate larger plants tend to favour TCR of CaO-based
148,1133,9
161,4149,9
0
20
40
60
80
100
120
140
160
180
Config. 2 Config. 3
Plan
t LCO
E ($
/MW
h)
Plant LCOE - Low coal price ($/MWh) Plant LCOE - High coal price ($/MWh)
Plant size – 700 MWg Unit 1 2 3
Total Capital Requirement (TCR) $/kW 1875 4658 3803
Plant LCOE $/MWh 58.6 123.3 112.1
Plant size – 100 MWg Unit 1 2 3
Total Capital Requirement (TCR) $/kW 3246 8480 6129
Plant LCOE $/MWh 106.2 219.7 197.6
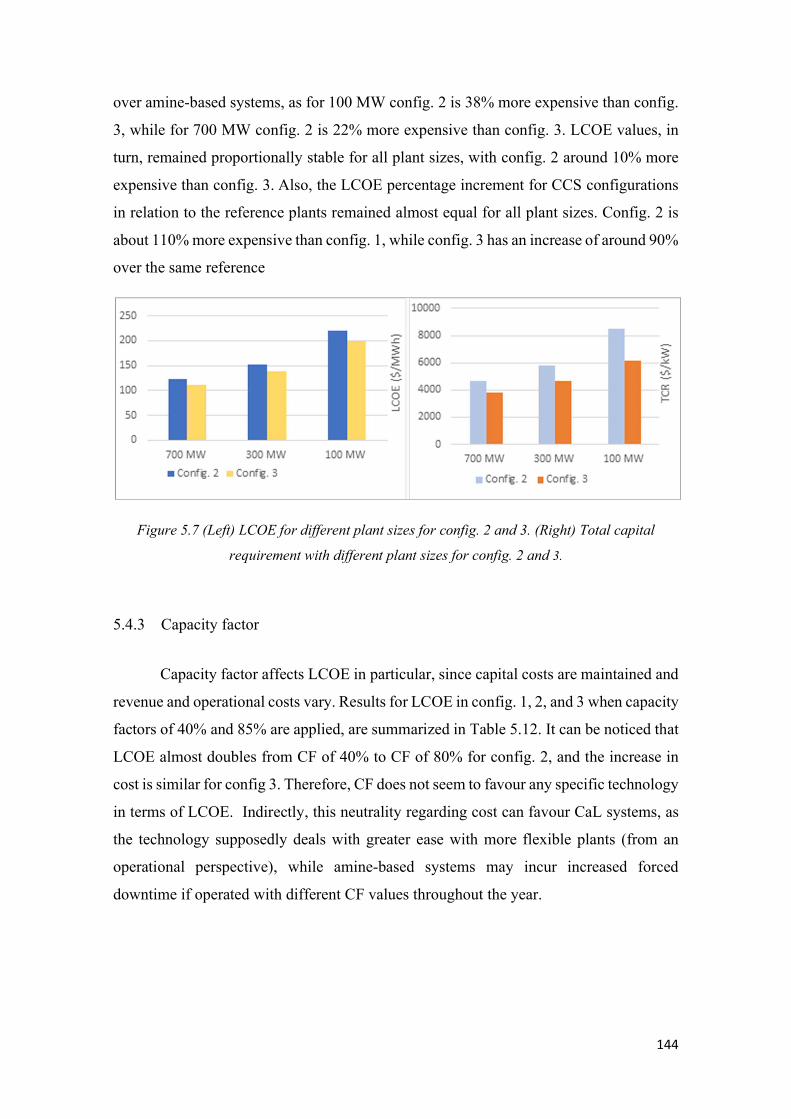
144
over amine-based systems, as for 100 MW config. 2 is 38% more expensive than config.
3, while for 700 MW config. 2 is 22% more expensive than config. 3. LCOE values, in
turn, remained proportionally stable for all plant sizes, with config. 2 around 10% more
expensive than config. 3. Also, the LCOE percentage increment for CCS configurations
in relation to the reference plants remained almost equal for all plant sizes. Config. 2 is
about 110% more expensive than config. 1, while config. 3 has an increase of around 90%
over the same reference
Figure 5.7 (Left) LCOE for different plant sizes for config. 2 and 3. (Right) Total capital
requirement with different plant sizes for config. 2 and 3.
5.4.3 Capacity factor
Capacity factor affects LCOE in particular, since capital costs are maintained and
revenue and operational costs vary. Results for LCOE in config. 1, 2, and 3 when capacity
factors of 40% and 85% are applied, are summarized in Table 5.12. It can be noticed that
LCOE almost doubles from CF of 40% to CF of 80% for config. 2, and the increase in
cost is similar for config 3. Therefore, CF does not seem to favour any specific technology
in terms of LCOE. Indirectly, this neutrality regarding cost can favour CaL systems, as
the technology supposedly deals with greater ease with more flexible plants (from an
operational perspective), while amine-based systems may incur increased forced
downtime if operated with different CF values throughout the year.

145
Table 5.12 Cost sensitivity analysis for capacity factor
5.4.4 Contingency factor
As seen in section 5.12, due to the current high uncertainty associated with the
CaL technology, an important cost component of these systems is the contingency cost
(process and project). Thus, it is also worth comparing costs of CaL and amine-based
configurations assuming both technologies have reached high technology maturity (TRL
9), with “N” plants constructed. If the cost of CaL systems remains significantly greater
than amine-based systems under these conditions, one can interpret as a strong sign the
technology will remain non-competitive compared with amine-based systems, regardless
of their level of maturity.
Table 5.13 displays LCOE, TCR, and costs of CO2 captured and avoided for
config. 2, 3, and 3FG+ considering equal contingency factors, equivalent to TRL 9. CaL
system has the lowest LCOE value among the simulated capture technologies. Regarding
TCR, config. 2 remains more expensive, but the difference decreases from 26% points to
a negligible 1% point plus compared with config. 3, and from 40% to 12% points plus
compared with config. 3FG+. For the cost of CO2 captured, config. 2 has an intermediate
value between the amine-based systems, while for CO2 avoided config. 2 has the lowest
cost among CCS configurations. Therefore, compared with the amine-based system, the
CaL process demonstrates advantages in LCOE and cost of CO2 avoided, and benefits
such as better thermodynamic performance, the larger amount of CO2 captured in the
plant location, lower plant-specific CO2 emission, and potential to re-power and operate
an existing plant with greater ease and flexibility.
CF – 40% Unit 1 2 3
Plant LCOE $/MWh 120.5 261.3 234.2
CF – 85% Unit 1 2 3
Plant LCOE $/MWh 66.1 136.6 124.9

146
Table 5.13 Cost results for NOAK CCS plants
Finally, results above indicate that continuous effort in R&D and CaL
demonstration and FOAK plants could help the technology to become economically
feasible against benchmark post-combustion capture technologies in the long-term, as
long as technology developers and investors pay present costs (currently higher for FOAK
plants) to build the necessary “N” plants that could bring costs down. Still, even for a
potential CaL NOAK plant, LCOE increased by 74% compared with a reference plant
without capture. Therefore, continuous effort to reduce the costs of CaL below the
expected values is paramount and involves more innovations and operational experience
with its two major capital cost components: the carbonator and the calciner.
NOAK Plant Unit 2 3 3FG+
Total Capital Requirement (TCR) $/kW 4570 4509 4085
Plant LCOE $/MWh 125.8 135.1 127.3
Cost of CO2 captured $/tonne CO2 49.5 56.3 45.8
Cost of CO2 avoided $/tonne CO2 68.9 87.7 77.4
147
6. Conclusions
This work aimed to evaluate technical and economic aspects of the emerging
capture technology known as calcium looping when applied for post-combustion CO2
capture in solid fuel combustion power plants, as well as its feasibility compared to more
conventional capture routes. Particularly, comparison analyses were conducted with the
state-of-the-art amine-based CO2 capture process, considered the benchmark capture
technology in post-combustion capture. Knowledge gaps in potential cost reduction due
to technology learning, water use, and space requirements, were recognized by reviewing
previous comparative studies with the calcium looping technology applied in large-scale
thermal power plants. The work objectives were then set to assess these gaps, plus the
applicability of the technology to capture-ready and/or existent plants. The feedstocks
selected were coal and sugarcane bagasse. From the author's knowledge, this is the first
detailed study on CaL for carbon capture developed in Brazil, including also the
evaluation of bagasse as a fuel.
Prior to the comparative analysis, however, a brief discussion in chapter 2 was
made over CCS demand, its general global status, and the main technologies for energy
generation and CO2 capture. In addition, technological maturity and suitability of the
capture routes to existent, new and capture-ready power plants were discussed, followed
by characterization of high-temperature solid looping cycles, chemical looping
technologies, and, finally, calcium looping technology. It was concluded that calcium
looping or CaL systems can be used as a post-combustion capture route and is a
technology suitable for retrofitting an existent power plant.
Also in chapter 2, a literature review of the calcium looping technology was made
describing the technical process for post-combustion, its main challenges and potential
advantages. Other promising applications of CaL and end uses for the purged sorbent
were briefly introduced. Regarding potential benefits, the possibility of re-powering a
power plant was highlighted as a unique feature among available capture technologies. In
addition, advantages from the use of subsystems that compose the CaL system and are in
a superior technology development stage, such as the ASU or CFB boilers, were
addressed, as these components have their own technology development path, apart from
the CaL technology. This can facilitate the scale-up of CaL systems.

148
Possible operational difficulties regarding the use of large scale solid-gas
processing plants with solids transportation between reactors were pointed out, as well as
potential challenges related to plant availability and sorbent attrition. However, absolutely
restrictive technical bottlenecks were not identified. Also, the integration with a base plant
was found to be potentially less complex than amine-based systems, which can enable the
steam cycles and capture plant to operate more independently and with greater flexibility.
Also, the current pilot plant experience was detailed to help to define the maturity level
of the technology, which was set as TRL 6, when applied to post-combustion, as of today.
Finally, relevant feedstock properties related to the operation of a CaL system were
discussed. The use of biomass as feedstock for CaL, though still with limited data and
only a few experimental tests on bench-scale (lower TRL than coal), was investigated
foreseeing the need for technologies with net negative emissions.
In chapter 3, mathematical modelling of the standard CaL system for post-
combustion was described, on the basis of experimentally validated performance models
published in other studies. The calculation procedure adopted by the Integrated
Environmental Control Model (IECM) software guided the model description, as this
software was used to conduct simulations for power plants with and without capture.
Mass and energy balance of the system were detailed, accounting for possible heat
integration using the CaL cycle heat streams and a secondary steam power cycle. Then,
reactors' design was discussed for carbonator and calciner based on semi-empirical
equations, pilot plant experience, and experience with CFB systems. The chapter also
discussed optimal operational and design parameters of a standard CaL plant, such as the
CO2 rich gas recirculation rate in the calciner (to reach a desired oxygen concentration in
the reactor), the optimal temperature in the reactors, superficial gas velocity in the reactor,
maximum cross-section area of reactors, the reaction kinetics of calcination and
carbonation and the expected sorbent carrying activity. The permanent equilibrium
analyses allowed the use of the simulator, by helping to define the appropriate inputs.
From the estimation of mass flows, they also allowed the evaluation of the plants’
footprints. Hence, the proposed models proved to be suitable for the aims of this study.
Chapter 4 presented the methodology and data applied for the comparative
analyses. Two feedstocks were selected for the cases modelled: bituminous coal and
sugarcane bagasse. The criteria behind the selection of these feedstocks involved the
dominant and wide use of coal in power plants, and particular aspects of the Brazilian

149
energy mix, which has sugarcane bagasse as an important energy vector for thermal
power plants. It was also shown that bagasse has further advantages over other biomasses
due to its inherent properties, which would likely allow its use in high calcination
temperatures and advanced steam cycles without negatively affecting the CaL system
operation with bed agglomeration, fouling, and ash fusion. The IECM broad use in
carbon capture comparative studies and its capabilities to evaluate CaL systems were then
introduced to justify its utilization for the plant simulations. The chapter also briefly
reviewed economic models for CaL systems and developed a cost method to estimate cost
uncertainty in emerging capture technologies, and, by doing so, differentiate costs for
FOAK and NOAK plants. The method consisted of applying appropriate contingency
factors to the capital cost of the capture unit, so that the uncertainty was in line with the
Technology Readiness Level of the evaluated post-combustion capture technology.
Finally, base configurations were defined to represent a reference plant and power plants
with CaL and amine-based CO2 capture. The simulations were conducted for supercritical
and subcritical CFPPs, as well as subcritical BFPPs. Sensitivity analyses were also
performed regarding fuel price, plant size, plant capacity factor, and contingency costs.
Technical results in chapter 5 were in agreement with literature values and
revealed the better thermodynamic performance of the CaL system. Not only the CaL
plant had a lower efficiency penalty - 3.3% in relation to the reference case, compared
with 9.4% and 10.8% of the amine-based configurations - but it has also shown a lower
specific emissions rate compared to the amine-based systems when the same capture rate
of 90% is applied to the flue gas. Furthermore, the additional generation capacity in the
base power plant with the retrofit of a CaL system was substantial, reaching a 72%
increase compared with the reference plant without capture in the simulation for a
supercritical CFPP. At the same time, the increase in required fuel input was 88% points.
Regarding economic results, it was seen that the CaL system is still highly
intensive in capital, not competing with amine-based systems when the current maturity
of the two technologies is considered (FOAK plants). Nevertheless, when the contingency
factors were low for both technologies (typical of NOAK plants), LCOE and cost of CO2
avoided favoured the CaL system technology. Among the other parameters varied in the
sensitivity analysis, plant size had the biggest influence in reducing CaL costs, which
indicates economies of scale. However, the costs increase in LCOE varied between 90%
and 120% compared with the reference plant with no capture. Even for a potential CaL

150
NOAK plant, LCOE increased by 74% points compared with a reference plant without
capture, which indicates the need for innovations and operational experience, particularly
in CaL systems’ two major capital cost components: the carbonator and the calciner.
Results for subcritical BFPP and CFPP were similar to what was obtained with the
supercritical CFPP. For the biomass-fired plant, the model worked properly and small
differences in solid circulation rates and solids residence time in reactors did not
compromise the operational parameters of the plant, that remained within reasonable
values. The cost analysis for the Bio-CaL adopted a process contingency factor greater
than for the CFPP cases, assuming biomass use in CaL systems is more incipient and
some of the equipment might need adaptations to receive biomass instead of coal.
Regarding water use, analyses were conducted in chapter 5 for withdrawal and
consumption parameters considering two typical water-cooling systems: once-through
and wet cooling tower. For both cooling systems, the addition of the CaL unit represented
a substantial increase in water use absolute values compared with the reference plant (in
some cases, more than twice the original value) and the amine-based systems. However,
the specific water use in m3/kWh was lower for the CaL system in all cases simulated.
Thus, a greater water use efficiency of the CaL system compared to amine-based systems
was demonstrated. This implies that if the addition of the capture unit is a retrofit to an
existent plant, - i.e. constructed without planning or preparing for the retrofit - the water
availability could be a restrictive aspect for CaL installation, even more than already is
for amine-based systems. On the other hand, if the plant is newly built or capture-ready,
and already accounts for the addition of a CO2 capture system in the present or sometime
in the future, the option for the CaL system could be preferable as it produces more energy
using less water.
For space requirements, it was seen that the CaL plant occupies a larger land
footprint due to the secondary steam cycle, but integration with the base plant could be
more flexible regarding the need for capture unit proximity, since there is no steam-
extraction from the primary steam cycle as in the amine-based system. In the CaL system,
the only integration with the base plant is the flue gas diverted from the stack. Besides,
some of the equipment required for the secondary steam cycle could be shared with
existing equipment of the primary cycle, so there is probably room for layout optimization
when applying CaL systems, and actual space requirements should be addressed in a case-
by-case basis.

151
Furthermore, the applicability of the CaL system cannot be discarded either for
greenfield, capture-ready, or brownfield scenarios (existent and without any pre-
modification to receive the capture plant). Nevertheless, it can be considered more
suitable for greenfield and/or capture-ready plants, as these can previously account for
the requirements regarding water, space, and additional fuel, which could be impeditive
for a brownfield plant.
Therefore, even though it is not possible to predict if calcium looping systems will
sometime in the near future become a disruptive capture technology, capable of
outperforming current state-of-the-art amine-based systems, there are clear advantages in
using these systems, markedly the lower efficiency penalty associated with additional
power generation. If capital costs of CaL are reduced, through sustained R&D and
technological learning, policy framework for investments, plant operation experience,
and scale-up, CaL systems could get closer to current advanced amine-based systems
regarding economic feasibility. Technically, the system is already feasible by using
relatively mature CFB power plant technology, even if there are operational challenges
to be faced.
Still, to enable more quantitative and precise cost and performance assessments
and confirm process advantages, it is important that this technology scales-up and reaches
a pilot or demonstration scale testing at a TRL 7 or higher, which could be a “dead valley”
for this emerging technology, as it will require large investments to build plants of tens
of MWth. Also, the demonstration of these technologies for biomass and other fuels needs
to be advanced to higher TRL.
For future work, the following subjects are recommended:
A study with a focus on developing learning rate curves for CaL systems,
accounting for the learning rate of individual components such as the carbonator
and the calciner;
A more detailed thermodynamic analysis, evaluating the minimal work of
separation of this technology based on the second law of thermodynamics;
Evaluation of chemical looping combustion (CLC) and other calcium looping
concepts such as calcination using pure oxygen or applied to pre-combustion
capture;

152
A study focused on industrial applications of CaL, such as cement and steel
production plants (possible integration with the industry sector and use of the
purged sorbent as a sealable product);
Project lifetime of power plants could be longer than certain equipment of the CaL
system, such as the calciner. The impact of a reduced lifetime of equipment in
CaL systems have not been assessed so far;
Operational plant commission, start-up, and shut-down procedures have not been
fully addressed in the literature;
A sensibility analysis focused on determining potential limitations for CaL
systems application regarding coal quality for high sulphur and ash content;
A comparative multicriteria analysis of the carbon capture technologies assessed
in this work with a focus on the 12 principles of Green Chemistry;
Comparison and determination of policies to enable emerging capture
technologies such as CaL against conventional capture and other low carbon
technologies;
Plant flexibility with CaL has only been addressed in a few preliminary studies.
These studies have pointed out possible advantages of the CaL system compared
with the amine-based system. However, much has to be learned about how
flexibility requirements will impact the efficiency and cost prospects of CaL.
Combinations with energy storage concepts also need to be investigated.

153
References
ABANADES, J. C., ARIAS, B., LYNGFELT, A., et al. "Emerging CO2 capture
systems", International Journal of Greenhouse Gas Control, v. 40, p. 126–166, 2015.
DOI: 10.1016/j.ijggc.2015.04.018. .
ACKIEWICZ, M., LITYNSKI, J., KEMPER, J., et al. "Technical Summary of Bioenergy
Carbon Capture and Storage ( BECCS )", Carbon Sequestration Leadership Forum,
p. 1–76, 2018. Disponível em:
https://www.cslforum.org/cslf/sites/default/files/documents/Publications/BECCS_Task_
Force_Report_2018-04-04.pdf.
ALONSO, M., DIEGO, M. E., PÉREZ, C., et al. "Biomass combustion with in situ CO2
capture by CaO in a 300kWth circulating fluidized bed facility", International Journal
of Greenhouse Gas Control, v. 29, p. 142–152, 2014. DOI: 10.1016/j.ijggc.2014.08.002.
Disponível em: http://dx.doi.org/10.1016/j.ijggc.2014.08.002.
ALONSO, M., RODRÍGUEZ, N., GRASA, G., et al. "Modelling of a fluidized bed
carbonator reactor to capture CO2 from a combustion flue gas", Chemical Engineering
Science, v. 64, n. 5, p. 883–891, 2009. DOI: 10.1016/j.ces.2008.10.044. .
ALONSO, Mónica, ARIAS, B., FERNÁNDEZ, J. R., et al. "Measuring attrition
properties of calcium looping materials in a 30 kW pilot plant", Powder Technology, v.
336, p. 273–281, 2018. DOI: 10.1016/j.powtec.2018.06.011. Disponível em:
https://doi.org/10.1016/j.powtec.2018.06.011.
AMEC FOSTER WHEELER ENERGIA OY. "Advanced Utility Cfb Technology for
Challenging New Solid Biomass Fuels", PowerGen Europe, p. 1–15, 2015.
ANEEL. BIG - Banco de Informações de Geração. 2020. Disponível em:
http://www2.aneel.gov.br/aplicacoes/capacidadebrasil/OperacaoCapacidadeBrasil.cfm.
Acesso em: 2 mar. 2020.
ARIAS, B., CRIADO, Y. A., SANCHEZ-BIEZMA, A., et al. "Oxy-fired fluidized bed
combustors with a flexible power output using circulating solids for thermal energy
storage", Applied Energy, v. 132, p. 127–136, 2014. DOI:
10.1016/j.apenergy.2014.06.074. Disponível em:

154
http://dx.doi.org/10.1016/j.apenergy.2014.06.074.
ARIAS, B., DIEGO, M. E., ABANADES, J. C., et al. "Demonstration of steady state
CO2 capture in a 1.7MWth calcium looping pilot", International Journal of
Greenhouse Gas Control, v. 18, p. 237–245, 2013. DOI: 10.1016/j.ijggc.2013.07.014.
Disponível em: http://dx.doi.org/10.1016/j.ijggc.2013.07.014.
ARIAS, Borja, ALONSO, M., ABANADES, C. "CO 2 Capture by Calcium Looping at
Relevant Conditions for Cement Plants: Experimental Testing in a 30 kW th Pilot Plant",
Industrial and Engineering Chemistry Research, v. 56, n. 10, p. 2634–2640, 2017.
DOI: 10.1021/acs.iecr.6b04617. .
ARIAS, Borja, DIEGO, M. E., MÉNDEZ, A., et al. "Operating Experience in la Pereda
1.7 MWth Calcium Looping Pilot", Energy Procedia, v. 114, p. 149–157, 2017. DOI:
10.1016/j.egypro.2017.03.1157. .
ARJUNWADKAR, A., BASU, P., ACHARYA, B. "A review of some operation and
maintenance issues of CFBC boilers", Applied Thermal Engineering, v. 102, p. 672–
694, 2016. DOI: 10.1016/j.applthermaleng.2016.04.008. Disponível em:
http://dx.doi.org/10.1016/j.applthermaleng.2016.04.008.
ASTOLFI, M., DE LENA, E., ROMANO, M. C. "Improved flexibility and economics of
Calcium Looping power plants by thermochemical energy storage", International
Journal of Greenhouse Gas Control, v. 83, n. October 2018, p. 140–155, 2019. DOI:
10.1016/j.ijggc.2019.01.023. Disponível em:
https://doi.org/10.1016/j.ijggc.2019.01.023.
ÁVILA, I., MORTARI, A., SANTOS, A. M., et al. "the Calcium Looping Cycle Study
for Capturing Carbon Dioxide Applied To the Energy Generation", Revista de
Engenharia Térmica, v. 12, n. 2, p. 28, 2013. DOI: 10.5380/reterm.v12i2.62041. .
AZZI, M., WHITE, S. Emissions from amine-based post-combustion CO 2 capture
plants. [S.l.], Elsevier Ltd, 2016. Disponível em: http://dx.doi.org/10.1016/B978-0-08-
100514-9.00020-2.
BAHADORI, A., ZAHEDI, G., ZENDEHBOUDI, S., et al. "Estimation of the effect of
biomass moisture content on the direct combustion of sugarcane bagasse in boilers",
International Journal of Sustainable Energy, v. 33, n. 2, p. 349–356, 2014. DOI:
10.1080/14786451.2012.748766.

155
BARKER, R. "The Reversibility of the Reaction CaCO3 to CaO + CO2", J. appl.
Biotechnol., v. 223, n. August, p. 733--742--, 1973.
BASTOS, J. B. V. Avaliação de Mecanismos de Incentivo à Cogeração de Energia a
partir do Bagaço da Cana de Açúcar em uma Planta Química Brasileira de Soda-
Cloro. 2011. 180 f. UFRJ, 2011.
BASU, P. Circulating fluidized bed boilers: Design, operation and maintenance. [S.l:
s.n.], 2015.
BASU, P. Combustion and Gasification in Fluidized Beds. [S.l.], CRC Press, 2006.
BEN ANTHONY, E. "Carbon Capture and Storage and Carbon Capture, Utilisation and
Storage", Issues in Environmental Science and Technology, v. 2018-Janua, n. 45, p.
198–215, 2018. DOI: 10.1039/9781788010115-00198. Disponível em:
https://www.iea.org/topics/carbon-capture-and-storage/. Acesso em: 27 nov. 2019.
BENNETT, S., STANLEY, T. "Commentary : US budget bill may help carbon capture
get back on track", n. March 2018, p. 1–8, 2019. Disponível em:
https://www.iea.org/newsroom/news/2018/march/commentary-us-budget-bill-may-
help-carbon-capture-get-back-on-track.html. Acesso em: 3 dez. 2019.
BERGMAN, P. C. A., BOERRIGTER, H., COMANS, R. N. J., et al.
"CONTRIBUTIONS ECN BIOMASS TO THE “12th EUROPEAN CONFERENCE
AND TECHNOLOGY EXHIBITION ON BIOMASS FOR ENERGY, INDUSTRY
AND CLIMATE PROTECTION”, … ECN BIOMASS TO THE “12th …, n. June,
2002. Disponível em: http://www.ecn.nl/docs/library/report/2002/rx02014.pdf#page=23.
BERSTAD, D., ANANTHARAMAN, R., JORDAL, K. "Post-combustion CO2 capture
from a natural gas combined cycle by CaO/CaCO3 looping", International Journal of
Greenhouse Gas Control, v. 11, p. 25–33, 2012. DOI: 10.1016/j.ijggc.2012.07.021.
Disponível em: http://dx.doi.org/10.1016/j.ijggc.2012.07.021.
BHOWN, A. S. "Status and analysis of next generation post-combustion CO2 capture
technologies", Energy Procedia, v. 63, n. 650, p. 542–549, 2014. DOI:
10.1016/j.egypro.2014.11.059. Disponível em:
http://dx.doi.org/10.1016/j.egypro.2014.11.059.
BP. BP Statistical Review of World Energy Statistical Review of World. The Editor
156
BP Statistical Review of World Energy. [S.l: s.n.], 2019. Disponível em:
https://www.bp.com/content/dam/bp/business-sites/en/global/corporate/pdfs/energy-
economics/statistical-review/bp-stats-review-2019-full-report.pdf.
BUI, M., DOWELL, N. Mac. Carbon Capture and Storage. Cambridge, Royal Society
of Chemistry, 2019. Disponível em:
http://ebook.rsc.org/?DOI=10.1039/9781788012744. Acesso em: 30 jan. 2020. (Energy
and Environment Series).
BUI, M., FAJARDY, M., DOWELL, N. Mac. "Thermodynamic Evaluation of Carbon
Negative Power Generation: Bio-energy CCS (BECCS)", Energy Procedia, v. 114, p.
6010–6020, 1 jul. 2017. DOI: 10.1016/j.egypro.2017.03.1736. Disponível em:
https://www.sciencedirect.com/science/article/pii/S1876610217319380. Acesso em: 4
dez. 2018.
BUTLER, J. Limestone as a sorbent for CO2 capture and its application in enhanced
biomass gasification. 2014. 279 f. 2014. Disponível em:
http://circle.ubc.ca/handle/2429/45680.
CALDECOTT, B., DERICKS, G., MITCHELL, J. Stranded Assets and Subcritical
Coal: The Risk to Companies and Investors. [S.l: s.n.], 2015. Disponível em:
https://ora.ox.ac.uk/objects/uuid:30c2bc1b-2ee4-4b04-9fa2-
767842a64805/download_file?file_format=pdf&safe_filename=2015.03.13_SA_and_S
C.pdf&type_of_work=Report.
CAO, Y., PAN, W. P. "Investigation of chemical looping combustion by solid fuels. 1.
Process analysis", Energy and Fuels, v. 20, n. 5, p. 1836–1844, 2006. DOI:
10.1021/ef050228d. .
CARBO, M. C., ABELHA, P. M. R., CIEPLIK, M. K., et al. "Fuel pre-processing, pre-
treatment and storage for co-firing of biomass and coal", Fuel Flexible Energy
Generation: Solid, Liquid and Gaseous Fuels, p. 121–143, 2016. DOI: 10.1016/B978-
1-78242-378-2.00005-5. .
CASTELO BRANCO, D. A., MOURA, M. C. P., SZKLO, A., et al. "Emissions reduction
potential from CO 2 capture: A life-cycle assessment of a Brazilian coal-fired power
plant", Energy Policy, v. 61, p. 1221–1235, 2013. DOI: 10.1016/j.enpol.2013.06.043.
Disponível em: http://dx.doi.org/10.1016/j.enpol.2013.06.043.

157
CENTENO-GONZÁLEZ, F. O., SILVA LORA, E. E., VILLA NOVA, H. F., et al. "CFD
modeling of combustion of sugarcane bagasse in an industrial boiler", Fuel, v. 193, p.
31–38, 2017. DOI: 10.1016/j.fuel.2016.11.105. .
CHANG, M. H., CHEN, W. C., HUANG, C. M., et al. "Design and Experimental Testing
of a 1.9MW th Calcium Looping Pilot Plant", Energy Procedia, v. 63, p. 2100–2108,
2014a. DOI: 10.1016/j.egypro.2014.11.226. Disponível em:
http://dx.doi.org/10.1016/j.egypro.2014.11.226.
CHANG, M. H., CHEN, W. C., HUANG, C. M., et al. "Design and Experimental Testing
of a 1.9MWth Calcium Looping Pilot Plant", Energy Procedia, v. 63, p. 2100–2108,
2014b. DOI: 10.1016/j.egypro.2014.11.226. Disponível em:
http://dx.doi.org/10.1016/j.egypro.2014.11.226.
CHEMENGONLINE. Chemical Engineering Plant Cost Index: 2018 Annual Value -
Chemical Engineering | Page 1. 2019. Disponível em:
https://www.chemengonline.com/2019-cepci-updates-january-prelim-and-december-
2018-final/. Acesso em: 7 mar. 2020.
CHENG, Z., QIN, L., FAN, J. A., et al. "New Insight into the Development of Oxygen
Carrier Materials for Chemical Looping Systems", Engineering, v. 4, n. 3, p. 343–351,
2018. DOI: 10.1016/j.eng.2018.05.002. Disponível em:
https://doi.org/10.1016/j.eng.2018.05.002.
CHOU, V., LYENGAR, A., SHAH, V., et al. "Cost and Performance Baseline for Fossil
Energy Plants Supplement: Sensitivity to CO2 capture Rate in Coal-Fired Power Plants",
p. 26, 2015.
CLARENS, F., ESPÍ, J. J., GIRALDI, M. R., et al. "Life cycle assessment of CaO looping
versus amine-based absorption for capturing CO2 in a subcritical coal power plant",
International Journal of Greenhouse Gas Control, v. 46, p. 18–27, 2016. DOI:
10.1016/j.ijggc.2015.12.031. Disponível em:
http://dx.doi.org/10.1016/j.ijggc.2015.12.031.
CMU EPP. Integrated Environmental Control Model (IECM). 2012. Disponível em:
https://www.cmu.edu/epp/iecm/index.html. Acesso em: 10 fev. 2019.
CNA, PECEGE- USP. Custos de Produção de Cana-de-Açúcar, Açúcar, Etanol e
Bioeletricidade no Brasil. . [S.l: s.n.], 2015.

158
COELHO JUNIOR, L. M., DA SILVA SEGUNDO, V. B., DOS SANTOS, N. A., et al.
"Carbon footprint of the generation of bioelectricity from sugarcane bagasse in a sugar
and ethanol industry", International Journal of Global Warming, v. 17, n. 3, p. 235,
2019. DOI: 10.1504/ijgw.2019.10020020.
CONSOLI, C. "Bioenergy and CCS 2019 Perspective", Global CCS Institute, n. c, p. 1–
14, 2019.
COPPOLA, A., MONTAGNARO, F., SALATINO, P., et al. "Attrition of limestone
during fluidized bed calcium looping cycles for CO 2 capture", Combustion Science and
Technology, v. 184, n. 7–8, p. 929–941, 2012. DOI: 10.1080/00102202.2012.663986.
CORMOS, A. M., CORMOS, C. C. "Investigation of hydrogen and power co-generation
based on direct coal chemical looping systems", International Journal of Hydrogen
Energy, v. 39, n. 5, p. 2067–2077, 2014. DOI: 10.1016/j.ijhydene.2013.11.123.
Disponível em: http://dx.doi.org/10.1016/j.ijhydene.2013.11.123.
CORMOS, A. M., SIMON, A. "Assessment of CO2 capture by calcium looping (CaL)
process in a flexible power plant operation scenario", Applied Thermal Engineering, v.
80, p. 319–327, 2015. DOI: 10.1016/j.applthermaleng.2015.01.059. Disponível em:
http://dx.doi.org/10.1016/j.applthermaleng.2015.01.059.
CORMOS, A. M., SIMON, A. "Dynamic modelling of CO2 capture by calcium-looping
cycle", Chemical Engineering Transactions, v. 35, p. 421–426, 2013. DOI:
10.3303/CET1335070. .
CORMOS, C. C., PETRESCU, L. "Evaluation of calcium looping as carbon capture
option for combustion and gasification power plants", Energy Procedia, v. 51, p. 154–
160, 2014. DOI: 10.1016/j.egypro.2014.07.017. Disponível em:
http://dx.doi.org/10.1016/j.egypro.2014.07.017.
CRAIG, K. R., MANN, M. K. "Cost and Performance Analysis of Biomass-Based
Integrated Gasification Combined-Cycle ( BIGCC ) Power Systems Cost and
Performance Analysis of Biomass-Based Integrated Gasification Combined-Cycle (
BIGCC ) Power Systems", Biomass, n. October, p. 1–70, 1996.
CRIADO, Y. A., ARIAS, B., ABANADES, J. C. "Calcium looping CO2 capture system
for back-up power plants", Energy and Environmental Science, v. 10, n. 9, p. 1994–
2004, 2017. DOI: 10.1039/c7ee01505d. .

159
CUI, H., ZHAO, T., WU, R. "An investment feasibility analysis of ccs retrofit based on
a two-stage compound real options model", Energies, v. 11, n. 7, 2018. DOI:
10.3390/en11071711. .
DA SILVA, F. T. F., CARVALHO, F. M., CORRÊA, J. L. G., et al. "CO2 capture in
ethanol distilleries in Brazil: Designing the optimum carbon transportation network by
integrating hubs, pipelines and trucks", International Journal of Greenhouse Gas
Control, v. 71, n. January, p. 168–183, 2018. DOI: 10.1016/j.ijggc.2018.02.018. .
DAI, J., SOKHANSANJ, S., GRACE, J. R., et al. "Overview and some issues related to
co-firing biomass and coal", Canadian Journal of Chemical Engineering, v. 86, n. 3,
p. 367–386, 2008. DOI: 10.1002/cjce.20052. .
DANTAS, G. A., LEGEY, L. F. L., MAZZONE, A. "Energy from sugarcane bagasse in
Brazil: An assessment of the productivity and cost of different technological routes",
Renewable and Sustainable Energy Reviews, v. 21, p. 356–364, 2013. DOI:
10.1016/j.rser.2012.11.080. Disponível em: http://dx.doi.org/10.1016/j.rser.2012.11.080.
DEAN, C. C., BLAMEY, J., FLORIN, N. H., et al. "The calcium looping cycle for CO2
capture from power generation, cement manufacture and hydrogen production",
Chemical Engineering Research and Design, v. 89, n. 6, p. 836–855, 2011. DOI:
10.1016/j.cherd.2010.10.013. .
DIAS, M. O. S., MODESTO, M., ENSINAS, A. V., et al. "Improving bioethanol
production from sugarcane: Evaluation of distillation, thermal integration and
cogeneration systems", Energy, v. 36, n. 6, p. 3691–3703, 2011. DOI:
10.1016/j.energy.2010.09.024. Disponível em:
http://dx.doi.org/10.1016/j.energy.2010.09.024.
DIEGO, M. E., ARIAS, B., ABANADES, J. C. "Evolution of the CO2carrying capacity
of CaO particles in a large calcium looping pilot plant", International Journal of
Greenhouse Gas Control, v. 62, n. April, p. 69–75, 2017. DOI:
10.1016/j.ijggc.2017.04.005. Disponível em:
http://dx.doi.org/10.1016/j.ijggc.2017.04.005.
DIEGO, M. Elena, ARIAS, B., ALONSO, M., et al. "The impact of calcium sulfate and
inert solids accumulation in post-combustion calcium looping systems", Fuel, v. 109, p.
184–190, 2013. DOI: 10.1016/j.fuel.2012.11.062. Disponível em:

160
http://dx.doi.org/10.1016/j.fuel.2012.11.062.
DIEGO, M. Elena, ARIAS, B., GRASA, G., et al. "Design of a novel fluidized bed reactor
to enhance sorbent performance in CO2 capture systems using CaO", Industrial and
Engineering Chemistry Research, v. 53, n. 24, p. 10059–10071, 2014. DOI:
10.1021/ie500630p. .
DIEGO, M.E., MARTÍNEZ, I., ALONSO, M., et al. Calcium looping reactor design
for fluidized-bed systems. [S.l.], Elsevier, 2015. Disponível em:
http://dx.doi.org/10.1016/B978-0-85709-243-4.00006-9.
DIETER, H, HAWTHORNE, C., BIDWE, A. R., et al. "The 200 kWth dual fluidized bed
calcium looping pilot plant for efficient CO2 capture: plant operating experiences and
results". 1, 2012. Anais [...] [S.l: s.n.], 2012. p. 397–404. Disponível em:
https://www.researchgate.net/publication/284813961_The_200_kWth_dual_fluidized_b
ed_calcium_looping_pilot_plant_for_efficient_CO2_capture_Plant_operating_experien
ces_and_results. Acesso em: 20 fev. 2020.
DIETER, Heiko, BIDWE, A. R., VARELA-DUELLI, G., et al. "Development of the
calcium looping CO2 capture technology from lab to pilot scale at IFK, University of
Stuttgart", Fuel, v. 127, p. 23–37, 2014. DOI: 10.1016/j.fuel.2014.01.063. Disponível em:
http://dx.doi.org/10.1016/j.fuel.2014.01.063.
ECN. Phyllis2 - Database for biomass and waste. 2013. Web Database. Disponível em:
https://www.ecn.nl/phyllis2/. Acesso em: 14 fev. 2019.
ENDESA. "CaOling project. Final publishable summary report", 2013. .
EPE. "Balanço energético nacional: Ano base 2018", EPE - Empresa de Pesquisa
Energética, p. 67, 2019. .
EPE. Empresa de Pesquisa Energética - Thermal Power Energy: Natural Gas,
Biomass, Coal, Nuclear (In Portuguese). [S.l: s.n.], 2017. Disponível em:
http://www.epe.gov.br/Documents/Energia Termelétrica - Online 13maio2016.pdf.
ERANS, M., JEREMIAS, M., MANOVIC, V., et al. "Operation of a 25 KWth calcium
looping pilot-plant with high oxygen concentrations in the calciner", Journal of
Visualized Experiments, v. 2017, n. 128, p. 1–10, 2017. DOI: 10.3791/56112. .
ETC. Mission Possible: Reaching Net-Zero Carbon Emissions from the Hard-to-

161
Abate Sectors by Mid-Century. . [S.l: s.n.], 2019. Disponível em: http://www.energy-
transitions.org/sites/default/files/ETC_MissionPossible_FullReport.pdf. Acesso em: 20
out. 2019.
EUROPEAN CENTRAL BANK. ECB euro reference exchange rate: US dollar
(USD). 2019. ECB/ Eurosystem policy and exchange rates. Disponível em:
https://www.ecb.europa.eu/stats/policy_and_exchange_rates/euro_reference_exchange_
rates/html/eurofxref-graph-usd.en.html. Acesso em: 7 mar. 2020.
EUROPEAN COMMISSION. Calcium looping CO2 capture technology with
extreme oxy- coal conditions in the calciner. . [S.l: s.n.], 2019.
FAN, F., LI, Z. S., CAI, N. S. "Experiment and modeling of CO2 capture from flue gses
at high temperature in a fluidized bed reactor with ca-based sorbents", Energy and Fuels,
v. 23, n. 1, p. 207–216, 2009. DOI: 10.1021/ef800474n. .
FAN, L., LI, F., RAMKUMAR, S. "Utilization of chemical looping strategy in coal
gasification processes", Particuology, v. 6, n. 3, p. 131–142, 2008. DOI:
10.1016/j.partic.2008.03.005. .
FAN, L. S. Chemical Looping Systems for Fossil Energy Conversions. [S.l: s.n.],
2010. Disponível em: https://www.wiley.com/en-
us/Chemical+Looping+Systems+for+Fossil+Energy+Conversions-p-9780470872529.
FAN, L. S., ZENG, L., WANG, W., et al. "Chemical looping processes for CO2 capture
and carbonaceous fuel conversion – prospect and opportunity", Energy and
Environmental Science, v. 5, n. 6, p. 7254–7280, 2012. DOI: 10.1039/c2ee03198a. .
FENNELL, P. S., ANTHONY, E. J. Calcium and Chemical Looping Technology for
Power Generation and Carbon Dioxide (CO2) Capture. [S.l.], Woodhead, 2015.
Disponível em: https://www.sciencedirect.com/book/9780857092434/calcium-and-
chemical-looping-technology-for-power-generation-and-carbon-dioxide-co2-capture.
Acesso em: 1 set. 2019.
FERON, P. H. M. Absorption-Based Post-combustion Capture of Carbon Dioxide.
[S.l: s.n.], 2016. Disponível em:
https://books.google.com.br/books?id=X5PBCQAAQBAJ&pg=PA765&lpg=PA765&d
q=cansolv+kinetics&source=bl&ots=ZSz3pPSED7&sig=ACfU3U220A-Y9fEpjJN-
pQIj4Gmxhwet9w&hl=pt-

162
BR&sa=X&ved=2ahUKEwjy6tXGuszmAhUqGrkGHfQWBIUQ6AEwCHoECAoQAQ
#v=onepage&q=cansolv kinetics&f=false. Acesso em: 4 jan. 2020.
FLORIN, N., FENNELL, P. CCR Land Footprint Review, IC 26. . [S.l: s.n.], 2011.
Disponível em:
https://www.gov.uk/government/uploads/system/uploads/attachment_data/file/43615/C
CR_guidance_-_Imperial_College_review.pdf.
FOUT, T., ZOELLE, A., KEAIRNS, D., et al. Cost and Performance Baseline for
Fossil Energy Plants Volume 1a: Bituminous Coal (PC) and Natural Gas to
Electricity Revision 3. National Energy Technology Laboratory (NETL). [S.l: s.n.],
2015. Disponível em: http://www.netl.doe.gov/File Library/Research/Energy
Analysis/Publications/Rev3Vol1aPC_NGCC_final.pdf.
FREEMAN, B. C., BHOWN, A. S. "Assessment of the technology readiness of post-
combustion CO2capture technologies", Energy Procedia, v. 4, p. 1791–1796, 2011.
DOI: 10.1016/j.egypro.2011.02.055. Disponível em:
http://dx.doi.org/10.1016/j.egypro.2011.02.055.
GARDARSDOTTIR, S. O., DE LENA, E., ROMANO, M., et al. "Comparison of
technologies for CO 2 capture from cement production—Part 2: Cost analysis", Energies,
v. 12, n. 3, 2019. DOI: 10.3390/en12030542. .
GLOBAL CCS INSTITUTE. Facilities - Global CCS Institute Database. 2020.
Disponível em: https://co2re.co/FacilityData. Acesso em: 4 set. 2020.
GLOBAL CCS INSTITUTE. Global CCS Institute Fact Sheet Capturing CO2. . [S.l:
s.n.], 2018a. Disponível em: https://www.globalccsinstitute.com/wp-
content/uploads/2018/12/Global-CCS-Institute-Fact-Sheet_Capturing-CO2.pdf. Acesso
em: 1 set. 2019.
GLOBAL CCS INSTITUTE. "The Global Status of CCS: 2017", p. 43, 2017. Disponível
em:
http://www.globalccsinstitute.com/sites/www.globalccsinstitute.com/files/uploads/globa
l-status/1-0_4529_CCS_Global_Status_Book_layout-WAW_spreads.pdf.
GLOBAL CCS INSTITUTE. "The Global Status os CCS 2018", p. 84, 2018b. Disponível
em: www.globalccsinstitute.com.

163
GLOBAL CCS INSTITUTE. "Water use in Thermal power Plants equipped with CO2
capture systems", p. 51, 2016. .
GRACE, J. R., CHAOUKI, J., PUGSLEY, T. Fluidized bed reactor. [S.l: s.n.], 2016.
GRASA, G. S., ABANADES, J. C. "CO2 capture capacity of CaO in long series of
carbonation/calcination cycles", Industrial and Engineering Chemistry Research, v.
45, n. 26, p. 8846–8851, 2006. DOI: 10.1021/ie0606946. .
HAAF, M., STROH, A., HILZ, J., et al. "Process Modelling of the Calcium Looping
Process and Validation Against 1 MWth Pilot Testing", Energy Procedia, v. 114, n.
November 2016, p. 167–178, 2017. DOI: 10.1016/j.egypro.2017.03.1159. Disponível
em: http://dx.doi.org/10.1016/j.egypro.2017.03.1159.
HAAF, Martin, HILZ, J., HELBIG, M., et al. "Assessment of the operability of a 20
MWth calcium looping demonstration plant by advanced process modelling",
International Journal of Greenhouse Gas Control, v. 75, n. May, p. 224–234, 2018.
DOI: 10.1016/j.ijggc.2018.05.014. Disponível em:
https://doi.org/10.1016/j.ijggc.2018.05.014.
HANAK, D., MANOVIC, V. "Calcium looping for decarbonisation of coal-fired power
plants Calcium looping for decarbonisation of coal-fired power plants Dawid P. Hanak *,
Vasilije Manovic Combustion and CCS Centre, Cranfield University,", n. November
2016.
HANAK, Dawid P., ANTHONY, E. J., MANOVIC, V. "A review of developments in
pilot-plant testing and modelling of calcium looping process for CO2 capture from power
generation systems", Energy and Environmental Science, v. 8, n. 8, p. 2199–2249,
2015. DOI: 10.1039/c5ee01228g. .
HANAK, Dawid P., BILIYOK, C., ANTHONY, E., et al. "Evaluation of a calcium
looping CO2capture plant retrofit to a coal-fired power plant". 38, 2016. Anais [...] [S.l.],
Elsevier Masson SAS, 2016. p. 2115–2120. DOI: 10.1016/B978-0-444-63428-3.50357-
X. Disponível em: http://dx.doi.org/10.1016/B978-0-444-63428-3.50357-X.
HANAK, Dawid P., BILIYOK, C., ANTHONY, E. J., et al. "A study of integration of
calcium looping CO 2 capture plant and coal-fired power plant", 2015a. .
HANAK, Dawid P., BILIYOK, C., ANTHONY, E. J., et al. "Modelling and comparison

164
of calcium looping and chemical solvent scrubbing retrofits for CO2 capture from coal-
fired power plant", International Journal of Greenhouse Gas Control, v. 42, p. 226–
236, 2015b. DOI: 10.1016/j.ijggc.2015.08.003. Disponível em:
http://dx.doi.org/10.1016/j.ijggc.2015.08.003.
HANAK, Dawid P., BILIYOK, C., MANOVIC, V. "Calcium looping with inherent
energy storage for decarbonisation of coal-fired power plant", Energy and
Environmental Science, v. 9, n. 3, p. 971–983, 2016. DOI: 10.1039/c5ee02950c. .
HANAK, Dawid P., ERANS, M., NABAVI, S. A., et al. "Technical and economic
feasibility evaluation of calcium looping with no CO2 recirculation", Chemical
Engineering Journal, v. 335, p. 763–773, 2018. DOI: 10.1016/j.cej.2017.11.022.
Disponível em: https://doi.org/10.1016/j.cej.2017.11.022.
HANAK, Dawid P., MANOVIC, V. "Calcium looping combustion for high-efficiency
low-emission power generation", Journal of Cleaner Production, v. 161, p. 245–255,
2017. DOI: 10.1016/j.jclepro.2017.05.080. Disponível em:
http://dx.doi.org/10.1016/j.jclepro.2017.05.080.
HANAK, Dawid P., MICHALSKI, S., MANOVIC, V. "From post-combustion carbon
capture to sorption-enhanced hydrogen production: A state-of-the-art review of carbonate
looping process feasibility", Energy Conversion and Management, v. 177, n. April, p.
428–452, 2018. DOI: 10.1016/j.enconman.2018.09.058. Disponível em:
https://doi.org/10.1016/j.enconman.2018.09.058.
HANAK, Dawid Piotr, MANOVIC, V., ANTHONY, E. J. "The future of Ca looping – A
review of developments", n. November, 2014. DOI: 10.13140/2.1.3638.8162. .
HE, D., QIN, C., MANOVIC, V., et al. "Study on the interaction between CaO-based
sorbents and coal ash in calcium looping process", Fuel Processing Technology, v. 156,
p. 339–347, 2017. DOI: 10.1016/j.fuproc.2016.09.017. Disponível em:
http://dx.doi.org/10.1016/j.fuproc.2016.09.017.
HELBIG, M., HILZ, J., HAAF, M., et al. "Long-term Carbonate Looping Testing in a 1
MW th Pilot Plant with Hard Coal and Lignite", Energy Procedia, v. 114, n. November
2016, p. 179–190, 2017. DOI: 10.1016/j.egypro.2017.03.1160. Disponível em:
http://dx.doi.org/10.1016/j.egypro.2017.03.1160.
HEPBURN, C., ADLEN, E., BEDDINGTON, J., et al. "The technological and economic

165
prospects for CO2 utilization and removal", Nature, v. 575, n. 7781, p. 87–97, 2019.
DOI: 10.1038/s41586-019-1681-6. Disponível em: http://dx.doi.org/10.1038/s41586-
019-1681-6.
HETLAND, J., YOWARGANA, P., LEDUC, S., et al. "Carbon-negative emissions:
Systemic impacts of biomass conversion. A case study on CO2 capture and storage
options", International Journal of Greenhouse Gas Control, v. 49, p. 330–342, 2016.
DOI: 10.1016/j.ijggc.2016.03.017. Disponível em:
http://dx.doi.org/10.1016/j.ijggc.2016.03.017.
HILLS, T. P., SCEATS, M. G., FENNELL, P. S., "Chapter 10: Applications of CCS in
the cement industry". RSC Energy and Environment Series, [S.l.], Royal Society of
Chemistry, 2020. v. 2020-Janua. p. 315–352. DOI: 10.1039/9781788012744-00315.
HILZ, J., HAAF, M., HELBIG, M., et al. "Scale-up of the carbonate looping process to
a 20 MWth pilot plant based on long-term pilot tests", International Journal of
Greenhouse Gas Control, v. 88, n. April, p. 332–341, 2019. DOI:
10.1016/j.ijggc.2019.04.026. Disponível em:
https://doi.org/10.1016/j.ijggc.2019.04.026.
HIRAMA, T., HOSODA, H., KITANO, K., et al. Method of separating carbon dioxide
from carbon dioxide containing gas and combustion apparatus having function to
separate carbon dioxide from the combustion gas. . [S.l: s.n.]. , 1994
HOFFMANN, B. S. O ciclo combinado com gaseificação integrada e a captura de
CO2: Uma solução para mitigar as emissôes de CO2 em termeletricas a carvão em
larga escala no curto prazo? 2010. 0–128 f. UFRJ, 2010.
HOFFMANN, B. S., SZKLO, A., SCHAEFFER, R. "Limits to co-combustion of coal
and eucalyptus due to water availability in the state of Rio Grande do Sul, Brazil", Energy
Conversion and Management, v. 87, p. 1239–1247, 2014. DOI:
10.1016/j.enconman.2014.01.062. Disponível em:
http://dx.doi.org/10.1016/j.enconman.2014.01.062.
HORNBERGER, M., SPÖRL, R., SCHEFFKNECHT, G. "Calcium Looping for CO2
Capture in Cement Plants - Pilot Scale Test", Energy Procedia, v. 114, n. November
2016, p. 6171–6174, 2017. DOI: 10.1016/j.egypro.2017.03.1754. Disponível em:
http://dx.doi.org/10.1016/j.egypro.2017.03.1754.

166
HU, J., GALVITA, V. V., POELMAN, H., et al. "Advanced chemical looping materials
for CO2 utilization: A review", Materials, v. 11, n. 7, 2018. DOI: 10.3390/ma11071187.
.
HUMBIRD, D., DAVIS, R., TAO, L., et al. "Process design and economics for
conversion of lignocellulosic biomass to ethanol", NREL technical report NREL/TP-
5100-51400, v. 303, n. May 2011, p. 275–3000, 2011. Disponível em:
http://www.nrel.gov/docs/fy11osti/51400.pdf%5Cnpapers2://publication/uuid/49A5007
E-9A58-4E2B-AB4E-4A4428F6EA66.
HURST, T. F., COCKERILL, T. T., FLORIN, N. H. "Life cycle greenhouse gas
assessment of a coal-fired power station with calcium looping CO2 capture and offshore
geological storage", Energy and Environmental Science, v. 5, n. 5, p. 7132–7150, 2012.
DOI: 10.1039/c2ee21204h. .
IEA. 20 Years of Carbon Capture and Storage. 20 Years of Carbon Capture and
Storage. [S.l: s.n.], 2016.
IEA. Carbon capture, utilisation and storage - A critical tool in the climate energy
toolbox. 2019a. Disponível em: https://www.iea.org/topics/carbon-capture-and-storage/.
Acesso em: 28 nov. 2019.
IEA. "Cement production", IEA ETSAP - Technology Brief, n. June, p. 138–139, 2010.
DOI: 10.18356/78df6b88-en-fr. .
IEA. Coal explained Coal prices and outlook. 2019b. Disponível em:
https://www.eia.gov/energyexplained/coal/prices-and-outlook.php. Acesso em: 4 mar.
2020.
IEA. Five keys to unlock CCS investment. . [S.l: s.n.], 2017a. Disponível em:
https://www.iea.org/media/topics/ccs/5KeysUnlockCCS.PDF%0Ahttp://www.iea.org/m
edia/topics/ccs/5KeysUnlockCCS.PDF.
IEA. Five keys to unlock CCS investment. . [S.l: s.n.], 2017b. Disponível em:
https://www.iea.org/media/topics/ccs/5KeysUnlockCCS.PDF.
IEA. Gaps: CCS applied to cement manufacturing. 2019c. Disponível em:
https://www.iea.org/topics/innovation/industry/gaps/ccs-applied-to-cement-
manufacturing-2.html. Acesso em: 22 out. 2019.

167
IEA. Gaps: Reduce the energy penalty and cost of CCUS capture. 2019d. Disponível
em: https://www.iea.org/topics/innovation/power/gaps/reduce-the-energy-penalty-and-
cost-of-ccus-capture.html. Acesso em: 20 out. 2019.
IEA. Geco 2019. 2019e. International Energy Agency Website. Disponível em:
https://www.iea.org/geco/. Acesso em: 1 set. 2019.
IEA. Power. 2019f. Disponível em: https://www.iea.org/topics/innovation/power/.
Acesso em: 15 out. 2019.
IEA. Tracking Power, IEA, Paris. 2019g. Disponível em:
https://www.iea.org/reports/tracking-power-2019/coal-fired-power. Acesso em: 9 mar.
2020.
IEAGHG. ASSESSMENT OF EMERGING CO 2 CAPTURE TECHNOLOGIES
AND THEIR POTENTIAL TO Report : 2014 / TR4 December 2014. . [S.l: s.n.],
2014a.
IEAGHG. Assessment of Emerging CO2 Capture Technologies and Their Potential.
. [S.l: s.n.], 2014b. Disponível em: https://ieaghg.org/docs/General_Docs/Reports/2014-
TR4.pdf. Acesso em: 20 out. 2019.
IEAGHG. Potential for Biomass and Carbon Dioxide Capture and Storage. Ieaghg.
[S.l: s.n.], 2011. Disponível em: www.ieaghg.org.
INTERCEPT. The Environmental Left Is Softening on Carbon Capture Tech. 2019.
Disponível em: https://theintercept.com/2019/09/20/carbon-capture-technology-unions-
labor/. Acesso em: 15 out. 2019.
INTERNATIONAL ENERGY AGENCY. "Carbon Dioxide Capture in the Cement
Industry", n. July, p. 1–180, 2008. Disponível em:
http://hub.globalccsinstitute.com/sites/default/files/publications/95751/co2-capture-
cement-industrypdf.pdf.
IPCC. 2. Mitigation Pathways. Global Warming of 1.5°C. [S.l: s.n.], 2018a.
IPCC. Special Report on the impacts of global warming of 1.5oC - Summary for
Policymakers. . [S.l: s.n.], 2018b. Disponível em:
https://www.ipcc.ch/sr15/chapter/summary-for-policy-makers/.

168
IPCC. Summary for Policymakers - Global warming of 1.5oC, an IPCC special
report. [S.l: s.n.], 2019. Disponível em:
https://www.researchgate.net/publication/329866816_Summary_for_Policymakers_In_
Global_warming_of_15C_An_IPCC_Special_Report%0Ahttps://www.ipcc.ch/sr15/cha
pter/spm/.
JANTTI, T. "Advanced CFB technology for large scale biomass firing power plants.",
Bioenergy from Forest, 2012. .
JENKINS, S. CEPCI Updates: January 2018 (prelim.) and December 2017 (final) -
Chemical Engineering | Page 1. 2018. Chemengonline. Disponível em:
https://www.chemengonline.com/cepci-updates-january-2018-prelim-and-december-
2017-final/?printmode=1. Acesso em: 16 fev. 2020.
JUNK, M., KREMER, J., STRÖHLE, J., et al. "Design of a 20 MWth carbonate looping
pilot plant for CO2-capture of coal fired power plants by means of limestone", Energy
Procedia, v. 63, p. 2178–2189, 2014. DOI: 10.1016/j.egypro.2014.11.237. Disponível
em: http://dx.doi.org/10.1016/j.egypro.2014.11.237.
KANNICHE, M., LE MOULLEC, Y., AUTHIER, O., et al. "Up-to-date CO2 Capture in
Thermal Power Plants", Energy Procedia, v. 114, n. July, p. 95–103, 2017. DOI:
10.1016/j.egypro.2017.03.1152. Disponível em:
http://dx.doi.org/10.1016/j.egypro.2017.03.1152.
KEITH, D. W., REINELT, S. "Carbon Capture Retrofits and the Cost of Regulatory
Uncertainty", Energy Journal, v. 28, n. 4, p. 101–127, 2009. .
KHAN, A. A., DE JONG, W., JANSENS, P. J., et al. "Biomass combustion in fluidized
bed boilers: Potential problems and remedies", Fuel Processing Technology, v. 90, n. 1,
p. 21–50, 2009. DOI: 10.1016/j.fuproc.2008.07.012. Disponível em:
http://dx.doi.org/10.1016/j.fuproc.2008.07.012.
KHATIWADA, D., LEDUC, S., SILVEIRA, S., et al. "Optimizing ethanol and
bioelectricity production in sugarcane biorefineries in Brazil", Renewable Energy, v. 85,
p. 371–386, 2016. DOI: 10.1016/j.renene.2015.06.009. Disponível em:
http://dx.doi.org/10.1016/j.renene.2015.06.009.
KNOWLTON, T. M. "Tools and Techniques for Diagnosing and Solving Operating
Problems in Fluidized Bed Systems", Oil and Gas Science and Technology, v. 55, n. 2,

169
p. 209–217, 2000. DOI: 10.2516/ogst:2000013. .
KRZEMIEŃ, A., WIĘCKOL-RYK, A., DUDA, A., et al. "Risk Assessment of a Post-
Combustion and Amine-Based CO 2 Capture Ready Process", Journal of Sustainable
Mining, v. 12, n. 4, p. 18–23, 2013. DOI: 10.7424/jsm130404. .
KUNII, D., LEVENSPIEL, O. "Circulating fluidized-bed reactors", Chemical
Engineering Science, v. 52, n. 15, p. 2471–2482, 1997. DOI: 10.1016/S0009-
2509(97)00066-3. .
KURSUN, B., RAMKUMAR, S., BAKSHI, B. R., et al. "Life cycle comparison of coal
gasification by conventional versus calcium looping processes", Industrial and
Engineering Chemistry Research, v. 53, n. 49, p. 18910–18919, 2014. DOI:
10.1021/ie404436a. .
LARA, Y., ROMEO, L. M. "On the Flexibility of Coal-fired Power Plants with Integrated
Ca-looping CO2 Capture Process", Energy Procedia, v. 114, n. July, p. 6552–6562,
2017. DOI: 10.1016/j.egypro.2017.03.1791. Disponível em:
http://dx.doi.org/10.1016/j.egypro.2017.03.1791.
LASHERAS, A., STRÖHLE, J., GALLOY, A., et al. "Carbonate looping process
simulation using a 1D fluidized bed model for the carbonator", International Journal of
Greenhouse Gas Control, v. 5, n. 4, p. 686–693, 2011. DOI:
10.1016/j.ijggc.2011.01.005. Disponível em:
http://dx.doi.org/10.1016/j.ijggc.2011.01.005.
LI, F., ZENG, L., FAN, L. S. "Biomass direct chemical looping process: Process
simulation", Fuel, v. 89, n. 12, p. 3773–3784, 2010. DOI: 10.1016/j.fuel.2010.07.018.
Disponível em: http://dx.doi.org/10.1016/j.fuel.2010.07.018.
LI, Z. S., CAI, N. S., CROISET, E. "Process analysis of CO2 capture from flue gas using
carbonation/calcination cycles", AIChE Journal, v. 54, n. 7, p. 1912–1925, 2008. DOI:
10.1002/aic.11486. .
LIVINGSTON, W., MIDDLEKAMP, J., WILLEBOER, W., et al. "The status of large
scale biomass firing", p. 1–88, 2016. Disponível em:
http://www.ieabcc.nl/publications/IEA_Bioenergy_T32_cofiring_2016.pdf.
LUIS, P. "Use of monoethanolamine (MEA) for CO 2 capture in a global scenario:

170
Consequences and alternatives", Desalination, v. 380, p. 93–99, 2016. DOI:
10.1016/j.desal.2015.08.004. Disponível em:
http://dx.doi.org/10.1016/j.desal.2015.08.004.
LYNGFELT, A., LECKNER, B. "A 1000 MWth boiler for chemical-looping combustion
of solid fuels – Discussion of design and costs", Applied Energy, v. 157, p. 475–487,
2015. DOI: 10.1016/j.apenergy.2015.04.057. Disponível em:
http://dx.doi.org/10.1016/j.apenergy.2015.04.057.
LYNGFELT, A., LECKNER, B., MATTISSON, T. "A fluidized-bed combustion process
with inherent CO2 separation; Application of chemical-looping combustion", Chemical
Engineering Science, v. 56, n. 10, p. 3101–3113, 2001. DOI: 10.1016/S0009-
2509(01)00007-0. .
LYNGFELT, A., LINDERHOLM, C. "Chemical-Looping Combustion of Solid Fuels -
Status and Recent Progress", Energy Procedia, v. 114, n. November 2016, p. 371–386,
2017. DOI: 10.1016/j.egypro.2017.03.1179. Disponível em:
http://dx.doi.org/10.1016/j.egypro.2017.03.1179.
MACIEJEWSKA, A., VERINGA, H., SANDERS, J., et al. Co-Firing of Biomass With
Coal: Constraints and Role of Biomass Pre-Treatment. Institute for Energy. [S.l:
s.n.], 2006.
MANTRIPRAGADA, H. C., RUBIN, E. S. "Calcium looping cycle for CO2 capture:
Performance, cost and feasibility analysis", Energy Procedia, v. 63, p. 2199–2206, 2014.
DOI: 10.1016/j.egypro.2014.11.239. Disponível em:
http://dx.doi.org/10.1016/j.egypro.2014.11.239.
MANTRIPRAGADA, H. C., RUBIN, E. S. "Chemical Looping Combustion for Pre-
combustion CO2 Capture", n. September, p. 58, 2012. Disponível em:
http://www.cmu.edu/epp/iecm/documentation/IECM CLC Tech Report -
09_27_2012.pdf.
MANTRIPRAGADA, H. C., RUBIN, E. S. "Chemical Looping for Pre-combustion and
Post-combustion CO2 Capture", Energy Procedia, v. 114, n. November 2016, p. 6403–
6410, 2017a. DOI: 10.1016/j.egypro.2017.03.1776. Disponível em:
http://dx.doi.org/10.1016/j.egypro.2017.03.1776.
MANTRIPRAGADA, H. C., RUBIN, E. S. "IECM Technical Documentation: Calcium

171
Looping Cycle for Post-Combustion CO2 Capture", n. November, 2017b. .
MANTRIPRAGADA, H. C., ZHAI, H., RUBIN, E. S. "Boundary Dam or Petra Nova –
Which is a better model for CCS energy supply?", International Journal of Greenhouse
Gas Control, v. 82, n. December 2018, p. 59–68, 2019a. DOI:
10.1016/j.ijggc.2019.01.004. Disponível em:
https://doi.org/10.1016/j.ijggc.2019.01.004.
MANTRIPRAGADA, H. C., ZHAI, H., RUBIN, E. S. "Boundary Dam or Petra Nova –
Which is a better model for CCS energy supply?", International Journal of Greenhouse
Gas Control, v. 82, n. October 2018, p. 59–68, 2019b. DOI: 10.1016/j.ijggc.2019.01.004.
Disponível em: https://doi.org/10.1016/j.ijggc.2019.01.004.
MARÍA ERANS MORENO. "Enhanced Sorbents for the Calcium Looping Cycle and
Effects of High Oxygen Concentrations in the Calciner", Cranfield University, n. May
2017, p. 2017–2018, 2017. .
MARQUES, F. Bagasse is the target | Revista Pesquisa Fapesp. 2011. Pesquisa
FAPESP. Disponível em: https://revistapesquisa.fapesp.br/en/2011/04/20/bagasse-is-the-
target-2/. Acesso em: 14 fev. 2020.
MARTÍNEZ, I., ARIAS, B., GRASA, G. S., et al. "CO2 capture in existing power plants
using second generation Ca-Looping systems firing biomass in the calciner", Journal of
Cleaner Production, v. 187, p. 638–649, 2018. DOI: 10.1016/j.jclepro.2018.03.189. .
MARTÍNEZ, I., GRASA, G., MURILLO, R., et al. "Modelling the continuous
calcination of CaCO3 in a Ca-looping system", Chemical Engineering Journal, v. 215–
216, p. 174–181, 2013. DOI: 10.1016/j.cej.2012.09.134. .
MARTÍNEZ, I., MURILLO, R., GRASA, G., et al. "Integration of a Ca-looping system
for CO2 capture in an existing power plant", Energy Procedia, v. 4, p. 1699–1706,
2011a. DOI: 10.1016/j.egypro.2011.02.043. .
MARTÍNEZ, I., MURILLO, R., GRASA, G., et al. "Integration of a Ca-looping system
for CO2capture in an existing power plant", Energy Procedia, v. 4, p. 1699–1706, 2011b.
DOI: 10.1016/j.egypro.2011.02.043. Disponível em:
http://dx.doi.org/10.1016/j.egypro.2011.02.043.
MARTÍNEZ, Isabel, GRASA, G., PARKKINEN, J., et al. "Review and research needs

172
of Ca-Looping systems modelling for post-combustion CO2 capture applications",
International Journal of Greenhouse Gas Control, v. 50, p. 271–304, 2016. DOI:
10.1016/j.ijggc.2016.04.002. Disponível em:
http://dx.doi.org/10.1016/j.ijggc.2016.04.002.
MARX-SCHUBACH, T., SCHMITZ, G. "Modeling and simulation of the start-up
process of coal fired power plants with post-combustion CO2 capture", International
Journal of Greenhouse Gas Control, v. 87, n. April, p. 44–57, 2019. DOI:
10.1016/j.ijggc.2019.05.003. Disponível em:
https://doi.org/10.1016/j.ijggc.2019.05.003.
MATUSZEWSKI, M. Cost and Performance for Low-Rank Pulverized Coal
Oxycombustion Energy Plants. . [S.l: s.n.], 2010.
MERROW, E. "Linking R&D to problems experienced in solids processing", 1984.
Disponível em: https://apps.dtic.mil/docs/citations/ADA154238. Acesso em: 19 fev.
2020.
MERSCHMANN, VASQUEZ, E., SZKLO, A. S., et al. "Modeling water use demands
for thermoelectric power plants with CCS in selected Brazilian water basins",
International Journal of Greenhouse Gas Control, v. 13, p. 87–101, 2013. DOI:
10.1016/j.ijggc.2012.12.019. Disponível em:
http://dx.doi.org/10.1016/j.ijggc.2012.12.019.
MERSCHMANN, SZKLO, SCHAEFFER, "Technical potential and abatement costs
associated with the use of process emissions from sugarcane ethanol distilleries for EOR
in offshore fields in Brazil", International Journal of Greenhouse Gas Control, v. 52,
p. 270–292, 2016. DOI: 10.1016/j.ijggc.2016.07.007. Disponível em:
http://dx.doi.org/10.1016/j.ijggc.2016.07.007.
METZ, DAVIDSON, O., LOOS, M., et al. The IPCC special report on carbon dioxide
capture and storage. [S.l: s.n.], 2005.
MICHALSKI, S., HANAK, D. P., MANOVIC, V. "Techno-economic feasibility
assessment of calcium looping combustion using commercial technology appraisal tools",
Journal of Cleaner Production, v. 219, p. 540–551, 2019. DOI:
10.1016/j.jclepro.2019.02.049. Disponível em:
https://doi.org/10.1016/j.jclepro.2019.02.049.

173
MIT. Carbon Capture and Sequestration Technologies Database. 2009. Disponível
em: http://sequestration.mit.edu/tools/projects/wa_parish.html. Acesso em: 23 out. 2019.
MOGHTADERI, B. "Review of the recent chemical looping process developments for
novel energy and fuel applications", Energy and Fuels, v. 26, n. 1, p. 15–40, 2012. DOI:
10.1021/ef201303d. .
MONTAGNARO, F., SALATINO, P., SCALA, F. "The influence of temperature on
limestone sulfation and attrition under fluidized bed combustion conditions",
Experimental Thermal and Fluid Science, v. 34, n. 3, p. 352–358, 2010. DOI:
10.1016/j.expthermflusci.2009.10.013. Disponível em:
http://dx.doi.org/10.1016/j.expthermflusci.2009.10.013.
MOORE, C. C. S., KULAY, L. "Effect of the implementation of carbon capture systems
on the environmental, energy and economic performance of the Brazilian electricity
matrix", Energies, v. 12, n. 2, 2019. DOI: 10.3390/en12020331. .
MOREIRA, J. R., ROMEIRO, V., FUSS, S., et al. "BECCS potential in Brazil: Achieving
negative emissions in ethanol and electricity production based on sugar cane bagasse and
other residues", Applied Energy, v. 179, p. 55–63, 1 out. 2016. DOI:
10.1016/j.apenergy.2016.06.044. Disponível em:
https://www.sciencedirect.com/science/article/pii/S0306261916308194. Acesso em: 9
dez. 2018.
MUKHERJEE, S., KUMAR, P., YANG, A., et al. "Energy and exergy analysis of
chemical looping combustion technology and comparison with pre-combustion and oxy-
fuel combustion technologies for CO<inf>2</inf> capture", Journal of Environmental
Chemical Engineering, v. 3, n. 3, p. 2104–2114, 2015. DOI: 10.1016/j.jece.2015.07.018.
Disponível em: http://dx.doi.org/10.1016/j.jece.2015.07.018.
NIU, Y., TAN, H., HUI, S. "Ash-related issues during biomass combustion: Alkali-
induced slagging, silicate melt-induced slagging (ash fusion), agglomeration, corrosion,
ash utilization, and related countermeasures", Progress in Energy and Combustion
Science, v. 52, p. 1–61, 2016. DOI: 10.1016/j.pecs.2015.09.003. Disponível em:
http://dx.doi.org/10.1016/j.pecs.2015.09.003.
NUORTIMO, K., ERIKSSON, T., NEVALAINEN, T. "Large scale utility CFB
technology in worlds largest greenfield 100% biomass power plant", European Biomass

174
Conference and Exhibition Proceedings, v. 2017, n. 25thEUBCE, p. 1920–1925, 2017.
.
NYKO, D., BRANDÃO, R., FARIA, A. Y., et al. "Determinantes do baixo
aproveitamento do potencial elétrico do setor sucroenergético : uma pesquisa de campo",
BNDES Setorial, v. 33, p. 18, 2011. .
OLHOFF, A. "Emissions Gap Report 2018 Key Messages". 2018. Anais [...] [S.l: s.n.],
2018. p. 1–20. Disponível em:
http://wedocs.unep.org/bitstream/handle/20.500.11822/26896/EGR-
KEYMESSAGES_2018.pdf?sequence=1&isAllowed=y. Acesso em: 1 set. 2019.
ORTIZ, C., CHACARTEGUI, R., VALVERDE, J. M., et al. "A new model of the
carbonator reactor in the calcium looping technology for post-combustion CO2 capture",
Fuel, v. 160, p. 328–338, 2015. DOI: 10.1016/j.fuel.2015.07.095. Disponível em:
http://dx.doi.org/10.1016/j.fuel.2015.07.095.
OZCAN, D. C., BOCCIARDO, D., FERRARI, M. C., et al. "Comparison of various
carbon capture technologies to reduce CO2 emissions from a cement plant", CO2
Capture 2013 - Topical Conference at the 2013 AIChE Annual Meeting: Global
Challenges for Engineering a Sustainable Future, n. November, p. 133, 2013. .
OZCAN, Dursun Can. "Techno-Economic Study for the Calcium Looping Process for
CO2 Capture from Cement and Biomass Power Plants", PhD Thesis, School of
Engineering, The University of Edinburgh, n. November, 2014. DOI:
10.1016/j.enconman.2015.01.060. Disponível em:
http://dx.doi.org/10.1016/j.wasman.2011.12.015%5Cnhttp://www.scopus.com/inward/r
ecord.url?eid=2-s2.0-
79954467269&partnerID=40&md5=5efec8df756a4f4a00a90a8de29bd559%5Cnhttp://u
petd.up.ac.za/thesis/available/etd-07022009-133535/unrestricted/dissertation.pdf.
OZCAN, ALONSO, AHN, et al. "Process and cost analysis of a biomass power plant
with in situ calcium loopingCO2 capture process", Industrial and Engineering
Chemistry Research, v. 53, n. 26, p. 10721–10733, 2014. DOI: 10.1021/ie500606v. .
OZCAN, BOCCIARDO, FERRARI, et al. "Comparison of various carbon capture
technologies to reduce CO2 emissions from a cement plant". 2013. Anais [...] [S.l: s.n.],
2013. p. 133.

175
PARKKINEN, J., MYÖHÄNEN, K., ABANADES, J. C., et al. "Modelling a Calciner
with High Inlet Oxygen Concentration for a Calcium Looping Process", Energy
Procedia, v. 114, n. November 2016, p. 242–249, 2017. DOI:
10.1016/j.egypro.2017.03.1166. Disponível em:
http://dx.doi.org/10.1016/j.egypro.2017.03.1166.
PAWLAK-KRUCZEK, H., BARANOWSKI, M. "Effectiveness of CO2 Capture by
Calcium Looping with Regenerated Calcium Sorbents - Last Step Calcination", Energy
Procedia, v. 105, p. 4499–4512, 2017. DOI: 10.1016/j.egypro.2017.03.962. Disponível
em: http://dx.doi.org/10.1016/j.egypro.2017.03.962.
PELLEGRINI, L. F., DE OLIVEIRA JÚNIOR, S., BURBANO, J. C. "Supercritical
steam cycles and biomass integrated gasification combined cycles for sugarcane mills",
Energy, v. 35, n. 2, p. 1172–1180, 2010. DOI: 10.1016/j.energy.2009.06.011. .
PEREJÓN, A., ROMEO, L. M., LARA, Y., et al. "The Calcium-Looping technology for
CO2 capture: On the important roles of energy integration and sorbent behavior",
Applied Energy, v. 162, p. 787–807, 2016. DOI: 10.1016/j.apenergy.2015.10.121. .
PILLAI, B. B. K., SURYWANSHI, G. D., PATNAIKUNI, V. S., et al. "Performance
analysis of a double calcium looping-integrated biomass-fired power plant: Exploring a
carbon reduction opportunity", International Journal of Energy Research, n.
December 2018, p. 5301–5318, 2019. DOI: 10.1002/er.4520. .
RENTIZELAS, A. A. Biomass storage. [S.l.], Elsevier Ltd, 2016. Disponível em:
http://dx.doi.org/10.1016/B978-1-78242-366-9.00006-X.
RITTER, B. C. Projeto Conceitual de uma termelétrica a biomassa com captura de
carbono. 2019. 2019. Disponível em:
http://monografias.poli.ufrj.br/monografias/monopoli10028333.pdf.
ROCHEDO, Pedro R.R., COSTA, I. V. L., IMPÉRIO, M., et al. "Carbon capture potential
and costs in Brazil", Journal of Cleaner Production, v. 131, p. 280–295, 2016. DOI:
10.1016/j.jclepro.2016.05.033. .
ROCHEDO, Pedro Rua Rodriguez. Análise Econômica Sob Incerteza Da Captura De
Carbono Em Termoelétricas a Carvão: Retrofitting E Capture-Ready. 2011. 362 f.
UFRJ, 2011.

176
RODRIGUEZ, ALONSO, M., ABANADES, J. C. "Experimental Investigation of a
Circulating Fluidized-Bed Reactor to Capture CO2 with CaO", AICHE Journal, v. 57,
p. 1356–1366, 2011. DOI: 10.1002/aic.12337. .
RODRIGUEZ, N., ALONSO, M., ABANADES, J. C., et al. "Comparison of
experimental results from three dual fluidized bed test facilities capturing CO2 with
CaO", Energy Procedia, v. 4, p. 393–401, 2011. DOI: 10.1016/j.egypro.2011.01.067. .
RODRÍGUEZ, N., ALONSO, M., ABANADES, J. C. "Average activity of CaO particles
in a calcium looping system", Chemical Engineering Journal, v. 156, n. 2, p. 388–394,
2010. DOI: 10.1016/j.cej.2009.10.055. .
ROLFE, A., HUANG, Y., HAAF, M., et al. "Integration of the calcium carbonate looping
process into an existing pulverized coal-fired power plant for CO2 capture: Techno-
economic and environmental evaluation", Applied Energy, v. 222, n. January, p. 169–
179, 2018. DOI: 10.1016/j.apenergy.2018.03.160. Disponível em:
https://doi.org/10.1016/j.apenergy.2018.03.160.
ROLFE, A., HUANG, Y., HAAF, M., et al. "Techno-economic and Environmental
Analysis of Calcium Carbonate Looping for CO2 Capture from a Pulverised Coal-Fired
Power Plant", Energy Procedia, v. 142, p. 3447–3453, 2017. DOI:
10.1016/j.egypro.2017.12.228. Disponível em:
https://doi.org/10.1016/j.egypro.2017.12.228.
ROMANO, M. C. "Modeling the carbonator of a Ca-looping process for CO 2 capture
from power plant flue gas", Chemical Engineering Science, v. 69, n. 1, p. 257–269,
2012. DOI: 10.1016/j.ces.2011.10.041. Disponível em:
http://dx.doi.org/10.1016/j.ces.2011.10.041.
ROMANO, M. C., MARTÍNEZ, I., MURILLO, R., et al. "Process simulation of Ca-
looping processes: Review and guidelines", Energy Procedia, v. 37, n. i, p. 142–150,
2013. DOI: 10.1016/j.egypro.2013.05.095. Disponível em:
http://dx.doi.org/10.1016/j.egypro.2013.05.095.
ROMANO, M., MARTÍNEZ, I., MURILLO, R., et al. Guidelines for modeling and
simulation of Ca-looping processes. Prepared for the European Energy Research
Alliance. Sintef.No. [S.l: s.n.], 2012. Disponível em:
http://www.sintef.no/project/EERA-CCS/EERA - Ca-looping simulation guidelines.pdf.

177
ROMEO, L. M., ABANADES, J. C., ESCOSA, J. M., et al. "Oxyfuel
carbonation/calcination cycle for low cost CO2 capture in existing power plants", Energy
Conversion and Management, v. 49, n. 10, p. 2809–2814, 2008. DOI:
10.1016/j.enconman.2008.03.022. .
RUBIN, E.S. Integrated Environmental Control Model. 2020. Center for Energy and
Environmental Studies. Disponível em: https://www.cmu.edu/epp/iecm/. Acesso em: 4
mar. 2020.
RUBIN, Edward S. "Understanding the pitfalls of CCS cost estimates", International
Journal of Greenhouse Gas Control, v. 10, p. 181–190, 2012. DOI:
10.1016/j.ijggc.2012.06.004. Disponível em:
http://dx.doi.org/10.1016/j.ijggc.2012.06.004.
RUBIN, Edward S., DAVISON, J. E., HERZOG, H. J. "The cost of CO2 capture and
storage", International Journal of Greenhouse Gas Control, v. 40, p. 378–400, 2015.
DOI: 10.1016/j.ijggc.2015.05.018. Disponível em:
http://dx.doi.org/10.1016/j.ijggc.2015.05.018.
RUBIN, Edward S., SHORT, C., BOORAS, G., et al. "A proposed methodology for CO2
capture and storage cost estimates", International Journal of Greenhouse Gas Control,
v. 17, p. 488–503, 2013a. DOI: 10.1016/j.ijggc.2013.06.004. Disponível em:
http://dx.doi.org/10.1016/j.ijggc.2013.06.004.
RUBIN, Edward S., SHORT, C., BOORAS, G., et al. "A proposed methodology for CO2
capture and storage cost estimates", International Journal of Greenhouse Gas Control,
v. 17, n. September 2013, p. 488–503, 2013b. DOI: 10.1016/j.ijggc.2013.06.004. .
RUBIN, Edward S., YEH, S., ANTES, M., et al. "Use of experience curves to estimate
the future cost of power plants with CO2 capture", International Journal of Greenhouse
Gas Control, v. 1, n. 2, p. 188–197, 2007. DOI: 10.1016/S1750-5836(07)00016-3. .
RUBIN, Edward S. "Status and Outlook for CO 2 Capture Systems Outline of Talk
Resources for the Future Many Ways to Capture CO 2 Amine-Based CO 2 Capture at a
Natural Gas Processing Plant Power Plant Option 1 : Post-Combustion CO 2 Capture
Post-Combustion Capture at the Bo", p. 1–8, 2017a. .
RUBIN, Edward S. "The Outlook for Lower-Cost Carbon Capture and Storage for
Climate Change Mitigation Outline of Talk Schematic of a CCS System Leading

178
Candidates for CCS Motivation for CCS Without CCS …", p. 1–13, 2017b. .
RYDÉN, M., LYNGFELT, A., LANGØRGEN, O., et al. "Negative CO2 Emissions with
Chemical-Looping Combustion of Biomass - A Nordic Energy Research Flagship
Project", Energy Procedia, v. 114, p. 6074–6082, 2017. DOI:
10.1016/j.egypro.2017.03.1744. .
RYDÉN, M., MOLDENHAUER, P., MATTISSON, T., et al. "Chemical-looping
combustion with liquid fuels", Energy Procedia, v. 37, p. 654–661, 2013. DOI:
10.1016/j.egypro.2013.05.153. Disponível em:
http://dx.doi.org/10.1016/j.egypro.2013.05.153.
SACRISTÁN, M. A. S.-B. Final Report Summary - CAOLING (Development of
postcombustion CO2 capture with CaO in a large testing facility: “CaOling”). 2014.
Disponível em: https://cordis.europa.eu/project/id/241302. Acesso em: 21 fev. 2020.
SAI, G. V. S. N., PUNDLIK, R. C., VENKATESWARA RAO, P., et al. "Chemical
looping combustion of biomass for renewable and non- CO2 emissions energy - status
and review", International Journal of Engineering and Technology(UAE), v. 7, n. 2,
p. 6–10, 2018. DOI: 10.14419/ijet.v7i2.1.9872. .
SAIKAEW, T., SUPUDOMMAK, P., MEKASUT, L., et al. "Emission of NO x and N
2O from co-combustion of coal and biomasses in CFB combustor", International
Journal of Greenhouse Gas Control, v. 10, n. x, p. 26–32, 2012. DOI:
10.1016/j.ijggc.2012.05.014. Disponível em:
http://dx.doi.org/10.1016/j.ijggc.2012.05.014.
SÁNCHEZ-BIEZMA, A., BALLESTEROS, J. C., DIAZ, L., et al. "Postcombustion CO2
capture with CaO. Status of the technology and next steps towards large scale
demonstration". 4, 2011. Anais [...] [S.l.], Elsevier Ltd, 2011. p. 852–859. DOI:
10.1016/j.egypro.2011.01.129.
SÁNCHEZ-BIEZMA, A., PANIAGUA, J., DIAZ, L., et al. "Testing postcombustion
CO2 capture with CaO in a 1.7 MW t pilot facility", Energy Procedia, v. 37, p. 1–8,
2013. DOI: 10.1016/j.egypro.2013.05.078. .
SCALA, F., CHIRONE, R., SALATINO, P. Attrition phenomena relevant to fluidized
bed combustion and gasification systems. [S.l: s.n.], 2013.

179
SCHOLARSARCHIVE, B., LIN BAXTER, L., LIN, L. "Biomass-coal Co-combustion:
Opportunity for Affordable Renewable Energy BYU ScholarsArchive Citation",
Original Publication Citation Fuel, v. 84, p. 1295–1302, 2005. Disponível em:
https://scholarsarchive.byu.edu/facpubcoalCo-
combustion:OpportunityforAffordableRenewableEnergy%22.
SEKAR, R. C., PARSONS, J. E., HERZOG, H. J., et al. "Future carbon regulations and
current investments in alternative coal-fired power plant technologies", Energy Policy,
v. 35, n. 2, p. 1064–1074, fev. 2007. DOI: 10.1016/j.enpol.2006.01.020. Disponível em:
https://linkinghub.elsevier.com/retrieve/pii/S0301421506000759. Acesso em: 3 ago.
2019.
SHIMIZU, T., HIRAMA, T., HOSODA, H., et al. "A twin fluid-bed reactor for removal
of CO2 from combustion processes", Chemical Engineering Research and Design, v.
77, n. 1, p. 62–68, 1999. DOI: 10.1205/026387699525882. .
SILVA, A. J. G. da. Avaliação Da Rota Termoquímica De Produção De Etanol E
Alcoóis Superiores. 2013. 1–223 f. UFRJ, 2013. Disponível em:
http://www.ppe.ufrj.br/ppe/production/tesis/gerbasi.pdf.
SILVA, J. A. da, CHIMENTÃO, R. J., SANTOS, J. B. O. dos. Impactos das Tecnologias
na Engenharia Química - Capítulo 25 - CAPTURA DE CO2 UTILIZANDO O
PROCESSO CALCIUM-LOOPING. [S.l: s.n.], 2019.
SPINELLI, M., MARTÍNEZ, I., DE LENA, E., et al. "Integration of Ca-Looping Systems
for CO2 Capture in Cement Plants", Energy Procedia, v. 114, n. November 2016, p.
6206–6214, 2017. DOI: 10.1016/j.egypro.2017.03.1758. Disponível em:
http://dx.doi.org/10.1016/j.egypro.2017.03.1758.
STRÖHLE, J., JUNK, M., KREMER, J., et al. "Carbonate looping experiments in a 1
MWth pilot plant and model validation", Fuel, v. 127, p. 13–22, 2014. DOI:
10.1016/j.fuel.2013.12.043. .
STRÖHLE, J., LASHERAS, A., GALLOY, A., et al. "Simulation of the carbonate
looping process for post-combustion CO2 capture from a coal-fired power plant",
Chemical Engineering and Technology, v. 32, n. 3, p. 435–442, 2009. DOI:
10.1002/ceat.200800569. .
TAGOMORI, I. S., CARVALHO, F. M., DA SILVA, F. T. F., et al. "Designing an

180
optimum carbon capture and transportation network by integrating ethanol distilleries
with fossil-fuel processing plants in Brazil", International Journal of Greenhouse Gas
Control, v. 68, n. October 2017, p. 112–127, 2018. DOI: 10.1016/j.ijggc.2017.10.013. .
TAMARYN, N., HILLS, T., SOLTANI, S. M., et al. A survey of key technological
innovations for the low-carbon economy. Grantham Institute - Climate Change and
Environment. [S.l: s.n.], 2017. Disponível em:
http://www.oecd.org/environment/cc/g20-climate/collapsecontents/Imperial-College-
London-innovation-for-the-low-carbon-economy.pdf. Acesso em: 20 out. 2019.
THE ECONOMIST. "Should the world pay more attention to adapting to climate change
than to efforts to mitigate it? |". 2019. Disponível em: https://www.economist.com/what-
the-world-thinks/should-world-pay-more-attention-adapting-climate-change-than-
efforts-mitigate-it?page=3. Acesso em: 20 out. 2019.
THITAKAMOL, B., VEAWAB, A., AROONWILAS, A. "Environmental impacts of
absorption-based CO2 capture unit for post-combustion treatment of flue gas from coal-
fired power plant", International Journal of Greenhouse Gas Control, v. 1, n. 3, p.
318–342, 2007. DOI: 10.1016/S1750-5836(07)00042-4. .
TIAN, X., NIU, P., MA, Y., et al. "Chemical-looping gasification of biomass: Part II. Tar
yields and distributions", Biomass and Bioenergy, v. 108, n. November 2017, p. 178–
189, 2018. DOI: 10.1016/j.biombioe.2017.11.007. .
TURNER, M., IYENGAR, A., WOODS, M. COST AND PERFORMANCE
BASELINE FOR FOSSIL ENERGY PLANTS SUPPLEMENT: SENSITIVITY TO
CO2 CAPTURE RATE IN COAL-FIRED POWER PLANTS. . [S.l: s.n.], 2019.
Disponível em: http://netl.doe.gov/File Library/Research/Energy
Analysis/OE/BitBase_FinRep_Rev2a-3_20130919_1.pdf.
U.S. DEPARTMENT OF ENERGY/NETL. Carbon Capture and Storage Database |
netl.doe.gov. 2019a. Disponível em: https://www.netl.doe.gov/coal/carbon-
storage/worldwide-ccs-database. Acesso em: 1 set. 2019.
U.S. DEPARTMENT OF ENERGY/NETL. "DOE/NETL Capture Program R&D:
Compendium of Carbon Capture Technology", n. April, 2018. Disponível em:
https://www.netl.doe.gov/research/coal/carbon-storage/research-and-
development/precombustion.

181
U.S. DEPARTMENT OF ENERGY/NETL. Post-Combustion CO2 Capture |
netl.doe.gov. 2019b. Disponível em: https://netl.doe.gov/coal/carbon-capture/post-
combustion. Acesso em: 20 out. 2019.
UNICA. União da Indústria de Cana-de-Açúcar. Boletim/Unica: a bioeletricidade
em números – setembro/2018. . [S.l: s.n.], 2018. Disponível em:
www.unica.com.br/documentos/documentos/.
VALIX, M., KATYAL, S., CHEUNG, W. H. "Combustion of Thermochemically
Torrefied Sugar Cane Bagasse", Bioresource Technology, v. 223, n. June, p. 202–209,
2017. DOI: 10.1016/j.biortech.2016.10.053. .
VALVERDE, J. M., SANCHEZ-JIMENEZ, P. E., PEREZ-MAQUEDA, L. A. "Ca-
looping for postcombustion CO2 capture: A comparative analysis on the performances of
dolomite and limestone", Applied Energy, v. 138, p. 202–215, 2015. DOI:
10.1016/j.apenergy.2014.10.087. .
VAN VUUREN, D. P., STEHFEST, E., GERNAAT, D. E. H. J., et al. "Alternative
pathways to the 1.5 °c target reduce the need for negative emission technologies", Nature
Climate Change, v. 8, n. 5, p. 391–397, 2018. DOI: 10.1038/s41558-018-0119-8. .
VERSTEEG, P., RUBIN, E. S. "IECM Technical Documentation : Amine-based Post-
Combustion CO 2 Capture", n. September, p. 59, 2019. .
VERSTEEG, P., RUBIN, E. S. "IECM Technical Documentation: Ammonia-Based Post-
Combustion CO2 Capture. Prepared for: National Energy Technology Laboratory", n.
September, p. 59, 2012. Disponível em:
http://www.cmu.edu/epp/iecm/documentation/IECM Ammonia System - September
2012.pdf. Acesso em: 8 dez. 2018.
VOLDSUND, M., GARDARSDOTTIR, S. O., DE LENA, E., et al. "Comparison of
technologies for CO 2 capture from cement production—Part 1: Technical evaluation",
Energies, v. 12, n. 3, 2019. DOI: 10.3390/en12030559. .
WANG, M., LAWAL, A., STEPHENSON, P., et al. "Post-combustion CO2 capture with
chemical absorption: A state-of-the-art review", Chemical Engineering Research and
Design, v. 89, n. 9, p. 1609–1624, 2011a. DOI: 10.1016/j.cherd.2010.11.005. Disponível
em: http://dx.doi.org/10.1016/j.cherd.2010.11.005.

182
WANG, M., LAWAL, A., STEPHENSON, P., et al. "Post-combustion CO2 capture with
chemical absorption: A state-of-the-art review", Chemical Engineering Research and
Design, v. 89, n. 9, p. 1609–1624, 1 set. 2011b. DOI: 10.1016/j.cherd.2010.11.005.
Disponível em: https://www.sciencedirect.com/science/article/pii/S0263876210003345.
Acesso em: 4 dez. 2018.
WOOLF, D., LEHMANN, J., LEE, D. R. "Optimal bioenergy power generation for
climate change mitigation with or without carbon sequestration", Nature
Communications, v. 7, n. 1, p. 13160, 21 dez. 2016. DOI: 10.1038/ncomms13160.
Disponível em: http://www.nature.com/articles/ncomms13160. Acesso em: 3 dez. 2018.
XU, Y., YANG, K., ZHOU, J., et al. "Coal-Biomass Co-Firing Power Generation
Technology: Current Status, Challenges and Policy Implications", Sustainability, v. 12,
n. 9, p. 3692, 2020. DOI: 10.3390/su12093692. .
YANG, Y., ZHAI, R., DUAN, L., et al. "Integration and evaluation of a power plant with
a CaO-based CO2 capture system", International Journal of Greenhouse Gas Control,
v. 4, n. 4, p. 603–612, 2010. DOI: 10.1016/j.ijggc.2010.01.004. Disponível em:
http://dx.doi.org/10.1016/j.ijggc.2010.01.004.
YLÄTALO, J., PARKKINEN, J., RITVANEN, J., et al. "Modeling of the oxy-
combustion calciner in the post-combustion calcium looping process", Fuel, v. 113, n.
Figure 1, p. 770–779, 2013. DOI: 10.1016/j.fuel.2012.11.041. .
ZEP. Future CCS technologies, Zero Emission Platform. . [S.l: s.n.], 2017. Disponível
em: https://ec.europa.eu/clima/policies/ets/reform/index_en.htm. Acesso em: 20 out.
2019.
ZHAI, H., RUBIN, E. S. "Carbon capture effects on water use at pulverized coal power
plants", Energy Procedia, v. 4, n. October, p. 2238–2244, 2011. DOI:
10.1016/j.egypro.2011.02.112. .
ZHAI, H., RUBIN, E. S., VERSTEEG, P. L. "Water Use at Pulverized Coal Power Plants
with Postcombustion Carbon Capture and Storage", Environmental Science &
Technology, v. 45, n. 6, p. 2479–2485, 15 mar. 2011. DOI: 10.1021/es1034443.
Disponível em: https://pubs.acs.org/doi/10.1021/es1034443.
ZHANG, X., SONG, P. "Performance Assessment of Coal Fired Power Plant Integrated
with Calcium Looping CO2 Capture Process", Energy Sources, Part A: Recovery,

183
Utilization and Environmental Effects, v. 00, n. 00, p. 1–22, 2019. DOI:
10.1080/15567036.2019.1673510. Disponível em:
https://doi.org/10.1080/15567036.2019.1673510.
ZHAO, X., ZHOU, H., SIKARWAR, V. S., et al. "Biomass-based chemical looping
technologies: The good, the bad and the future", Energy and Environmental Science,
v. 10, n. 9, p. 1885–1910, 2017. DOI: 10.1039/c6ee03718f. .
ZHENG, L., YAN, J. Thermal coal utilization. [S.l.], Woodhead Publishing Limited,
2013. v. 2. Disponível em: http://dx.doi.org/10.1533/9781782421177.3.237.