
First Flight of Scaled Electric Solar Powered UAV ... - CiteSeerX
Upload
khangminh22Category
view
1download
0
SMALL SCALED REACTIVE MATERIALS COMBUSTION TEST FACILITY
BY
DAVID PAUL CHONOWSKI
THESIS
Submitted in partial fulfillment of the requirements
for the degree of Master of Science in Mechanical Engineering
in the Graduate College of the
University of Illinois at Urbana-Champaign, 2010
Urbana, Illinois
Adviser:
Professor Nick Glumac

ii
Abstract
Combustion of reactive materials forms an active area of research for reactive fragment and
structural materials applications. Currently, reactive fragment tests involve high velocity (1-2 km/s),
large caliber projectiles directed into blast chambers where overpressure is measured to quantify output.
Unfortunately, these existing facilities suffer many issues including high cost per test, which limits the
ability to perform true parametric studies, as well as limited access in some cases for diagnostics other
than transient pressure. To address these issues, we developed a small-scale reactive materials
combustion test facility based on the Remington .17 caliber rifle which safely launches projectiles at
velocities approaching 1.3 km/s. By making custom projectiles and firing these into a small chamber
with complete optical access, we are able to obtain transient pressure and capture high-speed imagery.
The setup also allows for optical measurements including pyrometry and spectroscopy. In this work the
diagnostic measurements are primarily the bullet velocity and chamber overpressure.
After completion of the design and installation of the laser optical chronograph and the
appropriate pressure transducers, several tests at velocities of 1.2 km/s were performed comparing inert
bullets with those comprised of reactive metals in air, 100% nitrogen, and 40% oxygen rich environments.
Therefore this paper outlines the major components of the combustion test facility, the system diagnostics
and the effect that different intermetallics in various environments have on combustion performance.
Results indicate that the facility performed as intended by capturing quantitative differences in the
chemical energy release of various energetic systems. Further, through the post-processing of specimen
residue with X-ray diffraction, the identification of reaction products provided better insight into the
chemical reactions contributing to the observed energy release assisting in the determination of elements
responsible for combustion performance.

iii
Acknowledgements
As an unfunded research project in the traditional sense, my thesis research would not have been
possible without the support of Prof. Nick Glumac. His continued mentorship along with Prof. Herman
Krier proved invaluable to the graduate learning experience by allowing me the time to troubleshoot
problems, create solutions, and implement under their guidance.
As members of our research group, Drew Coverdill, Bradley Horn, Lance Kingston, Jeff Mason,
Jennifer Peuker, and John Rudolphi each volunteered their time and expertise to me when asked. From
MATLAB code hints to assistance in conducting tests to opinions on design concepts, I extend my
gratitude to all of you. Further, Doug Logan, an undergraduate research assistant, devoted dozens of hours
during the bulk of my testing practically doubling my testing pace resulting in over 100 tests with the
small scale combustion facility.
Adam Hurst, senior research and development engineer at Kulite Semiconductor Products, Inc.
was very supportive in our research efforts by supplying a Kulite XTL-190-25SG pressure transducer.
The fast response time of this pressure transducer over the Gems 2200 series transducers allowed us to
capture the full and accurate pressure trace inside the pressure chamber.
David Costley, owner of Dave’s Firearms and Cycle Repair located in Urbana, Illinois, and Keith
Parrish, the research laboratory shop supervisor for the Mechanical Science and Engineering Department
at the University of Illinois both freely provided their knowledge of firearms and ballistics and aided in
the development of a safe and reliable bullet design.
Lastly, Dr. Richard Lee, Research & Technology Department, Naval Surface Warfare Center,
Indian Head Division, offered helpful advice during the early stages of this project on the design and
implementation of impact initiated reactive materials laboratories. His insight allowed me to gain a better
understanding into the design and operation of their facilities and apply that knowledge to my own
research.

iv
For my wife

v
Table of Contents
Chapter 1 Introduction…………………………………………………………………………………...... 1
1.1 Energetic Materials Applications……………………………………………………………. 1
1.2 Types of Impact Initiated Test Facilities ……………………………………………………..2
Chapter 2 Objective of Current Research and Literature Review ………………………………………...3
2.1 Objective of Current Research ……………………………………………………………….3
2.2 Previous Work ………………………………………………………………………………..4
Chapter 3 Experimental Methods and Facility……………………………………………………………. 8
3.1 Overview……………………………………………………………………………………... 8
3.2 Determination of Energy Deposition from Pressure………………………………………... 10
3.3 Experimental Small Scaled Test Facility ……………………………………………………12
3.4 Projectile and Specimen Preparation……………………………………………………….. 24
Chapter 4 Results and Discussion………………………………………………………………………... 33
4.1 Projectile Velocity………………………………………………………………………….. 33
4.2 Blast Wave Analysis ………………………………………………………………………..34
4.3 Energy Release……………………………………………………………………………... 36
4.4 X-Ray Diffraction Analysis………………………………………………………………… 37
4.5 Pressure Chamber Environment……………………………………………………………. 37
4.6 Inert Baseline Tests………………………………………………………………………… 38
4.7 Copper(II) Oxide Systems in Air…………………………………………………………... 40
4.8 Tungsten-Zinc-Zirconium Systems in Air………………………………………………….. 43
4.9 Tungsten-Zinc-Hafnium Systems in Air…………………………………………………… 47
4.10 Potassium Perchlorate Systems in Air……………………………………………………… 50
4.11 Boron Carbide Systems……………………………………………………………………...55
4.12 Bismuth Oxide Systems in Air……………………………………………………………... 66
Chapter 5 Conclusions…………………………………………………………………………………… 68
5.1 Recommendations for Future Studies……………………………………………………… 68
5.2 Best Performing Systems…………………………………………………………………... 69
References………………………………………………………………………………………………… 71
Appendix A: Sample Preparation Equations……………………………………………………………... 73
Appendix B: Complete Test Results……………………………………………………………………… 75

vi
Appendix C: MATLAB Analysis Code…………………………………………………………………... 78
C.1: Quasi-Static Pressure Curve Analysis……………………………………………………… 78
C.2: Impulse Analysis……………………………………………………………………………. 80
C.3: Velocity Analysis…………………………………………………………………………… 82
Appendix D: Endevco 106/109 Settings………………………………………………………………….. 83
Appendix E: SOP for Model 700 Remington Rifle………………………………………………………. 84
Appendix F: Data Recording Sheet………………………………………………………………………. 85
Appendix G: Proposed Bullet Press Design Sketches……………………………………………………. 86
Appendix H: Remote Trigger Drawings………………………………………………………………….. 87
Appendix I: Mounting Block Sketch……………………………………………………………………... 89
Appendix J: Reactive Material Moisture Study…………………………………………………………... 90
Appendix K: Experimental Results in Energy Output per Volume………………………………………. 91
Appendix L: XRD Analysis Results……………………………………………………………………… 95

1
Chapter 1
Introduction
1.1 Energetic Materials Applications
“Reactive Materials (RM) denotes a class of materials that generally combines two or more
nonexplosive solids which, upon their ignition, react to release chemical energy in addition to the kinetic
energy when the high-speed projectile containing the reactive materials collides with the target” [1]. The
rare combination of stability under normal conditions and the ability to release large amounts of energy
make them attractive substitutes over more commonly used explosives such as TNT (trinitrotoluene) or
PETN (pentaerythritol tetranitrate). Moreover, the energy release and subsequently destructive capacity
can exceed standard explosives. For example, TNT generates 1120 cal/g [2] in blast energy while
materials such as aluminum and hafnium have been experimentally shown to exceed 2300 cal/g and 1400
cal/g respectively [3].
From the reduction of collateral damage to enhanced destructive capability of hardened targets to
increased effective range, energetic materials are an integral part of many modern defense systems.
Specifically, reactive materials significantly improve a systems ability to deliver damage to hard or soft
targets through: increased internal temperature form the chemical energy, enhanced blast and
overpressure, and deflagration of critical components [1].
According to the Committee on Advanced Energetic Materials and Manufacturing Technologies,
the United States is losing its capacity to create new energetic materials. In fact, “[t]he U.S. effort in the
synthesis of energetic materials at present involves approximately 24 chemists, several of whom are
approaching retirement. Few chemists are being trained to replace them” [1]. Clearly, the energetic
research community stands to benefit from increased academic involvement. Therefore, the
implementation of academic facilities such as the University of Illinois’ Department of Mechanical
Science and Engineering small scaled reactive test facility provides added opportunity to grow energetic
material research efforts fostering new ideas and potentially newly trained scientists in this field.

2
1.2 Types of Impact Initiated Test Facilities
Research surrounding reactive materials is a growing field due to the wide array of applications.
Typically these materials consist of intermetallics, metal-oxidizers, or metal-polymer combinations that
exhibit high strength, stability, and the ability to maintain multiple form factors.
Numerical simulation programs such as CHEETAH, a thermo-chemical coding language, are
excellent tools for determining the theoretical energy release of a reactive material specimen. In
comparison reactive material test facilities can experience variations (sometime significant) in terms of
the energy released by a given system. In the field of impact initiated energetic materials there currently
exist three main experimental methods [4]. The first being direct impact experiments consisting of a 25.4
mm bore powder gun that propels 19.4 g spherical reactive materials specimens initially mounted inside a
sabot towards a hardened metallic surface without any interference. Diagnostic equipment includes
photodiodes and spectrometers positioned to detect light emissions to determine product formation and
energy release. Another researched method is the indirect impact facility where a steel disk impacts a two
steel anvil configuration, which compress a grooved energetic pellet resting inside. Similar to the direct
impact experiment, high-speed imagery and spectroscopy provide the qualitative and quantitative sources
of data. Lastly, and most relevant to the research in this paper is the two-step impact experiment where a
thin .060 inch steel plate induces fragmentation in a projectile prior to impact on a hardened steel surface.
In addition to the previously mentioned diagnostic equipment, the two-step impact tests occur inside a
steel pressure vessel making the use of pressure transducers a relevant diagnostic [4].

3
Chapter 2
Objective of Current Research and
Literature Review
2.1 Objective of Current Research
The goal of impact-initiated energetic material research is to determine the reagent combination
that delivers maximum target damage. Therefore, the target and projectile interaction of a test facility
must closely resemble that of a real world scenario. Our small-scale facility and the larger ballistic
facilities at the Naval Surface Warfare Center (Figure 2.1), which our facility was modeled after, are
commonly referred to as vented calorimetric chambers for impact-initiated energetic materials. Chambers
with this design are initially sealed with a thin mild steel cover that allows for projectile penetration into
the chamber. The vent hole created from the initial penetration allows gases to escape as the reactive
metals combust inside the chamber after final impact on a hardened metallic surface. The exothermic
release of energy from the reactive materials results in a measurable increase of chamber pressure. More
specifically, the change in system pressure immediately following the chemical reaction, but before heat
transfer and losses is considered the quasi-static pressure. By quantifying the quasi-static pressure
generated from various constituents, experimentalists can draw conclusions about a material’s ability to
damage a target in real world applications.
Figure 2.1: Impact initiated “Octapig” (left) and “Bluepig” (right) test facility operated by NSWC [3]
Thus, the quasi-static pressure has become the most prominent metric of comparison for reactive
materials using this type of facility. Variations in the material type, mixture ratio, and particle size

4
contribute to distinct changes to energy release and in the quasi-static pressure allowing us to examine
parametric variations in reactive materials composition to isolate the key microstructural elements
responsible for optimized combustion performance.
2.2 Previous Work
Ames and Waggener
Richard Ames and Samuel Waggener published a paper, Reaction Efficiencies for Impact-
Initiated Energetic Materials, providing a performance comparison within a large-scale combustion test
facility of aluminum, tantalum, zirconium, and hafnium metals pressed with various fluorpolymers
binders. Each of the metal-binder specimens consisted of a 19.4 g spherical mass. Using a sabot the
projectiles were fired through a smooth bore powder gun (Figure 2.1) capable of achieving velocities of
2.4 km/s.
For the tests specifically referenced in the aforementioned paper, the metals were each propelled
at 1.2 km/s, 1.8 km/s, and 2.4 km/s. Comparison among specimens launched at similar velocities allows
for a relative comparison of the chemical potential of each specimen since the kinetic energy deposited in
the chamber is essentially equivalent. However, comparison of specimen performance launched at
different velocities requires the subtraction of the kinetic energy from the total measured energy release.
Ames and Waggener determined the chemical energy release (Total energy release=chemical energy +
kinetic energy) for each of the metals at each of the respective velocities. Figure 2.2 produced in their
paper depicts the chemical energy deposition of each metal-binder relative to the other specimens as well
as the theoretical energy release. As such, increased velocities yield performance closer to theoretical
results.
Figure 2.2: Comparison of velocity increases and theoretical energy release [3]

5
With the first experimental facility for impact initiated vented caloric calorimeter originating at
the Naval Surface Warfare Center, it is fitting that their work provides a basis of comparison. Figure 2.3
and Figure 2.4 below are two directly applicable charts as they depict materials of interest such as
aluminum, zirconium, tantalum, and hafnium.
Figure 2.3: Comparison of energy release at 1.2 km/s for various energetic metals [3]
Figure 2.4: Comparison of energy release at 1.8 km/s for various energetic metals [3]

6
Arguably the most interesting result from this paper was that materials with the highest
theoretical energy release did not always dominate in terms of combustion performance. As the
compression yield strength of a given material increases from weak, moderate, to strong (5.0 MPa, 12
MPa, and 15 MPa respectively), its performance deviates from the 100% theoretical values as seen in
Figure 2.5. Ames and Waggener suggested that “higher strength would likely result in better distribution
of the mechanical energy within the material and delay the development of hot-spot initiation points” [3].
They went on further to prove this statement by using chemically identical fluoroploymer binders which
each exhibit a distinct static compression yield strength. Since THV-500 has a yield strength of 12 MPa
while THV-220 has a yield strength of 5.0 MPa, the binders served as excellent materials for comparison.
Figure 2.6 displays how the weaker binder, THV-220, produces a more efficient reaction when compared
to the THV-500. This significance of this finding makes it an important point to consider when selecting
and comparing materials for testing in impact initiated systems.
Figure 2.5: Yield strength effects on energy release [3]
Figure 2.6: Relationship between efficiency and strength [3]

7
Felts
Josh Felts conducted several velocity measurement tests using the same .17 caliber, Model 700
BDL, Remington rifle that is in use for the small scaled reactive materials combustion test facility (Figure
2.7). By thoroughly documenting the performance of various propellants and their respective quantities,
he demonstrated the velocity limitations of the rifle. Although the maximum charge for this rifle is
considered to be 24 grains with most powders, amounts exceeding 24 grains are obtainable, but require
close monitoring of the rifle and casings to avoid overpressure. Pressure from the gunpowder reaction
provides the force to accelerate the bullet through the rifle barrel. Theoretically a research assistant could
control the velocity from 0 to 1.4 km/s. However, in practice the range of charges is limited by the
minimum pressure required to eject the bullet without it becoming lodged in the barrel and the maximum
pressure that does not exceed the design limitation of the chamber. Through his efforts we were able to
avoid conducting our own series of tests to determine the best performing powder. With a ballistic
coefficient of .185 for the standard .17 caliber, 20 grain, Hornady V-MAX bullet, a muzzle velocity of 1.2
km/s (4,000 ft/s) creates 1.32 N of air resistance for a 1.30 gram bullet resulting in a difference of 1-2 m/s
when measuring the velocity one foot from the muzzle as Felts did with his facility or a three feet from
the muzzle in our facility. The nominal velocity difference made Felt’s results relevant in our facility.
Figure 2.7: Effect of gun powder amounts and brand on bullet velocity [5]

8
Chapter 3
Experimental Methods and Facility
3.1 Overview
The design of the pressure chamber is intended to simulate the conditions upon impact of a lightly
armored vehicle or aircraft in which a thin metal exterior shell encases larger and denser metallic
components. Under these circumstances the ballistic projectile fragments after piercing the outer shell and
continues to propagate through the medium until stopped by a denser surface. Similar to a water
calorimeter that equates the temperature change to the total amount of energy release, the impact chamber
allows for the measurement of pressure increases, which correlate to energy release depending on the air
conditions and volume of the chamber. Tests in confined spaces where the mass of the reactants was less
than 10% of the inside air demonstrated that an increase in air temperature was the strongest contributor
to the quasi-static pressure increase [6]. The energy transfer from a kinetic impact and the subsequent
chemical reaction of a reactive material create the damage to a target.
Figure 3.1: Projectile-Chamber fragmentation & interaction [6]
Each projectile’s total energy is the summation of its kinetic energy and stored chemical energy.
It is important to note that like many systems, not all of the energy is measureable. Following the initial

9
penetration of the fragmentation plate with minor losses in both mass and energy, the total energy
dissipates into various forms as depicted in Figure 3.2. Energy transfer through three major mediums or
sinks includes general losses, local blast pressures, and the global quasi-static pressure. General losses
include “heat that remains in the solid reaction products, heat losses to the chamber walls, and heat losses
that result from the venting process” [6]. But in application structural damage capacity is done by the
local and global pressures so the chamber pressure-time relationship or the global quasi-static pressure is
the most meaningful measurement when determining the total energy release from a given projectile.
Figure 3.2: Diagram of energy dissipation [6]
According to Ames, the quasi-static pressure is a more global phenomenon and a result of the
energy deposited into the chamber environment. Moreover, blast perturbations or local blast pressure
waves perform PdV work on the internal chamber environment further increasing the global quasi-static
pressure. Figure 3.3 demonstrates the measurable pressure that results from an energetic specimen impact.
Using a pressure transducer with an adequate response time, the high-pressure initial blast wave is
typically measured in the first few milliseconds. Following the initial blast is a series of undulations or
localized blast pressure waves traversing and reflecting, but dissipating inside the pressure chamber that
provide additional PdV work to the environment and lead to an increase in the global quasi-static
pressure.
In application a reactive material projectile would immediately affect a target upon penetration of
the target’s outer skin and subsequently be altered itself. Test facilities at the Naval Surface Warfare
Center typically use a 19.4 g homogenous sphere and experience an 8% loss in mass when perforating a

10
1/16th inch thick mild steel plate. Additionally, the projectile experiences a 20% reduction in velocity
when passing through the steel entry plate [6]. Although post-perforation velocity and mass
measurements were not conducted to determine the change in mass and velocity for this facility, it is
important to mention since the measured velocity is not the same velocity at impact due to the reduction
induced by the breaker plate.
Figure 3.3: Total pressure contributions to quasi-static pressure increase [6]
Since the standard .17 caliber Hornady bullet is primarily comprised of lead with a thin copper
coating which increases a bullet’s thermal capacity and resistance to deformation while traversing the rifle
barrel, there is a small, detectable level of chemical energy release when using an “inert” bullet.
Therefore, a baseline test is necessary for each chamber environment in order to differentiate between the
kinetic and chemical energy release from the bullet and the chemical energy release of the reactive metal
specimen. It’s important to note that rotational effect of the bullet created by the rifling of the Remington
700 Model BDL rifle is ignored to simplify the calculations as they are assumed to be insignificant in
energy disposition when compared to the translational kinetic energy.
3.2 Determination of Energy Deposition from Pressure
In order to calculate the total energy released by the reactive specimen and ballistic impact in the
chamber environment, we assume the pressure chamber acts as a closed system during the first few
milliseconds prior to reaching the maximum recordable overpressure. While also assuming an ideal gas
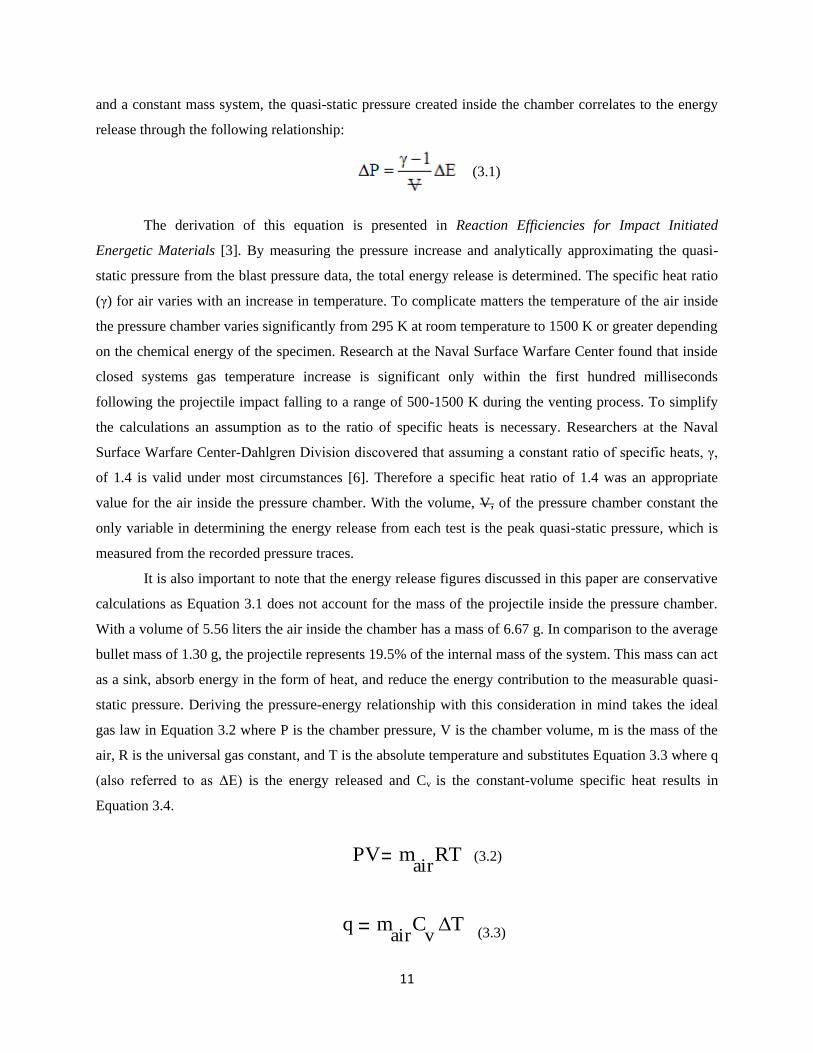
11
PV mair
RT
and a constant mass system, the quasi-static pressure created inside the chamber correlates to the energy
release through the following relationship:
(3.1)
The derivation of this equation is presented in Reaction Efficiencies for Impact Initiated
Energetic Materials [3]. By measuring the pressure increase and analytically approximating the quasi-
static pressure from the blast pressure data, the total energy release is determined. The specific heat ratio
(γ) for air varies with an increase in temperature. To complicate matters the temperature of the air inside
the pressure chamber varies significantly from 295 K at room temperature to 1500 K or greater depending
on the chemical energy of the specimen. Research at the Naval Surface Warfare Center found that inside
closed systems gas temperature increase is significant only within the first hundred milliseconds
following the projectile impact falling to a range of 500-1500 K during the venting process. To simplify
the calculations an assumption as to the ratio of specific heats is necessary. Researchers at the Naval
Surface Warfare Center-Dahlgren Division discovered that assuming a constant ratio of specific heats, γ,
of 1.4 is valid under most circumstances [6]. Therefore a specific heat ratio of 1.4 was an appropriate
value for the air inside the pressure chamber. With the volume, V, of the pressure chamber constant the
only variable in determining the energy release from each test is the peak quasi-static pressure, which is
measured from the recorded pressure traces.
It is also important to note that the energy release figures discussed in this paper are conservative
calculations as Equation 3.1 does not account for the mass of the projectile inside the pressure chamber.
With a volume of 5.56 liters the air inside the chamber has a mass of 6.67 g. In comparison to the average
bullet mass of 1.30 g, the projectile represents 19.5% of the internal mass of the system. This mass can act
as a sink, absorb energy in the form of heat, and reduce the energy contribution to the measurable quasi-
static pressure. Deriving the pressure-energy relationship with this consideration in mind takes the ideal
gas law in Equation 3.2 where P is the chamber pressure, V is the chamber volume, m is the mass of the
air, R is the universal gas constant, and T is the absolute temperature and substitutes Equation 3.3 where q
(also referred to as ΔE) is the energy released and Cv is the constant-volume specific heat results in
Equation 3.4.
(3.2)
(3.3) q mair
CvT

12
P
mair
R
V mair
Cv
mproj
Cproj
E
P
mair
1( )
V mair
mproj
Cproj
Cv air
E
(3.4)
Knowing that the universal gas constant, R, is equal to Cv(γ-1), Equation 3.4 is mathematically equivalent
to Equation 3.5. However, Equation 3.5 differs from Equation 3.1 in that the mass of the projectile now
influences the pressure-energy relationship. Using the constant-volume specific heat of air as .718
KJ/KgK and the specific heat of .13 KJ/KgK for a lead bullet (1.1 g of lead) doubled the estimated energy
output for a given system when compared to the methods in Equation 3.1 that assumed the mass of the
projectile has no effect on the measured pressure data.
(3.5)
This analysis shows that there are several ways to interpret the pressure data and by neglecting the mass
of the bullet, the energy results tabulated in Appendix B and derived from Equation 3.1 are very
conservative values for each system (50% reduced from Equation 3.5). Given the chaotic nature of the
fragmentation, it is difficult to discern how the energy is distributed post impact between the air or other
gaseous environments and the projectile mass since the projectile fragments with a range of particle sizes.
Further analysis of experimental results and residue form inert cases like those discussed in Chapter 4.6
could help discern the level of lead oxidation and influential fragmentation (in relation to Equation 3.5).
Additionally, the timescale at which the lead absorbs heat is significantly longer than that of air reducing
the effects of lead absorbing pressure enhancing energy. Therefore, for this work the results are based on
Equation 3.1.
3.3 Experimental Small Scaled Test Facility
Overview
Cost, system reliability and laboratory safety were all factors taken into consideration during the
design and construction of this small-scale facility. The system design is an integration of standardized
components that house a .17 caliber Model 700 BDL Remington rifle in a foam padded metal locker

13
creating a noise reducing environment as seen in Figure 3.4. From the safety of an adjacent room, the rifle
trigger mechanism, which requires 4.25 lbf is remotely engaged through a sealed linear solenoid that
transmits 8.1 lbf. Figure 2.7 shows that a variation in gunpowder charge amounts (24 grain for 100%) and
brands, allows for the adjustment of bullet velocity with a maximum safe test velocity of 1.2-1.3 km/s.
Although the maximum velocity of the small scaled facility is less than those of the national
laboratories, the limitations of current weapon systems must also be taken into account. Velocities of
2.4km/s are attainable in large laboratory settings; however, they are less likely to be seen in fielded
weapon systems. For example, many of the current kinetic energy rounds such as those commonly
delivered in the M1A1/M1A2 Abrams Main Battle Tank operate at velocity ranges from 1.5-1.7 km/s [7].
In short, current deficiencies of a small scaled facility are not as significant when considering the
limitations of present day delivery systems. Research at the Naval Surface Warfare Center has also shown
that 1.2 km/s is fast enough to see reactive materials effects while velocities of 0.6 km/s are not [1].
Figure 3.4: Small scaled reactive materials combustion facility
Pressure Chamber
To properly measure the energy release, we required a facility durable enough to safely withstand
the initial impact and reflected shock waves created from a high-speed bullet, absorb and retain blast
pressures and fragments from the reactive constituents, provide optical access for diagnostics, and
accommodate multiple pressure transducers. The basic chamber design consists of a ½ in. thick, 8 in.
square section of A36 steel tubing spanning 10 inches in length. Two 4 in. x 8 in. sections were cut into
the steel tubing and covered with ½ inch thick polycarbonate plates functioning as ballistic windows and
secured by a 6061 aluminum frame. Serving as end caps are two 8 in. square, 1 in. thick A36 steel plates.
Elevating the chamber and acting as table mounting assembly are 4, 1 in. diameter 6061 aluminum rods
joined and supported on two 6 in. x 10 in. A36 steel plates.
The current chamber design allows for the placement of three pressure transducers in the ½
inch NPT fittings evenly distributed along the top chamber wall (Figure 3.5). The projectile first enters
the chamber by penetrating a 1/16 in. mild steel breaker plate, which induces fragmentation of the lead
bullet and the reactive constituents. Although certain materials may require the replacement of one sensor
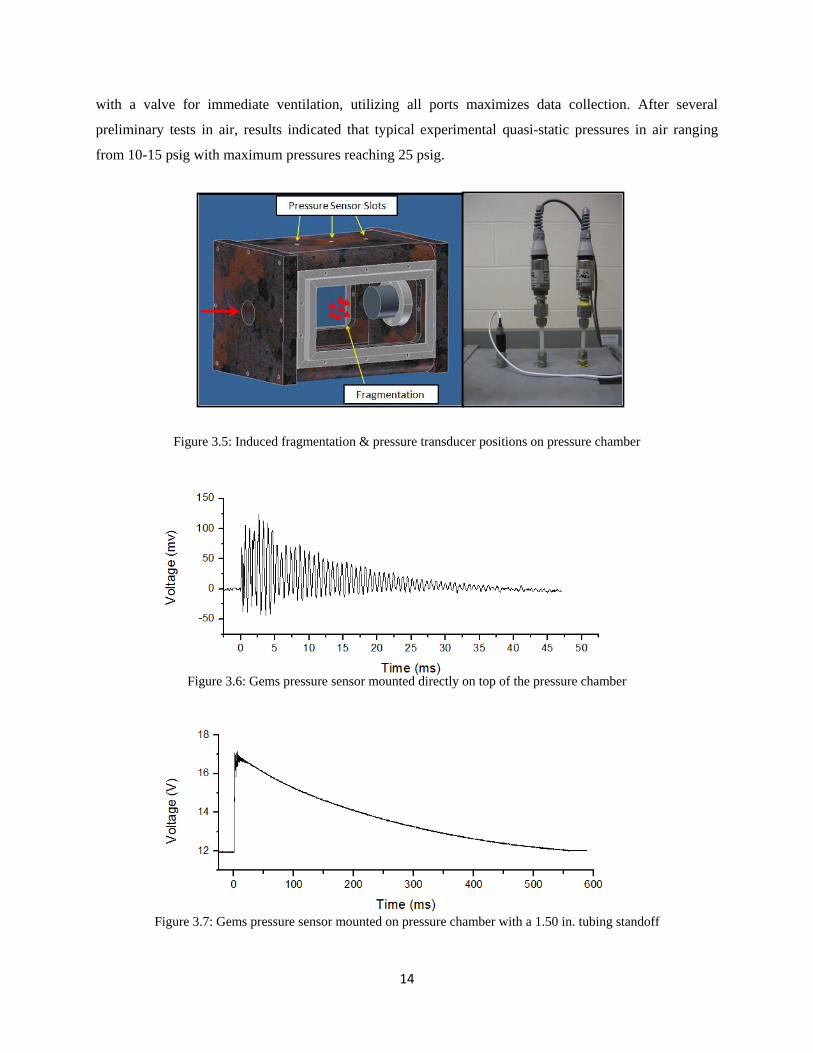
14
with a valve for immediate ventilation, utilizing all ports maximizes data collection. After several
preliminary tests in air, results indicated that typical experimental quasi-static pressures in air ranging
from 10-15 psig with maximum pressures reaching 25 psig.
Figure 3.5: Induced fragmentation & pressure transducer positions on pressure chamber
Figure 3.6: Gems pressure sensor mounted directly on top of the pressure chamber
Figure 3.7: Gems pressure sensor mounted on pressure chamber with a 1.50 in. tubing standoff

15
Due to the confined space of the chamber, the minor spatial difference of each transducer mount
did not attribute to any measurable variation in recordable pressure. Therefore, several peizoresistive
pressure transducers within the appropriate expected pressure range of 0 to 25 psig were selected. To
accurately record the peak blast pressure a XTL-190-25SG Kulite, 100 mv output, pressure transducer
was used in conjunction with the a Wheatstone strain gauge amplifier. The Kulite XTL series pressure
transducers are recommended for their high frequency response and resistance to vibrational noise. With
the blast peak pressure occurring in less than a millisecond, a voltage amplifier with a sufficient response
time equivalent to the Kulite XTL sensor was necessary. After testing several strain gauge amplifiers
with the Kulite pressure transducer, an Endevco 106, dual channel piezoresistive bridge signal
conditioner and an Endevco 109 power supply became the ideal choice.
Although not capable of recording the sub-millisecond peak impulse, the Gems 2200
peizoresistive pressure transducers enhance the reliability of the pressure measurements. A Gems 2200
series, 4-20 ma output, -15 to 45 psig and a -15 to 15 psig pressure transducer allowed for two additional
distinct pressure traces with each energetic specimen. Mounted in the middle is a Gems 2200 series, 4-20
ma output, -15 to 45 psig pressure transducer. Closest to the anvil is a Gems 2200 series, 4-20 ma output,
-15 to 15 psig pressure transducer. To mitigate unwanted vibrations the two Gems pressure transducers
were offset from the chamber by a 1.5 in. long and ¼ in. thick nylon tube (Figure 3.5). The use of nylon
tubing to offset certain vibrational “sensitive” transducers is necessary in order to capture usable data. A
simple test was performed with a Gems 2200 sensor mounted directly into the ½ in. NPT slot on top of
the pressure chamber without the use of any damping material. As expected Figure 3.6 depicts the
abundance of oscillations would make data post-processing challenging even with the best data filters.
Thus, the ¼ in. outer diameter and 1.50 in. long tube was a simple and reliable method to mitigate this
problem. Figure 3.7 shows the benefits in noise reduction with the nylon adapter.
Since the Gems sensors operate as a current output transducer, observable voltages are controlled
by adjustments to the terminal resistors fixed to the BNC output connector. A simple BNC style variable
terminator allowed for preferential adjustment in voltage output. Both 500 ohms and 1000 ohms were
suitable settings; however, all tests conducted and discussed in this paper were set to 1000 ohms mainly
due to the mathematical simplicity when converting the voltage output to pressure. Three pressure
transducers provide both experimental reliability and standoff distance variation (results showed that the
standoff distance between pressure transducers did not affect the pressure measurements).
Projectile Cabinet
Assembled by a senior design team, a standard athletic locker was modified into a projectile
housing facility, an incredibly useful container that creates a closed system during testing as well as

16
provides a secure manner to store the rifle when not in use. Moreover, the Remington 700 BDL rifle bolt
was stored and locked in a separate location as an additional safety precaution. The 12 in. x 18 in. x 72
in. Hallowell ValueMax locker lined with one inch egg shell insulation foam became the rifle housing
cabinet. To mount the rifle, a steel Caldwell Lead Sled DFT Rifle Shooting rest provided an excellent “off
the shelf” solution to securing the rifle and reducing the recoil especially when mounted one of the 30 in.
x 60 in. x 30 in. maple wood workbench tables via the U-hook and the ½ in. threaded rod [8].
The large door provided easy access to the rifle, rifle mount, and trigger solenoid. Minor
improvements such as a hinged rear access panel for rifle bore cleaning and two light duty cotton/nylon 3
foot long, 2 inch thick, hinged bar buckle straps created a cost effect method of increasing the rifle
stability within the Caldwell shooting rest and reducing test turnaround time. In the metal panel opposite
the mounted rifle Silver’s Machine, a local machine shop, cut a 3 in. diameter exit hole for the bullet.
Figure 3.8: Projectile cabinet with Caldwell shooting resting and Remington rifle
Figure 3.9: Rear access panel of projectile cabinet
Initially it was unclear as to the level of sound intensity that a muffled rifle would generate and
whether this facility could be used in the Mechanical Engineering Laboratory during normal business
hours. Several preliminary early morning tests demonstrated that although rifle blasts were noticeable to
17
KE1
2mv
2
someone in the immediate vicinity of the test facility, the noise did not permeate throughout the building.
As a result testing could be conducted inside the building and during normal business hours without being
a nuisance to others.
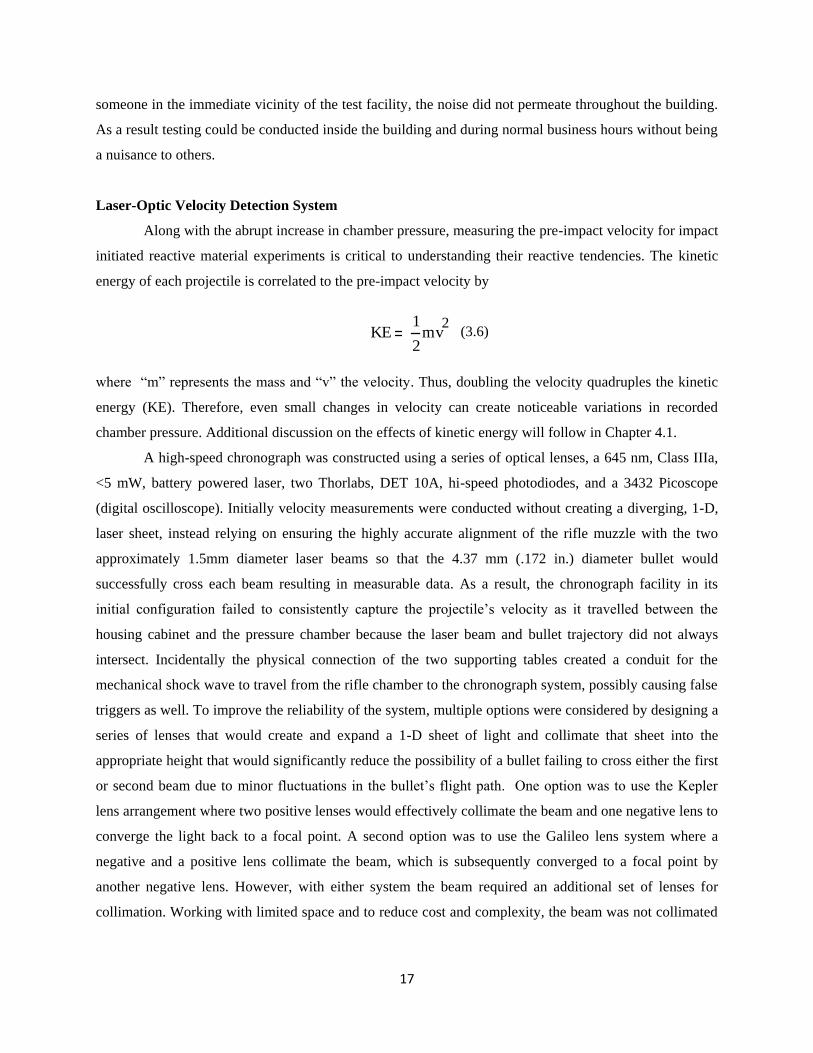
Laser-Optic Velocity Detection System
Along with the abrupt increase in chamber pressure, measuring the pre-impact velocity for impact
initiated reactive material experiments is critical to understanding their reactive tendencies. The kinetic
energy of each projectile is correlated to the pre-impact velocity by
(3.6)
where “m” represents the mass and “v” the velocity. Thus, doubling the velocity quadruples the kinetic
energy (KE). Therefore, even small changes in velocity can create noticeable variations in recorded
chamber pressure. Additional discussion on the effects of kinetic energy will follow in Chapter 4.1.
A high-speed chronograph was constructed using a series of optical lenses, a 645 nm, Class IIIa,
<5 mW, battery powered laser, two Thorlabs, DET 10A, hi-speed photodiodes, and a 3432 Picoscope
(digital oscilloscope). Initially velocity measurements were conducted without creating a diverging, 1-D,
laser sheet, instead relying on ensuring the highly accurate alignment of the rifle muzzle with the two
approximately 1.5mm diameter laser beams so that the 4.37 mm (.172 in.) diameter bullet would
successfully cross each beam resulting in measurable data. As a result, the chronograph facility in its
initial configuration failed to consistently capture the projectile’s velocity as it travelled between the
housing cabinet and the pressure chamber because the laser beam and bullet trajectory did not always
intersect. Incidentally the physical connection of the two supporting tables created a conduit for the
mechanical shock wave to travel from the rifle chamber to the chronograph system, possibly causing false
triggers as well. To improve the reliability of the system, multiple options were considered by designing a
series of lenses that would create and expand a 1-D sheet of light and collimate that sheet into the
appropriate height that would significantly reduce the possibility of a bullet failing to cross either the first
or second beam due to minor fluctuations in the bullet’s flight path. One option was to use the Kepler
lens arrangement where two positive lenses would effectively collimate the beam and one negative lens to
converge the light back to a focal point. A second option was to use the Galileo lens system where a
negative and a positive lens collimate the beam, which is subsequently converged to a focal point by
another negative lens. However, with either system the beam required an additional set of lenses for
collimation. Working with limited space and to reduce cost and complexity, the beam was not collimated

18
but lenses were placed accordingly to allow for the expanded beam to fully converge back on the
photodiodes seen in Figure 3.10 and 3.11.
Figure 3.10: Diagram of final proposed chronograph system
The 1.5mm laser beam was split by a 1 in. diameter 50/50 splitter lens that allowed 50% of the beam to
travel unimpaired to the hi-speed, Thorlab, DET 10A, photodiodes. This detector was chosen for its fast
rise time of 1 ns and appropriate wavelength range of 200-1100 nm. Using two plano-concave cylindrical
lenses (f=-40mm, H=10mm, L=12mm), the beam was expanded in such a manner that the 1-D sheet
height at the bullet path would be 14.5 mm (.57 in.). Clearly the 14.5 mm created a larger margin of error
than that of the original beam diameter of 1.5 mm. Two double convex, 50mm diameter, 50mm focal
length lenses refocused the diverging beam onto the photodiode receptor cells. Special attention must
always be given to the alignment of the laser beam onto each respective photodiode’s receptor cell. Non-
centered and incorrectly focused beams could result in failed measurements.
Figure 3.11: Completed laser/optic chronograph system

19
To properly record the bullet velocity several Picoscope setting variations were attempted prior to
determining the most suitable. Furthermore, due to a slight reduction in the beam intensity at the second
photodiode, Channel B, voltage sensitivity was set to a smaller range than Channel A. The Picoscope
software settings were as follows: Channel A: +/-500 mv, DC voltage and Channel B: +/-200 mv, DC
voltage, with 20 us/div and a sampling rate of 200 MS/s. The trigger was typically set at 30-40 mv below
Channel A’s mean voltage (200 mv & depending on battery power) and 10% from the initial recorded
data. During diagnostic tests of the velocity laser-optic chronograph, the recorded measurement signatures
did not accurately reflect the bullet passage as seen in Figure 3.12. More specifically a reliable velocity
graph would clearly depict a decrease in the mean voltage resulting from the bullet tip breaking the beam
and reducing the laser coverage of the photocell, a flat base where the bullet is blocking a 4.37 mm long
region of the 14.5 mm thick 1-D sheet, and then a quick rise returning to the voltage to its baseline.
Figure 3.14 displays the configuration of the two BNC cables connecting the hi-speed
photodiodes to the model 3424 Picoscope. Each BNC cable is terminated with a 560 ohm resistor
connected via a BNC grabber clips resulting in the reduction of RC response time.
Figure 3.12: Data from Laser-Optic Chronograph without BNC termination
Figure 3.13: Data from Laser-Optic Chronograph with 560 ohm BNC terminations

20
Figure 3.14: 560 ohm terminations on Laser-Optic Picoscope
Remote Trigger Mechanism
From a safety standpoint individuals using this facility require the ability to remotely trigger the
rifle from the safety of an adjacent room. Therefore, a sealed, push style linear actuator was integrated
with a hemispherical 3 in. x 1 in. rod designed to slide across the bottom of the trigger guard and guide
the rod directly into the front surface of the trigger. Since the Remington 700 BDL rifle requires 4.25 lbf
of trigger squeeze [5] to engage the firing pin, the 8.1 lbf generated by the solenoid is ample force to
successfully fire the rifle. Figure 3.16 depicts the design improvements over the work completed by the
senior design project [8]. The first improvement includes a support rod welded inside the 90 degree angle
bar supporting the solenoid. Prior to this modification when the solenoid engaged the trigger, a noticeable
amount of deflection in the angle bar occurred. Any deflection would reduce the force pressing on the
rifle trigger and potentially result in a misfire. Therefore, the simple design improvement resolved this
problem. Further Figure 3.15 depicts the original proposed “trigger guide rod” which consisted of a band
wrapped around trigger with a rubber grommet. The grommet would reside on an adjustable length screw
extending from the hemispherical rod. The intent was to provide a direct transfer of force from the
solenoid to the trigger. Instead the direct physical contact of the solenoid to the trigger was determined to
be a safety hazard. The final design shown in Figure 3.16 is the proposed design of Figure 3.15 without
the direct contact of the hemispherical rod to the trigger. Wire from the solenoid was adhered to the room
wall in 2310 MEL into 2312 MEL and connected to a power supply. Using a 24V, 7.2A push button
power supply to generate the current necessary to remotely trigger the solenoid as shown in Figure 3.16,
research assistants were now able to safely engage the rifle with adequate standoff distance and cover
from the thick concrete wall.

21
Figure 3.15: Proposed modifications to trigger mechanism
Figure 3.16: Remote trigger power supply (left) and final solenoid assembly (right)
Transition Section
A fire extinguisher cabinet serves as the transition section between the projectile cabinet and the
pressure chamber. Supported by 4 wooden legs (2 in. x 4 in. lumber) the simple, yet effective component
fulfills multiple purposes. First it satisfies an obvious safety requirement to close the entire facility. As
per the testing SOP (Appendix E), the transition section must be in place prior to loading a bullet in the
chamber. This precaution helps prevent obstructions in the bullet path. Secondly, the 1 in. eggshell foam
lining on the inside provides an extension to the projectile cabinet further reducing the blast noise and
containing ejected muzzle blast powder. Lastly, although the majority of the fragmentation travels into the
pressure chamber, small amounts of debris are emitted backwards, containment here is critical both for
safety reasons and to protect the sensitive laser-optic system.

22
Figure 3.17: Transition section (left) and the transition section with the laser-optic chronograph (right)
Fragmentation Plate
The projectile first enters the chamber by penetrating a 2 in. square by 1/16 in. thick mild steel
breaker plate, which induces fragmentation of the lead bullet and the reactive constituents. An entry plate
holder constructed from a 3.50 in. square A36 steel plate, secured with four 1/8 in. screws, and with a 1
in. diameter hollow center securely mounts the 2 in. square breaker plate. A crucial component to testing
is selecting the appropriate plate thickness since too thick of a plate will force a premature reaction while
too thin of a plate won’t effectively disperse the bullet and its inner constituents. Experimenters at the
Naval Surface Warfare Center found that a 1/16 inch mild steel was ideal. Therefore, we set out to
confirm that this is the case in our scaled combustion facility. It is also important to note that their most
commonly used projectile was a 0.65-1.0 in. diameter sphere whereas ours is a standard .17 caliber bullet
[9]. The images in Figure 3.19 are results obtained from a Phantom v5 high-speed digital imagining
camera varying the thickness of the metal skin. The top image shows the bullet filled with 100 mg of two-
micron aluminum travelling at 1 km/s inside the pressure chamber without the use of the fragmentation
skin. The middle image shows the effects of a reactive aluminum filled bullet with the equivalent mass
and traveling at an equivalent velocity passing through a 1/16 in. metal plate. The bottom picture shows
the effects under the same conditions of a 1/8 in. metal plate. In this instance there was significantly more
reactivity both at the metal plate as well as in the airborne fragmentation. Since the goal was to initiate
fragmentation, not the chemical reaction, and concentrate a majority of the projectiles mass onto the
hardened anvil, a 1/16 in. plate was chosen as the most ideal for this application. Additionally, the thicker
the entry plate the more likely a reaction will occur outside of the chamber, and subsequently outside the
measurement reach of the pressure transducers.

23
Figure 3.18: Fragmentation plate holder (left) and mounted 2 in. diameter shaft collar with anvil (right)
Figure: 3.19: Bullet travelling at 1 km/s with no metal plate (top), a 1/16 in. metal plate (middle), and a 1/8 in. metal
plate (bottom)
Impact Surface
The type of metal, more specifically the hardness of that metal, plays a significant role in amount
of energy that performs mechanical work on a projectile and specimen as opposed to portions of the
kinetic energy transferring to anvil deformation. Similar impact energy tests at the Naval Surface Warfare
Center found 38-40 HRC for a 4340 steel anvil adequate [4]. By increasing the hardness of the metal, the
kinetic energy lost to the deformation of the metal is reduced. With the goal of selecting a cost effective,
hard metal, the final design consisted of a 2 in. diameter, 1 in. long metal disk of heat treated, air cooled
4140 steel with approximate hardness values of 50 HRC as tested on the Rockwell Hardness Tester.
Figure 3.20 shows the anvil surface before and after a test with approximately 100 mg of
aluminum travelling at 1 km/s. Anvils are stored after each test for potential future fragmentation
analysis.

24
Figure 3.20: 4140 Steel anvil surface before (left) and after (right) an impact-initiated chemical reaction
3.4 Projectile and Specimen Preparation
Custom Bullet Design
To successfully conduct impact-initiated tests of energetic materials, a transport mechanism is
necessary that can achieve velocities of 1.2 km/s or more, shelter a significant portion of the energetic
material specimen from reacting prior to impact on the anvil, and provide a stable flight path allowing for
velocity measurement and a repeatable direct surface impact. The first transport mechanism attempt in
Figure 3.21 was a .605 in. long, .171 in. diameter copper cylinder with a hollowed inner cavity. Despite
the advantage of increased capacity over using a standard .172 caliber bullet, the cylindrical design had
several inherent challenges with seating correctly in the rifle chamber and potential stability problems
travelling through the bore.
Figure 3.21: Standard Hornady, .17 caliber bullet (left) & proposed custom bullet design (right)
Figure 3.22: Final (left) & initial proposed (right) custom bullet design

25
Figure 3.23 and Figure 3.24 display a series of stress analysis tests conducted with the stress
analysis environment in Autodesk Inventor. Approximating chamber pressures of 50,000 psi at the rear of
the proposed bullet cylinder [10], Von Mises stress analysis captured likely points of failure for a bullet
machined from .171 in. diameter round stock copper. Computations showed that internal cylinder failure
was plausible potentially resulting in structural degradation while travelling inside the rifle bore and
unwanted fragmentation at the muzzle exit. Other material choices were feasible and could have provided
more structural integrity. However, after completion of a prototype (Figure 3.22) other complications
became apparent. Since typical chamber pressures for the Remington Model 700 rifles approach 50,000
psi, any obstructions preventing the escape of high velocity gas could significantly damage the rifle.
Furthermore, without the conical tip, the entire length of the cylindrical bullet would remain in contact
with the rifling and inner surface of the rifle bore. One possible outcome would be a reduction in bullet
velocity due to increased friction while another is the potential collapse of the thin bullet walls from
prolonged contact resulting in a failed test. Despite minor losses in mass transport capacity, the second
design eliminated any rifle integration or safety concerns. Standard 20 grain, .17 caliber, Hornady bullets
were machined creating a cavity capable of holding 100-300 mg. Preliminary results demonstrated that
this amount is adequate for reactive material comparison.
Figure 3.23: Von Mises Stress from 50,000 psi on proposed bullet design
Figure 3.24: Von Mises Stress from 50,000 psi on .17 caliber Hornady bullet

26
Measuring the Constituents
For each energetic material system the proportion of fuel to oxidizer or secondary energetic
constituent in the case of boron carbide systems was determined from a plausible set of products as
predicting all possible products without a more robust software package was outside the scope of this
research project. A representative example would be the Ti-B4C system where the sample mixture ratios
were created from the following stoichiometric equation:
3Ti (s) + B4C (s) → 2TiB2 (s) + TiC (s) + 680 KJ (3.7)
A Ti-B4C system reacting in argon could yield a series of condensed products (Ti, B, C, B4C, TiB, TiB2,
TiC) as well as a host of gaseous products (Ti, Ti2, B, B2, C, C2, C3, C4, C5, BC, B2C, BC2) [11]. Clearly
to balance each equation based on all known or suspected products would have been a cumbersome feat
without the use of a more advanced software packages. Given that the vast majority of tests were
conducted in air at normal room conditions (14.7 psia & 71 oF), the predominant concentration of oxygen
and nitrogen in air added another set of possible reactants to each system. A “best guess” equation of
likely products based on favorable heat of formation values was used when mixing each system. In
addition most all systems were stoichiometrically balanced with some exceptions where a fuel rich or fuel
lean mixture tested performance variations. Appendix A is a reference for the equations used to mix the
list of systems found in Appendix B.
Moisture Content
While testing an array of energetic systems certain specimens of the same composition exhibited
variations of 10-20% in performance as measured by the recorded chamber pressure. Although numerous
factors such as impact velocity, exact impact location on the breaker plate and anvil, moisture content in
the ambient air and the test specimen, and particle fragmentation patterns contribute to the measured
performance of a each sample; it seemed reasonable to a large extent that the moisture levels of mixed
powders were measurable and controllable. Moreover, the significant fluctuations in the outside air
temperature and relative humidity from May through August when the ballistic tests were conducted
made it worthwhile to investigate. Using the W-Zn-Zr system mixed in the weight ratio of
17.5%/16.0%/66.5% respectively, a series of tests varying the moisture content from 0% to 15% were
conducted to determine whether moisture levels affect the energetic performance and, if so, to what
extent.
27
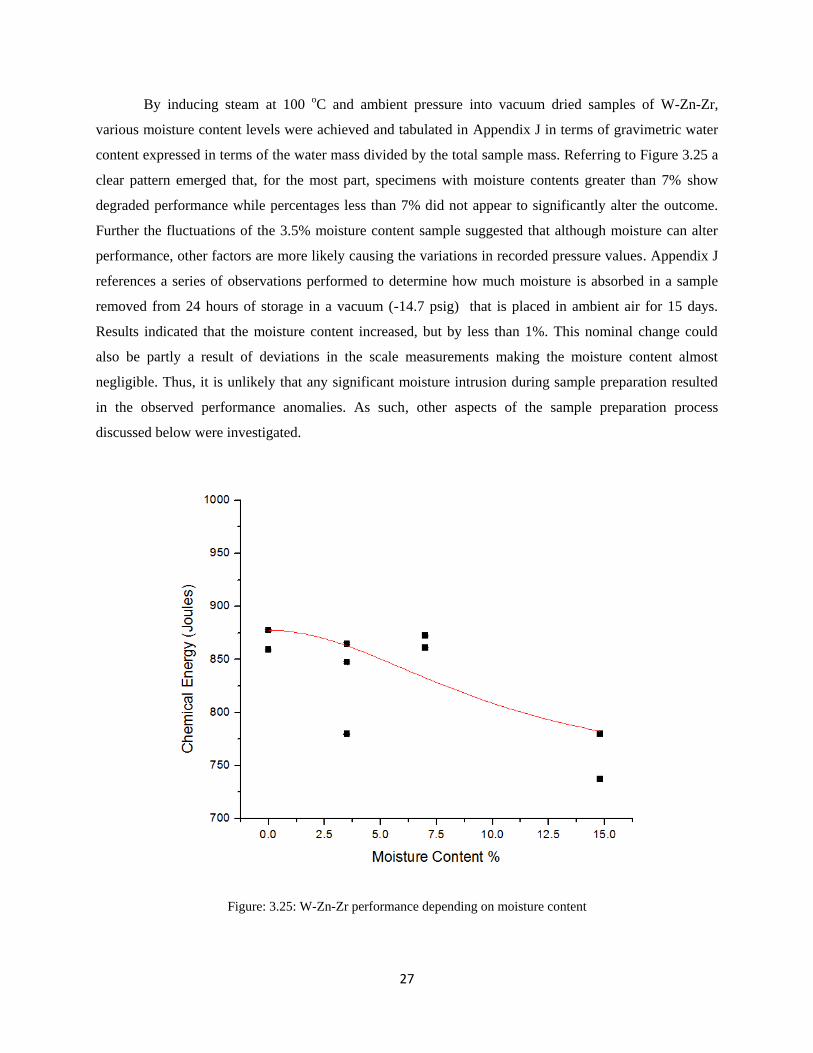
By inducing steam at 100 oC and ambient pressure into vacuum dried samples of W-Zn-Zr,
various moisture content levels were achieved and tabulated in Appendix J in terms of gravimetric water
content expressed in terms of the water mass divided by the total sample mass. Referring to Figure 3.25 a
clear pattern emerged that, for the most part, specimens with moisture contents greater than 7% show
degraded performance while percentages less than 7% did not appear to significantly alter the outcome.
Further the fluctuations of the 3.5% moisture content sample suggested that although moisture can alter
performance, other factors are more likely causing the variations in recorded pressure values. Appendix J
references a series of observations performed to determine how much moisture is absorbed in a sample
removed from 24 hours of storage in a vacuum (-14.7 psig) that is placed in ambient air for 15 days.
Results indicated that the moisture content increased, but by less than 1%. This nominal change could
also be partly a result of deviations in the scale measurements making the moisture content almost
negligible. Thus, it is unlikely that any significant moisture intrusion during sample preparation resulted
in the observed performance anomalies. As such, other aspects of the sample preparation process
discussed below were investigated.
Figure: 3.25: W-Zn-Zr performance depending on moisture content

28
Mixing the Constituents
Equally as important to conducting a repeatable experiment with the diagnostic equipment
functioning properly is creating homogenous mixtures of the fuel and oxidizer or multiple intermetallic
combinations. After weighing the correct proportions (rich, lean, or stoichiometic) from the balanced
reaction equation, a few ounces of hexane, mixture of isomers, ACS reagent >98.5% were used in
conjunction with an ultrasonic processor at an amplitude setting of 80 and run for a period of four
minutes to thoroughly mix each sample. For most specimens the hexane solution created using the
ultrasonic processor was adequate for producing homogenous mixtures. Hexane polymers are typically
nonreactive and evaporate readily under normal conditions and at an increased rate inside a vacuum. To
quickly and sufficiently remove the hexane from each sample, a 4 CFM, 1/3 HP, high performance
vacuum pump was used to create a vacuum at -100 kPa inside a Fisher Isotemp Vacuum oven. For this
application, it was unnecessary to heat the samples as the hexane evaporated at room temperature.
General practice was to prepare the samples one day, store the prepared mixtures inside the vacuum
overnight, and remove and press the powders the following day. Hexane served, in most cases, as an
adequate medium for creating homogenous mixtures. Unfortunately, systems such as W-Zn-Zr failed to
mix uniformly in part, due to large differences in material densities and settling rates leaving layers of
elements or “swirls” opposed to well-mixed samples after use in the ultrasonic processor. To resolve the
settling issues, insoluble samples unable to thoroughly mix in Hexane were mechanically hand mixed
with two, 6 mm steel balls in translucent polyethylene bottles for two minutes.
After weighing and properly mixing the reactive powders, each test sample required a facility
capable of securing the bullet while pressing the powders inside the inner cavity. Figure 3.26 is a
conceptual diagram of a proposed system where a research assistant would start by placing a series of .17
caliber bullets into a mounting block and securing it with a back plate. The assembled mounting block
would then fit to a movable base resting on the press. Similar to how an adjustable stop works on a
common table or floor drill press, a threaded rod allows the operator to raise and lower the dial
controlling the pressing force. Although not pictured, a tension scale attached in a similar manner could
accommodate the same purpose. Thus, the table sized, hand powered, miniature press could provide a
simple and effective means to construct reactive bullets for testing. Ironically since this design was
modeled after a standard drill press, the simplest solution to this phase in the sample preparation phase
was to acquire a drill press and create the necessary modifications to suit our needs. Therefore, a
personally owned Craftsman, 2/3 HP, 10 in. drill press with an adjustable base plate was an almost
complete solution as seen in Figure 3.30. Figures 3.27 through 3.30 show the sample preparation process.

29
Figure 3.26: Proposed bullet press design
Figure 3.27: Ultrasonic processor (left) and Fisher Isotemp vacuum oven (right)

30
Figure 3.28: Securing bullet inside press mount
Figure 3.29: Placing specimen powder inside bullet cavity
Figure 3.30: Pressing powder inside bullet cavity using drill press mount

31
Loading Ammunition
Following the safety requirements and standard loading procedures for rifle ammunition [12],
each casing was visually inspected for anomalies that could affect safe firing inside the rifle chamber.
Next, firmly twisting the deburring tool over the outer and inner neck of the casings removed minor
metallic burs which could inhibit the bullet insertion during loading or the casing position inside the rifle
chamber. CCI small rifle primers were then pressed into each casing using a RCBS single stage press
mounted to the testing table. Measuring 1.62 g (25 grains) of BL(C)2 Hodgon powder for each casing
provided enough propellant to achieve a muzzle velocity of 1.2 km/s (4,000 ft/s). It is important to note
that all tests exceeded the maximum BL(C)2 Hodgon powder label recommendation of 24 grains by 4%,
but that realistically, with proper precautions, the rifle chamber can handle loads that slightly exceed 24
grains. Best practices include monitoring the condition of the expended casing looking for excessive
expansion while also inspecting the primer, as flat primers are another indicator of overpressure. Firing a
few tests with a “low-end” charge of 20 grains, for example, will provide an excellent baseline for the
expended casings to use in comparison with those of greater charges to monitor for early overpressure
warnings before they cause serious damage to the rifle. Selecting the appropriate type of gunpowder and
quantity can alter the muzzle velocity of each test. Therefore, consistency is essential to both material
selection and amounts in order to achieve repeatable velocities. Although most gun powder
manufacturers annotate grain to velocity metrics on their labels, these values are often measured at a
distance of 15 feet from the muzzle and back-calculated to determine the velocity at the muzzle exit.
Generally a light coat of lubricant placed with the forefinger and thumb around the neck of the cartridges
prevents jamming inside the bullet press. The reactive material bullet was applied at the tip with clear
finger nail polish as a sealant. The final step in the cartridge preparation was the loading of the compacted
and sealed .172 caliber reactive material bullet with a rifle cartridge filled with 25 grains of rifle powder
in the RCBS press.
Effects of Atmospheric Conditions Ballistics
Complete control of the bullet speed is practically impossible. Once 25 grains of Hodgon BL-
C(2) rifle powder proved adequate in achieving 1.2 km/s, the focus was on a consistent reloading process.
Just as environmental conditions affect energetic materials, so does the environment affect the gunpowder
performance. For each powder type and atmospheric moisture content a level of moisture exists referred
to the moisture equilibrium. This moisture equilibrium will remain constant given that the moisture
content in the surrounding air remains unchanged. Typical moisture equilibriums can vary from .20
percent moisture content when the ambient air is at 10 percent humidity to 1.5 percent when the ambient
air is at 90 percent humidity [10]. Along with relative humidity, temperature changes can alter ballistic

32
Velocity T( ) V70
1 .000405 T 70( )[ ]
performance by changing the gravimetric density of the gunpowder. Generally speaking, although the
relationship may not always be linear, increases in temperature reduce the gravimetric density, but
increase the pressure and the bullet velocity. Heating gunpowder to high storage temperatures (> 140 oF)
can drive out some residual moisture; however, this procedure can also alter the burning performance of
the powder by burning off certain volatile solvents such as acetone and removing deterrent coatings from
the powder surface [10].
Mathematically the velocity in feet per second (fps) is a function of the bullet velocity at 70 oF
and the current ambient temperature (T) in degrees Fahrenheit:
(3.8)
This relationship from [10] shows that a fluctuation in 5 oF above or below would change the
bullet velocity 10 ft/s. Although this change is minor, coupled with other potential inconsistencies such as
whether the rifle powder is predominately in the front of the casing, towards the primer in the rear, or
evenly distributed could also affect the rate and level of pressure reached inside the rifle chamber.
Consistency in the type of primer and powder, the handling and storage of raw materials or prepared
bullets, the avoidance of moist environments, and the utilization of all equipment as intended such as
keeping the rifle powder in the appropriate container will help ensure that each test is within the desired
velocity parameters.

33
Chapter 4
Results and Discussion
4.1 Projectile Velocity
The amount of gunpowder in each casing strongly correlates to the muzzle velocity of the bullet
as it exits the rifle and enters the pressure chamber. After several tests using a variation of 22, 24, and 25
grain charges, 25 grains (1.6200 g) became the ideal charge that consistently and safely achieved
velocities close to 4,000 ft/s. Figure 4.1 below depicts a distribution of 74 tests conducted in air each
with exactly 25 grains of Hodgon BL-C(2) rifle powder. With a mean velocity of 3,973 ft/s and a standard
deviation of 69 ft/s, 68% of the tests resided within this range. Unfortunately, the amount of grain charge
is not the only factor affecting the bullet muzzle velocity.
Figure 4.1: Variation in bullet velocity with a 25 grain charge
3,750
3,800
3,850
3,900
3,950
4,000
4,050
4,100
4,150
0 20 40 60 80
Vel
oci
ty (
ft/s
)
Test Numbers
Velocity Data Point
Upper Limit (1 Standard Deviation)
Lower Limit (1 Standard Deviaiton)

34
A t( ) Ao
e
t
4.2 Blast Wave Analysis
Pressure and velocity are the two primary and critical diagnostic components for this research and
for determining the kinetic and chemical energy release of each reactive material system. With each
different specimen exhibiting its own unique pressure trace, impulse is one metric for relative
performance comparison. Research into blast wave performance discovered that the numeric value of the
impulse is “an important aspect of damage-causing ability” [2]. Explosive Shocks in Air dissected a blast
wave impulse into three main components: the peak, the time span for the first positive phase, and the
decay behavior. Energetic systems containing larger amounts of material are more likely to exhibit both
positive and negative phases on a pressure-time plot. In the case of our scaled facility, dealing with
relatively small amounts of energetic material constrained the pressure curves to a single positive phase
without any noticeable negative phases for an air or nitrogen based environment tests. Trace negative
phases were observed in the 40% oxygen environment.
Although the positive phase of the pressure wave impulse correlates strongly with a system’s
ability to damage a target, impulse as a unit of force-time does not translate directly into energy based
units. Figure 4.2 below shows the correlation between impulse (PSI-ms) measured and total energy
(Joules) calculated using the method outlined in Chapter 3.2 with a ratio of specific heats of 1.40 for and
pressure chamber volume of .0056 m3
Using MATLAB the decay portion of each pressure curve was fit to a logarithmic decay function
of the form:
(4.1)
where AO denotes is the peak quasi-static pressure or overpressure, e the base of natural logarithms, t the
instantaneous time, and τ the exponential time constant. The logarithmic decay function is intended to
model curves only in the positive phase and not in the negative phase when pressure drops below 0 psig.
Nevertheless, this is not a concern since the quantifiable destructive section of the blast occurs in the first
positive phase and nominal secondary negative phases were only observed in the 40% oxygen tests.
Fitting equation 4.1 to the decay section of the pressure curve 30-50 ms to after the initial blast until the
pressure returns to zero provided enough data to accurately depict the decay free from any distortions
typically recorded post-impact from shock wave perturbations and mechanical vibrations inside the
pressure chamber as seen in Figure 4.3 in blue. Further, the abrupt rise in over-pressure from the initial
shock wave was modeled as a linear curve in blue as well. The linear equation and logarithmic equation
derived from the curve fitting were used to calculate an extension, and the intersection of the two curves
yielded the maximum quasi-static overpressure of each pressure trace. This computational process was

35
repeated in MATLAB for each pressure transducer associated with the 110 energetic material systems
examined in this research.
Figure 4.2: Linear fit of total energy and impulse for 91 tests conducted in air with an R2 of .91
Figure 4.3: Sample calculation of curve fitting and intersect to determine the maximum over-pressure

36
4.3 Energy Release
As discussed in Chapter 3.3 the total energy dissipation is the summation of the kinetic and
chemical energy release of each specimen. After determining the peak quasi-static pressure from the
measured pressure data and the kinetic energy from the velocity data, the chemical energy is derived
simply as:
Total Energy = Kinetic Energy + Chemical Energy (4.2)
Figure 4.4 is a fictitious energy bar, yet it is representative of the total energy breakdown of energetic
materials used in this facility as for several of the tests in air. Approximately 25% of the energy released
is a direct result of the kinetic energy (and oxidation from relatively inert elements discussed in Chapter
4.4), while the remaining 75% is generated from the stored chemical potential of the reactive material.
Therefore, the chemical energy component is the metric of comparison as it provides a performance
gauge between different reactive materials and against the theoretical performance helping us to
understand what variations and elements enhance combustion performance. A complete tabulation of the
total, kinetic, and chemical energy release for each system can be found in Appendix B.
Figure 4.4: Hypothetical example of total energy breakdown

37
4.4 X-ray Diffraction Analysis
X-ray diffraction (XRD) was chosen as a quick, non-destructive method for analyzing several of
the residue samples from reactive materials of interest. Information on a peak intensity, width, location,
and phase position all provide indicators as to the polycrystalline structure [13] and ultimately the
material itself through the use of robust analytical software packages. Clearly, with over 100 possible
residue samples available for analysis, time became the limiting factor in the residue processing. The
Siemens D5000 XRD Diffraktometer recorded the phase angle and intensity for the systems of interest
and the MDI Jade software compared the results to over 200,000 possible chemical compounds using the
various powdered diffraction files (PDF) libraries. The challenges with this method are that non-
crystalline or amorphous structures, which lack a uniform lattice structure, are more difficult to identify
and would not be clearly apparent, except by a non-distinct “hump” in the collected data. An additional
challenge to the analysis, which would be the same for any post-processing technique, was that only small
amounts of residue were available. Starting with only 100-300 mg, the residue collected comprised
mainly of lead, smaller amounts of copper, metallic shrapnel from the anvil and inner walls of the
pressure chamber and lesser amounts of the critical reaction products. With the use of #40, #200, and
#325 sieve each residue sample was filtered down to the <44 μ level, thus removing a large proportion of
the unwanted debris from each sample. Further, a single crystal quartz, zero background holder, with a
.25 in. diameter inner cavity aided in the reduction of background noise, which was imperative when
looking for critical reaction products that in some cases only existed in trace amounts compared to the
overall sample.
From each reactive material system, one of the better performing sub-systems was chosen as a
candidate for XRD in hopes that an increased energy release would possibly enhance the production of
other less prevalent reactions and yield noticeable signatures. Processed residue samples not mentioned in
the discussion below can be found in Appendix L.
4.5 Pressure Chamber Environment
In most cases the energy released by the reactive metals originated from some level of oxidation
with the reactive specimens. Therefore, to better understand the oxidation effects different levels of
oxygen rich environments were tested using inert bullets. A 21%, 40%, 50%, 75%, and 100% by volume
oxygen rich environments were compared among each other and to a 100% rich nitrogen environment.
It’s also important to note that despite using the terminology and referring to the bullet as “inert,” the lead
and copper content do oxidize. This topic will be discussed in Chapter 4.6.

38
Variations in the volumetric proportion of oxygen inside the pressure chamber alter the level of
oxidation of energetic specimens and ultimately the energy released and the post-impact pressure
measured. To create a 50% oxygen environment and starting with ambient conditions the pressure in the
chamber was reduced to 9.91 psia and filled with pure oxygen to 15.7 psia resulting in a 50% oxygen and
50% inert (nitrogen) environment. For a 75% oxygen environment the pressure was reduced to 4.88 psia
and subsequently filled with pure oxygen to 15.7 psia resulting in a 75% oxygen and 25% inert (nitrogen)
environment. As the pressure chamber is not one solid piece, but an assembly of various components such
as the window panes, metal end plates, and a fragmentation plate mount thereby restricting the pressure
chamber’s ability to achieve a perfect vacuum seal, it’s limited to 1 psia using a ¼ HP Vacuum pump. To
achieve a near perfect oxygen environment the pressure chamber required three evacuation and fills. By
first evacuating to 27.9 in. Hg refilling to slightly above 14.7 psia for three cycles with the final cycle
being pressurized to 15.7 psia to reduce the mixing effects from outside air following penetration, a
99.9% pure oxygen environment was achieved.
4.6 Inert Baseline Tests
Averaging the total energy results from five inert tests conducted in air with the standard .17
caliber Hornady bullet resulted in a total energy output of 386 J. This value was initially thought to solely
represent the kinetic energy transferred into measurable shock waves and pressure perturbations inside the
chamber. The terminology of “inert” or baseline test is somewhat deceiving as a copper coated, lead
bullet with a conical polymer tip undergoes a chemical reaction which became increasingly apparent in
oxygen rich environments as seen in Figure 4.5. Contributing chemical energy components were the
formation of PbO and possible trace amounts of PbO2 and FeN resulting in the measurable amount energy
release. Since each residue sample is predominately lead, this left only 8-20% of the mass for the
energetic materials depending on the sample density. Therefore, conclusive XRD results for certain
compounds are unlikely as phase angles are often shared with either Pb, PbO, or Cu, which are in
abundance (Figure 4.6). Excluding the mass associated with polymer tip and the copper jacket the
standard .17 caliber Hornady bullet contains approximately 1.10 g of Pb. Considering Equation 4.3 a
bullet would yield 1154 J of energy if 100% of the lead combusted. Figure 4.5 shows that 13% of the
bullet reacts in air while 45% of the bullet reacts in a 100% oxygen rich environment resulting in the
formation of PbO.
2Pb (s) + O2 (g) → 2PbO (s) ΔH= -217.3 KJ/mol (4.3)

39
Figure 4.5: Standard .17 caliber Hornady bullet tested in various environments
Figure 4.6: Standard .17 caliber Hornady bullet tested in a 40% oxygen environment (Test #105)

40
Fuel
Oxidizer
Mixture
Fuel
Oxidizer
Stoich
4.7 Copper(II) Oxide Systems in Air
Tests outlined in Chapter 4 and Chapter 5 were conducted on a constant volume basis where each
bullet cavity (.035 cc) was completely filled with reactive material, pressed, and sealed. Appendix K takes
into account the units of energy output per volume (J/cc) for all discussed systems. However, for
simplicity many of the charts in this paper will only refer to joules as the energy output.
A -325 mesh, <44 μ, copper(II) oxide powder served as an oxidizer for various fuels and was
mixed with 2-3µ zirconium, <44 µ tungsten, <44 µ titanium, <2 µ tantalum, <44µ hafnium, 3 µ
aluminum, and 80 nm aluminum powder. The first objective was to understand how a rich versus lean
mixture can affect the results for a well-known oxidizing metal. Aluminum-copper(II) oxide was selected
as the system to study and mix in rich, lean, and stoichiometric proportions to understand how
stoichiometry affects combustion performance.
Stoichiometric reaction for aluminum:
2Al (s) + 3CuO (s) → Al2O3 (s) + 3Cu (s) + 1204 KJ (4.4)
To gauge the performance effects of changes in the fuel, rich and lean Al-CuO ratios were
calculated using the stoichiometric equation as a baseline. Samples labeled “rich” were mixed using an
equivalence ratio, ϕ, of 2 while the “lean” samples were based on a ϕ of 0.5.
(4.5)
As anticipated the rich Al-CuO mixture outperformed all other Al-CuO systems, and the
stoichiometrically balanced mixture outperformed the lean mixture. To put the energy enhancement in
perspective, by quadrupling the amount of aluminum (by mass) in the rich mixture increases the chemical
energy output by a factor of 2.5 over that of the lean mixture. Additionally and although not conclusive as
the nanoscale results are of a single test, a strochiometric mixture of 80 nm aluminum powder did not
contribute to an improvement in the combustion performance of the Al-CuO system over the 3 µ
aluminum powder. In the absence of a nanoscale copper(II) oxide, a 44 µ powder acted as an oxidizer, but
most likely served as the limiting factor to improved performance. Recommendations for future tests

41
would be to conduct a series of nanoscale tests using both nano size powder for the fuel and the oxidizer.
Another peculiar result for the Al-CuO oxide system as per Figure L.3 in Appendix L is that the Al2O3
was not distinctly visible in the XRD analysis because the Al2O3 peaks shared phase peaks with other
materials such as copper.
Figure 4.7 and Figure 4.8 show the graphical relationship for the Al-CuO systems as well as other
metallic fuels. Titanium is one of the best performers in the copper(II) oxide series. Titanium and
copper(II) oxide were prepared under the assumption that the process yielded titanium(IV) oxide and
copper in an exothermic reaction. The XRD results indicated minor traces of titanium(IV) oxide and the
disproportionally large release of energy suggests that oxidation of titanium was likely. Also of interest is
the relatively high reaction level of the zirconium, hafnium, and aluminum in each of their respective
systems. In comparison to the maximum theoretical value, zirconium exhibited 77% reaction completion,
74% for hafnium, and 58% for aluminum. These are very optimistic results and demonstrate that
velocities of 1.2 km/s are sufficient for achieving significant levels of reactive material combustion in our
facility. In comparison, to the 13% of lead combustion in air as discussed in Chapter 4.6, it is reasonable
to argue that the compressed reactive material powders react more readily than the solidified lead bullet.
Figure 4.7: Energy release from various CuO combinations

42
Figure 4.8: Energy release per gram from various CuO combinations
After studying the results another system of interest is Ta-CuO. Tantalum’s poor performance at
1.2 km/s in the Naval Surface Warfare Center apparatus as outlined in Chapter 2.2 and its extremely high
boiling point at 3007 oC second only to tungsten at 3414 oC made even a moderately exothermic reaction
seem unlikely [14]. However, comparing the results the Ta-THV mixture released 645 J/g of chemical
energy while the Ta-CuO mixture yielded 1803 J/g. With the energetic output increasing by a factor of 3
the most reasonable conclusion is that the oxidation of tantalum is necessary and does occur to achieve a
reasonable level of energy output. This observation is also apparent in the Ta-B4C system as discussed in
Chapter 4.11.

43
4.8 Tungsten-Zinc-Zirconium Systems in Air
An intermetallic mixture comprised of tungsten, zinc, and zirconium was extensively tested by
varying the weight percentages of tungsten, zinc, or zirconium in the same constant volume process as
discussed in Chapter 4.7. Each powdered metal was selected so as to provide an important component to
the overall energetic system. A -325 mesh (44 μ) powdered tungsten, -325 mesh powdered zinc, and a 2-3
μ powdered zirconium mixed in different percentages created ten different W-Zn-Zr subsystems with the
addition of a few W-Zr subsystems for examination. As an extremely dense metal, tungsten provided the
mass necessary to increase the kinetic energy when confined to a small volume of the sample cavity in
each bullet. The addition of zinc is thought to increase the production of gas following the impact,
ultimately leading to higher measurable overpressures. Of the transition metals zinc has one of the lowest
melting points at 420 oC and boiling points at 907 oC while zirconium has a much higher melting point of
1854 oC and boiling point of 4409 oC and tungsten even higher with a melting point of 3414 oC and a
boiling point of 5555 oC [14]. Zinc is also known to oxidize into forms such as zinc oxide (ZnO) and zinc
nitrate (N2O6Zn), which made it an important component to the experimental system. Lastly, zirconium
has been commonly tested in other energetic applications due to its ability to readily react with the
oxygen forming zirconium(IV) oxide (ZrO2) making it one of the top performing energetic metals. Also
of interest in the tri-metallic system is whether tungsten reacts either with the other metals or with the
environment (nitrogen or oxygen). Thus, a W-Zn-Zr system has the potential to be a highly energetic
system given our intent to combined density and gas production with an exothermic reaction. Figure 4.9 displays the results from dozens of W-Zn-Zr subsystems where variations of each
constituent contributed to a change in the total energy deposited. The differences in the total energy
amount to at most 100 joules making drawing conclusions challenging. A 18/33/50% of W-Zn-Zr
respectively resulted in the highest performing energetic combination for this system averaging a total
energy output of approximately 1,000 J. Unfortunately on a chemical energy basis, the relatively close
proximity of the results make distinguishing the effects of consentient combinations on chemical energy
output difficult.
A better metric for comparison is to consider the energy output per unit mass for each system. Figure 4.10
below highlights the results from the ten W-Zn-Zr or W-Zr systems. In review of W-Zn-Zr system the
most apparent trend, above all other material variations, is that by increasing the proportion of zirconium
in the samples the system yields a higher energy output measured in joules per gram. This is observable
when comparing W-Zn-Zr 18/45/38% to 10/33/57% to 17/16/67% to 5/16/79% where each specimen
contained an equal or greater quantity of zirconium resulting in a more exothermic reaction.

44
Figure 4.9: Chemical energy release from various W-Zn-Zr combinations
Figure 4.10: Energy release per gram from various W-Zn-Zr combinations

45
Figure 4.11: XRD results from various W-Zn-Zr 17/16/67% combinations (Test# 31, 43, 58, 51)
Figure 4.11 is the XRD analysis for W-Zn-Zr 17/16/67% as numerous tests of this system
resulted in a large collection of residue allowing the use of the .50 in. diameter quartz zero background
holder. Although challenging to discern from multiple shared phase angles, the XRD analysis detected
possible traces of both ZnO and Zr0.5W0.5O2, which offered insight into how this system performed
slightly better than others. In an effort to better understand whether tungsten reacts exothermically to form
either Zr0.5W0.5O2 or WO2 or WO3 and contribute to the measured quasi-static pressure, a series of Zr-W
tests were conducted allowing for the isolation of any potential tungsten energy release. Figure 4.12
depicts the results of 2-3 µ powdered zirconium and <1 µ powdered tungsten mixed in various ratios and
comparing the theoretical energy release of the zirconium metal in the form of:
Zr (s) + O2 (s) → ZrO2 (s) + 1101 KJ (4.6)
Results indicate that for the 50/50 and 40/60 Zr-W systems that the actual release of energy is only 55%
of the theoretical zirconium energy release. However, for the Zr-W ball milled specimen the outcome was
surprisingly different as the measured results exceed the theoretical results by 31 joules. Taking into

46
account the fact that the zirconium in the Zr-W ball milled specimen is not going to release an energy
equivalent to its theoretical maximum this left approximately 390 J of energy that did not originate from
the formation of ZrO2. Figure 4.13 shows the XRD analysis of the residue and although quantities of pure
tungsten were detected so were traces of Zr0.5W0.5O2 as several phase angles were not shared by any other
compounds or element. To sum up, the reaction of tungsten would require further testing to definitively
prove, yet both the XRD analysis and the recorded pressures indicate the strong likelihood that tungsten
reacts exothermically.
Figure 4.12: Comparison of the theoretical zirconium energy release to the measured Zr-W energy release

47
Figure 4.13: XRD results for a Zr-W 66/33% ball milled sample (Test#19)
4.9 Tungsten-Zinc-Hafnium Systems in Air
Similar to the W-Zn-Zr system, tungsten was replaced with hafnium and mixed in increasing
amounts for three different systems. With 1145 KJ/mol released for the formation of HfO2 compared to
1101 KJ/mol for ZrO2, the energy release using either zirconium or hafnium are very comparable yet
hafnium is twice as dense at 178.5 g/mol compared to 91.2 g/mol for zirconium. Figure 4.14 compares
and contrasts the two different experimental systems. At first glance it appears as though in some
situations zirconium outperforms hafnium while in others the opposite is true. When considering the
amounts of zirconium and hafnium in each test (i.e. there are 115 mg of hafnium versus 71 mg of
zirconium in the 18/45/37% system) and their respective energy output per gram, the results below may
not justify zirconium outperforming hafnium. Therefore, other aspects were considered.

48
Figure 4.14: Comparison of W-Zn-Hf and W-Zn-Zr experimental systems
As expected Figure 4.15 shows that the energy output per gram of zirconium exceeds that of
hafnium, thus in many cases making the W-Zn-Zr system a better choice both in terms of overall energy
output and energy to weight ratio in practical application. Due to the increased mass (300mg versus
200mg) for specimens containing hafnium, the hardened steel anvils experienced greater penetration. The
average penetration depth for a hafnium filled bullet was 5 mm compared to 1-2 mm for other specimens.
With this in mind, it’s reasonable to assume that a greater proportion of the kinetic energy is transferred
into the mechanical deformation of the anvil than to the generation of “hot spots” in the reactive material.
This less favorable energy transfer is a result of the hafnium requiring hardness greater than the 50 HRC
achieved from heat treating the 4140 steel anvils. The heat treatment of the 4140 steel proved to be a cost
effective approach to a relatively high level of hardness; however, future tests with dense metals would
require a hardness greater than 50 HRC to avoid the energy loss due to penetration.
49
Figure 4.15: Comparison of W-Zn-Hf and W-Zn-Zr systems in Joules/gram
Figure 4.16: XRD results for a W-Zn-Hf 5/16/79% sample (Test#39)

50
Similar to the W-Zn-Zr investigation, part of the interest with the W-Zn-Hf system was to
determine whether the increased exothermic nature of hafnium over zirconium could create an
environment and achieve a temperature or activation energy that would yield a tungsten reaction. Unlike
the XRD results for W-Zn-Zr, the W-Zn-Hf analysis did not show similar formations of tungsten oxides
or indicators of ZnO (Figure 4.16). Again, the presence of these compounds is still likely, yet the “dirty”
intensity-phase plots with numerous overlapping phase angles and materials exhibiting multiple, small
intensity peaks made post processing challenging and often inconclusive for some materials.
4.10 Potassium Perchlorate Systems in Air
Potassium perchlorate, KClO4, is a white crystalline solid that is widely used in explosives and
propellants due to its ability to readily transfer oxygen to reactive metals resulting in significant
exothermic reactions. Potassium perchlorate itself is relatively stable, yet the additional oxygen atoms
create a system that enhances the oxidation above that of air with 21% oxygen by volume. Oxidizers such
as potassium chlorate, KClO3, are available and oxidize very readily. Since potassium perchlorate has an
activation energy 50% greater than that of potassium chlorate, it is a much more stable and safe oxidizer
to handle in a university laboratory setting [15]. Figure 4.17 serves as an excellent example of where
hafnium tested in air is compared to a Hf-KClO4 system tested in air. With only 47% hafnium by mass in
the Hf-KClO4 mixture (149mg) compared to the pure hafnium (313 mg) system, it’s apparent that the
potassium perchlorate significantly enhances the oxidation of hafnium in the formation of hafnium oxide,
HfO2.
Figure 4.17: Energy release of hafnium versus a Hf-KClO4 system

51
Using results from Chapter 2.2 as a reasonable reference the graphical summary in Figure 4.18
and Figure 4.19 are interesting in that tantalum demonstrates a moderate level of performance, which is
unusual given previously published results as referenced in Chapter 2.2 where zirconium, tantalum,
tungsten, and hafnium underwent similar testing mixed with various fluoropolymers. To better understand
the reaction process of KClO4 with the various metals, the Hf-KClO4 system residue, the most exothermic
of this series, was analyzed to determine reaction products using X-ray diffraction. The results in Figure
4.20 show that HfO2, KCl, and KO2 are likely products and primary contributors to the measured
chemical energy release of this system.
Proposed stoichiometric system reaction for chemical mixing:
2Hf (s) + KClO4 (s) → KCl (s) + 2HfO2 (s) + 2293 KJ (4.7)
Figure 4.18: Chemical energy release for various KClO4 systems

52
Figure 4.19: Energy release per gram for various KClO4 systems
With the results from Figure 4.20 indicating an additional, unsuspecting product, KO2, the equation below
provides an explanation. Energy transferred from the impact and the chemical reaction of hafnium could
likely result in the dissociation of KClO4 into KO2(s) and ClO2(g).
Plausible balanced system reactions given XRD results:
3Hf (s) + KClO4 (s) + O2 (g) → KCl (s) + 3HfO2 (s) + 3438 KJ (4.8)
392 KJ + KClO4 (s) → KO2 (s) + ClO2 (g) (4.9)

53
Figure 4.20: XRD results for the Hf-KClO4 system (Test #72)
Given that the Hf-KClO4 system had an average of 207 mg for the two tests examined, the
maximum theoretical chemical energy release based on the plausible reaction above would yield 960 J.
This conclusion seems reasonable as energy losses such as those discussed in Chapter 3.1 and possible
secondary endothermic reactions reduce that value to approximately 572 J as seen in Figure 4.18.
Unlike the Ta-CuO system, Ta-KClO4 performs unsuspectingly well and better than the Zr-
KClO4 in terms of total energy output. If the tantalum were to fully oxidize into Ta2O5, the reaction would
yield 2046 KJ/mol in comparison to 1145 KJ/mol for complete oxidation of zirconium into ZrO2.
Although the tantalum system outperformed the hafnium system, it was not by a factor of 2 as the
theoretical case would indicate for a complete reaction. Therefore, the formation of Ta2O5 in significant
amounts is unlikely and was not detected in the XRD analysis as seen in Figure 4.21. In contrast, unique
phase angles for TaN and TaO were apparent and demonstrated the likelihood of these compounds as
reaction products. According to S.P. Garb et al. in The O-Ta (Oxygen-Tantalum) System the formation of
tantalum and oxygen in the metastable phase TaO is typically only found in kinetically influenced
processes. In fact, any form outside of the stable Ta2O5 requires such an influence [16]. Since TaO is not
the most stable combination of tantalum and oxygen, it requires 251 KJ/mol to form from its elements

54
while TaN yields 251KJ/mol during the reaction. At 3433 J or 621 KJ/mol of tantalum (reactant), the Ta-
KClO4 system releases enough energy to initiate the endothermic formation of TaO.
Proposed stoichiometric system reaction for chemical mixing:
8Ta (s) + 5KClO4 (s) → 4Ta2O5 (s) + 5KCl (s) + 8202 KJ (4.10)
Plausible unbalanced system given XRD analysis and experimental results:
Ta (s) + KClO4 (s) + (O2 (g) +3.76N2 (g)) → O2 (g) + KCl (s)
+ TaN (s) + Energy (4.11)
Energy + Ta (s) + O2 (g) → TaO (s) (4.12)
Figure 4.21: XRD results for the Ta-KClO4 system (Test #57)

55
4.11 Boron Carbide Systems
Boron carbide (B4C) is another system of interest and the one most extensively studied in this
research. Boron carbide is a unique material since it exhibits extreme hardness, resistance to chemical
agents, and a low specific weight creating numerous practical applications such as bullet proof vests, tank
armor, and coatings for cutting tools. Boron carbide is also known to increase its levels of oxidation with
an increase in temperature making it unsuitable for some practical applications but interesting for our
purposes [17]. Figure 4.22 shows only residual amounts of nitration while the primary energy release
originates from the moderate level of oxidation in air and enhanced levels in a 40% oxygen environment.
At 2237 J in a 40% oxygen environment the boron carbide energy release is 69% of its maximum
theoretical value of 3232 J compared to only 300 J of energy release in air at 9% of the theoretical energy
release. The energy release here is significantly less in air than those discussed in Chapter 4.7 for the CuO
systems. One hypothesis is that the energy required to break apart the boron carbide molecules and fully
oxidize the boron and carbon atoms is not sufficient at 1.2 km/s. However, in limited amounts in air and
at a greater percentage in 40% oxygen, the 4-7 µ boron carbide powder oxidation most likely occurs in
the form of:
B4C (s) + 4O2 (g) → 2B2O3 (s) + CO2 (g) + 2878 KJ (4.13)
Figure 4.22: Chemical energy release from various boron carbide combinations

56
Figure 4.23: Chemical energy release from various boron carbide combinations in air
Figure 4.24: Chemical energy release per gram from various boron carbide combinations in air

57
Reviewing the results from Figure 4.23 and Figure 4.24, the boron carbide reaction with oxygen
alone does not account for the full energy release of each respective system. With boron carbide reaching
only 10% of its theoretical value in air, the expected 4852 J/g of energy output for boron carbide was used
to calculate the contribution of boron carbide in each system assuming the boron reacted solely with air at
10% of complete reaciton (Figure 4.25). In each case the metallic component of the titanium, zirconium,
and hafnium boron carbide systems oxidizes or nitrates in air or forms borides and releases relatively
large amounts of energy while the refractory metals tungsten and tantalum show similar promise with
lesser energy output per mole.
Figure 4.25: Chemical energy release for boron carbide systems based on experimental results
Tantalum and tungsten with their strong interatomic bonding and high melting temperatures of
3017 oC and 3414 oC respectively tend to resist chemical reactivity until extremely high temperatures are
reached [18]. This result is apparent in Figure 4.25 where tantalum and tungsten performed relatively
poorly in comparison to other systems. Even a substitution of <1 µ for < 44 µ tungsten only slightly
improved the chemical contribution of tungsten while titanium, zirconium, and hafnium boron carbide
systems demonstrated significant energy release. Further, hafnium and titanium boron carbide were

58
among the top five performers in terms of energy output and zirconium of all systems examined in this
paper and titanium boron carbide were the top two performers in terms of energy output per mass. A
complete discussion of top performers is found in Chapter 5.
The relatively high exothermic nature of the Ti-B4C system is attributed to the highly reactive
nature of both titanium and boron carbide at elevated temperatures. As discussed previously, boron
carbide oxidizes readily at elevated temperatures. Similarly, titanium exhibits increased levels of chemical
reactivity in higher temperature regimes [18]. XRD analysis for Ti-B4C in air contained unique phase
angles for B2O3 and TiO2 in the residue with minor traces of C3N4 and Ti2N. Of interest is the 40%
oxygen system for Ti-B4C as several distinct phase angles are likely the result of Ti3B4 formation in the
products while peak intensities for Ti3B4 were not detected in air (Figure 4.26). Ti2O3 has a heat of
formation of -1521 KJ/mol while TiO2 has a value of -944 KJ/mol both in crystalline form. Moreover,
B2O3 has a value of -1274 KJ/mol, BN a value of -251KJ/mol, TiB2 a value of -279 KJ/mol, TiC a value
of -184 KJ/mol, and Ti2N a value of -122 KJ/mol. To add to the uniqueness of titanium, it is one of the
few metals that burns in nitrogen at temperatures of 800 oC [19]. Thus, the exothermic nature of most all
the possible products increased the probability that a large percentage of the prepared sample would react
exothermically either with the surrounding environment or as a binary system.
Figure 4.26: XRD results for the Ti-B4C system in 40% oxygen (Test #108)

59
To examine this process further the entire boron carbide system was tested in a 100% nitrogen
environment as well as in air. Figure 4.27 shows minor, yet measurable energy output for each boron
carbide system in nitrogen. The pure boron carbide test demonstrates that various nitrides such as BN and
C3N4 are possible as chemical reactions are measured. Unfortunately, BN shares multiple phase angles
with that of copper making assurance of its presence impractical with XRD analysis. Based on the
experimental pressure results and the XRD analysis in Figure 4.26 and Figures 4.29-4.34 the B4C reacted
primarily with the oxygen forming B2O3 (s) and CO2 (g) (assumed but not confirmed) for all tests
conducted in air. C3N4 is an endothermic reaction and the phase angles which represent C3N4 are shared
with B2O3 and PbO making a definitive conclusion impossible again through XRD analysis. However, G.
Goglio explained in “State of Art trends in bulk carbon nitride synthesis” that the nitration of carbon can
occur through various mechanosynthesis processes where “[t]he involved mechanisms are related to the
high intergranular pressure associated with high temperature due to collisions and frictions phenomena
during the grinding process. In this sense, despite of the fact that experimental pressure and temperature
conditions are moderate, the local pressure and temperature are very high which allows classifying this
process as a high pressure-like” [20]. The paper goes on further to discuss in high energy ball milling as a
viable mechanosynthesis process for the formation of C3N4 as well as the influence of dynamic pressures.
Figure 4.27: Chemical energy release contributions for boron carbide compared to the metallic component

60
Estimates place a reactive material bullet travelling at 1.2 km/s experiencing up to 62 MPa or 9,000 psi at
the point of impact on the anvil. Thus, the localized pressure, energy, and friction of B4C particles at the
point of impact in a nitrogen heavy environment (air) could yield C3N4 or other variation of the carbon
nitride. In contrast, if the reaction of nitrogen and boron were to proceed as follows without the formation
of C3N4:
B4C (s) + 2N2 (g) → 4BN (s) + C + 941 KJ (4.14)
the results in Figure 4.27 show that BN would only be performing at 9% of its theoretical energy release
of 1038 J for a 61 mg sample. Since all the binary boron carbide systems exceed the pure boron carbide
system in energy release, metallic borides, carbides, and nitrides are conceivable products. As for the case
of pure hafnium, the exothermic formation of a hafnium nitride can be ruled out as pure hafnium was
tested in 100% nitrogen yielding no measurable energy release (Figure 4.28). Figure 4.28 also shows that
at 1244 J the combustion of hafnium in a 40% oxygen rich environment is 62% of the theoretical energy
release of 2008 J while only 13% in air at 257 J. Referring back to previous discussions in Chapters 4.7
and 4.11that either through a 40% oxygen rich environment or the addition of powdered oxidizers with
the metal, high-levels (>60%) reaction efficiencies can be achieved.
Figure 4.28: Chemical energy release of hafnium in various environments

61
Given the current post processing methods and the limited amount of residue to process, the
following set of unbalanced global equations are plausible reaction systems:
Ti-B4C
Ti (s) + B4C (s) + (O2 (g) +3.76N2 (g)) → TiB2 (s) + B2O3 (s)
+ TiO2 (s)+ BN (s) + C3N4 (s) + Ti2N (s) + CO2 (g) + Energy (4.15)
Ta-B4C
Ta (s) + B4C (s) + (O2 (g) +3.76N2 (g)) → TaC (s) +Ta2O5 (s) + B2O3 (s)
+ BN (s) + CO2 (g) + C3N4 (s) + Energy (4.16)
W-B4C
W (s) + B4C (s) + (O2 (g) +3.76N2 (g)) → WO3 (s) + B2O3 (s) + BN (s) + CO2 (g)
+ C3N4 (s) + Energy (4.17)
Zr-B4C
Zr (s) + B4C (s) + (O2 (g) +3.76N2 (g)) → ZrO2 (s) + B2O3 (s) + BN (s) + CO2 (g)
+ C3N4 (s) + Energy (4.18)
Hf-B4C
Hf(s) + B4C (s) + (O2 (g) +3.76N2 (g)) → HfO2 (s) + HfC (s) + B2O3 (s)
+ BN (s) + CO2 (g) + C3N4 (s) + Energy (4.19)

62
Figure 4.29: XRD results for the Ti-B4C system in air (Test #80)
Figure 4.30: XRD results for the Ta-B4C system in air (Test #88)

63
Figure 4.31: XRD results for the Zr-B4C system in air (Test #42)
Figure 4.32: XRD results for the W-B4C system in air (Test #82)

64
Figure 4.33: XRD results for the Hf-B4C system in air (Test #41)
Figure 4.34: XRD results for the Hf-B4C system in 100% nitrogen (Test #93)

65
In review of all boron carbide systems and environments it is apparent that oxidation is still the
greatest contributor to exothermic reactions. Figure 4.35 compares all environments and shows that
doubling the oxygen content from air at 21% oxygen to a 40% oxygen environment doubles the energy
output of titanium, zirconium, and hafnium boron carbide systems. Figure 4.35 also shows that the
nitration levels are only minor contributors at best to the overall energy release. With the high level of
reactivity in the 40% environment tests, the measured pressures were surprisingly high in the range of 20-
30 psig, which approached or exceeded the design limit for some of the pressure transducers. Therefore,
further testing in enriched oxygen environments would require the use of pressure transducers with a
greater pressure range.
Figure 4.35: Chemical energy release of all tested boron carbide systems in various environments

66
4.12 Bismuth Oxide Systems in Air
Experimentation with bismuth oxide system provided an additional opportunity to investigate
tantalum and tungsten in relation to the previous set of systems. Results from tests conducted with
tungsten, tantalum, and hafnium bismuth oxide are tabulated in Figure 4.36. The two extremes are of no
surprise in that tungsten performed poorly with little to no oxidation while the oxidation of hafnium
yielded the largest energy release with just over 400 J of measured chemical energy.
Figure 4.36: Chemical energy release from various bismuth oxide combinations in air
Of interest, again, is the high-energy release from the Ta- Bi2O3 system, which rivals Hf-Bi2O3.
Although previous XRD analysis on tantalum systems did not reveal the formation of tantalum oxides,
it’s possible that both tantalum and tungsten combust and assume amorphous structures. Unfortunately,
non-crystalline structures are undetectable using XRD. Nonetheless, the performance of tantalum
suggests that tantalum readily oxidized yielding a significant energy output relative to Hf-Bi2O3.
Plausible reaction given experimental pressure results:
6Ta (s) + 5Bi2O3 (s) → 3Ta2O5 (s) + 10Bi (s) + 3269 KJ (4.20)

67
Processing the Hf-Bi2O3, the most exothermic reaction of the bismuth oxide systems, provided an
understanding as to whether the reaction behaved as expected. Figure 4.37 displays the XRD results and
as expected HfO2 and Bi were detected in the residue with small traces of Bi2O3 that failed to react.
Plausible reaction given experimental pressure results:
3Hf (s) + 2Bi2O3 (s) → 3HfO2 (s) + 4Bi (s) + 2286 KJ (4.21)
Figure 4.37: XRD results for the Hf-Bi2O3 system (Test #78)

68
Chapter 5
Conclusions
5.1 Recommendations for Future Studies
A wide range of binary and tertiary reactive material systems were proposed and experimentally
tested in the scaled combustion facility. The facility demonstrated a capacity to withstand scores of tests
and provide a high level of experimental repeatability despite specimen samples only ranging from 100-
300 mg in mass. The facility also performed well under the different environmental conditions.
Additional testing in 40% oxygen would require the use of flame resistant material over the two
polycarbonate windows or their replacement altogether. The enhanced combustion during these tests
resulted in the superficial burning of the windows.
Of the 110 tested reactive material and inert systems, tungsten was an element of interest as
significant levels of combustion are rare. In most cases a reduction in particle size with the <1 µ over the
< 44µ tungsten powder or an alternative oxidizing agent created no significant improvements. The W-Zn-
Zr 18/33/50% system’s arrangement provided the optimal amount of each primary element maximizing
combustion. Again, XRD analysis on the residue was not conclusive as the presence Zr0.5W0.5O2 or other
tungsten oxides were not definitive and the formation of ZnO (g) is undetectable, which could attribute to
the high-level of performance. The one exception to this trend of inclusiveness was the results for the
single Zr-W (66/33%) ball milled specimen. This binary system demonstrated a level of performance that
could not be explained by the zirconium alone as the energy release exceeded zirconium’s theoretical
maximum. Further tests with ball milled specimens of different tungsten and zirconium ratios could
generate supporting evidence that high impact alloying is the sample preparation “ingredient” required to
achieve higher levels of tungsten reactivity.
Further, additional post processing on the Ti-B4C residue by X-ray fluorescence or chemical
detection should assist in determining the different products as XRD failed to detect non-crystalline
structures and residue samples with multiple products became “crowded” and complicated to process.

69
5.2 Best Performing Systems
Figure 4.38 and 4.39 display the top ten systems in terms of energy output in joules and energy
output per mass in joules/gram. The results herein provide a reference for follow-on research into
dissecting each system and understanding the specifics into what makes these optimal.
Figure 5.1: Top 10 performers in terms of chemical energy (J)

70
Figure 5.2: Top 10 performers in terms of chemical energy per mass (J/g)

71
References
1. Committee on Advanced Energetic Materials and Manufacturing Technologies. Advanced
Energetic Materials. National Academy of Sciences. The National Academies Press. 2004. 20-23.
2. Kinney, Gilbert. Explosive Shocks in Air. United States Naval Postgraduate School, Monterey
California. The Macmillan Company, 1962.
3. Ames, Richard and Samuel Waggener. “Reaction Efficiencies for Impact-Initiated Energetic
Materials.” Naval Surface Warfare Center, Dahlgren Division. Proceedings of the 32nd
International Pyrotechnics Seminar. Jun 2005.
4. Lee, R.J. W. Mock, J.R. Carney, W.H. Holt, G.I. Pangilinan, R.M. Gamache, J.M. Boteler, D.G.
Bohl, J. Drotar, and G.W. Lawrence. “Reactive Materials Studies.” Naval Surface Warfare Center,
Indian Head & Dahlgren Division.
5. Felts, Josh. “Experimental Investigations for Initiating Reaction of High Speed Aluminum in
Gaseous and Liquid H2O.” Master’s Thesis in Mechanical Engineering at the University of Illinois
at Urbana-Champaign. 2006.
6. Ames, Richard. “Vented Chamber Calorimetry.” Naval Surface Warfare Center, Dahlgren
Division. Proceedings of the 43rd AIAA Aerospace Science Meeting. Jan 2005.
7. Headquarters, Department of the Army. TM 43-0001-28. Army Ammunition Data Sheet. Apr 1994.
8. Ali, Mudasir, Michael Hernandez, Laura Nagel, and David Tersch. “Mini Pig: Design of a Scaled
Reactive Material Test Apparatus.” Senior design final project in Mechanical Engineering at the
University of Illinois at Urbana-Champaign, Dec 2006.
9. Lee, Richard Dr. Dynamics & Diagnostics Division, Research & Technology Department, Naval
Surface Warfare Center, Indian Head Division. Phone conversation on 12 Feb 2010.
10. Accurate Arms Company. Accurate Smokeless Powder Loading Guide. Wolfe Publishing
Company, 1994.
11. Gordienko, S.P. “Thermodynamic Analysis of the Reaction of Titanium with Boron Carbide in a
Self-Propagating High-Temperature Synthesis Regime.” Powder Metallurgy and Metal Ceramics,
Vol 38, Nos. 3-4, 1999.
12. Blount, Inc. Sporting Equipment Division. Speer Reloading Manual Rifle and Pistol. Fourth
Printing, Nov 2001.
13. Speakman, Scott. “Basics of X-Ray Diffraction: Self User Training for the X-Ray Diffraction
SEF.” Power Point slides prepared by author and accessed at http://prism.mit.edu/xray. Nov 2010.

72
14. The Chemical Rubber Company. CRC Handbook of Chemistry and Physics: 86th Edition.
Chemical Rubber Publishing Company. 2005.
15. Journal of Pyrotechnics, Inc. Pyrotechnic Chemistry: Pyrotechnic Literature Series Version 4.
Journal of Pyrotechnics, Inc. 2004.
16. Garg, S.P., N. Krishnamurthy, A. Awasthi Bhabha Atomic Research Centre, and M. Venkatraman
Naval Chemical and Metallurgical Laboratory. “The O-Ta (Oxygen-Tantalum) System.” Journal
of Phase Equilibria Vol. 17 No. 1, 1996.
17. Li, Y.Q. and T. Qiu. “Oxidation behavior of boron carbide powder.” Material Science and
Engineering A 444 (2007) 184-191. 2006.
18. Callister, William. Materials Science and Engineering an Introduction: Fifth Edition. Von
Hoffman Press. 2000.
19. Rossi, Auguste. “On the Manufacture of Ferro-Alloys in General and of Ferro-Titanium in
particular in the Electric Furnace.” Electrochemcial Industry. Volume I, Nov 1903.
20. Goglio, Graziella, Denis Foy, and Gerard Demazeau. “State of Art and recent trends in bulk
carbon nitrides synthesis.” Materials Science and Engineering R 58, 195-227. 2008.

73
Appendix A:
Sample Preparation Equations
System mixtures were based on the following proposed reactions:
Copper(II) Oxide Systems
2Al (s) + 3CuO (s) → Al2O3 (s) + 3Cu (s) + 1204 KJ
W (s) + CuO (s) → WO3 (s) + 3Cu (s) + 686 KJ
2Ta (s) + 5CuO (s) → Ta2O5 (s) + 3Cu (s) + 1260 KJ
2Ti (s) + 2CuO (s) → TiO2 (s) + 2Cu (s) + 629 KJ
Zr (s) + 2CuO (s) → ZrO2 (s) + 2Cu (s) + 786 KJ
Hf (s) + 2CuO (s) → HfO2 (s) + 2Cu (s) + 830 KJ
Boron Carbide Systems
3Ti (s) + B4C (s) → 2TiB2 (s) + TiC (s) + 680 KJ
3Zr(s) + B4C (s) → 2ZrB2 (s) + ZrC (s) + 779 KJ
3Hf(s) + B4C (s) → 2HfB2 (s) + HfC (s) + Energy
3W(s) + B4C (s) → 2WB2 (s) + WC (s) + Energy

74
3Ta(s) + B4C (s) → 2TaB2 (s) + TaC (s) + Energy
Potassiumperchlorate Systems
4W (s) + 3KClO4 (s) → WO3 (s) + 3KCl (s) + 854 KJ
2Hf (s) + KClO4 (s) → 2HfO2 (s) + KCl (s) + 2293 KJ
8Ta (s) + 5KClO4 (s) → 4Ta2O5 (s) + 5KCl (s) + 8202 KJ
2Zr (s) + KClO4 (s) → 2ZrO2 (s) + KCl (s) + 2205 KJ
Bismuth Oxide Systems
W (s) + Bi2O3 (s) → WO3 (s) + 2Bi (s) + 269 KJ
3Hf (s) + 2Bi2O3 (s) → 3HfO2 (s) + 4Bi (s) + 2286 KJ
6Ta (s) + 5Bi2O3 (s) → 3Ta2O5 (s) + 10Bi (s) + 3269 KJ

75
Appendix B:
Complete Test Results

1.4
Vol
ume(
cc)
0.03
4847
**25
gra
ins*
* m
eans
vel
ocity
mea
sure
men
t fai
led
TS
WZ
ZB
llM
()
Mat
eria
l Ve
loci
ty
Velo
city
G
15G
45K
li25
G15
G45
Kli
25G
15G
45K
li25
G15
G45
Kli
25T
lE(J)
Kii
E(J)
Chem
ical
CE
(J)/
Ratio
of S
pecific
Hea
tEn
ergy
Rel
ease
(Jou
les)
Impu
lse F
S(PS
I-ms)
Even
t Tim
e (m
s)Pe
ak P
ress
ure
(PSI
-G)
Test
Syst
emW
ZnZr
Bulle
t Mas
s (g)
Mat
eria
l M
ass (
mg)
Velo
city
(ft/s
)Ve
loci
ty
(m/s
)Ge
ms-
15Ge
ms-
45Ku
lite-
25Ge
ms-
15Ge
ms-
45Ku
lite-
25Ge
ms-
15Ge
ms-
45Ku
lite-
25Ge
ms-
15Ge
ms-
45Ku
lite
25To
tal E
nerg
y (J)
Kine
tic E
nerg
y (J)
Chem
ical
En
ergy
(J)
CE(J)
/g
1W
-Zn-
Zr17
.50%
33.0
%49
.50%
1.29
0719
1.7
3724
1135
2453
2507
2522
475
475
475
13.8
713
.81
13.9
213
2813
2313
3413
2933
099
952
092
W-Z
n-Zr
17.5
0%33
.0%
49.5
0%1.
2938
201.
433
0910
0919
4619
5119
6853
453
266
510
.63
10.5
110
.61
1018
1007
1016
1014
261
752
3735
2W
ZnZr
17.5
0%33
.0%
49.5
0%1 .
2938
201.
433
0910
0919
4619
5119
6853
453
266
510
.63
10.5
110
.61
1018
1007
1016
1014
261
752
3735
3W
-Zn-
Zr17
.46%
45.3
2%37
.39%
1.30
5220
0.4
3850
1173
2218
2260
2277
487
487
533
13.8
313
.66
13.8
013
2513
0913
2213
1835
696
248
014
W-Z
n-Zr
17.4
6%45
.32%
37.3
9%1.
3046
205.
235
9810
9421
3621
4421
9952
951
994
812
.11
11.8
511
.48
1160
1136
1100
1132
310
822
4007
8W
-Zn-
Zr5.
06%
16.0
%78
.94%
1.25
7616
4.6
3718
1133
2810
2865
2864
635
637
713
13.6
913
.47
13.4
513
1112
9012
8912
9732
097
659
318
W-Z
n-Zr
5.06
%16
.0%
78.9
4%1.
2576
164.
637
1811
3328
1028
6528
6463
563
771
313
. 69
13.4
713
. 45
1311
1290
1289
1297
320
976
5931
35W
-Zn-
Zr5.
06%
16.0
%78
.94%
1.29
6917
2.5
3902
1189
2914
2950
2966
655
647
721
13.1
113
.02
13.1
012
5612
4712
5512
5336
488
951
5285
W-Z
n-Zr
5.06
%16
.0%
78.9
4%1.
279
176.
539
7912
1330
1631
0531
1164
965
571
314
.27
14.2
714
.34
1367
1367
1374
1369
373
996
5642
9W
-Zn-
Zr10
06%
3316
%56
78%
127
9117
67
3573
1089
2756
2796
2802
624
618
760
1290
1270
1279
1236
1217
1226
1226
301
925
5236
9W
-Zn-
Zr10
.06%
33.1
6%56
.78%
1.27
9117
6.7
3573
1089
2756
2796
2802
624
618
760
12. 9
012
.70
12.7
912
3612
1712
2612
2630
192
552
3638
W-Z
n-Zr
10.0
6%33
.16%
56.7
8%1.
291
188.
338
2311
6828
5428
8528
9964
764
672
612
.79
12.6
712
.82
1225
1213
1228
1222
350
873
4635
87W
-Zn-
Zr10
.06%
33.1
6%56
.78%
1.30
4118
8.3
4057
1237
2683
2713
2722
630
625
713
13.0
312
.81
13.0
012
4812
2712
4512
4039
684
444
8310
W-Z
n-Zr
505
%45
4%49
56%
130
0119
48
3895
1187
2808
2831
2840
639
626
703
1308
1286
1297
1253
1232
1242
1242
364
879
4511
10W
-Zn-
Zr5.
05%
45.4
%49
.56%
1.30
0119
4.8
3895
1187
2808
2831
2840
639
626
703
13.0
812
.86
12. 9
712
5312
3212
4212
4236
487
945
1136
W-Z
n-Zr
5.05
%45
.4%
49.5
6%1.
2983
198.
339
7312
1128
9829
4729
6166
265
773
813
.14
12.9
913
.10
1259
1245
1255
1253
378
875
4413
11W
-Zn-
Zr10
.01%
40.5
%49
.44%
1.30
6920
6.0
3829
1167
2834
2895
2900
602
603
674
14.0
313
.95
13.8
813
4513
3613
2913
3735
398
447
7437
W-Z
n-Zr
1001
%40
5%49
44%
129
0718
96
3876
1182
2820
2849
2868
675
665
774
1228
1225
1223
1176
1173
1172
1174
358
816
4304
37W
- Zn-
Zr10
.01%
40.5
%49
.44%
1.29
0718
9.6
3876
1182
2820
2849
2868
675
665
774
12.2
812
.25
12.2
311
7611
7311
7211
7435
881
643
0412
W-Z
n-Zr
17.4
6%16
.0%
66.5
0%1.
2874
188.
437
6611
4811
9214
2312
7626
266
466
416
.43
15.7
916
.32
1574
1513
1564
1550
337
1214
6441
31W
-Zn-
Zr17
.46%
16.0
%66
.50%
1.28
9419
0.1
3908
1191
3143
3219
3230
694
690
761
13.9
113
.88
13.9
013
3313
3013
3213
3236
396
950
9548
WZn
Zr17
46%
160%
6650
%1
295
193
340
2412
2733
2534
0934
1671
970
579
414
0914
1414
1213
5013
5513
5213
5238
796
649
9548
W- Z
n-Zr
17.4
6%16
.0%
66.5
0%1 .
295
193.
340
2412
2733
2534
0934
1671
970
579
414
. 09
14.1
414
. 12
1350
1355
1352
1352
387
966
4995
34W
-Zn-
Zr17
.46%
16.0
%66
.50%
1.29
1919
0.3
4031
1229
3596
3605
3615
794
754
822
13.6
913
.62
13.7
213
1213
0513
1413
1038
792
348
5151
W-Z
n-Zr
17.4
6%16
.0%
66.5
0%1.
2914
190.
039
4712
0331
0731
4631
5270
569
677
513
.44
13.3
613
.30
1287
1280
1275
1281
371
910
4788
55W
ZnZr
(14
8%M
C)17
46%
1600
%66
50%
128
9219
00
4084
1245
2451
2477
2496
584
579
651
1230
1224
1230
1178
1173
1178
1176
397
780
4105
55W
-Zn-
Zr (1
4.8%
MC)
17.4
6%16
.00%
66.5
0%1.
2892
190.
040
8412
4524
5124
7724
9658
457
965
112
.30
12.2
412
.30
1178
1173
1178
1176
397
780
4105
68W
-Zn-
Zr (1
4.9%
MC)
17.4
7%16
.00%
66.5
3%1.
2847
189.
440
4412
3323
0323
2023
3657
457
066
311
.77
11.6
911
.76
1127
1120
1127
1125
388
737
3892
56W
-Zn-
Zr (7
.0%
MC)
17.4
6%16
.00%
66.5
0%1.
2886
190.
025
gra
ins
1220
2983
3037
3054
670
666
746
13.1
013
.12
13.0
212
5512
5712
4712
5338
187
245
9170
WZn
Zr(7
0%M
C)17
47%
1600
%66
53%
128
5018
97
4050
1235
2303
2320
2336
574
570
663
1371
1371
1173
1313
1313
1123
1250
389
861
4538
70W
- Zn-
Zr (7
.0%
MC)
17.4
7%16
.00%
66.5
3%1 .
2850
189.
740
5012
3523
0323
2023
3657
457
066
313
. 71
13.7
111
. 73
1313
1313
1123
1250
389
861
4538
62W
-Zn-
Zr (3
.5%
MC)
17.4
6%16
.00%
66.5
0%1.
2827
190.
139
9812
1925
4725
6325
7661
862
169
312
.11
12.1
212
.04
1160
1161
1154
1158
378
780
4102
71W
-Zn-
Zr (3
.5%
MC)
17.4
7%16
.00%
66.5
3%1.
2868
189.
540
7712
4329
4029
9730
0066
767
072
913
.17
13.1
713
.10
1262
1262
1255
1259
395
865
4563
86W
ZnZr
(35%
MC)
1750
%16
00%
6650
%1
3206
189
539
7212
1126
4026
8426
9860
760
568
412
9012
9012
7812
3612
3512
2412
3238
484
744
7286
W- Z
n-Zr
(3.5
% M
C)17
.50%
16.0
0%66
.50%
1 .32
0618
9.5
3972
1211
2640
2684
2698
607
605
684
12. 9
012
.90
12. 7
812
3612
3512
2412
3238
484
744
7263
W-Z
n-Zr
(0%
MC)
17.4
6%16
.00%
66.5
0%1.
2867
188.
740
3112
2927
8328
3428
4564
064
474
213
.03
13.0
112
.93
1249
1247
1239
1245
386
859
4553
66W
-Zn-
Zr (0
% M
C)17
.47%
16.0
0%66
.53%
1.26
7118
9.7
3909
1192
2989
3029
3039
690
692
789
12.9
112
.92
12.8
412
3612
3812
3012
3535
787
846
26
Test
Syst
emW
ZnHf
Bulle
t Mas
s (g)
Mat
eria
l M
ass (
mg)
Velo
city
(ft/s
)Ve
loci
ty
(m/s
)Ge
ms-
15Ge
ms-
45Ku
lite-
25Ge
ms-
15Ge
ms-
45Ku
lite-
25Ge
ms-
15Ge
ms-
45Ku
lite-
25Ge
ms-
15Ge
ms-
45Ku
lite
25To
tal E
nerg
y (J)
Kine
tic E
nerg
y (J)
Chem
ical
En
ergy
(J)
CE(J)
/g
14W
ZHf
1776
%44
62%
3762
%1
4111
310
738
2911
6720
9220
7320
2858
457
364
710
6110
4910
7610
1610
0510
3110
1738
163
620
4714
W-Z
n-Hf
17.7
6%44
.62%
37.6
2%1.
4111
310.
738
2911
6720
9220
7320
2858
457
364
710
.61
10.4
910
.76
1016
1005
1031
1017
381
636
2047
17W
-Zn-
H f4.
94%
15.9
5%79
.11%
1.45
3135
2.8
3941
1201
3550
3732
3732
709
707
764
15.1
116
.17
16.3
514
4715
4915
6715
2141
611
0531
3239
W-Z
n-H f
4.94
%15
.95%
79.1
1%1.
4555
352.
740
2612
2742
9845
4945
1682
281
387
014
.81
16.3
816
.54
1419
1569
1585
1524
435
1090
3089
f50
W-Z
n-Hf
4.90
%15
.74%
79.3
5%1.
4537
352.
740
0512
2138
0040
0340
1274
173
379
514
.96
16.0
916
.30
1433
1541
1562
1512
430
1082
3068
20W
-Zn-
H f10
.93%
32.5
0%56
.57%
1.45
3935
2.0
3884
1184
3342
3339
3347
743
710
771
13.5
013
.43
13.4
612
9412
8712
9012
9040
488
625
1647
W-Z
n-Hf
10.9
3%32
.50%
56.5
7%1.
4245
325.
839
8612
1531
2031
5831
6870
669
877
413
.20
13.0
213
.18
1264
1247
1262
1258
417
841
2580
Test
Syst
emFu
el (g
)O
xidi
zer
(g)
Clas
s.Bu
llet M
ass (
g)M
ater
ial
Mas
s(m
g)Ve
loci
ty
(ft/s
)Ve
loci
ty
(m/s
)Ge
ms-
15Ge
ms-
45Ku
lite-
25Ge
ms-
15Ge
ms-
45Ku
lite-
25Ge
ms-
15Ge
ms-
45Ku
lite-
25Ge
ms-
15Ge
ms-
45Ku
lite
25To
tal E
nerg
y (J)
Kine
tic E
nerg
y (J)
Chem
ical
En
ergy
(J)CE
(J)/g
(g)
Mas
s (m
g)(ft/s
)(m
/s)
Ener
gy (J
)
5AL
-CuO
1.00
624.
449
Stoi
ch1.
282
122.
135
2910
7614
3814
3814
2652
452
475
67.
647.
627.
3573
273
070
472
229
542
835
026
AL-C
uO1.
0062
4.44
9St
oich
1.28
4211
8.5
3589
1094
1516
1505
1541
541
536
950
7.77
7.84
7.79
744
751
746
747
305
442
3730
22AL
-CuO
0.06
990.
309
a no(
AL):S
toic
1.24
5314
637
9011
5515
0015
0015
1655
456
269
37.
497.
477.
5371
871
572
171
833
038
926
6121
AL-C
uO1.
0062
4.44
9St
oich
1.23
6713
4.8
3963
1208
1879
1875
1892
562
572
671
9.30
9.26
9.32
891
888
893
891
358
532
3950
7AL
-CuO
2.01
244.
449
Rich
1.32
3213
5.5
3618
1103
1617
1611
1614
515
512
598
8.90
8.85
8.78
853
848
842
847
319
528
3896
27AL
-CuO
2.01
244.
449
Rich
1.23
7513
6.6
25 g
rain
s12
2023
6223
6623
8257
657
164
412
.14
12.0
912
.10
1163
1158
1159
1160
366
795
5817
33AL
-CuO
2.01
244.
449
Rich
1.23
9113
8.5
3927
1197
2603
2608
2624
634
634
743
12.0
411
.98
11.9
411
5311
4811
4411
4835
279
657
4640
AL-C
uO2.
0124
4.44
9Ri
ch1.
2373
136
4040
1231
2274
2267
2285
610
605
682
10.7
110
.80
10.7
510
2610
3510
3010
3037
265
848
3846
AL-C
uO2.
0124
4.44
9Ri
ch1.
2345
130.
740
5112
3523
0723
1223
2657
256
965
911
.75
11.7
211
.73
1126
1122
1124
1124
374
750
5740
49AL
-CuO
2.01
244.
449
Rich
1.23
0513
0.8
4031
1229
2525
2535
2546
620
610
707
11.9
111
.87
11.8
311
4111
3711
3311
3736
976
858
7326
AL-C
uO0.
5031
4.44
9Le
an1.
2551
153.
625
gra
ins
1220
1412
1411
1431
556
552
782
6.75
6.71
6.86
646
643
658
649
371
278
1811
26AL
CuO
0.50
314.
449
Lean
1.25
5115
3.6
25 g
rain
s12
2014
1214
1114
3155
655
278
26.
756.
716.
8664
664
365
864
937
127
818
1132
AL-C
uO0.
5031
4.44
9Le
an1.
2652
166.
240
2612
2715
4515
4615
6055
855
968
07.
537.
497.
8272
271
874
973
037
835
221
1613
W-C
uO0.
7749
1.00
41St
oich
1.35
8425
8.7
3804
1160
910
913
910
477
498
934
4.89
4.86
4.89
468
466
469
467
363
105
405
15W
-CuO
0.77
491.
0041
Stoi
ch1.
3436
244.
236
1811
0375
075
077
747
847
594
73.
873.
863.
9337
137
037
637
232
448
196
15W
CuO
0.77
491.
0041
Stoi
ch1.
3436
244.
236
1811
0375
075
077
747
847
594
73.
873.
863.
9337
137
037
637
232
448
196
18Hf
-CuO
0.47
980.
4272
Stoi
ch1.
3419
249.
938
0511
6020
4620
4720
5856
657
067
310
.24
10.2
010
.22
981
977
979
979
358
620
2483
77Hf
-CuO
0.40
540.
3613
Stoi
ch1.
3442
245.
138
5411
7522
6322
5622
7663
062
872
410
.28
10.2
210
.58
984
979
1013
992
368
624
2546
44Ta
-CuO
0.34
10.
3747
Stoi
ch1.
3051
204.
940
0612
2118
4318
4218
5361
160
973
38.
178.
208.
2878
378
579
378
738
640
119
5744
TaCu
O0.
341
0 .37
47St
oich
1 .30
5120
4.9
4006
1221
1843
1842
1853
611
609
733
8.17
8.20
8.28
783
785
793
787
386
401
1957
58Ta
-CuO
0.34
10.
3747
Stoi
ch1.
3004
204.
540
2712
2817
1517
1117
3062
162
383
77.
587.
557.
6172
672
372
972
638
933
716
4889
Ti-C
uO0.
1716
0.57
02St
oich
1.27
0715
0.5
4070
1241
2012
2008
2019
587
596
679
9.63
9.57
9.52
922
917
912
917
388
529
3513
90Zr
-CuO
0.28
140.
4108
Stoi
ch1.
2777
158.
625
grai
ns12
2017
5817
5617
6857
257
177
08.
718.
658.
6683
482
983
083
137
745
428
6090
ZrCu
O0 .
2814
0.41
08St
oich
1.27
7715
8.6
25 g
rain
s12
2017
5817
5617
6857
257
177
08.
718 .
658.
6683
482
983
083
137
745
428
60
76
Figu
re B
.1: T
abul
ated
Exp
erim
enta
l Dat
a

Il
FS(P
SI)
ETi
()
Pk
P(P
SIG)
ER
l(J
l)
Test
Syst
emFu
el (g
)O
xidi
zer
(g)
Classifi
cati
onBu
llet M
ass (
g)M
ater
ial
Mas
s(m
g)Ve
loci
ty
(ft/s
)Ve
loci
ty
(m/s
)Ge
ms-
15Ge
ms-
45Ku
lite-
25Ge
ms-
15Ge
ms-
45Ku
lite-
25Ge
ms-
15Ge
ms-
45Ku
lite-
25Ge
ms-
15Ge
ms-
45Ku
lite
25To
tal E
nerg
y (J)
Kine
tic E
nerg
y (J)
Chem
ical
En
ergy
(J)CE
(J)/g
Impu
lse F
S(PS
I-ms)
Even
t Tim
e (m
s)Pe
ak P
ress
ure
(PSI
-G)
Ener
gy R
elea
se (J
oule
s)
(g)
onM
ass (
mg)
(ft/s
)(m
/s)
Ener
gy (J
)
25W
-KCL
O4
0.96
880.
5478
Stoi
ch1.
2806
183.
239
3011
9888
888
792
244
243
394
95.
195.
155.
2149
749
349
949
636
513
271
976
W-K
CLO
40.
3538
0.2
Stoi
ch1.
2892
183
3979
1213
799
804
834
419
433
949
4.94
4.93
4.97
473
472
476
474
376
9753
223
Hf-K
CLO
40.
543
0.21
05St
oich
1.31
1421
0.9
3884
1184
1778
1784
1796
512
516
650
9.29
9.94
9.87
890
952
946
929
365
564
2676
72Hf
-KCL
O4
0.43
360.
1683
Stoi
ch1.
3054
203.
639
1511
9318
0318
0518
2651
852
072
09.
829.
939.
9594
195
195
394
836
958
028
4724
Ta-K
CLO
40.
5543
0.26
54St
oich
1.28
2618
1.7
3865
1178
1434
1437
1451
502
504
629
7.68
7.78
7.78
736
746
745
742
353
389
2141
57Ta
-KCL
O4
0.55
430.
2654
Stoi
ch1.
2753
176.
439
6812
0916
5516
5216
7152
552
973
28.
688.
768.
7483
283
983
783
637
046
626
4364
Ta-K
CLO
40.
5543
0.26
54St
oich
1.27
0317
6.6
4017
1225
1491
1487
1505
511
504
660
8.12
8.21
8.16
778
786
782
782
378
404
2287
73Ta
-KCL
O4
0.37
240.
1782
Stoi
ch1.
2792
180.
739
9712
1914
7114
6414
9550
750
579
07.
968.
048.
0076
377
176
776
737
738
921
5545
Zr-K
CLO
40.
4041
0.30
68St
oich
1.22
0411
7.2
25 g
rain
s12
2014
1714
0914
3652
052
068
77.
397.
477.
4870
871
571
771
436
035
330
1253
Zr-K
CLO
40.
4041
0.30
68St
oich
1.21
1311
2.2
3992
1217
1216
1216
1241
469
471
683
7.04
7.12
7.35
674
682
705
687
356
331
2951
74Zr
-KCL
O4
0.28
120.
2135
Stoi
ch1.
2198
115.
840
0412
2112
9913
0213
2447
848
078
07.
407.
507.
4870
971
871
771
536
135
430
54
16In
ert
NA
NA
Iner
t1.
3074
Iner
t38
4211
7157
857
960
836
537
095
03.
843.
893.
9736
837
338
137
435
6N/A
N/A
28In
ert
NA
NA
Iner
t1.
3084
Iner
t40
2012
2563
163
866
139
941
695
03.
853.
923.
9636
937
537
937
539
0N/A
N/A
NA
NA
Iner
t1.
3084
Iner
t40
2012
2563
163
866
139
941
695
03.
853.
923.
9636
937
537
937
539
0N/A
N/A
54In
ert
NA
NA
Iner
t1.
3078
Iner
t40
2412
2763
363
967
338
539
194
94.
184.
214.
2540
140
340
840
439
1N/A
N/A
67In
ert
NA
NA
Iner
t1.
308
Iner
t41
1112
5362
062
165
340
240
195
03.
853.
893.
9536
837
337
837
340
8N/A
N/A
69In
ert
NA
NA
Iner
t1.
3081
Iner
t39
9112
1765
966
269
040
640
495
04.
104.
174.
2439
339
940
639
938
4N /
AN/A
69In
ert
NA
NA
Iner
t1.
3081
Iner
t39
9112
1765
966
269
040
640
495
04.
104.
174.
2439
339
940
639
938
4N/A
N/A
19Zr
80-W
200.
665
0.33
5Ba
ll M
ill1.
299
197.
638
7211
8030
9831
0331
1271
371
077
912
.50
12.3
212
.40
1198
1180
1188
1189
359
830
4199
61Zr
-W0.
40.
62-
3u/<
1u1.
351
250.
739
7912
1331
0031
5431
2174
777
785
112
.07
12.0
011
.99
1156
1150
1148
1151
394
757
3019
61Zr
W0.
40.
623u
/<1u
1.35
125
0.7
3979
1213
3100
3154
3121
747
777
851
12.0
712
.00
11.9
911
5611
5011
4811
5139
475
730
1965
Zr-W
0.5
0.5
2-3u
/<1u
1.31
122
4.2
3947
1203
2662
2660
2669
714
717
848
10.6
910
.54
10.7
210
2410
1010
2710
2037
764
428
70
30Hf
-Bi2
O3
0.12
530.
3436
Stoi
ch1.
3431
241.
139
4012
0117
8617
8918
0063
363
476
37.
727.
707.
7074
073
873
873
838
435
414
6830
HfBi
2O3
0.12
530.
3436
Stoi
ch1 .
3431
241.
139
4012
0117
8617
8918
0063
363
476
37 .
727 .
707.
7074
073
873
873
838
435
414
6878
Hf-B
i2O
30.
2576
0.44
83St
oich
1.38
0227
6.2
3991
1217
1856
1855
1868
574
575
699
9.02
8.96
9.01
864
858
863
862
406
456
1652
29Ta
-Bi2
O3
0.30
980.
6625
Stoi
ch1.
3558
255.
440
3312
2918
2418
2618
3960
760
575
78.
358.
328.
5980
079
782
380
740
640
115
6959
Ta- B
i2O
30.
3098
0.66
25St
oich
1.33
9124
2.1
3947
1203
1582
1589
1604
592
599
850
7.32
7.29
7.25
702
699
695
698
385
314
1296
59Ta
Bi2O
30 .
3098
0 .66
25St
oich
1.33
9124
2.1
3947
1203
1582
1589
1604
592
599
850
7 .32
7.29
7.25
702
699
695
698
385
314
1296
60Ta
-Bi2
O3
0.30
980.
6625
Stoi
ch1.
3374
241.
939
5912
0715
3615
3215
5858
557
291
17.
357.
327.
3170
470
170
170
238
731
513
0443
W-B
i2O
30.
9671
2.45
18St
oich
1.32
6922
2.9
3973
1211
1021
1021
1044
521
516
818
4.93
4.98
5.02
473
477
481
477
386
9140
879
W-B
i2O
30.
2332
0.59
11St
oich
1.36
9826
8.4
3922
1195
1010
1004
1035
511
514
943
4.92
4.96
4.99
471
475
478
475
388
8632
279
W-B
i2O
30 .
2332
0 .59
11St
oich
1 .36
9826
8.4
3922
1195
1010
1004
1035
511
514
943
4 .92
4.96
4.99
471
475
478
475
388
8632
2
41Hf
-B4C
0.59
0.06
18St
oich
1.35
3725
2.3
3953
1205
3529
3568
3575
767
765
854
13.7
613
.65
13.8
213
1813
0713
2413
1739
092
736
7375
Hf- B
4C0
90
0929
Stoi
ch1
3503
252
239
0911
9231
4132
1032
1267
568
675
414
0213
9614
1013
4313
3713
5113
4438
196
338
1975
Hf- B
4C0 .
90.
0929
Stoi
ch1 .
3503
252.
239
0911
9231
4132
1032
1267
568
675
414
. 02
13.9
614
. 10
1343
1337
1351
1344
381
963
3819
42Zr
-B4C
0.53
110.
1073
Stoi
ch1.
2138
110.
739
8612
1527
8627
8327
9570
972
178
911
.18
11.1
011
.14
1071
1064
1068
1067
356
712
6430
81Zr
-B4C
0.53
110.
1073
Stoi
ch1.
2166
116.
040
4412
3327
4927
3227
4067
066
278
111
.89
11.7
511
.86
1139
1126
1136
1133
367
766
6607
52Ti
- B4C
040
880
1575
Stoi
ch1
1968
961
3897
1188
3037
3044
3053
686
687
782
1255
1260
1233
1202
1207
1181
1197
335
862
8965
52Ti
- B4C
0 .40
880 .
1575
Stoi
ch1.
1968
96.1
3897
1188
3037
3044
3053
686
687
782
12.5
512
.60
12.3
312
0212
0711
8111
9733
586
289
6580
Ti-B
4C0.
4088
0.15
75St
oich
1.20
2998
.840
6412
3934
5635
0535
1270
369
677
014
.55
14.9
313
.54
1394
1430
1297
1374
366
1007
1019
682
W-B
4C0.
6707
0.06
72St
oich
1.44
934
8.8
3966
1209
1716
1714
1728
616
619
748
7.49
7.45
7.52
718
714
720
717
420
297
852
83W
-B4C
075
360
0755
Stoi
chW
<1u
136
4226
63
4017
1225
1744
1743
1756
635
639
835
759
755
758
727
723
726
725
406
319
1199
83W
- B4C
0.75
360 .
0755
Stoi
ch W
<1u
1.36
4226
6.3
4017
1225
1744
1743
1756
635
639
835
7 .59
7 .55
7.58
727
723
726
725
406
319
1199
84Ta
-B4C
0.71
520.
0733
Stoi
ch T
a<2u
1.36
126
0.9
4017
1225
1772
1767
1791
633
626
939
7.25
7.14
7.29
694
684
699
692
405
287
1100
88Ta
-B4C
0.71
520.
0733
Stoi
ch T
a<2u
1.36
9424
7.8
3885
1184
1414
1417
1434
596
597
837
6.07
5.96
6.07
582
571
581
578
381
197
795
96B4
C(A
ir)0
0618
N/A
Pure
118
0261
839
7212
1115
21N/A
1537
595
06N/A
788
976
71N/A
672
642
N/A
644
643
343
300
4852
96B4
C (A
ir)0.
0618
N/A
Pure
1 .18
0261
.839
7212
1115
21N/A
1537
595.
06N/A
788.
976 .
71N/A
6.72
642
N/A
644
643
343
300
4852
100
Hf (A
ir)0.
3137
N/A
Pure
1.43
4931
3.7
3991
1217
1981
N/A
1992
711.
5N/A
949.
77.
03N/A
7.15
673
N/A
685
679
422
257
821
91W
B4C
(100
%N
2)0
7805
007
82St
oich
W<1
u1
3868
248
739
4712
0381
1N/A
802
589
N/A
579
391
N/A
391
375
N/A
375
375
242
132
532
91W
-B4C
(100
% N
2)0 .
7805
0 .07
82St
oich
W<1
u1 .
3868
248.
739
4712
0381
1N/A
802
589
N/A
579
3.91
N/A
3.91
375
N/A
375
375
242
132
532
92In
ert (
100%
N2)
N/A
N/A
Iner
t1.
308
N/A
3972
1211
340
N/A
368
335
N/A
2.41
N/A
2.43
231
N/A
233
232
232
N/A
N/A
93Hf
-B4C
(100
% N
2)0.
90.
0929
Stoi
ch.
1.36
4324
3.4
4004
1221
1054
N/A
1069
570
N/A
728
4.82
N/A
4.83
461
N/A
463
462
246
216
889
94Zr
B4C
(100
%N
2)0
5311
010
75St
oich
123
3711
30
4037
1231
596
N/A
605
351
N/A
374
374
N/A
372
358
N/A
356
357
226
131
1164
94Zr
- B4C
(100
% N
2)0 .
5311
0 .10
75St
o ich
.1 .
2337
113.
040
3712
3159
6N/A
605
351
N/A
374
3 .74
N/A
3.72
358
N/A
356
357
226
131
1164
95B4
C (1
00%
N2)
0.06
07N/A
Pure
1.18
0160
.740
3112
2942
2N/A
432
297
N/A
432
2.98
N/A
2.97
285
N/A
285
285
215
7011
46
97Ta
B4C
(100
%N
2)0
8105
008
25St
oich
137
223
64
3891
1186
617
N/A
626
357
N/A
384
367
N/A
371
352
N/A
356
354
233
121
511
97Ta
-B4C
(100
% N
2)0.
8105
0.08
25S t
oich
1.37
223
6.4
3891
1186
617
N/A
626
357
N/A
384
3 .67
N/A
3.71
352
N/A
356
354
233
121
511
98Ti
-B4C
(100
% N
2)0.
4088
0.15
76St
oich
1.22
8593
.325
gra
ins
1220
518
N/A
527
313
N/A
341
3.48
N/A
3.52
333
N/A
337
335
221
114
1227
99Hf
(100
% N
2)0.
3148
N/A
Pure
1.43
3831
4.8
3979
1213
439
N/A
451
324
N/A
358
2.71
N/A
2.74
260
N/A
263
261
255
721
101
Iner
t (50
% O
2)N/A
N/A
Iner
t1.
3089
N/A
25 g
rain
s12
2011
13N/A
1119
423
N/A
446
6.18
N/A
6.25
593
N/A
599
596
N/A
N/A
N/A
102
Iner
t (50
% O
2)N/A
N/A
Iner
t1.
3093
N/A
3972
1211
1016
N/A
1024
374
N/A
391
6.12
N/A
6.19
586
N/A
593
589
N/A
N/A
N/A
103
It(
75%
O2)
N/A
N/A
It
130
84N/A
3928
1197
1446
N/A
1451
459
N/A
487
748
N/A
753
717
N/A
721
719
N/A
N/A
N/A
103
Iner
t (75
% O
2)N/ A
N/A
Iner
t1.
3084
N/A
3928
1197
1446
N/A
1451
459
N/A
487
7.48
N/A
7.53
717
N/A
721
719
N/A
N/A
N/A
104
Iner
t (10
0% O
2)N/A
N/A
Iner
t1.
3089
N/A
3953
1205
1614
N/A
1619
496
N/A
520
7.77
N/A
7.83
745
N/A
751
748
N/A
N/A
N/A
105
Iner
t (40
% O
2)N/A
N/A
Iner
t1.
3088
N/A
3915
1193
1036
N/A
1059
490
N/A
949
5.52
N/A
5.63
529
N/A
539
534
931
N/A
N/A
106
Hf-B
4C (4
0% O
2)0.
90.
0929
N/A
1.37
1724
3.1
3922
1195
7635
N/A
9968
N/A
N/A
N/A
29.2
0N/A
24.4
027
97N/A
2338
2568
562
2006
8251
107
Zr-B
4C (4
0% O
2)0.
5311
0.10
75N/A
1.23
9611
8.6
3891
1186
9072
N/A
1245
5N/A
N/A
N/A
31.6
5N/A
29.1
730
32N/A
2795
2913
500
2413
2034
910
8Ti
B4C
(40%
O2)
008
80
6/
2286
938
60/
620
620
/83
88
9/
209
20
/23
620
92
988
038
108
Ti-B
4C (4
0% O
2)0.
4088
0.15
76N/A
1.22
8695
.438
6011
77N/A
6240
6240
N/A
838
859
N/A
20.9
745
21.0
7N/A
2364
2019
2191
488
1703
1785
410
9Hf
(40%
O2)
0.31
05N/A
N/A
1.43
9831
0.5
3872
1180
N/A
5077
5068
N/A
768
784
N/A
17.3
717
.54
N/A
1958
1680
1819
575
1244
4007
110
B4C
(40%
O2)
0.06
37N/A
N/A
1.18
363
.738
2411
66N/A
9868
9817
N/A
1029
1042
N/A
25.9
325
.82
N/A
2923
2474
2698
461
2237
3511
6
77
Figu
re B
.1: (
cont
.)

78
Appendix C:
MATLAB Analysis Code
C.1: Quasi-Static Pressure Curve Analysis
t = tC_beg(:,1);
rel = C_beg(:,1);
% for A
start_A_lin = -1.5;
finish_A_lin = .30;
%Extrapolated Linear Region
start_A_linext=.3001;
finish_A_linext=4;
%%Curved Region
start_A_exp = 50;
%%finish_A_exp = max(tC_beg);
finish_A_exp = max(tC_beg);
%%Extrapolated Curve Region
start_A_exp2 = 0;
finish_A_exp2 = start_A_exp-.0001;
S_A_lin = find(t>start_A_lin & t<finish_A_lin);
S_A_lin2 = find(t>start_A_linext & t<finish_A_linext);
S_A_exp = find(t>start_A_exp & t<finish_A_exp);
S_A_exp2 = find(t>start_A_exp2&t<finish_A_exp2);
%%Curve A%%
A_lin = rel(S_A_lin);
t_A_lin = t(S_A_lin);
t_A_linext=t(S_A_lin2);
A_exp = rel(S_A_exp);
t_A_exp = t(S_A_exp);
t_A_exp2 = t(S_A_exp2);
% Define your exponential function
fh = @(x,p) p(1) + p(2)*exp(-x./p(3))
% define the error function. this is the function to
% minimize: you can also use norm or whatever:

79
errfh = @(p,x,y) sum((y(:)-fh(x(:),p)).^2)
% an initial guess of the exponential parameters
p0 = [mean(A_exp) (max(A_exp)-min(A_exp)) (max(t_A_exp) - min(t_A_exp))/2];
% search for solution
P = fminsearch(errfh,p0,[],t_A_exp,A_exp)
% plot exponental graphs
f1 = fh(t_A_exp,P);
f2 = fh(t_A_exp2,P);
p2=polyfit(t_A_lin,A_lin,1);
f3=polyval(p2,t_A_lin);
f4=polyval(p2,t_A_linext);
%%Determing the Intersection
elements1=length(f2);
elements2=length(f4);
Diff=elements1-elements2;
Diff2=abs(f2(1:elements2)-f4);
Minimum=min(Diff2);
Value=find(Diff2==Minimum);
Curve_Intersect=f2(Value)
Linear_Intersect=f4(Value)
P_mean=(Curve_Intersect+Linear_Intersect)/2
%%determine the time of peak pressure
Peak_Pressure_Time=tA_beg(Value)
% plot the result
plot(t,rel,'g',t_A_exp,A_exp,'bo',t_A_exp,f1,'r-',t_A_exp2,f2,'r',t_A_lin,f3,'bo',t_A_linext,f4,'r')

80
C.2: Impulse Analysis
%%convert data to time scale%%
t = [Tstart*1000:Tinterval*1000:Tstart*1000+(Length-1)*Tinterval*1000]';
%%calculate the mean of the baselines to get a more accurate number%%
A_mean=mean(A(1:1000),1);
B_mean=mean(B(1:1000),1);
C_mean=mean(C(1:1000),1);
%%Convert Gems-15 Data from Voltage to Pressure%%
D=[A-A_mean]/.533333;
%%Convert Gems-45 Data from Voltage to Pressure%%
Z=[B-B_mean]/.266666;
%%Subrtract the base line for sealed gauge Kulite-25SG%%
V=(((C-C_mean)/125)/.1)*25;
%%Set the threshold for the start and end of impulse curves%%
beg_thresh_per = 0.01;
end_thresh_per = 0.01;
%%Determine where the Impulse curve begins%%
A_thresh_beg = A_mean * (1+beg_thresh_per);
B_thresh_beg = B_mean * (1+beg_thresh_per);
C_thresh_beg = C_mean * (1+beg_thresh_per);
A_thresh_end = A_mean * (1+end_thresh_per);
B_thresh_end = B_mean * (1+end_thresh_per);
C_thresh_end = C_mean * (1+end_thresh_per);
% find positions of beginning data all values in A greater than beginning
% threshold
[Pos Val] = find(A(:,1) > A_thresh_beg);
[Pos1 Val1]=find(A(:,1) > A_thresh_end);
[Pos2 Val2] = find(B(:,1) > B_thresh_beg);
[Pos3 Val3]=find(B(:,1) > B_thresh_end);
[Pos4 Val4] = find(C(:,1) > C_thresh_beg);
[Pos5 Val5]=find(C(:,1) > C_thresh_end);
tA_beg = t(Pos,1);
A_beg = D(Pos,1);
tB_beg = t(Pos2,1);
B_beg = Z(Pos2,1);
tC_beg = t(Pos4,1);
C_beg = V(Pos4,1);

81
%%plot(t_beg,B_beg,'k',t_beg,A_beg,'r
Impulse_Gems15=trapz(tA_beg, A_beg)
Impulse_Gems45=trapz(tB_beg, B_beg)
Impulse_Kulite25=trapz(tC_beg, C_beg)
Max_Gems15=max(tA_beg)
Max_Gems45=max(tB_beg)
Max_Kulite25=max(tC_beg)
Impulse15=trapz(t,D);
Impulse45=trapz(t,Z);
ImpulseKulite25=trapz(t,V);

82
C.3: Velocity Analysis
%%convert data to time scale%% t = [Tstart*1000:Tinterval*1000:Tstart*1000+(Length-1)*Tinterval*1000]'; %%calculate the mean of the baselines to get a more accurate number%% A_mean=mean(A(1:100),1); B_mean=mean(B(1:100),1); %%Set the threshold for the start and end of impulse curves%% beg_thresh_per = 0.95; %%Determine where the Impulse curve begins%% A_thresh_beg = A_mean * (beg_thresh_per); B_thresh_beg = B_mean * (beg_thresh_per);
% find positions of beginning data all values in A less than beginning % threshold [Pos Val] = find(A(:,1) < A_thresh_beg); [Pos1 Val1] = find(B(:,1) < B_thresh_beg); t_beg = t(Pos,1); A_beg = A(Pos,1); t_beg2 = t(Pos1,1); B_beg = B(Pos1,1); Diode1=t_beg(1,1); Diode2=t_beg2(1,1); Time=Diode2-Diode1 Velocity_FS=.24666666/Time*1000 Velocity_MS=.075184/Time*1000 %%2.97 in is .2475 ft & .075438 m%% %%2.87 in is .23916666 ft & .072898 m %% %%2.89 in is .24083333 ft & .073406 m%% %%2.96 in is .24666666 ft & .075184m %%

83
Appendix D: Endevco 106/109 Settings
Figure D.1: Endevco 106/109 settings (top channel only)
Figure D.2: Gain calculations for Endevco 106/109
Gain1
FS mv( )
100
%Setting 10000

84
Appendix E:
SOP for Model 700 Remington Rifle
Standard Operating Procedure for safe experimentation with the Model 700 Remington Rifle
1. Put the safety mechanism in the “S” position.
2. Ensure that the AV-DC volt transformer is unplugged and in the off position.
3. Ensure the firearm is pointed in a safe and intended direction.
4. Ensure that the chamber is secure and assembled.
5. Place the device spacer on the table between the locker and the chamber.
6. Place the bolt in the weapon (if not already done so).
7. Place one cartridge on the magazine follower or in the chamber.
8. Slide the bolt handle forward, then push the bolt handle down to lock the cartridge into the
chamber.
9. Without placing your fingers in the bullet path perform a check for proper alignment with the
muzzle laser pointer as the weapon may have shifted during loading.
10. REMOVE the LASER POINTER
11. Adjust the solenoid bar so that it is as far front of the trigger guard as possible.
12. Set any hallway notification signs in place.
13. Put the safety mechanism in the “F” position.
14. Assume a safe position behind the adjacent room wall.
15. Insert proper hearing protection.
16. Plug in the power inverter.
17. Fire the weapon.
18. Turn off solenoid & unplug the transformer.
19. Place the weapon on “S”
20. Inspect lab results.
In case of a misfire
1. Turn off solenoid & unplug the transformer.
2. Place the weapon on “S”
3. Remove the bolt and unused round.
4. Inspect the round.
5. Begin at step #6 from above.

85
Appendix F:
Data Recording Sheet Date______________________ Time______________________ Test#_____________________ System____________________ Specimen__________________
Gun Powder Type_____________________________ Gun Powder Weight__________________________ Empty Bullet Weight_________________________ Filled Bullet Weight___________________________ Specimen Weight_____________________________ Total Bullet Weight (w/sealant)_________________ Chamber Pressure:
Location on Chamber:
Ch A Ch B Ch C
Sensor Type:
Gain Setting:
Trigger Setting:
Voltage:
Voltage Sensitivity:
Time Scale:
Bullet Velocity Settings:
Position: Ch A Ch B
Diode Type:
Trigger:
Voltage:
Voltage Sensitivity:
Time Scale:
Misc

86
Appendix G:
Proposed Bullet Press Design Sketches
Figure G.1: Sketches depicting a proposed “mass production” bullet powder press

87
Appendix H:
Remote Trigger Drawings
Figure H.1: Remote trigger dimensions

88
Figure H.2: Remote trigger CAD model

89
Appendix I:
Mounting Block Sketch
Figure I.1: Mounting block sketch

90
Appendix J:
Reactive Material Moisture Study
Table J.1: Moisture absorption from the storage of vacuum dried reactive materials in ambient air for 15 days

91
Appendix K:
Experimental Results in Energy Output per
Volume
Figure K.1: Energy output per volume for CuO systems

92
Figure K.2: Energy output per volume for W-Zn-Zr systems
Figure K.3: Energy output per volume for W-Zn-Hf systems
93
Figure K.4: Energy output per volume for KClO4 systems
Figure K.5: Energy output per volume for B4C systems

94
Figure K.6: Energy output per volume for B4C systems in 100% nitrogen
Figure K.7: Energy output per volume for Bi2O3 systems in air

95
Appendix L:
XRD Analysis Results
Figure L.1: Residue from inert test in 100% nitrogen (Test#92)

96
Figure L.2: Mixture of Al-CuO before testing
Figure L.3: XRD results for the Al-CuO system (Test #33)

97
Figure L.4: Mixture of W-Zn-Zr 5/16/79% before testing
Figure L.5: W-Zn-Zr 5/16/79% residue sample (Test#35)

98
Figure L.6: Mixture of W-Zr (33/66%) before testing
Figure L.7: Residue from W-Zr (60/40%) test in air (Test#61)

99
Figure L.8: Mixture of Hf-KClO4 before testing
Figure L.9: Residue from B4C test in 100% nitrogen (Test#95)

100
Figure L.10: Mixture of Ti-B4C before testing
Figure L11: Residue from Ti-B4C test in 100% nitrogen (Test#98)

101
Figure L.12: Mixture of Hf-Bi2O3 before testing
Copyright © 2022 FDOKUMEN