
electrical energy audit at brothers flour and biscuit factory
92
ADDIS ABABA UNIVERSITY SCHOOL OF GRADUATE STUDIES ADDIS ABABA INSTITUTE OF TECHNOLOGY ELECTRICAL AND COMPUTER ENGINEERING DEPARTMENT ELECTRICAL ENERGY AUDIT AT BROTHERS FLOUR AND BISCUIT FACTORY By Elias Nugusu Tulu Advisor Dr. Getachew Bekele Beyene A Thesis Submitted to the Addis Ababa Institute of Technology, School of Graduate Studies, Addis Ababa University In Partial Fulfillment of the Requirement for the Degree of Masters of Science in Electrical and Computer Engineering (Electrical power Engineering) October, 2018 Addis Ababa, Ethiopia
-
Upload
khangminh22 -
Category
Documents
-
view
2 -
download
0
Transcript of electrical energy audit at brothers flour and biscuit factory

ADDIS ABABA UNIVERSITY
SCHOOL OF GRADUATE STUDIES
ADDIS ABABA INSTITUTE OF TECHNOLOGY
ELECTRICAL AND COMPUTER ENGINEERING DEPARTMENT
ELECTRICAL ENERGY AUDIT AT BROTHERS FLOUR AND
BISCUIT FACTORY
By
Elias Nugusu Tulu
Advisor
Dr. Getachew Bekele Beyene
A Thesis Submitted to the Addis Ababa Institute of Technology,
School of Graduate Studies, Addis Ababa University
In Partial Fulfillment of the Requirement for the Degree of
Masters of Science in Electrical and Computer Engineering
(Electrical power Engineering)
October, 2018
Addis Ababa, Ethiopia

Addis Ababa University
Addis Ababa Institute of Technology
Electrical and Computer Engineering Department
ELECTRICAL ENERGY AUDIT AT BROTHERS FLOUR AND
BISCUIT FACTORY
By: Elias Nugusu Tulu
APPROVED BY BOARD OF EXAMINERS
_________________ __________ __________
Chairman, Department Signature Date
of Graduate Committee
Dr.Getachew Bekele Beyene __________ __________
Advisor Signature Date
_______________ _________ __________
Internal Examiner Signature Date
________________ __________ __________
External Examiner Signature Date

i
DECLARATION
I, the undersigned, declare that this thesis is my original work, has not been presented for
any degree or otherwise in this or any other university, and all sources of materials used
for the thesis have been fully acknowledged.
Elias Nugusu Tulu _______________
Name Signature
Place: Addis Ababa
Date of Submission: ___________
I, the undersigned, certify that I read and hereby recommend for the acceptance by Addis
Ababa University a thesis entitled, ‘’Electrical Energy Audit at Brothers flour and Biscuit
factory” in partial fulfilment of a degree of Masters of Science in Electrical Power
Engineering with my approval as a university advisor.
Dr.Getachew Bekele Beyene ______________ ____________
Advisor’s Name Signature Date

ii
ACKNOWLEDGMENT
First and foremost, I would like to give thanks and praise to the Almighty God for his
grace and blessings throughout the whole thesis work. Without him, this is nothing.
During the completion of this thesis, there were many kinds of supports I have got. I would
like to express my deepest thanks and gratitude to:
Dr. Getachew Bekele, who is an outstanding advisor. Despite loads of own work,
he always had time to answer mails, discuss any issues and make helpful
comments, and for his valuable guidance, assistance and constructive advice
throughout the whole thesis work.
My family and wife (Wubit Seyoum, M.Sc.) who have taught me many valuable
lessons in life and have always gave their best advice. Their encouragement and
pray have made me stronger to face all the problems in this thesis work.
Brothers Flour and Biscuit’s factory electrical department maintenance manager,
Ato Redi and Marketing manager, Ato Umer Mohammed for their cooperation
with the collection of all necessary data.
Brothers Flour and Biscuit’s factory main operator, in flour factory, Ato Hussein
Jemal for his help and encouragement during data gathering.
Finally, I need to extend my earnest appreciation to Dilla University for offering
me this opportunity to pursue my graduate studies.
And special thanks goes to whomever that I have missed out and had helped me in
one way or another.
Without all those listed above, this thesis work would not have been completed.
Elias Nugusu Tulu

iii
ABSTRACT
Electrical energy plays a vital role almost everywhere, especially those that are energy
intensive institutions. As there are limited resources and increased cost to generate
electricity, it is our keen duty to save resources for future use by doing research about
energy conservation, which energy audit is one to consider in different sectors such as the
one this research work is attempting. This would help the factory to be competent in the
market because their production cost depends on electric power.
This thesis presents about electrical energy audit in Brothers Flour and Biscuit Factory,
which is one of the intensive energy consumer industries currently flourishing in our
country. For the purpose of data analysis, a historical data regarding their energy
consumption and energy intensive equipment’s, such as electric motors and lighting
systems were collected. Countries with energy efficient Biscuit and Flour factory have
been selected as a benchmark to compare the energy efficiency of the factory. From the
data analysis it is found that the factory loses 31% and 22% of total energy for biscuit and
flour respectively due to inefficient electrical energy consumption and pays a total of
4,320,216 ETB/year.
Modelling and simulation of the whole power distribution system based on the primary
data collected and one-line diagram have been done with Electrical transient analyzer
program (ETAP 12.6.0) software package. Annual technical energy loss of the factory
power distribution system has been investigated and its value is 1.2%. i.e. ideal loss within
acceptable range, which is 3-6%. But, expenditure for technical energy loss due to
distribution transformers is high in comparison to distribution cables.
The factory accomplishes its activities with extra and inefficient lamps and also with low
efficiency of electric motor due to under load operation of the motor for specific
application. At the end of factory’s electrical energy audit the possible total energy saving
potential in KWh per year from lighting only was 338.7 MWH/year by using energy
efficient lamps and optimizing the illumination of the existing lighting system. Hence the
total saving in Ethiopian birr per year from lighting were 138,397.54 and their payback
period is less than 6 months. By replacing standard (low efficiency) motors with energy
efficient motor gives 49,482 KWh/year energy saving and cost saving of $1,484 per year
as well as payback period of less than 10 years as analyzed by Motor Master software.
Key words: energy Audit, Energy Conservation, Energy conservation opportunities
(ECOs), technical energy loss, ETAP

iv
TABLE OF CONTENTS
Contents Page
DECLARATION ................................................................................................................. i
ACKNOWLEDGMENT .................................................................................................... ii
ABSTRACT ..................................................................................................................... iii
LIST OF TABLES ............................................................................................................. vi
LIST OF FIGURES .......................................................................................................... vii
NOMENCLATURES AND ABBREVIATIONS .......................................................... viii
CHAPTER ONE ................................................................................................................. 1
INTRODUCTION .............................................................................................................. 1
1.1 Background of the study ..................................................................................... 1
1.2 Statement of the Problem .................................................................................... 3
1.3 Objectives ........................................................................................................... 3
1.3.1 General Objective ......................................................................................... 3
1.3.2 Specific Objectives ....................................................................................... 3
1.4 Significance of the study .................................................................................... 4
1.5 Limitation of the study ........................................................................................ 4
1.6 Methodology ....................................................................................................... 5
1.7 Organization of the thesis ................................................................................... 6
CHAPTER TWO ................................................................................................................ 7
ENERGY EFFICIRENCY TECHNOLOGIES AT BROTHERS FLOUR & BISCUIT
FACTORY AND LITERATURE REVIEW ...................................................................... 7
2.1 Brothers Flour and Biscuit Factory ...................................................................... 7
2.2 Energy Security Systems and Energy Auditing ................................................. 13
2.3 Basic Energy Efficiency Principles and Technologies ...................................... 17
2.4 Literature Review ............................................................................................... 21
2.4.1 Electrical energy Auditing .......................................................................... 21
2.4.2 Technical Loss Assessment ........................................................................ 26
CHAPTER THREE .......................................................................................................... 30
DATA COLLECTION AND SYSTEM MODELLING .................................................. 30

v
3.1 Data Collection .................................................................................................. 30
3.2 Software Description and Model Development ................................................. 35
3.2.1 Constructing the Model .............................................................................. 37
3.2.2 Technical Loss Estimation .......................................................................... 39
3.3 Major causes of energy loss and saving opportunities in 2BF ........................... 40
3.3.1 Analysis of Lighting Systems ..................................................................... 41
3.3.2 Energy Conservation opportunities in Lighting System ............................. 44
3.3.3 Analysis of Electric Motors ........................................................................ 48
3.3.4 Energy conservation Opportunities in Electric Motors .............................. 50
3.3.5 Electrical energy bill analysis ..................................................................... 58
3.3.6 Electric energy intensity comparisons of 2BF with Benchmarks ............... 60
CHAPTER FOUR ............................................................................................................ 62
SIMULATION STUDIES AND ANALYSIS OF RESULTS ......................................... 62
4.1 Power Distribution System Simulation Results ................................................. 62
4.2 Analysis of Technical Energy Loss ................................................................... 68
4.3 Cost Estimation of Technical Energy loss ......................................................... 71
CHAPTER FIVE .............................................................................................................. 73
CONCLUSIONS, RECOMMENDATIONS AND FUTURE WORK ........................... 73
5.1 Conclusions ........................................................................................................ 73
5.2 Recommendations .............................................................................................. 75
5.3 Suggestions for Future Work ............................................................................. 76
REFERENCES ................................................................................................................. 77
APPENDIX A: Electric Energy bill of 2BF ..................................................................... 80
APPENDIX B: Spread Sheet of technical energy loss ..................................................... 81

vi
LIST OF TABLES
Table 3-1 Name plate data of distribution transformers ................................................. 32
Table 3-2 No load, on load and Taping, data of distribution transformers .................... 32
Table 3-3 Measured and name plate motor data of biscuit factory ................................ 33
Table 3-4 Collected cable data ....................................................................................... 34
Table 3-5 input and output field data measurements for analysis saving potential of
electric motor .................................................................................................................... 35
Table 3-6 Required load flow calculation data ............................................................... 36
Table 3-7 Input data required by the power grid ............................................................ 38
Table 3-8 Luminous Intensity and Life time of Various Lamps .................................... 41
Table 3-9 Illumination required in various working station ........................................... 42
Table 3-10 Lighting data summary................................................................................. 43
Table 3-11 Under load operating electric motor of 2BF ................................................ 54
Table 3-12 Electric motors improvment with replacement of under loaded operating
motors with proper sized motors. ..................................................................................... 57
Table 3-13 Monthly electricity cost of 2BF .................................................................. 58
Table 3-14 Monthly electricity energy intensities of 2BF .............................................. 59
Table 3-15 Energy intensity comparison with benchmarks ........................................... 60
Table 4-1 Simulation results of distribution cables ........................................................ 64
Table 4-2 Simulation results of distribution transformers .............................................. 65
Table 4-3 Annual technical energy loss of distribution cables ....................................... 69
Table 4-4 Annual technical energy loss of distribution transformers ............................. 69

vii
LIST OF FIGURES
Figure 2-1 Location map of Adama town where 2BF is found ........................................ 8
Figure 2-2 Biscuit baking process .................................................................................... 9
Figure 2-3 brother’s flour and biscuit factory organization structure ............................. 10
Figure 2-4 Simplified single line diagram of power distribution system of the factory . 13
Figure 2-5 Comparison between Tubes light with copper choke ................................... 22
Figure 2-6 Equipment Wise Energy Consumption ......................................................... 23
Figure 2-7 Percentage of household graph ..................................................................... 24
Figure 2-8 Annual loads and annual consumption chart ................................................ 25
Figure 2-9 Annual cost for energy chart ......................................................................... 26
Figure 3-1 Prepared one-line diagram ............................................................................ 31
Figure 3-2 Motor losses .................................................................................................. 49
Figure 3-3 Standard vs. high efficiency motors (for typical 3- phase Induction Motors)
.......................................................................................................................................... 50
Figure 3-4 Motor selection from MotorMaster catalog .................................................. 55
Figure 3-5 Energy Efficient motor selection from MotorMaster catalog ....................... 55
Figure 3-6 Motor Saving Analysis as compared to the standard existing motor ............ 56
Figure 3-7 Utility Costs/Use data ................................................................................... 56
Figure 4-1 Simulation results of distribution cables ....................................................... 62
Figure 4-2 Comparison between distribution cables by Voltage drop and Power loss .. 64
Figure 4-3 Comparison between Transformers by power loss and voltage drop ........... 66
Figure 4-4 Simulation results of distribution transformers............................................. 67
Figure 4-5 General simulation results of the factory power distribution System ........... 67

viii
NOMENCLATURES AND ABBREVIATIONS
2BF Brothers Flour and Biscuit Factory
ABB Asean Brown Boveri
AMI Advanced metering infrastructure
AMR Automatic meter reading
ANSI American national standard
B Bus
C Cable
CB Circuit Breaker
CCR Central Control Room
CFL Compact fluorescent lamp
DG Distributed generation
DPCA Distributed Power Coalition of America
DT Distribution Transformer
ECMs Energy Conservation measures
ECOs Energy Conservation Opportunities
EEP Ethiopian Electric Power
EEPCO Ethiopian Electric Power Corporation
EEU Ethiopian Electric Utility
ETAP Electrical Transient Analyzer Program
ETB Ethiopian Birr
HID High-Intensity discharge
HVAC Heating, ventilation and air-conditioning
IEC International electro technical commission
JICA Japan International cooperation Agency
LED Light Emitting diode
LF Load Factor
LLF Loss Load Factor
LTC Load Tap Changing
MD Maximum Demand
MDB Main Distribution Board
METEC Metal Engineering Corporation
NEC National Electric Code
OTI Operation Technology, Inc.
PEA Provincial Electricity Authority
PLED Polymer light emitting diode
PQA Power quality analyzer
SEEDT Selecting Energy Efficient Distribution Transformers
TCF Trillion Cubic Feet
THD Total harmonic distortion
TNEB Tamil Nadu Electricity Board
UGS Underground Raceway Systems
UPS Uninterruptable Power Supply

1
CHAPTER ONE
INTRODUCTION
1.1 Background of the study
Energy conservation is a most spoken subject in the world today. Every factory, industries,
commercial complexes, offices, institutions, hospitals etc. are now totally dependent on
electricity [1]. The demand and the cost of electricity are continuously increasing and
availability is limited. Presently, the energy auditing is becoming more popular to cut
down energy bill and reduce the recurring expenditures [2]. It attempts to balance the total
energy inputs with its use and serves to identify the areas where wastage can be minimized
if not totally eliminated. It also quantifies energy usage according to its discrete functions.
Energy audit consists of several tasks which can be carried out depending on the type of
the audit and the function of the audited facility [3]. It starts with a review of the historical
data on energy consumption, which can be compiled from the electricity bills. Factory
energy audit is an effective tool in defining and pursuing comprehensive energy
management programme [4]. The energy management programme is a systematic on-
going strategy for controlling a factory's energy consumption pattern. It is to reduce waste
of energy and money to the minimum permitted by the climate the factory is located, its
functions, occupancy schedules, and other factors. It establishes and maintains an efficient
balance between a factory's annual functional energy requirements and its annual actual
energy consumption.
As per the Energy Conservation Act, 2001, Energy audit is defined as the verification,
monitoring and analysis of energy use including submission of technical report containing
all the recommendations for improving energy efficiency with cost analysis and an action
plan to reduce consumption [5]. A systematic approach, to monitor industrial energy
consumption and to pin point source of wastage, is known as energy audit. Energy audit is
an energy survey or an energy analysis of energy flows for energy conservation in a
building, process or system to reduce the amount of energy input into the system without
negatively affecting the output(s), so that it is not confused with a financial audit [6].
Recent days, energy saving has become essential rather than electricity generation.
In any factory, the three top operating expenses are often found to be energy (both
electrical and thermal), labour and materials. If one were to relate to the manageability
of the cost or potential cost savings in each of the above components, energy would

2
invariably emerge as a top ranker, and thus energy management function constitutes a
strategic area for cost reduction. The energy demand is increasing because of the
increasing population in the country from time to time. Energy Audit will help to
understand more about the ways energy and fuel are used in any industry, and help in
identifying the areas where waste can occur and where scope for improvement exists.
Electrical Energy Audit forms an integral part of an Industrial Energy Audit. It is one of
the two main forms of energy that is being audited and accounted for during Energy Audit.
For some of the Industries/factories which do not have Thermal Utilities an Energy Audit
will only consist of Electrical Energy Audit, as that of 2BF.
Electrical Energy Audit involves Studying, Assessing, Measuring and Analyzing electrical
utilities. In a typical Plant, the electrical utilities consist of
Transformers
Power Distribution System
Metering and Monitoring System
Motors
Blowers/Fans
Compressors
Pumps
Lighting, Etc.
The Energy Audit would give a positive orientation to the energy cost reduction,
preventive maintenance and quality control programmes which are vital for production
and utility activities. Such an audit programme will help to keep focus on variations which
occur in the energy costs, availability and reliability of supply of energy, decide on
appropriate energy mix, identify energy conservation technologies etc. Energy auditing
will not only save money but it also improves the quality of electrical energy supply. Most
of the saving is possible with low investment, without affecting the manufacturing
processes and quality [7].
In general, Energy Audit is the translation of conservation ideas into realities, by lending
technically feasible solutions with economic and other organizational considerations
within a specified time frame [6].

3
1.2 Statement of the Problem
Both electric utilities and end users of electric energy are becoming concerned about the
energy/power loss and their main causes. The utility is concerned about the power loss or
the energy losses until the meter of consumer and the loss behind the meter is the concern
of the consumer. Brothers Flour and Biscuit Factory is one of the energy intensive
consumer factories in our country as compared to commercial and the expenditure of the
factory for electrical energy is high.
The Factory worker did not know their energy consumption patterns in well-defined
manner by performing energy audit. This is due to:
Lack of awareness for the factory workers about energy management,
Lack of skilled human resource in energy management,
The absence of enough measuring instruments for audit,
Absence of energy audit team in the factories, etc.…
As a result of the above facts Brothers Flour and Biscuit Factory was selected, which has
electrical energy related problems, to conduct energy audit. The walk-through observed
problems (such as using energy inefficient equipment) in the factory also signify that it
should conduct energy auditing. The owner of the factory is unable to know the monthly
profit due to variation of electrical energy consumption for constant output.
This thesis investigates the electrical energy consumption patterns of the Brothers Flour
and Biscuit Factory and analyses the efficiencies of the major energy consuming systems
thereby identifying energy conservation opportunities.
1.3 Objectives
1.3.1 General Objective
The general objective of the research is to investigate the way energy is being used in
Brothers Flour and Biscuit Factory, to identify energy conservation opportunities and
come up with recommendations to minimize energy wastage without affecting production
& quality.
1.3.2 Specific Objectives
The specific objectives of the thesis include:
Understanding how energy is being used in Brothers Flour and Biscuit Factory
Investigating energy conservation opportunities of the factory.

4
Examining electrical energy consuming systems of the factory so the
improvements can be quantified in terms of both energy and cost.
Identifying and analyzing improved operational techniques and / or new
equipment’s that could substantially reduce energy and which ones are cost-
effective
Evaluating economic and technical practicability of opportunities and
recommending the feasible measures
Assessment of technical energy loss of 2BF distribution system components
Determination of causes and effects of technical energy loss in the factory
Recommendations for minimization of energy wastage without affecting
production & quality.
1.4 Significance of the study
The energy audit in a factory is a feasibility study. For it not only serves to identify energy
use among the various services and to identify opportunities for energy conservation [1],
but it is also a crucial first step in establishing an energy management programme. The
audit will produce the data on which such a programme is based. The study reveals to the
owner, manager, or management team of Brothers Flour and Biscuit Factory or for any
concerned body the alternatives available for reducing energy waste, the costs involved,
and the benefits achievable from implementing those energy-conserving opportunities
(ECOs).
1.5 Limitation of the study
In this study technical energy loss was assessed based on maximum power loss (simulation
result at maximum demand), load factor and loss factor of power system components in
the factory power distribution system. The load factor and loss factor were estimated from
the measured power demand of each department based on the production operation period
of each department. However, accurate assessment of technical energy loss requires
accurate load factor and loss factor, and this needs accurate measurement of power demand
for 24 hours, which is measured per hour interval. The main reasons were:
Most of the ammeters, voltmeters, and watt meters installed in the control room
of each department are not accurate which is observed during sample measurement
and sum of them are already damaged. Hence, the only alternative was to measure
load current of each department device.

5
Measuring load current for 24 hours per hour interval for each equipment, which
are installed far away from each other, was impossible by one person. At least it
requires three people per department, to measure day and night demand per 24
hours accurately.
1.6 Methodology
Generally, the methodology employed under this study is presented according to the
following steps.
1. Gathering data and analyzing it with preliminary audit, critical analysis of papers
2. Conducting introductory meetings, audit interview, walk through tour with
relevant managers by establishing work relation with the factory management
3. Primary data of the power distribution system of the factory is gathered through
personal interviews, measurement, telephone, and the available documents of the
company
4. Analysis of lighting system and electric motor analysis with Motor Master +
International software as well as bill analysis with bench mark have been done
5. Simulation of the model of the factory power distribution system is prepared using
ETAP 12.6.0
6. Load flow analysis of the simulation is done numerically using ETAP
7. Load flow result of the simulation is compared to the standard
8. Technical energy loss of branch circuits is calculated and the result is compared to
the ideal standard for loss in electrical power system (3-6%)
9. Cost of technical energy loss is estimated according to EEU tariff
10. Identifying energy conservation opportunities by:
Performing technical evaluation
Performing economic evaluation
Calculating payback periods for energy consuming equipment’s used in the
factory
11. Investigation of motors and their data as well as ECOs (economic conservation
opportunities with software) is done.

6
1.7 Organization of the thesis
This thesis contains 5 chapters which are organized as follows: -
Chapter one provides general introduction of the thesis, which highlights the background
of thesis, statement of the problem, objectives of the thesis.
Chapter two describes about the factory as well as background theory and literature review
of energy audit and technical electrical energy loss assessment.
Chapter three is about data collection and system modelling. Under this chapter data
organization, system modelling and software used and analysis of different load of the
factory are explained in detail. Major power consuming areas which have high energy
saving opportunities are also discussed and technically and economically feasible energy
conservation opportunities are summarized.
Chapter four presents simulation studies, analysis of results and discussions. In the last
chapter, conclusions and recommendations of the research is presented. Finally, the
references and appendices are presented at the end of the thesis.

7
CHAPTER TWO
ENERGY EFFICIRENCY TECHNOLOGIES AT
BROTHERS FLOUR & BISCUIT FACTORY AND
LITERATURE REVIEW
2.1 Brothers Flour and Biscuit Factory
Brother Flour & Biscuit Factory is a profit based company established in November 1992
E.C for the purpose of engaging mainly in the business of food processing, with the initial
capital investment of 8,671,660 ETB on 700 sq.m land, The Company is owned by private
shareholders and over seen by the general manager Mr. Mohamed Seid Ibrahim. The total
area of the company is more than (30,000) Sq.m. at this time.
The latest Brother Flour & Biscuit Factory was equipped with modern biscuit
manufacturing technology which was established in 2004 E.C.
Location
2BF is found in Adama city. Adama, also known as Nazreth, is a city in central Ethiopia
and the previous capital of the Oromia Region. Adama forms a special Zone of Oromia
which have six sub cities and is surrounded by Misrak Shewa Zone. It is located at
08°32′29″N 39°16′08″E/ 8.54139°N 39.26889°E Latitude and Longitude respectively at
an elevation of 1,712 meters (5,617 ft.), 99 Km, which is now reduced to around 84 Km
on high way, Southeast of Addis Ababa along the main road to Harar. The city sits between
the base of an escarpment to the west, and the Great Rift Valley to the east.

8
Figure 2-1 Location map of Adama town where 2BF is found
Climate
Adama lies in somewhat warm and lower badda dare Climate. Hence, it enjoys hot and
dry weather for the greater part of the winter and warm and sunny climate in summer.
Thus, the area is generally, known for its attractive weekends and summer resort release.
References to its temperature points that Adama has a minimum annual temperature falling
between 190 and 220C. Its yearly minimum rainfall is reported to be 760 mm.
Biscuit Production Process
The production process involves the following unit operations; receiving raw material,
cleaning, storage, transferring through conveyors to intermediate storage, seed mixing,
milling, packing, dough mixing, rotary molder (Hard dough), rotary cutter/laminator (Soft
Dough), biscuit baking oven, cooling conveyor, stacking machine, and finally to biscuit
packing machines.

9
All materials except flour are preparatory mixed in a certain cream mixer. Materials used
at this stage are sugar, shortening, salt, millet jelly, glucose, starch etc. Materials premixed
in the previous stage are put into the mixing machine with flow and undergone
fermentation. Then the dough is rolled by laminator and the dough sheet is made and it is
automatically punched in a molded design by a cutting machine.
Biscuit is then baked on a steel belt (or wire mesh belt) running in the oven for some
minutes. The speed of the belt can be adjusted based on the kind of biscuit. After baking,
biscuits are cooled on a cooling conveyor which is connected to oven. Finally, biscuits are
stacked and then packed.
Figure 2-2 Biscuit baking process
There are around 60 ovens of 15KW each in one factory. Oven of 2 factories have
intelligent controller. The milling, mixing, biscuit baking as well as packing are fully
automated. The size of packaging range for flour is (50 & 100) KG and the packaging
range for biscuit is 24.07 & 53.80 gram. In different part of the machine there is
temperature control device, flow meters, control board, etc. most of them are digital
devices and some of them have chart.
Organizational Structure
Everyone in the company has responsibility for the quality and safety of its work, to
operate in conformance with requirements of the food safety management system.
Moreover, particular responsibilities and authorities are assigned to managers for the
effective operation of their departments. Specific responsibilities for each employee are
indicated and communicated in the job description, work instruction and procedures as
required. Figure 2-3 shows the factory organizational structure in block diagram.

10
Figure 2-3 brother’s flour and biscuit factory organization structure
Staff profile
Currently the factory has total number of more than 1800 workers, out of which:
800 are Permanent staff including the administrators which have total of around 45
professionals (15 Degree and 30 College Diploma), and
1000 are temporary workers and this number varies based on the day today activity
of the factory
2BF have six departments, statistician and secretaries under General Manager. The six
departments include: Total personnel service department, finance department,
maintenance/electrical department, property section, Wheat Flour production department,
and Biscuit production department. The distribution of the permanent workers in each
department depends on the need of the factory. Temporary workers are needed with
different number within each working day of the factory based on the activities performed
in each section of the factory. Most of the time, more temporary workers are needed in
Wheat Flour and Biscuit production sections.

11
Operating Hours
The factory operates throughout the year with three shifts 8 hours operating times for each
shift.
Morning shift from 6:00 AM to 2:00 PM
Afternoon shift from 2:00 PM to 10:00 PM and
The last which is Night shift is from 10:00 PM to 6:00 AM
Depending on the availability of the product, if there is sufficient product, some of the
machines may not be in operation on Sunday once a week.
Utilities
The factory depends on the following utility systems: -
i. Electricity utility systems: The factory uses electricity for lighting and to run
electrical appliances (such as pumps motors, flour milling motor, oven, air
compressor fans, mixer, conveyor, laminator, computers, etc.). So, the factory
should have the necessary source of electricity utility systems.
ii. Water distribution utility systems: The factory consumes too much water. The
source of much amount of water used in 2BF is ground water in the factory
compound and some amount is from Adama town water utility distribution system.
Therefore, to have these functions the factories presence of water distribution
utility systems is required.
Additionally, the factory has three 250KVA standby diesel generators which are used
during power interruption for some critical loads. This generator only supplies loads
connected to the transformer named T3 & T4, T5 & T6 and T7 & T8. The factory has a
total connected load of about 4.608MVA as obtained from the factory’s data.
Major energy consuming equipment’s
Major energy consuming equipment’s in 2BF are motors. Here motors which have rated
power greater than 1HP are taken as major energy consuming equipment.
Cream mixer
Dough mixing machine
Laminator
Cutting machine
Rotary molding machine
Steel belt Oven

12
Cooling conveyor
3-step cooling conveyor
Stacking machine
Wire cut attachment
Oil spray machine
Revolving salt duster -
Factory supply
Power is supplied from Adama distribution substation which supplies the factory
distribution system through 15KV overhead transmission line. The factory consists of nine
distribution transformers, which is shown in figure 2-4.
The factory is classified into different departments and sections in consideration to its vast
size and process. The departments are generally named as production departments,
electrical departments, and supporting facilities. Inside the production department also
there are different departments which are assigned according to the production process
undertaken. And, all the departments have their own control room with appropriate
protective devices, controllers and fault or history indicators in collaboration with CCR
(central control room). Power is distributed to different departments and each department
has its own distribution transformer. Currently the factory is on the erection process to
expand the factory. Simplified one-line diagram of the factory is given below and the load
labelled 1 to 6 are the load on each transformer at which their value is specified in chapter
3.

13
Figure 2-4 Simplified single line diagram of power distribution system of the factory
2.2 Energy Security Systems and Energy Auditing
Energy is an overpowering need of any society. It plays an important role in the national
security of any given country as a fuel to power the economic engine. However, the uneven
distribution of energy supplies among countries has led to significant vulnerabilities and
as a scarce resource it has been an underlying cause of political conflicts and wars. Energy
security is a term for an association between national security and the availability of natural
energy resources. It refers to the uninterrupted availability of energy sources at an
affordable price. Long-term energy security is linked to timely investments to supply
energy in line with economic developments and environmental needs. On the other hand,
short-term energy security focuses on the ability of the energy system to react promptly to
sudden changes in the supply-demand balance. Currently, long term measures are being
considered in the world to increase energy security by reducing dependence on any one
source of imported energy, exploiting native fossil fuel or renewable energy resources,
increasing the number of suppliers, and reducing overall demand through energy
conservation measures. In addition to the security problem, the gathering and use of energy
resources can also be harmful to local ecosystems and may have global outcomes. When

14
producing electrical energy from the conventional energy resources through the traditional
processes, the greenhouse gases leak into the atmosphere, which are very harmful to the
environment. With these concerns countries have been researching new methods of
creating electricity in a clean way [9].
Types of Energy Audit
Energy audit is the basic to a systematic approach for decision-making in the area of energy
management. It attempts to balance the total energy inputs with its use and assists to
identify all the energy streams in a facility. It is the process of assessing the way energy is
being used and possibly wasted in industries, factories, energy consuming systems,
machines, etc… and if there is wastage, it takes corrective measures to diminish the
wastage. Minimization of energy wastage is done by finding better way of meeting the
energy demand. Saving money on energy bills is attractive to business, industries and
individuals alike. Customers, whose energy bills use up a large part of their income and
especially those customers whose energy bills represent a substantial fraction of their
company’s operating costs, have a strong inspiration to initiate and continue an ongoing
energy cost control program. Energy audit is sometimes called an energy survey or an
energy analysis, so that, it is not in a weak position (hampered) with the negative
connotation of an audit. Energy Audit can be classified into two types.
1. Preliminary Audit [11] [12]: It is a relatively quick exercise to:
Establish energy consumption in the organization
Estimate the scope for saving
Identify the most likely and the easiest areas for attention
Identify immediate (especially no- or low-cost) improvements or savings
Set a “bench mark” (reference point)
Identify areas for more detailed study or measurement
Preliminary energy audit uses existing, or easily obtained data.
The preliminary audit alternatively called a simple audit, screening audit or walk-through
audit which is the simplest and quickest type of audit. It involves slight interviews with
site operating personnel, a brief review of facility utility bills and other operating data, and
a walk-through of the facility to become familiar with the building operation and identify
glaring areas of energy waste or wastefulness.
2. Detailed Audit [12] [13]: -A wide-ranging audit provides a detailed energy project
implementation plan for a facility, since it evaluates all major energy using systems.

15
This type of audit provides the most accurate estimate of energy savings and costs. It
considers all the equipment’s that use existing energy in the factory and performs
energy cost saving calculations.
In a comprehensive audit, one of the key elements is the energy balance. This is based on
an inventory of energy using systems, assumptions of present operating conditions and
calculations of energy use. This estimated use is then compared to utility bill charges.
This type of audit will be able to identify all energy conservation measures which are
suitable for the facility given in operating parameters. A detailed financial analysis is
executed for each measure based on detailed implementation cost estimates (site-specific
operating cost savings, and the customer's investment criteria).
Energy Efficiency
Efficient energy use, or simply called energy efficiency, is the goal of efforts made to
reduce the amount of energy required to provide products and to attain the same level of
services. Improvements in energy efficiency are most often achieved by adopting a more
efficient technology or production process. Reducing energy use reduces energy costs and
may result in a financial cost saving to consumers if the energy savings offset any
additional costs of implementing an energy efficient technology. Energy efficiency is also
seen to have a national security benefit because it can be used to reduce the level of energy
imports from foreign countries and may slow down the rate at which domestic energy
resources are depleted. As more electricity is used, fossil-fueled power plants not only
generate more electricity, but also more pollution. Therefore, reducing energy use is also
seen as a key solution to the problem of reducing emissions [10].
Power and Energy Losses
Power system losses are the difference in the amount of energy or power that is required
to be delivered to a system to supply the customer’s energy or power needs and the power
or energy practical used by customers.
1. Power losses, defined in kW or MW create a need for the provision of additional
capacity to be installed on the system over and above that required to meet the
system demand.
2. Energy Losses, defined in kWh or MWh, is the integral of the power losses with
respect to time and represents the amount of additional energy that needs to be
purchased.

16
Energy losses associated with a distribution system can be classified as follows [14]:
1) Technical Losses - losses associated with the electrical system
Series losses which are proportional to the square of the current and to the
resistance of the circuit elements and
Shunt losses due the excitation losses in transformers and rotating
machines, as well as leakage currents in cables
2) Non-technical (economical) losses - losses associated with unidentified and
uncollected revenue. This covers matters such as illegal connections, meter
tampering, metering errors, errors in estimating unmetered supplies, errors in
invoicing and revenue collection.
The technical loss is the component of distribution system losses that is inherent in the
electrical equipment, devices and conductors used in the physical delivery of electric
energy. It includes the Load and No-Load (or Fixed) losses in the following [15]:
Sub-transmission Lines;
Substation Power Transformers;
Primary Distribution Lines;
Distribution Transformers;
Secondary Distribution Lines;
Service Drops;
Voltage Regulators;
Capacitors;
Reactors; and
All other electrical equipment necessary for the operation of the Distribution
System.
This research focuses on distribution transformers, and secondary distribution lines
technical energy loss for 2BF power distribution system.
Technical losses represent 6-8% of the cost of generated electricity and 25% of the cost to
deliver the electricity to the customer [14]. Transformer losses in distribution network are
also considered as copper losses due to the internal impedance of the transformer coils and
the core losses. Transformers connected to the energy distribution network are connected
permanently to the power supply system; therefore, the no- load losses of the transformer
must be taken in to consideration.

17
2.3 Basic Energy Efficiency Principles and Technologies
During the design and development process, energy efficient buildings must have a
comprehensive, integrated outlook that seeks to reduce loads. Although a single technique
cannot achieve a significant energy reduction, combined techniques could do it. So many
combinations should be assessed.
Climate and Site
The basic principle of building climatic design focuses on the building's response to the
natural environment and how to gain the maximum benefit from the local climatic
conditions. A building’s location and surroundings play a key role in regulating its
temperature and illumination.
The six important aspects of architectural planning which will affect thermal and energy
performance of buildings are site selection, layout, shape, spacing, orientation and mutual
relationship. When faced with unfavorable climatic conditions, optimal siting and site
design may solve all or part of the problems. Site elements to be considered include
topography (slopes, valleys, hills and their surface conditions), vegetation (plant types,
mass, texture) and built forms (surrounding buildings and structures). For example, trees,
landscaping, and hills can provide shade and block wind. In cooler climates, designing
buildings with south-facing windows increases the amount of sun entering the building,
minimizing energy use by maximizing passive solar heating. Tight building design,
including energy-efficient windows, well-sealed doors, and additional thermal insulation
of walls, basement slabs, and foundations can reduce heat loss by 25 to 50 percent [17].
Building Envelope
Elements of the building envelope are exterior walls, windows, roof, underground slab and
foundation. And the three factors determining the heat flow across the building envelope
are temperature differential, area of the building exposed and heat transmission value of
the exposed area [18].
Glazing must be selected for optimal performance. Glass on south, east and west facades
should be highly protective against solar heat gain, except glazing that is protected by
shading devices or south-facing glazing being used for passive solar heating. Glass on
north facades can be clear or lightly tinted. Consider fritted and spectrally selective
glazing, tuned to use and orientation on south, east or west elevations.

18
To minimize heating, and cooling loads, effective insulation should be provided by
optimally insulating the building envelope. Avoid thermal bridging in metal-framed
assemblies through exterior wall, roof and floor details and components. Avoid irregular
exterior building shapes, which increase surface area, resulting in unwanted heat loss.
Air and moisture in the building envelope should be controlled by detailing the building
envelope to minimize infiltration and to prevent moisture build-up within the walls due to
condensation. Ensure that all internal sources of humidity are properly ventilated.
Efficient Lighting Systems
Energy efficient lighting system should ensure that illumination is not excessive and
switching is provided to turn off unnecessary light. Also, take advantage of day-lighting
opportunities whenever possible. The use of techniques to bring sunlight into buildings
and the efficiency of artificial lighting system can contribute to saving energy. Efficient
lighting system that utilizes both natural and electric sources can also provide a
comfortable yet visually interesting environment for the occupants. Lighting systems
introduce heat into the space and increase building cooling loads. Because lighting systems
significantly impact a building’s operating cost and energy performance, options for the
lighting systems should be evaluated before considering strategies for a low-energy HVAC
system. Therefore, to reduce the need for artificial lighting, minimize the total primary
energy consumption and energy costs, daylighting techniques are the first daytime solution
to employ. Efficient daylighting design should consider sky conditions, site environment,
building space and form, glazing systems. By comparing different energy efficiency
lamps: Fluorescent Lamps: are about 3 to 5 times as efficient as standard incandescent
lamps and can last about 10 to 20 times longer. To gain the most efficiency, use current
and proven equipment technology and install fluorescent luminaires in places where they
can be integrated with the architecture, available daylight, and switching or dimming
controls [9] [17]. Compact fluorescent lamps (CFLs) are often used as a simple substitute
for incandescent lamps due to their significantly longer life and better energy efficiency.
Due to their small size, CFL lamps are used in recessed Luminaires, wall and ceiling
mounted fixtures, and even track lighting and task lighting. The diffuse nature of the
fluorescent lamp makes the CFL lamp a good choice for down lighting and wall lighting.
Compact fluorescents have a typical life of about 8,000 hours [23].
High-Intensity Discharge Lamps (HID): are still one of the best performing and most
efficient lamps for lighting large areas or great distances. Metal halide (white light) lamps

19
are replacing high pressure sodium lamps in many outdoor applications because white light
sources can be 2 to 30 times more effective in peripheral visual detection than yellow-
orange sources like high pressure sodium. Typically, HID lamps do not work well with
occupancy sensors because most HID lamps take a long time to start each time they are
switched off. Special ballasts are available that allow the lights to be step-dimmed to 50%
(or another level). These ballasts could be used with occupancy sensors and the lights
would be automatically dimmed to a set level when the room is unoccupied [10] [17].
Incandescent Lamps: are still used for specialty lighting, where the warm color, controlled
brightness, instant-on, and dimming capabilities of these sources is needed. However,
because of their lower energy efficiency and shorter lamp life, incandescent lamps should
be used carefully for lighting of specific features. Incandescent bulbs have a typical life of
1,000 hours [10] [17].
Light Emitting Diodes, LED Lamps: is a solid-state lamp that uses light-emitting diodes
(LEDs) as the source of light. High power light-emitting diodes with higher lumen output
are making it possible to replace other lamps with LED lamps. LED lamps can be made
interchangeable with other types of lamps. LED lamps offer long service life and high
6energy efficiency, but initial costs are higher than those of fluorescent lamps. LED lamps
are used for both general and special-purpose lighting. Compared to fluorescent bulbs,
advantages claimed for LED light bulbs are that they turn on instantly, and that lifetime is
unaffected by cycling on and off, so that they are well suited for light fixtures where bulbs
are often turned on and off. A LED lamp can be made dimmable over a wide range. Many
LED lamps have become available as replacements for screw-in incandescent or compact
fluorescent light bulbs, ranging from low-power 5–40 watt incandescent bulbs, through
conventional replacement bulbs for 60 watt incandescent bulbs (typically requiring about
6 watts of power), and higher wattage bulbs, e.g., a 13-16 watt LED bulb which is about
as bright as a 100W incandescent [22]. These bulbs are more power-efficient than compact
fluorescent bulbs and offer lifespan of 30,000 or more hours, reduced operated at a higher
temperature than specified. LED light bulb can be expected to last 25–30 years under
normal use. The higher purchase cost than other types may be more than offset by savings
in energy and maintenance [10] [17].
Fluorescent Ballasts: The efficiency of fluorescent tubes with modern electronic ballasts
and compact fluorescents commonly ranges from 50 to 67lum/w. Most compact
fluorescents rated at 13 W or more with integral electronic ballasts achieve about 60lum/w,
which is comparable to the LED bulb [17].

20
Rapid start ballasts: offer a long lamp life at a reasonable cost. They have been
used for years with lighting controls to provide energy savings.
Instant start ballasts: have higher efficiency than rapid start ballasts, but lamp life
is shorter, especially when the frequency of starts is increased due to the use of
controls. They are often used where energy savings is the primary goal and lights
are on continuously for very long periods of time.
Program rapid start ballasts: are the best to use for energy efficiency and long lamp
life. These ballasts are slightly more expensive than standard rapid start ballasts,
but use a "gentler" starting method so that frequent starting lessens the reduction
in rated lamp life.
Dimming electronic ballasts: for linear fluorescent lamps usually fall into two
categories. The first type has a dimming range of 5% or 10% up to 100% light
output and is generally the least expensive. This ballast is commonly used when
the lowest light levels are not needed, or to achieve energy savings by dimming the
lights when there is plentiful daylight. The second type of ballast often referred to
as an "architectural dimming ballast," is more expensive and has a dimming range
of 1% to 100% light output. This ballast is used in situations where lower light
levels are desired.
Electronic high-intensity discharge ballasts (HID): for metal halide lamps are now
available for most lamps up to 150 watts. These ballasts should improve lamp
performance and offer a limited range of dimming to achieve some energy savings.
Efficient electric lighting controls are used in lighting design to achieve a high quality
energy efficient lighting system. They are used as part of an efficient lighting system that
integrates daylight and electric light sources to provide a comfortable and visually
interesting environment for the occupants of a space. Electric lighting controls can be
incorporated with daylighting to provide flexibility and energy savings. Specifying a
daylight-integrated lighting control system gives the occupants control of the lighting
while providing appropriate lighting levels. Lighting controls [17] [21]:
Provide multi-zone switching for multiple use spaces by properly zoning lighting
circuits and switches to optimize energy-efficient operation
Provide multi-level switching for multiple use spaces through multi-level controls
Incorporate time clock or energy management system controls

21
When electric lighting controls are used properly, energy will be saved and the life of
lamps and ballasts can be extended. Lighting controls will help reduce energy by:
Reducing the number of hours per year that the lights are on
Allowing occupants to use controls to lower light levels and save energy
Reducing the amount of power used during the peak demand period by
automatically dimming lights or turning them off when they are not needed
Reducing internal heat gains by cutting down lighting use, which allows for
reduced
HVAC system size and a reduction in the building's cooling needs
Efficient Electrical Equipment
Other industrial systems that consume energy include electrical appliances, motors,
pumps, compressor, oven, etc... Modern energy-efficient appliances use significantly less
energy than older conventional model appliances. In addition to this, the replacement of
old appliances is one of the most efficient global measures to reduce emissions of
greenhouse gases.
Many countries identify energy-efficient appliances using energy input labeling.
Appliance consumer products meeting independent energy efficiency testing and receiving
Eco-label certification marks for reduced electrical-'natural-gas' consumption and product
manufacturing carbon emission labels are preferred for use in Low-energy buildings. The
eco label certification marks of Energy Star and EKO-energy are examples.
2.4 Literature Review
Literature referred in carrying out this thesis work are guidelines, books, articles,
publications, website and research papers mostly published in international journals have
been reviewed and appropriate strategies and methodologies were adopted. The notes
given under this chapter are taken from these sources.
2.4.1 Electrical energy Auditing
Malkiat Singh [25] presents his idea about industrial energy management. As there was a
different industry, the demand for the energy is also variable (different), across the world
with the growing technique and innovation in the field of energy has proved the path for
achieving energy efficiency. It conveys us to look forward to more renewable resources
present around us and with the managed approach of renewable energy source with the
audit a more cost effective and efficient energy technology can be achieved. Along with

22
this one also had to make changes in the installation process. Figure 2-5 shows the
comparison of power consumption between Fluorescent tube with copper choke and
Fluorescent tube with electronics choke.
Figure 2-5 Comparison between Tubes light with copper choke
It indicates that the Fluorescent tubes with copper chokes consume more energy than
fluorescent tubes with electronics chokes.
Mehul Kumar [26] this paper deals with energy conservation and its value in developing
the economy of one country. As considering materially, the standard of the living in any
economy is evaluated by the expense of the energy used per capita. As with the growing
population a huge exploitation of energy can be seen on the earth’s resources.
He concluded that the energy audit type is one of types which add completeness to the
energy conservation. In present scenario apart from the industrial point of view most of
the common peoples are wasting huge amount of power (energy) by different methods in
their homes, shops, etc. due to lack of awareness. Also the consumer has to look at the
more efficient techniques and machineries towards the renewable energy resources. This
research paper will help the owner to know the status of the factory through energy audit
analyzed by ETAP software.
Mukesh k saini [1] in this paper the author state about the industrial development in India
and provide recommendation for industry energy audit. He considered as an electrical
energy consumption by industries is about 60 percent of the total energy consumption. The
industrial development in the country is progressing at a fast pace, due to the increase in

23
the number of industries the gap between demand and supply of electricity is also
increasing day by day and to solve this problem author suggest that doing the energy audit
for all industries on regular bases as the best solution. The energy audit will determine
energy wastage and losses and provide techniques and ways to minimize the losses. The
energy consumption techniques suggested by the energy audit will not only minimize the
losses but also reduce monthly electricity bill. In general, this paper suggests ways and
means to conduct an energy audit in industry.
Figure 2-6 Equipment Wise Energy Consumption
This paper focuses light on the advantages of the conventional energy sources and its loss-
less power generation every growing economy is mainly using the resources available on
the earth and hot conserving the energy by innovation techniques. As electrical equipment,
transmission also creates loss. A huge loss in the industries and at domestic level is existed
because of the harmonics and distortion present which distorts the sinusoidal waveform.
The authors [27] Mario E. Berges & Etal says Non-intrusive load monitoring is an idea for
reducing the power consumption and operation schedule or individual load in a building
through measurement of voltage and current. There are many opportunities reducing
electricity consumption in building. Energy audit is used as one way to obtain accurate
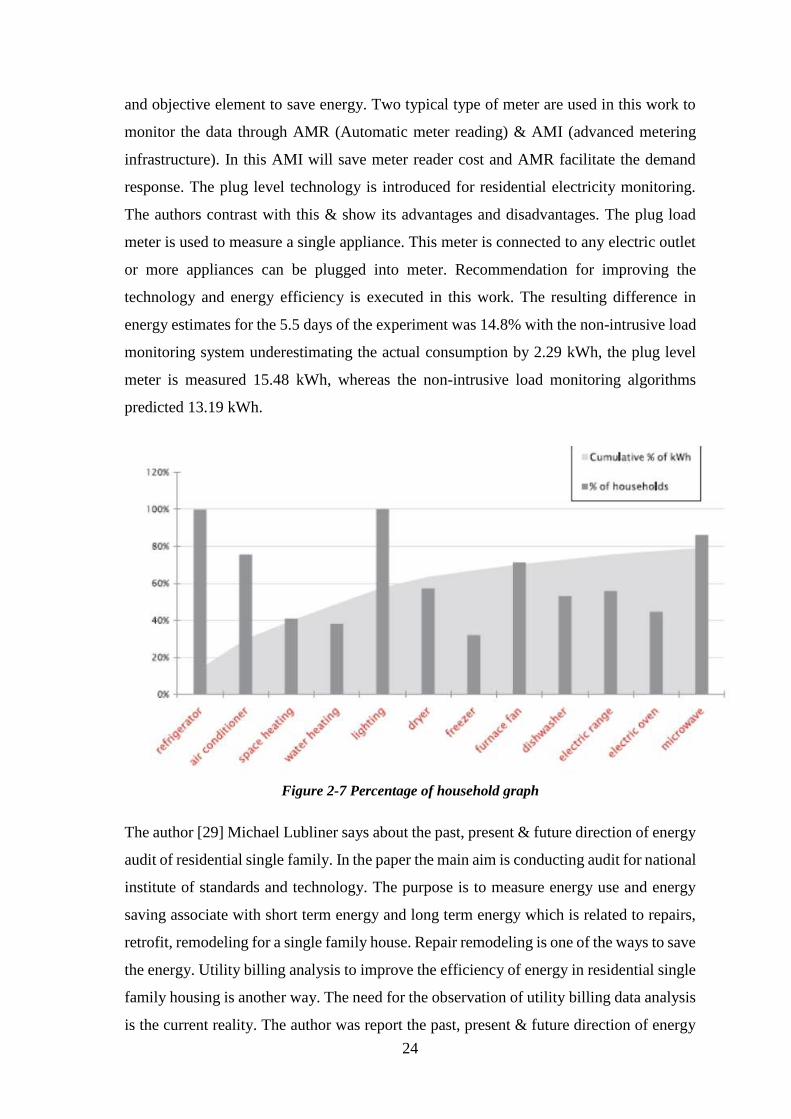
24
and objective element to save energy. Two typical type of meter are used in this work to
monitor the data through AMR (Automatic meter reading) & AMI (advanced metering
infrastructure). In this AMI will save meter reader cost and AMR facilitate the demand
response. The plug level technology is introduced for residential electricity monitoring.
The authors contrast with this & show its advantages and disadvantages. The plug load
meter is used to measure a single appliance. This meter is connected to any electric outlet
or more appliances can be plugged into meter. Recommendation for improving the
technology and energy efficiency is executed in this work. The resulting difference in
energy estimates for the 5.5 days of the experiment was 14.8% with the non-intrusive load
monitoring system underestimating the actual consumption by 2.29 kWh, the plug level
meter is measured 15.48 kWh, whereas the non-intrusive load monitoring algorithms
predicted 13.19 kWh.
Figure 2-7 Percentage of household graph
The author [29] Michael Lubliner says about the past, present & future direction of energy
audit of residential single family. In the paper the main aim is conducting audit for national
institute of standards and technology. The purpose is to measure energy use and energy
saving associate with short term energy and long term energy which is related to repairs,
retrofit, remodeling for a single family house. Repair remodeling is one of the ways to save
the energy. Utility billing analysis to improve the efficiency of energy in residential single
family housing is another way. The need for the observation of utility billing data analysis
is the current reality. The author was report the past, present & future direction of energy
25
audit in single family houses for heating & ventilating air conditioning for industries. The
residential or domestic energy audit research will improve the energy efficiency. The
author’s use the round robin auditing to improve energy auditing and retrofit practices.
Finally, the author feedback from round robin to helps ensure that house owner get
comparatively consistent, reliable, repeatable & useful recommendation from home
performance contracting industry.
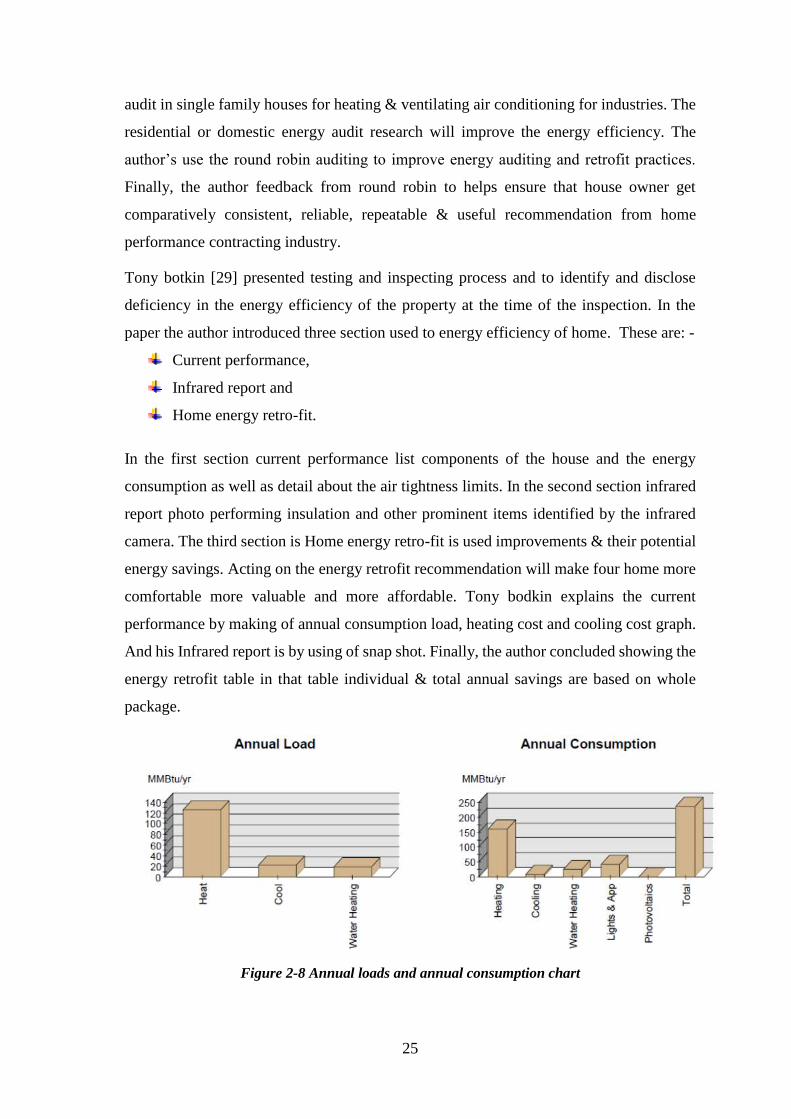
Tony botkin [29] presented testing and inspecting process and to identify and disclose
deficiency in the energy efficiency of the property at the time of the inspection. In the
paper the author introduced three section used to energy efficiency of home. These are: -
Current performance,
Infrared report and
Home energy retro-fit.
In the first section current performance list components of the house and the energy
consumption as well as detail about the air tightness limits. In the second section infrared
report photo performing insulation and other prominent items identified by the infrared
camera. The third section is Home energy retro-fit is used improvements & their potential
energy savings. Acting on the energy retrofit recommendation will make four home more
comfortable more valuable and more affordable. Tony bodkin explains the current
performance by making of annual consumption load, heating cost and cooling cost graph.
And his Infrared report is by using of snap shot. Finally, the author concluded showing the
energy retrofit table in that table individual & total annual savings are based on whole
package.
Figure 2-8 Annual loads and annual consumption chart

26
Figure 2-9 Annual cost for energy chart
Bhansali, V.K [31] describes that the gap between supply and demand of energy is
continuously increasing despite huge outlay for energy sector since independence. Further,
the burning of fossil fuel is resulting in greenhouse gases which are detrimental to the
environment. The gap between supply and demand of energy can be bridged with the help
of energy conservation which may be considered as a new source of energy which is
benign and environment friendly. The energy conservation is cost effective with a short
payback period and modest investment. There is a good scope of energy conservation in
various sectors, viz., industry, agriculture, transport and domestic. The energy audit can
unearth huge profits to the industry. The industrial sector has failed to take full advantage
of many financial incentives provided by the government to encourage energy
conservation strategies. The planners have started appreciating the role and significance
of energy conservation in future energy scenario of India. However, the achievements so
far are far from satisfactory. It is imperative to develop energy conservation as a mass
movement.
2.4.2 Technical Loss Assessment
Betrianis et al [32] have employed simulation method to study technical energy loss of
distribution system. Their paper is presented as follows.
One best method to see a system is to make a model and do simulation. Model is a
representation of a system. Through model, it can be easier to forecast and control the
changing of each element system. Electricity distribution is also a system. Losses are
general problem that exist in a distribution network system. But with the right methods,

27
specifically technical energy losses can be reduced in order to increase the efficiency. By
making model of the distribution network, the value of technical energy losses in the whole
network as well as in every line can be observed. Simulation can also be used to see all
losses reduction alternatives. By comparing results from each alternative, the best
alternative, which gives best result can be decided and implemented. To make a good
simulation, it needs a model based on real condition. So the model can represent real
condition. [32] has done their research in distribution station, a distribution station which
has operated since 1970s, and it focus on low voltage network and counts only technical
energy losses.
For constructing the model, [32] used Simulink software which is packaged with Matlab
ver. 6.5.1. In Simulink, subsystem construction is possible. So, [32] constructs the main
model simply by using subsystems, and places complicated formulas on those subsystems.
This simplifies their main model. In model construction, there are three main subsystems,
[32] employs: pole subsystems, cable sub-systems, and station subsystems.
According to [32] the present model, simulation displays varied total energy and total
losses. But in short, total average energy which comes out from the station is 4,831.345
kWh per day with average daily losses as big as 203.4023 kWh. In means losses are 4.21
% from total energy. Finally, seven alternatives are used to minimize the average daily
losses; seven of them employ replacing distribution lines with high loss.
Narong Mungkung et al [33], which have been one of the best literatures this study refers,
were really crucial for this study. It has been helpful in simplifying the methodology used
to assess the technical loss. Their paper presents the techniques used to assess power loss
and calculates technical energy loss provided in different power system equipments. [33],
first uses PSS/Adept program to find maximum power loss by simulating a model and then
mathematically calculate the technical energy loss provided in different power system
components as follows:
Transmission Line Losses (kWh) = Loss Factor * Line Losses * period.
When
Loss Factor = 267.033.0 LFLF ………………………………………………….. (2.1)
Load Factor (LF) =Peak
AVe
KW
KW
Peakload
dAverageloa ……………………………………….. (2.2)

28
Power Transformer Losses included two types:
No Load Losses are losses which occurred at core of transformer. The core losses
are ensured from current which causes magnetic flux in core of transformer, when
it is energized. Core losses are constant value at constant voltage.
Load Losses are losses which are occurred at winding of transformer. At the
beginning this loss was known by Copper losses but this time since transformer are
also using aluminum instead of copper, winding loss is the appropriate name.
Power Transformer Losses = Winding Losses + No Load Losses.
When
No Load Losses
Core losses from test report of manufacturer or Provincial Electricity Authority (PEA)
standard.
Winding Losses = LossFactorLoadLossesMVA
MVA
Rated
Peak**
2
2
……………………….… (2.3)
Load Losses = Copper losses from Test Report of manufacturer.
Loss Factor = 28.02.0 LFLF …………………….………………….…………..…. (2.4)
Distribution line losses = Loss Factor * Line Losses * period
When
Loss Factor = 267.033.0 LFLF …………………………….….…………………. (2.5)
Load Factor (LF) from eqn. (2.2)
Distribution Transformer Losses = Winding Losses + No Load Losses
When
No Load Losses from Provincial Electricity Authority (PEA) standard
Winding Losses from eqn. (2.3)
Load Losses from PEA standard
Loss Factor from eqn. (2.4)
According to [33], technical energy loss due to transmission lines, power transformers,
distribution lines, and low voltage transformers and distribution lines was totally
42,201.675 MWH.
Marina Yusoff et al [34], in their research on TNB distribution system technical loss
assessment, have employed a simplified approach for estimating technical loss based on
load profile and feeder characteristics; such as length, peak demand to installed capacity
ratio, and load distribution profile. The developed methodology is implemented in spread

29
sheets format, which is simple and user friendly. It requires minimum set of input data,
while giving reasonably accurate results. The approach is tested on a real TNB distribution
network and the results were reasonably accurate. Additionally, the spread sheet developed
based on the methodology could also be used to perform various energy auditing exercises.
The proposed approach of [34] for their study is peak power loss functions of medium
voltage feeders of different characteristics (variation in feeder length, peak demand, and
load distribution profile) are first established through network simulation using PSS Adept
software. Subsequently, technical losses for each medium voltage feeder are estimated
based on user input peak demand, load factor, and feeder length. An analytical expression
incorporating weight-age factors, calculated by taking the ratio of energy flow through
each feeder against the total energy supplied to the system is used to estimate technical
losses contributed by the respective medium voltage network. Technical losses in
distribution transformers are estimated based on empirical formulas of no load and full
load loss scaled by capacity factors. For low voltage network, its technical losses level is
primarily influenced by its percentage loading, besides load factor and network type
(overhead or underground).
Bo Yang et al [35] has developed four feeder models representing typical urban, suburban,
semi-rural and rural feeders, which are used as a platform to examine the breakdown of
technical losses in distribution systems. Two attributes are evaluated to illuminate the
characteristics of technical losses, peak power loss and yearly energy loss. Power losses
are analyzed assuming system loading at close to its thermal limit and are summarized for
each system level, i.e. main feeder (three phase), laterals, distribution transformers,
secondary mains, and service drops.

30
CHAPTER THREE
DATA COLLECTION AND SYSTEM MODELLING
3.1 Data Collection
The methodology employed under this study to assess technical energy loss is to develop
a system model. The model is developed from the one-line diagrams, the electrical
equipment data (transformers, cables, machines, etc.), the utility system characteristics,
and the loading information. The result is a database that should include the following
elements:
Representation of the utility system supplying the facility.
Transformers (ratings and nameplate impedances).
Cable data (resistance, reactance, capacitance)
Load data for each bus/boards (kW, kvar, and kVA).
The first part of the process is to gather data on the system. This involves finding circuit
diagrams, information on transformers, cables, motors etc. and finally the load size in
(kVA, Kvar, KW) and type of loads. In addition, bills and all energy consumption data of
the factory were collected.
One-line diagram is prepared to simplify the circuit so that data can be easily gathered
from the practical network of the factory and modelled by ETAP 12.6.0. All the bus bar,
transformer, motor, and load ID’S are created just for this study. And the detail data’s of
the components in the network is given according to this ID’S. The prepared one-line
diagram is given in figure 3-1.

31
Figure 3-1 Prepared one-line diagram
Finally, the summary of the data gathered for transformers, cables, motors and loads is
given below.
Most of the data’s used to model the distribution transformers are gathered from the name
plate of the transformers except the X/R which is typically selected by ETAP depending
on the percentage impedance of the transformer. In addition to this, no load and on load
loss data for the distribution transformers are gathered from the SEEDT (Selecting Energy
Efficient Distribution Transformers) [39], ABB distribution transformers manufacturer
data and EEPCO for distribution transformers and it is used to calculate transformer
technical loss. All the name plate data’s, including the no load and on load data’s used, are
given in Table 3-1 and 3-2
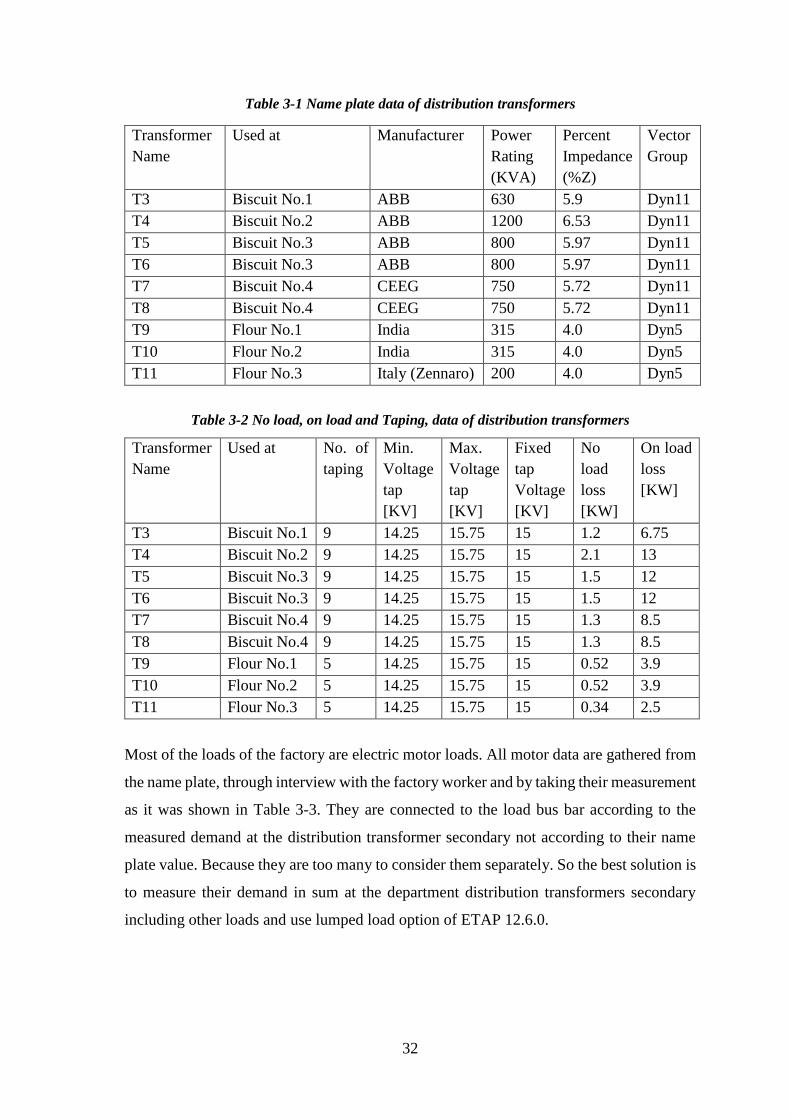
32
Table 3-1 Name plate data of distribution transformers
Transformer
Name
Used at Manufacturer Power
Rating
(KVA)
Percent
Impedance
(%Z)
Vector
Group
T3 Biscuit No.1 ABB 630 5.9 Dyn11
T4 Biscuit No.2 ABB 1200 6.53 Dyn11
T5 Biscuit No.3 ABB 800 5.97 Dyn11
T6 Biscuit No.3 ABB 800 5.97 Dyn11
T7 Biscuit No.4 CEEG 750 5.72 Dyn11
T8 Biscuit No.4 CEEG 750 5.72 Dyn11
T9 Flour No.1 India 315 4.0 Dyn5
T10 Flour No.2 India 315 4.0 Dyn5
T11 Flour No.3 Italy (Zennaro) 200 4.0 Dyn5
Table 3-2 No load, on load and Taping, data of distribution transformers
Transformer
Name
Used at No. of
taping
Min.
Voltage
tap
[KV]
Max.
Voltage
tap
[KV]
Fixed
tap
Voltage
[KV]
No
load
loss
[KW]
On load
loss
[KW]
T3 Biscuit No.1 9 14.25 15.75 15 1.2 6.75
T4 Biscuit No.2 9 14.25 15.75 15 2.1 13
T5 Biscuit No.3 9 14.25 15.75 15 1.5 12
T6 Biscuit No.3 9 14.25 15.75 15 1.5 12
T7 Biscuit No.4 9 14.25 15.75 15 1.3 8.5
T8 Biscuit No.4 9 14.25 15.75 15 1.3 8.5
T9 Flour No.1 5 14.25 15.75 15 0.52 3.9
T10 Flour No.2 5 14.25 15.75 15 0.52 3.9
T11 Flour No.3 5 14.25 15.75 15 0.34 2.5
Most of the loads of the factory are electric motor loads. All motor data are gathered from
the name plate, through interview with the factory worker and by taking their measurement
as it was shown in Table 3-3. They are connected to the load bus bar according to the
measured demand at the distribution transformer secondary not according to their name
plate value. Because they are too many to consider them separately. So the best solution is
to measure their demand in sum at the department distribution transformers secondary
including other loads and use lumped load option of ETAP 12.6.0.

33
Table 3-3 Measured and name plate motor data of biscuit factory
Name of
Motor
Name plate data Measured Data
Type
Rat
ed
Volt
age
V(V
)
Spee
d
(RP
M)
Curr
ent
(A)
Pow
er
(KW
)
Pow
er
Fac
tor
Volt
age
V(v
)
Curr
ent
I(A
)
Pow
er
P(K
W)
Pow
er
fact
or
Air
Compressor
(*2)
GA11F
380
1420
23
11
0.88
378.6
18.51
8.23
0.83
Horizontal
mixer (*2)
TR750
400
3560
135
65
0.87
400.9
117.9
48.31
0.86
Pri Mixer JM Gola
400
1410
5.7
1.5
0.79
392.6
4.93
1.34
0.77
Pri Mixer
pressure
control
Mlk Mul
400
2900
32
15
0.88
388.2
28.91
10.52
0.83
Sugar Mill M200L
A
400
3560
52.7
36
0.9
393.6
46.75
31.91
0.84
Sugar
Conveyor
M1100
380
1450
4.65
2.2
0.81
379.4
3.52
1.63
0.73
Sugar Mixer EF100L
B.4
400
1430
6.5
3
0.82
394.2
4.81
1.91
0.77
Invert pump
1752J
415
935
5.1
2.2
0.87
402.3
4.82
1.78
0.81
Dough load
unload
M3A RF
400
1430
4.9
2.2
0.78
392.4
4.27
1.95
0.71
Palm
Oil(Cream)
Mixer
M200
400
1430
25
12
0.85
391.1
21.83
10.56
0.74
Laminator 1 KAZ87 380 1460 14.3 4 0.83 380.2 11.43 3.24 0.77
Laminator 2 KAZ87 380 1460 14.3 4 0.82 380.6 11.14 3.31 0.74
Laminator 3 KAZ97 380 1420 2.55 1.1 0.79 380.8 2.31 0.82 0.71
Laminator 4 KAZ87 380 1430 5.45 1.5 0.77 379.4 4.21 1.12 0.70
Oven 11-21-
014
400 - 1.43 935 - 368 2.15 924 0.89
Biscuit
Conveyor
(*10)
SF 47 380 1420 2.5 1.1 0.92 372 2.2 1.12 0.87
Packing(*4) EPL 22 380 - 25 22 0.88 374.3 23.5 19 0.85
Water pump PS6 220 - 3.5 1.5 0.87 205 2.8 1.24 0.83
Total 1195
.2

34
The cable data are gathered from the factory documentation [39] and electric cables
handbook [40]. Since the contribution of underground cables to the technical loss depends
on the resistance, reactance, capacitance and length of the cables accurate data are
required. So the exact length is taken from the cable list documentation of the factory; and
the exact resistance, reactance and capacitance from the electric cables handbook
according to its specification because it is not in the cable list documentation. Cable data
are given in Table 3-4.
Table 3-4 Collected cable data
Cable ID
Connected Bus ID Length
[Km]
R
[]
X
[]
Y
[S] From To
Cable 1 B2 B4 0.012 0.004 0.001 0.00000118
Cable 2 B3 B4 0.012 0.004 0.001 0.00000118
Cable 3 B5 B6 0.084 0.029 0.009 0.0000084
Cable 4 B5 B7 0.250 0.014 0.023 0.00005
Cable 5 B5 B8 0.072 0.025 0.008 0.0000072
Cable 6 B5 B9 0.072 0.025 0.008 0.0000072
Cable7 B5 B10 0.450 0.185 0.047 0.000003
Cable8 B5 B11 0.450 0.185 0.047 0.000003
Cable 9 B5 B12 0.311 0.106 0.033 0.0000311
Cable 10 B5 B13 0.311 0.106 0.033 0.0000311
Cable 11 B5 B14 0.077 0.026 0.008 0.0000077
For this research clump on ammeter is used for direct measurement of load current, which
is taken at each load. The same load current is considered for each phase because the
system is balanced. It is also assumed that the measured current is fundamental frequency
current; losses due to harmonic currents are not considered. Technical loss of a distribution
system varies as the load demand connected to it varies. As the given factory have
consistent period of operation load varies slightly. So, consideration of the whole day
demand or load duration curve of the distribution system is not required to assess technical
energy loss. Load duration curve for Brothers Flour and Biscuit factory is not available,
so the consumption of power for each individual department is measured, considering
process of production interval.
The overall peak power demand of 2BF power distribution is 3.924MW and 2.364Mvar at
utility entrance according to EEU peak power demand data.

35
3.2 Software Description and Model Development
In this research two softwares are used for selecting a proper electric motor in
terms of efficiency, cost effectiveness & energy saving potential and technical energy loss
assessment.
Motor master + International software
Motor Master + International software supports motor management functions at
commercial and institutional facilities, water supply and wastewater treatment systems,
irrigation districts and medium sized and large industrial facilities. Designed for utility
auditors, energy managers, and plant or consulting engineers, International Motor
Selection and Savings Analysis (IMSSA) Software supports motor and motor systems
improvement planning through identifying the most efficient action for a given repair or
motor purchase decision. IMSSA can be used to compute the energy and demand savings
associated with purchase of a new EFF1 instead of a standard EFF3 or Improved
Efficiency EFF2 motor model or evaluate the cost-effectiveness of replacing a failed or
operable EFF3 motor with an EFF1 motor [47]. Input and output data for the software is
shown in Table 3-5.
Table 3-5 input and output field data measurements for analysis saving potential of electric
motor
Input for existing motors
(Existing Data)
Input for energy efficient
motors (Software catalogue)
Output parameters
-Power rating (KW)
-Loading (%)
-Efficiency (%)
-Nameplate speed (rpm)
-Voltage rating (v)
-Power rating (KW)
-Loading (%)
-Efficiency (%)
-Nameplate speed (rpm)
-Voltage rating (v)
-Purchase price
-Energy
-Demand savings and
-simple Payback period
ETAP 12.6.0 software
ETAP 12.6.0 is used as software for this study. Operation Technology, Inc (OTI) is the
developer of the ETAP enterprise solution for the simulation and analysis of electrical
power systems using offline as well as real-time data. Operation Technology, Inc. is a full

36
spectrum analytical engineering firm specializing in the planning, design, analysis,
operation, training, and computer simulation of power systems.
Table 3-6 Required load flow calculation data
Bus Data
1. Nominal kV
2. %V & Angle (when initial condition is set to use bus voltage)
3. Load diversity factor(when the loading option is set use DF)
Branch Data
1. Branch Z, R, X or X/R values and units, tolerance, and temperature, if
applicable
2. Cable and Transmission line, length, and units
3. Transformer rated KV, and KVA/MVA, tap, and LTC settings
4. Impedance base KV and base KVA/MVA
Power Grid
Data
1. Operating mode (Swing, Voltage control, Mvar control or pf control)
2. Nominal/Rated KV
3. %V and angle for Swing mode
4. %V, MW loading, and Mvar limits (Q max and Q min) for Voltage control
mode
5. MW and Mvar loading for Mvar control mode.
Induction
Motor Data
1. Rated KW/HP and KV
2. Power factors and efficiencies at 100%, 75%, and 50% loadings.
3. % of loading and loading category ID
4. Equipment cable data.
Static Load
Data
1. Static load ID
2. Rated KVA/MVA and KV
3. Power factor
4. % loading and loading category ID
5. Equipment cable data
Lumped
Load Data
1. Load ID
2. Rated KV, KVA/MVA, power factor, and % motor load
3. % loading and loading category ID

37
The full version of ETAP is integrated with all calculation modules such as Load Flow,
Short-Circuit, Transient Stability, DC load flow, Optimal Capacitor Placement, Harmonic
Analysis, Protective Device Coordination, UGS, and ETAP Real-Time etc. Newton-
Raphson, Fast–decoupled, and Accelerated Gauss-Seidel are the three load flow solution
methods available. The Newton-Raphson method is recommended for use with any system
as a first choice after few Gauss-Seidel iterations to establish a set of bus voltage initial
values. It uses ANSI or IEC standard; so for a new project it is mandatory to select ANSI
or IEC standard first. For this study load flow modules are used to estimate technical
energy loss. Required load flow calculation data for buses, branch, Power grid, static load
and lumped load data are given in Table 3-6.
3.2.1 Constructing the Model
Power Grid
The power grid is used as swing bus and the following data’s are used as an input.
Short circuit current, rated KV and X/R are data of the transmission line from Adama
substation, which is the input for the power transformer primary, it is taken from EEP. The
others are calculated as follows based on the given data:
Step1. Calculate the source impedance [42]
%Z source = (Z source ohms / %Z transformer base) x 100 ………………...……….(3.1)
Where,
Z source ohms = (KV L-L) 2 / (MVA short circuit) ………………...………...……… (3.2)
%Z transformer = (KV L-L)2/ (MVA transformer) …………………………..…..……(3.3)
Finally, %Z source = (MVA transformers / MVA short circuit) x 100
MVA short circuit = √3 x KVL-L X I Short circuit ………….………..…………………….(3.4)
MVA short circuit =√3 x 132 KV X 28 KA = 6,401.7 MVA
%Z transformer and MVA transformer are 10.05%, 25MVA
%Z source = (25MVA) / (6401.7MVA)
Z source = 0.0039 Ω
%Z source at 100 MVA base can be calculated as follows
%Z source = Z source Ohms ×rmerMVAtransfo
100MVA
%Z source = 0.0039 Ω × MVA25
100MVA
%Z source = 0.016
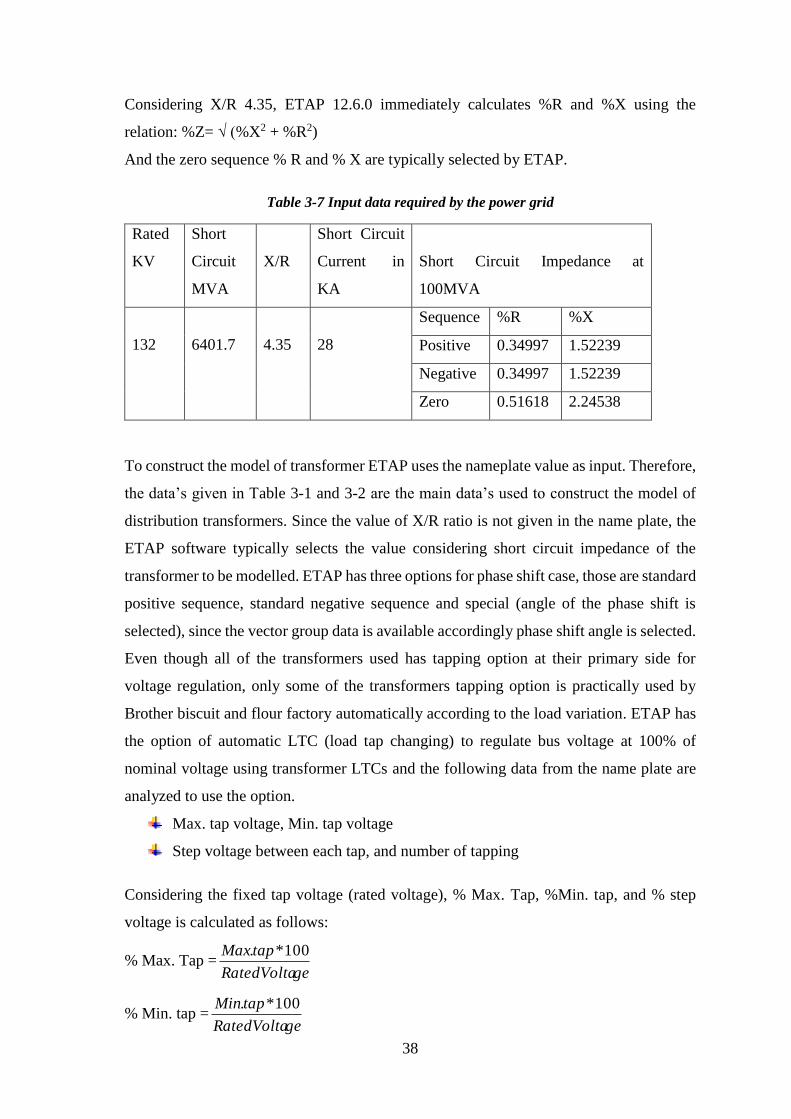
38
Considering X/R 4.35, ETAP 12.6.0 immediately calculates %R and %X using the
relation: %Z= √ (%X2 + %R2)
And the zero sequence % R and % X are typically selected by ETAP.
Table 3-7 Input data required by the power grid
To construct the model of transformer ETAP uses the nameplate value as input. Therefore,
the data’s given in Table 3-1 and 3-2 are the main data’s used to construct the model of
distribution transformers. Since the value of X/R ratio is not given in the name plate, the
ETAP software typically selects the value considering short circuit impedance of the
transformer to be modelled. ETAP has three options for phase shift case, those are standard
positive sequence, standard negative sequence and special (angle of the phase shift is
selected), since the vector group data is available accordingly phase shift angle is selected.
Even though all of the transformers used has tapping option at their primary side for
voltage regulation, only some of the transformers tapping option is practically used by
Brother biscuit and flour factory automatically according to the load variation. ETAP has
the option of automatic LTC (load tap changing) to regulate bus voltage at 100% of
nominal voltage using transformer LTCs and the following data from the name plate are
analyzed to use the option.
Max. tap voltage, Min. tap voltage
Step voltage between each tap, and number of tapping
Considering the fixed tap voltage (rated voltage), % Max. Tap, %Min. tap, and % step
voltage is calculated as follows:
% Max. Tap =geRatedVolta
tapMax 100*.
% Min. tap =geRatedVolta
tapMin 100*.
Rated
KV
Short
Circuit
MVA
X/R
Short Circuit
Current in
KA
Short Circuit Impedance at
100MVA
132
6401.7
4.35
28
Sequence %R %X
Positive 0.34997 1.52239
Negative 0.34997 1.52239
Zero 0.51618 2.24538

39
% Step voltage = geRatedVolta
eStepVoltag 100*
ETAP has two options to construct load model, which are lumped and Static load options.
First, MW, MVar and MVA equivalent of the load current measured is calculated
considering V L-L and 0.91 power factor at MDB, measured power factor for 2BF
distribution system is 0.91 at MDB. Next depending on the type of loads available, motor
or static loads, load models are selected. Static load is selected for loads, which are
stationary and lumped load for loads, which are mixture of both motor and static load.
Under the lumped load option, the mixture of motor and static load is identified in percent.
For this study, lumped load option is selected because the composition of motor is more
than 85%. Since peak power loss of each branch component is required, peak load current
is selected from the measured load current to calculate the MVA rating of lumped loads.
3.2.2 Technical Loss Estimation
The methodology used in this study to estimate the overall technical loss of the factory
distribution system detail calculation is shown below:
1. Distribution Line Technical Losses
The feeder current (Im) at maximum demand is measured (MD)
Network model of the whole industrial distribution system is prepared using ETAP
12.6.0.
Load flow is carried out for the network model maximum demand connected at
each load bus bar and power loss at maximum demand is determined (KW loss @
MD).
Load Factor (LF) of the distribution feeder is determined using equation 3.6.
The Load Loss Factor (LLF) is calculated using the empirical formula [42]
LLF = 0.2 * LF + 0.8 * LF2 …………………………………………(3.5)
When
Load Factor (LF) = )(
)(
peak
avg
KWPeakLoad
KWdAverageLoa ……………………..…(3.6)
The annual technical loss for the distribution feeder is calculated using the formula
below:
Annual technical energy loss for distribution feeder = (KW loss) * LLF * 8760......(3.7)
where
8760= 24 hours * 365 days

40
Total annual technical loss for all distribution feeders can then be calculated by
summing the annual loss for each individual distribution feeder.
2. Distribution Transformer Technical Loss
MD (maximum demand) of transformers is measured.
Typical copper losses (LCU) of the transformers at their nameplate rating are
determined from ABB technical data catalogue and European distribution
transformer loss standard.
Copper loss (LCm ) is calculated for the distribution transformers at MD using the
following empirical formula:
LCm = LCU * (MD / Transformer Nameplate Rating)2 ………………….……(3.8)
The load factor (LF) of the distribution transformer is estimated.
The load loss factor (LLF) is calculated using the empirical formula given below:
LLF = 0.2 * LF + 0.8 * LF2
Average copper loss (LC) for the distribution transformer is calculated as follows:
LC = LCM * LLF……………………………………………………………....(3.9)
Iron losses (LI) for the distribution transformers are added.
Total annual loss of the distribution transformer is calculated as follows:
Total annual technical loss for distribution transformers = (LC + LI) * 8760.…(3.10)
Total technical losses for all distribution transformers can then be calculated by
summing the annual technical loss for each individual distribution transformer.
3.3 Major causes of energy loss and saving opportunities in 2BF
Based on the walk-through audit conducted in the factory as well as information from the
collected data, the major power consuming areas which have high energy saving
opportunities are lightings, rewound motors, electrical networks, and air compressors.
Energy efficiency improvements for the factory refers to a reduction in the energy usage
for a given energy service (production, lighting, etc.). Energy efficiency is a matter of
individual behavior and rationale of energy consumers. Avoiding excessive consumption
of energy or choosing the most appropriate equipment to reduce the cost of the energy
contribute to decrease individual energy consumption without affecting individual welfare
and production.
There are different opportunities to improve energy efficiency of 2BF by maintaining or
enhancing productivity. Improving energy efficiency at the factory was approached from

41
several directions. First, the factory uses energy for different equipment’s which require
regular maintenance, good operation and replacement when necessary. Thus, a critical
element of the factory energy management involves the efficient control of cross-cutting
equipment that powers the production processes of a factory. Second and equally
important area is the proper and efficient operation of the processes. Process optimization
and ensuring the most productive technologies are keys to realize energy saving in a
factory’s Operation.
3.3.1 Analysis of Lighting Systems
Lighting system analysis of the factory was done by comparing the existing lighting
system with appropriate illumination (standard lux) level for various sections of the
factory, which may reduce the energy use and cost throughout the entire factory.
For the purpose of analyzing existing lighting systems of the factory, it is necessary to
consider & determine the:
total number of lamps and power rating which was installed in each section
Area of each room measured in square meter.
Operating hours of each lamps
Standard illumination required or illumination of specific working stations and
Total lumen output and illumination produced by the existing lamp installed in the
room
Table 3-8 Luminous Intensity and Life time of Various Lamps
No. Types of lamps Luminous
Intensity
[Lumens/watt]
Relative
Efficiency
based on HPS
Lamp Life
[hrs]
1 Incandescent 8-18 19% 1000-2000
2 Tungsten-Halogen Lamps 80-100 77% 2000-4000
3 High Pressure Hg Vapour lamps 50-60 46% 16,000-24,000
4 Fluorescent tube 65-85 65% 5000
5 LED Lights 70-120 92% 50,000-100,000
6 High Pressure Sodium 75-130 100% 24,000
7 Low Pressure Sodium 100-200 100% plus 24,000
8 Compact Fluorescent Lam 30-60 46% 7,000-10,000

42
The luminous intensity of various lamps and the standard illumination required in various
working stations are given in Table 3-7 and 3-8 respectively.
Various terms and definitions are used to quantify light, light source, etc. They are
luminous flux, luminous intensity, illumination, luminance, etc.
Table 3-9 Illumination required in various working station
No. Working station Average Illumination required
[Lux=lumens/m2]
1 Office 500
2 Workshops 200-750
3 General Store 300
4 Baking Rooms 500-1000
5 Flour Mill 600-1000
6 Garage 500
The key descriptions and discussions of the results of the lighting data of Table 3-8 are
given below.
The following relation shows detail calculation about the lighting used.
Total Power=Peach *Number of Lamps ………….……..…………….....…. (3.11)
Total luminous o/put of lamps=Number of Lamps *Lo.………………..… (3.12)
IP=TL/RA …….…………………………………...………..……………. (3.13)
where
Peach – is power of each lamp
Lo – is the luminous output of each fluorescent lamp which is 85 lumens/watt obtained
from Table 3-7
RA – Area of each room [m2]
IP –illumination produced in each section by Installed lamps expressed in lux (1 lux
~1lumens/m2).
OH – Operating hours per day
LR – The lamps required for proper illumination which is used to analyze energy wastes
due to improper illumination. Number of lamps required with the same ratings at the
factory can be calculated as: -
LR=(IR/IP) *NL …………………………………………………………………… (3.14)

43
Table 3-10 Lighting data summary
No. Section NL TP
(KW)
TL
[Lumen]
RA
[m2]
IP
[Lum
n/m2]
LR OH
[hr.
]
EU
[KWh]
/day
ER
[KWh]
/day
ED
[KWH]
/day
1 Administratio
n building 76 3.040 258400 340 760 50 8 24.32 16.00 8.32
2 Guard 8 0.480 5760 32 180 8 24 11.52 11.52 0.00
3 Biscuit Store 92 3.680 312800 600 521.3 88 24 88.32 88.48 3.84
4 Biscuit
Baking room 162 6.480 550800 800 688.5 236 24 155.52 226.56 -71.04
5 Raw material
store 40 1.600 136000 300 453.3 26 24 38.4 24.96 13.44
6 Flour store 96 3.840 326400 520 627.7 46 8 30.72 14.72 16.00
7 Garage 38 1.520 129200 240 538.3 36 8 12.16 11.52 0.64
8 Flour mill 360 1.440 1224000 600 2040 176 24 345.60 168.96 176.64
9 Biscuit Baking
room 4 25 6.250 812500 320 2539 10 24 150.00 60.00 90.00
10 General store 22 0.880 74800 150 498.7 16 8 7.04 5.12 1.92
11 Wheat store 70 2.800 238000 750 317.3 66 24 67.20 63.36 3.84
12 Bran store 30 1.200 102000 200 510 18 24 28.80 17.28 11.52
13 Workshops 22 0.880 74800 128 584.4 28 8 7.04 8.96 -1.92
14 Maintenance 16 0.640 54400 118 461.0 10 8 5.12 3.20 1.92
15 Time keeper 4 0.160 13600 36 377.8 4 24 3.84 3.84 0.00
16 Packing and
transport 26 1.040 88400 240 368.3 36 16 16.64 23.04 -6.40
17 Rest Room 16 0.960 11520 36 320 16 16 15.36 15.36 0.00
Total 1103 49.85 872 1007.6 758.88 248.72
where
IR= is the illumination required in each room which is 500 Lux for office from Table 3-7
and this figure is compared with the lux produced in each office. The lamp required (LR)
are calculated for each section and compared with number of lamps (NL) currently
installed. Energy utilization (EU) for the lighting systems can be calculated using equation
below and compared with the energy required (ER) after a proper illumination as shown

44
in table. Energy difference (ED) shows the difference between energy utilization and the
energy required after proper illumination.
EU=NL*Peach ……...……………………………………………….………..…...…. (3.15)
ER=LR*Peach………………...………………………………………….….……….. (3.16)
ED=EU-ER …………...………………………….………………………………… (3.17)
The lighting data of each department of the factory is collected and analyzed in Table 3-9.
Currently a total of 1103 lamps which consists of 1054 fluorescent, 24 incandescent, and
25 high pressure sodium lamps are installed with 40 W, 60 W and 250 W power ratings
respectively. Total installed capacity of the lighting system is about 49.85 KW and a daily
energy consumption of 1,007.6 kWh. The actual lamps required in the factory should be
838 fluorescents, 24 incandescent, and 10 high pressure sodium lamps. Therefore, there is
a significant energy differences (ED) between the energy utilization (EU) due to
unnecessary installed lamps and the energy required (ER). The result shows 248.72 KWh
daily energy loss which gives 90,782.8 KWh per year due to lighting systems in the
factory.
3.3.2 Energy Conservation opportunities in Lighting System
As it was discussed above, there is a chance to conserve energy within this lighting system.
Inventorying existing lighting, identifying deficiencies, evaluating improvements, and
listing these improvements to guide the retrofit are all most easily done with a Table, such
as a spreadsheet, which lists all spaces in a building. The space-by-space approach may
seem like it is extra effort, but it typically makes the evaluation and recommendations go
faster, with better results and more energy savings. Without space-by-space evaluations,
opportunities are missed, and confusion arises when proceeding from evaluation/audit to
installation. Therefore, it is essential to examine whether the light source is utilized in the
most efficient way and take energy saving measures. Energy saving opportunities of the
lighting system that should be implemented in the factory have been discussed below.
Lighting Controls
Lights can be shut off during non-working hours manually or by automatic controls, such
as occupancy sensors that turn off lights in unoccupied areas, spaces that have intermittent
occupancy, such as conference rooms and storage areas.
Occupancy sensors can save up to 10-20% of facility lighting energy use. System Manual
controls can be used in conjunction with automatic controls to save additional energy in
smaller areas. One of the easiest measures is to install switches to allow occupants to

45
control lights. It is also important to make employees aware of the importance of turning
off lights in other lighting controls include daylight controls for indoor and outdoor lights,
which adjust the intensity of electrical lighting based on the availability of daylight [44].
Task Lighting
Task lighting denotes providing the required illuminance only in the actual area where the
task is being performed, while the general illuminance of the shop floor or office is kept
at a lower level; e.g. Machine mounted lamps or Table lamps. Energy saving takes place
because good task lighting can be attained with low wattage lamps. If the concept of task
lighting is implemented, it can reduce the number of general lighting fixtures, reduce the
wattage of lamps, save considerable energy and provide better illumination and also
provide visually attractive atmosphere. In some engineering industries, task lighting on
machines is provided with CFLs. Even in offices, localized Table lighting with CFLs may
be preferred instead of providing a large number of fluorescent tube lights of uniform
general lighting [43].
Use of Natural Day Lighting
Day lighting is the effective use of natural light in order to minimize the need for artificial
light in buildings. Increasing daylight levels within a rooms can reduce electrical lighting
loads. Effective day lighting system may provide evenly dispersed light without creating
heat gains. Day lighting differs from other energy conserving measures because its features
are integral to the architecture of a building, and so it is applied primarily to new buildings
and incorporated at the design stage. However, existing buildings can be cost-effectively
refitted with day lighting systems. Various day lighting systems are available on the
market; some of which can be supplied as kits to retrofit an existing building. Day lighting
can be combined with lighting controls to maximize its benefits. Because of its variability,
day lighting is usually combined with artificial lighting to provide the necessary
illumination on cloudy days or after dark. Day lighting technologies include properly
placed and shaded windows, atria, angular or traditional (flat) roof lights, clerestories, light
shelves, and light ducts. Clerestories, light shelves, and light ducts utilize angles of the sun
and redirect light with walls or reflectors.
Not all parts of a facility may be suitable for the application of day lighting. Day lighting
is most appropriate for those areas that are used in daytime hours by people. In office
spaces, day lighting may save between 30 and 70%. The savings will vary widely
depending the facility and buildings. Some problems associated with day lighting in

46
industrial buildings have been identified due to the structure of the building. Various
companies offer day lighting technologies. Day lighting systems will have a payback
period of around 4 years, although shorter paybacks have been achieved [43].
Lighting Maintenance
Maintenance is basic to lighting efficiency. The light levels decrease through time because
of aging lamps and dirt on fixtures, lamps and room surfaces. These factors can reduce
total illumination by 50 percent or more, while lights continue drawing full power.
The following basic and simple maintenance suggestions can help prevent this.
-Replace lenses if they appear yellow.
-Make fixtures, lamps and lenses clean every 6 to 24 months by wiping off the
dust.
-Clean or repaint small rooms every year and larger rooms every 2 to 3 years. Dirt
collects on surfaces, which reduces the amount of light they reflect [43].
Installation improvement of the System
There must be sufficient and suitable illumination for varieties of operation in the factory.
The illumination required for various operations and the luminous intensity of various
lamps are given in Table 3-7 and 3-8. As explained above, currently, there are 1103
lighting points installed in the factory all fitted with 40W fluorescent lamps, 60W
incandescent lamps and 250W High pressure sodium lamps. In certain work station
segments the illumination is not significant and additional lamps need to be installed to
bring the appropriate brightness. On the other hand, there is more than sufficient
illumination in the other work station indicating possibility of reducing the number of
lamps installed in these work stations. After the appropriate illumination has been checked,
only 872 lamps or 838 fluorescent lamps of 40W ratings, 24 incandescent lamps of 60W
ratings and 10 high pressure sodium lamps of 250W ratings would be required. This results
in total reduction of 231 lamps which is equivalent to 12.374 KW of power. It also results
in energy saving of 90,782.8 KWh per year and in money savings of 37,093.95 Ethiopian
Birr annually. The analysis of lighting lamps has done through comprising of the existing
illumination level at the specific area of the factory with the standards of illumination (see
Table 3-9 lighting data summary), the saving potential of lighting systems from
illumination level improvement.

47
Incandescent lamp replacement with CFL
The existing incandescent lamps which have 60W power rating can be replaced by energy
efficient compact florescent lamps (CFL) with 18W power ratings. The cost of the
replacement lamp is determined about $2.7(74.25 ETB) more than the 60W lamp which
was $1.25(34.375) [50]. The new lamp is a direct screw in replacement and no change is
needed in the fixture. Labor cost is assumed to be the same to install either lamp. Energy
saving is realized in replacement of incandescent lamps with CFL because the luminous
intensity of CFL is better than that of the incandescent lamp as it can be seen in Table 3.7.
The benefits or cost savings can be calculated as:
Power saving (PS):
PS = total power of incandescent lamp – total power of CFL
= (LRincandescent *Peach/1000) -(LRCFL*Peach/1000)
= [(24*60) -(24*18)]/1000=24*(60-18)/1000
= 1.008 KW
Energy Saving (ES):
ES =PS*(NL*OH) =1.008 KW (8*24hrs/day + 16*16hrs/day) *365 days/year
= 1.008 KW* (192+256) *365 days/year
=164,828.16 KWh/year
Ethiopian Birr Saving (ETB Saving):
ETB/year Saving = ES*Tariff Rate= 164,828.16 kwh/year * 0.4086 birr/KWh = 67,348.79
Payback period (SPP): The SPP for an ECO is found by taking the initial cost and dividing
it by the annual savings.
SPP= 24*74.25/ETB Saving = (24*74.25 ETB)/67,348.79 ETB/year
=0.0266 years
This would be considered an extremely cost effective ECO. Therefore, it is recommended
that the existing incandescent lamps should be replaced by CFL to get saving of 67,348.79
ETB/year with SPP of 0.0266years.
Replacing T-12 Tubes with T-8 Tubes
In many industries including 2BF T-12 tube florescent lamps have been used. Quite
simply, “T” which stands for tubular is the diameter of the tube in the lamp. A T-12 tube
refers to the diameter in 1/8-inch increment (T-12 means 12/8 inch or 3.8 cm diameter
tubes). The initial output and energy consumption of these lights is high. These also have
extremely poor efficiency, lamp life, lumen depreciation, and colour rendering index.
Because of these maintenance and energy costs of T-12 tubes are high. Replacing T-12(old

48
and inefficient) lamps with T-8 (smaller diameter) lamps approximately doubles the
efficiency of the former, the narrower the lamp the more efficient it will be. Also, T-8
tubes generally last 60% longer than T-12 tubes, which lead to savings in maintenance
costs. Typical energy savings from the replacement of a T-12 lamp by a T-8 lamp are
around 30% and also 20% more expensive in cost [46]. As it has been discussed earlier,
there are 1103 lamps currently installed in the factory indicating that there are 1054 T-12
fluorescent tubes. After the corrected installation, however, only 838 lighting points would
be required.
Replacing these 838 T-12 lamp tubes with T-8 lamps tubes is given by:
Power saving (PS):
PS = (0.3*LR*Peach)/1000 = (0.3*838*40)/1000
= 10.056 KW
Energy Saving (ES):
ES = (0.3*ER*365 days/year) = 0.3*758.91 KWh/day*365 days /year
=83,100.65 KWh/year
Ethiopian Birr Saving (ETB Saving):
ETB Saving=ES*Tariff Rate= 83,100.65 kwh/year*0.4086 birr/KWh = 33,954.9
ETB/year
Simple Payback period (SPP)= 9.954,33
838*65*2.0 0.321 years, or about 4 months. This would
be considered an extremely cost effective ECO.
3.3.3 Analysis of Electric Motors
Brothers biscuit and flour factory uses a vast number of electric motors. These are used to
drive many different machines. The motors consume more than 75% of electrical energy
in the factory. By improving the efficiencies of these motors or by replacing with energy
efficient motors 5% to 15% of electrical energy can be saved.
The efficiency of a motor can be defined as “the ratio of a motor’s useful mechanical power
output to its total electrical power input.”
iP
Loadhp**746.0 ……………………...……………………………………. (3.18)
where
η = Efficiency as operated in %
Hp = Nameplate rated horsepower

49
Load = Output power as a % of rated power
Pi= Three-phase power in KW
Motors convert electrical energy to mechanical energy to serve a certain load. In this
process, Energy is lost as shown in Figure 3-2. Manufacturers design motors to operate at
a 50-100% load. But once the load drops below 50% the efficiency decreases rapidly.
Figure 3-2 motor losses
Many motors of different power ratings are currently in operation in the factory. Most of
these motors are old, rewound and not regularly maintained. At present the motor
technology is improved. Energy efficient motors are being designed to transfer the input
energy to the shaft very efficiently. Efficient motors also tend to have a better relative
performance at part load, which is of increased benefit for applications with variable load
requirements. In this regard there is a high opportunity to save energy in the factory. High
motor efficiencies and power factor close to 1 are desirable for an efficient operation and
for keeping costs down of the entire plant and not just the motor. For this reason, it is
useful to determine both the load and efficiency when assessing a motor’s performance
[19].
The primary factors affecting motor efficiency are:
Speed: - high-speed motors tend to be more efficient
The size of the motor: - larger motor rate capacity tends to be more efficient.
Type of enclosure: - open enclosures tend to be more efficient
Design classification: -lower slip motors tend to be more efficient
Size of the air gap between the rotor and the stator:-Large air gaps tend to maximize
efficiency at the expense of power factor, while small air gaps slightly compromise
efficiency while significantly improving power factor.
Rewinding of motor can reduce its efficiency

50
Temperature Totally-enclosed fan-cooled (TEFC) motors are more efficient than
screen protected drip-proof (SPDP) motors.
Motor load:- generally motors operating below 75% of full load relatively reduces
their efficiency and with operating below 50% totally inefficient.
Age: - New motors are more efficient than old one.
3.3.4 Energy conservation Opportunities in Electric Motors
When planning to improve the efficiency of the motor system in a factory shown in Table
3-3, a system approach incorporating pumps, compressors, and funs must be used in order
to attain optimal savings and performance. Consideration with respect to energy use and
energy saving opportunities for a motor system are discussed below.
i. Replacing Standard Motors with Energy Efficient Motors
High efficiency motors have been designed specifically to increase operating efficiency
when compared to standard motors. Design improvements focus on reducing intrinsic
(fixed and variable) motor losses.
Figure 3-3 Standard vs. high efficiency motors (for typical 3- phase Induction Motors)
Improvements include the use of lower-loss silicon steel, a longer core (to increase active
material), thicker wires (to reduce resistance), thinner laminations, smaller air gap between
stator and rotor, copper instead of aluminum bars in the rotor, superior bearings and a
smaller fan, etc. They cover a wide range of ratings and the full load efficiencies. Energy
efficient motors are higher from 3 to 7 % of standard efficiency motors as shown in figure
3-3.

51
However, high efficiency motors typically cost 30% more than standard motors, the
decreased electricity usage can offset the higher capital costs in a short time. An industrial
motor can use electricity worth about four times its capital cost annually. Changing to high
efficiency models yields larger efficiency improvements and percentage cost savings in
the small motor sizes, but greater absolute cost savings in the large sizes. Larger motors
are often rewound, not replaced, when they malfunction. Rewinding is initially less
expensive than purchasing a new motor, but ultimately costs more because of degraded
efficiency. The efficiency of a rewound motor is typically about 2% below that of a new
standard motor [22].
An energy efficient motor replacement can always be found in the same frame size and
with comparable starting torque and locked rotor current as the existing motor. High motor
efficiencies and power factor close to one are desirable for an efficient operation and for
keeping costs down of the entire plant. However, as a result of the modifications to
improve performance, the costs of energy efficient motors are higher than those of standard
motors.
The higher cost will often be paid back rapidly in saved operating costs, particularly in
new applications or end-of-life motor replacements. But replacing existing motors that
have not reached the end of their useful life with energy efficient motors may not always
be financially feasible, and therefore it is recommended to only replace these with energy
efficiency motors when they fail [22].
ii. Replacing Under Loaded Motors with Proper Sized Motors
Probably the most common practice contributing to less motor efficiency is that of under
loading. Under loading results in lower efficiency, power factor and higher than necessary
first cost for the motor and related control equipment.
Under loading increases motor losses and reduces motor efficiency and the power factor.
Under-loading is the most common cause of inefficiencies for several reasons:
Equipment manufacturers tend to use a large safety factor when selecting the
motor.
Equipment is often under-utilized. For example, machine tool equipment
manufacturers provide for a motor rated for the full capacity load of the equipment.
In practice, the user may rarely need this full capacity, resulting in under-loaded
operation most of the time.

52
Large motors are selected to enable the output to be maintained at the desired level
even when input voltages are abnormally low.
Large motor is selected for applications requiring a high starting torque but where
a smaller motor that is designed for high torque would have been more suitable.
Motor size should be selected based on a careful evaluation of the load. But when replacing
an oversized motor with a smaller motor, it is also important to consider the potential
efficiency gain. Larger motors namely have inherently higher rated efficiencies than
smaller motors. Therefore, the replacement of motors operating at 60 – 70% of capacity
or higher is generally not recommended. If the plant’s motor operates under 50% of full
rated load, it considers to replace large, partially loaded motors with smaller, full loaded
motors either from company catalog / new energy efficient motor.
iii. Rewinding
It is common practice in industry/factory to rewind burnt motors. The number of rewound
motors in some industries exceeds 40% of the total number of motors. Careful rewinding
can sometimes maintain motor efficiency at previous levels, but in most cases results in
efficiency losses. Rewinding can be affected by a number of factors that contribute to
deteriorated motor efficiency. Such as: - winding and slot design, winding material,
insulation performance, and operating temperature. For example, when heat is applied to
strip old windings the insulation between laminations can be damaged, thereby increasing
eddy current losses. A change in the air gap may affect power factor and output torque
[44].
Rewinding is a common practice in 2BF. However, there are some problems in the process,
removing the old winding, selecting wires of appropriate size, slot size design and
rewinding the motors more than one times as well as manual way of winding which affects
the insulation level. All these have an impact on the efficiency of the rewound motor.
However, if proper measures are taken, the motor efficiency can be maintained after
rewinding.
iv. Improving maintenance
The purposes of motor maintenance are to prolong motor life and to prevent a motor
failure. Motor maintenance measures can be categorized as either preventive or predictive.
Preventative measures, the purpose of which is to prevent unexpected downtime of motors,
include electrical consideration, voltage imbalance minimization, load consideration, and

53
motor ventilation, alignment, and lubrication. The purpose of predictive motor
maintenance is to observe on going motor temperature, vibration, and other operating data
to identify when it becomes necessary to overhaul or replace a motor before failure occurs.
The savings associated with an on-going motor maintenance program are significant, and
could range from 2% to 30% of total motor system energy use [8].
The maintenance condition of the motors in 2BF is poor because, there is no a regular
schedule for measuring the line voltages and currents to check the line imbalance and
loading conditions of the motors. They do not inspect motors regularly for wear in bearings
and housings (to reduce frictional losses) and for dirt/dust in motor ventilating ducts (to
ensure proper heat dissipation). Although more motors do have their own ventilating fun
for cooling, there are some motors which do not have fun for ventilation. The installed AC
conditioning systems do not work is some section of the factory. Also Appropriately
Lubrication is not done according to the manufacturer’s recommendations. Thus a proper
on going motor maintenance program should be applied to save energy from 2% to 30%
of the motor use.
v. Analyzing electric motors of 2BF with software
Motor master + international software is used in this work to evaluate the performance of
the existing motors with the energy efficient motors. The loading, efficiency, nameplate
speed (RPM), voltage rating (V) and power rating (KW) are the inputs of the software
which are taken from the existing motors at 2BF and the specifications for the energy
efficient motors are taken from the Motor master + international software catalogue. These
values are selected in such a way to improve the loadings of the existing operation. The
output parameters of the software are: Energy and demand savings, money savings and a
simple payback period.
For example, if we evaluate the air compressor pump driver motor of 11 KW which exist
in 2BF to the energy efficient motor model from the software catalogue, the following
outcome will be obtained as a sample outputs.

54
Table 3-11 Under load operating electric motor of 2BF
Name of
Motor
Name plate data Measured Data
Load
ing (
%)
Curr
ent
(A)
Volt
age
V(V
)
Pow
er
Fac
tor
Pow
er
(KW
)
Spee
d
(RP
M)
Eff
i. (
%)
Curr
ent
I(A
)
Volt
age
V(v
)
Pow
er
P(K
W)
Mixer water
feed pump
10.9
380
0.87
7.5
2930
71.0
7.47
379.7
2.32
30.9
Cooler water
feed pump
20
380
0.88
5.5
2910
74.0
12.45
219.6
2.71
49.3
Air compressor
pump
14.3 400 0.88 11 3000 65.0 7.61 400.9 4.62 42
Belt Conveyor 23 400 0.97 22 1500 75.0 15.9 384 10.2 46.36
Submersible
water pump
30 400 0.9 30 1500 79.0 18.6 365 8.75 35.7
Hydrant pump 67 380 0.92 110 1480 82.0 56.7 377 33.1 30.1

55
Figure 3-4 Motor selection from MotorMaster catalog
Figure 3-5 Energy Efficient motor selection from MotorMaster catalog

56
Figure 3-6 Motor Saving Analysis as compared to the standard existing motor
Figure 3-7 Utility Costs/Use data

57
A short payback period investment cost required to buy the energy efficient motors was
effective. From the energy analysis summarized in figure 3-6, an energy efficient motor
for air compressor pump requires 918 dollars to purchase, 84 dollars for the installation.
But these costs will be back after 4.26 years with an energy savings of 7,833 Kwh per year
and money saving of 235 dollars/year with contribution of CO2 reduction. This is due to
replacement of under load motors with proper sized motors and standard electric motors
with energy efficient electric motors. Therefore, this method should be implemented in
the factory to use electric energy more efficiently. Table 3-11 shows summarized potential
of energy and cost saving of proper sized motors and energy efficient motors as compare
with the existing inefficient electric motors of the factory.
Table 3-12 Electric motors improvment with replacement of under loaded operating motors
with proper sized motors.
No. Existing Motor Replaced Efficient
Motor
Energy
Cost
$/year
Energy
Saving
KWh/year
Money
Saving
$/year
Payback
Period
in years
KW Loading
(%)
% KW Loading
(%)
%
1 7.5 30.9 71 5.5 42.1 84.9 164 2,135 64 7.65
2 5.5 49.3 74 5.5 49.3 87.7 186 2,287 69 7.14
3 11 42 65 7.5 61.6 89.7 309 7,833 235 4.26
4 22 46.36 75 15 68.0 91.9 666 10,014 300 5.26
5 30 35.7 79 18.5 57.9 92.0 698 7,672 230 8.64
6 110 30.1 82.0 75 44.1 93.3 2,130 19,541 586 9.82
Total 49,482 1,484
Table 3-11 shows the Motor master + international software result of replacing standard
motor with energy efficient motor which shows 49,482 KWh/year energy saving and
$1,484 per year cost saving.

58
3.3.5 Electrical energy bill analysis
Electrical energy was used for the production of biscuit and flour in 2BF. So the factory
pays cost for this energy source. Bills and energy consumption data of the factory is listed
within the factory logbook for many years. From these only 12-months (from September
1st 2008 E.C to August 31st 2008 E.C) of two units’ data regarding the factory consumption
of electricity, and produced Flour and Biscuit are presented in appendix and used in the
analysis [Appendix A].
The energy bills show that the factory paid more than 18 million birr for the selected audit
year (from September 2008 E.C to August 2008 E.C). Therefore, the bill analysis is
necessarily dependent on the paid money to the used energy by the factory.
The collected electricity consumption pattern is processed into monthly factory paid
energy intensity. Based on the voltage consumption and number of phases, 2BF use three
phases and medium voltage line, used in the factory, cost of electricity varies. The data
collected shows that as the factory used the medium voltage of 15KV, a tariff with flat
equivalent rate of 0.4086 per KWh is applied. But if the factory uses only three phases, a
tariff with flat equivalent rate of 0.5778 per KWh is incurred. Monthly electricity cost is
given by:
Table 3-13 Monthly electricity cost of 2BF
Billing period
[2008 E.C]
Total production
of biscuit [KG]
Total production of flour
[Quintal]
Cost of electricity
[ETB]
September 1,396,920.04 8,370.46 1,829,277.12
October 772,995.51 9,158.21 1,233,948.08
November 864,295.81 9,888.50 1,362,480.00
December 966,976.42 7,740.31 1,361,584.86
January 1,087,935.43 10,157.25 1,602,864.06
February 997,171.24 8,924.55 1,450,267.93
March 910,899.72 9,268.61 1,379,467.56
April 867,834.36 9,152.05 1,330,003.42
May 963,846.77 20,151.70 1,966,324.84
June 692,870.78 9,601.68 1,174,261.97
July 1,194,172.19 8,832.00 1,645,889.63
August 1,284,081.72 8,754.66 1,733,450.43
Total 12,000,000.00 120,000.00 18,069,819.90

59
Monthly Electricity Cost [ETB] = Electricity charge [ETB/KWh] *Monthly used
electricity[KWh]…………………………………………………………………... (3.19)
So, with this formula Monthly electricity cost can be calculated or directly read from the
factory logbook and tabulated as shown in Table 3-12.
Monthly Energy Intensity Consumption Pattern of 2BF
Monthly energy intensity consumption of the factory is defined as an average monthly
energy needed to produce one kilogram of biscuit and flour which are given by the
following equations.
Monthly electric energy intensity of biscuit =][Pr
][
KgoducedcuitMonthlyBis
KWhedctricityUsMonthlyEle……...(3.20)
Monthly electric energy intensity of flour =][Pr
][
KgoducedurMonthlyFlo
KWhedctricityUsMonthlyEle….....…(3.21)
Substituting data from [appendix A] in equation 3.20 and 3.21 gives the value given in
Table 3-13.
Table 3-14 Monthly electricity energy intensities of 2BF
Billing
period [2008
E.C]
Monthly electricity
used for biscuit
[KWh]
Monthly
electricity used for
flour
[KWh]
Electric Energy
Intensity of
biscuit
[KJ/KG]
Electric Energy
Intensity of flour
[KJ/Quintal]
September 1,665,000.00 1,451,250.00 1.191908 173.3775256
October 1,822,500.00 796,500.00 2.357711 86.97110867
November 1,968,750.00 884,250.00 2.277866 89.42208182
December 1,541,250.00 999,000.00 1.593886 129.0645147
January 2,025,000.00 1,127,250.00 1.861324 110.9798022
February 1,777,500.00 1,032,750.00 1.782542 115.7201106
March 1,845,000.00 938,250.00 2.02547 101.228753
April 1,822,500.00 891,000.00 2.100055 97.35522788
May 2,171,250.00 992,250.00 2.252692 49.23901694
June 1,901,250.00 708,750.00 2.744018 73.81519098
July 1,755,000.00 1,235,250.00 1.469637 139.8607627
August 1,743,750.00 600,750.00 1.357974 68.62059978
where 1 Quintal =100Kg

60
3.3.6 Electric energy intensity comparisons of 2BF with Benchmarks
The energy intensities of benchmark factories which produce biscuit and flour at greater
amount and had so far good practices of biscuit and flour production at efficient use of
energy are included. By taking the average values of electric energy intensity consumption
patterns at national level, Table 3-14 provide data of 5 benchmark countries [Zambia,
China, Vietnam, Tanzania, Ghana].
The comparison is energy intensities of 2BF and the benchmarks. It can be seen that there
is a significant difference between the energy intensities of the 2BF and the benchmarks.
From the twelve months’ electric energy intensity analysis of 2BF, we can see that the
ranges are from 1.191908 to 2.744018 KWh/Kg of biscuit and 0.49239 to 1.733775
KWh/Kg of flour with an average monthly intensity of 1.92 and 1.03 respectively. The
following Table shows the difference in energy intensity of 2BF with the benchmarks.
Table 3-14 shows the difference in energy intensity of 2BF with the benchmarks.
Discussion of the results
It can be seen from the analysis of the energy intensity of 2BF, there is a substantial
difference between the electric energy intensity of 2BF as compared to the selected
benchmarks. This shows that there is a chance for improving the energy utilization of the
factory.
Table 3-15 Energy intensity comparison with benchmarks
Benchmarking
Countries
Average EEI
[KJ/KG of
biscuit]
Average EEI
[KJ/KG of
flour]
Difference in EEI
flour of 2BF and
benchmarks [%]
Difference in EEI
biscuit of 2BF and
benchmarks [%]
Zambia 1.35 0.87 0.16 0.57
China 1.52 0.94 0.09 0.4
Vietnam 1.68 0.81 0.22 0.24
Tanzania 1.74 0.83 0.2 0.18
Ghana 1.38 0.88 0.15 0.54
The following calculation shows clearly how much the company is spending for energy
which was not essential.
Annual Average production of biscuit and flour is 12,000,000.00 Kg/year each
Cost of electricity for 3 phase input line = 0.5778 ETB/KWh
Cost of electricity for 15KV input line = 0.4086 ETB/KWh

61
Difference in electric energy intensity
For flour = 0.22 KWh/Kg [with Vietnam] & For biscuit= 0.57 KWh/Kg [with
Zambia]
Annual cost of biscuit factory due to inefficient use of electric energy
= electric consumption in KWh * cost of electricity.
=energy intensity[KWh/Kg] *production[Kg/year] * cost of electricity [ETB/KWh]
=0.57 KWh/Kg*12,000,000.00 Kg/year * 0.4086 ETB/KWh= 2,794,824 ETB/year.
Annual cost of flour factory due to inefficient use of electric energy
=electric consumption in KWh * cost of electricity.
=energy intensity[KWh/Kg] * production[Kg/year] * cost of electricity[ETB/KWh)
=0.22 KWh/Kg* 12,000,000.00 Kg/year* 0.5778 ETB/KWh= 1,525,392 ETB/year.
Total Annual cost of the factory due to inefficient use of electric energy
= Cost for biscuit + Cost for flour= 4,320,216 ETB/year.
So, from the data analysis the factory losses 31% and 22% of total energy for biscuit and
flour respectively which is due to inefficient electrical energy consumption. This cost is in
comparison with the benchmark countries. However, the benchmarks have their own
limitation, it is a relative indication of ineffectiveness of the factory in energy utilization.
Therefore, the factory can conduct energy audit on its major energy consuming devices to
identify the basic energy loss.

62
CHAPTER FOUR
SIMULATION STUDIES AND ANALYSIS OF RESULTS
4.1 Power Distribution System Simulation Results First, simulation results of the factory power distribution system are presented, discussed
and compared to the available standard for possible loss in electrical equipment. Next
annual technical energy loss of the factory power distribution system is determined and
the result is discussed. Moreover, cost of the energy loss is estimated based on EEU billing
tariff.
Figure 4-1 Simulation results of distribution cables
Here results, which are essential for estimating technical energy loss and comparison of
the power distribution system and its components with standard for possible loss in
electrical equipment and electric system are presented.
In Table 4-1 power flow, Power loss, voltage drop, power factor of simulated results of
distribution cables, which are important for this study, are shown.
In 2nd column maximum active power flow through each cable of the power distribution
system is shown. The simulated active power flow result through each cable is maximum,
because during modelling of the power distribution system load connected at each load

63
bus bar is the measured peak demand at MDB of each department. On the next column
power factor of the maximum apparent power flow through each cable shows how much
the reactive component of the current through each cable is minimized. So that, decision
can be taken over the option of loss minimization by minimizing reactive component of
current flow through distribution cables. At this point, there is no option to minimize power
loss by controlling the active component of the current, since it is determined by the
electrical energy utilized by the load connected. At the fourth column, simulated voltage
drop result of distribution cables expressed in percentage of the voltage at sending end bus
bar is shown. Reactive power flow affects both power loss and voltage drop of the
distribution cables, therefore, when we think to minimize power loss of distribution cables
by controlling reactive power flow voltage drop should be considered. Simulated power
loss result of the distribution cables is shown in the remaining two columns in KW and
expressed in percentage of maximum power flow through each cable. This is the most
critical result of the simulation because; it decides the technical energy loss and efficiency
of the distribution cables. Generally, based on maximum power loss result, load factor and
loss factor average technical energy loss of the distribution cables is calculated. Moreover,
before technical energy loss minimization of cables is considered; simulated maximum
power loss result is compared to standard for possible loss of cables at maximum load.
Comparison of power loss and voltage drop between distribution cables shown in figure
4-1 is not based on the maximum power loss or voltage drop of the cables; it is based on
power loss and voltage drop expressed in percentage of their maximum power flow and
voltage at the sending end bus bar. For example, the power loss of Cable 7 and 8 is greater
than Cable 9 however, when it is compared to the power loss expressed in percentage of
maximum power flow through each cable, power loss of Cable 9 is greater than Cable 7
and 8. From figure 4-1 we can easily understand that power loss and voltage drop are
proportional. According to the simulated result even though, the power loss of each
distribution cable is within the standard for possible loss in cables at maximum load, (1-
4% loss of maximum load), care should be given to cable 7 and cable 8 as they have high
power loss and voltage drop as compared to others.

64
Table 4-1 Simulation results of distribution cables
Branch
Circuit
Connected
Bus ID
Power Flow
@MD
Power
Factor
Voltage
Drop
Power Loss
@MD
Power loss
at MD
ID From To MW % % KW %
Cable 1 B2 B4 1.977 86.65 0 0.004 0.0002
Cable 2 B3 B4 1.968 86.25 0 0 0
Cable 3 B5 B6 0.422 83.2 0 0.009 0.002133
Cable 4 B5 B7 0.811 82.75 0.01 0.049 0.006042
Cable 5 B5 B8 0.545 82.99 0 0.011 0.002018
Cable 6 B5 B9 0.546 82.99 0 0.011 0.002018
Cable 7 B5 B10 0.532 94.49 0.13 0.683 0.128383
Cable 8 B5 B11 0.532 94.49 0.13 0.683 0.128383
Cable 9 B5 B12 0.214 83.87 0.01 0.032 0.014953
Cable 10 B5 B13 0.214 83.87 0.01 0.032 0.014953
Cable 11 B5 B14 0.131 84.31 0 0.001 0.000763
Total Loss 1.515
Figure 4-2 Comparison between distribution cables by Voltage drop and Power loss
0
0.02
0.04
0.06
0.08
0.1
0.12
0.14
Cable 1 Cable 2 Cable 3 Cable 4 Cable 5 Cable 6 Cable 7 Cable 8 Cable 9 Cable 10 Cable 11
%
Cable ID
Distribution Cables Comparison by Power loss & Voltage drop
Voltage Drop Power Loss

65
Table 4-2 Simulation results of distribution transformers
Branch
Circuit
Connected Bus
ID
Power Flow
at MD
Rated S
Power Loss
at MD
Voltage
Drop
Power
Loss
ID From To MW MVA KW % %
T1 B1 B2 1.978 25 1.056 0.5 0.053
T2 B1 B3 1.969 25 0.891 0.5 0.543
T3 B6 B15 0.422 0.63 5.954 3.49 1.411
T4 B7 B16 0.81 1.2 7.358 3.51 0.9084
T5 B8 B17 0.545 0.8 5.542 3.34 1.017
T6 B9 B18 0.546 0.8 5.545 3.34 1.016
T7 B10 B19 0.531 0.75 5.977 2.3 1.126
T8 B11 B20 0.531 0.75 5.977 2.3 1.126
T9 B12 B21 0.214 0.315 2.567 2.5 1.200
T10 B13 B22 0.214 0.315 2.567 2.5 1.200
T11 B14 B23 0.12 0.2 2.26 2.6 1.88
Total Loss 45.694
In Table 4-2 power flow, power loss and voltage drop simulated results of distribution
transformer at maximum demand are shown. These results are important for this study.
The first column shows the maximum active power flow at the primary bus bar of the
transformers. When it is compared to the rating of distribution transformers given in the
next column considering power factor of the load connected, it is below the rating.
According to NEC (National Electric code) the rating of transformers should be 1.25 times
the maximum demand. There for according to the simulated result, all of the transformers
fulfil this condition. It is maximum value for the same reason given for distribution cables.
In the next column maximum power loss of each transformer were shown, this value is
vital for determining average technical energy loss due to transformers and comparing the
loss of transformers to the standard for possible loss in transformers at maximum load. In
the column 2nd from the last, simulated maximum voltage drop result is shown, this result
is important for the same reason given for distribution cables. Simulated power factor
result is not shown in Table 4-2 because, it is already shown for distribution cables which
supply the distribution transformer, reactive power management option for power loss or
technical energy loss minimization can be decided based on that result.

66
Figure 4-3 shows comparison between transformers depending on the power loss and
voltage drop expressed in percentage of maximum power flow and primary voltage. When
we observe on the result it is clear that power loss and voltage drops are proportional for
the factory power distribution system. Based on the simulation result, power loss of every
transformer is within the standard for possible loss in transformer at maximum load which
is (0.4-1.9%) [7]. However, care should be given to the transformers with high power
loss.
Figure 4-3 Comparison between Transformers by power loss and voltage drop
0
0.5
1
1.5
2
2.5
3
3.5
4
T1 T2 T3 T4 T5 T6 T7 T8 T9 T10 T11
%
Transformer ID
Comparison between transformers by Voltage drop and
Power loss
Voltage Drop Power loss

67
Figure 4-4 Simulation results of distribution transformers
Figure 4-5 General simulation results of the factory power distribution System

68
When the simulated overall peak demand of active and reactive power result is compared
to the overall peak power demand of the factory according to EEU (3.924MW,
2.364Mvar), it is approximately similar. This shows the measurement of power demand
taken at each department secondary transformer is good enough. This result is important
for comparing the technical energy loss of each distribution system components to the total
demand of the factory. The other important simulated result is the overall power factor of
the power distribution system of the factory at the swing bus. This result gives information
to what extent we can manage or control the overall reactive power to decrease technical
energy loss or power loss of the factory. The last important result is simulated overall
maximum power loss result of the factory power distribution system. This result is
compared to the ideal loss standard for power system, before technical energy loss
minimization options are considered. From the result shown in figure 4-3 it is clear that
the overall power loss of the distribution system for 2BF at maximum demand is only 1.2%
of the overall simulated maximum power demand of the distribution system. And this is
within the ideal standard for losses in an electric system, which is 3 to 6% [7].
4.2 Analysis of Technical Energy Loss
A spread sheet is prepared according to the methodology and sample examples already
discussed in chapter three of this paper, to determine average annual technical energy loss
of the distribution cables and distribution transformers. The spread sheet detail used to
calculate technical energy loss is attached under the appendix B.

69
Table 4-3 Annual technical energy loss of distribution cables
Branch
Circuit
Measured
maximum
Demand
Simulated
Max.
Power loss
Simulated
Power Factor
Estimated
Annual Technical
Energy Loss
Estimated Annual
Technical Energy
Loss
ID MW KW % MWH %
Cable 1 - 0.004 86.65 - -
Cable 2 - 0 86.25 - -
Cable 3 0.43942 0.009 83.2 0.049551292 0.001287
Cable 4 0.81856 0.049 82.75 0.345169723 0.004814
Cable 5 0.55155 0.011 82.99 0.070314432 0.001455
Cable 6 0.55254 0.011 82.99 0.070360177 0.001454
Cable 7 0.53091 0.683 94.49 4.747330674 0.102076
Cable 8 0.53091 0.683 94.49 4.747330674 0.102076
Cable 9 0.24512 0.032 83.87 0.190622496 0.008878
Cable 10 0.24512 0.032 83.87 0.190622496 0.008878
Cable 11 0.15273 0.001 84.31 0.004586338 0.000343
Total Loss 1.515 10.4158883
Table 4-4 Annual technical energy loss of distribution transformers
Branch
Circuit
Rated
S
Simulated
max.
power
loss
Maximum
load
demand
Calculated
copper loss
Estimated
annual
technical
energy loss
Estimated
annual
technical
energy loss
ID MVA KW MW KW MWH %
T1 25 1.056 - - - -
T2 25 0.891 - - - -
T3 0.63 5.954 0.421 3.96551438 32.34492895 0.591722
T4 1.2 7.358 0.809 7.30464497 69.85196485 0.73833
T5 0.8 5.542 0.544 4.87894525 42.57529655 0.639499
T6 0.8 5.545 0.545 4.89647582 42.70771872 0.641488
T7 0.75 5.977 0.53 7.23648513 73.25473088 1.161446
T8 0.75 5.977 0.53 7.23648513 73.25473088 1.161446
T9 0.315 2.567 0.213 2.62430158 21.56242671 0.661684
T10 0.315 2.567 0.213 2.62430158 21.56242671 0.661684
T11 0.2 2.26 0.13 1.75777473 11.53541916 0.470296
Total Loss 45.694 42.5249286 388.6496434

70
In Table 4-3 simulated power loss, and estimated annual technical energy loss of each
distribution cables of 2BF power distribution system are shown. In addition, measured
peak demand and average annual technical energy loss expressed in percentage of the
average annual energy demand of each distribution cable is shown for discussion purpose.
Simulated power loss and power factor shown in column three and four have been already
discussed under the discussions section of simulation result. However, they are repeated
here to discuss their relationship with average annual technical energy loss. The direct
relationship was shown between simulated power losses and estimated average annual
technical energy loss and this proofs that for minimizing technical energy loss, power loss
should be minimized. And the relationship between power factor of the apparent power
flow through the cables and annual technical energy loss of the cables justifies whether
reactive power management is possible or not for minimizing technical energy loss of
distribution cables. The estimated average annual technical energy loss in the sixth column
indicates that the loss of each individual distribution cable is within the ideal standard for
losses in power systems (3-6%). In addition, power loss of each distribution cable at
maximum demand is compared with the standard power loss at maximum demand for
energy efficient cables (1-4% loss of maximum load) at the previous discussion of the
simulation result and the loss of the cables was below the standard. The following points
are the main reason for the low technical energy loss in the distribution cables:
The length of the distribution cables is very short, the longest cable is 0.45 KM
All of the distribution cables peak demand is below the design capacity of the
cables
The power factor of power distribution system is compensated at each department
control room by capacitor banks. Because of this, the power factor of the apparent
power flow through these cables are above 90% for most of them.
In Table 4-4, simulated power loss, calculated copper loss and estimated annual average
technical energy loss of distribution transformers are shown. In addition, the rating value
and measured peak demand of the transformers is given in Table 4-4 for discussion
purpose. Simulated power loss of the transformers is already discussed in simulation result
discussions in the previous subtitle but it is repeated here to discuss its relationship with
calculated copper loss and average annual technical energy loss. The relationship between
maximum power loss and calculated copper loss shows that they are similar; this indicates
the typical value selected for on load and no load loss of transformers is good enough. The
other thing is the relationship between power loss and average annual technical energy

71
loss and the result in Table 4-4 shows they are directly related. Estimated average annual
technical energy loss expressed in percentage of annual average energy demand of each
transformer at the last column shows, distribution transformer is very small. When it is
compared to the standard loss in power systems (3-6%), it is with in the standard. In
addition to this, the simulated maximum power loss of the transformers is compared to the
standard for possible loss at transformers in maximum load, (0.4-1.9), it is with in the
standard. The main reason for this low technical energy loss of the transformers is the
measured maximum demand of all of the transformers, which is below their rating as it is
shown in result Table 4-4.
The overall average annual technical energy loss of 2BF power distribution system is
summarized using Table 4-5.
The result shows contribution of distribution cables, and distribution transformers to total
annual technical energy loss of the factory power distribution system.
The contribution of distribution transformers to the total technical energy loss of the
factory power distribution is dominant as it is shown in the summary result, so focus should
be given to it to minimize the overall loss. The total estimated annual technical energy loss
of the factory is about 1.2% of the factory simulated total active power demand, which is
obtained from the simulated maximum active power demand of the factory and load factor
obtained from the measured data, and when it is compared to the standard loss for power
system, which is 3-6 %, the overall loss is within the standard.
4.3 Cost Estimation of Technical Energy loss
At this point cost of average annual technical energy loss for 2BF power distribution
system is estimated according to EEU billing tariff. EEU billing tariff for Industrial sectors
is presented as follows: -
380V input line low voltage customer pay 0.5778 cents/KWH
15 KV input line high voltage industries pay 0.4086 cents/KWH
132KV input line high voltage industries pay 0.3805cents/KWH
The power factor penalty for high voltage industries is 68.369 birr/0.01pf, if the
power factor is less than 0.9.
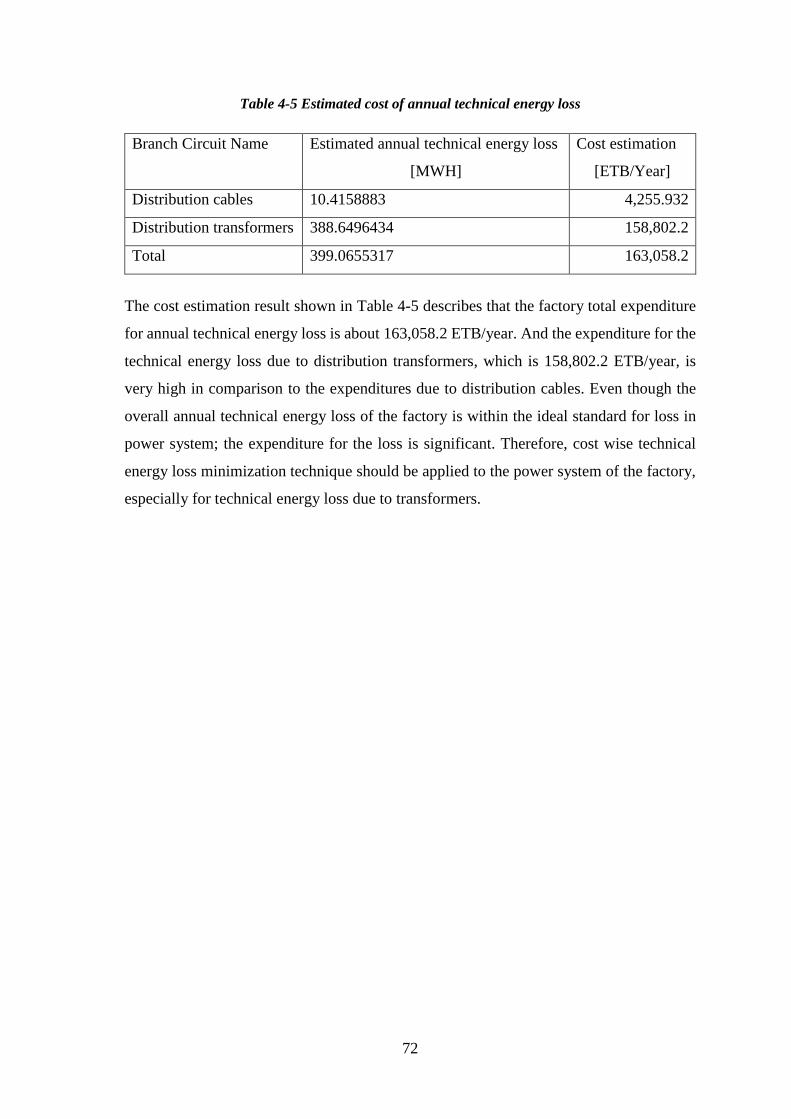
72
Table 4-5 Estimated cost of annual technical energy loss
Branch Circuit Name Estimated annual technical energy loss
[MWH]
Cost estimation
[ETB/Year]
Distribution cables 10.4158883 4,255.932
Distribution transformers 388.6496434 158,802.2
Total 399.0655317 163,058.2
The cost estimation result shown in Table 4-5 describes that the factory total expenditure
for annual technical energy loss is about 163,058.2 ETB/year. And the expenditure for the
technical energy loss due to distribution transformers, which is 158,802.2 ETB/year, is
very high in comparison to the expenditures due to distribution cables. Even though the
overall annual technical energy loss of the factory is within the ideal standard for loss in
power system; the expenditure for the loss is significant. Therefore, cost wise technical
energy loss minimization technique should be applied to the power system of the factory,
especially for technical energy loss due to transformers.

73
CHAPTER FIVE
CONCLUSIONS, RECOMMENDATIONS AND FUTURE
WORK
5.1 Conclusions
Electrical energy is used in Brothers Biscuit and Flour Factory as a common power source
for all types of load in the factory. They use electric energy inefficiently, since attention is
not given toward their energy utilization and energy efficiency. This implies a lot of
avoidable expenditure on energy due to inefficient use.
Based on the walk-through audit conducted in the factory as well as information from the
collected data, the major power consuming areas which have high energy saving
opportunities are lighting systems, rewound motors, electrical networks and air
compressors. This study may help them for analyzing the progress of their energy
utilization and energy efficiency, especially on their electric motor and lighting system.
And also helps them on how they can get the energy efficiency improvement opportunities
(technologies and measures) to improve the system.
Analysis of bills
As the result of data analysis the factory loses 31% and 22% of total energy for biscuit and
flour respectively which is due to inefficient electrical energy consumption and pays a total
of 4,320,216 ETB/year. This cost is in comparison with the benchmarks. However, the
benchmarks have their own limitation in energy utilization, it is a relative indication of
ineffectiveness of the factory in energy utilization. By improving the energy efficiency
system of the factory considerable amount of energy can be saved and it also leads to have
clean environment. So, the factory can conduct energy audit on its major energy
consuming devices to identify the basic energy losses. This helps the factory to find out
energy conservation opportunities and take the energy conservation measures.
Analysis of lighting system
By lighting installation improvement energy saving of 248.72 KWH per day which
gives around 90,782.8 KWH per year is obtained with money saving of 37,093.85
ETB/year.
By replacing old type of T-12 fluorescent tube with T-8 fluorescent tube 83,100.65
KWH/year energy is saved with 33,954.9 ETB/year money saving as well as

74
simple payback period of less than 6 months.
The factory also uses low efficiency incandescent lamp of 60W rating. Replacing
60W incandescent lamp with 18W Compact fluorescent lamp (CFL) gives
164,828.16 KWH/year energy saving which corresponds to money saving of
67,348.79 ETB/year. Again the payback period is less than 6 months. In general,
it has energy saving of around 338.711MWh per year with 138,397.54 ETB saving.
Analysis of electric motors
Brothers biscuit and flour factory uses a vast number of relatively small electric motors.
These are used to drive many different machines. The motors consume more than 75% of
electrical energy in the factory. By improving the efficiencies of these motors or by
replacing with energy efficient motors 5% to 15% of electrical energy can be saved with
short payback period. Even if rewinding different types of motor have low initial cost, its
running cost with short period of time can buy the new motor or energy efficient motor.
So care should be taken while rewinding the motor. And replacing under loaded motor can
have significant saving.
On the other hand, there are no rigid rules governing motor selection and the savings
potential needs to be evaluated on a case-by-case basis. As the result of the analysis, this
factory uses electric motor operated inefficient due to under load operation and low
efficiency of rating, thus needs to improve their energy efficiency.
Using motor master+ international software, it has been seen that replacing 11 KW of the
existing pump motor with a 7.5 KW energy efficient motor can bring energy savings of
7,833 KWh per year and money savings of 235 dollars per year with 4.26 years’ payback
periods. Also, replacing standard motor with energy efficient motor shows 49,482
KWh/year energy saving and $1,484 per year cost saving.
In general, when you buy new types of motor for replacement it is better to be with
professional person in that area and refer Motor master + international software catalog.
From these measures, the factory should have a clear image of its energy handling practice
and take all the possible measures to become energy efficient and competent biscuit
manufacturer industry.
In this thesis technical energy loss assessment of brothers’ biscuit and flour factory power
distribution system has also been studied. Technical energy losses, which are dissipated in
the form of heat, occurred naturally in power system components such as distribution lines,

75
transformers etc.; mainly this is due to the current flow and resistance of the power system
components. For this study, load current is measured at the MDB or secondary of
distribution transformers of each department, model of the power distribution system of
the factory is simulated, technical energy loss of each branch circuit is calculated and its
cost is estimated based on EEU billing tariff. Modelling, simulation and numerical solution
of the load flow for the factory power distribution system has been done using ETAP
12.6.0. For numerical solution of brothers’ biscuit and flour factory power distribution
system load flow analysis; Newton- Raphson solution method was employed and
according to the result report of ETAP 12.6.0, 99 maximum iterations has done and 0.0001
precision is achieving to obtain the final load flow solution. Load flow analysis result of
the factory power distribution system presented in chapter five has been compared with
the standard for loss in electrical equipments at maximum load taken from “Development
of Building Regulations and Guidelines to Achieve Energy Efficiency in Bangalore City”
[33] and the overall maximum power loss with the ideal standard power loss of power
systems 3-6% [32]. And the maximum power loss result of each branch circuit and
maximum overall power loss of the power distribution system of the factory has been with
in the standard considered. But the contribution of distribution transformers for the
technical energy loss is high when compared to distribution cables.
For estimating the average annual technical energy loss of the factory power distribution
system; load factor and loss factor of the power distribution system estimated from the
measured power demand data were employed. More over a spread sheet is prepared in
excel to calculate average technical energy loss according to empirical formulas presented
in chapter three. The average annual technical energy loss of the factory power distribution
system is estimated around 1.2% of the simulated average annual demand. And when it is
compared to the ideal standard for loss in power system (3-6%) it is with in the standard.
5.2 Recommendations
This thesis recommended major ECMs from the conducted detail electrical energy audit
for different system units and energy conservation measures so as to help the factory
reduce its energy cost.
The factory’s managers & their staffs’ also gives low attention on how their energy uses
efficiently, which is a means of most successful and cost-effective way of bringing
optimum energy consumption. Thus, upgrading the efficiency of new technologies alone
cannot achieve optimal savings, but when combined with a strong energy management

76
program such as good operational and maintenance practices, day to day follow-up on their
energy utilization and efficiency can lead to significant savings. The government also
gives low attention to check whether the amount of energy presently being generated is
efficiently used and give awareness of energy conservation especially for the industry
sectors of the country. Thus, the government should involve with a technical and financial
expenditure of improving energy efficiency of industries. Especially on:
creating awareness on general management of the industry on use of their energy
efficiently without investment
Implement the cost effective measures (especially for lighting system) with
investing such as to optimization system
5.3 Suggestions for Future Work
To study the technical energy loss and power quality problem of Brother biscuit and flour
factory power supply distribution due to harmonic component of the load current, it is
suggested that wave shapes of the voltage and current may be further investigated for
THDV and THDi using power quality analyzer (PQA) and effects of these harmonics on
power and power factor may be analyzed.
The factory is in the process of expansion to increase its production. Therefore,
complete technical energy loss assessment of the expanded factory may be carried
out.
The high cost or capital intensive measures may be further investigated and
detailed audit and analysis carried out.

77
REFERENCES
1. Mukesh K Saini, S. Chatterji and Lini Mathew, “Energy Audit of an Industry”,
International Journal of Scientific & Technology Research, Volume 3, Issue 12,
2014
2. “General Aspects of Energy Management and Energy Audit” “Bureau of energy
efficiency, New Delhi
3. International Journal of Engineering and Applied Sciences on electrical energy
audit
4. Guide to Energy Management, Cape Hart, Turner and Kennedy
5. Mehul kumar J Panchal,Ved Vyas Dwivedi and Rajendra Aparnathi ―”The Case
study of Energy Conservation and Audit in Industry Sector” International Journal
Of Engineering And Computer Science,Vol.3, Issue, pp 5298-5303,April,2014
6. Dr. Getachew Bekele, Addis Ababa University, Handout on Energy Conservation,
2016
7. L.Ramesh,S.P.Chowdhury, S.Chowdhury,
.A.Natarajan,C.T.Gaunt,“Minimization of Power Loss in Distribution
Networks by Different Techniques,” International Journal of Energy and Power
Engineering,2:1 2009
8. Christina Galitsky and Ernst Worrell, 2008‘’ Energy Efficiency Improvement and
Cost Saving Opportunities for the Vehicle Assembly Industry’’, an Energy Star
Guide for Energy and Plant Managers, March 2008
9. US Department of Energy, DOE, Energy Efficiency & Renewable Energy, January
2016, http://www.eere.energy.gov
10. Donald R. Wulfinghoff, The Modern History of Energy Conservation: An
Overview for Information Professionals, Energy Institute Press
11. Energy Management and Audit.pdf, www.em-ea.org/GuideBooks/Books-1/1.3
12. Barney L. Capehart, Ph.D., CEM; Guide to energy management, 2nd edition
13. http://www.museumstuff.com/learn/topics/Energy_audit::sub::History
14. Johannes Wilhelmus Fourie, “A Strategy for Management of Energy Loss in a
Local Electricity Distribution Network,” Bachelor of Engineering Thesis,
University of Pretoria, October 2004
15. Energy Regulatory Commission, “Guidelines for the Application and Approval of
Caps on the Recoverable Rate of Distribution System Losses”, Republic of the
Philippines, San Miguel Avenue, Pasig City
16. Ray Daniel Zimmerman, “Network Reconfiguration for Loss Reduction in Three
Phase Power Distribution Systems”, Bachelor of Engineering Thesis, Faculty of
the Graduate School, Cornell University, May 1992
17. Whole Building Design Guide (WBDG), A program of the National Institute of
Building Sciences, January 2016, http://www.wbdg.org
18. US Department of Energy, DOE, January 2016, http://energy.gov/
19. William T. Choate, “Energy and emission reduction opportunities for cement industry”,
U.S. department of energy, 2003.
20. Energy Design Resources, January 2016, http://www.energydesignresources.com
78
21. US Department of Energy, DOE, Energy Efficiency & Renewable Energy,
Sustainable Design Guide, Chapter 5: Lighting, HVAC, and Plumbing,
January2016,http://apps1.eere.energy.gov/buildings/publications/pdfs/commercia
l_initiative/sustainable_guide_ch5.p
22. Ali Hasanbeigi, Energy efficiency Improvement Opportunities for the Textile Industry,
LBNL-3970E, 2010
23. Green-The-World.net, Energy efficient light bulbs, January 2016,
http://www.green-theworld.net/energy_efficient_light_bulbs.html
24. Bill VonNeida, Dorene Maniccia and Allan Tweed, An analysis of the energy and
cost savings potential of occupancy sensors for commercial lighting systems, IES
Paper #43
25. Malkiat Singh, Gurpreet Singh and Harman deep Singh, “Energy Audit: A Case
Study to Reduce Lighting Cost “Asian Journal of Computer Science and
Information Technology, 2016, PP 119-122
26. Mehul kumar J Panchal, Ved Vyas Dwivedi and Rajendra Aparnath, “The Case
study of Energy Conservation & Audit in Industry Sector” , International Journal
Of Engineering And Computer Science, Volume 3 Issue 4 April, 2016 Page No.
5298-5303
27. Mario,E. Berges, “ Enhancing Electricity Audits in Residential Buildings with
Non-intrusive Load Monitoring
28. Michael Lubliner, Rick Kunkle, David Hales, Andy Gordon, “Past, Present and
Future Directions in Residential Single-Family Energy Audits and Retrofits” Final
Report to NIST, WSU Energy Program – revised January 2015
29. Tony botkin, “HOME ENERGY AUDIT REPORT”
30. Irawati Naik, Prof.S.S. More, Himanshu Naik, “Scope of Energy Consumption &
Energy Conservation in Indian auto part manufacturing Industry”
31. Bhansali, V.K, “Energy conservation in India - challenges and achievements”
32. Betrianis, dan Randite Herawan, “Analysis of Technical Energy Losses by Using
Simulation,” Makara, Teknologi, vol. 10, no. 1, April 2011: 11-17
33. Narong Mungkung, Nittaya Gomurut1, TanesTanitteerapan, Somchai
Arunrungrusmi, Weerachai Chaokumnerd and Toshifumi Yuji, “Analysis of
Technical Loss in Distribution System,” Department of Electrical Technology
Education, Dhurakij Pundit University, Bangkok, Thailand
34. Marina Yusoff, Asnawi busrah, Malik Mohamad , Mau Tengau, “A Simplified
Approach in Estimating Technical Losses in TNB Distribution Network Based on
Load Profile and Feeder Characteristics,” TNB Research, Bangi, Selangor ,
Malaysia
35. Bo Yang, James Weiss, Reigh Walling, Lavelle Freeman, Mike Marshall “The
Breakdown and Mitigation of Technical Losses on Distribution Power Systems”.
Presented at the 2012 Distribution Tech, March 25th, 2012
36. Zenachew Muluneh, Technical Energy Loss Assessment and Minimization in
Industrial Power Distribution System Case Study: Messebo Building Material
Production Factory, May 2013
79
37. Bezawit Teshome, Energy Conserving Electrical System Design and Performance
Analysis for Commercial Buildings in Addis Ababa, June 2013
38. Polish Copper Promotion Centre and European Copper Institute. “Selecting
Energy Efficient Distribution Transformers, a Guide for Achieving Least-Cost
Solutions,” PROJECT Nº EIE/05/056/SI2.419632, June 2015
39. “Cable list for Brothers flour and biscuit factory”
40. G. F. Moore, Electric Cables Handbook/BICC Cables, USA: Blackwell, 1797
41. Jim Phillips, “Short Circuit Calculations–Transformer and Source Impedance”,
T2G Technical Training Group.
42. Aurora Energy Pty Ltd, “Distribution Loss Factor Calculation Methodology”, BES
(Australia) Pty Ltd, Tasmania, Report 4246/3, July 2014.
43. National Productivity Council, India. 2005,’’Electrical Energy Equipment:
Electric Motors’’ Energy Efficiency Guide for Industry in Asia. Available at
http://www.energyefficiencyasia.org
44. Worrell E., Galitsky C., Masanet E., Graus W., 2008 ‘’Energy Efficiency
Improvement and Cost Saving Opportunities in the Glass Industry’’, an ENERGY
STAR Guide for Energy and Plant Managers, March 2008
45. http://eartheasy.com/live_led_bulbs_comparison.html
46. www.T12 vs T8 vs T5: ‘’T-12’’...As Outdated As Your Grandparents Bingo
Game.htm February 16,2017
47. U.S. development of energy, “motor Master user guide”, Washington state
university corporate extension on energy program, 2003

80
APPENDIX A: Electric Energy bill of 2BF
Table A-1: Energy bill of 12 months for one energy meter among 6 of 2BF that produces
different types biscuit which categorized in high voltage industry@15KV line input
Month Year Consumption
KWh/KVA
Block
Rate
Monthly
charge(Birr)
Service
charge
(Birr)
Power
factor
(Birr)
Total
(Birr)
September 2008 333,000.00 0.4086 136.063.80 54.01 546.18 136,663.99
October 2008 364,500.00 0.4086 148,934.70 54.01 536.85 149,525.56
November 2008 393,750.00 0.4086 160,886.25 54.01 508.59 161,448.85
December 2008 308,250.00 0.4086 125,950.95 54.01 370.66 126,375.62
January 2008 405,000.00 0.4086 165,483.00 54.01 299.81 165,836.82
February 2008 355,500.00 0.4086 145,257.30 54.01 399.25 145,710.56
March 2008 369,000.00 0.4086 150,773.40 54.01 500.61 151,328.02
April 2008 364,500.00 0.4086 148,934.70 54.01 436.23 149,424.94
May 2008 434,250.00 0.4086 177,434.55 54.01 198.95 329,015.53
June 2008 380,250.00 0.4086 155,370.15 54.01 1,341.88 156,766.04
July 2008 351,000.00 0.4086 143,418.60 54.01 726.85 144,199.46
August 2008 348,750.00 0.4086 142,499.25 54.01 383.50 142,936.76
Total 1,959,232.15
Table A-2: 12 months’ bill of 1 energy meter among 3 of the factory that produces wheat
flour which categorized in Industrial (low voltage industry)
Month Year Consumption
KWh/KVA
Block
Rate
Monthly
charge(Birr)
Service
charge
(Birr)
Power
factor
(Birr)
Total
(Birr)
September 2008 483750.00 0.5778 279510.75 53.7 4292.71 283,857.03
October 2008 265500.00 0.5778 153405.90 53.7 3614.81 157,074.28
November 2008 294750.00 0.5778 170306.55 53.7 5266.57 175,626.69
December 2008 333000.00 0.5778 192407.40 53.7 4030.63 196,491.60
January 2008 375750.00 0.5778 217108.35 53.7 3908.80 221,070.72
February 2008 344250.00 0.5778 198907.65 53.7 3666.03 202,627.25
March 2008 312750.00 0.5778 180706.95 53.7 4336.18 185,096.70
April 2008 297000.00 0.5778 171606.60 53.7 4685.55 176,345.72
May 2008 330750.00 0.5778 191107.35 53.7 4694.73 195,855.65
June 2008 236250.00 0.5778 136505.25 53.7 4233.95 140,792.77
July 2008 411750.00 0.5778 237909.15 53.7 4695.53 242,658.25
August 2008 200250.00 0.5778 115704.45 53.7 4377.24 260,928.03
Total 2,438,424.69
Source: brother’s flour and biscuit factory catalog

81
APPENDIX B: Spread Sheet of technical energy loss
Table B-1 Spread sheet prepared on excels to calculate annual technical energy loss of
distribution transformers model
Bra
nch
Cir
cuit
ID
Co
nn
ecte
d b
us
ID
Rat
ed
S
Sim
ula
ted
po
we
r lo
ss
Sim
ul.
VD
Pea
k lo
ad
dem
and
co
nn
. A
vera
ge
load
d
eman
d
con
n.
Cal
cula
te
d c
op
per
lo
ss
Typ
ical
co
pp
er
loss
at
I r
ated
No
load
Lo
ss
Load
fa
cto
r
Loss
fa
cto
r
Cal
cula
ted
an
nu
al
tech
nic
al
ener
gy
loss
Fro
m
To
KW
Kva
r
%
MW
MW
KW
KW
KW
MW
H
T3 B6 B15
0.63
5.99
5
23.7
41 3.5
0.43942
0.33841
3.96551438 6.75 1.2 0.77
0.62850446 32.34492895
T4 B7 B16 1.
2
7.40
9
52.5
91 3.
53 0.81856
0.72471
7.3046
4497 13 2.1 0.89
0.804
14156 69.85196485
T5 B8 B17 0.
8
5.58
1
32.3
14 3.
35 0.55155
0.46231
4.8789
4525 8.5 1.3 0.84
0.729
7056 42.57529655
T6 B9 B18 0.
8
5.58
4
32.3
29 3.
35 0.55254
0.46331
4.8964
7582 8.5 1.3 0.84
0.730
18034 42.70771872
T7 B10 B19
0.75
6.01
8
23.8
29 2.
31 0.53 0.51458
7.2364
8513 12 1.5 0.97
0.948
30737 73.25473088
T8 B11 B20
0.75
6.01
8
23.8
29 2.
31 0.53 0.51458
7.2364
8513 12 1.5 0.97
0.948
30737 73.25473088
T9
B12 B21
0.315
2.58
5
7.98
7 2.
51 0.23514
0.19863
2.6243
0158 3.9 0.52 0.84
0.739
80226 21.56242671
T10
B13 B22
0.315
2.58
5
7.98
7 2.
51 0.23514
0.19863
2.6243
0158 3.9 0.52 0.84
0.739
80226 21.56242671
T11 B14 B23 0.
2 2.
69
4.03
5 2.
84 0.15261
0.10954
1.7577
7473 2.5 0.34 0.72
0.555
71892 11.53541916
Total
44.4
65
208.
642
71.05 10.2
8
388.6496434

82
Table B-2 Spread sheet prepared on excels to calculate annual technical energy loss of
distribution cables
Bra
nch
Cir
cuit
Connec
te
d B
us
ID
Sim
ula
te
d
P.l
oss
@M
D
I fl
ow
P. F
V.D
rop
Pea
k P
.D
Aver
age
P.D
Load
fact
or
Loss
fact
or
Cal
cula
te
d
annual
tech
nic
al
loss
Annual
tech
nic
al
loss
ID
Fro
m
To
KW
Kvar
A
%
%
MW
MW
MW
H
%
Cable
1
B2 B4 0.0
15
0.00
4
17
7.
1
86.4
3
0 4.02
35
3.5869
0.8914875
0.8140
975 0.10697241 1.00933562
7
Cable
3
B5 B6
0.009 0.003
19.68
83.18 0
0.43942
0.33841
0.770
1288
0.6285
045 0.049551292
0.46754003
5
Cable
4
B5 B7 0.0
5 0.082
38.
03
82.7
3 0.01
0.81
856
0.724
71
0.885
3474
0.8041
416 0.345169723
3.32330683
7
Cable
5
B5 B8 0.0
12 0.012
25.
51
82.9
7 0
0.55
155
0.462
31
0.838
2014
0.7297
056 0.070314432
0.72376379
5
Cable
6
B5 B9 0.0
12 0.004
25.
52
82.9
7 0
0.55
254
0.463
31
0.838
5094
0.7301
803 0.070360177
0.72423466
6
Cable
7
B5 B1
0 0.6
83 0.236
21.
85
94.4
8 0.13 0.53091
0.466
52
0.878
7177
0.7934
593 4.747330674
45.0556583
6
Cable
8
B5 B1
1 0.6
83 0.236
21.
85
94.4
8 0.13
0.53
091
0.466
52
0.878
7177
0.7934
593 4.747330674
45.0556583
6
Cable
9
B5 B1
2 0.0
32 0.01
9.8
96
83.8
6 0.01
0.24
512
0.197
42
0.805
4014
0.6800
175 0.190622496
1.79861402
3
Cable
10
B5 B1
3 0.0
32 0.01
9.8
96
83.8
6 0.01
0.24
512
0.197
42
0.805
4014
0.6800
175 0.190622496
1.79861402
3
Cable
11
B5 B1
4 0.0
01 0
5.9
93 84.3 0
0.15
273
0.105
93
0.693
5769
0.5235
545 0.004586338
0.04327427
9
Total loss 1.5
15 0.597
10.4158883 100