Investor Presentation - Bath & Body Works
80
JULY 19, 2021 Investor Presentation
-
Upload
khangminh22 -
Category
Documents
-
view
1 -
download
0
Transcript of Investor Presentation - Bath & Body Works

JULY 19, 2021Investor Presentation

We caution that any forward-looking statements (as such term is defined in the Private Securities Litigation Reform Act of 1995) contained in this presentation or made by our Company or our management involve risks and uncertainties and are subject to change based on various factors, many of which are beyond our control. Accordingly, our future performance and financial results may differ materially from those expressed or implied in any such forward-looking statements. Words such as “estimate,” “project,” “plan,” “believe,” “expect,” “anticipate,” “intend,” “planned,” “potential” and any similar expressions may identify forward-looking statements. Risks associated with the following factors, among others, in some cases have affected and in the future could affect our financial performance and actual results and could cause actual results to differ materially from those expressed or implied in any forward-looking statements included in this presentation or otherwise made by our company or our management:
the spin-off may not be consummated within the anticipated time period or at all;
disruption to our business in connection with the proposed spin-off and that we could lose revenue as a result of such disruption;
the spin-off may not be tax-free for U.S. federal income tax purposes;
a loss of synergies from separating the businesses that could negatively impact the balance sheet, profit margins or earnings of both businesses
or that the companies resulting from the spin-off do not realize all of the expected benefits of the spin-off;
the combined value of the common stock of the two publicly-traded companies will not be equal to or greater than the value of our common stock had the spin-off not occurred;
general economic conditions, consumer confidence, consumer spending patterns and market disruptions including pandemics or significant health hazards, severe weather conditions, natural disasters, terrorist activities, financial crises, political crises or other major events, or the prospect of these events;
the novel coronavirus (COVID-19) global pandemic has had and is expected to continue to have an adverse effect on our business and results of operations;
the seasonality of our business;
difficulties arising from turnover in company leadership or other key positions;
our ability to attract, develop and retain qualified associates and manage labor-related costs;
the dependence on mall traffic and the availability of suitable store locations on appropriate terms;
our ability to grow through new store openings and existing store remodels and expansions;
our ability to successfully operate and expand internationally and related risks;
our independent franchise, license and wholesale partners;
our direct channel businesses;
our ability to protect our reputation and our brand images;
our ability to attract customers with marketing, advertising and promotional programs;
our ability to maintain, enforce and protect our trade names, trademarks and patents;
the highly competitive nature of the retail industry and the segments in which we operate;
consumer acceptance of our products and our ability to manage the life cycle of our brands, keep up with fashion trends,
develop new merchandise and launch new product lines successfully;
our ability to source, distribute and sell goods and materials on a global basis, including risks related to:
political instability, environmental hazards or natural disasters;
significant health hazards or pandemics, which could result in closed factories, reduced workforces, scarcity of raw materials,
and scrutiny or embargoing of goods produced in infected areas;
duties, taxes and other charges;
legal and regulatory matters;
- CONTINUED -
Forward Looking Statements
- CONTINUED - 2
Safe Harbor Statement Under the Private Securities Litigation Reform Act of 1995

volatility in currency exchange rates;
local business practices and political issues;
potential delays or disruptions in shipping and transportation and related pricing impacts;
disruption due to labor disputes; and
changing expectations regarding product safety due to new legislation;
our geographic concentration of vendor and distribution facilities in central Ohio;
fluctuations in foreign currency exchange rates;
the ability of our vendors to deliver products in a timely manner, meet quality standards and comply with applicable laws and regulations;
fluctuations in product input costs;
our ability to adequately protect our assets from loss and theft;
fluctuations in energy costs;
increases in the costs of mailing, paper, printing or other order fulfillment logistics;
claims arising from our self-insurance;
our and our third-party service providers' ability to implement and maintain information technology systems and to protect associated data;
our ability to maintain the security of customer, associate, third-party and company information;
stock price volatility;
our ability to pay dividends and related effects;
shareholder activism matters;
our ability to maintain our credit rating;
our ability to service or refinance our debt and maintain compliance with our restrictive covenants;
our ability to comply with laws, regulations and technology platform rules or other obligations related to data privacy and security;
our ability to comply with regulatory requirements;
legal and compliance matters; and
tax, trade and other regulatory matters.
We are not under any obligation and do not intend to make publicly available any update or other revisions to any of the forward-looking statements contained in this presentation to reflect circumstances existing after the date of this presentation or to reflect the occurrence of future events even if experience or future events make it clear that any expected results expressed or implied by those forward-looking statements will not be realized.
Non-GAAP Financial Measures
This presentation contains financial measures which have not been calculated in accordance with United States generally accepted accounting principles (“GAAP”), because they are a basis upon which our management assesses our performance and we believe they reflect the underlying trends and indicators of our business. Although we believe these measures may be useful for investors for the same reasons, these financial measures should not be considered as an alternative to GAAP financial measures as a measure of the Company’s financial condition, profitability and performance or liquidity. In addition, these financial measures may not be comparable to similar measures used by other companies. In the Appendix to this presentation, we provide further descriptions of these non-GAAP measures and reconciliations of these non-GAAP measures to the corresponding most closely related GAAP measures.
Forward Looking Statements
3
Safe Harbor Statement Under the Private Securities Litigation Reform Act of 1995

Andrew MeslowChief Executive Officer | L Brands, Inc. and Bath & Body Works

1. Who We Are
2. Investing in Digital
3. Optimizing Real Estate
4. International Expansion
5. Financials & Growth Opportunities
6. Appendix
5
Agenda

Bath & Body Works makes the world a brighter, happier place through the power of fragrance. This idea is what Bath & Body Works was founded on, and it’s at the heart of everything we do. We’re a team that cares about our customers and believes in giving them a reason to celebrate with fragrance every day. We remain committed to fostering a diverse, equitable, and inclusive culture that is focused on delivering exceptional fragrances and experiences. We work hard to improve our communities and our planet in a way that will make us proud for years to come…because we believe the world is a better place when everyone has access to the things that make them happy.
6
Our Purpose
1.

Market leader in our product categories Deep & experienced management team
Uniquely differentiated from competitors Strong performance across channels with diversified footprint across mall, off-mall & digital
Loyal & growing customer base Consistent history of delivering sales & profit growth
Engaged, motivated & knowledgeable associates create distinctive in-store experience
International growth opportunities through expansion of store & digital sales
Blend between constant flow of newness & replenishment of favorites
Substantial opportunities for growth at a strongprofit rate
A Compelling Investment Opportunity
7

#1Specialty Home Fragrance
& Fragrant Body Care in America
$6.4B
2020 Net Sales
11%
Revenue Growth (5 Year CAGR)1,2
24.6%
Average Operating Income Rate2 over 5 Years
>30%
of Sales via Digital Platforms
>55M
Customers3
>1,750 Stores Across the U.S.
and Canada
~290 International Franchise
Locations
Bath & Body Works at a Glance
Note: All numbers as of 2020 year-end except for customer count and U.S. and Canada stores, which are as of Q1 20211Represents 5-year period ending with fiscal year 20202Represents sales and adjusted operating income of Bath & Body Works stores and direct in the U.S. and Canada and does not include unallocated corporate overhead historically reported in the "other" segment. Please see reconciliation of reported to adjusted results in the appendix3Customer count based on identified transactions in prior 12 months
8

Management Team with Diverse Perspectives to Create Value for All Stakeholders
Andrew Meslow 2003Chief Executive Officer, L Brands and Bath & Body Works
Julie Rosen 2020President
Chris Cramer 2001Chief Operating Officer
Wendy Arlin 2005Chief Financial Officer
Deon Riley 2020Chief Human Resources Officer
Ron Ford 2003Executive Vice President and Head of Stores and Sales
Danielle Demko 2004Executive Vice President and General Manager of Bath & Body Works’ Direct Channel
Tom Ramsey 1997Chief Marketing Officer
Nada Aried 1989Executive Vice President, Chief Information Officer
Tony Garrison 2003Senior Vice President, International
Michael Wu 2021Chief Legal Counsel
Betsy Schumacher 2018Executive Vice President, Head of Merchandising
Bill Plasket 1996Executive Vice President, Head of New Business Opportunities
George Arenschield 1994Executive Vice President, Merchandise, Planning & Allocation
Highly Experienced Senior Leadership Focused on Execution
Note: year next to name denotes year individual joined the company
9

The Premier Specialty Fragrance Retailer Bath & Body Works Operates Across Growing Product Categories
Home Fragrance Body Care & FragranceSoaps & Sanitizers
$6.4BGlobal Sales
Home Fragrance
~40%Soaps & Sanitizers
~20%Body Care & Fragrance
~35%
Note: Gifting, accessories and other represents remaining 5%
Source: Fiscal year 2020 BBW net sales for US and Canada 10
Category Dominant

11
Substantial Scale through Multiple Channels
$2.0B2020 Sales
Highly profitable business
655M annual site visits
31%Digital
$2.2B2020 Sales
957 store locations
~99% of stores are cash flow positive
35%Mall
$2.0B2020 Sales
779 store locations
~100% of stores are cash flow positive
31%Off-Mall
$0.2B2020 Sales
Highly profitable franchise model
Significant opportunity for growth in existing and new geographies
3%International
Note: Data as of 2020 year-end

~$5BTAM
~$11BTAM
Bath & Body Works
22% Share
~$71BTAM
Bath & Body Works Is a Leader in the Beauty and Home Fragrance MarketsLarge and Growing Addressable Markets; Including Big Segments Where BBW Doesn’t Play Today
Note: Charts not to scaleTotal Body Care + Fragrance Includes Body Moisturizer, Body Wash, Hand Cream, Bath Additives, Sun Care, Essential Oils, Fragrance (including FFM, women’s, unisex and men’s fine fragrance), Bar Soap (73%). Home Fragrance includes Candles, Active Diffusers, Room Sprays, HF Oils & Wax Melts, Car, Passive Diffusers. Soaps & Sanitizers includes Hand Soap, Hand Sanitizer, Bar Soap (27%). Sales are calendar year 2020, U.S. only. Excludes accessories. Sources: Kline, Global Data, IRI, LB Actuals
Bath & Body Works
3% Share
Bath & Body Works
21% Share
Bath, Body & Beauty Industry Home Fragrance Soaps & Sanitizers
12

Fine Fragrance Mist
Body Lotion Body Cream Candles Electric Diffuser Liquid HandSoap
Hand Sanitizer
Bath & Body Works is a Clear Leader in Fragrant Body Care and Home Fragrance Products
#1brand in…Kline, Global Data, IRI, NPD, Euromonitor, LB Actuals; Reflects 2020 US Sales Only

Attributes Best-in-Class Vertical Retailer
CPG Company Bath & Body Works
Control channels of distribution (stores and digital)
Frequent newness and product launches - floorsetschange every 4-6 weeks
Emotional connection between brand and customers
High “giftability” of products
Passionate, knowledgeable sales associates; fun, engaging store experience
Replenishment-like qualities / Repeat business
Consistent traffic
Supply chain management
Uniquely Differentiated Versus CompetitionProducts Positioned at the Crossroads of Best-in-Class Vertical Retailer and CPG Business
14

>80%Brand Awareness of Women
18-59 Years Old; ~60% Awareness among Men in Same Cohort
>55MCustomers (as of Q1 2021)
~40%of Women 18-59 Years Old Shop
at Bath & Body Works
~$115Annual Spend per Customer
~3Average Customer Purchases per Year
~$40Average Customer
Spend per Visit
7Units Purchased per Visit
I always love coming in to see and smell what’s new. Bath & Body Works is one of the most fun places to come and just see what’s new because there’s always so much to choose from. — Bath & Body Works customer
Our Customer at a Glance
15
#1Consumer Products Brand for Gen Z
Women1
Note: Represents year end 2020 with the exception of customer file1Source: Morning Consult: https://morningconsult.com/most-loved-brands-genz/

$0
$300
$600
$900
$1,200
1 2 3 4 5 6
Years Active
Highly Loyal, Engaged Customer BaseConsistently Increasing Retention, Leading to Extremely Valuable Customers
1Percentage of customers who purchased in the current year and also in the prior yearSource: BBW Customer Data Mart (CDM)*2021 is rolling 12-month average ending May 2021
I use the website a lot to pre-shop before heading into the store. It’s a fun way to get a head start on knowing which fragrances you really want to make sure to smell when you go in the store. —Bath & Body Works customer
16
Customer Longevity is Key to Driving ValueTotal Lifetime Spend ($)
Loyalty is Stronger than Ever: Retention Rates Growing Nearly Every Year, Outpacing Industry1
45% 46%53%
58% 54% 57%
2016 2017 2018 2019 2020 2021*

Customer Spend Continues to Increase Over Time
Source: BBW Customer Data Mart (CDM), data as of year-end 2020
18%of customers shop across multiple channels which has more than doubled in four years
60%of customers shop across multiple categories
$65 $68 $77
$88 $95
$111
2015 2016 2017 2018 2019 2020
Trips 2.3 2.3 2.6 2.8 2.9 2.7
Average Customer Spend
17
$2652020 average dual channel customer spend, 139% higher than average customer spend
$1752020 average multi-category customer spend, 247% higher than single-category customer spend
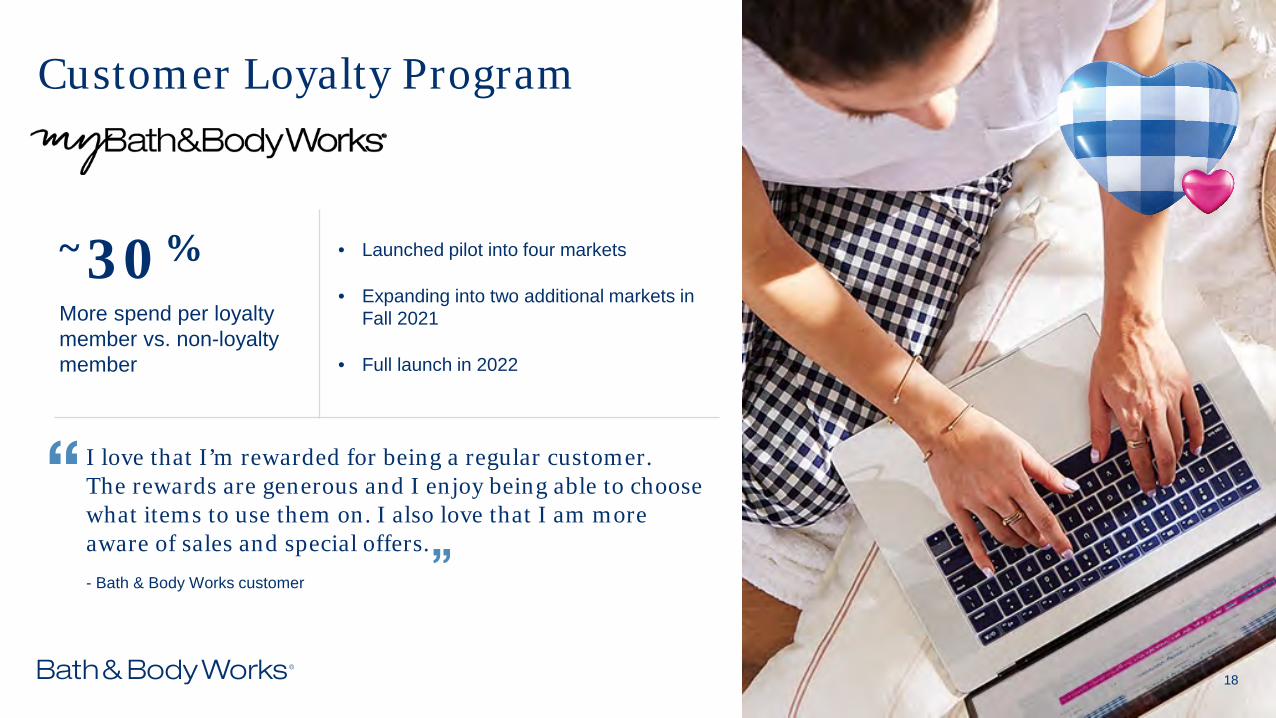
~30%More spend per loyalty member vs. non-loyalty member
I love that I’m rewarded for being a regular customer. The rewards are generous and I enjoy being able to choose what items to use them on. I also love that I am more aware of sales and special offers. - Bath & Body Works customer
• Launched pilot into four markets
• Expanding into two additional markets in Fall 2021
• Full launch in 2022
Customer Loyalty Program
18

Julie RosenPresident | Bath & Body Works

Product Pillars
Our product pillars drive every decision we make.
We are fragrance first We are an inclusive brand We are positioned as masstige
We drive big market leading forms and fragrances
We know fashion & newness lead the way
We use storytelling to amplify emotional content
We are actively moving to be greener and cleaner
We are a use-up business … quality is a must
We celebrate seasons& holidays
20

Bath & Body Works makes the world a brighter, happier place through the power of fragrance.
Bath & Body Works was founded on this idea, and it’s at the heart of everything we do.
Fragrance is transportive:
• It is mood-enhancing.
• It makes us feel happy, relaxed, empowered and comforted.
• Smell is our sense most connected to memories.
We are an inclusive brand We are positioned as masstige
We drive big market leading forms and fragrances
We know fashion & newness lead the way
We use storytelling to amplify emotional content
We are actively moving to be greener and cleaner
We are a use-up business … quality is a must
We celebrate seasons& holidays
We are fragrance first
Product Pillars
21

>55Mcustomers who reflect America's diverse demographics.
Focused on delivering products that celebrate the diversity and values of our brand.
Leveraging our Associate Inclusion Resource Groups to ensure products celebrate our customers’ diversity.
Product Pillars
We are fragrance first We are positioned as masstige
We drive big market leading forms and fragrances
We know fashion & newness lead the way
We use storytelling to amplify emotional content
We are actively moving to be greener and cleaner
We are a use-up business … quality is a must
We celebrate seasons& holidays
We are an inclusive brand
22

Look to mass to size the prize, and prestige to inspire our execution.
Customers are proud to use and gift Bath & Body Works products.
Seek global new ideas to apply to our brand.
Product Pillars
We are fragrance first We are an inclusive brand
We drive big market leading forms and fragrances
We know fashion & newness lead the way
We use storytelling to amplify emotional content
We are actively moving to be greener and cleaner
We are a use-up business … quality is a must
We celebrate seasons& holidays
We are positioned as masstige
23

Product Pillars
We are fragrance first We are an inclusive brand We are positioned as masstige
We know fashion & newness lead the way
We use storytelling to amplify emotional content
We are actively moving to be greener and cleaner
We are a use-up business … quality is a must
We celebrate seasons& holidays
We drive big market leading forms and fragrances
Portfolio is driven by key items that occupy market leading positions.
Portfolio includes 6fragrances that individually drive
$100M+ and collectively
drive nearly $1B in sales.
7 forms with #1 market position.
24

Product Pillars
We are fragrance first We are an inclusive brand We are positioned as masstige
We drive big market leading forms and fragrances
We know fashion & newness lead the way
We use storytelling to amplify emotional content
We are actively moving to be greener and cleaner
We celebrate seasons& holidays
We are a use-up business … quality is a must
Bath & Body Works products are designed to be used daily and replenished frequently.
Consistent quality across all products drives repeated use.
Leverage promotions to inspire trial and build loyalty.
25

Product Pillars
We are fragrance first We are an inclusive brand We are positioned as masstige
We drive big market leading forms and fragrances
We use storytelling to amplify emotional content
We are actively moving to be greener and cleaner
We are a use-up business … quality is a must
We celebrate seasons& holidays
We know fashion & newness lead the way
Unique product development model for personal care and home.
Flow of newness drives trips and repeat customers.
Fashion/trend-inspired products build brand relevance and differentiate us from our competition.
Merchants and designers partner with a dedicated team focused solely on trend, fashion and emerging concepts.
26

Product Pillars
We are fragrance first We are an inclusive brand We are positioned as masstige
We drive big market leading forms and fragrances
We know fashion & newness lead the way
We are actively moving to be greener and cleaner
We are a use-up business … quality is a must
We celebrate seasons& holidays
We use storytelling to amplify emotional content
Tell stories through fragrance, packaging and all customer touchpoints.
Centralize story around themes that excite customers and allow them to reminisce or be transported.
Continue to focus the brand on key pillars including happiness and fun.
27

Product Pillars
We are fragrance first We are an inclusive brand We are positioned as masstige
We drive big market leading forms and fragrances
We know fashion & newness lead the way
We use storytelling to amplify emotional content
We are actively moving to be greener and cleaner
We are a use-up business … quality is a must
We celebrate seasons& holidays
Embrace the seasons and holidays, and celebrating with friends and family.
Foster “Celebrating 365” as a key initiative to encourage customers to celebrate daily.
Strength across key holidays including Christmas and Mother’s Day.
28

We are fragrance first We are an inclusive brand We are positioned as masstige
We drive big market leading forms and fragrances
We know fashion & newness lead the way
We use storytelling to amplify emotional content
We are a use-up business … quality is a must
We celebrate seasons& holidays
Product Pillars
We are actively moving to be greener and cleaner
Focused on developing clean and eco-friendly products for our customers and planet.
Introduced recycled plastics across categories to migrate entire portfolio of plastic.
Continue execution of “Good For You, Good for the Earth” initiative.
29

Bath & Body Works Unique Operating Platform Enables Responsiveness and Agility in an Ever-Changing Environment
Learn
PatterningStore Visits
Launch
Regular Flow of New Product
Testing
ReactBeauty Park
Promo Calendar
Rapid Replenishment
Rapid Responses
Read
Daily SalesReports/Store Days
30

31
We Keep our Powerhouse Forms in Growth Mode with a Constant Flow of New Launches
Holiday
Core
Spring Summer Fall

We Keep our Powerhouse Forms in Growth Mode with Formula Upgrades
2009 | Triple Moisture 2014 | Ultra SheaIncrease of Shea Butter+24 HR Moisture Claim
2021 | Ultimate HydrationUltra Shea + Hyaluronic Acid
2022 | Ultimate Hydration + Clean Beauty Launch
New Clean Beauty Formula+ Ultimate Hydration
Made Without ParabensIncrease of Shea Butter, Cocoa Butter, Vitamin E & Aloe
32

33
2006 2009
2020
2013 2016
We Keep our Powerhouse Fragrances in Growth Mode with Packaging Refreshes
33

We Move Aggressively to Own New Categories and New Forms . . . and to Explore Next
May 2020 Launch | Spray Sanitizer
Fall 2021 Launch | Bar Soaps
2021 | Green & Clean Product Development
34

Chris CramerChief Operating Officer | Bath & Body Works

Quality and innovation at core of sourcing strategy
Strong technical R&D and innovation capabilities drive prolific product development
Poised to quickly respond to shifting consumer trends
Continually invest in production capacity and capabilities as well as innovation and development
Key suppliers focused on environmental sustainability and being financially and socially responsible
Our Business Is Enabled by an Agile Supply ChainSourcing Strategy Supports Innovation and Product Development, Drives Efficiencies and Mitigates Risk
36

Our Business Is Enabled by an Agile Supply Chain
Industry-leading speed in product development from concept to customer
Formidable chase capabilities
Long-term supplier relationships
Predominately U.S. supply base
• 6,000+ new SKUs launched each year across channels, including 250+ new fragrances
• Development teams in New York and Columbus
• Fragrance developers, R&D chemists and package engineers support product pipeline
• ~50% total production via speed replenishment model
• Re-order speeds as fast as 3-5 weeks
• Ability to leverage vertically integrated Beauty Park vendors
• 50 strategic, vendor relationships provide deep capabilities across product categories
• Numerous vendor relationships for 15+ years
• Beauty Park vertically-integrated for 10+ years; responsible for ~60% of finished goods and ~30% of components
• Multi-sourced product and raw materials
• 80% of product sourced in U.S.; global production based on market capabilities
37

5th Third-party direct channel fulfillment center opened recently
Investing in
1Msq ft
New company-owned direct-channel fulfillment center in Columbus
Initial benefits expected in fall 2022; full capacity expected in fall 2023
Strategic Investments in Supply Chain to Fuel Growth
Past Investments Ongoing and Future Investments
3Company-owned distribution centers support U.S. and international stores
4 Current permanent third-party direct-channel fulfillment centers in the U.S.
5-6 Pop-up third-party facilities to support peak needs
38

Investing in Digital
2.
39

Digital Sales Channel Demonstrating Continued Growth Highly Profitable Digital Channel
$450M$560M
$725M$960M
$2B
201612%
201713%
201816%
201919%
202031%
Focused on customers with:
BOPIS (>500 stores with capability currently)
BORIS
Auto-replenishment (in development)
Shop in App
Upgraded Order Management System
Expanded Fulfillment Capacity
Bath & Body Works Direct Sales
Penetration
40

>5.5BAnnual Digital Marketing
Impressions
Leveraging Digital Strengths and CapabilitiesDiverse Digital Marketing Strategy Driving Consumer Engagement
41
665MAnnual Website Visits to BathandBodyWorks.com
>30MCustomers in Email Database
285MUnits Processed
10MFacebook Followers
~6.5MInstagram Followers
~300KTwitter Followers
~415KPinterest Followers
Note: as of 2020 year end

Continuous Improvement of Online Experience • Enhanced graphics, video, marketing/content mix• Improved ease of navigation for customer • Ongoing feedback from customer
Expanding Fulfillment Options to the Customer• Diversified fulfillment model leveraging third-party partners and Bath & Body Works facilities• National coverage with BOPIS (plans for 700 - 800 stores)
Acquiring new customers across channels • Email, Facebook, Display Advertising, YouTube
More than 20 international .com sites• Launch digital geographically
Digital customers*
>15M
>70%Increase in digital customers in 2020
Continuing to Improve the Digital Experience
*Digital customer count as of May 2021 42

43
OptimizingReal Estate
3.

Store is the best experience of the Brand with passionate, knowledgeable, engaged sales force
Fragrance, sinks and testers in stores allow customers to experience products before buying
44
Unique, Engaging In-Store ExperienceDifferentiated Retail Experience

10%
17%
15%
13%
45%
A Malls B Malls C Malls D Malls Off-Mall
High profitability across all store venues in North America
Continued off-mall expansion limiting exposure to vulnerable mall locations
Leases provide significant protection based on occupancy and co‐tenancy provisions
99% of stores are cash flow positive
Average lease term in D-malls is 2.3 years
Total Stores
1752*
Diversified Store Portfolio
45
*As of May 1, 2021.

188 Stores opened primarily in top tier and off‐mall venues 2016-2020
$831$844
$891
$931$916
2016 2017 2018 2019 2020*
Continue to adjust investment levels based on performance
Diverse real estate portfolio across venue tiers and types
124 Stores closed primarily in lower tier venues 2016-2020
Real Estate OptimizationEnhances ProfitabilityContinued Proactive Management of Real Estate
* 2020 reflects the impact of store closures for approximately 3 months due to COVID-19 pandemic 46
Bath & Body Works U.S. Sales per Average Selling Square Foot

18%
21%
18%6%
39%
10%
17%
15%
11%
47%
D Malls
A Malls
B Malls
C Malls
Off-Mall
# of Stores Avg. sales per store ($M) Sales per square foot Return on sales Avg remaining lease term
Off-Mall 779 $2,529 $999 36% 5.3A 168 $3,248 $995 25% 5.3B 303 $2,857 $925 32% 5.2C 255 $2,105 $814 34% 4.0D or Lower 231 $1,326 $612 33% 2.3
Strong Sales and Profit in All Location TypesOff-Mall Penetration Approaching 50%
FY 2016 Store Count FY 2021E Store Count
D Malls
A Malls
B Malls
C Malls
Off-Mall
Note: table is as of 2020 year end 47

Design Evolution / White Barn Remodel ProgramRemodel Program has Delivered Increased Sales and Profit
>15%Average increase in sales and traffic one year following remodel completion
About 50% of stores currently in White Barn design
Expect to remodel
~50%of remaining core stores over next 2-4 years
48
Before After

Go-forward Physical Retail Strategy
Best-in-Class Future OrientedRe-imagined Retail Highly Profitable
Expect low-single digit annual increase in North American square footage, with off-mall penetration increasing
Regularly reviewing and adjusting to maintain flexibility
Open new stores in emerging non-mall venues or as replacement stores for non-viable malls
Close stores in non-viable or declining malls
Remodel 100-150 stores per year into White Barn format
Scaling BOPIS to 700 - 800 locations; strong customer engagement to-date
Testing multiple “faster shipping” options for the customer, including Ship From Store
Fleet Management
Capabilities
49
50
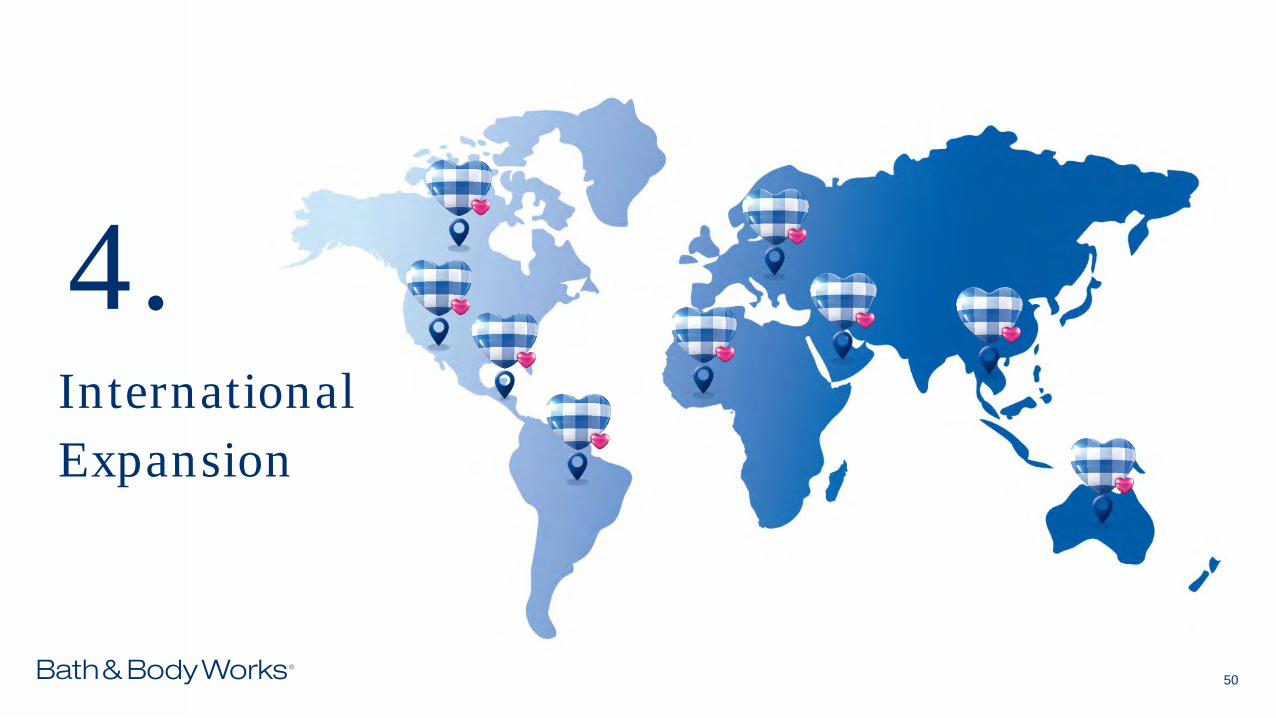
InternationalExpansion
4.

Successful International Operating Model
Bath & Body Works is a Top Performing Brand for Franchise Partners• Bath & Body Works is consistently among top 3 brands within franchise partners’ portfolios• Franchise partners are committed to greater expansion
~$225MRecognized revenue in 2020
~$455MRetail sales in 2020
Partnership-based business model with small number of world-class partners • Own assortment, pricing architecture, promotions, store designs and real estate approval• Paid on royalty basis • Partners make investments as experts in local real estate, people and practices• Local associates ensure standardized coaching, training, expediting and escalating
51

52
Broad International PresenceNumber of Stores
147Middle East
74Asia
53Americas
9Europe incl. UK
35Operating Countries
~290Retail Locations 2020 Year End
5Australia

Experienced Teams Delivering on the International Opportunity
53
Experienced International Leadership Team & Strong Associate Culture
Product Categories Catered to the Global Customer
Fragrance portfolio allows successful olfactive distortions to preferences of regions
International customer has perceived high value and giftability of brand
Leadership team averages 16 years with L Brands / Bath & Body Works
~6,000 global associates comprise the “Gingham Global Team”

Proven Track Record of GrowthConsistent Record of Store Growth and Comp Growth Proving the Positive Financial Health of the Brand and Demonstrating Existing Stores’ Positive Performance Against Other Locations
Consistent record of both store growth and comp growth proving the positive financial health of the brand and demonstrating existing store’s positive performance against other locations.
As different retail space standards and availability exist in the global marketplace, our international stores are ~ ½ the size of North American Stores, yielding average sales per selling square foot near North America performance.
-
50
100
150
200
250
300
-
$50
$100
$150
$200
$250
$300
$350
$400
$450
$500
2010 2011 2012 2013 2014 2015 2016 2017 2018 2019 2020
Stor
e C
ount
Sale
s ($
Ms)
Sales Store Count
54
International Retail Sales and Stores

Existing Market Franchise Stores & Digital Digital Expansion Test New/Emerging Markets
International Business Expected to Drive Significant Future Growth
Source: Company information
Strong growth in existing markets coupled with growth in new markets, especially Europe, and potential emerging markets sets foundation for sustained, significant growth
55
High-teens To Low-twentiesAnnual Revenue Growth Target
Key Areas of Focus

Wendy ArlinChief Financial Officer | Bath & Body Works

57
Financials & GrowthOpportunities
5.

Strong Track Record of Performance
Represents historically reported BBW segment results.
Please see reconciliation of reported to adjusted results in the appendix
$6,434
$5,170
$4,631
2020
2019
2018
$2,003
$958
$724
2020
2019
2018
$1,832
$1,224
$1,103
2020
2019
2018
45%
10%
11%
2020
2019
2018
Sales (Annual, in $M)
Direct Sales (Annual, in $M)
Adjusted Operating Income (Annual, in $M)
Comparable Sales Increase (Stores & Direct)
58

$2,625 $2,822
$3,033 $3,118 $3,350
$3,587 $3,852
$4,103
$4,631
$5,170
$6,434
$-
$1,000
$2,000
$3,000
$4,000
$5,000
$6,000
$7,000
2010 2011 2012 2013 2014 2015 2016 2017 2018 2019 2020
Net Sales
Consistent Growth in SalesNet Sales ($M's)
Note: Sales in 2017 and prior years do not include international results, which were not material59

$474 $526 $616 $648
$737 $858 $907 $939
$1,103 $1,224
$1,832
18.1%18.6%
20.3% 20.8%22.0%
23.9% 23.6%22.9% 23.3% 23.0%
28.5%
10%
15%
20%
25%
30%
$-
$200
$400
$600
$800
$1,000
$1,200
$1,400
$1,600
$1,800
$2,000
2010 2011 2012 2013 2014 2015 2016 2017 2018 2019 2020
Operating Income Operating Income %
Consistent Growth in Operating IncomeNet Sales & Operating Income ($M's)
Note: Sales in 2017 and prior years do not include international results, which were not material
Note: Operating income is as reported historical Bath & Body Works segment and does not include unallocated corporate overhead included in the Other segment or the impact of the separation
*Represents adjusted operating income. Please see reconciliation of reported to adjusted results in the appendix 60
*

Topline Consistency and SuccessHistorical Quarterly Comps (U.S. & Canada Stores and Direct)
% Comps Growth Q1 2020 Q2 2020 Q3 2020 Q4 2020 FY 2020
Stores & Direct 41% 123% 56% 22% 45%
-2%
-5%
2% 2%
7%
1%
7%6%
12%
5%
10%
4%5%
8%
6%
8%
5%4% 4%
0%
3%
5%
8%9%
5%6%
7% 7%6%
5%
7%
5%
2%
6%
4%
6%
8%
10%
13%12%
13%
8%9%
-10%
-5%
0%
5%
10%
15%
20192018201720162015201420132012201120102009
Q1 Q2 Q3 Q4
10%
Read & Quickly Correct
Q1 Q2 Q3 Q4 Q1 Q2 Q3 Q4 Q1 Q2 Q3 Q4 Q1 Q2 Q3 Q4 Q1 Q2 Q3 Q4 Q1 Q2 Q3 Q4 Q1 Q2 Q3 Q4 Q1 Q2 Q3 Q4 Q1 Q2 Q3 Q4 Q1 Q2 Q3 Q4
61

Separation Unlocks BBW’s High-Growth and High-Margin Profile
Note: All estimates calendarized to Jan-30. Revenue growth reflects 2017-2019 CAGR (pre-COVID); EBIT margins reflect 2020A; Figures for Best-in-Class and Beauty peer sets represent medians. Best-in-Class peers include Costco, Canada Goose, Home Depot, Lululemon, Nike, RH, Ulta and VF Corp. Beauty peers include Colgate-Palmolive, Coty, e.l.f. Beauty, Estee Lauder, L’Oreal, Shiseido and L’Occitane. 1Pre-COVID represents data prior to 21-Feb-2020.
Revenue Growth EBIT Margin
Current Forward EV/EBITDA 1Y Avg. Pre-COVID1 EV/EBITDA
6.6 % 4.9 %
~12%
Best-in-Class BrandedPeers
Beauty Peers Bath & Body Works
13.5 % 14.4 %
~28%
Best-in-Class BrandedPeers
Beauty Peers Bath & Body Works
5.8 x
16.7 x 15.8 x
L Brands Best-in-Class BrandedPeers
Beauty Peers
7.6 x
18.9 x 20.3 x
L Brands Best-in-Class BrandedPeers
Beauty Peers
62

Growth in Existing Categories• Positioned to capitalize on growing addressable market• Will continue to innovate and drive the market through new
forms, new fragrances and additional products
Growth in New or Adjacent Categories• Opportunities for growth in new categories including hair care, skin
care and wellness product lines
Growth in Digital Channel • Continuing to invest in capabilities to provide an exceptional
customer experience
Growth Internationally• Additional growth opportunities through expansion of store and
direct sales
Continued Execution Creates Opportunities for Long-Term Growth Focusing on Key Priorities
63

Multiple Category Levers for Growth (3 to 5 Years)Growth Across Categories ($M)
• Packaging & formula driven innovation in core forms
• Extension into adjacent cleanser & moisturizing forms
• Pursue key opportunity areas: men's & wellness
• Continued innovation in leading forms
• Adjacent candle forms
• Enhanced diffusion technology
• Fragrance for more spaces/rooms
• Continued packaging and formula innovation
• Additional hand soap and sanitizer forms
• Facial skincare
• Hair
• Home care
2020 Revenue Fragrant Body Care Home Fragrance Soaps & Sanitizers New Categories
64

• Continued rollout of White Barn format
• Increase in overall selling square footage
• New & scaled omnichannel capabilities
• Continually evolving digital experience
• Increasing speed & convenience for customer
• Expanded experiences (loyalty program, shoppable app, auto-replenishment, etc.)
• Introduce new marketing channels (SMS, TikTok, etc.)
• Brand strength in existing markets (positive customer response)
• Scaling opportunities in existing markets (more stores & digital growth)
• Potential growth into new regions
2020 Revenue North America Stores Digital International
Multiple Channel Levers for Growth (3 to 5 Years)Growth Across Channels ($M)
65

Three to Five Year Financial Targets
Metric Target
U.S. & Canada Store Comps Growth Low- to mid-single digit
U.S. & Canada Square Footage Growth Low-single digit
Direct Channel Sales Growth High-single digits to mid-teens
International Sales Growth High-teens to low-twenties
Total Sales Growth Mid- to high-single digit
Operating Income Growth Mid- to high-single digit
Operating Income Rate Low- to mid-twenties
66

Capital Structure Disciplined Financial Strategy to Drive Continued Profitable Growth and Reduce Leverage while Delivering Additional Value to Shareholders
Mid-2xRANGE
Targeted adjusted debt to EBITDAR leverage ratio
$500M Debt reduction
$0.60 Continuation of L Brands’ annual dividend
$1.5B Share repurchase authorization
$250 - 300M 2021 capital expenditures forecast
UP TO
PER SHARE
67

Market leader in our product categories Deep & experienced management team
Uniquely differentiated from competitors Strong performance across channels with diversified footprint across mall, off-mall & digital
Loyal & growing customer base Consistent history of delivering sales & profit growth
Engaged, motivated & knowledgeable associates create distinctive in-store experience
International growth opportunities through expansion of store & digital sales
Blend between constant flow of newness & replenishment of favorites
Substantial opportunities for growth at a strongprofit rate
A Compelling Investment Opportunity
68

69
PLEASE STAND BY
THE Q & A SESSIONWILL BEGIN MOMENTARILY
70
Q&A

Thank You!
71

Appendix
6.
72

1 In the second quarter of 2020, we recognized pre-tax severance charges of $11 million related to restructuring activities.
Adjusted Operating Income Reconciliation for Historically Reported Segment
2018 2019 2020
Operating Income - GAAP $ 1,103 $ 1,224 $ 1,821
Restructuring Charges1 $ - $ - $ 11
Adjusted Operating Income $ 1,103 $ 1,224 $ 1,832
Adjusted Operating Income % of Sales 23% 23% 28%
Bath & Body Works$s in millions
73

1 The Bath & Body Works segment represents company-operated retail stores located in the U.S. and Canada, company-operated Bath & Body Works digital platforms, and international stores/digital platforms operated by partners under franchise, license and wholesale arrangements. Additionally, this segment includes the Bath & Body Works merchandise sourcing and production function serving the Company and its international partners.
2 Corporate/Other includes corporate infrastructure and governance functions and other non-recurring items that are deemed to be corporate in nature. The amounts above include all of the unallocated L Brands' corporate costs that were historically reported in Other and do not exclude any portion related to Victoria's Secret & Co. As a result of the VS Spin-Off, the above operating results are not necessarily indicative of future results nor do they reflect what results of operations would have been as an independent public company during the periods presented.
Quarterly Financial Information, Fiscal 2021Historical Reported Results – Giving Effect to VS Spin-Off; Quarterly
First Quarter
Bath & Body WorksSegment1 Corporate / Other2 Total LB / RemainCo
Net Sales $ 1,469,479 $ 1,469,479
Costs of Goods Sold, Buying and Occupancy 722,192 $ 5,589 727,781
Gross Profit 747,287 (5,589) 741,698
General, Administrative and Store Operating Expenses 367,379 46,776 414,155
Operating Income $ 379,908 $ (52,365) $ 327,543
Gross Profit Rate 50.9% nm 50.5%
Operating Income Rate 25.9% nm 22.3%
$s in thousands, (Unaudited)
74

Quarterly Financial Information, Fiscal 2020Historical Reported Results – Giving Effect to VS Spin-Off; Quarterly$s in thousands, (Unaudited)
First Quarter Second Quarter Third Quarter
Bath & Body WorksSegment1
Corporate /Other2
Total LB / RemainCo
Bath & Body WorksSegment1
Corporate /Other2
Total LB / RemainCo
Bath & Body WorksSegment1
Corporate /Other2
Total LB / RemainCo
Net Sales $ 760,602 $ 760,602 $ 1,253,132 $ 1,253,132 $ 1,702,177 $ 1,702,177
Costs of Goods Sold, Buying and Occupancy
481,397 $ 11,357 492,754 671,999 $ 22,267 694,266 821,239 $ 18,231 839,471
Gross Profit 279,204 (11,357) 267,847 581,133 (22,267) 558,866 80,937 (18,231) 862,706
General, Administrative and Store Operating Expenses
203,477 28,200 231,678 244,180 51,946 296,127 386,808 39,840 426,648
Operating Income $ 75,727 $ (39,557) $ 36,169 $ 336,953 $ (74,213) $ 262,740 $ 494,129 $ (58,072) $ 436,058
Gross Profit Rate 36.7% nm 35.2% 46.4% nm 44.6% 51.8% nm 50.7%
Operating Income Rate 10.0% nm 4.8% 26.9% nm 21.0% 29.0% nm 25.6%
1 The Bath & Body Works segment represents company-operated retail stores located in the U.S. and Canada, company-operated Bath & Body Works digital platforms, and international stores/digital platforms operated by partners under franchise, license and wholesale arrangements. Additionally, this segment includes the Bath & Body Works merchandise sourcing and production function serving the Company and its international partners.
2 Corporate/Other includes corporate infrastructure and governance functions and other non-recurring items that are deemed to be corporate in nature. The amounts above include all of the unallocated L Brands' corporate costs that were historically reported in Other and do not exclude any portion related to Victoria's Secret & Co. As a result of the VS Spin-Off, the above operating results are not necessarily indicative of future results nor do they reflect what results of operations would have been as an independent public company during the periods presented. 75

1 The Bath & Body Works segment represents company-operated retail stores located in the U.S. and Canada, company-operated Bath & Body Works digital platforms, and international stores/digital platforms operated by partners under franchise, license and wholesale arrangements. Additionally, this segment includes the Bath & Body Works merchandise sourcing and production function serving the Company and its international partners.
2 Corporate/Other includes corporate infrastructure and governance functions and other non-recurring items that are deemed to be corporate in nature. The amounts above include all of the unallocated L Brands' corporate costs that were historically reported in Other and do not exclude any portion related to Victoria's Secret & Co. As a result of the VS Spin-Off, the above operating results are not necessarily indicative of future results nor do they reflect what results of operations would have been as an independent public company during the periods presented.
Quarterly Financial Information, Fiscal 2020Historical Reported Results – Giving Effect to VS Spin-Off; Quarterly
Fourth Quarter Full Year
Bath & Body WorksSegment1
Corporate /Other2
Total LB / RemainCo
Bath & Body WorksSegment1
Corporate /Other2
Total LB / RemainCo
Net Sales $ 2,718,192 $ 2,718,192 $ 6,434,102 $ 6,434,102
Costs of Goods Sold, Buying and Occupancy
1,303,209 $ 8,645 1,311,854 3,277,845 $ 60,500 3,338,345
Gross Profit 1,414,983 (8,645) 1,406,338 3,156,257 (60,500) 3,095,757
General, Administrative and Store Operating Expenses
501,253 35,857 537,110 1,335,719 155,844 1,491,563
Operating Income $ 913,730 $ (44,502) $ 869,228 $ 1,820,539 $ (216,345) $ 1,604,194
Gross Profit Rate 52.1% nm 51.7% 49.1% nm 48.1%
Operating Income Rate 33.6% nm 32.0% 28.3% nm 24.9%
$s in thousands, (Unaudited)
76

1 The Bath & Body Works segment represents company-operated retail stores located in the U.S. and Canada, company-operated Bath & Body Works digital platforms, and international stores/digital platforms operated by partners under franchise, license and wholesale arrangements. Additionally, this segment includes the Bath & Body Works merchandise sourcing and production function serving the Company and its international partners.2 Corporate/Other includes sales to La Senza through the merchandise sourcing and production function.3 Corporate/Other includes corporate infrastructure and governance functions and other non-recurring items that are deemed to be corporate in nature. The amounts above include all of the unallocated L Brands' corporate costs that were historically reported in Other and do not exclude any portion related to Victoria's Secret & Co. As a result of the VS Spin-Off, the above operating results are not necessarily indicative of future results nor do they reflect what results of operations would have been as an independent public company during the periods presented.
Quarterly Financial Information, Fiscal 2019Historical Reported Results – Giving Effect to VS Spin-Off; Quarterly$s in thousands, (Unaudited)
First Quarter Second Quarter Third Quarter
Bath & Body WorksSegment1
Corporate /Other2,3
Total LB / RemainCo
Bath & Body WorksSegment1
Corporate /Other2,3
Total LB / RemainCo
Bath & Body WorksSegment1
Corporate /Other2,3
Total LB / RemainCo
Net Sales $ 918,996 $ 39,411 $ 958,408 $ 1,106,760 $ 10,086 $ 1,116,846 $ 1,098,961 $ 300 $ 1,099,261
Costs of Goods Sold, Buying and Occupancy 511,490 49,772 561,261 648,341 16,035 664,376 605,484 12,142 617,626
Gross Profit 407,507 (10,361) 397,146 458,419 (5,949) 452,470 493,477 (11,842) 481,635
General, Administrative and Store Operating Expenses
239,786 35,980 275,766 274,852 38,395 313,247 284,717 30,594 315,311
Operating Income $ 167,721 $ (46,341) $ 121,380 $ 183,568 $ (44,344) $ 139,224 $ 208,760 $ (42,436) $ 166,324
Gross Profit Rate 44.3% nm 41.4% 41.4% nm 40.5% 44.9% nm 43.8%
Operating Income Rate 18.3% nm 12.7% 16.6% nm 12.5% 19.0% nm 15.1%
77

1 The Bath & Body Works segment represents company-operated retail stores located in the U.S. and Canada, company-operated Bath & Body Works digital platforms, and international stores/digital platforms operated by partners under franchise, license and wholesale arrangements. Additionally, this segment includes the Bath & Body Works merchandise sourcing and production function serving the Company and its international partners.2 Corporate/Other includes sales to La Senza through the merchandise sourcing and production function.3 Corporate/Other includes corporate infrastructure and governance functions and other non-recurring items that are deemed to be corporate in nature. The amounts above include all of the unallocated L Brands' corporate costs that were historically reported in Other and do not exclude any portion related to Victoria's Secret & Co. As a result of the VS Spin-Off, the above operating results are not necessarily indicative of future results nor do they reflect what results of operations would have been as an independent public company during the periods presented.
Quarterly Financial Information, Fiscal 2019Historical Reported Results – Giving Effect to VS Spin-Off; Quarterly
Fourth Quarter Full Year
Bath & Body WorksSegment1
Corporate /Other2
Total LB / RemainCo
Bath & Body WorksSegment1
Corporate /Other2
Total LB / RemainCo
Net Sales $ 2,230,947 $ 2,230,947 $ 5,355,664 $ 49,797 $ 5,405,461
Costs of Goods Sold, Buying and Occupancy 1,162,749 $ 12,130 1,174,879 2,928,064 90,078 3,018,142
Gross Profit 1,068,198 (12,130) 1,056,068 2,427,601 (40,281) 2,387,319
General, Administrative and Store Operating Expenses
404,471 38,536 443,007 1,203,826 143,506 1,347,332
Operating Income $ 663,726 $ (50,666) $ 613,060 $ 1,223,774 $ (183,787) $ 1,039,987
Gross Profit Rate 47.9% nm 47.3% 45.3% nm 44.2%
Operating Income Rate 29.8% nm 27.5% 22.9% nm 19.2%
$s in thousands, (Unaudited)
78

1 In the second quarter of 2020, we recognized pre-tax severance charges of $30 million ($11 million in Bath & Body Works segment results and $19 million in Corporate / Other) related to restructuring activities. Note: The operating income results above include all of the unallocated L Brands' corporate costs that were historically reported in Other and do not exclude any portion related to Victoria's Secret & Co. As a result of the VS Spin-Off, the above operating results are not necessarily indicative of future results nor do they reflect what results of operations would have been as an independent public company during the periods presented.In addition to our results provided that are in accordance with accounting principles generally accepted in the United States (“GAAP”), we have also provided non-GAAP financial measures which present operating income on an adjusted basis, which remove certain special items. We believe that these special items are not indicative of our ongoing operations due to their size and nature. We use adjusted financial information as key performance measures of results of operations for the purpose of evaluating performance internally. These non-GAAP financial measures are not intended to replace the presentation of our financial results in accordance with GAAP. Instead, we believe that the presentation of adjusted financial information provides additional information to investors to facilitate the comparison of past and present operations. Further, our definition of adjusted financial information may differ from similarly titled measures used by other companies and therefore may not be comparable among companies. The table above reconciles the GAAP financial measures to the non-GAAP financial measures.
Adjusted Operating Income ReconciliationHistorical Reported Results - Giving Effect to VS Spin-Off; Quarterly
2019 2020 2021
Q1 Q2 Q3 Q4 FY Q1 Q2 Q3 Q4 FY Q1
Operating Income - As Reported $ 121,380 $ 139,224 $ 166,324 $ 613,060 $ 1,039,987 $ 36,169 $ 262,740 $ 436,058 $ 869,228 $ 1,604,194 $ 327,543
Restructuring Charges1 - - - - - - 29,572 - - 29,572 -
Operating Income - Adjusted $ 121,380 $ 139,224 $ 166,324 $ 613,060 $ 1,039,987 $ 36,169 $ 292,311 $ 436,058 $ 869,228 $ 1,633,766 $ 327,543
$s in thousands, (Unaudited)
79

Note: Amounts above included certain liabilities related to Victoria’s Secret that will be retained in connection with the separation and exclude any potential cash proceeds from Victoria's Secret as part of the separation. Further, as a result of the separation, the above financial position is not necessarily indicative of future results nor does it reflect what Bath & Body Works' financial position would have been as an independent public company during the period presented.
Balance Sheet – As of January 30, 2021Historical Reported Results - Giving Effect to VS Spin-Off$s in millions, (Unaudited)
Current Liabilities 30-Jan-21Accounts Payable $ 345Accrued Expenses and Other 712Current Debt 0Current Operating Lease Liabilities 173Income Taxes 83
Total Current Liabilities 1,314Deferred Income Taxes 141Long-term Debt 6,366Long-term Operating Lease Liabilities 942Other Long-term Liabilities 289Shareholder's Equity -
Preferred Stock -Common Stock 143Additional Paid-in-Capital 891AOCI 79Retained Earnings (2,457)Less: Treasury Stock (358)
Total L Brands Equity (1,702)Noncontrolling Interest 1Total Equity (1,701)Total Liabilities and Equity $ 7,351
Liabilities and Equity (Deficit)Current Assets
Cash and Cash Equivalents $ 3,568
Accounts Receivable, Net 148
Inventories 572
Other 52
Total Current Assets 4,340
Property and Equipment, Net 1,017
Operating Lease Assets 968
Goodwill 628
Trade Names 165
Deferred Income Taxes 58
Other Assets 176
Total Assets $ 7,351
Assets
80