A review on liquid metal as cathode for molten salt/oxide ...
Upload
independentCategory
view
5download
0
ORIGINAL PAPER
A single mutation induces molten globule formationand a drastic destabilization of wild-type cytochrome cat pH 6.0
Md. Khurshid Alam Khan Æ Utpal Das ÆMd. Hamidur Rahaman Æ Md. Imtaiyaz Hassan ÆA. Srinivasan Æ Tej P. Singh Æ Faizan Ahmad
Received: 31 October 2008 / Accepted: 20 February 2009 / Published online: 10 March 2009
� SBIC 2009
Abstract Amino acid sequences of seven subfamilies of
cytochromes c show that other than heme binding residues
there are only four positions which are conserved in all
subfamilies: Gly/Ala6, Phe/Tyr10, Leu/Val/Phe94, and
Tyr/Trp/Phe97. These residues are 90% conserved in all
sequences reported and are also considered to be involved
in a common folding nucleus. To determine the importance
of conserved interactions offered by the side chain of
Leu94, we made an L94G mutant of horse cytochrome c.
Characterization of this mutant by the far-UV, near-UV,
and Soret circular dichroism, intrinsic and 1-Anilino-8-
naphthalene sulfonate fluorescence, and dynamic light
scattering measurements led to the conclusion that the
L94G mutant has all the common structural characteristics
of a molten globule at pH 6.0 and 25 �C. NaCl induces a
cooperative transition between the acid-denatured state and
a state of L94G having all the common structural charac-
teristics of a pre-molten-globule state at pH 2 and 25 �C.
Thermal denaturation studies showed that the midpoint of
denaturation of the mutant is 28 �C less than that of the
wild-type protein. Interestingly, the structure analysis using
the coordinates given in the Protein Data Bank (1hrc) also
suggested that the L94G mutant would be less stable than
the wild-type protein.
Keywords Site-directed mutagenesis � Molten globule �Pre-molten globule � Thermal stability � Cytochrome c
Introduction
It is well known and widely discussed that there are fam-
ilies of functionally and evolutionary related proteins
which have similar overall 3D structures (folding patterns)
but quite different amino acid sequences [1, 2]. This does
not mean, of course, that protein 3D structures do not
depend on the protein sequences. However, it implies that
not all features of the protein sequence is important for its
folding pattern. The usual explanation of this phenomenon
is that the protein-folding pattern is determined not by all
details of the amino acid sequences but by the key char-
acteristics of the sequences of all proteins of a given family
[3]. That is, just a few identical or conserved residues are
enough to ensure the common folding patterns of these
proteins. Both experiment and theory have shown that
these conserved residues form a folding nucleus which is
specific, i.e., it involves a definite set of native contacts,
and that the residues which form the nucleus are scattered
along the chain [3].
Cytochrome c, a 104-residue protein, is a member of an
extended family of heme proteins involved in electron
transfer functions in the mitochondrial respiratory chain and
bacterial photosynthesis [4]. Despite their highly divergent
amino acid sequences, these cytochromes c share some
common structural features, including the covalent linkage
of the heme group to two Cys residues, the axial ligands of
the heme iron, and a cluster of three a-helices grouped
Md. Khurshid Alam Khan � Md. Hamidur Rahaman �Md. Imtaiyaz Hassan � F. Ahmad (&)
Centre for Interdisciplinary Research in Basic Sciences,
Jamia Millia Islamia,
New Delhi 110025, India
e-mail: [email protected]
U. Das � A. Srinivasan � T. P. Singh
Department of Biophysics,
All India Institute of Medical Sciences,
Ansari Nagar,
New Delhi 110029, India
123
J Biol Inorg Chem (2009) 14:751–760
DOI 10.1007/s00775-009-0488-6
around one edge of the heme. The total number of conserved
residues in the subfamilies of cytochrome c considered is
surprisingly small. Four conserved residues Cys14, Cys17,
His18, and Met80 bind to the heme. Four nonfunctional
conserved residues (Gly/Ala6, Phe/Tyr10, Leu/Val/Phe94,
Tyr/Trp/Phe97) form, on average, 23 interatomic contacts
between N- and C-terminal helices, substantially contrib-
uting to the stability [3]. Besides these interhelical contacts,
there are a number of contacts inside or near the C-end of the
N-terminal helix. This interface involves the conserved
residues Leu94 and Tyr97 of the C-terminal helix and Gly6
and Phe10 of the N-terminal helix in cytochrome c from
horse heart. The side chain of Leu94 packs into the hole
created by Gly6 with a peg-in-hole interaction, while Tyr97
and Phe10 pack against each other through an aromatic–
aromatic interaction [3]. These sets of conserved nonfunc-
tional residues at the interface between N- and C-terminal
helices suggest that these residues are of special importance
for the structure and/or the folding of cytochrome c. It is
assumed that they are involved in a common folding nucleus
of all subfamilies of c-type cytochromes.
One may exploit the potential offered by site-directed
mutagenesis to alter specific interactions in the protein and,
consequently, gain insight into the role of such interactions.
To determine the importance of noncovalent interactions
offered by the side-chain atoms of the conserved Leu94
residue in the stability and folding of native horse cyto-
chrome c, we made a novel amino acid substitution of Leu
by Gly at position 94. The choice of this mutant was based
on our structural analysis using the CCP4 package [5]. In
this communication we show that (1) at pH 6.0 and 25 �C
the L94G mutant exists as a molten globule (MG) whose
midpoint of thermal denaturation is 28 �C less than that of
the wild-type protein and (2) at pH 2.0 and 25 �C NaCl
induces a cooperative transition between the acid-dena-
tured state (D state) and a state of the mutant having all the
common structural characteristics of a pre-MG state.
Materials and methods
Structural analysis
The crystal structure of horse cytochrome c [6] was ana-
lyzed using 3D structure analysis tools. Leu was mutated to
Gly at position 94 by using the Coot package of the CCP4
suite [5]. The structure of the mutant was checked by
PROCHEK [7] and Ramachandran plot [8] for its accuracy.
The ribbon diagram was drawn using PyMOL [9]. Contacts
between Leu94 and other residues in the wild-type protein
and those between Gly94 and other residues in the mutant
protein were determined using the contact program from
the CCP4 package.
Construction of the mutant
The expression plasmid, pBTR containing wild-type horse
cytochrome c gene and heme lyase, was a kind gift from
Professor Gary Pielak, University of North Carolina, USA.
This plasmid construct was used for making the mutant
L94G protein. The L94G mutation was carried out by site-
directed mutagenesis using the PCR-based QuikChange
site-directed mutagenesis kit (Stratagene, USA). The fol-
lowing primers (Microsynth, Switzerland) were used:
Primer 1: 50 GAACGCGAAGACGGCATCGCGTACC
TGAAAAAG 30
Primer 2: 50 CTTTTTCAGGTACGCGATGCCGTCTT
CGCGTTC 30
Mutation was confirmed by DNA sequencing (Applied
Biosystem, USA). A positive clone was used for the mutant
protein expression in Escherichia coli BL21 (DE3) strain.
Purification of mutated horse cytochrome c
Mutated cytochrome c protein was purified according to the
protocol followed by Patel et al. [10] with a slight modifi-
cation. Briefly, inoculation (1%) of 1 L of rich medium
(12 g bactotryptone, 24 g yeast extract, 4 mL glycerol, 2.3 g
KH2PO4, 12.5 g K2HPO4) was done with overnight primary
culture. Ampicillin was added to the culture to a final con-
centration of 100 lg/L. Cells were grown at 37 �C in a
shaker incubator for 36 h at 200 rpm. Cells were harvested
and cell paste was resuspended in lysis buffer containing
50 mM tris(hydroxymethyl)aminomethane–Cl, pH 6.8,
1 mM EDTA (3 mL/g cell paste). Cells were sonicated
on ice (Bandelin sonicator, Bandelin, Germany) with five
pulses of 10 s at an interval of 2 min. The lysate was cen-
trifuged at 8,000 rpm for 20 min and the supernatant was
collected. Ammonium sulfate was added to the supernatant
to a final concentration of 300 g/L while stirring the mixture
on ice, and the mixture was centrifuged at 8,000 rpm for
20 min at 4 �C and the supernatant was collected. This
supernatant was dialyzed against distilled water at 4 �C with
two changes every 8 h. The dialysate was concentrated on a
3-kDa MWCO Centricon filter (Millipore, USA) to less than
50 mL and dialyzed against low-salt buffer (0.878 g/L
NaH2PO4, 3.656 g/L Na2HPO4). The dialysate was loaded
onto a preequilibrated SP-Sepharose cation-exchange col-
umn (Sigma, USA). The mutant was eluted with high-salt
buffer (0.652 g/L NaH2PO4, 4.096 g/L Na2HPO4, 58.44 g/L
NaCl) using a linear gradient. Fractions of 3 mL each were
collected and A280 and A410 (where A represents absorbance)
were measured. All fractions having an absorbance ratio
(A410/A280) greater than 4 were pooled in one tube.
Both native and sodium dodecyl sulfate polyacrylamide
gel electrophoresis were performed to check the purity.
752 J Biol Inorg Chem (2009) 14:751–760
123
The final yield of the purified mutant cytochrome c (L94G)
was found to be 5 mg/L of culture. (The yield of wild-type
cytochrome c was 15 mg/L.)
Preparation of solutions
Both wild-type and purified L94G cytochrome c were
oxidized by adding 0.1% potassium ferricyanide as
described earlier [11]. The concentration of the oxidized
cytochrome c was determined experimentally using a value
of 106,000 M-1 cm-1 for the molar absorption coefficient
(e) at 409 nm [12]. A value of 5,000 M-1 cm-1 for e at
350 nm was used to determine the concentration of 1-
Anilino-8-naphthalene sulfonate (ANS) [13]. The samples
were prepared as follows. For the native state (N state),
each protein solution was prepared in 0.03 M cacodylate
buffer containing 0.1 M NaCl at pH 6.0. The acid-dena-
tured proteins were prepared by incubating them in a
water–HCl mixture at pH 2.0. The A state of the wild-type
protein was induced by the addition of 1 M NaCl to the
acid-denatured protein [11]. The acid-denatured L94G
mutant was titrated with NaCl. The titration curve shows
that the acid-denatured mutant is transformed to a new state
in the presence of an NaCl concentration of 1.0 M or
higher, called here the ‘‘X state.’’
Absorbance measurements
Absorption spectra (720–660 nm) of both wild-type horse
cytochrome c and the L94G mutant were measured using a
Shimadzu 1601 UV/vis spectrophotometer at 25.0 ±
0.1 �C. The temperature of the cell compartment was
maintained by circulating water from an external thermo-
stated water circulator. The protein concentrations used for
the absorption measurements were in the range 75–80 lM.
A cell of 1.0-cm path length was used for the absorption
measurements.
Circular dichroism measurements
The far-UV circular dichroism (CD) spectra (200–250 nm)
were recorded with a JASCO 715 spectropolarimeter using
a 1 mm path length cell. For the near-UV CD (270–
300 nm) and Soret CD (370–450 nm) measurements, a
1 cm path length cuvette was used. CD spectra of proteins
were measured at 25 ± 0.1 �C. Each spectrum was cor-
rected for the blank contribution. The protein concentration
used was 18–20 lM. The raw CD data were converted into
the mean residue ellipticity [h]k, (deg cm2 dmol-1) at
wavelength k using the relation
½h�k ¼ Mohk=10lc
where hk is the observed ellipticity in millidegrees at
wavelength k, Mo is the mean residue weight of the protein,
c is the protein concentration in milligrams per milliliter,
and l is the path length of the cell in centimeters. The
protein-to-ANS molar ratio used for measurements in the
far-UV region was 1:20 at pH 6.0.
Fluorescence measurements
Fluorescence spectra were measured using a JASCO FP
6200 spectrofluorimeter (Tokyo, Japan) in a 5-mm quartz
cell whose temperature was maintained at 25 ± 0.1 �C by
circulating water from an external thermostated water cir-
culator. A slit width of 10 nm was used for excitation and
emission. For the Trp fluorescence measurements, the
excitation wavelength was 280 nm, and emission spectra
were recorded from 300 to 440 nm. For the ANS fluores-
cence in ANS–protein binding experiments, the excitation
wavelength was 360 nm, and emission spectra were
recorded from 400 to 600 nm. The protein concentration
used for Trp and ANS fluorescence measurements was 7–
10 lM. The protein-to-ANS molar ratio for the fluores-
cence study was 1:20.
Thermal denaturation measurements
Heat-induced denaturation of horse cytochrome c and its
mutant was carried out in a JASCO spectropolarimeter
(model J-715) and a JASCO V-560 UV/vis spectropho-
tometer equipped with a Peltier-type temperature controller
with a heating rate of 1 �C/min, a scan rate providing
adequate time for equilibration. Changes in [h]222 of each
protein were measured in the temperature range 20–85 �C.
After denaturation, the sample was immediately cooled to
measure the reversibility of the process at different tem-
peratures. The data (y, T) were fitted to a two-state
denaturation model using the relation [14, 15]
yðTÞ ¼ yNðTÞ þ yDðTÞ exp½�DHm=Rð1=T � 1=TmÞ�1þ exp½�DHm=Rð1=T � 1=TmÞ�
ð1Þ
where y(T) is the experimentally observed optical property
of the protein at temperature T in kelvins, yN(T) and yD(T)
are the optical properties of the native (N) and denatured
(D) molecules at temperature T in kelvins, R is the uni-
versal gas constant, and DHm is the van’t Hoff enthalpy
change at Tm, the midpoint of the thermal denaturation. All
solution blanks showed negligible changes in measurable
parameters with temperature and were, therefore, neglected
during the data analysis.
Dynamic light scattering measurements
Dynamic light scattering measurements were carried out
using a RiNA Laser Spectroscatter-201 to obtain hydro-
dynamic radii of different states of cytochrome c and L94G
J Biol Inorg Chem (2009) 14:751–760 753
123
mutant at 25 ± 0.1 �C. Each sample contained 2.5 mg/mL
protein. Measurements were made at a fixed angle of 90�using an incident laser beam of 689 nm. Ten measurements
were made with an acquisition time of 30 s for each sample
at a sensitivity of 10%. The data were analyzed for
hydrodynamic radii using PMgr version 3.01 p17, provided
by the manufacturer.
Results
Selection and design of the mutant
It is quite evident from the sequence alignment of various
cytochromes c that, apart from the heme binding residues,
there are a few residues which are evolutionarily conserved
in these proteins. These are identified as Gly/Ala6, Phe/
Tyr10, Leu/Val/Phe94, and Tyr/Trp/Phe97. They are also
considered to be involved in the common folding nucleus
of all subfamilies of cytochromes c [3]. It may be seen
from the known coordinates of horse cytochrome c that
there are a number of interactions within these four resi-
dues (Gly6, Phe10, Leu94, and Tyr97), which hold the N-
and C-terminal helices of cytochrome c [6]. We tried to
make a feasible mutant which could help us to determine
the importance of these interactions in holding these heli-
ces. Gly6 cannot be replaced by any other residues because
of their bulkier side chains; hence, they can cause a severe
packing defect in the protein structure. Phe10 interacts with
Tyr97 of the protein through aromatic–aromatic interac-
tion, which is important for the stability of the protein [3].
In fact, we tried to make mutants to disrupt this aromatic–
aromatic interaction by replacing Phe10 with Gly, Val, and
Ile, but none of them could be expressed in E. coli. The
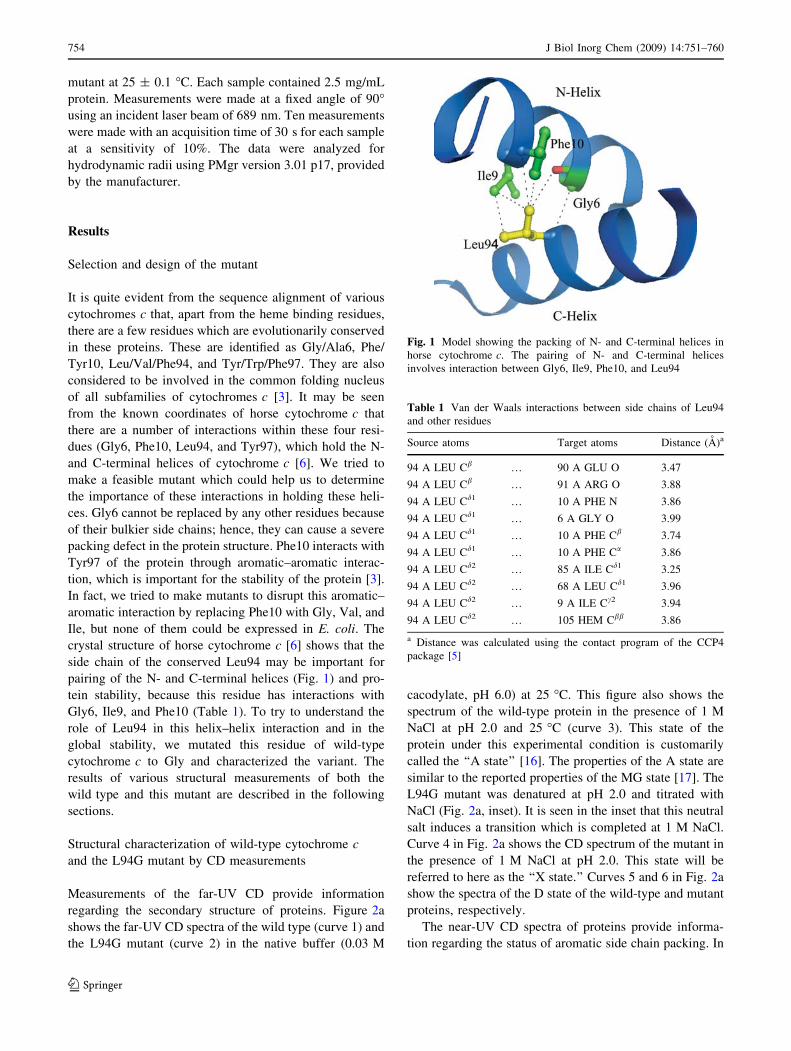
crystal structure of horse cytochrome c [6] shows that the
side chain of the conserved Leu94 may be important for
pairing of the N- and C-terminal helices (Fig. 1) and pro-
tein stability, because this residue has interactions with
Gly6, Ile9, and Phe10 (Table 1). To try to understand the
role of Leu94 in this helix–helix interaction and in the
global stability, we mutated this residue of wild-type
cytochrome c to Gly and characterized the variant. The
results of various structural measurements of both the
wild type and this mutant are described in the following
sections.
Structural characterization of wild-type cytochrome c
and the L94G mutant by CD measurements
Measurements of the far-UV CD provide information
regarding the secondary structure of proteins. Figure 2a
shows the far-UV CD spectra of the wild type (curve 1) and
the L94G mutant (curve 2) in the native buffer (0.03 M
cacodylate, pH 6.0) at 25 �C. This figure also shows the
spectrum of the wild-type protein in the presence of 1 M
NaCl at pH 2.0 and 25 �C (curve 3). This state of the
protein under this experimental condition is customarily
called the ‘‘A state’’ [16]. The properties of the A state are
similar to the reported properties of the MG state [17]. The
L94G mutant was denatured at pH 2.0 and titrated with
NaCl (Fig. 2a, inset). It is seen in the inset that this neutral
salt induces a transition which is completed at 1 M NaCl.
Curve 4 in Fig. 2a shows the CD spectrum of the mutant in
the presence of 1 M NaCl at pH 2.0. This state will be
referred to here as the ‘‘X state.’’ Curves 5 and 6 in Fig. 2a
show the spectra of the D state of the wild-type and mutant
proteins, respectively.
The near-UV CD spectra of proteins provide informa-
tion regarding the status of aromatic side chain packing. In
Fig. 1 Model showing the packing of N- and C-terminal helices in
horse cytochrome c. The pairing of N- and C-terminal helices
involves interaction between Gly6, Ile9, Phe10, and Leu94
Table 1 Van der Waals interactions between side chains of Leu94
and other residues
Source atoms Target atoms Distance (A)a
94 A LEU Cb … 90 A GLU O 3.47
94 A LEU Cb … 91 A ARG O 3.88
94 A LEU Cd1 … 10 A PHE N 3.86
94 A LEU Cd1 … 6 A GLY O 3.99
94 A LEU Cd1 … 10 A PHE Cb 3.74
94 A LEU Cd1 … 10 A PHE Ca 3.86
94 A LEU Cd2 … 85 A ILE Cd1 3.25
94 A LEU Cd2 … 68 A LEU Cd1 3.96
94 A LEU Cd2 … 9 A ILE Cc2 3.94
94 A LEU Cd2 … 105 HEM Cbb 3.86
a Distance was calculated using the contact program of the CCP4
package [5]
754 J Biol Inorg Chem (2009) 14:751–760
123
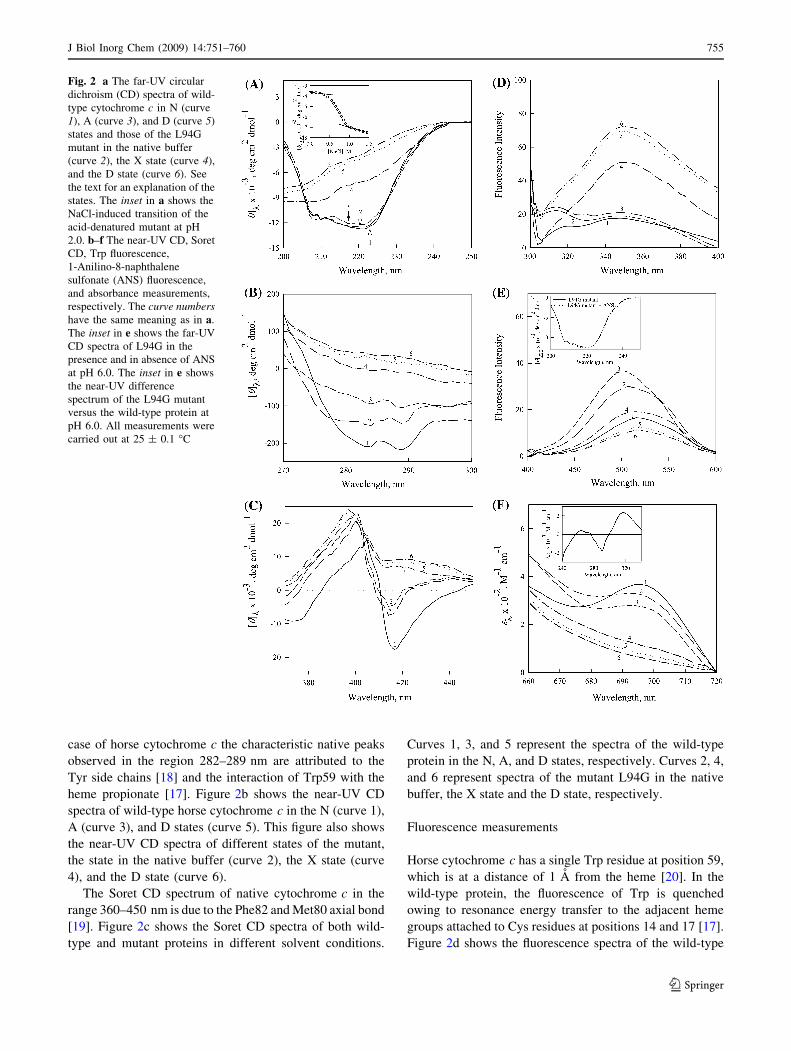
case of horse cytochrome c the characteristic native peaks
observed in the region 282–289 nm are attributed to the
Tyr side chains [18] and the interaction of Trp59 with the
heme propionate [17]. Figure 2b shows the near-UV CD
spectra of wild-type horse cytochrome c in the N (curve 1),
A (curve 3), and D states (curve 5). This figure also shows
the near-UV CD spectra of different states of the mutant,
the state in the native buffer (curve 2), the X state (curve
4), and the D state (curve 6).
The Soret CD spectrum of native cytochrome c in the
range 360–450 nm is due to the Phe82 and Met80 axial bond
[19]. Figure 2c shows the Soret CD spectra of both wild-
type and mutant proteins in different solvent conditions.
Curves 1, 3, and 5 represent the spectra of the wild-type
protein in the N, A, and D states, respectively. Curves 2, 4,
and 6 represent spectra of the mutant L94G in the native
buffer, the X state and the D state, respectively.
Fluorescence measurements
Horse cytochrome c has a single Trp residue at position 59,
which is at a distance of 1 A from the heme [20]. In the
wild-type protein, the fluorescence of Trp is quenched
owing to resonance energy transfer to the adjacent heme
groups attached to Cys residues at positions 14 and 17 [17].
Figure 2d shows the fluorescence spectra of the wild-type
Fig. 2 a The far-UV circular
dichroism (CD) spectra of wild-
type cytochrome c in N (curve
1), A (curve 3), and D (curve 5)
states and those of the L94G
mutant in the native buffer
(curve 2), the X state (curve 4),
and the D state (curve 6). See
the text for an explanation of the
states. The inset in a shows the
NaCl-induced transition of the
acid-denatured mutant at pH
2.0. b–f The near-UV CD, Soret
CD, Trp fluorescence,
1-Anilino-8-naphthalene
sulfonate (ANS) fluorescence,
and absorbance measurements,
respectively. The curve numbershave the same meaning as in a.
The inset in e shows the far-UV
CD spectra of L94G in the
presence and in absence of ANS
at pH 6.0. The inset in e shows
the near-UV difference
spectrum of the L94G mutant
versus the wild-type protein at
pH 6.0. All measurements were
carried out at 25 ± 0.1 �C
J Biol Inorg Chem (2009) 14:751–760 755
123
protein in the N (curve 1), A (curve 3), and D (curve 5)
states. This figure also shows the spectra of the L94G
mutant in the native buffer (curve 2), the X state (curve 4),
and the D state (curve 6).
The presence of exposed hydrophobic clusters and their
binding with hydrophobic dyes such as ANS is one of the
properties of the MG state [21]. Figure 2e shows ANS
fluorescence spectra in the presence of the wild-type pro-
tein in the N (curve 1), A (curve 3), and D (curve 5) states.
This figure also shows the ANS fluorescence spectra in the
presence of the mutant L94G in the native buffer (curve 2),
the X state (curve 4), and the D state (curve 6).
Absorbance measurements
Figure 2f shows the absorption spectra (660–720 nm) of
the wild-type and mutant proteins. A positive peak at
695 nm in the native wild-type cytochrome c spectrum is
diagnostic for the presence of a Met80–Fe(III) axial bond
[22]. Curves 1, 3, and 5 in Fig. 2f represent spectra of the
wild-type protein in its N, A, and D states, respectively.
Spectra of the L94G mutant in the native buffer (curve 2),
the X state (curve 4), and the D state (curve 6) are also
shown in this figure.
Dynamic light scattering measurements
To determine the hydrodynamic radius (Rh) of the protein
under different solvent conditions, dynamic light scattering
measurements were performed at 25 �C. It has been
observed that Rh values of native wild-type cytochrome c
and the L94G mutant in native buffer are 1.54 ± 0.02 and
1.71 ± 0.04 nm, respectively. The hydrodynamic radii of
the wild-type protein in the A and D states are 1.82 ± 0.09
and 3.61 ± 0.05 nm, respectively. Values of 2.2 ± 0.13
and 3.63 ± 0.08 nm for the hydrodynamic radii of the X and
D states, respectively, of the L94G mutant were observed.
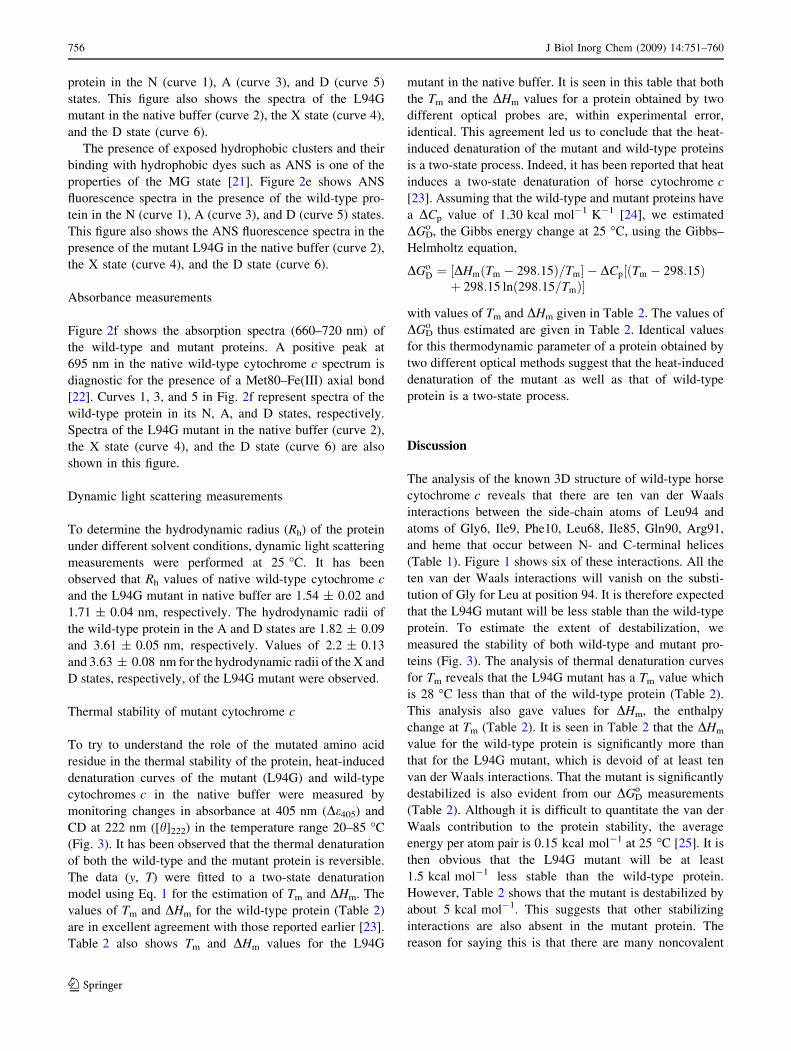
Thermal stability of mutant cytochrome c
To try to understand the role of the mutated amino acid
residue in the thermal stability of the protein, heat-induced
denaturation curves of the mutant (L94G) and wild-type
cytochromes c in the native buffer were measured by
monitoring changes in absorbance at 405 nm (De405) and
CD at 222 nm ([h]222) in the temperature range 20–85 �C
(Fig. 3). It has been observed that the thermal denaturation
of both the wild-type and the mutant protein is reversible.
The data (y, T) were fitted to a two-state denaturation
model using Eq. 1 for the estimation of Tm and DHm. The
values of Tm and DHm for the wild-type protein (Table 2)
are in excellent agreement with those reported earlier [23].
Table 2 also shows Tm and DHm values for the L94G
mutant in the native buffer. It is seen in this table that both
the Tm and the DHm values for a protein obtained by two
different optical probes are, within experimental error,
identical. This agreement led us to conclude that the heat-
induced denaturation of the mutant and wild-type proteins
is a two-state process. Indeed, it has been reported that heat
induces a two-state denaturation of horse cytochrome c
[23]. Assuming that the wild-type and mutant proteins have
a DCp value of 1.30 kcal mol-1 K-1 [24], we estimated
DGDo , the Gibbs energy change at 25 �C, using the Gibbs–
Helmholtz equation,
DGoD ¼ ½DHmðTm � 298:15Þ=Tm� � DCp½ðTm � 298:15Þþ 298:15 lnð298:15=TmÞ�
with values of Tm and DHm given in Table 2. The values of
DGDo thus estimated are given in Table 2. Identical values
for this thermodynamic parameter of a protein obtained by
two different optical methods suggest that the heat-induced
denaturation of the mutant as well as that of wild-type
protein is a two-state process.
Discussion
The analysis of the known 3D structure of wild-type horse
cytochrome c reveals that there are ten van der Waals
interactions between the side-chain atoms of Leu94 and
atoms of Gly6, Ile9, Phe10, Leu68, Ile85, Gln90, Arg91,
and heme that occur between N- and C-terminal helices
(Table 1). Figure 1 shows six of these interactions. All the
ten van der Waals interactions will vanish on the substi-
tution of Gly for Leu at position 94. It is therefore expected
that the L94G mutant will be less stable than the wild-type
protein. To estimate the extent of destabilization, we
measured the stability of both wild-type and mutant pro-
teins (Fig. 3). The analysis of thermal denaturation curves
for Tm reveals that the L94G mutant has a Tm value which
is 28 �C less than that of the wild-type protein (Table 2).
This analysis also gave values for DHm, the enthalpy
change at Tm (Table 2). It is seen in Table 2 that the DHm
value for the wild-type protein is significantly more than
that for the L94G mutant, which is devoid of at least ten
van der Waals interactions. That the mutant is significantly
destabilized is also evident from our DGDo measurements
(Table 2). Although it is difficult to quantitate the van der
Waals contribution to the protein stability, the average
energy per atom pair is 0.15 kcal mol-1 at 25 �C [25]. It is
then obvious that the L94G mutant will be at least
1.5 kcal mol-1 less stable than the wild-type protein.
However, Table 2 shows that the mutant is destabilized by
about 5 kcal mol-1. This suggests that other stabilizing
interactions are also absent in the mutant protein. The
reason for saying this is that there are many noncovalent
756 J Biol Inorg Chem (2009) 14:751–760
123
interactions, including 36 of them between heme and
amino acid residues, that stabilize the wild-type protein [6].
In the absence of the 3D structure of the L94G mutant, it is,
however, not possible to say which noncovalent interac-
tions other than those shown in Table 1 are perturbed on
the mutation of Leu94.
Although the L94G mutant is thermodynamically less
stable than the wild-type protein (Table 2), the far-UV CD
measurements revealed that the overall secondary struc-
tures present in both proteins are almost identical (Fig. 2a,
curves 1 and 2). This suggests that stabilizing noncovalent
interactions, including van der Waals interactions holding
the N- and C-terminal helices (Fig. 1), are not important
for guiding the formation of the secondary structure of
cytochrome c.
Leu94, Phe10, and Gly6 are considered to be involved in
a common folding nucleus which guides the protein to fold
properly [3]. The mutation of Leu to Gly at position 94
may lead to improper folding at the level of the tertiary
structure. To check this, we determined the tertiary struc-
ture of the L94G mutant and compared it with that of the
wild-type protein. A comparison of the near-UV CD
spectrum of wild-type horse cytochrome c (Fig. 2b, curve
1) with that of the L94G mutant in the native buffer
Fig. 3 Thermal denaturation of
wild-type horse cytochrome cand its L94G mutant monitored
by [h]222 (a) and De405 (b) at pH
6.0. WT h-cyt-c wild-type horse
cytochrome c
Table 2 Thermal denaturation of proteins in the native buffer
Probe Wild-type horse cytochrome c L94G mutant
Tm (oC) DHm (kcal mol-1) DGDo (kcal mol-1) Tm (�C) DHm (kcal mol-1) DGD
o (kcal mol-1)
[h]222 83.1 ± 0.3 101 ± 5 9.9 ± 0.6 54.7 ± 0.4 76 ± 3 5.06 ± 0.13
De405 82.8 ± 0.2 99 ± 4 9.6 ± 0.3 54.2 ± 0.3 75 ± 3 4.96 ± 0.2
The ± sign represents the deviation from the mean value of triplicate measurements
J Biol Inorg Chem (2009) 14:751–760 757
123
(Fig. 2b, curve 2) shows that there is a considerable loss of
aromatic CD of the mutant. This weak CD signal observed
in the mutant may be due to improper packing of Tyr side
chains and/or decrease in heme–Trp interaction [17, 18].
Since the Trp fluorescence spectra of the mutant and wild-
type proteins are very similar, it seems that the heme–Trp
distance is largely maintained in L94G (Fig. 2d, curves 1
and 2). To show that the reduction in CD of the mutant
(Fig. 2b, curve 2) is due to the exposure of the aromatic
amino acid residues to the polar solvent and not due to
reduction in their asymmetry only, we measured the dif-
ference absorption spectrum of the mutant against the wild-
type protein. It is seen in the inset of Fig. 2f that the L94G
mutant has its aromatic residues exposed to the polar water
solvent [26], because a decrease in De287 is also a signature
of exposure of Tyr from a nonpolar to a polar solvent.
Thus, the mutant in the native buffer has less tertiary
structure than the wild-type protein.
The common structural characteristics of the MG state
are as follows: (1) the presence of a pronounced amount of
secondary structure, (2) the absence of most of the specific
tertiary structure produced by the tight packing of side
chains, (3) the compactness of the protein molecule with a
radius of gyration 10–30% larger than that of the native
state, and (4) the presence of a loosely packed hydrophobic
core that increases the hydrophobic surface accessible to
the solvent [21]. A comparison of the far- and near-UV CD
spectra of native wild-type horse cytochrome c (Fig. 2a, b,
curves 1) with those of the L94G mutant in the native
buffer (Fig. 2a, b, curves 2) suggests that the mutant has
two of the structural characteristics of the MG state,
namely, characteristics 1 and 2 mentioned above. However,
comparison of the near-UV CD spectrum of the L94G
mutant in the native buffer (Fig. 2b, curve 2) with that of
its D state (Fig. 2b, curve 6) suggests that the characteristic
native tertiary interactions in the wild-type protein
(Fig. 2b, curve 1) are only partially lost in the mutation-
induced MG state. This finding is consistent with the
reports that there is remarkable diversity among MG states
of a protein induced by different solvent conditions
[21, 27], and there is substantial nativelike tertiary packing
in the MG states of some proteins [21].
To ascertain whether the L94G mutant has other MG-
like characteristics, we carried out fluorescence measure-
ment of ANS in the presence of wild-type and mutant
proteins under different solvent conditions (Fig. 2e),
because the dye shows increase in fluorescence intensity
with a blueshift in the emission maximum on binding with
exposed hydrophobic clusters known as finger prints of the
MG state [28]. Our observations suggest that there is
blueshift in the emission maximum of the dye in the
presence of the mutant and an increase in fluorescence
intensity. This observation suggests that the L94G mutant
has more hydrophobic patches exposed to the polar solvent
than the wild-type protein. It was shown earlier that ANS
induces a secondary structure in acid-denatured wild-type
cytochrome c at pH 2 [29]. To see whether the dye induces
a secondary structure, we measured the far-UV CD of the
L94G mutant in the presence and absence of ANS. It was
observed that ANS does not alter the secondary structure
content of the L94G mutant at pH 6.0 (Fig. 2e, inset).
To further characterize the state of the the L94G mutant
in the native buffer, we measured its hydrodynamic radius
(Rh) and compared it with the observed Rh of wild-type
horse cytochrome c. For a solid sphere, Rh is related to RG
through the relation RG2 = 3Rh
2/5 (Eqs. 18–20 in [30]. We
estimated RG values from the observed values of Rh of the
wild type and the mutant in the native buffer. It was found
that the compactness of the L94G mutant is 14% larger
than that of the wild-type protein, which qualifies the
mutant to have characteristic 3 mentioned above. These
measurements and the optical characterizations of the
L94G mutant in the native buffer and their comparison
with those of wild-type cytochrome c (Fig. 2) led us to
conclude that a single mutation in wild-type horse cyto-
chrome c induces a MG state.
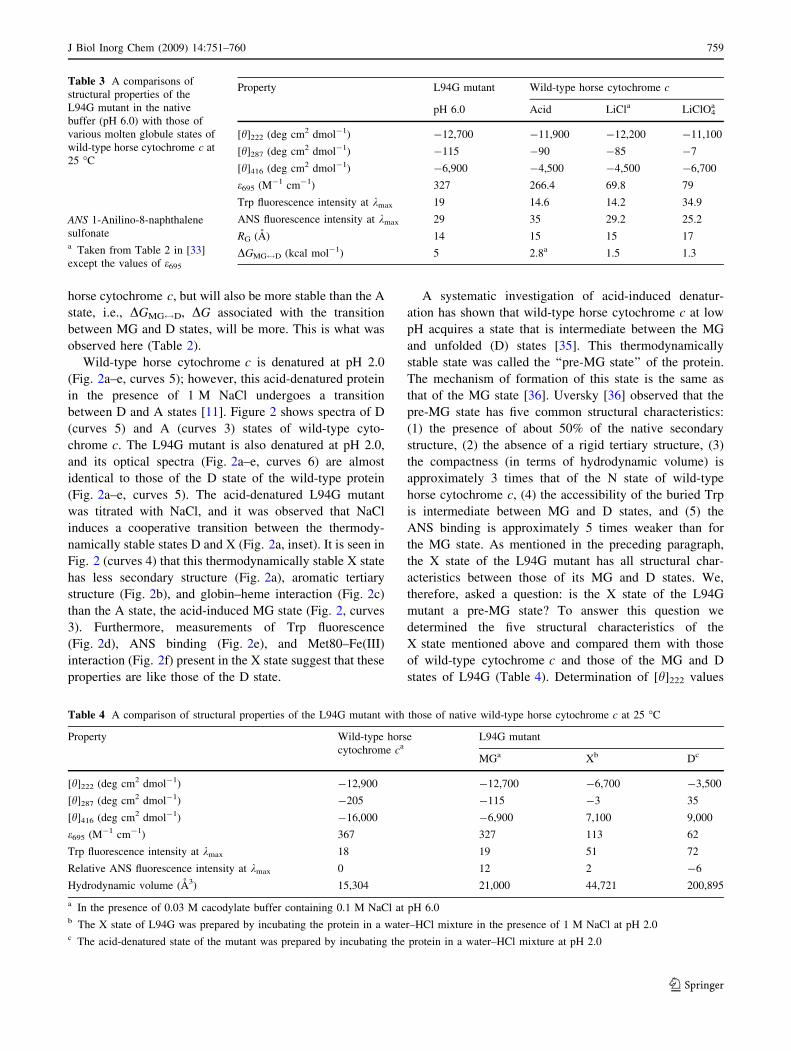
Various MG-like thermodynamically stable intermedi-
ates have been observed in wild-type horse cytochrome c,
and only MG states induced by NaCl (pH 2.0) and weak
salt denaturants (LiCl, CaCl2, LiClO4) are well character-
ized in terms of thermodynamic [23, 27, 31] and structural
[17, 32] parameters at pH 6.0. Table 3 compares these
parameters of the MG state of the L94G mutant only with
those of the wild-type protein induced by LiClO4 and LiCl
at pH 6.0 at 25 �C and NaCl (pH 2.0) at 25 �C because
CaCl2- and LiCl-induced MG states have been shown to
have identical structural and thermodynamic properties
[27]. Since a comparison of the A state with various MG
states of wild-type horse cytochrome c induced by LiCl
and LiClO4 has already been presented and discussed in
detail elsewhere [33], we shall not repeat it here. Instead,
we shall present a comparison of structural and thermo-
dynamic characteristics of the mutation-induced MG state
with those of the A state of the wild-type protein. The
helical content of both MG states are, within experimental
error, identical (Fig. 2a, curves 1 and 2). This finding is
consistent with the argument that the hydrophobic core
composed of main helix segments of wild-type protein is
retained in the acid-induced MG state [20, 33, 34]. It is
seen in Fig. 2 that the L94G mutant (curves 2) retains more
tight packing of aromatic side chains (Fig. 2b), heme–
globin interaction (Fig. 2c), hydrophobic surface area
(Fig. 2e), and Met80–Fe(III) interactions (Fig. 2f) com-
pared with the A state (Fig. 2b–f, curves 3). If this is the
case, it is then expected that the L94G mutant is not only
structurally different from other MG states of wild-type
758 J Biol Inorg Chem (2009) 14:751–760
123
horse cytochrome c, but will also be more stable than the A
state, i.e., DGMG$D, DG associated with the transition
between MG and D states, will be more. This is what was
observed here (Table 2).
Wild-type horse cytochrome c is denatured at pH 2.0
(Fig. 2a–e, curves 5); however, this acid-denatured protein
in the presence of 1 M NaCl undergoes a transition
between D and A states [11]. Figure 2 shows spectra of D
(curves 5) and A (curves 3) states of wild-type cyto-
chrome c. The L94G mutant is also denatured at pH 2.0,
and its optical spectra (Fig. 2a–e, curves 6) are almost
identical to those of the D state of the wild-type protein
(Fig. 2a–e, curves 5). The acid-denatured L94G mutant
was titrated with NaCl, and it was observed that NaCl
induces a cooperative transition between the thermody-
namically stable states D and X (Fig. 2a, inset). It is seen in
Fig. 2 (curves 4) that this thermodynamically stable X state
has less secondary structure (Fig. 2a), aromatic tertiary
structure (Fig. 2b), and globin–heme interaction (Fig. 2c)
than the A state, the acid-induced MG state (Fig. 2, curves
3). Furthermore, measurements of Trp fluorescence
(Fig. 2d), ANS binding (Fig. 2e), and Met80–Fe(III)
interaction (Fig. 2f) present in the X state suggest that these
properties are like those of the D state.
A systematic investigation of acid-induced denatur-
ation has shown that wild-type horse cytochrome c at low
pH acquires a state that is intermediate between the MG
and unfolded (D) states [35]. This thermodynamically
stable state was called the ‘‘pre-MG state’’ of the protein.
The mechanism of formation of this state is the same as
that of the MG state [36]. Uversky [36] observed that the
pre-MG state has five common structural characteristics:
(1) the presence of about 50% of the native secondary
structure, (2) the absence of a rigid tertiary structure, (3)
the compactness (in terms of hydrodynamic volume) is
approximately 3 times that of the N state of wild-type
horse cytochrome c, (4) the accessibility of the buried Trp
is intermediate between MG and D states, and (5) the
ANS binding is approximately 5 times weaker than for
the MG state. As mentioned in the preceding paragraph,
the X state of the L94G mutant has all structural char-
acteristics between those of its MG and D states. We,
therefore, asked a question: is the X state of the L94G
mutant a pre-MG state? To answer this question we
determined the five structural characteristics of the
X state mentioned above and compared them with those
of wild-type cytochrome c and those of the MG and D
states of L94G (Table 4). Determination of [h]222 values
Table 3 A comparisons of
structural properties of the
L94G mutant in the native
buffer (pH 6.0) with those of
various molten globule states of
wild-type horse cytochrome c at
25 �C
ANS 1-Anilino-8-naphthalene
sulfonatea Taken from Table 2 in [33]
except the values of e695
Property L94G mutant Wild-type horse cytochrome c
pH 6.0 Acid LiCla LiClO4a
[h]222 (deg cm2 dmol-1) -12,700 -11,900 -12,200 -11,100
[h]287 (deg cm2 dmol-1) -115 -90 -85 -7
[h]416 (deg cm2 dmol-1) -6,900 -4,500 -4,500 -6,700
e695 (M-1 cm-1) 327 266.4 69.8 79
Trp fluorescence intensity at kmax 19 14.6 14.2 34.9
ANS fluorescence intensity at kmax 29 35 29.2 25.2
RG (A) 14 15 15 17
DGMG$D (kcal mol-1) 5 2.8a 1.5 1.3
Table 4 A comparison of structural properties of the L94G mutant with those of native wild-type horse cytochrome c at 25 �C
Property Wild-type horse
cytochrome caL94G mutant
MGa Xb Dc
[h]222 (deg cm2 dmol-1) -12,900 -12,700 -6,700 -3,500
[h]287 (deg cm2 dmol-1) -205 -115 -3 35
[h]416 (deg cm2 dmol-1) -16,000 -6,900 7,100 9,000
e695 (M-1 cm-1) 367 327 113 62
Trp fluorescence intensity at kmax 18 19 51 72
Relative ANS fluorescence intensity at kmax 0 12 2 -6
Hydrodynamic volume (A3) 15,304 21,000 44,721 200,895
a In the presence of 0.03 M cacodylate buffer containing 0.1 M NaCl at pH 6.0b The X state of L94G was prepared by incubating the protein in a water–HCl mixture in the presence of 1 M NaCl at pH 2.0c The acid-denatured state of the mutant was prepared by incubating the protein in a water–HCl mixture at pH 2.0
J Biol Inorg Chem (2009) 14:751–760 759
123
(which are a measure of secondary structure) of native
wild-type cytochrome c and the MG, X, and D states of
the L94G mutant suggests that the X state contains about
52% of the secondary structure present in the wild-type
protein. Thus, the first criterion of a pre-MG state is
fulfilled. Measurements of [h]287, [h]416, e695, ANS
binding, and Trp fluorescence of native wild-type horse
cytochrome c and L94G under different solvent condi-
tions suggest the presence of almost no rigid tertiary
structure in the X state of L94G (Table 4). This fulfills
the second structural characteristics of a pre-MG state.
The third structural characteristic of a pre-MG state is
that its hydrodynamic volume is approximately 3 times
more than that of the N state of the wild-type protein.
Our results given in Table 4 do suggest that the hydro-
dynamic volume of the X state of L94G is approximately
3 times more than that of wild-type horse cytochrome c.
Fluorescence measurements suggest that the ANS binding
with the X state is 6 times weaker than that with the MG
state of the mutant (Table 4). Thus, the structural char-
acteristics of the X state of L94G and their comparison
with those of other states led us to conclude that the
L94G mutant in the presence of 1 M NaCl at pH 2.0 exits
as a pre-MG state.
It is seen in the inset of Fig. 1 that the thermodynamic
equilibrium between D and X states is cooperative, sug-
gesting that there exits a specific binding site(s) on the
protein in the X state [37]. Assuming a specific binding
model, we analyzed this equilibrium for the value of n, the
number of Cl- ions bound to the X state, using appropriate
relations (see Eqs. 1–3 in [37]). We obtained a value of 1.1
for n, suggesting that the X state has one binding site for
the Cl- ion. Thus, the pre-MG (X) state of cytochrome c is
stabilized by Cl- binding, although some contributions
from general salt effects (Debye–Huckle screening) cannot
be ruled out. It is noteworthy that from their kinetic studies,
Colon and Roder [37] showed the presence of a kinetic
intermediate (I0C) in the D ? MG transition of horse
cytochrome c at pH 2.0. A comparison of I0C with the
thermodynamically stable pre-MG state observed in this
study shows that both have similar properties.
In summary, the native MG state of the L94G mutant is
different from the MG states of horse cytochrome c [33].
L94G in the presence of 1 M NaCl or more at pH 2.0 exists
as a thermodynamically stable pre-MG state.
Acknowledgments This work supported by grants from the CSIR
and DST to F.A. M.K.A.K., M.H.R., and M.I.H are thankful to the
CSIR, UGC, and DST, respectively, for fellowships.
References
1. Bashford D, Chothia C, Lesk AM (1987) J Mol Biol 196:199–216
2. Chothia C, Lesk AM (1986) EMBO J 5:823–826
3. Ptitsyn OB (1998) J Mol Biol 278:655–666
4. Meyer TE, Kamen MD (1982) Adv Protein Chem 35:105–212
5. Emsley P, Cowtan K (2004) Acta Crystallogr D Biol Crystallogr
60:2126–2132
6. Bushnell GW, Louie GV, Brayer GD (1990) J Mol Biol 214:585–
595
7. Laskowski RA, Moss DS, Thornton JM (1993) J Mol Biol
231:1049–1067
8. Ramachandran GN, Sasisekharan V (1968) Adv Protein Chem
23:283–438
9. DeLano WL (2002) The PyMOL molecular graphics system.
DeLano Scientific, San Carlos
10. Patel CN, Lind MC, Pielak GJ (2001) Characterization of horse
cytochrome c expressed in Escherichia coli. Protein Expr Purif
22:220–224
11. Goto Y, Takahashi N, Fink AL (1990) Biochemistry 29:3480–
3488
12. Margoliash E, Frohwirt N (1959) Biochem J 71:570–572
13. Mulqueen PM, Kronman MJ (1982) Arch Biochem Biophys
215:28–39
14. Sinha A, Yadav S, Ahmad R, Ahmad F (2000) Biochem J
345(3):711–717
15. Santoro MM, Bolen DW (1988) Biochemistry 27:8063–8068
16. Goto Y, Calciano LJ, Fink AL (1990) Proc Natl Acad Sci USA
87:573–577
17. Santucci R, Bongiovanni C, Mei G, Ferri T, Polizio F, Desideri A
(2000) Biochemistry 39:12632–12638
18. Hamada D, Kuroda Y, Kataoka M, Aimoto S, Yoshimura T, Goto
Y (1996) J Mol Biol 256:172–186
19. Santucci R, Ascoli F (1997) J Inorg Biochem 68:211–214
20. Dill KA, Chan HS (1997) Nat Struct Biol 4:10–19
21. Arai M, Kuwajima K (2000) Adv Protein Chem 53:209–282
22. Schejter E, Saludjian P (1967) Biopolymers 5:788–790
23. Moza B, Qureshi SH, Ahmad F (2003) Biochim Biophys Acta
1646:49–56
24. Makhatadze GI, Clore GM, Gronenborn AM (1995) Nat Struct
Biol 2:852–855
25. Fersht AR (1997) Curr Opin Struct Biol 7:3–9
26. Donovan JW (1973) Methods Enzymol 27:497–525
27. Qureshi SH, Moza B, Yadav S, Ahmad F (2003) Biochemistry
42:1684–1695
28. Semisotnov GV, Rodionova NA, Razgulyaev OI, Uversky VN,
Gripas AF, Gilmanshin RI (1991) Biopolymers 31:119–128
29. Ali V, Prakash K, Kulkarni S, Ahmad A, Madhusudan KP,
Bhakuni V (1999) Biochemistry 38:13635–13642
30. Tanford C (1961) Physical chemistry of macromolecules. Wiley,
New York
31. Kuroda Y, Kidokoro S, Wada A (1992) J Mol Biol 223:1139–1153
32. Jeng MF, Englander SW (1991) J Mol Biol 221:1045–1061
33. Moza B, Qureshi SH, Islam A, Singh R, Anjum F et al (2006)
Biochemistry 45:4695–4702
34. Marmorino JL, Pielak GJ (1995) Biochemistry 34:3140–3143
35. Fink AL, Calciano LJ, Goto Y, Kurotsu T, Palleros DR (1994)
Biochemistry 33:12504–12511
36. Uversky VN (1997) Protein Pept Lett 4:355–367
37. Colon W, Roder H (1995) Nat Struct Biol 3:1019–1025
760 J Biol Inorg Chem (2009) 14:751–760
123
Copyright © 2022 FDOKUMEN


![An EMF Study of LiF-BeF2 Solutions [Disc 3] - Molten Salt ...](https://static.fdokumen.com/doc/165x107/63237dd8be5419ea700ea0fe/an-emf-study-of-lif-bef2-solutions-disc-3-molten-salt-.jpg)