Characterization of molten globule state of fetuin at low pH
Upload
khangminh22Category
view
1download
0
RE i;aRN TO:NUCLEAR NGMIIVEERING LIBRARY
139 ALBANY STREETCAMRIDGE, MASS. 0213
THEORETICAL STUDIES ON
31-109-38-2831 -1
MITNE- 155C, I
SOME ASPECTS OF
MOLTEN FUEL-COOLANT THERMAL INTERACTION
by
Mujid S. Kazimi
May 1973
Department of Nuclear Engineering
Massachusetts Institute of Technology
77 Massachusetts Avenue
Cambridge, Massachusetts 02139
AEC Research and Development
Contract 31-109-38-2831
Argonne National Laboratory
A
I* 1.
TR

THEORETICAL STUDIES ON SOME ASPECTS OF
MOLTEN FUEL-COOLANT THERMAL INTERACTION
by
Mujid S. Kazimi
May 1973
Department of Nuclear Engineering
Massachusetts Institute of Technology
77 Massachusetts Avenue
Cambridge, Massachusetts 02139
Approved
RTURN TO,NUCLGEA EfNGINEERING LUBR ARY
1 Af3ANY STREETCkm kdGE, MASS. 02139
Neil E. TodreasPrincipal Investigator

2
THEORETICAL STUDIES ON SOME ASPECTS OFMOLTEN-FUEL-COOLANT THERMAL INTERACTION
ABSTRACT
Rapid generation of high pressures and mechanical workmay result when thermal energy is transferred from the hotmolten nuclear fuel to the coolant in an LMFBR accident.Such energetic thermal interactions are facilitated by thelarge heat transfer area created when molten fuel is frag-mented in the coolant. Two aspects of the molten fuel-coolant interaction problem are investigated: (1) theeffects of gas/vapor blanketing of the fuel on post-frag-mentation generation of pressure and mechanical work, and(2) the mechanism of the fragmentation of the molten fuelas it contacts the coolant.
A model developed at Argonne National Laboratory toanalyze fragmentation-induced energetic fuel-coolant inter-actions is modified to allow for gas/vapor blanketing ofthe fuel. The modified model is applied to a. hypotheticalaccident involving an FFTF subassembly. The results in-dicate that high shock pressures are not necessarily pre-cluded by gas/vapor blanketing of the fuel. However, thegeneration of mechanical work is greatly reduced.
A model is developed to simulate the dynamic growth ofthe vapor film around a hot spherical particle which hasbeen suddenly immersed in a coolant. The model is appliedto various cases of hot spheres in water and in sodium. Afragmentation mechanism based on the ability of the pressurepulsations of the vapor film to induce internal cavitationin the molten material is shown to predict the reportedfragmentation behavior of drops of several hot moltenmaterials in water and sodium.

3
ACKNOWLEDGEMENTS
I wish to express my sincere appreciation to ProfessorNeil E. Todreas and Professor David D. Lanning for theirencouragement, suggestions and constructive criticismthroughout the development of this work, to Professor WarrenM. Rohsenow of the Mechanical Engineering Department forhis invaluable advice on several considerationsin this work,and to Dr. Dae H. Cho of Argonne National Laboratory for hisadvice on developing the analysis in Chapter 3 and for makingavailable unpublished experimental results.
I am also grateful to Mr. Rateb Abu Eid for his assist-ance in drawing some of the figures, to Mrs. Virginia O'Keefeand Miss Clare Egan for their patience and skill in convertingmy scribblings into this manuscript in a short time.

4
TABLE OF CONTENTS
Page13Nomenclature
Chapter 1. Introduction
1.1 Molten Fuel - Coolant Thermal Interaction
in LMFBR Safety Analysis
1.2 The Physical Mechanisms Involved in
Explosive Thermal Interactions
1.3 The Present Work
Chapter 2. Literature Review: Studies of Thermal
Interactions of Hot Molten Materials
and Coolants
2.1 Introduction
2.2 Experimental Studies
2.3 Theoretical Studies
Chapter 3. Effect of Gas/Vapor Blanketing of Fuel
on Fragmentation - Induced Explosive
Thermal Interaction in LMFBR
3.1 Introduction
3.2 The Original ANL Parametric Model for
Fuel - Coolant Interaction
3.3 Modification of the Model to Include
the Blanketing Effect
3.4 Application of the Modified Model:
Results and Discussion
Chapter 4.
4.1
4.2
4.3
Dynamics of Vapor Film Growth Around
a Hot Particle in a Coolant
Introduction
Formulation of the Model
Application of the Model to Hot Spheres
in Water
1718
19
21
23
24
24
53
63
64
65
70
82
93
94
94127

4.4 Application of the Model to Hot
Spheres in Sodium
Chapter 5. The Mechanism of Free-Contact
Fragmentation of Hot Molten Materials
in Coolants
5.1 Introduction
5.2 Modes of Fragmentation
5.3 Summary of the Experimental Observations
of Free-Contact Fragmentation
5.4 Discussion of Previously Advanced
Mechanisms
5.5 A Proposed Mechanism of Fragmentation
Chapter 6..
6.1
6.2
Appendix
Appendix
Appendix
A.
B.
C.
Appendix D.
Appendix E.
Appendix F.
Conclusion
Summary
Recommendations for Future Work
Contribution of Radiative Heat Transfer
to Total Heat Transfer in Film Boiling
On the Average Film Temperature
Estimation of the Effects of Non-
Equilibrium Conditions on the Dynamic
Vapor Film Growth
On the Adequacy of the Integral Method
for Describing the Heat Transfer in
the Model for Dynamic Vapor Film Growth
Listing of the Computer Program for
Dynamic Vapor Film Growth, FILDYN
Derivation of the Starting Values for
the Numerical Integration of the
5
Page
145
158
159159162
164
172
190
191
194
197
200
203
207
215
223

6
Pag~e
Equations of Vapor Film Growth
Appendix G. Comparison of Experimental Data to 227
the Predictions of Various Correlations
for the Minimum Wall Temperature
Required to Stabilize Film Boiling
Appendix H. Nucleation in Liquids 239
Appendix I. -Properties of Materials 251
References 258

7
LIST OF FIGURES
Figure No. Page
2.1 Results of Dropping Various Materials 31
into Sodium
2.2 Effect of Initial Temperature of Stainless 32
Steel on Mean Diameter of Fragments
2.3 Mean Diameter of Residue and Ejected UO 2 33
and Stainless Steel Fragments as a Function
of Sodium Bath Temperature
2.4 Results of Dropping Various Materials in 35
Water
2.5 Effect of Weber Number on the Fragmentation 37
of Molten Drops in Water
2.6 Fragmentation of Liquid Gallium Quenched 38
in 300C Water
2.7 Fragmentation of Molten Tin Quenched in 39
220C Water
2.8 Effect of Water Subcooling on Fragmen- 40
tation of Molten Ti-n in Water
2.9 Fragmentation of Molten Bismuth in Water
2.10 Fragmentation of Molten AgCl in Water 42
2.11 Fragmentation of Molten Lead in Water 43
2.12 Some Pictures From the Fragmentation 46
Experiments of Ref. 42
3.1 Schematic Diagram for the System Described 67
by the Original ANL Parametric Fuel
Interaction Model

8
Page
3.2 Schematic Diagram for the System Described 71
by the Modified ANL Model for Fuel-Sodium
Thermal Interaction
3.3 Effect of Gas Blanketing on Pressure- 85Time History
3.L4 Effect of Vapor Blanketing on Pressure- 86
Time History
3.5 Effect of Vapor Blanketing on Mechanical 88
Work
3.6 Effect of Vapor Blanketing on the Mechanical 90
Work in Presence of a Cushion Gas
3.7 Effect of Gas Blanketing on Mechanical Work 91
4.1 Schematic Diagram for the Model for Dynamic 107Vapor Film Growth
4.2 Block Diagram for the Numerical Integration 128
Scheme for the Variables (Yi)
4.3 Effect of Water Pool Temperature on the 131
Pressure-Time History of the Growing Film
4.4 Effect of Water Pool Temperature on 132
Vaporization
4.5 History of Vapor Film Growth 133
4.6 Effect of Water Pool Temperature on the 134
Rate of Heat Transfer from the Sphere
4.7 Effect of Initial Temperature of the Sphere 136
on Pressure-Time History
4.8 Effect of Sphere Temperature on Envelope 137
of Pressure Oscillations

9
Page
4.9 Effect of Initial Gas Film Thickness 139
4.10 Effect of Sphere Radius on Pressure-Time 141
History
4.11 Effect of Liquid Compressibility on Pressure- 142
Time History
4.12 Effect of the Sphere Initial Temperature 143
on Pressure-Time History using the Acoustic
Approximation
4.13 Effect of the Water Pool Temperature on the 144
Pressure-Time History using the Acoustic
Approximation
4.14 Effect of Sodium Pool Temperature on the 148
Pressure-Time History of the Film Growing
at a Stainless Steel Sphere
4.15 History of Vapor Film Growth 150
4.16 Effect of Sodium Pool Temperature on 151
Rate of Heat Transfer From the Hot Sphere
4.17 Effect of Sodium Pool Temperature on 152
Rate of Vaporization
4.18 Effect of Sodium Pool Temperature on 155
the Pressure-Time History of a Film
Growing at a UO2 Sphere
4.19 Effect of Initial Sphere Temperature 156
on Pressure-Time History
4.20 Effect of Sphere Material Properties on 157
Pressure-Time History
5.1 Comparison of the Effect of Water Pool 176
Temperature on the Fragmentation in Water
and on the Maximum Subatmospheric Pressure

10
Page
Reduction in a Vapor Film Growing
Around a Hot Particle in Water
5.2 Comparison of the Effect of Sodium Pool 178
Temperature on the Fragmentation of Stainless
Steel in Sodium and the Maximum Subatmospheric
Pressure Reduction in a Vapor Film Growing
Around a Stainless Steel Particle in Sodium
5.3 Comparison of the Effect of the Initial 181
Temperature of the Hot Material on the
Fragmentation in Water and the Maximum
Subatmospheric Film Pressure Reduction in
Water Pool at 200C
5.4 Comparison of the Observed Fragmentation 183
Behavior in 200C Water with the Stable
Film Criterion
5.5 Comparison of the Observed Fragmentation 185
Behavior in 250 0C Sodium with the Stable
Film Criterion
D.1 Illustration of Options for Film Boundary 211
Temperatures
D.2 Results of the Calculations of the First 213
Pressure Pulse using Integral and Finite
Difference Approximations to Describe the
Heat Transfer
G.1 Data from Literature Compared to 233
Predictions of Berenson
G.2 Data from Literature Compared to 234
Predictions of Spiegler et al.
G.3 Data from Literature Compared to 235
Predictions of Kalinin et al.

Data from Literature Compared
Predictions of Henry
Comparison of the Predictions
Correlations with the Data of
a Ta Sphere in Sodium
Comparison of the Predictions
Correlations with the Data of
for Ag Sphere in Water
to
of Different
Farahat for
of Different
Stevens et al.
P-V-T Diagram of a Pure Fluid
Determination of the .Spontaneous
Nucleation Temperature of Sodium
Determination of the Spontaneous
Nucleation Temperature of Water
G.5
11
Page
G.6
H. 1
H. 2
H.3
236
237
238
240
245
246

12
LIST OF TABLES
Table No. Page
3.1 Summary of the Varied Conditions 83
in the Investigated Cases
4.1 Experiments of Quenching of Spheres 98
in Subcooled Coolants
4.2 Values of the Parameters Varied for 129
the Cases of Hot Spheres in Water
4.3 Values of the Parameters Varied for 146
the Cases of Hot Spheres in Sodium
5.1 Suggested Mechanisms of Free-Contact 165
Fragmentation
5.2 Comparison of Spontaneous Nucleation 171
Temperatures of Sodium and Water with
Temperatures at the Interface of
some Molten Materials
B.1 Comparison of the Exact and Approximate 202
Film Temperatures
G.1 Summary of Correlations for Prediction of 228
Minimum Wall Temperature to Stabilize
Film Boiling
G.2 Experimental Data on Minimum Wall 231
Temperature to Stabilize Film Boiling
G.3 Values of Predicted and Observed Wall 232
Superheats for Data Summarized in Table G.2
H.1 Values of Negative Pressures Required for 248
Cavitation

13
NOMENCLATURE
A surface area, a constant or coefficient
A Avogadro's Number
B constant characteristic pressure of a compressi-
ble liquid (Eq. 4.32)
B compressibility coefficient
C specific heat, sonic velocity or a coefficient
Cp specific heat, at constant pressure
H enthalpy or kinetic enthalpy
G perfect gas constant
L length of constraining sodium (Chapter 3)
K coefficient
M mass or molecular weight
P pressure
PC* ambient pressure
P(T) saturation pressure at the temperature T
Q total heat content
R radius of sphere
R radius of the film/liquid interface (Chapter 4)
S cross sectional area of flow (Chapter 3)
T temperature
Tsat saturation temperature
T* minimum temperature of a hot wall to sustain
film boiling

14
U velocity
V volume
W mass of fuel/gm of interacting sodium (Chapter 3)
or work of formation of a vapor nucleus (App. H)
Y generalized variable in Chapter 4
Z length of the interaction zone in Chapter 3
a coefficient
c specific heat or sonic velocity
g conversion factor
h specific enthalpy
h* heat transfer coefficient
hfg heat of vaporization
h(T) specific enthalpy at the saturation temperature T
k thermal conductivity or Boltzman's constant
m mass of one molecule
n adiabatic index (for a perfect gas = C p/C V)
q" heat flux
r radius
t time
tm characteristic time for fuel surface area
generation in Chapter 3
u radial velocity at any radius r
v specific volume

15
a thermal diffusivity
a' thermal expansion coefficient
8 isothermal compressibility
Y negative pressure required for cavitation
6 film (blanket) thickness
A thickness of the thermally active region
in the liquid (Chapter 4)
emissivity of radiative heat
accommodation coefficient
A thickness of the thermally active region in
the sphere (Chapter 4) or heat of vaporization
of one molecule (Appendix H)
y. viscosity
p density
a surface tension
Subscripts
b blanket
c defined at the center of the sphere
cr critical thermodynamic value
f film
g gas
gb blanket gas
in at the interface

16
h hot sphere (Chapter 4)
hi initial value for the hot sphere
z liquid
ki initial value for the liquid
tv at the liquid/vapor interface
m.p. at the melting point
r radiation
R at the radius R
s sodium
s.n. spontaneous nucleation
u fuel (UO2)
v vapor

Chapter One
INTRODUCTION
1.1 Molten Fuel-Coolant Thermal Interaction
in LMFBR Safety Analysis
1.2 The Physical Mechanisms Involved in
Explosive Thermal Interactions
1.3 The Present Work
17
Page
18
19
21

18
Chapter One
INTRODUCTION
1.1 Molten Fuel-Coolant Interaction In LMFBR SafetyAnalysis
In the current approach to safety analysis. of the
liquid metal fast breeder reactor (LMFBR), considerable
attention is being given to the possibility and consequences
1-3of thermal interaction of molten fuel and sodium
The consequences of molten fuel-coolant interaction have
a larger degree of uncertainty than other key phenomena
of interest to LMFBR safety. Thermodynamically, as much
as 30% of the thermal energy of the molten fuel may
be converted to mechanical work by the transfer of heat
from the fuel to sodium . The possibility of producing
such a high thermal-to-mechanical energy conversion ratio
has been demonstrated in small scale laboratory experiments
involving injection of an amount of sodium into molten
fuel5. However, such high energy conversion ratios have
not been observed in each case in which molten fuel and
sodium were brought into contact. The pressure pulses and
mechanical work generated by molten fuel-sodium thermal
interaction seem to depend on the conditions of contact
between the molten fuel and sodium. An understanding of
the basic physical mechanisms involved in the thermal
interaction process is required if an accurate assessment
of the influence of the contact conditions on the consequences

19
of molten fuel-sodium thermal interaction is to be made.
The possibility of producing energetic thermal
interactions is not a pecularity of LMFBR materials.
Rapid generation of high pressure and mechanical energy
has been observed in accidents and experiments involving
other hot molten materials and coolants, as will be
reviewed in Chapter 2. Such occurrences are often called
thermal explosions or vapor explosions. At present,
there is no consensus of opinion about the sequence of
physical events leading to such explosions.
1.2 The Physical Mechanisms Involved In Explosive ThermalInteractions
The sequence of physical events leading to explosive
pressure generation when a hot liquid contacts a relatively
cold liquid is not yet completely understood. Two
plausible theories have been advanced:
11 Fragmentation-Induced Explosive Interaction
In this theory the explosive pressure gener-
ation is due to rapid heating of a constrained
volume of the cold liquid. The rapid heat
transfer is facilitated by an increase in the
heat transfer surface area when either of the
two fluids is fragmented and is dispersed in
the other fluid 6 -8
2] Nucleation-Induced Explosive Interaction
In this theory the explosive pressure generation

20
is due to superheating the cold liquid to the
temperature at which spontaneous nucleation
9-11occurs~. Vaporization by spontaneous nucleation
is rapid enough to cause high pressure pulses.
In this case the heating rate of the cold liquid
is not controlling as long as the liquid can
be heated to the temperature required for
spontaneous nucleation.
Fragmentation of molten UO2 as it contacts sodium
has been observed at several laboratories12,13 If the
thermal energy of the dispersed UO2 fragments is trans-
ferred to a constrained volume of sodium, large pressure
pulses and potentially damaging mechanical work can be
developed. This is the picture depicted in the Parametric
Model for Fuel Coolant Interaction developed at Argonne
National Laboratory (ANL-FCI)l4'v79. Parametric studies
using the ANL-FCI model have identified several conditions
that can prevent the development of high pressures and
mechanical work. These conditions include:
1. Limiting the amount of UO2 and sodium that
actually interact.
2. Making available a large expansion volume for the
heated sodium.
3. Limiting the heat transfer rate from the fuel
to sodium, which can result from either high
thermal resistance or limited interface area
between the fuel and sodium.

21
For nucleation-induced vapor explosions to occur in
a UO2 /Na system, the sodium must be confined in a zone
such that it can be heated up to the spontaneous nucleation
temperature. Sodium confinement is necessary since the
interface temperature obtained by sudden contact of UO2
and sodium is far below the spontaneous nucleation
temperature of sodium . Additionally, the availability
of nucleation sites at the molten UO2/liquid Na interface
or within the sodium will prevent the development of highly
superheated sodium. The requirements that the sodium
be confined and that nucleation sites be unavailable
highly restrict the conditions under which nucleation-
induced explosive pressure generation can develop in an
LMFBR accident.
The relative roles of both of the afore outlined
theories for explosive thermal interactions in the varied
configurations of fuel-sodium contact conditions of interest
for LMFBR safety analysis is still to be determined.
1.3 The Present Work
The objective of the present work is two-fold:
1 Assessment of the effect of gas/vapor blanketing
of the fuel on the pressure pulses and mechanical
work that can be generated by a fragmentation-
induced vapor explosion.
2] Identification of the physical mechanism inducing

22
the fragmentation of the molten fuel as it
contacts sodium.
The assessment of the effects of gas/vapor blanketing
on the thermal interaction is made by modification of the
ANL Parametric Model for Fuel-Coolant Interactions. In
the original model the thermal resistance to the heat
flow from the fuel was assumed to be only that of the fuel
fragments. Such an assumption is highly conservative if
the fuel fragments become blanketed by non-condensable
gases released from the fuel pins or by sodium vapor.
The formulation of the modified model and the results of
its application to various cases are presented in Chapter 3.
The physical mechanism leading to fragmentation of the
molten fuel as it contacts sodium has not been previously
identified. In Chapter 5, the fragmentation mechanism
is investigated. In this investigation use is made of
experiments involving the fragmentation of several
molten materials in different liquids. Additionally,
use is made of the results of an analytic model developed
in the present study to describe the dynamic growth of a
vapor film around a spherical particle.
It is hoped that the results of the present work
will be useful in the realistic assessment of the conse-
quences of thermal interaction of molten fuel and sodium
under LMFBR accident conditions.

23
Chapter Two
LITERATURE REVIEW: STUDIES OF THERMALINTERACTIONS OF HOT MOLTEN MATERIALS
AND COOLANTS Page
2.1 Introduction 24
2.2 Experimental Studies 24
2.2.1 Incidents of Explosive Thermal Interaction 25
2.2.2 Experiments of Discharging Large Amounts of 26Hot Molten Materials Into Coolants
2.2.3 Shock-Tube Experiments 28
2.2.4 Experiments of Dropping Small Amounts of Hot 29Molten Materials in Coolants
a. In Sodium 30
b. In Water 34
C. In Other Coolants 50
2.2.5 Experiments of Injection of Small Amounts of 50Coolants Into Hot Molten Materials
2.2.6 In-pile Experiments of Fuel-Pin Failure 51
2.3 Theoretical Studies 53
2.3.1 Thermodynamic Models 54
2.3.2 Rate Limited, Parametric Models 55
2.3.3 Accident Dependent Models 58
2.3.4 Theoretical Studies on the Mechanism of 60Fragmentation

24
Chapter Two
LITERATURE REVIEW: STUDIES OF THERMAL INTERACTIONSOF HOT MOLTEN MATERIALS AND COOLANTS
2.1 Introduction
The purpose of this review is to give a comprehensive
summary of experimental and theoretical studies presently
available in literature related to the nature and conse-
quences of thermal interaction of molten fuel and sodium.
The volume of the published studies on the thermal inter-
action of molten UO2 and sodium is small but rapidly expanding
because of the emphasis in many countries on the development
of LMFBR for future production of electrical energy.
Additionally, extensive studies on thermal interaction
of other hot molten materials and coolants have been
undertaken through safety programs of other types of reactors
as well as of non-nuclear industries. While this review
is not intended to be inclusive of all studies on thermal
interactions of hot and cold liquids, an attempt is made
to summarize the pertinent results of such studies.
2.2 Experimental Studies on Thermal Interactions of HotMolten Materials and Coolants
The experimental studies reviewed here have been largely
conducted in the U.S.. Results of several experiments
conducted abroad are in general agreement with the U.S.
findings. Active international experimental programs
related to fuel-sodium interactions have been reported
at the CREST Meeting on Fuel-Sodium Interaction at Grenoble,

France in January 1972. A summary of the presented papers
can be found in Ref.15. Where differences with the U.S.
experimental results exist, the results of the non U.S.
work are included here.
2.2.1 Incidents of Explosive Thermal Interactions
The production of explosive pressures when a hot
molten material contacts a liquid was reported as early
16as the 19th century. Percy reported in 1864 the occurrence
of such accidents in the metal refining industry. As
recently as 1966 Lipset reported an explosion when about
100 lb. of molten steel dropped accidentally in a shallow
trough containing about 750 gallons of water. Several
other incidents involving spillage of molten metals and
paper smelt (fused sodium carbonate) onto wet surfaces
have been documented by Epstein and Witte et al'.
In some nuclear reactor incidents and destructive
tests the observations seem to be well explained by the
occurrence of energetic thermal interactions between
molten nuclear fuel and the coolant. A comprehensive
summary of the causes and observations of such accidents20and tests has been given by Thompson2. The first thermal
interaction between molten nuclear fuel and reactor coolant
may have been obtained in 1952 as a result of the core
meltdown accident of the Canadian NRX test reactor.
Although several mechanisms may have contributed to the
destructive energy release (nuclear energy release, chemical

26
energy release, and thermal metal-water interaction),
Hurst2 1 concluded in his analysis of this accident that
the damage to the calandria tubes was a direct result of
either uranium-steam or uranium-water interaction and was
not nuclear or chemical in nature. Dietrich22 attributed
the high pressures (probably - 10,000 psi) observed in the
BORAX-I destructive test to the contact of molten metallic
fuel elements and water coolant. He found no evidence
of chemical reaction, although some of the fuel elements
that had melted appeared as spongy globules. Kettel et al.2 3
postulated that vaporization of Nak (coolant) entrained in
the molten fuel produced the spongy structure observed in
the EBR-I meltdown accident. Several other studies have
shown that the explosions observed in the SL-1 accident
and the SPERT-lD destructive test were most likely the
result of rapid generation of vapor from contact of water
and molten metals24-26
2.2.2 Experiments of Discharging Large Amounts of HotMolten Materials into Coolants
The occurrence of explosions in the nuclear and non-
nuclear industries led to several experimental programs
concentrating on the mechanisms involved in the inter-
actions of molten materials and coolants. Elgert and27 28 6Brown , Higgins and Long observed explosive interactions
when molten metals were discharged in water. The extent
of chemical reactions involved, as evidenced by post-test

27
examination, did not justify the intensive pressure
generation. Epstein2 9 showed that the kinetics of chemical
reactions between metals and water make the development of
some of the observed rapid generation of high pressures
impractical by chemical means.
In the experiments of Long6 involving the discharge of
50 lbs of aluminum in a water tank, explosions were
prevented when the bottom of the tank was coated by grease,
oil or paint. Long concluded that the explosions were a
result of rapid heat transfer from aluminum fragments to
water, and that aluminum fragmentation was the result of
vaporization of a small amount of water entrapped between
the molten aluminum and the bottom of the tank. Experi-
ments with magnesium produced similar results. However,
when a mixture of molten sodium chloride and potassium
chlorid was poured into water, explosions could not be
prevented by grease coatings of the water tank. No
explanation was provided by Long for the difference in
behavior of a salt/H2 0 system from a metal/H2 0 system. Long's
findings from the Al/H 20 experiments were further supported
30 31by Hess and Brondyke . Sallack , after experiments of
paper smelt quenched in green liquor, proposed that spontan-
eous fragmentation of the quenched molten material results
from vaporization of liquid entrained in cracks in the
solidified surface of the smelt.

28
2.2.3 Shock Tube Experiments
Several types of experiments were conducted at TRW
Space Technology Laboratories in order to determine the
mechanism of creating high pressure levels during a nuclear
reactor transient. The earliest tests used a flat plate
fuel element and the KEWB reactor as a pulsed heating
32source . Another group of experiments employed a stain-
less steel electrical heater which could achieve more rapid
thermal transients than the ractor heat source . These
tests indicated that the pressures generated by vaporization
of water by heat fluxes from solid surfaces are relatively
low and further reduced if non-condensable gases were present
34in the system. Later, Wright conducted experiments in-
volving the use of a shock tube, in which a column of
water impacted hot materials held in the bottom of the
tube. The water column was 3 ft long and was initially
held above the hot material by a diaphragm. Solid and
molten aluminum, silver and UO2 Powder were used as heat
sources. The impact of the water column on solid metal
resulted in low pressure generation. The impact of the
water column on molten materials resulted in the generation
of pressures as high as 5800 psi and the dispersion of
part of the molten materials as fine fragments. The peak
pressures would increase as the temperature of the molten
metal was increased. The time rise of the pressure was
within 0.5 msec from the initial contact of the metal and

29
the water. The peak pressures observed in the UO2
powder experiments were lower than those with molten
aluminum (same temperature of UO2 and Al). This was
attributed to the existence of compliant space in the
discontinuous UO2 material as well as the lower thermal
conductivity of U0 2 *
The results of Wright's shock tube experiments have
been supported by the recent European experiments of
Hillaryl5 and Darbyl5. In those experiments, the presence
of non-condensable gases in the interaction zone at a
pressure of 1 cm Hg prevented the fragmentation of the
molten material and inhibited the explosion.
Shock tube experiments employing a sodium column have
been reported by Holtbecker et al.15 . The hot molten material
in the reported experiments was alumina at 2670 0K.
Repeated pressures of small magnitude have been observed.
Molten UO2 instead of alumina is to be used as a heat source
in future experiments.
2.2.4 Experiments of Dropping Small Amounts of Hot MoltenMaterials in Coolants
The fragmentation of hot molten materials in the form of
small drops as they contact relatively cold liquids has been
observed at several laboratories. A detailed summary
of the results of these experiments in included here since
these results provide evidence on the nature of the
mechanism inducing the fragmentation of molten

30
UO2 on free contact with sodium (Discussed in Chapter 5).
The data from these experiments is summarized here as
quantitatively as could be obtained from the reported
literature. The hot drop temperature is usually given at
the initial time of dropping and not at the time of actual
interaction with the coolant. The drop temperature of
interaction would be less than the initial temperature due
to cooling during both the fall through the gaseous
atmosphere and also through the coolant depth.
2.2.4-a Experiments in Sodium
Experiments of dropping small amounts of materials
in a sodium pool have been conducted at ANL by several
12,35-37investigators1. Figure 2.1 summarizes the results
of these experiments. The effect of the initial temperature
of stainless steel on the size of resulting fragments 37 is
shown in Fig. 2.2. Early qualitative observations 36of
dropping 22000C stainless steel into sodium at 250, 450,
600, 700 and 8200C indicated an enhancement of fragmentatinn
with the increase in the sodium temperature. This conclusion
is supported by the more recent quantitative results of
12Armstrong (shown in Fig. 2.3) and the qualitative observations
of Amblardl3
With the increase in the sodium pool temperature from
2000C to 4000c the peak pressure in the sodium pool as
12observed by Armstrong increased from 350 psi to 635 psi.
The pressure transducer did not operate in 6000C sodium.

31
x I
0200C- Na X xSPONTANEOUSXNUCLEATIONTEMPERATURE
185 0*C
100CH_ SODIUM BOILING
TEMPERATURE = 88O0 C
-40
0
1000 2000
MELTING POINT OF DROP MATERIAL, *C
1. OBSERVED IN EXPERIMENTS IN WHICH "u 1 cm UO2 WAS DROPPEDIN SODIUM AT 200, 400 and 600*C (REF. 12)
FIG. 2.1: RESULTS OF DROPPING VARIOUS MATERIALS INTOSODIUM (REF. 36)
SODIUM TEMPERATURE = 250*CDROP VOLUME 0.3 cm 3
HEIGHT OF DROPPING = 2 ft.

32
ORIGINAL DROPDIAMETER- I
SODIUM TEMP.
DROP VOLUME
HEIGHT OFDROPPING
= 250'C
" .3 cm3
= 2 ft.
II.III
M.P. OFSTAINLESS STEEL
1500
z
0
mw
H-
2000
INITIAL TEMPERATURE OF STAINLESS STEEL, 0C
FIG. 2.2: EFFECT OF INITIAL TEMPERATURE OF STAINLESS STEELON MEAN DIAMETER OF FRAGMENTS (REF. 37)
300
200 1-
I
S
100
I
I
- ..... 0 -. it_ _i

DROP
9
0AA
MATERIAL
UO2
UO2
SS
SS
SS
INITIAL
RESIDUE
EJECTED
RESIDUE
EJECTED
RESIDUE
TEMP.
29000C
2900 0 C
1800 0 C
18004C
22000 C
0
-0
0
*A
400 boo
SODIUM TEMPERATURE, 0C
FIG. 2.3: MEAN DIAMETER OF RESIDUE AND EJECTED U02 ANDSTAINLESS STEEL FRAGMENTS AS A FUNCTION OFSODIUM BATH TEMPERATURE (REF. 12) (HEIGHTOF DROPPING NOT REPORTED)
33
A
I0
4000 "-
3000 I-
z
cl)2000 1-
500
400
300
c.'J0
200
1001000
200
I
I I

34
The results of the sodium experiments indicate:
1. Initially solid hot materials do not fragment into
sodium.
2. Some degree of sensible heat is required above
melting, for fragmentation to occur.
3. At a fixed sodium pool temperature, fragmentation
of stainless steel is enhanced by the increase in
the initial drop temperature.
4. For a fixed initial drop temperature, fragmentation
of stainless steel is enhanced by the increase in
the temperature of the sodium pool, within the
tested range of 200 to 820 0C. The experiments of
UO2 are less definitive in this respect.
2.2.4-b Experiments in Water
Water has been the most extensively used coolant in
dropping experiments. In their experiments Swift and Pavlik35,36
found some of the molten metals will not fragment in water,
as shown in Fig. 2.4. Ivins observed an enhancement of
the fragmentation with the increase in the "Weber Number"
of the drop. The Weber Number is a measure of the ratio
of the inertial forces resisting the motion of the drop
to the forces of its surface tension. The Weber Number
is defined as N = pDV2/ where p is the coolant density,
D is the drop diameter, V is the velocity of the drop as
it contacts the coolant and i is the interfacial surface
tension. The existence of a Weber Number effect is an

35
REMAINED INTACT
FRAGMENTED
REMAINED INTACTAT WATER TEMP.6000
WATER TEMPERATURE = 0*C
DROP VOLUME n, .3 cm3
DROPPING HEIGHT 2 ft.
00
H
0
c'j
C.0
CY-)
HE-
0c'j
0.- o0
rl F~
p'~:
I'
F
50
U0
E-
:E:
HHH
1000
MELTING POINT OF DROP MATERIAL, 0C
FIG. 2.4: RESULTS OF DROPPING VARIOUS MATERIALS IN WATER(REF. 36)
0
20 CRITICAL
'EMPERATURE3730C
bo
2000 [-
1000 |-
~Li
xx
co 2-a, ow,
00
I I

36
indication of the influence of a hydrodynamic mode of
4ofragmentation. Hinze has analyzed this mode of fragment-
ation and shown that the initial forces around a deformable
drop may overcome the surface tension of a drop at a
critical Weber Number. The fragmentation of mercury in
water under isothermal conditions in the experiments of
38 15Ivins and Delhaye verify the influence of this mode of
fragmentation (See Fig.2.5). The experiments of gallium
(See Fig. 2.6) indicate, however, that the Weber Number
effect is not the only mechanism inducing fragmentation
when the coolant temperature exceeds its boiling point.
The dependence of the extent of fragmentation of the
initial temperature of the hot sphere and the temperature
of the coolant for different molten materials dropped in
12,3water has been studied by Cho ,39 Cho's experimental
results are shown in Fig. 2.7 thru Fig. 2.11.
The results of ANL experiments in water can be summarized
as follows:
1. Some materials that fragment in sodium do not
fragment in water, e.g. Ag and Au.
2. Some but not all molten materials fragment in water.
3. The fragmentation of the hot molten material is
influenced by two mechanisms: a hydrodynamic
mechanism and a thermal mechanism.
4. Fragmentation of the hot material is enhanced by

37
800
400
200
100
N
N
40
20
10
* MERCURY (250C)
14 A LEAD (6000 C)
0 BISMUTH (600 0 C)2 - Y TIN (6000 C) -
I t Iii I I I I
2 4 10 20 40 100
NUMBER OF FRAGMENTS
FIG. 2.5: EFFECT OF THE WEBER NUMBER ON FRAGMENTATIONOF MOLTEN DROPS IN WATER (REF. 38)

38
(EACH POINT IS AVERAGE OF FIVE EXPERIMENTS OFFRAGMENTATION OF 0.37 cm DIA. DROPS)
5.3
I I I _ I I I24.8M. P.OF Ga
100 200 300 400 500 600
INITIAL GALLIUM TEMPERATURE, 0C
FIG. 2.6: FRAGMENTATION OF LIQUID GALLIUM IN 300C WATER(REF. 38)
20E-4
0
10

1"
400 600 800 1000INITIAL TEMPERATURE OF MOLTEN TIN, *C
FIG. 2.7: FRAGMENTATION OF MOLTENWATER (REF. 12)
TIN QUENCHED IN 220 C
39
EbO
1000
800
o 600
400
200
0
ENTRANCEVELOCITY,cm/sec
A 99o 244
* 489
* 773
WEBERNUMBER
7.5-9.046-55
200-220
430-54oa
0
I Ii
I

40
DROP DIAMETER = 0.34-0.52 cm
WEBER NUMBER = 6.1 -9.4
400
200
400
200
0 1 1 1 I I 1
200 400 600 800
INITIAL TEMPERATURE OF MOLTEN TIN, 0C
FIG. 2.8: EFFECT OF WATER SUBCOOLING ON FRAGMENTATION OFMOLTEN TIN IN WATER. (REF. 12)
bD
0
CL4

41
600 "A-AJ -Vwa e
64*c600 -U~~/~A x --
40 400N
500
rz
~ 400
o 220
S3000e
200
500C A
100 A A
400 500 600 700 800INITIAL TEMPERATURE OF BISMUTH, *C
FIG. 2.9: EFFECT OF WATER TEMPERATURE ON FRAGMENTATION OFMOLTEN BISMUTH IN WATER (REF. 39) (MELTING POINTOF BISMUTH 2710C)

SYMBOL WATER TEMP.
40C
22*C
A 500C* 88*C
DROP DIA. = 0.23-0.48 cm
WEBER NO. = 12.9-27.1
500F
4001
300
200
100
A
A
M.P. OF AgC1
If500 600 700 800
INITIAL TEMPERATURE OF AgCl, *C
FIG. 2.10: FRAGMENTATION OF AgCl IN WATER (REF. 39)
42
600
eib
C'2
z
0
IE
0
04
i I I I

DROP DIAMETER = 0.29-0.45 cm
WATER TEMPERATURE = 220C
WEBER NUMBER = 6.6-10.7
0
0
0
0
Clj
C~4
0
M.P. OF LEAD
4,400 500 600
INITIAL TEMPERATURE OF LEAD, *C
FIG. 2.11: FRAGMENTATION OF MOLTEN LEAD IN WATER (REF. 39)
43
140 1~
0 0
120
100
80
60
0
40
700|II I I

44
an increase in the water subcooling (decrease in
the water temperature)
5. The extent of fragmentation does not follow a
consistent pattern when the initial temperature
of the hot drop is increased. The observed Sn
behavior indicates the existence of a range of
initial drop temperatures for which fragmentation
is greatly enhanced. This is supported by the
behavior of Bi in 500 water and to a less extent
in the experiments with Ga. The experiments of
Pb, Bi in 40C and 220C water and AgCl in 40C and
220C water show a monotonic increase in the area
of fragments with the initial drop temperature.
Based on the early ANL experiments, Swift and Pavlik 35
advanced the hypothesis that fragmentation is associated
with the violence of vapor bubble growth and collapse in
the .nucleate and transition regions of boiling. Thus they
expected materials of melting points above the critical
temperature of a coolant not to fragment when dropped in
that coolant. This criterion was based on the assertion
41by Westwater that bubbles can not be formed at a surface
whose temperature is higher than the critical temperature
of the liquid. This criterion, however, does not explain
the fragmentation of UO2 in sodium (Fig. 2.1) or AgCl in
water (Fig. 2.10).

45
In the experiments at University of Kansas42,43 o
which only qualitative results have been reported, molten
Al, Pb, Sn, Bi, Zn, Cu, Hg and Wood's Metal were dropped
in water. The results support the observations made at ANL
of enhanced fragmentation with the increase in the drop
Weber Number and with the decrease in the water pool temp-
erature. However, the fragmentation of tin seems to be
enhanced with the increase in the initial drop temperature
for all the range of tested temperatures (23200 - 9500C).
No other metal was tested for such a wide range of tempera-
tures. The following additional observations have been
reported by the investigators at University of Kansas
1. There is no evidence of any violent boiling
around the hot drops. In the most violent
cases fragmentation takes place almost
instantaneously upon contact of the metal and
water.
2. Fragmentation takes place as an outward burst of
the metal. The residues in many cases had a spongy
appearance (Fig. 2-12).
3. Many aluminum drops swelled, while under water, into
hollow thin-shelled "bubbles". Some of these
"bubbles" would burst subsequently (Fig. 2.12).
4. A 50% decrease in the surface tension of molten Al
(by the addition of 1% Bi) resulted in a greater
tendency for fragmentation, although no actual

46
Fig . 12. c Aluminum bubble that burst outward. Scale line shownrepresents - cm.
F ig. 12 . a Series of frames from film taken of the fragmentationof a lead sample. The frames are 220 ysec apart. Scale lineshown represents 2 cm.
Fig. I 2. d Aluminum bubble showing what appears to be interioraluminum that was forced through the outer shell. Scale lineshown represents j cm.
Fig.12.b Aluminum bubble thatrepresents i cm.
collapsed. Scale line shown Fig. 12.. Interior of completely mossy lead after fragmentation.Scale line shown represents I cm.
Fig. 2.12 Some pictures from the fragmentationexperiments of Ref. 42 .
to

47
explosion occurred.
5. Increasing the viscosity of water approximately
five times, by the addition of powdered carboxy-
methylcellulose, greatly reduced if not prevented
the fragmentation of the molten metals.
The experiments were interpreted by the investigators
to give evidence of fragmentation due to encapsulation of
coolant inside the hot drop as a result of formation of
surface instabilities (Helmholtz Instabilities). Other
mechanisms have also been proposed for encapsulation of a
coolant by a colliding dropl3,31,44
13The results of the Grenoble experiments indicated
that UO2 does not fragment in water. Based on the results
of their water and sodium experiments the investigators
concluded that UO2 fragmentation in sodium may be due to
two main causes: encapsulation of coolant in UO2 drops
and/or stresses of thermal origin due to high thermal
gradients at the drop surface.
Experiments conducted at University of Houston45
confirmed in general the observations (but not conclusions)
of the afore mentioned dropping experiments. In the
experiments involving injection of molten metallic jets
in water the following observations have been made 6
1. The fragmentation seemed to be sensitive to the
surface temperature, more so than the bulk temp-
erature, of the molten jet.

48
2. The blanketing of the jet with a thick vapor
shield prevented the initiation of fragmentation
from the shielded portion of the jet.
3. "Several of the observed explosions (fragmentation)
were preceded by a noticeable bulge in the jet
at the point where the explosion (fragmentation)
subsequently occurred." This observation is similar
to the aluminum swelling phenomenon observed by
Flory et al. .
In an effort to identify the fragmentation mechanism,
the investigators at University of Houston conducted several
experiments on transient film boiling and transition boiling
around spheres in water 4 . The boiling experiments revealed
a phenomenon of very rapid (within 250 microseconds) collapse
of the vapor film when the sphere temperature can no longer
sustain stable film boiling. The rapid collapse of the film
has been suggested as a possible mechanism inducing the
fragmentation .
al4 8Board et al. have recently reported several experi-
ments involving the fragmentation of molten tin in water.
In the first type of experiments a few grams of tin were
dropped from 2-5 cm above an open tank of water about
30 cm deep. It was found that fragmentation occurred only
if both the tin temperature was initially above 4000C and
water pool temperature was below 600c. They reported an
explosive interaction between tin at 8000 and water in

49
200C. The observations from the fast motion pictures
(8000 frames per second) and the pressure pulses indicate
a sequence of four interactions with increasing violence
took place. In each case the approximately spherical
bubble-like region of two-phase coolant and debris would
grow and then contract slightly before the next inter-
action. In a second class of experiments molten tin
was introduced in water under reduced pressure. When
the external pressure was increased fragmentation with
pressure pulses took place. In a third type of experiments
a mechanical disturbance was applied to the otherwise
stable situation of a tin drop supported on a crucible
under water at 800C. The disturbance was in the form of
an impulse transmitted via a. steel rod to the loosely-
mounted crucible. This resulted in some cases in ex-
tensive fragmentation and large pressure pulses. It
was shown by a separate experiment with a similarly
sized drop of Bi-Pb-Sn-Cd (melting point 700C and hence
molten at the water temperature) that the impulse was
not sufficient to cause any dispersion. The investi-
gators conclude that:
1. Fragmentation is triggered by a mechanism that
leads to unstable film boiling between the two
liquids. This can be produced by transition
boiling or some other mechanism depending on
the operating conditions.

50
2. There is a cyclic escalation for the fragmentation
(and associated pressure pulses), that is a small
perturbation causes a mild fragmentation which
then leads to more intensive interaction.
3. Vapor collapse seems to be the main cause of
dispersion in thermal interactions. This is
possibly done by a small jet of coolant
penetrating the molten material and producing
fine dispersed coolant in the molten material
leading to the fragmentation.
2.2.4-c Experiments with other coolants
No fragmentation resulted when molten Bi, Sn, Pb, Hg
35,43,45and Al were dropped in saturated liquid nitrogen
Stainless steel is reported to fragment in potassium,
mercury and lithium in Swift and Pavlik's experiments.
They did not report, however, the temperatures involved
in the experiment.
2.2.5 Experiments of Injection of Small Amounts of CoolantsInto Hot Molten Materials
Several experiments involving the injection of small
amounts of water (1-5 ml) at room temperature into various
molten materials (50 ml in 1" dia steel crucible) were
12performed at ANL . The water was injected above as well
as under the surface of the molten material. In some cases
explosions developed. The dynamics of the mixing of water
and the transparent molten sodium chloride was studied by
49high speed motion (2500 frames per second) motion pictures.

51
The explosions, when resulting, would take place after a
delay time of several hundred milliseconds, but would
develop within one frame (400 ysec). A gas layer between
the two fluids seemed to prevent the consistent development
of an explosion50 . Limited number of experiments of injection
of small amounts of sodium (,%j 0.2 ml) in molten UO2
(5 -7 ml) have also been conducted at ANL5 . Explosions
developed in some cases. Again a delay period of a few
hundred milliseconds was observed. Anderson and Armstrong
hypothesized that the observed explosions result from
fragmentation of the coolant followed by extremely rapid
mixing with the molten material. Fauske 11 , while not
excluding the possibility of initial fragmentation of
sodium, suggested that the explosions observed in the
U02 /Na injection experiments result from spontaneous
nucleation of superheated sodium. Spontaneous nucleation
of the cold fluid has been suggested by Nakaniski and Reid9
and Enger et al. 10 to explain the observed explosions when
a cryogenic hydrocarbon is spilled on relatively hot water.
2.2.6 In-Pile Tests of Fuel Pin Failure
Fuel pin failure experiments involving molten
fuel-coolant interactions have been performed under thermal
reactor safety studies51-53 as well as the LMFBR safety
analysis program54-59. The Transient Reactor Test Facility
(TREAT) has been used for the on-going LMFBR fuel pin
failure studies. These experiments have supplied data on

52
the threshold of fuel pin failure, movement of fuel and
coolant under transient conditions as well as post-failure
effects of fuel-sodium interactions. The stagnant sodium
piston-autoclave tests (S-series) of ANL have been
specifically designed to give information on the pres-
sures and mechanical energy that can be generated by
molten fuel-sodium interactions under situations simu-
lating an accidental over-power transient in LMFBR. The
fuel melting and pin failure are produced by a nuclear
power pulse. The subsequent molten fuel-sodium inter-
action has been observed to result in extensive fuel
fragmentation and a series of pressure pulses. The
results indicate that the nuclear-to-mechanical energy
conversion ratios obtained under such conditions are
several orders of magnitude less than the maximum thermo-
dynamic limit of 30%4. Similar low energy conversion
ratios have been observed in experiments with flowing
sodium (E and H series) 59 . The energy conversion
ratios of the U02/Na pin failure experiments are com-
parable to the observed ratios of UO2/H2 0 pin-failure
52experiments at low values of specific energy inputs
At an energy input of 720 cal/g-UO2, however, a conver-
sion ratio of 2.8% was reported for water5 3; two orders
of magnitude higher than the observed ratio in U02/Na
experiments with the same specific fission-energy input.

53
The limited results of the S-series experiments also
suggest that the presence of the He-bond gas in the
fuel pin reduces the mechanical energy produced by the
interaction.
The available limited results of th e pin-failure
experiments suggest that large scale vapor explosions
may not be feasible under reactor conditions. Such a
conclusion remains to be verified by experiments simu-
lating other conditions of molten fuel-sodium contact
(e.g. sodium re-entry conditions) as well as by analytic
studies on the factors affecting the mechanisms involved
in energetic thermal interactions.
2.3 Theoretical Studies on Thermal Interactions of
Molten Fuel and Sodium
Most of the theoretical work to date has been aimed
at calculating the pressures and mechanical work re-
sulting from the thermal interaction of molten fuel and
sodium. Some work has been aimed at studying the
possible mechanisms involved in the fragmentation of
molten fuel. Both types of work are reviewed here.
The theoretical assessment of the consequences of
thermal interactions of molten fuel and sodium has
developed in three distinct approaches:
1. Thermodynamic Models

54
2. Rate-limited, parametric models
3. Accident Dependent Models
2.3.1 Thermodynamic Models
The classic work of Hicks and Menzies constituted
the first attempt to assess the potentially damaging work
that can develop when the thermal energy is transferred
from the molten fuel to the relatively cold sodium. In
their model the thermal energy is instantaneously shared
between the fuel and the sodium, bringing them to a
thermal equilibrium. The heated sodium is subsequently
expanded to the ambient pressure, and the work is calculated
as the difference in the internal energy of sodium between
the two ends of the expansion process. Thus the mechanical
work was determined as a function of the fuel-to-sodium mass
ratio. Their calculations show a maximum work for a mass
ratio of ll. Several modifications of their original
6o -62treatment have been introduced by other authors .
Notably, Judd61 has shown the sensitivity of the resultant
work to the assumed sodium equation of state.
The thermodynamic approach to the evaluation of the
expected work yields high thermal-to-mechanical energy
conversion efficiencies which may be prohibitively
pessimistic. Additionally, no information is provided
by this approach about the time-rate for the pressure
and mechanical work generation, which is of significance
in the assessment of the consequences of an accident.

55
2.3.2 Rate limited, Parametric Models
Several models have been developed taking into
account the rate limited heat transfer to sodium and the
subsequent sodium expansion. In one class of such models
sodium is heated at a limited interface with molten UO2
In a second class of these models the fuel is assumed
to fragment and intermix with sodium.
a) First class:
63Pfefflerlen estimated the pressure and
work accompanying the formation of a shock wave
in sodium following the initial contact of molten
fuel and sodium. The model is based on a semi-
infinite slab geometry and assumes a heat transfer
cut-off following vaporization of sodium at the
64iinterface. More recently Biasi et al. presented
a similar model in spherical geometry. Because
vaporization in both models develops in a short
time (< 1 microsecond), the amount of heated
sodium is limited, and very low values of mechanical
work are developed.
b) Second class
Padilla65 introduced a model in which an amount
of sodium is bulk-heated by fuel particles. The
fuel particles are assumed to be spherical and
uniformly distributed in an "interaction zone"
with sodium. The heated sodium in the interaction

56
zone is constrained from expansion by the surrounding
cold sodium. The increase in the specific enthalpy of
the volume-constrained sodium raises the pressure in
the interaction zone, which accelerates the constraining
surroundings. When the pressure in the expanding inter-
action zone is decreased to the saturation pressure of
the prevailing sodium temperature, evaporation is
initiated. Evaporation is also initiated when the reflected
pressure wave from a free surface reaches the interaction
zone. After the initiation of the evaporation no heat
is transferred to sodium, and isentropic expansion takes
place. Padilla's model has been used to calculate the
mechanical work energy of a core disruptive accident
for the Fast Flux Test Facility (FFTF).
Several improvements over Padilla's basic assumptions
were incorporated in the ANL Parametric Model for Fuel-
Coolant Interaction (ANL-FCI) developed by Cho et al.
The ANL-FCI model allows for a rate-limited generation
of fuel surface area in the interaction zone, which accounts
for the finite rate of fragmentation and mixing of the fuel
in sodium. The area of the fuel was taken to change as
A(t) = Ao ( 1 - et/tm) (2.1)
This formulation, however, is not based on any physical
description of the processes of fragmentation and mixing.
The reported parametric studies indicate that the maximum

57
generated pressure will be larger the higher the rate
of surface area generation (shorter tm in Eq. 2.1).
Additionally, the compliance of non-condensable gases
that may be present in the interaction zone was shown
to reduce the maximum pressure and to cause a delay in
the generation of the pressure peak. Although the model
allowed for extending the calculations beyond the initiation
of evaporation, the only thermal resistance that was con-
sidered is that of the fuel particles. The treatment of
the effect of film blanketing the fuel by non-condensable
gas or sodium vapor, which will be described in Chapter 3,
66has been added to the ANL-FCI for optional use6 .
Several models developed in other countries are based
on the same assumptions involved in the ANL-FCI model.
Teaguel5 reviews the essential features of eight such
models. Some differences are worth mentioning here.
Duf67 Rad 68
The British models of Duffy and Randles ignore the
initial pressure generation due to heating liquid sodium
and consider the pressure generation as due to vapor
generation only. Puig and Szeless69 consider a spherical
geometry rather than a one-dimensional cartesian model.
They find the ratio of the square of the fuel particle
diameter to the radius of the interaction zone a determining
factor in the development of mechanical work.
In CaldarOla's model,the sodium vapor, when developed,
is partitioned between that forming a vapor film around the

58
fuel particles and that escaping the film to a "vapor
zone " within the interaction zone. Caldarola developed
a heat transfer coefficient for the vapor film based on
the conduction thru the film and a film thickness that is
related to the rate of vapor generation. His results
indicate the retardation of heat transfer due to vapor
film formation reduces the generated pressure and mechanical
work.
In all these models, the conditions at which the
molten fuel and sodium contact each other (temperature,
amounts of masses involved, presence of non-condensable
gases) are optional parameters. Additionally, the rate
and diameter at which the fuel fragments are produced are
optional. Both the conditions of contact and the descrip-
tion of fragmentation have significant effect on the
resultant pressure and mechanical work. The rate limited
parametric models are, therefore, most useful in sensitivity
studies of the effects of the different parameters. The
acceptability of the predictions of such models when applied
to reactor accidents depends on proper justification of
the input parameters.
2.3.3 Acc ident -Dependent Models
Some models have been developed for specific reactor
accidents. In these models the conditions of contact
between the molten fuel and sodium are derived from the
accident sequence.

59
Carelli7 1 formulated a model for a jet-type ejection
of molten fuel through an orifice in a failed fuel rod.
Tilbrook72 used Carelli's model in a whole-core multi-
channel analysis model to evaluate the rate at which the
fuel is ejected into sodium. The results indicated the
pressure generated by the thermal interaction may halt
the fuel ejection intermittently. Tilbrook's model
also indicated a significant effect of sodium vapor con-
densation at the liquid/vapor interface on the ejection
rate of the sodium slug. A post-fragmentation model
73has been applied by Cronenberg to the analysis of the
H-2 rod-failure test in TREAT. Cronenberg's results also
indicated the significance of the condensation of vapor
on the cold interface with sodium.
A multichannel power excursion core-disassembly
accident model (FISFAX), that utilized in part the
formulation of ANL-FCI, has been reported by Lorenzini
74and Flanagan . An explicit account is made for the motion
of the fuel particles in the voided channel. It was found
that the fuel motion feed back on reactivity was a
main factor in terminating the excursion. This is par-
ticularly interesting since the rapid sodium voidage
caused by the thermal interaction is a major source of
positive reactivity addition in reactor accidents. Mills
75and Kastenberg find little effect in going from the

60
point-kinetics model to the more elaborate space-time
model for the disassembly accident. Very recently, the
mechanistic approach to assessment of molten fuel-sodium
interaction has been incorporated in the SAS code developed
at ANL for LMFBR hypothetical core disruptive accident
analysis7. The SAS/FCI model is largely based on the
assumptions of ANL-FCI parametric model.
2.3.4 Theoretical Studies on the Mechanism of Fragmentation
The hydrodynamically invoked fragmentation has been
40thoroughly analyzed by Hinze . His analysis reveals the
dependence of the fragmentation process on the Weber
Number of the deformable body passing through a fluid..
A critical Weber Number is needed for fragmentation to
occur. The critical Weber Number was shown to depend
on the way in which the relative velocity of the two
fluids varies with time. For a sudden exposure of a drop
to a parallel velocity field (a case similar to dropping
experiments) he found the critical Weber Number to be - 13.
Only few attempts have been made at investigating the
thermal mechanism leading to fragmentation of hot molten
materials into cold liquids. Hsiao et al.77 considered
the pressurization of a solidifying sphere in an infinite
cooling medium. They concluded that tangential stresses
will exceed the radial stresses for both thermal and
pressurization stresses. The maximum stresses were shown
to occur as solidification starts, hence rupture should

61
occur immediately after solidification begins.
73Cronenberg considered the energy associated
with the creation of the surface area of fuel in sodium.
He compared this energy to the inertial energy associated
with the fuel particles released from a failed pin, to the
energy associated with a shock wave due to sudden heating
of the sodium at the interface, and to the energy associated
with sodium bubble growth and collapse at the UO2 surface.
He concluded that the energy associated with the nucleate
boiling exceeds the other energies by several orders of
magnitudes and is therefore more likely to induce frag-
mentation.
The recent work of Roberts represents a first
attempt in describing the mixing that occurs between
the two fluids. Roberts considered a jet of coolant
penetrating a molten, hot material. He divided the
sequence of events into seven stages, allowing for a
feed back effect. Following the initial penetration
an initial entrainment of the coolant is assumed to take
place due to formation of vortices. An increase in the
surface area is then assumed to take place due to fluid
turbulence. This increase in area is limited by the kinetic
energy of the jet and the interfacial surface tension.
Assuming the presence of an undefined mechanism by which
the heat transfer and the mild pressure pulse can cause
further turbulence, he showed how a vast increase in the

62
surface area can be generated following a delay time.
Roberts model seems appropriate for simulating the
shock tube experiments and the jet penetration of a
molten drop suggested by Board et al. as a mechanism
for fragmentation.

63
Chapter Three
EFFECT OF GAS/VAPOR BLANKETING OF FUEL ON
FRAGMENTATION-INDUCED EXPLOSIVE THERMAL
INTERACTION IN LMFBR
Page
3.1 Introduction 64
3.2 The Original ANL Parametric Model for 65Fuel Coolant Interaction
3.3 Modification of the Model to Include 70the Blanketing Effect
3.3.1 Basic Assumptions 70
3.3.2 Mathematical Formulation 73
3.3.3 The Numerical Solution 82
3.4 Application of the Modified Model: 82Results and Discussion

64
Chapter Three
EFFECT OF GAS/VAPOR BLANKETING OF FUEL ON
FRAGMENTATION-INDUCED EXPLOSIVE THERMAL
INTERACTION IN LMFBR
3.1 Introduction
In the model that has been developed at Argonne
National Laboratory to analyze a fragmentation-induced
vapor explosion in a hypothetical large scale LMFBR
meltdown accident, the rate of heat transfer from the
fuel to the sodium is assumed to be limited only by the
14fuel thermal resistance . Thus any contact resistance
that may be established by the presence of non-condensable
gases or sodium vapor at the fuel-sodium interface has
been neglected. In an operating reactor, non-condensable
gases will be present as interstitial gas in the fuel,
thermal bond gas, and fission gases released to the plenum.
It is therefore conceivable that under reactor accident
conditions non-condensable gases will at least partially
blanket the fuel surface area. Additionally, once vapor-
ization of sodium takes place, the vapor would most
probably be formed at the fuel surface, where sodium is
at the highest temperature. The purpose of the present
analysis is to assess the effect of the existence of a
gas/vapor blanket around the fuel particles on the pressure
and mechanical work generated by the fuel-sodium interaction.

65
The assessment of such an effect is made by modification
of the ANL Parametric Fuel-Coolant Interaction Model
(ANL-FCI) to account for the blanketing effect. A brief
description of the assumptions and formulation of the
original ANL-FCI model is given in Section 3.2. The
assumptions and formulation of the modified model are
given in Section 3.3. The results of the application of
the modified model to several cases of fuel-sodium thermal
interaction are then discussed in Section 3 .4.
3.2 The Original ANL Parametric Model for Fuel-Coolant
Interaction
Only. the basic assumptions and formulation of the
orignial ANL model for fuel-coolant interactions are re-
viewed here. For more detailed discussions of the model,
the reader is referred to Ref. 14 and Ref. 79.
In the ANL model, the thermal interaction process
in a volume of fuel-sodium mixture at some location in the
core is considered. The heat transfer from the fuel to
the interacting sodium increases the sodium specific
enthalpy and leads to pressure generation in the "inter-
action zone". The interaction zone then expands against
the constraint provided by the surroundings. The pressure
history in the interaction zone is then determined by the
two competing processes: the heating of the sodium which
produces pressure, and the expansion of the interaction

66
zone which reduces the pressure. The following assumptions
are made in the formulation of the model:
1. The system can be treated in one-dimensional
cartesian coordinates (See Fig. 3.1).
2. There is no pressure gradient in the interaction
zone.
3. The liquid sodium in the interaction zone has
uniform temperature.
4. There is no heat or mass exchange between the
interaction zone and the surroundings.
5. The change in the specific volume of the fuel
can be neglected at all temperatures.
6. The fuel fragments are uniformly dispersed in
the interaction zone. The fragments may be
represented by spherical particles of equal
size.
7. The surface area of the fuel is generated in
the exponential manner:
A = A (1 - e-t/tm) 3.1
which represents the finite rate of fragmentation
and mixing of fuel. The characteristic time,
tm, and the asymptotic fuel surface area, A 0 ,
are optional parameters.
8. Non-condensable gases may be present in the
interaction zone only away from the fuel-sodium
I

67
FREE SURFACE
UNHEATEDSODIUMSLUG
INTERACTIONZONE
FIG. 3.1:
L
Z (t)
JI00 0 0
FUEL PARTICLE
- CUSHION GAS
SCHEMATIC DIAGRAM FOR THE SYSTEM DESCRIBED BYTHE ORIGINAL ANL PARAMETRIC FUEL-COOLANTINTERACTION MODEL
.P

68
interface. Hence, the presence of the non-
condensable gases does not interfere with the
heat transfer in the system. (This type of
non-condensable gas will be called "cushion gas"
in this study). The non-condensable gas may be
treated adiabatically.
9. When sodium vapor is formed in the interaction
region, it is uniformly mixed with the liquid.
All the vapor can be treated as at thermodynamic
equilibrium with the liquid sodium in the inter-
action zone.
10. The heat transfer from the fuel is limited only
by the thermal resistance of the fuel particle.
The heat flux from a fuel particle is given by:
q= hu (Tu - Ts)S 3.2
where Tu is the average fuel particle temperature*
hu is the heat transfer coefficient and is given
by
h = ku +u V'iat Ru
3.3
where ku and au are the thermal conductivity and
diffusivity of the fuel respectively, and R is
the fuel particle radius.
The first term in the expression 3.3 for hu represents
a "transient" heat transfer coefficient while the second
term represents a "steady state" coefficient.

69
Utilizing the aforementioned assumptions, the problem
is then determined by the solution of five simultaneous
equations:
a) The rate of heat transfer from fuel to sodium:
Th A u - T) 3.4dt u u u s
b) The first law of thermodynamics applied to the
sodium in the interacting zone:
dH = dQ VdP 35t dt dt ,
where H is the enthalpy of sodium,
V is the volume of sodium,
P is the pressure in the interaction zone,
and is the total heat transfer rate from thedt
fuel.
c) The equation of state of sodium:
H = H (P, V), 3.6
d) The constraint equation, relating the rate at
which the interaction volume is expanding to
the pressure in the interaction zone:
P = F (V, I 2, and 3.7dt dt
e) the rate of fuel cooling
dTu -1 dQ 3.8
u
where Cu and W are the specific heat and the
mass of interacting fuel.

70
For the constraint equation, two approximate solutions
can be used: the inertial approximation and the acoustic
approximation. In the inertial approximation the surround-
ings are considered incompressible. In the acoustic
approximation, the surroundings are considered compressible
but non-reflecting of pressure waves. In this case the
pressure waves generated by the expansion of the interaction
zone propagate only outward, away from the interaction zone.
3.3 Modification of the ANL Model to Include the Blanketing
Effect
3.3.1. Basic Assumptions
The basic system described by the model (fuel and
sodium in an interaction zone expanding against constraints)
has not been altered in the present treatment. The basic
assumptions 1 through 7 of the original model are also
retained. Additionally, the following assumptions are
made:
1. Non-condensable gases may be present in the
interaction zone at the fuel surface (blanket gas)
and/or away from it (cushion gas). The cushion
gas may be treated adiabatically (as in the
original model). The blanket gas, if present,
is of uniform thickness surrounding each fuel
particle. (See Fig. 3.2).

71
FREE
1-f
UNHEATEDSODIUMSLUG
INTERACTIONZONE
L
Z(t)
SURFACE
P
0~ 00 0
FUEL PARTICLE
-GAS/VAPOR BLANKET
CUSHION GAS
FIG. 3.2: SCHEMATIC DIAGRAM FOR THE SYSTEM DESCRIBED BYTHE MODIFIED ANL MODEL FOR FUEL-SODIUM THERMALINTERACTION

72
2. The sodium vapor in the interaction zone, whether
initially present or generated in the course of
the interaction, surrounds the fuel particles
as a blanket of uniform thickness. If a gas
blanket already exists around the fuel, vapor
is added to the blanket uniformly.
3. The temperature profile in the blanket is linear.
The vapor is superheated, with respect to the
prevailing pressure, everywhere in the blanket
except at the blanket/liquid sodium interface.
4. The heat transfer from the fuel is limited by
both the thermal resistance of the fuel particle
and the blanket. The heat transfer across the
blanket is by conduction only. (See Appendix A
for an estimate of the contribution of the
radiative heat transfer in the cases of interest).
The heat transfer coefficient of the blanket is
given by kb/6, where kb is the blanket thermal
conductivity and 6 is the blanket thickness.
5. An average temperature of the gases in the blanket
may be given by (See Appendix B)
T + TT=b u 2 s 3.9
6. The thermal energy consumed by heating the
blanket gas may be neglected compared to that
consumed by heating the sodium. However, the

73
compliance of the blanket gas is taken into
account in the pressure calculations.
3.3.2 Mathematical Formulation
Since homogeneity of the interaction zone is assumed,
the equations are formulated on the basis of a represent-
ative one gram of the interacting sodium.
a) Heat Transfer From the Fuel
The rate of heat transfer from the fuel is given
by:
= h Au T - Ts), 3.10dtu U S*
where h is a composite heat transfer coefficient given
by:
h = .+ 3.11h kb
The values of the fuel particle heat transfer*
coefficient h has been defined in equation 3.3. The
heat transfer area per gram of interacting sodium in-
creases in the exponential form defined in equation 3.1.
At any time, t, the blanket thickness, 6, is given
by the total volume of the blanket gas and vapor divided
by the surface area of the fuel:
xV + M V
6= Au g gb , 3.12

74
where x is the mass of sodium vapor per gram of the
interacting sodium (the quality of the inter-
acting sodium),
M is the mass of the blanket gas per gram of
interacting sodium,
Vv and Vgb are the specific volumes of the vapor
and blanket gas respectively.
The gas blanketing is assumed to occur at the same
rate as that of surface area generation:
M = M (1-e-t/tm),g gmax 3.13
where Mg ma is the total mass of non-condensable gas
available for blanketing per gram of the interacting
sodium.
b) The First Law of Thermodynamics Applied to the
Interacting Sodium
The first law of thermodynamics applied to the
interacting sodium is given by:
dQ dh dP
dt t s~ sdt 3.14
where all the heat transferred from the fuel is assumed
to be consumed by sodium only, and where hs and Vs are
the specific enthalpy and specific volume of sodium.
For a single-phase liquid sodium, the change in
the enthalpy can be related to the change in the tem-
perature and pressure by the thermodynamic relation

75
dh = C dT + v (1 - a' T) dP, 3.15p
where Cp is the specific heat at constant pressure and a'
is the thermal expansion coefficient given by:
3.16
By substitution from equation 3.15 and 3.16 in
equation 3.14, the first law of thermodynamics may be
written as:
dQ dT dP-- = C~ ---- VTs - 3.17dt dt dt
where the subscript k refers to liquid sodium.
For a two-phase interacting sodium the specific
enthalpy, hs, and the specific volume, Vs, of the sodium
to be used in equation 3.13 are given by:
h (1 - x)h + x hv, 3.18
Vs (1 - x)VX + x VV, 3.19
By substitution from equations 3.18 and 3.19 into
equation 3.14, the thermodynamic relation becomes,
dQ dh dh + dx= (1 - x) - x (hv - hL)
dt]

76
The values of the specific enthalpies and the specific
volumes for liquid and vapor sodium are to be determined
from the state equations of sodium.
c) The Equation of State of Sodium
For two-phase sodium, the liquid is assumed to
be in equilibrium condition, so that the state equation for
saturated liquid are used:
h = hI (T ), 3.21.a
V = V I(T ), 3.21.b
The vapor is assumed to be at an average temperature
T b higher than the saturation temperature at the pre-
vailing pressure. The thermodynamic properties are there-
fore given by:
hsv = hy s) + Cpv b - Ts),
Vv
B G T= v v b
P
3.21.c
3.21.d
where hv T s) is the saturated vapor specific enthalpy
at temperature Ts,
Cpv is the vapor specific heat at constant
pressure,
G is the vapor gas constant, and
B is a temperature-dependent compressibility
factor.

77
The blanket average temperature, Tb, has been defined in
equation 3.9. The numerical values of the thermodynamic
properties of sodium are given in Appendix I.
The state equations are used to determine the
relation between the rate of change of the total volume
of the interaction zone and the pressurization rate as
follows:
The total volume of the interaction zone per one
gram of the interacting sodium, Vt, is given by the sum
of the volume of sodium, blanket gas, cushion gas, and
fuel:
V Po I1/n - WVt s +Mgmax Vgb +go [;p P u
3.22
where V is the initial volume of the cushion gas,go
P0 is the initial pressure in the interaction zone,
n is the adiabatic index of the cushion gas
(for a perfect gas n = C /C ), andp v
pu is the density of the fuel.
By differentiating equation 3.22 with respect to
time, the following relation is obtained:
dV dV dV V P 1/n dP-t _ -- + Mg oo--
dt dt gmax dt n P (1+1/n) dt
The rate of change of the specific volume of
liquid sodium is given by:
3.23

78
dV 3V dT V dP
t aTs at- dt3.24.aS
By using the thermal expansion coefficient, a',
defined in equation 3.15 and the isothermal compressibility,
a defined as
V =PlT 3.25
equation 3.24.a may be written in the form
dVL dT dPS aS V s V 3.24.b
dt XtV I -t L~ z, dE
For saturated liquid a' and 82 are function of temperature
only.
The rate of change of the specific volume of vapor
sodium is obtained by differentiating equation 3.21.d
with respect to time:
dVv GvTb 3B BvGv T BvGvTb P Gv b dTv= vb + vv + v ~v
dt P aT5 P 9Ts P2 T . dt P 3Tu dt
3.26
The total rate of change of the specific .volume of
sodium is given by:
i) For single phase liquid sodium
, and 3.27at at'

79
ii) For two-phase sodium:
dV dV dV dxs (j-) + x + (V V - 3.28
The rate of change of the specific volume of the
blanket gas is given by:
dV d G Tgb gb bdt dt P
dV G dT G dT G T dPu gbb 3.29
dt 2P dt 2P dt P dt
where the assumption T (T +TI/2 has been used.b s u
d) The Constraint Equation
Another equation for the rate of change of the
total volume of the interaction zone can be obtained by
considering the motion of the constraining surrounding
due to the pressure generated in the interaction zone.
In the original ANL-FCI model, two approximate formulations
for the motion are employed for the "constraint equation":
the acoustic approximation and the inertial approximation.
The two formulations have not been altered in the modified
model.
d-1) The acoustic approximation
In this formulation the compressibility of the
constraining sodium slug is taken into account. The

80
formulation allows for the compression waves produced in
the surroundings by the expansion of the interaction zone
to propagate away from the interaction zone. However,
the reflected waves are neglected. Hence, this approx-
imation is appropriate for an initial period of the
interaction less than the period 2L/C, where L is the
distance to the reflecting surface and C is the speed0
of sound in unheated sodium. In one dimensional cartesian
coordinates, the rate at which the interaction zone is
expanding is given by
dV SdZ
dt T3.30
where S is the corss sectional area of flow per gram
of interacting sodium, and
Z is the length of the interaction zone.
In one dimensional cartesian coordinate, the motion
of the compressible liquid sodium induced by propagation
of a pressure wave is given by80.
dZ 1 d_(Pdt p0C0 dt
3.31
where p0 is the density of the unheated sodium, and
P is the external pressure (See Fig. 3.2).
Equation 3.31, when integrated with respect to time
once, gives:

81
dZ P - P3.32
dt p0 C0
d-2) The inertial approximation
In this formulation, the constraining unheated
sodium is considered incompressible. This formulation
is appropriate when the time is larger than 2L/C . The
expansion in this case is limited by the inertia of the
unheated slug (neglecting any friction or viscous forces).
The acceleration of the linear expansion of the inter-
action zone is given by the familiar Newton's law of
motion:
d2 Z P -PC- 3.33
dt p0 L
The volume expansion rate has been defined in equation
3.30.
e) The Rate of Fuel Coolin
For equal size fuel fragments uniformly distributed
in the interaction zone, the average temperature of the
particles is reduced at a rate given by equation 3.8:
dT 1 dQ3.8
dt Cu Wdt

82
3.3.3 The Numerical Solution
The simultaneous solution of equations 3.10, 3.17
(or 3.20), 3.21, 3.23 and 3.30 have been obtained by
numerical integration. The equations of the modified
formulation were programmed in Fortran IV language and
linked to the computer program for the original ANL-FCI
model. The parts of the original computer program that
supply the numerical values for the thermodynamic prop-
erties of sodium and perform the numerical integration
have not been altered.
The numerical values for the temperature dependent
properties of sodium are based on equations recommended
81by Golden and Tokar . The validity of the equations,
however, is assumed to extend beyond the temperature limit
of 1644"K for which date is tabulated in Ref. 81. The
equations for sodium properties are given in Appendix I.
The numerical solution is performed by an integration
subroutine developed at Argonne National Laboratory. The
integration scheme is based on the Bulirsh-Stoer method
of extrapolation of rational functions 82
3.4 Application of the Modified Model: Results and Discussion
Various cases have been investigated using the modified
model developed in Section 3.3. The calculations considered
a 35 cm long molten zone at the core mid-plane of an FFTF

Summary of the Varied
Table 3.1
Conditions in the Investigated Cases
Variable Cushion Gas+ Blanket Gas+ Vapor*Initial Volume Initial Thickness Blanketing Constraint**
Case (cm3/gm) (y)
1 --- Yes Acoustic2 --- 10 Yes Acoustic3 20 Yes Acoustic4 0.27 --- No Acoustic
5 0.27 Yes Acoustic6 --- --- No Inertial7 Yes Inertial8 0.27 No Inertial9 0.27 --- Yes Inertial
10 --- 10 Yes Inertial11 --- 20 Yes Inertial
Heat Transfer12 Cutoff at Inertial
Vaporization
+Assumed to be Xenon.
*Cases without vapor blanketing are calculated by the original model.**The inertial constraint is taken to be equivalent to 200 cm long unheated sodium slug.
xD

84
subassembly. The initial conditions and parameters common
to all calculations have been chosen equal to a set of
values used in the calculations of Ref. 14 utilizing the
original model. These values are:
Initial Temperature of Sodium = 11000 K
Initial Temperature of Fuel = 29000 K
Fuel Particle Radius = 117 y (microns)
Fuel to sodium mass ratio = 8.3
2Flow area per gram of interacting sodium, S = 0.077 cm
Fragmentation and mixing time constant = 1.0 msec
The fuel particle radius used is the median of the particle
radius distribution observed in the dropping experiments
12of Armstrong1. Table 3.1 summarizes the different con-
ditions of the investigated cases.
The pressure histories calculated with an acoustic
constraint (cases 1 to 5) are shown in Fig. 3.3 and 3.4.
Consider the results shown in Fig. 3.3. In the absence of
any gas in the interaction zone (case 1), the pressure
rise suppresses vaporization until the peak pressure is
relieved. When gases are present in the interaction zone,
an initial vaporization process takes place. All the
vapor recondenses at a later time, and a high pressure
peak develops when all the interacting sodium is in the
liquid phase. The results of Fig. 3.3 indicate that gas
blanketing results in a delay in the pressure rise time.

85
TIME, msec
FIG. 3.3: EFFECT OF GAS BLANKETING ON PRESSURE-TIME HISTORY
4')C/)

86
0.27 cm 3/gm Na CUSHION GAS, NO VAPOR BLANKET
1030.27 cm3/gm Na CUSHION GAS, VAPOR BLANKET
4-)210
10
o VAPORIZATION
O3 RECONDENSATION
2 4 6 8 10
TIME, msec
FIG. 3.4: EFFECT OF VAPOR BLANKETING ON PRESSURE-TIME HISTORY

87
Additionally, the peak pressure is reduced as the initial
thickness of the gas blanket increases.
Consider the results shown in Fig. 3.4 for cases 4
and 5. It is seen that an equal value for the peak
pressure is obtained with or without accounting for vapor
blanketing. However, vapor blanketing seems to cause a
delay in the pressure rise time.
The above results indicate, that, when all interacting
sodium is initially liquid as is all the present cases,
vapor and gas blanketing do not preclude the development
of high shock pressures.
The generated mechanical work is calculated using
the inertial formulation for the constraint. The length
of the unheated sodium slug, L, in these calculations is
taken to be 200 cm. The mechanical work is plotted in
Fig. 3.5 as a function of the slug displacement for cases
6, 7 and 12. The mechanical work is equivalent to the
slug kinetic energy since the interaction zone in the
present model is assumed to expand under adiabatic con-
ditions. It is seen that vapor blanketing reduces the
mechanical work that is developed at each displacement.
For example, when no gas is initially present in
the interaction zone (cases 6 and 7), the mechanical
work at a displacement of 100 cm is reduced by about 40%
when vapor blanketing is considered.

88
DISPLACEMENT, cm
FIG. 3.5: EFFECT OF VAPOR BLANKETING ON MECHANICAL WORK
co:
0
50

89
From the results of cases 7 and 12, plotted in
Fig. 3.5, it is seen that in the calculations of mechanical
work, vapor blanketing is nearly equivalent to a heat
transfer cutoff at the onset of vaporization. It should
be noted however that for the calculated cases vapor was
continuously produced with the movements of the unheated
sodium slug. Therefore, the equivalence of vapor
blanketing to a heat transfer cutoff is observed when
recondensation of sodium vapor does not take place.
The results for cases 8 and 9 are plotted in Fig. 3.6.
The results also show the marked reduction in the generated
mechanical energy when vapor blanketing is taken into
account.
The effect of gas blanketing is seen in Fig. 3.7 to
reduce the mechanical work for the initial displacement.
The reduction in the developed work is greater the larger
the initial thickness of the gas blanket. The reduction
in the mechanical work is larger at smaller displacement
values. It is interesting to note here that the limited
data of the in-pile fuel pin failure experiments in the
TREAT reactor (see Chapter 2, Section 2.2.6) indicate
that larger thermal-to-mechanical energy conversion ratios
may be obtained by molten fuel-sodium thermal interaction
in the absence of a gaseous bond in the fuel pin.

90
0.27 cm3 /gm NaCUSHION GAS.NO VAPOR BLANKET
100
U)
0 0.27 cm3/gm NaCUSHION GAS,VAPOR BLANKET
050
0 VAPORI-ZATION
50 100
DISPLACEMENT, cm
FIG. 3.6: EFFECT OF VAPOR BLANKETING ON THE MECHANICALWORK IN PRESENCE OF A CUSHION GAS

91
NO GAS, VAPOR BLANKET
a 100
bo
C/2 INITIALLYw
10y THICKBLANKET GAS
0
50-INITIALLY 20p THICKBLANKET GAS
0 VAPORIZATION
50 100
DISPLACEMENT, cm
FIG. 3.7: EFFECT OF GAS BLANKETING ON MECHANICAL WORK

92
The above observations may be summarized as follows:
1. Gas/vapor blanketing of fuel does not preclude
the development of high pressure pulses by post
fragmentation thermal interaction of molten
fuel and liquid sodium.
2. The peak pressures produced by the interaction
are, however, reduced by the presence of an
initial gas blanket.
3. Gas/vapor blanketing results in an increase
in the pressure rise time.
4. Vapor blanketing results in a substantial re-
duction in the mechanical work that can be
developed by the interaction. For the cases
considered in the calculation of the mechanical
work, vapor blanketing was tantamount to a heat
transfer cutoff.
5. The effect of initial gas blanketing is to
further reduce the mechanical work developed
by the interaction. The larger the blanket
thickness the greater is the reduction in the
mechanical work.

93
Chapter Four
DYNAMICS OF VAPOR FILM GROWTH
AROUND A HOT PARTICLE IN A COOLANTPage
4.1 Introduction 94
4.2 Formulation of the Model 94
4.2.1 Basic Assumptions 94
4.2.2 Discussion of the Assumptions 96
4.2.3 Mathematical Formulation 104
4.3 Application of the Model to Hot Spheres in 127
Water
4.4 Application of the Model to Hot Spheres in 145
Sodium

94
Chapter Four
DYNAMICS OF VAPOR FILM GROWTH
AROUND A HOT PARTICLE IN A COOLANT
4.1 Introduction
In this chapter the dynamic behavior of a vapor
film growing at the surface of a hot sphere which has
been suddenly immersed in a coolant is considered. The
purpose of this study is to investigate the effects of
the initial temperature and the properties of both the
sphere and the coolant on the dynamic behavior of the
growing film. The results of this study are used in
Chapter 5 to investigate a possible correlation between
the pressure history of the growing film and the observed
fragmentation of hot molten materials when dropped in
relatively cold liquids.
The formulation of the model used in the study is
first discussed. The model is then applied to hot
spheres in water and sodium coolants. The sphere
materials are chosen from the materials used in reported
experiments of dropping molten materials in water and
sodium. (See Section 2.2.4)
4.2 Formulation of the Model
4.2.1 Basic Assumptions
Consider a sphere which has been suddenly immersed
in a large amount of a relatively cold liquid. The

95
sphere is initially at a high enough temperature to
induce film boiling of the liquid at the hot surface.
The liquid is initially subcooled with respect to the
ambient pressure. Part of the heat flux from the
sphere is consumed in vapor formation at the film/liquid
interface, the rest is conducted away from the film
into the liquid. The growth of the film is governed
by the evaporation rate as well as the inertial effects
of the liquid motion induced by unbalanced pressure
across the liquid. Thus, the film may grow due to
formation of new vapor as well as to a film pressure
in excess of the ambient pressure. Conversely, the
film may collapse due to vapor condensation as well as
to a film pressure less than the ambient pressure.
Additionally, the following assumptions are made:
1. The system may be treated as spherically
symmetric.
2. All the generated vapor is retained in the
film, i.e. no vapor is allowed to detach.
3. A small gaseous film initially exists at
the surface of the sphere.
4. The pressure in the film may be considered
uniform.
5. The liquid and the vapor are at equilibrium
at the film/liquid interface. Hence, the
vapor pressure at any time determines the
temperature at the film/liquid interface.

96
6. The heat is transferred across the film only
by conduction. The heat flux corresponds to
a linear temperature profile in the film:
q1 = k AT/6
7. The vapor and gases in the film may be treated
as perfect gases at the average temperature
of the sphere surface and the film/liquid
interface.
8. Buoyancy effects may be neglected.
9. Convective heat transfer in the liquid may
be neglected.
10. The liquid may be treated either as incompress-
ible or as acoustically infinite.
11. The physical properties of the sphere and the
liquid may be considered temperature indepen-
dent.
4.2.2 Discussion of Assumptions
In the present model, the coolant is assumed to
undergo "film boilin" rather than "nucleate boiling"
when exposed to the hot sphere. It should be emphasized
that "film boiling" as used here does not mean "stable
film boiling" but the mode of boiling in which evapora-
tion takes place at all points of the hot surface and

97
not at preferred locations. It is generally accepted
that film rather than "nucleate boiling" takes place
when the surface is at a high enough temperature 8 .
The conditions under which film boiling (both stable
and unstable) observed in experiments of quenching hot
spheres in water and sodium are summarized in Table 4.1.
The motion picture observations of the boiling modes
by Walford86 (700 frames/second) and Stevens et al.
(2000 - 4000 frames/second) indicate that transition
between stable film boiling and nucleate boiling takes
the form of a pulsating film. This is supported by the
observations of Board et al.90 in experiments of rapid
heating of a 0.001 inch thick nickel foil. Additionally,
the observations of Walford and Stevens et al. indicate
that film boiling may not be preceeded by nucleate
boiling. Therefore, the assumption of film-wise evapora-
tion seems suitable for the range of sphere and coolant
pool temperatures studied in the present analysis.
The assumption of spherical symmetry implies that
the variation of the film thickness is small compared
to the thickness itself. The assumptions of spherical
symmetry (Assumption 1) and the retention of all the
vapor in the film (Assumption 2) are supported by several
experimental observations of film boiling in subcooled

Table 4.1
Experiments of Quenching of Spheres in Subcooled Coolants
CSphere Range of Temperatures of Range of Coolant 0
Investigator Material Temperature in Critical Heat Temperatures Velocity 0(Reference) (Dia., inch) Experiment, *C Flux, 0C For Film ft/sec L(Da. nc) ________ ____ ___ Boiling A
Coolant Sphere Coolant Sphere NT Th T Th T
Stable filmboiling in27, 53, 95W
27 600 0C water for ABradfield Cr-plated Cu 27-95 160-870 53 332 sphere tem- 0.0 T(84, 85) (2.35) peratures
95 204 above 704, E593 and 260 R0C respec-tively
For TL >180C film
Walford Nickel 18-99 104-466 boiling 1.8-5.0(86) (0.25) takes placewhen Th<4600C
A film wasalways main-
Jacobson tained by
and Shair Steel 10-49 - continuous 0.7-5.0((0.5) heating of87) the sphere.
Temperaturesnot reported,

Table 4.1 (continued)
Experiments of Quenching of Spheres in Subcooled Coolants
Sphere Range of Temperatures of Range of Coolant 0Investigator Material Temperature in Critical Heat Temperatures Velocity 0(Reference) (Dia., inch) Experiment, 0C Flux, 0C For Film ft/sec 0
Boiling LCoolant Sphere Coolant Sphere A
T Th T Th N
Ag-plated Cu 24,60 190-246 - 9.6-20(0.75)
Stable or WStevens Ag 24-95 565 - pulsating 0.0 Aet al. (0.356) film was T(47, 88) 24 271 always ob- E
Ag 24, 60, 260-537 60 260 served ini- 5.0 R(1.0) 77 77 221 tially
Stable film
875 1-9514 boiling for
Farahat Tantalum up to sphere tem- 0Faaa (0.5, 0.75 156-875 235 400 \1426 peratures 0.0 D(89) and 1.0) 156 above T*tt I
given by: UT*-TA=421 M+6.2 (Ts-Tj)oC
tInitial sphere temperatures are givent tThe correlation specifies the sphere temperature at which minimum heat
was observed.
flux
'.0

100
liquids. The assumptions are less justified for saturated
boiling which we do not consider. Bradfield observed
"...as the subcooling is increased, the normally wavey
interface gradually changes in appearance and becomes
glassy smooth". Jacobson and Shair 8 observed that
"Water subcoolings to 100C and 500 C resulted in a stable
vapor film and no bubbles left the film . The cool
liquid prevented the emission of vapor from the
film due to buoyant forces". Stevens et al. also
observed that in many instances their silver sphere
"appeared to travel through the pool enclosed in an
almost perfectly spherical shell of vapor, without a
trailing vapor wake behind the sphere".
Assumption 3 of initial existence of a small
gaseous film at the surface of the sphere is made in
light of the practical conditions for which the model
would be applied: namely, the study of the character-
istics of boiling around molten particles dropped in
coolants. In the reported experiments of this type
the particles were usually dropped through a gaseous
atmosphere. Thus, a gaseous film may exist at the sur-
face due to physical adsorption 9 1,92 as well as to
"sweeping" some of the gas into the coolant pool. There
is no experimental data on the thickness of the gas film
that would be swept into the pool under such conditions.

101
The initial thickness of the gas film is therefore
treated parametrically and is varied between 10-6 and
10~ cm. The existance of a non-condensable gas at the
surface is also justified for nuclear fuel contacting
liquid sodium under LMFBR environment, where non-conden-
sable gases (fuel pin bond gas or fission gases) may
adhere to the fuel surface.
It should be pointed out, however, that the present
model is incapable of treating the cases where intimate
contact between the hot sphere and the coolant may be
assumed. In such cases, when the change of phase is
accompanied by a change in the specific volume of the
coolant, vaporization cannot take place initially under
the assumed equilibrium conditions at the film/liquid
interface.
The assumption of uniform pressure in the film
(Assumption 4) can be considered acceptable as long as
a pressure disturbance at one end of the film reaches
the other end in a time less than the time involved in
appreciably changing the average pressure in the film.
The pressure equalization time T is given by Tp = 26/c,
where 6 is the film thickness and c is the velocity of
sound in the film. The calculated periods of oscillation
of the uniform pressure in the present analysis have been
typically greater than T by two orders of magnitude.

102
For the cases considered in this study the assumed
equilibrium at the film/liquid interface (Assumption 5)
seems adequate since the interface temperature is expec-
ted to vary negligibly from that of saturation at the
film pressure. (See Appendix C)
The contribution of radiative heat transfer to the
total heat transfer is small for the considered tempera-
tures and film thicknesses (see Appendix A), and may
therefore be neglected. The effect of convective heat
transfer in the film was shown negligible in studies of
transient growth of a vapor film around hot wires.
The approximation of a linear temperature profile in the
film is a common approximation in studies of steady state
95-97 90film boiling9 . There are indications , however,
that the conduction value (kv AT/6) underestimates the
transient heat flux for subcooled water film boiling,
when the film thickness is > 3 x 10- 3cm.
The treatment of the vapor as a perfect gas
(Assumption 7) is an approximation of the state equation
of the vapor. However, unless the pressure in the film
gets to values near the critical pressure, the error
introduced by this approximation is not of appreciable
significance. The use of the average of the sphere sur-
face temperature and the film/liquid interface tempera-
ture to evaluate an effective gas density is again an

103
approximation that introduces a maximum error of 13% in
estimation of the perfect gas density under the assumed
linear temperature in the film (See Appendix B).
In pool boiling the assumptions of negligible effects
of buoyancy and convective heat transfer in the liquid
(Assumptions 8 and 9) are justified only for short-time
after the initiation of the film growth93,94. It should
be noted that the two assumptions are affected 'differ-
ently by the liquid subcooling. Subcooling retards the
vapor generation rate and hence the buoyancy effects.
On the other hand, with larger subcoolings the density
variation leading to the convective currents is enhanced.
As a consequence of the two assumptions, however, only
short term behavior of the vapor film can be predicted
by the present model. For forced convection conditions,
as encountered in the dropping experiments, the thermal
resistance of the liquid would be less than the conduc-
tion resistance. This would retard the film growth by
reducing the amount of evaporation, and would therefore
lead to a higher cooling rate of the sphere than the
pool boiling case 88.
Finally, to avoid the complexity of solving the
explicit equations of the conservation of mass and
momentum of the liquid coolant, the calculations are

104
made for the two limiting cases of (Assumption 10):
i - incompressible liquid
ii - compressible, acoustically infinite liquid.
Both assumptions are commonly made in analysis of vapor
bubble dynamics98 ~O'. For a rapidly changing pressure
field in the film,the liquid compressibility should be
taken into account in calculating the film/liquid
interface velocity. When the liquid is so large that
reflections of pressure waves, originated at the film
interface, at free or rigid surfaces can be neglected
in the time period of interest, the acoustically infinite
liquid is the more appropriate approximation. However,
if the time for pressure wave reflections to reach the
film is small compared to the time period in which
the transient pressure is appreciably changed, the
incompressible liquid is more appropriate. The actual
interface velocity lies between these two bounds.
4.2. 3 Mathematical Formulation
The dynamic growth of the vapor film is determined
by the simultaneous solution of the following equations:
a. The heat transfer equation in the hot sphere.
b. The heat transfer equation in the cold liquid.
c. The equations determining the rate of vaporiza-
tion.

105
d. The equation of motion of the film/liquid
interface.
e. The equations of state for the gases in the
film.
The integral approach is used for the description
of the heat transfer in the sphere and the liquid. This
approach is used to overcome the difficulty of solving
the differential heat transfer equations under the
highly non-linear boundary conditions. The adequacy
of the integral method for the description of the heat
transfer is discussed in Appendix D.
The integral approach to the description of the
heat transfer in the sphere yields two time dependent
variables by which the rate of heat transfer from the
sphere is determined at any time. These two variables
are: TR(t), the temperature of the sphere surface, and
X(t), the thickness of the thermally active region.
When the thermally active region progresses to include
all the sphere A(t) becomes constant (equal to the
radius of the sphere), and is replaced as a variable
by the temperature of the center of the sphere, T C(t).
Similarly, the integral approach to the description of
the heat transfer in the cold liquid yields two variables,
T v(t) and A(t), that determine the rate of heat transfer

106
into the liquid at any time. The variable TIv(t) is
the temperature at the film/liquid interface. The
variable A(t) is the thickness of the thermally active
region in the liquid, which can progress indefinitely
within the large body of liquid. Three additional
variables are to be determined at any time: R6 (t), the
radius of the film/liquid interface; U(t), the velocity
of the film/liquid interface due to imbalances between
the film pressure and the ambient pressure, and Pf(t)
the film pressure at any time.
The aforementioned equations a, b, c, d and e are
utilized in the following to derive relations that couple
the rate of change of the seven variables (TR, Ttv, A(or
T C), A, R6 , U and Pf). A numerical solution is then
obtained for the resulting set of first order differ-
ential equations for the rates of change of these
variables with time.
Heat Transfer in the Sphere
For a spherical coordinate system with its origin
at the center of the sphere (see Fig. 4.1), the heat
transfer is governed by Fourier's equation105 ,1 07:
Sr2 D Tr,t) 4.1rh(r,t)) ] T tr

107
Vapor Liquid\
Th TR T N~
R-X
TCZ RP
RR
T
I RI
R
T
R Rd
Fig. 4.1 A Schematic Diagram
of the Temperature Field

108
where ah is the thermal diffusivity of the hot sphere,
and the spherical symmetry assumption has been applied.
Following the standard integral approach, the
temperature is assumed to be affected only within a
penetration, X(t), which progresses with time. The
temperature at the center of the sphere, T., remains
constant until the thermally active region progresses
to include the whole sphere, i.e. until X(t) = R.
Equation 4.1 is to be satisfied in the integral form:
RT 2 Th(r,t) R r2 h(r,t)ah dr r _t dr 4.2
0 0
Since the temperature in the sphere is initially uni-
form and is affected only within the thickness 1(t)
from the surface, equation 4.2 may be written as:
R 2 h(r,t) R 2 Th(r,t)ah dr h r at dr 4.3
R-A(t) R-A (t)
Assume the temperature profile within the thermally
active region is of the quadratic form:
Th(r,t) = a0 (t) + a (t)r + a2(t)r2
R > r >R-A 4.4

109
By applying the conditions:
Th(Rt) = TR(t),
} )
4. 4a
4.4b
and
DTh
-arIR - A(t)4.4c= 0
Equation 4.4 can be written in the form:
for A < R
ThiTh(r,t) 2T-T [1--] ; R > r > R- XThi-TR
= 0 ; R- A> r > 0 I 4.5a
,
and for A = R
c -hr,t) 2
-Tr = [1 - ] ; all r < R,9TcT RR
where the notation of the dependence of A, T , and Tc
on t has -been dropped and where y = R-r.
4. 5b
T h(R-X(t),t) T Thi'XR
T c ; X= R

110
Note that as long as X < R, the thermal field in
the sphere is determined once the values of A and TR
are obtained. When X = R, the thermal field is deter-
mined when the values of Tc and T are obtained.
The rate of heat transfer from the sphere is given
by:
dQh 2 3Th(r,t)d~= 47 R2[-kh ar
where kh is the thermal conductivity of the sphere. By
substitution for Th(r,t) from Equation 4.5 in Equation
4.6, the heat transfer rate is determined by:
dQh 87r R 2kh (Thi-TR= A <BR, 4.6a
and
dQh = 8*7rRk = R. R4.6bdt h(TcTR)
The rates of change of X and Tc are determined by
substitution for Th (r,t) from Equations 4.5 into
Equation 4.3 yielding:

for X < R
A dX a*h+ X A A dT R2 dT ~ + 2(Thi-TR ,
where
1
A1
1A2 =
X 1 X 2~RE + (T
~6 + 26IT)
7R 2
and for X = R
dTc dTR
dt
As the sphere surface temperature, TRI is not adTR
priori defined, d is determined from the heat flux
boundary condition:
kv(TR-T vR - RR6 -
hat (r,t)- h a t R
111
4.7a
X = R 4.7b3 1lah (R-T c)[ R
4.8a

112
i.e.,
1 dQh kv(TR-Tiv)
4 7r R2 ~ R a - R , 4. 8b
where k is the thermal conductivity of the vapor, and
T xv is the temperature at the film/liquid inter-
face.dQh
By substituting for Tt- from Equation 4.6 into
Equation 4.8b and differentiating the resultant equations
with respect to time we get:
For X < R
kv 2kh dTR k dT1, + kv (TR-T v) dRaT-+ -X-] - - dt + 2 dt
2kh (Thi-TR) dA
- 2 dlt,4.9a
and for X = R
kv 2kh dTR -2kh dTc kv dTtv6- + -;C-] - =R dt + dt
kv ( R-Tv) dR6+ 6 2 di -
4.9b
where 6 = R - R, the thickness of the film.

113
Heat Transfer in the Liquid
For a liquid in motion, the Fourier equation for
heat conduction in fixed spherical coordinates takes the
form1 0 7:
ata 2 a a- jr- FT,(r~t)1 T (rt r' T(.t.
r2 ra tjr 4.10
where a is the thermal diffusivity of the liquid.
The Fourier equation is to be satisfied in the inte-
gral form:
, d r 2 $a T (r,t) =
R6 (t)
r2n T(r,t) dr
R 6(t)
2 r r DT9I(r,t)r . - r dr .
R (t
4.11
Assume a quadratic temperature profile in the thermally
active region of thickness At), (see Figure 4.1):

114
T (r,t) C0(t) + Cl(t)r + C2 (t)r 2 ; R6 4 r 4 Rd + A
= T i r > R6 + At 4.12
where the notation of the dependence of R6 and A on t
has been dropped.
By applying the conditions:
T (R6,t) = Tjv(t),
T (R6 +A,t) = T i
aTx(r,t)
Dr ' +Rd+6
4.12a
4.12b
4.12c= 0 ,
Equation 4.12 can be written in the form:
T (r,t)-T i X 2
TLv(t)-T 6 < r < R + A
= 0 r > R + A 1I4.13
;
where X = r - R6.
The integration of Eqn. 4.11 can be greatly simplified
if the liquid within the thermally active region is considered

115
incompressible so that, from conservation of mass con-
siderations.
r2 = R 2rat 6ITIR
= R U
Note that U is the film/liquid interface velocity due to
dynamic pressure in the film only; i.e. not including the
velocity of the interface due to change of phase. Substi-
tution in Eq. 4.11 for T (r,t) from Eq. 4.13 and forf Eat
from Eq. 4.1~4 and performing the integration yields:
dA a AC dT v dR 6 1C 2 Att 2(Tv-T ) Cdt -3 + If U , 4.15
where
C + 0A 2R6
4.15a
C l +C2 +
1 a
C = + I A+3 " 3R 6
1 A 276
6
The rate at which the heat is conducted away from
the film into the bulk liquid is given by:
4.14
4. 15c

dQZ 2 a L(r,t)4 R64-w [ -k] 4-16a
which, when substituting for T (r,t) from Eqn. 4.13,
gives:
dQ 8wR 2 k (TIV-T )Z it Zi4.16b
Rate of Vaporization
Assuming the energy consumed in heating (or cooling)
the gas and vapor in the film is negligible as compared
to the energy consumed in vaporization (or condensation),dMv
the rate of vaporization, - , is determined by the net
available heat
dMv 1 dQh dQlI - [ h1 J 4 1dt h Edt dt
where hfg is the latent heat of vaporization. The mass
of the vapor in the film, M , is given by:
VMv W PvVf Uv * r (R - R)41

117
where Pv is the vapor density in the film and is given
by the perfect gas law:
P
vT
where GV is the gas constant for the vapor, and
T is the average film temperature given by
T R + T 4.T = R 0v 4.20
Note that P v is the partial vapor pressure in the film,
the total film pressure being composed of the partial
pressures of the gas and the vapor. Thus, in this treat-
ment the pressure of the film is partitioned between the
gas and the vapor, both of which having the total volume
Vf. An alternate approach has been used in Chapter 3,
where the film volume was partitioned between the gas and
the vapor, both of which having the total pressure Pf
From the assumption of equilibrium at the film/liquid
interface, the vapor pressure is given by:
P = P(TV) .2 4.21

118
The change in the vapor mass, Mv, is accommodated
by changing the vapor density and the film radius. Thus,
differentiating Equation 4.18 with respect to time yields:
dMv 4 3 2 dR6w(R+ 4R. 4.22
Substitution from Equations 4.18, 4.19, 4.20 and
4.21into Equation 4.22 gives:
dMV Vf dP (TIV) v dTV f Pv dTRdt G T dT dt 2G T -dtv f IV fV f
dR4.+ 4 wR 6 pV . 4.23
Velocity of the Film/Liquid Interface
The equation of motion of the film/liquid interface
is given by:
U + 4.24dt4R 2P dt
The first term represents the motion of the inter-
face due to the dynamic imbalances between the film

119
pressure, Pf, and the ambient pressure, P.. The second
term represents the motion due to the change in phase
at the interface.
An exact determination of the velocity component
U requires simultaneous solution of the equations of
conservation of mass and conservation of momentum of the
liquid. For a spherically symmetric system the conser-
vation of mass is given by10 7:
+ u + p (r 2u) = 0 4.25
and the conservation of momentum, when the viscosity
is ignored, is given by 107'
pEu+ u -] = p - 4.26
where u is the radial velocity at any radius, r.
a) Case of Incompressible Liquid:
For incompressible liquids, the conservation of mass
yields
R2u = U . 4.14
r

120
By substituting from Eqn. 4.14 into Eqn. 4.26 and
integrating over radius between the film/liquid interface
108and infinity, the well known Rayleigh equation is
obtained:
Rd + U2 - P4.276 dt P
b) Case of Compressible, Acoustically Infinite Liquid:
When only outgoing pressure waves exist in the liquid,
the liquid is said to be acoustically infinite. For such
a system Kirkwood and Bethe proposed that the kinetic
2enthalpy r(h+ -) is propagated in the liquid with a speed
u + c, in such a manner that the kinetic enthalpy value
remains unchanged. Here c is the local speed of sound
and is given by
C =4.28dPX
and h is the specific enthalpy of the liquid and is
given by:
P
h - 4.29P P

121
When the Kirkwood-Bethe assumption is made, the equation
of motion of the interface of a spherical cavity has been
derived by Gilmorel10 as'
Rd ( ) + 3 U2 (1- ) = H(1+ ) + R6 ( U)dH 4.30
where C is the speed of sound in the liquid at the inter-
face and H is now given by
P(R6 ,t)
H dP h(P 4.31P P
Note that Eqn. 4.30 reduces to Rayleigh's equation for
incompressible liquid if C becomes infinite.
Ignoring the effects of density changes due to the
temperature changes within the thermal region, the relation
between the pressure and the density of the liquid can
be related as901.
p = P + B , 4.32
where m and B are constants.

122
Thus, by substituting from Eqn. 4.32 into Eqn. 4.28,
the speed of sound at the interface may be given by:
M-1
2 f + B mC-=CP + B.
2CO. 4.33
Substitution from Eqn. 4.33 in Eqn. 4.31 gives
C 2 C 2
m- O 4.34
Making use of Eqn. 4.34, Eqn. 4.30 can now be written as
R d(1- ) + 3U2l Cm (+R dt C 2u(--C m-l O(l+&
R 1C60 U 1 dPf+ --1 )( B)-d
4.35
Equation 4.35 provides the equivalent equation to that
of Rayleigh for incompressible liquid.
The Film Pressure
The pressure in the film is determined by Dalton's
law for partial pressures:
.
.

123
P = Pv + P . 4.36
Assuming the non-condensable gas may be treated
adiabatically, the partial gas pressure at any time is
given by:
g n
P =P* 4.37
0
where P is the initial partial pressure of the gas
in the film,
V* is the initial film volume, and
n is the adiabatic index of the non-condensable
gas.
From the assumption of vapor-liquid equilibrium at
the film/liquid interface, the vapor pressure is given by:
Pv P v). 4.21
The rate of change of the film pressure is obtained
by substitutions for Pv and P from Equations 4.37 and
4.21 in Equation 4.36 and differentiation with respect
to time:

124
dP dP(T I) dTIV P dVf
dt dTtV dt Vf dt 4.38
Method of Solution
Equations 4.7, 4.9, 4.15, 4.23, 4.24, 4.27 (or
4.35) and 4.38 constitute a set of non-linear first
order differential equations in the seven time-dependent
variables TR, Ttv, A or (Tc ), A, R6, U and Pf. These
equations are expressed in the form
7Z-K dY1K -Y' = fi
i=1
i = 1 ... , 7
where Yi is one of the variables TR, Tvv
A, R6, U and Pf, and
Ki and fi are expressions
Y i.
By successive substitutions
of 4.39, the time rate of change
can be expressed in the form:
4.39
X (or T C)
involving the variables
among the seven equations
for each variable, Y ,
dYi
dt = F -( YY2' '''' 7) , . . . 4.40

125
A simultaneous solution of the equations in the
form 4.40 has been obtained by numerical integration.
The computer program developed in Fortran IV language
for the solution is given in Appendix E. The numerical
integration subroutine, DHPCG, was provided by the Code
Library of M.I.T. Information Processing Center. In
the subroutine DHPCG the numerical integration is carried
out using a standard predictor corrector methodl30. An
essential feature of DHPCG is the ability to estimate
the local truncation error and to chose a smaller time
step for the integration if the truncation error exceeds
a preset value. In the cases presented in this chapter,
the maximum acceptable truncation error has been chosen
to keep the overall relative error in the calculated
variables less than 0.1%.
Since Equations 4.7 and 4.15 initially involve
infinite derivatives, an analytic solution suitable for
an initial small period of time is used to start the
numerical integration. The initial time solution assumes
a constant heat flux across the film and ignores the
small value of film/liquid interface velocity developed
in this initial period. The derivation of the expressions
used in calculating the starting values is given in
Appendix F. The sensitivity of the resultant film be-
havior to the assumed starting time was checked in

126
several cases. The results seemed to be insensitive to
the starting time values as long as the change in the
temperature drop across the film, TR - TIV, during this
initial period did not exceed 10% of the initial value.
The time steps for starting the numerical integra-
tion had to be extremely small (10-8 to 1011 second).
Larger values of the time steps would lead to instabilities
due to a reversal in the evaporation rate. (Too large a
time step would overestimate the increment in the film
pressure and, hence, an overestimated temperature at the
film/liquid interface. This increases the rate of heat
conduction in the liquid causing condensation of vapor.
Refer to Equation 4.17.) The time steps could be increased
(up to 10-6 seconds) after the pressure reaches its first
peak, as the rate of change of the pressure in the film
is then considerably smaller than the initial values. In
general the required time steps were smaller for cases
of large coolant subcoolings. In such cases the net heat
consumed in vaporization is a smaller fraction of the
total rate of heat transfer from the sphere. For the
largest case of subcooling of sodium (Case 17 of a stain-
less steel sphere in 2500C sodium, to be discussed in
Section 4.4), the time steps have been restricted to a
maximum of 10-10 seconds throughout the calculations.

127
A block diagram for the numerical integration scheme
is shown in Fig. 4.2.
4.3 Application of the Model to Hot Spheres in Water
The model developed in Section 4.2 has been applied
to the growth of a vapor film around hot spheres in water,
under various conditions. The temperature of the water
pool, the initial temperature of the hot sphere, the
thickness of the assumed initially present gaseous film
around the sphere, the material of the sphere and the
sphere radius have been varied to cover the ranges of
variation of these parameters in the reported experiments
of dropping hot molten materials in water (see Section
2.2.4). Table 4.2 summarizes the values of parameters
in the cases considered.
In all cases the rapid vaporization initially results
in a pressure rise in the film which accelerates the
film/liquid interface. However, the outward motion of the
interface continues beyond the equilibrium position (at
which the film pressure is equal to the ambient pressure).
Thus, the film pressure falls below the ambient level
leading to deceleration of the interface motion. The
film/liquid interface motion is then reversed, and the
film starts to collapse. The continued evaporation in
the film leads to a second pressure rise in the collapsing
film and the collapse is stopped before sphere/liquid

128
INPUT VALUES Y )
FIG. 4.2: BLOCK DIAGRAM FOR THE NUMERICAL INTEGRATIONSCHEME FOR THE VARIABLES (Y)
dYdt

Table 4.2
Values of the Parameters Varied for the Cases of Hot Spheres in Water+
Variables Nu1 2 3 4 5 6 7 8 9 10 11 12 13
Sphere Material Sn Sn Sn Sn Sn Sn Sn AgCl Sn Sn Sn Sn Sn
Initial Sphere 500 500 500 400 700 700 700 700 700 700 700 500 500Temperature, 0C
Tepra e, *C 20 50 80 20 20 20 20 20 20 20 20 20 80
Sphere Radius, em 0.3 0.3 0.3 0.3 0.3 0.3 0.3 0.3 0.1 1.0 0.3 0.3 0.3
Initial Film 10- 106 l5 l5 l0 l 4 605Thickness, cm 10 10 10 10 106 1 10- 5 10 10-5 l0-5
Coolant Compressibility
I = incompressible II I I C C C
C = compressible
+For all cases the initial film pressure and the ambient pressure are taken to be 1 atm.

130
contact is achieved. The cycle of growth and partial
collapse is repeated several times with decreasing ampli-
tude of the pressure fluctuations. The amplitude and
frequency of the film pressure during the oscillatory
growth depend on the conditions of interaction, as dis-
cussed in the following paragraphs.
A. Effect of Water Temperature
The time history of the pressure in the vapor film
for cases 1, 2 and 3 are shown in Figure 4.3. It is clear
that in spite of the initially larger pressure pulse, the
oscillatory behavior of the pressure is damped quickly
when the water subcooling is small. The reason for the
damped oscillations at lower subcoeling is the more rapid
vaporization obtained, which tends to prevent the pressure
in the film from reaching low subatmospheric values. The
energy consumed in vaporization and the growth history of
the vapor film are shown for cases 1, 2 and 3 in Figure
4.4 and Figure 4.5 respectively. The trend of increased
frequency of the growing film as water subcooling is
increased is similar to the experimentally observed trend
of oscillations of the vapor film reported by Board et al9.
The rates of heat transfer from the hot sphere for
cases 1, 2 and 3 are shown in Figure 4.6. When the heat
transfer rate (Fig. 4.6) is compared with the energy con-
sumed in vaporization (Fig. 4.4) it is seen that only
a small fraction of the transferred heat is consumed in

Sphere MaterialInitial Sphere Temp., *CPool Temp., *C
Sphere Radius, cmInitial Film Thickness, cm
C ase12
Sn500
variable0.310-5
Water Temp., *C2050
3 80
IAA
I\1
\ 1% , X' \ Iatm
-. ,case2case
I-
1/
I0 -3
Time (sec)
4.3 Effect of Water Pool Temperature onHistory of the Growing
the Pressure-Time
0CL102
a.
E
N
10
0
Fig.H1H
I I I
A
I
Film

nTH 20 = 80* C
C 220
N0 0-
0 TH 2 050C *CC O -20=
>
Sphere Material Sn0 Initial Sphere Temp., *C 500
E Pool Temp., *C variable
n Sphere Radius, cm 0.3o Initial Film Thickness, cm 10-5U
- 10 Case Water Temp.,*C1 202 --- 50
C 3 80
10 60-5 10~4Time (sec)
Fig.4.4 Effect of Water Pool Temperature on Vaporization Rate

Sphere Material Sno Initial Sphere Temp., *C 500X Pool Temp., *C variable case 3
10 sphere Radius, cm 03-E Initial Film Thicknesscm 10- case 2
Case Water Temp., *CU --- 20cae4)2 --- 50
3 800)
E
10~ -10- 6 10-5 10 0-3
Time (sec)
Fi A R L 45H t1 C; f1 Fi Growtho apor m Ig.- . s 1 o y

%%0QI)
U-
CL)
E
0
CCase
- 223
Sn500
variable
0.310-5
Water Temp.,*C205080
iseI
case 2
case 3
10-6 10-5Time (sec)
Fig. 4.6 Effect of Water Pool TemperatureTransfer from Hot Sphere
10-4
on the Rate of
10-3
F-wA
Heat J
Sphere MaterialInitial Sphere Temp., *CPool Temp., *CSphere Radius, cmInitial Film Thickness, cm
10
10 2

135
vaporization. The larger the water subcooling the smaller
is the fraction consumed in vaporization. The system
eventually approaches a near-zero vaporization rate.
Transient film boiling around spheres with no net vapori-
zation has been observed by Jacobson and Shair and
Stevens et al. for water subcoolings of 90 0 C to 500 C.
B. Effect of Hot Sphere Temperature
The pressure time histories for the vapor film in
cases 1, 4 and 5 are shown up to 0.1 msec in Fig. 4.7.
In Fig. 4.8 the envelopes of the pressure oscillations
between 0.1 msec and 1.0 msec for these cases (1, 4 and
5) are shown. As the tin temperature is increased, the
pressure oscillations have larger amplitudes initially,
but their frequency is decreased. The pressure oscilla-
tions are damped faster for the sphere of initial tempera-
ture of 700 0 C, as shown in Fig. 4.8. The present model
neglects the effects of convection in both the water pool
and the vapor film. It also neglects the bouyancy effects.
These two effects become more important at larger times
and hence the model cannot predict the eventual stability
of the film. Henry's correlation for stable film boiling
(see Appendix G) predicts eventual stable film boiling
for tin at 7000C, (in water at 200 C) but not for tin at
4000C or 5000C.

Sphere MaterialInitial Sphere Temp., *CPool Temp., *CSphere Radius, c mInitial Film Thickness, cm
cas case5casel \
'K
C as e4
5
Snvaria ble
200.310-5
Initia I Sphere Temp.,*C400500700
I'
IJ
%%*_~
/ \.;
'I
'I'I/
j, I10 -5
T ime ( se c)
Fig. 4.7 Effect of InitiaTime History
I Temperature of the Sphere on Pressure-
02
10
CL
E)
(0
10- 6 10-4
I
Ii

137
Sphere Material Sninitial Sphere Temp., *C Variable
40 Pool Temp., *C 20Sphere Radius, cm 0.3Initial Film Thickness, cm 10-5
Case Initial Sphere Temp., *C4 4001 5005 700
30- 500 Tsn= 700*C
01.
400
4 0010
50
700
0. 5 x 10- 3 10-3 I.5xO-3
Time (sec)
Fig. 4.8 Effect of Sphere Temperature on Envelope of PressureOscillations

138
C. Effect of Initial Gas Film Thickness
Figure 4.9 shows the pressure time history in a
film growing around a tin sphere at 7004C immersed in
water at 200 C, assuming the initial gaseous film around
the sphere has a thickness of 10-6 cm, 10- 5cm and 10 cm (case 5,
6 and 7). The influence of the initial thickness on
the pressure history is very significant. If a relatively
large amount of gas was swept with the drop into the
liquid, the initial boiling around the sphere would be
"quiet", since the large gaseous film retards the fast
transfer of heat to the liquid coolant which causes the
initial pressurization event.
D. Effect of the Sphere Material
Calculations have been performed for the case of
an AgCl sphere at 7000 C (Case 8). AgCl has been used
in dropping experiments at ANL 39. The thermal diffusivity
of AgCl is 0.0055 cm2/see while that of Sn is 0.17 cm2/sec.
The pkc value of AgC1 is also much lower than that of Sn
(.001 vs .033 in cal 2/cm4 sec deg ). The results of the
calculations were nearly identical to those of a Sn sphere
in water under the same conditions (Case 5). This strongly
suggests that the heat transfer rate for such cases is
determined by the water side. Further discussion of this
observation will be given in Section 4.4 of this chapter.

10
I I II I10- 10~ 10 -6 10 -5
Time (sec)
Fig. 4.9 Effect of Initial Gas Film Thickness, 80History
on Pressure - Time
CL
4I)%M.
CL

140
E. Effect of the Sphere Radius
The results for cases 8, 9 and 10 are shown in
Fig. 4.10. In these calculations the radius of the
sphere is the only varied parameter. The radius is
varied between 0.1 cm and 1.0 cm to cover the range of
particle radii used in dropping experiments at ANL 39 ,1 2
and G.C.E.B (U.K.) . The results indicate that the
amplitude of pressure pulsations is enhanced by the
increase in the sphere radius, however the frequency
of the oscillation is retarded. Board et al 0 have
reported an increase in the frequency of the oscillating
film with the decrease of the total heated area in ex-
periments of rapid laser heating of a nickel foil in
water. The theoretical trend of frequency change with
the heating area agrees with their results.
F. Effect of Liquid Compressibility
In cases 1 to 8 the water has been considered in-
compressible. In Fig. 4.11 a comparison is shown between
the pressure histories predicted for case 8 and case 11,
for which all the initial conditions are identical. In
case 11 the water is considered to be compressible. It
is clear from Fig. 4.11 that the treatment of water as
compressible leads to a significant reduction in the
pressure pulse amplitudes, and a faster stabilization
of the film pressure. As seen in Fig. 4.12 and Fig. 4.13
the trends of the pressure time history with the change

100
0.
10
10-6 10 -5 10-4Time (sec)
Fig. 4.10 Effect of Sphere
a)
I,)U'a)0~
I
_jJ=IjRadius on Pressur e- Time H i stor y

Sphere MaterialInitial Sphere Temp., *CPool Temp., *CSphere Radius, cmInitial Film Thickness, cm
case 8
00 case il
atm
Case8
Sn700200.310-5
Compressibility Appr ---- - Incompressible
Acoustically Infinite
pI'IlI'
ZT~
I/ \j 'I\
-7 10 - 6 10-5 10-4 10Time (sec)
Fig. 4.11 Effect of theHistory
Liquid Compressibility on Pressure -Time
C)CL 100 --
U)U)a)
I0
H_
1 1, 1
I

case Il
.- case 12
Sphere Material Sn
Initial Sphere Temp., *C variablePool Temp., *C 20
Sphere Radius, cm 0.3
Initial Film Thickness,cm 10-5
C ase Initial Sphere Temp.*C
I 70012 500
10- 310- 5
Time (sec)
Fig. 4.12 Effect of theTime History
Sphere Initial Temperature on Pressure-Using the Acoustic Approximation
-100W
a)
LU)In0)1.~0~ I0
I atm
10-6I I I
II
I

I IISphere Material
Initia I Sphere Temp., *CPool Temp., *C
Sphere Radius, cmInitial Film Thickness, cm
Sn500
variable0.310-5
Pool Temp., *C2080
- latm-
- -
10- 5
Time (sec)
4.13 Effect of theTime History
Water Pool Temperature on the Pressure -Using the Acoustic Approximation
00 [-U)
-
C ase
1213case 1 3
case 12
10 -
10-6
Fig.
10 -4 10-3
*4w
I

145
in the initial sphere temperature and the water tempera-
ture when the compressibility of water is irncluded are
similar to the cases where the water was considered
incompressible. Because of the Kirkwood-Bethe assumption
employed in the treatment of compressibility (see Section
4.2.3), the results of the compressible water treatment
may be invalidated by the presence of reflected pressure
waves in the liquid. For example, for a reflecting
surface at a 3 cm distance from the sphere surface the
Kirkwood-Bethe assumption would be invalidated in
, 2 x 10⁻⁵ seconds.
4.4 Application of the Model to Hot Spheres in Sodium
The model has also been applied to hot stainless
steel and UO2 spheres in liquid sodium. The initial
temperatures of the spheres and the liquid sodium have
been chosen from the range over which dropping experi-
ments have been reported in literature1 2' 1 3 ,35 . The sphere
radius and the initial thickness of the gaseous film have
been kept constant in this study, since the effect of
their variation is expected to be similar to that studied
in the water cases. The sphere radius is chosen to
approximate the radii of particles used in ANL dropping
experiments 35 . The initial film thickness is chosen
-6arbirtarily as 5 x 10~ for lack of experimental data
on the gas films that is swept with the molten particles
in dropping experiments. The values of the parameters

Table 4.3
Values of Parameters Varied for the Cases of Hot Spheres in Sodiumt
CaseNumber 14 15 16 17 18 19 20 21
Variable
Sphere Material SS SS SS SS U02 U02 U02 U02
Tempeature 0 2200 2200 2200 2200 3200 3200 3200 2200
Tempatur , 850 800 600 250 850 800 600 800
1For all ca es the sphere radius is 0.35 cm, the initial gas film thicknessis 5 x 10- cm; the initial film pressure and ambient pressure are at1 atm, and the liquid sodium is considered incompressible.
H
J=

147
in the cases considered are summarized in Table 4.3.
The results for the cases indicate the growth of
the vapor film will also follow an oscillatory pattern.
The amplitude and frequency of oscillation depend on
the conditions of the case as discussed in the following:
A. Effect of Sodium Temperature
The pressure time histories for cases 14 through
17 are shown in Fig. 4.14. The first pressure pulse is
seen to be higher for smaller sodium subcooling, because
of the larger initial pressurization rate. However, the
amplitude of the pressure oscillations following the
initial pressure rise exhibit a maximum for an intermediate
sodium subcooling. In other words, starting at near-
saturated sodium (i.e. case 14), as the subcooling is in-
creased the amplitude of the pressure fluctuations is
enhanced initially. Further subcooling, however, leads to
smaller amplitude of fluctuations. Farahat has reported
that the largest pressure pulse recorded in his experiments
during transition boiling showed a maximum for sodium at
about 715 0 C. He suggested an explanation which applies
for the present case also. In the case of small sodium
subcooling, as in case 14, the availability of a large
volume for the present vapor (see Fig. 4.15) prevents
large pressurization of the vapor due to the partial film
collapse. At the other end, i.e. for large sodium sub-

50
40
30
E 2 0
10
Fig. 4.14
10-6 10-5Tim .e (sec)
Effect of Sodium Pool Temperature on the Pressure - TimeHistory of the Film Growing at a Stainless Steel Sphere
HO

149
cooling as in case 18, the ability of liquid sodium to
absorb the heat of condensation is higher. Thus the
faster vapor condensation rate during the collapse pre-
vents the development of large pressurization. The
trend of enhancement of the amplitude of the pressure
pulses for an intermediate subcooling range is different
from the water cases, where the pulses increased in
amplitude with water subcooling, without a reversal at
low subcoolings.
In Figure 4.15, the history of vapor film growth
for cases 14 through 16 is shown. The film thickness
for case 17 remained less than 10- 5 cm for the time
period of 2.5 x 10⁻⁵ sec for which the calculation was
performed, and, therefore, lie outside the scale of
Fig. 4.15, The rate of heat transfer from the sphere
for cases 14 through 17 is shown in Fig. 4.16. The
rate of heat transfer is seen to be more rapidly de-
creasing for lower sodium subcoolings because of the
faster growth of the film. In Fig. 4.17, the rate of
heat consumption in evaporation is shown for cases 14
through 16. Comparison of the total heat transfer rate
from the sphere (Fig. 4.16) and the rate of heat con-
sumption in evaporation (Fig. 4.17) indicate that the
heat consumed in evaporation is a small fraction of the
total heat transfer rate from the sphere.

- Sphere MaterialInitial Sphere TernPool Temp., *CSphere Radius, cInitial Film Thickn
1OH F
I,
C ase141516
SSp., 0 C 2200
variable c ase 14m 0.35ess, cm 5 x 10⁻⁶
Pool Temp., *C850
- 800- 600
case 16
10-5Time (sec)
Fig. 4.15 History of Vapor Film Growth
00-'0'C
EU
U)
i-
t
10-110-3
C)7
I

I I
case 17
case 16
Sphere Material SSInitial Sphere Temp., *C 2200Pool Temp., *C variable
-. Sphere Radius, cm 0.35Initial Film Thickness, cm 5 x 10- case 15
Case Pool Temp.,*C14 85015 80016 600 case 14
- 17 250
610-6 IT0 4
Time (sec)Fig. 4.16 Effect of Sodium Pool Temperature
Transfer from the Hot Sphereon Rate of Heat
10 4
+-
U)*~)
0r
10-
1-
I
10 3
I

CU
0
C
E
0
.
C
CP
0
e)
Sodium Pool Temperature
40 -
20 caee 14
case 15
P-44
0 -
Sphere Material SSInitial Sphere Temp., *C 2200Pool Temp., *C variable
20 Sphere Radius, cm 0.35Initial Film Thickness, cm 5 x 10⁶
C a s e Pool Temp., C14 850
- 5 - 80016 600
10-6 10 5 ecT ime (sec)
1--H.U,on Rate of VaporizationFig. 4.17 E ff ect of

153
The effect of sodium pool temperature on the pressure
history of a film growing around a UO2 sphere in sodium
is shown in Fig. 4.18. The results indicate the pressure
pulses produced when the sodium temperature is at 800*C
are larger than those for sodium at either 8500C and 6000C,
as observed for stainless steel in Fig. 4.14.
B. Effect of Hot Sphere Temperature
The effect of the initial hot sphere temperature on
the pressure time history for a vapor film growing in
sodium is obtained by comparing the results for cases
18 and 21. In Fig. 4.19 the pressure time history for
both cases is shown. It is seen that as the sphere
initial temperature is increased, the amplitude of the
pressure pulses is increased but the frequency is de-
creased. This trend is similar to the trend observed
for the cases of water (Fig. 4.7).
C. Effect of Sphere Material
The pressure time histories for the film in cases
14 and 21 are plotted in Fig. 4.20. All the parameters
in these two cases are identical except for the sphere
material. The results indicate that the sphere material
has some influence on the pressure history, which was
not observed for the water cases. The stainless steel
sphere (thermal diffusivity of 0.038 cm2/sec) encounters
higher pressure pulses than the UO2 sphere (thermal

154
diffusivity of 0.005 cm 2/sec). The effect of the material
properties of the sphere is apparently more important for
a film growing in sodium than in water.

case 18
case 19\
I-
//
//
Vt
Sphere MaterialInitial Sphere Temp., *CPool Temp., 0 CSphere Radius, cminitial Film Thickness, cm
Case1918
U0 23200var iable0.35
5x 10⁻⁶Sodium Temp., *C
850800
20 600
case 2030- I'
I''II'I'I'
I atm
-h
10-5
Time (sec)
Fig. 4.18 Effect of Sodium Pool Temperature on the Pressure - TimeHistory of a Film Growing at a Uo2 Sphere
60
50
40E)
LL
20
0
I'IiiI'I ~j It
jiii
I
10-6
HU,U,
I

case 18/
/-I
//
//
Sphere MaterialInitial Sphere Temp., *CPool Temp., oCSphere Radius, cmInitial Film Thickness, cm
C ase2118case 21
U02variable
8000.35
5 x 10⁻⁶
Initial Sphere Temp.,*C22003200
II'I'1~
IIJLAZI atm
10-6 io- 5 10-4Time (sec)
L
Fig.4.19 Effect of Initial
60
50
40
C)
U)
20
10
Lim / %\Ulko'j
30
Sphere Temperature on Pressure -imfe History

Sphere Material variableInit ial Sphere Temp.,O*c 2 200
50 Pool Temp., *c 800
Sphere Radius, cm 0.35Initiail Film Thickness, cm 5 x 10⁻⁶
Q. case 14 Case Sphere Materia I40- 21 U02
14 Ss
30 case 2
E-L 20\
Ilatm l
10-
0-6 10-5 10-4
Time (sec)
Fig. 4.20 Effect of Sphere Material Properties on Pressure-TimeHistory

158
Chapter Five
THE MECHANISM OF FREE-CONTACT FRAGMENTATION
OF HOT MOLTEN MATERIALS IN COOLANTS
Page
5.1 Introduction 159
5.2 Modes of Fragmentation 159
5.3 Summary of Experimental Observations 162of Free-Contact Fragmentation
5.4 Discussion of Previously Advanced 164Mechanisms
5.4.1 Shell Solidification 164
5.4.2 Coolant Encapsulation 164
5.4.3 Acoustic Pulse in the Coolant 168
5.4.4 Spontaneous Nucleation of 170the Coolant
5.4.5 Bubble Growth and Collapse 172
5.5 A Proposed Mechanism of Fragmentation 172

159
Chapter Five
THE MECHANISM OF FREE-CONTACT FRAGMENTATION OF
HOT MOLTEN MATERIALS IN COOLANTS
5.1 Introduction
The fragmentation of hot molten materials as they
contact relatively cold liquids has been observed under
several experimental conditions. A review of these
experiments is given in Chapter 2: Sections 2.2.2, 2.2.3
and 2.2.4. The experimental observations indicate the
presence of four modes of fragmentation as described in
Section 5.2. These modes of fragmentation depend on the
conditions of contact of the two fluids. In this chapter,
the physical mechanism inducing fragmentation of hot
molten materials under free-contact conditions is investi-
gated. A mechanism based on cavitation within the molten
material due to the pressure pulses of transient film
boiling at the molten surface is shown to predict most of
the observed fragmentation behavior.
5.2 Modes of Fragmentation
The observed fragmentation of hot molten materials
in coolants can be categorized according to four distin-
guishable conditions of contact of the two fluids:

160
1. Entrapment Fragmentation was demonstrated in
6the experiments of Long involving dropping of large
quantities ( 50 lbs) of molten aluminum in water (See
Section 2.2.2). This mode of fragmentation is induced
by the evaporation of coolant entrapped between the hot
molten material and a solid surface. In Long's experi-
ments, when the entrapment of water was made difficult
by greasing or painting the bottom of the water container,
fragmentation of the aluminum was prevented.
2. Impact Fragmentation was demonstrated in the
shock tube experiments of Wright34 and others 15 (See
Section 2.2.3). In those experiments a column of water
held in a tube impacted on hot molten metals at the
bottom of the tube. Impact fragmentation has been
attributed to the effects of the mechanical impact .
Recently, the observed fragmentation and vapor explosions
in shock tube experiments have been associated with
spontaneous nucleation of the coolant and with the
48dispersal of the coolant within the molten material
The limited data available from shock tube experiments
does not provide conclusive evidence for any of these
proposed mechanisms of fragmentation. However, since
aluminum fragments under shock-tube conditions but does
not fragment -when dropped in small quantities in water

161
(as other metals do), the impact of the water column
seems to be necessary for producing this mode of fragmen-
tation.
3. Hydrodynamic Fragmentation was demonstrated in
the experiments of Ivins38 and Delhaye 1 5 involving the
fragmentation of mercury in water under isothermal con-
15338ditions (See Section 2.2.4). This mode of fragmen-
tation is caused by the nonuniformity of the forces
resisting the motion of a deformable body in a fluid.
Hydrodynamic fragmentation is sometimes referred to as
the Weber Number Effect since a critical Weber Number has
to be exceeded if hydrodynamic fragmentation is to take
place. This mode of fragmentation has been thoroughly
40analyzed by Hinze
4. Free-Contact Fragmentation was demonstrated in
several experiments involving the dropping of small
amounts (of the order of one gram) of hot molten materials
in relatively cold liquids. The observed fragmentation
occurred under conditions that do not lead to fragmentation
by the preceding three modes. Free-contact fragmentation
is highly influenced by the temperatures of the two fluids,
which indicates the thermal nature of the mechanism inducing
this mode of fragmentation. Several mechanisms have been
advanced to explain free-contact fragmentation, but none

162
seem to be successful in predicting the observed trends
of fragmentation. The previously advanced mechanisms are
discussed in Section 5.4. In Section 5.5 a hypothesis
that is capable of predicting the experimentally observed
behavior of fragmentation is advanced.
5.3 Summary of the Experimental Observations of Free-
Contact Fragmentation
The following observations are summarized from re-
ported experiments involving dropping a small amount of
molten material in a pool of relatively cold liquid. A
detailed review of such experiments has been given in
Section 2.2.4. The interpretation of the dropping experi-
ments must take into consideration the possible contri-
bution of hydrodynamic fragmentation to the over-all
observed fragmentation. The trends of fragmentation as
the initial temperature of the hot material or the tem-
perature of the coolant pool changes can be attributed to
the free-contact mode of fragmentation. When the Weber
Number is kept below the critical value (" 13), fragmen-
tation is due only to the free-contact mechanism. With
these qualifications, the following experimentally deter-
mined behavior can be considered characteristic of the
free-contact mode of fragmentation:
1. Fragmentation occurs for some but not all hot

163
molten materials dropped with equal initial
temperature in water.
2. Some hot materials, at the same temperature ,
fragment in sodium but not in water.
3. For all tested materials, fragmentation in water
is reduced by the increase of the water tempera-
ture between 00C and 800 C.
4. For highly subcooled sodium (200*C - 400*C),
fragmentation of stainless steel is enchanced by
the increase of the sodium temperature. In some
experiments3 5 the trend of fragmentation enhance-
ment with the increase in the sodium temperature
seems to be continued up to a temperature of
128200 C. Other experiments indicate a reversal
in this trend as the sodium temperature is
increased from 400 0C to 6000C.
5. As the initial temperature of the molten material
is increased, fragmentation of some of the molten
materials in water is enhanced. In some cases,
the enhancement of fragmentation occurs only
within a certain range of temperatures (See
Figs. 2.7 through 2.11).
6. The fragmentation seems to result from internal
pressure generation in the molten material, as

164
evidenced by the outward burst of metals in the
experiments of Flory et al.4 3 (See Fig. 2.12),
and Bradley et al. 4 6
5.4 Discussion of Previously Advanced Mechanisms
Numerous physical mechanisms have been suggested to
explain the free-contact mode of fragmentation. Table 5.1
summarizes these mechanisms. Some of these mechanisms are
discounted by experimental observations as pointed out
in the following.
5.4.1 Shell Solidification
Fragmentation may be postulated to result from
pressurization of the molten core of the hot material due
to shrinkage of the solidifying surface. This mechanism,
however, is incapable of explaining the observed fragmen-
tation of bismuth in water39,45, since bismuth volume
increases about 3% upon solidification. Furthermore, the
fragmentation of hot mercury (melting point -38.8 0 C) in
water45 is also inexplicable by this mechanism.
5.4.2 Coolant Encapsulation
Fragmentation has been suggested to result from
the evaporation of an amount of coolant that penetrates
the molten material3l 4 3,48. There is difficulty, however,

165
Table 5.1
Suggested Mechanisms of Free-Contact Fragmentation
1. Shell Solidification
2. Coolant Encapsulation:
a. by cracks in a solidifying shell
b. by Helmholtz instabilities
c. by penetration of a coolant jet
3. Acoustic Pulse in the Coolant
4. Spontaneous Nucleation of the Coolant
5. Vapor Bubble Growth and Collapse
6. Cavitation within the Molten Material (Proposedin the present study)

166
in defining the mechanism by which the coolant penetrates
the molten material which, in many cases, is at a tempera-
ture higher than the critical temperature of the coolant
(e.g., Tin at 50000 fragments in 200C water while the
water critical temperature is 374*C). At such high tem-
peratures, mere contact of the liquid coolant with the
molten material induces spontaneous nucleation in the
coolant.
Sallack31 suggested encapsulation takes place in cracks
77in the solidified surface. Hsiao's calculations indicate
that the thermal and contraction stresses are of maximum
values at the instant at which the solid shell starts to
develop. Thus, the solidifying shell is most likely to
develop cracks when the shell thickness is very small. If
such is the case, no significant penetration of coolant
can occur. Also, the fragmentation of bismuth and mercury
cannot be explained by this penetration mechanism.
Flory et al. suggested encapsulation of coolant is
due to the development of surface instabilities in the
molten material. Again, the ripples formed at the molten
surface by these instabilities, called Helmholtz insta-
bilities, were of small size. Even when liquid coolant is
assumed to be encapsulated within the ripples, the pene-
tration of the coolant would be too small to explain the

167
central cavities observed in some of the aluminum drops in
the experiments of Flory et al. (See Fig. 2.12).
Board et al. have recently suggested that penetra-
tion of a jet of coolant into the hot molten material may
result when a vapor film collapses at the molten surface.
(Stevens et al. have also suggested an association of
the film collapse with fragmentation, but have not advanced
a defined mechanism for the process.) The jet would hydro-
dynamically disperse within the hot material, and the
energy transfer to the small dispersed coolant droplets
would then result in fragmentation of the hot material.
Plesset and Chapman114 have considered the formation of
a jet of coolant by a collapse of a vapor bubble near a
solid (rigid) wall. Their results indicate that the jet
will be formed at the later stages of the. collapse when
the bubble radius has become even less than half its
original value. Considering the blanket collapse around
a hot molten drop may be approximately treated, at least
initially, as a collapse of a vapor bubble, the initial
radius of the vapor blanket would have to be at least
twice the radius of the molten drop to form the penetrating
jet. Such thick vapor blankets are not observed to exist
around the molten drops prior to their fragmentation (See
Fig. 2.12).

168
5.4.3 Acoustic Pulse in the Coolant
It has been suggested7 that fragmentation may
be associated with the pressure pulse that develops in
the liquid coolant due to instantaneous heating of the
coolant at the interface with the hot molten material.
If a constrained volume of liquid suddenly undergoes
a temperature changeof AT, the pressure in the liquid
volume is changed by an amount AP given by:
AP g)v AT. 5.1
3T T
Tin
T2
If perfect contact is postulated between the hot
material (initially at a temperature T1 ) and the coolant
(initially at a temperature T2 ), the interface temperature,
Tin, assumes an intermediate value that may be calculated
considering each of the materials semi-infinite in extension.

169
The solution of the heat conduction problem of this type
is given by Carslaw and Jaegerl15 (page 70). The inter-
face temperature is found to be constant in time and given
by:
(pkc)Ti 1 1-T2) 5.2
i 1 / (pkc)1 2 (pkc) 2
where p, k, and c are the density, thermal conductivity
and specific heat respectively.
Thus, at the time of contact, the coolant at the
interface develops a pressure increase given by:
AP v (inT 2 * 5.3
By substitution from equation 5.2 into equation 5.3,
equation 5.3 may be written as:
.A3 P f (T1T54= +P) 1 + f 1-T2),
where
f (pkc) 1/(pkc) 2 - 5.5
This pressure pulse at the interface with the hot
surface propagates in the coolant as a pressure wave, and
the pressure at the interface is reduced very rapidly.
(The acoustic velocity in water is "' 1500 m/sec at 20*0C

170
and in sodium is ^v 2500 m/sec at 550 0 C. ) From equation
5.4, it is clear that the pressure pulse developed at the
interface of a certain combination of hot and cold materials
would be larger the larger is the difference (T1-T2). It
is then expected that the extent of fragmentation by this
mechanism, for a certain material combination, would
increase proportional to (T 1-T2). This is contradictory
to the observed decrease in the fragmentation of stainless
steel (initially at 22000C) in sodium as the sodium tem-
perature decreases between 820 0 C and 2000C in the experi-
ments of Swift and Pavlik35 and between 4000C and 200 0C
in the experiments of Armstrong. 12
5.4.4 Spontaneous Nucleation of the Coolant
It has. been suggested that if the interface tempera-
ture defined by equation 5.2 is higher than the spontaneous
nucleation temperature of the coolant, the high localized
pressures resulting from the nucleation would extensively
116fragment the hot material also. The spontaneous nucleation
temperature of sodium and water are calculated in Appendix H.
In Table 5.2 the spontaneous nucleation temperatures are
compared to the interface temperatures for the conditions
of some fragmentation experiments. It is evident that for
molten uranium dioxide and stainless steel in sodium the

171
Table 5.2
Comparison of Spontaneous Nucleation Temperatures of
Sodium and Water with Temperatures at the Interface
of Some Molten Materials
Coolant Molten Material Tin, 0C Ts.n. 0
(Temp., *C) (Temp., *C) (Eq. 5.2) (App. H)
UO2
(2900) 1130 1850Sodium(600)
Stainless Steel 1346 1850(2200)
Pb(700) 543 314
Water(20)
(70) 543 314
All the molten materials are reported to fragment underthe experimental conditions.

172
interface temperatures are much below the spontaneous
nucleation temperature, and hence the observed fragmen-
tation cannot be explained by this mechanism.
5.4.5 Bubble Growth and Collapse
Vapor bubble growth and collapse at the surface of
the molten materials have been suggested to induce free-
contact fragmentation.6 This mechanism is incompatible
with the observed fragmentation of molten metals in water,
when the metal water is at temperatures higher than the
critical temperature of water.
For sodium, Judd has shown that the pressure pulse
generated by the collapse of a vapor bubble is higher for
lower temperatures of sodium. Thus an association of
fragmentation with the pressure pulses of the collapsing
bubbles predicts an increase in the extent of fragmentation
of stainless steel at lower sodium temperatures, contrary
to the observed trend of fragmentation at large sub-
coolings of sodium.
5.5 A Proposed Mechanism of Fragmentation
In Chapter 4 a model has been developed to simulate
the dynamics of the growth of a vapor film around a hot
spherical particle in a coolant. The results of the model
indicate that large pressure pulsations accompany, under

173
certain conditions, the growth of the vapor film. A
rapidly changing pressure at the surface of a molten
material gives rise to pressure waves within the molten
material. As the pressure fluctuations created at the
surface of a spherical (or cylindrical) particle travel
towards the center (or axis) of the particle, the pressure
fluctuations are expected to be magnified. Camp1 25
(page 64) treats the problem of pressure distribution
inside a nonviscous compressible fluid for a spherically
symmetric, time-wise sinusoidally varying pressure wave.
He finds the spatial distribution may be given by:
P(r) = e +kr, 5.6
where P(r) is the pressure at radius r, and
A, k are constants depending on the particular
problem.
Equation 5.6 substantiates the possibility of magnifying
the pressure fluctuations created at the surface of the
molten drop. The pressure at the molten surface due to
the growth of a vapor film would exhibit, as calculated
in Chapter 4, positive and negative fluctuations about
the initially uniform pressure in the molten drop-coolant
system, which in the calculations of Chapter 4 was taken
to be 1 atm. Therefore, subatmospheric pressures obtained
at the surface can momentarily reach very large "negative"

174
values near the drop center, thus facilitating internal
cavitation in the molten material which leads to the
observed fragmentation. (Cavitation is used here to
denote the process of growth of vapor nuclei within a
liquid when the liquid pressure is reduced. The. vapor
nuclei in a liquid may also grow if the liquid, at the
original pressure, is sufficiently superheated; a process
usually called spontaneous or homogeneous nucleation.)
Internal cavitation in a liquid due to negative liquid
pressure' has been the subject of several experimental
studies. 1 1 7- 1 20 It is particularly interesting that the
possibility of inducing cavitation in a liquid by an
oscillatory pressure field, in which the reduction of
the liquid pressure required for cavitation is obtained
intermittently, has been well deomonstrated in experiments
involving the application of high intensity sound fields
to several liquids. 120,121 This phenomenon is usually
referred to as acoustic cavitation.
In Appendix H, the theoretical negative pressures
required to facilitate cavitation in molten metals are
estimated using an expression developed by Bernathl22
The theoretical negative values required for cavitation
are very large. Cavitation, however, may be obtained at
smaller values of negative pressures should the molten
material contain impurities or dissolved gases. For

175
water at room temperature under negative pressures of few
atmospheres 19 , i.e., below the theoretical value required
for cavitation by two orders of magnitude. This proposed
mechanism for free-contact fragmentation seems particularly
suitable to explain the internal cavities produced in
aluminum in the experiments of Flory et al. , and the
expansion in the size of the molten jet prior to the
fragmentation in the experiments of Bradley et al.
Other observed fragmentation behavior can also be predicted
by this mechanism, as demonstrated in the following:
1. The analytic results of Chapter 4 indicate that
lower water temperatures lead to lower sub-
atmospheric values of pressure in the vapor
film growing around a tin sphere in water. The
film pressure behavior was also observed to be
insensitive to the thermal diffusivity of the
sphere material. Thus it is expected that larger
"negative" pressures could be obtained, in all
materials, as the water temperature is decreased.
Therefore, more extensive fragmentation is
expected at lower water temperatures, in agreement
with the observed behavior of all materials that
fragmented in water. In Fig. 5.1, the maximum
reduction in the film pressure as calculated by

RESULTS OF ANL EXPERIMENTS FOR DROPINITIALLY AT I, 5000C (REF. 12 and 39)
CALCULATED MAXIMUM SUBATMOSPHERICREDUCTION OF FILM PRESSURE FOR SPHERESINITIALLY AT 5000C (FIG. 4.3)
8
P4
- 6 -
8C14
4LI
WATER POOL TEMP., 0C WATER POOL TEMP., *C
FIG. 5.1: COMPARISON OF THE EFFECT OF WATER POOL TEMPERATURE ON THE FRAGMENTATIONIN WATER AND ON THE MAXIMUM SUBATMOSPHERIC PRESSURE REDUCTION IN A VAPORFILM GROWING AROUND A HOT PARTICLE IN WATER.
r=
-1
P4%
0
0
Ml
P.4
3001
200
100
H

177
the model of Chapter 4 is compared to the pro-
jected area of fragments for Sn and AgCl as
obtained in experiments conducted at ANL. 12 ,39
The data for fragmentation of Bi in 804C water
is unavailable but the general trend of the frag-
mentation of Bi in water at 4*C, 220C and 500 C
(Fig. 2.9) is diminshed with the increase in
water temperature.
2. As the temperature of liquid sodium is decreased
in the range 250-8500 C, the analytic results
indicate that there is an intermediate sodium
temperature below which the subatmospheric re-
duction in pressure is decreased with the decrease
in the sodium temperature. Therefore, the extent
of fragmentation is to be enhanced within an
intermediate range of temperatures. This is in
agreement with the observed trend of fragmentation
in Armstrong's12 experiments (See Fig. 5.2). The
diminished fragmentation of stainless steel in
sodium as the sodium temperature is reduced has
also been qualitatively observed by Swift and
Pavlik 3 5,36 for a sodium temperature range of
250-820 *C. The qualitative results of Amblard's1 3
experiment of dropping UO2 in sodium also indicate
more extensive fragmentation took place in 4000C
sodium than in 2000C sodium.

RESULTS OF ANL EXPERIMENTS (AREA ISBASED ON MEAN DIAMETER OF FRAGMENTSGIVEN IN REF. 12)
T 2 200*C
/U1~
T =18000 C
-r/)
8
CALCULATED MAXIMUM SUBATMOSPHERICREDUCTION OF FILM PRESSURE (FIG. 4.14)
T 22004C
bO
zw
0
:E:
I
200 400 600
SODIUM POOL TEMP., *C
800 200 400 600 800
SODIUM POOL TEMP., 0C
FIG. 5.2: COMPARISON OF THE EFFECT OF SODIUM POOL TEMPERATURE ON THE FRAGMENTATIONOF STAINLESS STEEL IN SODIUM AND THE MAXIMUM SUBATMOSPHERIC PRESSUREREDUCTION IN A VAPOR FILM GROWING AROUND A STAINLESS STEEL PARTICLE INSODIUM.
2 -
0.6
0.~4
0.2~ r
H-
I I I I
6 |-
I

179
3. Under the same conditions of pressure pulsation
at the sphere surface (i.e., for the same negative
pressures obtained in the molten material),
fragmentation should be easier to produce in
molten materials of lower surface tension (See
Appendix H). The results of the analytic model
of Chapter 4 suggest the thermal diffusivity of
the hot sphere material does not have appreciable
influence on the pressure oscillations of the
vapor film growth in H20. Thus, for initial drop
temperature of 7004C, the extent of fragmentation
of At, Zn, Pb and Bi should increase in that
order. (Surface tension values are given in
Appendix I.) Indeed the results of the ANL
experiments show that no fragmentation occurs
at free-contact conditions with 204C water for
At (a = 900 dyne/cm) and Zn (a = 750 dyne/cm)
but that fragmentation occurs for Pb (a = 400
dyne/cm) and Bi (a ~ 350 dyne/cm). The fragmen-
tation of Bi is observed to be more extensive
than that of Pb.
4. For the same coolant temperature, larger amplitude
of the pressure oscillations in the film are pre-
dicted as the initial temperature of the molten

180
drop is increased (See Fig. 4.7 and Fig. 4.19).
The predicted enhancement of the extent of
fragmentation of stainless steel in sodium with
the increase in the initial drop temperature is
in good agreement with the observed trend35,36
(Fig. 2.2). For water at 200C, the predicted
enhancement of fragmentation of Bi and Pb is
also in agreement with the observed trend (See
Fig. 5.3). The data of ANL for Sn/H 2 0 system
show enhancement with the increase in the initial
tin temperature up to 5000C, followed by a re-
versal of this trend for initial tin temperatures
in the experimentally observed range of 500-800*C.
The Sn behavior is not readily explainable, but
could be related to the rapid stabilization of
the vapor film at temperatures above 50000 (See
Fig. 4.8). The minimum temperature at the hot
surface that is required to stabilize film boiling,
T , for several hot surface/liquid material com-
binations seems to be best correlated by the.11
expression proposed by Henryll3 (Appendix G).
The values of T for Sn, Pb and Bi as predicted
by Henry's correlation are shown in Fig. 5.3.
It is interesting to note that the film sta-
bilization temperature for Sn in 200C water

RESULTS OF ANL EXPERIMENTS WITH 200C WATER(REF. 12, 39)
CALCULATED MAXIMUM SUBATMOSPHERICREDUCTION OF FILM PRESSURE FOR WATERPOOL AT 200C (FIG. 4.7)
B1
aU
0
I'l-
0
0
0
U
9'
c.-.4p-I
8p-I
10 1-
91-
8
Pb
S0
T SI
I. - .- I
40 u buu dOO
TPb Bi
.J-L
INITIAL DROP TEMP., 0C
7|-
600 s00
coH-
IIL+uU
INITIAL DROP TEMP., *C
FIG. 5.3: COMPARISON OF THE EFFECT OF THE INITIAL TEMPERATURE OF THE HOT MATERIALON THE FRAGMENTATION IN WATER AND THE MAXIMUM SUBATMOSPHERIC FILMPRESSURE REDUCTION IN A WATER POOL AT 200C
4001-
30 O-
0
2001-
10 -
I f

182
(600 0 C) limits the range for which extensive
free-contact fragmentation of tin was observed.
While the values of T for Bi (9600 C) and Pb
(940 0C) lie beyond the experimental range of the
initial drop temperature of 500-8000C.
Based on the above discussed behavior of the frag-
mentation of tin, it can be hypothesized that fragmentation
takes place only if the initial temperature of the molten
material, Thi, was below the film stabilization temperature,
T . Then fragmentation occurs if
*TM.P. < Thi < T 5.6
The criterion 5.6 is capable of explaining the
observed fragmentation behavior of tin in the ANL experi-
ments. However it cannot be further supported by the
available data on fragmentation of other materials, because
of the limited range of the initial temperature, Thi, used
in the experiments. From equation 5.6 it is seen however
that free-contact fragmentation is expected only if the
melting point of a material is less than the film stabi-
lization temperature, i.e., if
TM.P. < T. 5.7
The fragmentation data can be used to verify the relaxed
criterion of 5.7. In Fig. 5.4 this criterion is tested

183
UO2
FRAGMENTATIONNOT EXPECTED
2 -FRAGMENTATION 20 EXPECTED
C)
o NiSS
Au 0Agg
Ate0A FRAGMENTATION OCCURS
Zn@Pb A FRAGMENTATION DOESBiA NOT OCCUR
SnA&
WOOD'S METAL A
1 2
MINIMUM TEMPERATURE FOR FILM BOILING IN A WATER POOLOF BULK TEMPERATURE 200 C, 1034C
FIG. 5.4: COMPARISON OF THE OBSERVED FRAGMENTATION BEHAVIORIN 200C WATER WITH THE STABLE FILM CRITERION

184
for the fragmentation of molten materials in 200C water.
The criterion shows good agreement with the experimental
results. In Fig. 5.5 it is seen that the criterion also
satisfies the observed fragmentation in 250*C sodium.
It is interesting to note that the materials pre-
dicted to fragment in Fig. 5.4 (Sn, Bi, Pb and Wood's
metal) have surface tension values lower than the materials
predicted not to fragment (Zn, At, Ag, Au, SS, Ni and UO ).
The validity of criterion 5.7 should be further tested in
future experiments by observing the fragmentation of a
material that satisfies the criterion but has a surface
tension value less than that of Bi and Pb (i.e., a < 300
dyne/cm). Should such a material fragment, then the
agreement between the criterion 5.7 and the water experi-
ments of Fig. 5.4 is coincidental only.
Equation 5.6 represents even a more restricted
criterion for fragmentation. The criterion satisfies the
results of the ANL Sn/H 20 experiments. However, frag-
mentation of Sn at initial temperatures higher than the
film stabilization temperature is reported to take place
in experiments at other laboratories.4 3,48 The conflicting
results could be due to the difference in the size of the
molten tin drops used in the experiments. For example,
in the experiments of Board et al. the tin drops were

185
UO2 A
FRAGMENTATION
EXPECTED
2 ~2
0 ZrA
0 Ni ASA
zE-1
1 AgA
AtAA FRAGMENTATION OCCURS
9 FRAGMENTATION DOESNOT OCCUR (NO CASESEXIST)
5 10 15
MINIMUM TEMPERATURE FOR FILM BOILING IN A SODIUM POOL
OF BULK TEMPERATURE 2500 C, 10 3 oc
FIG. 5.5: COMPARISON OF THE OBSERVED FRAGMENTATION BEHAVIORIN 250 0 C SODIUM WITH THE STABLE FILM CRITERION

186
"few grams" in weight while in the ANL experiments the tin
drop was "approximately 0.3 gm in weight". The more ex-
tensive fragmentation of the larger drops may be due to
hydrodynamic fragmentation (higher Weber Number). Another
possible explanation is the larger amplitude of pressure
pulsation in the film growing around larger particles as
indicated by the results of the analytic model (Fig. 4.9).
Both larger surface subatmospheric pressure reduction and
volume of the molten drop increase the internal volume of
the liquid which may be subjected to the large negative
pressures required for cavitation.
Finally, if cavitation due to the pressure pulses of
the growing film is the mechanism inducing the fragmentation,
then fragmentation should be observed within a short time
of the initial contact of the molten material and the
coolant. The accurate estimate of the time which would
theoretically be expected to elapse between the initial
contact of the two fluids and the fragmentation phenomenon
requires a solution of the problem of a cavity growing
within the molten material under the expected dynamic
pressure conditions. An order of magnitude estimate of
the time for growth of a cavity may be obtained by con-
sidering the calculations that have been conducted by
Flynn121 for cavities growing in water under acoustic
pressure fields. For an acoustic pressure field of an

187
amplitude of 0.8 atm and of a frequency of 24.5 kc/sec.,
a cavity of 0.027 cm radius was shown by Flynn to
approximately double its size in 1 msec. The calculations
121of Flynn ., however, indicate the sensitivity of the
maximum radius to which a bubble may grow to the initial
radius of the cavity as well as the frequency of the
oscillatory pressure. For smaller frequencies (longer
periods), larger radii may be achieved.
It should be noted that the case considered by Flynn
is different from our case in two respects: 1) the surface
tension values of the molten materials of interest are
higher than the water surface tension; which implies that
larger values of negative pressures are required in the
present case to maintain the same rate of cavity growth,
and 2) the amplitudes of the pressure fluctuations above
1 atm are higher, in our case, than the subatmospheric
pressure amplitudes which would tend to retard the cavity
growth rate calculated for an acoustic pressure field.
The calculations of Flynn should, therefore, be considered
representative only of the order of magnitude of the
times involved inthe growth of cavities in the molten
materials of interest.
The experimental data on the time elapsed between
the initial contact of the molten material and the coolant
are not always reported. Flory et al.4 3 find the most

188
violent cases of fragmentation to occur "almost instan-
taneously" upon contact of the molten material and the
water. Witte et al.45 observed delay time ranging between
3 and 80 milliseconds. The fragmentation process itself
takes place in a shorter time (< 1 msec., See Fig. 2.12a).
The time required for growth of cavities under dynamic
pressure conditions, as discussed above, seem to be of
the same magnitude of the limited reported experimental
data.
In summary, the proposed mechanism of cavitation
induced free-contact fragmentation due to pressure pulsa-
tion at the surface of the molten material is capable of
explaining the experimentally observed trends of fragmen-
tation:
1. Enhanced fragmentation of molten materials for
greater subcoolings of water.
2. Enhanced fragmentation of stainless steel for
an intermediate subcooling of sodium.
3. The apparent internal pressure generation within
the quenched molten material.
4. The observed fragmentation of some but not all
molten materials in water.
5. The increased fragmentation of Pb, Bi and AgCl
in water and stainless steel in sodium for increased
initial drop temperatures.
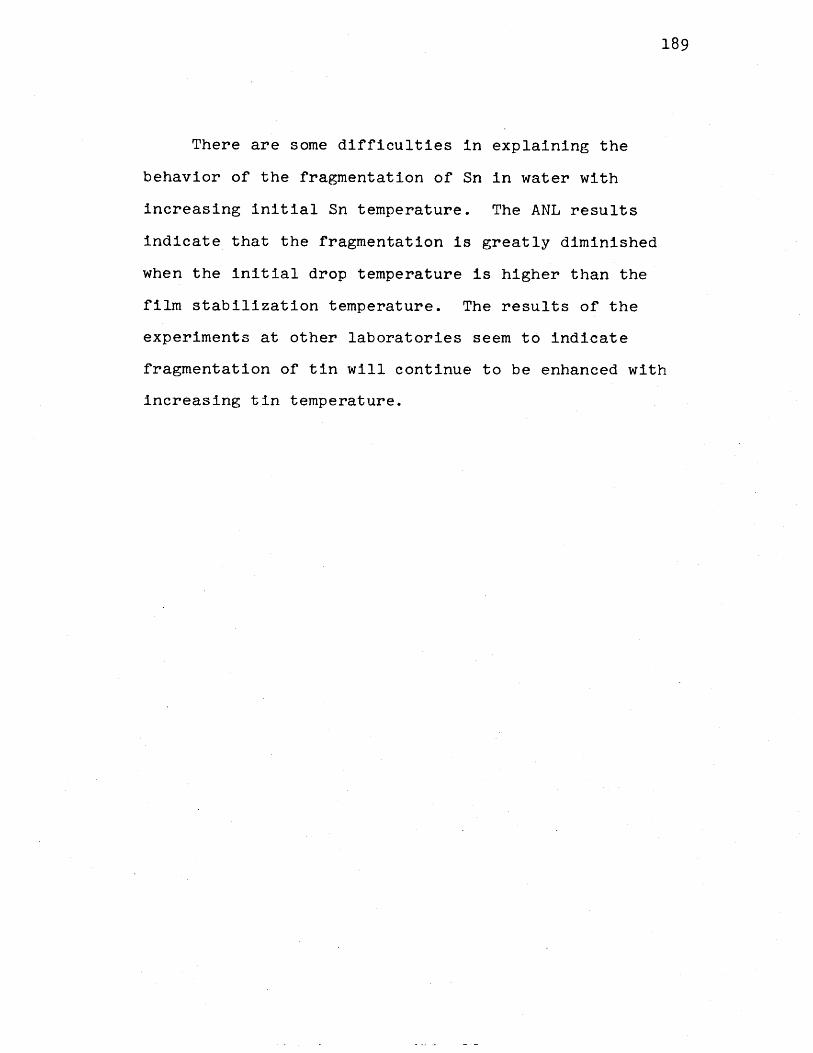
189
There are some difficulties in explaining the
behavior of the fragmentation of Sn in water with
increasing initial Sn temperature. The ANL results
indicate that the fragmentation is greatly diminished
when the initial drop temperature is higher than the
film stabilization temperature. The results of the
experiments at other laboratories seem to indicate
fragmentation of tin will continue to be enhanced with
increasing tin temperature.

190
Chapter Six
CONCLUSION
Page
6.1 Summary
6.2 Recommendations for Future Work
191
194

191
Chapter Six
CONCLUSION
6.1 Summary
Two aspects of the thermal interaction of hot molten
fuel and coolant that may take place under LMFBR accident
conditions have been investigated:
1. The effect of gas/vapor blanketing of the fuel
on the pressure and mechanical work that may
develop due to fragmentation of the molten
fuel in sodium, and
2. The association of the phenomenon of fragmentation
of molten fuel as it contacts sodium with the
pressure pulses that accompany transient vapor
film formation at the molten surface.
In Chapter 3, a model developed at Argonne National
Laboratory to analyze the fragmentation-induced vapor
explosions in LMFBR accidents has been modified to include
the effect of gas/vapor blanketing of the fuel. The
modified model accounts for both thermal resistance and
the compliance of the gas/vapor blanket. The modified
model has been applied to several cases involving a
hypothetical accident in an FFTF subassembly to assess the

192
effects of gas/vapor blanketing of fuel on post-fragmentation
generation of pressure and mechanical work. The major
conclusions of this study are:
1. Gas/vapor blanketing of the fuel reduces,
but does not preclude the high pressure that
may be developed by the thermal interaction.
2. The mechanical work generated by the thermal
interaction is considerably reduced when gas!
vapor blanketing is accounted for.
In Chapter 4, a model has been formulated to simulate
the dynamic growth of a vapor film around a hot spherical
particle which is suddenly immersed in a large pool of
relatively cold liquid. The model has been applied to
several cases of hot spheres in both water and sodium.
The results indicate that the rapid vaporization initially
leads to a pressure rise in the film which drives the
film growth in an oscillatory manner. The film pressure
exhibits a damped oscillatory behavior in which sub-
atmospheric values of pressure are repeatedly.reached.
The conclusions of this study are:
1. In water, the pressure oscillations are more
quickly damped as the subcooling is decreased.
2. In sodium, the amplitude of the pressure
oscillations exhibits a maximum for an intermediate
range of subcooling.

193
3. In both water and sodium, for a fixed coolant
temperature, the increase in the initial sphere
temperature leads to increased amplitude of
pressure fluctuations.
4. The thermal properties of the hot sphere seem not
to influence the pressure history of the film in
water, but have a small effect in sodium.
5. Higher pressures accompany the growth of the vapor
film for increased sphere radius.
In Chapter 5, a hypothesis has been advanced to explain
the observed fragmentation of hot molten materials in
coolants under free-contact conditions. The hypothesis
relates the observed fragmentation to internal cavitation
within the molten materials due to the dynamic conditions
of pressure at the molten surface. The observed frag-
mentation behavior in reported experiments involving
dropping of small molten particles in both sodium and
water has been compared in Chapter 5 to the predicted
behavior by this hypothesis. The predicted behavior is
in general agreement with the observed one. It is noted,
however, that the available experimental data on free-
contact fragmentation in some instances shows conflicting
fragmentation behavior. Possible explanations for this
contradictory behavior have been advanced in Chapter 5.

194
Further experimental investigation seems to be required
for confirming the proposed explanations as discussed in
Section 6.2.
6.2 Recommendations for Future Work
The hypothesis of cavitation-induced fragmentation,
advanced in Chapter 5, merits further investigation.
Both theoretical -and experimental work may be suggested
to further examine the hypothesis.
Theoretical studies can be directed to analysis of
the pressure field established within the molten material
under conditions of pulsating pressure at the surface.
The knowledge of the time varying pressure field within
the molten material could be utilized in the assessment
of the time required for internal cavities to grow within
the hot molten materials to large sizes, at which frag-
mentation can be expected. Such information should be
of direct interest in the description of the rate of
generation of the fuel surface area in the models developed
for LMFBR. accident analysis.
Experimental investigations are needed for both
reexamining what seems to be conflicting trends of frag-
mentation and verification of the proposed mechanism of
fragmentation. As have been discussed in Chapter 5, the
fragmentation of molten tin in water in the ANL experiments12
seem to be enhanced as the initial temperature of tin is

195
increased up to a temperature of "5004C, beyond which
free-contact fragmentation is diminished. Other quali-
tative data43,4 8 indicates fragmentation of tin is in-
creased with the increase in the initial temperature up
to 9000C. Additionally, fragmentation of bismuth, lead
and silver chloride have been observed in other ANL
experiments to, in general, be enhanced with the increased
initial temperature of the molten material up to a tem-
perature of 8004C. Future experiments should involve
dropping of molten materials other than Sn in subcooled
water such that the initial temperature of the molten
drop be higher than the temperature required to stabilize
film boiling in the water. Bismuth and lead initially
at 10000C may be dropped in 200C water to satisfy such a
condition (See Fig. 5.3). If the fragmentation of such
high temperature molten materials is diminished, then
the tin fragmentation behavior may be induced by the
stabilization of the vapor film as proposed in the present
study. The influence of the size of the molten drop has
been suggested in Chapter 5 as a possible explanation
for the conflicting results of tin fragmentation in water.
An experimental investigation involving dropping tin
particles at the same initial temperature from the same
height above a water pool can be conducted to establish

196
the effect of the radius of the molten particle.
Another investigation may be necessary to establish
the effect of sodium temperature on the fragmentation
of stainless steel. Quantitative results of fragmentation
in a range higher than the available Armstrong data 1 2
(200-6000C) would verify the trend of enhancement of
fragmentation at an intermediate sodium subcooling. In
all future experiments, data on the time elapsed between
initial contact and actual fragmentation should be sought,
as it serves as basis for comparing theoretical fragmen-
tation mechanisms, which could then be useful in specifying
the time-rate of fuel area generation in models of LMFBR
accident analysis.
An experimental investigation of the possibility of
inducing fragmentation in hot molten materials by rapid
reduction of the surface pressure is required to verify
the proposed mechanism of fragmentation. The dynamic
pressure conditions in the growing film may be simulated
by a sound field acting at the surface of a molten hot
material. In effect, this would serve to confirm that
acoustic cavitation, which is a well-established phenomenon
for liquids of small surface tension values,121 can also
occur in the molten materials of high surface tension
values as those used in fragmentation studies.

197
Appendix A
Contribution of Radiative Heat Transfer
to Total Heat Transfer in Film Boiling
Consider a spherical hot particle in a liquid under-
going film boiling at the hot surface. Heat will be trans-
ferred across the film by radiation and conduction. Assuming
the thickness of the film is small compared with the sphere
radius, the thermal flux due to radiation is given by 131.
1/c= + 14 T 4r 1/c h + l/Ez Cl (h - Tv
where
The th
A.1
a = Stephent s constant = 1.38x10⁻¹² cal/cm2 sec4K
Ch' c.= the emissivity of the sphere and the
liquid respectively,
Th, Tzv = the temperatures of the sphere surface
and the film/liquid interface.
ermal flux due to conduction is given by:
q" kc = (T h - T tv)'
where k = vapor conductivityv
6 = vapor film thickness.
A.2
From A.1 and A.2, the ratio of q" and q" is:r c
qI
q r
4 T46a Th tv
k v lh+ 1/E-l) Th TvA 3

198
The ratio of radiative to conductive heat flux is directly
proportional to the film thickness 6. Consider the film
thickness at which the ratio q" : q" = 0.1:r C
0.lkg (Th - T v
6 A.40.1 4 4
l/Eh+l/E .1 h -Tv
Consider a Uo2 sphere (32000 K) in sodium (11530 K)
Since no data is available for eNa and EUo2, assume con-
servatively that eUo = 1.0 (black body) ,2
ENa = 0.1 (all metals reported in Ref. 131
have emissivity values less than
0.1)
k =.2x10 cal/cm sec K
The value of 60.1 is obtained from equation A.4 as:
6 43x1 cm. A.50.1 33 x 10
Consider a metallic sphere (1000 0 K) in water (373 0 K).
Again let Emetal 0.1
H o = 1.0
kv = 9 x 1-5 cal/cm sec 0K
Then, by substitution in equation A.4 we obtain
60.1 = 400 x 10~4 cm . A.6
For the range of surface temperatures and film thick-
nesses encountered in this study, the error in estimating
the rate of heat transfer across the film introduced by

199
neglecting the radiation heat transfer does not exceed 10%.

200
Appendix B
On the Average Film Temperature
In both chapters 3 and 4 of this study, the tempera-
ture profile in the gaseous film was assumed a linear function
of distance. The average temperature of the gases in the
film can be estimated under such conditions as follows:
Hot FilmSphere
Th
TIV
+-6+ Coldx Liquid
The average temperature in the film for any profile,
T(r), is given by: 6
OT OT(r) 4wr2 dx6 ,6 B.1
of p 4wr 2 dx
where x = r-R, and
R = radius of the hot sphere.
For a relatively thin film (i.e. x<<R),
r R and hence equation B.1 reduces to
6
fTf =~ 0pT dx .B.2fo p dx

201
The density of a perfect gas is given by:
PB3=B.3
Substituting from equation B.3 in equation B.2
gives:
T f= 6 dx B.4
f dx0 T
The assumption of linear temperature in the film
yields:
T - Th -T B.5h TEv
By differentiation of equation B.5 we get
dx = - dT B.6h Iv
Thus, changing the variable from x to T in equation
B.4 yields:
TvT h f dT Th - T V
T fT - =n(Th /Tv) B.7
T dTTh
In Table B.1 the values of Tf as obtained from equation
B.7 are compared to the values obtained from the approximation:
T +TT = h 2V B.8f2

202
TABLE B.1
Comparison of the Exact and Approximate Film Temperature
T Th tv-1
v ~n(Th-Tv)
1.44
1.82
2.16
T Th tv+1
T 2
1.5
2.0
2.5
For the cases encountered in this study, the value of
Th/ tv has always been less than 3 for the water coolant and
less than 4 for the sodium coolant. Therefore, the error
in T when estimated by equation B.7 is at most 13.6%, which
gives negligible effect on the calculated parameters of
interest.
Th
T v
2
3
4

203
Appendix C
Estimation of the Effects of Nonequilibrium
Conditions on the Dynamic Vapor Film Growth
The kinetic theory can be used to obtain the following
expression for the net evaporation at a vapor/liquid inter-
facel28 .
dM v 1 e.dt -- /T /Ti v
C.1
Where P = the saturation pressure at the liquid
interface temperature, Ti,
P = the vapor pressure,
T = the saturation temperature at a pressure Pv'v
G = the vapor gas constant,
ne = accomodation factor for evaporation,
c = accomodation factor for condensation, and
' = a correction factor for the net vapor mass
at the interface, reflecting the effect of
the vapor "progress" velocity away from the
interface given by:
dMv
r = 1 - t
1rGTV
C.2

204
By substitution from equation C.2 into equation C.1
we obtain:
dMv 2 1 e n c _v--V2, [ ][e ]0.3dt 2-nc /rid /3 c~
v
If the accomodation coefficients for evaporation and
condensation are assumed equal:
i.e. 1 e = nc 'n
then equation C.3 reduces to:
dMv 2n 1 P P ydt [ --n] / -. c.4
i V
Let Pi = Pv + AP ,and C.5
T = Tv + AT -. 6
If AP is smaller than P and AT is smaller than TV, then
by substitution from equations C.5 and C.6 into equation
C.4 the net rate of evaporation may be given by:
dM 2 n P' Al AT[ - ] C.7
/22 GT v v
For pressures as low as 0.001 atm, for metal vapors
and water, the magnitude of AT/2T is around 3 to 4% of
AP/P. At higher pressures this relative magnitude is smaller.
Thus, if AT/2T is neglected in equation C.7, the equationv

205
reduces to:
=AP C.8
dt 2 - n/2IGTV
Equation C.8 permits the estimation of the amount of
superheat required in the liquid to supply a net evaporation
rate of dMvvdt
In the calculations performed in chapter 4, the maxi-
mum rate of heat consumption in vaporization around hot
spheres in water was 26 cal/sec (See Fig. 4.4). This
belongs to a maximum evaporation flux at the film radius,
R=0.3 cm, of
dM 26 2( )= 262 = 0.083 lb m/ft2.sec
max 4wR h g
By substituting the values G=86 ft - lb f/lbm OR and
T = 672 0 R in equation C.8 we obtain
AP = 8.8 (2-D) lbf/ft 2
= 0.061 (&n) psi C.9
The values of the accomodation coefficients have been
summarized by Wylie and Brodkey 129, and range between very
low (.001) to very high (1.0). Rohsenowl28 has suggested
that when attention is paid to the cleanliness of the vapor/
liquid interface in the experiments and to precision in
measurements, the value of n tends to be close to unity.
If n is taken to be unity in equation C.10 the expected

206
value of AP is only 0.061 psi. Thus the corresponding
superheat required to maintain the observed evaporation rate
is less than 10 C. Thus the assumption made in chapter 4
that the vapor/liquid interface is at equilibrium does not
introduce appreciable error.
For the cases of hot spheres in sodium, the maximum
rate of heat consumption in vaporization was 40 cal/sec
(for case 18). Using the same steps outlined above for
the water case we obtain the value of AP to sustain such
a rate of evaporation (around a sphere of 0.35 cm radius and
for the values G = 67.3 lbm/ft2 .sec and Tv=2020 0 R) to be:
AP = 0.075 psi.
The corresponding value of AT is again less than 1C which
indicates the suitability of the equilibrium assumption.

207
Appendix D
On the Adequacy of the Integral Method for
Describing the Heat Transfer in the
Model for Dynamic Vapor Film Growth
In chapter 3, a model has been developed to simulate
the growth of a vapor film around a sphere immersed in a
coolant. The integral approximation has been used for the
description of the heat transfer in the hot sphere and the
coolant. In the integral approximation, the heat conduction
equation is satisfied over thermally-active regions in both
the sphere and the liquid, assuming a certain temperature
profile exists in the active region. The integral approxi-
mation thus leads to a coupling between the total amount of
heat transferred across both interfaces of the vapor film
and the rate at which the heat is transferred at any time,
without satisfying the heat conduction equation at each
infinitesimal volume element within the sphere or the liquid.
Such an approach is employed to overcome the difficulty of
solving the heat transfer equation in each medium with the
nonlinear boundary conditions. Quadratic temperature profiles
have been assumed in both the sphere and the liquid. The
assumption of a monotonic temperature profile along with
the integral approach has been used by Judd1 0 0 ,1 0 1 and
Theofanous et al. 102 ,1 03 to describe the heat transfer in
the liquid surrounding growing or collapsing vapor bubbles.
Both models have reported successful application of the method

208
to the cases of growing bubbles in superheated liquids but
encountered cases where the method would fail to describe
the heat transfer around collapsing bubble in subcooled
liquidsl 01'1 03 . In both treatments the net change of the
vapor bubble energy had to be supplied (or withdrawn) by
the heat flux at the liquid/vapor interface. Thus the heat
flux at the interface is specified. Additionally the
temperature of the liquid/vapor interface is specified by
the conditions in the bubble (through the equilibrium
condition in Judd's model and the nonequilibrium condition
101in the model of Theofanous et al.). As reported by Judd ,
the integral method with a monotonic temperature profile
would fail when the specified heat flux at the bubble inter-
face would mean the transfer of heat across the thermally
active region from the boundary of a lower temperature to
the boundary of a higher temperature. Theofanous et al. 10 3 ,
do not elaborate on the reason for the failure of the method
in their study beyond stating that the treatment is inadequate
in case vaporization develops in a collapsing bubble as it
rebounds. It is seen, however, that in their model vapori-
zation can not be accounted for should it develop while the
liquid temperature at the bubble interface is higher than the
bulk liquid temperature, since then the required vaporization
energy cannot be supplied.
In the present model the rate of change of the vapor
energy is equal to the difference between the rates of heat

209
supply by the hot sphere and the heat transmission to the
liquid (i.e., evaporation takes place when the difference
between the heat supply and heat transmission rates is
positive and condensation takes place when the difference
is negative). Thus a reversal of the temperature gradient
at the interface is not required when vaporization changes
to condensation or vise versa. Difficulties as those des-
101cribed by Judd , have not resulted in any of the calculated
cases of this study.
Two additional remarks about the integral method are
worth mentioning here. First, the method gives indefinite
values for the heat fluxes at both sides of the film at the
zero-time moment. A solution applicable for short times
after the start of the interaction was used to specify the
starting conditions for the code (see Appendix F). Secondly,
very short time steps have to be used at the beginning as
the film pressure starts to depart from the initial condition
so as not to reverse the evaporation rate. The required
time steps vary with the rate at which the film pressure
is undergoing change initially. The time steps can be in-
creased after the first peak pressure is reached. In the
numerical subroutine used, a maximum allowable time step is
specified but the time advancement can use shorter steps to
keep the truncation errors within a specified maximum value.
In all cases, the value of the specified maximum truncation
error has been chosen to keep the overall relative error

210
less than 0.1%.
As a part of this study, attempts were also made to
describe the heat transfer in the sphere and the liquid by
a finite-difference formulation. In this method the sphere
and the liquid are divided into a number of concentric
shells, each at a uniform temperature. The heat transfer
between each two adjacent shells depends on the temperature
difference between the two shells and their inter-resistance.
Thus one is immediately faced with the question of appropriate
selection of shell thickness. The large thermal gradients
involved require small shell thicknesses which limits the
time step that can be used. The time steps are limited
throughout the calculation and cannot be increased as the
vapor film grows. Thus, for the cases calculated up to
about 5 x 10⁻⁵ sec, the calculations of the film growth by
the finite-difference formulation were about three to five
times more expensive than the calculations using the integral
method. With the finite difference formulation, two options
have been tried for the boundary conditions of equal tempera-
tures- on both sides of the sphere/film interface and the
film/liquid interface. As one option, the vapor temperature
at both interfaces may be equated to the temperature of
the shell in contact with the vapor film as shown in Fig.
D.l.a. As the second option, the vapor temperature may
be equated to interface temperatures dissociated from the
first shell temperatures, as shown in Fig. D.l.b. The two

211
Q)'
C/)
I jI g
I I
I I
-I
I II I
.3-
+ radius
Fig. D.la
IFI-
ro
.-H
I II I
I II I
-+ radius
Fig. D.2b
Fig. D.1 Illustration of Options for Film Boundary Temperature

212
treatments result in somewhat different pressure-time
history, as shown in Fig. D.2. In fact the pressure-time
history of the film predicted by the finite difference
method is influenced by the choice of the shell thicknesses
(in all calculations the ratio of the shell-thickness in the
sphere to that in the liquid has been taken to be equal to
the square root of the ratio of their thermal diffusivities,
i.e., (Ar)h /(Ar) h . No "saturation" of the influence
of shell thickness was seen even when the water shell thick-
ness was decreased to equal 3 x 10⁻⁵ cm. The pressure time
history as calculated by the finite difference approximation,
with the water shell thickness as small as 3 x 10⁻⁵ cm, also
departs from the results of the integral method. However,
because of the arbitrariness of the finite-difference results,
depending on the shell thickness, no confidence can be
assigned to its results.
The finite difference formulation with interface
temperatures dissociated from the adjacent shell temperatures
exhibited small fluctuations of pressure about the "average"
trend of pressure. Taking smaller time-steps produces a
"smoother" development of pressure.
Using even smaller shell thicknesses than the ones
already used in calculations and changing the numerical
integration scheme from a predictor-corrector method
(which is equivalent to a partially explicit and partially
implicit integration scheme) to a fully implicit method to

213
Initial Sphere Temperature = 400 0 CWater Pool Temperature = 200CInitial Film Thickness = lo-5cm
IntegralF.D., (Ar)H 20 = 3 x 10⁻⁵ cm
---- F.D., (Ar)H 20 = 6 x 10⁻⁶ cm------- F.D., (Ar)H 20 = 3 x 10⁻⁵ cm
interface temperature dis-sociated from shell temperature.
m F.D., (Ar)H 20 = 3 x 10⁻⁵ cm,interface shell thickness isAr/2.
I atm.
- 10
- 5
10-6 10-5C
TIME, sec
Results of the Calculations of the First
Pressure Pulse Using Integral and Finite Difference
Approximations to Describe the Heat Transfer
100
50
PL.4
Fig. D2

214
ensure stability may have improved the agreement between the
results of the finite difference and the integral formula-
tion. Using both smaller shell thicknesses and an implicit
method of integration would have also increased the expenses
of the calculation. The solution of the heat transfer problem
by finite difference methods was, therefore, discontinued
in this study in favor of the integral method.

Appendix E. Listing of the Computer Program for Dynamic Vapor Film Growth, FILDYN
C VAPCR FILM DYNAMICS =FILCYNCC THE NCCEI CESC.RIHES THE CYNAMIC CRCWTH CF A VAPOR FILM ARCLND AC HOT PARTICLE IMMERSED IN A LARGE APCUNT CF LIQUIC. THE INTFGPALC MET CC IS USFD Tr DESCRIPF THE HEAT TRANSFER IN BOTH THE SPHEREC ANC THE LICUID. AN INITIAL GASEOUS FILM IS ASSUMED TO EXIST AT THEC INTERFACE OF THE SPHERF AND THE LICUID. THE FILP/LICUIC INTFRFACEC IS ASSUMED TO BE AT THERMCDYNAMIC EQUILIBRIUM CCNDITICANS AT ALLC TIMES. THE EQUATION CF MCTTCN CF THE INTERFACE IS OPTICNAL BETIEENC THAT ASSOCIATED WITF AN INCCEPRESSIELE LIQUID CR THAT ASSOCIATECC WITI- AN ACCUSTICALLY INFINITE CCMPRESSIELE LIQUIDCCC THE PROGRAM CCNSISTS CF FOUR PARTS A MAIN PART ANC THREEC SLBRCUTINES. SUBROUTINE FCT SUPPLIES THE DIFFERENTIAL EAUATIONSC DESCRIBING THE PHYSICAL PROCESSES IN THE SYSTEM. SUBROLTINE CHFPCGC IS A STANDARD INTEGRATICN SUBRCUTINE SUPPLIED BY M.I.T. COCEC LIBRARY AT THE INFORMATICN PRCCESSING CENTER. SUBROUTINE CLTFC SPECIFIES THE OUTPUT FORMAT ANC ANY OTHER OUANTITIES TC EF PRINTEDC BY MANIPULATION OF THE MAIN VARIALSLS.CC
IMPLICIT REAL*8 (A-H,0-Z)REAL*8 KHKLKVINTECER*4 CCMDIMENSICN Y(7) ,DERY(7),FRMT (9) ,ALX (16,7) ,TIT(20)COMMCN /Pl/RAHKHTHIALKLKVGTB,RUL,PINFS,PGO,GAPVFC,L IC,CC
EXTERNAL FCT,0UUTPCC REAC INPUT PARAMETERS AND INITIAL VALUESC
REAC.(5,5) (TIT(I),I=1,2G)REAC (5,10) (PRMT(I),I=1,4),NCIM*LICCCMREAC (5,20) R.AH.KHTHIREAC (5,30) ALKL,KVG, TBRULFINF,S

REA C (5,40) (Y( I), I=1,7), (DERY (MI =1,7)REAC (5,'50). PGO ,GAm,VFCF CQP -T (20A4 )FCRAT (401C.4,313)FCRMAT (4C1C.4)FORfPAT (801C.4)FCRIA T (701C.4)FCRPAT (3C10.4)
CC WRITE SYSTEm PARAMETERSC
WRITE (E,2C4) (PPMT(I),I=1,4)204 FORMAT (//,' VAPOR FILM DYNAMIC
1 ' TC TIME T = '010.4.' SEC ',21C.4,' SEC ',//,' LPPER ERRCR P
WRITE (6.2C2) (TIT(I),I=1,2C)202 FGRMAT (/,5X,20A4)
WRITE (6,2C5) R.AHKHTHI205 FCRMAT (//,' PROPERTIES CF HOT
1.DIC.4,/,' THERVAL CIFFUSIVITY2NDUCTIVITY (CAL/CM.SEC.DEG K) =
S ',//,'//,' INICUN IS
SPHERE '
(Cm SC/S01cIC.4
FROM TIME T = ',[1C.4,1OX,TIAL TIME INCRENEAT IS ',D',010.4)
,/,EC)
,/,
' SPHERF RADIUS (CM) = I',C10.4,/,' TI-RMAL CO
'INITIAL SPHEFE TEMPERA3TURE (DEG K) = ',D10.4)
WRITE (f,2C6) ALKLKVGTBRUL.,FINF,S206 FORMAT (//,' PROPERTIES OF-FLUIC 'o/, 0 THERMAL DIFFUSIVITV (CM SC
1/SEC) = ',010.4,/,' LICUTC THERtAL CCNELCTIVITY (C8L/CM.SEC.DEG K2) = ',D10.4,/, VAPOR THERMAL CCNCtCIIITY (CAL/CM.SEC.CEG K) ='3010.4,/,' GAS CCNSTANT (PSI.CM*3/CEG K) = .010.4,/,' INITIAL LICL41C TEMPERATURE (CEG K) = '.D10.4,/' LICUID DENSITY (CM/Cl*3) =5.010.4,/,' AMBIENT PRESSURE (PSI) = ',CIC.4,/,' SOUNr VELCCITY IN6 LICLID (CM/SEC) = ',D1C.4)WRITE (6,207) PGCGAMVFC
207 FCRNAT (/,' INITIAL GAS PROPERTIFS a/,'1 PARTIAL GAS P0 ESSLRE (PSI)11) =',D1C.4,/,' ADIA9ATIC GAS INCEX = ',D10.4,/,' INITIAL FILM V)2LUMF (CM*3) = ',C1C.4)
IF (LCIQ.NE.1) GC TO 222WRITE (6,221)
51020304050

221 FORMAT (/,SX.15ITAQUTDCC IC 224
222 PITE (6,223)223 FORlAT (/,5X,16ILII[D224 If (CCM.NF.1) GC TC 212
SRITF (6,211)211 FCRMT (/,5X,35FLICUT
GC TC 214212 WRITE (6.213)213 FCPtNA.T (/,5X,33FLIOUICO214 CONT INUE
CC ST AR T CCUL AT IC NSC
PRMT (9)=21C.Y(1)=R+Y(I1)
201 CALL CHFCG(PRMT,Y,DERYCCC
5152
536C6162199
TS aTER,/)
IS SEDIlM,/)
IS CCNSICEREC INCCMPRESSIBLF,/)
IS CCNSTIERFD
,NCIMIHLFFCTCLTPAUX)
ERRCF MESSAGES
IF (X.GF.PRMT(2) ) CC TC SIF (PRMT(5).NE.O.0) GC TC 51GC TC 52WRITE (6,61) PRMT(5)IF (IHLF.GT.10) GO TC 53CC TC 6CWRITF (6,62) IHLFCONT INUEFOR"tT ( PARAMETER 5 IS , 01C.4)FORW T (' 1I-LF IS ',13)STCPENC
CCivQRESSlBLE,/ )

SLBRNCUT IN E FCT( (YvERY )
Tf~PL C IT R)EiL*8 ( A-F-,-7)REtL*8 I<H,t,KVINTECFR*4 CCMU WFK~STCN YU.tCERY (3CCUMICN /RI/RAHKHTF-I ,ALKLKV.GTPP'JLPTNF, SP~r,CA?',VFC,[IC,,C!
U=Y (2)TI-.=*Y ()T R =Y (5.)T H CV( 3TV= .50* TW+. 95*TRI F (Y(6 ) .GE .(R-LI. C- C4sIF ([IC.NE.1) GC TC 5
Y ( 6 ) = R
INATER CtSE CALCULATICN CF VAPCP PRESSURE
HFG=r -45.P=14.7*CEXP(I-FG/.1103*(1./373-.-1./TW))DP=F-FG*P/ (*1 103*TW**2)CC TC 6
SM[IUM CASF ;CAICILAICN OF VAPCP PRESSURE
5 P=DF(P(15.3838-(12767./T ))/TW**0.613'44*14.17DP=P*(l2767.8/T'A**2-0.61344/Ti)FFC=S!0 .
6 RUVi=P/( G*T )IF(Y((6)-R)1,2
CC Tf 32 DOT=12.565 *R**?*(TF-C-TA)/( (PC-R)/KV*+R*.5./KH)3 D1=PC-R
C2= (PC**2-R**2) /2.
CC
CCC
CCC

D73= (f f*43R**3) /I-c4= (Pf**1t-R**4) /4.05~= (fPC*5 .- R*-*5)J/5.A 1.=Y (6) /R
A 3= 1. ./f. .- A 1 /6. +,A I*-"2/2C.C 1='v(7) /Y( 1)C2?=1 ./3 .+C 1/6.1-C l**2/3C .
QC=2'-.l3*KL*pfl4*2*(T,A-TP)/Y(7)VF= 12.c5f:*03P G= PC C(V F C/V F)4~*GCAPF=F+PGIJMI= (FOOT-CC) /I-FG
8 C[=Y(2)+D'Vf(12.565r-*RC**2*RUL)IF ('6)-R) lO.2C92C
c TFPRNAL PENFTRATIO\ IS L.ESS TF-Ar TFE RACIUS, OF THE SPi-ERE
I DOCT=12.565*R**2*(T-T-Tft)/( (Nr-R)/KVi+Y.(6)'*.5/KH)10 (1= (2.+A2/A3 )*Kt-/Y (6) +KV/Dl
G3=12.565*fl3*(DP-.5*P/TV )/(G':TV)64= 12.565*C3*P/ (2.*C*TV**2)
rFTR= (KVy 'TW/rI-C2*DCCT )/C 1CER () =DRF-IF (COM NE .I ) GC TC IC2
CC CASF OF iNCVmPRESSIELF LICUICc
D0FRY(2J=( (PF-PINF)/RUL-*6.894C~ .*(2*2)Y1GC if 1C3
C CASE C!F CrY~PRESSIPLE LTIIC

C102 flPF=CP*CTW-CM*FG*2565*PC**?>*CRi/viF
B=4 -4C 4C'=S*((PF+t3)/(PINF4P))**.423uc= I .-uicUrc= 1 .+uicfERY(2)=(UCC/6.*(C*"*2-S**?).pC*UC*C/(7.*(PF+B) )*CPF-1.-c*L**2*( 1.-U.
1C3 CCNTINUECER(3) =0.0CEPY (4) =flTiCERV (5)=DTP
GC TC 3CC.C TH~ERMAL PFERTC IS FOUAL TO THE PACIUS. CF THE SPHEREC
20 Cl=c.*KH/R+KV/DIG2=(15.*AH/P**2-0RC/Cl)/(12.56c.*R**2)G3=12-.5(5*C3*(DF-.5*p/T,)/I(C*TV)G4=12.565*C?*P/( 2.*G*TV**2)C.Tih=(CMV-12.565*RC**2*RUV*CpD-C2*C4*CQCT/G1.)/(G3-KV*G,4/(Cl*G I))DTR =(KV*f~TYI/01-G2*DCDT I/ClCERN (1)=DRCIF i(CCM.NE.I.) GC TO 105
CC CASE' OF INCO~MPRESS18LE LIQUIDc
!ERY(2)=( (PF-PTNF)/pQUL*6-.8q4C £4l.5*Y(2)**?)/Ytl)CC, TC 106
CC CASE OlF COMPPESSIPLF LIQUIDC
105 OP=P.C -~t*G12. 5e5*P04*2*CRDC/VFf3=4.tfl 4

C=S*((?F+E)/(DfNF+Pi)**.428IIC= 1 .- 0 /CIJCC=I.+L/COERY(2)=(IJCC/6.1 l(t'-**2-S*-2)+Rr*UC-C/(7.*(PF-+B))*DPF-I.S,"rL"T,,'r2*(I.-L
1/(3.'*C) ))/(ROAUC)106 N T I N U F
DFRY(3)=(I('.*AH*(TR-THC)/R'*2-CTR)*1.5CERV(4)=OTCER (5)=DTROER (6)=O..CIF (CERY (6 ) LT.C.C) OERY(6)=C.Cr)ERY17)=0.5/C3*(?.*,6L/Y(7)+IJ-Cz *Y(7)*DT %/(Y(4)-TB)-2.-C4-*r PC)
C R E T L RNENC

SUB RCUT1INE CUTP (XY 9FtY91 L *CI PN
I NFLICI T RE4L:'c (A-j-C-7)REAL**e KHK[,tvjINTECFR*4 CCWPIIVFt'ICN V(7) *CFPY(7) PMNfU9) 9.UX(16q7)
COMY.CN /R I /R AHqKHTH1,9A L PKLvKjvG 9TH 9RLL 9P INF vS vPGO , CAN I, FC PL I Ct CC
1F M Il).L T.P) FP NN(5)= 1.0T i= Y ( 4).RC=Y (1IF (Y(6)-R+l.O-0,4) 2029213,v
203 PRMiU(6)=12.'-654R**?*(THI-TGC T.C ?23
V (6 )=R22e PRNII(7)=25.l3*K[-*PC**?*(Tt,-
PIPMV (8e) =RPD-RFRPN IS () =~Pfii (9)J + 1.0.IF (PPMOMq-210.) 8C,81981
8C IRETtPN81 Pppp'fs)=1.C
I F ( L10NE .I) GOC TC 82IFG=545.P =l1 *7* CEX P (IF C/ *iC 3 1*l/ 3
82 P=CEXP( 15.38Q38-(.12767.P/TW )'3 VF=4.l8c*(RC**3.AP**3-)
PG=FCC* (VFC/VF)**GAPPF= F PG
207 FCRN'tT (TX971710.4)WRITE (6t2C8 PF*P
2C8 FORMATPFTL PN
)/((RC-R)/KV+Y(6)*.5/KH)
W) ((RC-R) /tV+R*.5/K-)
T P ( 7)
73.-1./TW-))
)/Tif**O.6.1344'*i4.7
(CEPYl I)v 1=1,7),t ( PRMM(I) , I=6 P ) ,X
(IXf PF (PSI) = ',Dl0.'i*3X*' PV (PSI) = 490I0.4)
CC

223
Appendix F
Derivation of the Starting Values for
the Numerical Integration of the Equations
of Vapor Film Dynamics
F.l Heat Transfer From the Hot Sphere
The rate of heat transfer from the hot sphere is
given by:
1 d~h 2 kh (Thi-TR) 4 .6a47R2 H x .46
The heat flux is subject to the boundary condition
2 kh (ThiT R- kv (R-Tv , 48b
where the notation is kept as given in chapter 4.
The difference in temperature TR-T tv and the film
thickness, 6, may be assumed approximately constant for
a short period of time, t . Thus, the heat flux across the
film may be considered constant in this small period of
time.
Hence,
d = h constant; t<t . F.1
By substituting from equation F.1 into equation 4.6a
and differentiating with respect to time, the following
relation between the rate of change of TR and X is obtained:
dT R 4h 1 dX F.2dT'2 dt= 2 F.

224
For short times X<<R, and hence equation 4.7a reduces
to:
6 ah X dTRdt x TR-Thi dt
F.3
dTSubstitution for aj from equation F.2 in equation
F.3 gives:
dX 6 ah x- x T -TR hi
2 kh (Thi-TR) 1 dX
h
which reduces to:
dX = 3a
Integrating equation F.4 gives:
X = /6at ; t<t F.5
Substituting for from equation F.5 into equation 4.6a and
rearranging the resultant equation:
T =T -Qh V6ahtR hi 8k 2 ; t<t
8Tkh e
F.2 Heat Transfer into the Cold Liquid
F.6
For short times A<<R6, hence equation 4.15 reduces to:
dA 6aA dTtv dR6dtA T v-T dt + U - dt t<to
F.7
Neglecting the velocity of the film/liquid interface
that can be developed within time to;

225
dRi.e. U = 0 ; t<t , F.8
at 0
equation F.7 reduces to:
dA 6a X A dT v F.9alt~ A T I-T tidt
For subcooled boiling most of the heat flux from the
hot surface is conducted away from the film into the liquid.
Assuming the heat flux from the sphere and the heat flux
into the. liquid are approximately equal, then
1 dh 1 dAt F.14wR2 dt ~ 7rR 2 -
Equation 4.16b yields:
1 d4t 2k (T kv-T ti) .16b
2 dF - A4x6
Differentiating equation 4.16b with respect to time gives:
1 1 dQt dA dTkV2k t 47R 2 dt dt F.ll
Using equation F.10, 4.16b and F.ll, equation F.9 can
be reduced to the form:
SA4A~- Z,

226
which, when integrated gives
A = /6att ; t<t
By substitution from equation F.12 into equation
4.16b, we obtain
T v = T + ; t<t
F.12
F.13
The starting values for the variables TR, TZVI X, A,
and U are determined from equations F.6, F.13, F.5, F.12
and F.8 respectively. The value of R 6 (o) is given by
R6 (o) = R + 60 , 5.14
where R is the sphere radius and 6 is the optional initial
film thickness.
The value of Pf(o) is obtained using equation 4.36:
Pr(o) = P (o) + P(Tv) 55.15

227
Appendix G
COMPARISON OF EXPERIMENTAL DATA TO THE PREDICTIONS
OF VARIOUS CORRELATIONS FOR THE MINIMUM WALL
TEMPERATURE TO STABILIZE FILM BOILING
In the past few years, several correlations have
been advanced for the prediction of the minimum wall
temperature required to stabilize film boiling at a
heating wall, T . Table G.1 summarizes the proposed
correlations. Berenson95 obtained his correlation from
a Tayler instability analysis of film boiling on a
horizontal surface. Berenson's correlation shows
that TB (the subscript denotes the originator(s) of
*the correlation for predicting T ) depends on the
thermodynamic properties of the liquid but not the
surface material. Spiegler et al. based their
analysis on a spontaneous nucleation theory and de-
duced that T is dependent only on the critical
temperature of the liquid, Tcr Kalinin et alll2
assumed that the film boiling stabilization requires
a certain interface temperature to be obtained when
the liquid and the heating wall get in contact. Hence,
Kalinin et al. concluded that the ratio of the pkc
product of the liquid and the hot material is an
important parameter for film boiling. Henry's 1 1 3
correlation is based on the assumption that the hydro-

Table G.1
Summary of Correlations for Prediction of Minimum
Wall Temperature to Sustain Film Boiling, T t
1. The subscripts given to T in the correlations refer to the originator(s)of the correlation.
2. The engineering system of units is to be used in Berenson's correlation.Absolute temperatures are to be used in the correlation of Spiegler et al.The other correlations include only dimensionless parameters.
3. Properties with subscript vf are to be evaluated at the average temperaturein the film.
2 13 -- 2 -3
Berenson TB Tsa 0. 127 vf fg gk-v) g~ c v
Spiegler et al. TS = 0.84 Tor
T -T (pkc) 0.25Kalinin et al. TK at = 0.165 + 2.48 (pk)
cr w
T - T (pkc) hHenry H = 0.42
TB - T f (pkc)w c w(TB - Tsat)
t+
R\)N)OD
*

229
*dynamically determined T of Berenson is to be obtained
at the interface as the liquid contacts the heating wall.
Henry also assumed the influence of an evaporating micro-
layer of liquid adhering to the heating wall and hence*
deduced that h /cw(TB - Tsat) is a significant parameter
for film boiling.
Table G.2 summarizes some of the data reported in
literature on the minimum temperature for stable film*
boiling, T , and Leidenfrost temperature, TLeid*
Baumeister et al. 1 2 7 have considered both temperatures
and concluded T and TLeid may be considered equivalent
when TLeid is determined from the evaporation rates of
*large saturated drops. The wall superheat, T - Tsat'
determined from the data in Table G.2 and the superheat
predicted by the different correlations are summarized
in Table G.3. The predicted superheat of each correla-
tion is compared to the experimental superheat on Figures
G.1, G.2, G.3 and G.4. In Figure G.1 it is seen that,
in general, Berenson's correlation underestimates the
needed wall superheat for film stabilization. For
sodium the needed superheat is underestimated by a
factor as large as 15. Kalinin's correlation (Fig. G.3)
shows a reverse trend by overestimating T - Ta The
disagreement between the predictions and the experimental

230
data is again largest for sodium. Spiegler's correlation
(Fig. G.2) shows better agreement with the experimental
data than the correlations of Berenson and Kalinin et al.,
although the degree of scatter of the data remains
appreciable. In Fig. G.4 it is seen that Henry's correla-
tion shows a better agreement with the data than the
other correlations, especially so for the sodium data. A
clearer comparison with the sodium data of Farahat89 is
given in Fig. G.5. The correlation accurately predicts
the trend of increasing wall superheat with subcooling in
Farahat's experiments. The correlation is less accurate
in describing the trend of the wall superheat in the
Ag/H 20 experiments of Stevens et al. , as shown in Fig.
G.6.
In conclusion, over a wide range of material com-
binations, Henry's correlation shows a better agreement
with the experimental observations than the other available
correlations.

Table G.2*
Experimental Data on Minimum Wall Temperature to Stabilize Film Boiling, T
Heating
Surface
Material
Cu
Cu
SS
SS
SS
Al
Ag
Ag
Ta
Ta
Liquid
n-pentane
CC14
Benzene
Ethanol
Water
Water
Water
Water
Sodium
Sodium
Temperatures in *C
Liquid Characteristic Experimental DataTermperatures
Tsat (1 atm)
36
77
80
78
100
100
100
100
880
880
Tcr
197
283
288
243
374
374
374
374
2300
2300
T
36
77
80
78
100
100
24
60
849
859
T
94
157
185
178
305
235
406
266
1700
1576
Ref.
95
95
126
126
127
127
88
88
89
89
Data
No.
1
2
3
4
5
6
7
8
9
10
Symbols
Used
In
Figures
A
A
4
V
0
0
r-
erd
;4
Cdi
0-H
CO)
N')LA)H-

232
Table G.3
Values of Predicted and Observed Wall
Superheat for Data Summarized in Table G.2
Data Superheat in *C
No. * *
T -T sat B Tsat T T T-t TKT T H- Tsat
1 58 54 85.7 68 72.5
2 80 90 117 92 96.8
3 105 54 118 161 73.5
4 100 55.8 82 138 94.0
5 205 78 170 341 214.5
6 135 78 170 211 126.0
7 306 78 170 241 265.0
8 166 78 170 217 222.0
9 820 53.5 1008 2692 905.0
10 696 53.5 1008 2674 803.6

233
I I0
10
t0
E-1
1.0c-4
rI) -
E
0.1 x
I II I
LIQUID
FIG. G.1: DATA FROM LITERATURE COMPARED TO PREDICTIONSOF BERENSON

234
10
1.0
0.1
K
F-
v
A00U
z
wz
zw
z
I
0
r-i0-
LIQUID
FIG. G.2: DATA FROM LITERATURE COMPARED TO PREDICTIONSOF SPIEGLER ET AL.
CI
4-)
E-
co
*
I I I I I i
I

235
- ~
0 -E- z 0
zO
H z E-4U L E- 0
LIQUID
FIG. G.3: DATA FROM LITERATURE COMPARED TO PREDICTIONSOF KALININ ET AL.
10
1.0
.3
E4
*
0.1

236
10
E-
>1.0
*
0.1
14H00
LI QW I
LIQUID
FIG. G.4: DATA FROM LITERATURE COMPARED TO PREDICTIONS OFHENRY

20
Tsat
FIG. G.5: COMPARISON OF THE PREDICTION OF DIFFERENTCORRELATIONS WITH THE DATA OF FARAHAT FORA Ta SPHERE IN SODIUM
237
3000
2000 f00
4-)
*r
KALININ et al.
SPIEGLER et al.
HENRY
DATA OF FARAHAT
BERENSON
1000
10 30i I

238
FIG. G.6: COMPARISON BETWEEN THE PREDICTION OF THEDIFFERENT CORRELATIONS WITH THE DATA OFSTEVENS ET AL. FOR A Ag SPHERE IN WATER
800 0 DATA OF STEVENS et al.
600
0
PL40
HENRY
400 KALININ ei
SPIEGLER et al.
200 BERENSON
50 100 150
Tsat - T , *F

239
Appendix H
Nucleation in Liquids
When a liquid under normal pressure is heated beyond
its saturation temperature in the absense of bounding walls
with cavities, vapor bubbles appear in the bulk of the fluid
at a certain temperature usually referred to as the spon-
taneous nucleation temperature. Vapor bubbles can be pro-
duced with the liquid at its original temperature by
subjecting the liquid to negative (tensile) pressure. In
this case, cavitation is said to have occurred.
A thermodynamic limit can be set for both processes
by considering the equation of state of a pure real fluid
(see for example Ref. 132, page 233) as illustrated in
Fig. H.l. The curve abcdef represents an isotherm for a
fluid at temperature T . Consider a liquid initially at
the state b. By heating the liquid at constant pressure,
the liquid approaches the point g beyond which the liquid
temperature can not be increased at the same pressure.
Therefore, the temperature T2 is the thermodynamic limit
for the temperature at which "spontaneous nucleation"
would take place for a liquid at pressure P .
If the liquid, initially at b, is maintained at the
temperature T but its pressure is reduced, the liquid
approaches the point c beyond which the pressure can not be
further reduced at the same temperature. The negative
pressure P2 is then the thermodynamic limit for the "cavitation"

T
a2
Pcr
- f
C
\/FIG. H.1: P-V-T DIAGRAM FOR A PURE FLUID
240
P
0
2

241
pressure for the liquid at the temperature T . The points
g and c represent what Gibbs1 33 called "the limit of essen-
tial instability", and are defined by
6P(v,T) =0
T
where P(v,T) is the equation of state of the liquid.
The above approach to the estimation of the conditions
at which vapor bubbles will appear in a liquid, by either
spontaneous nucleation or cavitation,. ignores the possibility
of transient production of vapor nuclei by molecular thermal
fluctuations in the liquid. The approach of Bernathl2 2
(based on work by Volmer 123) for the determination of the
limits of spontaneous nucleation and cavitation in liquids
takes into account the probability of production of vapor
nuclei at any temperature. Expressions given by Bernath
are used here to estimate the required superheat for spon-
taneous nucleation and the required negative pressures for
cavitation.

242
H.1 Spontaneous Nucleation Temperature, T
At any temperature, T, the average number of vapor
nuclei originated in a unit volume of the liquid per unit
time, J, is given by:
i =C 6 12 - /kT e- W/kT ,H.2F a 11/2jm(3-b)]
where ( is the number of molecules of liquids per unit
volume,
m is the mass of one molecule (gm),
a is the surface tension (dyne/cm),
A is the heat of vaporization of one molecule (erg),
k is Boltzman's constant (1.38x10⁶ erg/K),
T is the absolute temperature of the liquid (OK),
b is a pressure parameter defined by b = (P i V
where Pv is the pressure in the nucleus and P is
the pressure in the liquid, and W is the work done
in the formation of one nucleus.
W is given by:
16 Tr a
W = 3(P-P )2 H.3
Equation H.2 can be rearranged to give the excess
pressure P k required to produce J vapor nuclei at
temperature T:

243
2 167 a3 H.4
3kT[En(+1/2An(6a/wm(3-b)-EnJJ-3A
For a unit volume of the liquid, the number of mole-
cules is given by:
SA
M
where 6 is the density (gm/cm3 ), Av is Avogadro's Number
(0.6 x 1024 moleculer/gm-mole), and M is the molecular
weight of the liquid (gm). The mass of the molecule is
given by:
m = . H.6Avv
By substitution for E from equation H.5 and for m
from equation H.6, equation H.4 may be written as:
2 16w a 3
(P -P ) =3kT[3/2ZnA +1/2tn(6ap /wM 2)-l/2Zn(3-b)-LnJ]-3Xv
H.7
Equation H.7 is a transcendental equation since b is
a function of (P -P ) also. However, for practical purposes,
spontaneous nucleation takes place at high values of Pv
such that
b = v - 1 . H.8Pv
Additionally, the value of 6ap 2/irM2 for the temperature
range of interest in sodium and water may be taken as

244
0.35. Equation H.7 is then simplified to:
(P -P )2 l6 a3 H.93kT[l.5ZnAv,-nJ-1.35]-3X
To determine the temperature T that satisfies equation
H.9, we assume the pressure of the vapor Pv is that of
saturation at the prevailing liquid temperature. Thus, for
a liquid pressure P of 1 atm, and a vapor current, J, of
106 nuclei/cm3 sec equation H.9 may be given as:
[P (T)-1] = x10-16 atm. H.10v T9.llxl0 1 5 T-X
For sodium, X and a are given by
x ~ 1.68x10⁻¹² erg, and
a = 234-0.lT dyne/cm.,
The saturation pressure is calculated from the
Stone's equation 8 .
P (T) = T-0.61344 exp(15.3828 - 12767.8/T), H.11
where Pv T) is in atmospheres.
The spontaneous nucleation temperature is determined by
equating P (T) from H.11 to Pv (T) from H.10 (see Fig. H.2)
thus giving
T s (1 atm) = 18500C
For water, X and a are given by:
X= 0.82x10⁻¹ 2 erg, and
a= 153.4-0.237 T dyne/cm.

245
150- P (T) 150
STONE'S EQN.
100 100
EQUATION 5050~ H.10
2000 2100 2200 2300
TEMPERATURE OF LIQUID SODIUM, *K
FIG. H.2: DETERMINATION OF THE SPONTANEOUS NUCLEATIONTEMPERATURE OF SODIUM (Pz = 1 atm)

Pv(T) -FROM REF. 124
575 600
Pv -EQUATION\ H.10
625TEMPERATURE OF LIQUID WATER, OK
FIG. H.3: DETERMINATION OF THE SPONTANEOUS NUCLEATIONTEMPERATURE OF WATER (P = 1 atm)
150 t-
4-,
100
550I
I I I I
50F
i iI i

247
The saturation pressure is obtained from Ref. 124. The
spontaneous nucleation temperature is determined to be
T ( 1 atm) = 3140C
H.2 Cavitation Pressures
The following expression has been obtained by
Bernathl22 for the minimum negative pressure required,
theoretically, to induce cavitation in liquids:
9.06 a3/kT 11/2
Y= .4562 a 2 H.12
y E3/2 GT kT J
where y is the absolute value of the required
negative pressure (dyne/cm 2
p is liquid density (gm/cm3),
G is the universal gas constant (erg/*K),
and the other symbols as defined above.
Using equation H.12, the values of the theoretically
required negative pressure for cavitation in materials used
in the fragmentation experiments are shown in Table H.l.
Where existing, the experimental values of the maximum nega-
tive pressure that have been experimentally sustained in the
liquids are shown also. It is clear that the theoretical
values greatly exceed the experimentally observed ones. It
is usually suggested that small amounts of impurities or
dissolved gases act as sites for nucleation, thus reducing
the negative pressures required to fracture the liquids under

248
practical conditions.
TABLE H.1
Values of Negative Pressures Required for Cavitation
Cavitation Pressure, atm
MeltingMaterial Point Temperature Calculated Experimental
*C *C Eqn H.12 Maximum*
H20 0.0 20 - 1,039 - 281
Hg -38.87 300 - 11,900 - 460
Sn 232 500 - 24,500 ---
Bi 271 500 - 10,500
Pb 327 500 - 14,200
Al 660 800 - 35,000
Ag 961 1000 - 30,800 ---
Au 1083 1100 - 44,800
*Reference 119

249
It should be noted that equation H.12 is valid only if
the liquid is at a temperature lower than the temperature
Tz for which a zero pressure would be enough to produce
cavitation (see Fig. H.1). The thermodynamic limit for the
temperature Tz may be determined from the state equation of
the liquid by requiring the two conditions:
6P T = 0, and H.13
T
P(v,T) = 0 H.14
be satisfied simultaneously.
If the Van Der Wall's equation is used as an approxi-
mate state equation for the liquid, then the P-v-T relation
is given by
P = H.15v-b v
where G is the gas constant, and a, b are constants
that are related to the critical properties of
the fluid by:
27GbTa = cr, and H.16
b = vc 3 . H.17
When the condition H.13 is applied to equation H.15
we obtain
) ,H.18

250
where P* and v* are the pressure P and the volume v at the
point where = 0. When the condition H.l14 is applied to
P* as given in equation H.18 we get
v* = 2b . H.19
By substituting from equation H.19 into equation H.15 and
applying the condition H.14 we get
GTP= 0 _ z a
b 4b2
which can be rearranged to:
T = a H.20
When the value of the constant "a" from equation H.16 is
substituted in equation H.20 the value of Tz is determined
to be
T 27 T . H.20z 32 c
The temperature T is the maximum liquid temperature
for which equation H.12 can be applied. The temperatures
at which the cavitation pressures were calculated for
different materials in Table H.1 are all below the respective
limiting values of T .

251
Appendix I
PROPERTIES OF MATERIALS
I.1 Properties Used in Chapter 3
I.l.a Temperature Dependent Thermophysical Properties
of Sodium Unsed in Chapter 3
The properties of sodium used in the model for
fragmentation-induced vapor explosions of Chapter 3 are
the same values that were incorporated in the Parametric
Model for Fuel-Coolant Interaction. 4'79 These properties
are based on the values recommended by Golden and Takar.8
The properties are defined by the following expressions.
(The temperature, T, in the following is in *K)
A) On-Phase Liquid Sodium
1. The specific heat at constant pressure, C :
C R(cal/gm OK) = 0.389352 - 1.99078 x 10 T
+ 11.0542 x 10⁻⁸ 2 1.1
2. The thermal expansion coefficient, a':
a' (*Kl) = 0.21968 x 10- 3 + 0.81226 x 10~7 T
+ 0.97135 x 10 + 0.68998 x 10- 15T3.
1.2

252
3. The isothermal compressibility 6:
6 (OK ) =s + V T C(a')2
pt
where
S (OK~ ) = 0.69651 x 10⁻⁵ + 0.26741 x 10~7T
- 0.14891 x- 10 T2 + 0.82082 x 10 T3
I.4
B) Two-Phase Sodium
1. Saturation pressure, P:
P(atm) = T-0. 6 1344 exp 15.3828 - 12767.8 1.5
2. Saturated liquid and vapor enthalpies, H and Hv
h (cal/gm) = -0.9213 x 10³ + 1.9434T
-2 263-0.1051 x 10 T + 0.22418 x 10⁻⁶ T3
1.6
h v(cal/gm) = 0.18605 x 10 - 1.4691 T
+ 0.10381 x 10⁻² T2 - 0.23238 x 10⁻⁶ T3
1.7
3. The specific volume of the liquid, Vk:
V (cm3/gm) = Vto exp [ a' d TI,Tt
1.8
where a' is given above, and V is a reference

253
specific volume at the reference temperature
T . For the cases of Chapter 3 T to = 1100*K
and V = 1.35 cm 3/gm.
4. The specific volume of the Vapor, Vv
V v v , where
B =-0.97258 + 0.421417.x 10- 2 T - 0.28996 x 10⁻⁵T2
+ 0. 5 51124 x 10~9T3
and
Gv = 3.565 cm3 - atm/*K gm, gas constant for
1 gm of vapor, I.10
and Tb is defined by equation 3.9.
I.l.b Other Properties Used in Chapter 3
Thermal conductivity of the gaseous blanket,
kb = 1.64 x 10~ cal/cm *K sec
Thermal conductivity of the fuel,
k = 0.005 cal/cm *K sec
Density of the fuel,
Pu = 9.8 cm 3/gm
Speficif heat of the fuel,
Cu = 0.121 cal/gm *K
Adiabatic index of the non-condensable gas,
n = 1.4

254
Speed of sound in 1100 0 K sodium
C = 2.15 x 105 cm/sec
Density of liquid sodium at 11004K,
3pO = 0.74 gm/cm
1.2 Properties Used in Chapter 4
In the model of Chapter 4, temperature-independent
properties of both the hot spheres and the liquid coolants
are used. The values of the thermal conductivity and
thermal diffusivity of the material are taken to be those
at an intermediate temperature in the range of temperature
in the considered cases. These values are summarized in
Table I.l. Other properties of water and sodium used
in Chapter 4 are as follows:
Property Water Sodium
1. Density, p (gm/cm ) 1.0 .83
5 52. Sound velocity in liquid, 1.149 x 10 2.5 x 10
C. (cm/sec)
3. .Thermal conductivity of vapor, 9 x 10⁻⁵ 1.5 x 10~4
kv (cal/cm 0 C sec)
4. Latent heat of vaporization, 545. 930.
h g (cal/gm)
For water, the saturation pressure is taken to be given
by the integral of the Clausius-Clapeyron equation (Ref. 131
page 217):

255
h 1 1P(T) = 14.7 exp - (- - -) psi 1.11
0.1103 373 T
For sodium, equation 1.5 is used to define the
saturation pressure.
The constants of the equation 4.3 2 were taken to be:
For water98 B = 4.4 x 10 psi, m = 7, and for sodium101
B = 6 x 10 psi, m = 7, the adiabatic gas constant, n = 1.4.

256
Table 1.1
Values of the Thermal Conductivity and Diffusivity of
Material used in Chapter 4.

Fig. I.1 Surface Tension of Molten Metals (Ref. 134)
-Ag
ZnGa
Sn
Hg Pb
Bi
Na Ag Cl
H 0H2
400 600 800 1000200Temperature, *C.
1000
800
600
0N
00g~$
~I)H
UCTJc4-4
(/2 400
200
1200
>,
1400
I I

258
REFERENCES
1. C.N. Kelber et al.., "Safety Problems of Liquid-Metal-Cooled Fast Breeder Reactors", ANL-7657,Feb. 1970.
2. F.R. Farmer et al., "An Appreciation of Fast ReactorSafety (1970)", UKAEA, Safeguards Division, A.S.H.B.,NP-18487, 1970.
3. J. Graham, Fast Reactor Safety, Academic Press,New York, 1971.
4. E.P. Hicks and D.C. Menzies, "Theoretical StudiesOn The Fast Reactor Maximum Accidents", in Proc.Conf. Safety, Fuels and Core Design in Large FastPower Reactors, ANL-7120, October 1965.
5. D.R. Armstrong, "Reactor Development Program ProgressReport - February 1972", ANL-RDP-2, 8.31-8.32,March 1972.
6. G. Long, "Explosion of Molten Aluminum in Water -Cause and Prevention", Metal Progress 71, 107-112,May 1957.
7. R.O. Ivins and L. Baker, "Chemical EngineeringDivision Semiannual Report, January - June 1964",ANL-6900, 270-280, Aug. 1964.
8. L.C. Witte and J.E. Cox, "Nonchemical ExplosiveInteraction of LNG and Water", ASME 71-WA/HT-31,1971.
9. E. Nakanishi and R.C. Reid, "Liquid Natural Gas-Water Reactions", Chem. Eng. Prog. 67 No. 12,36-41, Dec. 1971.
10. T. Enger et al., "Explosive Boiling of LiquifiedHydrocarbon Water Systems", Paper presented atCryogenic Engineering Conference, Boulder, Colorado,August 1972.
11. H.K. Fauske, "The Role of Nucleation in VaporExplosions", Trans. Am. Nucl. Soc. 15(2), p 813,Nov. 1972.

259
12. D. Armstrong and D. Cho, "LMFBR Nuclear SafetyProgram Annual Report", ANL-7800, 340-358,July 1971. Also see ANL-7765, 117-119, Dec. 1970.
13. M. Amblard et al., "Contact Effects Between MoltenU02 and Sodium and Molten U02 and Water",EURFNR-811, March 1970.
14. D. Cho et al., "Pressure Generation by MoltenFuel-Coolant Interactions Under LMFBR AccidentConditions", Proc. Conf. New Developments inReactor Mathematics and Applications, Idaho Falls,Idaho, March 1971, Conf-710302.
15. H.J. Teague,"Summary of the Papers Presented atthe CREST Meeting on Fuel-Sodium Interaction atGrenoble in January 1972 and Report of ConferencePapers 38a-k on Fuel-Sodium Interactions", Presentedat Int. Conf. Engineering of Fast Reactors forSafe and Reliable Operation, Karlsruhe, Oct. 1972.
16. J. Percy, Metallurgy p 625, J. Murray, London, 1864.
17. S.G. Lipsett, "Explosions From Molten Materialsand Water", Fire Technology 2, 118-126, May 1966.
18. L.F. Epstein, "Metal-Water Reactions: VII ReactorSafety Aspects of Metal-Water Reactions",GEAP-3335, Jan. 1960.
19. L.C. Witte et al., "The Vapor Explosion", J. ofMetals 39-44, Feb. 1970.
20. T.J. Thompson, "Accidents and Destructive Tests",in The Technology of Nuclear Reactor Safety Vol 1,Ed. T.J. Thompson and J.G. Beckerley, M.I.T. Press,Cambridge, Ma., 1964.
21. D.G. Hurst, "The Accident of the NRX Reactor, PartII", AECL No. 233, reprinted Feb. 1956.
22. J.R. Dietrich, "Experimental Determination of theSelf-Regulation and Safety of Operating Water-Moderated Reactors", Proc. Int. Conf. on PeacefulUses of Atomic Energy Vol 13, 88-101 (see alsop 125), 1955.

260
23. J.H. Kittel el al., "The EBR-I Meltdown Physicaland Metallurgical Changes in the Core", Nucl.Sci. Eng. 4, 180-199, 1958.
24. "Final Report of SL-1 Recovery Operation"$IDO-19311, July 1962.
25. R.W. Moller et al., "Report on the SPERT-IDestructive Test Program on an Aluminum, Plate-Type,Water-Moderated Reactor", IDO-16883, June 1964.
26. S.M. Zivi et al., "Kinetic Studies of HeterogeneousWater Reactors - Annual Summary Report 1964",STL 372-13, 45-68,TRW Space Technology Laboratories,Dec. 1964.
27. J.O. Elgert and A.W. Brown, "In-Pile Molten-MetalWater Reactions", IDO-16257, June 1956.
28. H.M. Higgins, "A Study of the Reaction of Metaland Water", AECD-3664, April 1955 and "The Reactionof Molten Uranium and Zirconium Alloys With Water",Aerojet General Report AGC-AE-7, 1965.
29. E.F. Epstein, "Metal Water Reactions: VI AnalyticalFormulations for the Reaction Rate", GEAP-3272,Sept. 1959.
30. P.D. Hess and K.J. Brondyke, "Molten Aluminum WaterExplosions, Metal Progress, 93-100, April 1969.
31. J.A. Sallack,"On Investigation of Explosions in theSoda Smelt Dissolving Operation", Canadian Pulp andPaper Association Meeting, Quebec, Canada,June 6-8, 1955.
32. S.M. Zivi et al., "Kinetic Studies of HeterogeneousWater Feactors", Annual Summary Report 1963,STL-6312, 5-49; Annual Summary Report 1964,STL-372-13, 5-44; Annual Summary Report 1965,STL-372-30, 7-23.
33. R.W. Wright, "Pressure Pulses in Rapid TransientBoiling", Trans. Am. Nucl. Soc. 6 (2), p 338,Nov. 1963 and also in STL-6312, 50-70, TRW SpaceTechnology Laboratories, Dec. 1963.

261
34. R.W. Wright, "Kinetic Studies of Heterogeneous WaterReactors, Annual Summary Report 1965", STL-372-30,TRW Systems, Dec. 1965 and "Annual Summary Report1966", STL-372-50, Dec. 1966.
35. D. Swift and J. Pavlik, "Chemical EngineeringDivision Semiannual Report, July-December 1965",ANL-7125, 187-193 May 1966.
36. "Reactor Development Program Progress Report,January 1966", ANL-7152, 90-96, Feb. 1966.
37. As reported in "Core Design Developments Needs inRelation to Fuel Failure Propagation, Sodium Boilingand Clad/Fuel-Sodium Thermal Interaction",GEAP-13639-2, 770-774, October 1970.
38. R.O. Ivins, "Reactor Development Program ProgressReport, Nov. 1967", ANL-7399, 162-165, Dec. 1967.
39. D. Cho, Private Communications, January 1972.
40. J.O. Hinze, "Fundamentals of the HydrodynamicMechanism of Splitting in Dispersion Processes",A.I.Ch.E. Journal 1 3 pp 289-295, Sept. 1955. Also"Forced Deformations of Viscous Liquid Globules",App. Sci. Research Al, 263-288, 1948.
41. J.W. Westwater, Advances in Chemical EngineeringVol. 1, Academic Press, New York 1957.
42. F.E. Brauer, et al., "Metal/Water Explosions",Nucl. Sci. Eng. 31, 551-554, March 1968.
43. K. Flory, et al., "Molten Metal-Water Explosions",Chem. Eng. Progress 65, 50-54, Dec. 1969.
44. P. Gronveld, "Explosive Vapor Formation", Trans.ASME J. Heat Transfer, 236-238, May 1972.
45. L.C. Witte et al., "Rapid Quenching of MoltenMetals", ORO-3936-6, August 1971.
46. R.H. Bradley et al., "Investigation of the VaporExplosion Phenomena Using a Molten-Metal JetInjection Into Distilled Water", ORO-3936-7,October 1971.

262
47. J.W. Stevens et al., "Transient Film and TransitionBoiling From a Sphere", ORO-3936-9, September 1972.
48. S.J. Board et al., "Fragmentation in Thermal Explo-sions", Central Electricity Generating Board ReportRD/B/N2423, Oct. 1972.
49. R. Anderson and L. Bova, "Experimental Investigationof Vapor Explosions in a Molten Salt-Water System",Trans. Am. Nucl. Soc. 14 (1), p 236, June 1971.
50. R. Anderson and D. Armstrong, "Laboratory Tests ofMolten-Fuel-Coolant Interactions", Trans. Am. Nucl.Soc. 15 (1), p 313, June 1972.
51. R.C. Liimatainen and F.J. Testa, "Chemical EngineeringDivision Semiannual Report, July-December 1965",ANL-7125, 170-178, May 1966.
52. R.W. Miller and W.G. Lussie, "Power Bursts inZircaloy-2 Clad Oxide Fuel Rods", Trans. Am. Nucl.Soc. 12 (1), 344-346, 1969.
53. Z.R. Martinson, "Behavior of 5-Inch Long, 1/4-InchOD, Zircaloy-2 Clad Oxide Fuel Rods Subjected toHigh Energy Power Bursts", IN-ITR-107, August 1969.
54. C.E. Dickerman, "Studies of Fast Reactor CoreBehavior Under Accident Conditions", Nuclear Safety11, 195-205, May-June 1970.
55. J.J. Barghusen et al., "LMFBR Nuclear Safety ProgramAnnual Report", ANL-7800, 321-339, July 1971.
56. R.W. Wright et al., "Reactor Development ProgramProgress Report, June 1971", ANL-7833, p 8.23,July 1971.
57. R.W. Wright et al., "Reactor Development ProgramProgress Report, August 1971", ANL-7854, 8.19-8.21,September 1971.
58. J.J. Barghusen, "Reactor Development Program ProgressReport, March 1972", ANL-RDP-3, 8.34-8.38, April 1972.
59. C.E. Dickerman, et al., "Fuel Dynamics ExperimentsOn Fast Reactor Oxide Fuel Performance Under TransientHeating Conditions Using the TREAT Reactor", Trans.Am. Nucl. Soc. Supplement No. 1 to Volume 14, p 28,April 1971.

263
60. A.E. Klickman, "Summary of Energy Release Analysesof the Hypothetical Meltdown Design Accident forCore A of the Enrico Fermi Reactor", APDA-LA-7,July 1969.
61. A.M. Judd, "Calculation of the ThermodynamicEfficiency of Molten-Fuel-Coolant Interactions",Trans. Am. Nucl. Soc. 13 (1), p 369, 1970.
62. A. Padilla, "Analysis of Mechanical Work Energy forLMFBR Maximum Accidents", Nucl. Technology 12 No. 4,348-355, Dec. 1971.
63. H. Pfefferlen, "Analytical Evaluation of the Con-sequences of a Hypothetical Instantaneous Loss ofCoolant Flow to a Fast Flux Test Facility DriverFuel Assembly", Compiled by L.M. McWethy, GEAP-10059,July 1969.
64. L.C. Biasi et al., "Heat Transfer and Fluid Dynamicsof Fuel-Sodium Interaction", Paper presented at theInternational Center for Heat and Mass Transfer,Trogior, Yogoslavia, Sept. 1971.
65. A. Padilla, "Transient Analysis of Fuel-SodiumInteraction", Trans. Am. Nucl. Soc. 13 (1), p 375,1970.
66. D. Cho et al., "Effects of Gas/Vapor Blanketing OnPressure Pulses and Mechanical Work Produced ByMolten Fuel-Coolant Interactions", Trans. Am. Nucl.Soc. 15 (1), p 314, 1972.
67. R.B. Duffy, "Channel Voiding Due to Fuel-CoolantInteractions in Sodium Cooled Fast Reactors",CEGB Report RD/B/N 1609, 1970.
68. J. Randles, "A Thermodynamic Model For The TheoreticalStudy of Boiling and Ejection of the Coolant From aReactor Channel Due To Direct Contact With Hot MoltenFuel", EUR-4592e, 1971.
69. I. Puig and A. Szeless, "Evaluation De La ProductionDe Vapeur Au Cours De La Dispersion Du CombustibleChaud Dans Du Sodium", Paper presented at the CRESTMeeting on Fuel-Sodium Interaction at Grenoble,France, January 1972.

264
70. L. Caldarola, "A Theoretical Model for the Molten-Fuel-Sodium Interaction in a Nuclear Fast Reactor",Nucl. Eng. Design 22 (2), 175-211, October 1972.
71. M.D. Carelli, "Fission Gas and Molten Fuel EjectionFrom Failed Fuel Rods in an LMFBR", Proc. Conf.New Developments in Reactor Mathematics andApplications, Idaho Falls, Idaho, March 1971.
72. R.W. Tilbrook, "Coolant Voiding Transients inLMFBR's", Proc. Conf. New Developments in ReactorMathematics and Applications, Idaho Falls, Idaho,March 1971.
73. A.W. Cronenberg, "A Thermodynamic Model for MoltenU02 -Na Interaction Pertaining to Fast Reactor Fuel-Failure Accidents", Ph.D. Thesis, Nucl. Eng. Dept.,Northwestern University, June 1971.
74. P.G. Lorenzini and G.F. Flanagan, An Evaluation ofFuel-Coolant Interactions During Disassembly of anLMFBR", Proc. Conf. New Developments in ReactorMathematics and Applications, Idaho Falls, Idaho,March 1971.
75. J.C. Mills and W.E. Kastenberg, "An Axial KineticsModel for Fast Reactor Disassembly Accidents", Proc.Conf. New Developments in Reactor Mathematics andApplications, Idaho Falls, Idaho, March 1971.
76. L.L. Smith et al., "SAS/FCI: A Fuel-Coolant Inter-action Model for LMFBR Whole-Core Accident Analysis",ANS Topical Meeting on Mathematical Models andComputational Techniques for Analysis of NuclearSystems", Ann Arbor, Mich., April 1973.
77. K.H. Hsiao et al., "Pressurization of a SolidifyingSphere", J. App. Mechanics, ASME Paper No. APM-71-AAA.
78. K.V. Roberts, "Theoretical Calculations on Fuel-Coolant Interactions", Paper presented at CRESTSpecialist Meeting on Fuel-Sodium Interaction atGrenoble, France, January 1972.
79. D. Cho and R.W. Wright, "LMFBR Nuclear SafetyProgram Annual Report", ANL-7800, 358-369, July 1971.
80. A.H. Shapiro, The Dynamics and Thermodynamics ofCompressible Fluid Flow, Vol. 1, p 46, The RonaldPress Company,1953,
265
81. G.H. Golden and J.V. Tokar, "ThermodynamicalProperties of Sodium", ANL-7323, August 1967.
82. R. Bulrisch and J. Stoer, Proceedingsof IFIPCongress, W.A. Kalenich Ed., Vol 2, SparatanBooks, 487-488, 1965.
83. W.M. Rohsenow, "Heat Transfer With Boiling",in Developments in Heat Transfer, M.I.T. Press,Cambridge, MA 1964.
84. W.S. Bradfield, "Liquid-Solid Contact in StableFilm Boiling", I. & E. C. Fundamentals 5 (2),200-204, May 1966.
85. W.S. Bradfield, "On the Effect of Subcooling OnWall Superheat in Pool Boiling", J. Heat Transfer89 (3), 269-270, August 1967.
86. F.J. Walford, "Transient Heat Transfer From aNickel Sphere Moving Through Water", Int. J. HeatMass Transfer 12, 1621-1625, 1969.
87. R.N. Jacobson and F.H. Shair, "Film Boiling froma Sphere During Forced Convection of SubcooledWater", I.& E.C. Fundamentals 9 (1), 183-185,Feb. 1970.
88. J.W. Stevens et al., "Transition Boiling From Spheresto Water", University of Houston ORO-3936-3,April 1970.
89. M.M.K. Farahat, "Transient Boiling Heat TransferFrom Spheres to Sodium", Ph.D. Thesis, Dept. Nucl.Eng., Northwestern University, August 1971.
90. S.J. Board et al., "An Experimental Study of EnergyTransfer Processes Relevant to Thermal Explosions",Int. J. Heat Mass Transfer 14, 1631-1641, October1971.
91. G.L. Gains, Jr., Insoluble Monolayers at Liquid-GasInterfaces, Interscience Publishers, New York, 1966.
92. N.K. Adam, The Physics and Chemistry of Surfaces,Oxford University Press, Third Edition 1941.

266
93. H. Lurie and H.A. Johnson, "Transient Pool Boilingof Water On a Vertical Surface With a Step in HeatGeneration", J. Heat Transfer 84 (3), 217-224,August 1962.
94. D.P. Wehmeyer and T.W. Jackson, "Transient FilmBoiling of Carbon Tetrachloride and Freon-113 ona Horizontal Cylindrical Surface", J. Heat Transfer,November 1972.
95. P.J. Berenson, "Film Boiling Heat Transfer From aHorizontal Surface", J. Heat Transfer 83, 351-358,August 1961.
96. E.K. Kalinin et al., "Heat Transfer in Tubes WithRod Regime in the Case of Film Boiling of a SubcooledLiquid", Cocurrent Gas-Liquid Flow, Plenum Press,1969.
97. L.C. Witte, "Film Boiling From a Sphere", I&ECFundamentals 7 (3), 517-518, August 1968.
98. R. Hickling and M.S. Plesset, "Collapse and Reboundof a Spherical Bubble in Water", Phy. of Fluids 1 (1),p 7, January 1964.
99. R.D. Ivany and F.G. Hammitt, "Cavitation BubbleCollapse in Viscous Compressible Liquids - NumericalAnalysis", J. Basic Eng. ASME Series D, p 977,December 1965.
100. A.M. Judd, "Boiling and Condensation of Sodium inRelation to Fast Reactor Safety", Paper IV-A-4,International Conference on the Safety of FastReactors, Aix-en-Provence, September 1967.
101. A.M. Judd, "The Condensation of Sodium Vapour Bubbles"AEEW-M813, UKAEA-Reactor Group, Winfrith, 1968.
102. T. Theofanous et al., "A Theoretical Study on BubbleGrowth in Constant and Time-Dependent PressureFields", Chem. Eng. Sci 24, 885-897, 1969.
103. T.G. Theofanous et al., "Nonequilibrium BubbleCollapse, A Theoretical Study", llth National HeatTransfer Conference, Minneapolis, August 1969.

267
104. R.B. Duffy, "The Analytical Description of VapourBubble Dynamics in Water and Liquid Sodium",Central Electricity Generating Board ReportRDIB/N1349, April 1969.
105. M.N. Ozisik, Boundary Value Problems of HeatConduction, International Textbook Co., Scranton,Pa., 1968.
106. T.R. Goodman, "Application of Integral Methods toTransient Nonlinear Heat Transfer", in Advancesin Heat Transfer Vol. 1, 1964.
107. R.B. Bird, W.E. Stewart and E.N. Lightfoot,Transport Phenomena, John Wiley and Sons Inc., 1960.
108. Lord Rayleigh, "Pressure Due to Collapse of Bubbles",Phil. Mag. 34, 94-98, 1917.
109. J.G. Kirkwood and H.A. Bethe, Report No. 588, 1942Office of Scientific Research and Development, 1942.
110. F.R. Gilmore, Report No. 26-4, Hydrodynamics Labora-tory, California Institute of Technology, Pasadena,1952.
111. P. Spiegler et al,., "Onset of Stable Film Boilingand the Foam Limit", Int. J. Heat Mass Transfer 6,987-989, 1963.
112. E.K. Kalinin et al., "Investigation of the Crisisof Film Boiling in Channels", Moscow AviationInstitute, USSR, 1968.
113. R.E. Henry, "A Correlation for the Minimum WallSuperheat in Film Boiling", Trans. Am. Nucl. Soc.15, p 420, 1972.
114. M.S. Plesset and R.B. Chapman, "Collapse of anInitially Spherical Vapor, Cavity in the Neighbor-hood of a Solid Boundary", J. Fluid Mechanics 47 (2)283-290, 1971. ~~
115. H.S. Carslaw and J.C. Jeager, Conduction of HeatIn Solids, Oxford University Press, 1947.
116. R.E. Henry and D.H. Cho, "Reactor Development ProgramProgress Report, December 1972", ANL-RDP-12, p 9.34,February 1973.

268
117. L.J. Briggs, "Limiting Negative Pressure of Water",J. App. Phy. 21 (7), 721-722, July 1950.
118. D.C. Couzens and D.H. Trevera, "Critical Tensionin a Liquid Under Dynamic Conditions of Stressing",Nature, 222, May 3, 1969.
119. A.T.J. Hayward, "Negative Pressure in Liquids:Can it be Harnessed to Serve Man?", AmericanScientist 59 (4), 434-443, July-August 1971.
120. M.G. Sirotyuk, "Experimental Investigations ofUltrasonic Cavitation", in High Intensity UltrasonicFields, L.D. Rozenberg Ed., Plenum Press, New York,1971.
121. H.G. Flynn, "Physics of Acoustic Cavitation inLiquids", in Physical Acoustics Vol. I - Part B,W.P. Mason, Ed., Academic Press, New York, 1964.
122. L. Bernath, "Theory of Bubble Formation in Liquids",Ind. Eng. Chem. 44, 1310-1313, 1952.
123. M. Volmer, Kinetik der Phasenbildung, TheodoreSteinkapft, Dresden and Leipsig, 1939.
124. J.H. Keenan et al, Steam Tables, John Wiley andSons, Inc., New York, 1969.
125. L. Camp, "Underwater Acoustics", Wiley-Interscience,New York, 1970.
126. B.S. Gottfried et al., "The Leidenfrost Phenomenon:Film Boiling of Liquid Droplets on a Flat Plate",Int. J. Heat Mass Transfer 9, 1167-1187, Nov. 1966.
127. K.J. Baumeister et al., "Role of the Surface in theMeasurements of the Leidenfrost Temperature", Proc.ASME Symp. on Augmentation of Convective Heat andMass Transfer, 91-101, 1970.
128. W.M. Rohsenow, "Film Condensation of Liquid Metals",Paper presented at the International Center forHeat and Mass Transfer, Troigir , Yugoslavia,Sept. 1971 also Trans. CSME 1 (1), 5-12, March 1972.

269
129. K.F. Wylie and R.S. Brodkey, "Transport Phenomenaat the Liquid-Vapor Interface of Mercury UsingRadioactive Tracers", Int. Sym. Two Phase Flow,Haifa, Israel, August 1971.
130. A. Ralston, "Mathematical Methods for DigitalComputers, H.S. Wilf Ed., 95-109, Wiley, New York,1960.
131. W.M. Rohsenow and H.Y. Choi, Heat, Mass andMomentum Transfer , Prentice Hall, Inc., 1961.
132. G. Hatsopoulos and J. Keenan, Principles of GeneralThermodynamics, John Wiley & Sons, Inc., N.Y., 1965.
133. W.R. Gibbs, Collected Papers, Vol. I Thermo.,Yale University Press, 1948 (as Referenced inW.M. Rohsenow, "Nucleation With Boiling HeatTransfer", in Role of Nucleation in Boiling andCavitation, R. Nystrom and F. Hammitt, Ed., ASMEPublications, 1970.
134. C.J. Smithells Ed., Metals Reference Book, Vol. III,Fourth Edition, Butterworth and Company, London,1967.
Copyright © 2022 FDOKUMEN