Fluid-Structure Interaction for Coolant Flow in Research-type Nuclear Reactors
6
Franklin G. Curtis 1 · Kivanc Ekici 1 · James D. Freels 2 Fluid-Structure Interaction for Coolant Flow in Research-type Nuclear Reactors Abstract The High Flux Isotope Reactor (HFIR), located at the Oak Ridge National Laboratory (ORNL), is sched- uled to undergo a conversion of the fuel used and this pro- posed change requires an extensive analysis of the flow through the reactor core. The core consists of 540 very thin and long fuel plates through which the coolant (wa- ter) flows at a very high rate. Therefore, the design and the flow conditions make the plates prone to dynamic and static deflections, which may result in flow blockage and structural failure which in turn may cause core damage. To investigate the coolant flow between fuel plates and as- sociated structural deflections, the Fluid-Structure Inter- action (FSI) module in COMSOL will be used. Flow in- duced flutter and static deflections will be examined. To verify the FSI module, a test case of a cylinder in cross- flow, with vortex induced vibrations was performed and validated. Keywords fluid flow, structural dynamics, fluid-structure interactions, FSI, COMSOL 1 Introduction As the HFIR goes through the changes in fuel design from high-enriched uranium (HEU) to low-enriched uranium (LEU) fuel, the characteristics of the fuel plates are ex- pected to change. The HEU is dispersion-type fuel (powder- based), whereas the LEU is a pure metallic structure; there- fore, it is expected that the overall plate will be stiffer. Dur- Research funded by the Department of Energy (DOE) Of- fice of Science and the Global Threat Reduction Initiative (GTRI) of the National Nuclear Security Administration (NNSA) http://nnsa.energy.gov/ 1 Mechanical, Aerospace and Biomedical Engineering Dept. The University of Tennessee Knoxville, TN 37996 2 Oak Ridge National Laboratory 1 Bethel Valley Road P.O. Box 2008 Oak Ridge, TN 37831-6392 E-mail: [email protected] · E-mail: [email protected] · E-mail: [email protected] ing the past half century, significant effort has been made to determine the deflections caused by the coolant flow in the reactor. These analyses were based on the conserva- tive Miller Critical Velocity (M c ) [1]. The effectiveness of the M c has been argued both analytically by Swinson [2] and Wick [3] and experimentally by Smissaert [4]. A fully numerical approach to the FSI phenomena has not been simulated for the HFIR fuel plates for either the HEU or LEU fuel. The conversion to LEU fuel is not only planned for the HFIR but across all US research reactors and thus experi- mental and numerical analyses are being performed to aid in the conversion process. A generic test plate experiment is being designed and constructed at the Oregon State Uni- versity (OSU) that uses a flat plate, multi-channel design to measure both static and dynamic fuel plate deflections. The experiments performed by OSU and others will be used to validate COMSOL’s FSI module and provide con- fidence for the numerical analysis of the HFIR involute fuel plates. A three-step process has been created for the analysis: 1. Verify the COMSOL FSI module with a simple 2-D and 3-D analysis of a cylinder in cross-flow 2. Create a 3-D plate model that will compare to estab- lished (Smissaert) and future (OSU) experimental data 3. And create a 3-D involute geometry effective in pre- dicting the deflection characteristics of both the cur- rent HEU fuel and the future LEU fuel. 2 Governing Equations The flow field for both the cylinder in cross-flow and the fuel plates is considered to be incompressible. The best representation of the flow is given by the Navier-Stokes (N-S) equations for non-linear, unsteady flow. The deriva- tion is well documented in the literature. In differential form, the N-S equations for laminar flow are given by: ρ Du Dt = -∇ p + μ ∇ 2 u + F (1) and ∇ · u = 0 (2)
-
Upload
independent -
Category
Documents
-
view
4 -
download
0
Transcript of Fluid-Structure Interaction for Coolant Flow in Research-type Nuclear Reactors

Franklin G. Curtis1 · Kivanc Ekici1 · James D. Freels2
Fluid-Structure Interaction for Coolant Flow in Research-typeNuclear Reactors
Abstract The High Flux Isotope Reactor (HFIR), locatedat the Oak Ridge National Laboratory (ORNL), is sched-uled to undergo a conversion of the fuel used and this pro-posed change requires an extensive analysis of the flowthrough the reactor core. The core consists of 540 verythin and long fuel plates through which the coolant (wa-ter) flows at a very high rate. Therefore, the design andthe flow conditions make the plates prone to dynamic andstatic deflections, which may result in flow blockage andstructural failure which in turn may cause core damage.To investigate the coolant flow between fuel plates and as-sociated structural deflections, the Fluid-Structure Inter-action (FSI) module in COMSOL will be used. Flow in-duced flutter and static deflections will be examined. Toverify the FSI module, a test case of a cylinder in cross-flow, with vortex induced vibrations was performed andvalidated.
Keywords fluid flow, structural dynamics, fluid-structureinteractions, FSI, COMSOL
1 Introduction
As the HFIR goes through the changes in fuel design fromhigh-enriched uranium (HEU) to low-enriched uranium(LEU) fuel, the characteristics of the fuel plates are ex-pected to change. The HEU is dispersion-type fuel (powder-based), whereas the LEU is a pure metallic structure; there-fore, it is expected that the overall plate will be stiffer. Dur-
Research funded by the Department of Energy (DOE) Of-fice of Science and the Global Threat Reduction Initiative(GTRI) of the National Nuclear Security Administration (NNSA)http://nnsa.energy.gov/
1Mechanical, Aerospace and Biomedical Engineering Dept.The University of TennesseeKnoxville, TN 37996
2Oak Ridge National Laboratory1 Bethel Valley RoadP.O. Box 2008Oak Ridge, TN 37831-6392
E-mail: [email protected] · E-mail: [email protected] · E-mail:[email protected]
ing the past half century, significant effort has been madeto determine the deflections caused by the coolant flow inthe reactor. These analyses were based on the conserva-tive Miller Critical Velocity (Mc) [1]. The effectiveness ofthe Mc has been argued both analytically by Swinson [2]and Wick [3] and experimentally by Smissaert [4]. A fullynumerical approach to the FSI phenomena has not beensimulated for the HFIR fuel plates for either the HEU orLEU fuel.
The conversion to LEU fuel is not only planned for theHFIR but across all US research reactors and thus experi-mental and numerical analyses are being performed to aidin the conversion process. A generic test plate experimentis being designed and constructed at the Oregon State Uni-versity (OSU) that uses a flat plate, multi-channel designto measure both static and dynamic fuel plate deflections.The experiments performed by OSU and others will beused to validate COMSOL’s FSI module and provide con-fidence for the numerical analysis of the HFIR involutefuel plates. A three-step process has been created for theanalysis:
1. Verify the COMSOL FSI module with a simple 2-Dand 3-D analysis of a cylinder in cross-flow
2. Create a 3-D plate model that will compare to estab-lished (Smissaert) and future (OSU) experimental data
3. And create a 3-D involute geometry effective in pre-dicting the deflection characteristics of both the cur-rent HEU fuel and the future LEU fuel.
2 Governing Equations
The flow field for both the cylinder in cross-flow and thefuel plates is considered to be incompressible. The bestrepresentation of the flow is given by the Navier-Stokes(N-S) equations for non-linear, unsteady flow. The deriva-tion is well documented in the literature. In differentialform, the N-S equations for laminar flow are given by:
ρDuDt
=−∇p+µ∇2u+F (1)
and
∇ ·u = 0 (2)

where Eq. (1) is the conservation of momentum and Eq.(2) is the conservation of mass. The Reynolds-AveragedNavier-Stokes (RANS) is used for the turbulence modelsin the COMSOL code. The turbulence models used forour experiments are the k − ε model and Low-ReynoldsNumber (LRN) k− ε model.
3 Methods
3.1 Cylinder in Cross-flow
To gain confidence in COMSOL’s FSI capabilities, thefundamental problem of a cylinder in cross-flow was con-sidered. Previous research has shown that at relatively smallReynolds numbers (47<Re< 180), a phenomenon knownas Von Karman vortex shedding occurs in which a vortexis shed alternatively from the top and bottom of the cylin-der (Roshko [5] and Williamson [6]). The nature of theshedding is determined solely from the non-dimensionalRe and has a relationship to the Strouhal number (St),which is the dimensionless cylinder shedding frequency.The Reynolds number is defined by
Re =U∞Dν∞
(3)
where U∞ is the free-stream velocity, D is the characteris-tic length of the cylinder (the diameter) and ν∞ is the free-stream kinematic viscosity. The non-dimensional Strouhalnumber is defined by
St =f DU∞
(4)
where f is the shedding frequency, D is the characteristiclength and U∞ is the free stream velocity.
The cylinder in cross-flow was analyzed for three dif-ferent cases in 2-D:
1. A stationary cylinder2. A moving cylinder subject to prescribed motion3. A moving cylinder modeled as a mass-damper system
with the forcing function calculated from the lift cre-ated by the shedding vortices
All cases had the same inlet and exit conditions and com-putational domain. The working fluid was taken to be wa-ter, the cylinder diameter was taken to be 1mm, and theinlet velocity varied depending upon the desired Reynoldsnumber. The computational domain is shown in Fig. 1.
Case 1 was run for Re = 100. In order to cut down com-putational time, a stationary solution was used as the ini-tial condition for the transient solver. Initial time-accurateruns proved difficult as the cylinder did not exhibit vor-tex shedding. Upon further inspection, it was discoveredthat the COMSOL implicit solver, by default, uses an al-gorithm to determine the minimum time step based uponthe instability of the solution. This algorithm did not detectthe flow instability and thus created time steps too large tocapture the flow phenomena. To alleviate this problem, the
Fig. 1 The 2-D domain used for the cylinder in cross-flow. Themeshing was more dense behind the cylinder in an effort to capturethe vortex shedding (top). A close up of the boundary layer mesharound the cylinder (bottom).
maximum time step was limited to 1/10 of the expectedshedding frequency for the entirety of the computationalrun. Although this significantly slowed the computationaltime, the solution exhibited the expected frequency shed-ding results.
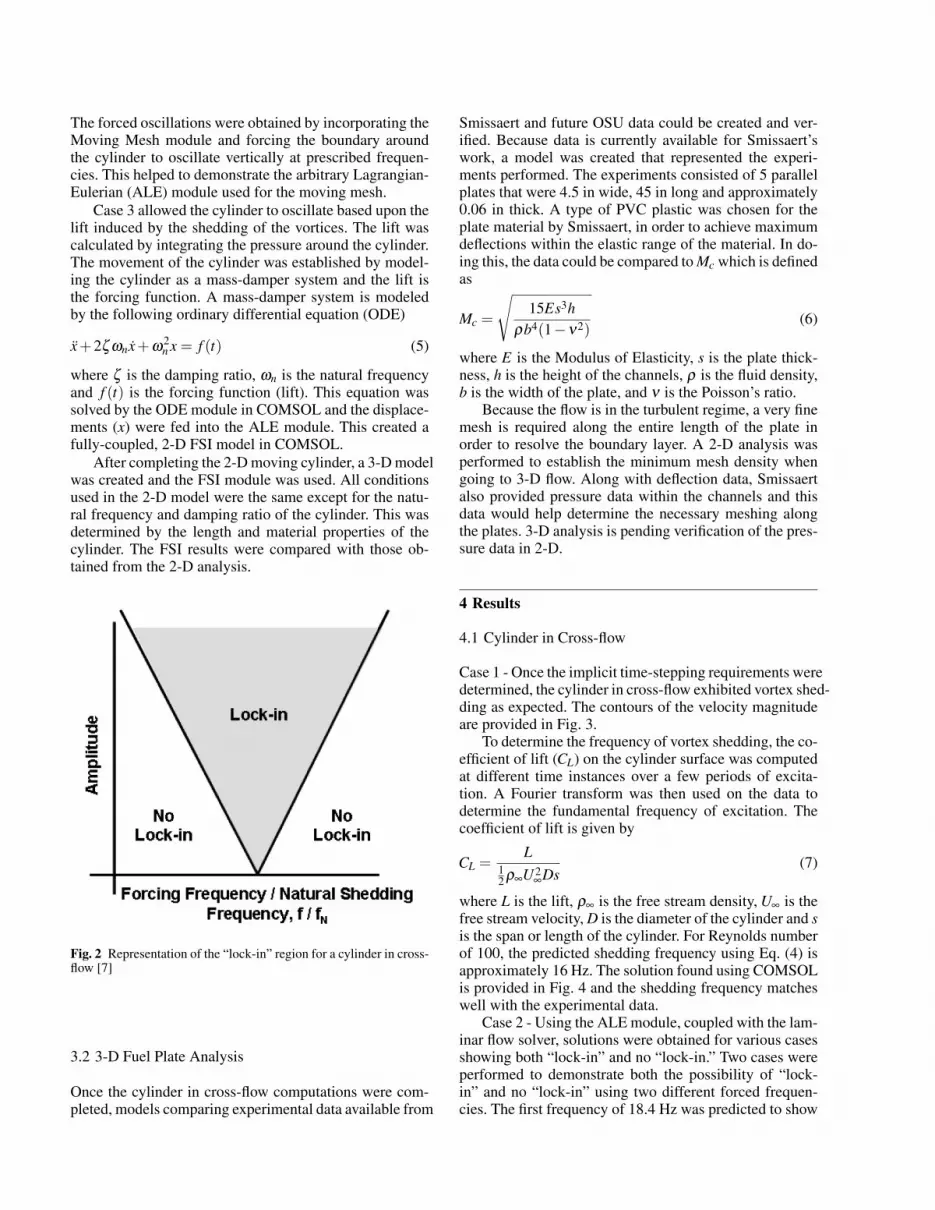
Case 2 involved a cylinder that was forced to move inplunging motion at a prescribed frequency. For a cylin-der that is forced at a frequency near its natural sheddingfrequency, the shedding frequency will “lock-in” to the os-cillating frequency. For forced oscillations outside of thisregion, the cylinder will shed vortices near the predictedshedding frequency given by the Strouhal number [7]. Arepresentation of the “lock-in” region is provided in Fig. 2.
The forced oscillations were obtained by incorporating theMoving Mesh module and forcing the boundary aroundthe cylinder to oscillate vertically at prescribed frequen-cies. This helped to demonstrate the arbitrary Lagrangian-Eulerian (ALE) module used for the moving mesh.
Case 3 allowed the cylinder to oscillate based upon thelift induced by the shedding of the vortices. The lift wascalculated by integrating the pressure around the cylinder.The movement of the cylinder was established by model-ing the cylinder as a mass-damper system and the lift isthe forcing function. A mass-damper system is modeledby the following ordinary differential equation (ODE)
x+2ζ ωnx+ω2n x = f (t) (5)
where ζ is the damping ratio, ωn is the natural frequencyand f (t) is the forcing function (lift). This equation wassolved by the ODE module in COMSOL and the displace-ments (x) were fed into the ALE module. This created afully-coupled, 2-D FSI model in COMSOL.
After completing the 2-D moving cylinder, a 3-D modelwas created and the FSI module was used. All conditionsused in the 2-D model were the same except for the natu-ral frequency and damping ratio of the cylinder. This wasdetermined by the length and material properties of thecylinder. The FSI results were compared with those ob-tained from the 2-D analysis.
Fig. 2 Representation of the “lock-in” region for a cylinder in cross-flow [7]
3.2 3-D Fuel Plate Analysis
Once the cylinder in cross-flow computations were com-pleted, models comparing experimental data available from
Smissaert and future OSU data could be created and ver-ified. Because data is currently available for Smissaert’swork, a model was created that represented the experi-ments performed. The experiments consisted of 5 parallelplates that were 4.5 in wide, 45 in long and approximately0.06 in thick. A type of PVC plastic was chosen for theplate material by Smissaert, in order to achieve maximumdeflections within the elastic range of the material. In do-ing this, the data could be compared to Mc which is definedas
Mc =
√15Es3h
ρb4(1−ν2)(6)
where E is the Modulus of Elasticity, s is the plate thick-ness, h is the height of the channels, ρ is the fluid density,b is the width of the plate, and ν is the Poisson’s ratio.
Because the flow is in the turbulent regime, a very finemesh is required along the entire length of the plate inorder to resolve the boundary layer. A 2-D analysis wasperformed to establish the minimum mesh density whengoing to 3-D flow. Along with deflection data, Smissaertalso provided pressure data within the channels and thisdata would help determine the necessary meshing alongthe plates. 3-D analysis is pending verification of the pres-sure data in 2-D.
4 Results
4.1 Cylinder in Cross-flow
Case 1 - Once the implicit time-stepping requirements weredetermined, the cylinder in cross-flow exhibited vortex shed-ding as expected. The contours of the velocity magnitudeare provided in Fig. 3.
To determine the frequency of vortex shedding, the co-efficient of lift (CL) on the cylinder surface was computedat different time instances over a few periods of excita-tion. A Fourier transform was then used on the data todetermine the fundamental frequency of excitation. Thecoefficient of lift is given by
CL =L
12 ρ∞U2
∞Ds(7)
where L is the lift, ρ∞ is the free stream density, U∞ is thefree stream velocity, D is the diameter of the cylinder and sis the span or length of the cylinder. For Reynolds numberof 100, the predicted shedding frequency using Eq. (4) isapproximately 16 Hz. The solution found using COMSOLis provided in Fig. 4 and the shedding frequency matcheswell with the experimental data.
Case 2 - Using the ALE module, coupled with the lam-inar flow solver, solutions were obtained for various casesshowing both “lock-in” and no “lock-in.” Two cases wereperformed to demonstrate both the possibility of “lock-in” and no “lock-in” using two different forced frequen-cies. The first frequency of 18.4 Hz was predicted to show

Fig. 3 Solution of the stationary cylinder in cross-flow.
Fig. 4 Coefficient of lift on the cylinder displayed in the frequencydomain using a Fast Fourier Transform (FFT).
“lock-in” and thus the cylinder should shed vortices atonly the forcing frequency. The second frequency at 28 Hzshould exhibit no “lock-in” and the FFT should show twofrequencies, one close to the natural shedding frequencyand another one at the forcing frequency. Figs. 5 and 6demonstrate this concept.
Fig. 5 The FFT of the CL of the cylinder with a forcing frequency of18.4 Hz demonstrating a case of “lock-in” with only one frequencypresent.
Fig. 6 The FFT of the CL of the cylinder with a forcing frequencyof 28 Hz demonstrating a case of no “lock-in” with two distinct fre-quencies present.
Case 3 - As described in the Methods section, casethree allowed the cylinder to freely oscillate based uponthe lift created by the shedding of the vortices. The liftaround the cylinder was determined and input into theODE solver of COMSOL for Eq. (5). The result was thenfed into the Moving Mesh module which allowed the cylin-der to oscillate. This technique simulates a 3-D cylinderin cross-flow. The position of the cylinder as a function oftime is provided in Fig. 7

Fig. 7 The position of the cylinder as a function of time using thelift of the cylinder to drive the movement.
Careful examination of the oscillations of the cylinderwill reveal a drift present in the displacement. The cylin-der would continually drift and then settle to a new equi-librium position regardless of time stepping or maximumerror tolerance. This perplexing phenomena also induceda secondary oscillation observable in Fig. 7. This abnor-mality was corrected in the 3-D case.
3-D Cylinder - The 3-D cylinder in cross-flow usedonly the FSI module to model the oscillations of the cylin-der due to the changes in lift caused by the shedding vor-tices. It was discovered during this process that the qualityof the mesh had a very significant effect in the behavior ofthe shedding vortices and oscillations of the cylinder. Theasymmetry of the mesh, coupled with numerical inaccu-racies, caused the flow to be slightly asymmetric resultingin a small, steady lift. To ensure a quality mesh while stillusing a free-mesh scheme, a horizontal line going throughthe center of the cylinder was created to ensure an almostsymmetric mesh around the cylinder. With this new mesh,the oscillations of the 3-D cylinder exhibited the expectedresults provided in Fig. 8.
Fig. 8 The position of the cylinder as a function of time using 3-DFSI.
4.2 3-D Fuel Plate Analysis
As stated in the Methods section, 2-D pressure results willhelp to determine the correct boundary layer meshing forthe 3-D analysis of the fuel plates. Early results for the
PVC plates tested by Smissaert have shown computationalresults with an incorrect inlet pressure of approximately50% difference. Results as compared to experimental dataare provided in Fig. 9.
-10
0
10
20
30
40
50
60
70
-5 0 5 10 15 20 25 30 35 40 45 50
Pre
ssu
re (
in H
2O
)
Distance from Leading Edge (in)
Middle ChannelUpper ChannelLower Channel
Channel 1Channel 2Channel 3Channel 4Channel 5Channel 6
Fig. 9 Pressure along the length of the channels.
The layout for the computational domain for the 2-Dplates is provided in Fig. 10.
Fig. 10 The inlet area of the 5 plate domain used for Smissaert’swork.
As seen in Fig. 10, the leading edge of the plates havebeen sharpened to a point whereas the experimental plates,although not specified, had most likely flat leading edges.If anything, this should decrease the pressure through chan-nels. Interestingly, although the inlet pressure is too high,the pressure along the channel after about 15 in agreeswell with the experimental data.

After further inspection of the paper by Smissaert, ithas been found that the pressure transducer and inlet flowvelocity uncertainties were not specified. Along with otherdiscrepancies in the report, including various plate andchannel widths, it is possible that the measurements pro-vided could be slightly off. For the case being used forcomparison, Smissaert lists the MC = 8.5 f t/s, but we cal-culated the MC = 7.65 f t/s. A computation was performedto examine the effects of specifying the inlet velocity basedon the newly calculated MC. Along with the new inletvalue, the plate thickness was decreased to 0.05 in and thechannel thickness was increased to 0.253 in. The resultsare provided in Fig. 11.
-10
0
10
20
30
40
50
60
70
-5 0 5 10 15 20 25 30 35 40 45 50
Pre
ssu
re (
in H
2O
)
Distance from Leading Edge (in)
Middle ChannelUpper ChannelLower Channel
Smissaert MCNew calculated MC
Fig. 11 Comparison of pressure data for the MC = 8.5 f t/s (Smis-saert’s value) and the MC = 7.65 f t/s (new calculated value).
The results presented in Fig. 11 show that Smissaertmay have inaccuracies with the measurements provided.A small change in parameters produces results that bet-ter agree with his experimental data. A 3-D model willbe run for Smissaert’s PVC plate experiment and compar-isons will be made.
5 Conclusion
The ability of COMSOL to perform multi-physics analy-sis while allowing the coupling of additional external equa-tions upon input has proven to be a very powerful tool. Wewill model the OSU test plates and anticipate that the datawill validate our approach for COMSOL.
References
1. Miller, D. R., “Critical Flow Velocities for Collapse of ReactorParallel-Plate Fuel Assemblies,” Tech. Rep. KAPL-1954, KnollsAtomic Power Lab, 1960.
2. Swinson, W. F. and Yahr, G. T., “Dynamic Pressure Approachto Analysis of Reactor Fuel Plate Stability,” Tech. Rep. CONF-900608-21, Oak Ridge National Laboratory, 1990.
3. Wick, R. S., “Hydro-elastic Behavior of Multiple-plate Fuel-assemblies - I: Pressure Wave Propagation,” Journal of NuclearEnergy, Vol. 23, 1969, pp. 387–405.
4. Smissaert, G. S., “Static and Dynamic Hydroelastic Instabilitiesin MTR-type Fuel Elements Part 1. Introduction and Experimen-tal Investigation,” Nuclear Engineering and Design, Vol. 7, 1968,pp. 535–546.
5. Roshko, A., On the Development of Turbulent Wakes from VortexStreets, Ph.D. thesis, California Institute of Technology, 1952.
6. Williamson, C. H. K., “Defining the Universal and ContinuousStouhal-Reynolds Number Relationship for the Laminar VortexShedding of a Circular Cylinder,” Physics of Fluids, 2004.
7. Spiker, M. A., Development of an Efficient Design Methodfor Non-synchronous Vibrations, Ph.D. thesis, Duke University,2008.