
A feasibility study of scaling-up the electrolytic production of carbon nanotubes in molten salts
12
A feasibility study of scaling-up the electrolytic production of carbon nanotubes in molten salts Aleksandar T. Dimitrov 1 , George Z. Chen *, Ian A. Kinloch, Derek J. Fray * Department of Material Science and Metallurgy, University of Cambridge, Pembroke Street, Cambridge CB2 3QZ, UK Received 18 July 2002; received in revised form 28 August 2002 Abstract The feasibility of scaling-up the electrolytic production of carbon nanotubes in molten salts has been investigated with the aid of electron microscopy (TEM and SEM). Using molten LiCl as the electrolyte and commercial graphite as both cathode and anode materials, carbon nanomaterials, including nanotubes, were prepared by constant voltage electrolysis. The cell was more than 20 times as large as that used in previous work. The nanotube concentration in the final product increased with cell voltage (including iR drop) from 1 vol.% at 4.0 V to 35 vol.% at 8.4 V. Under desired conditions, the charge and energy consumption for the cathode erosion was 0.28 Ah/g and 4.1 Wh/g, of which 60 /70 wt.% were for producing nanomaterials (nanotubes: /30 vol.%). When adding 1 wt.% SnCl 2 to the electrolyte, partial and fully filled nanotubes were obtained with the nanomaterials containing up to 20 wt.% Sn. Preliminary results from applying the product as the electrode in lithium ion batteries are reported. # 2002 Elsevier Science Ltd. All rights reserved. Keywords: Carbon nanotubes; Molten salts; Electrolysis; Scaling up; Electron microscopy 1. Introduction Carbon nanotubes (CNTs) are strong, stiff, and electrically conductive. They possess large aspect ratios and surface areas, and can be either multi- or single walled structures [1]. Practical uses of CNTs have become more promising in recent years, such as fillers in polymer composites, field emitters for flat panel displays, electrodes for supercapacitors and elements in nano-electronics [2 /4]. CNTs are typically produced in the gas phase, by the evaporation of pure carbon using a high-powered energy source (e.g. electric arc, laser or solar heat) or by the catalytic decomposition of gaseous hydrocarbons over a transition metal (e.g. acetylene over Fe) [5 /7]. However, in 1995, Hsu et al. discovered that CNTs could also be produced in molten LiCl by electrolysis using high purity carbon electrodes, presenting the first example of producing CNTs in a condensed phase [8]. In their experiments, the carbon cathode underwent erosion and nanometre sized pro- ducts, including multiwalled CNTs were found in the molten salt (electrolyte). Subsequently they conducted a more detailed study and concluded that for CNT production, the immersion of cathode in the electrolyte needed to be shallow ( B/3 cm), the current moderate ( B/5 A) and the voltage low ( B/5 V) [9]. The discovery of Hsu et al. stimulated further work in this laboratory under various conditions in different electrolytes (LiCl, NaCl and KCl) and, particularly, suitable CNT pre- paration temperatures for each electrolyte were estab- lished [10,11]. It was concluded that CNTs were not to form at temperatures higher than the boiling points of the alkali metals [10,11]. In 2000, Kaptay et al. reported that, on graphite cathode, the electro-deposition of Li, Na, K, Mg and Ca from the respective molten chlorides all led to the formation of CNTs, but not of Sn and Ni [12]. Hsu et al. [13] reported later that the electrolytic method could also be used to make carbon coated metal nanowires by adding a low melting temperature metal or * Corresponding authors. Tel.: /44-1223-762965; fax: /44-122- 3334567 E-mail addresses: [email protected] (G.Z. Chen), [email protected] (D.J. Fray). 1 Academic Visitor from the Faculty of Technology and Metallurgy, Uni versity ‘St.Cyril and Methodius’, 16 Rudjer Boskovic, 1000 Skopje, R Macedonia. Electrochimica Acta 48 (2002) 91 /102 www.elsevier.com/locate/electacta 0013-4686/02/$ - see front matter # 2002 Elsevier Science Ltd. All rights reserved. PII:S0013-4686(02)00595-9
-
Upload
nottingham -
Category
Documents
-
view
2 -
download
0
Transcript of A feasibility study of scaling-up the electrolytic production of carbon nanotubes in molten salts
A feasibility study of scaling-up the electrolytic production of carbonnanotubes in molten salts
Aleksandar T. Dimitrov 1, George Z. Chen *, Ian A. Kinloch, Derek J. Fray *
Department of Material Science and Metallurgy, University of Cambridge, Pembroke Street, Cambridge CB2 3QZ, UK
Received 18 July 2002; received in revised form 28 August 2002
Abstract
The feasibility of scaling-up the electrolytic production of carbon nanotubes in molten salts has been investigated with the aid of
electron microscopy (TEM and SEM). Using molten LiCl as the electrolyte and commercial graphite as both cathode and anode
materials, carbon nanomaterials, including nanotubes, were prepared by constant voltage electrolysis. The cell was more than 20
times as large as that used in previous work. The nanotube concentration in the final product increased with cell voltage (including
iR drop) from 1 vol.% at 4.0 V to 35 vol.% at 8.4 V. Under desired conditions, the charge and energy consumption for the cathode
erosion was 0.28 Ah/g and 4.1 Wh/g, of which 60�/70 wt.% were for producing nanomaterials (nanotubes: �/30 vol.%). When
adding 1 wt.% SnCl2 to the electrolyte, partial and fully filled nanotubes were obtained with the nanomaterials containing up to 20
wt.% Sn. Preliminary results from applying the product as the electrode in lithium ion batteries are reported.
# 2002 Elsevier Science Ltd. All rights reserved.
Keywords: Carbon nanotubes; Molten salts; Electrolysis; Scaling up; Electron microscopy
1. Introduction
Carbon nanotubes (CNTs) are strong, stiff, and
electrically conductive. They possess large aspect ratios
and surface areas, and can be either multi- or single
walled structures [1]. Practical uses of CNTs have
become more promising in recent years, such as fillers
in polymer composites, field emitters for flat panel
displays, electrodes for supercapacitors and elements
in nano-electronics [2�/4]. CNTs are typically produced
in the gas phase, by the evaporation of pure carbon
using a high-powered energy source (e.g. electric arc,
laser or solar heat) or by the catalytic decomposition of
gaseous hydrocarbons over a transition metal (e.g.
acetylene over Fe) [5�/7]. However, in 1995, Hsu et al.
discovered that CNTs could also be produced in molten
LiCl by electrolysis using high purity carbon electrodes,
presenting the first example of producing CNTs in a
condensed phase [8]. In their experiments, the carbon
cathode underwent erosion and nanometre sized pro-
ducts, including multiwalled CNTs were found in the
molten salt (electrolyte). Subsequently they conducted a
more detailed study and concluded that for CNT
production, the immersion of cathode in the electrolyte
needed to be shallow (B/3 cm), the current moderate
(B/5 A) and the voltage low (B/5 V) [9]. The discovery
of Hsu et al. stimulated further work in this laboratory
under various conditions in different electrolytes (LiCl,
NaCl and KCl) and, particularly, suitable CNT pre-
paration temperatures for each electrolyte were estab-
lished [10,11]. It was concluded that CNTs were not to
form at temperatures higher than the boiling points of
the alkali metals [10,11]. In 2000, Kaptay et al. reported
that, on graphite cathode, the electro-deposition of Li,
Na, K, Mg and Ca from the respective molten chlorides
all led to the formation of CNTs, but not of Sn and Ni
[12].
Hsu et al. [13] reported later that the electrolytic
method could also be used to make carbon coated metal
nanowires by adding a low melting temperature metal or
* Corresponding authors. Tel.: �/44-1223-762965; fax: �/44-122-
3334567
E-mail addresses: [email protected] (G.Z. Chen),
[email protected] (D.J. Fray).1 Academic Visitor from the Faculty of Technology and
Metallurgy, University ‘St.Cyril and Methodius’, 16 Rudjer
Boskovic, 1000 Skopje, R Macedonia.
Electrochimica Acta 48 (2002) 91�/102
www.elsevier.com/locate/electacta
0013-4686/02/$ - see front matter # 2002 Elsevier Science Ltd. All rights reserved.
PII: S 0 0 1 3 - 4 6 8 6 ( 0 2 ) 0 0 5 9 5 - 9
salt in small concentrations to the electrolyte. For
example, SnCl2 added to LiCl resulted in the production
of nanotubes filled with Sn [13] and this is an advantage
of the electrolytic method over some of the otherproduction methods since the filled nanotubes are
produced in situ.
While all results from this and other laboratories
suggest that the electrochemical formation of CNTs in
molten salts is related with the erosion of the cathode,
such behaviour of a carbon cathode is, as was first
pointed out by Fray [10,14], common in the Hall-
Heroult cell where the intercalation of alkali metals,particularly sodium, into the carbon cathode is known
to have caused cathode expansion, cracking and erosion.
Based on the facts that CNTs were collectable from the
solidified salt phase and also the CNT yield depended
strongly on electrolysis current and temperature [8�/12],
it was further proposed [11,15] that the alkali metal ion
(M�) intercalates, under the influence of a sufficiently
negative electrode potential, into the graphite latticewhere it is reduced in situ. The alkali metal then expands
the lattice and more strain is put into the lattice as the
amount of metal increases, until the lattice fragments.
The carbon based fragments may then enter the molten
salt and, without the protection of the graphite lattice,
undergo through an inter- and/or intra-fragment re-
combination process, leading to the formation of
various carbon nanoparticles and nanotubes in theelectrolyte [11,12]. Alternatively, as it was initially
postulated in this laboratory, the intercalation of alkali
metal could lead to the extrusion of carbon. Instead of
forming CNTs in electrolyte via the re-combination of
carbon fragments, the outcome of extrusion may be the
direct formation of CNTs or their pre-cursors on the
surface of the cathode. Interestingly, this prediction had
not been experimentally confirmed in this and otherlaboratories [8�/14] until recently when Kaptay et al.
reported their observation of carbon micro-tubes on the
surface of a graphite cathode [16]. Nevertheless, the two
proposed post-intercalation processes can be considered
essentially the same if the extruded CNTs or their pre-
cursors can fall into and grow further in the electrolyte
or the inter- and/or intra-fragment re-combination may
occur on the cathode’s surface.As reported in literature, the majority of researchers
performed constant current electrolysis in their prepara-
tions of CNTs in molten salts and, even when voltage
control was used, results were mainly expressed in terms
of current [9]. However, in constant current electrolysis,
because of erosion, the surface area of cathode changes
with time and so does the current density. This is
obviously undesirable as the electrode reaction can besignificantly altered by current density variation, mak-
ing it difficult to correlate electrochemical parameters
with the products. In a two-electrode cell, a relatively
constant cathode potential, and hence the current
density, can be achieved if a constant cell voltage is
applied between the cathode and an anode of much
larger surface area. Following this approach, constant
voltage electrolysis was carried out in molten NaCl in
this laboratory and the results exhibited a maximum
CNT yield against cell voltages that was varied between
3 and 9 V [15]. This observation supports strongly the
intercalation mechanism in which the speed of alkali
metal intercalation, which can be correlated with the
electrode potential (and hence the current density), plays
a key role in determining the composition and structure
of fragmented or extruded products [11,15].
It should be pointed out that, up till now, all reports
on the formation of CNTs in molten salts have
described electrolysis in relatively small cells. In addi-
tion, the electrolysis times given in these reports are
usually short, which is due to firstly the complete
erosion of the cathode and secondly the saturation of
the salt by electrolysis products, particularly the alkali
or alkaline earth metal. Therefore, it would be both
scientifically interesting and practically important to
investigate the electrochemical method at increased
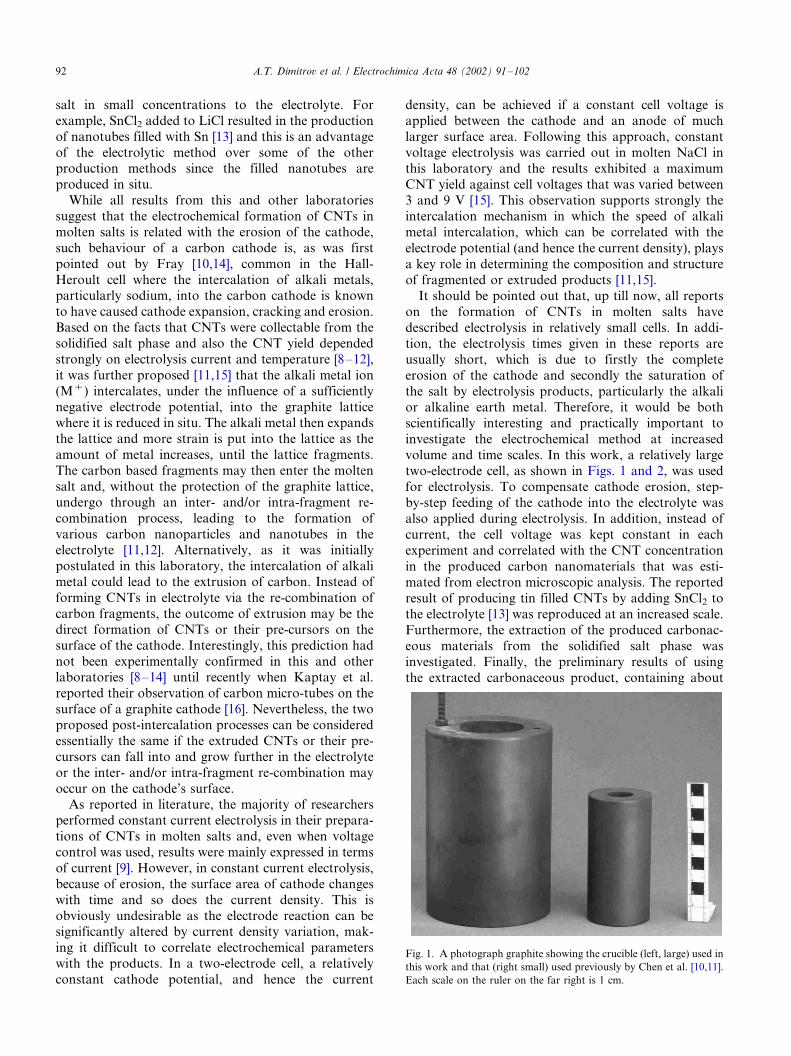
volume and time scales. In this work, a relatively large
two-electrode cell, as shown in Figs. 1 and 2, was used
for electrolysis. To compensate cathode erosion, step-
by-step feeding of the cathode into the electrolyte was
also applied during electrolysis. In addition, instead of
current, the cell voltage was kept constant in each
experiment and correlated with the CNT concentration
in the produced carbon nanomaterials that was esti-
mated from electron microscopic analysis. The reported
result of producing tin filled CNTs by adding SnCl2 to
the electrolyte [13] was reproduced at an increased scale.
Furthermore, the extraction of the produced carbonac-
eous materials from the solidified salt phase was
investigated. Finally, the preliminary results of using
the extracted carbonaceous product, containing about
Fig. 1. A photograph graphite showing the crucible (left, large) used in
this work and that (right small) used previously by Chen et al. [10,11].
Each scale on the ruler on the far right is 1 cm.
A.T. Dimitrov et al. / Electrochimica Acta 48 (2002) 91�/10292
30 vol.% CNTs, as the lithium intercalation electrode in
lithium ion batteries are reported.
2. Experimental
Electrolysis was carried out in a cylindrical graphite
cell (external: 15.0 cm height and 9.0 cm diameter;
internal: 14.0 cm height and 7.0 cm diameter, Graphite
Technologies, high density grade) which also acted as
the anode during electrolysis. This cell had a volume
significantly larger than those used previously in thislaboratory [10,11] (see Fig. 1). A graphite rod (6.5 mm
diameter, Graphite Technologies, EC4 grade, density:
1.75 g/cm3) was used as the cathode and was fed, step-
by-step, into the electrolyte after electrolytic consump-
tion. Molten LiCl or LiCl�/SnCl2 (99:1 by weight, both
from Aldrich, ACS grade) was used as the electrolyte at
700 8C (Table 1). As was observed previously, the
electrolysis continuously produced alkali metal (Li)that could float on the surface of the molten salt,
providing a short circuit between anode and cathode. To
prevent this, the cathode was surrounded with an
alumina sheath (external and internal diameters: 1.15
and 0.8 cm) whose lower end was placed about 1.5 cm
underneath the surface of the molten salt. The cell and
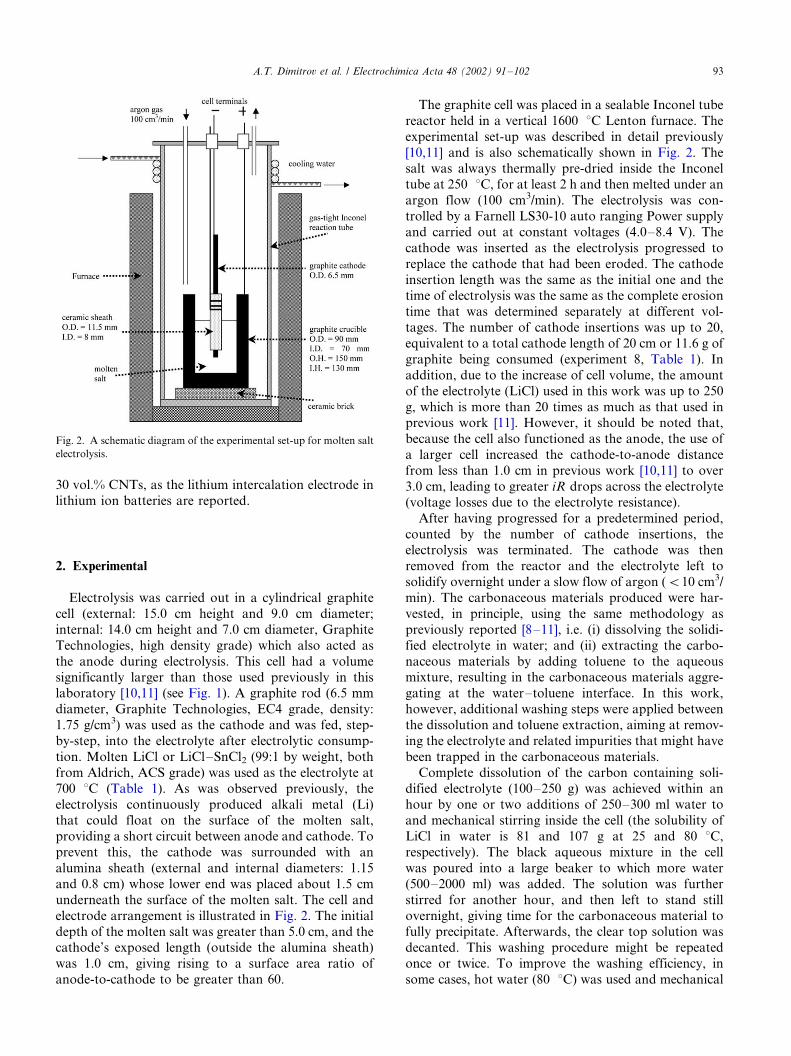
electrode arrangement is illustrated in Fig. 2. The initial
depth of the molten salt was greater than 5.0 cm, and thecathode’s exposed length (outside the alumina sheath)
was 1.0 cm, giving rising to a surface area ratio of
anode-to-cathode to be greater than 60.
The graphite cell was placed in a sealable Inconel tube
reactor held in a vertical 1600 8C Lenton furnace. The
experimental set-up was described in detail previously
[10,11] and is also schematically shown in Fig. 2. Thesalt was always thermally pre-dried inside the Inconel
tube at 250 8C, for at least 2 h and then melted under an
argon flow (100 cm3/min). The electrolysis was con-
trolled by a Farnell LS30-10 auto ranging Power supply
and carried out at constant voltages (4.0�/8.4 V). The
cathode was inserted as the electrolysis progressed to
replace the cathode that had been eroded. The cathode
insertion length was the same as the initial one and thetime of electrolysis was the same as the complete erosion
time that was determined separately at different vol-
tages. The number of cathode insertions was up to 20,
equivalent to a total cathode length of 20 cm or 11.6 g of
graphite being consumed (experiment 8, Table 1). In
addition, due to the increase of cell volume, the amount
of the electrolyte (LiCl) used in this work was up to 250
g, which is more than 20 times as much as that used inprevious work [11]. However, it should be noted that,
because the cell also functioned as the anode, the use of
a larger cell increased the cathode-to-anode distance
from less than 1.0 cm in previous work [10,11] to over
3.0 cm, leading to greater iR drops across the electrolyte
(voltage losses due to the electrolyte resistance).
After having progressed for a predetermined period,
counted by the number of cathode insertions, theelectrolysis was terminated. The cathode was then
removed from the reactor and the electrolyte left to
solidify overnight under a slow flow of argon (B/10 cm3/
min). The carbonaceous materials produced were har-
vested, in principle, using the same methodology as
previously reported [8�/11], i.e. (i) dissolving the solidi-
fied electrolyte in water; and (ii) extracting the carbo-
naceous materials by adding toluene to the aqueousmixture, resulting in the carbonaceous materials aggre-
gating at the water�/toluene interface. In this work,
however, additional washing steps were applied between
the dissolution and toluene extraction, aiming at remov-
ing the electrolyte and related impurities that might have
been trapped in the carbonaceous materials.
Complete dissolution of the carbon containing soli-
dified electrolyte (100�/250 g) was achieved within anhour by one or two additions of 250�/300 ml water to
and mechanical stirring inside the cell (the solubility of
LiCl in water is 81 and 107 g at 25 and 80 8C,
respectively). The black aqueous mixture in the cell
was poured into a large beaker to which more water
(500�/2000 ml) was added. The solution was further
stirred for another hour, and then left to stand still
overnight, giving time for the carbonaceous material tofully precipitate. Afterwards, the clear top solution was
decanted. This washing procedure might be repeated
once or twice. To improve the washing efficiency, in
some cases, hot water (80 8C) was used and mechanical
Fig. 2. A schematic diagram of the experimental set-up for molten salt
electrolysis.
A.T. Dimitrov et al. / Electrochimica Acta 48 (2002) 91�/102 93
stirring was carried out while placing the beaker in an
ultrasonic bath.
After washing and decanting most of the water, a
small amount of the carbonaceous material was dried
and analysed directly and the rest was transferred into a
large separation flask (1.0 l) containing mixed water and
toluene (10:1, vol.), followed by thorough shaking. Theflask was then allowed to stand still for phase separa-
tion. As reported previously, after phase separation, the
carbonaceous materials were found to aggregate at the
water/toluene and toluene/glass wall interfaces [10].
Once separated, the water phase was drained. The
carbonaceous materials and toluene were transferred
into a storage bottle (with lid). The toluene could be re-
collected by the conventional evaporation method, andre-used in the next extraction. However, for most
samples, some toluene was kept in the storage bottle
with the carbonaceous materials. This was because it
was much easier to simply shake the bottle to tempora-
rily and uniformly suspend the carbonaceous materials
and take a small amount of the suspension for further
analysis, e.g. by electron microscopy which was per-
formed on JEOL 200CX (TEM, 200 kV) and JEOL6340F (SEM, 5 to 20 kV, capable of energy dispersive
X-ray analysis). The CNT concentration in the collected
carbonaceous materials was estimated from SEM
images of relatively low magnifications [8�/11].
Some of the samples were sent to AEA Technologies
and made into the lithium intercalation electrodes whose
capacity and rechargeablity were examined in a testing
lithium ion battery by the standard method developedby AEA Technologies.
3. Results and discussion
3.1. Electrolysis
In previous work, electrolytic preparation of CNTs in
molten salts was conducted using naked graphite rod
cathodes and constant current [8�/13,16]. Consequently,
due to its lower density than the corresponding molten
chloride salt, the electrolytically formed alkali or alka-
line earth metal floated on the electrolyte’s surface and
provided a short circuit between the anode and cathode.
While such a problem might not be very serious for
batch preparation, it will certainly prevent further or
continuous operations from using the same molten salt.
In this work, in order to avoid the floating alkali metal
(Li) shorting the electrodes, it was decided to use an
alumina sheath to surround the upper portion of the
cathode in contact with the electrolyte, as shown in Fig.
2. In addition, as discussed in Section 1, constant
voltage electrolysis was applied. Because such experi-
mental arrangements have never been applied in pre-
vious work, it is worth reporting firstly the cell
performance in the batch operation mode.
In this work, all electrolysis experiments were con-
ducted at 700 8C which is in the optimal temperature
range for CNT preparation in molten LiCl as deter-
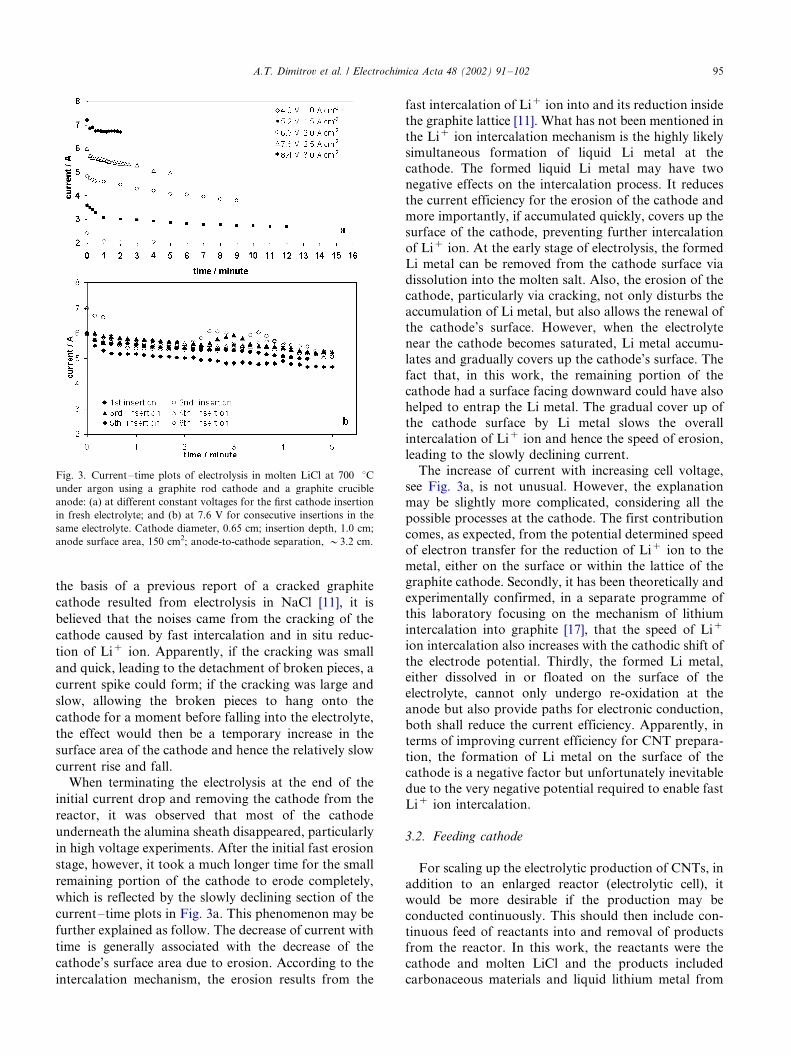
mined in previous work [10,11]. Fig. 3 plots the currents
measured at different times and voltages when electro-
lysing a fresh bath of pure molten LiCl for the first
cathode insertion (Fig. 3a), and that at 7.6 V for a
number of consecutive insertions (Fig. 3b). For the first
insertion (Fig. 3a), apart from the strong dependence of
the current on the applied cell voltage, the plots show
clearly two processes: the current drops relatively
rapidly in a short period soon after applying the voltage
and then declines slowly with time, either continuously
at low voltages (Fig. 3a) or passing through one or more
peaks at high voltages (Fig. 3b). It is worth mentioning
that, when a high voltage (�/7.0 V) was applied,
intermittent cracking noises were heard from the reactor
during electrolysis. Simultaneously, the current was seen
to rise and fall on the display of the power supply. In
some cases, the rise and fall of the current were as sharp
as a spike (not shown in Fig. 3 which were recorded
manually) and, in others, took a relatively longer time,
forming the broad current peaks as shown in Fig. 3b. On
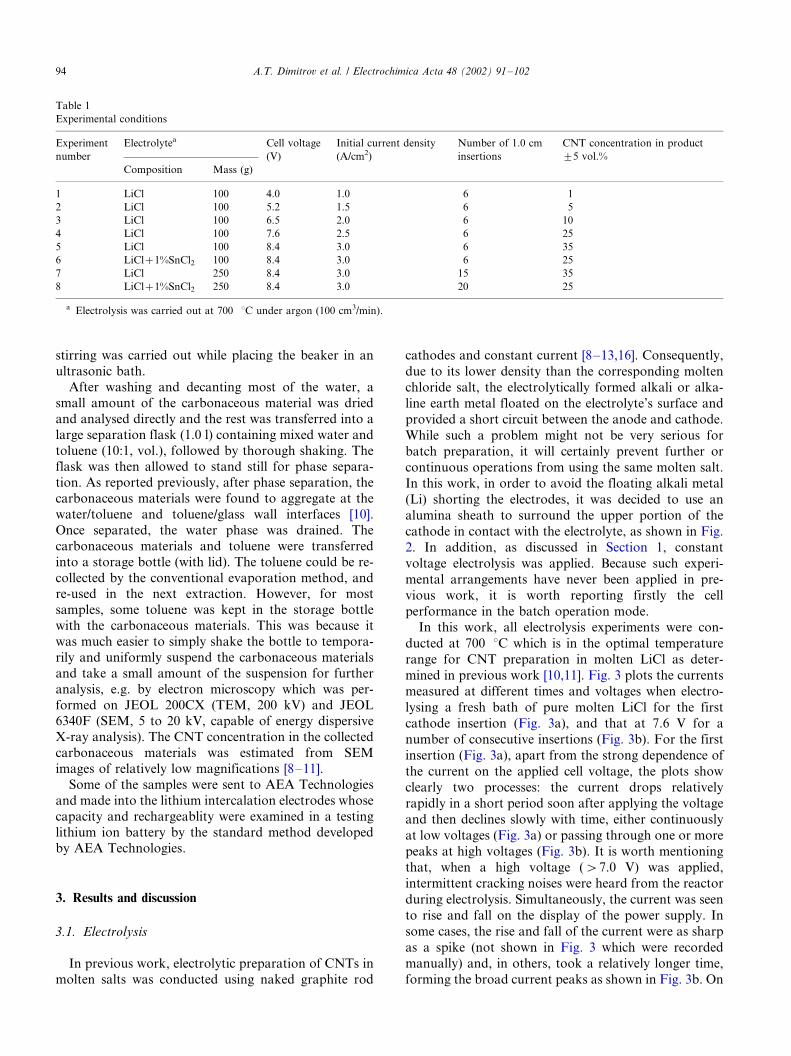
Table 1
Experimental conditions
Experiment
number
Electrolytea Cell voltage
(V)
Initial current density
(A/cm2)
Number of 1.0 cm
insertions
CNT concentration in product
95 vol.%
Composition Mass (g)
1 LiCl 100 4.0 1.0 6 1
2 LiCl 100 5.2 1.5 6 5
3 LiCl 100 6.5 2.0 6 10
4 LiCl 100 7.6 2.5 6 25
5 LiCl 100 8.4 3.0 6 35
6 LiCl�1%SnCl2 100 8.4 3.0 6 25
7 LiCl 250 8.4 3.0 15 35
8 LiCl�1%SnCl2 250 8.4 3.0 20 25
a Electrolysis was carried out at 700 8C under argon (100 cm3/min).
A.T. Dimitrov et al. / Electrochimica Acta 48 (2002) 91�/10294
the basis of a previous report of a cracked graphite
cathode resulted from electrolysis in NaCl [11], it is
believed that the noises came from the cracking of the
cathode caused by fast intercalation and in situ reduc-
tion of Li� ion. Apparently, if the cracking was small
and quick, leading to the detachment of broken pieces, a
current spike could form; if the cracking was large and
slow, allowing the broken pieces to hang onto the
cathode for a moment before falling into the electrolyte,
the effect would then be a temporary increase in the
surface area of the cathode and hence the relatively slow
current rise and fall.
When terminating the electrolysis at the end of the
initial current drop and removing the cathode from the
reactor, it was observed that most of the cathode
underneath the alumina sheath disappeared, particularly
in high voltage experiments. After the initial fast erosion
stage, however, it took a much longer time for the small
remaining portion of the cathode to erode completely,
which is reflected by the slowly declining section of the
current�/time plots in Fig. 3a. This phenomenon may be
further explained as follow. The decrease of current with
time is generally associated with the decrease of the
cathode’s surface area due to erosion. According to the
intercalation mechanism, the erosion results from the
fast intercalation of Li� ion into and its reduction inside
the graphite lattice [11]. What has not been mentioned in
the Li� ion intercalation mechanism is the highly likely
simultaneous formation of liquid Li metal at thecathode. The formed liquid Li metal may have two
negative effects on the intercalation process. It reduces
the current efficiency for the erosion of the cathode and
more importantly, if accumulated quickly, covers up the
surface of the cathode, preventing further intercalation
of Li� ion. At the early stage of electrolysis, the formed
Li metal can be removed from the cathode surface via
dissolution into the molten salt. Also, the erosion of thecathode, particularly via cracking, not only disturbs the
accumulation of Li metal, but also allows the renewal of
the cathode’s surface. However, when the electrolyte
near the cathode becomes saturated, Li metal accumu-
lates and gradually covers up the cathode’s surface. The
fact that, in this work, the remaining portion of the
cathode had a surface facing downward could have also
helped to entrap the Li metal. The gradual cover up ofthe cathode surface by Li metal slows the overall
intercalation of Li� ion and hence the speed of erosion,
leading to the slowly declining current.
The increase of current with increasing cell voltage,
see Fig. 3a, is not unusual. However, the explanation
may be slightly more complicated, considering all the
possible processes at the cathode. The first contribution
comes, as expected, from the potential determined speedof electron transfer for the reduction of Li� ion to the
metal, either on the surface or within the lattice of the
graphite cathode. Secondly, it has been theoretically and
experimentally confirmed, in a separate programme of
this laboratory focusing on the mechanism of lithium
intercalation into graphite [17], that the speed of Li�
ion intercalation also increases with the cathodic shift of
the electrode potential. Thirdly, the formed Li metal,either dissolved in or floated on the surface of the
electrolyte, cannot only undergo re-oxidation at the
anode but also provide paths for electronic conduction,
both shall reduce the current efficiency. Apparently, in
terms of improving current efficiency for CNT prepara-
tion, the formation of Li metal on the surface of the
cathode is a negative factor but unfortunately inevitable
due to the very negative potential required to enable fastLi� ion intercalation.
3.2. Feeding cathode
For scaling up the electrolytic production of CNTs, in
addition to an enlarged reactor (electrolytic cell), it
would be more desirable if the production may be
conducted continuously. This should then include con-
tinuous feed of reactants into and removal of productsfrom the reactor. In this work, the reactants were the
cathode and molten LiCl and the products included
carbonaceous materials and liquid lithium metal from
Fig. 3. Current�/time plots of electrolysis in molten LiCl at 700 8Cunder argon using a graphite rod cathode and a graphite crucible
anode: (a) at different constant voltages for the first cathode insertion
in fresh electrolyte; and (b) at 7.6 V for consecutive insertions in the
same electrolyte. Cathode diameter, 0.65 cm; insertion depth, 1.0 cm;
anode surface area, 150 cm2; anode-to-cathode separation, �/3.2 cm.
A.T. Dimitrov et al. / Electrochimica Acta 48 (2002) 91�/102 95

the cathode, and chlorine gas from the anode. Except
for chlorine gas that escapes from the reactor naturally,
continuous removal of the other two products requires
sophisticated mechanism and devices for handling the
corrosive high temperature molten materials. Obviously,
the experimental set-up used in this work was not
suitable for continuous removal of the molten materials.
While ongoing efforts are being made in this direction,
as a first attempt, this work focused on feeding the
cathode.Because the aim of feeding the cathode is to compen-
sate the loss of the cathode due to erosion, it is necessary
to first determine the erosion rate of the cathode. As
discussed in previous reports [8�/11], the cathode erosion
rate can be influenced by a number of parameters,
including geometry of cathode, cathode insertion depth,
melt type and composition, working temperature and
most importantly current density (cathode potential). In
this work, the insertion depth and cell voltage were
varied but all the other parameters were fixed (see
Section 2). It should be pointed out that although it was
hoped to maintain a relatively stable cathodic current
density by constant voltage electrolysis with a large
anode-to-cathode surface area ratio, strictly speaking,
variation of the cathode current density could still occur
to a certain degree. For example, because of the total
current varies with time due to the erosion decreasing
the cathode surface area, the iR drop of the cell would
decrease. Therefore, the actual cathode potential would
also become more negative with time, leading to an
increase in the potential driven current density. Never-
theless, the influence of cell voltage on the erosion rate
could still be, although to a lesser quantitative degree,
investigated by visual inspection and comparison of the
cathodes after different times of electrolysis. Fig. 4 plots
the cell voltage or the initial cathode current density
against the electrolysis time when complete cathode
erosion was achieved. Interestingly, it can be seen that
the complete cathode erosion time decreases almost
linearly with increasing the cell voltage or the initial
current density. This inverse dependence of erosion rate
on voltage or initial current density is in fact expected
according to the intercalation mechanism that predicts
the speed of Li� ion intercalation and hence the cathodeerosion to increase with increasing the cathode current
density [11].
Based on the data in Fig. 3a and Fig. 4, the charge
and energy consumption per gram of eroded cathode
(density 1.75 g/cm3) were evaluated and found to
undergo through a maximum at an intermediate voltage
(6.5 V). At the high voltage end (8.4 V), the consump-
tion was 0.28 Ah/g for charge and 4.1 Wh/g for energy.As will be discussed later, it was found that, on average,
about 60�/70% of the eroded graphite were converted
into carbon nanomaterials of which 25�/35% were
CNTs. If the same charge consumption is used to reduce
the Li� ion (disregarding the product being Li metal or
Li2C2 or other intercalation compounds) with 90�/100%
current efficiency, it can be calculated that the number
of reduced Li� ions is about a quarter of and the sameas that of the carbon atoms in the carbon nanomaterials
and CNTs, respectively. Interestingly, these findings
may be compared favourably with the intercalation
mechanism proposed in Ref. [11] in which it was
assumed that the formation of CNTs resulted from the
decomposition of the metastable species MiCx that were
generated by fast intercalation and in situ reduction of
M� (the alkali or alkaline earth metal ion). It wasfurther assumed that the values of i and x in MiCx ,
correlated as x ]/i ]/2, were crucial for CNT formation.
It should be pointed out that although simple atomic
ratios between electrolytically reduced lithium ions and
produced carbon nanomaterials (Li:C�/1:4) or CNTs
(Li:C�/1:1) are unprecedentedly reported in literature,
such correlations may not be very surprising considering
the following facts. First of all, these findings haveresulted from experiments in which electrolysis was
conducted in fresh molten LiCl and terminated before
too much accumulation of lithium metal in and above
the electrolyte, and also the alumina sheath functioned
effectively to further reduce electronic conduction
through lithium metal that were accumulated in the
upper region of the electrolyte. Secondly, recent chron-
oamperometric studies in molten LiCl [17] revealed thatthe current response of a graphite rod electrode to a
potential step in the range of 0.8�/�/1.8 V vs. Li�/Li was
dominated by the contribution from lithium intercala-
tion into graphite. Finally, Hsu et al. [18] reported that
the thermal decomposition of the metal carbide, Al4C3,
indeed led to the formation of graphite fragments and
also CNTs if a transition metal catalyst was present.
Having determined the electrochemical parameters inrelevance with cathode erosion, particularly the com-
plete cathode erosion time, experiments were then
carried out to feed the cathode into the electrolyte via
step-by-step manual insertion. In these experiments, the
Fig. 4. Plots of the complete cathode erosion time against the cell
voltage and initial current density of electrolysis. Experimental
conditions were the same as in Fig. 3a.
A.T. Dimitrov et al. / Electrochimica Acta 48 (2002) 91�/10296
interval between consecutive insertions was determined
according to Fig. 4. For example, the interval was 2.5
min at 8.4 V and 5 min at 7.6 V. During the electrolysis
after each insertion, it was observed that, considering
experimental error (e.g. the inaccuracy in insertion
depth resulting from manual operation), the current
always started at the same high values and ended at the
same low values, although in some cases the current
decreased continuously and in other cases passed
through one or more peaks. Typical current�/time plots
recorded in one of these experiments are presented in
Fig. 3b. The insertion depth was kept at 1.0 cm in most
experiments. This is because firstly the result was more
repeatable at this insertion depth, and secondly, at 2.0 or
3.0 cm, much larger portions of the cathode cracked off
at the early stage of electrolysis. Also, with further
increasing the insertion depth, the cathode surface area
increased, resulting in, at high voltages, greater currents
than the limit of the power supply.
It can be seen in Fig. 3b that, except for the peaks, the
currents recorded after each insertion are very similar to
each other, demonstrating the step-by-step cathode
insertion to be a feasible method for scaling up the
electrolytic production of CNTs. After some systematic
trials with feeding the cathode (Table 1, Experiments 1�/
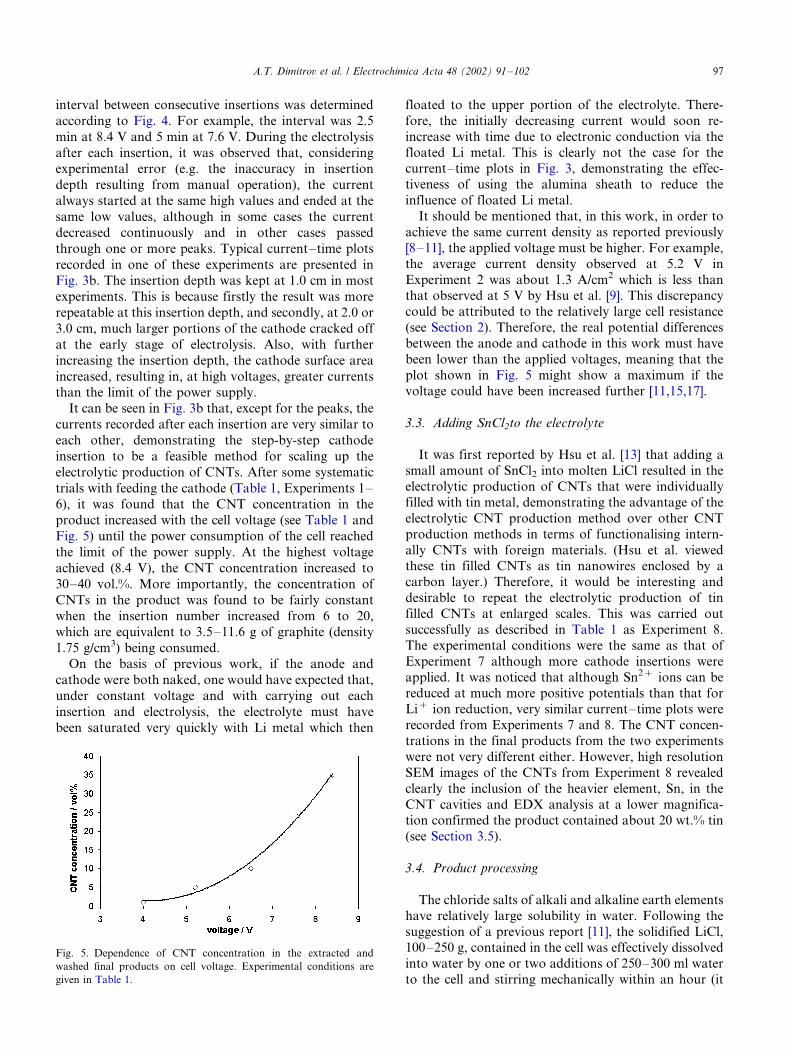
6), it was found that the CNT concentration in the
product increased with the cell voltage (see Table 1 and
Fig. 5) until the power consumption of the cell reached
the limit of the power supply. At the highest voltage
achieved (8.4 V), the CNT concentration increased to
30�/40 vol.%. More importantly, the concentration of
CNTs in the product was found to be fairly constant
when the insertion number increased from 6 to 20,
which are equivalent to 3.5�/11.6 g of graphite (density
1.75 g/cm3) being consumed.
On the basis of previous work, if the anode and
cathode were both naked, one would have expected that,
under constant voltage and with carrying out each
insertion and electrolysis, the electrolyte must have
been saturated very quickly with Li metal which then
floated to the upper portion of the electrolyte. There-
fore, the initially decreasing current would soon re-
increase with time due to electronic conduction via the
floated Li metal. This is clearly not the case for thecurrent�/time plots in Fig. 3, demonstrating the effec-
tiveness of using the alumina sheath to reduce the
influence of floated Li metal.
It should be mentioned that, in this work, in order to
achieve the same current density as reported previously
[8�/11], the applied voltage must be higher. For example,
the average current density observed at 5.2 V in
Experiment 2 was about 1.3 A/cm2 which is less thanthat observed at 5 V by Hsu et al. [9]. This discrepancy
could be attributed to the relatively large cell resistance
(see Section 2). Therefore, the real potential differences
between the anode and cathode in this work must have
been lower than the applied voltages, meaning that the
plot shown in Fig. 5 might show a maximum if the
voltage could have been increased further [11,15,17].
3.3. Adding SnCl2to the electrolyte
It was first reported by Hsu et al. [13] that adding a
small amount of SnCl2 into molten LiCl resulted in the
electrolytic production of CNTs that were individually
filled with tin metal, demonstrating the advantage of the
electrolytic CNT production method over other CNT
production methods in terms of functionalising intern-
ally CNTs with foreign materials. (Hsu et al. viewedthese tin filled CNTs as tin nanowires enclosed by a
carbon layer.) Therefore, it would be interesting and
desirable to repeat the electrolytic production of tin
filled CNTs at enlarged scales. This was carried out
successfully as described in Table 1 as Experiment 8.
The experimental conditions were the same as that of
Experiment 7 although more cathode insertions were
applied. It was noticed that although Sn2� ions can bereduced at much more positive potentials than that for
Li� ion reduction, very similar current�/time plots were
recorded from Experiments 7 and 8. The CNT concen-
trations in the final products from the two experiments
were not very different either. However, high resolution
SEM images of the CNTs from Experiment 8 revealed
clearly the inclusion of the heavier element, Sn, in the
CNT cavities and EDX analysis at a lower magnifica-tion confirmed the product contained about 20 wt.% tin
(see Section 3.5).
3.4. Product processing
The chloride salts of alkali and alkaline earth elements
have relatively large solubility in water. Following the
suggestion of a previous report [11], the solidified LiCl,100�/250 g, contained in the cell was effectively dissolved
into water by one or two additions of 250�/300 ml water
to the cell and stirring mechanically within an hour (it
Fig. 5. Dependence of CNT concentration in the extracted and
washed final products on cell voltage. Experimental conditions are
given in Table 1.
A.T. Dimitrov et al. / Electrochimica Acta 48 (2002) 91�/102 97
would take days for the salt to dissolve in still water).
After dissolution, it was found that there were often
relatively large graphite pieces at the bottom of the
crucible. These large pieces, apparently resulting fromthe cracking of the cathode during electrolysis, were
more often observed in experiments of higher cell
voltages. However, the reproducibility of these larger
pieces was poor, particularly in terms of total mass, size
and shape. In one experiment, the whole bottom section
(intact cylinder, 0.5 cm average length) of the cathode
was collected. These large pieces were manually picked
out and weighed after further leaching in water for atleast 24 h and drying. The total mass of the large pieces
was higher for experiments of higher cell voltages but
was generally less than 30 wt.% of the total amount of
eroded cathode.
The carbonaceous materials in the black aqueous
suspension from the cell could be directly extracted by
adding toluene [8�/11]. However, under the scanning
electron microscope, it was found that such collectedsamples contained too much electrolyte and related
impurities. Apparently upon drying, the impurities ‘re-
crystallised’ into very fine structures on the nanometre
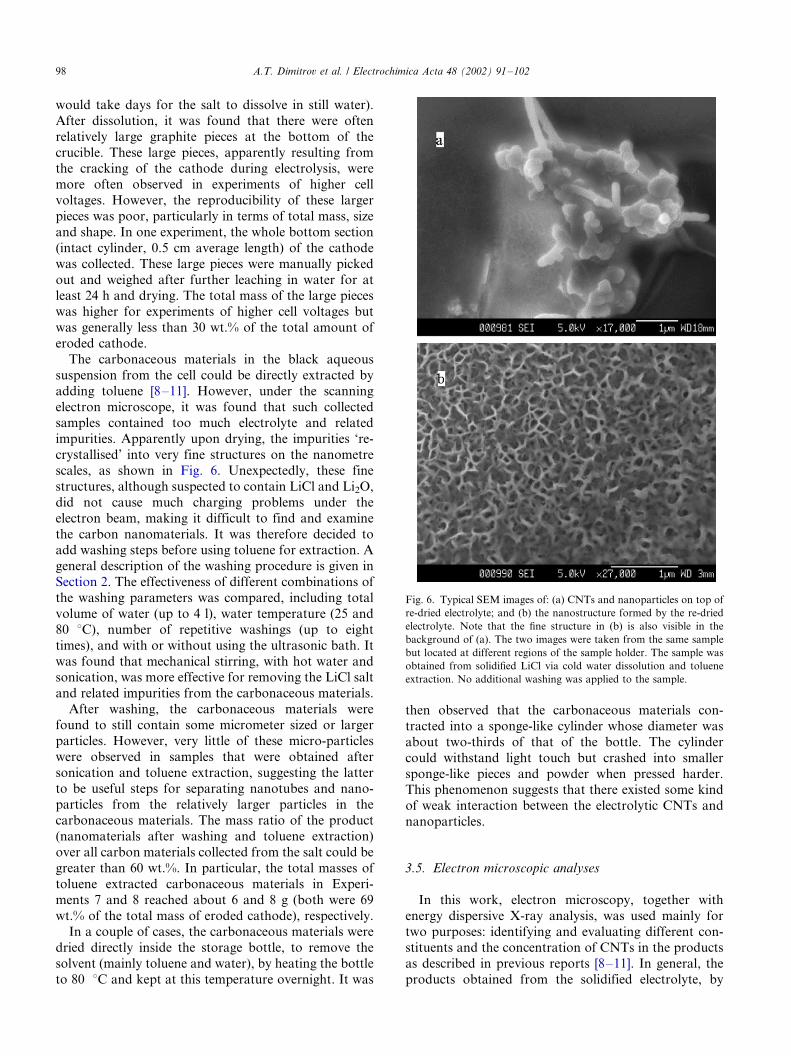
scales, as shown in Fig. 6. Unexpectedly, these fine
structures, although suspected to contain LiCl and Li2O,
did not cause much charging problems under the
electron beam, making it difficult to find and examine
the carbon nanomaterials. It was therefore decided toadd washing steps before using toluene for extraction. A
general description of the washing procedure is given in
Section 2. The effectiveness of different combinations of
the washing parameters was compared, including total
volume of water (up to 4 l), water temperature (25 and
80 8C), number of repetitive washings (up to eight
times), and with or without using the ultrasonic bath. It
was found that mechanical stirring, with hot water andsonication, was more effective for removing the LiCl salt
and related impurities from the carbonaceous materials.
After washing, the carbonaceous materials were
found to still contain some micrometer sized or larger
particles. However, very little of these micro-particles
were observed in samples that were obtained after
sonication and toluene extraction, suggesting the latter
to be useful steps for separating nanotubes and nano-particles from the relatively larger particles in the
carbonaceous materials. The mass ratio of the product
(nanomaterials after washing and toluene extraction)
over all carbon materials collected from the salt could be
greater than 60 wt.%. In particular, the total masses of
toluene extracted carbonaceous materials in Experi-
ments 7 and 8 reached about 6 and 8 g (both were 69
wt.% of the total mass of eroded cathode), respectively.In a couple of cases, the carbonaceous materials were
dried directly inside the storage bottle, to remove the
solvent (mainly toluene and water), by heating the bottle
to 80 8C and kept at this temperature overnight. It was
then observed that the carbonaceous materials con-
tracted into a sponge-like cylinder whose diameter was
about two-thirds of that of the bottle. The cylinder
could withstand light touch but crashed into smaller
sponge-like pieces and powder when pressed harder.This phenomenon suggests that there existed some kind
of weak interaction between the electrolytic CNTs and
nanoparticles.
3.5. Electron microscopic analyses
In this work, electron microscopy, together with
energy dispersive X-ray analysis, was used mainly for
two purposes: identifying and evaluating different con-stituents and the concentration of CNTs in the products
as described in previous reports [8�/11]. In general, the
products obtained from the solidified electrolyte, by
Fig. 6. Typical SEM images of: (a) CNTs and nanoparticles on top of
re-dried electrolyte; and (b) the nanostructure formed by the re-dried
electrolyte. Note that the fine structure in (b) is also visible in the
background of (a). The two images were taken from the same sample
but located at different regions of the sample holder. The sample was
obtained from solidified LiCl via cold water dissolution and toluene
extraction. No additional washing was applied to the sample.
A.T. Dimitrov et al. / Electrochimica Acta 48 (2002) 91�/10298
dissolution in cold water and extraction with toluene,
were found to contain too many electrolyte related
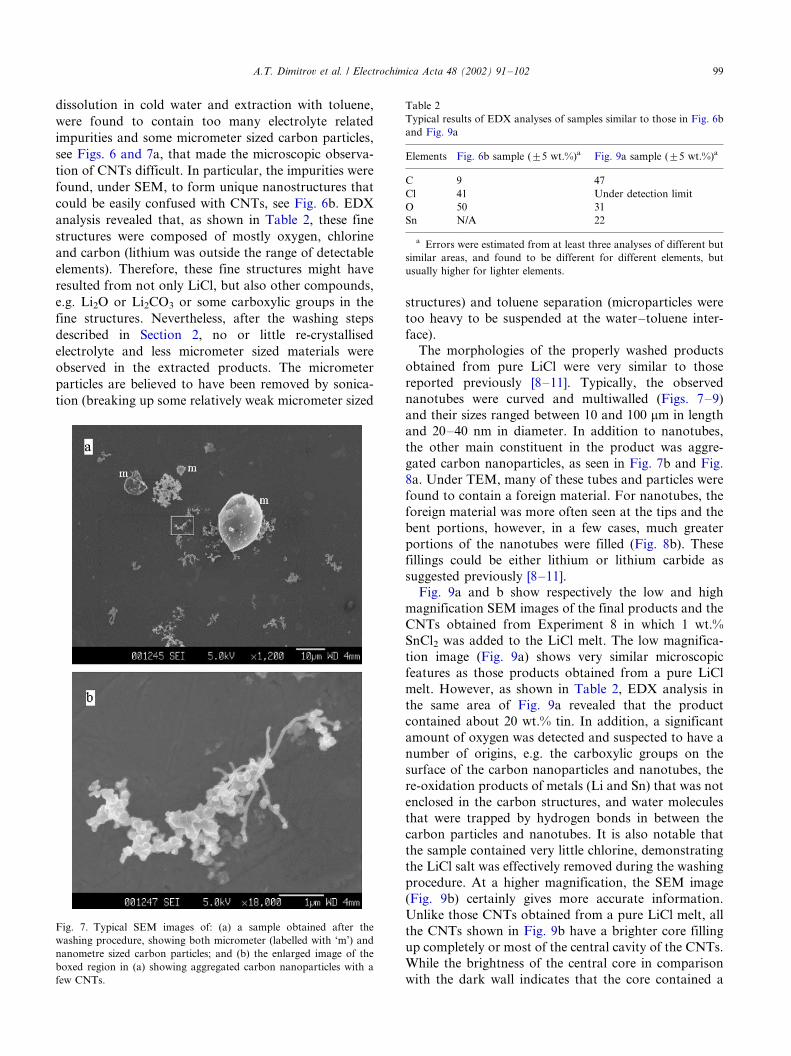
impurities and some micrometer sized carbon particles,
see Figs. 6 and 7a, that made the microscopic observa-
tion of CNTs difficult. In particular, the impurities were
found, under SEM, to form unique nanostructures that
could be easily confused with CNTs, see Fig. 6b. EDX
analysis revealed that, as shown in Table 2, these fine
structures were composed of mostly oxygen, chlorine
and carbon (lithium was outside the range of detectable
elements). Therefore, these fine structures might have
resulted from not only LiCl, but also other compounds,
e.g. Li2O or Li2CO3 or some carboxylic groups in the
fine structures. Nevertheless, after the washing steps
described in Section 2, no or little re-crystallised
electrolyte and less micrometer sized materials were
observed in the extracted products. The micrometer
particles are believed to have been removed by sonica-
tion (breaking up some relatively weak micrometer sized
structures) and toluene separation (microparticles were
too heavy to be suspended at the water�/toluene inter-
face).
The morphologies of the properly washed products
obtained from pure LiCl were very similar to those
reported previously [8�/11]. Typically, the observed
nanotubes were curved and multiwalled (Figs. 7�/9)
and their sizes ranged between 10 and 100 mm in length
and 20�/40 nm in diameter. In addition to nanotubes,
the other main constituent in the product was aggre-
gated carbon nanoparticles, as seen in Fig. 7b and Fig.
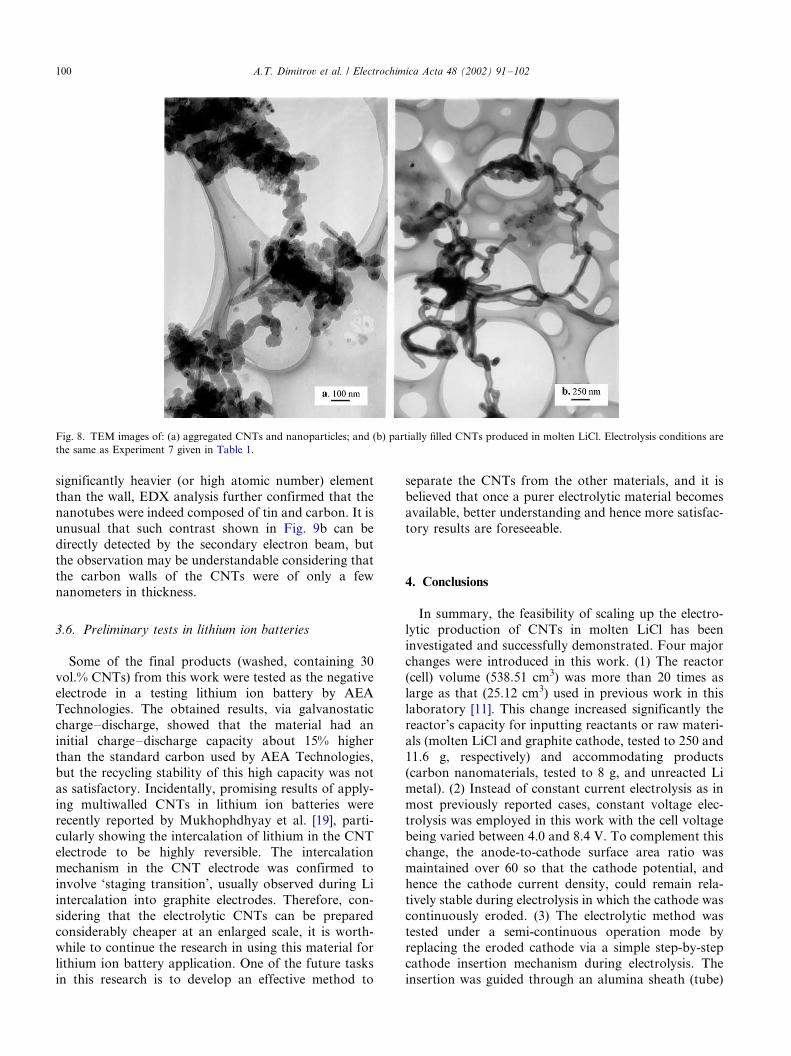
8a. Under TEM, many of these tubes and particles were
found to contain a foreign material. For nanotubes, the
foreign material was more often seen at the tips and the
bent portions, however, in a few cases, much greater
portions of the nanotubes were filled (Fig. 8b). These
fillings could be either lithium or lithium carbide as
suggested previously [8�/11].
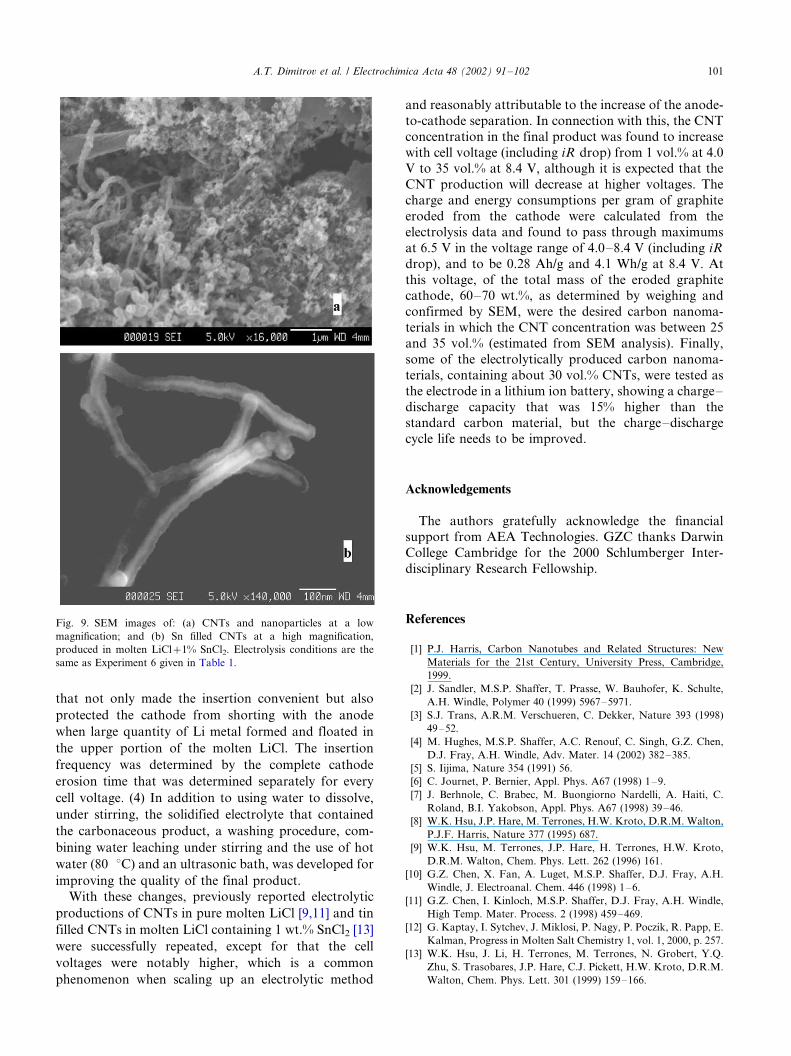
Fig. 9a and b show respectively the low and high
magnification SEM images of the final products and the
CNTs obtained from Experiment 8 in which 1 wt.%
SnCl2 was added to the LiCl melt. The low magnifica-
tion image (Fig. 9a) shows very similar microscopic
features as those products obtained from a pure LiCl
melt. However, as shown in Table 2, EDX analysis in
the same area of Fig. 9a revealed that the product
contained about 20 wt.% tin. In addition, a significant
amount of oxygen was detected and suspected to have a
number of origins, e.g. the carboxylic groups on the
surface of the carbon nanoparticles and nanotubes, the
re-oxidation products of metals (Li and Sn) that was not
enclosed in the carbon structures, and water molecules
that were trapped by hydrogen bonds in between the
carbon particles and nanotubes. It is also notable that
the sample contained very little chlorine, demonstrating
the LiCl salt was effectively removed during the washing
procedure. At a higher magnification, the SEM image
(Fig. 9b) certainly gives more accurate information.
Unlike those CNTs obtained from a pure LiCl melt, all
the CNTs shown in Fig. 9b have a brighter core filling
up completely or most of the central cavity of the CNTs.
While the brightness of the central core in comparison
with the dark wall indicates that the core contained a
Fig. 7. Typical SEM images of: (a) a sample obtained after the
washing procedure, showing both micrometer (labelled with ‘m’) and
nanometre sized carbon particles; and (b) the enlarged image of the
boxed region in (a) showing aggregated carbon nanoparticles with a
few CNTs.
Table 2
Typical results of EDX analyses of samples similar to those in Fig. 6b
and Fig. 9a
Elements Fig. 6b sample (95 wt.%)a Fig. 9a sample (95 wt.%)a
C 9 47
Cl 41 Under detection limit
O 50 31
Sn N/A 22
a Errors were estimated from at least three analyses of different but
similar areas, and found to be different for different elements, but
usually higher for lighter elements.
A.T. Dimitrov et al. / Electrochimica Acta 48 (2002) 91�/102 99
significantly heavier (or high atomic number) element
than the wall, EDX analysis further confirmed that the
nanotubes were indeed composed of tin and carbon. It is
unusual that such contrast shown in Fig. 9b can be
directly detected by the secondary electron beam, but
the observation may be understandable considering that
the carbon walls of the CNTs were of only a fewnanometers in thickness.
3.6. Preliminary tests in lithium ion batteries
Some of the final products (washed, containing 30
vol.% CNTs) from this work were tested as the negativeelectrode in a testing lithium ion battery by AEA
Technologies. The obtained results, via galvanostatic
charge�/discharge, showed that the material had an
initial charge�/discharge capacity about 15% higher
than the standard carbon used by AEA Technologies,
but the recycling stability of this high capacity was not
as satisfactory. Incidentally, promising results of apply-
ing multiwalled CNTs in lithium ion batteries wererecently reported by Mukhophdhyay et al. [19], parti-
cularly showing the intercalation of lithium in the CNT
electrode to be highly reversible. The intercalation
mechanism in the CNT electrode was confirmed to
involve ‘staging transition’, usually observed during Li
intercalation into graphite electrodes. Therefore, con-
sidering that the electrolytic CNTs can be prepared
considerably cheaper at an enlarged scale, it is worth-while to continue the research in using this material for
lithium ion battery application. One of the future tasks
in this research is to develop an effective method to
separate the CNTs from the other materials, and it is
believed that once a purer electrolytic material becomes
available, better understanding and hence more satisfac-
tory results are foreseeable.
4. Conclusions
In summary, the feasibility of scaling up the electro-
lytic production of CNTs in molten LiCl has been
investigated and successfully demonstrated. Four major
changes were introduced in this work. (1) The reactor
(cell) volume (538.51 cm3) was more than 20 times aslarge as that (25.12 cm3) used in previous work in this
laboratory [11]. This change increased significantly the
reactor’s capacity for inputting reactants or raw materi-
als (molten LiCl and graphite cathode, tested to 250 and
11.6 g, respectively) and accommodating products
(carbon nanomaterials, tested to 8 g, and unreacted Li
metal). (2) Instead of constant current electrolysis as in
most previously reported cases, constant voltage elec-trolysis was employed in this work with the cell voltage
being varied between 4.0 and 8.4 V. To complement this
change, the anode-to-cathode surface area ratio was
maintained over 60 so that the cathode potential, and
hence the cathode current density, could remain rela-
tively stable during electrolysis in which the cathode was
continuously eroded. (3) The electrolytic method was
tested under a semi-continuous operation mode byreplacing the eroded cathode via a simple step-by-step
cathode insertion mechanism during electrolysis. The
insertion was guided through an alumina sheath (tube)
Fig. 8. TEM images of: (a) aggregated CNTs and nanoparticles; and (b) partially filled CNTs produced in molten LiCl. Electrolysis conditions are
the same as Experiment 7 given in Table 1.
A.T. Dimitrov et al. / Electrochimica Acta 48 (2002) 91�/102100
that not only made the insertion convenient but also
protected the cathode from shorting with the anode
when large quantity of Li metal formed and floated in
the upper portion of the molten LiCl. The insertion
frequency was determined by the complete cathode
erosion time that was determined separately for every
cell voltage. (4) In addition to using water to dissolve,
under stirring, the solidified electrolyte that contained
the carbonaceous product, a washing procedure, com-
bining water leaching under stirring and the use of hot
water (80 8C) and an ultrasonic bath, was developed for
improving the quality of the final product.
With these changes, previously reported electrolytic
productions of CNTs in pure molten LiCl [9,11] and tin
filled CNTs in molten LiCl containing 1 wt.% SnCl2 [13]
were successfully repeated, except for that the cell
voltages were notably higher, which is a common
phenomenon when scaling up an electrolytic method
and reasonably attributable to the increase of the anode-
to-cathode separation. In connection with this, the CNT
concentration in the final product was found to increase
with cell voltage (including iR drop) from 1 vol.% at 4.0V to 35 vol.% at 8.4 V, although it is expected that the
CNT production will decrease at higher voltages. The
charge and energy consumptions per gram of graphite
eroded from the cathode were calculated from the
electrolysis data and found to pass through maximums
at 6.5 V in the voltage range of 4.0�/8.4 V (including iR
drop), and to be 0.28 Ah/g and 4.1 Wh/g at 8.4 V. At
this voltage, of the total mass of the eroded graphitecathode, 60�/70 wt.%, as determined by weighing and
confirmed by SEM, were the desired carbon nanoma-
terials in which the CNT concentration was between 25
and 35 vol.% (estimated from SEM analysis). Finally,
some of the electrolytically produced carbon nanoma-
terials, containing about 30 vol.% CNTs, were tested as
the electrode in a lithium ion battery, showing a charge�/
discharge capacity that was 15% higher than thestandard carbon material, but the charge�/discharge
cycle life needs to be improved.
Acknowledgements
The authors gratefully acknowledge the financial
support from AEA Technologies. GZC thanks Darwin
College Cambridge for the 2000 Schlumberger Inter-
disciplinary Research Fellowship.
References
[1] P.J. Harris, Carbon Nanotubes and Related Structures: New
Materials for the 21st Century, University Press, Cambridge,
1999.
[2] J. Sandler, M.S.P. Shaffer, T. Prasse, W. Bauhofer, K. Schulte,
A.H. Windle, Polymer 40 (1999) 5967�/5971.
[3] S.J. Trans, A.R.M. Verschueren, C. Dekker, Nature 393 (1998)
49�/52.
[4] M. Hughes, M.S.P. Shaffer, A.C. Renouf, C. Singh, G.Z. Chen,
D.J. Fray, A.H. Windle, Adv. Mater. 14 (2002) 382�/385.
[5] S. Iijima, Nature 354 (1991) 56.
[6] C. Journet, P. Bernier, Appl. Phys. A67 (1998) 1�/9.
[7] J. Berhnole, C. Brabec, M. Buongiorno Nardelli, A. Haiti, C.
Roland, B.I. Yakobson, Appl. Phys. A67 (1998) 39�/46.
[8] W.K. Hsu, J.P. Hare, M. Terrones, H.W. Kroto, D.R.M. Walton,
P.J.F. Harris, Nature 377 (1995) 687.
[9] W.K. Hsu, M. Terrones, J.P. Hare, H. Terrones, H.W. Kroto,
D.R.M. Walton, Chem. Phys. Lett. 262 (1996) 161.
[10] G.Z. Chen, X. Fan, A. Luget, M.S.P. Shaffer, D.J. Fray, A.H.
Windle, J. Electroanal. Chem. 446 (1998) 1�/6.
[11] G.Z. Chen, I. Kinloch, M.S.P. Shaffer, D.J. Fray, A.H. Windle,
High Temp. Mater. Process. 2 (1998) 459�/469.
[12] G. Kaptay, I. Sytchev, J. Miklosi, P. Nagy, P. Poczik, R. Papp, E.
Kalman, Progress in Molten Salt Chemistry 1, vol. 1, 2000, p. 257.
[13] W.K. Hsu, J. Li, H. Terrones, M. Terrones, N. Grobert, Y.Q.
Zhu, S. Trasobares, J.P. Hare, C.J. Pickett, H.W. Kroto, D.R.M.
Walton, Chem. Phys. Lett. 301 (1999) 159�/166.
Fig. 9. SEM images of: (a) CNTs and nanoparticles at a low
magnification; and (b) Sn filled CNTs at a high magnification,
produced in molten LiCl�/1% SnCl2. Electrolysis conditions are the
same as Experiment 6 given in Table 1.
A.T. Dimitrov et al. / Electrochimica Acta 48 (2002) 91�/102 101

[14] (a) D.J. Fray, High Temp. Mater. Process. 3 (1999) 67;
(b) D.J. Fray, Molten Salts Bull. 66 (1999) 2.
[15] G.Z. Chen, D.J. Fray, in: Chen Nianyi, Qiao Zhiyu (Eds.),
Proceedings of 6th International Symposium on Molten Salt
Chemistry and Technology (October), Shanghai University Press,
Shanghai, China, 2001, pp. 79�/85.
[16] G. Kaptay, I. Sytchev, M.S. Yaghmaee, A. Kovacs, E. Cserta, M.
Ark, in: Chen Nianyi, Qiao Zhiyu (Eds.), Proceedings of 6th
International Symposium on Molten Salt Chemistry and Tech-
nology (October), Shanghai University Press, Shanghai, China,
2001, pp. 168�/173.
[17] Q. Xu, C. Schwandt, G.Z. Chen, D.J. Fray, J. Electroanal. Chem.
530 (2002) 16�/22.
[18] W.K. Hsu, Y.Q. Zhu, S. Trasobares, M. Terrones, N. Grobert, H.
Takikawa, J.P. Hare, H.W. Kroto, D.R.M Walton, App. Phys. A.
Mater. Sci. Proc. 68 (1999) 493�/495.
[19] I. Mukhopadhyay, N. Hoshino, S. Kawaski, F. Okino, W.K.
Hsu, H. Touhara, J. Electrochem. Soc. 149 (2002) A39�/A44.
A.T. Dimitrov et al. / Electrochimica Acta 48 (2002) 91�/102102