Clusterin interacts with Paclitaxel and confer Paclitaxel resistance in ovarian cancer

Characterization of Ovarian Cancer Ascites on Cell Invasion,Proliferation, Spheroid Formation, and Gene Expression inan In Vitro Model of Epithelial Ovarian Cancer1,2
Marie-Line Puiffe*, Cecile Le Page*, Abdelali Filali-Mouhim*, Magdalena Zietarska*,3, Veronique Ouellet*,3,Patricia N. Tonin y,z,§, Mario Chevrette§,b, Diane M. Provencher*,# and Anne-Marie Mes-Masson*,**
*Centre de recherche du Centre hospitalier de l’Universite de Montreal/Institut du cancer de Montreal,Montreal, Quebec, Canada; yDepartment of Medicine, McGill University, Montreal, Quebec, Canada;zDepartment of Human Genetics, McGill University, Montreal, Quebec, Canada; §The Research Instituteof McGill University Health Centre, Montreal, Quebec, Canada; bDepartment of Surgery, Urology Division,McGill University, Montreal, Canada; #Division of Gynecologic Oncology/Universite de Montreal, Montreal,Quebec, Canada; **Departement de medicine, Universite de Montreal, Montreal, Quebec, Canada
Abstract
At least one third of all cases of epithelial ovarian
cancer are associated with the production of ascites,
although its effect on tumor cell microenvironment
remains poorly understood. This study addresses the
effect of the heterologous acellular fraction of ovarian
cancer–derived ascites on a cell line (OV-90) derived
from the chemotherapy-naıve ovarian cancer patient.
Ascites were assayed for their effect on cell invasion,
growth, and spheroid formation. When compared to
either no serum or 5% serum, ascites fell into one
of two categories: stimulatory or inhibitory. RNA from
OV-90 cells exposed to selected ascites were arrayed
on an Affymetrix HG-U133A GeneChip. A supervised
analysis identified a number of differentially expressed
genes and quantitative polymerase chain reaction vali-
dation based on OV-90 cells exposed to 54 indepen-
dent ascites demonstrated that stimulatory ascites
affected the expression of ISGF3G, TRIB1, MKP1, RGS4,
PLEC1, and MOSPD1 genes. In addition, TRIB1 ex-
pression was shown to independently correlate with
prognosis when its expression was ascertained in an
independent set of primary cultures established from
ovarian ascites. The data support the validity of the
strategy to uncover molecular events that are associ-
ated with tumor cell behavior and highlight the impact
of ascites on the cellular and molecular parameters of
ovarian cancer.
Neoplasia (2007) 9, 820–829
Keywords: Epithelial ovarian cancer, ovarian ascites, cell behavior, inva-sion, molecular profiling.
Introduction
Ovarian cancer is the fifth leading cause of cancer-related
deaths in the Western world, the second most common
gynecological cancer, and the leading cause of death from
gynecological malignancies. The most common form of cancer
of the ovary is epithelial ovarian cancer (EOC). EOCs originate
either from the normal ovarian surface epithelium itself or from
the crypts and inclusion cysts on the surface epithelium [1].
Ovarian carcinomas can spread by local extension, lymphatic
invasion, intraperitoneal implantation, hematogenous dissem-
ination, and/or transdiaphragmatic passage. In the commonly
observed intraperitoneal dissemination, malignant cells appear
to implant anywhere over peritoneal surfaces though mainly in
sites of stasis along the peritoneal fluid circulation.
At least one third of ovarian cancer patients present with
ascites [2,3], a generally voluminous exudative fluid with a cel-
lular fraction consisting mainly of ovarian cancer cells, lympho-
cytes, and mesothelial cells. The neoplastic cells in the ascites
are present either as single cells, as aggregates, or as spher-
oids, and may contribute to the spread of cancer to secondary
sites. Indeed, it has been demonstrated that ascites spheroids
adhere to extracellular matrix through b1 integrins, indicating
that this process may play a role in the dissemination of the
disease [4]. The acellular fraction of ascites is known to harbor
angiogenic factors such a vascular endothelial growth factor
[5] and growth factors such as the epidermal growth factor [6],
lysophosphatidic acid [7], and transforming growth factor (TGF)
family members [8,9] among others. How this acellular frac-
tion affects the tumor microenvironment, and specifically how it
Address all correspondence to: Anne-Marie Mes-Masson, CR-CHUM/ICM, 1560, rue Sherbrooke
est, Montreal, Quebec, Canada H2L 4M1. E-mail: [email protected] research was supported by The Cancer Research Society, Inc., Strategic Grant Program
in Genomics and Proteomics of Metastatic Cancer award to A.-M.M-M, P.N.T., M.C., and D.P.
The ovarian tissue bank was supported by the Banque de tissus et de donnees of the Reseau
de recherche sur le cancer of the Fonds de la Recherche en Sante du Quebec, affiliated with the
Canadian Tumor Repository Network.2This article refers to supplementary material, which is designated by ‘‘Figure W1’’ and ‘‘Table
W1’’ and is available online at www.bcdecker.com.3V.O. was supported by studentships from the Canadian Institutes of Health Research, and
V.O. and M.Z. by the Canderel fund of the Institut du cancer de Montreal.
Received 11 June 2007; Revised 21 August 2007; Accepted 22 August 2007.
Copyright D 2007 Neoplasia Press, Inc. All rights reserved 1522-8002/07/$25.00
DOI 10.1593/neo.07472
Neoplasia . Vol. 9, No. 10, October 2007, pp. 820 –829 820
www.neoplasia.com
RESEARCH ARTICLE

affects the cellular and molecular properties of tumor cells per
se is still a matter of debate [10,11]. Indeed, the recent resur-
gence of intraperitoneal-based chemotherapies highlights the
importance of understanding this important component of the
disease [12–14]. Recently, a targeted approach demonstrated
the ability of ascites to modulate the expression of urokinase
plasminogen activator, its receptor, and integrins, and these
modifications in expression were associated with changes in
the cellular behavior of ovarian cancer cell lines [15].
In the present study, we conducted a comprehensive
analysis of the effect of ascites on the growth characteristics
of the OV-90 ovarian cancer cell line, which we have pre-
viously described [16]. This EOC cell line, derived from the
cellular fraction of ascites from a chemotherapy-naıve pa-
tient, has been characterized by morphological, immunohis-
tochemical, cytogenetic, and molecular analyses including
gene expression profiles [16,17] and was shown to har-
bor mutations in genes implicated in ovarian cancer such as
tumor protein p53 (TP53), cyclin-dependent kinase inhibitor
1A (CDNK2A), and TGF�-RII. In addition to characterizing
the cellular effects of ascites, a DNA microarray approach
was used to assess differences in gene expression in OV-90
cell line grown in the presence or absence of serum, as
well as in the presence of ascites without serum. Statistical
analysis was used to identify differentially expressed genes
that correlated with cellular invasion for the OV-90 cell line.
Candidate genes were further validated on both arrayed
RNA and an extended test set using quantitative polymerase
chain reaction (Q-PCR), and their association with survival
was tested in an independent set of primary cultures derived
from patients with ovarian ascites.
Materials and Methods
Cell Culture, Clinical Material, and Patients
The OV-90 cell line was maintained in OSE media con-
sisting of 50:50 medium 199:105 (Sigma-Aldrich, St. Louis,
MO) supplemented with 10% fetal bovine serum (FBS), 2.5 mg/
ml amphotericin B and 50 mg/ml gentamicin [18]. Following
appropriate consent, ascites were collected at the time of
clinical intervention at the Centre Hospitalier de l’Universite de
Montreal (Montreal, QC, Canada). Ascites were centrifuged at
2500 rpm for 5 minutes. The acellular fractions were stored at
�20jC and tested within 6 months of reception. The protein
concentration in ascites fluid was measured by the Bradford
assay (Bio-Rad, Hercules, CA). Histopathology, grade, and
stage of ovarian tumors were assigned according to the Inter-
national Federation of Gynecology and Obstetrics criteria. Of
the 54 ascites included in our study on invasion, two thirds
were from patients diagnosed with papillary serous adeno-
carcinomas and most presented with stage IIIC and grade 3
disease (Table 1). One third of samples were from patients
who had already received chemotherapy prior to surgery. The
presence of neoplastic cells in ascites was determined from
pathology reports. Table 2 describes the 28 ovarian cancer
patients diagnosed with accompanying ascites that were
included in the survival analysis.
In Vitro Invasion Assay
Cellular invasion was assayed by determining the ability
of cells to invade a synthetic basement membrane (Matrigel;
Becton-Dickinson, Bedford, MA). Polycarbonate membranes
(8-mm pore size) of the upper compartment of Transwell
culture chambers were coated with 0.4 mg/ml Matrigel. The
upper compartment was filled with OSE media containing 1%
FBS and the lower compartment was filled with OSE media
either with no serum, with 5% FBS, or with 5% of the indicated
ascites. For inactivation, ascites were heated for 10 minutes at
100jC to denature proteins. Ovarian cancer cells were trypsi-
nized and resuspended in OSE media containing 1% FBS.
The cell suspension (20 � 103 cells/well) was placed in the
upper compartment. Then, cells were incubated at 37jC and
allowed to invade through the Matrigel barrier for 24 hours.
Following incubation, membranes were fixed with methanol
and stained (Giemsa; Sigma-Aldrich). Noninvading cells were
removed using a cotton swab, whereas invading cells on the
underside of the membrane were counted using an inverted
microscope. All experiments were performed at least twice.
Cell Proliferation
Two thousand cells were plated either with no serum,
with 5% FBS, or with 5% of the indicated ascites in six-well
plates and incubated at 37jC. At defined intervals, cells were
trypsinized and cell viability was assessed by a Trypan Blue
exclusion assay. Cell numbers were evaluated using a hemato-
cytometer. Each experiment was performed in triplicate.
Spheroid Formation
Spheroids were formed using a modification of the hang-
ing droplet method [19]. Briefly, 4 � 103 cells were resus-
pended in 15 ml of OSE media supplemented either with 5%
FBS, with 5% of the indicated ascites, or without serum, and
then placed on the cover of a 150-mm tissue culture plate.
The cover was placed over a plate that contained 15 ml of
OSE to prevent dehydration of the hanging droplet. Spheroid
formation was monitored after 4 days and representative
spheroids were photographed.
RNA Extraction
Total RNA was extracted with a reagent (TRIzol; Gibco/
BRL, Life Technologies, Inc., Grand Island, NY) as recom-
mended by the manufacturer. RNA was extracted from tumor
cells grown to 80% confluence in 100-mm Petri dishes. RNA
quality was assessed using a 2100 Bioanalyzer with the RNA
6000 Nano LabChip kit (Agilent Technologies, Mississauga,
ON, Canada) according to the manufacturer’s protocol.
Microarray Analysis
Hybridization assays and data collection were performed
at the McGill University and Genome Quebec Innovation
Centre (Montreal, Canada). Briefly, 20 mg of total RNA from
each sample was reverse-transcribed using an oligo-dT
primer containing a T7 RNA polymerase binding site. In vitro
transcription was performed on this cDNA and the resulting
cRNA was biotinylated through incorporation of biotinylated
Ascites and Ovarian Tumor Cell Interaction Puiffe et al. 821
Neoplasia . Vol. 9, No. 10, 2007

dUTP and dCTP. Samples were fragmented in 40 mM Tris–
acetate, 100 mM potassium acetate, and 30 mM MgCl2 (pH
8.1) at 95jC to reduce secondary structure. A total of 15 mg of
cRNA was hybridized to an Affymetrix HG-U133A GeneChip
array (Santa Clara, CA), washed, stained, and scanned with
a Hewlett Packard Gene Array scanner (Palo Alto, CA) and
.CEL files were normalized based on a quantile method.
Gene expression profiles were analyzed using R (www.
r-project.org), a statistical programming language, and Bio-
conductor [20], an open source software library for the
analyses of genomic data based on R. Background subtrac-
tion, normalization (quantile normalization), and expression
value calculations were performed using the justGCrma
function available as part of Bioconductor’s gcrma pack-
age. Bioconductor’s genefilter package was used to filter
out genes with insufficient variation in expression across all
samples tested. Expression values retained after this filtering
process presented intensities greater than 100 U in at least
Table 1. Clinical Characteristics of Patients from Which Ascites Were Obtained.
Ascites Age Histopathology Grade Stage Neoplastic Cells in Ascites Prior Chemotherapy Clinical Intervention Associated with Ascites Collection
A1185(2)* 82 PSA G3 IIIC Yes Yes Secondary cytoreduction
A1301 49 SA G3 IIIC Yes No Primary biopsy
A1317 60 PSA G3 IV No Yes Primary surgery
A1318 52 PSA G2 IIIC Yes No Primary surgery
A1322 71 PSA G3 IIIC Yes No Primary surgery
A1322(2) 71 PSA G3 IIIC Yes Yes Secondary cytoreduction
A1330 48 SA G3 IIIC Yes No Primary surgery
A1337 45 PSA G3 IIIC Yes No Primary surgery
A1369 60 PSA G3 IIIC Yes No Primary surgery
A1369(2) 60 PSA G3 IIIC Yes Yes Secondary cytoreduction
A1396 54 PSA G2 IIIC Yes No Primary surgery
A1406 49 PSA G2 IIIC N/S Yes Secondary cytoreduction
A1464 63 PSA G3 IIIC Yes No Primary surgery
A1483 74 PSA G3 IIIC Yes No Primary surgery
A1519 73 CCA G3 IV N/S No Primary surgery
A1526 50 PSA G2 IIIC Yes Yes Secondary cytoreduction
A1526(2) 50 PSA G2 IIIC Yes Yes Secondary cytoreduction
A1592 35 MCA G3 IIIC N/S No Primary surgery
A1607 59 SA GB IB No No Primary surgery
A1610 72 PSA G3 IIIC Yes No Primary surgery
A1611 45 MA GB IA No No Primary surgery
A1613 76 SA G3 IIIC No No Primary surgery
A1642 79 SA G3 IIB Yes No Primary surgery
A1717 45 PSA G2 IIIC N/S No Primary surgery
A1739 64 MA N/S N/S N/S No Primary surgery
A1778 87 PSA G3 IV Yes No Primary surgery
A1793 55 SA G3 IIIC No No Primary surgery
A1801 65 PSA G2 IIIC Yes No Primary surgery
A1810 62 PSA G2 IIIC Yes No Primary surgery
A1813 55 PSA G3 IIIC Yes No Primary surgery
A1830 56 PSA G3 IIIC Yes No Primary surgery
A1835 69 PSA G3 IIIC Yes No Primary surgery
A1876 44 PSA G3 IIIC No No Primary surgery
A1884 69 PSA G3 IV Yes No Primary surgery
A1891 62 PSA G3 IIIC No No Primary surgery
A1922 52 PSA G3 IIIC Yes No Primary surgery
A1927 48 PSA G3 IIIC Yes No Primary surgery
A1931 67 PSA G3 IIIC Yes No Primary surgery
A1946 75 PSA G3 IIIC Yes No Primary surgery
A1998 70 UA N/S N/S Yes Yes N/S
A1998(2) 70 UA N/S N/S Yes Yes N/S
A2069 63 MCA G3 IIIC Yes No Primary surgery
A2070 78 SA G3 IIIC Yes No Primary surgery
A2085 65 PSA G3 IIIC N/S Yes Secondary cytoreduction
A2085(2) 65 PSA G3 IIIC N/S Yes Secondary cytoreduction
A2085(3) 65 PSA G3 IIIC N/S Yes Secondary cytoreduction
A2090 76 UA N/S IIIC Yes Yes N/S
A2093 62 PSA G3 IV Yes Yes Secondary cytoreduction
A2093(2) 62 PSA G3 IV Yes Yes Secondary cytoreduction
A2774 42 EA G3 IB No No Primary surgery
A2775 49 PSA G2 IIIC Yes No Primary surgery
A2834 63 PSA G3 IIIC Yes No Primary surgery
A2912 54 PSA G3 IIIC Yes No Primary surgery
A2965 71 MCA G3 IIIC Yes No Primary surgery
PSA, papillary serous adenocarcinoma; SA, serous adenocarcinoma; MA, mucinous adenocarcinoma; MCA, mixed cell adenocarcinoma; CCA, clear cell
adenocarcinoma; UA, undifferentiated adenocarcinoma; EA, endometrioid adenocarcinoma; N/S, not specified.
Ascites further characterized in this study are in bold.
*Denotes second and third ascites collected from patient with the same number.
822 Ascites and Ovarian Tumor Cell Interaction Puiffe et al.
Neoplasia . Vol. 9, No. 10, 2007

two samples and a log base 2 scale of at least 0.2 for
the interquartile range across all tested samples. Differ-
entially expressed genes were identified using the limma
package, which estimates the fold-change between prede-
fined groups by fitting a linear model and using an empirical
Bayes method to moderate standard errors of the estimated
log-fold changes for expression values from each probe set.
Quantitative PCR
cDNA synthesis was prepared using the SuperScript
First-Strand Synthesis System for reverse transcription–
polymerase chain reaction (Invitrogen Life Technologies,
Carlsbad, CA) according to the manufacturer’s instruction.
Reverse transcription–polymerase chain reaction was per-
formed on 2 mg of total RNA using 2.5 ml of the random
hexamer solution. Samples were diluted 1:10 in water prior
to Q-PCR. Positive and negative controls were included in
all experiments.
Q-PCR was performed using the Rotor-gene 3000 (Corbett
Research, Montreal Biotech Inc., Montreal, QC, Canada).
Quantitect SYBR Green PCR (QIAGEN Inc., Mississauga,
ON, Canada) was used for labeling in a final volume of 25 ml
containing 5 ml of sample cDNA and 10 pg of the different
primers and reactions performed as described by the manu-
facturer. Experiments were repeated at least twice. Serial
dilutions (1:5) were performed to generate a standard curve
for each gene tested to define the efficiency of the Q-PCR
reaction and a melt curve was done to confirm the speci-
ficity of the reaction. We used the Pfaffl analysis method to
measure the relative quantity of gene expression [21]. The
algorithm is defined by R = (Etarget)DCp target(control � sample)/
(Eref)DCp ref(control � sample), where R is the relative expression
ratio, E is the efficiency of the PCR reaction, and DCp is the
difference of the Ct (crossing point of the sample at a given
threshold). The reference gene, ActinB, was selected based
on its stable expression in all samples by microarray analysis.
Moreover, Q-PCR confirmed its appropriateness because no
significant statistical differences were noted among the sam-
ples. The first sample (with 5% FBS) served as the reference
sample in each experiment. The mean value of the Ct from
replicates was used to calculate R. Marker expression was
evaluated in the OV-90 cell line either with no serum, with 5%
FBS, or with 5% of the indicated ascites, under the same con-
ditions used to evaluate the invasion potential of the OV-90
cell line. For each marker, a Pearson correlation was calcu-
lated between the scored invasion result (1 < 100% and 2 z100% of invasion) and the scored genes expression (1 <
median and 2 z median).
Statistical Analysis
Univariate Cox proportional hazard regression, Kaplan-
Meier survival plots, and log-rank tests were performed to
determine the significance of markers’ ability to predict the
survival of EOC patients (Table 2). The expression threshold
used in the log-rank test that gave the best sensitivity–
specificity values was established based on the receiver op-
erating characteristics (ROC) curves. We used the ROC and
SURVIVAL packages from R version 2.4.0 (Vienna, Austria).
The Spearman correlation coefficient test (two-tailed)
was used to estimate the correlation between the invasion
rates and clinical data and gene expression. Statistical analy-
ses were performed with SPSS software 11.0 (SPSS Inc.,
Chicago, IL).
Results
Effect of Ascites on OV-90 Invasive Potential
To address the interactions among elements found within
the peritoneal tumor environment, we characterized the
effect of a large panel of ascites (Table 1) on the ability of
an aggressive EOC cell line (OV-90) to stimulate invasion in
an in vitro assay. Media containing 5% of ascites (acellular
fraction) from patients with ovarian cancer was added to the
lower chamber of Transwell plates containing micropore fil-
ters precoated with Matrigel and OV-90 cells were added to
the upper chamber. The potential for ascites to affect OV-90
invasion was scored in comparison to media supplemented
with 5% FBS (Figure 1A). OV-90 is capable of invasion in
Matrigel assay in presence of 5% FBS (Figure 1). A large
number of ascites led to an inhibition of OV-90 cell invasion
compared to cells in the presence of FBS. A lower, but still
important number of ascites was more stimulatory for inva-
sion than the FBS control. We assessed the correlation be-
tween the invasion rates of ascites and clinical parameters
Table 2. Patients’ Cohort with Ovarian Cancer and Accompanying Ascites,
for Survival Analyses.
Patients Death Survival (months) Histopathology
90 Yes 0 UA
513 No 37 SA
595 Yes 11 PSA
665 Yes 32 PSA
747 Yes 9 SA
866 No 9 PSA
889 Yes 51 SA
892 No 67 PSA
893 Yes 46 EA
899 No 5 SA
908 Yes 11 PSA
926 Yes 54 PSA
944 No 60 PSA
960 Yes 16 PSA
962 No 72 EA
976 Yes 0 CCA
980 No 26 PSA
993 No 13 SA
999 No 43 MA
1005 No 12 PSA
1012 Yes 3 EA
1035 No 41 CCA
1127 Yes 45 PSA
1129 Yes 16 CCA
1193 Yes 6 PSA
1330 No 13 SA
1830 No 6 PSA
1946 Yes 0 PSA
UA, undifferentiated adenocarcinoma; SA, serous adenocarcinoma; PSA, papil-
lary serous adenocarcinoma; EA: endometrioid adenocarcinoma; CCA, clear
cell adenocarcinoma; MA, mucinous adenocarcinoma.
Patients died following the progression of the disease, except for patients 976
and 1946, death was due to myocardium infarction and digestive hemorrhage.
Ascites and Ovarian Tumor Cell Interaction Puiffe et al. 823
Neoplasia . Vol. 9, No. 10, 2007

available for patients: age, grade, stage, presence of neo-
plastic cells, and chemotherapy, but no significant correlation
was observed (Table 1).
The acellular fraction of 10 independent EOC ascites
(A1317, A1318, A1322, A1322(2), A1337, A1592, A1835,
A1946, A2085, and A2090; Table 1) was selected for further
characterization based on their ability to invade. The invasive
potential was again compared to a 5% FBS control. In OV-90
cells, it should be noted that there is no difference in the
invasion rate with or without 5% FBS and thus the classifi-
cation of ascites as being either inhibitory or stimulatory is
independent of the effect of serum. Inhibitory ascites reduce
the invasion rate compared to either no serum or 5% FBS,
whereas stimulatory ascites results from a higher number of
cells able to cross a Matrigel barrier in comparison to con-
trols. Ascites A1592, A1946, A2085, and A2090 induced an
invasion rate greater to the one observed in the presence
or the absence of FBS. A1317, A1318, A1322, A1322(2),
A1337, and A1835 diminished OV-90 cell invasion potential
(Figure 1B). These effects were not due to differences in
protein concentration of each ascites because correcting for
the amount of protein did not affect the overall patterns
observed (data not shown).
Effect of Ascites on OV-90 Growth
To determine the effect of ascites on proliferation rates, 10
ascites were selected and tested for their ability to alter the
growth potential of OV-90 cells compared to a 5% FBS
control (Figure 2). OV-90 cells were incubated for 2 days in
media supplemented either with no serum, with 5% FBS, or
with 5% of the indicated ascites and cell growth was evalu-
ated by a Trypan Blue exclusion assay. The highest growth
rates were observed with exposure to FBS, as well as
A1835, A1946 or A2085, whereas the remaining ascites
samples conferred variable but lower growth rates. In partic-
ular, OV-90 exhibited lower growth rate in the presence of the
A1337 and A1322(2) ascites compared to those observed
with no serum. We noted that after 24 hours of incubation,
the time used to monitor invasion, no statistically significant
differences in the growth rate were observed (with one
exception). This suggests that the monitored invasive effects
are not a simple reflection of cell growth.
Effect of Ascites on OV-90 Spheroid Formation
We have previously demonstrated that the OV-90 cells
are able to grow as large compact spheroids [19]. Because
the relation between these three-dimensional structures and
invasive potential remains poorly defined, we determined the
effect of ascites on the formation of in vitro spheroids. For
Figure 1. Effect of ascites on the invasion of the ovarian cancer cell line OV-90. The invasive potential of OV-90 (solid bars) was determined by its ability to invade
a synthetic basement membrane after 24 hours compared to 5% FBS (%Invasion*). (A) Effects of 54 ascites on the invasive potential of the cell line. (B) Invasion
profile of OV-90 with OSE medium in the absence or presence of 5% FBS or with 5% of those ascites selected for gene expression analysis.
Figure 2. Effect of ascites on the proliferation of the OV-90 ovarian cancer
cell line. On day 0, 2 � 105 cells were incubated in media supplemented
either with no serum, with 5% FBS, or with 5% ascites and the cell growth
was evaluated with a Trypan Blue exclusion assay at 24 and 48 hours. Note
that, with one exception, there were no statistically significant differences in
growth after 24 hours in the different tested conditions. The asterisk denotes
a statistical significance (P < .05).
824 Ascites and Ovarian Tumor Cell Interaction Puiffe et al.
Neoplasia . Vol. 9, No. 10, 2007

this purpose, the OV-90 cell line was incubated either in the
absence of serum, in 5% FBS, or in 5% of ascites. The
formation of spheroids was monitored after 4 days. As shown
in Figure 3, the OV-90 cell line formed multiple very small and
nonreproducible spheroids from drop to drop in the absence
of FBS, which is consistent with previous findings [19]. In the
presence of FBS or ascites A1317 and A1592, however, OV-
90 formed large (approximately 500 mm in diameter) and
compact spheroids. This was reproducible from drop to drop
with one unique spheroid of similar size formed in each drop.
Although cell scattering around spheroids was observed, it
was not significantly different between spheroids generated
in the presence of different ascites. The ability for different
ascites to induce large and compact spheroid formation was
also confirmed with ascites A1318, A1322, A1322(2), A1337,
A1835, A1946, A2085, and A2090, which gave similar
results (Figure W1). Therefore, the ability of ascites to
stimulate spheroid formation did not correlate with the inva-
sion potential of the tested ascites.
Ascites Invasive Phenotype Characterization
Ascites that stimulated or inhibited OV-90 cell invasion
were combined to determine which effect is the most pre-
dominant (Figure 4A). We selected one stimulatory (A2090)
and two inhibitory (A1369 and A1526) ascites. When stimula-
tory and inhibitory ascites were added together (5% A2090 +
5% A1369 or 5% A2090 + 5% A1526), we observed that
the invasion rate was not significantly different compared
to the presence of inhibitory ascites alone. This result sug-
gests that the inhibitory ascites have a predominant impact
on invasion of OV-90 cells compared to a stimulatory as-
cites. This effect was not due to an increased concentration
of ascites in the assay as adjusting individually tested as-
cites to 10% had no effect on the invasive phenotype (data
not shown).
To determine if this predominant effect is protein-dependent,
inhibitory ascites were boiled at 100jC for 10 minutes before
being tested on OV-90 cells (Figure 4B). The results showed
that protein inactivation abolished the inhibitory effect of
the two selected ascites (A1369 and A1526). These com-
bined results suggest that inhibition of OV-90 cell invasion is
protein-based and that the inhibitory effect is stronger than
the stimulatory effect.
Modification of Gene Expression Induced By Ascites
in OV-90 Cells
To identify potential molecular players in invasion regu-
lated by ascites, gene profiling was performed using Affy-
metrix HG-U133A GeneChip arrays with RNA extracted from
OV-90 cells after 24 hours of exposure to either no serum, to
5% FBS, or to 5% of 1 of 10 different ascites (A1317, A1318,
A1322, A1322(2), A1337, A1592, A1835, A1946, A2085,
and A2090).
For supervised analysis purposes, two groups were cre-
ated for comparison. The group that stimulated invasion
(referred here as GSTIMUL group) included samples with
no FBS, with 5% FBS, or with 5% of the four ascites that
stimulated OV-90 cell invasion (A1592, A1946, A2085, and
A2090). An inhibitory group (referred here as GINHIB group)
Figure 4. In vitro invasion assay with the ovarian cancer cell line OV-90. (A) Effect of simultaneous exposure to ascites that stimulate or inhibit the invasion of OV-
90. Note that the inhibitory effect appears to be dominant. (B) Proteins of ascites A1369 and A1526 were inactivated by heating and their effect on the invasion of
OV-90 was evaluated. Note that ascites no longer maintain their inhibitory effect.
Figure 3. Effect of ascites on spheroid formation. Spheroids were formed using
a modification of the hanging droplet method. Cells were incubated with OSE
media supplemented either with no serum, with 5% FBS, or with 5% of the
indicated ascites. Spheroid formation was monitored after 4 days. All pictures
were taken at a magnification of �100.
Ascites and Ovarian Tumor Cell Interaction Puiffe et al. 825
Neoplasia . Vol. 9, No. 10, 2007
containing the six ascites that inhibited cell invasion (A1317,
A1318, A1322, A1322(2), A1337, and A1835) was also
defined. Expression analysis identified 243 probe sets to
be differentially expressed (P V .1) between the GSTIMUL
and GINHIB groups (Table W1).
Differential Expression Validation of Selected
Candidates By Q-PCR
As differences in expression are subtle but tended to be
statistically significant, it was important to validate the value
of the cutoff selected. For this purpose, we selected genes
with different P values (Table 3) to test the robustness of their
association with invasion. Table 3 describes the seven can-
didate genes upregulated in the GSTIMUL group [dickkopf
homolog 1 (Xenopus) (DKK1), regulator of G-protein sig-
naling 4 (RGS4), interferon-stimulated transcription factor 3,
gamma 48 kDa (ISGF3G), tribbles homolog 1 (Drosophila)
(TRIB1), MAP kinase phosphatase 1 (MKP1), cyclooxy-
genase 2 (COX2), and motile sperm domain containing 1
(MOSPD1)] and two candidate genes upregulated in the
GINHIB group [plectin 1, intermediate filament binding pro-
tein 500 kDa (PLEC1) and myristoylated alanine-rich protein
kinase C substrate (MARCKS)] that were selected for fur-
ther validation. Q-PCR was used to validate the differential
expression of selected candidates in RNA derived from
OV-90 cells exposed individually to the entire panel of
54 ascites (Table 1). The relative expression ratio (R) of
each gene, based on the Pfaffl method (see Materials and
Methods section for details), was quantified and, for each
experiment, the median ratio was calculated and the results
scored. Pearson correlations were then calculated for each
candidate correlating ascites invasion effects (stimulatory or
inhibitory) and scored gene expression, as shown in Table 4.
The scored gene expression of RGS4, ISGF3G, TRIB1,
MKP1, MOSPD1, and PLEC1 correlated significantly with
the ascites’ invasion effects, but not the expression of DKK1,
COX2, and MARCKS. These results also suggest that an
extensive validation of candidates identified in the super-
vised analysis by Q-PCR is warranted to uncover the rich-
ness of genes implicated in the invasive process.
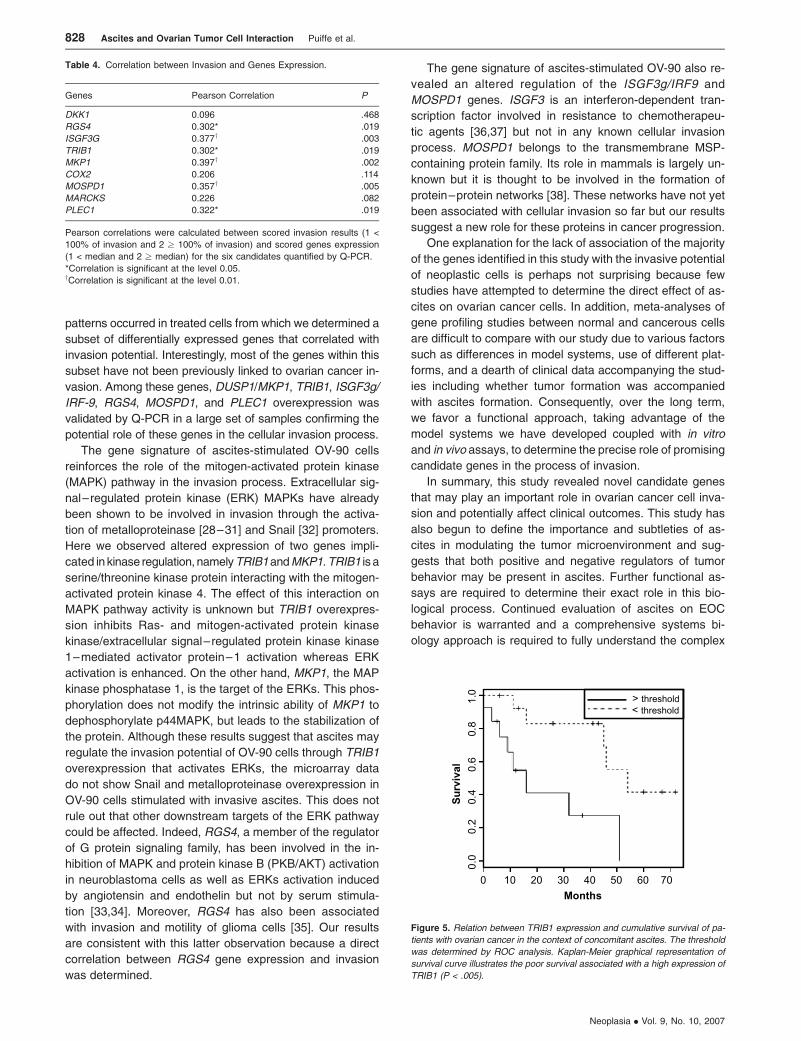
Survival
To evaluate the prognosis potential of the selected gene
candidates RGS4, ISGF3G, TRIB1, MKP1, MOSPD1, and
PLEC1, we sought to access the expression of these genes
in samples derived from patients with ovarian ascites. There-
fore, we extracted expression values from a microarray
analysis of RNA extracted from 28 primary cultures derived
from the cellular fraction of ascites from ovarian cancer pa-
tients (Table 2). Univariate Cox regression analysis showed
a strong association only between TRIB1 gene expression
and overall survival (P = .0007). Using a threshold deter-
mined by ROC analysis, a Kaplan-Meier curve coupled to a
log-rank test identified the presence of two patient groups
and high TRIB1 expression was associated with a poorer
survival rate (log-rank P = .005) (Figure 5).
Discussion
Although ascites is a common phenotype in ovarian cancer,
the origin of malignant ascitic fluid and its relationship to the
developing tumor is still poorly understood. The observation
that ascites is often associated with the most invasive
malignant tumors indirectly supports the notion that ascites
is involved in the progression of ovarian cancer [22] presum-
ably by favoring the dissemination of malignant cells within
the peritoneal cavity. Contributing to the development of
ascites are soluble factors produced by tumor cells that are
known to increase vascular permeability and induce angio-
genesis [5,23]. Although ascitic soluble factors such as
chemokines, angiogenic factors, and growth factors have
been implicated in ovarian cancer cell invasion [24–26], the
combined effect of these factors in the progression of ovarian
cancer has not been addressed. In this study, we assessed
the effects of ascites on the invasion, proliferation, spheroid
formation, and gene expression of the cell line OV-90 [16].
The overall aim was to determine how ascites alters its
microenvironment and thus the biological characteristics of
ovarian cancer cells.
Using a Matrigel-based invasion assay, 54 individual
ascites showed varying effects on OV-90 cell invasion with
some ascites being either poorly stimulatory or inhibitory
compared to serum. This data is in contrast to other ascites
that strongly stimulated the invasive capacity of this cell line.
The varying invasive effects were not associated with total
protein concentration in ascites, because adjusting for this
factor did not affect the overall effect of invasion (data not
shown). The inhibitory effect of ascites was lost when
samples were heated, suggesting that the effect was due
to protein inactivation rather than other soluble factors.
Moreover, no correlation between the effect of ascites on
invasion and chemotherapy, received prior to ascites collec-
tions, was noted.
Correlation of the invasion assay results with two other
parameters, cellular proliferation and spheroid formation,
was assessed because stimulation of cell growth could lead
to bias in the number of cells counted in the upper chamber
of the Transwell and because formation of compact spher-
oids may interfere with the ability to pass through the
polycarbonate membrane pores. The initial characterization
studies focused on 10 ascites possessing either stimulatory
or inhibitory properties. Although cell growth and spheroid
formation were influenced to some extent by ascites, neither
parameter was strongly associated with OV-90 invasive
capacity. In general, higher doubling times or saturation
densities with ascites in comparison to serum were not
observed. These findings are similar to results obtained by
independent analyses of the PEO.36, OVHS, and SKOV-3
ovarian cancer cell lines [15,27], suggesting that although
ascites might affect the in vitro biological characteristics
(e.g., survival) of tumor cells, it does not necessarily contrib-
ute to the proliferation of tumor cells.
To investigate the molecular events associated with the
invasive effect of ascites, global RNA gene expression from
OV-90 cells in the presence or absence of serum or ascites
was characterized. As expected, differential gene expression
826 Ascites and Ovarian Tumor Cell Interaction Puiffe et al.
Neoplasia . Vol. 9, No. 10, 2007

Tab
le3.
Sele
cte
dG
enes
Diff
ere
ntia
llyE
xpre
ssed
betw
een
the
GS
TIM
UL
Gro
up
and
the
GIN
HIB
Gro
up.
PR
egula
tion
inO
V-9
0C
ells
with
Ascite
s
That
Inhib
ited
the
Invasio
n
Pro
be
Set
HG
-U133a
UniG
ene
Descriptio
nS
ym
bol
Cyto
band
GO
Bio
logic
al
Pro
cess
Descriptio
nG
OM
ole
cula
rF
unctio
nD
escriptio
n
.011
Dow
n204602_at
Hs.4
0499
Dic
kkopf
hom
olo
g1
(Xenopuslaevis
)DKK1
10q11
.2D
evelo
pm
ent
Sig
nal
transducer
activ
ity
Wnt
recepto
rsig
nalin
gpath
way
Pro
tein
bin
din
g
Gro
wth
facto
ractiv
ity
Low
-density
lipopro
tein
recepto
rbin
din
g
.027/.
082*
Dow
n204337_at
Hs.3
86726
Regula
tor
of
G-p
rote
insig
nalin
g4
RGS4
1q23.3
Inactiv
atio
nof
MA
PK
activ
ityS
ignal
transducer
activ
ity
204339_s_at
G-p
rote
in–
couple
dre
cepto
rpro
tein
sig
nalin
gpath
way
GT
Pase
activ
ato
ractiv
ity
Calm
odulin
bin
din
g
.044
Dow
n203882_at
Hs.1
706
Inte
rfero
n-s
timula
ted
transcriptio
n
facto
r3,
gam
ma
48
kD
a
ISGF3G
14q11
.2T
ranscriptio
nT
ranscriptio
nfa
cto
ractiv
ity
Imm
une
response
Pro
tein
bin
din
g
Cell
surf
ace
recepto
r–lin
ked
sig
nal
transductio
n
Meta
lio
nbin
din
g
Response
tovirus
.052
Dow
n202241_at
Hs.4
44947
Tribble
shom
olo
g1
(Drosophila
)TRIB1
8q24.1
3P
rote
inam
ino
acid
phosphory
latio
nP
rote
inserine/t
hre
onin
ekin
ase
activ
ity
Cell
pro
lifera
tion
Regula
tion
of
MA
PK
activ
ityA
TP
bin
din
g
.057
Dow
n201041_s_at
Hs.1
71695
MA
Pkin
ase
phosphata
se
1MKP1
5q34
Pro
tein
am
ino
acid
Non
–m
em
bra
ne-s
pannin
gpro
tein
Dephosphory
latio
nT
yro
sin
ephosphata
se
activ
ity
Response
tooxid
ativ
estr
ess
Pro
tein
bin
din
g
Cell
cycle
Hydro
lase
activ
ity
MA
Pkin
ase
phosphata
se
activ
ity
Pro
tein
tyro
sin
e/s
erine/t
hre
onin
e
phosphata
se
activ
ity
.066
Dow
n204748_at
Hs.1
96384
Cyclo
oxygenase
2COX2
1q25.2
Pro
sta
gla
ndin
bio
synth
esis
Pero
xid
ase
activ
ity
q25.3
Cell
motil
ityP
rosta
gla
ndin
–endopero
xid
esynth
ase
activ
ity
Physio
logic
alpro
cess
Meta
lio
nbin
din
g
Blo
od
pre
ssure
regula
tion
Oxid
ore
ducta
se
activ
ity
Cyclo
oxygenase
path
way
Kera
tinocyte
diff
ere
ntia
tion
Anagen
Lip
idbio
synth
esis
Infla
mm
ato
ryre
sponse
.082
Dow
n218853_s_at
Hs.5
90789
Motil
esperm
dom
ain
conta
inin
g1
MOSPD1
Xq26.3
Str
uctu
ral
mole
cule
activ
ity
.011
Up
216971_s_at
Hs.4
34248
Ple
ctin
1,
inte
rmedia
tefil
am
ent
bin
din
gpro
tein
500
kD
a
PLEC1
8q24
Cyto
skele
talanchoring
Actin
bin
din
g
Str
uctu
ral
mole
cule
activ
ity
.014
Up
213002_at
Hs.5
19909
Myristo
yla
ted
ala
nin
e-r
ich
pro
tein
kin
ase
Csubstr
ate
MARCKS
6q22.2
Cell
motil
ityC
alm
odulin
bin
din
g
Actin
bin
din
g
The
GS
TIM
UL
gro
up
consis
tsofO
V-9
0sam
ple
sw
ithno
FB
S,w
ith5%
FB
S,or
with
5%
ofth
efo
ur
ascite
sth
atstim
ula
ted
cell
invasio
n(A
1592,A
1946,A
2085,and
A2090).
The
GIN
HIB
gro
up
consis
tsofO
V-9
0sam
ple
sw
ith5%
of
the
six
ascite
sth
at
inhib
ited
cell
invasio
n(A
1317,
A1318,
A1322,
A1322(2
),A
1337,
and
A1835).
*Corr
espondin
gto
two
diff
ere
nt
pro
beset
on
the
Affym
etr
ixH
G-U
133A
GeneC
hip
arr
ay.
Ascites and Ovarian Tumor Cell Interaction Puiffe et al. 827
Neoplasia . Vol. 9, No. 10, 2007
patterns occurred in treated cells from which we determined a
subset of differentially expressed genes that correlated with
invasion potential. Interestingly, most of the genes within this
subset have not been previously linked to ovarian cancer in-
vasion. Among these genes, DUSP1/MKP1, TRIB1, ISGF3g/
IRF-9, RGS4, MOSPD1, and PLEC1 overexpression was
validated by Q-PCR in a large set of samples confirming the
potential role of these genes in the cellular invasion process.
The gene signature of ascites-stimulated OV-90 cells
reinforces the role of the mitogen-activated protein kinase
(MAPK) pathway in the invasion process. Extracellular sig-
nal–regulated protein kinase (ERK) MAPKs have already
been shown to be involved in invasion through the activa-
tion of metalloproteinase [28–31] and Snail [32] promoters.
Here we observed altered expression of two genes impli-
cated in kinase regulation, namelyTRIB1andMKP1.TRIB1 is a
serine/threonine kinase protein interacting with the mitogen-
activated protein kinase 4. The effect of this interaction on
MAPK pathway activity is unknown but TRIB1 overexpres-
sion inhibits Ras- and mitogen-activated protein kinase
kinase/extracellular signal–regulated protein kinase kinase
1–mediated activator protein–1 activation whereas ERK
activation is enhanced. On the other hand, MKP1, the MAP
kinase phosphatase 1, is the target of the ERKs. This phos-
phorylation does not modify the intrinsic ability of MKP1 to
dephosphorylate p44MAPK, but leads to the stabilization of
the protein. Although these results suggest that ascites may
regulate the invasion potential of OV-90 cells through TRIB1
overexpression that activates ERKs, the microarray data
do not show Snail and metalloproteinase overexpression in
OV-90 cells stimulated with invasive ascites. This does not
rule out that other downstream targets of the ERK pathway
could be affected. Indeed, RGS4, a member of the regulator
of G protein signaling family, has been involved in the in-
hibition of MAPK and protein kinase B (PKB/AKT) activation
in neuroblastoma cells as well as ERKs activation induced
by angiotensin and endothelin but not by serum stimula-
tion [33,34]. Moreover, RGS4 has also been associated
with invasion and motility of glioma cells [35]. Our results
are consistent with this latter observation because a direct
correlation between RGS4 gene expression and invasion
was determined.
The gene signature of ascites-stimulated OV-90 also re-
vealed an altered regulation of the ISGF3g/IRF9 and
MOSPD1 genes. ISGF3 is an interferon-dependent tran-
scription factor involved in resistance to chemotherapeu-
tic agents [36,37] but not in any known cellular invasion
process. MOSPD1 belongs to the transmembrane MSP-
containing protein family. Its role in mammals is largely un-
known but it is thought to be involved in the formation of
protein–protein networks [38]. These networks have not yet
been associated with cellular invasion so far but our results
suggest a new role for these proteins in cancer progression.
One explanation for the lack of association of the majority
of the genes identified in this study with the invasive potential
of neoplastic cells is perhaps not surprising because few
studies have attempted to determine the direct effect of as-
cites on ovarian cancer cells. In addition, meta-analyses of
gene profiling studies between normal and cancerous cells
are difficult to compare with our study due to various factors
such as differences in model systems, use of different plat-
forms, and a dearth of clinical data accompanying the stud-
ies including whether tumor formation was accompanied
with ascites formation. Consequently, over the long term,
we favor a functional approach, taking advantage of the
model systems we have developed coupled with in vitro
and in vivo assays, to determine the precise role of promising
candidate genes in the process of invasion.
In summary, this study revealed novel candidate genes
that may play an important role in ovarian cancer cell inva-
sion and potentially affect clinical outcomes. This study has
also begun to define the importance and subtleties of as-
cites in modulating the tumor microenvironment and sug-
gests that both positive and negative regulators of tumor
behavior may be present in ascites. Further functional as-
says are required to determine their exact role in this bio-
logical process. Continued evaluation of ascites on EOC
behavior is warranted and a comprehensive systems bi-
ology approach is required to fully understand the complex
Table 4. Correlation between Invasion and Genes Expression.
Genes Pearson Correlation P
DKK1 0.096 .468
RGS4 0.302* .019
ISGF3G 0.377y .003
TRIB1 0.302* .019
MKP1 0.397y .002
COX2 0.206 .114
MOSPD1 0.357y .005
MARCKS 0.226 .082
PLEC1 0.322* .019
Pearson correlations were calculated between scored invasion results (1 <
100% of invasion and 2 z 100% of invasion) and scored genes expression
(1 < median and 2 z median) for the six candidates quantified by Q-PCR.
*Correlation is significant at the level 0.05.yCorrelation is significant at the level 0.01.
Figure 5. Relation between TRIB1 expression and cumulative survival of pa-
tients with ovarian cancer in the context of concomitant ascites. The threshold
was determined by ROC analysis. Kaplan-Meier graphical representation of
survival curve illustrates the poor survival associated with a high expression of
TRIB1 (P < .005).
828 Ascites and Ovarian Tumor Cell Interaction Puiffe et al.
Neoplasia . Vol. 9, No. 10, 2007

interactions within the peritoneum that influence EOC pro-
gression and metastasis.
Acknowledgements
We are grateful to Louise Champoux, Lise Portelance, Manon
de Ladurantaye, Jason Madore, and Marise Roy for technical
assistance. We thank Pierre Drouin, Philippe Sauthier, and
Philippe Gauthier for their assistance in tissue procurement.
We are grateful to Luke Masson for reviewing the manuscript
and Kate Morris for editing.
References[1] Auersperg N, Wong AS, Choi KC, Kang SK, and Leung PC (2001).
Ovarian surface epithelium: biology, endocrinology, and pathology.
Endocr Rev 22, 255 –288.
[2] Auersperg N, Ota T, and Mitchell GW (2002). Early events in ovarian
epithelial carcinogenesis: progress and problems in experimental ap-
proaches. Int J Gynecol Cancer 12, 691 – 703.
[3] Cvetkovic D (2003). Early events in ovarian oncogenesis. Reprod Biol
Endocrinol 1, 68.
[4] Burleson KM, Casey RC, Skubitz KM, Pambuccian SE, Oegema TR Jr,
and Skubitz AP (2004). Ovarian carcinoma ascites spheroids adhere
to extracellular matrix components and mesothelial cell monolayers.
Gynecol Oncol 93, 170 – 181.
[5] Zebrowski BK, Liu W, Ramirez K, Akagi Y, Mills GB, and Ellis LM
(1999). Markedly elevated levels of vascular endothelial growth factor
in malignant ascites. Ann Surg Oncol 6, 373 – 378.
[6] Miyamoto S, Hirata M, Yamazaki A, Kageyama T, Hasuwa H, Mizushima
H, Tanaka Y, Yagi H, Sonoda K, Kai M, et al. (2004). Heparin-binding
EGF-like growth factor is a promising target for ovarian cancer therapy.
Cancer Res 64, 5720–5727.
[7] Mills GB, Eder A, Fang X, Hasegawa Y, Mao M, Lu Y, Tanyi J, Tabassam
FH, Wiener J, Lapushin R, et al. (2002). Critical role of lysophospholipids
in the pathophysiology, diagnosis, and management of ovarian cancer.
Cancer Treat Res 107, 259–283.
[8] Saltzman AK, Hartenbach EM, Carter JR, Contreras DN, Twiggs LB,
Carson LF, and Ramakrishnan S (1999). Transforming growth factor –
alpha levels in the serum and ascites of patients with advanced epithe-
lial ovarian cancer. Gynecol Obstet Invest 47, 200 –204.
[9] Abendstein B, Stadlmann S, Knabbe C, Buck M, Muller-Holzner E,
Zeimet AG, Marth C, Obrist P, Krugmann J, and Offner FA (2000).
Regulation of transforming growth factor – beta secretion by human
peritoneal mesothelial and ovarian carcinoma cells. Cytokine 12,
1115 –1119.
[10] Jandu N, Richardson M, Singh G, Hirte H, and Hatton MW (2006).
Human ovarian cancer ascites fluid contains a mixture of incompletely
degraded soluble products of fibrin that collectively possess an anti-
angiogenic property. Int J Gynecol Cancer 16, 1536 –1544.
[11] Said NA, Najwer I, Socha MJ, Fulton DJ, Mok SC, and Motamed K
(2007). SPARC inhibits LPA-mediated mesothelial –ovarian cancer cell
crosstalk. Neoplasia 9, 23 – 35.
[12] Fung-Kee-Fung M, Provencher D, Rosen B, Hoskins P, Rambout L,
Oliver T, Gotlieb W, and Covens A (2007). Intraperitoneal chemother-
apy for patients with advanced ovarian cancer: a review of the evidence
and standards for the delivery of care. Gynecol Oncol 105, 747 – 756.
[13] Petignat P, du Bois A, Bruchim I, Fink D, and Provencher DM (2007).
Should intraperitoneal chemotherapy be considered as standard first-
line treatment in advanced stage ovarian cancer? Crit Rev Oncol
Hematol 62, 137 –147.
[14] Armstrong DK, Bundy B, Wenzel L, Huang HQ, Baergen R, Lele S,
Copeland LJ, Walker JL, and Burger RA (2006). Intraperitoneal cisplatin
and paclitaxel in ovarian cancer. N Engl J Med 354, 34– 43.
[15] Ahmed N, Riley C, Oliva K, Rice G, and Quinn M (2005). Ascites in-
duces modulation of alpha6beta1 integrin and urokinase plasminogen
activator receptor expression and associated functions in ovarian car-
cinoma. Br J Cancer 92, 1475 –1485.
[16] Provencher DM, Lounis H, Champoux L, Tetrault M, Manderson EN,
Wang JC, Eydoux P, Savoie R, Tonin PN, and Mes-Masson AM (2000).
Characterization of four novel epithelial ovarian cancer cell lines. In Vitro
Cell Dev Biol Anim 36, 357 – 361.
[17] Tonin PN, Hudson TJ, Rodier F, Bossolasco M, Lee PD, Novak J,
Manderson EN, Provencher D, and Mes-Masson AM (2001). Micro-
array analysis of gene expression mirrors the biology of an ovarian
cancer model. Oncogene 20, 6617 –6626.
[18] Kruk PA, Maines-Bandiera SL, and Auersperg N (1990). A simplified
method to culture human ovarian surface epithelium. Lab Invest 63,
132 – 136.
[19] Zietarska M, Maugard CM, Filali-Mouhim A, Alam-Fahmy M, Tonin PN,
Provencher DM, and Mes-Masson AM (2007). Molecular description
of a 3D in vitro model for the study of epithelial ovarian cancer
(EOC). Mol Carcinog 48, 872 – 885.
[20] Dudoit S, Gentleman RC, and Quackenbush J (2003). Open source soft-
ware for the analysis of microarray data. Biotechniques Suppl, 45–51.
[21] Pfaffl MW (2001). A new mathematical model for relative quantification
in real-time RT-PCR. Nucleic Acids Res 29, e45.
[22] Shen-Gunther J and Mannel RS (2002). Ascites as a predictor of ovar-
ian malignancy. Gynecol Oncol 87, 77– 83.
[23] Richardson M, Gunawan J, Hatton MW, Seidlitz E, Hirte HW, and
Singh G (2002). Malignant ascites fluid (MAF), including ovarian-
cancer-associated MAF, contains angiostatin and other factor(s) which
inhibit angiogenesis. Gynecol Oncol 86, 279 – 287.
[24] Westermann AM, Beijnen JH, Moolenaar WH, and Rodenhuis S (1997).
Growth factors in human ovarian cancer. Cancer Treat Rev 23, 113–131.
[25] Brown MR, Blanchette JO, and Kohn EC (2000). Angiogenesis in ovarian
cancer. Baillieres Best Pract Res Clin Obstet Gynaecol 14, 901–918.
[26] Schutyser E, Struyf S, Proost P, Opdenakker G, Laureys G, Verhasselt
B, Peperstraete L, Van de Putte I, Saccani A, Allavena P, et al. (2002).
Identification of biologically active chemokine isoforms from ascitic fluid
and elevated levels of CCL18/pulmonary and activation-regulated che-
mokine in ovarian carcinoma. J Biol Chem 277, 24584 – 24593.
[27] Yabushita H, Shimazu M, Noguchi M, Kishida T, Narumiya H, and
Sawaguchi K (2003). Vascular endothelial growth factor activating ma-
trix metalloproteinase in ascitic fluid during peritoneal dissemination of
ovarian cancer. Oncol Rep 10, 89– 95.
[28] Montesano R, Soriano JV, Hosseini G, Pepper MS, and Schramek H
(1999). Constitutively active mitogen-activated protein kinase kinase
MEK1 disrupts morphogenesis and induces an invasive phenotype
in Madin-Darby canine kidney epithelial cells. Cell Growth Differ 10,
317 – 332.
[29] Lakka SS, Jasti SL, Kyritsis AP, Yung WK, Ali-Osman F, Nicolson GL,
and Rao JS (2000). Regulation of MMP-9 (type IV collagenase) produc-
tion and invasiveness in gliomas by the extracellular signal – regulated
kinase and jun amino-terminal kinase signaling cascades. Clin Exp
Metastasis 18, 245 –252.
[30] Tan X, Egami H, Abe M, Nozawa F, Hirota M, and Ogawa M (2005).
Involvement of MMP-7 in invasion of pancreatic cancer cells through
activation of the EGFR mediated MEK –ERK signal transduction path-
way. J Clin Pathol 58, 1242 – 1248.
[31] Ahmed N, Oliva K, Wang Y, Quinn M, and Rice G (2003). Downregu-
lation of urokinase plasminogen activator receptor expression inhibits
Erk signalling with concomitant suppression of invasiveness due to loss
of uPAR –beta1 integrin complex in colon cancer cells. Br J Cancer 89,
374 – 384.
[32] Barbera MJ, Puig I, Dominguez D, Julien-Grille S, Guaita-Esteruelas S,
Peiro S, Baulida J, Franci C, Dedhar S, Larue L, et al. (2004). Regula-
tion of Snail transcription during epithelial to mesenchymal transition of
tumor cells. Oncogene 23, 7345 –7354.
[33] Leone AM, Errico M, Lin SL, and Cowen DS (2000). Activation of ex-
tracellular signal – regulated kinase (ERK) and Akt by human serotonin
5-HT(1B) receptors in transfected BE(2)-C neuroblastoma cells is in-
hibited by RGS4. J Neurochem 75, 934 – 938.
[34] Albig AR and Schiemann WP (2005). Identification and characteri-
zation of regulator of G protein signaling 4 (RGS4) as a novel inhibitor
of tubulogenesis: RGS4 inhibits mitogen-activated protein kinases and
vascular endothelial growth factor signaling. Mol Biol Cell 16, 609 – 625.
[35] Tatenhorst L, Senner V, Puttmann S, and Paulus W (2004). Regulators
of G-protein signaling 3 and 4 (RGS3, RGS4) are associated with glioma
cell motility. J Neuropathol Exp Neurol 63, 210 – 222.
[36] Luker KE, Pica CM, Schreiber RD, and Piwnica-Worms D (2001). Over-
expression of IRF9 confers resistance to antimicrotubule agents in
breast cancer cells. Cancer Res 61, 6540 – 6547.
[37] Schmidt M, Schler G, Gruensfelder P, and Hoppe F (2006). Differential
gene expression in a paclitaxel-resistant clone of a head and neck
cancer cell line. Eur Arch Otorhinolaryngol 263, 127 –134.
[38] Laurent F, Labesse G, and de Wit P (2000). Molecular cloning and
partial characterization of a plant VAP33 homologue with a major sperm
protein domain. Biochem Biophys Res Commun 270, 286 –292.
Ascites and Ovarian Tumor Cell Interaction Puiffe et al. 829
Neoplasia . Vol. 9, No. 10, 2007
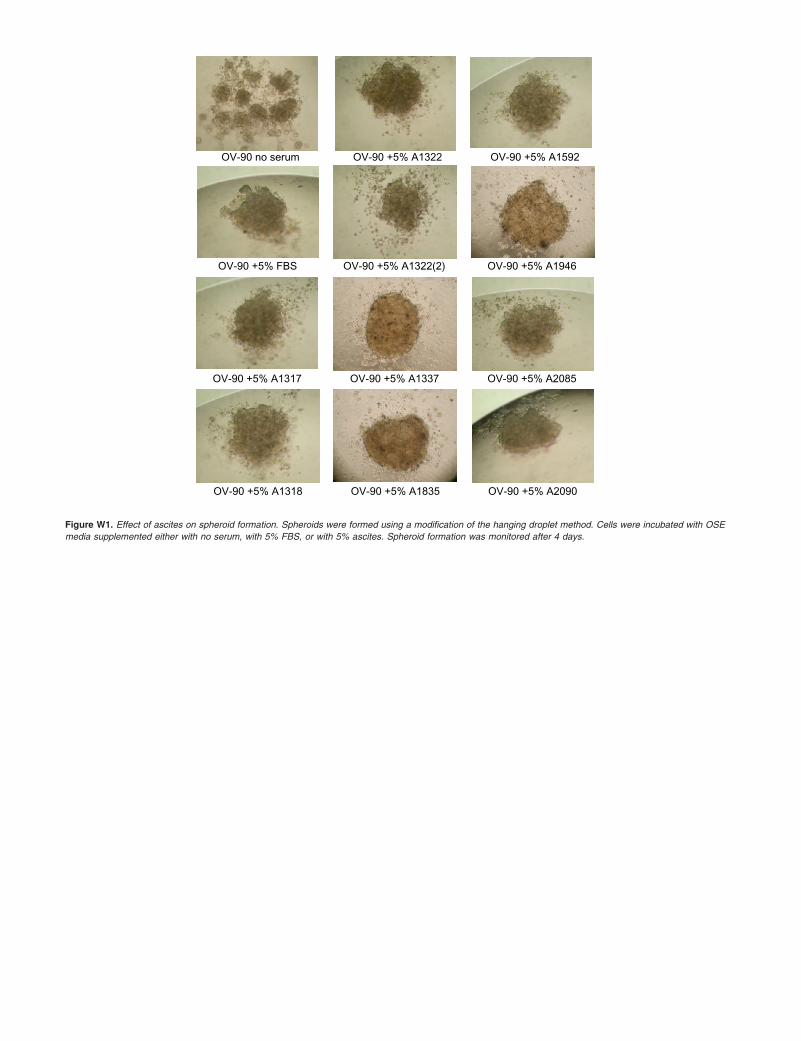
Figure W1. Effect of ascites on spheroid formation. Spheroids were formed using a modification of the hanging droplet method. Cells were incubated with OSE
media supplemented either with no serum, with 5% FBS, or with 5% ascites. Spheroid formation was monitored after 4 days.

Tab
leW
1.
Genes
Diff
ere
ntia
llyE
xpre
ssed
betw
een
the
GS
TIM
UL
Gro
up
and
the
GIN
HIB
Gro
up.
P
Regula
tion
inO
V-9
0C
ells
with
Ascite
sT
hat
Inhib
ited
the
Invasio
nP
robe
Set
HG
-U133a
UniG
ene
Descriptio
nS
ym
bol
Cyto
band
.009069738
Dow
n205505_at
Hs.5
21568
Glu
cosam
inyl
(N-a
cety
l)tr
ansfe
rase
1,
core
2
(beta
-1,6
-N-a
cety
lglu
cosam
inyltr
ansfe
rase)
GCNT1
9q13
.010986586
Do
wn
204602_at
Hs.4
0499
Dic
kko
pf
ho
mo
log
1(X
en
op
us
laevis
)DKK1
10q
11.2
.011
494572
Dow
n208960_s_at
Hs.4
055
Kru
ppel-lik
efa
cto
r6
KLF6
10p15
.012167277
Dow
n201565_s_at
Hs.1
80919
Inhib
itor
of
DN
Abin
din
g2,
dom
inant
negativ
ehelix
-loop-h
elix
pro
tein
ID2
2p25
.012194066
Dow
n202378_s_at
Hs.2
3581
Leptin
recepto
roverlappin
gtr
anscript
LEPROT
1p31.3
.013785587
Dow
n210297_s_at
Hs.2
55462
Mic
rosem
inopro
tein
beta
MSMB
10q11
.2
.014105088
Dow
n213982_s_at
Hs.5
85378
RA
BG
TP
ase-a
ctiv
atin
gpro
tein
1–
like
RABGAP1L
1q24
Hs.5
91475
Hs.6
15081
.015017693
Dow
n209568_s_at
Hs.4
97148
Ralguanin
enucle
otid
edis
socia
tion
stim
ula
tor–
like
1RGL1
1q25.3
.015955247
Dow
n201844_s_at
Hs.6
42635
RIN
G1
and
YY
1bin
din
gpro
tein
RYBP
3p13
.019102681
Dow
n203053_at
Hs.2
2960
Bre
ast
carc
inom
a–
am
plif
ied
sequence
2BCAS2
1p21
–p13.3
.019591227
Dow
n213668_s_at
Hs.3
57901
SR
Y(s
ex-d
ete
rmin
ing
regio
nY
)-box
4SOX4
6p22.3
.019677541
Dow
n202068_s_at
Hs.2
13289
Low
-density
lipopro
tein
recepto
r(f
am
ilialhyperc
hole
ste
role
mia
)LDLR
19p13.3
.020450451
Dow
n212993_at
.020537623
Dow
n203910_at
Hs.4
83238
Rho
GT
Pase-a
ctiv
atin
gpro
tein
29
ARHGAP29
1p22.1
.021916807
Dow
n205849_s_at
Hs.1
31255
Ubiq
uin
ol–
cyto
chro
mec
reducta
se
bin
din
gpro
tein
UQCRB
8q22
.022344932
Dow
n204224_s_at
Hs.8
6724
GT
Pcyclo
hydro
lase
1(D
OP
A-r
esponsiv
edysto
nia
)GCH1
14q22.1
–q22.2
.02250785
Dow
n218859_s_at
Hs.3
69284
Chro
mosom
e20
open
readin
gfr
am
e6
C20orf6
20p12.1
.023487203
Dow
n219230_at
Hs.1
73233
Tra
nsm
em
bra
ne
pro
tein
100
TMEM100
17q22
.024086813
Dow
n221046_s_at
Hs.1
27496
GT
P-b
indin
gpro
tein
8(p
uta
tive)
GTPBP8
3q13.2
.024674823
Dow
n212155_at
Hs.3
56377
Rin
gfin
ger
pro
tein
187
RNF187
1q42.1
3
.02542067
Dow
n203893_at
Hs.2
48941
TA
F9
RN
Apoly
mera
se
II,
TA
TA
box
bin
din
gpro
tein
(TB
P)–
associa
ted
facto
r,32
kD
a
TAF9
5q11
.2–
q13.1
.025748062
Dow
n21911
9_at
Hs.5
92275
LS
M8
hom
olo
g,
U6
sm
all
nucle
ar
RN
A-a
ssocia
ted
(Saccharomyces
cerevisiae
)
LSM8
7q31.1
–q31.3
.026383595
Dow
n202049_s_at
Hs.2
69211
Zin
cfin
ger,
MY
M-t
ype
4ZMYM4
1p32
–p34
.026879501
Dow
n204717_s_at
Hs.5
69017
Solu
tecarr
ier
fam
ily29
(nucle
osid
etr
ansport
ers
),m
em
ber
2SLC29A2
11q13
.027130811
Do
wn
204337_at
Hs.3
86726
Reg
ula
tor
of
G-p
rote
insig
nali
ng
4RGS4
1q
23.3
.02816821
Dow
n221989_at
Hs.5
34404
Rib
osom
al
pro
tein
L10
RPL10
Xq28
.02911
9959
Dow
n211
475_s_at
Hs.3
77484
BC
L2-a
ssocia
ted
ath
anogene
BAG1
9p12
.031204448
Dow
n202371_at
Hs.1
94329
Tra
nscriptio
nelo
ngatio
nfa
cto
rA
(SII
)–lik
e4
TCEAL4
Xq22.2
.033222043
Dow
n209066_x_at
Hs.1
31255
Ubiq
uin
ol–
cyto
chro
mec
reducta
se
bin
din
gpro
tein
UQCRB
8q22
.033426388
Dow
n203261_at
Hs.1
58427
Dynactin
6DCTN6
8p12
–p11
.03413633
Dow
n202536_at
Hs.4
76930
Chro
matin
-modifyin
gpro
tein
2B
CHMP2B
3p11
.2
.03460712
Dow
n218546_at
Hs.5
19839
Chro
mosom
e1
open
readin
gfr
am
e11
5C1orf115
1q41
.036049912
Dow
n209194_at
Hs.8
2794
Centr
in,
EF
-hand
pro
tein
,2
CETN2
Xq28
.036137594
Dow
n218263_s_at
Hs.1
83684
Zin
cfin
ger,
BE
D-t
ype
conta
inin
g5
ZBED5
11p15.3
.036963092
Dow
n218718_at
Hs.5
70855
Pla
tele
t-derived
gro
wth
facto
rC
PDGFC
4q32
.037577573
Dow
n213346_at
Hs.3
9811
1C
hro
mosom
e13
open
readin
gfr
am
e27
C13orf27
13q33.1
.03797463
Dow
n217971_at
Hs.5
17438
Mito
gen-a
ctiv
ate
dpro
tein
kin
ase
kin
ase
1in
tera
ctin
gpro
tein
1MAP2K1IP1
4q23
Hs.6
42730
.03885642
Dow
n203008_x_at
Hs.5
36122
Thio
redoxin
dom
ain
conta
inin
g9
TXNDC9
2q11
.2
.039788327
Dow
n209577_at
Hs.5
85089
Phosphate
cytid
yly
ltransfe
rase
2,
eth
anola
min
ePCYT2
17q25.3
Hs.6
40301
.04068575
Dow
n212990_at
Hs.4
73632
Synapto
janin
1SYNJ1
21q22.2
.040856296
Dow
n206340_at
Hs.2
82735
Nucle
ar
recepto
rsubfa
mily
1,
gro
up
H,
mem
ber
4NR1H4
12q23.1
.043263551
Dow
n203095_at
Hs.1
49894
Mito
chondrial
transla
tional
initi
atio
nfa
cto
r2
MTIF2
2p14
–p16

.043675477
Dow
n213365_at
.043675478
Dow
n213853_at
Hs.1
87269
Zin
cfin
ger,
CS
L-t
ype
conta
inin
g3
ZCSL3
11p13
.044556918
Dow
n204833_at
Hs.2
64482
AT
G12
auto
phagy
–re
late
d12
hom
olo
g(S
.cerevisiae
)ATG12
5q21
–q22
.044832106
Do
wn
203882_at
Hs.1
706
Inte
rfero
n-s
tim
ula
ted
tran
scri
pti
on
facto
r3,
gam
ma
48
kD
aISGF3G
14q
11.2
.045284015
Dow
n201362_at
Hs.4
97183
Influ
enza
virus
NS
1A
bin
din
gpro
tein
IVNS1ABP
1q25.1
–q31.1
.045488235
Dow
n204905_s_at
Hs.6
31818
Eukary
otic
transla
tion
elo
ngatio
nfa
cto
r1
epsilo
n1
EEF1E1
6p24.3
–p25.1
.048564587
Dow
n217523_at
Hs.5
02328
CD
44
mole
cule
(India
nblo
od
gro
up)
CD44
11p13
.049825918
Dow
n221838_at
Hs.5
17419
Kelc
h-lik
e22
(Drosophila
)KLHL22
22q11
.21
.051012172
Dow
n210130_s_at
Hs.3
1130
Tra
nsm
em
bra
ne
7superf
am
ilym
em
ber
2TM7SF2
11q13
.051573086
Dow
n205070_at
Hs.4
89811
Inhib
itor
of
gro
wth
fam
ily,
mem
ber
3ING3
7q31
.052089067
Dow
n220046_s_at
Hs.4
859
Cyclin
L1
CCNL1
3q25.3
2
.052837334
Do
wn
202241_at
Hs.4
44947
Tri
bb
les
ho
mo
log
1(D
rosophila
)TRIB1
8q
24.1
3
.053014196
Dow
n203219_s_at
Hs.2
8914
Adenin
ephosphoribosyltr
ansfe
rase
APRT
16q24
.053104357
Dow
n205476_at
Hs.7
5498
Chem
okin
e(C
–C
motif
)lig
and
20
CCL20
2q33
–q37
.055079649
Dow
n212077_at
Hs.4
90203
Cald
esm
on
1CALD1
7q33
.055257276
Dow
n221803_s_at
Hs.4
49628
Nucle
ar
recepto
rbin
din
gfa
cto
r2
NRBF2
10q21.2
.056358813
Dow
n201719_s_at
Hs.4
86470
Ery
thro
cyte
mem
bra
ne
pro
tein
band
4.1
–lik
e2
EPB41L2
6q23
.056740375
Dow
n203469_s_at
Hs.1
09
Cyclin
-dependent
kin
ase
(CD
C2-lik
e)
10
CDK10
16q24
.057018399
Dow
n204093_at
Hs.2
92524
Cyclin
HCCNH
5q13.3
–q14
.057376594
Dow
n218640_s_at
Hs.2
9724
Ple
ckstr
inhom
olo
gy
dom
ain
conta
inin
g,
fam
ilyF
(with
FY
VE
dom
ain
)
mem
ber
2
PLEKHF2
8q22.1
.057726739
Do
wn
201041_s_at
Hs.1
71695
MA
Pkin
ase
ph
osp
hata
se
1MKP1
5q
34
.05848611
1D
ow
n212852_s_at
Hs.2
88178
TR
OV
Edom
ain
fam
ily,
mem
ber
2TROVE2
1q31
.058922152
Dow
n204518_s_at
Hs.1
10364
Peptid
ylp
roly
lis
om
era
se
C(c
yclo
phili
nC
)PPIC
5q23.2
.060798058
Dow
n209090_s_at
Hs.1
36309
SH
3-d
om
ain
GR
B2-lik
eendophili
nB
1SH3GLB1
1p22
.060979735
Dow
n218669_at
Hs.1
19889
RA
P2C
,m
em
ber
of
RA
Soncogene
fam
ilyRAP2C
Xq25
.0611
51359
Dow
n203351_s_at
Hs.5
58364
Origin
recogniti
on
com
ple
x,
subunit
4–
like
(yeast)
ORC4L
2q22
–q23
.062158872
Dow
n218618_s_at
Hs.1
59430
Fib
ronectin
type
III
dom
ain
conta
inin
g3B
FNDC3B
3q26.3
1
.063122027
Dow
n216262_s_at
Hs.6
32264
TG
Fb-
induced
facto
r2
(TA
LE
fam
ilyhom
eobox)
TGIF2
20q11
.2–
q12
.063521509
Dow
n208714_at
Hs.7
744
NA
DH
dehydro
genase
(ubiq
uin
one)
flavopro
tein
1,
51
kD
aNDUFV1
11q13
.064380244
Dow
n202829_s_at
Hs.2
4167
Synapto
bre
vin
-lik
e1
SYBL1
Xq28
and
Yq12
.064471815
Dow
n204064_at
Hs.5
92342
TH
Ocom
ple
x1
THOC1
18p11
.32
.064815795
Dow
n218932_at
Hs.5
111
Chro
mosom
e1
open
readin
gfr
am
e181
C1orf181
1p22.3
.065594194
Dow
n209892_at
Hs.3
90420
Fucosyltr
ansfe
rase
4(a
lpha
(1.3
)fu
cosyltr
ansfe
rase,
myelo
id-s
pecifi
c)
FUT4
11q21
Hs.5
72064
Hs.6
23098
.066601688
Dow
n221580_s_at
Hs.3
55750
Josephin
dom
ain
conta
inin
g3
JOSD3
11q21
.066737657
Dow
n215136_s_at
Hs.2
94041
Exosom
ecom
ponent
8EXOSC8
13q13.1
.066741405
Do
wn
204748_at
Hs.1
96384
Cyclo
oxyg
en
ase
2COX2
1q
25.2
–q
25.3
.066935084
Dow
n204731_at
Hs.4
82390
Tra
nsfo
rmin
ggro
wth
facto
r,beta
recepto
rII
I(b
eta
gly
can,
300
kD
a)
TGF�R3
1p33
–p32
.070237276
Dow
n212451_at
Hs.9
997
KIAA0256
15q21.1
.070395379
Dow
n2211
93_s_at
Hs.2
9700
Zin
cfin
ger,
CC
HC
dom
ain
conta
inin
g10
ZCCHC10
5q31.1
.070491097
Dow
n205555_s_at
Hs.8
9404
msh
hom
eobox
hom
olo
g2
(Drosophila
)MSX2
5q34
–q35
.071242737
Dow
n204605_at
Hs.5
9106
Cell
gro
wth
regula
tor
with
ring
finger
dom
ain
1CGRRF1
14q22.2
.071332992
Dow
n202486_at
Hs.5
28996
AF
G3
AT
Pase
fam
ilygene
3–
like
2(y
east)
AFG3L2
18p11
.071381219
Dow
n211
297_s_at
Hs.1
84298
Cyclin
-dependent
kin
ase
7(M
O15
hom
olo
g;Xenopuslaevis
)CDK7
5q12.1
.072368959
Dow
n202268_s_at
Hs.4
60978
Am
ylo
idbeta
pre
curs
or
pro
tein
bin
din
gpro
tein
1APPBP1
16q22
.072874958
Dow
n212036_s_at
Hs.4
09965
Pin
in,
desm
osom
e-a
ssocia
ted
pro
tein
PNN
14q21.1
.073704052
Dow
n218889_at
Hs.7
4899
Nucle
ola
rcom
ple
x–
associa
ted
3hom
olo
g(S.cerevisiae)
NOC3L
10q23.3
3
.07411
839
Dow
n209180_at
Hs.7
8948
Rab
gera
nylg
era
nyltr
ansfe
rase,
beta
subunit
RABGGTB
1p31
.074852081
Dow
n201993_x_at
Hs.5
27105
Hete
rogeneous
nucle
ar
ribonucle
opro
tein
D–
like
HNRPDL
4q13
–q21
.07580573
Dow
n208788_at
Hs.5
20189
ELO
VL
fam
ilym
em
ber
5,
elo
ngatio
nof
long
chain
fatt
yacid
s(F
EN
1/E
lo2,
SU
R4/E
lo3
–lik
e,
yeast)
ELO
VL5
6p21.1
–p12.1
.076258333
Dow
n210609_s_at
Hs.5
0649
Tum
or
pro
tein
p53
–in
ducib
lepro
tein
3TP53I3
2p23.3
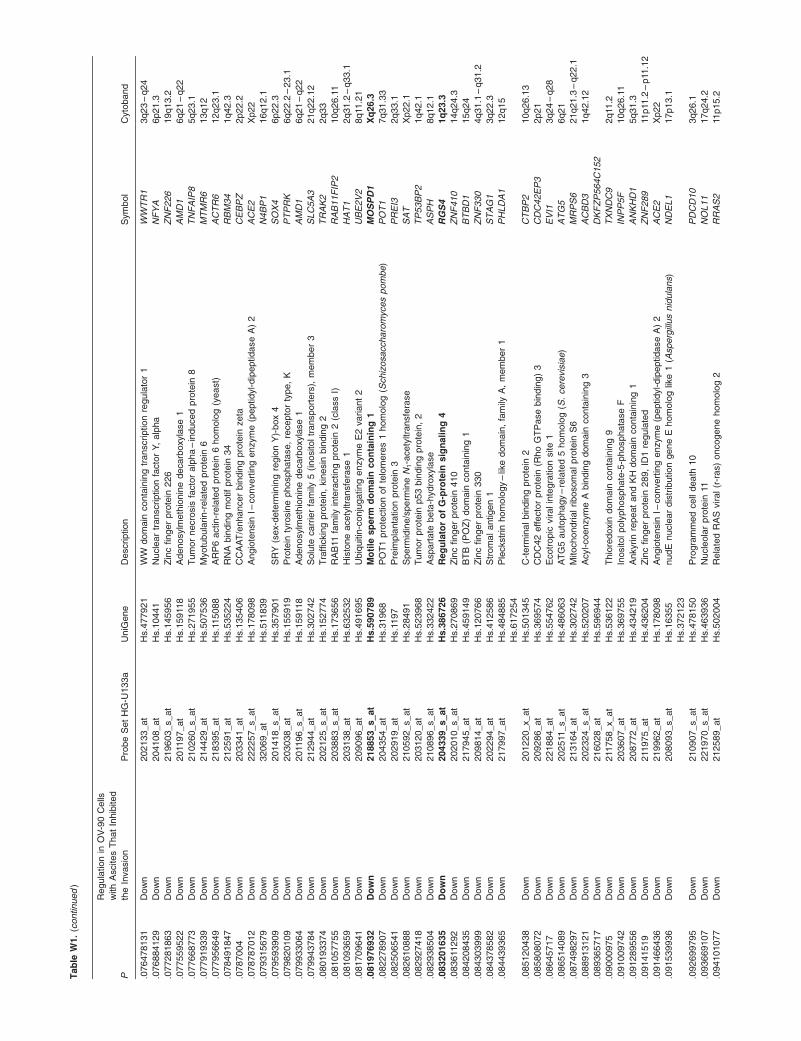
Tab
leW
1.
(contin
ued
)
P
Regula
tion
inO
V-9
0C
ells
with
Ascite
sT
hat
Inhib
ited
the
Invasio
nP
robe
Set
HG
-U133a
UniG
ene
Descriptio
nS
ym
bol
Cyto
band
.076478131
Dow
n202133_at
Hs.4
77921
WW
dom
ain
conta
inin
gtr
anscriptio
nre
gula
tor
1WWTR1
3q23
–q24
.076884129
Dow
n204108_at
Hs.1
0441
Nucle
ar
transcriptio
nfa
cto
rY,
alp
ha
NFYA
6p21.3
.077281863
Dow
n219603_s_at
Hs.1
45956
Zin
cfin
ger
pro
tein
226
ZNF226
19q13.2
.077559522
Dow
n2011
97_at
Hs.1
5911
8A
denosylm
eth
ionin
edecarb
oxyla
se
1AMD1
6q21
–q22
.077668773
Dow
n210260_s_at
Hs.2
71955
Tum
or
necro
sis
facto
ralp
ha
–in
duced
pro
tein
8TNFAIP8
5q23.1
.077919339
Dow
n214429_at
Hs.5
07536
Myotu
bula
rin-r
ela
ted
pro
tein
6MTMR6
13q12
.077956649
Dow
n218395_at
Hs.1
15088
AR
P6
actin
-rela
ted
pro
tein
6hom
olo
g(y
east)
ACTR6
12q23.1
.078491847
Dow
n212591_at
Hs.5
35224
RN
Abin
din
gm
otif
pro
tein
34
RBM34
1q42.3
.0787004
Dow
n203341_at
Hs.1
35406
CC
AA
T/e
nhancer
bin
din
gpro
tein
zeta
CEBPZ
2p22.2
.078787012
Dow
n222257_s_at
Hs.1
78098
Angio
tensin
I–convert
ing
enzym
e(p
eptid
yl-dip
eptid
ase
A)
2ACE2
Xp22
.079315679
Dow
n32069_at
Hs.5
11839
N4BP1
16q12.1
.079593909
Dow
n201418_s_at
Hs.3
57901
SR
Y(s
ex-d
ete
rmin
ing
regio
nY
)-box
4SOX4
6p22.3
.079820109
Dow
n203038_at
Hs.1
55919
Pro
tein
tyro
sin
ephosphata
se,
recepto
rty
pe,
KPTPRK
6q22.2
–23.1
.079933064
Dow
n2011
96_s_at
Hs.1
5911
8A
denosylm
eth
ionin
edecarb
oxyla
se
1AMD1
6q21
–q22
.079943784
Dow
n212944_at
Hs.3
02742
Solu
tecarr
ier
fam
ily5
(inosito
ltr
ansport
ers
),m
em
ber
3SLC5A3
21q22.1
2
.080193374
Dow
n202125_s_at
Hs.1
52774
Tra
ffic
kin
gpro
tein
,kin
esin
bin
din
g2
TRAK2
2q33
.081057755
Dow
n203883_s_at
Hs.1
73656
RA
B11
fam
ilyin
tera
ctin
gpro
tein
2(c
lass
I)RAB11FIP2
10q26.1
1
.081093659
Dow
n203138_at
Hs.6
32532
His
tone
acety
ltransfe
rase
1HAT1
2q31.2
–q33.1
.081709641
Dow
n209096_at
Hs.4
91695
Ubiq
uiti
n-c
onju
gating
enzym
eE
2variant
2UBE2V2
8q11
.21
.081976932
Do
wn
218853_s_at
Hs.5
90789
Mo
tile
sp
erm
do
main
co
nta
inin
g1
MOSPD1
Xq
26.3
.082278907
Dow
n204354_at
Hs.3
1968
PO
T1
pro
tectio
nof
telo
mere
s1
hom
olo
g(Schizosaccharomycespombe)
POT1
7q31.3
3
.082506541
Dow
n202919_at
Hs.1
197
Pre
impla
nta
tion
pro
tein
3PREI3
2q33.1
.082610888
Dow
n210592_s_at
Hs.2
8491
Sperm
idin
e/s
pe
rmin
eN
1-a
cety
ltransfe
rase
SAT
Xp22.1
.082927418
Dow
n203120_at
Hs.5
23968
Tum
or
pro
tein
p53
bin
din
gpro
tein
,2
TP53BP2
1q42.1
.082938504
Dow
n210896_s_at
Hs.3
32422
Aspart
ate
beta
-hydro
xyla
se
ASPH
8q12.1
.083201635
Do
wn
204339_s_at
Hs.3
86726
Reg
ula
tor
of
G-p
rote
insig
nali
ng
4RGS4
1q
23.3
.083611
292
Dow
n202010_s_at
Hs.2
70869
Zin
cfin
ger
pro
tein
410
ZNF410
14q24.3
.084208435
Dow
n217945_at
Hs.4
59149
BT
B(P
OZ
)dom
ain
conta
inin
g1
BTBD1
15q24
.084303999
Dow
n209814_at
Hs.1
20766
Zin
cfin
ger
pro
tein
330
ZNF330
4q31.1
–q31.2
.084378582
Dow
n202294_at
Hs.4
12586
Str
om
al
antig
en
1STAG1
3q22.3
.084439365
Dow
n217997_at
Hs.4
84885
Ple
ckstr
inhom
olo
gy
–lik
edom
ain
,fa
mily
A,
mem
ber
1PHLDA1
12q15
Hs.6
17254
.085120438
Dow
n201220_x_at
Hs.5
01345
C-t
erm
inal
bin
din
gpro
tein
2CTBP2
10q26.1
3
.085808072
Dow
n209286_at
Hs.3
69574
CD
C42
effecto
rpro
tein
(Rho
GT
Pase
bin
din
g)
3CDC42EP3
2p21
.08645717
Dow
n221884_at
Hs.5
54762
Ecotr
opic
viralin
tegra
tion
site
1EVI1
3q24
–q28
.086514089
Dow
n202511
_s_at
Hs.4
86063
AT
G5
auto
phagy
–re
late
d5
hom
olo
g(S
.cerevisiae
)ATG5
6q21
.087498297
Dow
n213164_at
Hs.3
02742
Mito
chondrial
ribosom
al
pro
tein
S6
MRPS6
21q21.3
–q22.1
.088913121
Dow
n202324_s_at
Hs.5
20207
Acyl-coenzym
eA
bin
din
gdom
ain
conta
inin
g3
ACBD3
1q42.1
2
.089365717
Dow
n216028_at
Hs.5
96944
DKFZP564C152
.09000975
Dow
n211
758_x_at
Hs.5
36122
Thio
redoxin
dom
ain
conta
inin
g9
TXNDC9
2q11
.2
.091009742
Dow
n203607_at
Hs.3
69755
Inosito
lpoly
phosphate
-5-p
hosphata
se
FINPP5F
10q26.1
1
.091289556
Dow
n208772_at
Hs.4
34219
Ankyrin
repeat
and
KH
dom
ain
conta
inin
g1
ANKHD1
5q31.3
.09141519
Dow
n211
975_at
Hs.4
36204
Zin
cfin
ger
pro
tein
289,
ID1
regula
ted
ZNF289
11p11
.2–
p11
.12
.091466436
Dow
n219962_at
Hs.1
78098
Angio
tensin
I–convert
ing
enzym
e(p
eptid
yl-dip
eptid
ase
A)
2ACE2
Xp22
.091539936
Dow
n208093_s_at
Hs.1
6355
nudE
nucle
ar
dis
trib
utio
ngene
Ehom
olo
glik
e1
(Aspergillusnidulans)
NDEL1
17p13.1
Hs.3
72123
.092699795
Dow
n210907_s_at
Hs.4
78150
Pro
gra
mm
ed
cell
death
10
PDCD10
3q26.1
.093669107
Dow
n221970_s_at
Hs.4
63936
Nucle
ola
rpro
tein
11NOL11
17q24.2
.094101077
Dow
n212589_at
Hs.5
02004
Rela
ted
RA
Sviral(r
-ras)
oncogene
hom
olo
g2
RRAS2
11p15.2

.094697368
Dow
n219974_x_at
Hs.4
86410
Enoylcoenzym
eA
hydra
tase
dom
ain
conta
inin
g1
ECHDC1
6q22.3
3
.094809596
Dow
n222138_s_at
Hs.5
21973
WD
repeat
dom
ain
13
WDR13
Xp11
.23
.095015393
Dow
n200961_at
Hs.1
18725
Sele
nophosphate
synth
eta
se
2SEPHS2
16p11
.2
.095206438
Dow
n201427_s_at
Hs.2
75775
Sele
nopro
tein
P,
pla
sm
a,
1SEPP1
5q31
Hs.6
43494
.095716917
Dow
n221786_at
Hs.4
35933
Chro
mosom
e6
open
readin
gfr
am
e120
C6orf120
6q27
Hs.5
91375
.096224309
Dow
n221547_at
Hs.1
611
81
PR
P18
pre
-mR
NA
pro
cessin
gfa
cto
r18
hom
olo
g(S.cerevisiae
)PRPF18
10p13
.096395443
Dow
n208961_s_at
Hs.4
055
Kru
ppel-lik
efa
cto
r6
KLF6
10p15
.096791953
Dow
n205354_at
Hs.8
1131
Guanid
inoaceta
teN
-meth
yltr
ansfe
rase
GAMT
19p13.3
.097014688
Dow
n218839_at
Hs.2
34434
Hairy/e
nhancer-
of-
split
rela
ted
with
YR
PW
motif
1HEY1
8q21
.09727472
Dow
n219137_s_at
Hs.4
71528
Chro
mosom
e2
open
readin
gfr
am
e33
C2orf33
2q36.3
.098024766
Dow
n211
506_s_at
Hs.6
24
Inte
rleukin
8IL8
4q13
–q21
Hs.4
43948
Hs.4
49585
Hs.5
51925
Hs.5
61078
.099035679
Dow
n201791_s_at
Hs.5
03134
7-D
ehydro
chole
ste
rolre
ducta
se
DHCR7
11q13.2
–q13.5
.099690261
Dow
n204881_s_at
Hs.3
04249
UD
P–
glu
cose
cera
mid
eglu
cosyltr
ansfe
rase
UGCG
9q31
Hs.5
93014
.099764699
Dow
n202542_s_at
Hs.5
91680
Sm
all
inducib
lecyto
kin
esubfa
mily
E,
mem
ber
1(e
ndoth
elia
l
monocyte
-activ
atin
g)
SCYE1
4q24
.099913337
Dow
n210559_s_at
Hs.3
34562
Cell
div
isio
ncycle
2,
G1
toS
and
G2
toM
CDC2
10q21.1
.099922386
Dow
n220547_s_at
Hs.5
00419
Fam
ilyw
ithsequence
sim
ilarity
35,
mem
ber
AFAM35A
10q23.2
.0011
26617
Up
206561_s_at
Hs.1
16724
Ald
o–
keto
reducta
se
fam
ily1,
mem
ber
B10
(ald
ose
reducta
se)
AKR1B10
7q33
.00261037
Up
201224_s_at
Hs.1
8192
Serine/a
rgin
ine
repetit
ive
matr
ix1
SRRM1
1p36.1
1
.003250785
Up
219161_s_at
Hs.1
5159
Chem
okin
e-lik
efa
cto
rCKLF
16q21
.004857387
Up
209160_at
Hs.7
8183
Ald
o–
keto
reducta
se
fam
ily1,
mem
ber
C3
(3-a
lpha
hydro
xyste
roid
dehydro
genase,
type
II)
AKR1C3
10p15
–p14
.007192628
Up
202595_s_at
Hs.1
46585
Leptin
recepto
roverlappin
gtr
anscript–
like
1LEPROTL1
8p21.2
–p21.1
.007559525
Up
218755_at
Hs.7
3625
Kin
esin
fam
ilym
em
ber
20A
KIF20A
5q31
.008187471
Up
214711
_at
Hs.3
69624
15E1.2
12q24.3
1
.010930189
Up
208699_x_at
Hs.8
9643
Tra
nsketo
lase
(Wern
icke-K
ors
akoff
syndro
me)
TKT
3p14.3
.011257353
Up
216971_s_at
Hs.4
34248
Ple
cti
n1,
inte
rmed
iate
fila
men
tb
ind
ing
pro
tein
500
kD
aPLEC1
8q
24
.011
376131
Up
202589_at
Hs.5
92338
Thym
idyla
tesynth
eta
se
TYMS
18p11
.32
.014883308
Up
213002_at
Hs.5
19909
Myri
sto
yla
ted
ala
nin
e-r
ich
pro
tein
kin
ase
Csu
bstr
ate
MARCKS
6q
22.2
.015913145
Up
212804_s_at
Hs.4
95134
GT
Pase-a
ctiv
ating
pro
tein
and
VP
S9
dom
ain
s1
GAPVD1
9q33.3
.018202268
Up
201328_at
Hs.5
17296
v-e
tsery
thro
bla
sto
sis
virus
E26
oncogene
hom
olo
g2
(avia
n)
ETS2
21q22.3
.018385256
Up
214101_s_at
Hs.4
43837
Am
inopeptid
ase
puro
mycin
-sensiti
ve
NPEPPS
17q21
.022757889
Up
204363_at
Hs.6
2192
Coagula
tion
facto
rII
I(t
hro
mbopla
stin
,tis
sue
facto
r)F3
1p22
–p21
.023172458
Up
201508_at
Hs.4
62998
Insulin
-lik
egro
wth
facto
rbin
din
gpro
tein
4IG
FBP4
17q12
–q21.1
.023408518
Up
201540_at
Hs.4
35369
Four
and
ahalf
LIM
dom
ain
s1
FHL1
Xq26
.023845409
Up
396_f_
at
Hs.3
75142
Ery
thro
poie
tinre
cepto
rEPOR
19p13.3
–p13.2
Hs.6
31624
.024106098
Up
212009_s_at
Hs.3
37295
Str
ess-induced
phosphopro
tein
1(H
sp70/H
sp90-o
rganiz
ing
pro
tein
)STIP1
11q13
.025879993
Up
217294_s_at
Hs.5
17145
Enola
se
1,
(alp
ha)
ENO1
1p36.3
–p36.2
.030350275
Up
209120_at
Hs.3
47991
Nucle
ar
recepto
rsubfa
mily
2,
gro
up
F,
mem
ber
2NR2F2
15q26
.030563305
Up
211
159_s_at
Hs.5
33308
Pro
tein
phosphata
se
2,
regula
tory
subunit
B(B
56),
delta
isofo
rmPPP2R5D
6p21.1
.031970709
Up
203925_at
Hs.3
15562
Glu
tam
ate
–cyste
ine
ligase,
modifi
er
subunit
GCLM
1p22.1
.032952351
Up
201946_s_at
Hs.1
89772
Chapero
nin
conta
inin
gT
CP
1,
subunit
2(b
eta
)CCT2
12q15
.033839191
Up
216348_at
Hs.4
33427
Rib
osom
al
pro
tein
S17
RPS17
15q
Hs.5
911
17
.034984241
Up
201715_s_at
Hs.1
24490
Apopto
ticchro
matin
condensatio
nin
ducer
1ACIN1
14q11
.2
.036651891
Up
217445_s_at
Hs.4
73648
Phosphoribosylg
lycin
am
ide
form
yltr
ansfe
rase
GART
21q22.1

Tab
leW
1.
(contin
ued
)
P
Regula
tion
inO
V-9
0C
ells
with
Ascite
sT
hat
Inhib
ited
the
Invasio
nP
robe
Set
HG
-U133a
UniG
ene
Descriptio
nS
ym
bol
Cyto
band
Phosphoribosylg
lycin
am
ide
synth
eta
se
Phosphoribosyla
min
oim
idazole
synth
eta
se
.03907979
Up
218516_s_at
Hs.5
91872.
Inosito
lm
onophosphata
se
dom
ain
conta
inin
g1
IMPAD1
8q12.1
Hs.5
95255
.040109269
Up
218726_at
Hs.5
32968
DKFZp762E1312
2q37.1
.042122483
Up
211
657_at
Hs.4
66814
Carc
inoem
bry
onic
antig
en
–re
late
dcell
adhesio
nm
ole
cule
6(n
onspecifi
c
cro
ss-r
eactin
gantig
en)
CEACAM6
19q13.2
.044612439
Up
210567_s_at
Hs.2
3348
S-p
hase
kin
ase-a
ssocia
ted
pro
tein
2(p
45)
SKP2
5p13
.045719671
Up
205729_at
Hs.1
20658
Oncosta
tinM
recepto
rOSMR
5p13.1
.048046212
Up
216603_at
Hs.6
32348
Solu
tecarr
ier
fam
ily7
(catio
nic
am
ino
acid
transport
er,
y+
syste
m),
mem
ber
8
SLC7A8
14q11
.2
.048541567
Up
221520_s_at
Hs.5
24571
Cell
div
isio
ncycle
–associa
ted
8CDCA8
1p34.3
.050464722
Up
201555_at
Hs.1
79565
MC
M3
min
ichro
mosom
em
ain
tenance-d
efic
ient
3(S.cerevisiae
)MCM3
6p12
.050727362
Up
206055_s_at
Hs.5
28763
Sm
all
nucle
ar
ribonucle
opro
tein
poly
peptid
eAV
SNRPA1
15q26.3
.051366041
Up
204962_s_at
Hs.1
594
Centr
om
ere
pro
tein
ACENPA
2p24
–p21
.056793421
Up
209339_at
Hs.4
77959
Seven
inabsentia
hom
olo
g2
(Drosophila
)SIAH2
3q25
.056873703
Up
209142_s_at
Hs.4
62035
Ubiq
uiti
n-c
onju
gating
enzym
eE
2G
1(U
BC
7hom
olo
g,
yeast)
UBE2G1
1q42
.058777804
Up
215073_s_at
Hs.3
47991
Nucle
ar
recepto
rsubfa
mily
2,
gro
up
F,
mem
ber
2NR2F2
15q26
.060517092
Up
201978_s_at
Hs.2
10532
KIA
A0141
KIAA0141
5q31.3
.060749639
Up
213642_at
Hs.1
99739
Rib
osom
al
pro
tein
L27
RPL27
17q21.1
–q21.2
Hs.5
14196
.061262381
Up
204900_x_at
Hs.5
91715
Sin
3A
-associa
ted
pro
tein
,30
kD
aSAP30
4q34.1
.061541582
Up
213093_at
Hs.5
31704
Pro
tein
kin
ase
C,
alp
ha
PRKCA
17q22
–q23.2
Hs.6
37776
.062594025
Up
212135_s_at
Hs.3
43522
AT
Pase,
Ca
2+
transport
ing,
pla
sm
am
em
bra
ne
4ATP2B4
1q32.1
.062847997
Up
205008_s_at
Hs.1
29867
Calc
ium
and
inte
grin
bin
din
gfa
mily
mem
ber
2CIB2
15q24
.064320779
Up
220633_s_at
Hs.1
42442
Hete
rochro
matin
pro
tein
1,
bin
din
gpro
tein
3HP1BP3
1p36.1
2
.065638186
Up
203581_at
Hs.2
96169
RA
B4A
,m
em
ber
RA
Soncogene
fam
ilyRAB4A
1q42
–q43
.066286963
Up
218753_at
Hs.5
5024
XK
,K
ell
blo
od
gro
up
com
ple
xsubunit
–re
late
dfa
mily
,m
em
ber
8XKR8
1p35.3
.0666011
08
Up
201912_s_at
Hs.5
28780
G1
toS
phase
transiti
on
1GSPT1
16p13.1
.067445733
Up
209101_at
Hs.5
91346
Connectiv
etis
sue
gro
wth
facto
rCTGF
6q23.1
.067510121
Up
217144_at
Hs.3
56190
Ubiq
uiti
nB
UBB
17p12
–p11
.2
.06804711
3U
p208781_x_at
Hs.1
2102
Sort
ing
nexin
3SNX3
6q21
.068892541
Up
205673_s_at
Hs.1
9404
Ankyrin
repeat
and
SO
CS
box
–conta
inin
g9
ASB9
.068897609
Up
200653_s_at
Hs.2
82410
Calm
odulin
1(p
hosphory
lase
kin
ase,
delta
)CALM1
14q24
–q31
.068938006
Up
211
410_x_at
Hs.6
43606
Kill
er
cell
imm
unoglo
bulin
–lik
ere
cepto
r,tw
odom
ain
s,
long
cyto
pla
sm
ic
tail,
5A
KIR2DL5A
19p13.3

.06902663
Up
203744_at
Hs.1
911
4H
igh-m
obili
tygro
up
box
3HMGB3
Xq28
.070332508
Up
213803_at
Hs.5
32793
Kary
opherin
(im
port
in)
beta
1KPNB1
17q21.3
2
.072861566
Up
201088_at
Hs.5
94238
Kary
opherin
alp
ha
2(R
AG
cohort
1,
import
inalp
ha
1)
KPNA2
17q23.1
–q23.3
.073174705
Up
219336_s_at
Hs.5
00007
Activ
atin
gsig
nalcoin
tegra
tor
1com
ple
xsubunit
1ASCC1
10pte
r–q25.3
.073421992
Up
204174_at
Hs.5
07658
Ara
chid
onate
5-lip
oxygenase
–activ
atin
gpro
tein
ALOX5AP
13q12
.074525606
Up
2011
82_s_at
Hs.1
62233
Chro
modom
ain
helic
ase
DN
Abin
din
gpro
tein
4CHD4
12p13
.075211
814
Up
200709_at
Hs.4
71933
FK
506
bin
din
gpro
tein
1A
,12
kD
aFKBP1A
20p13
.075504884
Up
210052_s_at
Hs.2
44580
TP
X2
mic
rotu
bule
-associa
ted
hom
olo
g(Xenopuslaevis
)TPX2
20q11
.2
.07569381
Up
20811
3_x_at
Hs.4
58280
Poly
(A)
bin
din
gpro
tein
,cyto
pla
sm
ic3
PABPC3
13q12
–q13
.077198877
Up
212016_s_at
Hs.1
72550
Poly
pyrim
idin
etr
act
bin
din
gpro
tein
1PTBP1
19p13.3
.079810692
Up
212074_at
Hs.4
38072
Unc-8
4hom
olo
gA
(Caenorhabditiselegans)
UNC84A
7p22.3
.0828011
03
Up
210754_s_at
Hs.4
91767
v-y
es-1
Yam
aguchi
sarc
om
aviral–
rela
ted
oncogene
hom
olo
gLYN
8q13
Hs.6
14775
.08285677
Up
206155_at
Hs.3
68243
AT
P-b
indin
gcassett
e,
subfa
mily
C(C
FT
R/M
RP
),m
em
ber
2ABCC2
10q24
.083154934
Up
213671_s_at
Hs.6
32707
Meth
ionin
e-t
RN
Asynth
eta
se
MARS
12q13.2
.084684756
Up
212064_x_at
Hs.2
3650
MY
C-a
ssocia
ted
zin
cfin
ger
pro
tein
(purine-b
indin
gtr
anscriptio
nfa
cto
r)MAZ
16p11
.2
.085140368
Up
202974_at
Hs.4
96984
Mem
bra
ne
pro
tein
,palm
itoyla
ted
1,
55
kD
aMPP1
Xq28
.08611
8323
Up
222231_s_at
Hs.3
70927
Leucin
e-r
ich
repeat
conta
inin
g59
LRRC59
17q21.3
3
.08648983
Up
208624_s_at
Hs.4
33750
Eukary
otic
transla
tion
initi
atio
nfa
cto
r4
gam
ma,
1EIF4G1
3q27
–qte
r
.088237636
Up
205905_s_at
Hs.7
7961
MH
Ccla
ss
Ipoly
peptid
e–
rela
ted
sequence
AMICA
6p21.3
Hs.5
49053
.089037251
Up
211
653_x_at
Hs.4
60260
Ald
o–
keto
reducta
se
fam
ily1,
mem
ber
C2
(dih
ydro
dio
ldehydro
genase
2;
bile
acid
bin
din
gpro
tein
;3-a
lpha
hydro
xyste
roid
dehydro
genase,
type
III)
AKR1C2
10p15
–p14
Hs.5
67256
.089916902
Up
212379_at
Hs.4
73648
Phosphoribosylg
lycin
am
ide
form
yltr
ansfe
rase
GART
21q22.1
Phosphoribosylg
lycin
am
ide
synth
eta
se
Phosphoribosyla
min
oim
idazole
synth
eta
se
.090303455
Up
220363_s_at
Hs.2
10469
Engulfm
ent
and
cell
motil
ity2
ELMO2
20q13
.091459911
Up
211
984_at
Hs.2
82410
Calm
odulin
1(p
hosphory
lase
kin
ase,
delta
)CALM1
14q24
–q31
.091528808
Up
202032_s_at
Hs.1
16459
Mannosid
ase,
alp
ha,
cla
ss
2A
,m
em
ber
2MAN2A2
15q26.1
.093413146
Up
206665_s_at
Hs.5
16966
BC
L2-lik
e1
BCL2L1
20q11
.21
.093798599
Up
204030_s_at
Hs.1
34665
Schw
annom
inin
tera
ctin
gpro
tein
1SCHIP1
3q25.3
3
.094856181
Up
205687_at
Hs.3
459
UBPH
16p12
.096611
542
Up
202275_at
Hs.4
61047
Glu
cose-6
-phosphate
dehydro
genase
G6PD
Xq28
.097379811
Up
217356_s_at
Hs.7
8771
Phosphogly
cera
tekin
ase
1PGK1
Xq13
.0974342
Up
202122_s_at
Hs.1
40452
Mannose-6
-phosphate
recepto
rbin
din
gpro
tein
1M6PRBP1
19p13.3
.098406916
Up
40093_at
Hs.1
10675
Basalcell
adhesio
nm
ole
cule
(Luth
era
nblo
od
gro
up)
BCAM
19q13.2
The
GS
TIM
UL
gro
up
consis
tsofO
V-9
0sam
ple
sw
ithno
FB
S,w
ith5%
FB
S,or
with
5%
ofth
efo
ur
ascite
sth
atstim
ula
ted
cell
invasio
n(A
1592,A
1946,A
2085,and
A2090).
The
GIN
HIB
gro
up
consis
tsofO
V-9
0sam
ple
sw
ith5%
of
the
six
ascite
sth
at
inhib
ited
cell
invasio
n(A
1317,
A1318,
A1322,
A1322(2
),A
1337,
and
A1835).
Genes
furt
her
chara
cte
rized
inth
isstu
dy
are
inb
old
.
Copyright © 2022 FDOKUMEN