Che: "Managing cancer and self-employment". (2014) Breast Cancer Consortium Quarterly.
Upload
independentCategory
view
2download
0
Wintzell et al. BMC Cancer 2012, 12:359http://www.biomedcentral.com/1471-2407/12/359
RESEARCH ARTICLE Open Access
Protein markers of cancer-associated fibroblastsand tumor-initiating cells reveal subpopulationsin freshly isolated ovarian cancer ascitesMy Wintzell1, Elisabet Hjerpe2, Elisabeth Åvall Lundqvist2 and Maria Shoshan1*
Abstract
Background: In ovarian cancer, massive intraperitoneal dissemination is due to exfoliated tumor cells in ascites.Tumor-initiating cells (TICs or cancer stem cells) and cells showing epithelial-mesenchymal-transition (EMT) areparticularly implicated. Spontaneous spherical cell aggregates are sometimes observed, but although similar tothose formed by TICs in vitro, their significance is unclear.
Methods: Cells freshly isolated from malignant ascites were separated into sphere samples (S-type samples, n=9)and monolayer-forming single-cell suspensions (M-type, n=18). Using western blot, these were then compared forexpression of protein markers of EMT, TIC, and of cancer-associated fibroblasts (CAFs).
Results: S-type cells differed significantly from M-type by expressing high levels of E-cadherin and no or littlevimentin, integrin-β3 or stem cell transcription factor Oct-4A. By contrast, M-type samples were enriched for CD44,Oct-4A and for CAF markers. Independently of M- and S-type, there was a strong correlation between TIC markersNanog and EpCAM. The CAF marker α-SMA correlated with clinical stage IV. This is the first report on CAF markersin malignant ascites and on SUMOylation of Oct-4A in ovarian cancer.
Conclusions: In addition to demonstrating potentially high levels of TICs in ascites, the results suggest that theS-type population is the less tumorigenic one. Nanoghigh/EpCAMhigh samples represent a TIC subset which may beeither M- or S-type, and which is separate from the CD44high/Oct-4Ahigh subset observed only in M-type samples.This demonstrates a heterogeneity in TIC populations in vivo which has practical implications for TIC isolation basedon cell sorting. The biological heterogeneity will need to be addressed in future therapeutical strategies.
Keywords: Ovarian carcinoma, Dissemination ascites, Cancer-associated fibroblasts, Tumor-initiating cells, EMT
BackgroundMost patients with epithelial ovarian carcinoma (EOC)are diagnosed with stage III or IV disease, i.e., whendissemination is already at hand. Along with rapiddevelopment of chemoresistant disease, this brings downthe 5-year disease-specific survival in EOC to 50% [1].Dissemination is mainly abdominal via tumor cells in as-cites. These are likely enriched for aggressive cells thatmay have exfoliated not only from an excised primarytumor but also from established and often numerousmetastases.
* Correspondence: [email protected] of Oncology-Pathology, Cancer Center Karolinska CCK R8:03Karolinska Institutet, Stockholm S-171 76, SwedenFull list of author information is available at the end of the article
© 2012 Wintzell et al.; licensee BioMed CentraCommons Attribution License (http://creativecreproduction in any medium, provided the or
Ascitic ovarian cancer cells are proposed to undergoepithelial-to-mesenchymal-transition (EMT) to a motilephenotype with low levels of E-cadherin and higherinvasivity than the primary tumor cells [2,3]. They arethus similar to blood- or lymph-borne circulating tumorcells from other types of carcinoma. They are similaralso in that they represent a less studied but phenotypic-ally and pathologically progressed stage compared to theprimary tumors.Of importance for the present study, ascitic tumor
cells may occur as single-cell suspensions and sheet-likecell aggregates, but occasionally also as compact spheresin which individual cells cannot be discerned. Althoughspheres have been associated with invasivity, e.g., inin vitro models using artificially created spheroids from
l Ltd. This is an Open Access article distributed under the terms of the Creativeommons.org/licenses/by/2.0), which permits unrestricted use, distribution, andiginal work is properly cited.
Wintzell et al. BMC Cancer 2012, 12:359 Page 2 of 10http://www.biomedcentral.com/1471-2407/12/359
cell lines [4-6], these in vivo populations have not beenextensively characterized. Interestingly,”collective migra-tion” of multicellular clusters of cancer cells has beendescribed as an enhanced type of metastatic behavior inbreast and colon cancer [7].Sphere formation in vitro, dissemination and chemore-
sistance are in turn features associated with cancer stemcells or tumor-initiating cells (TICs). TICs are nowregarded as a major cause of relapse in chemoresistantcancer, and thus need to be identified both for prognos-tic and therapeutic purposes [8-10]. In the experimentalin vitro setting, TIC identity is commonly based onexpression of two or three of a set of markers, and isverified based on high tumorigenicity and/or serialtransplantation in nude mice. Irrespective of whetherTICs originate from stem cells or from a certain subpo-pulation of cancer cells, they are regulated not only bygenetic but also by epigenetic and adaptational events[11]. As part of adaptation to hypoxia, both TICs andnormal stem cells depend on glycolysis rather thanmitochondrial respiration for ATP. Importantly, hypoxiahas been shown to promote tumor”stemness” as well asEMT [12,13], suggesting that in ascitic EOC spheres,the hypoxic interior might enrich for TICs.Cancer-associated fibroblasts (CAFs) represent yet
another parameter contributing to invasivity, metastasisand chemoresistance [14]. Immunohistochemical ana-lysis has shown absence of the CAF marker smoothmuscle actin (α-SMA) in normal ovarian tissue, whereasthe stroma of metastatic EOC tumors abounded inCAFs [15].To explore the molecular pathology of EOC ascitic
cell populations, we have here examined spheres andsingle-cell populations that were isolated directly frompatients. The samples were compared in terms ofexpression of metabolic, EMT, TIC and CAF markers,and analysed by western blot in order to specifically as-sess the net outcome of genetic, epigenetic and post-translational effects. Importantly, freshly isolated humanEOC ascitic samples were used rather than subculturedclones or cell lines, in which pheno- and genotypic driftis a wellknown problem. As metabolic marker we usedmitochondrial β-F1-ATPsynthase, which reflects mito-chondrial oxidative respiration and is downregulated atthe mRNA level in cancer cells [16]. It has prognosticpower on its own and in a ratio to Hsp60, i.e., as a bio-energetic cell (BEC) index shown to be indicative of lowmitochondrial respiration and worse prognosis in, e.g.,breast, lung and head-and-neck cancer [17,18]. We alsoexamined the mitochondrial transcription factor A,TFAM, as it correlates with cellular mitochondrial con-tent [19,20] and hence indirectly with oxidative metab-olism. With regard to EMT and motility, we examinedE-cadherin and vimentin as standard markers of
epithelial and mesenchymal cells, respectively [7]. ForCAF markers, we used α-SMA and the receptor forPDGFβ (PDGFβR) [14,15].The significance and use of TIC markers requires
some consideration. For cell sorting/isolation purposes,the surface proteins CD44, CD117 [10,21,22] andEpCAM [23,24] are convenient antibody targets. Theyalso have intriguing dual functions as adhesion mole-cules as well as receptors [11]. In TICs isolated fromprimary breast cancer, shRNA-mediated knockdownof CD44 led to decreased expression of stemness-associated genes and to loss of tumorigenicity [25].CD133 is another common TIC marker, including inEOC [26]. However, CD133 has been questioned asa marker of tumor-initiating capability in EOC[22,27], and there is uncertainty as to the roles ofdifferent splice and glycosylation forms and differentantibody clones [28,29].TICs are also characterized by transcription factors
that are essential for stem cell self-renewal and pluripo-tency, and which include Nanog and Oct-4A [10,11,22].Several studies have used combinations of surface andintracellular markers, e.g., CD44, CD117, Nanog andOct-4 to characterize TICs derived from experimentalEOC spheroids created in vitro [10]. The same reportalso used ABCG2, the membrane efflux pump whichdefines a side population enriched for TICs [30-32] andwhich contributes to chemotherapy resistance [33].In summary, it is clear that the biology and molecular
pathology of malignant ascites are of importance for theunderstanding and treatment of this deadly disease [6].There is, however, still a dearth of information on asciticcell subpopulations in vivo, i.e., isolated directly frompatients. Based on such material and on protein markerprofiles reflecting known phenotypic traits, our resultsindicate potentially very high levels of circulatingTIC-type cells in malignant ascites and demonstratethat ascitic spheres and monolayer-forming cells aretwo distinct in vivo populations with different tumori-genic potential, based on protein markers. For the firsttime, the presence in malignant ascites of cancer-associated fibroblasts is also indicated.
MethodsPatients, ascites and cell cultureMalignant ascites were collected from 22 ovarian cancerpatients (Table 1) at the Department of GynecologicOncology, Karolinska University Hospital. The studywas approved by the Regional Ethics Committee ofStockholm (EPN 2009/1897-31/1) and samples collectedwith the consent of the patients.Cells in the ascitic fluid were pelleted, resuspended in
PBS, and separated on a discontinuous gradient consist-ing of (bottom to top) Lymphoprep (Axis-Shield, Oslo,

Table 1 Clinicopathologic characteristics of cancerpatients (n = 22)
No (%)
Carcinoma diagnosis
Epithelial ovarian 13 (59)
Fallopian tube 2 (9)
Primary peritoneal 7 (32)
FIGO stage
IIIC 16 (73)
IV 6 (27)
Histologic subtype
Serous 19 (86)
Endometroid 1 (5)
Clear cell 1 (5)
Unclassified 1 (5)
Grade of differentiation
2 2 (9)
3 15 (68)
Not stated 5 (23)
Time of sampling
During 1st line platinum-based therapy
Chemosensitive 2 (9)
Refractory 1 (5)
Recurrence
PFI < 6 months
Before start of 1st course recurrence treatment 7 (32)
During chemotherapy period 12 (55)
Type of cells
M-type only 13 (59)
S-type only 4 (18)
M and S 5 (23)
Median age at diagnosis 66.5 years
PFI; platinum-free interval.
Wintzell et al. BMC Cancer 2012, 12:359 Page 3 of 10http://www.biomedcentral.com/1471-2407/12/359
Norway), Lymphoprep/Krebs HEPES Ring solution 3:1and Lymphoprep/Krebs HEPES Ring solution 1:2 (KrebsHEPES Ring solution: 137 mM NaCl, 5.4 mM KCl, 0.34mM Na2HPO4, 0.35 mM KH2PO4, 8 mM MgSO4, 1 mMHEPES pH 7.4). Cells were then centrifuged at 1,500 × gfor 20 min.Tumor cells were collected at the interphase between
the top and middle layer, washed and plated. Whenspheres were present, these were collected by aspirationthe day after. We define spheres as compact sphericalaggregates where individual cells cannot be discerned.Sheets/irregular aggregates of discernible and dispersiblecells have not been included in this category. All cells,including the ovarian cancer cell line SKOV-3, whichoriginates from malignant ascites, were kept at +37°C in
5% CO2 in RPMI1640 medium supplemented with10% fetal calf serum, 1% penicillin-streptomycin, 2 mML-glutamine (Nordic Biolabs AB, Täby, Sweden). Finally,for comparison with the physiological spheres frompatients, artificial spheroids were made in vitro fromfreshly isolated tumor cells using previously describedmethodology [34].
Western blot analysis and immunoprecipitationWhole-cell lysates of monolayer-forming cell samplesand spheres, respectively, were made either immedi-ately or after a maximum of one passage. This rapidanalysis is important for avoiding culture-inducedphenotypic drift. Protease and phosphatase inhibitorcocktails (P2714 and P5726; Sigma-Aldrich Sweden AB,Stockholm, Sweden) were added freshly to RIPA lysisbuffer (1% NP-40, 0.5% sodium deoxycholate, 0.1% so-dium dodecyl sulfate, 0.004% sodium azide). Sampleswere loaded for gel electrophoresis at 30 μg/sample.Aliquots of the one and same SKOV-3 lysate were runon each gel as an internal control. After separation,proteins were transferred onto PVDF membranes, con-firmed with Ponceau S staining. Membranes wereblocked for 1 h in 5% milk/PBS-Tween or 4% BSA/TBS-Tween. All antibodies were diluted in blockingagent. Membranes were incubated overnight at +4°Cwith primary antibodies and then for 1 h at roomtemperature with the appropriate HRP-conjugated sec-ondary antibody (see complete list of antibodies inAdditional file 1: Table S1). Images were developedwith Western Lightning Plus-ECL (PerkinElmer, Upp-lands Väsby, Sweden) and captured using Kodak M35X-omat processor. Densitometry results are based onmedian signals from raw-data tif-format images, andnormalized based on GAPDH levels and against thesame SKOV-3 lysate present on each membrane.For immunoprecipitation, whole-cell lysates were
incubated with primary antibody to Oct-4A or SUMO-1overnight at +4°C. Immunocomplexes were collectedusing Protein A/G PLUS-Agarose beads (Santa CruzBiotechnology), and were then washed four times inlysis buffer and further analyzed by western blotting.See complete list of antibodies in Additional file 1:Table S1.
StatisticsDensitometry data were analysed using the IBMSPSS statistics 20.0 software (IBM Corp. NY, USA).Shapiro-Wilk test was used to determine whether vari-ables/groups were normally distributed. Between-groupcomparisons were performed using the Independentt-test or Mann–Whitney U test, when appropriate.Spearman’s Rank Order correlation was used to testassociation between variables. In all tests, a two-tailed

Table 3 All significant correlations1, using Spearman’sRank Order correlation
Variables Spearman’scorrelationcoefficient(rs)
Significance(2-tailed)
CD44 Vimentin 0.810 <0.001 **
E-cadherin 100 K 0.676 <0.001 **
E-cadherin CD44 −0.528 0.005 **
E-cadherin Vimentin −0.692 <0.001 **
EpCAM 100 K 0.494 0.009 **
EpCAM β-F1-ATPsynthase 0.700 <0.001 **
Nanog EpCAM 0.694 <0.001 **
Nanog β-F1-ATPsynthase 0.432 0.024 *
Nanog 100 K 0.425 0.027 *1 All marker combinations were tested. Only those showing a significantcorrelation are shown.
Wintzell et al. BMC Cancer 2012, 12:359 Page 4 of 10http://www.biomedcentral.com/1471-2407/12/359
p-value < 0.05 was considered significant, and p-values<0.05 or <0.01 are represented with one and two aster-isks, respectively, in the figures. Relevant statistics arepresented in Tables 2 and 3. Due to lack of material,two samples (one M- and one S-type) could not beanalysed for expression of α-SMA and PDGFβ-R. Thiswas taken into account in the statistical analyses.
ResultsSome but not all ascitic cell samples containspontaneously formed spheresThe clinicopathologic characteristics of the 22 patientsare shown in Table 1. The majority was serous adenocar-cinoma and all patients had advanced stage of disease(FIGO stages IIIC or IV). Three of the cases were newlydiagnosed, of which one was platinum-refractory andtwo were chemosensitive, and 19 were in relapse.The ascitic samples contained single cells, loose sheet-
like aggregates and sometimes spheres (for definition,see Materials and Methods). Single-cell suspensions andeasily dispersed loose aggregates readily formed mono-layer cultures. Such samples are henceforth calledM-type, and the isolated spheres are henceforth calledS-type. In contrast to loose aggregates, the spheres could
Table 2 Statistical analysis of relative protein expression as based on densitometry
A. Comparison of M- and S-type samples, using Mann–Whitney U test/Independent t-test
Variable Sample size (n)Sample type
Median (IQR)1 Sample type Mann– Whitney U p-value Exact Sign.(2-tailed)
M S M S
β-F1-ATPsynth. 18 9 0.74 (0.76) 0.66 (0.86) 72.0 0.659
100 K 18 9 1.9 (9.6) 29 (33.15) 33.0 0.012 *
ABCG2 18 9 0.17 (0.63) 0.06 (0.26) 52.5 0.148
CD44 18 9 0.13 (0.20) 0.00 (0.00) 8.50 <0.001 **
E-cadherin 18 9 0.71 (5.2) 8.6 (7.2) 31.0 0.009 **
Nanog 18 9 0.52 (0.72) 0.92 (2.21) 70.5 0.605
Oct-4A 18 9 1.1 (3.0) 0.02 (0.48) 26.0 0.003 **
SUMO-Oct-4A 18 9 0.96 (1.0) 0.45 (0.80) 34.0 0.014 *
TFAM 18 9 0.77 (1.0) 0.51 (2.0) 79.0 0.929
Vimentin 18 9 0.69 (0.8) 0.05 (0.10) 11.0 <0.001 **
Variable Sample size (n)Sample type
Mean (± Std.deviation)Sample type
t-value p-value Signif.(2-tailed)
M S M S
α-SMA 17 8 1.8(±1.1) 0.86(±0.30) 3.042 0.0062 **
EpCAM 18 9 0.90(±0.47) 0.87(±0.44) 0.130 0.8973
Variable Sample size (n)Clinical stage
Mean (± Std.deviation)Clinical stage
t-value p-value Signif.(2-tailed)
IIIC IV IIIC IV
α-SMA 17 8 1.1(±0.67) 2.3(±0.46) −2.401 0.0062 **1 IQR: Inter-quartile range.2 Equal variances not assumed.3 Equal variances assumed.
E-cadh
GAPDH
SKOV3#29 #37 #44 #55
M S M S M S S
vim
GAPDH
SKOV3 #29 #37 #44 #55 M S M S M S S
#29 #37 M S AS M S AS
E-cadh
vim
GAPDH
integrin β3
GAPDH
SKOV-3
#44 #48M S M S
Rel
ative
exp
ress
ion
E-cadh vim
M S M S
9
6
3
12
15
21
.50
.25
1.00
.75
2.00
A.
D.
C.
B.
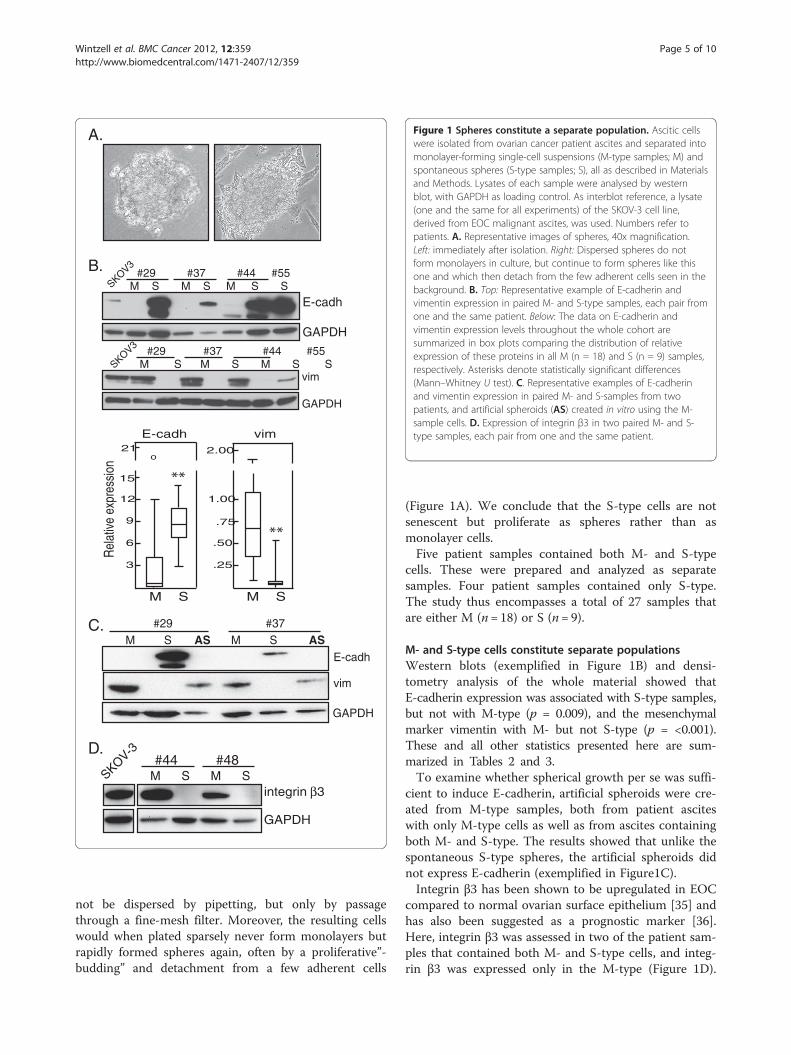
Figure 1 Spheres constitute a separate population. Ascitic cellswere isolated from ovarian cancer patient ascites and separated intomonolayer-forming single-cell suspensions (M-type samples; M) andspontaneous spheres (S-type samples; S), all as described in Materialsand Methods. Lysates of each sample were analysed by westernblot, with GAPDH as loading control. As interblot reference, a lysate(one and the same for all experiments) of the SKOV-3 cell line,derived from EOC malignant ascites, was used. Numbers refer topatients. A. Representative images of spheres, 40x magnification.Left: immediately after isolation. Right: Dispersed spheres do notform monolayers in culture, but continue to form spheres like thisone and which then detach from the few adherent cells seen in thebackground. B. Top: Representative example of E-cadherin andvimentin expression in paired M- and S-type samples, each pair fromone and the same patient. Below: The data on E-cadherin andvimentin expression levels throughout the whole cohort aresummarized in box plots comparing the distribution of relativeexpression of these proteins in all M (n = 18) and S (n = 9) samples,respectively. Asterisks denote statistically significant differences(Mann–Whitney U test). C. Representative examples of E-cadherinand vimentin expression in paired M- and S-samples from twopatients, and artificial spheroids (AS) created in vitro using the M-sample cells. D. Expression of integrin β3 in two paired M- and S-type samples, each pair from one and the same patient.
Wintzell et al. BMC Cancer 2012, 12:359 Page 5 of 10http://www.biomedcentral.com/1471-2407/12/359
not be dispersed by pipetting, but only by passagethrough a fine-mesh filter. Moreover, the resulting cellswould when plated sparsely never form monolayers butrapidly formed spheres again, often by a proliferative”-budding” and detachment from a few adherent cells
(Figure 1A). We conclude that the S-type cells are notsenescent but proliferate as spheres rather than asmonolayer cells.Five patient samples contained both M- and S-type
cells. These were prepared and analyzed as separatesamples. Four patient samples contained only S-type.The study thus encompasses a total of 27 samples thatare either M (n= 18) or S (n= 9).
M- and S-type cells constitute separate populationsWestern blots (exemplified in Figure 1B) and densi-tometry analysis of the whole material showed thatE-cadherin expression was associated with S-type samples,but not with M-type (p = 0.009), and the mesenchymalmarker vimentin with M- but not S-type (p = <0.001).These and all other statistics presented here are sum-marized in Tables 2 and 3.To examine whether spherical growth per se was suffi-
cient to induce E-cadherin, artificial spheroids were cre-ated from M-type samples, both from patient asciteswith only M-type cells as well as from ascites containingboth M- and S-type. The results showed that unlike thespontaneous S-type spheres, the artificial spheroids didnot express E-cadherin (exemplified in Figure1C).Integrin β3 has been shown to be upregulated in EOC
compared to normal ovarian surface epithelium [35] andhas also been suggested as a prognostic marker [36].Here, integrin β3 was assessed in two of the patient sam-ples that contained both M- and S-type cells, and integ-rin β3 was expressed only in the M-type (Figure 1D).

Wintzell et al. BMC Cancer 2012, 12:359 Page 6 of 10http://www.biomedcentral.com/1471-2407/12/359
Altogether, these results show that S-type and M-typecells constitute two separate populations.We initially hypothesized that due to internal hypoxia,
spheres would show lower levels of the mitochondrialproteins β-F1-ATPsynthase and/or TFAM. This wasrefuted, however, as M- and S-type did not differ withrespect to either protein (p = 0.659 and 0.929, respect-ively; Tables 2 and 3).
Higher levels of CAF markers in M-type samples correlatewith stage IV diseaseSmooth muscle actin (α-SMA) and PDGFβ-R expressioncharacterize activated cancer-associated fibroblasts [14].Significantly higher levels of α-SMA were observed inM- compared to S-type samples (p = 0.006) (Figure 2A-Band Tables 2 and 3). Moreover, 9/25 samples analyzedshowed PDGFβ-R expression, and all 9 were M-type(Figure 2A and not shown), and 8/9 samples expressingPDGFβ-R also expressed the ovarian cancer TIC markerCD44 and high levels of stem cell transcription factorOct-4A (not shown and see below).
A.
B.
SKOV-3
M S M S M S#29 #47 #48
PDGFβ-R
α−SMA
GAPDH
5
1
2
3
4
α-SMA α-SMA
M IIIc
Rel
ativ
e ex
pres
sion
S IVFigure 2 Presence of cancer-associated fibroblasts in ascites. Arepresentative western blots showing co-expression of PDGFβR andα-SMA in paired M- and S-samples from three patients. In total 9/25samples showed expression of PDGFβR, all of them M-type.Numbers refers to patients. B. Box plots comparing the distributionof relative expression of α-SMA in M- (n = 17) and S-type (n = 8)samples (left) and in samples representing clinical stage IIIC (n = 17)and IV (n = 8) at diagnosis (right). Asterisks denote statisticallysignificant difference (Independent t-test).
Alpha-SMA was significantly higher in samples frompatients diagnosed with stage IV compared to stage IIIC (p= 0.040). The clinical data (summarized in Table 1) wereused for examining associations between markers and, e.g.,time to progression, platinum-free interval, survival etc.We found that (p = 0.040) (Figure 2B; Tables 2 and 3). Noother significant correlation was found (not shown).
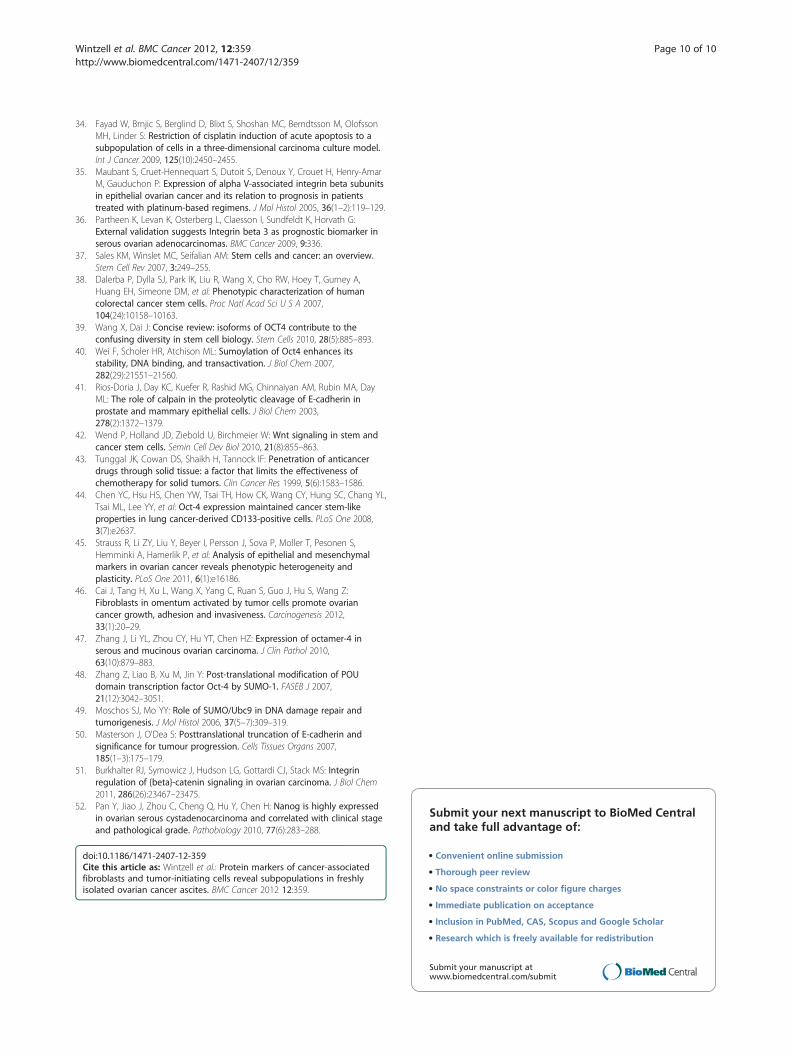
TIC surface markers: CD44 is expressed exclusively inM-type samplesThe TIC marker CD44 [15,23,37,38] was found only inM-type samples (p < 0.001) (exemplified in Figure 3A;Tables 2 and 3). Accordingly, it correlated inversely withE-cadherin expression (rs = −0.528, p = 0.005) andcorrelated strongly with vimentin expression (rs = 0.810,p = <0.001) (Table 2). By contrast, M- and S-type didnot differ with regard to TIC markers EpCAM [23,24]and ABCG2 [32] (p = 0.897 and 0.148, respectively;Table 2 and 3). CD117 was expressed in 4/27 samplesand was not further analysed.
TIC transcription factors: Oct-4A and SUMO-Oct4A levelsare higher in M-type samplesWe examined expression of stem cell transcription fac-tors Oct-4A and Nanog. Of the three isoforms of Oct-4,only Oct-4A is nuclear and crucial for stem cell renewal[39]. SUMOylation of Oct-4A is an important regulatorymechanism as it leads to increased stability and functionof the protein [40]. SUMO-Oct4A has to our knowledgenot been studied in ovarian cancer. We first identifiedthe SUMO-Oct4A band in SKOV-3 lysates using immu-noprecipitation of SUMO and Oct-4A, respectively, fol-lowed by western blotting for the same. A ~90 kDa bandcorresponded to SUMO-Oct4A (Figure 3B).In the patient samples, SUMO-Oct4A was observed at
varying levels in 24/27 samples while unmodified Oct-4Awas seen in 17/27 samples (exemplified in Figure 3C). M-type samples showed higher expression than did S-type ofOct-4A and SUMO-Oct-4A (p = 0.003 and 0.014, respect-ively) (Figure 3D; Tables 2 and 3). By contrast, M- and S-type did not differ with respect to Nanog (p = 0.605)(Figure 3D; Tables 2 and 3).There was a positive correlation between β-F1-
ATPsynthase and Nanog (rs = 0.432, p = 0.024; Tables 2and 3), and between β-F1-ATPsynthase and EpCAM (rs= 0.700, p = <0.001). Since Nanog and EpCAM also cor-relate (rs = 0.694, p = <0.001), there is an association be-tween these three markers, independently of sample type.
A cellular 100 kDa fragment of E-cadherin in S-typesamplesIn addition to these transcriptional factors, we notedthat in 13/27 samples E-cadherin was cleaved to a 100kDa fragment which can be seen in Figure 1B and 1C,

IP: Oct-4 SUMO m-IgGWB: Oct-4A Oct-4A Oct-4A
SUMO-Oct4A
Oct-4AIgG
A.
B.
3
2
1
10 o
4
o
3
1
2
14 o
Oct-4A SUMO-Oct-4A Nanog
M S M S M S
2
9 o
7
1
o
Rel
ativ
e ex
pres
sion
SKOV3 #47 #48 #34 #38 #39M S M S S S S
CD44
GAPDH
Oct-4A
GAPDH
SUMO-Oct4A
#50 #52 #54 #57SKOV3
#29 #37M S M SSKOV3
Oct-4A
GAPDH
SUMO-Oct4A
M M M M
D.
C.
Figure 3 TIC protein marker expression in M- and S-typesamples. A. Representative blot showing CD44 expression in M-and S-type samples. Based on all samples, CD44 was associated withM-type (p<0.001; Table 2). Numbers refer to patients. B. The SKOV-3cell line was used for immunoprecipitation with antibodies to Oct-4and to SUMO, respectively. Shown here is a representative westernblot of three immunoprecipitates made with antibodies to Oct-4,SUMO and mouse IgG, respectively, and which were then probedusing anti-Oct-4A. Mouse IgG served as negative control. SUMO-Oct-4A could be detected when probed with anti-SUMO (not shown).The results were confirmed using two other cell lines (not shown).Arrow: native ~40 kDa Oct-4A just above the 25 kDa IgG light chain.IP: immunoprecipitation; WB: western blot probe; m-IgG: mouse IgG.C. Oct-4A and SUMO-Oct-4A in M-type samples and paired samplesof M- and S-type. D. Box plots comparing the distribution of relativeexpression of Oct-4A, SUMO-Oct-4A and Nanog, respectively, in all M(n=18) and S (n=9) samples. Asterisks denote statistically significantdifferences (Mann–Whitney U test).
Wintzell et al. BMC Cancer 2012, 12:359 Page 7 of 10http://www.biomedcentral.com/1471-2407/12/359
and which we here call 100K. As argued in the Discus-sion section, this is likely the calpain-cleaved formshown by others to have lost the β- and γ-catenin bind-ing sites [41]. Such cleavage potentially leads to nucleartranslocation of β-catenin and Wnt signaling involved inTIC maintenance [42]. The 100 K form was significantlyhigher in S-type samples than in M-type (p = 0.012)and correlated with expression of EpCAM (rs = 0.494,p = 0.009), Nanog (rs = 0.425, p = 0.027) and E-cadherin(rs = 0.676, p = <0.001; Table 2 and 3).
DiscussionCompared to experimental studies on tumor-initiatingcells (TICs), the representation of TICs in the actualhuman in vivo situation is less well studied. This fact,and the nature of ovarian cancer ascitic cells as circulat-ing and potentially metastatic cells, prompted us toexamine freshly isolated ascitic samples for expressionmarkers of EMT, TICs and cancer-associated fibroblasts(CAFs).Previous studies have suggested that EOC ascitic cell
spheres represent the invasive and/or metastasis-forming subpopulation leading to recurrent disease [4,6].This notion has in part been supported by in vitro workon artificial spheroids, and is also based on the well-known fact that TICs can be isolated from in vitrospheroids cultured continuously in stem cell medium.Indeed, our own initial hypothesis was that the spontan-eous EOC ascitic spheres are similar to TIC spheroidsand that the hypoxic interiors of spheres would supportor harbor TIC-like cells.However, our results show that the S-type populations
freshly isolated from patients were not only of an epithe-lial and thus less invasive phenotype, but they were alsolow in the EOC TIC marker CD44 and the stem celltranscription factor Oct-4A and did not express CAFmarkers. Compared to the M-type samples, the S-typethus present a less tumorigenic profile. It may be noted,however, that they likely represent a chemoresistantpopulation since chemotherapeutic drugs do not pene-trate such multicellular structures [34,43].Among M-type samples, two subtypes could be dis-
cerned: one that was similar to S-type but obviously lack-ing some factor required for sphere formation in ascites,and a second subtype that was CD44high/Oct-4Ahigh andwhich in addition also expressed specific CAF markers.In addition to other reports on CD44 as an EOC TICmarker [10,21,22], the role of CD44 in regulating a TICphenotype was recently shown when shRNA-mediatedknockdown of CD44 caused breast cancer TICs to dif-ferentiate and abolished their tumorigenicity in mice[25]. Similarly, results of experimental knockdown ofOct-4 have indicated its role in regulation of a TICphenotype [44].

Wintzell et al. BMC Cancer 2012, 12:359 Page 8 of 10http://www.biomedcentral.com/1471-2407/12/359
We therefore propose that the second, CD44high/Oct-4Ahigh subtype of M is the more malignant one.This is based on the roles of CD44 and Oct-4A in de-fining TICs, on the motility/invasivity of vimentin-richtumor cells, and on the expression of CAF markersα-SMA and PDGFβ-R.In further support of this model, the inverse correl-
ation which we observed between CD44 and E-cadherinmay reflect the recent finding that in serial xenograftsof EOC tumors, the tumorigenic CD44high cells werelow/intermediate in E-cadherin [45]. Moreover, CAFsmay originate either as fibroblasts or from epithelialcells that have undergone EMT [14]. Here, the ratio ofE-cadherin:vimentin in M-type samples and theadherence-independence of these cells in vivo are bothin accordance with the latter scenario. Importantly, theobserved co-expression of PDGFβ-R and α-SMA fur-ther strengthens the identity and presence of activatedCAFs, whose role(s) as direct promoters of metastasis,angiogenesis and chemoresistance is increasingly clear[14,15,46].In line with such roles, we found that samples with a
diagnosis of clinical stage IV showed higher expressionof α-SMA than did samples from stage IIIC patients(p= 0.040). This is in line with the recent finding thatCAFs promote EOC growth and metastasis in vivo [15].It is also in line with stage IV being defined byhematogenous metastasis to distant sites, e.g., to theliver. Altogether, this is to our knowledge the first reportto indicate the presence of CAFs in EOC malignantascites.Transcription factors generally make up only a minute
fraction of the entire cellular proteome, and TIC-associated transcription factors an even smaller fractionwithin a population. Yet we could easily detect Oct-4Aand Nanog in the present material, indicating significantlevels of TICs within the samples. It is likely of greatimportance for this result that the samples were notsubcultured in vitro, where the differentiating condi-tions and the consequent asymmetric proliferation ofTICs will soon dilute the levels of TIC markers.We note that although Oct-4 was recently associated
with advanced FIGO stage and higher histological gradein serous ovarian adenocarcinoma [47], the presentreport is the first to show high expression in EOC ofOct-4A, the isoform that is crucial for stem cell renewal[39]. We are hence also first to show high expression inEOC of the stabilized, and more active, SUMOylatedform [48] of Oct-4A. Indeed, 24/27 (89%) of the samplesexpressed Oct-4A/SUMO-Oct4A. Moreover, and of im-portance for data interpretation in further studies, wefound that in some samples virtually all Oct-4A was inthe ~90 kDa SUMOylated form. This demonstrates thatlack of ~40 kDa Oct-4A in a western blot does not
necessarily correspond to lack of the protein. Interest-ingly, Ubc9 is the only SUMO-ligase required forSUMO-Oct-4A [48], and it is upregulated in ovariancancer [49], although its prognostic potential has notbeen investigated.The 100 K is likely the calpain-cleaved 100 kDa
E-cadherin fragment that releases β-catenin allowing itto translocate to the nucleus and participate in Wnt-likesignaling [41,50]. The antibody used here does notrecognize any other known intracellularly cleaved frag-ment. Nor could the fragment be due to the well-studiedextracellular cleavage of E-cadherin that generates thesoluble extracellular form, sometimes known as gp80 orsE-cad, which would not be found in cell lysates nor berecognized by the antibody used. Moreover, theremaining cellular fragment from sE-cad is around37 kDa, i.e., not the one we observed. It would be inter-esting to know whether 100 K is identical to the cyto-plasmic E-cadherin observed at high levels in themultipotent, tumorigenic epithelial-mesenchymal hybridsubset of EOC tumors [45], and/or to internalizedE-cadherin leading to increased β-catenin/Wnt signalingin EOC cells [51].Like Oct-4A, Nanog is involved in stem cell renewal.
In EOC, Nanog expression in tumors has been shown tocorrelate with clinical stage [52]. Here, Nanog correlatedwith TIC marker EpCAM (rs= 0.694, p= <0.001) andwith 100 K (rs= 0.425, p= 0.027), but not with CD44 orOct-4A. The results thus show that TIC surface andtranscriptional markers do not necessarily coincide. Thisin turn suggests that while abundant reports show thatcell sorting based on CD44 will enrich for TICs, theremay in vivo exist several subsets of TICs. Applied tothe present material, the model also suggests that theNanoghigh/EpCAMhigh samples represent a particularTIC subset which may be either M- or S-type, andwhich is separate from the CD44high/Oct-4Ahigh subsetobserved only in M-type samples.
ConclusionWe have here demonstrated high expression of TICmarkers in malignant ascitic cells, and thereby poten-tially high levels of TICs in ascites. M-type populationsexpressing CAF markers are likely more aggressive ortumorigenic than the S-type. Furthermore, Nanoghigh/EpCAMhigh samples represent a particular TIC subsetwhich may be either M- or S-type, and which is separatefrom the CD44high/Oct-4Ahigh subset observed only inM-type samples. This may have practical implicationsfor TIC isolation based on cell sorting, since using aparticular set of markers may result in a particular sub-set of TICs. It may moreover explain why the literaturecan present different sets of markers to identify TICs.The results also imply a biological heterogeneity that

Wintzell et al. BMC Cancer 2012, 12:359 Page 9 of 10http://www.biomedcentral.com/1471-2407/12/359
will need to be addressed in future therapeuticalstrategies.
Additional file
Additional file 1: Table S1. Antibodies used.
Competing interestsThe authors declare that they have no competing interests.
Authors' contributionsMW did all the lab work and statistics and contributed to writing andrevision. EH and EÅL contributed all clinical material, clinical data andmedical expertise. MS conceived of the study and drafted the manuscript. Allauthors read and approved the final manuscript.
Authors' informationSupported bySwedish Cancer Society, grant #10 0476Swedish Science Council, grant #K2011-54X-21748-01-6Olle Engkvist FoundationRadiumhemmet Foundation, grant #101441Golje Memorial Foundation, grant #LA2010-0041
AcknowledgmentsWe are grateful to the Swedish Cancer Society, the Radiumhemmet ResearchFunds, the Swedish Research Council, the medical training and clinicalresearch (ALF) agreement between Stockholm County Council andKarolinska Institutet, the Sigurd and Elsa Golje Memorial and the OlleEngkvist Foundations for financial support. We also thank Dr Martin Augstenfor helpful discussions.
Author details1Department of Oncology-Pathology, Cancer Center Karolinska CCK R8:03Karolinska Institutet, Stockholm S-171 76, Sweden. 2Department ofGynecologic Oncology, Karolinska University Hospital, Stockholm S-171 76,Sweden.
Received: 6 March 2012 Accepted: 31 July 2012Published: 18 August 2012
References1. Landen CN Jr, Birrer MJ, Sood AK: Early events in the pathogenesis of
epithelial ovarian cancer. J Clin Oncol 2008, 26(6):995–1005.2. Ahmed N, Thompson EW, Quinn MA: Epithelial-mesenchymal
interconversions in normal ovarian surface epithelium and ovariancarcinomas: an exception to the norm. J Cell Physiol 2007, 213(3):581–588.
3. Veatch AL, Carson LF, Ramakrishnan S: Differential expression of thecell-cell adhesion molecule E-cadherin in ascites and solid humanovarian tumor cells. Int J Cancer 1994, 58(3):393–399.
4. Sodek KL, Ringuette MJ, Brown TJ: Compact spheroid formation byovarian cancer cells is associated with contractile behavior and aninvasive phenotype. Int J Cancer 2009, 124(9):2060–2070.
5. Burleson KM, Hansen LK, Skubitz AP: Ovarian carcinoma spheroidsdisaggregate on type I collagen and invade live human mesothelial cellmonolayers. Clin Exp Metastasis 2004, 21(8):685–697.
6. Shield K, Ackland ML, Ahmed N, Rice GE: Multicellular spheroids inovarian cancer metastases: biology and pathology. Gynecol Oncol 2009,113(1):143–148.
7. Christiansen JJ, Rajasekaran AK: Reassessing epithelial to mesenchymaltransition as a prerequisite for carcinoma invasion and metastasis.Cancer Res 2006, 66(17):8319–8326.
8. Bapat SA, Mali AM, Koppikar CB, Kurrey NK: Stem and progenitor-like cellscontribute to the aggressive behavior of human epithelial ovariancancer. Cancer Res 2005, 65(8):3025–3029.
9. Berry NB, Bapat SA: Ovarian cancer plasticity and epigenomics in theacquisition of a stem-like phenotype. J Ovarian Res 2008, 1:8.
10. Zhang S, Balch C, Chan MW, Lai HC, Matei D, Schilder JM, Yan PS, HuangTH, Nephew KP: Identification and characterization of ovarian cancer-
initiating cells from primary human tumors. Cancer Res 2008,68(11):4311–4320.
11. Gires O: Lessons from common markers of tumor-initiating cells in solidcancers. Cell Mol Life Sci 2011, 68(24):4009–4022.
12. Das B, Tsuchida R, Malkin D, Koren G, Baruchel S, Yeger H: Hypoxiaenhances tumor stemness by increasing the invasive and tumorigenicside population fraction. Stem Cells 2008, 26(7):1818–1830.
13. Hill RP, Marie-Egyptienne DT, Hedley DW: Cancer stem cells, hypoxia andmetastasis. Semin Radiat Oncol 2009, 19(2):106–111.
14. Ostman A, Augsten M: Cancer-associated fibroblasts and tumorgrowth–bystanders turning into key players. Curr Opin Genet Dev 2009,19(1):67–73.
15. Zhang Y, Tang H, Cai J, Zhang T, Guo J, Feng D, Wang Z: Ovarian cancer-associated fibroblasts contribute to epithelial ovarian carcinomametastasis by promoting angiogenesis, lymphangiogenesis and tumorcell invasion. Cancer Lett 2011, 303(1):47–55.
16. Willers IM, Isidoro A, Ortega AD, Fernandez PL, Cuezva JM: Selectiveinhibition of beta-F1-ATPase mRNA translation in human tumours.Biochem J 2010, 426(3):319–326.
17. Isidoro A, Casado E, Redondo A, Acebo P, Espinosa E, Alonso AM, Cejas P,Hardisson D, Fresno Vara JA, Belda-Iniesta C, et al: Breast carcinomas fulfillthe Warburg hypothesis and provide metabolic markers of cancerprognosis. Carcinogenesis 2005, 26(12):2095–2104.
18. Lopez-Rios F, Sanchez-Arago M, Garcia-Garcia E, Ortega AD, Berrendero JR,Pozo-Rodriguez F, Lopez-Encuentra A, Ballestin C, Cuezva JM: Loss of themitochondrial bioenergetic capacity underlies the glucose avidity ofcarcinomas. Cancer Res 2007, 67(19):9013–9017.
19. Montoya J, Perez-Martos A, Garstka HL, Wiesner RJ: Regulation ofmitochondrial transcription by mitochondrial transcription factor A. MolCell Biochem 1997, 174(1–2):227–230.
20. Kanki T, Ohgaki K, Gaspari M, Gustafsson CM, Fukuoh A, Sasaki N, HamasakiN, Kang D: Architectural role of mitochondrial transcription factor A inmaintenance of human mitochondrial DNA. Mol Cell Biol 2004,24(22):9823–9834.
21. Alvero AB, Chen R, Fu HH, Montagna M, Schwartz PE, Rutherford T, SilasiDA, Steffensen KD, Waldstrom M, Visintin I, et al: Molecular phenotyping ofhuman ovarian cancer stem cells unravels the mechanisms for repairand chemoresistance. Cell Cycle 2009, 8(1):158–166.
22. Bapat SA: Human ovarian cancer stem cells. Reproduction 2010,140(1):33–41.
23. Marhaba R, Klingbeil P, Nuebel T, Nazarenko I, Buechler MW, Zoeller M:CD44 and EpCAM: cancer-initiating cell markers. Curr Mol Med 2008,8(8):784–804.
24. van der Gun BT, Melchers LJ, Ruiters MH, de Leij LF, McLaughlin PM, RotsMG: EpCAM in carcinogenesis: the good, the bad or the ugly.Carcinogenesis 2010, 31(11):1913–1921.
25. Pham PV, Phan NL, Nguyen NT, Truong NH, Duong TT, Le DV, Truong KD,Phan NK: Differentiation of breast cancer stem cells by knockdown ofCD44: promising differentiation therapy. J Transl Med 2011, 9:209.
26. Kryczek I, Liu S, Roh M, Vatan L, Szeliga W, Wei S, Banerjee M, Mao Y,Kotarski J, Wicha MS, et al: Expression of aldehyde dehydrogenase andCD133 defines ovarian cancer stem cells. Int J Cancer 2012, 130(1):29–39.
27. Kusumbe AP, Mali AM, Bapat SA: CD133-expressing stem cells associatedwith ovarian metastases establish an endothelial hierarchy andcontribute to tumor vasculature. Stem Cells 2009, 27(3):498–508.
28. Hermansen SK, Christensen KG, Jensen SS, Kristensen BW: Inconsistentimmunohistochemical expression patterns of four different CD133antibody clones in glioblastoma. J Histochem Cytochem 2011,59(4):391–407.
29. Bidlingmaier S, Zhu X, Liu B: The utility and limitations of glycosylatedhuman CD133 epitopes in defining cancer stem cells. J Mol Med (Berl)2008, 86(9):1025–1032.
30. Wu C, Alman BA: Side population cells in human cancers. Cancer Lett2008, 268(1):1–9.
31. Song J, Chang I, Chen Z, Kang M, Wang CY: Characterization of sidepopulations in HNSCC: highly invasive, chemoresistant and abnormalWnt signaling. PLoS One 2010, 5(7):e11456.
32. Hu L, McArthur C, Jaffe RB: Ovarian cancer stem-like side-population cellsare tumourigenic and chemoresistant. Br J Cancer 2010, 102(8):1276–1283.
33. Ishikawa T, Nakagawa H: Human ABC transporter ABCG2 in cancerchemotherapy and pharmacogenomics. J Exp Ther Oncol 2009, 8(1):5–24.
Wintzell et al. BMC Cancer 2012, 12:359 Page 10 of 10http://www.biomedcentral.com/1471-2407/12/359
34. Fayad W, Brnjic S, Berglind D, Blixt S, Shoshan MC, Berndtsson M, OlofssonMH, Linder S: Restriction of cisplatin induction of acute apoptosis to asubpopulation of cells in a three-dimensional carcinoma culture model.Int J Cancer 2009, 125(10):2450–2455.
35. Maubant S, Cruet-Hennequart S, Dutoit S, Denoux Y, Crouet H, Henry-AmarM, Gauduchon P: Expression of alpha V-associated integrin beta subunitsin epithelial ovarian cancer and its relation to prognosis in patientstreated with platinum-based regimens. J Mol Histol 2005, 36(1–2):119–129.
36. Partheen K, Levan K, Osterberg L, Claesson I, Sundfeldt K, Horvath G:External validation suggests Integrin beta 3 as prognostic biomarker inserous ovarian adenocarcinomas. BMC Cancer 2009, 9:336.
37. Sales KM, Winslet MC, Seifalian AM: Stem cells and cancer: an overview.Stem Cell Rev 2007, 3:249–255.
38. Dalerba P, Dylla SJ, Park IK, Liu R, Wang X, Cho RW, Hoey T, Gurney A,Huang EH, Simeone DM, et al: Phenotypic characterization of humancolorectal cancer stem cells. Proc Natl Acad Sci U S A 2007,104(24):10158–10163.
39. Wang X, Dai J: Concise review: isoforms of OCT4 contribute to theconfusing diversity in stem cell biology. Stem Cells 2010, 28(5):885–893.
40. Wei F, Scholer HR, Atchison ML: Sumoylation of Oct4 enhances itsstability, DNA binding, and transactivation. J Biol Chem 2007,282(29):21551–21560.
41. Rios-Doria J, Day KC, Kuefer R, Rashid MG, Chinnaiyan AM, Rubin MA, DayML: The role of calpain in the proteolytic cleavage of E-cadherin inprostate and mammary epithelial cells. J Biol Chem 2003,278(2):1372–1379.
42. Wend P, Holland JD, Ziebold U, Birchmeier W: Wnt signaling in stem andcancer stem cells. Semin Cell Dev Biol 2010, 21(8):855–863.
43. Tunggal JK, Cowan DS, Shaikh H, Tannock IF: Penetration of anticancerdrugs through solid tissue: a factor that limits the effectiveness ofchemotherapy for solid tumors. Clin Cancer Res 1999, 5(6):1583–1586.
44. Chen YC, Hsu HS, Chen YW, Tsai TH, How CK, Wang CY, Hung SC, Chang YL,Tsai ML, Lee YY, et al: Oct-4 expression maintained cancer stem-likeproperties in lung cancer-derived CD133-positive cells. PLoS One 2008,3(7):e2637.
45. Strauss R, Li ZY, Liu Y, Beyer I, Persson J, Sova P, Moller T, Pesonen S,Hemminki A, Hamerlik P, et al: Analysis of epithelial and mesenchymalmarkers in ovarian cancer reveals phenotypic heterogeneity andplasticity. PLoS One 2011, 6(1):e16186.
46. Cai J, Tang H, Xu L, Wang X, Yang C, Ruan S, Guo J, Hu S, Wang Z:Fibroblasts in omentum activated by tumor cells promote ovariancancer growth, adhesion and invasiveness. Carcinogenesis 2012,33(1):20–29.
47. Zhang J, Li YL, Zhou CY, Hu YT, Chen HZ: Expression of octamer-4 inserous and mucinous ovarian carcinoma. J Clin Pathol 2010,63(10):879–883.
48. Zhang Z, Liao B, Xu M, Jin Y: Post-translational modification of POUdomain transcription factor Oct-4 by SUMO-1. FASEB J 2007,21(12):3042–3051.
49. Moschos SJ, Mo YY: Role of SUMO/Ubc9 in DNA damage repair andtumorigenesis. J Mol Histol 2006, 37(5–7):309–319.
50. Masterson J, O'Dea S: Posttranslational truncation of E-cadherin andsignificance for tumour progression. Cells Tissues Organs 2007,185(1–3):175–179.
51. Burkhalter RJ, Symowicz J, Hudson LG, Gottardi CJ, Stack MS: Integrinregulation of {beta}-catenin signaling in ovarian carcinoma. J Biol Chem2011, 286(26):23467–23475.
52. Pan Y, Jiao J, Zhou C, Cheng Q, Hu Y, Chen H: Nanog is highly expressedin ovarian serous cystadenocarcinoma and correlated with clinical stageand pathological grade. Pathobiology 2010, 77(6):283–288.
doi:10.1186/1471-2407-12-359Cite this article as: Wintzell et al.: Protein markers of cancer-associatedfibroblasts and tumor-initiating cells reveal subpopulations in freshlyisolated ovarian cancer ascites. BMC Cancer 2012 12:359.
Submit your next manuscript to BioMed Centraland take full advantage of:
• Convenient online submission
• Thorough peer review
• No space constraints or color figure charges
• Immediate publication on acceptance
• Inclusion in PubMed, CAS, Scopus and Google Scholar
• Research which is freely available for redistribution
Submit your manuscript at www.biomedcentral.com/submit
Copyright © 2022 FDOKUMEN