![Optical Light Curve of the Type I[CLC]a[/CLC] Supernova 1998[CLC]bu[/CLC] in M96 and the Supernova Calibration of the Hubble Constant](https://static.fdokumen.com/doc/165x107/632035b7069357aa45061842/optical-light-curve-of-the-type-iclcaclc-supernova-1998clcbuclc-in-m96.jpg)
Freshly Formed Dust in the Cassiopeia A Supernova Remnant as Revealed by the Spitzer Space Telescope
28
arXiv:0709.2880v1 [astro-ph] 18 Sep 2007 Freshly Formed Dust in the Cassiopeia A Supernova Remnant as Revealed by the Spitzer Space Telescope J. Rho 1 , T. Kozasa 2 , W. T. Reach 1 , J. D. Smith 3 , L. Rudnick 4 , T. DeLaney 5 , J. A. Ennis 4 , H. Gomez 6 , A. Tappe 1,7 ABSTRACT We performed Spitzer Infrared Spectrograph mapping observations covering nearly the entire extent of the Cassiopeia A supernova remnant (SNR), producing mid-infrared (5.5-35 μm) spectra every 5 ′′ -10 ′′ . Gas lines of Ar, Ne, O, Si, S and Fe, and dust continua were strong for most positions. We identify three distinct ejecta dust populations based on their continuum shapes. The dominant dust continuum shape exhibits a strong peak at 21 μm. A line-free map of 21 μm- peak dust made from the 19-23 μm range closely resembles the [Ar II], [O IV], and [Ne II] ejecta-line maps implying that dust is freshly formed in the ejecta. Spectral fitting implies the presence of SiO 2 , Mg protosilicates, and FeO grains in these regions. The second dust type exhibits a rising continuum up to 21 μm and then flattens thereafter. This “weak 21 μm” dust is likely composed of Al 2 O 3 and C grains. The third dust continuum shape is featureless with a gently rising spectrum and is likely composed of MgSiO 3 and either Al 2 O 3 or Fe grains. Using the least massive composition for each of the three dust classes yields a total mass of 0.020 M ⊙ . Using the most-massive composition yields a total mass of 0.054 M ⊙ . The primary uncertainty in the total dust mass stems from the selection of the dust composition necessary for fitting the featureless dust as well as 70 μm flux. The freshly formed dust mass derived from Cas A is sufficient from SNe to explain the lower limit on the dust masses in high redshift galaxies. 1 Spitzer Science Center, California Institute of Technology, Pasadena, CA 91125; rho, [email protected] 2 Department of Cosmosciences, Graduate School of Science, Hokkaido University, Sapporo 060-0810, Japan 3 Steward Observatory, 933 N. Cherry Ave., Tucson, AZ 85712 4 Department of Astronomy, University of Minnesota, 116 Church St. SE, Minneapolis, MN 55455 5 MIT Kavli Institute, 77 Massachusetts Ave., Room NE80-6079, Cambridge, MA 02139 6 School of Physics and Astronomy, University of Wales, Cardiff, Wales, UK 7 Harvard-Smithsonian Center for Astrophysics, 60 Garden Street, Cambridge, MA 02138
Transcript of Freshly Formed Dust in the Cassiopeia A Supernova Remnant as Revealed by the Spitzer Space Telescope

arX
iv:0
709.
2880
v1 [
astr
o-ph
] 1
8 Se
p 20
07
Freshly Formed Dust in the Cassiopeia A Supernova Remnant as
Revealed by the Spitzer Space Telescope
J. Rho1, T. Kozasa2, W. T. Reach1, J. D. Smith3, L. Rudnick4, T. DeLaney5, J. A. Ennis4,
H. Gomez6, A. Tappe1,7
ABSTRACT
We performed Spitzer Infrared Spectrograph mapping observations covering
nearly the entire extent of the Cassiopeia A supernova remnant (SNR), producing
mid-infrared (5.5-35 µm) spectra every 5′′-10′′. Gas lines of Ar, Ne, O, Si, S and
Fe, and dust continua were strong for most positions. We identify three distinct
ejecta dust populations based on their continuum shapes. The dominant dust
continuum shape exhibits a strong peak at 21 µm. A line-free map of 21 µm-
peak dust made from the 19-23 µm range closely resembles the [Ar II], [O IV],
and [Ne II] ejecta-line maps implying that dust is freshly formed in the ejecta.
Spectral fitting implies the presence of SiO2, Mg protosilicates, and FeO grains
in these regions. The second dust type exhibits a rising continuum up to 21
µm and then flattens thereafter. This “weak 21 µm” dust is likely composed of
Al2O3 and C grains. The third dust continuum shape is featureless with a gently
rising spectrum and is likely composed of MgSiO3 and either Al2O3 or Fe grains.
Using the least massive composition for each of the three dust classes yields a
total mass of 0.020 M⊙. Using the most-massive composition yields a total mass
of 0.054 M⊙. The primary uncertainty in the total dust mass stems from the
selection of the dust composition necessary for fitting the featureless dust as well
as 70 µm flux. The freshly formed dust mass derived from Cas A is sufficient
from SNe to explain the lower limit on the dust masses in high redshift galaxies.
1Spitzer Science Center, California Institute of Technology, Pasadena, CA 91125; rho,
2Department of Cosmosciences, Graduate School of Science, Hokkaido University, Sapporo 060-0810,
Japan
3Steward Observatory, 933 N. Cherry Ave., Tucson, AZ 85712
4Department of Astronomy, University of Minnesota, 116 Church St. SE, Minneapolis, MN 55455
5MIT Kavli Institute, 77 Massachusetts Ave., Room NE80-6079, Cambridge, MA 02139
6School of Physics and Astronomy, University of Wales, Cardiff, Wales, UK
7Harvard-Smithsonian Center for Astrophysics, 60 Garden Street, Cambridge, MA 02138

– 2 –
Subject headings: supernovae:general- dust:ISM - supernova remnants:Cas A
1. Introduction
The recent discovery of huge quantities of dust (108 − 109 M⊙) in very high–redshifted
galaxies and quasars (Isaak et al. 2002; Bertoldi et al. 2003) suggests that dust was produced
efficiently in the first generation of supernovae (SNe). Theoretical studies (Kozasa et al.
1991; Todini & Ferrara 2001, hereafter TF; Nozawa etal. 2003, N03) predicted the formation
of a significant quantity of dust (∼ 0.1 − 1.0 M⊙) in the ejecta of Type II SNe, and the
predicted dust mass is believed to be sufficient to account for the quantity of dust observed
at high redshifts (Maiolino et al. 2006; Meikle et al. 2007). Recently, a model of dust
evolution in high–redshift galaxies (Dwek et al. 2007) indicates that at least 1 M⊙ of dust
per SN is necessary for reproducing the observed dust mass in one hyperluminous quasar
at z = 6.4. Observationally, the presence of freshly formed dust has been confirmed in a
few core-collapsed SNe, such as SN1987A, which clearly have showed several signs of dust
formation in the ejecta (see McCray 1993 for details). The highest dust mass obtained
so far for SN 1987A is 7.5 × 10⁻⁴ M⊙ (Ercolano et al. 2007). Recent Spitzer and HST
observations (Sugerman et al. 2006) showed that up to 0.02 M⊙ of dust formed in the ejecta
of SN2003gd with the progenitor mass of 6–12 M⊙, and the authors concluded that SNe
are major dust factories. However, from the detailed analysis of the late–time mid–infrared
observations, Meikle et al. (2007) found that the mass of freshly formed dust in the same
SN is only 4 × 10⁻⁵M⊙, and failed to confirm the presence 0.02 M⊙ dust in the ejecta. The
aforementioned results show that the derived dust mass is model-dependent, and that the
amount of dust that really condenses in the ejecta of core-collapsed SNe is unknown.
Cassiopeia A (Cas A) is the only Galactic supernova remnant (SNR) that exhibits clear
evidence of dust formed in ejecta (Lagage et al. 1996; Arendt et al. 1999, hereafter ADM).
The amount of dust that forms in the ejecta of young SNR is still controversial. Previous
observations inferred only < 3 × 10⁻³ M⊙ of dust at temperatures between 90 and 350 K
(ADM; Douvion et al. 2001, hereafter D01) ; this estimate is 2 to 3 orders of magnitude too
little to explain the dust observed in the early Universe. Recent submillimeter observations
of CasA and Kepler with SCUBA (Dunne et al. 2003; Morgan et al. 2003) revealed the
presence of large amounts of cold dust (∼ 0.3 − 2 M⊙ at 15–20 K) missed by previous
IRAS/ISO observations. On the other hand, highly elongated conductive needles with mass
of only 10−4 to 10−3 M⊙ could also explain a high sub-mm flux of Cas A, when including grain
destruction by sputtering (Dwek 2004), though the physicality of such needles is doubtful
(Gomez et al. 2005). While Krause et al. (2005) showed that much of the 160µm emission

– 3 –
observed with Multiband Imaging Photometer for Spitzer (MIPS) is foreground material,
suggesting there is no cold dust in Cas A, Wilson & Batrla (2005) used CO emission towards
the remnant to show that up to about a solar mass of dust could still be associated with the
ejecta, not with the foreground material. These controversial scenarios of dust mass highlight
the importance of correctly identifying the features and masses of dust freshly formed in Cas
A. The Galactic young SNR Cas A allows us to study in detail the distribution and the
compositions of the dust relative to the ejecta and forward shock with infrared Spectrograph
onboard the Spitzer Space Telescope.
Cas A is one of the youngest Galactic SNRs with an age of 335 yr attributed to a SN
explosion in AD 1671. The progenitor of Cas A is believed to be a Wolf-Rayet star with
high nitrogen abundance (Fesen 2001) and to have a mass of 15-25 M⊙ (Kifonidis et al. 2000;
Young et al. 2006) or 29-30 M⊙ (Perez-Rendon et al. 2002). The predicted dust mass formed
in SNe depends on the progenitor mass; for a progenitor mass of 15 to 30 M⊙, the predicted
dust mass is from 0.3 to 1.1 M⊙ (NO3) and from 0.08 to 1.0 M⊙ (TF), respectively. In this
paper, we present Spitzer Infrared Spectrograph (IRS) mapping observations of Cas A, and
identify three distinct classes of dust associated with the ejecta and discuss dust formation
and composition with an estimate of the total mass of freshly formed dust.
2. The IRS Spectra and Dust Maps
We performed Spitzer IRS mapping observations covering nearly the entire extent of
Cas A on 2005 January 13 with a total exposure time of 11.3 hr. The Short Low (SL: 5-15
µm) and Long Low (LL: 15-40 µm) IRS mapping involved ∼16×360 and 4 × 91 pointings,
producing spectra every 5′′ and 10′′, respectively. The spectra were processed with the S12
version of the IRS pipeline using the CUBISM package (Kennicutt et al. 2003; Smith et
al. 2007), whereby backgrounds were subtracted and an extended emission correction was
applied. The spectral resolving power of the IRS SL and LL modules ranges from 62 to 124.
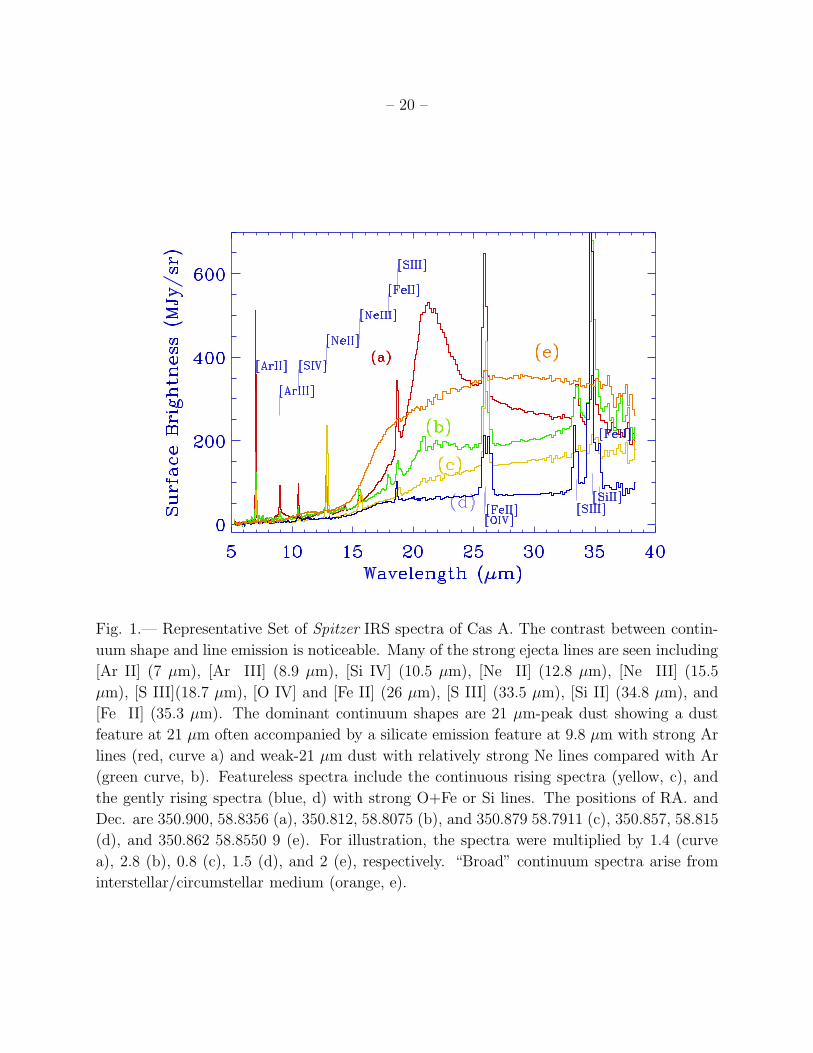
The IRS spectra of Cas A show bright ejecta emission lines from Ar, Ne, S, Si, O, and
Fe and various continuum shapes as indicated by the representative spectra in Figure 1.
The most common continuum shape exhibits a large bump peaking at 21 µm as shown by
spectrum “a” in Figure 1. This “21 µm-peak” dust is often accompanied by the silicate
emission feature at 9.8 µm which corresponds to the stretching mode. A second class of
continuum shapes exhibits a rather sharp rise up to 21 µm and then stays flat thereafter. This
“weak-21 µm dust” is often associated with relatively strong Ne lines (in comparison with
Ar lines) and is indicated by spectrum “b” in Figure 1. The third type of dust continuum is
characterized by a smooth and featureless, gently rising spectrum with strong [O IV]+[Fe II]

– 4 –
and [Si II] emission lines as shown by spectra “c” and “d” in Figure 1. The spectrum “d”
shows double line structures that may be due to doppler-resolved lines of [O IV] at 26 µm
and [Si II] at 35 µm. Note that the “featureless” dust (spectrum “d” in Fig. 1) is a class of
dust, separate from the interstellar/circumstellar dust (spectrum “e” in Fig. 1) heated by the
forward shock. The interstellar/circumstellar dust spectrum in Cas A has no associated gas
line emission. The “broad” continuum (see Figure 7b of Ennis et al. 2006) is a combination
of the spectra “c” and “e”. The spectrum “c” has contamination from the shock heated dust
in projection, and for simplicity it is excluded in estimating the masses of the freshly formed
dust (see §5). The “featureless” dust lacks the gentle peak around 26 µm and also lacks the
interstellar silicate-emission feature between 9 µm and 11 µm observed in the spectra from
the forward shock region. Most importantly, the “featureless” dust accompanies relatively
strong Si and S ejecta lines and mostly from the interior of the remnant (blue region in Fig.
2f).
We generated a map of the 21 µm-peak dust by summing the emission over 19-23 µm
after subtracting a baseline between 18-19 µm and 23-24 µm. The line-free dust map (Fig.
2a) resembles the [Ar II] and [O IV]+[Fe II] ejecta-line maps, as shown in Figures 2b and 2c,
and we also find that the [Ne II] map is very similar to the [Ar II] map. The [Ar II] map shows
a remarkable similarity to the 21 µm-peak dust map (Fig. 2a and 2b), thereby confirming
this dust is freshly formed in the ejecta. Maps of [Si II] (Fig. 2d) and [O IV]+[Fe II] (Fig.
2c) shows significant emission at the center revealing ejecta that have not yet been overrun
by the reverse shock (unshocked ejecta). There is also [Si II] and [O IV]+[Fe II] emission at
the bright ring indicating that some of the Si and O+Fe ejecta have recently encountered
the reverse shock. While the bright O+Fe emission outlines the same bright ring structure
as the [Ar II] and 21 µm-peak dust maps, the bright part of the Si shell shows a different
morphology from the other ejecta maps.
We can characterize the spectra of our three dust classes by using the flux ratios between
17 µm and 21 µm and between 21 µm and 24 µm. Although the spectra in Cas A show
continuous changes in continuum shape from strong 21 µm peak to weak 21 µm peak and
to featureless, we can locate regions where each of the three classes dominates. Figure 2f
shows the spatial distribution of our three dust classes where red, green, and blue indicate
21 µm-peak dust, weak-21 µm dust, and featureless dust, respectively. The flux ratios used
to identify the three dust classes are as follows where Iλ is the flux density in the extracted
spectrum at wavelength λ (µm):
1) 21 µm-peak dust: we use the ratio I21/I24 > 1+σ21/24, where σ21/24 is the dispersion in
I21/I24 over the remnant, which is equivalent to I21/I17 ≥ 3.4. The regions with 21 µm-peak
dust coincide with the brightest ejecta.

– 5 –
2) Weak-21 µm dust: we use the ratio 1 − σ21/24 < I21/I24 < 1 + σ21/24, which is
equivalent to 2.3 < I21/I17 < 3.4. The regions showing the weak-21 µm continuum shape
mostly coincide with faint ejecta emission, but not always.
3) Featureless dust map: we use the ratio I21/I24 < 1 − σ21/24, which is equivalent to
I21/I17 < 2.3. This ratio also picks out circumstellar dust heated by the forward shock, so we
used several methods to exclude and mitigate contamination from circumstellar dust emis-
sion. First, using X-ray and radio maps, we excluded the forward shock regions at the edge
of the radio plateau (Gotthelf et al. 2001). Second, there are highly structured “continuum-
dominated” X-ray filaments across the face of the remnant which are similar to the exterior
forward shock filaments and may be projected forward shock emission (DeLaney 2004). For
our analysis, we excluded regions where there were infrared counterparts to the projected
forward shock filaments. Third, for simplicity we excluded regions with gently rising spectra
identified by curve “c” (the spectra which continues to rise to longer wavelengths) in Figure
1. This type of spectrum is mainly found on the eastern side of Cas A where there is an Hα
region, the northeast jet, and other exterior optical ejecta (Fesen 2001) making it difficult
to determine if the continuum emission is due to ejecta dust or circumstellar dust. However,
note that some portion of the continuum in the spectra, “c”, is freshly formed dust. We
finally excluded regions where there was a noticeable correlation to optical quasi-stationary
flocculi (van den Bergh 1971) which are dense circumstellar knots from the progenitor wind.
The featureless dust emission appears primarily across the center of the remnant, as
shown in Figure 2d (blue). The featureless dust is accompanied by relatively strong [Si II] and
[S III] and [O IV+Fe II] lines, as shown by the spectrum “d” of Figure 1. The [O IV]+[Fe II]
line map (Fig. 2c) shows significant emission at the center as well as at the bright ring of
the reverse shocked material. The [Si II] line map shows different morphology than other
line maps and the 21 µm-peak dust map; depicting center-filled emission with a partial shell,
as shown in Figure 2. This poses the following important question: why is the Si map more
center-filled than the Ar map? The answer is unclear because Si and Ar are both expected
at similar depths in the nucleosynthetic layer (e.g. Woosley, Heger & Weaver 2002). The
relatively faint infrared emission of Si and S at the reverse shock may imply relatively less
Si and S in the reverse shock. We suspect it is because the Si and S have condensed to solid
form such as Mg protosilicate, MgSiO3, Mg2SiO4 and FeS. In contrast, Ar remains always
in the gas and does not condense to dust, so it should be infrared or X-ray emitting gas.
Alternate explanation is that the ionization in the interior is due to photoionization from the
X-ray shell (see Hamilton & Fesen 1988); in this case, the lack of interior Ar II relative to Si II
might be due to its much higher ionization potential (16 eV compared to 8 eV). Theoretical
models of nucleosynthesis, accounting for heating, photoionization, and column density of
each element would be helpful for understanding the distribution of nucleosynthetic elements.

– 6 –
The Si and S emission detected at the interior, is most likely unshocked ejecta where
the revere shock has not yet overtaken the ejecta. The radial profile of unshocked ejecta
is centrally peaked at the time of explosion, as shown by Chevalier & Soker (1989). The
radial profile of unshocked Fe ejecta is also expected to be center-filled for ∼1000 yr old
Type Ia SNR of SN 1006 (Hamilton & Fesen 1988). The morphology of the featureless dust
resembles that of unshocked ejecta, supporting the conclusion that the featureless dust is
also freshly formed dust. The spectrum in Figure 1 (curve “d”), shows the resolved two lines
at 26 µm and at 35 µm. The two respective lines at ∼26 µm may be resolved lines of [O IV]
and [Fe II], and at ∼35 µm [Si II] and [Fe II] (as expected that the unshocked ejecta near
the explosion center have a low velocity); alternatively, they could be highly doppler-shifted
lines (in this case the two lines at 26 µm are both [O IV], and the two lines at 35 µm are
both [Si II]). The newly revealed unshocked ejecta deserves extensive studies; preliminary
doppler-shifted maps were presented in DeLaney et al. (2006) and the detailed analysis of
velocities and abundances of unshocked and shocked ejecta will be presented in future papers
(DeLaney et al. 2007; Smith et al. 2007).
3. Spectral Fitting and Dust Composition
We performed spectral fitting to the IRS continua using our example regions in Figure
1. Included in the fitting are MIPS 24 µm and 70 µm fluxes (Hines et al. 2004), and the con-
tribution of synchrotron emission (Figs. 3 and 5), estimated from the radio fluxes (DeLaney
2004) and Infrared Array Camera (IRAC) 3.6 µm fluxes (Ennis et al. 2006). We measured
synchrotron radiation components for each position using radio maps and assuming the
spectral index α=-0.71 (Rho et al. 2003) where log S ∝ α log ν. Because the full-width-half-
maximum of 24 µm is smaller than the IRS extracted region, the surface brightnesses for 24
µm were measured using a 15′′ box, the same size as the area used for the extracted IRS LL
spectra. We also made color corrections to each MIPS 24 µm data point based on each IRS
spectrum and band-filter shape; the correction was as high as 25% for some positions. While
the uncertainty of calibration errors in IRAC is 3-4%, that of MIPS 24 µm is better than
10%. The MIPS 70 µm image (Hines et al. 2004), shown in Figure 2e, clearly resolves Cas A
from background emission, unlike the 160 µm image (Krause et al. 2005). Most of the bright
70 µm emission appears at the bright ring and corresponds to the 21 µm dust map and the
shocked ejecta, particularly [Ar II], indicating that the 70 µm emission is primarily from
freshly formed dust in the ejecta. The 70 µm emission also appears at the interior as shown
in Figure 2e. We measured the brightness for 70 µm within a circle of radius 20′′ for each
position, accounting for the point-spread function (note that when the emission is uniform,
the aperture size does not affect the surface brightness). We estimated the uncertainties of

– 7 –
the 70 µm fluxes to be as large as 30%. The largest uncertainty comes from background
variation due to cirrus structures based on our selection of two background areas, 5′ to the
northwest and south of the Cas A.
The dust continuum is fit with the Planck function (Bν(T )) multiplied by the absorp-
tion efficiency (Qabs) for various dust compositions, varying the amplitude and temperature
of each component. To determine the dust composition, we consider not only the grain
species predicted by the model of dust formation in SNe (TF, N03), but also Mg protosili-
cates (ADM) and FeO (Henning et al. 1995) as possible contributors to the 21 µm feature.
The optical constants of the grain species used in the calculation are the same as those of
Hirashita et al. (2005), except for amorphous Si (Piller 1985), amorphous SiO2 (Philipp
1985), amorphous Al2O3 (Begemann 1997), FeO (Henning et al. 1995), and we apply Mie
theory (Bohren & Huffman 1983) to calculate the absorption efficiencies, Qabs, assuming the
grains are spheres of radii a = 0.01 µm. We fit both amorphous and crystalline grains for
each composition, but it turned out that the fit results in Cas A (see §3) favor amorphous
over crystalline grains. Thus, default grain composition indicates amorphous, hereafter. For
Mg protosilicate, the absorption coefficients are evaluated from the mass absorption coeffi-
cients tabulated in Dorschner et al. (1980), and we assume that the absorption coefficient
varies as λ−2 for λ > 40 µm, typical for silicates. We fit the flux density for each spectral type
using scale factors Ci for each grain type i, such that Fiν = Σi Ci Bν Qabs,i/a. Note that the
calculated values of Qabs/a are independent of the grain size as long as 2π|m|a/λ <<1 where
m is the complex refractive index. Thus the derived scale factor Ci as well as the estimated
dust mass (see §4) are independent of the radius of the dust. The dust compositions of the
best fits are summarized in Table 1.
The strong 21 µm-peak dust is best fit by Mg proto-silicate, amorphous SiO2 and FeO
grains (with temperatures of 60-120 K) as shown in Figure 3. These provide a good match
to the 21 µm feature. ADM suggested that the 21 µm feature is best fit by Mg proto-silicate
while D01 suggested it is best fit by SiO2 instead. We found, however, that SiO2 produced a
21 µm feature that was too sharp. We also fit the observations using Mg2SiO4, which exhibits
a feature around 20 µm and the overall variation of absorption coefficients of Mg2SiO4 with
wavelength might be similar to that of Mg protosilicate (Dorschner et al. 1980; Jager et al.
2003). However, with Mg2SiO4, the fit is not as good as that of Mg protosilicate, not only
at the 21-µm peak, but also at shorter (10-20 µm) and longer (70 µm) wavelengths. Thus,
we use Mg protosilicate and SiO2 as silicates to fit the 21 µm-peak dust feature. The fit
with Mg protosilicate, SiO2 and FeO is improved by adding aluminum oxide (Al2O3, 83 K)
and FeS (150 K), where Al2O3 improved the overall continuum shape between 10-70 µm
and FeS improved the continuum between 30-40 µm (underneath the lines of Si, S and Fe),
as shown Figure 3. The silicate composition is responsible for the 21 µm peak, suggesting

– 8 –
that the dust forms around the inner-oxygen and S-Si layers and is consistent with Ar being
one of the oxygen burning products. We also include amorphous MgSiO3 (480 K) and SiO2
(300 K) to account for the emission feature around the 9.8 µm. The composition of the low
temperature (40-90 K) dust component necessary for reproducing 70 µm is rather unclear.
Either Al2O3 (80 K) (Model A in Table 1) or Fe (100 K) (Model B in Table 1 and Figure 4)
can fit equally well, as listed in Table 1. We could use carbon instead of Al2O3 or Fe, but the
line and dust compositions suggest the emission is from inner O, S-Si layers, where carbon
dust is not expected. There are still residuals in the fit from the feature peaking at 21 µm
(20-23 µm), and an unknown dust feature at 11-12.5 µm (it is not a part of typical PAH
feature), as shown in Figure 3. The former may be due to non-spherical grains or different
sizes of grains.
The weak 21 µm continuum is fit by FeO and Mg2SiO4 or Mg protosilicate (Models
C and D in Table 1) since the curvature of the continuum changes at 20-21 µm as shown
in Figure 5. To fit the rest of the spectrum, we use glassy carbon dust and Al2O3 grains.
The glassy carbon grains (220 K) can account for the smooth curvature in the continuum
between 8-14 µm. Carbon dust (80 K) and Al2O3 (100 K) contribute to the continuum
between 15-25 µm. We could use Fe dust instead, but we suspect carbon dust because of the
presence of relatively strong Ne line emission with the weak 21 µm dust class. Ne, Mg, and
Al are all carbon burning products. We cannot fit the spectrum replacing carbon by Al2O3
with a single or two temperatures because Qabs/a of Al2O3 has a shallow bump around 27
µm, thus the fit requires three temperature components of Al3O2 or a combination of two
temperature components of Al3O2 and a temperature component of carbon. The continuum
between 33-40 µm (underneath the lines of Si, S and Fe) can be optimally fit by FeS grains.
The 70 µm image shown in Figure 2e shows interior emission similar to the unshocked
ejecta but that may also be due to projected circumstellar dust at the forward shock. In
order to fit the featureless spectrum out to 70 µm, we must first correct for possible pro-
jected circumstellar dust emission. The exterior forward shock emission is most evident in
the northern and northwestern shell. Taking the typical brightness in the NW shell (∼20
MJy sr−1), and assuming the forward shock is a shell with 12% radial thickness, the pro-
jected brightness is less than 4-10% of the interior emission (∼40 MJy sr−1 after background
subtraction). We assume that the remaining wide-spread interior 70 µm emission is from
relatively cold, unshocked ejecta. Using the “corrected” 70 µm flux, the featureless spectra
are equally reproduced by three models (Models E, F, and G) in Table 1 and Figures 6 and
7. All fits include MgSiO3, FeO and Si, and either aluminum oxide, Fe, or a combination of
the two are required at long wavelength. Carbon dust can also produce featureless spectra at
low temperature but we exclude this composition because of the lack of Ne (produced from
carbon burning). Aluminum oxide and Fe dust are far more likely to be associated with the

– 9 –
unshocked ejecta because they result from O-burning and Si-burning, respectively and the
unshocked ejecta exhibit Si, S, and O+Fe line emission. However, one of the key challenges
in SN ejecta dust is to understand featureless dust such as Fe, C, and aluminum oxide, and
to link it to the associated nucleosynthetic products.
4. Dust Mass
We estimated the amount of freshly formed dust in Cas A based on our dust model fit
to each of the representative 21 µm-peak, weak-21 µm, and featureless spectra (Fig. 1). The
dust mass of i-grain type is given by:
Mdust,i =F i
ν d2
Bν(Td,i) κi=
F iνd
2
Bν(Td,i)
4 ρi a
3 Qabs,i
where F iν is the flux from i-grain species, d is the distance, Bν is the Planck function, ρi
is the bulk density, and a is the dust particle size. By employing the scale factor Ci and
the dust temperature Td,i derived from the spectral fit, the total dust mass is given by
Mdust =∑
i ρiΩd2Ci/3, where Ω is the solid angle of the source. The total mass of the 21
µm-peak dust is then determined by summing the flux of all the pixels in the 21 µm-peak
dust region (red region in Fig. 2f) and assuming each pixel in this region has the same dust
composition as the spectrum in Fig. 3. We took the same steps for the weak-21 µm dust
and the featureless dust.
The estimated total masses for each type of dust using a distance of 3.4 kpc (Reed et al.
1995) are listed in Table 1. Using the least massive composition in Table 1 for each of the
three dust classes yields a total mass of 0.020 M⊙ (the sum of masses from Models A, D, and
F). Using the most-massive composition for each of the three dust classes yields a total mass
of 0.054 M⊙ (the sum of masses from Models B, C, and E). The primary uncertainty in the
total dust mass between 0.020 and 0.054 M⊙ is due to the selection of the dust composition,
in particular for the featureless dust.
We also extracted a global spectrum of Cas A , but excluding most of the exterior
forward shock regions. The spectrum is well fit with the combination of our three types
of dust (including all compositions from Models A-G), as shown in Figure 8. We used
the dust composition of Models A-G as a guideline in fitting the global spectrum, because
the dust features (which were noticeable in representative spectra) were smeared out. Our
goal in fitting the global spectrum is to confirm consistency between the mass derived from
global spectrum and that derived from representative spectra described above. The total
estimated mass from the global spectrum fit is ∼0.028 M⊙, being consistent to the mass

– 10 –
determined from the individual fits to each dust class. The respective dust mass for each
grain composition is listed in Table 3. The masses of MgSiO3, SiO2, FeS and Si are more
than a factor of ten to hundred smaller than the predictions; the predictions (N03 and TF)
also have the dust features at 9 µm for MgSiO3, 21 µm for SiO2, and 30-40 µm for FeS
stronger than the observed spectra if the dust mass is increased. The carbon mass is also a
factor of 10 lower than the predictions. We were not able to fit the data with as much carbon
dust mass as expected, even if we use the maximum carbon contribution allowed from the
spectral fits.
5. Discussion
We find an estimated total freshly-formed dust mass of 0.020-0.054 M⊙ is required to
produce the mid-infrared continuum up to 70 µm. The dust mass we derive is orders of
magnitude higher than the two previous infrared estimates of 3.5×10⁻³ M⊙ and 7.7× 10⁻⁵
M⊙, which are derived by extrapolation from 1.6×10⁻⁴ M⊙ (D01) and 2.8× 10⁻⁶ M⊙ (ADM)
for selected knots, respectively. One of the primary reasons for our higher mass estimate
is that we include fluxes up to 70 µm while the fits in D01 and ADM accounted for dust
emission only up to 30 and ∼40 µm, respectively. The cold dust (40-150 K) has much
more mass than the warmer (>150 K) dust. In addition, our IRS mapping over nearly the
entire extent of Cas A with higher spatial and spectral resolutions provides more accurate
measurements, while D01 and ADM covered only a portion of the remnant. In addition,
ADM use only Mg protosilicate dust; the absorption coefficient for Mg protosilicate is a few
times larger than those of other compositions.
Our dust mass estimate is also at least one order of magnitude higher than the estimate
of 3× 10⁻³ M⊙ by Hines et al. (2004). They fitted MSX and Spitzer MIPS data with Mg
protosilicate. Note that they used only one composition. They derived a freshly synthesized
dust mass of 3×10⁻³ M⊙ at a temperature of 79-82 K and a smaller dust mass of 5×10⁻⁶ M⊙
at a higher temperature of 226-268 K, and they explained that the mass estimate depends
on the chosen dust temperature. As ADM mentioned, the absorption coefficient for Mg
protosilicate is a few times larger than those of other compositions. Therefore, even including
the long-wavelength data, the estimated mass was small since only Mg protosilicate was
modeled. With the photometry in Hines et al. (2004), one could easily fit the data with
only Mg protosilicate and would not need additional grain compositions. However, with the
accurate IRS data, many dust features and the detailed continnum shape could not be fit
solely with the Mg protosilicate. Note that the continuum shapes of weak 21 µm dust and
“featureless” dust are very different from the shape of protosilicate absorption coefficient.

– 11 –
Therefore, it was necessary to include many other compositions in order to reproduce the
observed IRS spectra.
It should be noted here that, in contrast with the previous works, we introduced Si and
Fe–bearing materials such as Si, Fe, FeS and FeO. We explain why we included such dust in
our model fitting as follows. Firstly, we included Si and Fe dust because these elements are
significant outputs of nucleosynthesis; indeed Woosley & Weaver (1995) show that Si and Fe
are primary products in the innermost layers of the ejecta. Secondly, we observed strong Si
and Fe lines in the infrared and X-ray spectra; strong Si lines were detected in the Spitzer
spectra, as shown in Figure 1 (also see D01), and the Fe line detection at 17.9 µm is also
shown in Figure 5. (The Fe maps at 17.9 µm and at 1.64 µm were presented in Ennis et al.
(2006) and Rho et al. (2003), respectively.) Si and Fe lines from ejecta are also bright in X-ray
emission (Hwang, Holt & Petre 2000). Thirdly, dust such as Si, Fe, FeO and FeS is predicted
to form in the ejecta of Population III supernovae (N03). TF and N03 predict Fe3O4 instead
of FeO in the uniformly mixed ejecta where the elemental composition is oxygen-rich, but
the kind of iron-bearing grains in oxygen-rich layers of the ejecta is still uncertain, partly
because the surface energy of iron is very sensitive to the concentration of impurities such as
O and S (as was discussed by Kozasa & Hasegawa (1988)), and partly because the chemical
reactions at the condensation of Fe-bearing dust is not well understood. Depending on the
elemental composition and the physical conditions in the ejecta, it is possible that Fe, FeO
and/or FeS form in the oxygen-rich layers of Galactic SNe. The observations of Cas A favor
FeO dust over Fe3O4, in order to match the spectral shape of the 21 µm-peak dust and
the weak-21 µm dust. This aspect should be explored theoretically in comparison with the
observations in the future.
Our total mass estimate is also about one order of magnitude higher than the estimate
of 6.9×10⁻³ M⊙ by Dwek (1987), who used IRAS fluxes (possibly confused by background
cirrus) and assumed a silicate–type dust as stellar or supernova condensates being present
in supernova cavity and heated up by the reverse shock. Our estimated mass is much less
than 1 M⊙, which Wilson & Batrla (2005) suggested may still be associated with the ejecta,
after accounting for results of high-resolution CO observations. Our estimated mass of 0.020
to 0.054 M⊙ is only derived for wavelengths up to 70 µm, so it is still possible that the
total freshly-formed dust mass in Cas A is higher than our estimate because there may be
colder dust present. Future longer-wavelength observations with Herschel, SCUBA-2 and
ALMA are required to determine if this is the case. Also note that we did not include any
mass from fast moving knots projected into the same positions as the forward shock, such
as in the northeast and southwest jets, and the eastern portions of the SNR outside the 21
µm-peak dust region (see Fig. 2e), because such dust could not be cleanly separated from
the interstellar/circumstellar dust.

– 12 –
We can use our dust mass estimate in conjunction with the models of N03 and TF to
understand the dust observed in the early universe. If the progenitor of Cas A was 15 M⊙,
our estimated dust mass (0.020-0.054 M⊙) is 7–18% of the 0.3 M⊙ predicted by the models.
If the progenitor mass was 30 M⊙, then the dust mass is 2–5% of the 1.1 M⊙ predicted by the
models. One reason our dust mass is lower than predicted by the models is that we cannot
evaluate the mass of very cold dust residing in the remnant from the observered spectra up
to 70 µm as described above, unless the predicted mass is overestimated. Another reason
is that when and how much dust in the remnant is swept up by the reverse shock is highly
dependent on the thickness of the hydrogen envelope at the time of explosion and that the
evolution and destruction of dust grains formed in SNe strongly depend not only on their
initial sizes but also the density of ambient interstellar medium (Nozawa et al. 2007). Dust
formation occurs within a few hundred days after the SN explosion (Kozasa et al. 1989;
TF; N03). Without a thick hydrogen envelope, given an age for Cas A of ∼300 years, a
significant component of dust may have already been destroyed if dust grains formed in the
ejecta were populated by very small-sized grains; otherwise, it is possible that some grain
types may be larger, which would increase the inferred mass.
We observed most of the dust compositions predicted by SN Type II models, and the
global ejecta composition is consistent with the unmixed-case N03 model than mixed-case
model; however, note that different morphologies of Ar and Si maps imply that some degree
of mixing has occurred. Our estimated dust mass with Spitzer data is one order of magnitude
smaller than the predicted models of dust formation in SNe ejecta by N03 and TF, but one
to two orders of magnitude higher than the previous estimations. We now compare the
dust mass in high-redshift galaxies with the observed dust mass of Cas A based on the
chemical evolution model of Morgan & Edmunds (2001). By a redshift of 4, SNe have been
injecting dust in galaxies for over 2 billion years and there is enough dust from SNe to explain
the lower limit on the dust masses (∼7×10⁷ M⊙) inferred in submm galaxies and distant
quasars (Chini & Kruegel 1994; Isaak et al. 2002). It should be noted with the dust mass
per SN implied by our results for Cas A alone, the interpretation of dust injection from
SNe is limited, because the amount of dust built up over time is strongly dependent on the
initial mass function, stellar evolution models and star formation rates (Morgan & Edmunds
2003), and destruction rates in supernova are believed to be important at timescales greater
than a few billion years. Additional infrared/submm observations of other young supernova
remnants and supernovae are crucial to measure physical processes of dust formation in
SNe including the dust size distribution, composition and dependence on nucleosynthetic
products and environment, and to understand the dust in the early Universe in terms of
dust injection from SNe.

– 13 –
6. Conclusion
1. We presented Spitzer IRS mapping covering nearly the entire extent of Cas A and
examined if SNe are primary dust formation sites that can be used to explain the high
quantity of dust observed in the early Universe.
2. The ejecta maps, show a remarkable similarity to the dust maps, thereby confirming
that dust formation occurs in the SN ejecta.
3. The IRS spectra of Cas A show a few dust features such as an unique 21 µm peak
in the continuum from Mg protosilicate, SiO2, and FeO. We observed most of the dust
compositions predicted by SN Type II dust models. However, the dust features in Cas A
favour Mg protosilicate rather than Mg2SiO4, and FeO rather than Fe3O4. The composition
infers that the ejecta are unmixed.
4. Our total estimated dust mass with Spitzer observations ranging from 5.5 - 70 µm is
0.020-0.054 M⊙, one order of magnitude smaller than the predicted models of dust formation
in SNe ejecta by N03 and TF, but one or more orders of magnitude higher than the previous
estimations. The freshly formed dust mass derived from Cas A is sufficient from SNe to
explain the lower limit on the dust masses in high redshift galaxies.
J. Rho thanks U. Hwang for helpful discussion of X-ray emission of Cas A. This work
is based on observations made with the Spitzer Space Telescope, which is operated by the
Jet Propulsion Laboratory, California Institute of Technology, under NASA contract 1407.
Partial support for this work was provided by NASA through an GO award issued by
JPL/Caltech.
REFERENCES
Arendt, R. G., Dwek, E., & Moseley, S. H. 1999, ApJ, 521, 234 (ADM)
Begemann, B. et al., 1997, ApJ, 476, 1991
Bertoldi, F., Carilli, C. L., Cox, P., Fan, X., Strauss, M. A., Beelen, A., Omont, A., Zylka,
R., 2003, a,406, 55
Bohren, C. F., Huffman, D. R., 1983, Absorption and scattering of light by small particles,
New York
Chevalier, R. & Soker1989, ApJ, 341, 867

– 14 –
Chini, R. & Kruegel, E., 1994, A&A, 288, L33
Clayton, D.D., Deneault, E. A.-N., Meyer, B.S., 2001, ApJ, 562, 480
DeLaney T., 2004, PhD thesis, U. Of Minnesota
DeLaney, T., Smith, J., Rudnick, L., Ennis, J., Rho, J., Reach, W., Kozasa, T., Gomez, H.,
2006, BAAS, 208, 59.03
DeLaney, T., Smith, J., Rudnick, L., Ennis, J., Rho, J., Reach, W., Kozasa, T., Gomez, H.,
2007, in preparation
Dorschner, J., Friedmann, C., Gutler, J., & Duley, W. W. 1980, Ap&SS, 68 159
Douvion, T., Lagage, P. O. & Pantin, E. 2001, A&A, 369, 589 (D01)
Dunne, L., Eales, S., Ivison, R., Morgan, H., & Edmunds, M. 2003, Nature, 424, 285
Dwek, E., Hauser, M. G., Dinerstein, H. L., Gillett, F. C., Rice, W. 1987, ApJ, 315, 571
Dwek, E. 2004, ApJ, 607, 848
Dwek, E., Galliano, F. & Jones, A. P. 2007, ApJ 662, 927
Ennis, J. et al., 2006, ApJ, 652, 376
Ercolano, B., Barlow, M. J., & Sugerman B. E. K., 2007, MNRAS, 375, 753
Fesen, R. A. 2001, ApJS, 133, 161
Gotthelf, E. V. et al., 2001, ApJL, 552, 39
Gomez H., Dunne L., Eales S., Gomez E., Edmunds M., 2005, MNRAS, 361, 1012
Gao, Y., Carilli, C.L., Solomon, P.M., Vanden Bout, P.A., 2007, ApJ, 660, L93
Hamilton, A. J. & Fesen, R. 1988, ApJ, 327, 178.
Henning, Th., Begemann, B., Mutschke, H., Dorschner, J, 1995, A&A Suppl. Ser. 112, 143
Hines, D. C. et al. 2004, ApJS, 154, 333
Hirashita, H., et al., 2005, MNRAS 357, 1077
Hwang, U., Holt, S. S., & Petre, R. 2000, 537, L119
Hwang, U., et al., 2004, ApJ, 615, 117

– 15 –
Isaak, K. G., Priddey, R. S., McMahon, R. G., Omont, A. et al. 2002, MNRAS, 329, 149
Jager, C., Dorschner, J., Mutschke, H., Posch, Th., Henning, Th. 2003, A&A, 408, 193
Kennicutt, R.C., Jr. et al., 2003, PASP, 115, 928
KifonidisK., Plewa, T., Janka, H.-T., & Muller, E. 2000, ApJ, 531, L123
Kozasa, T., & Hasegawa, H. 1988, Icarus, 73, 180
Kozasa, T., Hasegawa, H. & Nomoto, K. 1989, ApJ, 334, 325
Kozasa, T., Hasegawa, H., & Nomoto, K. 1991, A&A, 249, 474
Krause, O., et al., 2004, Nature, 432, 596
Lagage, P. O. et al., 1996, A&A, 315, L273
Maiolino et al. 2006, Memorie della Societa Astronomica Italiana, 77, 643
McCray, R. 1993, ARA&A, 31, 175
Meikle, W. P. S. et al. 2007, ApJ, 665,
Morgan, H. L., Dunne, L., Eales, S. A., Ivison, R. J., & Edmunds, M. G. 2003, ApJ, 597,
L33
Morgan, H. L. & Edmunds, M. G. 2003, MNRAS, 343, 427
Nozawa, T., Kozasa, T., Umeda, H., Maeda, K., & Nomoto, K. 2003, ApJ, 598, 785 (N03)
Nozawa, T. et al. 2007, ApJ preprint, arXiv:0706.0383
Pei, Y. C. & Fall, S. M., 1995, ApJ, 454, 69
Perez-Rendon B., Garcıa-Segura, G., & Langer, N., 2002, Ionized Gaseous Nebulae, Eds.
W. J. Henney, J. Franco, M. Martos, & M. Pena, Revista Mexicana de Astronomıa y
Astrofıca, 12, 94
Philipp, H. 1985, Handbook of Optical Constamts of Solids, ed. E. D. Palik, Academic Press,
San Diego,749
Piller, H. 1985, Handbook of Optical Constamts of Solids, ed. E. D. Palik, Academic Press,
571
Reed, J.E., Hester, J.J., Fabian, A.C., & Winkler, P.F., 1995, ApJ, 440, 706
– 16 –
Rho, J., Reynolds, S.P., Reach, W.T., Jarrett, T.H., Allen, G.E., & Wilson, J.C. 2003, ApJ,
592, 299
Smail I., Ivison R.J., Blain A.W., 1997, ApJ, 490, L5
Smith, J. D. T., Armus, L., Dale, D.A., Roussel, H., Sheth, K., Buckalew, B.A., Jarrett, T.
H., Helou, G., & Kennicutt, R. C., 2007, PASJ, submitted
Sugerman, Ben E. K. et al., 2006, Science, 313, 196
Todini, P. & Ferrara, A., 2001, MNRAS, 325, 726 (TF)
van den Bergh, S., 1971, ApJ, 165, 457
Wilson T.L., & Batrla W., 2005, A & A, 430, 561
Woosley, S. E., & Weaver, T. A., 1995, ApJS, 101, 181
Woosley, S. E., A. Heger, & Weaver, T. A 2002, Reviews of Modern Physics, 74, 1015
Young, P. A. et al. 2006, ApJ, 640, 891
Whittet D.C.B., 2003, Dust in the Galactic Environment, Second Edition, IOP, Cambridge
University Press, UK
This preprint was prepared with the AAS LATEX macros v5.2.

–17
–
Table 1. Properties of Freshly Formed Dust in Cas A
Dust Type Model Compositionsa Strong Nucleosynthesis Mass
(spectrum in Fig. 1) Lines Layers (M⊙)
21µm-peak (a) A Mg protosilicate, MgSiO3, SiO2, FeO, FeS, Si, Al2O3 Ar Inner-O, S-Si 0.0030
21µm-peak B Mg protosilicate, MgSiO3, FeO, SiO2, FeO, FeS, Si, Fe Ar Inner-O, S-Si 0.0120
weak-21µm (b) C C-glass, FeO, Al2O3, Si, Mg2SiO4 Ne, Si, Ar (S, O+Fe) C-burning 0.0180
weak-21µm D C-glass, FeO, Al2O3, Si, FeS, Mg protosilicate Ne, Si, Ar (S, O+Fe) C-burning 0.0157
Featureless (d) E MgSiO3, Si, FeS, Fe, Mg2SiO4 Si, S, (O+Fe) O, Al burning (Fe-Si-S) 0.0245
Featureless F MgSiO3, Si, FeS, Fe, Al2O3 Si, S, (O+Fe) O, Al burning (Fe-Si-S) 0.0171
Featureless G MgSiO3, Si, FeS, Al2O3, Mg2SiO4 Si, S, (O+Fe) O, Al burning (Fe-Si-S) 0.0009
aCompositions in the best fit, where a few primary compositions are written in bold, and alternative dust compositions are in italics.

–18
–
Table 2. Mass of dust with each composition
Composition Model Aa Model B Model C Model D Model E Model F Model G
Al2O3 6.66E-05 (083) 0.00E+00 (000) 5.13E-05 (105) 1.03E-04 (100) 0.00E+00 (000) 8.13E-04 (050) 6.50E-04 (060)
C glass 0.00E+00 (000) 0.00E+00 (000) 2.08E-03 (80/180) 1.07E-03 (80/220) 0.00E+00 (000) 0.00E+00 (000) 0.00E+00 (000)
MgSiO3 1.19E-08 (480) 1.19E-08 (480) 0.00E+00 (000) 0.00E+00 (000) 2.55E-05 (110) 3.19E-05 (110) 2.55E-05 (110)
Mg2SiO4 0.00E+00 (000) 0.00E+00 (000) 7.89E-05 (120) 0.00E+00 (000) 1.72E-06 (130) 0.00E+00 (000) 3.00E-06 (130)
Mg protosilicate 5.00E-05 (120) 4.67E-05 (120) 0.00E+00 (000) 3.77E-05 (120) 0.00E+00 (000) 0.00E+00 (000) 0.00E+00 (000)
SiO2 2.23E-03 (060/300) 1.40E-03 (065/300) 0.00E+00 (000) 0.00E+00 (000) 0.00E+00 (000) 0.00E+00 (000) 0.00E+00 (000)
Si 4.34E-04 (096) 4.34E-04 (100) 1.63E-03 (090) 8.17E-03 (080) 9.32E-04 (090) 1.24E-04 (120) 6.21E-05 (120)
Fe 0.00E+00 (075) 9.82E-03 (110) 0.00E+00 (000) 0.00E+00 (000) 2.16E-02 (95/135) 1.36E-02 (100/150) 0.00E+00 (000)
FeO 1.13E-04 (105) 2.11E-04 (095) 1.39E-02 (060) 5.97E-03 (065) 0.00E+00 (000) 0.00E+00 (000) 0.00E+00 (000)
FeS 1.20E-04 (150) 2.11E-04 (150) 0.00E+00 (000) 3.40E-04 (120) 1.94E-03 (055) 2.59E-03 (055) 1.29E-04 (100)
aThe numbers in parentheses are dust temperatures, and two numbers indicate two temperatures.

– 19 –
Table 3. Mass of dust with each composition
Composition Predicted (M⊙) Model (A+D+G)a Model (B+C+E)b Mass (global)c
Al2O3 2.40E-04 ∼ 9.00E-03 8.20E-04 5.1300E-05 1.22E-04 (105)
carbon 7.00E-02 ∼ 3.00E-01 1.07E-03 2.0767E-03 2.04E-03 (070/265)
MgSiO3 2.00E-03 ∼ 7.00E-3 2.55E-05 2.5500E-05 1.65E-04 (110)
Mg2SiO4 3.70E-02 ∼ 4.40E-1 3.00E-06 8.0620E-05 3.21E-05 (120)
Mg protosilicate d none 8.77E-05 4.6710E-05 6.70E-05 (110)
SiO2 2.50E-02 ∼ 1.400E-01 2.23E-03 1.3964E-03 1.35E-03 (065)
Si 7.00E-02 ∼ 3.00E-01 8.66E-03 2.9989E-03 4.42E-03 (080)
Fe 2.00E-02 ∼ 4.00E-02 0.00E+00 3.1459E-02 1.03E-02 (090)
FeO d none 6.08E-03 1.4136E-02 6.23E-03 (070)
FeS 4.00E-02 ∼ 1.10E-01 5.90E-04 2.1501E-03 2.90E-03 (090)
aThe sum of the masses using the least massive composition among models.
bThe sum of the masses using the most-massive compositions.
cThe mass using the global spectrum.
dsee the text for details.
– 20 –
Fig. 1.— Representative Set of Spitzer IRS spectra of Cas A. The contrast between contin-
uum shape and line emission is noticeable. Many of the strong ejecta lines are seen including
[Ar II] (7 µm), [Ar III] (8.9 µm), [Si IV] (10.5 µm), [Ne II] (12.8 µm), [Ne III] (15.5
µm), [S III](18.7 µm), [O IV] and [Fe II] (26 µm), [S III] (33.5 µm), [Si II] (34.8 µm), and
[Fe II] (35.3 µm). The dominant continuum shapes are 21 µm-peak dust showing a dust
feature at 21 µm often accompanied by a silicate emission feature at 9.8 µm with strong Ar
lines (red, curve a) and weak-21 µm dust with relatively strong Ne lines compared with Ar
(green curve, b). Featureless spectra include the continuous rising spectra (yellow, c), and
the gently rising spectra (blue, d) with strong O+Fe or Si lines. The positions of RA. and
Dec. are 350.900, 58.8356 (a), 350.812, 58.8075 (b), and 350.879 58.7911 (c), 350.857, 58.815
(d), and 350.862 58.8550 9 (e). For illustration, the spectra were multiplied by 1.4 (curve
a), 2.8 (b), 0.8 (c), 1.5 (d), and 2 (e), respectively. “Broad” continuum spectra arise from
interstellar/circumstellar medium (orange, e).

– 21 –
Fig. 2.— (a) 21 µm dust map; a continuum map of 19-23 µm subtracted by the baselines of
neighboring wavelengths. This dust map is remarkably similar to the [Ar II] map (b) the res-
olutions are convolved to match to each other). The image is centered at R.A. 23h23m25.86s
and Dec. +5849′14′′ (J2000), and covers an 7.87′ by 5′ field of view. (c) A combination of
[O IV] and [Fe II] line map at 26 µm. (d) [Si II] (34.8 µm) map. (e) MIPS 70 µm map from
Hines et al. (2004). The locations of the forward and reverse shock boundaries are marked
as ellipses where we adjusted for elongation from Gotthelf et al. (2001) using long-exposure
Chandra archival data (Hwang et al. 2004). (f) Distributions of three major groups of dust
types : 21µm-peak dust regions are in red (spectrum (a)), weak-21µm dust regions are in
green (spectrum (b)), and featureless-dust regions are in blue ((d) spectrum in Fig. 1). (Fig.
2 is a jpeg file)

– 22 –
Fig. 3.— 21 µm-peak dust spectrum superposed on the dust fit of Model A: A Spitzer IRS
spectrum towards a bright part of the northern shell fitted with dust compositions of Mg
proto-silicate, MgSiO3, SiO2, FeO, and Al2O3. The compositions suggest that the dust forms
around inner-oxygen and S-Si layers. The data and the total fit are shown in blue and thick
red lines, respectively, and MIPS fluxes are marked with squares. The dust temperatures are
shown in parentheses, and the dotted lines are from the second temperature components.
Synchrotron continuum contribution (green dashed line) is estimated based on the radio
fluxes and IRAC 3.6µm image.

– 23 –
Fig. 4.— 21 µm-peak dust superposed on the dust fit of Model B.

– 24 –
Fig. 5.— Weak-21 µm dust superposed on the dust fit of Model D: A second type of dust
continuum in Cas A. The distribution of this type of dust is shown in Fig. 2f, in green.

– 25 –
Fig. 6.— Featureless Dust Spectrum: the continuum can be fit with MgSiO3 and Fe (Model
E). The featureless spectra accompanies with S, Si, and O/Fe lines. The green dashed line
is predicted synchrotron emission model.

– 26 –
Fig. 7.— Featureless Dust Spectrum: The continuum can be fit with Al2O3, and MgSiO3
(Model G).

– 27 –
Fig. 8.— Total spectrum of Cas A and the dust fit of grains with a few primary contributions
of grain models. The dark green and brown lines are MgSiO3 (100 K) and SiO2 (65K),
respectively. The green dashed line is predicted synchrotron emission model.

This figure "f2.jpg" is available in "jpg" format from:
http://arxiv.org/ps/0709.2880v1