Observations of the Shell-type Supernova Remnant Cassiopeia A at TeV Energies with VERITAS
28
arXiv:1002.2974v1 [astro-ph.HE] 15 Feb 2010 Observations of the shell-type SNR Cassiopeia A at TeV energies with VERITAS V. A. Acciari 1 , E. Aliu 2 , T. Arlen 3 , T. Aune 4 , M. Bautista 5 , M. Beilicke 6 , W. Benbow 1 , D. Boltuch 2 , S. M. Bradbury 7 , J. H. Buckley 6 , V. Bugaev 6 , Y. Butt 8 , K. Byrum 9 , A. Cannon 10 , A. Cesarini 11 , Y. C. Chow 3 , L. Ciupik 12 , P. Cogan 5 , W. Cui 13 , R. Dickherber 6 , C. Duke 14 , T. Ergin 8 , S. J. Fegan 3,† , J. P. Finley 13 , G. Finnegan 15 , P. Fortin 16,† , L. Fortson 12 , A. Furniss 4 , N. Galante 1 , D. Gall 13 , G. H. Gillanders 11 , J. Grube 10 , R. Guenette 5 , G. Gyuk 12 , D. Hanna 5 , J. Holder 2 , D. Huang 17 , C. M. Hui 15 , T. B. Humensky 18 , P. Kaaret 19 , N. Karlsson 12 , M. Kertzman 20 , D. Kieda 15 , A. Konopelko 17,∗ , H. Krawczynski 6 , F. Krennrich 21 , M. J. Lang 11 , S. LeBohec 15 , G. Maier 5,% , S. McArthur 6 , A. McCann 5 , M. McCutcheon 5 , J. Millis 13,$ , P. Moriarty 22 , R. A. Ong 3 , D. Pandel 19 , J. S. Perkins 1 , M. Pohl 21,& , J. Quinn 10 , K. Ragan 5 , P. T. Reynolds 23 , E. Roache 1 , H. J. Rose 7 , M. Schroedter 21 , G. H. Sembroski 13 , A. W. Smith 9 , B. R. Smith 17 , D. Steele 12,# , S. P. Swordy 18 , M. Theiling 1 , S. Thibadeau 6 , A. Varlotta 13 , V. V. Vassiliev 3 , S. Vincent 15 , R. G. Wagner 9 , S. P. Wakely 18 , J. E. Ward 10 , T. C. Weekes 1 , A. Weinstein 3 , T. Weisgarber 18 , S. Wissel 18 , M. Wood 3
-
Upload
independent -
Category
Documents
-
view
1 -
download
0
Transcript of Observations of the Shell-type Supernova Remnant Cassiopeia A at TeV Energies with VERITAS
arX
iv:1
002.
2974
v1 [
astr
o-ph
.HE
] 1
5 Fe
b 20
10
Observations of the shell-type SNR Cassiopeia A at TeV energies
with VERITAS
V. A. Acciari1, E. Aliu2, T. Arlen3, T. Aune4, M. Bautista5, M. Beilicke6, W. Benbow1,
D. Boltuch2, S. M. Bradbury7, J. H. Buckley6, V. Bugaev6, Y. Butt8, K. Byrum9,
A. Cannon10, A. Cesarini11, Y. C. Chow3, L. Ciupik12, P. Cogan5, W. Cui13,
R. Dickherber6, C. Duke14, T. Ergin8, S. J. Fegan3,†, J. P. Finley13, G. Finnegan15,
P. Fortin16,†, L. Fortson12, A. Furniss4, N. Galante1, D. Gall13, G. H. Gillanders11,
J. Grube10, R. Guenette5, G. Gyuk12, D. Hanna5, J. Holder2, D. Huang17, C. M. Hui15,
T. B. Humensky18, P. Kaaret19, N. Karlsson12, M. Kertzman20, D. Kieda15,
A. Konopelko17,∗, H. Krawczynski6, F. Krennrich21, M. J. Lang11, S. LeBohec15,
G. Maier5,%, S. McArthur6, A. McCann5, M. McCutcheon5, J. Millis13,$, P. Moriarty22,
R. A. Ong3, D. Pandel19, J. S. Perkins1, M. Pohl21,&, J. Quinn10, K. Ragan5,
P. T. Reynolds23, E. Roache1, H. J. Rose7, M. Schroedter21, G. H. Sembroski13,
A. W. Smith9, B. R. Smith17, D. Steele12,#, S. P. Swordy18, M. Theiling1, S. Thibadeau6,
A. Varlotta13, V. V. Vassiliev3, S. Vincent15, R. G. Wagner9, S. P. Wakely18, J. E. Ward10,
T. C. Weekes1, A. Weinstein3, T. Weisgarber18, S. Wissel18, M. Wood3
– 2 –
1Fred Lawrence Whipple Observatory, Harvard-Smithsonian Center for Astrophysics,
Amado, AZ 85645, USA
2Department of Physics and Astronomy and the Bartol Research Institute, University of
Delaware, Newark, DE 19716, USA
3Department of Physics and Astronomy, University of California, Los Angeles, CA 90095,
USA
4Santa Cruz Institute for Particle Physics and Department of Physics, University of Cal-
ifornia, Santa Cruz, CA 95064, USA
5Physics Department, McGill University, Montreal, QC H3A 2T8, Canada
6Department of Physics, Washington University, St. Louis, MO 63130, USA
7School of Physics and Astronomy, University of Leeds, Leeds, LS2 9JT, UK
8Harvard-Smithsonian Center for Astrophysics, 60 Garden Street, Cambridge, MA 02138,
USA
9Argonne National Laboratory, 9700 S. Cass Avenue, Argonne, IL 60439, USA
10School of Physics, University College Dublin, Belfield, Dublin 4, Ireland
11School of Physics, National University of Ireland, Galway, Ireland
12Astronomy Department, Adler Planetarium and Astronomy Museum, Chicago, IL 60605,
USA
13Department of Physics, Purdue University, West Lafayette, IN 47907, USA
14Department of Physics, Grinnell College, Grinnell, IA 50112-1690, USA
15Department of Physics and Astronomy, University of Utah, Salt Lake City, UT 84112,
USA
16Department of Physics and Astronomy, Barnard College, Columbia University, NY
10027, USA
17Department of Physics, Pittsburg State University, 1701 South Broadway, Pittsburg, KS

– 3 –
Received ; accepted
66762, USA
18Enrico Fermi Institute, University of Chicago, Chicago, IL 60637, USA
19Department of Physics and Astronomy, University of Iowa, Van Allen Hall, Iowa City,
IA 52242, USA
20Department of Physics and Astronomy, DePauw University, Greencastle, IN 46135-0037,
USA
21Department of Physics and Astronomy, Iowa State University, Ames, IA 50011, USA
22Department of Life and Physical Sciences, Galway-Mayo Institute of Technology, Dublin
Road, Galway, Ireland
23Department of Applied Physics and Instrumentation, Cork Institute of Technology, Bish-
opstown, Cork, Ireland
$Now at Department of Physics, Anderson University, 1100 East 5th Street, Anderson,
IN 46012
&Now at Institut fur Physik und Astronomie, Universitat Potsdam, 14476 Potsdam-Golm,
Germany; DESY, Platanenallee 6, 15738 Zeuthen, Germany
%Now at DESY, Platanenallee 6, 15738 Zeuthen, Germany
#Now at Los Alamos National Laboratory, MS H803, Los Alamos, NM 87545
†Now at Laboratoire Leprince Ringuet, Ecole Polytechnique, CNRS, IN2P3, Palaiseau,
France
*corresponding author
– 4 –
ABSTRACT
We report on observations of very high-energy γ rays from the shell-type
supernova remnant Cassiopeia A with the VERITAS stereoscopic array of four
imaging atmospheric Cherenkov telescopes in Arizona. The total exposure time
for these observations is 22 hours, accumulated between September and Novem-
ber of 2007. The γ-ray source associated with the SNR Cassiopeia A was de-
tected above 200 GeV with a statistical significance of 8.3σ. The estimated
integral flux for this γ-ray source is about 3% of the Crab-Nebula flux. The
photon spectrum is compatible with a power law dN/dE ∝ E−Γ with an index
Γ = 2.61 ± 0.24stat ± 0.2sys. The data are consistent with a point-like source.
We provide a detailed description of the analysis results, and discuss physical
mechanisms that may be responsible for the observed γ-ray emission.
1. Introduction
Cassiopeia A is the youngest of the historical galactic supernova remnants (SNR); it
first appeared in the sky about 1680 (Ashworth 1980; Stephenson & Green 2002). The
best estimate of the actual Cassiopeia A SN explosion date is AD 1680.5±18.7, which was
deduced from the HST (Hubble Space Telescope) measurements of the expansion of ejecta
knots (Fesen et al. 2006). It is also the brightest and one of the best studied radio sources
in the sky (e.g, Kassim et al. (1995)). Located 3.4 kpc away (Reed et al. 1995), the optical
shell of 2.5′ radius corresponds to a physical size of about 2.5 pc. The synchrotron radiation
of Cassiopeia A extends from radio wavelengths through the sub-millimeter (Mezger et al.
1986) and near-infrared (Tuffs et al. 1997) all the way to hard X-rays (Allen et al. 1997;
Favata et al. 1997; Vink et al. 2001; Renaud et al. 2006). The nature of the hard X-ray
– 5 –
emission measured up to 100 keV still remains unclear (see Helder & Vink (2008)), albeit
the morphology of the non-thermal X-ray emission is dominated by faint, well-defined
filaments and knots (Hughes et al. 2000; Vink & Laming 2003), which are possibly sites
of cosmic ray acceleration. These energetic hadronic cosmic rays (CR) can subsequently
produce γ rays in collisions with ambient gas via π◦-decay (Drury et al. 1994).
EGRET did not detect γ-ray emission above 100 MeV from Cassiopeia A (Esposito et al.
1996). Likewise, first attempts to detect TeV γ-ray emission from the ground with the
10 m Whipple telescope (Lessard et al. 1999) and with CAT (Goret et al. 1999) resulted
only in upper limits. With an exposure of 232 hours, accumulated during the summer
months of 1997, 1998, and 1999, HEGRA detected TeV γ-ray emission associated with
Cassiopeia A (Aharonian et al. 2001). A 5σ detection of Cassiopeia A resulted in a flux
estimate of (5.8 ± 1.2stat ± 1.2syst) × 10−13 cm−2s−1 above 1 TeV. The energy spectrum
measured in a range from 1 to 10 TeV was consistent with a power law with a photon index
of Γ = 2.5 ± 0.4stat ± 0.1syst. Recently MAGIC and VERITAS have made observations of
Cassiopeia A at a substantially lower energy threshold.
Cassiopeia A was observed with the 17 m MAGIC telescope between July 2006 and
January 2007 for a total exposure of 47 hours (Albert et al. 2007). The γ-ray source was
detected above 250 GeV at the level of statistical significance of 5.2σ, with a photon flux
above 1 TeV of (7.3± 0.7stat ± 2.2syst)× 10−13 cm−2s−1. The photon spectrum is compatible
with a power law with an index Γ = 2.3 ± 0.2stat ± 0.2syst. The source is point-like for the
given angular resolution of the telescope. The position of the MAGIC source is consistent
with the source position previously published by HEGRA. In addition, the energy spectrum
measured by MAGIC agrees within statistical errors with that measured by HEGRA.
Here we report on observations of Cassiopeia A with the VERITAS stereoscopic
array of four imaging atmospheric Cherenkov telescopes in Arizona. In this paper a short
– 6 –
description of the experiment is followed by a summary of observational data and analysis
results. Finally a discussion of the physics implications of VERITAS data for existing
models of TeV γ-ray emission from Cassiopeia A is given.
2. Experiment
VERITAS (Very Energetic Radiation Imaging Telescope Array System) (Weekes et al.
2002) is an array of four imaging atmospheric Cherenkov telescopes located in southern
Arizona (31◦40′ N, 110◦57′ W) at an altitude of 1.3 km. The four VERITAS telescopes
are almost identical in their technical parameters (Holder et al. 2006). The 12 m optical
reflector of a VERITAS telescope is a tessellated structure consisting of 357 identical
spherical mirror facets, which are hexagonal in shape. The arrangement of the mirror facets
constitutes a Davies-Cotton design (Davies & Cotton 1957), providing a total reflecting
area of 110 m2. The point-spread function of a VERITAS telescope has a FWHM of ∼ 4′
on-axis (McCann, Hanna, & McCutcheon 2009). A high-resolution imaging camera placed
at the focus of the reflector consists of 499 photomultiplier tubes (PMTs) in a close-packed
hexagonal arrangement and has a field of view of 3.5◦. Each camera PMT views a circle of
diameter 0.15◦ on the sky. A set of light concentrators is mounted in front of the PMTs
to increase the light-collection efficiency and block the off-axis light. The camera triggers
if the signal in each of any three adjacent PMTs exceeds a discriminator threshold of
50 mV, corresponding to approximately 4-5 photoelectrons. A coincidence of at least two
cameras triggering within a time gate of 100 ns is required to read out an event. A 48 ns
(24-samples) length of each PMT signal is digitized with custom-built 500 MegaSamples/s
flash-ADC electronics. The nominal trigger rate of the four-telescope array was about
230 Hz at zenith. The cameras are flat-fielded and calibrated using nightly measured
laser runs. The pedestal and pedestal variances (σ), which provide a measure of the night
– 7 –
sky background noise level, were calculated during each data run using pedestal events,
injected at a 1 Hz frequency. The pedestal variances were used for computing the dynamic
picture and boundary thresholds for consequent image cleaning. All PMTs with a signal
exceeding the picture threshold (5σ) were used in the image parametrization. PMTs with
a signal exceeding the boundary threshold (2.5σ) but lying near the picture PMTs were
also selected. (e.g., see Holder et al. (2006)). To characterize the shape and orientation
of calibrated images recorded by each telescope, the standard second-moment parameters
were calculated as described by Reynolds et al. (1993).
3. Summary of Data
Cassiopeia A was observed with VERITAS for 22 hours between September and
November of 2007. All observations were made with the full four-telescope array during
moonless nights. The data-analysis pipeline consists of two distinct phases. After the data
are processed, the distributions from the raw data are accumulated as diagnostics of both
the instrument performance and the stability of the weather conditions. Each data run is
inspected for rate, timing and tracking consistency, and either accepted or rejected based on
this first pass. Once this diagnostic pass is made, acceptable runs are further analyzed. All
data were taken in 20-minute runs using the so-called Wobble source-tracking mode, which
is optimal for observations of a point-like source. In Wobble mode the source is positioned
at a 0.5◦ offset from the center of the field of view of the camera during observations, which
allows for both on-source observations and simultaneous estimation of the background
contamination caused by charged cosmic rays. The number of background events in the
signal region was estimated using a number of regions distributed symmetrically with
respect to the center of the camera for each wobble offset. The offset directions towards
North, South, East, or West, were consequently alternated on a run-by-run basis. A total
– 8 –
of 74 data runs were collected at zenith angles between 26◦ and 39◦. The average zenith
angles and the average event trigger rate were 31.5◦ ± 3.7◦ and 232 ± 12 Hz, respectively.
Prior to applying analysis cuts, data were selected for adequate image quality, by requiring
a minimum integrated charge of all pixels in the image of 400 digital counts (approximately
80 photo-electrons) and a maximum distance of the image’s centroid from the center of
the field of view of 1.43◦. These cuts were a priori optimized using the Crab Nebula data
sample. Each accepted event was also required to contain at least two images passing these
cuts. The VERITAS experimental setup during Cassiopeia A observations included two
telescopes placed at a rather small separation of 35 m. Coincidence events including both
of these telescopes have been removed from the analysis. During the summer of 2009, one
of these telescopes was relocated in order to improve the sensitivity of the array.
4. Data Analysis
The imaging analysis of the VERITAS data is based on the reconstruction of the
shower direction for each individual event (Konopelko et al. 1999; Hofmann et al. 1999;
Krawczynski et al. 2006), and joint parametrization of the shape of the Cherenkov light
flash from an individual shower using a multiple-telescope approach (Konopelko 1995;
Krawczynski et al. 2006). All recorded events were subjected to the canonical directional
cut on θ2, where θ is the angular distance between the true source position on the sky and
the reconstructed one. Of the remaining events, the candidates for γ-ray showers were
selected using two simultaneously applied cuts on the parameters of image shape: MSW
(mean scaled Width) and MSL (mean scaled Length). These three major analysis cuts were
optimized using Crab Nebula observational data from the same epoch, chosen for the same
zenith angle range as covered in observations of Cassiopeia A. The choice of optimal analysis
cuts depends noticeably on the flux of the putative γ-ray source. Therefore, we developed
– 9 –
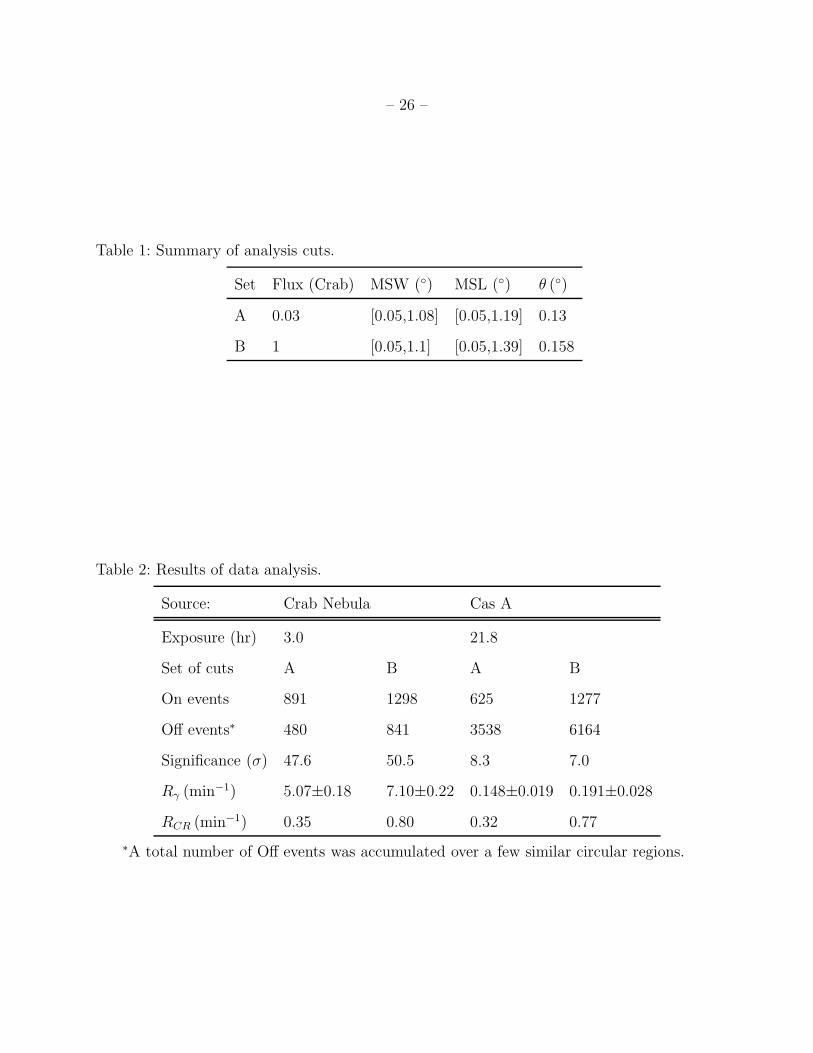
two sets of analysis cuts, appropriate for flux levels of 1 and 0.03 Crab (see Table 1)
respectively. Both sets of optimal analysis cuts yield comparable signal significances for the
Crab Nebula as well as Cassiopeia A (Table 2).
The VERITAS array enables measurement of the arrival direction of every individual
shower detected. All recorded events that have passed both the image quality cuts and
specific analysis cuts can be plotted in a two-dimensional sky map. Even after applying
rather strict selection criteria such maps are dominated by the flux of the isotropic cosmic
ray background. A number of methods (background models) have been developed for
effective removal of background (Berge et al. 2007). These models can effectively handle
the background issues of diverse observations, but the weaknesses or strengths of any
particular approach depend on the flux, angular morphology, and spectrum of a given γ-ray
source. In this paper we used a method that is rather stable with respect to any systematic
background inhomogeneity across the camera field of view, the so-called ring-background
model. In this model, a ring (annulus) around the location of a putative γ-ray source in
the camera focal plane provides an immediate background estimate. The canonical angular
radius of the background ring is 0.5◦, whereas the angular area (solid angle) covered by the
ring is typically chosen to be larger than that of the circular source region by a factor of
7-10. The excess map of the sky region around Cassiopeia A for the data set of 22 hours is
shown in Figure 1. An evident excess due to γ rays at a 8.3σ level of statistical significance
(Li & Ma 1983) can be observed at the position of Cassiopeia A. This result has been
cross-checked using a standard Wobble analysis.
5. Source Localization
The energy-averaged angular resolution of the VERITAS array for an individual γ-ray
event is approximately 4′ to 6′

– 10 –
γ-ray source detected by VERITAS appears as a spot of finite size in the expanded γ-ray
sky map. The centroid of this spot is taken as the coordinates of the putative γ-ray emitter.
Any error in the telescope pointing direction will deteriorate the exact measurement of
the γ-ray source position. Note that the pointing accuracy of the telescopes is limited,
by small misalignment of azimuth and altitude axes, and elastic deformations of the
telescope structure. These effects contribute to the mispointing of the array, which strongly
depends on the altitude and azimuth of observation. Most of the pointing uncertainties
can be substantially diminished by taking pointing calibration data on a monthly basis.
Each telescope is pointed at a number of bright stars uniformly distributed on the sky.
The star is imaged by the telescope mirror onto a screen in front of the Cherenkov
camera, and the image is recorded by a CCD camera. The position of each spot is then
compared to the nominal center of the Cherenkov camera. These results contribute to a
multi-parameter pointing model in the telescope tracking software that corrects for the
measured misalignment during observation. This procedure was extensively tested on a
number of VHE γ-ray point sources of known position. In addition, the residual mispointing
can be evaluated from a detailed comparison of the nominal position of the source evaluated
for the different wobble offsets, energy thresholds, telescope multiplicities, analysis cuts,
etc. During Cassiopeia A observations the systematic pointing error of the VERITAS array
is ∼ 1.2′.
The measured position of the γ-ray source is determined by a fit over a circular window
of 0.5◦ radius centered on Cassiopeia A using its known coordinates. The profile of the
γ-ray excess can be modeled by the two-dimensional Gaussian distribution:
f(θx, θy) ∝ exp(−1
2((θx − θxo)
2
σ2x
+(θy − θyo)
2
σ2y
), (1)
where θxo, θyo are the angular coordinates of the γ-ray emission centroid, and σ2x, σ
2y
are the extensions of the signal region in two perpendicular directions. The width of the
– 11 –
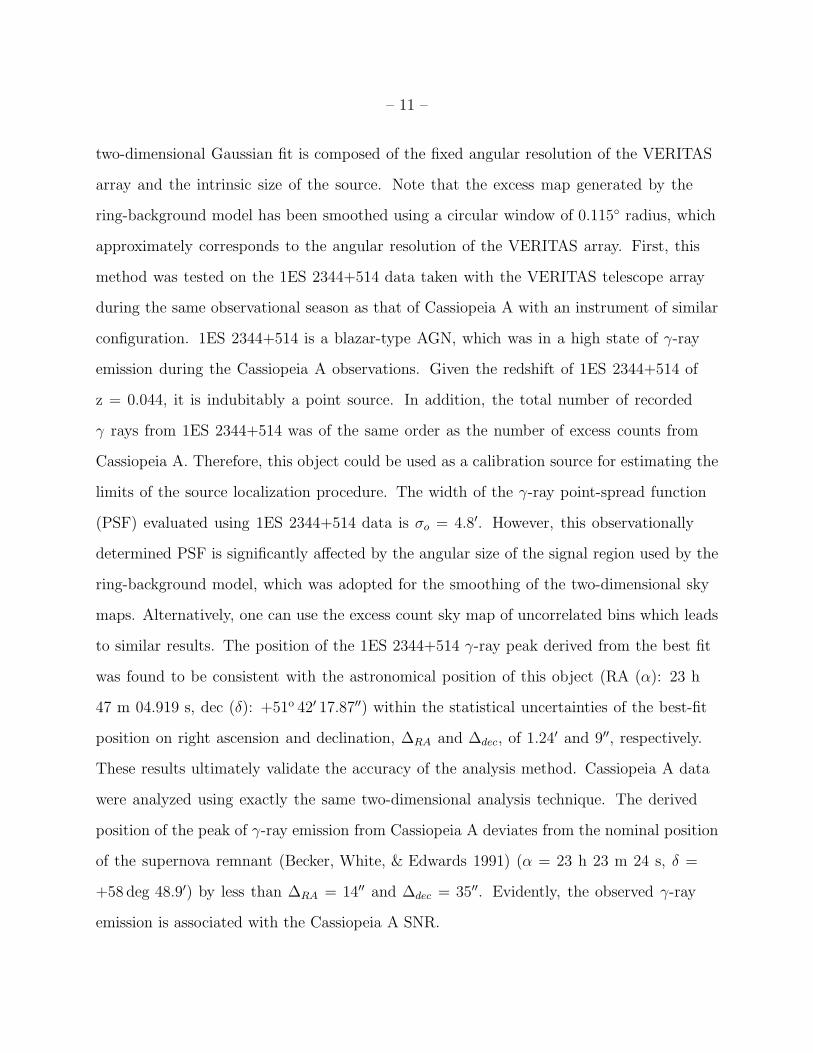
two-dimensional Gaussian fit is composed of the fixed angular resolution of the VERITAS
array and the intrinsic size of the source. Note that the excess map generated by the
ring-background model has been smoothed using a circular window of 0.115◦ radius, which
approximately corresponds to the angular resolution of the VERITAS array. First, this
method was tested on the 1ES 2344+514 data taken with the VERITAS telescope array
during the same observational season as that of Cassiopeia A with an instrument of similar
configuration. 1ES 2344+514 is a blazar-type AGN, which was in a high state of γ-ray
emission during the Cassiopeia A observations. Given the redshift of 1ES 2344+514 of
z = 0.044, it is indubitably a point source. In addition, the total number of recorded
γ rays from 1ES 2344+514 was of the same order as the number of excess counts from
Cassiopeia A. Therefore, this object could be used as a calibration source for estimating the
limits of the source localization procedure. The width of the γ-ray point-spread function
(PSF) evaluated using 1ES 2344+514 data is σo = 4.8′. However, this observationally
determined PSF is significantly affected by the angular size of the signal region used by the
ring-background model, which was adopted for the smoothing of the two-dimensional sky
maps. Alternatively, one can use the excess count sky map of uncorrelated bins which leads
to similar results. The position of the 1ES 2344+514 γ-ray peak derived from the best fit
was found to be consistent with the astronomical position of this object (RA (α): 23 h
47 m 04.919 s, dec (δ): +51o 42′ 17.87′′) within the statistical uncertainties of the best-fit
position on right ascension and declination, ∆RA and ∆dec, of 1.24′ and 9′′, respectively.
These results ultimately validate the accuracy of the analysis method. Cassiopeia A data
were analyzed using exactly the same two-dimensional analysis technique. The derived
position of the peak of γ-ray emission from Cassiopeia A deviates from the nominal position
of the supernova remnant (Becker, White, & Edwards 1991) (α = 23 h 23 m 24 s, δ =
+58 deg 48.9′) by less than ∆RA = 14′′ and ∆dec = 35′′. Evidently, the observed γ-ray
emission is associated with the Cassiopeia A SNR.
– 12 –
6. Source Extension
The angular radius of Cassiopeia A, measured at wavelengths longer than those
corresponding to TeV energies, is about 2.5′. Primarily, this can be used as a characteristic
angular size of the TeV γ-ray source. It is apparent that such a small angular dimension
of Cassiopeia A is well below the angular resolution (PSF) of VERITAS, σ◦ ≃ 4.8′, which
unavoidably smears out the intrinsic source distribution and consequently does not permit
detailed mapping of the morphology of the γ-ray source. The angular profile of the observed
γ-ray peak finally constrains the intrinsic angular size of the source. The two-dimensional,
azimuthally symmetric Gaussian function could be naturally used to model the measured
angular shape of the γ-ray signal. The angular extent of the γ-ray peak towards Cassiopeia
A measured with VERITAS is σCasA =5.3±0.5′.
The angular extent of the point-spread function can be derived from the data taken on
a calibration γ-ray source. For that we can use again the contemporaneous observations
of 1ES 2344+514. The best fit of the γ-ray peak for 1ES 2344+514 gives σ = 4.8±0.2′.
If we assume a γ-ray source with a Gaussian profile, an approximate upper limit on the
source extent can be calculated by summing the measured extents of the PSF and the
Cassiopeia A γ-ray signal in quadrature, σs = (σ2CasA − σ2)1/2 . 3.5′. Thus, given rather
large statistical errors of the involved angular extents the shape of the Cassiopeia A signal
is hardly distinguishable from the point-spread function and the γ-ray signal is statistically
consistent with the point source.
The low statistics of currently recorded γ rays from Cassiopeia A are not sufficient
to draw a final conclusion on the source extension. A further, deeper, observation of
Cassiopeia A with VERITAS might help to improve the measurement of the angular
extension of the TeV γ-ray source.
– 13 –
7. Energy Reconstruction
Stereoscopic observations of atmospheric showers with four VERITAS telescopes enable
accurate localization of the shower axis in the ground plane. Thus the impact distances from
the shower axis to the system telescopes can be calculated in a straightforward manner. The
generic reconstruction algorithm (Konopelko et al. 1999) is based on a simultaneous use
of image orientation in several telescopes for each individual event. The accuracy of such
reconstruction is limited by the uncertainties in the determination of the image orientation.
By observing γ-ray showers at zenith angles less than 45◦ and restricting the impact
distances to less than 250 m, the average accuracy in evaluation of the telescope impacts
is better than 10 m. If the distance from the shower axis to the telescope (ri, i = 1, n,
where n is the number of recorded images) is known, the primary energy of the air shower
can be evaluated using the inverse function of the image size with respect to the shower
energy Ei = F (Si, ri, θ) (Konopelko et al. 1999). Here Si stands for the image size (the
total number of photoelectrons in the image), ri is the impact distance, and θ is the zenith
angle. This function can be well represented by a multi-variable look-up table, which
contains the mean energy for Monte Carlo simulations across the range of image sizes
and impact distances of recorded γ-ray showers. Such look-up tables were created for a
number of zenith angles. Finally, the shower energy can be computed by averaging over all
reconstructed energies for individual telescopes Ei, i = 1, n, as Eo =∑
iwiEi, where wi is
the statistical weight (∑
i wi = 1). Rather accurate and robust estimations can be achieved
for wi = 1/n. The energy resolution of the VERITAS array of four imaging air Cherenkov
telescopes averaged over the entire dynamic energy range is 15-20%. Note that the energy
resolution is unavoidably limited by the fluctuations in image size for a given shower energy.
In order to control any possible systematic biases in the energy reconstruction, one
can use the error in the reconstructed energy, δE = (E − Eo)/Eo as a function of the true
– 14 –
energy, Eo. Even though this error usually does not exceed a 5% level over the energy range
from 150 GeV to 10 TeV, a positive bias can be observed at energies close to the threshold
and a negative drop-off can be seen at very high energies. These biases are an intrinsic
feature of the reconstruction algorithms and have been well understood using detailed
Monte Carlo simulations. To diminish any noticeable effect of these biases on the measured
energy spectrum, one can limit the lowest and highest energy by requiring that the energy
bias does not exceed 20% (see, e.g., Aharonian et al. (2006)). Note that the effective energy
range chosen for the spectrum evaluation substantially depends on the zenith angle of
observations as well as on the actual setup of a system configuration.
8. Spectral Analysis
Despite the fact that stereoscopic observations with four VERITAS telescopes provide
very efficient rejection of the cosmic ray background, the sample of selected γ-ray-like
events still contains a substantial fraction of background cosmic rays. In order to remove
any effect of background on the reconstructed energy spectrum of γ rays, a similar energy
reconstruction procedure has to be applied to the events acquired from a number of purely
background regions as defined in the wobble-mode analysis. This enables a proper estimate
of the background contamination, which has to be subtracted from the signal region. The
resulting energy-dependent γ-ray rate can be used for the spectrum evaluation by applying
a specific response matrix, which handles various zenith angles, system configurations,
observational modes, analysis setups, etc. Such a response matrix represents a complete set
of effective collection areas of the instrument, which can be derived using detailed Monte
Carlo simulations. The CORSIKA shower simulation code (see Maier et al. (2007)) was
used to generate the γ-ray- and cosmic-ray-induced air showers over the accessible range of
zenith angles and in the energy range between 50 GeV and 100 TeV, assuming the γ-ray

– 15 –
energy spectrum to be a power law with an index of 2.0. Simulations of the VERITAS
response were carried out using the GrISU code, developed by the Grinnell College and
Iowa State University groups (e.g., see Maier et al. (2007)). Simulations were compared
with data in great detail. In order to avoid any remaining small energy biases in the
energy reconstruction discussed above, it was necessary to compute the effective collection
areas as a function of the reconstructed energy rather than true shower energy (see, e.g.,
Aharonian et al. (2006)). This helps to complete the unfolding of the intrinsic source
spectrum.
The complete spectrum evaluation procedure has been tested on the Crab Nebula data
taken during 2007/2008 observation season. The result is consistent with the previous
measurements of the Crab Nebula spectrum with HEGRA (Aharonian et al. 2004),
HESS (Aharonian et al. 2006), and MAGIC (Albert et al. 2008), as well as measurements
made using VERITAS data but different analysis tools. Spectral analysis of the Cassiopeia A
data leads to the energy spectrum
dNγ
dE= (1.26± 0.18)× 10−12(E/1 TeV )−2.61±0.24stat±0.2sys cm−2s−1TeV−1, (2)
with the flux normalization
Fγ(> 1 TeV ) = (7.76± 0.11)× 10−13 cm−2s−1. (3)
A power-law fit to the Cassiopeia A spectrum yields a χ2 = 2.15 for 4 degrees of freedom
with a chance probability of P = 0.71%. This result is in good agreement with the HEGRA
spectrum estimate (Aharonian et al. 2001) as well as the recently published MAGIC
spectrum (Albert et al. 2007) (see Figure 2). Currently, the rather limited exposure on
Cassiopeia A with VERITAS limits spectral measurements to the energy range from
300 GeV to 5 TeV. The spectrum measured over this interval does not reveal any break of
a spectral slope or cutoff. Limiting the upper energy bound for the spectral fit at 3 TeV
– 16 –
results in a flatter spectrum index (Γ=2.4), even though the combination of the statistical
and systematic errors does not allow us to draw any firm conclusion. Despite the fact that
no γ-ray events were detected above 6 TeV, the statistical significance of this result is not
sufficient for any firm statement regarding possible deviation of the spectral shape from a
simple power law. Any other, more sophisticated, multi-parameter fit functions are not
favored over a simple power law. Adding to the spectral fit an exponential cutoff term,
dNγ/dE ∝ E−Γe−E/Eo, does not improve the result but rather degrades the quality of the fit.
For the cutoff energy Eo = 2 TeV (Γ = 2.35) the fit gives the χ2-value of 3.1 (P = 0.54%).
Further reduction of the cutoff energy down to Eo=1 TeV (Γ = 1.46) destroys the spectral
fit (χ2=5.4, P = 0.25%). This result shows that the value of possible high-energy cutoff in
the Cassiopeia A spectrum is outside the energy range measured here. Future observations
with VERITAS will help to extend the spectral measurements for Cassiopeia A SNR.
9. Discussion
Understanding the mechanism of particle acceleration in isolated SNR shocks is
of great interest. The question of whether or not the very-high-energy γ–ray emission
of Galactic supernova remnants implies a sufficiently high flux of charged cosmic rays,
merging into a steady flux of Galactic cosmic rays, remains one of the most stimulating
rationales for ground-based γ–ray astronomy. Following initial, simplified estimates of the
expected γ-ray flux from Galactic SNR (Drury et al. 1994), more refined models have been
developed to describe particle acceleration in, and high-energy emission from, Cassiopeia A
(e.g. Atoyan et al. 2000b; Berezhko, Puhlhofer & Volk 2003). Cassiopeia A is one of the
best-studied SNR in the Galaxy, and a multitude of observations in different wavebands
constrain its physical properties and hence the environment in which particle-acceleration
processes operate. The analysis of scattered optical light indicates that Cassiopeia A was of
– 17 –
type IIb and originated from the collapse of the helium core of a red supergiant that had
lost most of its hydrogen envelope before exploding (Krause et al. 2008).
Cassiopeia A is a very bright radio (Bell et al. 1975) and X-ray source (Holt et al.
1994). Borkowski et al. (1996) have modeled the thermal X-ray emission, including
the present size and expansion rate. They concluded that the fast wind of the final
blue-supergiant stage of the progenitor has swept into a dense shell the wind material from
the earlier red-supergiant phase. The SNR blast wave has already passed through and
accelerated the dense (nH ≃ 15 cm−3) shell of circumstellar material (CSM). About 8 M⊙ of
X-ray-emitting swept-up gas is found in Cassiopeia A, mostly in the form of heavy elements
and predominantly located in the CSM shell and the outer, unperturbed, red-supergiant
wind (Willingale et al. 2003). The presence of a jet, numerous slow-moving flocculi, and the
general asymmetry of the remnant requires careful 3-D modeling of the supernova explosion
(Laming & Hwang 2003; Young et al. 2006), which has recently been used to demonstrate
the absence of a WR phase of the progenitor van Veelen et al. (2009).
The high gas density combined with the high radio flux observed from Cassiopeia A
permit an estimate of the magnetic field strength, because the radio-emitting electrons must
produce non-thermal bremsstrahlung between 100 MeV and 10 GeV (Cowsik & Sarkar
1980). An upper limit on the GeV-band flux has been derived using EGRET data
(Esposito et al. 1996), which in a one-zone model leads to a lower limit on the magnetic
field, B & 0.4 mG (Atoyan et al. 2000b). A high magnetic-field strength strongly limits
the flux of an inverse-Compton emission component in the TeV band on account of its
direct relation to synchrotron X-ray emission (Pohl 1996), which is observed up to 120 keV
(Allen et al. 1997; Favata et al. 1997). The observed hard X-ray emission also includes lines
from the 44Ti decay chain (Renaud et al. 2006).
The non-thermal X-ray emission predominantly originates from filaments and knots

– 18 –
in the reverse-shock region of Cassiopeia A (Helder & Vink 2008), some of which are
variable in flux on timescales of years (Uchiyama & Aharonian 2008). Both the filaments
themselves and their flux variability require a strong magnetic field, but estimates of its
exact amplitude depend on their detailed interpretation. Typically, one obtains somewhat
higher values for the magnetic-field strength, if one assumes the size and variability
timescale are determined by electron energy losses (Vink & Laming 2003; Uchiyama et al.
2007; Uchiyama & Aharonian 2008), as opposed to scenarios involving the rapid damping
of a turbulently amplified field (Pohl et al. 2005) or localized spikes in dynamical magnetic
turbulence (Bykov et al. 2008). The complicated structure of Cassiopeia A, including
fast-moving clumps of ejecta and knots of high radio brightness, has triggered the
development of many scenarios involving first- and second-order Fermi-type acceleration at
various locations (e.g. Scott & Chevalier 1975; Jones et al. 1994; Atoyan et al. 2000a).
The presence of a large flux of high-energy electrons in the reverse-shock region,
responsible for the non-thermal radio-to-X-ray emission, will also produce high-energy
γ-ray emission through non-thermal bremsstrahlung and inverse-Compton scattering
(e.g. Atoyan et al. 2000b). Based on that leptonic emission, Cassiopeia A would
appear in VERITAS data as a disk- or ring-like source with outer radius Rl . 2′
(Uchiyama & Aharonian 2008). If, on the other hand, the VHE γ-ray emission from
Cassiopeia A were dominated by πo-decay photons produced in inelastic collisions of
relativistic protons, the location of the particle-acceleration sites is less constrained by
data in other wavebands, and substantial acceleration of cosmic-ray protons could proceed
at the outer blast wave (Berezhko, Puhlhofer & Volk 2003). The size of Cassiopeia A
in VERITAS data could therefore be slightly larger than for leptonic scenarios, with an
outer radius Rh . 2.5′. However, both predicted angular extensions are substantially less
than the current angular resolution of VERITAS. The VERITAS data are consistent with
a point-like γ-ray source. Since the extended TeV γ-ray emission has not been resolved
– 19 –
with VERITAS yet, current results remain fully consistent with the hypothesis that the
VHE γ-ray emission originates from the central part of Cassiopeia A, where a compact
object has been observed at longer wavelengths. Nevertheless, we encourage modeling the
spatial distribution of VHE γ-ray emission from Cassiopeia A in preparation for the next
generation of imaging atmospheric Cherenkov telescopes, CTA1 and AGIS2, both of which
are projected to have an angular resolution better than that of VERITAS by a factor of at
least 2.
None of the published calculations of VHE γ-ray production correctly predict both
the flux and the spectrum observed with VERITAS. Atoyan et al. (2000a,b) have carefully
modelled the acceleration, propagation, and photon-emission spectra of high-energy
electrons. For the parameters chosen for their displayed γ-ray spectra, the TeV-band
emission is a mixture of non-thermal bremsstrahlung and inverse-Compton scattering that
would account for about 25% of the flux observed with VERITAS and feature a softer
spectrum than observed (∝ E−3.2γ ). We can speculate that a better fit may be achieved by
a small reduction of the magnetic-field strength and/or an increase in the cut-off energy of
the electron injection spectrum, which astrophysically is determined by the details of the
acceleration process, the magnetic-field strength in the acceleration region, and efficiency
limitations imposed by the geometry of the acceleration region. However, a low GeV-band
flux measurement or upper limit derived with Fermi-LAT would imply a magnetic field
stronger than that assumed by Atoyan et al. (2000b).
Models of hadronic VHE γ-ray emission are somewhat less constrained by radio and
X-ray data than are their leptonic counterparts. An indirect relation exists in that a very
efficient acceleration of cosmic-ray nuclei by shock fronts leads to a modification of such
1www.cta-observatory.org
2www.agis-observatory.org

– 20 –
shocks, resulting in relatively soft spectra below a GeV particle energy and rather hard
spectra around a TeV (e.g. Blandford & Eichler 1987; Berezhko & Ellison 1999), although
a cosmic-ray-induced strong magnetic field can substantially reduce the shock modification
compared with the naive unmagnetized case (Caprioli et al. 2008). The soft radio spectrum
observed from Cassiopeia A is indeed consistent with non-linear kinetic models of cosmic-ray
acceleration in SNR (e.g. Berezhko, Puhlhofer & Volk 2003). However, the hard spectra
predicted beyond a particle energy of 1 TeV have not been observed to date. In fact, the
VHE γ-ray spectra measured from shell-type SNR are all well described by either a power
law with photon index s . −2.2, or a power law with gradual roll-off (e.g. Huang et al.
2007); this suggests that the acceleration of cosmic-ray protons beyond 1 TeV must be less
efficient than previously thought, if the observed VHE γ-ray emission completely arises
from interactions of these protons.
Except for the electron energy losses, the high-energy cut-off in the spectrum of
accelerated protons is determined by the same physical processes as that of the electrons,
the details of which are not well understood. The published models may therefore be too
optimistic in predicting the cut-off energy (e.g. Berezhko, Puhlhofer & Volk 2003). In
any case, more work is required to better understand the high-energy end of cosmic-ray
proton spectra accelerated in SNR (e.g. Ellison & Vladimirov 2008). In addition, the role
stochastic particle acceleration plays in SNR needs to be explored in more detail (Liu et al.
2008). Observationally, the next step toward a better understanding of particle acceleration
in Cassiopeia A will be measuring the GeV-band γ-ray spectrum with the Fermi-LAT.
Acknowledgements
This research was supported by grants from the U.S. Department of Energy, the U.S.
National Science Foundation and the Smithsonian Institution, by NSERC in Canada,

– 21 –
by Science Foundation Ireland and by STFC in the UK. The VERITAS collaboration
acknowledges the NASA support on the Fermi GST LAT Grant #NNX08AV62G.
– 22 –
REFERENCES
Aharonian, F., et al. 2001, A&A, 370, 112
Aharonian, F., et al. 2004, ApJ, 614, 897
Aharonian, F., et al. 2006, A&A, 457, 899
Albert, J., et al. 2008, ApJ, 674, 1037
Albert, J., et al. 2007, A&A, 474, 937
Allen, G.E., Keohane, J.W., Gotthelf, E.V., et al. 1997, ApJ, 487, L97
Ashworth, W.B. 1980, J. Hist. Astr. 11, 1
Atoyan, A.M., Aharonian, F.A., Tuffs, R. J., Volk, H.J. 2000, A&A 355, 211
Atoyan, A.M., Tuffs, R. J., Aharonian, F.A., Volk, H.J. 2000, A&A 354, 915
Becker, R.H., White, R.L., & Edwards, A.L. ApJS, 75, 1
Bell, A.R., Gull, S.F., Kenderdine, S. 1975, Nature 257, 463
Berge, D., Funk, S., Hinton, J. 2007, A&A, 466, 1219
Berezhko, E.G, Puhlhofer, G., Volk, H.J. 2003, A&A 400 971
Berezhko, E.G., Ellison, D.C. 1999, ApJ 526, 385
Blandford, R.D., Eichler, D. 1987, Phys. Rep. 154, 1
Borkowski, K.J., Szymkowiak, A.E., Blondin, J.M., Sarazin, C.L. 1994, ApJ 466, 866
Bykov, A.M., Uvarov, Y.A., Ellison, D.C. 2008, ApJ 689, L133
Caprioli, D., Blasi, P., Amato, E., Vietri, M. 2008, ApJ 679, L139
– 23 –
Cowsik, R., & Sarkar, S. 1980, MNRAS 191, 855
Davies, J.M. & Cotton, E.S. 1957, Journal of Solar Energy, 1, 16
Drury, L. O., Aharonian, F. A., & Volk, H. J. 1994, A&A, 287, 959
Ellison, D.C., & Vladimirov, A. 2008, ApJ 673, L47
Esposito, J.A., et al. 1996, ApJ, 461, 820
Favata, F., Vink, J., Dal Fiume, D., et al. 1997, A&A, 324, L49
Fesen, R.A., Hammell, M.C., Morse, J., et al. 2006, ApJ, 645, 283
Goret, P., Gouiffes, C., Nuss, E., & Ellison, D.C. 1999, in Proc. 26th ICRC, ed. D. Kieda,
M. Salamon, & B. Dingus, Salt Lake City, vol. 3, 496
Helder, E.A., & Vink, J. 2008, ApJ 686, 1094
Hofmann, W., Jung, I., Konopelko, A., et al. 1999, Astroparticle Physics, 12, 135
Holder, J., et al. (VERITAS collaboration) 2006, Astroparticle Physics, 25, 361
Holt, S.S., Gotthelf, E.V., Tsunemi, H., Negoro, H. 1994, PASJ 46, L151
Huang, C.-Y., Park, S.-E., Pohl, M., Daniels, C.D. 2007, Astropart. Phys. 27, 429
Hughes, J. P., Rakowski, C. E., Burrows, D. N., & Slane, P. O. 2000, ApJ, 528, L109
Jones, T.W., Kang, H., Tregillis, I.L. 1994, ApJ 432, 194
Kassim, N.E., Perley, R.A., Dwarakanath, K.S., Erickson, W.C. 1995, ApJ, 455, L59
Konopelko, A. 1995, Proc. Padova Workshop on TeV Gamma-Ray Astrophysics, Towards a
Major Atmospherics Cherenkov Detector-IV, ed. M. Cresti, Padova, Italy, 373-377
– 24 –
Konopelko, A., Hemberger, M., Aharonian, F., et al. 1999, Astroparticle Physics, 10, 275
Krause, O., Birkmann, S.M., Usuda, T. et al. 2008, Science, 320, 1195
Krawczynski, H., et al. 2006, Astroparticle Physics, 25, 380
Lessard, R.W., Bond, I.H., Boyle, P.J., et al. 1999, Proc. of the 26th ICRC, ed. D. Kieda,
M. Salamon, & B. Dingus, Salt Lake City, vol. 3, 488
Laming, J.M., Hwang, U. 2003, ApJ, 597, 347
Li, T.-P., Ma, Y.-Q. 1983, ApJ, 272, L317
Liu, S., Fan, Z.-H., Fryer, C.L., Wang, J.-M., Li, H. 2008, ApJ 683, L163
McCann, A., Hanna, D., McCutcheon, M. Astroparticle Physics, Vol. 32, Issue 6, 325
Maier, G., et al. 2007, Proc. 30th ICRC, Merida, Mexico, July 2007, 2007arXiv0709.4195
Mezger, P.G., Tuffs, R.J., Chini, R., Kreysa, E., Gemuend, H.-P. 1986, A&A, 167, 145
Reed, J.E., Hester, J.J, Fabian, A.C., & Winkler, P.F. 1995, ApJ 440, 706
Renaud, M., Vink, J., Decourchelle, A., et al. 2006 ApJ, 647, L41
Pohl, M. 1996, A&A 307, L57
Pohl, M., Yan, H., Lazarian, A. 2005, ApJ 626, L101
Reynolds, P.T., et al. 1993, ApJ, 404, 206
Scott, J.S., & Chevalier, R. 1975, ApJ 197, L5
Stage, M.D., et al. 2006, Nature Physics, Volume 2, Issue 9, p. 614
Stephenson, F. R., Green, D. A. 2003, ”The Historical Supernova Remnants”, Cambridge
University Press, Cambridge UK
– 25 –
Tuffs, R.J., Drury, L. OC., Fischera, J., Heinrichsen, I., Russel, S., Volk, H.J. 1997, Proc.
1st ISO Workshop on Analytical Spectroscopy (ESA SP-419), p.177
Uchiyama, Y., et al. 2007, Nature 449, 576
Uchiyama, Y., & Aharonian, F.A. 2008, ApJ 677, L105
van Veelen, B., Langer, N., Vink, J., Garca-Segura, G., van Marle, A. J. 2009, A&A, 503,
495
Vink, J. & Laming, J. M. 2003, ApJ, 584, 758
Vink, J., Laming, J.M., Kaastra, J.S., et al. 2001, ApJ, 560, L79
Weekes, T., et al. (VERITAS collaboration) 2002, Astroparticle Physics, 17, 221
Willingale, R., Bleeker, J. A. M., van der Heyden, K. J., Kaastra, J. S 2003, A&A, 398,
1021
Young, P.A., Fryer, C.L., Hungerford, A. 2006, ApJ, 640, 891
This manuscript was prepared with the AAS LATEX macros v5.2.
– 26 –
Table 1: Summary of analysis cuts.
Set Flux (Crab) MSW (◦) MSL (◦) θ (◦)
A 0.03 [0.05,1.08] [0.05,1.19] 0.13
B 1 [0.05,1.1] [0.05,1.39] 0.158
Table 2: Results of data analysis.
Source: Crab Nebula Cas A
Exposure (hr) 3.0 21.8
Set of cuts A B A B
On events 891 1298 625 1277
Off events∗ 480 841 3538 6164
Significance (σ) 47.6 50.5 8.3 7.0
Rγ (min−1) 5.07±0.18 7.10±0.22 0.148±0.019 0.191±0.028
RCR (min−1) 0.35 0.80 0.32 0.77
∗A total number of Off events was accumulated over a few similar circular regions.

– 27 –
Fig. 1.— Smoothed sky map of excess counts from the region centered at Cassiopeia A
observed with VERITAS for a total of 22 hours in 2007. The color bar represents the excess
event counts. The white circle indicates the size of the VERITAS point-spread function. The
cross indicates the measured position of the TeV γ-ray source. The radius of a smoothing
circular window was 0.115◦.

– 28 –
Fig. 2.— Differential energy spectrum of TeV γ rays from Cassiopeia A, measured with
VERITAS. Also shown are the HEGRA (dashed line) and the MAGIC (dotted line) energy
spectra adapted from (Aharonian et al. 2001) and (Albert et al. 2007), respectively.