The Spitzer c2d Survey of Nearby Dense Cores. V. Discovery of a VeLLO in the
29
To appear in Astrophysical Journal March 2009-v693 issue The Spitzer c2d Survey of Nearby Dense Cores. V. Discovery of a VeLLO in the “Starless” Dense Core L328 Chang Won Lee 1,2 , Tyler L. Bourke 2 , Philip C. Myers 2 , Mike Dunham 3 , Neal Evans 3 , Youngung Lee 1 , Tracy Huard 4 , Jingwen Wu 2 , Robert Gutermuth 2 , Mi-Ryang Kim 1 , Hyun Woo Kang 1 1 Korea Astronomy & Space Science Institute, 61-1 Hwaam-dong, Yusung-gu, Daejeon 305-348, Korea. E-mail: [email protected] 2 Harvard-Smithsonian Center for Astrophysics, 60 Garden Street, Cambridge, MA 02138, USA 3 Department of Astronomy, The University of Texas at Austin, 1 University Station, C1400, Austin, Texas 78712-0259, USA 4 Department of Astronomy, The University of Maryland, College Park, MD 20742-2421, USA ABSTRACT This paper reports the discovery of a Very Low Luminosity Object (VeLLO) in the “starless” dense core L328, using the Spitzer Space Telescope and ground based observations from near-infrared to millimeter wavelengths. The Spitzer 8 μm image indicates that L328 consists of three subcores of which the smallest one may harbor a source, L328-IRS while two other subcores remain starless. L328- IRS is a Class 0 protostar according to its bolometric temperature (44 K) and the high fraction (∼ 72%) of its luminosity emitted at sub-millimeter wavelengths. Its inferred “internal luminosity” (0.04 -0.06 L ) using a radiative transfer model under the most plausible assumption of its distance as 200 pc is much fainter than for a typical protostar, and even fainter than other VeLLOs studied previously. Note, however, that its inferred luminosity may be uncertain by a factor of 2 - 3 if we consider two extreme values of the distance of L328-IRS (125 or 310 pc). Low angular resolution observations of CO do not show any clear evidence of a molecular outflow activity. But broad line widths toward L328, and Spitzer and near-infrared images showing nebulosity possibly tracing an outflow cavity, strongly suggest the existence of outflow activity. Provided that an envelope of
-
Upload
independent -
Category
Documents
-
view
0 -
download
0
Transcript of The Spitzer c2d Survey of Nearby Dense Cores. V. Discovery of a VeLLO in the
To appear in Astrophysical Journal March 2009-v693 issue
The Spitzer c2d Survey of Nearby Dense Cores.
V. Discovery of a VeLLO in the “Starless” Dense Core L328
Chang Won Lee1,2, Tyler L. Bourke2, Philip C. Myers2, Mike Dunham3, Neal Evans3,
Youngung Lee1, Tracy Huard4, Jingwen Wu2, Robert Gutermuth2, Mi-Ryang Kim1, Hyun
Woo Kang1
1 Korea Astronomy & Space Science Institute, 61-1 Hwaam-dong, Yusung-gu, Daejeon
305-348, Korea. E-mail: [email protected]
2Harvard-Smithsonian Center for Astrophysics, 60 Garden Street, Cambridge, MA 02138,
USA
3Department of Astronomy, The University of Texas at Austin, 1 University Station,
C1400, Austin, Texas 78712-0259, USA
4Department of Astronomy, The University of Maryland, College Park, MD 20742-2421,
USA
ABSTRACT
This paper reports the discovery of a Very Low Luminosity Object (VeLLO)
in the “starless” dense core L328, using the Spitzer Space Telescope and ground
based observations from near-infrared to millimeter wavelengths. The Spitzer 8
µm image indicates that L328 consists of three subcores of which the smallest one
may harbor a source, L328-IRS while two other subcores remain starless. L328-
IRS is a Class 0 protostar according to its bolometric temperature (44 K) and the
high fraction (∼ 72%) of its luminosity emitted at sub-millimeter wavelengths.
Its inferred “internal luminosity” (0.04−0.06 L�) using a radiative transfer model
under the most plausible assumption of its distance as 200 pc is much fainter than
for a typical protostar, and even fainter than other VeLLOs studied previously.
Note, however, that its inferred luminosity may be uncertain by a factor of 2− 3
if we consider two extreme values of the distance of L328-IRS (125 or 310 pc).
Low angular resolution observations of CO do not show any clear evidence of
a molecular outflow activity. But broad line widths toward L328, and Spitzer
and near-infrared images showing nebulosity possibly tracing an outflow cavity,
strongly suggest the existence of outflow activity. Provided that an envelope of

– 2 –
at most ∼ 0.1 M� is the only mass accretion reservoir for L328-IRS, and the star
formation efficiency is close to the canonical value ∼ 30%, L328-IRS has not yet
accreted more than 0.05 M�. At the assumed distance of 200 pc, L328-IRS is
destined to be a brown dwarf.
Subject headings: ISM: individual (L328, L328-IRS)-stars: formation: low-mass,
brown-dwarfs
1. Introduction
Knowledge of how low mass stars form has been significantly improved thanks to the
recent availability of large telescopes and sensitive detectors, especially at millimeter and
infrared wavelengths. Molecular cloud condensations are understood to gradually increase
in density via several processes such as ambipolar diffusion or turbulent dissipation with
some contribution of magnetic fields. When the condensations are dense enough to be
detected with high density tracers such as the CS and NH3 transitional lines, but have not
yet formed a protostar, they are called “starless” cores (e.g., Benson & Myers 1989, Lee,
Myers, & Tafalla 1999). Some starless cores are believed to be gravitationally bound, and
are called pre-stellar cores under the assumption that protostars are likely to form in the
future (e.g., Ward-Thompson et al. 2007, Di Francesco et al. 2007). Once a core become
gravitationally unstable and collapses, it forms a protostar (the main accretion stage) with a
disk and infalling envelope. The protostar then evolves to the stage where the envelope has
mostly dispersed and a young stellar object (YSO) with an optically thick disk is revealed,
and eventually the disk becomes optically thin to finally reveal a normal main-sequence
(MS) star (e.g., Andre et al. 2000, Robitaille et al. 2006). Even though we have a good
consensus on the global scenario of evolution from the cores to MS stars, we still have very
little knowledge about which conditions decide how stars form and evolve in the dense cores.
Probably the initial stage of star formation may play the most important role in its further
evolution. This is why we study “starless” dense cores.
Dense molecular cores have typically been classified as “starless” if they contain no
Infrared Astronomical Satellite (IRAS) point source whose flux increases in the longer wave-
lengths (Beichmann et al. 1986; Benson & Myers 1989; Lee & Myers 1999). Therefore the
definition of “starless” has been limited to the sensitivity of the IRAS of ∼ 0.1(d/140)2L�
where d is the distance to the source (Myers et al. 1987). This implies that studying proto-
stars embedded in dense cores has been limited only to sources brighter than 0.1 L� at the
distance of nearby star-forming regions such as Taurus, resulting in fewer studies of young
stars fainter than 0.1 L� forming in the cores.

– 3 –
The sensitivity of the Spitzer Space Telescope (hereafter Spitzer) at infrared wavelengths
allows, for the first time, sensitive explorations to detect deeply embedded faint objects in
dense cores that were not detected by IRAS or the Infrared Space Observatory (ISO) (Young
et al. 2004; Dunham et al. 2006; Bourke et al. 2006). Such objects may become protostars
or brown dwarfs depending on how they obtain matter as time goes on. The objects fainter
than 0.1 L� are called Very Low Luminosity Objects (VeLLOs) (Young et al. 2004, Di
Francesco et al. 2007; Dunham et al. 2008). The key feature of these sources is that their
luminosity is an order of magnitude fainter than the accretion luminosity (∼ 1.6L�) that the
lowest mass protostar of ∼ 0.08M� can produce, under the standard star formation theory
(e.g., Shu et al. 1987), with a typical accretion rate (∼ 2 × 10⁻⁶M� yr−1) and protostellar
radius of ∼ 3R� (Dunham et al. 2006). These may simply be either very faint protostars
that will grow to become normal young stars, or proto-brown dwarfs that eventually become
brown dwarfs. So far there is no clear conclusion about what these objects are and will be in
the future because of the limited number of VeLLOs studied. There are only three VeLLOs
studied in detail: L1014-IRS (Young et al. 2004), L1521F-IRS (Bourke et al. 2006), and
IRAM 04191+1522 (Dunham et al. 2006). Their properties are similar in terms of their
faintness (0.06 − 0.09 L�), but found to be different in their outflow activity and relations
with physical properties of their parent cloud cores (Bourke et al. 2006, Dunham et al.
2008). Detailed studies on more VeLLOs are needed to better understand these objects and
their role in star formation.
This paper presents a study of another VeLLO, L328-IRS in the dark cloud Lynds 328,
using observations performed with a part of Spitzer c2d Legacy project (Evans et al. 2003,
2007) together with several complementary ground-based observations. L328-IRS has been
listed as one of 15 VeLLO candidates that were found in a search of c2d cores and clouds by
Dunham et al. (2008).
L328 is a dense molecular cloud located in projection between two nearby large clouds,
the Ophiuchus Molecular Cloud (hereafter the Ophiuchus) and the Aquila Rift. In L328,
neither an IRAS point source nor any PMS stars had been found, and thus it was classified as
“starless” (Lee & Myers 1999). Therefore this object has been studied as one of the starless
dense cores by many researchers (Visser et al. 2001, 2002; Bacmann et al. 2002, 2003; Crapsi
et al. 2005b; Lohr et al. 2007). The one thing to note is that the line width of N2H+ 1-0
is broad (∆V = 0.438 km s−1) compared with other starless cores, indicating the existence
of the significant contribution of turbulent gaseous motion (Crapsi et al. 2005b). Crapsi
et al. (2005b) have classified L328 as “not chemically and dynamically evolved” because it
does not show any evolved feature such as infall asymmetry, significant CO depletion, or
deuteration.

– 4 –
The distance to L328 is an important issue for this study. We will explain how we adopt
the distance of L328 in §2. In §3 we describe Spitzer observations as well as other ground-
based observations. The images of L328, photometric properties of L328-IRS, association
of L328-IRS with L328, and outflow activity of L328-IRS are described in §4. The Spectral
Energy Distribution (SED) of L328-IRS is modeled with a radiative transfer code and the
fate of L328-IRS is discussed in §5. The summary can be found in the last section.
2. Distance of L328
L328 is one of the c2d cores whose distance is not clearly known. This is mainly be-
cause the association of L328 with either of the two nearby large clouds whose distances
are reasonably well known, the Ophiuchus and the Aquila Rift, is not clear. The spatial
location on the sky of L328 at l, b=13◦03, −0◦83 is between the Ophiuchus located at ap-
proximately −12◦ < l < 12◦ and 10◦ < b < 25◦ and the Aquila Rift located at approximately
20◦ < l < 40◦ and −6◦ < b < 14◦ (Dame et al. 1987, 2001, Straizys et al. 2003). Interest-
ingly, the systemic velocity (VLSR = 6.5 km s−1 from this study) of L328 is also somewhat in
between the Ophiuchus (VLSR = −2 ∼ 7 km s−1) and the Aquila Rift (VLSR = 2 ∼ 12 km s−1)
(Dame et al. 2001). Considering all aspects, it is likely that L328 is located at a distance
between Ophiuchus and Aquila.
There are recent measurements of the distance of the Ophiuchus cloud using parallax
observations of radio emission of young stars (Loinard et al. 2008; 120 ± 4.5pc) and by
combining extinction maps and parallaxes from Hipparcos and Tycho (Mamajek 2008; 135±
8pc, Lombardi et al. 2008;119 ± 6pc). We adopt the distance of the Ophiuchus cloud as
125 pc in our paper which is the same distance as that of de Geus et al. (1989) and also
consistent with other measurements and the distance used in previous c2d papers (Young et
al. 2006; Enoch et al. 2007; Padgett et al. 2008). The distance of the central region of the
Aquila Rift has been estimated as 270 pc using interstellar extinction of stars over the cloud
(Straizys et al. 2003), By taking an average of the distances of two clouds, we assume the
distance of L328 core as 200 pc in the paper. The Aquila Rift has been suggested to have
different distances for front (225 pc) and far (310 pc) edges (Straizys et al. 2003), We will
discuss a possibility for L328 to be located at the far edge of the Aquila Rift and its effect
on our results.

– 5 –
3. Observations
The infrared observations toward L328 from 3.6 to 70 µm were conducted as a part of
the c2d Legacy program (Evans et al. 2003) using Spitzer equipped with the Infrared Array
Camera (IRAC; Fazio et. 2004) and the Multi-band Imaging Photometer (MIPS; Rieke et
al. 2004). The IRAC observations were made in four bands centered on 3.6, 4.5, 5.8, and
8.0 µm. In order to remove contamination from asteroids, observations were performed in
two epochs with about a day gap. The first epoch observation with IRAC was made on 2004
September 3 (AOR key 5147136) and the second on 2004 September 4 (AOR key 5147392).
Each observation has four dithers of 12 seconds each, offset by ∼ 10′′ to cover about a 5′× 5′
field with a total integration time of 48 s for each image.
The MIPS images were obtained in two bands of 24 and 70 µm in two epochs to detect
and remove the asteroids. The first epoch observation was made on 2004 April 11 (AOR
key 9420544) and the second one on 2004 April 12 (AOR key 9436160). Observations were
made in MIPS photometry mode with a sky offset of 300′′. The total integration time for 24
and 70 µm observations for each epoch was 48 s and 126 s, respectively.
After identifying an infrared source in L328, we also conducted follow-up deeper ob-
servations (called as Cores2Deeper) toward L328 with Spitzer (PID: 20386, PI: P. Myers),
using IRAC, and MIPS at 24 µm. The observation with IRAC was made on 2005 Septem-
ber 20 (AOR key 14608384) and the observation with MIPS at 24 µm was made on 2005
September 26 (AOR key 14616064), respectively. The IRAC images were obtained with two
epoch observations, 8 dithers of 30 s per epoch. Therefore the on source time for IRAC
image in each bands was 480 s which is 10 times longer than c2d data, making the images
3.2 times deeper than c2d data. For MIPS 24, we made one epoch observation with an on
source time of 333 s. Thus the MIPS 24 µm image had 6.9 times longer on source time or
2.6 times better sensitivity than the c2d data. In data analysis for this study we used the
Cores2Deeper data from 3.6 to 24 µm and c2d data at 70 µm.
The IRAC and MIPS images were processed by the Spitzer Science Center through their
standard pipeline version S13. The c2d team improved the images by correcting bad pixels
and other artifacts and made photometry of the extracted sources with a modified version of
DOPHOT (Schechter et al. 1993) using a digitized point source profile. More details on the
improvement of the images are given in the documentation for c2d data delivery by Evans
et al. (2007).
We also tried to observe or retrieve data for L328 at the other wavelengths bands to
broaden our knowledge of L328. Molecular line observations in the 3-mm band were made
with the Seoul Radio Astronomy Observatory (SRAO) 6 m radio telescope in 2005 April.

– 6 –
L328 was observed over the area of 16′ × 16′ with 1′ or 2′ grid spacings in the CO (1-0) line,
over 4′×4′ area with 1′ grid spacings in C18O (1-0), 2′×2′ area with 1′ grid spacings in CS(2-
1), and 4′ × 4′ area with 1′ grid spacings in N2H+(1-0). In the CO (1-0) line observations
the FWHM beam size of the SRAO was ∼ 100′′ (Koo et al. 2002), the velocity resolution
was ∼ 0.13 km s−1, and the typical rms sensitivity in T∗
A unit was ∼ 0.2 K.
The NIR (J, H, & Ks) data from the PANIC IR camera of Baade 6.5m telescope at Las
Campanas (Huard et al. 2008 in prep.), 350 µm continuum data from SHARC-II on the
CSO (Wu et al. 2007), 850 µm continuum data from JCMT SCUBA (Di Francesco et al.
2008), and 1.2 mm data from the bolometer array of the IRAM 30-m telescope (Bacmann
et al. 2000) were also obtained for this paper.
4. Results
4.1. Images of L328
Fig. 1 shows a Digital Sky Survey (DSS) red image of L328 over an area of ∼ 16′ × 16′.
The figure shows a dark opaque core (L328) of ∼ 2′×2′ size and several curved long tails which
extend to the SW ∼ 15 arc-minute long (L327). Fig. 2 shows Spitzer images of the region
indicated by a white box in Fig. 1, for reference, with its DSS-red image with 350 µm emission
contours overlaid. At optical wavelengths L328 is very opaque, and thus no background stars
are seen towards L328. However, our Spitzer observations are able to penetrate the deep
dark regions of L328 to see both embedded or background stars. L328 becomes significantly
transparent at 3.6 and 4.5 µm so that a number of background stars are seen. Starlight
gets fainter in longer wavelength bands such as 5.8 and 8.0 µm. However, background
emission from 6.2 & 8.6 µm features of Polycyclic Aromatic Hydrocarbons (PAHs) becomes
dominantly bright at these wavelengths because L328 is located almost toward the Galactic
plane. This allows L328 to be seen in absorption against the bright background at 5.8 and
8.0 µm. L328 is also dark at 24 µm. There is no feature of the PAH emission at this band
and the bright background is most likely due to hot dust emission over the Galactic disk
plane.
Note that L328 at 5.8, 8.0 and 24 µm is not seen as a single simple dark core, but
as two main dark regions and one small dark region in the South. These sub-structures in
L328 have been also found in 350 µm dust emission by Wu et al. (2007) who designated
these as L328-smm1, smm2, and smm3 from West to East. Their 350 µm image indicates
that L328-smm1 is the biggest among three, L328-smm3 is the next, and L328-smm2 is the
smallest in size.

– 7 –
The 70 µm image of L328 is not shown due to its low angular resolution. The L328 core
is seen in absorption at 70 µm which is rare (Stutz al. al 2008) but only as a single core.
4.2. L328-IRS
4.2.1. Photometric properties of L328-IRS
A surprise in the Spitzer observations is a discovery of an infrared source (L328-IRS) at
the SW edge of L328. The position of L328-IRS is marked with an arrow in Fig. 2. L328-IRS
is rather bright at 3.6, 4.5, and 5.8 µm, gets dimmer in 8.0 µm, and then much brighter at
24 and 70 µm than any other sources in the L328 region. This property, increasing flux to
longer wavelengths, suggests that L328-IRS may be a protostar.
The interesting thing to note is that it does not look like a point source, but is slightly
extended at the short wavelengths (3.6, 4.5, and 5.8 µm). The JHKs image with the highest
angular resolution, shown in Fig. 3, indicates that this is partly because the source itself
has extended emission and also partly because the Spitzer images of L328-IRS are possibly
contaminated with two nearby sources about 1′′−2′′ apart located to the South of the source.
We find that in the Ks image L328-IRS consists of a nucleus and an extended nebulosity, and
the position of the nucleus is consistent with the position of L328-IRS in all Spitzer images.
Thus the position of L328-IRS is given as the position of the nucleus seen in Ks image
[(α, δ)J2000=(18h16m59.s50,−18◦02′30.′′5)] which is determined as the flux weighted centroid
of the nucleus part of the Ks image.
Because L328-IRS is somewhat extended, the automated photometry by c2d team uti-
lizing a point source profile was not reliable for this particular source. This required us to
perform aperture photometry for this object at each wavelength using the “PHOT” task in
IRAF to include all emitting parts of the source. For the photometry in IRAC and MIPS
bands, we made an aperture correction in its values by using correction factors provided
by Spitzer Science Center. For the photometry at sub-millimeter wavelengths, although it
was not so clear which aperture size is the most appropriate, we tried to include all the
emission around smm2 sub-core, but not to include emission from the two other sub-cores,
smm1 and smm3. We chose a compromise aperture size of 20′′ for this reason and measured
emission fluxes from the dusty envelope surrounding L328-IRS at 350, 850, and 1200 µm.
The measured fluxes and apertures for each wavelength are listed in Table 1.
This enables us to construct the SED for L328-IRS and to measure its infrared slope,
α (α = log λFλ
log λ; Lada & Wilking 1984, Lada 1987). The slope is calculated to be 0.61
(±0.63) from a linear least squares fit for the range of 3.6 - 24 µm, indicating that L328-

– 8 –
IRS may be a Class I protostar (α is not defined for Class 0 protostars). The bolometric
temperature, which is defined as the temperature of a blackbody having the same flux-
weighted mean frequency as the observed continuum spectrum (Myers & Ladd 1993), is ∼44
K, and the fraction of luminosity at sub-millimeter wavelengths (≥ 350µm) with respect to
the bolometric luminosity is found to be about 72 percent. These additional quantities are
consistent with L328-IRS being a Class 0 type protostar.
4.2.2. Association of L328-IRS with L328
Fig. 4 shows a three color composite image around L328-IRS in 5.8 µm (blue), 8.0 µm
(green), and 24 µm (red). This map shows sub-structures of L328 and illustrates how they
are related to L328-IRS. Three sub-cores appear to be embedded in one dusty envelope and
two of them, smm1 (NW) and smm3 (NE), seem to be connected in the northern parts while
between these two cores in the south there is a cavity structure seemingly starting from
L328-IRS, which may be related to outflow activity from L328-IRS or simply a region of
lower column density. Further south there is one smaller core (smm2), that is connected to
smm1 by a curved dusty lane. L328-IRS is most closely aligned with smm2, with its position
offset by ∼ 3′′ from the peak position of smm2.
Note that L328-IRS is only prominently red source in the region. The colors of all
point sources in L328 field observed with the Spitzer are shown in Fig. 5, where L328-IRS
is distinctively red in [5.8]-[24.0] color ([3.6]-[4.5]=1.21 and [5.8]-[24.0]=5.94) while all other
objects are <1 in [5.8]-[24.0] color. It is interesting to note that the colors of other known
VeLLOs are similarly red in [5.8]-[24.0] color (4.66 for L1014-IRS, 5.94 for IRAM04191, and
7.67 for L1521F-IRS). We also found that the magnitude at 24 µm(m24 = 5.05) and [8.0]-[24]
color of 6.35 for L328-IRS are far out of the likely range of these values for the extragalactic
SWIRE sources (see Fig. 3 of Harvey et al. 2007), indicating that L328-IRS is unlikely to be
a background galaxy. Taken all together, L328-IRS is associated with high column density
material and is likely to be deeply embedded within smm2.
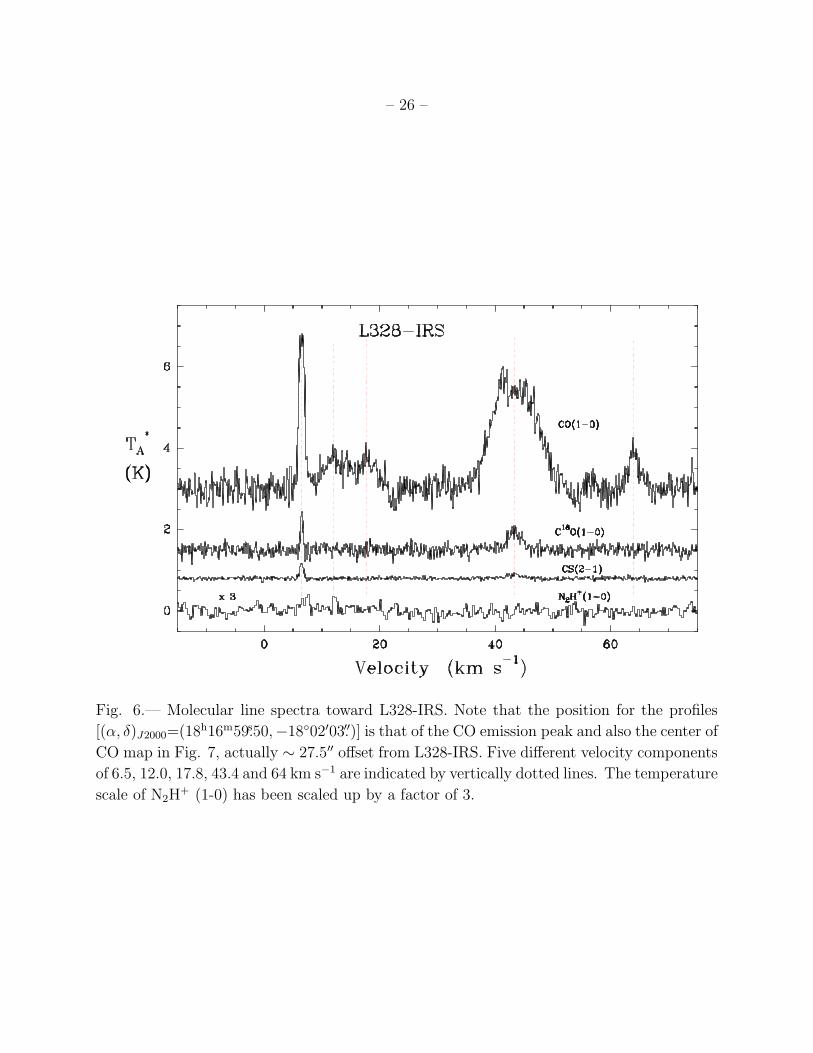
Fig. 6 shows molecular line profiles toward L328-IRS. Note that the position where the
profiles were taken is accidentally ∼ 27.5′′ offset from L328-IRS. However, since the SRAO
beam size is large enough (100′′ FWHM at the frequency of CO 1-0), these line data should
be useful to characterize L328-IRS and its environment. The CO profile indicates that there
are several clouds with at least five different LSR velocities of 6.5, 12.0, 17.8, 43.4 and 64
km s−1 along the line of sight of L328-IRS. Only two of those components, 6.5 and 43.4
km s−1, are detected in the denser tracers such as C18O (1-0) and CS (2-1) lines, and only
the 6.5 km s−1 component is detected in N2H+ (1-0) line. Note that N2H
+ (1-0) emission has
– 9 –
been previously detected from single pointing observations by Lee, Myers, & Tafalla (1999)
and Crapsi et al. (2005b). C18O integrated line maps of the velocity components at 6.5 and
43.4 km s−1 show that the 6.5 km s−1 component is a local peak corresponding to the dark
opaque part of L328, while there are no clear condensations of the 43.4 km s−1 component
and therefore no hint of an association of L328-IRS with the 43 km s−1 component (Fig. 7).
Thus L328-IRS is likely to be associated with the gas at 6.5 km s−1 following the tendency
for a star to form in a dense molecular region (e.g., Beichmann et al. 1986).
4.2.3. Outflow activity of L328-IRS
If L328-IRS is truly a protostar embedded in L328, then we may expect some outflow
activity. CO profiles can test for a possible existence of the molecular outflow. However, the
CO profile of the 6.5 km s−1 velocity component does not show any broad wing component.
Moreover, integrated intensity maps of blue-shifted and red-shifted velocities with respect to
the systemic velocity do not show any significant difference that would indicate the existence
of a molecular outflow. Our CO data do not seem to show any clear evidence of outflows
toward L328-IRS.
However, this does not necessarily mean that there is no outflow activity in L328-IRS
because there is a possibility that the large beam (100′′) of the SRAO might dilute any
signature of outflow if it exists at very small scales, just as the case of L1014-IRS where the
small scale (∼500 AU) outflow has been found through sensitive interferometry observations
with the SMA (Bourke et al. 2005) while it has not been clearly detected with lower angular
resolution (Crapsi et al. 2005a).
Near IR H & Ks observations with high sensitivity and fine angular resolution, shown
in Fig. 3, give some hints for the outflow activity around L328-IRS (Huard et al. 2008 in
prep.). First of all, we see a relatively empty region (designated as A in Fig. 3) of about 30′′
in length crossing the central region of L328 from SW to NE which is also seen in the Spitzer
images in Fig. 2 and 4. This looks like an elongated cavity shape possibly due to material
being evacuated by an outflow activity from L328-IRS. The opposite part of the cavity SW of
L328-IRS is, however, not clearly seen probably because there is not enough gaseous material
to highlight its relatively tenuous presence compared to surrounding regions.
Second, L328-IRS is the only source having a nebulosity in L328 region. Moreover, L328-
IRS at Ks band has a structure of a point-like nucleus plus an extended feature of nebulosity
to the SW while the overall image of L328-IRS at H band has only diffuse extended emission
which is nearly coincident with the extended part of Ks band image (the right panel of

– 10 –
Fig. 3). This feature may be related to nebulosity due to scattered light through a cavity
associated with outflow activity within a dusty envelope (Huard et al. 2006).
Third, a line bisecting L328-IRS and the 30′′ cavity structure (A in Fig. 3) to its NE
also passes through the nebulosity (B in Fig. 3) of the protostar itself seen in the near IR,
indicating that two different outflow structures are possibly related.
Fourth, line widths of N2H+ toward the central region of L328 where the cavity structure
exists are broader (0.438 ± 0.005 km s−1 from Crapsi et al. 2005b) than for most starless
cores (0.24 ± 0.06 km s−1: an average of FWHMs for the N2H+ profiles of 28 starless cores
except for L328 listed in Crapsi et al. 2005b) where thermal motions dominate. Our CO
map rules out the possibility that some cloud components with slightly different velocities
could cause the broadening of the line profile. Thus the broad line width may be due to
some turbulence effects produced by the outflow activity. One thing to note is that the
N2H+ line profile by Crapsi et al. (2005b) has not been obtained from the exact position of
L328-IRS, but from a position [(α, δ)J2000=(18h17m00.s40,−18◦01′52.′′)] about 40′′ offset to NE
from L328-IRS. However, the N2H+ observation with the IRAM 30m beam at that position
is found to include a significant part of the 30′′ cavity structure and thus may characterize
the possible outflow effect due to L328-IRS. Therefore, although the N2H+ profile may not
directly reflect the physical status toward L328-IRS, its broad line width may be an indirect
signature of the possible outflow activity from L328-IRS.
5. Discussion
5.1. Radiative transfer modeling of the SED of L328-IRS
The observed luminosity (i.e., bolometric luminosity) of L328-IRS was calculated to
be about 0.19 L� by using fluxes integrated through the observed wavelength range and its
assumed distance of 200 pc. This luminosity (Lbol) is the sum of an internal luminosity (Lint)
due to the central source and a luminosity (Lisrf) supplied by the interstellar radiation field
(ISRF) from the outside. The emission from the envelope is partly caused by heating by the
internal luminosity source and partly by the ISRF. Therefore it is necessary to separate the
emission of the central source from other contributions to estimate its internal luminosity
Lint. This can be done through a detailed study of the radiative process of emission from the
central source through the dusty envelope. To do this we used a one dimensional radiative
transfer package DUSTY (Ivezic. 1999) to calculate the SED of L328-IRS with assumed
physical properties of the central source and its dusty envelope. Similar studies of other
VeLLOs have recently been undertaken (Young et al. 2004; Dunham et al. 2006; Bourke
– 11 –
et al. 2006); all the details of the input parameters to this modeling are described in those
studies and Young & Evans (2005).
Our model consists of a stellar black body, a cooler disk, dusty envelope, and the
Interstellar Radiation Field (ISRF). Starting with an input spectrum from the central star
and disk, the model calculates the emission reprocessed by the model envelope with an
educated guess of the contribution of the ISRF. By adjusting the free parameters in the
model, the fitting process is iterated to get the χ2 best fit of the modeled SED to the
observed SED, and thus the best fit internal luminosity Lint.
The internal luminosity of the central source in the model is the luminosity from the
stellar component plus the luminosity from the disk. For the stellar component, we assume
the temperature and luminosity of a blackbody that provide a reasonable fit to the flux
densities between 3.6 - 8.0 µm. The flux densities at these emergent from the central source,
however, are absorbed by the dusty envelope surrounding L328-IRS and reprocessed to longer
wavelengths. Especially the flux density at 8 µm is highly affected by absorption which may
be caused mainly by 9.7 µm silicate features in the dusty envelope. These need to be
taken into account. The flux densities at 24 and 70 µm are not fitted at all by the stellar
component, and a dusty disk is included to fit those wavelengths. We employed a model
of a disk with surface density and temperature profiles described as Σ(r) = Σ0(r/r0)−p and
Tr = T0(r/r0)−q, respectively (Butner et al. 1994). We adopt the “spherical disk” approach
of Butner et al. (1994) in the sense that in the code the emission from the model disk is
averaged over all possible viewing angles and then added to the emission from the stellar
blackbody to produce an input spectrum for the internal source. In this modeling we tried
to fix all free parameters whose variation has small effect on the results. We assume a flared
disk with a power index p=1.5 in the surface density distribution, but with a slightly less
steep index (q=0.4) in the temperature distribution than in Butner et al. (1994) which helps
to better fit the 24 µm flux density than a model with q=0.5. The inner radius of the disk
was set to be the radius at which dust reaches its sublimation temperature (assumed to be
1500 K). It varied from 0.02 to 0.04 AU to be consistent with the internal luminosity of the
central source. On the other hand the outer radii were simply fixed to be 50 AU. Usually the
model was insensitive with the disk size. We run the models with outer disk radii of 10 AU
and 100 AU and found similar results for the inferred internal luminosity to the model with
a disk size of 50 AU. The code also includes the contribution from intrinsic disk emission
which can arise from accretion of the material on the disk.
The input emission emerging at mainly short wavelengths is then reprocessed in the
dusty envelope to produce emission at longer wavelengths. We adopted an approximate
isothermal equilibrium sphere for the envelope density distribution (Tafalla et al 2002),

– 12 –
n(r) = n0/[1 + (r/r0)α], where n is the density, r is the distance from the center, and n0, r0,
and α are scaling parameters of the density distribution (note that this is not the same α
from § 4.2.1). Alternatively, a power-law density distribution for the envelope [n(r) ∝ r−α]
was also tested and it was found that a shallow power index such as α = 1.1 resulted in a
very similar fit to the flux densities at sub-millimeters to that of the approximate isothermal
sphere .
The envelope is assumed to be heated by the emergent emission from the central source
inside and the ISRF outside. The inner radius of the envelope is set to be 50 AU and its
outer radius is 10,000 AU which roughly matches the size of the envelope seen in the DSS
image. The outer radius of the envelope is large enough to include the other sub-cores in
L328. However, this radius was set to better match the sub-millimeter and its long-ward flux
densities of the envelope with the model SED. Our simple model of the envelope considers
the flux contribution from the smm2 core only, but not that from other sub-cores.
The dust opacities are those of “OH5 dust” (grains with thin ice mantles) by Ossenkopf
& Henning (1994) which is known to be appropriate for cold dense cores (Evans et al. 2001;
Shirley et al. 2005). We adopted the Black-Draine ISRF (Black 1994, Draine 1978; see
Evans et al. 2001) and assumed it to be attenuated by dust grains having optical constants
of Draine & Lee (1984) with AV = 3.0. This extinction was chosen to simulate the situation
that L328 is somewhat embedded in diffuse dust between the Ophiuchus and the Aquila Rift
clouds.
We tried to fix most of free parameters regarding the envelope so that the estimated
mass of the envelope is consistent with the mass (Menv) of the envelope determined from
the 350 µm continuum. The mass was calculated from Menv = SνD2
Bν(T)κνwhere Sν is the flux
density at 350 µm, Bν(T) is the Planck function at temperature (T), and κν is dust opacity.
The estimated mass is about 0.05 - 0.09 M� in the range of temperatures of 15 - 20 K with a
measured flux density of 3.2 Jy (20′′ beam) with κν = 0.101 cm−2 g−1 (OH5 dust opacities in
Ossenkopf & Henning 1994). The mass was also estimated using the 850 and 1200 µm data
and found to be consistent within a factor of 2 with the mass derived from the 350 µm flux.
We chose the parameters of n0 = 6 × 105 cm−3, r0 = 1500 AU, and α = 2.0 as reasonable
parameters resulting in an envelope mass within a 2000 AU radius of 0.07 M�, consistent
with the observed mass of the envelope of 20′′ aperture.
With this combination of parameters, we tried to obtain a best fit with stellar tem-
peratures Tstar=1500, 1800, 2000, 2500, 3000, and 3500 K by adjusting Lint. Among these
temperatures a central source of 0.04 - 0.06 L� is found to produce the best fits to the
observed SED. Figure 8 shows a result of the best fit of the observed SED for Tstar=2000 K
and Lint = 0.05 L� which has a minimum value of χ2. This result implies that most of the

– 13 –
observed luminosity arises from emission at sub-millimeter wavelength regions heated by the
ISRF, as modeled by Evans et al. (2001) for starless cores.
Dunham et al (2008) have estimated the internal luminosity of L328-IRS by using an
empirical correlation between fluxes at 70 µm and internal luminosities in the VeLLOs that
were obtained from the calculation of the SED of embedded low luminosity protostars with
the two dimensional radiative transfer code RADMC (Dullemond & Dominik 2004; Crapsi
et al. 2008). Their value of Lint estimated from the 70 µm flux is 0.07 L� which is higher
than our Lint. However, their assumed distance of 270 pc is larger than our adopted value.
If they had used 200 pc, then their luminosity would be ∼ 0.04L�, consistent with our value.
Therefore our study suggests that, if the distance of L328 is correct, the luminosity of the
central source is well below 0.1 L� and qualifies L328-IRS as a VeLLO.
What if the assumed distance of L328 is different from 200 pc ? We calculated the
radiative transfer model for two possible extreme distances 125 pc (the distance of the
Ophiuchus) and 310 pc (the distance of the far edge of the Aquila), to examine other possible
values of the internal luminosity of L328-IRS due to the uncertainty of the distance, with
proper scaling of the mass and the size of its envelope at those distances. The internal
luminosities for Tstar=1500 to 3500 K are found to be 0.12 − 0.18L� for the distance of 310
pc and 0.02− 0.03L� for the distance of 125 pc. This indicates that in the extreme scenario
that L328 is possibly located at the far edge of Aquila Rift cloud at 310 pc (Straizys et al.
2003), the internal luminosity of L328-IRS can be slightly higher than the borderline for a
VeLLO. Therefore a good knowledge of the distance is a key issue in deciding whether faint
sources like L328-IRS are of very low luminosity.
There are several pieces of evidence to suggest that our assumed distance of 200 pc
for L328 is more reasonable than 310 pc or even 270 pc (the mean distance to the Aquila
Rift). First, the velocity of L328 is intermediate between that of Ophiuchus (125 pc) and the
Aquila Rift, suggesting an intermediate distance. Second, L328 is seen in absorption against
the background emission at the longer Spitzer wavelengths (5.8 – 70 µm). This background
emission is likely due to PAH and warm dust directly associated with the Aquila Rift clouds,
and strongly suggests that L328 is in the foreground or on the near side of the Rift1.
To summarize, with our best estimate of the distance to L328 of 200 pc and the modeling
of the SED of L328-IRS with a radiative transfer code, its inferred internal luminosity is 0.04
- 0.06 L� and qualifies it as a VeLLO. At the distance extremes which seem to be unlikely,
1Our recent measurement of the distance of L328 using near-IR photometry of 2MASS data around L328
gives a distance of 220 ± 40 which is very consistent with our adopted distance (Maheswar & Lee 2008 in
prep.).

– 14 –
Lint can be lower to 0.02 L� and higher up to 0.18L� In any case, even if Lint = 0.18L�
for L328-IRS, its luminosity would still be close to the VeLLO cutoff, which is not strongly
based on physical properties, and would still be significantly lower than typical protostars.
Accurate determination of the distance of L328-IRS and higher dimensional radiative transfer
modeling together with a more complete SED are required to better determine the luminosity
of L328-IRS.
5.2. Evolutionary fate of L328-IRS
Here we discuss the properties of L328-IRS and compare those with the properties of
other VeLLOs. First of all, we note that the internal luminosity of L328-IRS is fainter than
that of other VeLLOs studied with a similar level of detail, given that all the distances are
fully correct (L1014-IRS, 0.09 L�; L1521F-IRS, 0.06 L�; IRAM 04191+1522, 0.08 L�).
We saw several possible hints for the outflow of L328-IRS. Nebulosity of a few arc-
seconds in length and a probable cavity structure a few tens of arc-seconds long are seen in
L328. The projected length of the NE cavity from L328-IRS is about 6,000 AU (30′′). If
we assume that the nebulosity and tenuous cavity structure represent something related to
outflow activity, then the total size of the outflow from L328-IRS would be at least 12,000
AU. This is larger than the outflow from L1014-IRS (a few hundred AU; Bourke et al. 2005),
but comparable to the projected size (∼ 10, 000 AU) of nebulosity seen in the Spitzer image
of L1521F-IRS (Bourke et al. 2005), and much smaller than the pc scale CO outflow in
IRAM 04191+1522.
We did not find any clear evidence that the outflow of L328-IRS may occur in an episodic
fashion. We looked for any possibility of an episodic event of the outflow by searching an
area of 30′× 30′ around L328 in DSS images and 5′× 5′ in Spitzer images and found no clear
evidence of Herbig-Haro objects or shocked region indicating possible episodic events within
the outflow activity.
Toward L328 no infall signatures are observed in molecular lines, no significant CO
depletion exists (there is CO depletion, but it is not classified as significant compared to
many other cores; Bacmann et al. 2002; Crapsi et al. 2005), and no enhanced deuteration is
observed, implying that it is dynamically and chemically young (Crapsi et al. 2005)1. This
is somewhat similar to what is found in L1014, but very different from the cores hosting the
1The molecular line observations referred in this discussion have been made at
(α, δ)J2000=(18h16m59.s50,−18◦02′30.′′5) which is about 40′′ offset from the position of L328-IRS and
closer to smm1 and smm3. Therefore the discussion may rely on the assumption that similarities of the line

– 15 –
VeLLOs, IRAM 04191+1522 and L1521F-IRS, that show many of these properties (Andre
et al. 1999; Belloche et al. 2002; Crapsi et al. 2004).
The mass (at most of order 0.1 M�) of the parent core smm2 associated with L328-IRS
as a reservoir providing gaseous material to it is much smaller than other cores with VeLLOs
(L1014-IRS, 1.7 M�, Young et al. 2004; L1521F-IRS, 4.8 M�, Crapsi et al. 2005; IRAM
04191+1522, 2.5 M�, Dunham et al. 2006).
Considering these points, L328-IRS is most likely a very low luminosity object, possibly
having outflow activity, embedded in an envelope of small mass that is not dynamically or
chemically evolved. Is L328-IRS just a small version of a protostar which will eventually
grow to a protostar by accreting material from its envelope, or is L328-IRS already on a
different pathway to become a brown dwarf? We find that its observed envelope mass is too
small as a provider of material for L328-IRS to become a star. If we assume a 30 percent
star formation efficiency in L328 (Lada et al. 2007), only a further ∼ 0.03M� of the observed
envelope mass will accrete onto L328-IRS.
Therefore, unless other sub-cores in L328 are involving in the accretion process, the star
formation efficiency is unusually higher than the canonical value, and it has already accreted
more than ∼ 0.05M�, L328-IRS seems to have no hope to become a star in the future, and
is probably destined to be a brown dwarf. However, if any of these assumptions is not true,
alternative scenario in which L328-IRS will grow as a faint protostar and evolve to a normal
star is not ruled out either.
6. Summary
Using data from Spitzer and complementary data at other wavelengths, we have discov-
ered a very faint infrared source (L328-IRS) toward L328 dark cloud which was previously
believed to be starless. L328-IRS is projected onto the smallest submm sub-core in size
among three sub-cores identified in the 8 µm image, and its infrared spectral slope (α = 0.6)
and infrared colors strongly suggests that it is embedded within this core. The low bolo-
metric temperature of about 44 K and the high luminosity fraction (about 72 percent) at
sub-millimeter wavelengths (≥ 350µm) with respect to the bolometric Luminosity suggests
that L328-IRS is a Class 0 protostar. L328-IRS is by far the reddest object in L328 region.
Our molecular line observations find that the optically obscured part of L328 is asso-
ciated with molecular gas with a velocity (LSR) of ∼ 6.5 km s−1, strongly suggesting an
characteristics between the observational position of the molecular lines and the position of L328-IRS exist.

– 16 –
association or similar distance to the nearby molecular clouds of Ophiuchus and the Aquila
Rift. Based on this information and the absorption of L328 at Spitzer wavelengths against
the background emission, we assume a most probable distance of 200 pc.
Using the 1-D radiative transfer code “DUSTY” we modeled the observed SED of L328
by assuming that the emission is from a central star of 1500 to 3500 K with a flared disk that
is reprocessed through an isothermal spherical envelope. The key result of this modeling is
that the internal luminosity of L328-IRS is in the range of 0.04−0.06L�. This classifies L328-
IRS as a VeLLO (Di Francesco et al. 2007; Dunham et al. 2008), and of the four confirmed
VeLLOs studied to a similar level of detail, L328-IRS is the faintest. However, because two
extreme values (125 or 310 pc) of the distance of L328-IRS may be possible, our calculation
with these two distances indicates that its inferred luminosity can be uncertain by a factor
of 2− 3. Accurate determination of the distance of L328-IRS would be necessary to confirm
whether it is a real VeLLO. Nevertheless its low luminosity even at the farthest plausible
distance is still an interesting feature.
The possibility of the existence of a molecular outflow from L328-IRS was explored using
CO observations, but no evidence was found. However, features such as the tenuous cavity
structure extending to the NE from L328-IRS at infrared wavelengths, nebulosity extending
to the SW from L328-IRS seen in H and Ks images, and unusually broad line widths toward
the central region of L328 in dense gas tracers, lead us to believe that outflow activity is
present in L328-IRS. Like the situation in L1014-IRS, the molecular outflow may be too
small and weak to be detected by our low angular resolution observations (Bourke et al.
2005).
The parent core around L328-IRS does not appear to be evolved chemically and dy-
namically, and is too small in mass to enable L328-IRS to become a normal star. Unless
the star formation efficiency in the core is abnormally high, other sub-cores within L328
become involved in the growth of L328-IRS, or L328-IRS has already accreted enough mass,
L328-IRS is probably destined to become a brown dwarf.
We thank an anonymous referee for useful comments and suggestions. We also thank
H. Kirk for providing unsmoothed SCUBA archive data, A. Bacmann for the 1200 µm data,
and H.J. Kim for the discussion on the DUSTY fitting. CWL & YL acknowledge the support
by the Basic Research Program (KOSEF R01-2003-000-10513-0) of the Korea Science and
Engineering Foundation. Support for this work, part of the Spitzer Legacy Science Program,
was provided by NASA through contract 1224608 issued by the Jet Propulsion Laboratory,
California Institute of Technology, under NASA contract 1407. Partial support for TLB was
also provided by NASA through contract 1279198 issued by the Jet Propulsion Laboratory,

– 17 –
California Institute of Technology, under NASA contract 1407. Partial support was also
obtained from NASA Origins grants NNG04GG24G and NNX07AJ72G to NJE.
REFERENCES
Andre, P., Motte, F., & Bacmann, A. 1999, ApJ, 513, L57
Andre, P., Ward-Thompson, D., & Barsony, M. 2000, in Protostars and Planets IV, ed.
Mannings, V., Boss, A.P., & Russell, S.S.(Tucson: University of Arizona Press), 59
Bacmann, A., Andre, P., Pujet, J.-L., Abergel, A., Bontemps, S., & Ward-Thompson, D.
2000, A&A, 361, 555
Bacmann, A., Lefloch, B., Ceccarelli, C., Castets, A., Steinacker, J., & Loinard, L 2002,
A&A, 389, 6
Bacmann, A., Lefloch, B., Ceccarelli, C., Steinacker, J., Castets, A., & Loinard, L 2003,
ApJ, 585, 55
Beichman, C. A., Myers P. C., Emerson, J. P., Harris, S., Mathieu, R., Benson, P. J., &
Jennings, R. E., 1986 ApJ, 307, 337
Belloche, A., & Andre, P., Despois, D., & Blinder, S. 2002 A&A, 393, 927
Benson P.J., & Myers P.C. 1989, ApJS, 71, 89
Black, J.H. 1994, in ASP Conf. Ser. 58, The First Symposium on the Infrared Cirrus and
Diffuse Interstellar Clouds, ed. R.M. Cutri & W. B. Latter (San Francisco: ASP),
355
Butner, H.M., Natta, A., & Evans, N. J., II 1994, ApJ, 420, 326
Bourke, T. L., Crapsi, A., Myers, P. C., Evans, N. J., II, Wilner, D. J., Huard, T. L.,
Jørgensen, J. K., & Young, C. H. 2005, ApJ, 633, L129
Bourke, T. L., Myers, P. C., Evans, N. J., II, Dunham, M. M., Kauffmann, J., Shirley, Y.
L., Crapsi, A., Young, C. H., Huard, T. L., Brooke, T. Y., Chapman, N., Cieza, L.,
Lee, C. W., Teuben, P., & Wahhaj, Z. 2006, ApJ 649, L37
Crapsi, A., Devries, C. H., Huard, T. L., Lee, J.-E., Myers, P. C., Ridge, N. A., Bourke, T.
L., Evans, N. J., II, Jørgensen, J. K., Kauffmann, J., Lee, C. W., Shirley, Y. L., &
Young, C. H. 2005a, A&A, 439, 1023
Crapsi, A., Caselli, P., Walmsley, C. M., Myers, P. C., Tafalla, M., Lee, C. W., & Bourke,
T. L. 2005b, ApJ, 619, 379

– 18 –
Crapsi, A., van Dishoeck, E.F., Hogerheijde, M.R., Pontoppidan, K.M., & Dullemond, C.P.
2008, A&A, 486, 245
Dullemond, C.P., & Dominik, C. 2004, A&A, 417, 159
Dame, T. M., Ungerechts, H., Cohen, R.S., de Geus. E.J., Grenier, I.A., May, J., Murphy,
D.C., Nyman, L.-A., & Thaddeus, P. 1987, ApJ, 322, 706
Dame, T. M., Hartmann, D., Thaddeus, P. 2001, ApJ, 547, 792
de Geus, E. J., de Zeeuw, P. T., Lub, J. 1989, A&A, 216, 44
Di Francesco, J., Evans, N. J., II, Caselli, P., Myers, P. C., Shirley, Y., Aikawa, Y., Tafalla,
M. 2007, in Protostars and Planets V, ed. Reipurth, B., Jewitt, D. & Keil K., (Tucson:
University of Arizona Press), 17
Di Francesco, J., Johnstone, D., Kirk, H., MacKenzie, T., Ledwosinska, E., 2008, ApJS, 175,
277
Draine, B. T. 1978, ApJS, 36, 595
Drain, B.T., & Lee, H. M. 1984, 285, 89
Dunham, M. M., Evans, N. J., II, Bourke, T. L., Dullemond, C. P., Young, C. H., Brooke,
T. Y., Chapman, N., Myers, P. C., Porras, A., Spiesman, W., Teuben, P. J., Wahhaj,
Z. 2006, ApJ, 651, 945
Dunham, M. M., Crapsi, A., Evans, N. J., II, Bourke, T. L., Huard, T.L., Myers, P.C., and
Kauffmann, J. 2008, ApJS, in press, ArXiv e-prints, 806, arXiv:0806.1754
Enoch, M. L., Glenn, J., Evans, N. J., II, Sargent, A. I., Young, K. E., & Huard, T. L. 2007,
ApJ, 666, 982
Evans, N. J. II, Rawlings, J. M. C., Shirley, Y. L., Mundy, L. G. 2001, ApJ, 557, 193
Evans, N. J. II, Allen, Lori E., Blake, G. A., Boogert, A. C. A., Bourke, T., Harvey, P. M.,
Kessler, J. E., Koerner, D. W., Lee, C.W., Mundy, L. G., Myers, P. C., Padgett, D.
L., Pontoppidan, K., Sargent, A. I., Stapelfeldt, K. R., van Dishoeck, E. F., Young,
C. H., & Young, K. E. 2003, PASP, 115, 965
Evans N.J. II., et al. 2007, Final Delivery of Data from the c2d Legacy Project: IRAC and
MIPS (Pasadena: SSC), http://ssc.spitzer.caltech.edu/legacy/all.html
Fazio, G. G., et al. 2004, ApJS, 154, 10
Harvey, P., Merin, B., Huard, T. L., Rebull, L.M., Chapman, N., Evans II, N. J., & Myers,
P.C. 2007, ApJ, 663, 1149
Huard, T. L., et al. 2006, ApJ, 640, 391
– 19 –
Ivezic, A., Nenkova, M., & Elitzur, M. 1999, User Manual for DUSTY (Lexington: Univ.
Kentucky)
Koo et al. 2002, JKAS, 36, 43
Lada, C. J. 1987, in IAU Symp. 115, Star forming regions, ed. Peimbert, M., & Jugaku, J.
(Dordrecht Reidel Publishing Co.), 1
Lada, C. J., & Wilking, B. A. 1984, ApJ, 287, 610
Lada, C. J., Alves, J.F., & Lombardi, M. 2007, in Protostars and Planets V, ed. Reipurth,
B., Jewitt, D. & Keil K., (Tucson: University of Arizona Press), 3
Lee, C. W., & Myers, P.C. 1999, ApJS, 123, 233
Lee, C. W., Myers, P.C., & Tafalla, M. 1999, ApJ, 526, 788
Lohr, A., Bourke, T.L., Lane, A.P., Myers, P.C., Parshley, S.C., Stark, A.A., & Torhill,
N.F.H. 2007, ApJS, 171, 478
Loinard, L., Torres, R. M., Mioduszewski, A., J., & Rodriguez, L.F. 2008, ApJ, 675, L29
Lombardi, M., Lada, C.J., & Alves, J. 2008, A&A, 480, 785
Mamajek, E.E. 2008, Astronomische Nachrichten, 329, 10
Myers, P. C., Fuller, Gary A., Mathieu, R. D., Beichman, C. A., Benson, P. J., Schild, R.
E., Emerson, J. P. 1987, ApJ, 319, 340
Myers, P. C., & Ladd, E.F. 1993, ApJ, 413, 47
Ossenkopf, V., & Henning, Th. 1994, A&A, 291, 943
Padgett, D.L., et al. 2008, ApJ, 672, 1013
Rieke, G. H., et al. 2004, ApJS, 154, 25
Robitaille, T.P., Whitney, B.A., Indebetouw, R., Wood, K., & Denzmore, P. 2006, ApJS,
167, 256
Schechter, P. L., Mateo, M., & Saha, A. 1993, PASP, 105, 1342
Shirley, Y. L., Nordhaus, M. K., Grcevich, J. M., Evans, N. J. II, Rawlings, J. M. C., &
Tatematsu, K. 2005, ApJ, 632, 982
Shu, F. H., Adams, F. C., Lizano, S. 1987, ARA&A, 25, 23
Straizys, V., Cernis, K.& Bartasiute, S. 2003, A&A, 405, 585
Stutz, A., Bourke, T.L., Rieke, G. H., Bieging, J. H., Misselt, K. A., Myers, P.C., & Shirley,
Y. L. 2008, ArXiv:0811.1581v1
Tafalla, M., Myers, P.C., Caselli, P., Walmsley, C.M. & Comito, C. 2002, ApJ, 569, 815
– 20 –
Visser, A.E., Richer, J.S., & Chandler, C.J. 2001, MNRAS, 323, 257
Visser, A.E., Richer, J.S., & Chandler, C.J. 2002, AJ, 124, 2756
Ward-Thompson, D., Andre, P., Crutcher, R., Johnstone, D., Onishi, T., & Wilson, C.
2007, in Protostars and Planets V, ed. Reipurth, B., Jewitt, D. & Keil K., (Tucson:
University of Arizona Press), 33
Wu, J., Dunham, M. M., Evans, N. J. II, Bourke, T. L., & Young, C. H. 2007, AJ, 133, 1560
Young, C. H., et al. 2004, ApJS, 154, 396
Young. C. H., & Evans, N. J. II. 2005, ApJ, 627, 293
Young, K. E., et al. 2006, ApJ, 644, 326
This preprint was prepared with the AAS LATEX macros v5.2.

– 21 –
Fig. 1.— Optical DSS-red image around L328. L328 consists of a dark part of ∼ 2′ × 2′ size
and less opaque tails of ∼ 15 arc-minute long extending to the SW. A white box indicates
the inner part of the region observed by Spitzer for which the Spitzer images are shown in
Fig. 2.

– 22 –
Fig. 2.— Multi-wavelength images of L328. In the bottom left panel is shown 350 µm
emission contours from Wu et al. (2007) over a DSS-red image of L328. Numbers indicate
sub-cores, smm1, smm2, and smm3. The other panels show the Spitzer images of L328. The
infrared source (L328-IRS) is indicated with an arrow. Intensities in all images are adjusted
to best highlight the structures of the L328 subcores. The contour levels of 350 µm emission
are 7, 13, 19, 25, 31, and 37 mJy/beam.

– 23 –
Fig. 3.— Near-IR composite images of L328. A left panel shows a 3 color JHKs composite
image of L328 (blue = J, green = H, red = Ks). This figure illustrates some structures
possibly related to an outflow activity from L328-IRS, ∼ 30′′cavity (designated as A) and
nebulosity associated with L328-IRS itself (designated as B). A region drawn with a white box
is enlarged in the right panel to show a close up of L328-IRS (at image center). Intensities
in the composite images are adjusted to best enhance the structures of these cavity and
nebulosity in L328 region.

– 24 –
Fig. 4.— Three color composite image of L328 at 5.8 µm (blue), 8 µm (green), and 24 µm
(red). White contours are 350 µm emission from Wu et al. (2007), drawn with the same
levels as those in Fig. 2. A circle in the right corner indicates the FWHM beam size (8.5′′)
of the 350 µm data. Intensities are manually adjusted to show better the structures of the
subcores and the ∼ 30′′cavity in L328 region.

– 25 –
Fig. 5.— Spitzer color-color diagram of L328. Colors ([3.6]-[4.5] versus [5.8]-[24.0]) for all
point sources in the L328 field observed with the Spitzer are displayed.
– 26 –
Fig. 6.— Molecular line spectra toward L328-IRS. Note that the position for the profiles
[(α, δ)J2000=(18h16m59.s50,−18◦02′03.′′)] is that of the CO emission peak and also the center of
CO map in Fig. 7, actually ∼ 27.5′′ offset from L328-IRS. Five different velocity components
of 6.5, 12.0, 17.8, 43.4 and 64 km s−1 are indicated by vertically dotted lines. The temperature
scale of N2H+ (1-0) has been scaled up by a factor of 3.

– 27 –
Fig. 7.— C18O integrated intensity (∫
T∗
Adv) maps for two brightest velocity components.
The central position of the map is (α, δ)J2000=(18h16m59.s50,−18◦02′03.′′), shifted by ∼ 27.5′′
from L328-IRS. The contour levels in the left panel are 0.10, 0.15, 0.20, 0.25, 0.30, 0.35,
0.40, and 0.45 K km s−1 while the contour levels in the right panel are 1.0, 1.1, 1.2, and 1.3
K km s−1. A star in both panels marks the position of L328-IRS.

– 28 –
Fig. 8.— An example of a best fit radiative transfer model to the SED of L328-IRS. Filled
circles with error bars are flux densities at the observed wavelengths. Open circles at 350
µm and long-ward are model fluxes measured with the same apertures as the observed ones.
Our model consists of a stellar black body (T=1500-3500K), a flared disk of 3.8× 10⁻⁴ M�,
and dusty isothermal envelope of inner radius 50 AU and outer radius of 10,000 AU. The full
model SED is shown with the solid continuous line, while the input internal star+disk and
envelope models are shown as dotted lines and labeled. The input emission from the central
source (star+disk) is absorbed by the dusty envelope at mainly short wavelengths (from NIR
to 70 µm) so that the output emission at these wavelengths is dimmer than the input, and
reprocessed in the envelope to produce emission at longer wavelengths. The model SED in
the figure was obtained with Tstar=2000K and Lint = 0.05L�.

– 29 –
Table 1. Photometry of L328-IRS
Wavelength Flux density σ Aperture
(λ) (mJy) (mJy) (arcsec)
3.6 2.52 0.34 9.0
4.5 4.99 0.46 10.1
5.8 4.64 0.48 10.1
8.0 1.72 0.27 4.6
24 69.2 5.0 34.3
70 281 41 29.7
350a 3200 950 20.0
850 163 80 20.0
1200 70 80 20.0
aNote that this photometry was conducted by centering L328-IRS in an aperture of 20′′
and thus the flux density is larger than that (2000 mJy) reported by Wu et al. (2007)
which had been obtained by centering on the peak position of the smm2 core with the same
aperture.


!['sou daltônico, não vejo cores': novas [velhas] estratégias de ...](https://static.fdokumen.com/doc/165x107/63147de0c72bc2f2dd0466bd/sou-daltonico-nao-vejo-cores-novas-velhas-estrategias-de-.jpg)