Spitzer 24 μm Images of Planetary Nebulae
24
Spitzer 24 μm Images of Planetary Nebulae You-Hua Chu 1 , Robert A. Gruendl 1 , Martin A. Guerrero 2 , Kate Y. L. Su 3 , Jana Bilikova 1 , Martin Cohen 4 , Quentin A. Parker 5 , Kevin Volk 6 , Adeline Caulet 1 , Wen-Ping Chen 7 , Joseph L. Hora 8 , Thomas Rauch 9 ABSTRACT Spitzer MIPS 24 μm images were obtained for 36 Galactic planetary nebulae (PNe) whose central stars are hot white dwarfs (WDs) or pre-WDs with effective temperatures of ∼100,000 K or higher. Diffuse 24 μm emission is detected in 28 of these PNe. The eight non-detections are angularly large PNe with very low Hα surface brightnesses. We find three types of correspondence between the 24 μm emission and Hα line emission of these PNe: six show 24 μm emission more extended than Hα emission, 10 have a similar extent at 24 μm and Hα, and 12 show diffuse 24 μm emission near the center of the Hα shell. The sizes and surface brightnesses of these three groups of PNe and the non-detections suggest an evolutionary sequence, with the youngest ones being brightest and the most evolved ones undetected. The 24 μm band emission from these PNe is attributed to [O IV] 25.9 μm and [Ne V] 24.3 μm line emission and dust continuum emission, but the relative contributions of these three components depend on the temperature of the central star and the distribution of gas and dust in the nebula. 1 Department of Astronomy, University of Illinois at Urbana-Champaign, 1002 West Green Street, Urbana, IL 61801; [email protected] 2 Instituto de Astrof´ ısica de Andaluc´ ıa, CSIC. c/ Camino Bajo de Hu´ etor 50, E-18008 Granada, Spain 3 Stewart Observatory, University of Arizona, Tucson, AZ 85721 4 Radio Astronomy Laboratory, University of California, Berkeley, CA 94720 5 Department of Physics, Macquarie University, Sydney, NSW 2109, Australia 6 Space Telescope Science Institute, 3700 San Martin Drive, Baltimore, MD 21218 7 Institute of Astronomy, National Central University, Chung-Li, Taiwan 8 Center for Astrophysics, 60 Garden St., MS 65, Cambridge, MA 02138 9 Institut f¨ ur Astronomie und Astrophysik T¨ ubingen (IAAT), Abteilung Astronomie, Sand 1, D-72076 T¨ ubingen, Germany
Transcript of Spitzer 24 μm Images of Planetary Nebulae

Spitzer 24 µm Images of Planetary Nebulae
You-Hua Chu1, Robert A. Gruendl1, Martin A. Guerrero2, Kate Y. L. Su3, Jana Bilikova1,
Martin Cohen4, Quentin A. Parker5, Kevin Volk6, Adeline Caulet1, Wen-Ping Chen7,
Joseph L. Hora8, Thomas Rauch9
ABSTRACT
Spitzer MIPS 24 µm images were obtained for 36 Galactic planetary nebulae
(PNe) whose central stars are hot white dwarfs (WDs) or pre-WDs with effective
temperatures of ∼100,000 K or higher. Diffuse 24 µm emission is detected in
28 of these PNe. The eight non-detections are angularly large PNe with very
low Hα surface brightnesses. We find three types of correspondence between the
24 µm emission and Hα line emission of these PNe: six show 24 µm emission
more extended than Hα emission, 10 have a similar extent at 24 µm and Hα,
and 12 show diffuse 24 µm emission near the center of the Hα shell. The sizes
and surface brightnesses of these three groups of PNe and the non-detections
suggest an evolutionary sequence, with the youngest ones being brightest and
the most evolved ones undetected. The 24 µm band emission from these PNe
is attributed to [O IV] 25.9 µm and [Ne V] 24.3 µm line emission and dust
continuum emission, but the relative contributions of these three components
depend on the temperature of the central star and the distribution of gas and
dust in the nebula.
1Department of Astronomy, University of Illinois at Urbana-Champaign, 1002 West Green Street, Urbana,
IL 61801; [email protected]
2Instituto de Astrofısica de Andalucıa, CSIC. c/ Camino Bajo de Huetor 50, E-18008 Granada, Spain
3Stewart Observatory, University of Arizona, Tucson, AZ 85721
4Radio Astronomy Laboratory, University of California, Berkeley, CA 94720
5Department of Physics, Macquarie University, Sydney, NSW 2109, Australia
6Space Telescope Science Institute, 3700 San Martin Drive, Baltimore, MD 21218
7Institute of Astronomy, National Central University, Chung-Li, Taiwan
8Center for Astrophysics, 60 Garden St., MS 65, Cambridge, MA 02138
9Institut fur Astronomie und Astrophysik Tubingen (IAAT), Abteilung Astronomie, Sand 1, D-72076
Tubingen, Germany

– 2 –
Subject headings: planetary nebulae: general – infrared: stars – white dwarfs –
circumstellar matter
1. Introduction
Low- and intermediate-mass stars expel their envelopes to form planetary nebulae (PNe),
while their exposed cores evolve into white dwarfs (WDs). The morphology of a PN can be
very complex. First of all, a PN may show a multiple-shell morphology due to interactions
between fast and slow winds (Kwok 1983) and between the winds and the ambient interstellar
medium (Dgani & Soker 1998; Villaver et al. 2003). A bipolar structure may be developed
in a PN owing to a fast stellar rotation or close binary interaction (Soker & Livio 1989).
Moreover, the effective temperature of the central star of a PN (CSPN) increases as the
nebula expands, and the varying stellar UV flux results in varying ionization and excitation
structure in the PN (Schonberner 1983). Therefore, images of a PN taken at different
wavelengths may exhibit very different morphologies, and comparisons among these images
help us understand the PN’s physical conditions and structure.
Infrared (IR) imaging of PNe from the ground is easy at wavelengths .2 µm, but
becomes increasingly difficult at longer wavelengths. The Spitzer Space Telescope (Werner
et al. 2004) makes it possible for the first time to obtain high-resolution images of a large
number of PNe at near- and mid-IR wavelengths. Its InfraRed Array Camera (IRAC; Fazio et
al. 2004) takes images at 3.6, 4.5, 5.8, and 8.0 µm, while the Multiband Imaging Photometer
for Spitzer (MIPS; Rieke et al. 2004) takes images at 24, 70, and 160 µm. IRAC images
are available for over 60 PNe and they have detected emission from ionized gas, warm
dust, polycyclic aromatic hydrocarbons (PAHs), and H2 molecular gas (e.g., Hora et al.
2004, 2008; Hora 2009). Only about a dozen mature PNe had MIPS images available (not
including proto-PNe, which are usually unresolved and often saturated in MIPS 24 µm
images). Analyses of MIPS observations of NGC 650 (Ueta 2006), NGC 2346 (Su et al.
2004), and NGC 7293 (Su et al. 2007) suggest that diffuse emission in the 24 µm band is
dominated by the [O IV] 25.9 µm line, and the 70 and 160 µm bands by dust continuum
emission.
We have conducted a Spitzer MIPS 24 µm survey of 72 hot WDs or pre-WDs, selected
from McCook & Sion (1999) and Napiwotzki (1999), to search for dust disks at radii of a
few tens of AU (PID 40953). Thirty-six of these hot stars surveyed are still surrounded by
visible PNe; therefore, our MIPS survey of hot WDs has provided a three-fold increase of

– 3 –
24 µm images of spatially resolved PNe in the entire Spitzer archive. Diffuse emission in
the 24 µm band is detected from 28 PNe, among which ∼50% show shell morphologies and
∼35% show emission only in the central region near the CSPN. In this paper, we describe
the observations in Section 2, present the results in Section 3, and discuss the origins of the
24 µm emission in Section 4 and implications of this emission in Section 5.
2. Observations
The MIPS onboard the Spitzer Space Telescope was used to image the 36 PNe in the
24 µm band as part of Program 40953. Each object was imaged in the Photometry Mode
using the small offset scale with 10 s exposure time for 3 cycles. The Basic Calibrated Data
processed by the Spitzer Science Center’s pipeline software were used to produce mosaics of
the PNe. Prior to building each mosaic, bad pixels and latent images of bright point sources
in each frame were flagged, and background brightness offsets between individual frames
were determined and corrected using the method outlined by Regan & Gruendl (1995).
The MOPEX software package was used to combine data and produce the mosaics. The
field-of-view of each mosaic covers ∼8.0′×7.5′, of which the central ∼3.5′×3.0′ portion has a
total exposure time of ∼420 s and the outer regions have exposure times 1/2 or 1/4 that of
the center. We note that latent images of the brighter PNe sometimes persist in the outer
portions of the final mosaics. The point spread function of MIPS at 24 µm has a FWHM of
∼6′′.
3. Results
The 36 PNe that have been imaged in the MIPS 24 µm band are listed in Table 1,
where their names, Galactic coordinates, and central stars are given in Columns 1–3. Table
1 also lists the following useful parameters: Column 4, the stellar effective temperature (Teff);
Column 5, the angular size of the main nebula in Hα; Column 6, distance; Column 7, the
linear size of the main nebula in Hα; Column 8, the He II/Hβ flux ratio; and Column 9, the
peak surface brightness at 24 µm. Eight of these 36 PNe were not detected in the 24 µm
images; these PNe are listed at the end of Table 1.
Among the 28 PNe that were detected, a variety of morphologies are observed. To
understand the origin of this emission, we compare each PN’s 24 µm morphology to its

– 4 –
optical morphology. Hα images1, showing all dense ionized gas, are best for such comparison;
however, not all PNe have Hα images available, and we have to resort to the Digitized Sky
Survey 2 red (DSS2r) images. For PNe with hot CSPNs, the nebular excitation and ionization
is high and the strongest emission line in the DSS red passband is the Hα line; thus DSS2r
images are excellent substitutes for Hα images. In one exception, HaTr 7, the DSS 2 blue
(DSS2b) image is used because it shows the nebula better than the DSS2r image (Hartl &
Tritton 1985). For the rest of the paper, we will loosely use these DSS2r and DSS2b images
as “Hα” images, assuming that they are similar.
To compare the spatial distribution of the 24 µm and Hα emission, we have extracted
surface brightness profiles along cuts through the nebular center (i.e., the CSPN) at position
angles (PAs) selected to avoid contaminating stars and to sample the well-defined parts of
the main nebula. The surface brightness profiles are normalized to the peak of the nebular
emission and plotted in the figures. Using the images and surface brightness profiles, we find
three kinds of correspondence between the 24 µm and Hα morphologies of the 28 PNe: (1)
the 24 µm emission is more extended than the Hα emission, (2) the 24 µm emission has the
same spatial extent as the Hα emission, and (3) the 24 µm emission peaks near the CSPN
within the Hα shell. We have used these different correspondences between 24 µm and Hα
emission to divide the PNe into three groups accordingly, and arranged them in Table 1 and
Figures 1–3 in the order of these groups to facilitate easy comparisons among objects. More
detailed descriptions of these groups are given below.
3.1. Group 1
PNe in Group 1 (Figure 1) appear more extended in MIPS 24 µm images than in Hα
images. Their images also show sharper outer rims in Hα than at 24 µm, but the differences
in sharpness are in part caused by different angular resolutions, ∼6′′ for 24 µm and ≤2.5′′
for Hα. The spatial extent of emission is better illustrated by the surface brightness profiles.
The 24 µm emission is 10–20′′ more extended than the Hα emission, and this extension
cannot be attributed to the poorer instrumental resolution of the 24 µm images. To further
1Hα images of MeWe 1-3, HeDr 1, Lo 4, and BlDz 1 are taken from AAO/UKST Hα Survey; those of
MWP 1, NGC 246, and Sh 2-188 were obtained using the Lulin Observatory 1 m telescope; that of NGC
1360 was obtained with the Mt. Laguna 1 m telescope; those of Abell 21, Abell 39, Abell 43, EGB 1, IC
1295, Jn 1, and JnEr 1 are taken from The IAC Catalog of Northern Galactic Planetary Nebulae (Manchado
et al. 1996); those of IC 289, NGC 2438, NGC 2610, NGC 3587, and NGC 6852 (published by Hajian et
al. 1997; Corradi et al. 2000, 2003) have been downloaded from the Image Database of Planetary Nebulae
Haloes web-page maintained by Romano L. M. Corradi.

– 5 –
illustrate this point, we have convolved the DSS2r image of Abell 15 with the MIPS 24 µm
PSF and plotted the convolved surface brightness profile in a dotted curve in Figure 1. It
is clear that the convolved “Hα” surface brightness profile is still not as extended as the 24
µm surface brightness profile.
PNe in Group 1 all show similar morphologies at 24 µm: a bright inner shell surrounded
by a faint outer envelope; however, the outer envelopes have obvious optical counterparts
only in IC 289 and NGC 2610. In the case of NGC 6852, the 24 µm image shows a smooth
spherical outer envelope, but its Hα and [O III] images show faint bipolar outer features
along PAs of 140◦ and 320◦ (Manchado et al. 1996).
3.2. Group 2
PNe in Group 2 (Figure 2) have 24 µm and Hα surface brightness profiles falling off in
a similar fashion at the outer rim. Some of these PNe have a well-defined shell morphology,
e.g., Abell 39, Abell 43, and NGC 246, but some have irregular shapes or a centrally filled
morphology, e.g., MWP 1 and NGC 1360. Overall the morphologies are similar at 24 µm
and Hα, although the details may differ. For example, Jn 1 shows clear limb-brightening
in Hα, but appears more filled-in at 24 µm. NGC 246 shows enhanced 24 µm emission at
40′′–45′′ NW and SE of the CSPN, and its IRAC images also show displaced enhancements
along the same PAs (Hora et al. 2004), but no Hα counterparts are seen.
3.3. Group 3
PNe in Group 3 (Figure 3) show diffuse 24 µm nebular emission only in the central
region near the CSPN, totally different from the distribution of Hα emission. A variety of
Hα morphologies are observed in this group of PNe: thick shells in JnEr 1 and NGC 2438;
centrally filled shells in Abell 61, BlDz 1, HaTr 7, IC 1295, K 1-22, NGC 3587, and Sh
2-216; semi-circular arcs in Abell 21 and Sh 2-188; and irregular morphology in EGB 1. It
is interesting to note that IC 1295, K 1-22, and NGC 3587 show 24 µm emission only near
the center of the Hα shell, but the 24 µm morphology is strikingly similar to a scaled-down
Hα morphology. In all three cases, the 24 µm image is bisected by a band of lower surface
brightness along the major axis of the Hα shell.

– 6 –
3.4. Nondetections
Eight PNe do not show detectable nebular emission in the 24 µm band. Seven of these
PNe are angularly larger than the areas that were mapped by the MIPS 24 µm observations
(see Column 5 of Table 1), and their surface brightnesses are very low near the CSPNs,
where the MIPS observations were centered. There might be some diffuse 24 µm emission in
the PN JavdSt 1 (Jacoby & van de Steene 1995), but it is close to the noise level. BE UMa
is a cataclysmic variable with a ∼3′ nebular shell (Liebert et al. 1995), which is completely
covered by the MIPS 24 µm mosaic, but no diffuse 24 µm emission is detected.
4. Origins of the MIPS 24 µm Emission
What are the origins of the diffuse emission detected in the Spitzer MIPS 24 µm band?
The [Ne V] 24.3 µm and [O IV] 25.9 µm nebular lines and dust continuum are the three
main candidates contributing to the MIPS 24 µm fluxes, as indicated by ISO SWS spectra
of the young PN NGC 7027 and the bipolar PN NGC 2346. In NGC 7027, [O IV] and [Ne V]
lines and dust continuum are all significant, although the [Ne V] line is only 1/2 as bright as
the [O IV] line (Bernard Salas et al. 2001). In NGC 2346, the [O IV] line contributes 27%,
and dust continuum contributes the rest of the emission in the MIPS 24 µm band (Su et al.
2004). The excitation potentials of Ne V and O IV are 97.1 and 54.9 eV, respectively. It is
not surprising that NGC 7027 and NGC 2346 have such different [Ne V]/[O IV] ratios, as
the former CSPN has an effective temperature of ∼160,000 K (Beintema et al. 1996) and the
latter CSPN has a Zanstra temperature of only ∼100,000 K (Mendez 1978). It is conceivable
that the [Ne V]/[O IV] ratio increases with stellar temperature, and for CSPNs with effective
temperatures ≤150,000 K the [O IV] 25.9 µm line is by far the strongest emission line in the
MIPS 24 µm band.
The ubiquitous presence of [O IV] line emission in our PNe is indicated by the He II
λ4686 emission that is detected in all available spectroscopic observations of these PNe
(see Column 8 of Table 1; compiled by Tylenda et al. 1994). The He II line is emitted
through recombinations of He III, of which the excitation potential is 54.4 eV. This excitation
potential is close to that of O IV, thus wherever the He II emission is present there ought to
be [O IV] emission, as long as the density is not excessively higher than the critical density
of [O IV], ∼ 9 × 103 cm−3.
Note that the He II/Hβ ratios in Column 8 of Table 1 appear to be higher for PNe
in Groups 1 and 2 than for those in Group 3, but this is an artificial effect of how the
observations were conducted. Optical spectrophotometric observations of PNe are usually

– 7 –
made in regions of high surface brightness. For PNe in Group 1 and Group 2, the optically
bright regions are also bright in the MIPS 24 µm band; however, for PNe in Group 3, the
bright 24 µm emission peaks near the center of a nebula, offset from the brightest optical
emission in the shell where spectrophotometric observations are made. The He II/Hβ ratios
at the central diffuse 24 µm emission regions should be much higher than those in the
nebular shells for Group 3 PNe. The radial variations of the He II/Hβ ratio, as well as the
[Ne V]/[O IV] ratio, reflect the well-known excitation and ionization stratifications in PNe.
The relative importance of nebular line emission and dust continuum in the MIPS 24 µm
band depends on the ionization structure and dust content of a PN. It has been illustrated by
Spitzer IRS observations of PNe in the Large and Small Magellanic Clouds that bipolar PNe
are generally dustier than round/elliptical PNe and that the largest PNe exhibit the least
dust continuum emission (Stanghellini et al. 2007). Group 1 PNe have 24 µm emission more
extended than the Hα emission. As [O IV] tracks He II and the He II/Hα ratio decreases with
radial distance from the CSPN, due to ionization and excitation stratification, the extended
emission in the MIPS 24 µm band must be dominated by dust continuum. For the main
bodies of PNe in Groups 1 and 2, it is likely that both the nebular [O IV] line emission
and dust continuum contribute to the MIPS 24 µm flux, but the exact ratios cannot be
determined from the current data; spectroscopic observations are needed.
To determine the ratio of line emission to dust continuum for Group 3 PNe, we take
a detailed look at Spitzer observations of diffuse emission from the Helix Nebula (Su et
al. 2007). The IRAC images and MIPS 70 and 160 µm images of the Helix Nebula show
the prominent helical ring structure with a hollow center, while the MIPS 24 µm image
shows bright diffuse emission in the central region but only faint emission in the helical
ring. Spitzer IRS observations were made at the central star and its immediate surroundings
without additional observations of an external background region. These observations were
adequate for deriving a spectrum of the central star but not a spectrum of the nebular
emission because the zodiacal background was bright toward the Helix Nebula. MIPS 24 µm
observations indicated that the nebular surface brightness was only about 1/7 that of the
zodiacal emission. Indeed, the spectrum of a diffuse emission region near the Helix central
star, shown in Figure 4, is dominated by the zodiacal dust continuum emission, and it is
not clear whether a small fraction of the dust continuum originates in the Helix Nebula.
Nevertheless, the nebular spectrum in Figure 4 shows strong [O IV] 25.9 µm line emission;
the [Ne V] 24.3 µm line is much weaker than that of the region encompassing the central
star (see Figure 2 of Su et al. 2007).
Recently, we obtained Spitzer IRS observations of the CSPN of Sh 2-188 in the mapping
mode (PID 50629). While these observations will be presented in another paper, we have

– 8 –
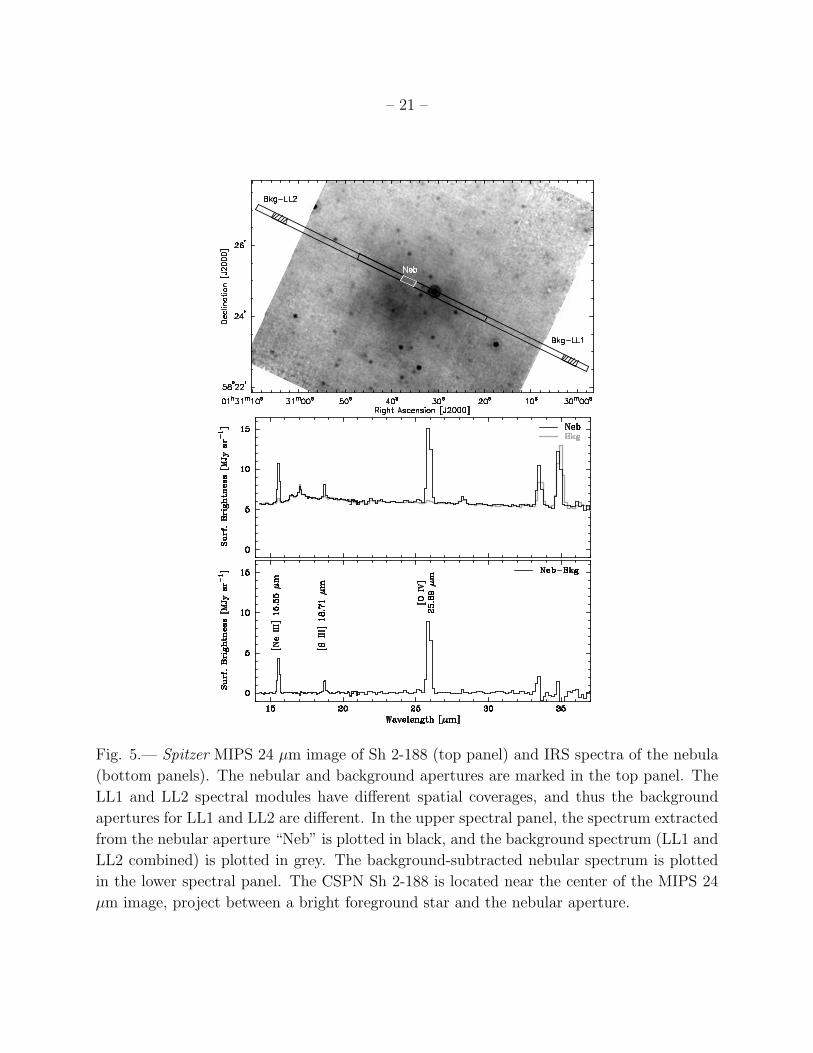
used these data to extract a spectrum of the diffuse emission near the central cavity. Figure
5 shows the slit positions marked on a MIPS 24 µm image of Sh 2-188. The spectra extracted
from the nebular aperture “Neb” and from the background aperture “Bkg” show significant
amounts of dust continuum emission and PAH emission. The origins of this dust continuum
and PAH emission are not clear and could be nebular, interstellar, or even zodiacal. The
background-subtracted nebular spectrum shows essentially all fine-structure line emission,
with the [O IV] line dominating in the MIPS 24 µm band. Therefore, at least in the case
of Group 3 PN Sh 2-188 the central diffuse emission in the MIPS 24 µm band is by far
dominated by the [O IV] line emission. It is likely that the central diffuse 24 µm emission
from all Group 3 PNe is dominated by the [O IV] line. The contribution of [Ne V] line is
smaller and depends on the effective temperature of the CSPN and the radial distance to
the CSPN.
Finally, we note a complication in NGC 2438. While NGC 2438 is placed in Group
3 with centrally peaked 24 µm emission, diffuse 24 µm emission at lower levels is detected
from its nebular shell as well as its halos. As shown in Figure 6, an archival IRAC 8 µm
image of NGC 2438 has detected two halos around its main nebular shell, similar to the
Hα+[N II] image reported by Corradi et al. (2003); our MIPS 24 µm image of NGC 2438 has
detected the main nebular shell and the inner halo clearly, and perhaps some faint emission
from the outer halo as well. The IRAC 8 µm band contains strong PAH emission features
at 7.7 and 8.6 µm, forbidden lines of [Ar II], [Ar III], [Ar V], and [Ne VI], and weak H I
recombination lines, such as Pfα. The bright halo emission of NGC 2438 in the 8 µm band
is most likely dominated by the PAH features. The 24 µm image of NGC 2438 resembles its
[O III] λ5007 image (Corradi et al. 2003), suggesting that [O IV] 25.9 µm line emission may
make significant contributions to the MIPS 24 µm flux. The relative importance of nebular
line and dust continuum emission is unknown. NGC 2438 is near an open cluster, which
may also play some role in radiatively exciting the halo of NGC 2438.
5. Implications on PN Evolution
We have defined three groups of PNe according to the spatial extent of the 24 µm emis-
sion compared with that of the Hα emission. To compare physical properties among these
three groups of PNe, we have used the information in Table 1 and plotted the distribution
of stellar Teff and nebular sizes in Figure 7. A rough trend of size increase is seen from
Group 1 through Groups 2 and 3 to the nondetections, suggesting an evolutionary sequence.
The stellar Teff , on the other hand, does not show any obvious trend. This is not surpris-
ing because stellar evolutionary tracks bend at the high-temperature extremes and different
– 9 –
initial stellar masses lead to different extreme stellar temperatures; thus stellar temperature
distributions are not sensitive indicators of evolution.
The evolutionary sequence is also supported by the 24 µm surface brightnesses. We
have measured the peak 24 µm surface brightness in the shell rim of each PN in Groups
1 and 2 and in the central diffuse-emission region of each PN in Group 3. These surface
brightness measurements are listed in Column 9 of Table 1. Two Group 2 PNe, Lo 4 and
NGC 246, have peculiar bright spots within their nebular shells; the surface brightnesses of
these bright spots are about twice as high as the peak surface brightness in the shell rim. It is
quite evident that Group 1 PNe on average have the highest surface brightnesses, and Group
3 PNe have the lowest surface brightnesses. The PNe that do not show detectable diffuse 24
µm emission are still fainter than Group 3 PNe. As surface brightness depends on density
that decreases as a PN expands, the trend that the 24 µm surface brightness decreases
from Group 1 through Groups 2–3 to the non-detections provides another indication of an
evolutionary sequence among these PNe.
6. Summary
We have obtained Spitzer MIPS 24 µm observations of 36 Galactic PNe, and detected
diffuse emission in 28 of them. Comparing the 24 µm surface brightness profiles with those in
the Hα line, we find the 24 µm emission can be more extended, similar, or present only in the
shell center, and divided these PNe into Groups 1–3, respectively. The optical shell sizes and
24 µm surface brightnesses of the PNe observed suggest that Groups 1–3 and non-detections
represent an age or evolutionary sequence, with Group 1 being the youngest.
The diffuse emission in the MIPS 24 µm band is attributed to [O IV] 25.9 µm and
[Ne V] 24.3 µm lines and dust continuum emission, but the relative proportions of these
three components depend on the nebular excitation and dust content. The extended 24 µm
emission in Group 1 PNe is most likely dominated by dust continuum, as high-ionization fine-
structure line emission is expected to decline radially outward. Spectroscopic observations
are needed to determine the ratio of nebular line emission to dust continuum for the main
bodies of PNe in Groups 1 and 2. Using a Spitzer IRS spectrum of the central diffuse emission
region of PN Sh 2-188, we illustrate that the [O IV] line is by far the dominant contributor
to the MIPS 24 µm emission. It is likely that [O IV] line emission, and some [Ne V] line
emission for the hottest CSPNs, dominates the central diffuse 24 µm emission among all
Group 3 PNe.
This research was supported by NASA grants JPL 1319342 and JPL 1343946. MAG

– 10 –
acknowledges support by grants AYA2005-01495 of the Spanish Ministerio de Educacion
y Ciencia (MEC) and AYA2008-01934 of the Spanish Ministerio de Ciencia e Innovacion
(MICINN).
REFERENCES
Beintema, D. A., et al. 1996, A&A, 315, L253
Bernard Salas, J., Pottasch, S. R., Beintema, D. A., & Wesselius, P. R. 2001, A&A, 367, 949
Cahn, J. H., Kaler, J. B., & Stanghellini, L. 1992, A&AS, 94, 399
Corradi, R. L. M., Schonberner, D., Steffen, M., & Perinotto, M. 2000, A&A, 354, 1071
Corradi, R. L. M., Schonberner, D., Steffen, M., & Perinotto, M. 2003, MNRAS, 340, 417
Dgani, R., & Soker, N. 1998, ApJ, 495, 337
Fazio, G. G., et al. 2004, ApJS, 154, 10
Hajian, A. R., Frank, A., Balick, B., Terzian, Y. 1997, ApJ, 477, 226
Harris, H. C., et al. 2007, AJ, 133, 631
Hartl, H., & Tritton, S. B. 1985, A&A, 145, 41
Hora, J. L. 2009, in Asymmetrical Planetary Nebulae IV, eds. R. L. M. Corradi, A. Man-
chado, & N. Soker, Springer-Verlag, in press
Hora, J. L., Marengo, M., Smith, H. A., Cerrigone, L., & Latter, W. B. 2008, in “The Evolv-
ing ISM in the Milky Way and Nearby Galaxies,” ArXiv e-prints, 803, arXiv:0803.3937
Hora, J. L., Latter, W. B., Allen, L. E., Marengo, M., Deutsch, L. K., & Pipher, J. L. 2004,
ApJS, 154, 296
Jacoby, G. H., & van de Steene, G. 1995, AJ, 110, 1285
Kwok, S. 1983, in IAU Symp. 103, Planetary Nebulae, p. 293
Liebert, J., Tweedy, R. W., Napiwotzki, R., & Fulbright, M. S. 1995, ApJ, 441, 424
Manchado, A., Guerrero, M. A., Stanghellini, L., & Serra-Ricart, M. 1996, The IAC Mor-
phological Catalog of Northern Galactic Planetary Nebulae

– 11 –
McCook, G. P., & Sion, E. M. 1999, ApJS, 121, 1
Mendez, R. H. 1978, MNRAS, 185, 647
Napiwotzki, R. 1999, A&A, 350, 101
Regan, M. W. & Gruendl, R. A. 1995, in ADASS IV Proceedings, ASP Conference Series
77, eds. R. A. Shaw, H. E., Payne, & J. J. E. Hayes, 335
Rieke, G. H., et al. 2004, ApJS, 154, 25
Schonberner, D. 1983, ApJ, 272, 708
Soker, N., & Livio, M. 1989, ApJ, 339, 268
Stanghellini, L., et al. 2007, ApJ, 671, 1669
Su, K. Y. L., et al. 2004, ApJS, 154, 302
Su, K. Y. L., et al. 2007, ApJ, 657, L41
Tylenda, R., Stasinska, G., Acker, A., & Stenholm, B. 1994, A&AS, 106, 559
Ueta, T. 2006, ApJ, 650, 228
Villaver, E., Garcıa-Segura, G., & Manchado, A. 2003, ApJ, 585, L49
Werner, M. W., et al. 2004, ApJS, 154, 1
Werner, K., & Herwig, F. 2006, PASP, 118, 183
This preprint was prepared with the AAS LATEX macros v5.2.

– 12 –

– 13 –
Fig. 1.— Images and surface brightness profiles of Group 1 PNe. The nebula names and
passbands are marked on the upper left and right corners, respectively. The surface bright-
ness profiles are extracted through the nebular center along the position angle PA labeled at
the upper right corner. The Hα surface brightness profile is plotted in black and 24 µm in
grey. Note that the “Hα” surface brightness profiles of Abell 15 and Abell 20 are extracted
from DSS2r images, and that the “Hα” surface brightness profile of Abell 15 convolved by
the MIPS 24 µm PSF is plotted in dotted black curve.

– 14 –

– 15 –

– 16 –
Fig. 2.— Same as Figure 1, but for Group 2 PNe. Note that the “Hα” surface brightness
profiles of K 1-27 and LoTr 4 are extracted from DSS2r images.

– 17 –

– 18 –

– 19 –
Fig. 3.— Same as Figure 1, but for Group 3 PNe. Note that the “Hα” surface brightness
profiles of Abell 61, K 1-22, and Sh 2-216 are extracted from DSS2r images, and HaTr 7
from a DSS2b image.

– 20 –
Fig. 4.— Spitzer IRS spectrum of the central 24 µm diffuse emission region of the Helix
Nebula. No off-source background spectrum was available for zodiacal background subtrac-
tion; thus the continuum in the spectrum is dominated by the zodiacal background, which
can be approximated by a 200 K blackbody model (dashed curve). The response curve of
the MIPS 24 µm band is plotted in a dotted curve.
– 21 –
Fig. 5.— Spitzer MIPS 24 µm image of Sh 2-188 (top panel) and IRS spectra of the nebula
(bottom panels). The nebular and background apertures are marked in the top panel. The
LL1 and LL2 spectral modules have different spatial coverages, and thus the background
apertures for LL1 and LL2 are different. In the upper spectral panel, the spectrum extracted
from the nebular aperture “Neb” is plotted in black, and the background spectrum (LL1 and
LL2 combined) is plotted in grey. The background-subtracted nebular spectrum is plotted
in the lower spectral panel. The CSPN Sh 2-188 is located near the center of the MIPS 24
µm image, project between a bright foreground star and the nebular aperture.

– 22 –
Fig. 6.— Spitzer IRAC 8.0 µm and MIPS 24 µm images of NGC 2438. The diagonal stripes
of stray light in the 24 µm image is spilled from the Calabash Nebula, a very bright IR source
in the post-AGB phase at ∼6.5′ northeast of NGC 2438.

– 23 –
A7
EGB
HDW WeDe1
JavdSt 1
A21
EGB1
K1−22
JnEr11
HaTr7
Sh 2−188
NGC3587
Sh 2−216
A61
BEUMa
MWP1
Jn 1
Lo4
LoTr
A20
A15IC
1360
A43
HeDr1
NGC
MeWe
NGC
K1−27NGC246
A39
1295IC NGC BlDz
61
2610
1−3
289
2438
3
A20
A15IC
289
6852NGC
NGC2610
A43
NGC
NGC4 246
1360
A39 Jn 1
K1−22
3587
1295
NGC
2438
NGC
ICA21
216Sh 2−
A74 A74
A7PuWe
1PuWe
Group 2
Group 3Group 3
Group 2
Group 1 Group 1
Non−detectionNon−detection
100 15080 90 120 130 140 160 170 180110 0.3 0.4 0.6 0.7 0.80.5 0.9 1.0 1.1 1.2
Stellar Effective Temperature (10 K)
>2.0>1.5
Size of Optical Shell (pc)3
Fig. 7.— Distributions of stellar effective temperatures of the CSPNs and optical (Hα) shell
sizes of the PNe.

– 24 –
Table 1. Survey Sample of Hot White Dwarfs and Pre-White Dwarfs
PN PNG CSPN Teffa Size Dist.b Size HeII/Hβc 24 µm SB
Name Number Name (103 K) (arcsec) (pc) (pc) flux ratio (MJy/sr)
(1) (2) (3) (4) (5) (6) (7) (8) (9)
Group 1
Abell 15 233.5−16.3 ... 110 36×32 3656 0.64×0.57 1.3 10.1
Abell 20 214.9+07.8 ... 119 68 1959 0.65 1.5 7.2
IC 289 138.8+02.8 ... 100 50 1434 0.35 0.88 593.4
MeWe 1-3 308.2+07.7 ... 100 18 ... ... ... 27.9
NGC 2610 239.6+13.9 ... 100 59×52 2194 0.63×0.55 1.04 79.5
NGC 6852 042.5−14.5 WD 1958+015 ... 28 2710 0.37 1.2 80.5
Group 2
Abell 39 047.0+42.4 WD 1625+280 117 164 1163 0.92 0.69 1.4
Abell 43 036.0+17.6 WD 1751+106 117 85×76 1619 0.67×0.60 0.93 11.3
HeDr 1 273.6+06.1 LS 1362 100 90 ... ... ... 13.4
Jn 1 104.2−29.6 WD 2333+301 150 330×295 709 1.13×1.02 0.5 0.9
K 1-27 286.8−29.5 ... 105 44 ... ... ... 8.7
Lo 4 274.3+09.1 WD 1003−441 120 44 ... ... 0.9 8.8
LoTr 4 291.4+19.2 ... 120 30×26 ... ... ... 17.9
MWP 1 080.3−10.4 WD 2115+339 170 300 ... ... ... 4.4
NGC 246 118.8−74.7 WD 0044−121 150 273×224 470 0.62×0.51 1.2 36.6
NGC 1360 220.3−53.9 ... 110 460×320 348 0.78×0.54 1.0 11.6
Group 3
Abell 21 205.1+14.2 WD 0726+133 140 685×530 541 1.8×1.4 0.26 0.8
Abell 61 077.6+14.7 WD 1917+461 88 187 ... ... ... 0.6
BlDz 1 293.6+10.9 ... 128 88×85 ... ... ... 2.6
EGB 1 124.0+10.7 WD 0103+732 147 300×180 ... ... ... 0.6:
HaTr 7 332.5−16.9 ... 100 198×180 ... ... ... 0.9
IC 1295 025.4−04.7 WD 1851−088 90 150×121 1024 0.74×0.60 0.5 16.1
JnEr 1 164.8+31.1 WD 0753+535 130 425×360 ... ... 0.26 1.1
K 1-22 283.6+25.3 ... 141 184 988 0.88 <0.1 0.4
NGC 2438 231.8+04.1 ... 114 69×60 1203 0.4×0.35 0.4 30.3
NGC 3587 148.4+57.0 WD 1111+552 94 208×198 615 0.63×0.60 0.14 4.5
Sh 2-188 128.0−04.1 WD 0127+581 102 550 ... ... ... 0.6
Sh 2-216 158.5+00.7 WD 0439+466 83 5760 129 3.6 ... 1.0:
Not Detected
Abell 7 215.5−30.8 WD 0500−156 99 870×672 676 2.9×2.2 ... <0.2
Abell 74 072.7−17.1 WD 2114+239 108 870×792 752 1.0×0.9 ... <0.2
EGB 6 221.5+46.3 WD 0950+139 100 834 ... ... ... <0.2
BE UMa 144.8+65.8 BE UMa 105 ... ... ... ... <0.2
HDW 3 149.4−09.2 WD 0322+452 125 540 ... ... ... <0.2
JavdSt 1 085.4+52.3 WD 1520+525 150 660 ... ... ... <0.2
PuWe 1 158.9+17.8 WD 0615+556 94 1200 365 2.12 ... <0.2
WeDe 1 197.4−06.4 WD 0556+106 141 1020×840 ... ... ... <0.2
aThe stellar effective temperatures are either derived or compiled by Napiwotzki (1999), except those of Abell 21,
Jn 1, and JnEr 1, which are from Werner & Herwig (2006).
bThe distances are from Cahn et al. (1992), except those of Abell 7, Abell 21, Abell 74, PuWe 1, and Sh 2-216 that
are from Harris et al. (2007).
cThe He II λ4686/Hβ flux ratios are from Tylenda et al. (1994).