Suspected Cancer: - NICE
264
Suspected Cancer: Appendix J2 (June 2015) Page 1 of 264 Suspected Cancer: recognition and referral NICE Guideline Appendix J2: Sections from NICE clinical guideline 27 evidence review that have been removed
-
Upload
khangminh22 -
Category
Documents
-
view
1 -
download
0
Transcript of Suspected Cancer: - NICE

Suspected Cancer: Appendix J2 (June 2015) Page 1 of 264
Suspected Cancer:
recognition and referral
NICE Guideline
Appendix J2:
Sections from NICE clinical guideline 27 evidence review that have
been removed
Suspected Cancer: Appendix J2 (June 2015) Page 2 of 264
Appendix A
Evidence tables for the chapters on:
• Lung cancer
• Upper gastrointestinal cancer
• Lower gastrointestinal cancer
• Breast cancer
• Gynaecological cancer.

Suspected Cancer: Appendix J2 (June 2015) Page 3 of 264
Table 1 LUNG CANCER: signs and symptoms, including risk factors
Author Setting Description No. Inclusion Exclusion Results Gold Std Quality
Alberg et al, 2003
The study provided a summary of the epidemiological evidence on lung cancer.
A single etiologic agent, cigarette smoking, has been noted as by far the leading cause of lung cancer accounting for approximately 90% of cases in the United States. Risk of lung cancer among cigarette smokers increases with the duration of smoking and the number of cigarettes smoked per day. This observation has been made repeatedly in cohort and case- control studies. Asbestos exposure may pose a risk to building occupants and radon has been associated with lung cancer.
The likelihood of developing lung cancer decreases among those who quit smoking compared to those who continue to smoke. As the period of abstinence from smoking cigarettes increases, the risk of lung cancer decreases. However, even for periods of abstinence of >40 years, the risk of lung cancer among former smokers remains elevated compared to never smokers. Studies have shown comparable reductions in risk following smoking cessation, regardless of sex, type of tobacco smoked and histologic type of lung cancer. Almost one quarter of lung cancer cases among never- smokers are estimated to be attributed to exposure to passive smoking. Estimates derived from case-control studies of the proportion of lung cancer that is contributed to by occupational exposures have ranged widely, but most point estimates or ranges have included values from 9 to 15%.
A comprehensive review and systematic synthesis was not undertaken.

Suspected Cancer: Appendix J2 (June 2015) Page 4 of 264
Author Setting Description No. Inclusion Exclusion Results Gold Std Quality
BTS 2001 Guidelines on management of malignany mesothelioma
Not evidence based
DoH 2000 Guidelines on referral for suspected cancer
Nationally recognised guidelines
G.I.V.I.O 1989
Italy Retrospective case series. Signs and symptoms were reported in a study of diagnostic and therapeutic care.
380 patients from 20 hospitals
Patients with lung cancer seen in Italian general hospitals between January – June 1987 irrespective of their age, sex and severity of disease
Symptoms most frequently reported at presentation were cough in 175 (46%), shortness of breath in 86 (23%), chest pain in 87 (23%), haemoptysis in 75 (20%) and fever in 52 (14%). Finally, 26 (9%) patients had symptoms due to distant metastases at diagnosis.
Histo/cytologic findings were available for 363 cases.
The study did not distinguish between late or early symptoms. The six month period of data collection was very short.
Herth et al 2001
UK Retrospective case series. Cases of lung cancer were reported in patients presenting with haemoptysis of unknown origin
722 In 135 patients (19%) no aetiology for the bleeding could be determined and this group was targeted for further follow- up. Follow-up data were available for 20 patients. Eighty- one patients (60%) were smokers, 16 patients (12%) had a history of chronic obstructive pulmonary disease (COPD) and 10 patients (7%) had a history of tuberculosis. Lung cancer developed in 7 of the 115 patients with unknown etiology despite unrevealing bronchoscopy and normal chest radiographic findings at initial presentation. Using the cohort study analysis for unpaired differences, a 10% probability was found for lung cancer developing after haemoptysis of unknown origin if the patient was a current smoker and > 40 years old.
Cytology A sizeable patient population was followed for a reasonable length of time.
Koyi et al 2002
Sweden Prospective cohort study examined patients referred to a specialised centre. GPs were encouraged to refer all suspected cases of lung carcinoma including those with a seemingly dismal prognosis as early as
362 All patients referred to a specialised centre between January 1997 and December 1999
In 50 of the 364 patients (13.7%) biopsy and/or a cytology test was not possible due to patients’ unwillingness or ethical reasons. X-ray
Data was provided on the initial symptoms of lung cancer prompting concern among patients and those which led them to consult a doctor. Good prospective study.

Suspected Cancer: Appendix J2 (June 2015) Page 5 of 264
Author Setting Description No. Inclusion Exclusion Results Gold Std Quality
possible. Definite diagnosis was aimed at with a biopsy and/or cytology test/- and in cases where this was not possible diagnosis was based on x-ray findings, clinical data and symptoms
findings clinical data & symptoms were used instead.
Krech et al 1992
USA Prospective cohort study. Symptoms experienced by patients with advanced cancer were described using a standard assessment tool for one and a half years since October 1987
100 Most common and severe symptoms were pain (86), dyspnoea (70) and anorexia (68). Males aged 64 experienced more easy fatigue (p=0.01), taste changes (p=0.009) and sleep problems (p=0.004), higher incidences of cough and > 10% weight loss. Nausea was more frequent in females (p=0.07) and wheezing in males (p=0.06), although neither was a dominant symptom.
No reference to gold standard test
The data indicated advanced symptoms. Different interpretations of weakness and fatigue may have affected the results reported.
Liedekerken et al 1997
Netherlands Systematic review examining the relationship between prolonged coughing and the diagnosis of lung cancer.
Studies examining the relationship between prolonged coughing and lung cancer diagnosis.
Studies were excluded if there were insufficient data for the calculations to be made or if patients were chosen selectively, other than by setting.
No primary care could be identified. One paper reported the relationship between prolonged cough and lung cancer based on 6027 patients in a specialised setting. It revealed a high negative (0.99) and a low positive (0.03) predictive value, a sensitivity of 0.48 and a specificity of 0.71.
-- Thorough attempt was made to identify evidence on the significance of prolonged cough for lung cancer but scarcely any studies came to light.
Macbeth et al, 1996
The risk factors associated with lung cancer have been identified as including tobacco, asbestos and radon. The influence of genetic factors and the effects of chromosomal abnormalities has also been assessed. At least thirty retrospective and eight prospective studies have established a link between cigarette smoking and lung cancer. It has been estimated that 85-90% of all lung cancers can be linked to active smoking. The use of cigarettes carries a significantly greater risk of developing lung cancer than either pipe or cigar smoking. The age of starting cigarette

Suspected Cancer: Appendix J2 (June 2015) Page 6 of 264
Author Setting Description No. Inclusion Exclusion Results Gold Std Quality
smoking, the duration of smoking and the nicotine content of the cigarettes are all important factors. The risk of lung cancer at the age of 60 years is reported to be three times greater for those who started smoking between the ages of 14 and 16 years compared to those who began 10 years later. It has been calculated that someone aged 35 years who smokes 25 or more cigarettes per day has a 13% chance of dying from lung cancer before the age of 75 years. Exposure to known carcinogens including asbestos, radon, chromium, nickel and inorganic arsenic compounds increases the risk of lung cancer. Even a short exposure may be sufficient to cause lung cancer, if the concentration of asbestos is high enough. Miners who are exposed to high concentrations of radon have an increased risk of lung cancer, but its role in domestic housing as a factor causing lung cancer is uncertain. Several studies have shown an increased risk in the siblings of patients who develop lung cancer.

Suspected Cancer: Appendix J2 (June 2015) Page 7 of 264
Mansson et al 1994
Sweden Retrospective case series. The records of patients with lung cancer reported to the Swedish Cancer Registry 1980-1984 were examined using hospital records, with special reference to GPs’ role
40 Records of all subjects with lung cancer reported to the Swedish Cancer Registry 1980- 1984
The mean and median ages at the time of the diagnosis was 69 and the range was 43-85 years. The initial symptoms were cough followed by dyspnoea, chest pain, fever, weight loss and tiredness. Other presenting symptoms were oedema, haemoptysis, facial pain, pricking sensations in the throat, stuffed nose, dizziness, frequent colds and tumour outside the throat. Symptoms included palpable lymph nodes (2 patients), dyspnoea, liver enlargement, cachexia, tendency to fall and an episode of unconsciousness. No v abnormal signs were found on physical examination in 10 patients (26%).
The most common abnormal laboratory finding was increased erythrocyte sedimentation rate (>30mm/h) found in 17 of the 35 patients (49%) in whom it was recorded. Increased leucocyte particle concentration was observed in nine of 31 patients (29%). Other abnormal laboratory findings were anaemia (two patients) and increased serum concentration of alkaline phosphatases (one patient). The mortality during the study period for this series was 97% (38 of 39 patients).
Diagnosis was confirmed by means of bronchoscopy, mediastinoscopy with cytology or at autopsy
Relationship of signs and symptoms to pulmonary cancer was not statistically evaluated.

Suspected Cancer: Appendix J2 (June 2015) Page 8 of 264
Mansson et al 2001
Sweden Retrospective case series. Diagnostic activities were scrutinised and coded when malignancy was suspected. Information on diagnostic activities drawn from patient records was coded where a malignancy may have been a differential diagnosis for colorectal, breast, lung and prostate cancer.
6812 patients
Pulmonary diagnostic codes comprised the greatest part of the study (9422 codes corresponding to 65%). Most of these codes were assumed to be accounted for by infectious diseases in the upper airways. C-reactive protein tests were taken 865 times and nasopharyngeal cultures 580 times. Blood haemoglobin and ESR were tested 822 and 579 times respectively. X-ray was performed 643 times. The yield of malignancy following chest X- ray was low, 0.4%.
No gold standard procedure stated to confirm diagnosis.
The retrospective design may not have identified all the signs and symptoms that patients presented with. Authors did not state the procedure used to confirm the diagnosis. No statistical tests were reported.

Suspected Cancer: Appendix J2 (June 2015) Page 9 of 264
Melling et al 2002
UK Retrospective case series. An analysis of the proportion of patients referred according to lung cancer guidelines was conducted in order to assess how different pathways resulted in varying management.
362 patients
Patients randomly selected from a Yorkshire cancer registry
Any patients that had missing case notes or were receiving private treatment or extra-regional care.
47.8% of lung cancer patients presented to hospital with a chest x-ray diagnosis of lung cancer. A total of 148 patients in the ‘without chest x-ray diagnosis group’ were referred to hospital because of their symptoms but with no prior chest x-ray. 11.3% presented as self referrals to A&E and the remainder were referred without a diagnosis of lung cancer by other routes mainly via GPs. 80% of the ‘with diagnosis group’ presented to their GP with mainly lung related symptoms (cough, chest pain or infection, haemoptysis or dyspnoea) compared to 69 (46.6%, CI:38.4%, 55.0%) of those without a diagnosis. Patients who did not present initially with a lung cancer diagnosis were less likely to receive specialist care (62%: 96%) or have histological confirmation (57.1%: 80.3%) or receive surgery or radical radiotherapy (6.9%: 13.9%). Surgery, chemotherapy and palliative radiotherapy were all used most frequently in the ‘with chest x-ray diagnosis group’, but the difference was only significant for surgery (P=0.035).
57.1% of patients presenting without a chest x-ray had histological confirmation of malignancy compared to 80.3% who did.
Study concluded that patients presenting to hospital without a suspicious CXR were less likely to have specialist care, histological confirmation and had lower rates of active treatment.
NICE 2004 Guidelines on the diagnosis and treatment of lung cancer
Still out for consultation

Suspected Cancer: Appendix J2 (June 2015) Page 10 of 264
Ruano- Ravina et al, 2003
A systematic literature review on risk factors was undertaken following a MEDLINE and EMBASE search from 1985 onwards
Editorials, commentaries and published articles less than 50 cases
Concluded that risk of developing smoking-related lung cancer depended on several factors including duration of habit (number of cigarettes per day), age at initiation and type of tobacco. Passive smoking was considered a risk factor for lung cancer (RR reported to be approximately 1.5) although exposure was very difficult to measure. Many occupational groups identified as at risk. Individuals in contact with dust or microscopic particles (asbestos, wood dust, silica) at higher risk of developing lung cancer despite the effects of environmental pollution being complicated to assess. Survival rated as being better in women than men with incidence reported as being at around 65 years of age. Slight ethnic differences observed with higher mortality rates among African- Americans. Certain diseases raised risk of developing lung cancer such as tuberculosis, chronic obstructive pulmonary disease and silicosis. Family history of lung cancer was associated with a rise in risk. One study of women showed that subjects reporting a family history of lung cancer had a 1.9 fold risk (95% CI 0.7-5.6) of developing lung cancer and those reporting a family history of cancer had a 1.8 fold risk of developing lung cancer (95% CI 1.0-3.2). Lung cancer was more common in families with record of breast & ovarian cancer.
Ecological studies lacked information on certain confounders such as tobacco use. No study results were combined. Details were not provided as to how the quality of the studies was assessed.

Suspected Cancer: Appendix J2 (June 2015) Page 11 of 264
Sarlani et al 2003
USA Retrospective case report and series identified from the literature. The aim was to evaluate facial pain as a presenting symptom of non-metastatic lung cancer.
32 The mean age at presentation was 54 years (range 34 to 78). The vast majority of the patients were smokers or former smokers. The facial pain preceded the diagnosis of lung cancer by a mean of 9 months (range 1-48). Facial pain related to non-metastatic lung cancer was almost invariably unilateral, always ipsilateral to the tumour. Eighteen of the 32 cases (56.25%) involved right sided pain and 12 (37.5%) left-sided pain. The pain most commonly affected the ear, the jaws and the temporal region. Pain in or around the ear was present in 20 of the 32 cases (62.5%) and jaw pain in 14 cases (43.75%). Such pain was commonly misdiagnosed as atypical facial pain, dental pain or pain associated with temporamandibular disorders (TMD) or trigeminal neuralgia
Not stated Methodological details as to how patients were selected from the literature and how comprehensive or systematic the search was for relevant cases was not made explicit.
SIGN 2004 Guidelines on lung cancer Evidence based. Nationally recognised.
SIGN 2002 Referral guidelines for suspected cancer
Nationally recognised. Based on unpublished audits and other published literature.
Smith et al, 1995
Meta-analysis to evaluate the relation between exposure to crystalline silica and lung cancer.
29 studies
Studies for which effect measures (such as RRs and ORs) could be extracted for lung cancer mortality among Silicotics
Studies were excluded they were deemed to under or overestimate lung cancer risk
After adjustment for competing risks, all 29 studies demonstrated lung cancer relative risk (RR) estimates greater than one. The pooled RR estimate for all studies that could be combined was 2.2, with a 95% CI of 2.1-2.4. The pooled estimates by study design were 2.0 (95% CI=1.8-3.3) for case- control studies. The proportional mortality studies combined gave a summary RR of 2.0 (95% CI=1.7-2.4) whereas the studies of cancer incidence gave a summary RR of 2.7 (95% CI = 2.3-3.2).
It was not clear whether the search for relevant studies was systematic. The potential confounding factor that could have exerted the most influence on results was smoking. The issues surrounding the process of quality assessment of studies reviewed was not highlighted in detail.

Suspected Cancer: Appendix J2 (June 2015) Page 12 of 264
Sridhar et al 1990
USA Retrospective case series. Hospital charts of patients with adenosquamous lung carcinoma identified between 1975 and 1988 were reviewed to determine the clinical features of lung cancer at the time of presentation.
127 Patients presented with cough 68 (54%); weight loss 54 (43%); expectoration 49 (39%); anorexia 45 (35%); chest pain 41 (32%); dyspnea 38 (30%); weakness 38 (30%); haemoptysis 30 (24%); pneumonia 16 (13%); fever 16 (13%); nausea 13 (10%); vomiting 9 (7%); dizziness 8 (6%); chills 6 (5). All the study patients had histopathologic or cytologic diagnosis of adenosquamous carcinoma of the lung established by a Pathology Department. It was reported that haemoptysis was a more common presenting symptom in men than in women (p=0.05).
Histopathologic or cytologic diagnosis
No mention was made of follow up The value of digital clubbing in reinforcing suspicion of malignancy in those with non small cell lung cancer is highlighted.
Sridhar et al 1998
USA Prospective cohort study. The aim was to determine the relative frequency of clubbing in small cell lung carcinoma (SCLC) versus non-small cell lung carcinoma (NSCLC). patients with a pathological diagnosis of lung cancer were examined for the presence or absence of digital clubbing. Comparisons were made between patients with and without clubbing on the following: age, sex, substance use, tobacco, smoking history, family history of lung cancer and subtype of cancer
111 patients
Clubbing was present in 32 (29%) of the 111 patients with lung cancer. Clubbing was more common in women (40%) than in
men (19%; χ2
test p=0.011) and was more common in patients with NSCLC (35%) than those
with SCLC (4%; χ2
test p=0.0036).
Pathology Difficult to evaluate the frequency and occurrence of symptoms retrospectively. Patients may not report all features unless asked

Suspected Cancer: Appendix J2 (June 2015) Page 13 of 264
Tyczynski et al, 2003
An epidemiological review of lung cancer in Europe reported risk related factors
Tobacco smoking featured as the most prominent risk in developing lung cancer. A clear dose-response relation was reported to exist between lung- cancer risk and the number of cigarettes smoked per day, degree of inhalation and age at initiation of smoking. A person who has smoked all their life has a lung cancer risk 20-30 times greater than a non-smoker. Lung cancer risk decreases with time since smoking cessation. The observation that the risk of lung cancer is greater in women than in men exposed to equivalent amounts of tobacco smoke is not supported by recent studies which conclude that risk is similar between the two sexes. Passive exposure to tobacco smoke also increases the risk of lung cancer. It is estimated that environmental exposure to tobacco smoke increases risk by 15-25%. Additional factors contributing lung cancer risk includes increasing duration of exposure to asbestos which rises almost two-fold in those subjected to it the longest. A synergistic (multiplicative) effect between asbestos and tobacco smoking and the relation between these two factors was documented in three comprehensive reviews. Occupational exposure to carcinogens and residential exposure to radon may increase the risk of lung cancer in men who never smoked. The
combined effect of smoking and
radon exposure however, is
unknown.

Suspected Cancer: Appendix J2 (June 2015) Page 14 of 264
Table 2 LUNG CANCER: investigations
Author
Setting
Description
No.
Inclusion
Exclusion
Results
Gold Std
Quality
Colice, 1997 Systematic review which Investigated whether fiberoptic bronchoscopy or CT resulted in the lowest number of tests needed to diagnose lung cancer in patients presenting with haemoptysis and a normal chest radiograph.
16 articles
Studies that described the outcome of an evaluation for lung cancer in patients presenting with haemoptysis and a chest x- ray.
it was estimated that 6% of patients presenting with haemoptysis and a normal chest x-ray would have lung cancer. Of the 997 patients described in these studies, 54 (5.4%) were found to have cancer, the vast majority of which were lung primaries. Performing FOB first with serial follow-up CXRs resulted in a smaller number of tests needed to diagnose (NTND) than the CT first strategy (101 for FOB vs 133 for CT).
These investigations were performed routinely in an outpatient setting. The calculations derived indicate the extent of reliability of CXR in detecting suspected lung cancer
Holmberg and Kragsbjerg, 1993
Sweden Diagnostic study. The value of routine convalescent chest radiography was assessed retrospectively using medical records from patients with pneumonia admitted to a Swedish hospital during 1981 and 1985. A second patient group was studied to investigate the clinical onset of pulmonary carcinoma
1011 Patients with pneumonia
Cases were excluded if they had an diagnoses, no x- ray performed, severe chronic debilitating disease resulting in multiple episodes of pneumonia and were aged < 15. there were also multiple other reasons
13/1011 pneumonia patients had previously undiagnosed pulmonary carcinoma. Many of these carcinomas (8/13) were disclosed by an acute chest x-ray. Pulmonary carcinoma was found by convalescent chest x-ray in 2/88 patients not feeling well and in 2/524 patients feeling well at follow-up. Of the 232 inpatients with pulmonary carcinoma, 29 (12.5%) presented with an acute respiratory tract infection; most of these latter patients did not recover as expected and their correct diagnosis was made following a chest x-ray due to persistent symptoms.
Stated that three cases were verified by histological examination.
Data were drawn from a large patient sample but a gold standard test was not necessarily applied in all cases.
NICE 2004 Guidelines on the diagnosis and treatment of lung cancer
Still out for consultation
Pederson and Milman, 2003
A diagnostic study which prospectively assessed the diagnostic value of an elevated platelet count and other routine laboratory tests for predicting malignancy in patients with radiologically suspected lung cancer.
126 Thrombocytosis (platelet count
>400x109/1
was present in 8% (5/65) of patients with benign disease and in 57% (35/61) of patients with malignant disease (p<0.00001). Elevated platelet count was more common in advanced disease (stage III and IV). The sensitivity of thrombocytosis for predicting malignancy was 0.57 and the specificity 0.92.
Pathology Hospitalized patients with radiologically suspected cancer were investigated and the relevance of these tests would have to be considered in a primary care setting
Suspected Cancer: Appendix J2 (June 2015) Page 15 of 264
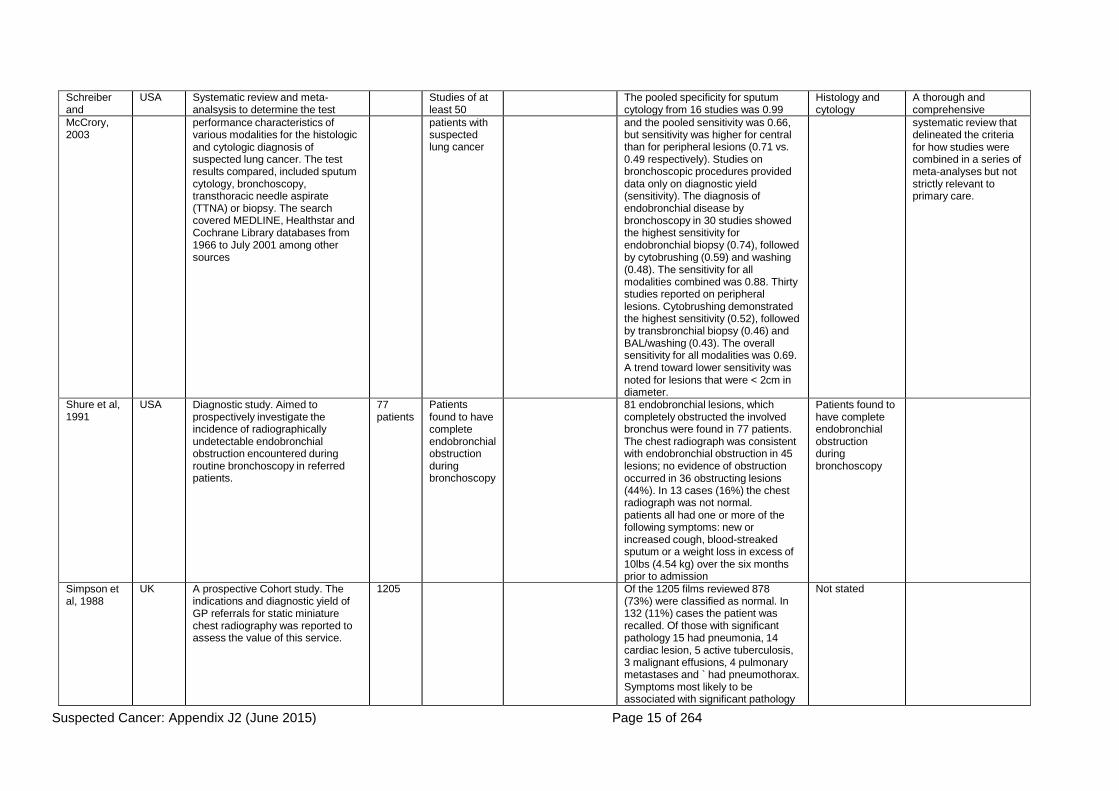
Schreiber and
USA Systematic review and meta- analsysis to determine the test
Studies of at least 50
The pooled specificity for sputum cytology from 16 studies was 0.99
Histology and cytology
A thorough and comprehensive
McCrory, 2003
performance characteristics of various modalities for the histologic and cytologic diagnosis of suspected lung cancer. The test results compared, included sputum cytology, bronchoscopy, transthoracic needle aspirate (TTNA) or biopsy. The search covered MEDLINE, Healthstar and Cochrane Library databases from 1966 to July 2001 among other sources
patients with suspected lung cancer
and the pooled sensitivity was 0.66, but sensitivity was higher for central than for peripheral lesions (0.71 vs. 0.49 respectively). Studies on bronchoscopic procedures provided data only on diagnostic yield (sensitivity). The diagnosis of endobronchial disease by bronchoscopy in 30 studies showed the highest sensitivity for endobronchial biopsy (0.74), followed by cytobrushing (0.59) and washing (0.48). The sensitivity for all modalities combined was 0.88. Thirty studies reported on peripheral lesions. Cytobrushing demonstrated the highest sensitivity (0.52), followed by transbronchial biopsy (0.46) and BAL/washing (0.43). The overall sensitivity for all modalities was 0.69. A trend toward lower sensitivity was noted for lesions that were < 2cm in diameter.
systematic review that delineated the criteria for how studies were combined in a series of meta-analyses but not strictly relevant to primary care.
Shure et al, 1991
USA Diagnostic study. Aimed to prospectively investigate the incidence of radiographically undetectable endobronchial obstruction encountered during routine bronchoscopy in referred patients.
77 patients
Patients found to have complete endobronchial obstruction during bronchoscopy
81 endobronchial lesions, which completely obstructed the involved bronchus were found in 77 patients. The chest radiograph was consistent with endobronchial obstruction in 45 lesions; no evidence of obstruction occurred in 36 obstructing lesions (44%). In 13 cases (16%) the chest radiograph was not normal. patients all had one or more of the following symptoms: new or increased cough, blood-streaked sputum or a weight loss in excess of 10lbs (4.54 kg) over the six months prior to admission
Patients found to have complete endobronchial obstruction during bronchoscopy
Simpson et al, 1988
UK A prospective Cohort study. The indications and diagnostic yield of GP referrals for static miniature chest radiography was reported to assess the value of this service.
1205 Of the 1205 films reviewed 878 (73%) were classified as normal. In 132 (11%) cases the patient was recalled. Of those with significant pathology 15 had pneumonia, 14 cardiac lesion, 5 active tuberculosis, 3 malignant effusions, 4 pulmonary metastases and ` had pneumothorax. Symptoms most likely to be associated with significant pathology
Not stated

Suspected Cancer: Appendix J2 (June 2015) Page 16 of 264
Author
Setting
Description
No.
Inclusion
Exclusion
Results
Gold Std
Quality
were cough, haemoptysis, wheeze, dyspnoea, weight loss. Non-specific malaise, tiredness, general ill health, chest pain, hypertension rarely associated with abnormal radiographs.

Suspected Cancer: Appendix J2 (June 2015) Page 17 of 264
Table 3 LUNG CANCER: delay and diagnostic difficulties
Author Setting Description No. Inclusion Exclusion Results Quality
Gorman et al, 2002
UK A questionnaire was sent to GP practices which coolected information about the use of investigations prior to referral depending on cancer for patients with suspected lung, large bowel, non-melanoma skin and breast cancer. Main outcome measures were determinants of primary care referral behaviour and clinical investigation strategies and perceptions of quality in secondary care and health promotion services.
79 General practices
The study was confined to one health board boundary in Lothian
Most cases of suspected lung cancer, approximately half of suspected colorectal cancer cases and very few cases of suspected breast cancer were investigated in primary care before referral to hospital. It was unlikely that a practice would investigate further in primary care a woman with symptoms suggestive of breast cancer, while with lung cancer further investigations by the practice prior to referral would be done in three quarters of cases and in 45% of those with colorectal cancer symptoms. Practices highlighted their wish for regularisation of fast track facilities and an increase in the availability of open access investigation and diagnostic services.
NICE 2004
Guidelines on the diagnosis and treatment of lung cancer
Still out for consultation
Varney et al, 1996
UK A 3-year Case series study. Aimed to identify the early symptoms of lung cancer
. Cough was the initial complaint in 117 patients. In 80% the cough was a new symptom, usually reported as dry, in 20% a previous cough had clearly changed, and 30% of all patients had quit smoking because of the cough. Most consulted their GP promptly but 26 patients delayed consulting by an average of 12 months. In those who consulted promptly, there was a mean delay of 7 months between reported symptoms and the first chest x- ray. Asthma treatment, antibiotics and steroids were commonly prescribed during this time. A total of 104 patients reported shoulder or chest pain as the first complaint: the tumours were always located in the upper lobes, with pain referred to the shoulder, anterior chest wall or scapula on the affected side. Most were initially treated with nonsteroidal and anti-inflammatory drugs and shoulder injections. Only 12 delayed consulting their general practitioner by an average of 3.5 months. Patients who consulted promptly had their first chest x-ray 5 months later on average. Sixty of these were current smokers. Additional presenting symptoms were: breathlessness (35 patients); weight loss with malaise (17 patients); haemoptysis (10 patients); and hoarseness (nine patients). Methodological details were lacking which could affect judgements about the applicability of results. There was no mention of whether lung cancer cases were histologically or cytologically verified.
No statistical evaluation of the predictive value of the symptoms recorded was given. It was never made explicit how the cases were recruited. No inclusion or exclusion criteria were mentioned.

Suspected Cancer: Appendix J2 (June 2015) Page 18 of 264
Author Setting Description No. Inclusion Exclusion Results Gold Std Quality
Adachi et al 1993
Japan Retrospective case series. it aimed to identify the most effective approach for detecting superficial oesophageal carcinoma was investigated through clinical histories using hospital charts.
46 patients with superficial oesophageal cancer
49 patients with advanced oesophageal cancer.
Patients with superficial and advanced oesophageal cancer
Patients who underwent preoperative therapy such as hyperthermia, chemotherapy and radiation
Symptoms were more frequent and the size of lesions was larger with increasing depth of invasion. A piercing sensation was present mostly in superficial oesophageal carcinoma, while pain or dysphagia was present both in advanced oesophageal cancer and submucosal carcinoma.
Pathology
Ahlgren 1996 Pancreatic cancer risk factors were reviewed
-- -- -- Direct evidence linking specific dietary carcinogens to pancreatic cancer in humans was difficult to establish.
Bakkevold et al 1992
Norway Primary care
Retrospective case series. Data on signs and symptoms were reported from case history and information provided prospectively on sensitivities of diagnostic investigations. The aim was to compare the symptoms and signs, delays in diagnosis, and the efficacy of diagnostic methods of pancreatic cancer at Norwegian hospitals
472 Patients with verified carcinoma of the pancreas or the papilla of Vater
Patients with endocrine tumour, cholangiocarcinoma, metastatic pancreatic tumour, cystadenocarcinoma, and unverifired primary pancreatic tumour.
Jaundice without pain was present in 18%. Nonspecified symptoms occurred in 49%, the commonest being dyspepsia (12%), diarrhoea/steatorrhoea (12%) and nausea in 5%. Jaundiced patients had less advanced tumours at staging (p=0.0000), but abdominal pain and/or weight loss predicted advanced disease (p=0.0001 and 0.004 respectively.
Histology or cytology
Crean et al 1982
UK Prospective Cohort study. A database was created to enable the development of a diagnostic decision system for dyspepsia by recording associated symptoms and clinical features.
1000 patients Indicants of gastric cancer were listed as age > 55, history < 1 year, daily pain, dark vomitus, early repletion, weight loss and interscapular radiation.
(Endoscopic or radiological observations were made)
Crean et al 1994
UK Prospective cohort study. The study of dyspepsia was carried out in a primary referral hospital to elicit relevant clinical information on the principal diagnoses.
1540 patients Patients that met the definition of dyspepsia and were seen at a primary referral hospital between 1974 and 1987.
-- Of patients attending a pimary referral hospital, the commonest principal diagnosis were duodenal ulcer (26%), functional dyspepsia (22%) and irritable bowel syndrome (15%), alcohol related dyspepsia (4%) was as common as gastric carcinoma or symptomatic gall
Biopsy specimens were taken depending on the findings.
Table 4 UPPER GASTROINTESTINAL CANCER: signs and symptoms

Suspected Cancer: Appendix J2 (June 2015) Page 19 of 264
Author Setting Description No. Inclusion Exclusion Results Gold Std Quality
stones. Delaney et al, 2000
The aim was to determine the cost effectiveness of initial endoscopy compared with usual management in patients with dyspepsia over age 50 years presenting to their primary care physician.
patients were recruited and randomly assigned to initial endoscopy or usual management. Primary outcomes were effect of treatment on dyspepsia symptoms and cost-effectiveness. Secondary outcomes were quality of life and patient satisfaction.
422 patients 213 (84%) patients had an endoscopy compared with 75 (41%) controls. Initial endoscopy resulted in a significant improvement in symptom score (p=0·03), and quality of life pain dimension (p=0·03), and a 48% reduction in the use of proton pump inhibitors (p=0·005). The ICER was £1728 (UK£) per patient symptom-free at 12 months. The ICER was very sensitive to the cost of endoscopy, and could be reduced to £165 if the unit cost of this procedure fell from £246 to £100
Department of Health Guidelines, 2000
The guideline was based on a report of the evidence prepared by a multi-disciplinary working group. It included a cost- effectiveness decision analysis of fast track referral for patients at risk of upper gastrointestinal malignancy.
50 The incidence of stomach cancer is decreasing, whereas the incidence of oesophageal cancer is increasing. Tumours at the junction between the stomach and oesophagus are increasing particularly rapidly. Dysphagia is a relatively uncommon symptom in a community/general practice setting. Patients with difficulty swallowing food should always be referred for further investigation. Dyspepsia is an extremely common problem in a community/general practice setting. The index of suspicion of cancer is very considerably raised if dyspepsia is combined with an ‘alarm’ symptom (weight loss, vomiting, anaemia). In patients aged over 55 years, recent onset of dyspepsia and/or continuous symptoms is associated with increased risk of cancer.

Suspected Cancer: Appendix J2 (June 2015) Page 20 of 264
Author Setting Description No. Inclusion Exclusion Results Gold Std Quality
Duggan 1999 UK This paper evaluated the
current cost of upper gastrointestinal disease in the UK, the base IGPCG algorithm and the 5 major alternative scenarios.
The original IGPCG algorithm was the least costly option of all those considered, with additional H. pylori testing for all patients with suspected ulcer being the second least expensive option. Routine endoscopy for all patients or for all patients aged more than 45 years were the most expensive scenarios and would require a 16- or 13-fold increase, respectively, in the provision of endoscopy services in the UK. The use of routine endoscopy for all patients aged more than 45 years who were presenting with upper gastrointestinal symptoms for the first time was a mid-priced option, but would still require a 5-fold increase in the provision of endoscopy services. The modelling process highlighted the fact that early stratification of patients into diagnostic and treatment groups, on the basis of history and symptom cluster, is a less costly approach than that of early routine endoscopy or H. pylori testing. If H. pylori testing is to be used routinely, then the least costly approach is to select those patients who have symptoms that are more indicative of ulcer disease.
Fielding et al 1980
UK Retrospective case series. The signs and symptoms associated with early gastric cancer were reported.
90 Patients diagnosed with early gastric cancer. Data obtained from cancer registry
-- Number (n=90) and percentage of patients experiencing symptoms was given for epigastric pain 26 (28.9%), vomiting 21 (23.3%), abdominal pain 17 (18.9%), weight loss 17 (18.9%), anorexia 13 (14.4%), indigestion 11 (12.2%), haematemesis 6 (6.6%), dysphagia 1 (1.1%).
Histology
Gillen et al 1999
UK Retrospective case series. Aimed to
169 patients. Patients years diagnosed with
Prevalence of symptoms for gastric and for oesophageal

Suspected Cancer: Appendix J2 (June 2015) Page 21 of 264
Author Setting Description No. Inclusion Exclusion Results Gold Std Quality
establish whether endoscopy was justified in uncomplicated dyspepsia in patients aged less than 55.
gastroesophageal cancer. Patients were identified between 1989 and 1993 from the West of Scotland Cancer Registry.
cancer are listed as follows: weight loss 61.8% and 63.0% respectively; persistent vomiting 35.6% and 35.6%, dysphagia 23.7% and 84.9%, anaemia 22.4% and 5.5%, hem’sis melena 18.4% and 2.7% and palpable mass 9.2% and 0%.
Gold and Goldin 1998
USA A review of epidemiological and risk factors for pancreatic cancer.
Heading et al 1999
UK A systematic review was undertaken of all studies on the population prevalence of upper gastrointestinal symptoms.
10 studies Studies that had been published up to December 1997, if sample size and response rate were reported, if vague terms such as dyspepsia or indigestion were defined, abdominal pain or discomfort enquired about, and patients with a history or evidence of organic disease had not been excluded.
Follow-up studies on groups of patients previously studied
The reported prevalence of upper abdominal symptoms (mostly upper abdominal pain or discomfort) ranged from approximately 8% to 54% while the prevalence of heartburn and/or regurgitation ranged from 10% to 48% for heartburn, from 9% to 45% for regurgitation and 21% to 59% for both/either. Variations were attributed to varying definitions used.
No meta analysis was undertaken and the studies were difficult to compare because the definition of signs and symptoms was not consistent.
Irving et al 2002
UK Retrospective case series to assess the impact of DoH cancer referral guidelines (2000) to reduce delay from presentation to referral.
90 patients Patients with treated at a oesophago-gastric cancer unit at a hospital between 1 November 1999 and 30 December 2001.
-- Sixty-five patients were diagnosed with oesophageal cancer and 25 with gastric cancer. Dysphagia was the most common presenting symptom and it was experienced by 58 patients in the study (64%). It was much more prevalent in patients with oesophageal rather than gastric malignancies (77% versus 32%).
Histology The study did not give details about the main focus of the study being on monitoring the speed with which patients with cancer were detected, referred and diagnosed.
Klamer et al 1982
USA Retrospective case series aimed to investigate epidemiologic factors, presenting symptoms, diagnostic methods, site and extent of cancer, treatment approaches and survival data associated with pancreatic cancer
33 The charts of all patients treated for cancer at Mount Sinai Medical Center between 1971 and 1978
Patients with cancers arising from periampullary and islet cell tissue
The most common complaint leading to hospitalisation was abdominal pain, which occurred in 23 (70%), followed by jaundice in 19 (57%), anorexia in 15 (45%), weakness in ten (30%), and nausea in eight (24%). Six patients (18%) complained of pruritis or diarrhea.
Histology The case series was based on a small sample size.

Suspected Cancer: Appendix J2 (June 2015) Page 22 of 264
Author Setting Description No. Inclusion Exclusion Results Gold Std Quality
through examining patients’ charts.
Lowenfels and Maisonneuve 2002
USA and Italy
A review of epidemiologic factors in pancreatic cancer.
Number of studies not mentioned
-- -- The proven risk factors were identified as being smoking, age and pancreatitis. Other potential risk factors were listed as being diabetes, peptic ulcer disease, gallstones, infections, salmonella, helicobacter pylori, obesity, diet, occupation, inherited and gene-environment factors. The relationship between smoking and pancreatic cancer has been studied extensively in case- control and cohort studies. Age was discussed as being the strongest risk factor. Pancreatic cancer is extremely unusual in patients younger than age 30 and is rare before age 50. The mean age of onset was about 65. Underlying benign disease is known to increase the eventual risk of malignancy. Examples include Barrett’s oesophagitis, and oesophageal cancer, gastritis and gastric cancer. Hereditary pancreatitis is a rare autosomal dominant disorder with a penetrance of about 80%. The clinical phenotype consists of involvement of siblings and multiple generations, early age of onset (generally <21 years old) and a course that resembles more common types of chronic pancreatitis.
NICE 2004 Guidelines on the management of adults with dyspepsia
Still out for consultation
Numans et al 2001
Netherlands This was a multicentre case series study of the diagnostic features of gastro-oesophageal malignancy. The usefulness of identified alarm symptoms in
861 patients Patients who were investigated with first time gastroscopy between October 1986 and October 1988
-- Malignancy was found in 21 patients (2.4%). Five patients had oesophageal cancer. Positive answers for the symptoms, weight loss (p<0.01) and dysphagia (p<0.01) together with negative answers
Pathology

Suspected Cancer: Appendix J2 (June 2015) Page 23 of 264
Author Setting Description No. Inclusion Exclusion Results Gold Std Quality
requesting gastroscopy was evaluated.
on pain during the night (p<0.01) and heartburn, predicted malignancy in the study population with an area
Ojala et al 1982
finland Retrospective case series. Symptoms associated with carcinoma before medical attention was sought and prior to diagnosis was investigated.
225 patients Any inclusion and exclusion criteria applied were not mentioned
-- Patients with carcinoma of oesophagus or gastric cardia presented with dysphagia 93%; weight loss 46%; vomiting 33%; gastric pain 25%; thoracic pain 21%; anorexia 7%; haematemesis or melaena 6%; belching, hiccups or dyspepsia 4%; pharyngeal pain 4%; sensation of a lump 3%; anaemia 3%; cough, hoarseness 2% & others 9%.
Histology
Shaheen and Ransohoff, 2002
USA The evidence linking Gastroesophageal reflux disease (GORD) and Barrett’s oesophagus to oesophageal carcinoma was examined. A MEDLINE search was performed to identify all English language reports about GORD, adenocarcinoma, and Barrett oesophagus from 1968 through 2001.
Not mentioned
Studies were of randomised controlled trials if available, case control data if trials were unavailable, and cohort-studies if case- control data were unavailable. Pertinent bibliographies were also reviewed to find reports not otherwise identified.
-- Cohort studies demonstrated that symptoms of GORD occurred monthly in almost 50% of US adults and weekly in almost 20%. Three large case-control studies demonstrated a positive association between reflux symptoms and risk of adenocarcinoma of the oesophagus, with more prolonged and severe symptoms accentuating this risk. However, because of the low incidence of adenocarcinoma of the oesophagus and the ubiquity of reflux symptoms, the risk of cancer in any given individual with reflux symptoms was low. Most studies on individuals with Barrett’s oesophagus reported a risk ratio of cancer that was 40 to 125 times higher than that of the general population. Estimates of the absolute risk of oesophageal adenocarcinoma varied widely from 0% to almost 3% per patient year. Recent larger studies and a meta analysis of these data suggested that a reasonable

Suspected Cancer: Appendix J2 (June 2015) Page 24 of 264
Author Setting Description No. Inclusion Exclusion Results Gold Std Quality
estimate was approximately 0.5% per-patient year.
Talley et al, 1998
USA This systematic review centred on evaluating the optimal management of patients with dyspepsia. A MEDLINE and Current Contents search was performed up to April 1997 using the MeSH term ‘dyspepsia’.
36 Studies reporting cancer rates using the findings on esophagogastro- duodenoscopy in patients with dyspepsia and in the general population.
-- Endoscopy was reported as consistently providing superior diagnostic accuracy in comparison with radiography.
Many of the studies indicated that dyspepsia was s symptom of cancer in approximately 2% of patients.
(The test performed was esophagogastro- duodenoscopy)
Tredaniel et al 1997
A review and meta- analysis of undertaken to provide a quantitative estimate of the association between gastric cancer risk and tobacco smoking.
40 studies. -- -- All the cohort studies showed a significantly increased risk of gastric cancer of the order of 1.5 –2.5 for cigarette smokers. Evidence from case-control studies was less consistent. The results suggested a risk of stomach cancer among smokers of the order of 1.5-1.6 as compared to non-smokers.
Wilson et al 2000
Canada Retrospective case series. The incidence of signs and symptoms associated with oesophageal or gastric cancer were observed and reported. The objectives were to determine the symptoms experienced by patients with pancreatic cancer and the response by health professionals in providing supportive care in a large, tertiary centre
99 Patients diagnosed with pancreatic cancer
-- The most common symptoms were dysphagia (93%), weight loss (46%), vomiting (33%), gastric cancer (25%), thoracic pain (21%), anorexia (7%) and GI bleeding (9%). Bleeding and anaemia were found in the lower oesophagus tumours & gastric cardia. Infections, backache or pain in the lower abdomen occurred in 9% of patients.
Histology There was no statistical evaluation of the results

Suspected Cancer: Appendix J2 (June 2015) Page 25 of 264
Table 5 UPPER GASTROINTESTINAL CANCER: investigations
Author Setting Description No. Inclusion Exclusion Results Gold Std
Quality
Allum et al , 2002 UK These joint guidelines of the Association of Upper Gastrointestinal Surgeons of Great Britain and Ireland, the British Society of Gastroenterology, and the British Association of Surgical Oncology recommend that ‘Rapid access gastroscopy is the investigation of choice with appropriate biopsy for those with risk symptoms (grade C).’ They also state that ‘Antisecretory therapy should be ideally withheld until after endoscopy to avoid misdiagnosis (grade B).’
The number of studies was not stated.
-- --
Department of Health 2000
The Department of Health guidelines did not consider primary care investigations for upper GI cancers other than referral for endoscopy.
Lionis, 2004 Pancreatic cancer may present with jaundice. The jaundice is extra-hepatic and due to biliary obstruction. Hyperbilirubinaemia may be confirmed by testing the urine for bilirubin, and blood tests may then be arranged. A ratio of direct to indirect serum bilirubin of greater than 50% favours biliary obstruction. The sensitivity of ultrasound to detect biliary obstruction is 55-95%, while specificity is 82- 95%.
NICE 2004 Guidelines on the managements of dyspepsia in adults
Still out for consultation
Tatsuta 1989 Japan Primary study. The accuracy of gastrofibercopic biopsy in diagnosis of gastric malignancies was evaluated. Biopsy materials and cytologic specimens were examined in two independent laboratories by different doctors without knowledge of the endoscopic diagnosis
1331 patients
Gastrofiberscopic biopsy was performed during follow-up of all 1331 patients examined from 1968-1976
Those without benign lesions were not followed up.
There were 31 (3.7%) false-negative diagnoses of malignancy among 858 patients diagnosed as having benign lesions and 3 (0.6%) false-positive diagnoses among 473 patients diagnosed as having malignant tumours.
Histology

Suspected Cancer: Appendix J2 (June 2015) Page 26 of 264
Table 6 UPPER GASTROINTESTINAL CANCER: delay and diagnostic difficulties
Author Setting Description No. Inclusion Exclusion Results Quality
Bramble et al, 2000
UK, Primary Care
The study aimed to examine the symptoms of early gastric cancer in patients and to document in detail the time scale of symptoms and management delays. The authors reviewed retrospectively patients with early gastric cancer treated at a surgical unit. Differences in clinical variables between groups were analysed by chi-square and Fishers’ exact test where appropriate.
44 Patients with early gastric cancer treated at a surgical unit from May 1983 to September 1998.
Not explicitly mentioned
The median duration of symptoms at the time of diagnosis was 51 days, 36.4% of the cases had symptoms for more than six months. Epigastric pain was main presenting complaint in 63.3% of cases, gastrointestinal haemorrhage was mode of presentation in 27.3% of cases. Median patient delay was 30 days, it was more than 6months and more than 1 year for 35.9% and 25.0% of the cases, respectively. Median doctor delay was 21 days, in 11.4% of cases the diagnosis was delayed by 4 months or more. Patient delay of more than 6 months was associated with patients aged 50 or younger (P = 0.04), and with those where pain was the main complaint (P = 0.05). Doctor delay of more than 4 months was more likely when there was a previously negative gastroscopy or barium meal in the last 12 months (P = 0.03). The tumour size, location or histological subtype were not association with the time scale of patient/doctor delay.
Poor description of methods, very likely recall bias, does not discriminate between primary care professional related delay and consultant’s delay, small sample, not clear whether randomised (likely to be consecutive sampling). As with all studies that look at early gastric cancer, there is likely to be “length bias sampling” (early gastric cancers are a group of cancer with better prognosis, and therefore remain at an earlier stage for a longer duration of time).
Grannel et al, 2001
Ireland, Community Based
The study aimed at sampling the level of public awareness of the potentially sinister significance of dysphagia The authors conducted a community survey using a questionnaire to evaluate the subjects’ impression of the significance of dysphagia, and compare it with their perception of the significance of breast lump. The information sought was urgency of medical advice, options for care and the probable cause of the symptoms.
164 Pedestrian subjects in a busy city centre
Not explicitly mentioned
75% stated that they would visit the doctor within one week of developing dysphagia (82% of males, 68% of females). Only 17% felt that cancer was a probable explanation for dysphagia compared to 80% who felt that a breast lump could be due to cancer (p < 0.001).
Basic qualitative study.
Hallisey et UK, The aim of the study was to see 2,659 Patients aged 40 or over No explicitly 2,659 patients were seen at the Lack of control group limits

Suspected Cancer: Appendix J2 (June 2015) Page 27 of 264
al, 1990 Primary Care
whether investigation of dyspeptic patients aged over 40 after their first consultation with the general practitioner would increase the proportions with early and operable gastric cancers. Prospective study of gastric cancer in dyspeptic patients aged over 40 from a defined population. General practitioners in 10 general practices were asked to refer all patients over 40 making the first attendance during the study period with any degree of dyspepsia. Patients were interviewed and examined by a member of the hospital team within two weeks, their symptoms recorded, and endoscopy performed within one week
referred with dyspepsia during the period April 1984 to December 1988
mentioned dyspepsia clinics and 2,585 attended for investigation. Malignancy was detected in 115 patients (4%), of whom 57 had gastric adenocarcinoma, 1 had gastric lymphoma, and 15 had carcinoma of the oesophagus. All other malignancies were diagnosed after further investigations and included colorectal (14), pancreatic (6), bronchial (8), prostatic (2), duodenal (1), liver (1), and gallbladder (1), amongst others. 15 cases (26%) of the cases were of early gastric cancer, according to the rules of the Japanese Research Society for Stomach Cancer. High risk lesions were identified in 19% (493) of patients, with 10 gastric cancers being identified during longer than 14-month follow up, six of which were early gastric cancers. One early case of gastric cancer is detected for every 177 patients examined. Neither the general practitioner nor the hospital doctor was accurate in diagnosing gastric malignancy at any stage out of clinical diagnosis. For advanced lesions, the diagnostic accuracy of the macroscopic assessment of the lesion at first endoscopy was high (28 of 41 such cancers being correctly identified), whereas early lesions were reliably identified in only 3 of the 15 being correctly diagnosed.
applicability of findings, analysis is mainly descriptive.
Haugstyedt et al, 1991
Norway, Secondary Care
The purpose of this paper was to investigate factors influencing delay and, secondly, to evaluate the potential consequences of treatment delay on resectability rate and postoperative morbidity and mortality in patients with stomach cancer.
The study was done as a sub-
1165 patients included in a Norwegian multicentre study with 51 surgical units participating. Data on patient delay were available for 939 patients, data on doctor delay were
Patients with stomach cancer
Not explicitly mentioned (presumably none)
The median TD was 107 days, the PD 42 days, and the DD 37 days. Univariate analyses. PD was related to weight loss (increasing PD with greater loss of weight, p < 0.0001) and hospital level (patients referred to university hospitals had a shorter PD than those admitted to local or county
The analysis of delay was performed as if delay was obtained from a prospective study, although some of the data elements were retrospective in nature, such as information about symptoms and symptom duration. Theoretically, this may give biased results.

Suspected Cancer: Appendix J2 (June 2015) Page 28 of 264
Author Setting Description No. Inclusion Exclusion Results Quality
study of a large prospective multicentre trial, data on delay were obtained retrospectively presumably from the medical records.
available for 964 patients, data for total delay were available for 1000 patients.
hospitals, p = 0.025). DD was longer for women than for men (p = 0.013), and more advanced stages of disease were associated with a short DD (p = 0.004). Patients admitted to a university hospital had a longer DD than those referred to country or local hospitals (p = 0.008). The magnitude of weight loss did not affect the DD. Women had a statistically significant longer TD than men (p = 0.045), and the proportion of patients with a long TD increased with increasing loss of weight (p < 0.0001). Multivariate analyses. Patients admitted to a university hospital had a shorter PD than those admitted to a local hospital (p = 0.03). The PD was longer in those with excess weight loss (p < 0.0001). Women experienced a longer DD delay than men (p = 0.003). TD was associated with the disease stage (p = 0.003) and weight loss (p < 0.0001). The findings, revealed by univariate analyses, that women had a longer TD than men and that the association between disease stage and TD was of no significance, were not confirmed in the multivariate analyses.
Recall bias is probably introduced by patients not remembering correctly the time of their first symptoms. Since patients were not sampled at the time of their initial symptoms and followed up prospectively, sampling bias may have been introduced. The authors fail to describe sufficiently how data were obtained (e.g. from medical records, from interviewing the patients). The also fail to make a difference between primary care doctor related delay and hospital doctor related delay.

Suspected Cancer: Appendix J2 (June 2015) Page 29 of 264
Irving et al, 2002
UK, Secondary Care
The study aimed to determine the impact of the referral guidelines for upper gastrointestinal cancers on the delays in the diagnosis of these cancers in a specialised oesophago-gastric cancer unit. All patients underwent standard history taking by the clinical nurse specialist. The details of referral, investigation and treatment were all obtained, and the dates of a number of events (first symptoms, presentation to GP, GP referral, endoscopy, histological diagnosis, and treatment) were recorded for each patient.
90 patients treated within an oesophago- gastric cancer unit between 1 November 1999 and 30 December 2001.
Patients with oesophago-gastric cancer
Not explicitly mentioned (presumably none)
46 (51%) patients were referred before the introduction of referral guidelines, and 44 (49%) were referred after the introduction; 65 patients were diagnosed with oesophageal cancer and 25 with gastric cancer. The overall median delay from the onset of symptoms to histological diagnosis throughout the study was 15.5 weeks. This was comprised of patient delay in consulting a doctor (50%), delay in GP referral (33%), and delay in diagnosis (17%). The introduction of guidelines resulted in a significant decrease in referral time from first GP consultation to endoscopy (median 7.25 to 3.0 weeks, p = 0.005). Only 11% (5/44) of patients waited more than four weeks from GP referral to endoscopy compared to 35% (16/46) before the guidelines were implemented (p = 0.008). No significant reduction in total delay (median 25.0 versus 17.5 weeks, p = 0.11) or change in the stage of disease at diagnosis was identified after the introduction of the guidelines.
Small sample, selection bias very likely to have occurred, study limits its aims to explore the effects of guidelines on diagnostic delay. No description of analysis methods.
Look et al, 2003
Singapore, Secondary Care
The study aimed to examine the symptoms of early gastric cancer in patients and to document in detail the time scale of symptoms and management delays. The authors reviewed retrospectively patients with early gastric cancer treated at a surgical unit. Differences in clinical variables between groups were analysed by chi-square and Fishers’ exact test where appropriate.

Suspected Cancer: Appendix J2 (June 2015) Page 30 of 264
Martin et al, 1997
UK, Secondary Care
The aim of the study was to examine the time taken to diagnose oesophageal or gastric cancer, identify the source of delay, and assess its clinical importance. The authors undertook a study of all new consecutive patients presenting to a surgical unit with carcinoma of the oesophagus over 16 months, starting in January 1994. Patients were interviewed at first presentation to the department. Dates were recorded according to the patients' recollection and cross referenced with the patients' notes. Details of the patient's first symptoms, the
115 (70 men and 45 women)
Patients with gastric or oesophageal cancer
Not explicitly mentioned
88 patients had cancer of the stomach and 27 cancer of the oesophagus. The median age of the patients when they first developed symptoms was 66 years (range 31 to 89 years). The first symptoms or signs were dyspepsia or indigestion in 19 (17%), dysphagia in 41 (24%), abdominal or chest pain in 48 (28%), nausea or vomiting in 27 (16%), heartburn in 7 (4%), weight loss in 20 (12%), early satiety in 27 (16%), and anaemia in 19 (17%). Some patients experienced more than one symptom. The median delay from the onset of symptoms to a definitive
Good quality study with information both from patients and medical records.

Suspected Cancer: Appendix J2 (June 2015) Page 31 of 264
Author Setting Description No. Inclusion Exclusion Results Quality
number of visits to the general practitioner before referral to hospital, and of any relevant drug treatment were recorded. The authors followed then the patients' subsequent clinical course.
histological diagnosis was 17.1 weeks for patients with gastric cancer and 17.3 weeks for patients with oesophageal cancer. Overall, delay in consulting a doctor accounted for 29% of the total, delay in referral 23%, delay in being seen at hospital 16%, and delay in establishing the diagnosis at the hospital 32%. The authors found no significant relation between the nature of the first symptoms and delay in diagnosis. Similarly no relation was found between diagnostic delay and tumour location. Use of open access endoscopy service reduced the delay in diagnosis. Overall the median delay for the 65 patients referred directly to the open access dyspepsia clinic was 14 weeks compared with 25 weeks for the 50 who were more conventionally referred (P<0.001). For patients with stomach cancer there was no clear relation between tumour stage and delay in diagnosis. For oesophageal cancer however, the median delay was 6.7 weeks in patients with stage I and II disease but 20.9 weeks in those with stage III and IV disease (P<0.02).

Suspected Cancer: Appendix J2 (June 2015) Page 32 of 264
Suyakovik et al, 1997
UK, Secondary Care
The aims of the study were to compare patients diagnosed as having gastric cancer at open access gastroscopy (OAG) with patients referred through other channels (mainly outpatient clinics) to see whether OAG did pick up more early tumours, and to analyse the effect of this on whole district figures. The study also attempted to analyse whether late stage disease was more common in patients with a longer history of symptoms prior to referral.
181 Patients with gastric cancer
Not explicitly mentioned
181 cases were identified (39 cases were diagnosed following OAG, 142 were diagnosed following clinic referral or emergency admission). The two groups were similar in terms of age and sex distribution. 21.1% of patients diagnosed through OAG had early gastric cancer or stage I disease compared with 10.6% of patients diagnosed through conventional channels. This difference failed to reach significance (
2=3.149;
p=0.05-0.1). The overall
A good quality study with no obvious biases. The authors fail to acknowledge any limitations to the study, which otherwise supports findings from previous trials. Reasons for patients presenting late are not analysed although indirect evidence suggests that previous investigation with benign diagnosis may account for part of it.

Suspected Cancer: Appendix J2 (June 2015) Page 33 of 264
The authors undertook a retrospective study of patients diagnosed as having gastric cancer during a 5-year period (1989-1994). Patients had been diagnosed either at open access gastroscopy or through conventional referral channels. The retrospective analysis included presenting symptoms, general practitioner diagnosis, hospital records, operative findings, and histological findings in both groups. The primary health care records of 81 of these patients dying from gastric cancer were analysed for previous dyspeptic symptoms (e.g. excluding those leading up to referral and diagnosis), investigations, and antisecretory drug therapy. The findings were compared with 200 age and sex matched controls dying from non- malignant causes during that period.
incidence of earlier gastric cancer remains low at 13% with 87% of patients having greater than stage I disease. Worrying symptoms (dysphagia, anaemia, or weight loss) were present in 85% (120 patients) of those referred to clinic compared with only 51% (20 patients) of those referred for open access
gastroscopy ( 2=17.43;
p<0.001). Gastric cancer, as specified on the referral form, was suspected in only six patients referred for OAG despite the fact that 20 patients had one or more worrying symptoms. General practitioner diagnosis was less clear from referral letters to clinic, but from the details given gastric cancer was a possibility in at least 49 patients (
2=4.42; p<0.05).
No differences in delay in diagnosis emerged between OAG and clinic based referrals although not all cancers were diagnosed at the first gastroscopy (21 were not). The primary care records analysis of 81 patients dying from gastric cancer indicated a lifetime prevalence of dyspepsia necessitating a consultation with the general practitioner in 73%. This compares with only 22% of the 200 age and sex matched controls dying of non-malignant disease from the same practices
( 2=56.23; p<0.001). Twenty-two
patients had no previous history of dyspepsia. Of 59 patients with a previous history of dyspepsia, 19 had not been investigated. In only 20 patients was the diagnosis suspected at the time of referral. Just under half the patients had been investigated at some time in the past (40 patients). The average time

Suspected Cancer: Appendix J2 (June 2015) Page 34 of 264
Author Setting Description No. Inclusion Exclusion Results Quality
between the onset of current symptoms and diagnosis was 32 weeks, equally split between the time the patient took to consult the general practitioner and the time the general practitioner took to refer the patient to hospital. 82% of patients with a previous history of dyspepsia had received some form of symptomatic treatment prior to a gastroscopy that did not reveal malignancy even though all patients were eventually found to have gastric cancer within three years.
Wayman et al, 1997
UK, Secondary Care
The aim of the study was to investigate the hypothesis that proton pump inhibitor use can delay the diagnosis of gastric cancer. Patients with gastric cancer completed a questionnaire. The time, in weeks, from onset of new gastrointestinal symptoms until first seeking medical advice was recorded, plus the time taken from first attending the GP until obtaining the diagnosis. Prescription for either PPIs or H2 antagonists prior to diagnosis was recorded. Analysis of data was by the unpaired t-test using a log- normal distribution and chi- squared test.
104 Patients with gastric cancer
Not explicitly mentioned
The mean presentation for all patients was 16.3 weeks and was not influenced by treatment. The mean time to diagnosis in the control group (n = 57) from the time of initial consultation was 4.1 weeks compared with 15.5 weeks for cases in which PPIs were prescribed before diagnosis (P = 0.0002). There was no significant difference in delay if patients received H2 antagonists, the mean time to diagnosis being 5.7 weeks (P = 0.12).
Short paper with insufficient description of methods.
Wayman et al, 2000
UK, Secondary Care
The study reports the healing effect of proton pump inhibitors on early gastric cancer. The authors undertook a case series of patients with ulcerated gastric cancers indistinguishable as malignant gastric ulcers at endoscopy who were inadvertently prescribed a short course of a proton pump inhibitor prior to a second confirmatory endoscopy.
7 Patients in whom histological examination of the first endoscopic biopsy specimens confirmed the presence of malignancy or dysplasia but in whom macroscopic resolution had occurred at the second endoscopy, and who had been inadevertently prescribed a PPI after their first endoscopy
Patients younger than 35 years.
In all cases the patient became asymptomatic, the endoscopic signs seen at the first endoscopy had resolved, and the lesions could not be recognised even by an experienced endoscopist.
Limited sample but highly indicative of the potentially serious masking effect of prescribing a short course of proton pump inhibitors.

Suspected Cancer: Appendix J2 (June 2015) Page 35 of 264
Table 7 LOWER GASTROINTESTINAL CANCER: signs and symptoms, including risk factors Author Setting Description No. Inclusion Exclusion Results Gold Std Qua Quality
Ahsan et al 1998
US A reconstructed cohort study to examine the risk of colorectal cancer among first-degree relatives of patients with adenoma compared with that among first-degree relatives of controls without adenoma
1554 The risk of colorectal cancer was elevated (RR, 1.74 {95% CI, 1.24-2.45) among first degree relatives of patients with newly diagnosed adenomas compared with the risk among first-degree relatives of controls. First degree relatives of patients with adenomas did not have elevated risk for other cancers. The risk for colorectal cancer among family members increased with decreasing age at diagnosis of adenoma in probands. Among first degree relatives of patients who were 50 years of age or younger when the adenoma was diagnosed, the risk was more than four times greater (RR, 4.36 [CI 2.24-8.51]) than that among first degree relatives of patients who were older than 60 years of age when adenoma was diagnosed.
Baquet and Commiskey 1999
US data from several population-based cancer registries were used to identify the incidence of colorectal cancer in different ethnic groups.
For men, the age- adjusted incidence rates were highest in Alaskan natives (79.7/100,000), followed by Japanese (64.1/100,000), then African-American (60.7/100,000), white (56.3/100,000), Vietnamese (30.5/100,000), and American Indian (18.6/100,000). For
The particular ethnic groups in the study were those typical of the US, and therefore the findings are not directly applicable to the UK

Suspected Cancer: Appendix J2 (June 2015) Page 36 of 264
Author Setting Description No. Inclusion Exclusion Results Gold Std Qua Quality
women, rates were highest in Alaskan natives (67.4/100,000), then African-Americans (45.5/100,000), Japanese (39.5/100,000), white (38.3/100,000), Vietnamese (27.1/100,000) and American Indian (15.3/100,000).
Bellentani et al 1990
Italy, Primary Care
Between Jan 1987-Mar 1988 patients consulting 14 GPs covering 14,000 citizens, or referred to the outpatient gastroenterology unit, either complaining of recurrent abdominal pain or having intestinal problems (as judged by the GP), were studied
254 All patients referred to the gastroenterology unit, either complaining of recurrent abdominal pain or having intestinal problems.
Patients with acute abdomen, acute gastroenteritis or a clear diagnosis of upper gastrointestinal tract disease (gastritis, oesophagitis, peptic ulcer, or dyspepsia).
Six parameters were significantly more common in patients with organic disease & weighted as a positive score, namely ESR>17mm; first hour, history of blood in stool, leukocytes>10 000cm3, age>45, slight fever and presence of neoplastic colonic diseases in first- degree relatives.
Final diagnosis after investigation
The number of patients with colorectal cancer was only 10. The symptom score was used to detect organic disease rather than colorectal cancer uniquely.
Bonelli et al 1988
The relationship between first degree family history of colorectal cancer and the risk of benign or malignant tumours of the large bowel was investigated in a case control study.
Two groups of cases :283 patients with adenomatous polyps and 414 patients with adenocarcinoma of the large bowel.
Two groups of controls: 399 polyp free subjects and 456 hospitalised patients.
Data from the two control groups were combined. A 3 fold increase in risk of adenomatous polyps in relatives of patients with colon cancer was observed (OR=3.18, 95% CI 2.06-4.89). The relative risk of colorectal carcinoma among relatives of patients with adenocarcinoma was 2.36 (95% CI 1.54- 3.60). No significant difference in the frequency of first degree relatives with a history of cancer of the large bowel was detected between patients with colorectal cancer and those with

Suspected Cancer: Appendix J2 (June 2015) Page 37 of 264
Author Setting Description No. Inclusion Exclusion Results Gold Std Qua Quality
adenomatous polyps Burke et al 1997
Studies of cancer risk, surveillance and risk reduction in individuals genetically susceptible to colon cancer were sought through a search of MEDLINE 1990-1995
The risk of colorectal cancer in people with confirmed HNPCC was estimated to be 68% to 75% by age 65, although the average age at diagnosis is 45 years. The risk of a new primary after limited resection for a first cancer is also high at 30% after 10 years. Endometrial cancer is the second most common cancer seen in HNPCC.
Cannon- Albright et al 1988
Members of the participants family and their spouses were screened by flexible proctosigmoidoscopic examination (60 cm) to determine how frequently colorectal adenomas and cancers result from an inherited susceptibility
670 Excluding the probands, 18 relatives in the 34 kindreds and 4 of the spouses were found to have a history of colorectal cancer. Adenomas were found in 78 of 407 (19%) of the relatives of probands and in 32 of 263 (12%) of the spouses (P<0.02 for the difference between relatives and spouses). The average age of the 407 relatives was 51 years, and that of the 263 spouses was 52 years. The results suggested that an inherited susceptibility to colonic adenomatous polyps and colorectal cancer was common and that it was probably responsible for the majority of colonic neoplasms observed clinically. An underlying genetic susceptibility was present in the majority of persons with

Suspected Cancer: Appendix J2 (June 2015) Page 38 of 264
Author Setting Description No. Inclusion Exclusion Results Gold Std Qua Quality
common colonic adenomatous polyps and colorectal cancers.
Chapuis et al 1985
Australia Men aged above 50 years were interviewed and underwent sigmoidoscopy
319 Of 351 veterans sampled, 328 (93%) consented to undergo flexible sigmoidoscopy.
Those who did not give their consent were excluded from the analysis.
Rectal bleeding had a specificity of 86%, a sensitivity of 33% and a positive predictive value of 8% for rectal or sigmoid polyps or cancer. Sigmoidoscopy in apparently healthy subjects will not result in the diagnosis of appreciable numbers of rectal and sigmoid polyps or cancers.
After a phosphate enema had been given, flexible sigmoidoscopy was performed with a 60cm fibreoptic sigmoidoscope.
Population survey of bleeding. Although flexible sigmoidoscopy was performed in this study by experienced endoscopists, in a minority of patients the instrument was not inserted beyond 40cm. This difficulty could be overcome by better bowel preparation. But the findings were valid for rigid sigmoidoscopy, for which the average length of insertion has been reported as 19.5 cm.
Curless et al 1994
UK Case controlled study of 273 patients newly diagnosed with colorectal cancer and 273 age and sex matched community controls.
546 none Patients with known colorectal adenoma, carcinoma of IBD
Lower GI symptoms were reported in a small but clinically significant number of community controls, particularly those aged 70 or older. The odds of 10 of 11 symptoms were greater among patients with cancer: change in bowl habit, abdominal pain, faecal incontinence, tenesmus, mucus, bleeding, change in flatus, anorexia, weight loss, bloating. There was no difference for malaise.
A specialist diagnosis of colorectal cancer, after investigations.
The study did not include patients consulting in primary care.
Dodds et al, 1999
UK Recording of symptoms and signs of patients referred to a specialist service.
8438 - - 471(5.6%) patients had colorectal cancers. Rectal bleeding & change in bowel habit were present in 252 (54%), PPV 1:8, LR 2.5; change in bowel habit alone in 110 (23%), PPV 1:17, LR 1.1; bleeding alone 48 (10%), PPV 1:18, LR
Diagnosis after full investigation.
The study was limited to patients who had been referred to secondary care.
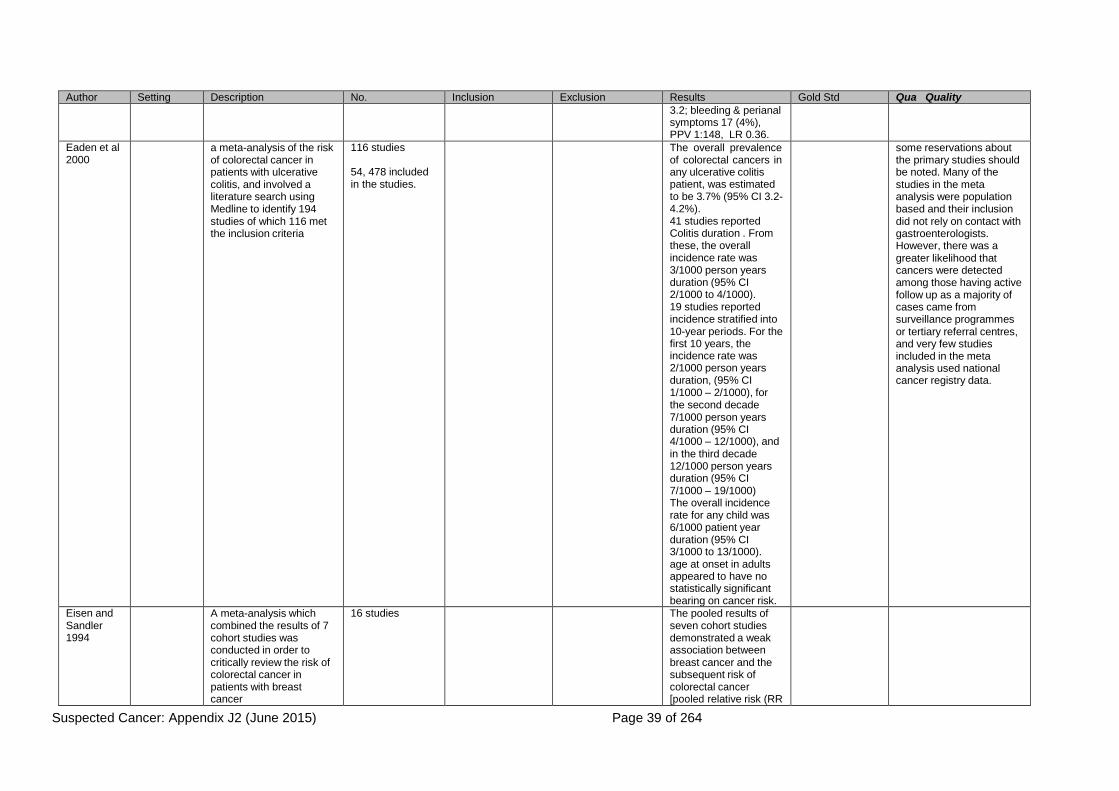
Suspected Cancer: Appendix J2 (June 2015) Page 39 of 264
Author Setting Description No. Inclusion Exclusion Results Gold Std Qua Quality
3.2; bleeding & perianal symptoms 17 (4%), PPV 1:148, LR 0.36.
Eaden et al 2000
a meta-analysis of the risk of colorectal cancer in patients with ulcerative colitis, and involved a literature search using Medline to identify 194 studies of which 116 met the inclusion criteria
116 studies
54, 478 included in the studies.
The overall prevalence of colorectal cancers in any ulcerative colitis patient, was estimated to be 3.7% (95% CI 3.2- 4.2%). 41 studies reported Colitis duration . From these, the overall incidence rate was 3/1000 person years duration (95% CI 2/1000 to 4/1000). 19 studies reported incidence stratified into 10-year periods. For the first 10 years, the incidence rate was 2/1000 person years duration, (95% CI 1/1000 – 2/1000), for the second decade 7/1000 person years duration (95% CI 4/1000 – 12/1000), and in the third decade 12/1000 person years duration (95% CI 7/1000 – 19/1000) The overall incidence rate for any child was 6/1000 patient year duration (95% CI 3/1000 to 13/1000). age at onset in adults appeared to have no statistically significant bearing on cancer risk.
some reservations about the primary studies should be noted. Many of the studies in the meta analysis were population based and their inclusion did not rely on contact with gastroenterologists. However, there was a greater likelihood that cancers were detected among those having active follow up as a majority of cases came from surveillance programmes or tertiary referral centres, and very few studies included in the meta analysis used national cancer registry data.
Eisen and Sandler 1994
A meta-analysis which combined the results of 7 cohort studies was conducted in order to critically review the risk of colorectal cancer in patients with breast cancer
16 studies The pooled results of seven cohort studies demonstrated a weak association between breast cancer and the subsequent risk of colorectal cancer [pooled relative risk (RR

Suspected Cancer: Appendix J2 (June 2015) Page 40 of 264
Author Setting Description No. Inclusion Exclusion Results Gold Std Qua Quality
= 1.5; 95% confidence intervals (CI) = 0.99- 1.31]. Pooled results from another five cohort studies showed that the risk of breast cancer after colorectal cancer was similar (pooled RR=1.10; 95% CI=1.03- 1.17). The combined results from five other cross sectional/case control studies revealed a positive association between breast cancer and colorectal adenomas (pooled RR = 1.74; 95% CI=1.27- 2.21). However, population based cohort studies, a stronger research design, showed essentially no increase in risk of colorectal cancer in women with previous breast cancer.
Fijten et al 1995
Netherlands General practice
Data collected about patients presenting overt rectal bleeding to the GP (83 GPs in the Netherlands). Outcome measures were sensitivity, specificity, predictive values, odds ratios and a prediction model derived from multiple logistic regression analysis. A further report from the study reported in Fitjen et al, 1993.
269 Patients presenting with overt rectal bleeding to the GP. There were fewer than expected patients with rectal bleeding
Patients younger than 17 yrs or older than 75, pregnant, or urgent admissions (eg massive bleeding or acute abdominal pain)
9 patients had colorectal cancer. Age (OR 8), bowel habit change (OR 10) & blood mixed with or on stool (OR 8), were predictive of cancer.
Follow up for at least one year, with diagnostic information being extracted from the medical record.
Small no of 9 patients with cancer in the study. Does not state how many of those without bleeding had cancer.
Fijten et al 1994
The review was undertaken to determine the occurrence and significance of overt blood loss per rectum.
Nine studies were found reporting the occurrence of rectal bleeding in the general population
Occurrence rates varied from 2% in the last 2 weeks to 20% in the last year. The positive predictive value of rectal bleeding in the general population was reported in four studies,
estimates involved several assumptions and they cannot be taken as precise.

Suspected Cancer: Appendix J2 (June 2015) Page 41 of 264
Author Setting Description No. Inclusion Exclusion Results Gold Std Qua Quality
varying from 3% to 8% for prediction of adenomas and 0% to 1% for carcinomas. The incidence of rectal bleeding without a specified diagnosis was 0.4 per 1000 persons per year. The incidence of bleeding associated with the diagnosis of haemorrhoids was 6.8/1000 consulting persons per year, anal fissure or perianal abscess 3.2, diverticular disease 1.6, colitis 0.8, and cancer 0 per 1000 persons per year. No epidemiologic data on the diagnostic value of rectal bleeding in patients presenting in primary care were found. The authors of the review estimated from the findings of a single Dutch study that around 0.8 per 1000 persons per year were referred with rectal bleeding by general practitioners to specialists. They went on to estimate the predictive values of rectal bleeding for colorectal cancer from the data they had identified of less than one in 1000 in the general population, two in 100 in general practice, and up to 36 in 100 referred patients.

Suspected Cancer: Appendix J2 (June 2015) Page 42 of 264
Fitjen et al 1993
Netherlands General practice
Data collected about consecutively attending patients with rectal bleeding. There were 83 doctors in study A and 10 involved with study B.
290 study A
48 study B
All patients presenting to the doctor with overt rectal bleeding or a history of recent (ie within the last 3 months) rectal blood loss visible to the patient.
Exclusions were younger than 18 years or older than 75 years, pregnancy and urgent admission to a hospital (massive bleeding or acute abdomen).
In about 90% of patients, rectal bleeding was due to minor ailments or self- limiting disorders. Incidence of rectal bleeding in study A, was 2.15 per 1000 persons per year. (6.8 per 1000 in study B). Gender differences were not statistically significant. In both studies combined, 3% of the total 313 patients were diagnosed with colorectal cancer.
Follow up for a minimum of 12 months.
Bias in the selection of patients with clinically relevant bleeding. Initial protocol used for patient selection to the study not made explicit. Problem of non compliance by doctors, resulted in under registration of patients visiting practice with rectal bleeding, particularly younger patients in study A. The studies included only a small number of patients with colorectal cancer. Patient drop out rate affected study A results, but the mean incidence rate was lower in study B.

Suspected Cancer: Appendix J2 (June 2015) Page 43 of 264
Fuchs et al 1994
A prospective study of men and women who provided data on first degree fmily relatives with colorectal cancer, diet and other risk factors for the diease.
Data were analysed from two ongoing studies: the Nurses Health Study and the Health Professionals Follow-Up Study
32,085 men
87,031 women
The age adjusted relative risk of colorectal cancer for men and women with affected first-degree relatives, as compared with those without a family history of the disease, was 1.72 (95% CI, 1.34-2.19). The relative risk among study participants with two or more affected first-degree relatives was 2.75 (95% CI, 1.34-5.63). For participants under the age of 45 years who had one or more affected first-degree relatives, the RR was 5.37 (95% CI, 1.98- 14.6), and the risk decreased with increasing age (P for trend, <0.001). Among women, the relative risk associated with a family history was highest for those younger than 50 years of age and the risk decreased progressively for older women

Suspected Cancer: Appendix J2 (June 2015) Page 44 of 264
Author Setting Description No. Inclusion Exclusion Results Gold Std Qua Quality
Goulston 1986
Australia Secondary care
Prospective study of patients above 40 years presenting to 58 GPs with overt rectal bleeding, who were followed through to final diagnosis to determine how successfully GPs & gastroenterologists establish the source of bleeding before full colonic investigation.
145 All patients aged 40 years or over with rectal bleeding.
Patients were excluded if a) their age or general medical condition precluded colonoscopy, b) they were known to have inflammatory bowel disease, colorectal cancer , or polyposis coli c) a coagulation defect or haematological disorder was present d) bleeding was melaena, or e) the patient refused investigation.
14 patients had one colorectal cancer and 1 patient had 2. Of the 63 patients in whom GPs predicted an anal source of bleeding only, 11 were ultimately found to be bleeding from a colonic or rectal source (NPV=82.5%); a false negative rate of 34.4%. However, GPs accuracy in attributing bleeding solely to a colonic or rectal source was much lower (PPV 35.6%). The NPV for colorectal cancer as assessed by GPs was 95.4% and the PPV 20.7%.
Diagnosis of source of bleeding before and after complete colonoscopic investigation.
Seven specialists participating in the study recruited GPs who regularly referred patients to them..
Those participating were possibly well informed about rectal bleeding as a symptom or were more interested and motivated.

Suspected Cancer: Appendix J2 (June 2015) Page 45 of 264
Grodstein et al 1999
A MEDLINE search dating from January 1966 to September 1998 yielded 18 epidemiologic studies of postmenopausal hormone therapy and colorectal cancer
Evidence these studies indicated that postmenopausal hormone therapy was associated with a 20% reduction in the risk of colon cancer in women (RR+0.80, 95% CI, 0.72 to 0.92) and a 19% decrease (RR=0.81, 95% CI, 0.72 to 0.92) in the risk of rectal cancer for postmenopausal women who had ever taken hormone therapy compared with women who never used hormones. Much of the apparent reduction in colorectal cancer was limited to current hormone users (RR+0.66, 95% CI, 0.59 to 0.74)
Of the ten studies with data on current hormone use, nine found a decreased risk
A potential bias in the primary studies was the possibility that women who chose to take postmenopausal hormones differed from non users in ways that influenced their risk of colorectal cancer. For example, women taking hormones had to visit their physician and undergo routine stool occult blood tests and endoscopy more frequently, which would reduce the risk of cancer through removal of precancerous lesions. Thus, it may appear that hormone use reduces the risk of cancer when it is simply behavioural characteristics of hormone users that lead to their lower rate of malignancy.

Suspected Cancer: Appendix J2 (June 2015) Page 46 of 264
Author Setting Description No. Inclusion Exclusion Results Gold Std Qua Quality
of colorectal cancer. The RRs in the 10 studies ranged from 0.4 to 1.0, with a summary RR of 0.66 (95% CI, 0.59 to 0.74) for current use. There was greater protection against colorectal cancer for recent use than for past use, compared with women who never took postmenopausal hormones. The observed decrease was strongest among women currently taking postmenopausal hormones, in whom the risk of colorectal cancer was 34% lower than in never users
Hamilton 1985
A small Case series review supported by a literature review.
there was some evidence that patients with Crohn’s disease and colorectal cancer were younger than other patients with colorectal cancer, and the histopathological type of cancer was different, being mucinous in 50% of the case series with Crohn’s in comparison with 9% in other colorectal cancer patients.
The quality of the study is not sufficient to provide convincing evidence that Crohn’s disease is associated with a higher risk of development of colorectal cancer,
Helfand et al 1997
US Patients with rectal bleeding identified by system review at consultations; these were investigated by sigmoidoscopy and barium enema. The diagnosis was reviewed after 10 years.
297 (201 completed all the investigations)
- - 13 of the 201 had colon cancer. The ten year incidence of cancer was not statistically different to that expected in a similar cohort of the general population.
Investigation for colorectal disease.
Only a small number of patients with cancer were included. The study included patients who reported rectal bleeding on questioning, rather than those consulting because of concern about bleeding.
Jarvinen et A study was based on an 251 (incl 118 CRC occurred in 6

Suspected Cancer: Appendix J2 (June 2015) Page 47 of 264
Author Setting Description No. Inclusion Exclusion Results Gold Std Qua Quality
al 1995 evaluation of the effectiveness of long term screening during a 10 year period.
The colorectal cancer and death rates were compared between two groups of asymptomatic at risk members of 22 families with HNPCC
controls) study subjects (4.5%) and in 14 controls (11.9%; P=0.03), a difference of 7.4% in favour of the study group. The tumour stage was more favourable in the screening group with no deaths caused by CRC compared with 5 of 14 cases in controls. Overall, there were 6 and 12 deaths within the 10 year period in the study and control groups, respectively (P=0.08). The 3 year interval screening programme more than halved the CRC rate in at-risk members of families with HNPCC and seemed to prevent CRC deaths.
Mansson et al 1999
Primary Care Sweden
Based on analysis of medical records in one district of all subjects with colorectal, pulmonary, breast or prostate cancer reported to the Swedish cancer registry.
42 none none The study provided information about the proportion of patients with colorectal cancer who had particular symptoms at initial presentation to the GP.
Notification of diagnosis to cancer registry
No patients included who did not have colorectal cancer
Mant et al, 1989
Australia Secondary care
Patients who complained of rectal bleeding were referred to a specialist for colonic investigation. 248 patients aged 40 years and older with rectal bleeding, consulted 58 GPs over an 11 month.
145 Patients aged 40 years and older, who consulted for rectal bleeding as a clinical problem.
Patients were excluded if 1) age, or general medical condition precluded colonoscopy, 2) known to have inflammatory bowel disease, colorectal cancer, or polyposis coli, 3) a coagulation defect or haematologic disorder was present, 4) bleeding was melenic or 5) the patient refused investigation.
16% of patients with haemorrhoids also had a colorectal source of bleeding and in 5% this was a malignancy. There was a slight tendency for patients reporting dark blood to have a colorectal source. Blood mixed with faeces was more likely to come from a colorectal than an anal source.
Association between patient history and final diagnosis established through complete investigation.
33 patients were not referred to a specialist either because they refused to participate or because the GP decided it was ethically unviable. Symptoms and signs for which there was missing data were family history of colorectal cancer (2 patients), colour of blood, where the blood was seen, whether the blood was separate from or mixed with faeces (5 no data, 21 uncertain); abdominal pain (1 patient), bowel habit

Suspected Cancer: Appendix J2 (June 2015) Page 48 of 264
Author Setting Description No. Inclusion Exclusion Results Gold Std Qua Quality
change (2 patients)
Metcalf et al 1996
UK Prospective study in which patients consecutively presenting with rectal bleeding to GPs underwent colooscopy
99 Age 40 or over - 8 (8.1%) had carcinoma. The sensitivity and specificity of presenting symptoms were low.
Colonoscopy It is unlikely that all patients presenting with rectal bleeding were enrolled in the study.
Muris et al 1995
Netherlands One year prospective observational study in 80 general practices
933 Aged 18-75; symptoms for minimum of 2 weeks, and with whom GP had a diagnostic problem
Refusal of consent 4/933 had colorectal cancer; 24 had a neoplasm (colorectal, stomach, pancreas, other). Diagnosis of cancer associated with no specific character to pain; pain relief after defaecation, pain affecting sleep; blood in stool. Regression analysis found male sex, greater age, no specific character to pain, weight loss, ESR above 20mm predicted neoplasm.
Diagnosis taken from clinical records, a mean of 18\months after presentation.
Few patients with colorectal cancer, and findings not specific to colorectal cancer.
Muris et al, 1993
Netherlands Patients from 11 general practices with a population of 25,000 were followed for 15 months to evaluate abdominal pain.
578 Cases of non acute abdominal pain were enrolled into the study.
Patients younger than 18 years and patients with a condition necessitating immediate referral to or admission into a hospital were not included into the study.
Diagnosis of abdominal or stomach pain with unknown cause; irritable bowel syndrome; acute gastroenteritis, presumed viral and disorders of the stomach function accounted for 70% of the final diagnoses. In 17% of cases the patient was referred most often to internal medicine (40%), surgery (24%) and gynaecology (21%). Ten people died during the follow up period of whom 2 cases were caused by malignant colorectal disease. Cases of abdominal complaints in age groups 18-39 295 ; 40- 49 80; 50-59 91; 60-75
Independent classification of diagnosis 15 months later.
A prospective study. The most appropriate work up of patients with abdominal pain is not speci.fied. The authors established that abdominal pain is common in general practice, but did not have a large sample of cancer patients, or elaborate on how their signs and symptoms were different. Only three malignant colorectal diseases were detected.

Suspected Cancer: Appendix J2 (June 2015) Page 49 of 264
Author Setting Description No. Inclusion Exclusion Results Gold Std Qua Quality
88. Murris et al 1993
A Medline search was undertaken for publications between 1982 and 1991 that investigated the diagnostic value of rectal examination in patients with abdominal pain and urinary complaints
Eight studies All the studies were carried out in populations selected by referral, adequate gold standards, based on histological evidence. The sensitivity of rectal examination for detecting rectal carcinoma in the two relevant studies were 50% and 24%; in one of these studies the specificity had been estimated as 95%, and likelihood ratio 4.8.
Norrelund et al 1996
General practice in Denmark
Danish GPs recorded information about 3-4 patients each presenting with rectal bleeding in 1989, and for a second sample in 1991.
208 patients 2. 209 patients
Age 40 or over, rectal bleeding
Known inflammatory bowel disease, colonic polyps, polyposis coli, colorectal cancer, coagulation defects, melaena
32/208 had colorectal cancer; only age and change in bowel habit predictive of cancer. 2. 28/108 who presented with first bleeding had cancer or polyps; 12/48 with change in bleeding pattern had cancer or polyps; 3/45 unchanged bleeding pattern had cancer or polyps. Combined data from both studies indicated only age and change in bowel habit were associated with cancer
At least one year follow up
Full ascertainment of presenting patients may not have been achieved.
Pinsky et al 2003
Patients who were part of a prostate, lung, colorectal and ovarian cancer screening trial were asked to complete a baseline questionnaire component with a family history section
149,332 A total of 26 respondents (0.02%) had families meeting the Amsterdam criteria for hereditary nonpolyposis colon cancer. The reported prevalence per 1000 in siblings was 9.4% for colorectal cancer. The ratio of reported to expected rate in men was 0.60 (95% CI, 0.57,0.62) and in

Suspected Cancer: Appendix J2 (June 2015) Page 50 of 264
Author Setting Description No. Inclusion Exclusion Results Gold Std Qua Quality
women it was 0.76 (0.73, 079).
Radack and Park 1993
A systematic review was undertaken of articles identified by search of Medline for all relevant studies from 1983 until January 1992 to assess the clinical utility of skin tags as a biomarker for colonic polyps
10 reports Only four of the ten studies reported a statistically significant association between skin tags and colonic polyps; the remaining studies reported outcomes indicating no association. Only four of the ten studies reported a statistically significant association between skin tags and colonic polyps; the remaining studies reported outcomes indicating no association.
Limitations potentially responsible for the varying outcomes included lack of blinded ascertainment of clinical information, noncomparability of subjects, differing diagnostic investigations of the colon, and uncontrolled confounding. All but one study were performed in a tertiary care setting, seriously limiting the relevance of the results to the “average” subject seen in primary care settings. Variability in study populations, methods of diagnostic evaluation and the control of possible confounders that could affect the potential relationship. For these reasons, the review did not provide a reliable estimate of any association between skin tags and polyps.
SIGN 2003 Guidelines for the management of colorectal cancer
Evidence based. Nationally recognised.
Silman et al 1983
Australia Symptom questionnaires were sent to workers in two large organisations and the results were compared with faecal occult blood testing in the same individuals using haemoccult.
916 All patients who returned their questionnaires were included.
No exclusions were mentioned.
No cancers were discovered but adenomas were found in 14 persons out of 916 giving a yield of 1.5%. In 7 of these, an adenoma greater than 10mm in diameter was present giving a yield of 0.8%. All 7 individuals had at least one symptom including 4 with dark bleeding, 2 with bright bleeding and 1 with diarrhoea. Six of the 7 individuals were
Use of haemoccult test to indicate presence of an adenoma.
Population study No cancers were reported The high rate of 12% of large bowel and anal symptoms among the screened population of 916 may have been influenced by some selection since symptomatic persons might have been more ready to participate. The impact of the education programme prior to screening may well have been to encourage those

Suspected Cancer: Appendix J2 (June 2015) Page 51 of 264
Author Setting Description No. Inclusion Exclusion Results Gold Std Qua Quality
haemoccult positive. with symptoms selectively to comply.
Stellon et al 1997
UK Patients in one general practice over the age of 50 years with proven iron deficiency anaemia were identified, investigated and followed up in general practice over a five year period to evaluate extent to which GI the tract should be investigated. Data collected between Jan 89-Mar 94.
26 All patients over 50 years of age found to have iron deficiency anaemia were entered in the study from a patient list size that varied between 2,400 and 3,400 patients during the study period.
No exclusion criteria mentioned
22 of the patients had faecal occult blood tests but only five were found to be positive. Endoscopy revealed significant disease in eight patients that could have accounted for the iron deficiency. The 22 barium enema examinations gave a diagnosis in two patients.
Five year follow up.
Faecal occult bloods using the haemoccult test, upper GI endoscopy, flexible sigmoidoscopy and the double contrast barium enema
Prospective study. Case series. Small sample of general practice patients were reported. One patient had caecal carcinoma not reported on the initial barium enema.
Trilling et al 1991
US Charts of 173 patients with hemorrhoids from a non selected population were reviewed for treatment management, associated anorectal disease, and sequelae.
173 All patients who had external or internal hemorrhoids diagnosed and were seen in the model Family Practice centre.
No exclusion criteria
During the period of chart review, eight cases of colon carcinoma and nine non colon gastrointestinal cancers were diagnosed in the practice in patients without hemorrhoidal disease. Sigmoidoscopy was performed in 72 patients. Findings were normal in 57 patients and abnormal in 15. Hemorrhoids usually coexist with other anorectal diseases.
Diagnosis after sigmoidoscopy
Physician approach toward hemorrhoid management based upon the practice habits of 10 academic physicians are difficult to generalise to the general population of family physicians. The study was limited by the small population size and the relatively few patients who had sigmoidoscopy or barium enema to rule out colon cancer.
Winawer et al 1993
The incidence of colorectal cancer was retrospectively compared in two cohort studies to test whether the current practice of removing adenomatous polyps of the colon and rectum prevented colorectal cancer. In group 1 patients who had polyps 1cm or larger and had declined surgical polypectomy, were followed for an average of
Group 1: 226 patients
Group 2: 1618 patients
Group1: Of the cancers detected, 21 (66%) were detected at the same site as the index polyp and 11 (34%) were at sites distant from it.
Group 2: 35 colon cancers were detected. The standardised incidence ratio for colon cancer was 2.1.

Suspected Cancer: Appendix J2 (June 2015) Page 52 of 264
Author Setting Description No. Inclusion Exclusion Results Gold Std Qua Quality
nine years and 32 colon cancers were detected. In Group 2 a cohort of patients who underwent excision of rectal adenomas were followed for an average of 14 years

Suspected Cancer: Appendix J2 (June 2015) Page 53 of 264
Winawer et al 1996
A large cohort of patients with newly diagnosed adenomatous polyps were interviewed in order to establish whether their families were at increased risk of colorectal cancer.
Colorectal cancer was reported in 68 of 2381 siblings, 133 of 1865 parents, and 29 of 1411 spouse controls. Of the 230 first-degree relatives or spouses reported to have had colorectal cancer 171 (74.3%) had died. The average age was 73.2 years for the parents, 62.3 years for the siblings, and 63.7 years for the spouses. The first degree relatives of patients with adenomas had an increased risk of colorectal cancer as compared with spouse controls (relative risk 1.78; 95 percent confidence interval, 1.18 to 2.67). The risk of colorectal cancer was higher for the siblings and parents of patients in whom adenomas were diagnosed before the age of 50 years and for the siblings of patients given the diagnosis at 50 to 59 years of age than for the siblings and parents of patients in whom adenomas were diagnosed at 60 years or older. The risk of colorectal cancer increased in the siblings with decreasing age of the index patient at the

Suspected Cancer: Appendix J2 (June 2015) Page 54 of 264
Author Setting Description No. Inclusion Exclusion Results Gold Std Qua Quality
diagnosis of adenoma
(P for trend<0.001).

Suspected Cancer: Appendix J2 (June 2015) Page 55 of 264
Table 8 LOWER GASTROINTESTINAL CANCER: investigations
Author Setting Description No. Inclusion Exclusion Results Gold Std Quality
Church, 1991 USA Patients presenting to a colorectal surgeon underwent colonoscopy, with the findings being related to the bleeding pattern.
269, 115 having outlet bleeding, 59 suspicious bleeding, 27 heamorrhage, 64 occult bleeding
- - 4% of outlet cases had carcinoma (all in the rectum or sigmoid), 22% with suspicious (10 left colon, 3 right colon), 19% with occult bleeding (12 of 13 proximal to splenic flexure), and 4% in haemorrhage (all 3 cancers right sided). The sensitivity of air contrast barium enema was 75%, specificity 43%, PPV 71% and NPV 47%
colonoscopy A selected group of referred patients.
Duffy et al 2003 Guidelines produced by the European Group on Tumour Markers
Extensive review of the evidence
Fijten et al 1995 Netherlands A further analysis of Fitjen et al, (1993){651}. The aim was to determine the diagnostic value of combinations of signs, symptoms and simple laboratory test results for colorectal cancer in patients presenting with rectal bleeding to the general practitioner. The tests were haemoglobin, erythrocyte sedimentation rate (ESR), white blood cell count (WBC), and faecal occult blood
In a multiple logistic regression that included symptoms and signs, none of the tests were significant independent predictors of colorectal cancer in patients with rectal bleeding.
Meyer et al, 2000
USA A retrospective cohort study 167347 patients undergoing gastrointestinal endoscopies
Medicare beneficiaries
Under age 65, claims for reimbursement disallowed, services provided outside continental US
Only 8% of colonoscopies were performed by generalists; generalists performed 35.2% of rigid sigmoidoscopies and 42.7% of flexible sigmoidoscopies. Specialists were more likely to perform the procedure to investigate cancer.
Medicare data

Suspected Cancer: Appendix J2 (June 2015) Page 56 of 264
Muris et al 1995 Netherlands Prospective observational study in 80 general practices. patients presented to their general practitioner with new non-acute abdominal complaints lasting two or more weeks. A structured history was obtained, an examination performed, and the following laboratory tests undertaken: haemoglobin, white blood cell count, ESR, faecal occult blood (three times, with peroxidase-free diet).
933 patients 24 (2.6%) of the sample of 933 were diagnosed to have cancer during the following year. Multiple logistic regression was used to estimate the odds of cancer given certain symptoms, signs and investigation results. Only an ESR greater than 20mm/hour was associated with a diagnosis of cancer (odds ratio 3.0 [95% CI 1.1-8.2]). The paper did not report sufficient data to enable the sensitivity or specificity of a raised ESR to be calculated.
NHS centre for Reviews and Dissemination 1997
Evidence based review to support the CSG on colorectal cancer
Evidence based, but not focused on diagnosis
Pierzchajlo et al 1997
USA Case series of 751 colonoscopies performed by a single family physician
555 patients with bleeding (49.9%), polyp follow-up (20.9%), pain (11.7%), diarrhoea (11.6%), abnormal findings on sigmoidoscopy (8.4%).
- - The adequacy of bowel preparation was excellent in 79.2%; completion (caecal intubation) was achieved in 91.5%. 407 biopsies and polypectomies were preformed, and three carcinomas discovered.
histology Only a single physician included.
Rodney 1987 USA Before and after study of impact of an education course on the use of flexible sigmoidoscopy
114 physicians - - The number of procedures performed by physicians increased after the course. 5467 procedures had been performed, and there had been one perforation. Physicians reported reaching an insertion depth of 52 cm by the 21
st examination.
- Study does not present information about the diagnostic utility of flexible sigmoidoscopy by family physicians.
Selvachandran et al 2002
UK Prospective study, the findings from a patient questionnaire that provided a malignancy risk score being compared to final diagnosis. The likelihood of cancer was graded by the surgeon on the basis of the GP’s letter into one of five groups.
2268 patients referred by GPs to a surgeon
- - 95 (4.2%) of the 2268 patients had colorectal cancer. The proportions with cancer were higher among those placed in high likelihood groups by specialists on the basis of the GP’s letter, and among those with higher patient questionnaire scores. The sensitivity and specificity of the malignancy risk score varied depending on the cut off point.
Final diagnosis after investigation

Suspected Cancer: Appendix J2 (June 2015) Page 57 of 264
Sorensen et al 1992
Denmark Data from the cancer registry were associated with data from service records of general practitioners in one county in Denmark
146 general practices; 95 patients diagnosed as having cancer of the rectum in 1986
- Practices were excluded if they experienced a change in doctors during the year of the study.
Proctoscopies were preformed in 128 (88%) of the practices, the number of examinations performed by GPs varied from 1 to 107. There was no relationship between the number of proctoscopies performed per year and the Dukes’ stage at time of diagnosis of cancer of the rectum.
Cancer registrations.
The study has no information on the findings of proctoscopy examinations and does not permit the calculation of sensitivity of specificity of the examination.
Steine 1994 Norway A survey of patients referred for barium enema; information on symptoms and tests were obtained from patients and referral letters.
1852 referred patients, 1477 from GPs.
- - 76% had had a haemoglobin test 37% faecal occult blood, and 16% proctosigmoidoscopy.
none The study did not obtain data from clinical records, and did not relate the result of tests to final diagnosis
Tate et al 1990 UK A prospective cohort study of patients referred for double contrast barium enema. Patients were randomly allocated to use one of three types of occult blood test before the enema.
969 patients undergoing barium enema.
Appointment within 7 days of request for examination by physician
49 (5.1%) had colorectal cancer detected on barium enema. The sensitivity, specificity and PPV of the three tests were: Haemoccult 80.0, 88.8, 32.7; Fecatwin 93.3, 71.6, 13.3; E-Z Detect 57.1, 88.9, 19.0, respectively.
Double- contrast barium enema

Suspected Cancer: Appendix J2 (June 2015) Page 58 of 264
Table 9 LOWER GASTROINTESTINAL CANCER: diagnostic difficulties
Author Setting Description No. Inclusion Exclusion Results Quality
Bankhead et al 2001
UK Postal questionnaire sent to practice nurses in 4 England health authorities.
600 49.8% collected information about a family history of colorectal cancer in new patient appointments, 45.6% in well person appointments, and 22.7% in chronic disease clinics. Only 33.2% expressed confidence in making a basic risk assessment in the case of colorectal cancer, 25.0% felt confident in reassuring those at low risk, and 61.1% felt confident in advising on relevant symptoms
Dixon et al 1990 In one general hospital, the referral letters from general practitioners for all 376 patients who had been treated by right hemicolectomy, anterior resection or abdominoperineal excision were reviewed to obtain information on the general practitioner’s diagnosis, duration of symptoms, physical signs, investigations, and time between referral and operation
The mean interval between the development of symptoms and outpatient assessment was 16 weeks for tumours on the left side (range four days to two years), and 27 weeks for those on the right (2-28 months). Of 202 patients who had an anterior resection, symptoms were attributed by the general practitioner to cancer in 143 (71.0%), diverticulosis in 28 (13.9%), haemorrhoids in 12 (5.9%), irritable bowel syndrome in 8 (4.0%), or no diagnosis was suggested (11, 5.5%). Of the 85 patients requiring abdominoperineal excision of the rectum, 59 (69.4%) were referred with the correct diagnosis, 11 (12.9%) were referred for the urgent investigation of possible malignancy, and 15 (7.4%) were referred with haemorrhoids without having had a rectal examination.
Henningan et al 1990
UK Postal questionnaires sent to general practices in london
609 279 general practitioners did five or fewer rectal examinations a month, 211 did six to 10, and 96 did more than 10. Factors associated with doing fewer examinations were a small partnership and being a female general practitioner, and expectation that the examination would be repeated. Lack of time in the surgery and an urgent outpatient appointment waiting time of less than 2 weeks were also important. The reasons given for deciding not to do a rectal examination in symptomatic patients were reluctance of the patient (278 respondents, 45.6%), the expectation that the examination would be repeated after referral (141, 23.2%), lack of time (132, 21.7%), or lack of a chaperone (39, 6.4%). General practitioners who thought they had been poorly taught, were more recently qualified, or worked in inner London were significantly more likely to be deterred by one or more of these factors.
Johnson et al 1995
The aim of this study was to assess the prevalence of a family history of cancers (colorectal, breast, uterus and ovary). Nurses asked all attenders at routine health checks in primary care, aged 35-64, about the presence of a history of cancer in close relatives, diagnosed under the age of 70 years.
all attenders at routine health checks in primary care, aged 35-64
3.1% reported a family history of colorectal cancer
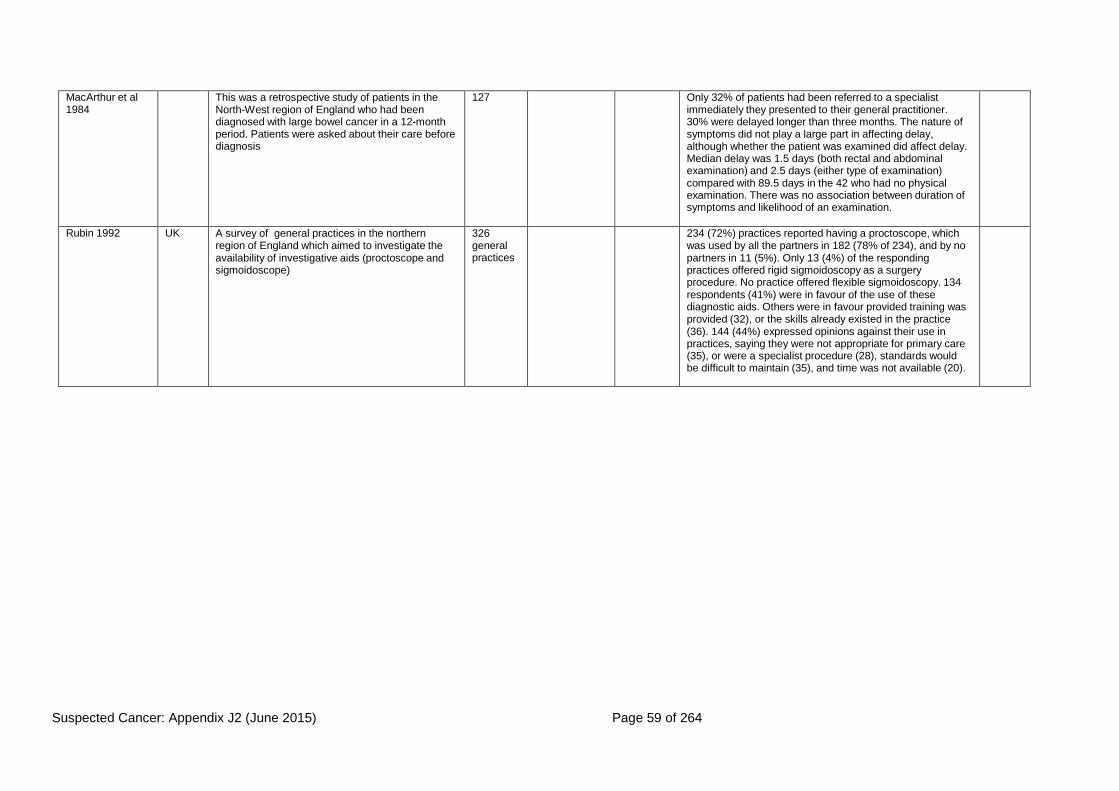
Suspected Cancer: Appendix J2 (June 2015) Page 59 of 264
MacArthur et al 1984
This was a retrospective study of patients in the North-West region of England who had been diagnosed with large bowel cancer in a 12-month period. Patients were asked about their care before diagnosis
127 Only 32% of patients had been referred to a specialist immediately they presented to their general practitioner. 30% were delayed longer than three months. The nature of symptoms did not play a large part in affecting delay, although whether the patient was examined did affect delay. Median delay was 1.5 days (both rectal and abdominal examination) and 2.5 days (either type of examination) compared with 89.5 days in the 42 who had no physical examination. There was no association between duration of symptoms and likelihood of an examination.
Rubin 1992 UK A survey of general practices in the northern region of England which aimed to investigate the availability of investigative aids (proctoscope and sigmoidoscope)
326 general practices
234 (72%) practices reported having a proctoscope, which was used by all the partners in 182 (78% of 234), and by no partners in 11 (5%). Only 13 (4%) of the responding practices offered rigid sigmoidoscopy as a surgery procedure. No practice offered flexible sigmoidoscopy. 134 respondents (41%) were in favour of the use of these diagnostic aids. Others were in favour provided training was provided (32), or the skills already existed in the practice (36). 144 (44%) expressed opinions against their use in practices, saying they were not appropriate for primary care (35), or were a specialist procedure (28), standards would be difficult to maintain (35), and time was not available (20).

Suspected Cancer: Appendix J2 (June 2015) Page 60 of 264
Table 10 LOWER GASTROINTESTINAL CANCER: delay
Author Setting Description No. Inclusion Exclusion Results Quality
Byles et al, 1992
The study aimed to estimate the incidence of rectal bleeding in the community, and to determine the proportion of individuals who delay or fail to seek medical advice after a first episode of rectal bleeding. Interviews were conducted with individuals who had taken part in a large-scale general population survey of the health practices and attitudes of individuals, and who had admitted to a first episode of rectal bleeding within the last five years.
1213 239 people (20%) reported noticing rectal bleeding at some time in their life. Of the 77 individuals who had noticed a first occurrence of rectal bleeding more than three months but less than five years prior to the interview, 23 (30%) had either not sought medical advice or had only done so after a period of delay. The most commonly reported reason (52%) for delay or failure to consult was thinking that the bleeding was not serious and would clear up by itself. The second most frequently reported reason (13%) for delay or failure to seek care was the fear that the resultant tests would be unpleasant or embarrassing.

Suspected Cancer: Appendix J2 (June 2015) Page 61 of 264
Crossland and Jones, 1995
The study aimed to determine the prevalence of rectal bleeding in the community, and to examine factors that lead patients to consult their general practitioners about rectal bleeding using a questionnaire design.
1200 287 admitted to having noticed rectal bleeding at some time in their lives, and 231 had noticed it within the previous 12 months. Bleeding was most commonly reported by those aged under 50. Only 118 (41%) respondents who had noticed rectal bleeding had sought medical advice. Patients aged over 60 were most likely to have consulted a doctor, and those aged 40-60 were least likely to have done so (56% vs 34%, x² =7.67, P<0.022). Patients with blood in their stools were more likely to have consulted a doctor than were those who had seen blood on the paper only (53 vs 64, x²=17.109, P<0.001). 60 of the respondents (30 consulters, 30 non- consulters) who had experienced rectal bleeding in the previous 12 months were then interviewed in order to assess their reasons for consulting or not consulting a doctor. The most common reason given for consulting a doctor was worry that rectal bleeding might be a sign of serious disease, the next most common reason given was that the bleeding and associated symptoms were causing pain, discomfort or embarrassment. For others the consultation arose while consulting for another reason. The main reason for not consulting a doctor was the belief that the bleeding was not serious. Most non-consulters thought that haemorrhoids were the cause of their bleeding. Haemorrhoids were recognised as the most common cause for rectal bleeding by respondents in the two groups, while cancer was recognised as the second most important cause, also in both groups. Most respondents, whether they had consulted a doctor or not, had also discussed their rectal bleeding with a relative or friend before consulting a doctor.

Suspected Cancer: Appendix J2 (June 2015) Page 62 of 264
Dent et al, 1990
interviews were conducted with patients who consulted their general practioners about rectal bleeding in order to identify demographic or psychological factors, or beliefs or behaviours related to delay in presentation of rectal bleeding
93 Patients aged 35 years and older and who consulted their general practitioners because of rectal bleeding
Delay ranged from 0 to 249 days with a median of 7 days; 29% delayed more than 14 days. Delay was unrelated to age, sex, ethnic origin, competence in English, length of schooling, social status, availability of social support, psychological traits, and to the belief that the cause might be cancer. The proportions delaying more than 14 days were statistically significantly elevated among those who were not worried by the bleeding (47% delayed), those who did not regularly look at their faeces or the toilet paper after use (37%), and those who took some other action before presenting to their general practitioner (43%). The main reasons given for delay were that the patient believed the bleeding was caused by haemorrhoids, it was of minor concern, and that it was not convenient to see a doctor when the bleeding first occurred.
Funch, 1988 The researchers examined factors influencing symptom reporting in patients with colorectal cancer.
The number of symptoms reported spontaneously by the subjects in response to open-ended questions was compared with the total number of symptoms reported using this technique plus a variety of other techniques.
294 Subject characteristics associated with spontaneous reporting were higher socio- economic status (SES), better prior health status, and psychological status (more depressed) at the time of the interview; age and sex were not related to symptom characteristics, with symptoms that were severe, unusual, and developed quickly being reported more often. Incomplete symptom reports also were associated with inaccurate estimates of patient delay.
Goodman and Irvin, 1993
An examination of the case records of patients with carcinoma of the right colon to assess the incidence of delays in the treatment, reasons for the delay and effects on survival.
152 Treatment of right-sided colonic cancer was delayed for more than 12 weeks in 61 patients (40%). The factors involved in delay included late presentation to the GP (17 patients), failure of the practitioner to investigate or refer the patient (18), and failure of hospital clinicians to investigate or diagnose the illness (36). The most common error on the part of GPs was failure to determine the cause of iron-deficiency anaemia (16), which was also a frequent error (17) during hospital management if the anaemia was an incidental finding during treatment of another illness.
Holliday and Hardcastle, 1979
Interviews were conducted with patients admitted to hospital with colon or rectal carcinomas. Data was recorded on the following: : total duration of symptoms, delay in presentation to the family doctor, number of visits to the family doctor, type of clinical
200 Mean delay between the onset of symptoms and treatment was 30.5 weeks in a hundred patients with colon carcinoma, and 38 weeks in a hundred patients with rectal carcinoma. Most of this delay occurred outside hospital, and delays attributable to the patient and family doctor were almost equal

Suspected Cancer: Appendix J2 (June 2015) Page 63 of 264
Author Setting Description No. Inclusion Exclusion Results Quality
examination performed, and department to which the patient was referred.
in duration. Patient delay was largely the result of not knowing the importance of bowel symptoms, while delay with the family doctor was the result of not examining patients with possible rectal carcinomas and not recognising symptoms suggestive of colon carcinoma. There was no relation between the duration of symptoms and the Duke’s stage of the tumour.
Jones, 1976 A survey was conducted with a randomly selcted population in order to gain an insight into people’s beliefs and perceptions of what constitutes “normal bowel habit”
Participants interviewed about a standard set of outcomes.
The majority of respondents had a set pattern for their bowel habit; of these 80% had one bowel motion per day; the majority realised that a severe change in bowel habit should lead them to consulting a doctor 24% had noticed blood on their bowel motions and 32% had noticed blood on the toilet paper. There were deficiencies in the understanding of the terms diarrhoea and constipation. The majority of patients treated themselves for slight changes in bowel habit.
Macadam, 1979
Patients admitted to hospital with gastrointestinal cancer were interviewed as soon as possible in order to explore their presenting symptoms, and delay in diagnosis and treatment.
Responses were compared with hospital records and General Practitioners’ recollections.
150 In approximately 50% of cases there was an interval of weeks between the patient consulting the general practitioner and being referred for hospital investigation. No association was demonstrated between delay and social class, age, physical isolation, or the regular consulting rate of the patient.
MacArthur and Smith, 1984
Interviews were conducted with patients with large bowel cancer that had recently received treatment in order to identify factors associated with delay in presentation, diagnosis and referral to treatment (patient delay, general practitioner delay, and hospital delay). Further data were obtained from general practitioners and abstracts from case notes.
127 45% of patients had consulted within a month, although few did so within a week of first noticing their symptoms. 28% delayed more than three months before consulting a doctor. The was no associations between personal characteristics such as age or social class and patient delay. Personal advice to go to the doctor was important in reducing delay. Patients with abdominal pain, or nausea and vomiting as an initial symptom, went more quickly to the doctor; those with both these symptoms went most quickly. Symptoms associated with long delay were loss of weight and rectal discomfort or pain. Patients with cancer of the colon were more likely to experience the symptoms of abdominal pain and vomiting, and this explains why they delay less than patients with rectal cancer. Only 32% of patients in this study were referred to a specialist immediately. 30% of the patients were delayed for longer than three months. Mean delay was 120.5 days and median delay 25.3 days.

Suspected Cancer: Appendix J2 (June 2015) Page 64 of 264
Author Setting Description No. Inclusion Exclusion Results Quality
There was a little more delay in patients with cancer of the rectum than colon. The nature of the symptoms the patient presented to the doctor did not play a large part in affecting this phase of delay; patients with constipation were referred a little more quickly than patients with diarrhoea or those with only one symptom. Patients from the manual social classes also waited a little longer than middle class patients. Examination of patients by the doctor at the first consultation was found to be associated with the speed of referral. Median delay for patients who had been examined was 1.5 compared with 89.5 days in the 42 cases where no physical examination took place. A longer duration of symptoms did not seem to prompt the doctor into more immediate action. Most patients (90.5%) reported that they had not considered cancer as a possible cause of their symptoms and had delayed consulting their doctor until such symptoms became either more severe or more persistent. The only patients who consulted quickly were those whose symptoms produced considerable initial discomfort.
MacDonald and Freeling,1986
A questionnaire was mailed to a randomly selected sample of patients regarding their experience and beliefs concerning bowel habit, their understanding of the terms “regular”, “diarrhoea”, “constipation”, and what they would do if they had a change in bowel habit.
266 Randomly selected patients aged 55 years and above, registered at a group general practice.
10% of the respondents reported no predictable frequency of movement, with women more likely to report so (14% vs 5%). 79% believed that a daily movement is important and 90% that “regularly” is necessary for good health. 14% were dissatisfied with their bowel habits and 16% regularly self- treated. 95% gave reasonable definitions of “regular” and “diarrhoea”, 10% were unsure about the definition of “constipation”. Although 76% believed there were bowel symptoms that require immediate medical attention, 98% would in the first instance treat themselves for constipation, 90% for diarrhoea, and 25% for rectal bleeding. Bowel symptoms for which a doctor should be seen without delay included passing blood (41%), pain (19%), constipation (16%), diarrhoea (12%), and “anything unusual” (9%). A third of respondents had consulted a doctor about their bowels at some time prior to the questionnaire. A greater proportionof those aged 65-74 years had done so than those in other age groups. Reasons for which they consulted were: constipation (25%), pain (21%), bleeding (12%), diarrhoea (12%), and piles (9%). All comparisons significant P<0.05
Mor et al, 1990)
Patients with a hospital diagnosis of lung, breast, and colorectal cancer were
24.6% of patients who reported noticing symptoms prior to diagnosis delayed longer than three

Suspected Cancer: Appendix J2 (June 2015) Page 65 of 264
Author Setting Description No. Inclusion Exclusion Results Quality
interviewed at home and then twice via the telephone for follow-up over a one-year period following diagnosis in an attempt to investigate the determinants of cancer symptom recognition and delay in seeking medical care.
months in seeking medical care. No demographic or social support factors were predictive of symptom recognition or delay, with the exception that older patients with colorectal cancer were less likely to notice symptoms, but also less likely to delay (patients in the youngest age category were almost three times more likely to delay than patients in the oldest age category; OR=2.76; 95% CI=1.10,6.91). Patients with more advanced disease at diagnosis were less likely to delay (p<0.5), as were also those with another chronic disease (p<0.5).
NHS Executive, 1997
The authors of this guidance undertook a systematic review of studies that examined reasons for the delay between the onset of symptoms of colon or rectal cancer and treatment
12 retrospective observational studies that gave figures for delay were identified
Relatively short delays by clinicians appeared to be linked with active encouragement to investigate all cases in which there is any suspicion of cancer. Some GP delay appeared to be due to misdiagnosis, most commonly the assumption that symptoms were caused by haemorrhoids. Inadequate investigation, notably of anaemia, could increase delay. There was evidence of failure by some GPs to carry out adequate rectal examination, leading to delay. In studies that investigated patients’ reasons for delaying consulting, respondents were most likely to report that they did not consider that their symptoms were likely to signify serious illness. Hospital delay may be caused by false negative results of investigations such as barium enema and endoscopy.
Potter and Wilson, 1999
A one-year retrospective audit carried out in a specialist teaching hospital to calculate the time to diagnosis for colorectal cancer from first hospital attendance, and to identify any remedial factors felt to contribute to an undue delay in diagnosis
The authors inspected the hospital records of patients who were undergoing surgical resection for colorectal carcinoma.
59 Twenty patients (34%) waited more than 30 days for their diagnosis. Incomplete examination or initial referral to a non-surgical specialty appeared to contribute to this delay: 14 patients (70%) were initially referred to a medical specialty. Rectal examination was documented in 23 (39%) GP referrals and 52 (88%) the hospital case notes at initial consultation. The reason for the delay in diagnosis was deciding on an alternative diagnosis leading to no initial gastrointestinal investigation in 13 patients; in 7 patients, despite initial suspicion of colorectal cancer with gastrointestinal investigation, the diagnosis was missed (of these patients, four were incompletely investigated as recommended by guidelines current at the time of the study). The GP had organised a colonoscopy or barium enema for 13 patients (22%) prior to referral. The same investigations were arranged after first hospital consultation in 34 (58%)

Suspected Cancer: Appendix J2 (June 2015) Page 66 of 264
Author Setting Description No. Inclusion Exclusion Results Quality
patients. Pullyblank et al, 2002
A questionnaire was administered to patients attending one-stop breast/ rectal bleeding clinics in order to identify their knowledge of breast and colorectal cancer symptoms, as well as their source of information
78 37% patients could name a colorectal cancer symptom. The symptoms most commonly cited were: bleeding (66%), change in bowel habit (45%), melaena (10%), and abdominal pain (17%). There was a positive association between knowledge of bowel cancer and female gender. There were no significant differences between knowledge of bowel cancer symptoms between men and women. TV/radio was the most common source of information. There was a strong association between knowledge of rectal cancer and a relevant history in a family member or friend.
Ratcliffe et al, 1989
The aim of this study was to examine delay in patients with colorectal cancer, those with risk factors and those with diverticular disease, and to assess the influence of delay on stage of disease at presentation, and patient survival.
Patients with large bowel cancer were interviewed about the history, duration of symptoms, and family history. Information regarding site of the tumour and Duke’s staging were recorded from the operation notes
Left-sided cancers had a significantly shorter general practitioner delay. There were no significant differences between total delay times for patients with risk factors, family history or diverticular disease and those patients without risk factors or diverticular disease (patients with risk factors had previously had a colon cancer or adenomatous polyps removed, or the diagnosis of ulcerative colitis, or Crohn’s disease established). There was no significant difference in delay times between the three Duke’s stages.
Rowe-Jones and Aylett, 1965)
patients with carcinoma of the colon or rectum who attended a hospital clinic were interviewed and their case notes analysed to examine where diagnostic delay occurred
200 For patients with colon cancer, symptoms were on average present for seven months with a standard deviation of 5.3 months (patient delay). Medical delay occurred in 22% of the patients, 68% of those at the hospital and 32% (7 patients) with the general practitioner. The average delay was 7.8 months, hospital delay 7.9 months, general practitioner delay 7.7 months). Of the seven cases with general practitioner delay, rectal examination was only carried out in one patient. In patients experiencing medical delay, a more advanced stage of disease was statistically significantly more likely (P=0.025) at the time of treatment. For patients with rectal cancer, symptoms were on average present for 10.3 months (standard deviation 8.82 months) before seeking medical advice. Medical delay occurred in 22% of cases. In contrast with cancer of the colon, the delay in rectal carcinoma was mainly with the GP. In 82% of those experiencing delay, the delay was due to the general practitioner, and in the remaining 18% to delay at the hospital. The principal reason for

Suspected Cancer: Appendix J2 (June 2015) Page 67 of 264
Author Setting Description No. Inclusion Exclusion Results Quality
GP delay was that in 18 patients with bowel symptoms, only two underwent a rectal examination, although all returned at least once to their GP with continuing symptoms of bleeding, or constipation, or diarrhoea, or with a lump. The commonest problem was the presumptive diagnosis of haemorrhoids as the cause of bleeding without any examination. As in patients with colon cancer, a more advanced stage of disease at the time of treatment was significantly more common in those who experienced medical delay (p<0.025).

Suspected Cancer: Appendix J2 (June 2015) Page 68 of 264
Young et al, 2000
A retrospective observational study assessed the incidence and reasons for delay in the diagnosis of colorectal cancer, and the effects of delay, gender, age and tumour site on the stage of disease. Data was collected over a one year period in relation to: principal presenting symptoms, time to first presentation to a doctor, time to diagnosis and treatment, reasons for delay, diagnostic procedures, tumour site, operation, and Australian clinicopathological stage of the tumour.
100 Only symptomatic patients with invasive adenocarcinoma who underwent excisions of their tumours were included in the study.
34 patients were diagnosed and treated more than three months from the onset of symptoms. The overall distribution of delay did not differ significantly between male and female patients, although men were more likely to have patient- related delay (31% of men vs 10% of women; Fisher’s exact test, P=0.011). The mean age of the delay group was not significantly different to the non-delay group (mean: 69.4 vs 71.0 years; t=0.63, d.f.=98; P=0.53). In the 18 patients with patient-related delay alone, 16 were due to a delay in presentation. Reasons included: not seeking medical help until the symptoms (bleeding, abdominal pain, anaemia) were severe (4); not being concerned by symptoms (change in bowel habit, abdominal pain) (4); assuming that bleeding was due to haemorrhoids (2), hoping that the bleeding would go away (1), and no reason at all (5). The others had refused investigations recommended by their doctors after initial visits, and both delayed for 24 months. Of the patients with doctor-related delay alone,symptoms had not been adequately investigated or had an incorrect original diagnosis or the doctor was slow to investigate symptoms. Three patients experienced delay because an initial rectal examination was not performed. One sigmoid cancer was missed on barium enema with a resulting 11.5 month delay; another cancer was missed on colonoscopy with an 11 month delay. One other patient failed to be diagnosed on both colonoscopy and barium enema which resulted in a 12 month delay. All 13 patients with doctor- related delay alone had presented within three months from the onset of symptoms. For the three other patients with patient-related and doctor-related delay (>6 months total delay), the delay was a combination of the patient’s failure to seek help early enough because of competing pressures or misperception of the symptoms’ significance, and the doctor’s incorrect initial diagnosis or slowness to investigate.

Suspected Cancer: Appendix J2 (June 2015) Page 69 of 264
Table 11 BREAST CANCER: signs and symptoms, including risk factors
Author Setting Description No. Inclusion Exclusion Results Gold Std
Quality
All Wales Minimum Standards, 2000
Standard 10 stipulated that there should be a mechanism to provide general practitioners with rapid access to an appropriate specialist, urgent referrals being seen within 10 working days of receipt of the referral by the hospital. The Standards did not include guidance on the presenting symptoms or signs.

Suspected Cancer: Appendix J2 (June 2015) Page 70 of 264
Austoker and Mansel, 2003
These guidelines quoted Barclay et al (1991) and Cochrane et al (1997).
Cochrane et al (1997) reported that of 2332 new patients presenting to a breast clinic, 147 had symptomatic carcinomas. The symptoms and signs reported by the general practitioners in patients referred with carcinoma were: lumps (90%), painful lumps (21%), nipple discharge (3.4%), nipple change (10.2%), skin contour change (4.8%), any family history (6.1%). The guidelines recommended urgent referral for patients with a discrete lump in the appropriate age group, or definite signs of cancer such as: ulceration, skin nodule, skin distortion (<3 months). Nipple discharge or pain in the absence of a lump were said to be much less common presentations of breast cancer. Conditions requiring referral, but not urgently, were: lump (in women <30yrs, asymmetrical nodularity persisting after menstruation, abscess, persistently refilling or recurrent cysts); pain (intractable, not responding to reassurance, simple measures such as wearing a well supporting bra and common drugs); nipple (age<50 with bilateral discharge sufficient to stain clothes); discharge (age<50 with bloodstained discharge, age>50 with any nipple discharge).
Barclay et al, Case series in which information 940 women The median age of those with

Suspected Cancer: Appendix J2 (June 2015) Page 71 of 264
Author Setting Description No. Inclusion Exclusion Results Gold Std
Quality
1991 was collected about women referred to breast or surgical outpatient clinics in a 10 year period.
with breast cancer.
benign disease was 35 years, but for those with cancer the median age was 57 years. The majority (91%) of referrals to the breast unit for benign disease occurred in patients under 55 years. Among those with cancer, a visible abnormality was noted in the left breast in 362 patients, and the right breast in 320 patients. The most common observed abnormalities were asymmetry (68%), nipple abnormalities (43%) and skin changes (7%). Of those diagnosed with breast disorders, 15% reported a family history of breast cancer, compared with only 18% of the 940 who had cancer reporting family history.
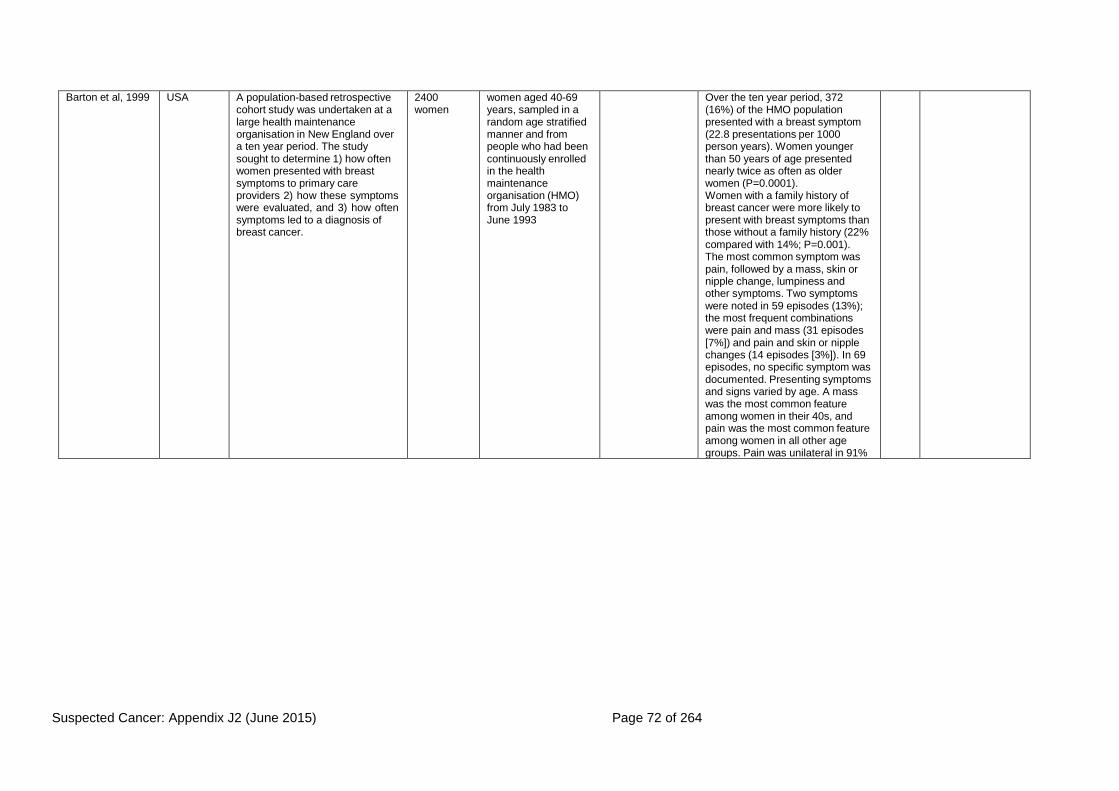
Suspected Cancer: Appendix J2 (June 2015) Page 72 of 264
Barton et al, 1999 USA A population-based retrospective cohort study was undertaken at a large health maintenance organisation in New England over a ten year period. The study sought to determine 1) how often women presented with breast symptoms to primary care providers 2) how these symptoms were evaluated, and 3) how often symptoms led to a diagnosis of breast cancer.
2400 women
women aged 40-69 years, sampled in a random age stratified manner and from people who had been continuously enrolled in the health maintenance organisation (HMO) from July 1983 to June 1993
Over the ten year period, 372 (16%) of the HMO population presented with a breast symptom (22.8 presentations per 1000 person years). Women younger than 50 years of age presented nearly twice as often as older women (P=0.0001). Women with a family history of breast cancer were more likely to present with breast symptoms than those without a family history (22% compared with 14%; P=0.001). The most common symptom was pain, followed by a mass, skin or nipple change, lumpiness and other symptoms. Two symptoms were noted in 59 episodes (13%); the most frequent combinations were pain and mass (31 episodes [7%]) and pain and skin or nipple changes (14 episodes [3%]). In 69 episodes, no specific symptom was documented. Presenting symptoms and signs varied by age. A mass was the most common feature among women in their 40s, and pain was the most common feature among women in all other age groups. Pain was unilateral in 91%

Suspected Cancer: Appendix J2 (June 2015) Page 73 of 264
Author Setting Description No. Inclusion Exclusion Results Gold Std
Quality
of episodes and bilateral in 9% of episodes. On physical examination, the clinicians found a mass in 184 episodes (34%), skin changes or nipple discharge in 43 episodes (8%), fibrocystic changes in 112 episodes (21%) and other findings in 32 episodes (6%). More than one finding was documented in 45 episodes and no specific findings were documented in 214 episodes (40%). Of the 196 episodes in which a patient reported a mass, the clinician confirmed the mass in 160 (82%). Of the 343 episodes in which mass was not one of the patient’s symptoms, the clinician documented a mass in 24 (7%).
Bywaters, 1977 UK, Primary Care
This study involved general practitioners in a UK practice recording consultations for breast problems from women.
6 GP’s
180 women.
Records of female patients who had consulted with any breast problem between October 1972 and December 1974
Records for women that had died or left the area.
28 of the 180 had cancer (18 new cases -10%); All these were aged 30 or over. Of 57 patients seen with a discrete lump, 32 (56.1%) were referred immediately.
Centre for Reviews and Dissemination, 2002
Systematic review of randomised controlled trials.
This Service Guidance Evidence review did not find any studies of the effectiveness of routine physical breast examination in self- presenting well women in the primary care setting. The review identified two large randomised controlled trials, a non-randomised trial, two cohort studies and three case control studies but no reliable evidence to suggest that breast self-examination (BSE) among asymptomatic women reduces mortality rates from breast cancer. In fact some evidence suggested that BSE can do harm through increased rates of biopsy for benign lesions.
Chalabian and Dunnington, 1998
USA This study involved graduating primary care physicians,
66 graduating
Not mentioned Participants who were unable to
The correlation detected between lump detection and examination

Suspected Cancer: Appendix J2 (June 2015) Page 74 of 264
Author Setting Description No. Inclusion Exclusion Results Gold Std
Quality
assessing the link between observed breast examination skills during an objective structured clinical examination (OSCE) and ability to detect lumps in silicone models.
primary care physicians.
complete all phases of the examination.
skills, although statistically significant, was only 0.34. No relationship was found between breast model sensitivity and specificity. Although the authors commented that thorough clinical breast examinations are imperative as they can identify 10% of breast cancers not visible on mammograms {763}, no specific manoeuvres or techniques could be recommended.
Collaborative Group on Hormonal Factors in Breast Cancer, 2002
an analysis of individual data from 47 epidemiological studies in 30 countries to estimate the association between breastfeeding patterns and childbearing with breast cancer.
For women who had never breastfed, the relative risk of breast cancer declined by 3% for each year younger they were when their first child was born. The relative risk of breast cancer decreased by 4.3% for every 12 months of breastfeeding (not necessarily consecutively) in addition to a decrease of 7% for each birth. The size of the decline in the relative risk of breast cancer associated with breastfeeding did not differ significantly for women in developed and developing countries, and did not vary significantly by age, menopausal status, ethnic origin, the number of births or age when the first child was born. It is estimated that the cumulative incidence of breast cancer in developed countries would be reduced by more than half, from 6.3 to 2.7 per 100 women by age 70, if women had the average number of births and lifetime duration of breastfeeding that had been prevalent in developing countries until recently.
DoH, Referral Guidelines for Suspected Cancer, 2000
The guidelines for urgent referral of patients with suspected breast cancer in these Department of Health Guidelines are based on those set out in Guidelines for Referral of Patients with Breast
Recommendations were concerned with the urgency of referral. Symptoms such as having a discrete lump and being in the appropriate age group (>30) were considered to be cases for an

Suspected Cancer: Appendix J2 (June 2015) Page 75 of 264
Author Setting Description No. Inclusion Exclusion Results Gold Std
Quality
Problems (1999) prepared by J. Austoker and R. Mansel under the auspices of the NHS Breast Screening Programme and the Cancer Research Campaign.
urgent referral as well as those with signs suggestive of cancer including ulceration, skin nodule, skin distortion, nipple eczema, recent nipple retraction or distortion. Conditions that require referral but not necessarily urgently, included lumps in younger women and Asymmetrical nodularity that persists at review after menstruation, abscess and a persistently refilling or recurrent cyst, pain and nipple discharge.

Suspected Cancer: Appendix J2 (June 2015) Page 76 of 264
Giordano et al, 2002
-- A systematic review. Published studies on the epidemiology, risk factors, genetics and pathology of breast cancer in men were sought using Cancer Lit, Medline and study bibliographies to identify articles.
-- Articles published between 1942-2000
-- The review reposted that The incidence of breast cancer in men has remained stable in the past 40 years, and the median age at diagnosis is 68 (compared to 63 in women). However, the disease has been reported in males from ages 5 to 93 years. The incidence increases exponentially with age. Breast cancer in men may be hormonally driven, as in women. Risk factors include: testicular abnormalities (undescended testis, congenital inguinal hernia, orchidectomy, orchitis, testicular injury); infertility; Klinefelter syndrome; positive family history; benign breast conditions (nipple discharge, breast cysts, breast trauma); radiation exposure; increasing age; Jewish ancestry. The rate of gynaecomastia in men with breast cancer is similar to the rate in the general population. Approximately 90% of all breast tumours in men are invasive carcinomas, the remaining 10% being non-invasive Approximately 85% (ranging between 50-97% in different studies) of affected men present with a painless subareolar mass. Other common signs include nipple retraction (10-51%), local pain (4-20%), nipple ulceration (4- 17%), nipple discharge (1-12%),
No primary studies are included in this evidence review as the systematic review of Giordano et al is recent and comprehensive.
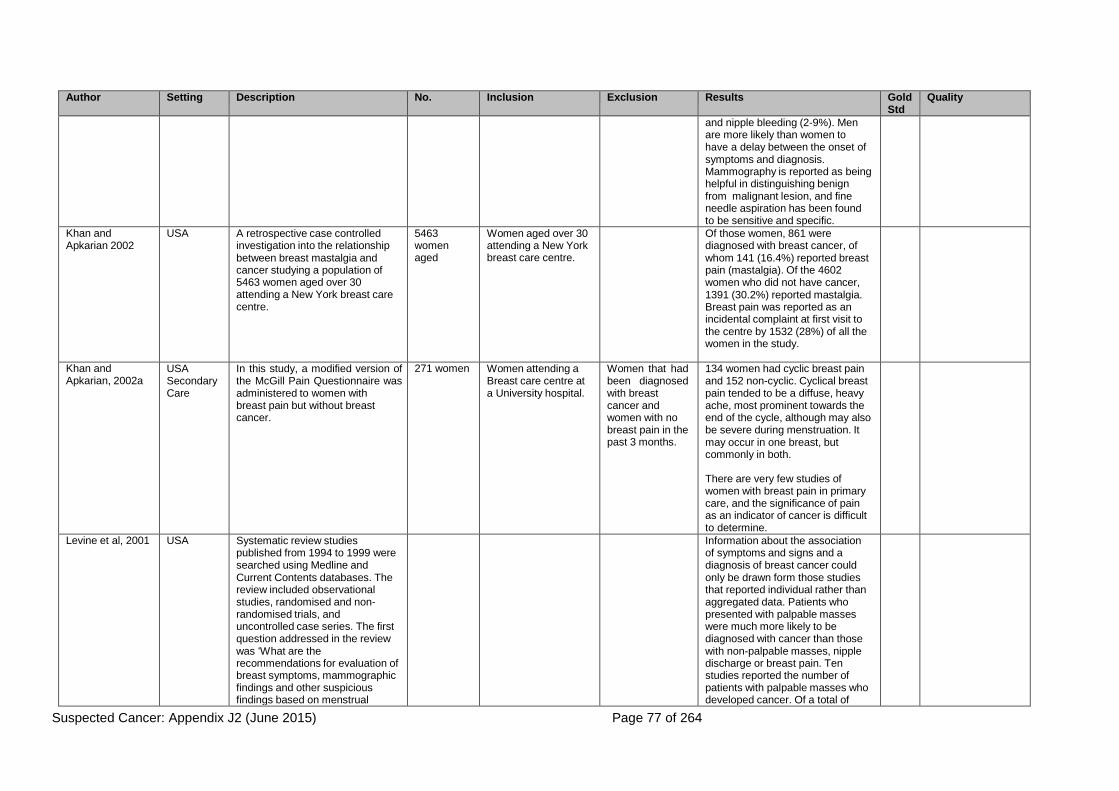
Suspected Cancer: Appendix J2 (June 2015) Page 77 of 264
Author Setting Description No. Inclusion Exclusion Results Gold Std
Quality
and nipple bleeding (2-9%). Men are more likely than women to have a delay between the onset of symptoms and diagnosis. Mammography is reported as being helpful in distinguishing benign from malignant lesion, and fine needle aspiration has been found to be sensitive and specific.
Khan and Apkarian 2002
USA A retrospective case controlled investigation into the relationship between breast mastalgia and cancer studying a population of 5463 women aged over 30 attending a New York breast care centre.
5463 women aged
Women aged over 30 attending a New York breast care centre.
Of those women, 861 were diagnosed with breast cancer, of whom 141 (16.4%) reported breast pain (mastalgia). Of the 4602 women who did not have cancer, 1391 (30.2%) reported mastalgia. Breast pain was reported as an incidental complaint at first visit to the centre by 1532 (28%) of all the women in the study.
Khan and Apkarian, 2002a
USA Secondary Care
In this study, a modified version of the McGill Pain Questionnaire was administered to women with breast pain but without breast cancer.
271 women Women attending a Breast care centre at a University hospital.
Women that had been diagnosed with breast cancer and women with no breast pain in the past 3 months.
134 women had cyclic breast pain and 152 non-cyclic. Cyclical breast pain tended to be a diffuse, heavy ache, most prominent towards the end of the cycle, although may also be severe during menstruation. It may occur in one breast, but commonly in both.
There are very few studies of women with breast pain in primary care, and the significance of pain as an indicator of cancer is difficult to determine.
Levine et al, 2001 USA Systematic review studies published from 1994 to 1999 were searched using Medline and Current Contents databases. The review included observational studies, randomised and non- randomised trials, and uncontrolled case series. The first question addressed in the review was ‘What are the recommendations for evaluation of breast symptoms, mammographic findings and other suspicious findings based on menstrual
Information about the association of symptoms and signs and a diagnosis of breast cancer could only be drawn form those studies that reported individual rather than aggregated data. Patients who presented with palpable masses were much more likely to be diagnosed with cancer than those with non-palpable masses, nipple discharge or breast pain. Ten studies reported the number of patients with palpable masses who developed cancer. Of a total of

Suspected Cancer: Appendix J2 (June 2015) Page 78 of 264
Author Setting Description No. Inclusion Exclusion Results Gold Std
Quality
status, use of hormone replacement therapy (HRT), pregnancy, age, and family history?’
2027 patients with masses, 303 (14.9%) had cancer. Six studies reported patients with ‘lesions’ as clinical findings; of 1094 with lesions, 358 (32.7%) were cancer. Four studies reported on nipple discharge, and among the total of 570 patients with discharge, 18 (3.2%) had cancer. Only two studies reported the incidence of cancer in association with breast pain, the proportions being seven of 216 (3.2%) in one study, and four of 221 (1.8%) in another.
Newton et al, 1999
UK, Primary Care
Case series collecting data prospectively from women consulting general practitioners in Sheffield over a four-week period between January and July 1995. The general practitioners used a standard pro-forma to record information about women consulting primarily for a breast problem.
508 women
248 GP’s
GP’s were asked to complete standardised pro forma for all women consulting primarily for a breast problem during a four week recording period.
The pro-formas were not completed for women who had a breast examination as part of a consultation for any other reason.
Referral rates increased according to patient age: 16-39 32.6%, 40-49 38.7%, 50-64 40.6%, 65+ 50.0% The mean number of consultations was 2.05 over the four week period, suggesting that a general practitioner would see 15.8 women with new breast problems in one year. However, this figure excludes women who consulted for primarily other problems but also had a breast problem.
NICE: The Classification and care of women at risk of familial breast cancer 2004
This evidence based guideline is limited to women over 18 who have not been previously diagnosed with breast cancer. The evidence searches were wide ranging and papers were graded according to NICE specifications, while quality of studies was assessed using modified SIGN checklists.
The guideline states that although most breast cancer occurrences are random, in 16-19% of cases a family history of the disease is identifiable. The probability of a 20 year old woman developing breast cancer by 80 increases with the incidence of breast cancer within her family. With no affected relatives the risk is 7.8%, with 1 13.3%, and with 2 21.1%
The evidence used in assessing the specific risk factors of breast cancer evaluated by the guideline was of varying quality. findings and subsequent recommendations were provided
Nichols et al, 1980
UK, Primary Care
Case series in which general practitioners were recruited in Southampton to record in a booklet all women seen with
193 GP’s All NHS GP’s and trainees practising in the city of Southampton were
Those that declined, were unavailbel or were about to
There were 331 consultations recorded by 323 women for breast conditions (mean: 3.5 per general practitioner). Of those consultations

Suspected Cancer: Appendix J2 (June 2015) Page 79 of 264
Author Setting Description No. Inclusion Exclusion Results Gold Std
Quality
breast symptoms over four weeks. invited to participate. leave the practice.
241 were for new episodes
Patel et al, 2000 Scotland Primary/ secondary Care
a prospective case series involving new patient referrals from general practitioners to a specialist breast clinic. The aim was to assess the number of unnecessary referrals to a specialist breast clinic.
321 patients
All referral letters sent to a breast clinic.
Screening patients, tertiary referrals and patients who failed to attend their first clinic appointment.
10% had breast cancer and 90% had either benign disease or no pathology. For those with breast cancer, features were: lump/nodularity (91%), nipple change (6%), axillary lump (3%). For those without breast cancer the features were, lump (60%), pain (19%), discharge/ change (8), family history only (4%), anxiety only (1%), other (8%) The study concluded that one third of the referrals were inappropriate.
Roberts et al, 1987
Scotland Secondary Care
This was a study to ascertain the effects of a recent health campaign on the number of general practitioner consultations for breast problems. The study involved giving each patient consulting with breast problems a questionnaire
262 women Questionnaires were completed only for women who had consulted primarily about their breast.
Women having a breast examination associated with contraceptive care or routine cervical cytology tests
124 presented with pain, 93 with a lump, 3 with discharge, and 40 with ‘other symptoms’
Steering Committee on Clinical Practice Guidelines for the Care and Treatment of Breast Cancer, 1998
a Canadian evidence-based guideline to assist decisions in excluding or confirming the presence of cancer when a breast lump is detected. The guidelines were based on published evidence supplemented by expert opinion. Articles were identified through a database search using MEDLINE (from 1966) and CANCERLIT (from 1985) to January 1996. A non systematic review of breast cancer literature continued to January 1997
The guidelines made recommendations on how to establish a reliable diagnosis using the minimum of procedures. Evidence graded I-III was used as far as possible, but when experimental evidence was weak or lacking, the opinion of respected authorities (level IV) was employed. Most lumps are not caused by cancer, but the possibility of malignancy must always be considered.

Suspected Cancer: Appendix J2 (June 2015) Page 80 of 264
Table 12 BREAST CANCER: investigations
Author Setting Description No. Inclusion Exclusion Results Gold Std Quality
All Wales Minimum Standards, 2000
Standard 11 requires that all diagnostic tests are carried out in one visit. The standard related to patients referred to and attending specialist services.
Austoker and Mansel, 2003
These guidelines did not suggest any primary care investigations before referral in patients presenting with a breast lump, breast pain, or severe cyclical mastalgia. In the case of nipple discharge in women less than 50 years of age, a test for blood was advised if the discharge is from multiple ducts. Referral was recommended when the test is positive. Other investigations, including triple assessment, were restricted to patients who had been referred, the investigations being carried out by the specialist.
Duijm et al, 1998a
Netherlands Secondary Care
In a study of women with a painful breast referred to the radiology department of a Netherlands hospital between 1992-1996, follow up was undertaken for two years
987 women All women aged 30 years or older referred by GPs for breast imaging to a radiology department between 1
st
January 1992 and 1
st October 1994.
84.1% of the sample had been referred by general practitioners. The findings were compared with a control sample of 987 asymptomatic women undergoing a screening mammogram. Four (0.4%) of the women with pain were diagnosed with cancer, in comparison with seven (0.7%) of the controls. Mammograms were classified as suspicious or malignant in only 1.2% of the symptomatic cases.
a recorded diagnosis of breast cancer during follow up

Suspected Cancer: Appendix J2 (June 2015) Page 81 of 264
Duijm et al, 1998b
Netherelands The study investigated the role of follow-up mammography of nonpalpable probably benign lesions.
987 women referred for radiological breast examination and 987 controls.
All women with a painful breat(s) referred by GPs or the hospital specialists to the radiology department of a teaching hospital
between 1st
January 1992 and 1
st January 1996
Any patienst whose letter of referral mentioned a palpable lesion in the painful breast and patients with a history of breast cancer or breast augmentation.
Routine screening mammograms may identify nonpalpable, probably benign lesions in 3%-11% of cases, and a proportion of these may eventually prove to be cancer.
it was difficult to ensure that all women were tested at appropriate intervals, and the recommended follow up was achieved in only 29.4% of the included 163 women. Consequently, the study does not provide sufficient evidence about the value of follow-up mammography in women found to have nonpalpable benign lesions on screening mammography.
DoH, Referral Guidelines for Suspected Cancer, 2000
The guidelines do not make any recommendations about investigations in the management of women presenting to primary care with breast problems.
Mansson and Bengtsson, 1992
Sweden Primary care
The primary care records of women with a diagnosis of breast cancer between 1981 and 1983 in Kungsbacka in Sweden were reviewed. Information was collected about the investigations ordered before diagnosis.
62 women All women with a diagnosis of breast cancer
-- The article does not report the number of women who underwent laboratory investigations, but notes that 12 (19%) were found to have an elevated erythrocyte sedimentation rate, eight (13%) had anaemia, and six (10%) had a leucocytosis.
The authors concluded that haematology and erythrocyte sedimentation tests did not assist in the diagnosis of breast cancer.
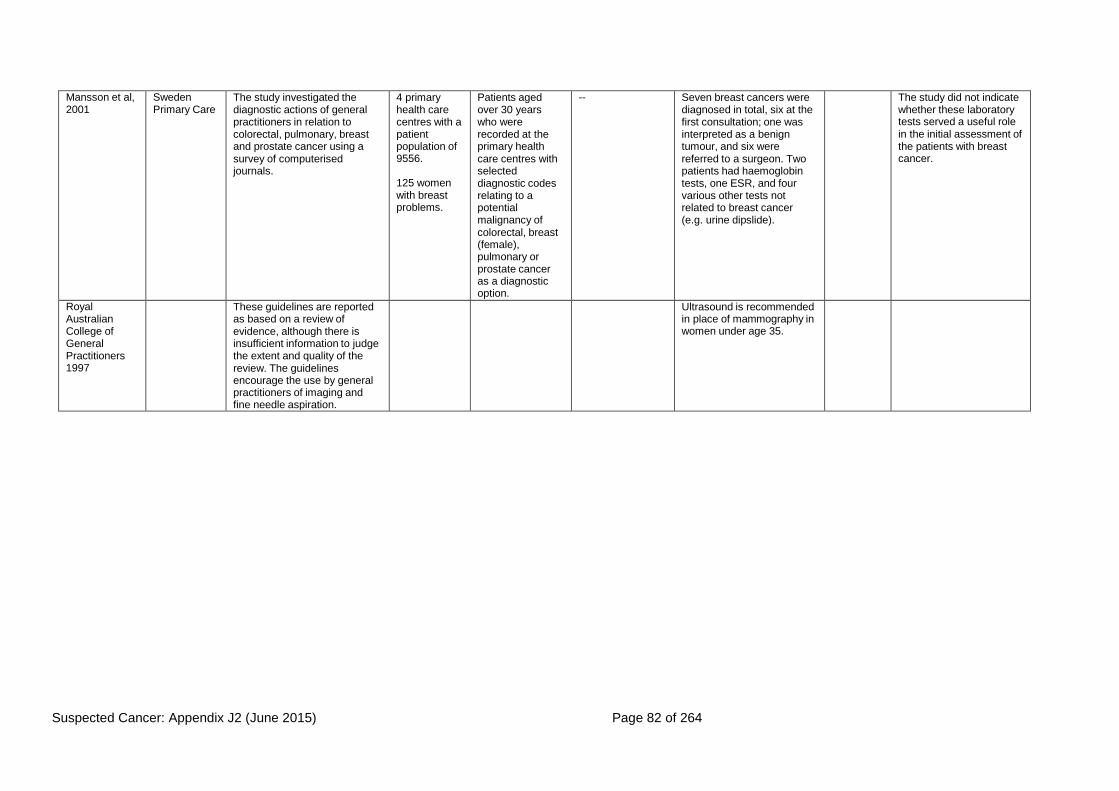
Suspected Cancer: Appendix J2 (June 2015) Page 82 of 264
Mansson et al, 2001
Sweden Primary Care
The study investigated the diagnostic actions of general practitioners in relation to colorectal, pulmonary, breast and prostate cancer using a survey of computerised journals.
4 primary health care centres with a patient population of 9556.
125 women with breast problems.
Patients aged over 30 years who were recorded at the primary health care centres with selected diagnostic codes relating to a potential malignancy of colorectal, breast (female), pulmonary or prostate cancer as a diagnostic option.
-- Seven breast cancers were diagnosed in total, six at the first consultation; one was interpreted as a benign tumour, and six were referred to a surgeon. Two patients had haemoglobin tests, one ESR, and four various other tests not related to breast cancer (e.g. urine dipslide).
The study did not indicate whether these laboratory tests served a useful role in the initial assessment of the patients with breast cancer.
Royal Australian College of General Practitioners 1997
These guidelines are reported as based on a review of evidence, although there is insufficient information to judge the extent and quality of the review. The guidelines encourage the use by general practitioners of imaging and fine needle aspiration.
Ultrasound is recommended in place of mammography in women under age 35.

Suspected Cancer: Appendix J2 (June 2015) Page 83 of 264
Steering Committee on Clinical Practice Guidelines for the Care and Treatment of Breast Cancer, 1998
These guidelines were based on a systematic review of evidence (Medline from 1966, Cancerlit from 1985, through to 1996). However, the studies cited were not confined to those involving patients in primary care.
Mammography was found to be unlikely to give useful information in younger women, although is more useful from aged mid-30s. The overall level of sensitivity of mammography was reported as possibly no higher than 82% (level III evidence), and therefore a normal mammogram cannot exclude cancer. The guideline indicated that fine needle aspiration can be carried out in office settings, and that cytologic examination should be ordered if the obtained fluid is bloody. Success in obtaining satisfactory samples, however, is operator dependent. The false negative rate in one reviewed study had been 15.2%. When physical examination, mammography and cytology are combined, the diagnosis is likely to be confirmed in 99% of cases in which all three tests are positive; cancer will be found in 0.5% of cases if all tests are negative
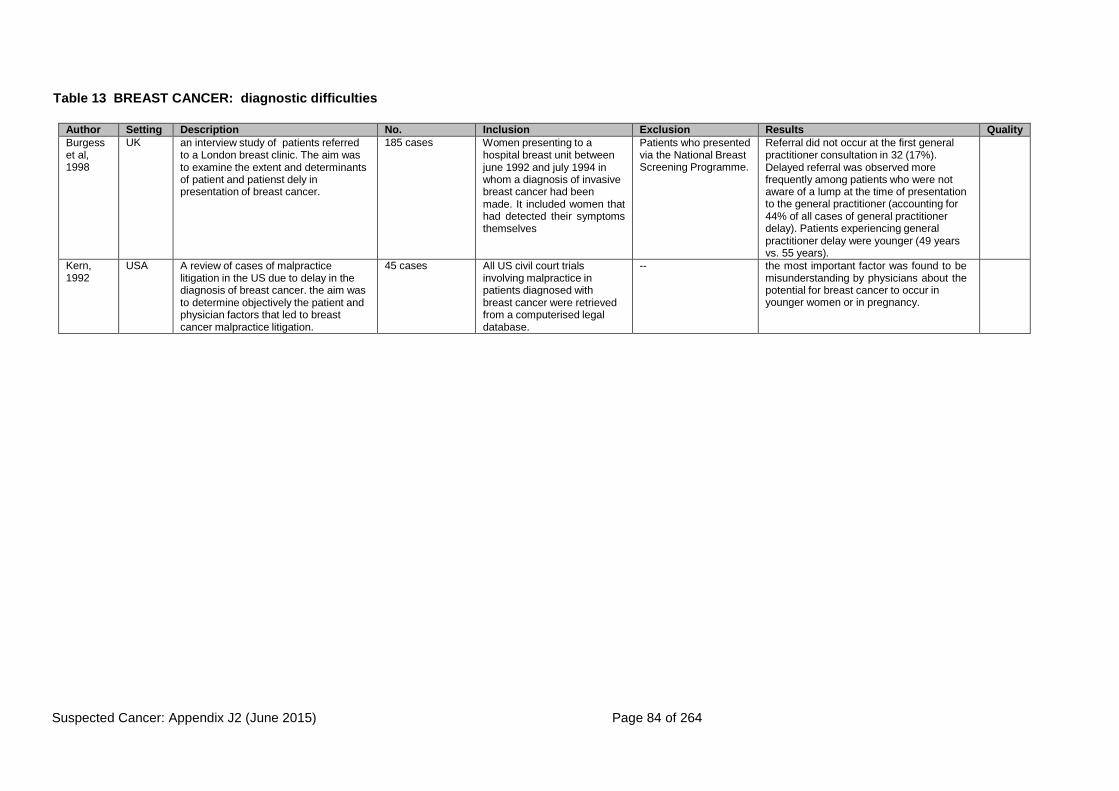
Suspected Cancer: Appendix J2 (June 2015) Page 84 of 264
Table 13 BREAST CANCER: diagnostic difficulties
Author Setting Description No. Inclusion Exclusion Results Quality
Burgess et al, 1998
UK an interview study of patients referred to a London breast clinic. The aim was to examine the extent and determinants of patient and patienst dely in presentation of breast cancer.
185 cases Women presenting to a hospital breast unit between june 1992 and july 1994 in whom a diagnosis of invasive breast cancer had been made. It included women that had detected their symptoms themselves
Patients who presented via the National Breast Screening Programme.
Referral did not occur at the first general practitioner consultation in 32 (17%). Delayed referral was observed more frequently among patients who were not aware of a lump at the time of presentation to the general practitioner (accounting for 44% of all cases of general practitioner delay). Patients experiencing general practitioner delay were younger (49 years vs. 55 years).
Kern, 1992
USA A review of cases of malpractice litigation in the US due to delay in the diagnosis of breast cancer. the aim was to determine objectively the patient and physician factors that led to breast cancer malpractice litigation.
45 cases All US civil court trials involving malpractice in patients diagnosed with breast cancer were retrieved from a computerised legal database.
-- the most important factor was found to be misunderstanding by physicians about the potential for breast cancer to occur in younger women or in pregnancy.

Suspected Cancer: Appendix J2 (June 2015) Page 85 of 264
McLeod et al, 1999
New Zealand
General practitioners were interviewed in depth to identify the key issues relating to the early detection and diagnosis of breast cancer in primary care. Following the interviews, a postal survey of a national random sample of active general practitioners was undertaken
30 GP’s interviewed
524 GP’s returned completed questionnaires.
General practioners were selected as known opinion leaders, from a range of geographical areas in New Zealand.
Others were recommended by GP’s that declined because it was felt that they would be more suitable for the interview in terms of experience and knowledge of the locality.
GP’s that refused to participate.
The general practitioners reported that they were limited in their management of symptomatic women by the availability of services such as mammography and fine needle aspiration, and access to specialist breast surgeons or clinics. In some isolated rural communities, distance to services was a limiting factor. Some general practitioners used investigations to confirm the presence of a lump, or the nature of a lump. In the postal survey, 137 (27%) general practitioners personally aspirated cysts and 39 (8%) personally performed fine needle aspiration for diagnostic purposes. Most considered referral should occur either when a lump was palpated or after abnormal test results, although would refer women over aged 50 more promptly. In younger patients, recall and review were more likely. Risk was viewed as associated with family history, although the definition of family history varied between respondents. There was a tendency to over estimate the impact of a first degree relative with breast cancer on the risk of cancer. The key area of difficulty was reported as being the management of young women with lumpy breasts. Concern about the possibility of missing a malignant lump had to be balanced with the risk of causing
Author Setting Description No. Inclusion Exclusion Results Quality
unnecessary worry. Some general practitioners requested more information on the management of breast pain and nipple discharge.

Suspected Cancer: Appendix J2 (June 2015) Page 86 of 264
The Bridge Study Group, 2002
UK This study evaluated the effects on patient management of breast disease guidelines issued to all general practitioners in the UK. The practices in the BRIDGE study were randomised to receive either the breast lump or the breast pain guideline. During the study, general practitioners and practice nurses in the participating 34 practices were invited to take part in discussion seminars. The views of the participants were sought on the management of women with breast symptoms, the problems encountered, and influences on decisions about treatment. The transcripts of the recorded discussions were analysed to identify primary health care professionals’ views about patients presenting with breast problems
Referral decisions emerged as an overarching theme, which set the context for discussions with participants about the nature of clinical presentation.
Watson et al, 2002
UK A cluster randomised controlled trial of educational interventions on general practitioner management of familial breast and ovarian cancer. Group A were provided an information pack and in-practice educational session, group B were mailed an information pack, and group C received no intervention at all. All general practitioner referral letters between March 1999 and December 2000 were audited and classified as appropriate or inappropriate referral.
688 GP’s from 170 practices.
236 post- intervention referrals were received from GP’s
All GP’s practices in two counties in England (Northamptonshire and Oxfordshire).
Referrals were excluded if they contained an additional valid reason for referral despite not meeting the guideline criteria. Where a GP sent more than one referral letter only the first was included.
The appropriateness of referrals improved among general practitioners who either received the guidelines alone (68.7% of referrals appropriate), or reinforced with an educational session (75.0% appropriate). In the group that did not receive the guideline or any other intervention, only 52.6% of referrals were judged appropriate.

Suspected Cancer: Appendix J2 (June 2015) Page 87 of 264
Table 14 BREAST CANCER: delay
Author Setting Description No. Inclusion Exclusion Results Quality
Bassett et al, 1986
USA This study used data from the Western Washington cancer surveillance system, and examined the influence of social class and race as predictors of survival in breast cancer in women in the first 11 years after diagnosis.
1506 women
All black women listed in the cancer surveillance system who were diagnosed with primary breast cancer between January 1973 and December 1983. The women were matched with a random sample of white women who had the same year of diagnosis and county of residence.
Women who were not residents of one of the 13 counties at the time of diagnosis.
Although survival was poorer among African-Americans, in regression analysis, the difference between them and whites was largely explained by socio-economic status.
Burgess et al, 2000
UK Women were interviewed five months after diagnosis to examine the influence of adverse life experiences and mood disorders on delayed presentation of breast cancer.
158 Women who presented to a Breast unit of a hospital in whom a diagnosis of invasive breast cancer had been made. The study included women that had detected symptoms themselves.
Patients who presented via the National breast Screening programme.
The study did not identify statistically significant associations between these factors and delay, and suggested that neither adverse life events nor mood disorders in the year before symptom discovery increased the risk of patients with symptoms of breast cancer delaying their presentation to their general practitioner.
Burgess et al, 2001
UK Interviews were conducted with women with newly diagnosed breast cancer to explore the factors that influence general practitioner consultation by women with breast cancer symptoms.
46 women
The women were selected purposely from a larger cohort from a previous study. They were women in whom a diagnosis of breast cancer had been made approximately eight weeks earlier.
-- The main factors that influenced help seeking behaviour were: the identification the woman made of their symptoms as suggestive or not of breast cancer; their attitudes to requesting an appointment with a general practitioner; their beliefs about the consequences of cancer treatment; the effect of competing events and difficulties that could be prioritised over and above their personal health; and influences or experiences that functioned as triggers to action.
Carnon et al, 1994
UK a retrospective analysis of data from a cancer registry within the catchments areas of two large hospitals in Glasgow, aiming to explain socio-economic differences in survival from pathology and biochemistry records for women diagnosed with breast cancer
1361 women
Data for women was identified the West of Scotland cancer Registry.
Cases registered before 1980 and cases registered after 1987. Patients aged 75 or over. Those with a diagnosis made only with a death certificate or without histological verification were omitted.
They could find no significant relation between socio-economic deprivation and four pathological prognostic factors at presentation: tumour size, negative nodes, tumour grade, and low oestrogen receptor concentration.

Suspected Cancer: Appendix J2 (June 2015) Page 88 of 264
Grunfeld et al, 2002
UK This study investigated the influence that women’s age and socio- economic status play on delayed presentation. women were interviewed to elicit their knowledge of breast cancer risk, breast cancer symptoms, and their perceptions of the management and outcomes associated with breast cancer.
996 women
Women, randomly selected though the postal address file
-- Older women were particularly poor at identifying symptoms of breast cancer, risk factors associated with breast cancer and their personal risk of developing the disease. Professional women and women classified as intermediate had a greater knowledge of risk factors than women from lower socio-economic groups. 32% of professional and intermediate women reported reduced risk compared to 10-15% of partly skilled and unskilled women, and women who were unskilled or had never worked identified significantly fewer symptoms than the other socio-economic groups.
Grunfeld et al, 2003
This study investigated the influence of psychosocial factors but in relation to women’s age. All women completed a postal questionnaire about beliefs regarding the symptoms, causes and outcomes associated with breast cancer, attitudes towards help seeking and beliefs about one’s ability to seek help.
546 women
The inability to correctly identify a range of potential breast cancer symptoms was a significant predictor of intention delay in seeking help across all age groups. For women aged 35-54, negative attitudes towards medical help seeking for breast symptoms and a negative belief in one’s ability to seek help were additional predictors of intention not to seek help. Holding negative beliefs about the consequences of breast cancer (i.e. that the disease could be potentially disabling or disfiguring) was found to be an important additional predictor of delay in help seeking among women aged over 65 years.
Kroman et al, 2000
Denmark A retrospective cohort study in Denmark to investigate the effect of young age on prognosis, and the influence of tumour staging and treatment on such association
10,356 women
Women who were less than 50 years old when diagnosed with breast cancer
-- Young women with a low risk disease who did not receive adjuctive treatment had a significantly increased risk of mortality; risk increased with decreasing age at diagnosis (adjusted rekative risk: 45-49 years: 1; 40- 44 years: 1.12 (95% confidence interval 0.89 to 1.40); 35-39 years: 1.40 (1.10 to 1.78); < 35 years: 2.18 (1.64 to 2.89). A similar trend was not seen in patients who received adjunctive cytotoxic treatment. The increased risk in young women that did not receive treatment compared with those that did remained when women were grouped according to the presence of node negative disease and tumour size.

Suspected Cancer: Appendix J2 (June 2015) Page 89 of 264
MacLeod et al, 2000
UK A population-based review of the case records of women with breast cancer. the aim was to assess whether clinical stage at presentation explains the known poorer survival outcomes for deprived women through describing and comparing pathological prognostic factors and surgeon assessment of stage of breast cancer of women living in affluent and deprived areas.
417 Women with breast cancer who were diagnosed under the age of 75 years. Women were included from the most affluent areas and the most deprived areas.
-- Women living in deprived areas (according to the Carstairs Index) were more likely to present with large, locally advanced cancers or with metastatic disease than those living in affluent areas. There were no major differences in pathological prognostic factors at presentation between socio- economic groups. Although stage at presentation accounts for some of the differences in survival between affluent and deprived women, other unidentified factors adversely affect survival in deprived women.
MacLeod et al, 2000b
UK A review of hospital and general practice case records of women with invasive breast cancer. the aim was to investigate whether poorer survival of breast cancer among deprived women compared to affluent women in relation to their NHS care.
821 Women resident in the greater Glasgow Health board area in whom invasive breast cancer was diagnosed in 1992. women were identified who lived in areas at either end of the deprivation spectrum and who were under 75 years of age at the time of diagnosis
-- Women living in affluent areas did not receive better NHS care for breast cancer than women in deprived areas. Admissions to hospital for problems not related to breast cancer were more common in those living in deprived areas, as also were the number of consultations with their general practitioners in the two years following diagnosis.
Nichols et al, 1981
UK Women with breast symptoms were interviewed to ascertain the interval between first noticing a breast symptom and consulting a doctor.
583 women
Women with breast symptoms referred to a specialist outpatient department.
Women who had attended breast and general clinics during the previous 12 months with the same symptoms.
Women were also excluded if they were not suitable interviewees (e.g. very elderly, over anxious, language barrier)
The largest component of delay was patient delay, with 20% of women delaying longer than 12 weeks. Long delays were related to age and symptoms other than lumps.

Suspected Cancer: Appendix J2 (June 2015) Page 90 of 264
Nosarti et al, 2000
UK Interviews were conducted with women referred to a breast clinic in order to identify factors associated with delay in presentation. And also to examine the influence that is played by women’s symptoms, psychosocial, socio-economic status and ethnicity.
692 women
Women referred to a breast clinic in London
Patiensts that had cognitive impairment, been diagnosed with breast cancer in the past five years, or were referred either due to a family history of breast cancer or for a second opinion of from the national breast screening service.
Sixty per cent of women with a breast lump presented to their doctor within 27 days from symptom discovery, compared to 34% of those without a lump. Of patients with breast tenderness or pain, 76% presented to their doctor within 27 days from symptom discovery, compared to 62% of those without pain. Thirty-five per cent of the women delayed presentation 4 weeks or more (median 13 days). The most common reason was that they thought their symptom was not serious. Others thought their symptom would go away or delayed presenting because they were scared. Delay was associated with psychiatric morbidity but not age. Median system delay was 18 days. Patients who thought they had cancer and those so diagnosed were seen more promptly (median 14 days). Most socio-demographic factors, including socio-economic status and ethnicity, were non-contributory to delay.
Quinn et al, 2001
Data from National Statistics providing information about incidence and survival according to level of deprivation.
In 1993, there was a negative gradient in the incidence of breast cancer by Carstairs deprivation category, the rate being about 30% higher in the most affluent groups. In contrast, mortality was not related to deprivation, implying that survival is better in the more affluent groups. The gap in survival between deprived and affluent groups in the 1980s was 6% at one year after diagnosis, and 9% at five years.

Suspected Cancer: Appendix J2 (June 2015) Page 91 of 264
Ramirez et al, 1999
UK A systematic review of articles to assess the quality and strength of evidence on risk factors for delays by patients and providers.
23 papers
Papers with data directly linking factors with delay. Papers published after 1960. Studies were included if they were based on consecutive- cohort or case control designs. Evidence for a particular factor was included if the the definition of the factor or measurement was validated or if if an appropriate questionnaire or interview was carried out without validation. Studies based on a clear description of a discrete interval of delay
Studies involving patients with benign breast disease. Studies based on small (n<10) case series or poor unrepresentative samples, such as studies based on non- systematic recall by physicians about patients with extreme delay. Evidence was excluded if a factor was poorly designed or if the measurement was not stated. Evidence was excluded if the analysis was misleading or inappropriate. Studies based on unclear definitions or looked at periods of delay by patiensts and providers that were indivisibly combined.
There was strong evidence for an association between older age and delay by patients, and strong evidence that marital status was unrelated to patient delays. There was moderate evidence for an association between patient delay and five other factors: fewer years of education, non-white ethnic origin, presenting with breast symptoms other than a lump, not disclosing the breast symptom to another, and not attributing the symptom to breast cancer. Younger age and presentation with a breast symptom other than a lump were strong risk factors for delays by providers. There was moderate evidence against non- white ethnic origin influencing delay by providers.
Sainsbury et al,1999
UK A retrospective analysis of patients with breast cancer listed on the Yorkshire Cancer Registry between 1976 to 1995, in order to investigate whether delay in referral from primary care influences survival. Patients were grouped according to time taken from family-physician referral to treatment (<30 days / 30-59 days / 60-89 days and 90> days).
36, 222 patients
Patients with breast cancer listed on the Yorkshire Cancer Registry between 1976 to 1995
Results demonstrated no evidence that delay up to three months (90 days) adversely influenced survival. From 1976 to 1995 the time from family-physician referral varied very little with a median of 10 vs.13 days. However the time from first visit to until the patient received treatment doubled for the same time period going from 7-13 days. Of the women included in the study, those who presented early and were in less than 30 days actually had significantly worse outcomes (p<0.001).
Schrijvers et al, 1995
UK An investigation into the association between deprivation and survival from breast cancer in women aged 30 and over. Data was collected from the Thames Cancer Registry, a population-based cancer registry a population of 14.1 million people in south-east England.
29, 676 women
Female residents of south Thames RHA who were diagnosed with malignant breast tumour in the decade 1980-89
Women for whom the date of death was known but the date of diagnosis was unknown. Women with an incomplete or unknown postcode were also excluded.
There was a clear gradient in survival that increased slightly with time since diagnosis, with better survival for women from more affluent areas. At all ages, women in the most deprived category had a 35% greater risk of death than women from the most affluent areas after adjustment for stage at diagnosis, morphology and type of treatment. In younger women (30-64 years), the survival gradient by deprivation category cannot be explained by these prognostic factors. In older women (65-99
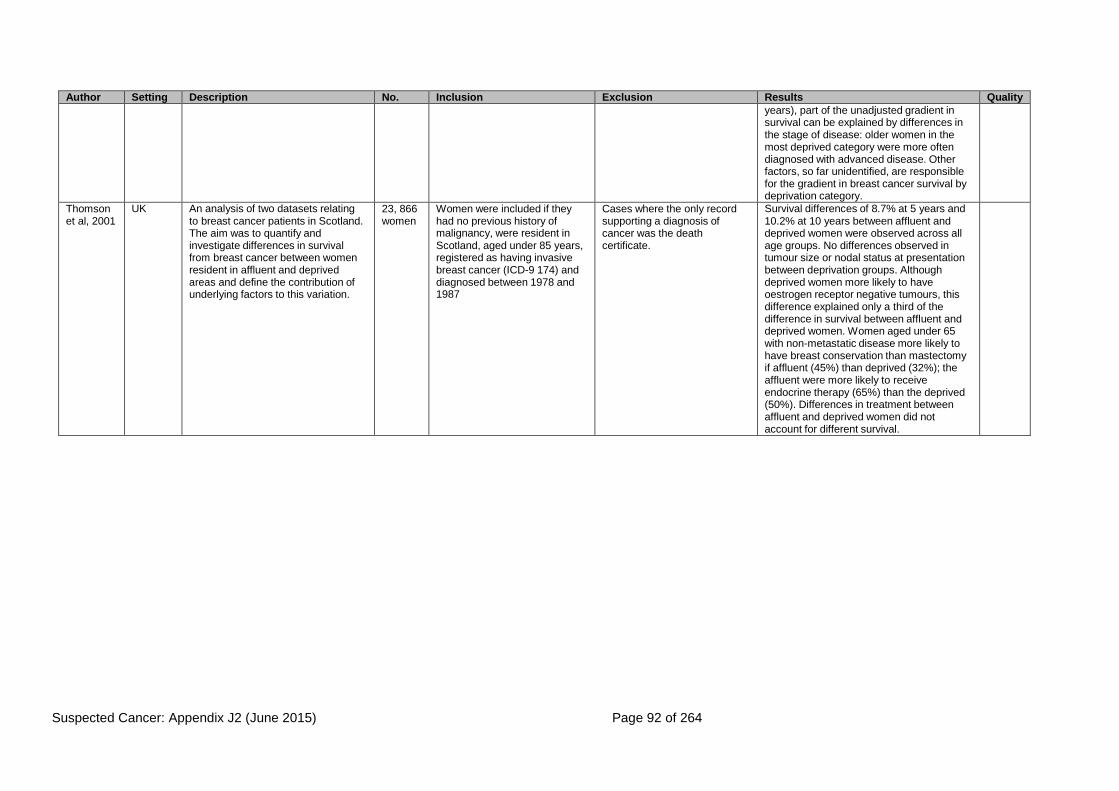
Suspected Cancer: Appendix J2 (June 2015) Page 92 of 264
Author Setting Description No. Inclusion Exclusion Results Quality
years), part of the unadjusted gradient in survival can be explained by differences in the stage of disease: older women in the most deprived category were more often diagnosed with advanced disease. Other factors, so far unidentified, are responsible for the gradient in breast cancer survival by deprivation category.
Thomson et al, 2001
UK An analysis of two datasets relating to breast cancer patients in Scotland. The aim was to quantify and investigate differences in survival from breast cancer between women resident in affluent and deprived areas and define the contribution of underlying factors to this variation.
23, 866 women
Women were included if they had no previous history of malignancy, were resident in Scotland, aged under 85 years, registered as having invasive breast cancer (ICD-9 174) and diagnosed between 1978 and 1987
Cases where the only record supporting a diagnosis of cancer was the death certificate.
Survival differences of 8.7% at 5 years and 10.2% at 10 years between affluent and deprived women were observed across all age groups. No differences observed in tumour size or nodal status at presentation between deprivation groups. Although deprived women more likely to have oestrogen receptor negative tumours, this difference explained only a third of the difference in survival between affluent and deprived women. Women aged under 65 with non-metastatic disease more likely to have breast conservation than mastectomy if affluent (45%) than deprived (32%); the affluent were more likely to receive endocrine therapy (65%) than the deprived (50%). Differences in treatment between affluent and deprived women did not account for different survival.

Suspected Cancer: Appendix J2 (June 2015) Page 93 of 264
Table 15 GYNAECOLOGICAL CANCER: signs and symptoms, including risk factors
Author Setting Description No. Inclusion Exclusion Results Gold
Std Quality
Bell at al 1998 Systematic review of screening for ovarian cancer
High quality evidence review (HTA)
Flam et al 1998 Sweden The symptamology of ovarian cancer was retrospectively reviewed in patients who had been referred to a single specialist centre. Patients gave an account of their initial symptoms and those that led to medical consultation. The disease was classified at early (stages IA-IIA) or advanced (stages IIB-IV) at diagnosis
362 Women with diagnosed ovarian cancer referred to Radiumhemmet for treatement between 1975-1976
- The most common initial symptoms were abdominal swelling and/or palpable tumour, pain and gastro- intestinal symptoms. The initial symptoms, however, were not necessarily those that prompted patients to seek medical advice. The most common reason was pain in the early group, but abdominal swelling in the advanced group (27.9%). Gynaecological disease was suspected by 55.2% of the early group and 37.9% of the advanced group. The results for initial symptoms in early and advanced ovarian carcinoma
The study did not include people presenting in primary care.
Ghurani and Penalver 2001
Narrative review on latest literature on vulvar cancer
Narrative, authoritative review

Suspected Cancer: Appendix J2 (June 2015) Page 94 of 264
Goff et al 2000 Canada This study observed symptoms and other factors that may contribute to the delayed diagnosis of ovarian carcinoma using a questionnaire survey.
1725 Patients with Ovarian carcinoma
- In terms of whether women had symptoms before the diagnosis of ovarian carcinoma, 77% reported abdominal symptoms, 70% gastrointestinal, 58% pain, 50% constitutional, 34% urinary and 26% pelvic.
Only 11% of women with Stage I/II and 3% with Stage III/IV reported they were completely asymptomatic before their diagnosis.
13% of participants reported being told by their provider that nothing was wrong, 6% were diagnosed with depression, 12% stress, 6% constipation, 15% irritable bowel syndrome, 9% gastritis and 47% were given other diagnoses. Only 20% of patients were told initially they might have ovarian carcinoma.
Women who had the most symptoms were significantly younger. Women with advanced disease were significantly more likely to have symptoms than those with early stage disease. The types of symptoms between both groups were similar however. Those who ignored their symptoms were significantly more likely to have more total symptoms and advanced stage disease compared with those who did not (85% vs. 74%; P=0.002).
Although there was a high response rate and geographic diversity. Bias may have occurred in the survey selection because the women who participated in this study were those who chose to subscribe to a newsletter or those active in support groups.

Suspected Cancer: Appendix J2 (June 2015) Page 95 of 264
Jones et al 1997 New Zealand The study aimed to determine trends in the clinicopathology of vulval squamous cell carcinoma over the past two decades, with particular reference to the possible effects of the increasing evidence of vulval intraepithelial neoplasia (VIN) during this time. A retrospective review of the clinical records of two cohorts of women presenting with squamous cell carcinoma to a gynaecological oncology unit. One cohort involved cases between 1965-1974, and the other between 1990-1994
113 - Any cases in which tissue was unavailable for review.
The mean age at presentation was 68.4 (44-92) years (median 72 years) in the 1965- 1974 cohort, and 69.2 (22-93) years (median 71 years) in the 1990-1994 cohort. In the 1965-1974 cohort, only one patient was younger than 50 years of age, whereas in the 1990-1994 cohort, 12 women (21%) were younger than 50 years (P = 0.001). There were no statistical differences in FIGO stage between the two cohorts. When stratified according to age, 11 of 13 women younger than 50 years, compared with 10 of 100 women older than 50 years of age, smoked cigarettes (P < 0.001). Ten of the 13 women younger than 50 years of age, compared with 13 of 100 women 50 years of age or older, had warty and/or basaloid VIN III associated with their invasive carcinoma (P < 0.001). Multiple lower genital tract neoplasia was also more common in women younger than 50 years of age (P < 0.001). Warty and basaloid VIN was associated with 16 of 19 (84%) warty or basaloid carcinomas and with seven of 94 (7.4%) typical squamous cell carcinomas (P < 0.001). In contrast, non-neoplastic epithelial disorders were associated with 55 of 94 (58.5%) typical squamous cell carcinomas and with none of the 19 basaloid or warty carcinomas.

Suspected Cancer: Appendix J2 (June 2015) Page 96 of 264
Messing and Gallup 1995
USA The aim was to determine if young women have a different risk factor history and outcome compared with older women. A retrospective review of the hospital medical records of women treated for squamous cell carcinoma of the vulva over a period of 15 years was conducted. A comparison was made between women younger than 45 years with those 45 years and over for historic risk factors, treatment modality, and outcome.
Cases of 78 women.
Patients presented with complaints of a lesion, lump, or pain in 70% of cases. There was no significant difference in the duration of symptoms for younger versus older women.
Women under 45 were found to have a stronger history of condyloma (P < 0.001, 95% confidence interval 3.69- 87.96). There was no significant difference by age in smoking history, alcohol consumption, or tumour size. Older women were more likely to have advanced stage disease (P = 0.03, 95% CI 0.43-0.91) but no metastatic disease. The median tumour size at presentation was 4 cm (range 0-27). Lesion size over 2cm was significantly associated with the presence of metastatic disease (P < 0.001). The following were associated with decreased survival: FIGO stage IV (P <0.001, 95% CI 1.6-5.1), presence of metastases (P < 0.001, 95% CI 1.5-3.6), and tumour size greater than 2cm (P = 0.002, CI 0.09-0.34). There was no detected difference in survival for women in either group.
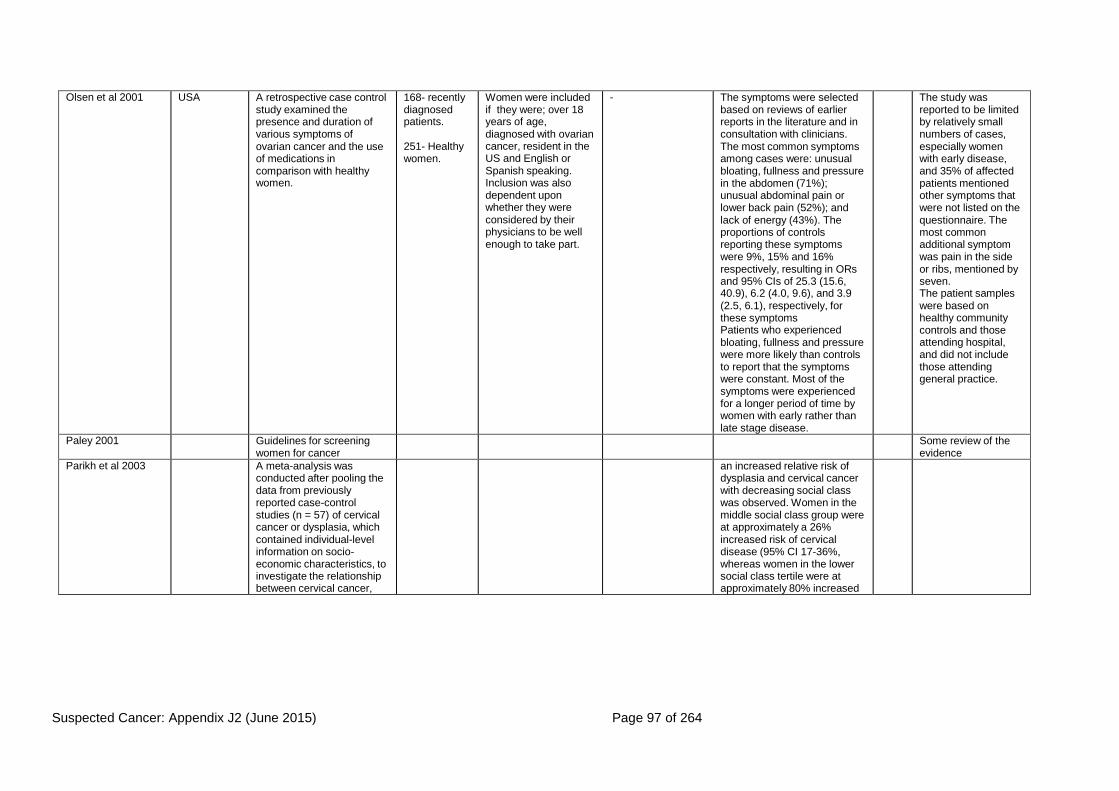
Suspected Cancer: Appendix J2 (June 2015) Page 97 of 264
Olsen et al 2001 USA A retrospective case control study examined the presence and duration of various symptoms of ovarian cancer and the use of medications in comparison with healthy women.
168- recently diagnosed patients.
251- Healthy women.
Women were included if they were; over 18 years of age, diagnosed with ovarian cancer, resident in the US and English or Spanish speaking. Inclusion was also dependent upon whether they were considered by their physicians to be well enough to take part.
- The symptoms were selected based on reviews of earlier reports in the literature and in consultation with clinicians. The most common symptoms among cases were: unusual bloating, fullness and pressure in the abdomen (71%); unusual abdominal pain or lower back pain (52%); and lack of energy (43%). The proportions of controls reporting these symptoms were 9%, 15% and 16% respectively, resulting in ORs and 95% CIs of 25.3 (15.6, 40.9), 6.2 (4.0, 9.6), and 3.9 (2.5, 6.1), respectively, for these symptoms Patients who experienced bloating, fullness and pressure were more likely than controls to report that the symptoms were constant. Most of the symptoms were experienced for a longer period of time by women with early rather than late stage disease.
The study was reported to be limited by relatively small numbers of cases, especially women with early disease, and 35% of affected patients mentioned other symptoms that were not listed on the questionnaire. The most common additional symptom was pain in the side or ribs, mentioned by seven. The patient samples were based on healthy community controls and those attending hospital, and did not include those attending general practice.
Paley 2001 Guidelines for screening women for cancer
Some review of the evidence
Parikh et al 2003 A meta-analysis was conducted after pooling the data from previously reported case-control studies (n = 57) of cervical cancer or dysplasia, which contained individual-level information on socio- economic characteristics, to investigate the relationship between cervical cancer,
an increased relative risk of dysplasia and cervical cancer with decreasing social class was observed. Women in the middle social class group were at approximately a 26% increased risk of cervical disease (95% CI 17-36%, whereas women in the lower social class tertile were at approximately 80% increased

Suspected Cancer: Appendix J2 (June 2015) Page 98 of 264
Author Setting Description No. Inclusion Exclusion Results Gold Std
Quality
social class, stage of disease, geographical region, age and histological type.
risk when compared to women in the upper tertile (95% CI 69- 92%). These elevated risks persisted after analysis was restricted to those studies which included only women aged <50 years (97% increase in risk of invasive cancer for the low socio-economic group; 95% CI 80-115%, and 58% increase in risk of dysplasia for the low socio-economic group; 95% CI 41-78%). When stratified by geographical region, the increased risk identified in studies that originated from Western Europe appeared to be only moderate, with a 45% increased risk of cervical disease in the low social class group as opposed to the high social class group (95% CI 29- 62%). When the analysis was restricted to studies that only included cases of cervical cancer, the increase in risk between social class and invasive cervical cancer was reduced to 28% (95% CI 10- 49%) for Western European studies. There was significant unexplained heterogeneity in most of the pooled odds ratios, which might have been possible because of the inability to control for variables such as background HPV prevalence.

Suspected Cancer: Appendix J2 (June 2015) Page 99 of 264
Rosen et al 1997 Sweden A retrospective review of the hospital records of patients with histologically confirmed primary invasive vulval cancer (Sweden). The aim was to evaluate the survival after treatment of vulval cancer in relation to various prognostic factors
328 patient records.
Patienrs with vulvar cancer.
-- The most common presenting symptoms were pruritus (24%), smarting pain (15%), and a vulval lesion (15%). Squamous cell carcinoma was the most common histological form of vulval cancer, constituting 91.4% of the cases (n= 300). Melanoma

Suspected Cancer: Appendix J2 (June 2015) Page 100 of 264
Author Setting Description No. Inclusion Exclusion Results Gold Std
Quality
(FIGO staging, tumour grading, age at diagnosis, heredity for any cancer, childbirth, and prior history of any cancer).
constituted 3% (n = 10), Paget’s disease 2.4% (n = 8), cancer of the Bartholin’s glands 1.8% (n = 6), adenocarcinoma 0.6% (n = 2), and basal cell carcinoma 0.6% (n = 2) of the vulval cancers. Survival analyses were limited to the 300 patients with squamous cell vulval cancer. The majority of patients with squamous cell vulval cancer were Stages I (35%) or II (37%) at diagnosis. 36% had a well-differentiated tumour, 43% had a moderately differentiated tumour, and 15% had a poorly differentiated tumour. There were significant differences in survival when comparing patients older than mean age at presentation (69 years) with the patients who were younger than mean age (P < 0.01). There were significant (P < 0.00001) differences in corrected survival times between different FIGO stages: 5 year survival rate was 93% for Stage I, 60% for Stage II, 40% for Stage III, and 13% for Stage IV. Histologic grade was also shown to be a significant prognostic marker for survival (P = 0.02): well-differentiated tumours had a 5 year survival rate of approximately 70% while moderately or poorly differentiated tumours had a 5 year survival rate of approximately 55%. Both parity and previous history of cancer did not influence survival times significantly.

Suspected Cancer: Appendix J2 (June 2015) Page 101 of 264
SIGN 2002 Guidelines on investigation of post-menopausal bleeding
Evidence based, but only referred to DoH 2000 referral guidelines
Smith et al 1985 USA A case series evaluating the characteristics of ovarian cancer symptoms, their perceived cause and delay in seeking a diagnosis associated with stage, grade and histologic features of disease at diagnosis among patients with cancer of the ovary
83 Women diagnosed with cancer were identified from the population based Iowa (National Cancer Institute Surveillance, Epidemiology, and End Results) NCI-SEER cancer registry.
Those participants who could not be interviewed due to severe illness, refusal or physician refusal to allow contact. Those individuals that did not have their diease staged at the beginning of the study were also excluded.
68% of patients had experienced symptoms that prompted a consultation. The most common number of symptoms occurring together was two (72.2%), with abdominal swelling most likely to be identified with other conditions: fatigue (23.5%), urination problems (17.6%), and pain (17.6%). Swelling, pain and fatigue were commonly seen together (29.4%). Only abdominal pain and swelling were significantly associated (P<0.05) with later stage disease. Pain was likely to convince women to seek a diagnosis. Those aged 40-49 years were more likely to report symptoms than patients in other age groups (P<0.05). No relationship between age and type or number of symptoms was found, nor associations with other sociodemographic factors. Less frequently noticed symptoms were irregular vaginal bleeding, metrorrhagia, indigestion and urination problems (frequency or difficulty). Symptoms were viewed less seriously if they were believed to be related to indigestion or menopausal conditions. Irregular menstrual cycles often convinced patients with early-stage cancers to seek a diagnosis.
The cohort did not include older patients for whom the results may be less applicable

Suspected Cancer: Appendix J2 (June 2015) Page 102 of 264
Stratton et al 1998 UK A systematic review of case control and cohort studies with the aim to estimate the relative and lifetime risks of ovarian cancer in women with various categories of family history (1- an unaffected first degree relative, 2- an affected mother, 3- an affected sister, and 4- women with more than one affected relative)
15 studies Published studies from 1066-1998- studies in which family history had been recorded.
-- Although there was heterogeneity in the studies used to estimate risk in first- degree relatives, this did not alter the estimate of the pooled relative risk Two studies reported the relative risks to first-degree relatives according to age at diagnosis or death of the index case. The pooled estimate of RR was 1.7 (95% CI 1.2-2.5) where the index case was diagnosed or dies from ovarian cancer before the age of 40, compared with 3.8 (95% CI 2.6-5.5) if the index case was diagnosed or died at an older age. Four studies reported RRs according to the ages of first-degree relatives. For women younger than 50 with an affected first degree relative the RR was 2.9 (95% CI 1.9-4.3), while for women older than 50 with an affected first degree relative the risk was 2 (95% CI 1.5-2.5). The risk to daughters of an affected mother was given in three case-control studies which provided a pooled estimated RR of 6 (95% CI 3.0-11.9). The risk to mothers with an affected daughter was given by two cohort studies and one case-control study. The estimated RR was 1.1 (95% CI 0.8-1.6). Four studies reported risks associated with having an affected sister. The pooled estimate from these studies gave an RR of 3.8 (95% CI 2.9-5.1). Only two case-control studies and no cohort study examined the risks associated with having a second degree relative with ovarian cancer. The pooled relative risk estimated from
Potential limitations included recall bias since women with ovarian cancer were more likely to recount a family history of ovarian cancer than control subjects

Suspected Cancer: Appendix J2 (June 2015) Page 103 of 264
these studies was 2.5 (95% CI 1.5-4.3). Two studies examined the risks involved in having more than one affected relative (either first or second degree) with ovarian cancer. The pooled risk estimate was 11.7 (95% CI 5.3-25.9).
Sturgeon et al 1992 USA An investigation to examine recent trends in the incidence of vulval cancer. The authors identified cases of in situ and invasive cell carcinoma of the vulva diagnosed between 1973 and 1987 from population- based cancer registries.
Cases of in situ or invasive squamous cell carcinoma of the vulva diagnosed between 1973 and 1987.
- Non-squamous cell malignancies were excluded from the analysis
The annual incidence of in situ vulval carcinoma for all races combined nearly doubled from 1.1 to 2.1 during the period from 1973 to 1976 and 1985 to 1987. The largest proportional increase occurred among white women <35 years old, for whom the rate nearly tripled. Increases were more modest among black women than among white women, with the rate not quite doubling among black women <35 years old. In situ rates among blacks of all ages were higher than those among whites before 1977, but the black-white differential has diminished in more recent years. The peak in situ rate has shifted over time from women > 54 years to women aged 35 to 54. The invasive squamous cell carcinoma incidence for all races combined was relatively stable over 1973 to 1976 and 1985 to 1987. Rates in each age group were also relatively steady, although among white women they tended to decline among those aged >55. Little racial difference was evident under age 35; rates were higher at ages 35 to 54 among blacks and at ages >54 among whites. In contrast to in situ cancers, invasive rates increased steadily with age.

Suspected Cancer: Appendix J2 (June 2015) Page 104 of 264
Vikki et al 1998 Finland An investigation into the predictive value of bleeding for detecting subsequent gynaecological or urinary cancers among women that were screened negative for cervical cancer.
Data from the Finnish Mass Screening Registry and National Cancer Registry were used to investigate the long term significance of bleeding symptoms. The mean length of follow-up was 7 years.
37,596 women in the national population-based mass screening programme for cervical cancer classified as having reported bleeding symptoms when screened
-- The prevalence of postmenopausal bleeding among the 37,596 women (all ages) was 0.2%, bloody discharge was 1.1%, coital bleeding 0.7%, and irregular bleeding 3.9%. During follow up 753 cancers were observed among women with bleeding symptoms; 197 (26%) of these were gynaecological. The relative risk of cancer of corpus uteri was 3.6 in women with postmenopausal bleeding. The RR of cervical cancer 1.1, (95% CI 0.8-1.4) was not significantly increased during follow up for a maximum period of ten years. Women with bloody discharge had an elevated risk of gynaecological cancers. The excess was attributable to cancer of corpus uteri (SIR 2.2, CI 1.3- 3.4). Coital bleeding was rare and not associated with gynaecological cancer (SIR 1.0). Irregular bleeding was associated with an increased risk of cancer of corpus uteri (SIR 1.8, 1.3-2.5). Risk of cancer of the corpus uteri increased with any bleeding symptom (SIR 2.1, 95% CI 1.6-2.6) but postmenopausal bleeding RR was 3.6 (95% CI 2.0-6.0).
The symptoms were those reported at the time of screening and not before diagnosis. It is not clear whether these findings can be related to people consulting with these symptoms.

Suspected Cancer: Appendix J2 (June 2015) Page 105 of 264
Vine et al 2001 USA An investigation into the types and duration of symptoms among women with invasive versus borderline ovarian tumours. Information about symptoms was obtained using a standardised questionnaire administered by interview conducted in the homes of study participants.
767 Women aged 20-69 year, and diagnosed histologically as having primary epithelial invasive of borderline ovarian cancer between 1994 and 1998. there was also area of residence criteria.
Participants were excluded if English was not spoken or if patients were not mentally competent. cases were also excluded if diagnosis was greater than 6 months, the patient was critically ill or dead, untraceable, the physician did not consent to contact and refusal to participate.
The percentage of women with symptoms was significantly higher in invasive versus borderline disease. Women with borderline disease had symptoms for longer periods of time than those with invasive disease or pelvic discomfort, bowel irregularity and urinary frequency/urgency. Pre- diagnostic symptom duration was longer among borderline than in invasive cases. Although women with invasive cancers were significantly older, no differences were found between women with invasive versus borderline tumours with respect to sociodemographic variables. Borderline tumours were more likely than invasive tumours to be mucinous (40 vs 8%) and less likely to be endometroid (2 vs 22%). Borderline and invasive cases reported similar types of symptoms. However, borderline cases were twice as likely as invasive cases to report not having had symptoms (16 vs 8%, P=0.005). Twice as likely as invasive cases to be diagnosed through routine examination (28 vs 16%, P=0.001). Invasive cases were more likely to be diagnosed because of symptoms (62 vs 48%, P=0.002).

Suspected Cancer: Appendix J2 (June 2015) Page 106 of 264
Weber et al 1999 US A case control study which aimed to identify independent risk factors for endometrial neoplasia in women with abnormal perimenopausal or postmenopausal bleeding in order to develop and test a predictive model.
57 cases of endometrial hyperplasia or cancer.
137 controls.
Patients with cancer (defined as any invasive malignancy of the endometrium), adenocarcinoma in situ, and complex endometrial hyperplasia with and without atypia.
Controls were defined by benign histologies on endometrial samplings (including simple hyperplasia)
Patients being investigated for fertility problems with endometrial samplings for menstrual cycle dating and pregnant women were excluded, as were those with cancer or hyperplasia.
Parity was related inversely (odds ratio [OR] 0.70; 95% CI 0.56, 0.88; P=0.02) and weight directly (OR 1.02 per kg; 95% CI 1.01, 1.04; P=0.018) to the risk of endometrial neoplasia. Age (OR 1.04 per year; 95% CI 1.00, 1.08; P=0.06) and diabetes (OR 3.50; 95% CI 0.99, 12.33; P=0.052) were significant marginally. Multivariate analysis suggested that increased age and weight, diabetes and lower parity were independently associated with endometrial neoplasia. The clinical model, did not have sufficient predictive ability to determine if women with abnormal perimenopausal or postmenopausal bleeding should have diagnostic testing

Suspected Cancer: Appendix J2 (June 2015) Page 107 of 264
Wickborn et al 1993 Sweden Case series investigating symptoms in patients with different types of ovarian cancer, by reviewing clinical records to identify information from first consultation to operation and diagnosis.
160 patients Patients diagnosed in a specialist centre between 1981 and 1986 with epithelial ovarian cancer that could be staged.
- No specific group of symptoms could be linked with type or stage of ovarian cancer. Only 21% complained of gynaecological symptoms. The majority of women did not experience symptoms in the genital organs. Women with class IC cancer had significantly more advanced disease than those with 2C-5C cancer as 77% had a stage III- IV tumour compared with 40% of class 2C-5C patients. The mean age was 62.6 years (range 25-87 years). Several women had more than one type of symptom, pain and abdominal swelling being the most common combinations. Irrespective of stage, 37% had symptoms related to the bladder; approximately 65% had pain and 60% had abdominal swelling. Gastrointestinal and general symptoms were less common in stage 1 than in higher stages. This was not the case with tumour classes 2C-5C disease.

Suspected Cancer: Appendix J2 (June 2015) Page 108 of 264
Table 16 GYNAECOLOGICAL CANCER: investigations
Author Setting Description No. Inclusion Exclusion Results Gold Std Quality
Andolf et al, 1986
Sweden Ultrasound scan for detection of ovarian enlargements was performed in a target group of out-patients attending a specialist outpatient clinic for various reasons.
805 Women aged between 40- 70 years.
Pathological findings were suspected in 83 of the 805 women at the first scan and were confirmed in 50 after a repeat scan, of whom 39 subsequently underwent surgery. None of the borderline or malignant ovarian lesions were found by manual pelvic examination.
The findings at the ultrasound examination were compared with those at pelvic examination, surgery and with subsequent histological examination (gold standard).
Bell at al 1998
Systematic review of screening for ovarian cancer
High quality evidence review (HTA)
Carmichael et al, 1984
Canada The aim of the study was to delineate causes for failure of cervical cytologic screening in a group of patients who eventually developed invasive cervical carcinoma. A retrospective review was conducted of the cytologic history of patients who developed invasive carcinoma of the cervix and were registered with the Ontario Cancer Foundation Clinic between January 1973 and October 1982.
245 Patients with invasive cervical carcinoma registered at a cancer foundation between January 1973 and October 1982.
Fifty three (35.6%) of the patients in group 1 had Stage 1 disease. Stage 1 disease was present in 16 patients (61.5%) of group 2 and in 55 patients (78.6%) of group 3. There was no significant difference between the three groups with respect to site of residence or access to the health care system. Of the patients in group 3, 20 (28.6%) had normal cytologic findings and 50 (71.4%) had abnormal cytologic findings. A review of 229 original cervical smears revealed that 52 (17.4%) had been significantly undercalled (ie the severity of abnormalities had been adequately identified), but only 21 (7.0%) had been undercalled as normal. In these patients, staging was unrelated to screening.
Clark et al 2002
Systematic review to determine the accuracy of hysteroscopy in diagnosing cancer
The diagnostic accuracy of hysteroscopy is high for endometrial cancer, but only moderate for endometrial disease (cancer or hyperplasia)

Suspected Cancer: Appendix J2 (June 2015) Page 109 of 264
Gredmark, 1995
Sweden The prospective cohort study was designed to investigate endometrial histopathology in a population postmenopausal patients presenting with uterine bleeding. The main outcome measures involved the frequency of bleeding and its correlation to endometrial histopathology and in relevant cases to pathological conditions in cervix and ovaries.
457 All women referred to the county gynaecological departments because of uterine bleeding, appearing one or more year after menopause were eligible for inclusion
Women using HRT (n=19) for vasometer symptoms were excluded from the study. Two women who had undergone subtotal hysterectomy were also excluded from the study.
The incidence of postmenopausal bleeding decreased with increasing age while the probability of cancer as the underlying cause increased. The peak incidence of endometrial carcinoma was found in women between 65 and 69 years of age. The mean age of the women with bleeding was 61.4 years (41-91) and the median age when menopause occurred was 50.6 years. Endometrial histopathology showed: atrophy (50%); proliferation (4%); secretion (1%); polpys (9%); different degrees of hyperplasia (10%); adenocarcinoma (8%); not representative (14%); other disorders (3%). In six women a squamous carcinoma of the cervix was found and eight proved to have ovarian tumours.
Gupta et al, 1996
UK A prospective cohort study was undertaken to establish the optimum method of investigating women with postmenopausal bleeding. Data were based on an investigation postmenopausal women in a teaching hospital setting. This was a comparative study of pipelle endometrial biopsy, pelvic ultrasonography, hysteroscopy and dilation and curettage.
76 Menopausal women presenting with postmenopausal bleeding who had not received HRT for at least one year
Women with an ovarian pathology.
Median age at presentation was 55 (range 51-64 years). Median age of menopause was 50 years (range 46-51 years). Pipelle biopsy was successful in 70% of cases and had a sensitivity of 70%. Endometrial thickness of >5mm used as an indicator of endometrial pathology compared to uterine curettage had a sensitivity of 83%, a specificity of 77% and a positive predictive value of 54%. Ultrasound also detected five ovarian tumours, two of which were malignant and three missed by pelvic examination alone. Hysteroscopy was performed without complication in 73 cases. Pelvic ultrasonography was performed in 75 cases. Endometrial thickness >5 mm used as an indicator of endometrial pathology, compared to dilation and curettage diagnosis, had a sensitivity of 83%, a specificity of 77%, a PPV of 54% and an NPV (negative predictive value) of 94%.
The histological diagnosis from the dilation and curettage was used as the gold standard

Suspected Cancer: Appendix J2 (June 2015) Page 110 of 264
Gupta et al, 2002
UK A systematic review/ meta- analysis was undertaken to determine the diagnostic accuracy of endometrial thickness measurement by pelvic ultrasonography for predicting carcinoma and disease during an investigation of women with postmenopausal bleeding.
57 studies
Women with post menopausal bleeding. The length of amenorrhoea indicating that the woman was menopausal was considered ideal if it was
≥12 months and inadequate if it was <12
months or unreported. No language restrictions were applied.
There were 1243 cases of endometrial carcinoma among 8890 patients (14% of all women in these studies). The likelihood ratios for various cut-off levels of abnormal endometrial thickness were 4mm (9 studies) and 5mm (21 studies), measuring both endometrial layers. None of the
nine studies using the ≤4mm cut-off were evaluated as being of good quality. Only four studies (of the 21) used the ≤5mm cut-off level, which employed the best quality criteria. Using the pooled estimates from these four studies only, a positive test result raised the probability of carcinoma from 14.0% (95% CI 13.3 – 14.7) to 31.3% (95% CI 26.1 – 36.3), while a negative test reduced it to 2.5% (95% CI 0.9- 6.4).
The diagnostic test was endometrial thickness measurement using ultrasound imaging. The gold standard employed for investigating endometrial carcinoma was histological testing.

Suspected Cancer: Appendix J2 (June 2015) Page 111 of 264
Janerich et al, 1995
USA A diagnostic study evaluation. Screening histories and outcomes were obtained for all cases of invasive cervical cancer diagnosed in a 5 year period. Each case of cancer cases were studied with a structured review procedure conducted by an expert panel to assess the reason that it was not detected before it became invasive.
481 All cases of invasive cervical cancer diagnosed in a 5 year period among Connecticut residents.
Reasons for non- participation included refusal by the patients or the phycian, not being able to locate participants and the patients next of kin not being available.
A total of 137 cases (28.5%) occurred among women who had never had a Pap test, and another 113 cases (23.5%) in women whose last Pap test was more than 5 years before diagnosis of cervical cancer. The average age of women who were never screened was 64.5 years compared with 46.5 years for the remainder of the 481 case patients. The study provides a 6.9% lower limit estimate for misread slides for the occurrence of invasive cancer. Delay for prompt follow-up of suspicious smears occurred for (52 of the 481 cases, 10.8%). Adenocarcinomas and adenosquamous carcinomas were seen nearly twice as often among the women who developed invasive disease within three years of a negative cytologic examination compared with the total study group. Ninety one of the 118 had a normal reread Pap smear or cytology report. These 91 cases (18.9% of the total of 481) were candidates for the rapidly progressive category. The number of cases judged to have occurred because of a misread screening smear was 33 (6.9%) of the entire group of 481.
Verification of invasation was based on a biopsy or hysterectomy report, or both.
Nanda et al 2000
Systematic review to assess the accuracy of conventional and new Pap testing
Insufficient high-quality data exist to estimate test operating characteristics of new cytologic methods for cervical screening. Future studies of these technologies should apply adequate reference standards. Most studies of the conventional Pap test are severely biased: The best estimates suggest that it is only moderately accurate and does not achieve concurrently high sensitivity and specificity. Cost- effectiveness models of cervical cancer screening should use more conservative estimates of Pap test sensitivity

Suspected Cancer: Appendix J2 (June 2015) Page 112 of 264
Tabor, 2002
Denmark and UK
Systematic review/ Meta- analysis using MEDLINE databases from 1991 to 1997. The purpose was to assess the value of endometrial thickness measurement as a test for endometrial cancer in post- menopausal women with vaginal bleeding.
9 studies Studies were included if the authors were able to provide information on the median endometrial thickness in unaffected symptomatic women and endometrial thickness values in affected women.
The median endometrial thickness in women with endometrial cancer was 3.7 times that in unaffected women with the same menopausal status and same hormone replacement therapy use category. The detection rate was 63% (95% CI 58, 69) for a 10% false-positive rate, or 96% (95% CI 94, 98) for a 50% false-positive rate. It was concluded that 4 percent of the endometrial cancers would still be missed with a false-positive rate as high as 50%. It underlined the importance of determining the median and distribution of endometrial thickness in each centre, and not using a fixed cut off. In the two centres which reported medians for premenopausal women who did not take HRT, the median endometrial thickness was 2-3 mm higher than in postmenopausal women who did not take HRT (P<0.01 for each).
Woodman et al, 1997
UK A questionnaire survey of all general practices and family planning doctors in Manchester Health Authority was undertaken to determine why more smears were taken in primary care than were scheduled by the screening programme.
111 General Practices
62 Family Planning doctors
Questionnaire were sent to all general practices and family planning doctors in the Manchester Health Authority. They were addressed to the senior were addressed to the senior partner who was requested to determine the most appropriate person in the practice to complete it.
The indications for additional smear tests most frequently cited by responders were postcoital (88%), postmenopausal (84%), or intermenstrual bleeding (55%), genital warts (87%) and multiple sexual partners (52%). Forty-six percent maintained that a woman should have a repeat test within one year of her first ever test. FDPs were less likely than general practices to take an extra smear if a woman was starting the oral contraceptive pill, having an intra- uterine contraceptive device (ICD) inserted, or attending for a postnatal check; or if she had a history of multiple sexual partners.

Suspected Cancer: Appendix J2 (June 2015) Page 113 of 264
Table 17 GYNAECOLOGICAL CANCER: delay
Author Setting Description No. Inclusion Exclusion Results Quality
Aziz et al, 1993 A retrospective study of patients with endometrial carcinoma who were treated at two US hospitals between 1975 and 1990. the purpose was to compare the prognostic factors - including grade, stage, depth of myometrial invasion, status of lymph nodes, and peritoneal cytology - and survival of black and white patients with endometrial carcinoma
290 136 (47.2%) patients were black, 135 (46.9%) were white, 15 (5.2%) were Hispanics, and the racial origin of 4 patients was not known. The mean age was 63 years in the range of 28-95 years (standard deviation 10.6). Black and white patients had similar treatments. Black patients had more advanced stage disease than white patients (Stage I, 45.9% vs. 54.1%; Stage II, 48.4% vs. 51.6%; Stage III, 88.9% vs. 11.1%; Stage IV, 100% vs. 0%; P = 0.034). Black patients also had more advanced grade disease (P = 0.008), myometrial invasive disease (P = 0.038), and lymph node involvement (P = 0.01). The overall corrected 10-year survival for all patients both blacks and whites, including all stages was 57%. The overall corrected 10-year survival for white patients was 72% as compared to 40% for the black patients (P = 0.0003). The overall survival for both blacks vs. whites less than 60 years of age (P = 0.002), and for blacks vs. whites more than 60 years of age (P = 0.003) was significantly lower in black patients as compared to white patients. Survival comparison stratified by both age and race indicates that black patients under 60 years of age had the worse survival rate. Survival comparisons, when stratified by race and each prognostic group, showed statistically significant overall survival differences in favour of white patients
This study did not address delay in diagnosis as such but merely describes differences in survival between blacks and whites following similar treatment for endometrial carcinoma. No inferences between advanced stage at presentation and diagnostic delay can be drawn. The paper does discuss the type of health care provider available to patients before and while being diagnosed.

Suspected Cancer: Appendix J2 (June 2015) Page 114 of 264
Crawford et al, 2002
Scotland An investigation into links between delays in treatment (secondary care provider delay) and survival by collecting data from the case notes of all women resident in Scotland who were diagnosed in the 2-year period 1996-1997 as having endometrial carcinoma.
703 Case notes of all women resident in Scotland who were diagnosed as having endometrial carcinoma between January 1996 and December 1997. Cases that involved operative treatment were analysed
The median interval from referral to definitive operation was 62 days
(90th
centile 150 days), with large variations between health board areas. Delay and survival were inversely related: women with the shortest delay had more advanced disease and survival was least likely for these patients (P values not provided by the authors).

Suspected Cancer: Appendix J2 (June 2015) Page 115 of 264
Goff et al, 2000 USA and Canada
A postal questionnaire was sent to women with ovarian carcinoma in order to evaluate preoperative symptoms and factors that may contribute to delayed diagnosis for women with ovarian carcinoma.
1725 Questionnaires were sent to women subscribed to a newsletter about ovarian carcinoma
95% of patients had symptoms before the diagnosis of ovarian carcinoma. Duration of symptoms was reported as 2 months or less by 30% of patients, 3-6 months by 35%, 7-12 months by 20%, and longer than 12 months by 15% of women. Women who ignored their symptoms were significantly more likely to be diagnosed with advanced disease compared to those who did not (85% vs. 74%; P = 0.002). There was no correlation between specific symptoms and delayed diagnosis (no P value given). Women with the most symptoms required significantly more time to make the diagnosis (P = 0.001); they were also more likely to be treated for another condition (P = 0.001), were younger (P = 0.001), were less likely to receive a diagnosis at an early stage (P = 0.001), and more likely to perceive that health care provider attitude towards them was a problem (P = 0.001). The type of health care provider initially seen by the women was a family practitioner in 34% of cases, an obstetrician-gynaecologist in 37%, an internist in 16%, a nurse practitioner in 3%, and other in 10% of cases. The time required by a health care provider to make the diagnosis was reported as less than 3 months by 55%, but greater than 6 months by 26%, and greater than 1 year by 11%. Time required to make the diagnosis was similar for the main three health care provider types (family practitioner, obstetrician-gynaecologist,

Suspected Cancer: Appendix J2 (June 2015) Page 116 of 264
Author Setting Description No. Inclusion Exclusion Results Quality
internist). Significantly more stage I/II tumours were diagnosed by obstetricians-gynaecologists than by other health care providers (P = 0.009). Other factors significantly associated (by univariate analysis) with delay in diagnosis were omission of pelvic examination at first visit (P = 0.016), and not initially organising an ultrasound, computed tomography, or CA125 (P = 0.001). Multivariate analysis was performed with linear regression to evaluate factors that were associated with the number of months to make a diagnosis. Only 20% of the delay is explained by the factors evaluated by the authors. The factors most significantly associated with delay in diagnosis were amount of time patients had symptoms (P = 0.001), the number of health care providers seen (P = 0.06), symptoms being ignored (P = 0.07), and initial incorrect diagnosis (P = 0.08).

Suspected Cancer: Appendix J2 (June 2015) Page 117 of 264
Jones and Joura, 1999
New Zealand
The authors examined the preceding clinical events in women presenting to a tertiary care gynaecologic oncology unit with squamous cell carcinoma of the vulva between the years 1989 and 1996. History, clinical findings, previous physician contact, investigations and treatment were analysed.
102 The age range was 36-94 years. Vulval symptoms were present for more than six months in 88% of patients and for more than five years in 28%. No statistical differences were noted in the duration of symptoms when the patients were grouped according to age. A history of intermittent or chronic vulval irritation was elicited in 94% of patients. In 31% of cases the women had had three or more medical consultations on account of vulval symptoms more than six months before the diagnosis of invasive cancer. The length of the history and the number of consultations were independent of age. A history of the prior application of topical oestrogen or corticosteroid to the vulva was elicited in 27% of women. Twenty-five percent of patients had previously had a diagnostic biopsy. Seventeen women (68%) with a history of preceding biopsy presented with stage I disease as compared with 26 (34%) in the cohort without a preceding biopsy (P < 0.01).

Suspected Cancer: Appendix J2 (June 2015) Page 118 of 264
Kirwan et al, 2002
A retrospective review of General Practice records of patients with epithelial ovarian cancer was conducted with the aim to identify referral pathways from primary care for women with ovarian cancer. In particular delays between the onset of symptoms and presentation to the general practitioner and delays between presentation and referral to hospital were examined.
135 Patients with epithelial cancer identified from an audit in the Mersey area between 1992 and 1994.
105 patients (78%) presented to the general practitioner within one month of developing symptoms and 64 (47%) within two weeks. Only 11 patients (8%) delayed more than three months before seeking medical advice. Primary symptoms in the patients’ notes were abdominal swelling (65), change in bowel habit (34), weight loss (11), backache (3), vaginal bleeding (15), and other (30). General practitioners referred 68 (50%) patients to hospital directly after their first consultation, 82 (60%) within 2 weeks, and 99 (73%) within one month. 36 patients (27%) experienced delays of over three months, half of whom were misdiagnosed as having irritable bowel syndrome. The mean age of the survivors was less than that of patients who died (63.7 years v 69.0 years, P=0.014). Multivariate analysis with survival as the dependent variable identified age (odds ratio 0.96, 95% confidence interval 0.93 to 0.99), cancer stage III or more (0.15, 0.05 to 0.43), and non-specific symptoms (0.36, 0.14 to 0.89) as significant variables
Smith and Anderson, 1985
USA Women were interviewed in order to evaluate the characteristics of symptoms, perceived cause, and delay in seeking a diagnosis associated with stage, grade, and histologic features of disease at diagnosis among incident cancers of the ovary. Delay was defined as the time interval (exceeding one week)
82 Women with histologically confirmed primary of the ovary within the last 3 months.
cases were excluded from the analysis were those that that could not be interviewed due to severe illness, those that refused, those who’s physician refused to allow contact and those that did not have their
56 (68.3%) women noticed symptoms before diagnosis. Women who were 40 years of age or older were significantly (P < 0.05) more likely to report having symptoms that convinced them to see a physician for diagnosis. Overall, fewer than 10% thought that they had cancer, and most women believed that their problems
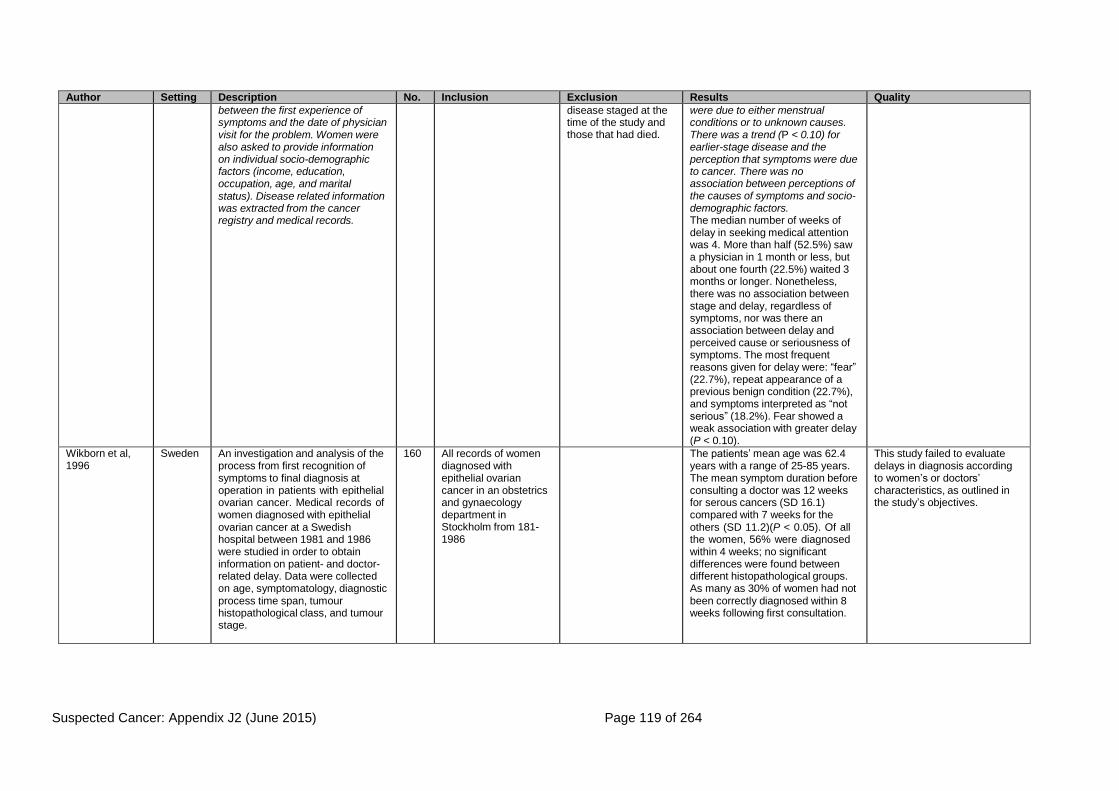
Suspected Cancer: Appendix J2 (June 2015) Page 119 of 264
Author Setting Description No. Inclusion Exclusion Results Quality
between the first experience of symptoms and the date of physician visit for the problem. Women were also asked to provide information on individual socio-demographic factors (income, education, occupation, age, and marital status). Disease related information was extracted from the cancer registry and medical records.
disease staged at the time of the study and those that had died.
were due to either menstrual conditions or to unknown causes. There was a trend (P < 0.10) for earlier-stage disease and the perception that symptoms were due to cancer. There was no association between perceptions of the causes of symptoms and socio- demographic factors. The median number of weeks of delay in seeking medical attention was 4. More than half (52.5%) saw a physician in 1 month or less, but about one fourth (22.5%) waited 3 months or longer. Nonetheless, there was no association between stage and delay, regardless of symptoms, nor was there an association between delay and perceived cause or seriousness of symptoms. The most frequent reasons given for delay were: “fear” (22.7%), repeat appearance of a previous benign condition (22.7%), and symptoms interpreted as “not serious” (18.2%). Fear showed a weak association with greater delay (P < 0.10).
Wikborn et al, 1996
Sweden An investigation and analysis of the process from first recognition of symptoms to final diagnosis at operation in patients with epithelial ovarian cancer. Medical records of women diagnosed with epithelial ovarian cancer at a Swedish hospital between 1981 and 1986 were studied in order to obtain information on patient- and doctor- related delay. Data were collected on age, symptomatology, diagnostic process time span, tumour histopathological class, and tumour stage.
160 All records of women diagnosed with epithelial ovarian cancer in an obstetrics and gynaecology department in Stockholm from 181- 1986
The patients’ mean age was 62.4 years with a range of 25-85 years. The mean symptom duration before consulting a doctor was 12 weeks for serous cancers (SD 16.1) compared with 7 weeks for the others (SD 11.2)(P < 0.05). Of all the women, 56% were diagnosed within 4 weeks; no significant differences were found between different histopathological groups. As many as 30% of women had not been correctly diagnosed within 8 weeks following first consultation.
This study failed to evaluate delays in diagnosis according to women’s or doctors’ characteristics, as outlined in the study’s objectives.

Suspected Cancer: Appendix J2 (June 2015) Page 120 of 264
APPENDIX B REFERRAL FOR SUSPECTED CANCER FULL
GUIDELINE JUNE 2005
Appendix B
Evidence tables for the chapters on:
• Urological cancer
• Haematological cancer
• Skin cancer
• Head and neck cancer including thyroid cancer
• Brain and CNS cancer
• Bone cancer and sarcoma
• Cancer in children and young people

Suspected Cancer: Appendix J2 (June 2015) Page 121 of 264
Table 1 UROLOGICAL CANCER: signs and symptoms, including risk factors
Author Setting Description No. Inclusion Exclusion Results Gold
Std Quality
Brett, 1998 Men attending a general practice in Perth were offered both digital rectal examination and PSA tests
211 men. Men aged 50–79 attending a solo general practice in Perth, in 1996
A prostate was regarded as abnormal on examination if there was evidence of nodularity, induration, asymmetry or absence of median sulcus. 199 (91.0%) were found to have a normal prostate, and 19 (9.0%) abnormal. The PSA test was regarded as normal if results were in the 0-4ng/ml range. 191 (90.5%) were in the normal range, and 20 (9.5%) were abnormal. Of the 211 patients, 182 were normal on both tests, 29 having an abnormal finding on one or other test. From the 29, 11 biopsies were performed, with prostate cancer detected in three (27.3%). Twelve patients opted for various reasons not to undergo biopsy (eight had had biopsies in the past), and six were not biopsied because of poor health.
Bruyninckx et al, 2003
A study of patients attending general practices with macroscopic haematuria. Patients were followed up for 18 months to determine final diagnosis.
83 general practitioners.
409 patients with macroscopic haematuria
all patients attending with macroscopic haematuria 1993-1994 in a network of Belgian general practices
409 patients attended with macroscopic haematuria and 126 patients diagnosed during the same period as having urological cancer. The mean age of patients with macroscopic haematuria was 57 years, but the age of those with cancer was 72 years. 13% of those with haematuria were younger than 40 years and 53% older than 60 years. In 87 patients (70 males, 17 females) bladder cancer was detected, and in 39 other urological cancers were detected. 75 of the 126 patients reported macroscopic haematuria in the weeks before diagnosis, giving a sensitivity for a diagnosis of any urological cancer of 59.5% (95% CI 50.4-68.1%). The PPV of macroscopic haematuria for the diagnosis of urological cancer was 10.3% (95% CI 7.6-13.7%). Occurrence of haematuria with dysuria or increased frequency of micturition did not change the likelihood of cancer

Suspected Cancer: Appendix J2 (June 2015) Page 122 of 264
Author Setting Description No. Inclusion Exclusion Results Gold Std Quality
Buntinx, 1997 This was a systematic review of studies of the diagnostic value of macroscopic haematuria in diagnosing urological cancers in primary care. Studies were sought using Medline and FAMLI databases. From the studies selected, none had been undertaken in primary care, most being based on chart reviews in hospital settings of referred patients
14 studies
Burgers, 1992 A comprehensive review of penile cancer Cancer of the penis is rare, accounting for only 0.4-0.6% of all male malignancies in the US (incidence 0.2/100,000 males/year). Squamous cell carcinoma accounts for at least 95% of cases, sarcomas being the most common non-squamous type. It usually presents in the sixth decade of life, with a mean age at diagnosis of 58. There is an association between absence of circumcision and penile cancer, but the precise aetiology is unclear. The possible role of pre-malignant conditions has not been clarified. Presentation is varied, ranging from innocuous areas of in-duration, erythema or warty growth to obvious extensive carcinoma with sloughing. The earliest symptoms include itching or burning, and ulceration which progresses to a lump, mass or nodule if left untreated. Pain is usually minimal in relation to the other features. It can occur at any anatomical site; 48% develop in the glans, 21% prepuce, both (9%), coronal sulcus 6%, shaft <2%.
Chamberlain et al, 1997
This was a review of the costs of diagnosis and management.
No data were found on diagnostic procedures in general practice or of delay in diagnosis of symptomatic prostate cancer, although variation in general practitioners’ skill in DRE was noted. The authors were unable to make any recommendations relating to diagnosis in primary care.

Suspected Cancer: Appendix J2 (June 2015) Page 123 of 264
Daniels, 2003 Retrospective review of a series of cases presenting 1993-2000 to a UK specialist breast surgeon with breast enlargement
175 men 127 of the men had gynaecomastia, eight had breast cancer, and four had testicular cancer, three of whom had a

Suspected Cancer: Appendix J2 (June 2015) Page 124 of 264
or lumps in men testicular mass at presentation. Author Setting Description No. Inclusion Exclusion Results Gold Std Quality
DoH, Referral Guidelines for Suspected Cancer, 2000
Provides information on the incidence of prostate, bladder, kidney, testis and penis cancer.
Fowler et al, 2000 The aim of the study was to determine whether features used to detect prostate cancer are different in black and white American men
179 black and 357 white men
black and white men who had undergone prostate biopsy 1992-1999 at one medical centre
The patients had an abnormal DRE, a PSA of less than 4ng/ml and no history of prostate surgery. Cancer was detected in 38 black (21%) and 65 white (18%) men. There was no difference in the overall or PSA stratified cancer detection rate.
Gospodarowicz, 1999
A review of testicular cancer. Testicular cancers are uncommon, occurring most commonly in men aged 15 to 35 years. The majority are primary germ cell tumours (GCT). Although the incidence of germ cell tumours has doubled in the past 30 years, the mortality has declined. There is considerable geographic and ethnic variation in incidence of germ cell tumours, it being less common in non- whites. Men with a history of cryptorchidism have an approximate five- fold risk. Family clusters have been reported, and patients with XY gonadal dysgenesis are at increased risk. Prior testicular cancer is also a risk factor for cancer in the surviving testis. Patients with tumours most commonly present with painless testicular enlargement. Up to 45% have testicular pain. Less common presentations include features of metastasis, for example back pain and dyspnoea.
Haid et al, 1994 USA This study involved men who had undergone transrectal ultrasound at a US hospital. The records were reviewed to extract information on findings from digital rectal examination (DRE), prostate biopsy reports, and PSA levels. With biopsy as the gold standard, 32 (32.3%) of the 99 had carcinomas.
99 men Among those with carcinoma, 24 (77.4%) (of 31 with data) had a palpable nodule on rectal examination, the mean PSA was 32.5, and 15/31 had an abnormality on transrectal ultrasound (48.4%). Among those who did not have carcinomas, 52/64 had a palpable nodule (81.2%), the mean PSA was 8.4, and 26/65 had an abnormality on ultrasound (40.0%).
Huyghe et al, 2003 a review to identify trends in the incidence of testicular cancer. a Medline search for articles published 1980 to 2002 was carried out.
30 studies.
A trend towards an increased rate over the last 30 years was observed in the majority of industrialized countries, including North America, Europe and

Suspected Cancer: Appendix J2 (June 2015) Page 125 of 264
Oceania. There were marked differences between nearby countries, for example 2.5/100,000 in Finland and 9.2/100,000 in Denmark, as well as among regions in the same country. From the limited information available about incidence in ethnic groups, the incidence among white men in the US has increased, but this is not the case among black Americans. Worldwide, only Maori were found to have an incidence as high as that among white males.
Author Setting Description No. Inclusion Exclusion Results Gold Std Quality
Lobel et al, 1998 These guidelines were developed by an international group, and included reference to 89 original articles, although the methods of guideline development were not described in detail. The guidelines give detailed consideration to initial assessment in primary care, but did state that all patients with gross haematuria should be examined and referred to a urologist for assessment for possible bladder tumour. Patients with asymptomatic microscopic haematuria should be referred if they are aged over 50 years. In those under aged 50, the guidelines were uncertain, but noted that the incidence of cancer in this group was 5% with asymptomatic microscopic haematuria and 10.5% with symptomatic microscopic haematuria.
Mansson et al, 1999
Sweden a retrospective case series with being patients identified from a cancer registry and from one district in Sweden (Kungsbacka). The medical records of all patients were reviewed for information about initial symptoms, diagnostic procedures, outcome of diagnostic procedures, level of care, and doctor’s delay. The study collected information about new cases of prostate cancer presenting 1980-1984.
86 cases
Mickisch et al, 2001 These guidelines were prepared by the European Association of Urology following a literature search using Medline, with articles being graded by a panel of experts. The presenting features

Suspected Cancer: Appendix J2 (June 2015) Page 126 of 264
include haematuria, palpable tumour and flank pain. However, presentation with clinical features is becoming less common and many cases are being diagnosed at the asymptomatic stage. The majority of tumours are diagnosed by abdominal ultrasound performed for various reasons.
Author Setting Description No. Inclusion Exclusion Results Gold Std Quality
Morganstern,1998 A review providing a summary of risk factors for urological cancers
Age is the principal risk factor for prostate cancer. Risk factors for the development of bladder cancer in addition to age include cigarette smoking, and occupational exposure among dye, rubber, textile and leather workers. The risk of bladder cancer with tobacco appears to be dose-dependent and partly reversible with smoking cessation, although the risk associated with occupational exposures appear to be relatively long lasting. Most cases of renal cell carcinoma are sporadic, although a small proportion are familial and related to mutations on chromosome 3p and Von Hippel-Lindau disease. There is a moderate, dose- dependent risk associated with cigarette smoking; Increased risk is also associated with excess body weight, hypertension and/or antihypertensives, increased parity, and a variety of occupational exposures including asbestos, petroleum products, and dry cleaning solvents. Acquired cystic kidney disease with renal insufficiency also poses a risk.
Muris et al, 1993 In this review, publications were identified from Medline dated 1982 to 1991,
8 studies
those included involved studies of patients with complaints in which rectal examination was indicated
The sensitivity of rectal examination in detecting prostate cancer was 98% and 92% in the two studies, specificity was 53% and 48%, and likelihood ratio 2.09 and 1.77.
NICE, 2001 This document was classified by NICE as guidance and was commissioned by the Department of Health and the National Assembly for Wales to provide advice to health professionals on the appropriate referral of patients from general to specialist services. A consensus method

Suspected Cancer: Appendix J2 (June 2015) Page 127 of 264
was used to generate the advice. A multidisciplinary panel was established for each topic considered, and selected research evidence was considered. One of the topics considered was urinary tract outflow symptoms. The advice recommended that patients be offered a prostate specific antigen (PSA) test with the reasons for doing the test being explained and the patient counselled with regard to the possible consequences. Patient information on PSA tests can be obtained from the National Electronic Library for Cancer (www.nelc.org.uk). Immediate referral was advised if the patient has acute urinary retention or evidence of acute renal failure; urgent referral was advised if the patient has (a) visible haematuria, (b) there is a suspicion of prostate cancer based on the findings of a nodular or firm prostate, and/or a raised PSA, (c) culture negative dysuria, (d) they develop chronic urinary retention with overflow or night-time incontinence. Referral to be seen soon was advised if the patient has recurrent urinary tract infection or microscopic haematuria. Referral within an appropriate time was advised if the patient has chronic renal failure or renal damage, or symptoms have failed to adequately respond to treatment in primary care. Use of a scoring system such as the WHO International Prostate Symptom Score was encouraged.

Suspected Cancer: Appendix J2 (June 2015) Page 128 of 264
Selley et al, 1997 a systematic review of the diagnosis, management and screening of early localised prostate cancer
From the included studies of digital rectal examination (DRE), it was concluded that 50-95% of localised prostate tumours are palpable and could be detected by DRE. A proportion of the lesions detected on palpation are benign, and include benign prostatic hyperplasia (BPH), retention cysts, prostatic calculi, prostatic atrophy, fibrosis associated with prostatitis, and non-specific granulomatous prostatitis. False positive rates on DRE are as high as 40-50%.
The sensitivity of DRE ranged from 44% to 97% in the four studies reporting this,

Suspected Cancer: Appendix J2 (June 2015) Page 129 of 264
and specificity from 22% to 96%. The reasons for these variable findings were probably related to the different sizes of the studies, case selection and variable final diagnostic criteria.
Author Setting Description No. Inclusion Exclusion Results Gold Std Quality
Summerton et al, 2002
A case series examining people referred to an open access haematuria clinic in the UK. nformation was collected prospectively about clinical features and comorbidities at first clinic attendance. Cases were classified into urological and non- urological cancers, and urological and non-cancerous/normal groups. The associations between clinical features and diagnoses were explored using a variety of statistical techniques, including logistic regression.
363 Patients were aged between 18 and 80
172 patients had macroscopic haematuria and 186 microscopic haematuria. Of the 363 referred patients, no abnormality was detected in 260, 42 had benign prostatic disorders, 12 had strictures or stenoses, 13 had calculi, and 36 had urological cancers (28 of which were bladder cancers, two prostate cancers, five renal cancers, and one had both renal and bladder tumours). In multivariate analysis, the variables tending to be associated with urological cancer were older age, male sex, macroscopic haematuria (especially if a single episode), poor stream, history of urinary tract infection and smoking.
final diagnosis was established by cystoscopy and radiological assessment, supplemented by review of the records to check for any changes in diagnoses over time
Zeegers at el, 2003 This review sought to determine the risk of prostate cancer among relatives of affected patients. Studies published up to 2002
33 studies
Studies published up to 2002
From the pooled findings, the relative risk among first-degree family members was 2.53 (95% CI 2.24-2.85). The risk for second-degree relatives was only slightly elevated (1.68, 95% CI 1.07-2.64). Among first-degree family members, the risk increased with the number of affected relatives and decreased with increasing age of the affected relative.

Suspected Cancer: Appendix J2 (June 2015) Page 130 of 264
Table 2 UROLOGICAL CANCER: investigations
Author Setting Description No. Inclusion Exclusion Results Gold
Std Quality
Garnick, 1996
This review was one of a series concerned with aspects of prostate cancer. Articles published 1992-1996 were sought in a search of Medline. A largely qualitative analysis of the identified articles was undertaken
Most of the initial screening studies that had assessed an abnormal PSA had used 4.0ng/ml as the upper limit of normal. Several studies have considered methods of refining interpretation of the PSA test. The PSA density refers to a numerical ratio determined by dividing the PSA serum value by the volume of the prostate gland as determined by transrectal ultrasonography. This gives the PSA value per gram of prostate, and densities of 0.15 or more may strongly indicate the presence of cancer. However, estimation of the volume of the prostate gland is subject to error. Prostate-specific antigen velocity refers to the rate of change in the PSA value over time. A value that continues to increase over time may signal cancer. Two studies of the value of PSA velocity were included in the review, and they indicated that a change of more than 0.75ng/ml per year should be regarded with a high degree of suspicion. Recent studies have also suggested that the upper-limit of normal PSA value varies by age, being lower in younger than older men. Some preliminary studies have been undertaken of the potential role of the relative percentage of free PSA and PSA bound to serum proteins.
Glas et al, 2003
Systematic review of articles that evaluated tumour markers in the diagnosis of primary bladder cancer. The markers included cytology, bladder tumour antigen, BTA stat, BTA TRAK, NMP22, telomerase and fibrin degradation product. Relevant studies that evaluated at least one of these markers were sought in a search of Medline and Embase for articles published 1990 to 2001.
42 studies.
Selley et al, 1997
This was a systematic review of the diagnosis, management and screening of early localised prostate cancer
PSA is a protease produced almost exclusively by prostatic epithelium. The normal range is between 0- 4ng/ml, although some men with cancer have values in the normal range, and high values can be caused by conditions other than cancer. Reports of PSA sensitivity range from 57-99%, and specificity from 59-97%. The gold standard test used in studies of PSA testing is prostate biopsy, but in the primary studies not all men with elevated results would have undergone biopsy. Therefore, the true number of cancers cannot be accurately determined. The review found that evidence to support use of PSA density was equivocal, and that further research was needed into the role of PSA velocity, free and bound PSA and age-specific reference ranges for PSA normal values.
Thomas General practices were randomized to receive the 66 general General practitioner compliance with the guidelines
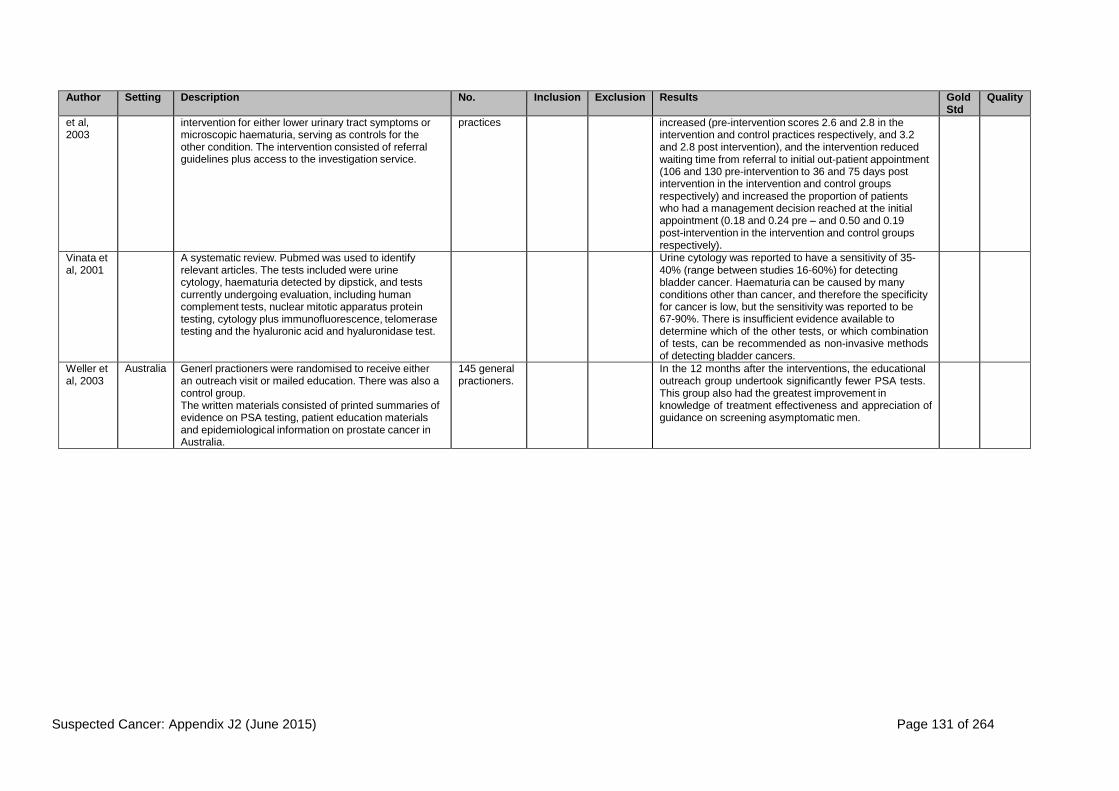
Suspected Cancer: Appendix J2 (June 2015) Page 131 of 264
Author Setting Description No. Inclusion Exclusion Results Gold Std
Quality
et al, 2003
intervention for either lower urinary tract symptoms or microscopic haematuria, serving as controls for the other condition. The intervention consisted of referral guidelines plus access to the investigation service.
practices increased (pre-intervention scores 2.6 and 2.8 in the intervention and control practices respectively, and 3.2 and 2.8 post intervention), and the intervention reduced waiting time from referral to initial out-patient appointment (106 and 130 pre-intervention to 36 and 75 days post intervention in the intervention and control groups respectively) and increased the proportion of patients who had a management decision reached at the initial appointment (0.18 and 0.24 pre – and 0.50 and 0.19 post-intervention in the intervention and control groups respectively).
Vinata et al, 2001
A systematic review. Pubmed was used to identify relevant articles. The tests included were urine cytology, haematuria detected by dipstick, and tests currently undergoing evaluation, including human complement tests, nuclear mitotic apparatus protein testing, cytology plus immunofluorescence, telomerase testing and the hyaluronic acid and hyaluronidase test.
Urine cytology was reported to have a sensitivity of 35- 40% (range between studies 16-60%) for detecting bladder cancer. Haematuria can be caused by many conditions other than cancer, and therefore the specificity for cancer is low, but the sensitivity was reported to be 67-90%. There is insufficient evidence available to determine which of the other tests, or which combination of tests, can be recommended as non-invasive methods of detecting bladder cancers.
Weller et al, 2003
Australia Generl practioners were randomised to receive either an outreach visit or mailed education. There was also a control group. The written materials consisted of printed summaries of evidence on PSA testing, patient education materials and epidemiological information on prostate cancer in Australia.
145 general practioners.
In the 12 months after the interventions, the educational outreach group undertook significantly fewer PSA tests. This group also had the greatest improvement in knowledge of treatment effectiveness and appreciation of guidance on screening asymptomatic men.

Suspected Cancer: Appendix J2 (June 2015) Page 132 of 264
Table 3 UROLOGICAL CANCER: delay and diagnostic difficulties
Author Setting Description No. Inclusion Exclusion Results Quality
Khadra et al, 2002
UK, Primary Care
The aims of this study were to investigate the level of awareness of testicular cancer (TC) and practice of testicular self examination (TSE) in male GP attenders, and to see if TSE was related to age, marital status, education, ethnicity, social class, knowing someone with TC, having attended a Men's Health Clinic and having heard of a TC awareness campaign. The authors recruited men from two English general practices, one inner city and one suburban. Confidential questionnaires were given out to consecutive male patients between the ages of 18 and 50 years attending the GP surgeries over a period of 1 month. The data were analysed using SPSS.
202 Male patients between the ages of 18 and 50 years
Not explicitly mentioned
Although 91% of men claimed to be aware of TC, only 26% knew both the age group most affected (25–34 years) and that TC can be curable if detected early. Forty-nine per cent of responders had carried out TSE in the past year, but only 22% did so according to recommendations, i.e. feeling for lumps on a monthly basis. TSE was associated with age >35 years, white ethnicity, having correct knowledge of TC, knowing someone with TC, having attended a Men's Health Clinic and having heard of a TC awareness campaign. TSE was suggested by the media to 56% of those who examined themselves and by a nurse or GP to only 16%. Forty-eight per cent of those carrying out TSE had received written instructions, and 10% had received a testicular examination by their GP. Only 3% had attended a Men's Health Clinic in the past. Of those 103 responders not carrying out TSE, 71% said they did not know what to do, 27% said they were too busy and 2% were afraid they might discover a lump. Eighty-five per cent (169/199) of the men were keen to find out more about TSE and 67% (136/202) would attend a Men's Health Clinic if one were set up in their GP's surgery.
Lechner et al, 2002
Netherlands Population based
This study analysed what determinants are important to describe and explain the intention of testicular self-examination (TSE). The authors recruited the subjects by approaching several high schools and asking them if they were prepared to let the researcher administer the written questionnaire among their male high school students aged 15– 20. Four schools were needed to get the needed sample for the study, and they were randomly selected from the available six schools.
274 Young men aged 15–19 attending senior high school.
Not explicitly mentioned.
Knowledge of testicular cancer and TSE was very low: 74% had never heard of testicular cancer and only 3% of all students had ever heard of TSE. Of all subjects, only 2% (n = 5) reported that they regularly performed TSE. Since knowledge and behaviour levels were so low, they showed no significant correlation with intention or any of the other determinants related to TSE. After hearing of TSE (through the questionnaire), 41% of students had a positive intention to perform TSE (32% positive, 9% very positive), while 27%
Reliability analysis showed that the assessment of some concepts still has room for improvement. Furthermore, there is still limited insight in the validity of the concepts assessed. Therefore, further research is needed in order to get more insight in the validity of the concepts assessed and to find out whether the assessments of the different concepts of the model can still be improved.
Since hardly any of the young

Suspected Cancer: Appendix J2 (June 2015) Page 133 of 264
Author Setting Description No. Inclusion Exclusion Results Quality
The questionnaire assessed determinants, including knowledge, attitude (positive and negative consequences, anticipated regret, and moral obligation), social influence (social norm, social support and modelling) and self-efficacy. Data analysis included basic descriptive statistics of the respondents. Statistical differences between the various intention groups were analysed using one-way ANOVA with Scheffé's multicomparison tests. Linear regression analysis was used to assess the predictive value of the determinants for the intention to perform TSE. All analyses were performed using the SPSS-X statistical program (SPSS Inc., 1988) (differences were significant at P < 0.05).
had a negative intention to do TSE (20% negative, 7% very negative). The rest of the subjects had not yet formed an intention. The highest correlations with intention were found for the moral obligation that subjects experienced to perform TSE, their self-efficacy expectations, the expected positive consequences of TSE, the social norm that subjects experienced and the regret they expected to feel if they did not perform TSE. The various intention groups (positive, neutral and negative) differed significantly on almost all of the determinants. Multiple regression analysis showed that young men who where anxious about TSE and those who were not anxious had different determinants explaining the variance in the intention to perform TSE regularly (R
2 = 41–57%).
men in this study performed TSE regularly, the determinants of behaviour were not assessed. Instead, the determinants of intention were analysed.

Suspected Cancer: Appendix J2 (June 2015) Page 134 of 264
Mansson et al, 1993
Sweden, Population based study (Primary and Secondary Care)
The study was undertaken to investigate various factors which may play a role in patient’s delay and doctor’s delay in the diagnosis of bladder cancer. The authors examined the clinical records of all patients with a diagnosis of bladder cancer as gathered from a regional tumour registry. Variables extracted from the records included onset date and specific pattern of symptoms, date and place of first medical consultation, referral patterns, investigations, and date of diagnosis, amongst others. The extracted variables specially studied in each case were patient’s delay and doctor’s delay. A questionnaire was sent to patients who were still alive on January 1, 1991. The replies were designed to reflect how seriously the patients viewed their first symptoms of bladder cancer, their experiences of previous serious or protracted illness, and their habitual perception of bodily changes and level of general education.
343 Patients with diagnosis of bladder cancer established in 1988.
Patients with non- malignant disease (n=16), recurrent bladder cancer (8), prostatic cancer (1), pathologist’s report dated 1989 (20), or missing records (5).
The clinical records of 343 patients were examined, and 203 patients completed the questionnaire (88.6% of those eligible). Macroscopic haematuria was the commonest symptom bringing the patient to the doctor. Urgency was more common in advanced than in superficial cancer (51% vs.34%, p<0.002). No correlation was found between presence of haematuria and tumour category. 161 (67%) patients initially consulted a primary unit of the health services (mostly a general practitioner) and 51 (15%) a private practice (mostly a general practitioner or gynaecologist). The remaining 118 patients presented at a hospital. Three patients (1%) never sought medical advice and were diagnosed at post-mortem examination). The median patient’s delay was 15 days (mean 141, range 0-2,857). There was no relationship between this delay and age or gender. The type of symptom was an important factor in patient’s delay. Neither urgency of micturition nor pain prompted the
The power to detect true median differences is low, since the delay variables are very skewly distributed and have large variances.
Good retrospective observational study. Some bias may have been introduced as respondents to questionnaire differ from non- respondents, i.e. alive patients, younger, and with earlier tumour stage.

Suspected Cancer: Appendix J2 (June 2015) Page 135 of 264
Author Setting Description No. Inclusion Exclusion Results Quality
Intergroup differences in patient’s and doctor’s delay were analysed with Wilcoxon’s rank sum test and Kruskal- Wallis test. The χ² test was used to compare categorical variables. All tests were two-sided.
patient to seek medical advice as quickly as haematuria (median 45 and 38 vs. 5 days, p<0.001). Although the difference was not statistically significant, median patient’s delay was longer in patients with advanced cancer than in those with superficial tumour. Amongst the responders to the questionnaire, no correlation was demonstrable between patient’s delay and level of education, perceived seriousness of initial symptoms, or civil status. The median doctor’s delay was 62 days overall. It was longer for women than for men (76 vs. 59 days, p<0.05). The initially consulted health-service level was a major factor in doctor’s delay (p<0.001), with median range from 78 days for patients initially seen in a primary care unit to 21 days when the patient came directly to a department of urology, but the longer median delay was not due to delayed referral to a specialist, since in the total series doctor’s delay phase A was only 6 days, whereas phase B was 47 days (suggesting considerable waiting time in the referral system). The use of urine cytology and intravenous urography in general or private practice was associated with some, but not significant, shortening of doctor’s delay. As in patient’s delay, the nature of presenting symptoms greatly influenced doctor’s delay, which was shorter with haematuria plus pain than with haematuria only, and longest when urgency was the only symptom (median 44, 53 and 114 days, p<0.001). Patient’s age influenced doctor’s delay. The median thus was less in patients younger than 70 years than in older patients, viz. 54 and 69 days (p<0.01).

Suspected Cancer: Appendix J2 (June 2015) Page 136 of 264
Mommsen et al, 1983
Denmark, Primary and Secondary Care
The purpose of this study was to elucidate causes of delay.
The authors interviewed all consecutive patients with newly diagnosed bladder tumour admitted to a department of Oncology and Radiotherapy during a 3-year period beginning in September 1977.
The interview concerned symptom, some demographic variables and the time intervals under study (phases A, B, and C).
The statistical procedures included χ² test.
212 patients
Patients with newly diagnosed bladder tumour.
Terminal, intractable cases.
The presenting symptom was haematuria, which commonly was painless, in 79% of the patients. The interval from onset of symptoms until treatment averaged 28 weeks (median = 15 weeks). The general practitioner delay comprised half of the total delay. Half of the patients consulted their general practitioner within a week after onset of the presenting symptom. A higher percentage of men than of women had a delay of ≥ 13 weeks. Fewer women than men (62% and 82%) were referred to hospital within 12 weeks of the index consultation with the general practitioner (χ² = 8.97; d.f.=1; p <0.005). Of the patients with haematuria, 13% of the men but 35% of the women were referred to hospital after 13 weeks or more (χ² =9.70; d.f.=1; p<0.005). Cystitis as the presenting symptom was associated with later referral to hospital than haematuria; this was most pronounced for men (χ²=12.56; d.f.=1; p<0.005).
The authors confirmed the reliability of the time data by comparing the intervals reported by the patients with corresponding information derived from the general practitioner’s records in 10% of a random sample of these patients. Skewness in distribution of delay. Small study with limited power.
Wallace et al, 1999
UK, Secondary Care
The authors examined the relationship between delay in presentation of patients with bladder cancer and tumour stage and material deprivation. Data on delay periods to treatment, tumour characteristics, occupation and postcodes were collected for patients with urothelial cancer presenting to a Regional Cancer Intelligence Unit. The Townsend material deprivation score was derived from the patient’s postcode (the score assesses four variables measuring unemployment, overcrowding, wealth and income).
1537 Patients with urothelial cancer.
Not explicitly mentioned.
A delay of < 2 weeks in the referral to hospital was associated with a 6% improvement in survival (P = 0.018); shorter delays to hospital appointment correlated inversely with survival (P < 0.001). The overall delay time and delay to hospital admission did not correlate with survival. The deprivation scores showed no correlation with delay times, smoking or T-category of tumour. Material deprivation was correlated with low tumour grade (P = 0.004) and better survival (P = 0.02).
Poor definition of delay and description of methods (only abstract was available for inspection). Most of the study relates to the association between delay and survival, which as such is not relevant to the guidelines.

Suspected Cancer: Appendix J2 (June 2015) Page 137 of 264
Wallace et al, 2002
UK, Secondary care.
The authors attempted to collect data prospectively on all newly diagnosed cases of urothelial cancer in the West Midlands from 1 January 1991 to 30 June 1992. The data collected included the dates of onset of symptoms, first referral by the GP, first hospital appointment and first definitive treatment. Clinical details collected included the presence or absence of haematuria (macroscopic or microscopic), the number, size and type of tumours, and the findings of the bimanual examination. Details of patient characteristics were also
1537 patients
Not explicitly mentioned
Not explicitly mentioned
The median (IQR) Delay 1 was 14 (0– 61) days. Patients with a longer delay were more likely to present with a higher stage tumour (P=0.04). Patients with an unknown haematuria status were more likely to have a shorter delay (P<0.001). No other patient or tumour characteristics showed a significant difference above or below the median delay. Delay 1 had a significant effect on survival; patients with a delay of <14 days to referral had an improved survival of 5% at 5-years compared with those who had a delay of >14 days (P=0.02). Adjusting for tumour stage,
Clinically based data (presence or absence and degree of haematuria) and more detailed epidemiological data (smoking status, risk of occupational exposure) relied upon clinicians and patients to complete questionnaires and some data are incomplete.

Suspected Cancer: Appendix J2 (June 2015) Page 138 of 264
Author Setting Description No. Inclusion Exclusion Results Quality
collected. In addition, patients were asked to complete a questionnaire on their smoking and occupational history.
Associations between the patient characteristics and median delay times were analysed using Pearson's chi-squared test for categorical data and the Mann–Whitney U-test for continuous data.
there was a trend for patients with a shorter Delay 1 to have a better survival (P=0.06). The median Delay 2 was 28 (7–61) days. Patients known to have had macroscopic haematuria (n=1032) were more likely to have a shorter delay than those known to have had microscopic haematuria (n=70); patients with an unknown haematuria status were more likely to have a longer delay (P<0.001). There were no other significant differences in patient or tumour characteristics above or below the median delay. Patients who had a shorter Delay 2 had a significantly worse survival (P=0.001). Survival by Delay 2 after adjusting for tumour stage similarly showed that patients with a shorter Delay 2 had significantly worse survival (P=0.001). The median total delay was 110 (62– 209) days. Longer delays were significantly associated with women (P=0.05), younger patients (P=0.03), non-smokers (P=0.04) and patients with a low risk of occupational exposure (P=0.04). No other patient or tumour characteristics showed significant differences above or below the median delay. The total delay had no effect on survival (P=0.17); this was also true after adjusting for tumour stage (P=0.43). For prognostic factors, there was no survival difference for sex (P=0.92), haematuria (P=0.39) and number of tumours (P=0.13), both in the log-rank analysis and Cox regression models.
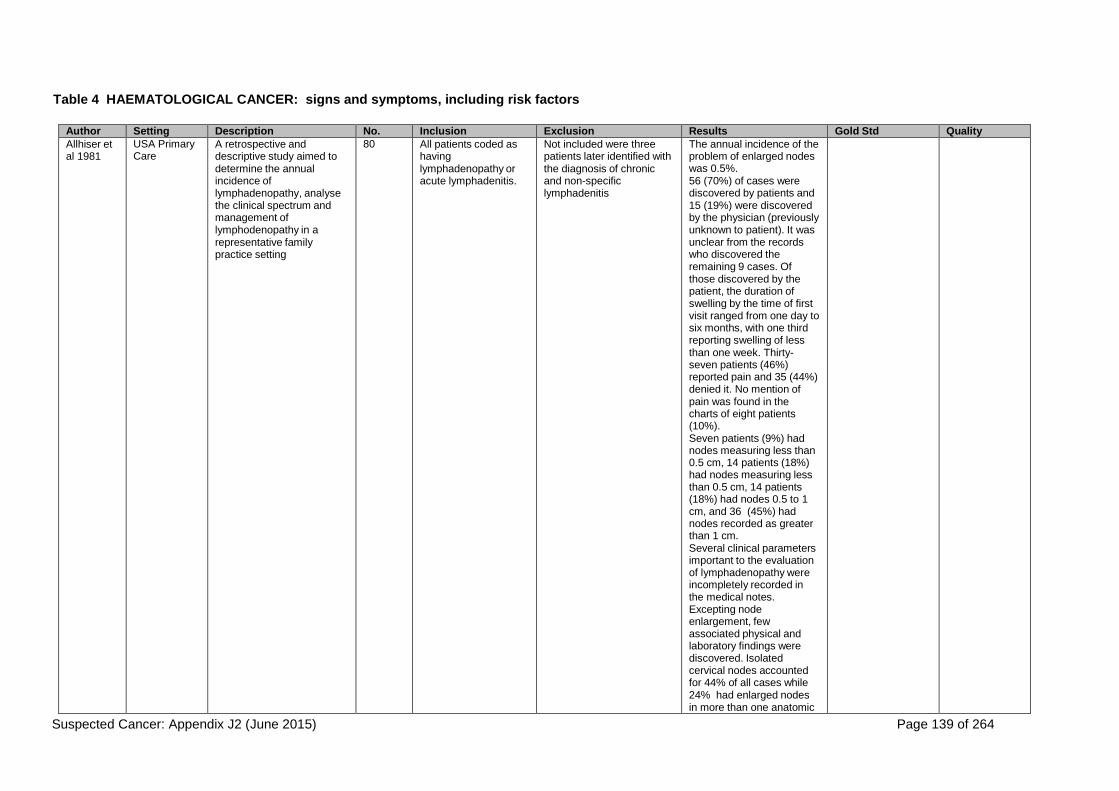
Suspected Cancer: Appendix J2 (June 2015) Page 139 of 264
Table 4 HAEMATOLOGICAL CANCER: signs and symptoms, including risk factors
Author Setting Description No. Inclusion Exclusion Results Gold Std Quality
Allhiser et al 1981
USA Primary Care
A retrospective and descriptive study aimed to determine the annual incidence of lymphadenopathy, analyse the clinical spectrum and management of lymphodenopathy in a representative family practice setting
80 All patients coded as having lymphadenopathy or acute lymphadenitis.
Not included were three patients later identified with the diagnosis of chronic and non-specific lymphadenitis
The annual incidence of the problem of enlarged nodes was 0.5%. 56 (70%) of cases were discovered by patients and 15 (19%) were discovered by the physician (previously unknown to patient). It was unclear from the records who discovered the remaining 9 cases. Of those discovered by the patient, the duration of swelling by the time of first visit ranged from one day to six months, with one third reporting swelling of less than one week. Thirty- seven patients (46%) reported pain and 35 (44%) denied it. No mention of pain was found in the charts of eight patients (10%). Seven patients (9%) had nodes measuring less than 0.5 cm, 14 patients (18%) had nodes measuring less than 0.5 cm, 14 patients (18%) had nodes 0.5 to 1 cm, and 36 (45%) had nodes recorded as greater than 1 cm. Several clinical parameters important to the evaluation of lymphadenopathy were incompletely recorded in the medical notes. Excepting node enlargement, few associated physical and laboratory findings were discovered. Isolated cervical nodes accounted for 44% of all cases while 24% had enlarged nodes in more than one anatomic

Suspected Cancer: Appendix J2 (June 2015) Page 140 of 264
Author Setting Description No. Inclusion Exclusion Results Gold Std Quality
region. The most frequently performed laboratory test was the full blood count (34%) and the most frequent positive test was the throat culture (30%). Twenty percent of patients received antibiotics.
Fijten and Blijham 1988
Dutch Primary Care study.
A retrospective investigation into the probability of malignancy in patients presenting with lymphadenopathy as well as the characteristics that may be discriminatory for malignant causes.
82 Patients who had undergone biopsy for unexplained lymphadenopathy between 1982 and 1984
Patients were excluded if they were not referred for unexplained lymphadenopathy or were not living in the Maastricht area.
Of the 82 patients, 29 had a malignant cause. The prior probability was 1.1% (29/ 2256 patients presenting this problem in family practice) and a posterior probability after referral of 11.0% (29/256) Diagnosis included 14 malignant lymphomas, 15 metastases, 37 reactive lymph nodes without specific diagnosis and 16 benign causes. Age over 40 years (4%) and the presence of an enlarged supracavicular node (50%) were related to an increased likelihood of malignancy (P <0.01). Borderline significance was obtained for an increased sedimentation rate and weight loss. Physician sensitivity of referral for malignant cases was 80 to 90%, 91-98% of benign cases were not referred.
Cytologic or histologic examination was used as the gold standard for malignant and benign lymphadenopathy.
Servaes et al 2002
Netherlands A review of the studies examining the relationship between cancer and fatigue The focus was on fatigue observed in patients during and after treatment for cancer using data from empirical studies.
54 articles
Articles from a Medline, current contents and psychlit Search undertaken for the period July 1980- 2001.
Review articles, editorials/ comments/ practical guidelines, studies in which the sample size was less than 15, studies investigating a sample of subjects other than adult cancer patients (eg children, caregivers), studies in which evaluation of a fatgue-questionnaire was the only intention,
The results from the studies indicate that fatigue was investigated among patients who were undergoing treatment for cancer rather than at the time of initial diagnosis. There was little information on the relationship between fatigue and haematological cancer. No articles were based on
Systematic review. Good review but not related to fatigue in general practice, or not specifically about Haematology.

Suspected Cancer: Appendix J2 (June 2015) Page 141 of 264
Author Setting Description No. Inclusion Exclusion Results Gold Std Quality
uncontrolled intervention studies, studies published in a language other than English or dutch and studies in which fatigue was measured with one or a few items from aquality of life questionnaires.
data in a primary care setting
Wang et al 2002
US Cancer Centre. Participants approached in both outpatient clinics and inpatient units. Tertiary care?
A cross-sectional study using a convenience sample aimed to describe fatigue severity, fatigue interference and associated haematological malignancies. Patients being treated for leukaemia and non- Hodgkin’s Lymphoma completed the Brief Fatigue inventory so that fatigue severity and functional interference caused by fatigue could be assessed. Data regarding patient demographics, Eastern Cooperative Oncology Group performance status, other physical symptoms, current treatments, and laboratory values were also collected. Descriptive statistics, bivariate correlations, and logistic regression were used for data analysis.
228 Patients were eligible if they were aged 18 years or older, had a pathologic diagnosis of leukaemia or lymphoma, and were able to read and understand self-report questionnaires in English.
-- 50% of the sample reported severe fatigue (defined as ‘fatigue worst’ with a rating of 7 or more). Patients with acute leukaemia were more likely to report severe fatigue (61%) compared with those with chronic leukaemia (47%) and non-Hodgkin’s lymphoma (46%) Increased fatigue severity significantly compromised patients’ general activity, work, enjoyment of life, mood, walking and relationships. Fatigue severity was strongly associated with performance status, use of opioids, blood transfusions, gastrointestinal symptoms (P<0.001) and sleep disturbance (P<0.001 and pain (P<0.01). In terms of laboratory variables it was also associated with low serum haemoglobin and albumin levels. Regression analysis revealed nausea was the significant clinical predictor of severe fatigue (odds ratio, 13), and low serum albumin was the significant laboratory value predictor (odds ratio, 3.8)
Primary evidence of fatigue relationship to leukaemia
Williamson 1985
US Primary Care
The primary care charts of patients with enlarged lymph nodes were reviewed to provide a primary care database for evaluating
249 (238 at follow up)
The study population was selected from patients seen between July 1978 and June 1983. patients studied
-- The mean age of patients was 24 years old and 26% were aged under 15 years. 58% of the patients were female. 51% had been

Suspected Cancer: Appendix J2 (June 2015) Page 142 of 264
Author Setting Description No. Inclusion Exclusion Results Gold Std Quality
lymphadenopathy. Data recoded included age, sex, location of enlarged nodes, diagnoses made, laboratory evaluation, outcome, referrals, and information to evaluate adequacy of follow-up.
were all those seen during the 5 year study period whose diagnoses were coded ‘enlarged lymph nodes, not infected’ and ‘lymphadenitis, acute’
seen once for enlarged lymph nodes, 23% had been seen twice and 26% three times or more. A firm diagnosis was made in 36% of patients despite an average of 1.7 visits and two laboratory yests per patient tested. Lymph nodes were biopsied in 3% of patients. No patient was found to have a prolonged, disabling illness without a prompt diagnosis. 18% had associated upper respiratory tract infection, 8% had infected or inflamed tissue near the node site and 5% had insect bites. No patients with potentially serious diseases presented with lumphadenopathy alone; all had associated signs or symptoms that led to a diagnosis. Older patients were more likely to have a serious disease associated with enlarged nodes

Suspected Cancer: Appendix J2 (June 2015) Page 143 of 264
Table 5 HAEMATOLOGICAL CANCER: investigations
Author Setting Description No. Inclusion Exclusion Results Gold Std Quality
Lee et al, 1980
USA, Secondary Care
The authors undertook a retrospective and all- inclusive study of patients who had isolated lymph node biopsies for diagnosis. They then looked at the statistical possibility of various pathological lesions for each of the lymph node biopsies. Data regarding age, sex, and site of node removed were obtained.
925 specimens (collected over a five- year period)
Histological specimens reported that involved only lymph node biopsies
Cases where nodal specimens were taken with resection of any visceral organs, either separately or in continuity (en-bloc) or removed during staging laparotomy for malignant lymphoma
551 (60%) of the nodes removed turned out to be benign lesions, 263 (28%) had carcinomas, and 111 (12%) had malignant lymphoma. Among the peripheral lymph node biopsies, the isolated axillary lymphadenopathy had the highest likelihood (23%) of lymphomatous involvement; second highest, the neck area (18%), and about 8% of the supraclavicular or groin node biopsies. The possibility that any peripheral lymphadenopathy is due to benign process decreases with the patient’s age (for patients younger than age 30, 77-85% of the lesions were benign, 2-8% carcinomatous, and 13-23% lymphomatous; for patients 51-80 years old, 35- 41% had biopsy for benign lesions, 32-47% for carcinomas, and 11-33% for lymphoma). For patients younger than 30 years old, peripheral lymphadenopathies were more likely to be lymphomatous lesions than carcinomas (mean 15% vs 6%); among patients older than 51 years, carcinomas were more common than lymphomas (mean 44% vs 16%). Sex of the patient did not influence the distribution of benign or malignant diagnosis of the lymph node biopsies. 4% of isolated abdominal lymph node biopsies, 1% of intrathoracic nodes, and 15% of peripheral lymph nodes contained lymphoma.
Histological diagnosis (lymph node biopsy)
Purely descriptive, retrospective study. Evaluation process of specimens insufficiently described. Limited extrapolation of findings to primary care setting.
Montserrat et al 1991
Spain Secondary Care
One hundred and seventeen patients with chronic lymphocytic leukaemia from 14
117 Younger patients with chronic lymphocytic leukaemia (of mean
A review of peripheral blood smears, as well as bone marrow aspirate and/or biopsy,
The number of cases of chronic lymphocytic leukaemia rose with age. There was a significant predominance of males (2.08 v
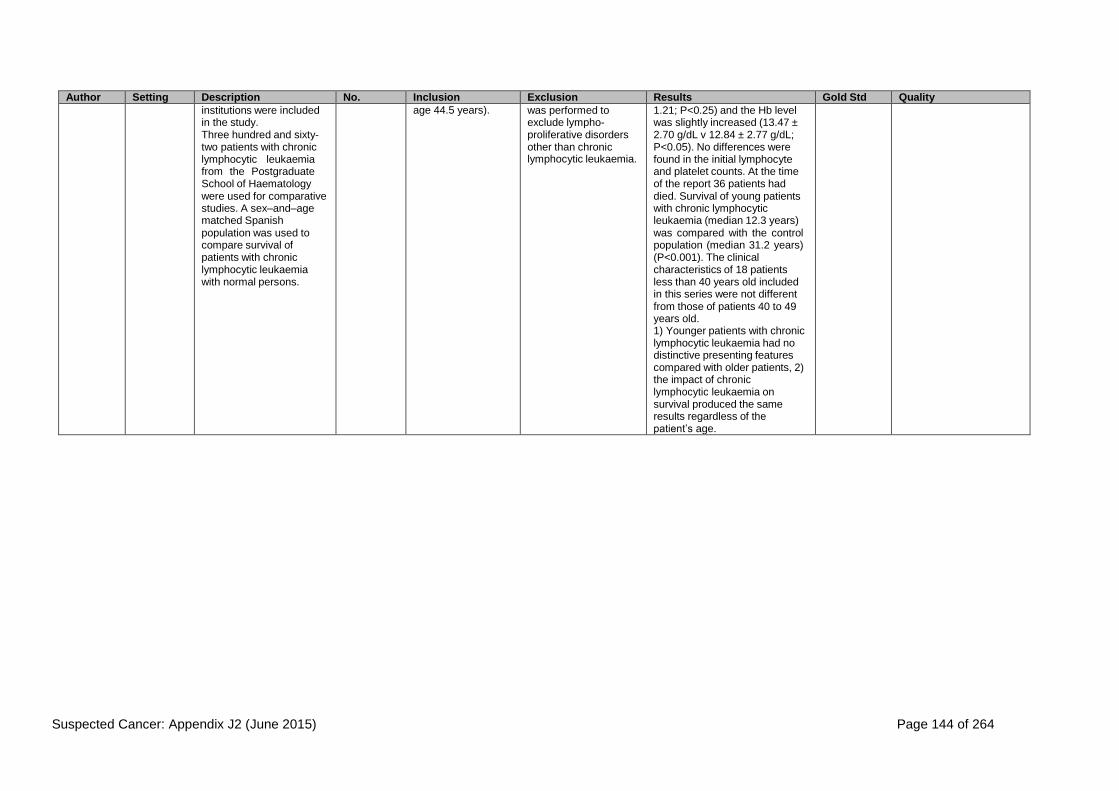
Suspected Cancer: Appendix J2 (June 2015) Page 144 of 264
Author Setting Description No. Inclusion Exclusion Results Gold Std Quality
institutions were included in the study. Three hundred and sixty- two patients with chronic lymphocytic leukaemia from the Postgraduate School of Haematology were used for comparative studies. A sex–and–age matched Spanish population was used to compare survival of patients with chronic lymphocytic leukaemia with normal persons.
age 44.5 years). was performed to exclude lympho- proliferative disorders other than chronic lymphocytic leukaemia.
1.21; P<0.25) and the Hb level was slightly increased (13.47 ± 2.70 g/dL v 12.84 ± 2.77 g/dL; P<0.05). No differences were found in the initial lymphocyte and platelet counts. At the time of the report 36 patients had died. Survival of young patients with chronic lymphocytic leukaemia (median 12.3 years) was compared with the control population (median 31.2 years) (P<0.001). The clinical characteristics of 18 patients less than 40 years old included in this series were not different from those of patients 40 to 49 years old. 1) Younger patients with chronic lymphocytic leukaemia had no distinctive presenting features compared with older patients, 2) the impact of chronic lymphocytic leukaemia on survival produced the same results regardless of the patient’s age.

Suspected Cancer: Appendix J2 (June 2015) Page 145 of 264
Nasuti et al 2000
US Secondary Care
Three hundred and sixty- five FNA specimens from 365 cases performed on palpable and non-palpable masses believed clinically to be lymph nodes, and an additional 22 cases (22 specimens) of extranodal lymphoma specimens diagnosed as representing lymphoreticular tumours at our institution over a five- year period from February 1993 to February 1998 were reviewed.
The results of the lymph node fine needle aspirations (FNAs) were divided into categories of benign/reactive, metastatic malignancies, lymphomas, miscellaneous and non
387 cases -- -- The study demonstrated that the use of LFNA alone was effective in staging a variety of non- lymphoid malignancies over a five year span, as evidenced by a 94% correlation with the surgical pathology diagnosis when available. One false- positive fine needle aspiration of the submandibular node, was stated to be due to the paucity of the diagnostic material at the time of aspiration. For the five year duration of this study only 30% of the 191 patients diagnosed with metastases by LFNA cytology underwent subsequent surgical excision of the lymph node to confirm the diagnosis. The diagnostic accuracy of LFNA enabled 135 patients over a five year span to avoid surgical lymph node
Excisional biopsy or tissue study was performed to confirm the diagnosis.
The evidence presented was relevant to secondary care. It was concluded that strict adherence to cellular adequacy could provide could provide a rapid, less morbid and more cost effective alternative to surgical lymph node staging of non-lymphoid malignancies. There were non diagnostic cases. Sample size was small which possibly accounted for variations in the higher predictive value of LFNA reported in this study. The authors did not specify when there was inadequate material for

Suspected Cancer: Appendix J2 (June 2015) Page 146 of 264
Author Setting Description No. Inclusion Exclusion Results Gold Std Quality
diagnostic. The cytologic diagnosis in all cases was compared with the results of the concurrent flow cytometric analysis and when available, with subsequent histological and flow cytometric findings of the surgically resected lymph nodes to determine diagnostic accuracy.
staging of their cancer. Non-diagnostic cases made up 12% (n=43) of the total LNFNAs. The Subsequent findings of malignancy in 23% of cases emphasised the need for follow- up of cases with inadequate material on FNA. There were 13 out of 43 non diagnostic cases. Follow-up results emphasised the importance of further sampling in non-diagnostic cases.
FNA to be performed for their specific study. The high proportion of non-diagnostic cases comprising 12% (n=43) emphasised the need for follow up of cases with inadequate material on FNA. The relatively high non-diagnostic rate with transbronchial LFNA was explained by the recent introduction of the emerging technology at the institution which required a very bronchoscopist to attempt the procedure.
Pangalis et al 1993
Greece Secondary care
The aim of this study was to determine whether a patient presenting with an enlarged lymph node was within or outside the normal limits. The exact cause of abnormal enlargement was subsequently investigated. This was a Hospital based study combining hospital data with a discussion of the literature review.
The vast majority of pathological
lymph node enlargement < 1cm2
in this Greek hospital based study had a non-specific etiology (118 of 186 patients [63.4%]). Among the specific causes, toxoplasmosis, infectious mononucleosis and tuberculosis were the most frequently encountered. A lymph node size of 2.25cm
2 (1.5 X 1.5cm) was
reported as discriminating between malignant or granulomatous Las from other Las (relative risk = 13.0). Data from the hospital unit suggested that splenomegaly coexists with lymphadenopathy in a small proportion of patients (10 of 220 or 4.5%) The presence of lymphadenopathy and splenomegaly is compatible with infectious mononucleosis (splenomegaly in 50% of the patients) Hodgkin’s disease, non-Hodgkin’s lymphomas, chronic lymphocytic leukaemia, and other leukaemias. Lymph node biopsy was necessary for establishing the diagnosis in 74 out of 220 patients (33.6%).

Suspected Cancer: Appendix J2 (June 2015) Page 147 of 264
Author Setting Description No. Inclusion Exclusion Results Gold Std Quality
Schmidt Et al 1985
Denmark Primary care
A retrospective investigation into the clinical diagnosis of monoclonal gammopathy (MG)
88 cases detected over a three year period
All cases of previously unknown monoclonal gammopathy detected by GP’s via serum protein electrophoresis. (SPE)
Not mentioned. Approximately 10 000 SPE’s were requested and of these 88 cases of MG were found. Results from men and women were similar and therefore grouped together. 15% had malignant monoclonal gammopathy, 5% had non- haematological cancers. In 80% a benign disorder was found MG was most common in patients aged between 60 and 80. 15% had malignany monoclonal gammopathy (MMG) and 85% had monoclonal gammopathy of undetermined significance (MGUS)(classification adapted from kyle 1980) 28 cases were classified as no recognised diease’ but presented with symptoms that made their GP ask for SPE. Only 1 out of 13 individuals below the age of 50 years with MG had a malignant disease. In comparing the age groups; younger than 70 and 70 and above, the results suggest that MMG is more common in the elder group. However even in this grouponly 19% had MMG.

Suspected Cancer: Appendix J2 (June 2015) Page 148 of 264
Slap et al, 1984
USA, Secondary Care
The authors developed a predictive (discrimination) model to differentiate patients whose biopsy results do not lead to treatment from those whose biopsy results do lead to treatment (granulomatous or malignant nodes – Hodgkin’s disease and non-Hodgkin’s lymphoma, and metastatic solid tumour). They reviewed the medical records and histopathology slides of patients who underwent biopsies of enlarged peripheral lymph nodes, and then compared the pathological diagnosis with 22 clinical findings. The authors retrospectively validated the model with a second sample of patients who had also undergone biopsies.
123 patients
9- to 25-year-old patients who had peripheral lymph node biopsies or excisions
Patients were excluded from the study if: (1) a previous biopsy had revealed histopathology, (2) there was no palpable peripheral lymphadenopathy on physical examination, or (3) the medical record or pathology slides were unavailable for review
The following four clinical findings were associated with granuloma or tumour at P<0.05: abnormal chest X-ry, lymph node size on physical examination greater than 2 cm in diameter, history of night sweats, and history of weight loss. A history of recent ENT symptoms (ear ache, coryza, or sore throat) was the only variable associated with the absence of granuloma or tumour at P<0.05. A haemoglobin value of 10.0 g/dl or less was associated with granuloma or tumour at P=0.08. Three of the variables (haemoglobin, night sweats, and weight loss) did not contribute significantly to discrimination. The model developed with the other three variables (chest X-ray, lymph node size, and history of recent ENT symptoms) classified correctly 95 to 97% of patients, with a sensitivity and positive predictive value of 95% and a specificity and negative predictive value of 96%. Chest X-ray was found to have the greatest impact on the discriminant score. The diagnostic performance of the model was significantly better than that of chance alone (P=0.001)
Histological diagnosis (lymph node biopsy)
Study only relevant to people aged 9 to 25 years, model not valid for other age ranges. Blinded assessors. Small sample size. Several problems associated with the derivation of multivariate models: as the number of variables analysed increases, the risks of finding an association where there actually is none increases; the model performance depends on the fidelity and consistency of its component variables (in this study, for example, lymph node size determined by palpation and external measurement). Model may not perform well in settings different from those in which they were derived (variations in disease prevalence, presentation, natural history, or surveillance).

Suspected Cancer: Appendix J2 (June 2015) Page 149 of 264
Vilpo et al 2001
Finland An informal review related to a set of guidelines issued by the Finnish Medical Society Duodecim
The review indicated that the symptom of bleeding in thrombocytopenia may be caused by leukaemia. Typical manifestations in thrombocytopenia were reported as including skin bruising and petechiae and mucous membrane bleeding. Gum and nasal bleeding was particularly common. Bleeding may take place in the alimentary and urinary tracts. Menorrhagia is common. Acquired causes of thrombocytopenia include aplastic anaemia and bone marrow infiltrates (carcinoma, leukaemia, myelofibrosis and tuberculosis).
The article did not present primary data.
Wang et al 2002
US Tertiary Centre
The hospital based study aimed to describe fatigue severity, fatigue interference and associated factors in haematologic malignancies. The relationship between low albumin and severe fatigue was investigated. Data on fatigue severity was categorised and summarised by diagnosis: acute leukaemia, chronic leukaemia and Non- Hodgkin’s lymphoma
228 A convenience sample of cancer patients (n=246) was approached in both outpatient clinics and inpatient units. Patients were eligible if they were 18 years or older, had a pathologic diagnosis of lekaemia or lymphoma.
Ten patients diagnosed with Hodgkin’s disease were not included in the report because of their relatively small number.
Fifty-four percent of patients with severe fatigue had haemoglobin levels of less than 10g/dL. Haemoglobin level was significantly different across diagnoses P=0.000), with NHL patients having significantly higher haemoglobin levels than patients with AL (P=0.000). Fatigue severity was negatively correlated with albumin level (r=- 0.396; P<0.001). Patients with albumin levels lower than the reference range reported significantly higher levels of fatigue than patients with albumin levels within the reference range (fatigue worst, 7.1 v 5.3; P<0.001).
The data used in this study was drawn from secondary care. Information on the nonfatigue symptoms experienced was obtained by asking whether these symptoms were present or absent, instead of using ratings Asking for ratings of the severity of these symptoms (as was used for pain and fatigue) would have helped to clarify the relationship between the severity of the symptoms and fatigue. The study was limited by its cross sectional design. Fatigue was expected to vary over the course of treatments. Patients could experience fatigue caused by disease and treatment.

Suspected Cancer: Appendix J2 (June 2015) Page 150 of 264
Wright et al 1992
UK Secondary and Tertiary Referral Centre
A review of case notes to investigate sources and types of referrals to a haematology department over one year. The following information was recorded: age and sex. Source of referral, reason for referral and time interval between referral and appointment.
The following outcome measures were also analysed: diagnosis, number of subsequent clinic visits and length of follow-up.
226 new patients
All new patients attending the haematology outpatient department during 1989.
-- 56% of referrals were initiated by GP’s, 30% were from consultants in other hospital departments and 25% were cross boundary referrals from hospitals outside the district. 1.8% of referrals were initiated by haematology medical staff (contacting GP’s and suggesting patients be referred following an abnormal full blood count) 56% of GP referrals were prompted by abnormal full blood counts or blood film findings- with haematologists often enclosing a written report suggesting referral. The remaining 1.3% of patients were transferred from private practice. Lymphadenopathy was the most common abnormality leading to referral (11%), followed by an iron deficient picture on a full blood count report (9%), Easy bruising (8%), Neutropenia (6%) and a full blood count report suggesting a myeloprofilerative disorder (6%). GP’s referred all patients with suspected iron-deficiency and 79% of referrals with lymphadenopathy. Hospital consultants referred most cases of thrombocytopenia for investigation, all cases of paraprotein and all cases of lymphoma proven by histology
Good GP based data though small study.

Suspected Cancer: Appendix J2 (June 2015) Page 151 of 264
Author Setting Description No. Inclusion Exclusion Results Gold Std Quality
before referral. GP’s referred 95% of case which subsequently iron deficient (17% of all GP referrals). No haematological abnormality was found in 13% of GP referrals requiring follow-up, in comparison with 5% from hospital referrals. 96% GP referrals also requested a diagnosis compared with 59% of hospital initiated referrals 45% of GP referrals were discharged from follow-up during the study period compared with 32% from hospital referrals.

Suspected Cancer: Appendix J2 (June 2015) Page 152 of 264
Table 6 HAEMATOLOGICAL CANCER: delay and diagnostic difficulties
Author Setting Description No. Inclusion Exclusion Results Quality
Norum 1995 Norway Secondary care
A retrospective hospital study was undertaken of the records of 50 patients treated for primary Hodgkin’s disease in Northern Norway between 1985 and 1993. The diagnostic delay related to clinical stage, age, sex, relapse or death. Diagnostic delay was defined as the time period between the patient’s first symptoms of lymphoma and the histological or cytological diagnosis of Hodgkin’s disease.
50 patient records
Records of all patients treated a 1 hospital for primary HD
the lymphocyte predominance Hodgkin’s disease sub group had a significant delay (P+0.038). The median delay was four months (range 0-48 months) in the subgroup lymphocyte predominance Hodgkin’s disease compared to four months (range 0-27months) in the other subgroups. The median age at diagnosis was 41 years (range 15-70 years). There was no statistical correlation between delay in diagnosis and age, sex, symptoms, stage of disease, recurrent disease or death of disease. The diagnostic delay in patients with Hodgkin’s disease did not seem to have any significant influence on stage distribution, relapse rate or short-term survival. Those dying of disease had had a short delay. The aggressiveness of the tumour could be the important parameter. All six patients dying of Hodgkin’s disease had a diagnostic delay of six months or less (median 3.2 months). The same tendency was revealed for relapse and diagnostic delay. Nine of ten relapsing patients had a delay of six months or less. There was no statistical correlation between delay in diagnosis and age, sex, or symptoms. There was no improvement in diagnostic delay during the study period (1985-93).
Purely descriptive, retrospective study. Evaluation process of specimens insufficiently described. Limited extrapolation of findings to primary care setting.
Summerfield et al 2000
UK Secondary Care
Delays in the diagnosis and treatment of lymphoma in district hospitals in the northern region of the UK were audited in order to assess the appropriateness of the requirement of the National Priorities Guidance (NPG) Cancer Targets that all new patients with suspected cancer be seen by a specialist within two weeks of a referral by their GP. Sources of delay were analysed in all 89 consecutive cases presenting to hospitals in 1997-9.
89 cases
The results of the audit showed that among four hospitals during the period of study, delay from GP referral to hospital appointment averaged 3.9± 1.2 (mean ± SE weeks). Further delay in the diagnostic process was observed from hospital appointment to biopsy 4.7 ± 1.0 (mean ± SE) weeks (n=87), followed by delay from biopsy to local histology report 1.2 ± 0.1 (mean ± SE weeks (n=83), and then from local histology to review panel report 3.1 ± 0.6 (mean ± SE) weeks (n=48). In addition a delay from diagnostic biopsy to bone marrow examination was recorded of 2.8 ± 0.3 (mean ± SE) weeks (n=70), furthered by delay from diagnostic biopsy to CT scan 2.8 ± 0.41 weeks (n=85). This results in a delay from completion of investigations to treatment of 2.5 ± 0.6 weeks (n=84). Therefore, the total delay recorded was 7.5 ± 1.0 (mean ± SE months (n=76), and of that patient delay accounted for 3.9 ± 0.8 (mean ± SE) months (n=76). Diagnostic delay amounted to 2.8 ± 0.4

Suspected Cancer: Appendix J2 (June 2015) Page 153 of 264
Author Setting Description No. Inclusion Exclusion Results Quality
(mean ± SE) months (n=88), with treatment delay being 1.2 ± 0.2 (mean ± SE) months (n=87). Overall patient diagnostic and treatment delay for high-grade non-Hodgkin’s lymphoma was recorded as n=41, for low-grade non-Hodgkin’s lymphoma it was n=35, and for Hodgkin’s disease it was n=9.

Suspected Cancer: Appendix J2 (June 2015) Page 154 of 264
Table 7 SKIN CANCER: signs and symptoms, including risk factors
Author Setting Description No. Inclusion Exclusion Results Gold Std Quality
Australian Cancer Network, 1999
These guidelines for melanoma were based on a systematic review of evidence that was considered by a multidisciplinary panel. The recommendations relating to clinical diagnosis were: Good lighting and magnification is recommended when lesions are examined. All clinicians should be trained in the recognition of early melanoma. A good clinical history of the change in the lesion (if any), a past history of skin lesions, and a family history of melanoma should be obtained. A family history is defined as melanoma in a direct-line family member – grandparent, parent, sibling or child of the patient. Lesions which are suspicious or cannot be diagnosed after a period of observation should be biopsied, or the patient referred for a specialist opinion. High risk individuals should be advised of the specific changes which suggest melanoma and encouraged to perform self-examination.
Brady et al, 2000 USA A case series with newly diagnosed patients with cutaneous melanoma presenting to a US specialist cancer centre between July 1995 and May 1998. All patients were asked to complete a questionnaire at their first visit to the cancer centre.
454 Patients for which the information regarding Breslow thickness of the melanoma was available.
Patients with an unknown primary site, noncutaneous melanoma, distant metastases or recurrent disease
Most patients presented with melanoma > 0.75mm in Breslow thickness (62%; N=283 patients). The remaining patients
(38%) had thin melanomas (≥0.75mm; N=122 patients) or in situ disease (N=49 patients). The majority of patients detected their own melanomas (N=270; 57%). Patterns of detection were influenced by patient gender. Females were more likely to self-detect than males (69% vs. 47%; P<0.0001). Physicians detected the melanoma in 16% of patients (N=74), followed by spouse in 11% (N=51). Physicians were three times more
likely to detect thin lesions (≤0.75 mm) compared with nonphysician detectors (95% confidence interval [95% CI] 2.1, 6.5; P=0.0001). Physician detection occurred in only four of 84 males under age 50 years compared with 43 of 166
males age ≥ 50 years (P<0.0001).

Suspected Cancer: Appendix J2 (June 2015) Page 155 of 264
Author Setting Description No. Inclusion Exclusion Results Gold Std Quality
Patients who reported a family history of melanoma had a 2.7 fold increased likelihood of presenting with a thin lesion (95% CI, 1.6, 4.7; P=0.003). Family history information was available for 451 patients. Of these, 84 patients (19%) reported a family history of melanoma, and 366 patients (81%) reported no first or second degree relative with the disease. Despite a trend towards thinner melanomas in females, the difference in the median Breslow thickness between females and males was not significantly different (1.10 mm vs. 1.13 mm; P=0.07). There was no significant association between tumour thickness and age, gender or lesion visibility.
Cassileth,1987 USA In this case series, a retrospective analysis of the charts of patients treated between 1972 and 1981 for superficial spreading melanomas was undertaken. Information was recorded routinely for all patients by clinic nurses using a structured interview guide during the patient’s first clinic visit. Patients were asked about the presence of each of seven symptoms (size, elevation, colour, bleeding, ulceration, itching and tenderness) plus other features. Information was recorded about the type, number and duration of individual symptoms noticed by the patient; catalyst symptoms or the particular event that preceded the patient’s request for medical attention; and location, thickness and level of the melanoma
568 patients
Patients who had attended a single specialist US centre, only data for patients over 17 years of age and with no prior primary melanomas
-- Forty-eight percent of patients who met the eligibility criteria were men. Forty-six percent of patients reported the simultaneous occurrence of more than one catalyst symptom; 35% reported experiencing one catalyst symptom only; and 19% claimed that they had noticed no changes in existing lesions. The most common catalyst symptom pattern, a combination of size, elevation and colour was reported by 60 patients, who were diagnosed an average of 11.2 months after observing this combination. The mean tumour thickness at diagnosis for
this group of patients was 1.26 mm (± 1.8 mm). The second most common catalyst symptom, bleeding, was reported by 49 patients, who were diagnosed after an average of 2.3 months. A total of 75 different catalyst symptoms or symptom combinations were described. Patients who sought medical attention in response to bleeding alone (N=49) had thicker lesions (mean 1.77 mm) than did the 45 patients who sought medical attention in response to changes in both size and colour (mean 0.54 mm). A total of 109 patients, 19% of the sample, could not identify any change in an existing lesion. The average lesion thickness for
these 109 patients was 0.93 mm (± 1.4 mm) compared with the average lesion

Suspected Cancer: Appendix J2 (June 2015) Page 156 of 264
Author Setting Description No. Inclusion Exclusion Results Gold Std Quality
thickness of 1.37 (± 1.8 mm) for all other patients (P<0.01).
DoH, Referral Guidelines for Suspected Cancer, 2000
Cancers tend to be larger (>1cm) than actinic keratoses and have a palpable component deep to the skin surface. Basal Cell Carcinoma Very common, but metastasize very rarely, so there is no need to refer urgently. Location: majority are on the face, particularly around the inner canthus and nose. Appearance: Slowly growing red pearly nodule on skin surface. Later may break down with crusting to give classic ‘rodent ulcer’. The slow growth and low metastatic potential of these lesions mean that they do not need to be seen within two weeks. Nevertheless patients with suspected basal cell carcinoma should be seen by a specialist within three months. Urgent referral Melanoma Pigmented lesions on any part of the body which have one or more of the following features: Growing in size, Changing shape, Irregular outline, Changing colour, Mixed colour, Ulceration, Inflammation. NB. Melanomas are usually 5mm or greater at the time of diagnosis, but a small number of patients with very early melanoma may have lesions of a smaller diameter than this.
Elwood et al 1998 Canada A report from a larger case control study of risk factors. Information on all confirmed cases of newly diagnosed cutaneous malignant melanoma was obtained from treatment centres and cancer registries in four provinces of Canada. Identified patients were interviewed about initial presentation and symptoms.
651 patients aged 20 to 79 years
Patients with acral lentiginous melanoma
415 patients (64%) had superficial spreading melanoma, 128 (20%) had nodular melanoma, 52 (8%) had unclassified or borderline melanoma and 56 (9%) had lentigo maligna melanoma. Most patients reported 1 or more of a set of 4 symptoms related to an existing mole or pigmented spot: Each of the 651 presenting with melanoma were asked to describe first indications of their disease. The results were as follows: Major symptom group- Enlargement, colour change, pain or bleeding (65%), Suspicious lesion, no other detail (24%),
Histology

Suspected Cancer: Appendix J2 (June 2015) Page 157 of 264
Author Setting Description No. Inclusion Exclusion Results Gold Std Quality
New mole (8%), Miscellaneous (3%). Frequency of classic symptoms- Enlargement (43%), Colour change (32%), Pain (22%), Bleeding (16%).
Hawrot et al, 2003
USA A summary of the literature regarding the incidence, causation, clinical and histologic presentation, prognosis, treatment, follow-up, and prevention of cutaneous squamous cell carcinoma.
-- -- -- Long term follow-up studies of patients who undergo treatment with high doses of PUVA show a relative risk of four to six compared with individuals not exposed to such treatments. PUVA effects appear to be dose related and although lesions may occur as early as five years after therapy, the strongest correlation is seen in the second decade after therapy completion. The incidence rate of cutaneous squamous cell carcinomas is increased in organ transplant recipients. Patients with transplants are at a three to four fold increased risk of systemic and cutaneous. An increased incidence rate of squamous cell carcinomas after transplantation is associated with time after transplantation, decreasing latitude and older age as well as childhood, duration of immunosuppression, intensity of immunosuppression, and history of skin cancer before transplantation. In some studies the relative risk of squamous cell carcinomas has been found to be approximately three times higher in people born in geographic areas receiving high amounts of ultraviolet radiation than in residents who moved to such areas only in adulthood; two to five times higher in those with very light skin colour, hazel or blue eyes and blonde or red hair; five times higher in individuals with exclusively outdoor occupations and three to eight times higher in people with severe versus no solar elastosis, freckling and facial telangiectasias. Although fair skinned whites, especially men in their 60s and 70s are at highest risk for cutaneous squamous cell carcinomas, other racial and ethnic types with intermediate skin types may be susceptible given predisposing environmental conditions
Motley et al, 2002 UK These British Association of Dermatologists/British Association of

Suspected Cancer: Appendix J2 (June 2015) Page 158 of 264
Author Setting Description No. Inclusion Exclusion Results Gold Std Quality
Plastic Surgeons guidelines addressed squamous cell carcinoma. Squamous cell carcinoma was defined as a malignant skin tumour of keratinizing cells of the epidermis or its appendages, which is locally invasive and has the potential to metastasize. The guidelines state it usually presents as an indurated nodular keratinizing or crusted tumour that may ulcerate, or may present as an ulcer without evidence of keratinization. Other forms of squamous cell carcinoma include (a) actinic and radiation keratoses, which are scaly erythematous papules or plaques on sun damaged or irradiated skin that may develop into invasive squamous cell carcinoma; (b) pre-invasive carcinoma (carcinoma in situ): (i) Bowen’s disease, which is crusted, keratotic or a velvety erythrematius plaque; (ii) erythroplasia of Queyrat, which appears on the glans penis as a red, velvety patch; (iii) erythroplakia and malignant leukoplakia, on mucous membranes other than the glans penis; (c) verrucous carcinoma, a warty tumour that occurs most often on the hands, feet, anogenital area and oral cavity; (d) keratoacanthoma.
Osborne, 1999 A retrospective case series. The aim was to investigate possible predictor variables for false negative gradings using the seven point checklist in a population of patients with confirmed malignant melanomas presenting in Leicestershire between 1982 and 1996. The case notes of the included patients were examined retrospectively. False negatives were defined as those patients in whom another diagnosis was made or in whom there was evidence in the case notes that the diagnosis was thought not to be malignant melanoma. Demographic data were recorded together with clinical diagnosis, clinical features of each lesion according to the revised seven point checklist, and site of the lesion.
778 cutaneous malignant melomas.
The case notes of all patients presenting with cutaneous malignant meloma in a UK city between 1982 and 1996
-- No clinical diagnosis had been given in the records for 43 of the 778 lesions, 599 were suspected of being melanoma, and 136 had not been suspected on clinical grounds. The clinical false negative diagnosis rate was 18.5% and the diagnostic sensitivity 81.5%. There were 476 females and 257 males, giving a ratio of 65% females. Sex had no effect on false negative rate; the proportion of females in the diagnosed group being 66% and the non-diagnosed group 60% (=0.20). The false negative rate varied markedly with site and was lowest for the trunk and leg (12 and 13%), but was 21% for the arm. More rarely occurring sites gave higher false negative rates from 31% to 42%. Comparing the false negative rate on the trunk (the lowest rate) with the
histology

Suspected Cancer: Appendix J2 (June 2015) Page 159 of 264
other sites, the odds ratio for the face was 3.4 (P=0.0007), head and neck 5.1 (P<0.0001), arm 2.0 (P=0.02), leg 1.0 (P=0.6), sole 3.4 (P=0.06) and subungual 5.5 (P=0.007). The false negative clinical diagnosis rate varied markedly with the presence of features of the seven point checklist (P<0.00001). It was lower if major features were present (8-18%), and greater if the minor features were present (13-35%). Major features associated with a particularly low rate were irregular shape and irregular pigmentation, 8 and 10%, respectively. Clinical features of lesions associated with a higher false negative rate were lack of irregular pigmentation and shape, altered sensation, the presence of inflammation and size < 7mm. The multivariate logistic regression of all parameters showed that the relationships of false negative rate and melanoma site, irregular pigmentation, irregular shape, sensation, inflammation and diameter >6 mm were significant and independent. For the individual sites, results of univariate and multivariate analysis were similar, although the adjusted odds ratio and its significance, for the face compared with the trunk increased markedly on multivariate analysis. The results suggested that the face is a particularly difficult site. All of the clinical features except surface oozing/crusting/bleeding retained significance on multiple regression.
Roberts et al, 2002
UK Guidelines for melanoma were produced jointly by the British Association of Dermatologists and the Melanoma Study Group. The seven- point checklist was recommended for both patient and general practitioner education. Lesions with any of the three major features (change in shape, irregular shape, irregular colour) or three of the minor features (largest diameter 7mm or more, inflammation, oozing, change in sensation) are suspicious of melanoma, and should ideally be seen by specialists (that is,

Suspected Cancer: Appendix J2 (June 2015) Page 160 of 264
Author Setting Description No. Inclusion Exclusion Results Gold Std Quality
clinicians routinely treating large numbers of patients with pigmented lesions). Specific recommendations were: Patients with lesions suspicious of melanoma should be referred urgently to a dermatologist or surgeon/plastic surgeon with an interest in pigmented lesions. These specialists should ensure that a system is in place to enable patients with suspicious lesions to be seen within two weeks of receipt of the referral letter. All patients who have had lesions removed by their general practitioner that are subsequently reported as melanoma should be referred immediately to specialists. (Grade C, level III)
Schwartz et al, 2002
USA A case series, in which patients presenting between January 1998 and December 1999 with in situ or invasive cutaneous melanomas were questioned about their signs and symptoms
1515 All patients with with in situ or invasive cutaneous melanomas presenting between January 1998 and December 1999
-- The mean age at diagnosis of the first primary melanoma was 52.6 years. The majority of patients (72%) were between the ages of 21 and 65, 26% being older than 65 years, and only 2% younger than 21 years. Females (48.9 years) were younger than males (56.1 years) at diagnosis of their first primaries (P<0.001). Physician detected lesions were thinner (0.40mm) than either self-detected (1.17 mm; P<0.001) or spouse-detected (1.00 mm; P<0.001) lesions. In males the Breslow depth of self-detected lesions (1.42 mm) was greater than that of the lesions detected by either the spouse (1.04 mm; P<0.005) or physician (0.42 mm; P<0.001). In females, the mean Breslow depth of self-detected lesions (0.98 mm) was greater than physician detected lesions (0.35 mm; P<0.001) but was not significantly different from spouse-detected lesions (0.72 mm; P=0.2). The most common changes noted by patients were the colour, size, and/or shape/elevation of a lesion. Less common changes included ulceration, bleeding, tenderness, and itching. Mean Breslow depths associated with a change in colour
All histology slides were reviewed by a skin pathologist to confirm the diagnosis of primary cutaneous melanoma.

Suspected Cancer: Appendix J2 (June 2015) Page 161 of 264
(1.15 mm), size (1.33 mm), shape/elevation (1.47 mm) and itching (1.70 mm) were less than mean Breslow depths associated with ulceration (2.69 mm), bleeding (2.63 mm) and tenderness (2.44 mm; all P<0.005).
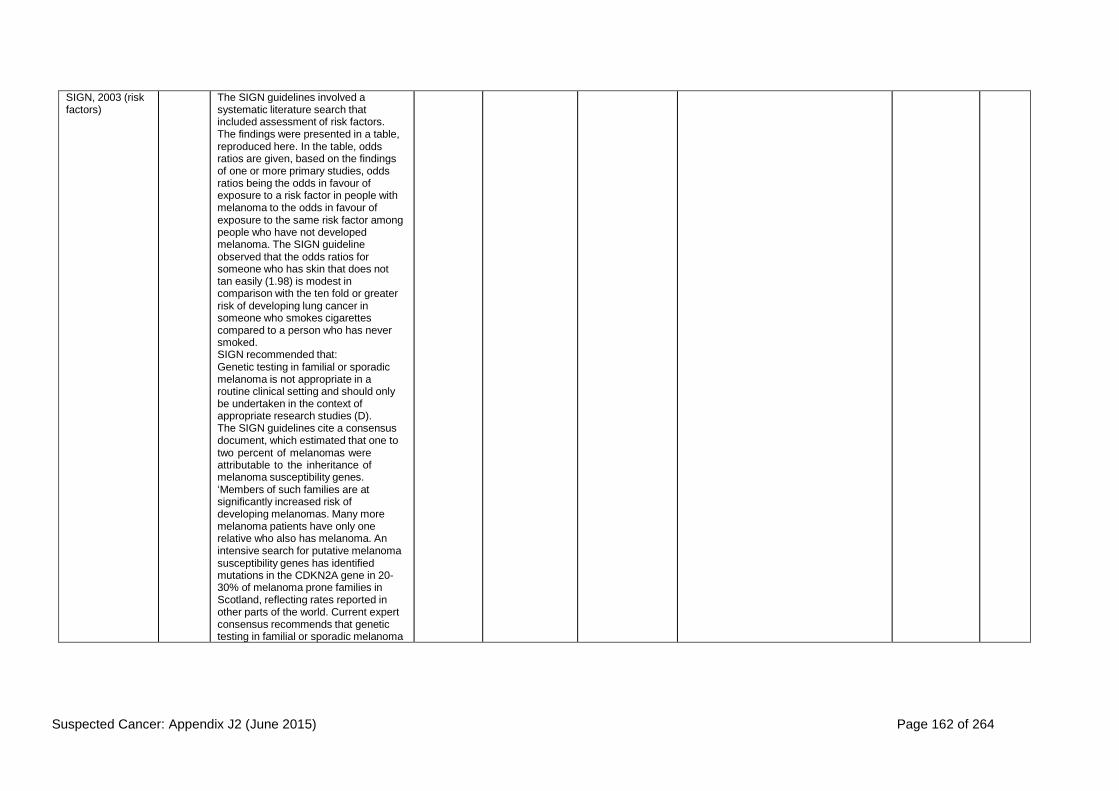
Suspected Cancer: Appendix J2 (June 2015) Page 162 of 264
SIGN, 2003 (risk factors)
The SIGN guidelines involved a systematic literature search that included assessment of risk factors. The findings were presented in a table, reproduced here. In the table, odds ratios are given, based on the findings of one or more primary studies, odds ratios being the odds in favour of exposure to a risk factor in people with melanoma to the odds in favour of exposure to the same risk factor among people who have not developed melanoma. The SIGN guideline observed that the odds ratios for someone who has skin that does not tan easily (1.98) is modest in comparison with the ten fold or greater risk of developing lung cancer in someone who smokes cigarettes compared to a person who has never smoked. SIGN recommended that: Genetic testing in familial or sporadic melanoma is not appropriate in a routine clinical setting and should only be undertaken in the context of appropriate research studies (D). The SIGN guidelines cite a consensus document, which estimated that one to two percent of melanomas were attributable to the inheritance of melanoma susceptibility genes. ‘Members of such families are at significantly increased risk of developing melanomas. Many more melanoma patients have only one relative who also has melanoma. An intensive search for putative melanoma susceptibility genes has identified mutations in the CDKN2A gene in 20- 30% of melanoma prone families in Scotland, reflecting rates reported in other parts of the world. Current expert consensus recommends that genetic testing in familial or sporadic melanoma

Suspected Cancer: Appendix J2 (June 2015) Page 163 of 264
Author Setting Description No. Inclusion Exclusion Results Gold Std Quality
is not appropriate in a routine clinical setting and should only be undertaken in the context of appropriate research studies and when appropriate counselling services are available.

Suspected Cancer: Appendix J2 (June 2015) Page 164 of 264
SIGN, Cutaneous melanoma: A National Clinical Guideline, 2003 (signs and symptoms)
The SIGN guidelines were developed following a detailed literature review. recommendations: Clinicians should be familiar with the seven point or the ABCDE checklist for assessing lesions (D). Clinicians using hand held dermatoscopy should be appropriately trained (D). Health professionals should be encouraged to examine patients’ skin during other clinical examinations (D) Patients with suspicious pigmented lesions should be seen at a specialist clinic in a time commensurate with the level of concern indicated by the general practitioner referral letter (recommended best practice). Emphasis should be given to the recognition of early melanoma by both patients and health professionals (recommended best practice). Targeted education can enhance professionals’ ability to diagnose melanoma (recommended best practice). Healthcare professionals and members of the public should be aware of the risk factors for melanoma (B). Individuals identified as being at higher risk should be (C) Advised about appropriate methods of sun protection, Educated about the diagnostic features of cutaneous melanoma, Encouraged to perform self- examination of the skin. Brochures and leaflets should be used to deliver preventive information on melanoma to the general public (D) Leaflets and brochures used in melanoma prevention work should be non-alarmist (recommended best practice). If computer-based learning programmes are used they should be interactive in nature (recommended best practice).

Suspected Cancer: Appendix J2 (June 2015) Page 165 of 264
Sober et al,1983 USA A questionnaire was administered to patients by a trained interviewer to evaluate the frequency with which signs and symptoms were associated with melanoma.
598 patients
Patients were seen either with the primary tumour intact or within 30 days of its removal.
-- For thin lesions (<0.85 mm) increase in size was noted in more than half and was the most frequent sign or symptom present for ‘thin’ tumours. This was closely followed by colour change, which was present in half. Bleeding, ulceration and tenderness were infrequently seen (present in five to 13%). Conversely, increase in height was the most frequent
feature noted with the thickest tumours (≥
3.65 mm), observed by more than 80% of patients. Bleeding and ulceration were reported in more than half. There was a direct relationship between increase in height and increasing tumour thickness. Itching of the lesion occurred in 20-46% of patients.
Telfer et al, 1999 UK These guidelines were produced on behalf of the British Association of Dermatologists, and dealt with basal cell carcinoma. Basal cell carcinoma was defined as a slow-growing, locally invasive malignant epidermal skin tumour, which occurs most commonly in caucasians. Metastasis is extremely rare, and morbidity is related to local tissue destruction, particularly on the head and neck. The clinical appearances are diverse, and include nodular, cystic, ulcerated (‘rodent ulcer’), superficial, morphoeic (sclerosing), keratotic and pigmented variants.
Whited, 1998 USA a systematic review of the accuracy of skin examination for melanoma using the ABCD(E) and revised seven point checklists. A literature search was performed using MEDLINE for the years 1966 through 1996 to identify relevant retrospective and prospective studies
12 studies Articles were evaluated and included if they had been given a quality rating of C or above
-- Two studies reported information about the sensitivity for the ABCD checklist, in one it was 92%; (CI 95%, 82%-96%), and in the other 100% (95% CI 54%-100%); one study reported specificity to be 98% (95% CI, 95%-99%). The revised seven point checklist has been reported to have a sensitivity of 79% (95% CI, 70%-85%) to 100% (95% CI 94%-100%) and specificity of 30% (95% CI, 21%-39%) to 37% (95% CI, 21%- 39%). Physicians’ global assessments for detecting the presence or absence of melanoma were estimated to have a specificity of 96% to 99%, while sensitivity

Suspected Cancer: Appendix J2 (June 2015) Page 166 of 264
Author Setting Description No. Inclusion Exclusion Results Gold Std Quality
ranges widely from 50% to 97%. Non- dermatologists’ examinations were less sensitive than those performed by dermatologists.
Wick et al, 1980 USA This case series investigated the clinical characteristics of the primary tumour in patients with confirmed superficial spreading melanoma.
786 -- -- The most useful features for early diagnosis were change in size and change in colour, present in 71% and 55% respectively of patients with level II lesions. Increase in height of lesion correlated with more advanced disease. Ulceration and bleeding were predominantly found in advanced primary lesions and were judged of limited use in early recognition. The data revealed that primary lesions were of substantial size and generally much larger than acquired naevi (<7mm) from which they must be differentiated. The results suggested that site was not a major determinant for the presentation of early lesions. There was however a higher proportion of level II lesions (42%) on the head and neck. Conversely, a higher percentage of deeper lesions were encountered on the foot. Characteristic features of early (II, III) lesions associated with tumour growth were colouration and size. The features characteristic of advanced lesions were tenderness, ulceration and bleeding. Elevation became common at level III and above.
Histology
Wong et al, 1989 UK An authoritative review. The aim was to provide a comprehensive overview of basal carcinoma, concentrating in particular on incidence, risk factors, molecular genetics, clinical features, and treatment.
Not stated Information obtained from a Medline search with basal cell carcinoma, rodent ulcer, and non-melanoma skin cancer as key words.
-- Exposure to ultraviolet radiation is the main causative factor in the pathogenesis of basal cell carcinoma. However, the precise relationship between risk of basal cell carcinoma and the amount, timing and pattern of exposure to ultraviolet radiation remains unclear. The magnitude of the risk associated with increased exposure seems to be insufficient to explain why particular people get these tumours whereas others do not. Several studies have shown an association between cumulative ultraviolet exposure and risk of basal cell carcinoma, although the magnitude of risk conferred has been small, with odds ratios in the region of 1.0 to 1.5. Other studies have failed to find a significant association between estimated

Suspected Cancer: Appendix J2 (June 2015) Page 167 of 264
Author Setting Description No. Inclusion Exclusion Results Gold Std Quality
cumulative sun exposure in adulthood and the presence of basal cell carcinoma. Skin type 1 (always burns, never tans), red or blonde hair and blue or green eyes have been shown to be risk factors for the development of basal cell carcinoma with an estimated odds ratio of 1.6. Development of basal cell carcinoma is reported to be more frequent after freckling in childhood and also after frequent or severe sunburn in childhood. This is in contrast to a story of sunburn as an adult, which does not seem to be associated with the development of basal cell carcinoma. Recreational sun exposure in childhood was identified as an important risk factor. A positive family history of skin cancer seems to be a predictor of development of basal cell carcinoma with an odds ratio estimated at 2.2. Several genetic conditions associated with the risk of developing basal cell carcinoma are albinism, xeroderma pigmentosa, and Bazex’s syndrome. Patients on immunosuppressive treatment also have an increased risk of basal cell carcinoma. The risk of developing a squamous cell carcinoma is increased slightly after a basal cell carcinoma, with a 6% risk at three years.

Suspected Cancer: Appendix J2 (June 2015) Page 168 of 264
Table 8 SKIN CANCER: investigations
Author Setting Description No. Inclusion Exclusion Results Gold Std Quality
Bricknell, 1993 UK This study reviewed histopathology reports at one UK hospital with an aim to examine the difference between skin biopsies of pigmented skin lesions taken by general practitioners and those taken by hospital specialists
1205 biopsies involving 1000 patients
The histopathology reports for all skin biopsy specimens from pigmented skin lesions fro the period 1 june 1986 to 31 may 1991. only records with a comment in the clinical summary or in the description of the macroscopic appearance mentioning colour or pigment were included.
-- 15 patients had melanomas. General practitioners had undertaken 55% of the biopsies on the 1000 identified patients. Features recorded on pathology forms included size increase (general practitioner 15.0%, specialists 25.1%), bleeding 13.6% vs. 6.6%, colour change 4.8% vs. 11.7% (all P<0.001). Hospital specialists excised significantly more lesions that had increased in size (P < 0.001) or changed in colour (P < 0.001). General practitioners excised more lesions that had bled (P < 0.001). Hospital specialists excised more of the 15 melanomas diagnosed (80%) (P < 0.05), and general practitioners excised more squamous papillomas (P < 0.01). Of the melanomas excised, 40% were not suspected by the clinician.
Cox 1992 UK In this study, the findings of skin biopsies by general practitioners examined at one UK hospital were reported.
1017 skin biopsy specimens.
All skin biopsy specimens received by the pathology laboratory from general practioners from 1 January 1989 to 31 March 1991
-- Of the total of 1017 biopsies, 56 (5.5%) were for malignant lesions. Of 21 basal cell carcinomas, nine had been considered by the general practitioner to be malignant. Six of the 21 had been inadequately excised. None of the four melanomas had been suspected, although they had been adequately excised. Additionally 21 squamous cell carcinomas were excised. Excision was adequate in eight, and the diagnosis had been suspected in only one.
Department of Health, 2000
The Department of Health guidelines stated: ‘It is not recommended that patients with
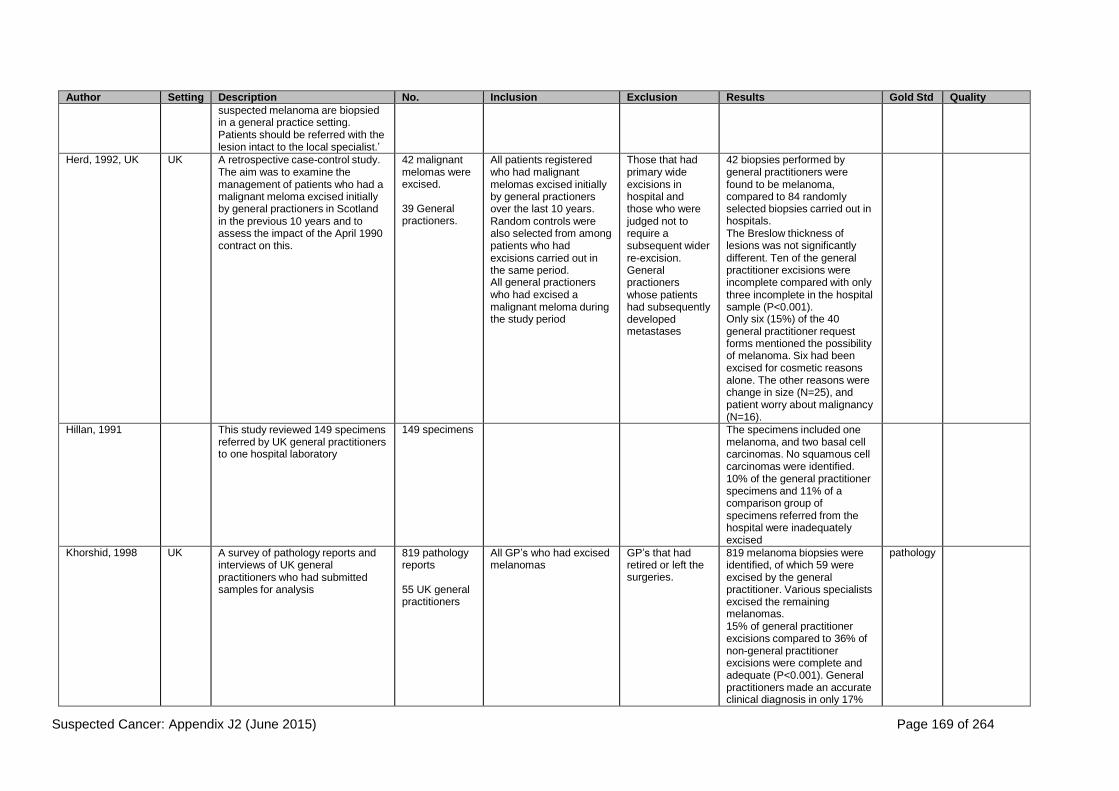
Suspected Cancer: Appendix J2 (June 2015) Page 169 of 264
Author Setting Description No. Inclusion Exclusion Results Gold Std Quality
suspected melanoma are biopsied in a general practice setting. Patients should be referred with the lesion intact to the local specialist.’
Herd, 1992, UK UK A retrospective case-control study. The aim was to examine the management of patients who had a malignant meloma excised initially by general practioners in Scotland in the previous 10 years and to assess the impact of the April 1990 contract on this.
42 malignant melomas were excised.
39 General practioners.
All patients registered who had malignant melomas excised initially by general practioners over the last 10 years. Random controls were also selected from among patients who had excisions carried out in the same period. All general practioners who had excised a malignant meloma during the study period
Those that had primary wide excisions in hospital and those who were judged not to require a subsequent wider re-excision. General practioners whose patients had subsequently developed metastases
42 biopsies performed by general practitioners were found to be melanoma, compared to 84 randomly selected biopsies carried out in hospitals. The Breslow thickness of lesions was not significantly different. Ten of the general practitioner excisions were incomplete compared with only three incomplete in the hospital sample (P<0.001). Only six (15%) of the 40 general practitioner request forms mentioned the possibility of melanoma. Six had been excised for cosmetic reasons alone. The other reasons were change in size (N=25), and patient worry about malignancy (N=16).
Hillan, 1991 This study reviewed 149 specimens referred by UK general practitioners to one hospital laboratory
149 specimens The specimens included one melanoma, and two basal cell carcinomas. No squamous cell carcinomas were identified. 10% of the general practitioner specimens and 11% of a comparison group of specimens referred from the hospital were inadequately excised
Khorshid, 1998 UK A survey of pathology reports and interviews of UK general practitioners who had submitted samples for analysis
819 pathology reports
55 UK general practitioners
All GP’s who had excised melanomas
GP’s that had retired or left the surgeries.
819 melanoma biopsies were identified, of which 59 were excised by the general practitioner. Various specialists excised the remaining melanomas. 15% of general practitioner excisions compared to 36% of non-general practitioner excisions were complete and adequate (P<0.001). General practitioners made an accurate clinical diagnosis in only 17%
pathology

Suspected Cancer: Appendix J2 (June 2015) Page 170 of 264
Author Setting Description No. Inclusion Exclusion Results Gold Std Quality
of cases.
Lowy, 1997 UK This study reviewed pathology specimens before and after the introduction of a policy of referring all removed tissue in the UK in order to examine whether histological examination of all tissue removed by general practitioners in minor surgery increases the rate of detection of clinically important skin lesions. A random sample of specimens sent by 257 general practices referring to 19 pathology laboratories was undertaken.
5723 specimens during the intervention period.
4430 during the control period.
Practices were selected at random from a register.
Practices that did not perform minor surgery and practices that did not keep records of hospital referrals by name.
This study reviewed pathology specimens before and after the introduction of a policy of referring all removed tissue in the UK in order to examine whether histological examination of all tissue removed by general practitioners in minor surgery increases the rate of detection of clinically important skin lesions. A random sample of specimens sent by 257 general practices referring to 19 pathology laboratories was undertaken.
McWilliam, 1991 UK A retrospective analysis of histology records at one UK hospital, it included skin biopsy specimens by general practitioners and general and plastic surgeons. The purpose was to evaluate and appraise skin biopsies performed by general practioners and compare their performance with that of hospital doctors.
292 skin biopsy specimens by general practitioners and 324 by general and plastic surgeons
All records of skin biopsy specimens submitted by GP’s for histological examination during 1984- 1989.
-- General practitioner cases included six (2%) basal cell carcinomas, five (1%) squamous cell carcinomas, and one (0.3%) melanoma. 36% of all general practitioner’s samples compared with 16% of surgeons’ samples were incompletely excised. Agreement between clinical and pathological diagnosis in malignant cases was 29% for general practitioners and 90% for surgeons.
O’Cathain, 1992 UK This study reported a prospective comparison of patients undergoing minor surgery in general practice and at one hospital
A total of 161 patients were compared, 67 of those in general practice and 94 in hospital
Patinas undergoing minor surgical procedures in the participating practices.
-- 9.8% of general practitioner cases and 1.2% of hospital cases were malignancies diagnosed as benign. 4.9% of general practitioner cases compared to 0% of hospital cases had not been adequately excised.
histology
SIGN, 2003 The SIGN guideline included the following recommendations: GPs should refer urgently all patients in whom melanoma is a strong possibility rather than carry out a biopsy in primary care (recommended best practice). The local availability of fast-track services for patients in whom

Suspected Cancer: Appendix J2 (June 2015) Page 171 of 264
Author Setting Description No. Inclusion Exclusion Results Gold Std Quality
melanoma is suspected should be advertised widely to general practitioners (recommended best practice). A suspected melanoma should be excised with a 2mm margin and a cuff of fat (D) If complete excision cannot be performed as a primary procedure a full thickness incisional or punch biopsy of the most suspicious area is advised (D). A superficial shave biopsy is inappropriate for suspicious pigmented lesions. (C).
Williams, 1991 This retrospective review of pathology records in one UK hospital evaluated skin biopsy specimens from general practitioners
571 skin biopsy specimens
26 (4.6%) biopsies were malignant (14 basal cell carcinomas, eight squamous cell carcinomas, four melanomas).
The study did not assess completeness of excision

Suspected Cancer: Appendix J2 (June 2015) Page 172 of 264
Table 9 SKIN CANCER: diagnostic difficulties
Author Setting Description No. Inclusion Exclusion Results Quality
Brochez, 2001
Belgium This study aimed to compare the diagnostic abilities of general practitioners and dermatologists in Belgium concerning pigmented skin lesions in general and melanoma in particular. The study design was a ‘before and after’ evaluation of a health education programme for general practitioners. A test set of 13 pigmented skin lesions on 35 mm colour slides as presented to participating general practitioners and dermatologists during a monthly educational course.
160 GP’s
60 dermatologists
All GPs educational groups in the province of East-Flanders, Belgium were invited to participate
-- The frequency of melanomas encountered was one in seven years for the general practitioners and one in eight months for dermatologists. Consultations for advice about pigmented lesions were encountered once in 30 days by general practitioners and once per day by dermatologists. Sensitivity of general practitioners before the course in diagnosing melanoma from the slides was 72%, and 84% afterwards (dermatologists 91%). Specificity among general practitioners was 71% before and 70% after, and 95% among dermatologists. The positive predictive value (PPV) of general practitioners before was 61%, and 63% after (dermatologists 92%). The negative predictive value was 80% before and 87% after among general practitioners (dermatologists 95%).
Chen 2001 USA This systematic review was undertaken in order to compare the diagnostic accuracy and biopsy or referral accuracy of dermatologists and primary care physicians. Studies that presented sufficient data to determine the sensitivity and specificity of dermatologists’ or primary care physicians ability to correctly diagnose lesions suggestive of melanoma and to perform biopsies on or refer patients with such lesions. Studies published between January 1966 and October 1999 in MEDLINE, EMBASE and CancerLit databases were retrieved.
32 studies Strict criteria for inclusion were applied to ensure results were comparable across studies. Studies were selected if they presented sufficient data to determine the sensitivity and specificity of dermatologists’ or PCPs’ ability to correctly diagnose lesions suggestive of melanoma and to perform biopsies on or refer patienst with such lesions.
-- None of the studies reported specificity for dermatologists. One study reported specificity for primary care physicians (0.98). For biopsy or referral accuracy, sensitivity ranged from 0.82 to 1.00 (from five studies) for dermatologists and 0.70 to 0.88 (from six studies) for primary care physicians. The range of specificity was 0.70 to 0.89 (from three studies) for dermatologists and 0.70 to 0.87 (from four studies) for primary care physicians. Most of the studies included in the review evaluated only diagnostic accuracy and not biopsy or referral and did not

Suspected Cancer: Appendix J2 (June 2015) Page 173 of 264
Author Setting Description No. Inclusion Exclusion Results Quality
report either sensitivity or specificity, and did not have an adequate sample size or describe the lesions shown to subjects.

Suspected Cancer: Appendix J2 (June 2015) Page 174 of 264
Del Mar et al,1995
Australia Randomised controlled trial of an intervention to improve diagnostic abilities of GP’s. Australian practitioners were offered an algorithm and the use of an instant developing camera in a trial to test whether this intervention would reduce the number of benign melanocytic lesions excised from the skin. Doctors in the city randomised to receive the intervention were offered a protocol to assist in the management of any melanocytic lesion for which a diagnosis of malignancy was entertained.
Control group: 45 general practitioners, seven surgeons and one dermatologist.
Intervention group: 48 general practitioners and four surgeons.
During the study, nine new doctors entered and two left the control community, and seven new doctors entered and five left the intervention community. All new incoming doctors agreed to take part except for one general practitioner in the intervention city.
The two cities were selected on the basis of their similarity.
Doctors refusing to take part.
. Reports from the previous six months were collected as a baseline to check that the excision rates of benign and malignant melanocytic lesions were comparable between the two cities. In the six months before the introduction of the intervention a total of 1358 melanocytic lesions were reported by the pathology laboratories: 752 (55%) from the control community and 606 (45%) from the intervention community. More than a hundred practitioners in total participated in the study but no power calculation was given. During the 24 months after the intervention was introduced a total of 4465 lesions were excised in the two study cities, of which 1995 (45%) were excised in the intervention city, the same proportion as at baseline. Nosignificant difference in the percentages of benign lesions reported in the intervention and control cities before the algorithm and camera were used (93.6% and 94.0% respectively) but there was a significant difference afterwards (88.8% and 93.8%, P < 0.001). There was no difference in the percentage of invasive melanomas excised per month in the intervention city (3.4%) compared with control city (3.4%). Offering doctors a diagnostic algorithm and providing them with a camera reduced the relative proportion of benign naevi they removed

Suspected Cancer: Appendix J2 (June 2015) Page 175 of 264
English, 2003
Australia This Australian randomised control trial was undertaken to determine whether the use of a camera and algorithm aided the diagnosis of pigmented skin lesions by reducing the ratio of benign lesions to melanomas in general practice. The trial built upon the earlier randomised control trial conducted by Del Mar et al (1995) in which participants were randomised by town rather than practice.
Intervention practices were given an algorithm and instant camera to assist with the diagnosis of pigmented skin lesions. All practices were given national guidelines on managing melanoma
223 practices participated.
468 general practioner participated in the trial.
General practioners on the mailing lists of the divisions of general practice in Perth were eligible. General practioners who joined a practice after randomisation or with whom no contact had been made before randomisation were also eligible.
-- During the two periods, the participants excised 8563 pigmented skin lesions: 295 (3%) melanomas (180 invasive and 115 in situ), 529 (6%) dysplastic naevi, 5065 (59%) other naevi and 2674 (31%) seborrhoeic keratoses. At baseline the ratios of benign to malignant lesions were lower in the intervention than the control group. During the trial period the ratios were higher in the intervention group (19:1 vs. 17:1 without seborrhoeic keratoses and 29:1 vs. 26:1 with seborrhoeic keratoses). After adjustment for patients’ age, sex and socioeconomic status, the ratio was 1.02 times higher (95% CI 0.68 to 1.51, P=0.94) in the intervention group when seborrhoeic keratoses were not included and 1.03 times higher (0.71 to 1.50, P=0.88) when seborrhoeic keratoses were included. General practitioners in the intervention group were less likely than those in the control group to excise the most recent pigmented skin lesion they had managed (22% vs. 48%, P<0.001) and to refer the patient to a specialist. Neither group showed substantial changes in excision rates within practices between the baseline and trial periods. The overall rates showed little change in the control group, but decreased in the intervention group between periods largely because of substantial reductions in a few practices with large numbers of baseline excisions. The imbalance between practices was due to

Suspected Cancer: Appendix J2 (June 2015) Page 176 of 264
Author Setting Description No. Inclusion Exclusion Results Quality
specialist general practitioners (to whom others refer patients with pigmented lesions and those who perform a substantial proportion of all excisions). Four of the total (five) were in the intervention group. When these general practitioners were excluded the number of benign lesions excised was similar.

Suspected Cancer: Appendix J2 (June 2015) Page 177 of 264
Gerbert et al1998
USA This study sought to determine whether a brief, multicomponent educational intervention could improve the skin cancer diagnosis of primary care residents to a level equivalent to that of dermatologists. The intervention comprised an interactive seminar, which included a slide show lecture, videotape and demonstrations on how to conduct a total body skin examination. This randomised control trial was suited to assessing the effects of an educational intervention with pre-test and post test measurements of residents’ ability to diagnose and make evaluation plans for lesions indicative of skin cancer. The pre-tests and post-tests consisted of lesions shown on slides, computer images, and patients.
26 primary care residents were assigned to a control group and 26 to an intervention group, and 13 dermatologists completed a pre-test and post-test.
Residents in primary care and family medicine.
-- No significant differences between control and intervention primary care residents on the demographic and dermatology experience variables or pre-test overall diagnosis and overall evaluation planning scores. The control group, the intervention group and the dermatologists all demonstrated improved performance over time, with the intervention group experiencing the largest gains. The intervention group showed significantly greater improvement than control in overall diagnosis and diagnosis of malignant melanoma and seborrheic keratosis. Intervention group primary care residents performed as well as the dermatologists on five of the six skin cancer diagnosis and evaluation planning scores with the exception of the diagnosis of basal cell carcinoma. The control group performed as well as the dermatologists on three of the six skin cancer diagnosis and evaluation planning scores. The dermatologists had significantly higher scores than the control group in 11 of the 14 diagnoses and evaluation planning categories. The intervention group showed
Some caution is required in applying the findings of this study to clinical practice. The sample of primary care residents was relatively small and lacked variation. The pre-test may have been more difficult than the post- test, as suggested by the higher scores of all three groups of subjects at the post test. Routine clinical practice is likely to differ from the test situation used in the study.

Suspected Cancer: Appendix J2 (June 2015) Page 178 of 264
Author Setting Description No. Inclusion Exclusion Results Quality
greater improvement than the control group across all six diagnostic categories (a gain of 13 percentage points vs. five, P<0.05) and in evaluation planning for malignant melanoma (a gain of 46 percentage points vs. 36, P<0.05) and squamous cell carcinoma (a gain of 42 percentage points vs. 21, P<0.01). The intervention group performed as well as the dermatologists on five of the six skin cancer diagnosis and evaluation planning scores with the exception of the diagnosis of basal cell carcinoma.

Suspected Cancer: Appendix J2 (June 2015) Page 179 of 264
Girgis et al 1996
Questionnaires were sent to randomly selected family physicians in one region in Australia to investigate their beliefs and practices in relation to skin cancer prevention, early detection and management.
97 family physicians Family physicians were randomly selected from the regional telephone book.
Ineligible participants were those who were unable to be contacted, were specialists or were retired.
91% of family physicians (N=86) indicated that they thought skin examinations were very/extremely worthwhile in the early detection of melanoma and other skin cancers. The three issues in which they felt most confident were performing a surgical excision (72%), diagnosing a basal cell carcinoma (71%), and advising patients on signs of skin cancer (69%). A total of 65% (53) of family physicians considered that they currently detected 90 to 100% of their patients with melanoma. Family physicians indicated that the factors most likely to encourage them to offer screening were patients being more informed about its benefits, patients initiating the procedure having instructions about the signs to look for, having long consultation times and a reduced patient workload (59%; N=57), and having consistent information about who needs screening and how often (57%; N=55). The factors that were most likely to discourage family physicians from screening their patients included lack of time (32%; N=31), forgetting (26%; N=25), lack of financial incentive (20%; N=19), not being familiar with the patients’ screening history (14%; N=14) and inability to convince patients who refuse (13%; N=13).
Compared with family physicians throughout Australia, the survey had significantly fewer family physicians aged less than 30 years, and a significantly higher proportion aged 40 to 49 years

Suspected Cancer: Appendix J2 (June 2015) Page 180 of 264
Raasch et al, 2000
Australia A randomised control trial to assess the value of an educational intervention based on audit and feedback to family physicians. Clinical performance of family physicians was judged by the ability to make a correct clinical diagnosis based on histology of the excised lesion and to provide adequate surgical treatment. The doctors’ individual skin cancer practices were compared within and between groups before and after the intervention. Data were recorded on 1) the proportion of all lesions correctly diagnosed 2) unrecorded clinical diagnosis 3) inadequate excisions and 4) certainty of diagnosis.
41 Family physicians (21 in intervention group and 20 in the control group)
Family physicians working three or more sessions per week in a primary-care situation, who were available for the whole of the proposed 9 months of the study
-- The intervention group doctors showed improved performance in providing clinical information on pathology requests and in adequate surgical excision of skin lesions. Diagnostic performance did not improve significantly but physicians’ certainty of diagnosis did. When a skin cancer was present (based on the histology of the lesion) the intervention group doctors, before receiving the intervention, had made a correct diagnosis in 72.2% (95% ci 65.8–78.6) of cases. After the intervention 77.1% (95% ci 68.7-85.5) of malignant lesions had been correctly diagnosed (P=.38). There also was no significant difference in sensitivity of diagnosis for malignant lesions between intervention and control group before or after the intervention. When a lesion was benign, the study group had made a correct diagnosis in 44.7% (95% ci 39.5-49.9) of cases before the intervention, compared with 28.5% (95% ci 23.8-33.2) in the control group. After the intervention 37.3% (95% ci 29.1-45.4) diagnoses were correct, compared with 22.4% (95% ci 11.7-33.1) in the control. The change in correct diagnoses before and after the intervention group was not statistically significant (P=0.144). A baseline comparison of patients who had skin lesions excised showed that the patients of intervention and control group doctors differed significantly in several ways.
Factors such as patient characteristics that had not been controlled for may have limited the conclusions that could be drawn.

Suspected Cancer: Appendix J2 (June 2015) Page 181 of 264
SIGN, Cutaneous melanoma: A National Clinical Guideline, 2003
The guidelines recommended that: targeted education can enhance health professionals’ ability to diagnose melanoma (recommended best practice).

Suspected Cancer: Appendix J2 (June 2015) Page 182 of 264
Table 10 SKIN CANCER: delay
Author Setting Description No. Inclusion Exclusion Results Quality
Betti et al, 2003
Italy Consecutive patients referred to an Italian hospital with cutaneous melanoma between September 1994 and December 2000 were interviewed by a trained dermatologist. The questionnaire included demographic, tumour and behavioural data.
216 patients Only patients agreeing to be subjects were enrolled.
Patients who were not able to respond accurately to the questionnaire
Mean patient delay was 6.11 months (range ± 9.75 months), and mean medical delay was 1.53 months (range ± 5.34 months). There were no differences among causes of patient delay and mean age, anatomic site of lesions, level of education, knowledge of the problem, civil status or pigmentation. 51% of the patients delayed the consultation of a physician because of anxiety, fear, or lack of no time or being too busy. They tended to have a longer patient delay and a higher Breslow thickness (0.99 ± 1.41) (P < 0.001). 22 cases (10.19%) were observed in which the practitioner or the specialist delayed diagnosis or treatment. No correlation between physician delay and anatomic location of the lesion was observed. Pigmentation of the lesion significantly delayed the time of diagnosis by the physician (4 ± 9 months vs. 1.34 ± 5 months for the pigmented melanomas) (P < 0.04).
Blum et al, 1999
Switzerland Patients were interviewed using a standardised questionnaire, the information obtained being merged with the data on tumour characteristics and case history contained in the medical records. Delay in melanoma diagnosis was defined as the time period between a patient’s first observation of a suspicious skin lesion and definite tumour treatment.
429 patients All patients with histologically confirmed cutaneous melanoma who had undergone surgical treatment at a Swiss hospital between 1993 and 1996. only those patients with a melanoma diagnosis within the last 3 years were included
All patients with an initial diagnosis more than 3 years previously.
The melanoma was detected in 67% of women and 45% of men by the patients themselves (inter-gender comparison: P < 0.0001). The tumour was detected in about 50% of the remaining patients by a physician. Earlier diagnosis and treatment of melanoma were not significantly related to prognostic tumour parameters such as Breslow thickness or Clark’s level of invasion. Women were significantly more aware than men of the possible benefit of early treatment (P= 0.004). However, increased melanoma awareness was not associated with an earlier visit to a physician. Patients who detected the lesions themselves sought medical attention later than patients in whom attention had been called to their skin changes by other persons (median 122 vs. 59 days), and therefore were treated significantly later (P < 0.01). A misdiagnosis by the first physician visited was reported by 18% of patients, and

Suspected Cancer: Appendix J2 (June 2015) Page 183 of 264
Author Setting Description No. Inclusion Exclusion Results Quality
60% of these physicians were dermatologists. Misdiagnosis increased the period of time between first observation and treatment (median 122 vs. 31 days, P < 0.0001) as well as between the first visit to a doctor and treatment (median 61 vs. 28 days, P < 0.0001). When more than one physician omitted the diagnosis of melanoma (in 8% of all patients), there was a significant additional delay in treatment (median 303 vs. 89 days, P < 0.001). Multiple regression analysis revealed the following factors to be significantly related to delay in melanoma diagnosis: denial of melanoma diagnosis by the first physician visited (P < 0.001, regression coefficient = 0.192), invasive melanoma of the head and neck (P < 0.05, regression coefficient = 0.134), self detection of melanoma vs. detection by other persons (P < 0.05, regression coefficient = 0.129), and patient’s knowledge about the induction of skin cancer by sun exposure (P < 0.05, regression coefficient = - 0.107). No correlation was found between delay in diagnosis/treatment and gender, age, Breslow tumour thickness, Clark’s level of invasion and histological type of melanoma.

Suspected Cancer: Appendix J2 (June 2015) Page 184 of 264
Brochez et al, 2001
Belgium The aim of this study was to describe the diagnostic pathway for cutaneous melanoma in a Belgian community, to quantify both patient and physician delay and to define factors related to it. Patients were recruited both from a university hospital setting and from practices (population based melanoma register). patients were asked to complete in a questionnaire about delay in diagnosis.
131 completed questionnaires.
All patients with a diagnosis of cutaneous melanoma between January 1995 and December 1999 were included
-- The time from the first noticing a new or changing lesion to consultation with a physician (patient delay) was a mean of 169 days (median, 61 days). Worried patients tended to have a longer patient delay, although the difference did not reach statistical significance. There was no difference in patient delay for lesions difficult to self-examine compared with lesions more easily self-examined such as head and neck, chest, abdomen, arms, extensor side of the legs. Colour change and itch were associated with longer patient delay (median 64 days vs. 24 days if no colour change, P < 0.05; and 137.5 days vs. 29 days if no itch, P < 0.01). Patient delay was not influenced by age, gender or socio-economic factors. General practitioners and dermatologists were the physicians most frequently involved in the first medical encounter about a lesion (55 and 33% of all cases, respectively). Of the physicians who first observed the lesion, 34 of the 43 dermatologists suspected the lesion immediately, compared with 38 of 72 GPs (x² = 7.95, P = 0.005). There were significant differences in the time to excision if the physician took immediate action, referred the patient or took no immediate action.

Suspected Cancer: Appendix J2 (June 2015) Page 185 of 264
Carli P et al, 2003
Italy The aim of this study was to investigate patterns of detection and variables associated with early diagnosis of melanoma in a population at intermediate melanoma risk. Each patient received a questionnaire about first identification of the lesion, the interval before diagnosis by a dermatologist or another specialist (patient’s delay), and the interval before the lesion was removed (physician’s delay). Patients were also asked about their knowledge of the criteria for early diagnosis of melanoma, their skin self- examination habits, and periodic medical consultation aimed to screen for melanoma. The main outcome measure was the relationship between patterns of detection and patients’ and physicians’ delays with melanoma thickness.
816 patients Patients with cutaneous melanoma diagnosed in 2001, in 11 Italian clinical centres.
Persons with newly diagnosed lesions were included in the study at the first visit after surgery.
-- Patterns of melanoma detection Most patients self-detected melanoma. Their spouse detected 12.5% of the lesions, while physicians first detected 38.7% of the lesions. The percentage of melanomas detected by a spouse differed according to sex (18.5% in male patients vs. 6.4% in female patients; x² test, P = .000). More than half of the subjects (68.9%) waited no more than three months before obtaining a diagnosis. The main reasons for longer waiting were the feeling that it was not important (56%), fear about a possible diagnosis of cancer (10.1%), lack of time (7.3%), and the mistaken opinion that to remove a naevus is dangerous (5.6%). Fifty-two patients (21%) reported waiting more than three months because another physician, seldom the family physician, did not think it was really a lesion suggestive of being a melanoma. Effects on mean thickness A lower mean thickness was significantly associated with female sex, high educational level, and the habit of performing skin self-examination. Age older than 60 years was associated with a higher mean thickness, compared with age younger than 40 years. Paradoxically, a lower mean thickness was found in those patients who waited more than one month before surgery once a definite diagnosis of a lesion suggestive of a melanoma was established (adjusted mean thickness, 0.74 vs. 0.89 mm). Association with diagnosis of thin lesions A statistically significant association with early diagnosis was found for female sex

Suspected Cancer: Appendix J2 (June 2015) Page 186 of 264
Author Setting Description No. Inclusion Exclusion Results Quality
(odds ratio [OR] for a lesion >1mm in thickness, 0.70; 95% confidence interval [CI], 0.50-0.97), higher educational level (OR, 0.44; 95% CI, 0.24-0.79), and the habit of performing skin self-examination (OR, 0.65; 95% CI, 0.45-0.93). The association with age was of borderline statistical significance.

Suspected Cancer: Appendix J2 (June 2015) Page 187 of 264
Cassileth et al, 1988)
USA In this study, consecutive patients with cutaneous malignant melanoma referred to two US hospital-based melanoma clinics by community physicians between 1984 and 1986 participated in the study. The authors conducted interviews with all the patients and also the physicians whom they had consulted regarding their suspicious lesions before their eventual referral to a melanoma centre. Histology data were obtained for all patients.
275 patients and 437 physicians
Charts of all patients diagnosed with superficial spreading melanoma at a university pigmented lesion clinic from 1972 through 1982. only data for patients over 17 years of age and with no prior primary melanomas were included.
---- A mean of six months elapsed (median one month) between the time that patients first noticed a new mark or a change in an existing lesion and the time that they became suspicious about it. The particular characteristics of lesions noted by patients did not influence length of time to suspicion. A mean of 2.6 additional months elapsed following suspicion until patients sought medical attention. The median delay during this period was one month. No lesion signs or characteristics were related to how quickly patients sought medical attention. The most common reason given by patients to explain this delay was that the lesion “did not represent an urgent problem”. For the entire subject population, the mean time from the initial physician visit to the diagnosis of malignant melanoma was 3.9 months. Time from initial physician visit to diagnosis was shorter only for lesions with pigmentation (P = 0.002). No other lesion characteristic was associated with length of delay from initial visit to diagnosis. Physicians alerted primarily by the lesion’s pigmentation and/or by its diameter or border, recalled having assessed the lesion clinically as a melanoma in 74% of patients. There was a significant relationship between correct identification of melanoma and physicians’ specialty (chi square, P < 0.05). Surgeons and dermatologists were more likely than other physicians to have identified the lesion correctly. The relationship between self-rated knowledge and correct identification of melanoma did not achieve statistical significance. Physicians’ actions in response to this initial evaluation were associated with

Suspected Cancer: Appendix J2 (June 2015) Page 188 of 264
Author Setting Description No. Inclusion Exclusion Results Quality
type of specialty practice (chi square, P < 0.001). Internists were most likely to make an immediate referral to a melanoma clinic, and surgeons were least likely to do so. Lesion characteristics were not associated with melanoma referral. Half of physicians interviewed reported that they did not examine the patient’s entire cutaneous surface. 52% of patients were seen by more than one physician prior to melanoma clinic referral. Patients who saw more than one physician were diagnosed as having melanoma a mean of 6.8 months after becoming suspicious about their lesions, compared to 4.1 months for patients who saw only one physician prior to melanoma clinic referral (Mann-Whitney U test, P= 0.006). Further, the interval from the initial physician appointment to diagnosis was greater for patients seen by more than one physician (5.8 months) than for patients seen by only one physician (1.8 months; P < 0.0001 by Mann-Whitney U test). Of all the demographic variables analysed (sex, occupation, education, marital status, health insurance, and age), only sex was significantly associated with delay. Men waited an average of 1.9 months and women an average of 3.3 months before seeing a physician after becoming suspicious about their lesions (P < 0.005 with the Mann-Whitney U test). Neither patients’ self-rated awareness of body changes nor their scores on the preoccupation with appearance test were associated with any component of delay, with tumour thickness, or with level of invasion.
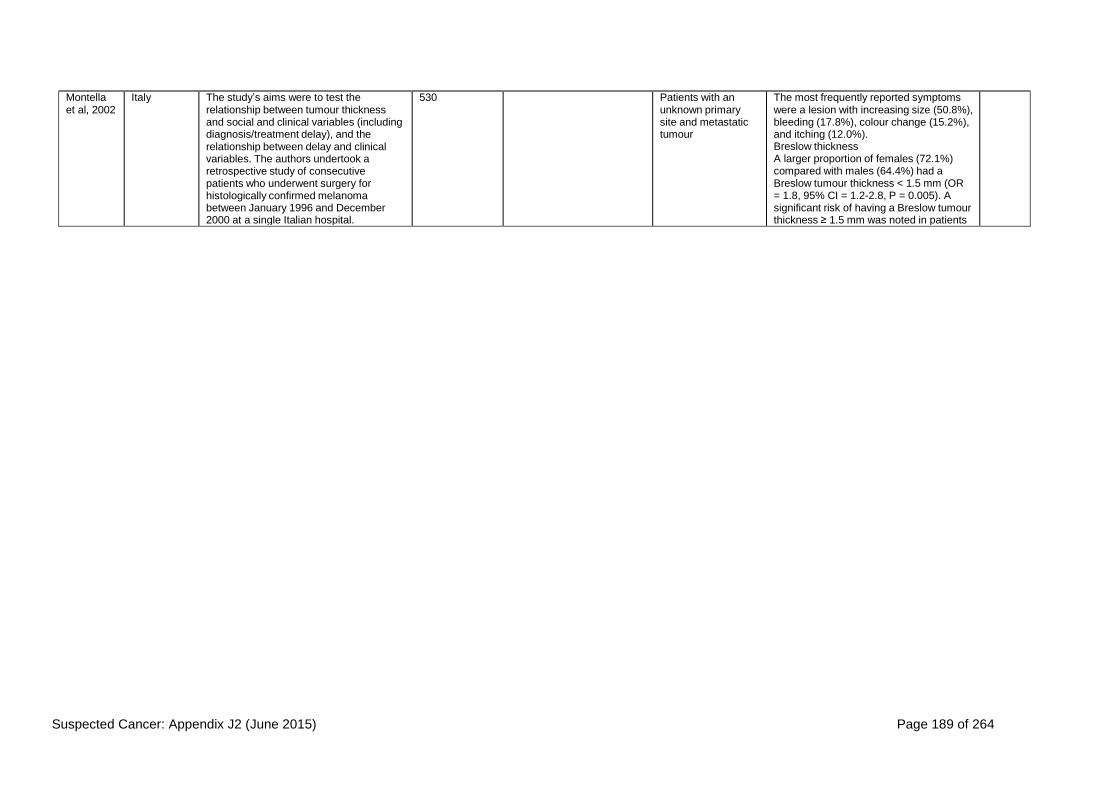
Suspected Cancer: Appendix J2 (June 2015) Page 189 of 264
Montella et al, 2002
Italy The study’s aims were to test the relationship between tumour thickness and social and clinical variables (including diagnosis/treatment delay), and the relationship between delay and clinical variables. The authors undertook a retrospective study of consecutive patients who underwent surgery for histologically confirmed melanoma between January 1996 and December 2000 at a single Italian hospital.
530 Patients with an unknown primary site and metastatic tumour
The most frequently reported symptoms were a lesion with increasing size (50.8%), bleeding (17.8%), colour change (15.2%), and itching (12.0%). Breslow thickness A larger proportion of females (72.1%) compared with males (64.4%) had a Breslow tumour thickness < 1.5 mm (OR = 1.8, 95% CI = 1.2-2.8, P = 0.005). A significant risk of having a Breslow tumour thickness ≥ 1.5 mm was noted in patients

Suspected Cancer: Appendix J2 (June 2015) Page 190 of 264
Author Setting Description No. Inclusion Exclusion Results Quality
who had a low level of education (OR 3.0, 95% CI 1.9-5.0, p = 0.0001) or who were unemployed (OR = 1.7, 95% CI = 1.1-2.8, P = 0.001). A significant risk of Breslow tumour thickness ≥ 1.5 mm was reported for patients who were examined by a physician other than a dermatologist (OR = 1.8, 95% CI = 1.2-2.8). Patient delay A greater than three month delay was observed for anatomic locations visible to patients (OR = 1.7, 95% CI = 1.1-2.6, P = 0.02). Anatomic site of the primary lesion was also related to patient delay: patients who had the primary lesion on an extremity were more likely to delay > three months (OR = 1.6, 95% CI = 1.1- 2.5, P = 0.02), especially females (OR = 2.2, 95% CI = 1.3-3.7, no P value given). Medical delay A significant association was observed between medical delay and the physician who made the diagnosis: a delay > three months carried a higher risk (OR = 2.0, 95% CI = 1.2-3.4, P = 0.01) in patients examined by a dermatologist. A medical delay of one to three months placed at risk patients with a primary lesion in an extremity (OR = 1.8, 95% CI = 1.0-2.9, P = 0.03). None of the other variables studied (gender, age at diagnosis, education, and occupational status) were significantly associated with either patient or medical delay.

Suspected Cancer: Appendix J2 (June 2015) Page 191 of 264
Oliveria et al, 1999
The purpose of this large population- based case control study was to examine the relationship between patients’ knowledge and awareness of the signs and symptoms of melanoma and delay in seeking medical attention for suspicious lesions. Personal interviews were conducted to obtain information on patient’s knowledge of melanoma signs and symptoms, skin awareness, and delay in seeking medical attention.
650 residents of Connecticut 18 years of age or older with cutaneous melanoma newly diagnosed between 1987 to 1989, who were part of a population-based control study
Patients who had their melanoma identified by a physician during a visit for an unrelated condition
The mean delay time for patients seeking medical attention was two months with a range from 0.5 to 22 months. Overall, the results revealed an inverse relationship between both knowledge and awareness and delay in seeking medical attention for melanoma. The odds ratios for knowledge of melanoma characteristics and delay ranged from 0.42 to 0.81 after controlling for age, gender, prior history of cancer, and skin self-examination. Patients who were aware of skin changes and or abnormalities had a reduced likelihood of delay in melanoma diagnosis after adjusting for age, gender, prior history of cancer, and skin self-examination practices (OR = 0.30, 95% CI = 0.12 – 0.71). The findings suggested that knowledge of two or more signs or symptoms of melanoma reduces the likelihood of a delayed diagnosis (OR = 0.34, 95% CI = 0.13-0.88). Skin awareness was associated with a reduced thickness (OR = 0.50, 95% CI = 0.28-0.89). Increased knowledge of melanoma signs and symptoms also decreased the likelihood of being diagnosed with a thick tumour (≥ 0.75 mm). The odds ratio ranged from 0.69 to 0.95 for the knowledge variables (except for larger diameter and abnormal shape, odds ratios = 1.17 and 1.14 respectively).

Suspected Cancer: Appendix J2 (June 2015) Page 192 of 264
Rampen et al, 1989
Netherlands. The aim of the study was to relate possible delay factors to the most important prognostic features at the time of diagnosis (the clinical stage of the disease for all patients, and the maximal tumour thickness). The study comprised consecutive patients with cutaneous melanoma presenting with primaries or metastases to 12 Dutch hospitals. All patients were interviewed shortly after diagnosis using a detailed questionnaire about the patient’s history, tumour characteristics, treatment particulars, and pathology.
284 patients Consecutive patients with cutaneous melanoma presenting with primaries or metastases, registered between January 1981 and the end of 1983
Patients with non- invasive (Clark level 1) melanoma, patients who refused taking part in the study, and patients who were mentally unsuitable for the enquiry
The interval between the onset of signs and the first visit to a doctor tended to increase with age (P = 0.055). Females presented with less advanced disease than males, particularly in stage I disease (P = 0.004). Visibility of the primary lesion had no impact on the stage of the disease. The average interval between the appearance of the first signs and doctor’s consultation was similar in males and females. For both sexes, the interval was considerably longer for the easily visible melanomas than for the more hidden ones (P < 0.001, adjusted for sex). If patients suspected they had cancer, this tended to have a favourable impact on the stage of the disease (for the microstage P = 0.079, for the clinical stage P = 0.049). There was no evidence that patients in the higher socio-economic class have a better knowledge of the malignant nature of their disease (P = 0.076). Even if patients were aware of the possible malignant character of the growth, they often displayed a delay of more than one month before they consulted a doctor (54% of cases, N = 63). The reasons given for this delay were a feeling that the situation was not pressing in 41, lack of time in 24, fear of cancer in 15, aversion of going to the doctor in ten, and miscellaneous reasons in nine patients (many patients gave more than one

Suspected Cancer: Appendix J2 (June 2015) Page 193 of 264
Author Setting Description No. Inclusion Exclusion Results Quality
reason). Patients who had waited until their symptoms became severe enough to seek medical care by themselves, had a more advanced clinical stage of the disease than those who had been persuaded by someone else to go to the doctor, or than those whose melanoma had been discovered by chance (P = 0.018). Patients who presented their melanoma secondary to another reason for visiting the doctor had a more favourable clinical stage and the primary melanomas were considerably thinner (P < 0.001). When doctors found a primary melanoma by chance, the microstage appeared to be much more favourable than when patients themselves had noticed a suspicious lesion (P < 0.001). Patients with amelanotic melanomas had more unfavourable microstages than those with melanotic primaries (P < 0.006). Melanoma suspicion was highest for melanotic and lowest for amelanotic tumours (P = 0.049).

Suspected Cancer: Appendix J2 (June 2015) Page 194 of 264
Richard et al, 2000a
France This paper evaluates the role of a patient in contributing to delay in diagnosis of skin cancer. Consecutive patients referred for cutaneous melanoma to 18 French dermatological departments of the public hospital system participated in the study conducted between 1995 and 1996. All patients were examined and interviewed by a specially trained dermatologist in each centre. The questionnaire addressed patients’ characteristics such as age, sex, residence, social level, and education level, amongst others.
590 Patients at least 12 years of age, histological confirmed diagnosis of melanoma, and interview within 12 weeks after melanoma resection. Patients were included only when the report forms were completed, when a histological slide was available, and when two experts confirmed the diagnosis.
Those that did not fulfil the inclusion criteria.
42.4% of the sample were males and 57.6% females. Tumour thickness in coincidentally diagnosed melanoma was significantly lower than in self-diagnosed melanoma (median 0.93 mm vs. 1.30 mm, P < 0.001). Median tumour thickness was significantly lower when the lesion was first detected by the patient than when it was detected by the family (1.22 mm vs. 1.40 mm, P < 0.001, Kruskal- Wallis test). Reasons for delay according to the patient Patients delayed presentation to a physician beyond two months in 48.1% of cases. The reasons given were: innocent appearance of the lesion together with the absence of systemic signs in 39.3%, absence of awareness about the urgency in 34.8%, occupational reasons in 20.4%, familial reasons in 16.9%, fear of diagnosis in 9.4%, passivity until family urged consultation in 5.5%, negligence in 4.5%, and absence of pain in 1.0%. Comparison of the self-detected and the coincidentally diagnosed melanoma Melanomas were more often self-detected by women than by men: 74.1% vs. 66.8%, respectively (x² test, P = 0.053). The patients with a self-detected melanoma had a significantly higher educational level than the patient with a coincidentally diagnosed melanoma (53.1% vs. 65.7%, x² test, P = 0.03). The patients with a coincidentally diagnosed melanoma lived more frequently in the countryside than the patient with a self-detected melanoma (29.6% vs. 20.3%, x² test, P = 0.02). Previous history of melanoma was more frequent in the patients with a coincidentally diagnosed melanoma than in the patients with a self-detected melanoma (27.9% vs. 16.5%, P < 0.001). The degree of awareness about skin, sun, and cancer was higher in patients who later detected their melanoma themselves than in those whose tumour was coincidentally detected. Analysis of factors influencing delays and tumour thickness in self-detected melanoma

Suspected Cancer: Appendix J2 (June 2015) Page 195 of 264
Univariate analysis. People older than 65 years sought medical attention more quickly than people younger than 50 years (P = 0.003), but they tended to develop thicker tumours (P = 0.51). Gender did not influence significantly any component of the delays, although Breslow thickness was higher in men than women (P < 0.001). Delays did not differ in patients with high and low level of education, although those with low education level had thicker tumours (P < 0.001). There was no difference in the socioeconomic profile of the patients in regard to delays or Breslow thickness. Delays or tumour thickness were not influenced by marital status. People living in the countryside, although seeking medical attention more rapidly (P = 0.003), developed thicker tumours (P = 0.045). Awareness and information about melanoma did not have any significant impact on patient delay. Tumour thickness was significantly thinner when the patient had already heard about melanoma and was previously aware of the early signs of melanoma. Multivariate analysis. None of the candidate variables related to patient delay significantly predicted independently patient delay in multivariate analysis. In a stepwise multiple linear regression using all variables influencing tumour thickness, three variables were predictive of a high Breslow: ulceration, the fact that the patient said that raising was the reason for consultation, and nodular histological type.

Suspected Cancer: Appendix J2 (June 2015) Page 196 of 264
Richard et al, 2000b
France The purpose of the study was to assess all doctor-related components in the delay before melanoma resection. Consecutive patients referred for cutaneous melanoma to 18 French dermatological departments of the public hospital system participated in the study conducted between 1995 and 1996. All patients were examined and interviewed by a specially trained dermatologist in each centre. The questionnaire investigated patient characteristics and habits, tumour clinical features, circumstances of melanoma detection, causes of delay in diagnosis, and doctors attitudes before removal. Physician delay was defined as the interval between the date the lesion was first examined by a physician and the date when a physician first proposed resection.
590 Inclusion criteria were: at least 12 years of age, histological confirmation of diagnosis of melanoma, and interview within 12 weeks after melanoma resection. Patients were accepted only when the report forms were completed, when a histological slide was available, and when two experts confirmed the diagnosis.
Persons that did not fulfil the inclusion criteria.
The median delay before the doctor proposed tumour resection was 0 (mean 103, range 0-5,783) days. For comparison, the median delay under patient responsibility was 912 (mean 3,829, range 0-25,261) days. Attitude of the physician The first advice from the first doctor was considered to be appropriate in 85.8% of cases. Factors influencing medical delays and tumour thickness Univariate analysis. The delay to propose resection was much longer when the attitude of the first physician was inappropriate than when removal was proposed at the first visit (median 109 days vs. 0 days, P< 0.001). Although there was a higher tumour thickness when the attitude was inappropriate (median 1.40 vs. 1.15 mm, mean 3.15 vs. 2.00 mm), the difference was not significant (P = 0.99). Tumour thickness was significantly lower when first seen by a dermatologist than by another physician (median 0.94 mm vs. 1.50 mm, mean 1.88 mm vs. 2.82 mm, respectively; P< 0.001). The delay to propose removal was significantly shorter when the first physician was a dermatologist than when he or she was a general practitioner or another specialist (median 0 vs. 25 days, mean 60 vs. 153 days, respectively; P < 0.001).

Suspected Cancer: Appendix J2 (June 2015) Page 197 of 264
Author Setting Description No. Inclusion Exclusion Results Quality
In self-detected tumours, doctors proposed removal significantly later for acrolentiginous melanoma, amelanotic melanomas, and melanomas of the hand and foot than for other tumours. Multivariate analysis. In a stepwise multiple linear regression, the most predictive factors influencing physician delay were histoclinical type and the ability of the first physician seen to recognise melanoma. The shorter delays were observed with lentigo melanoma and melanomas first seen by dermatologists. In a stepwise logistic regression, the factor most predictive of a long physician delay (> 30 days) remained the specialty of the first physician (other physicians vs. dermatologists; coefficient 2.27, SE 0.32, OR 9.7, 95% CI 5.16-18.2, P< 0.001).

Suspected Cancer: Appendix J2 (June 2015) Page 198 of 264
Schmid- Wendtner et al, 2002
Germany The aim of the study was to investigate the extent and consequence of patient and professional delay in diagnosis and treatment of cutaneous melanoma. The interview investigated melanoma- associated symptoms, the site and features of the cutaneous melanoma, time intervals, and reasons for delay in diagnosis.
233 patients Patients with primary cutaneous melanomas diagnosed and treated at a univerisyt hospital between January 1999 and January 2001.
Not mentioned. Patients with knowledge about melanoma presented with a median tumour thickness of 0.7 mm, whereas patients without knowledge had a median tumour thickness of 2.1 mm (P < 0.0001). Knowledge about melanoma was associated with the educational status of patients. More than 90% of patients with a high or medium educational status had knowledge about melanoma, and less than 10% had no knowledge about melanoma (P < 0.001). In contrast, only 71% of patients with low educational status were knowledgeable about melanoma. Medical attention was sought within 1 month of noticing the appearance of a new lesion or the onset of changes in a pre-existing lesion by 15.5% of patients. Longer periods of patient delay were not associated with greater tumour thickness. The majority of patients asked about the reasons for delay had initially thought that the pigmented lesion was benign or not important (63.5%). A smaller group of patients did not delay the consultation of a physician (12.0%), 9.9% of patients were afraid of the physician’s diagnosis, 8.1% of patients could not detect the lesions themselves because of its anatomical site, and 6.9% mentioned that they were too busy to consult a physician. In 3% of patients the reasons for delay remained unclear.

Suspected Cancer: Appendix J2 (June 2015) Page 199 of 264
Silfen et al, 2002
In this authoritative review, the authors investigated the role of the physician and the patients in diagnostic delay of melanoma
Physicians Tumour characteristics have an important effect, a shorter medical delay occurring for nodular and lentigo melanoma than for acrolentiginous melanoma. Longer diagnostic delays have also been associated with tumours deriving from nevi compared with de novo melanomas. Patients In one case-control study, monthly skin self-examination was associated with a 63% reduction in mortality from melanoma. However, although people may report conducting a thorough examination of their study, on closer questioning, only a few have actually done so (quoted in the review).

Suspected Cancer: Appendix J2 (June 2015) Page 200 of 264
Table 11 HEAD AND NECK CANCER INCLUDING THYROID CANCER: signs and symptoms, including risk factors
Author Setting Description No. Inclusion Exclusion Results Gold
Std Quality
Beaty et al, 1998
USA A retrospective review of the medical records of patients who had undergone tonsillectomy at a US hospital
453 Patients 18 years old or older undergoing palatine tonsillectomy at the University of Iowa Hospitals and clinic between January 1985 and September 1995.
-- There was a strong statistical association between the presence of risk factors and malignancy (P<.0001). Features postulated as predictive of a diagnosis of tonsillar malignancy included a prior history of head and neck cancer P<.0001; tonsillar asymmetry P<.0001; palpable firmness or visible lesion of the tonsil P<.0001, neck mass P<.0001; unexplained weight loss P<.0001; and constitutional symptoms including fatigue, night sweats, fevers and anorexia P=.003. These risk factors were correlated with the pathologic diagnosis in the reviewed cases. Of the 453 patients included, 25 had a tonsillar malignancy confirmed histopathologically. Patient age ranged from 18 to 72 years, with a mean age of 29.8 years. The mean age was 28.4 years for patients with benign lesions, and 54.4 years among those with malignant lesions. This difference was statistically significant (P.0001). There were 210 (49%) men and 218 (51%) women with benign disease. There were 17 (68%) male and 8 (32%) female patients with malignant lesions, (not a statistically significant difference). Of the 428 patients with benign disease, 87 (20%) identified themselves as tobacco smokers. Among the 25 patients with malignant pathology, 10 (40%) identified themselves as smokers. Tobacco smoking was significantly associated with the diagnosis of malignancy (P<0.05). No patient without the postulated features was found to have malignancy. Of the 25 patients with malignant tonsillar pathology, 23 had two or more features, and two patients had one feature only. Tonsillar asymmetry, found in 20 of the 25 cases was the sign most frequently associated with malignancy. Of the 453 patients, 70 had at least one of the features identified during their preoperative assessment. Of this group, 25 had malignant tonsillar lesions. Of the remaining 383 patients with no features

Suspected Cancer: Appendix J2 (June 2015) Page 201 of 264
Author Setting Description No. Inclusion Exclusion Results Gold Std
Quality
identified, none had histologically demonstrable malignancy. The same statistical protocol was used to analyse the patient group excluding those with a prior history of cancer because this group may have included some patients with recurrent or persistent disease rather than a primary malignancy. The chi-square and Fisher’s Exact tests resulted in p values of 1) history of cancer P<.0001; 2) tonsillar asymmetry P<0.001; 3) palpable firmness or visible lesion of the tonsil P<0.0001; 4) neck mass P<0.0001; 5) unexplained weight loss P= 0.0004 and 6) constitutional symptoms P=0.03. No patients with three or more features had benign tonsillar pathology. Modelling analyses that included all patients in the study indicated that advanced age, tonsillar asymmetry, history of cancer, and presence of a neck mass yielded a predictive model for malignancy with an R of 0.772. Patients’ smoking or alcohol history or sex was not significantly correlated with malignancy. 29 patients (6.8%) among the 428 with benign lesions were identified as alcohol abusers. Among the 25 with malignancy, 11 (44%) had a history of alcohol abuse; this difference was significant (P,0.001).
British Thyroid Association / Royal College of Physicians, 2002
The remit of the guideline group was to develop evidence based guidelines of best current practice for management of thyroid cancer in adults. The guidelines were developed from the Northern Cancer Network Guidelines through a process of literature review, discussion by the multidisciplinary guideline group and external peer review. Evidence was graded Ia to IV, and recommendations graded A to C.
The guideline recommendations on diagnosis and referral were concerned with the symptoms or signs that warrant an investigation (thyroid cancer usually present with a lump in the neck), symptoms needing urgent referral (e.g. thyroid lump in a patient with a family history of thyroid cancer), physical examination (the patient should have a full examination focussing on inspection and palpation of the neck), who to refer to
DiLeo et al, 1996
USA Patients with primary nasal septal squamous cell carcinoma of three university affiliated hospitals were identified from tumour registries and medical records. A meta-analysis was performed to evaluate predictors of survival.
16 Only primary tumour series giving individual patient stage, treatment, survival, and disease status were included in the analysis. Only those patients for
-- The 12 male and four female patients had a mean age of 62 years (range: 45 to 88 years). The time from first symptom to presentation averaged 12 months (range: 0- 48 months), and the most common initial symptom was a nasal mass. The time from the initial physician visit to the diagnosis of squamous cell carcinoma of the nasal
Histology

Suspected Cancer: Appendix J2 (June 2015) Page 202 of 264
Author Setting Description No. Inclusion Exclusion Results Gold Std
Quality
whom chart notes, surgical reports, or pathologic descriptions clearly identified the tumour as a primary squamous cell carcinoma of the nasal septum were entered into the study
septum averaged six months (range: 0-48 months). On physical examination, the most common findings were nasal ulcerations, masses, septal perforations and skin changes. A history of heavy smoking was reported in 15 of the 16 patients.
DoH Referral Guidelines for Suspected Cancer, 2000
Recommendations were made for urgent referral; Hoarseness persisting for >six weeks Ulceration of oral mucosa persisting for > three weeks Oral swellings persisting for > three weeks All red or red and white patches of the oral mucosa Dysphagia persisting for three weeks Unilateral nasal obstruction particularly when associated with purulent discharge Unexplained tooth mobility not associated with periodontal disease Unresolving neck masses for > three weeks Cranial neuropathies Orbital masses Additionally the level of suspicion is increased further if the patient is a heavy smoker or heavy alcohol drinker and is over 45 years and male.
Dolan, 1998
US
Hoare et al, 1993
UK Case series in which information was collected about patients referred to a hoarse voice clinic in Birmingham. All patients with a hoarse voice for four weeks were referred by general practitioners who were asked to make a presumptive diagnosis of laryngeal cancer, vocal cord palsy, laryngitis or other conditions.
271 patients
The first 300 patients. -- When seen in the clinic, 102 (34%) had normal voices and larynxes. Thirty-nine patients (14%) were admitted for direct laryngoscopy and biopsy under general anaesthetic. Ten (3.3%) were found to have laryngeal cancer of which eight were early lesions. All of those with cancer were current or past smokers. Although 40% of the study population were men, 80% of those with cancer were men. A hoarse voice for four or more weeks was regarded in this study as a symptom requiring specialist assessment. It was feasible to offer this service without appointments to patients with persistent hoarseness. There were six cases of cancer among the 25 patients in whom general

Suspected Cancer: Appendix J2 (June 2015) Page 203 of 264
Author Setting Description No. Inclusion Exclusion Results Gold Std
Quality
practitioners diagnosed malignancy. They did not diagnose malignancy in seven other cases of cancer or dysplasia. This gave a sensitivity and specificity for general practitioner diagnoses of 46% and 24% respectively. The mean duration of symptoms before initial general practitioner consultation was 14 weeks and the time between this consultation and attendance at the hoarse voice clinic was three weeks. This study indicated that the diagnosis of the cause of prolonged hoarseness without visualising the larynx was unreliable. Symptoms were insufficient to make an accurate diagnosis.

Suspected Cancer: Appendix J2 (June 2015) Page 204 of 264
Holmes, 2003 USA Case series in which clinical information about patients with newly diagnosed oral or oropharyngeal squamous cell carcinoma were collected through patient interview and chart audit
51 patients
Only patients with squamous cell cancers of the oral cavity or oropharynx.
Patients with second primaries or recurrences were excluded, as were patients with lesions discovered during the evaluation of neck mass.
Thirty-six patients had squamous cancer of the oral cavity and 15 had cancer of the oropharynx. The mean age of the study population was 62.2 years (range 29 to 88 years). Seventy-six percent of patients had a smoking history, and 67% admitted to occasional or heavy use of alcohol. Three patients had a family history of squamous cancer of the mouth or throat. The average clinical size of the lesions was 2.7cm. Detection of a lesion during an office visit for an unrelated reason or routine office visit (non-symptom-driven detection) occurred in 18 cases. Detection during these non- symptomatic driven examinations took place in dental offices (N=15), a denturist’s office (N=1), and in oral and maxillofacial surgeons’ offices (N=2). Lesions detected during a non- symptom driven examination were of a statistically significant lower average clinical and pathologic stage (1.7 and 1.6 respectively) than lesions detected during a symptom directed examination (2.6 and 2.5 respectively). Lesion (symptom-driven detection) occurred in 33 cases during appointments made by patients. Symptom driven examinations took place in dental offices (N=18), primary care offices (N=7), oral and maxillofacial surgeons’ offices (N=4), and otolaryngologists’ offices (N=4). Detection of a lesion during a non- symptom driven examination was associated with a significantly smaller lesion clinically (2.2; SD, 1.1 cm) than one detected during a symptom-directed examination (3.0; SD,

Suspected Cancer: Appendix J2 (June 2015) Page 205 of 264
Author Setting Description No. Inclusion Exclusion Results Gold Std
Quality
1.2cm). Lewin et al, 1998
Sweden The aim of this case controlled study was to investigate the association between tobacco smoking and alcohol consumption, and squamous cell carcinoma of the head and neck. males living in two geographic regions were studied in addition to controls.
605 males
756 controls
Males aged 40-79 living in two geographic regions selected by stratified random sampling from population registries
Cancers occurring outside the study base
Among those who were tobacco smokers at the time of the study, the relative risk of head and neck cancer was calculated at 6.5% (95% confidence interval, 4.4-9.5%). After cessation of smoking, the risk gradually declined, and no excess risk was found after 20 years. The results suggested that tobacco smoking and alcohol intake had a strong interactive effect on the risk of squamous cell carcinoma of the head and neck. Moderate alcohol intake (10-19 grams per day) had little or no effect among non-smokers. For different intensities of smoking, the RRs were 6.1 (95% CI =4.0-9.5) for men smoking <15 grams per day, 6.1 (95% CI =4.0-9.3) for men smoking 15-24 grams per day, and 6.6 (95% CI = 3.4-12.7) for men smoking 25 grams per day, suggesting little or no impact of mean smoking intensity. Nevertheless, smoking cessation and the duration of smoking each had a decisive impact on risk. The cancer subsites in the cases were: the oral cavity in 128 , the pharynx in 138 (75 oropharynx and 63 hypopharynx), the larynx (mainly glottic) in 157, and the oesophagus in 123 cases. Analysis by cancer subsite showed similar results, although the relative effect of smoking was more pronounced for cancers of the pharynx and larynx than for cancers at the other subsites. For current smokers, the RR (with 95% CI) were as follows: for cancer of the pharynx, 8.5 (4.0- 18.2); larynx 7.5 (3.9-14.2); oesophagus 5.2 (2.6-10.3); and oral cavity 4.9 (2.6-9.2). For men who had smoked 45 years or longer: pharynx, RR =10.1 (4.6-22.1); larynx, relative risk =7.6 (3.9-14.7); oesophagus, RR =5.4 (2.7-11.0); and oral cavity, RR =6.3 (3.2- 12.4). There was a gradual increase in the risk of cancer of the head and neck with increasing alcohol intake. However, moderate alcohol intake (10-19 grams per day) had little or no impact on the risk of cancer in ex-smokers and in men who had never smoked.
Lo Muzio et al, 1998
Italy A total patients affected by oral lichen planus were followed between 1986-
263 patients
The criteria for inclusion were 1)
-- Fourteen cases (5.3%) developed oral squamous cell carcinoma: ten (3.8%) in an

Suspected Cancer: Appendix J2 (June 2015) Page 206 of 264
Author Setting Description No. Inclusion Exclusion Results Gold Std
Quality
1996 in order to determine how many developed cancer. This study also investigated the clinical aspects of cases of oral squamous cell carcinoma affecting patients with oral lichen planus
clinical diagnosis of OLP; 2) confirmation of the diagnosis by oral biopsy.
area of pre-existing oral lichen planus, three (1.1%) in other sites, and in one case the diagnoses of oral lichen planus and squamous cell carcinoma were synchronous (0.4%). Three patients were positive for anti- HCV antibody. Of the 263 patients with oral lichen planus, 156 (59.3%) were in females. Age ranged from 22 to 80 years, with a mean of 55.5 years; 57.2 years for women and 54.7 years for men. The follow up period ranged from two to ten years, with a mean of 5.7 years. 74 (28.13%) patients were smokers. Nine of the fourteen patients who developed squamous cell carcinoma were male (64.3%) and five were female (35.7%); at the time of squamous cell carcinoma diagnosis the patients’ ages ranged from 25 years to 66 years, with a mean age at presentation of 53 years (52.7 years for males and 53.4 years for females). Three aetiological theories were possible: 1) oral lichen planus transforms into squamous cell carcinoma, thus being truly premalignant; 2) the altered surface epithelium could be more susceptible to carcinogens, viruses or chemical irritants; 3) a carcinoma could appear coincidentally in the area affected by oral lichen planus.

Suspected Cancer: Appendix J2 (June 2015) Page 207 of 264
Musholt et al, 2000
Germany A meta-review of the literature on familial papillary thyroid carcinoma (FPTC) was undertaken to identify the characteristics of families with frequent occurrence of papillary thyroid carcinoma (PCT) or multinodular goitre (MNG) or both.
A database of patients with thyroid cancer was searched for potential FPTC families at the Hannover University Medical School. Clinical examinations were performed in six of 12 Hannover kindreds identified and blood samples of all family members were collected for genetic analyses. Based on the meta-review and the team’s own experience, predictive criteria to identify families at risk were developed.
6 Hannover kindreds
Primary criteria for susceptibility to FPTC were identified as 1) papillary thyroid carcinoma in two or more first-degree relatives and 2) MNG in at least three first or second-degree relatives of a papillary thyroid carcinoma patient. Secondary criteria included diagnosis in a patient younger than 33 years, multifocal or bilateral papillary thyroid carcinoma, organ exceeding tumour growth (T4), metastasis (N1, M1), and familial accumulation of adolescent-onset thyroid disease. A hereditary predisposition to papillary thyroid carcinoma was considered if both primary criteria or one primary criterion plus three secondary criteria were present. From 1958 to 1999 a total of about 160 kindreds with two or more relatives suffering from papillary thyroid carcinoma (with or without MNG in family members) were identified in the literature search. Patient age

Suspected Cancer: Appendix J2 (June 2015) Page 208 of 264
Author Setting Description No. Inclusion Exclusion Results Gold Std
Quality
at the time of diagnosis of malignant thyroid disease ranged from 8 to 66 years but was often below 33 years. Approximately one- third of patients presented with organ- exceeding tumours. Bilateralism, tumour multifocality, or both were seen in about 40% to 50% of cases. There was early metastatic spread to loco-regional lymph nodes in a considerable number of patients and distant metastases in up to 5% of patients. In addition, even small multifocal tumours presented with lymph node metastases. Characteristic features of FPTC were outlined as early onset, a more aggressive biologic behaviour than that of sporadic papillary thyroid carcinomas, tumour in multiple thyroid sites, and metastasis even in micro- papillary thyroid carcinomas. A high incidence of MNG developing at a young age, and adolescent-onset thyroid disease such as hypo/hyperthyroidism, immunothyroiditis, or adenoma were identified as common features of blood relatives of FPTC patients.

Suspected Cancer: Appendix J2 (June 2015) Page 209 of 264
Office for National Statistics, 2001
Laryngeal cancer is rare in males aged under 40 but rates rise quickly after this age, reaching a peak in the 75-79 age group (27 per 100,000 in 1997) There were just under 600 deaths in males from laryngeal cancer in England and Wales in 1999. As with incidence, mortality from laryngeal cancer is rare in the under 40s but rises steeply thereafter. The most affluent groups have the lowest rates; mortality in the most deprived groups is approximately four times that in the most affluent groups. The steeper gradient with deprivation in mortality than in incidence suggests that survival is worse in the more deprived groups. There is a north-south divide in the incidence of laryngeal cancer. Incidence was substantially higher in the Northern and Yorkshire and North West regions with a rate around 30% above the average for England and Wales. The incidence in Anglia and Oxford, South Thames, Trent, South West and West Midlands is below average. The regional variation in mortality is generally similar to that for incidence. Survival from cancer of the larynx in England and Wales was rated as moderately good with one-year relative survival of 83% and after five years of 64% for patients diagnosed in 1991-93. Five year relative survival decreases with increasing age at diagnosis, from 75% in the youngest age group (15-39) to just over 50% in the oldest (80-99).

Suspected Cancer: Appendix J2 (June 2015) Page 210 of 264
Oral cancer awareness group, 2000
This review was prepared by the Scottish Oral Cancer Awareness Group to provide guidance to primary health care teams
In providing advice on prevention, the guidance highlighted the risk factors of tobacco, alcohol, nutrition (a diet high in fruit and vegetables was recommended), sunlight exposure, human papilloma viruses, oncogenes, and pre-existing mucosal abnormalities including leukoplakia, erythroplakia and speckled leukoplakia. Primary health care professionals were encouraged to help patients reduce their level of risk with an emphasis on smoking cessation and sensible drinking. The early symptoms of oral cancer were described as a (i) non-healing ulcer or sore, (ii) any lump or thickening, (iii) any white or red patch, (iv) persistent soreness. Late symptoms were described as (i) difficulty chewing or swallowing, (ii) difficulty moving the tongue or jaw, (iii) numbness of the tongue or other area of the mouth, (iv) swelling of any part of the mouth which may cause dentures to fir poorly or become uncomfortable, (v) a lump in the neck. Common presenting signs were described as (i) red patch, (ii) white and red patch, (iii) ulceration or erosion, (iv) induration, (v) fiaxation to surrounding tissues, (vi) lymphadenopathy.
Talamini et al, 1994
Italy An early detection programme for cancer of the head and neck was conducted from January 1991 to January 1993. high-risk individuals were referred to a research nurse by 21 general practitioners
212 Patients above 35 years of age, who reported habitual smoking and intake of more than half a litre of wine or equivalent per day
-- Head and neck cancer was found in 5 (2.4%) subjects (i.e. one cancer of the oral cavity, one of the pharynx, two of the larynx and one of the oesophagus, which was suspected because of saliva residues in the hypopharynx); precancerous lesions were detected in 15 (7.1%) additional subjects. Female had a 2.4-fold higher odds of non- compliance with the offered examination than males. Acceptance tended to be lower in younger age groups (OR of non compliance in individuals below age 45 as compared to

Suspected Cancer: Appendix J2 (June 2015) Page 211 of 264
Author Setting Description No. Inclusion Exclusion Results Gold Std
Quality
those aged 65 or above=2.1). The presence of upper aerodigestive tract symptoms (6.2% of the overall group) exerted a significant influence on compliance with the programme, making attendance at the ENT examination 2.4-fold more frequent than in the absence of symptoms. With respect to major risk factors for head and neck cancer, current smokers were more reluctant to attend the ENT examination (OR in current smokers vs. non smokers = 3.4, 95% CI 1.8-6.3). Drinkers and former drinkers were particularly likely to accept the invitation. It was concluded that the response of targeted patients to the invitation to undergo an ENT examination was low and the most important risk factor of smoking for head and neck cancer onset, was associated with a significantly lower compliance.

Suspected Cancer: Appendix J2 (June 2015) Page 212 of 264
Table 12 HEAD AND NECK CANCER INCLUDING THYROID CANCER: investigations
Author Setting Description No. Inclusion Exclusion Results Gold
Std Quality
British Thyroid Association / Royal College of Physicians, 2002
A recommendation about initial investigations in primary care of patients with thyroid nodules.
Appropriate investigations pending hospital appointment (B) Thyroid function tests should be requested by the general practitioner. Euthyroid patients with a thyroid nodule may have thyroid cancer and should be referred to a member of the multidisciplinary thyroid cancer team. Patients with hyper- or hypothyroidism and a nodular goitre should be referred routinely to an endocrinologist. Initiation of other investigations by the general practitioner, such as ultrasonography or isotope scanning, is likely to result in unnecessary delay and cost in making the diagnosis of cancer (IIb, B).
Caplan et al, 2000 USA A one-year retrospective chart review of patient records. A table was constructed to record the use of fine-needle aspiration (FNA), cytology, radionuclide scanning and thyroid ultrasonography by primary care physicians (non specialists) evaluating thyroid nodules
49 primary care
81 thyroid nodules
Patients evaluated for thyroid nodules at a medical centre in 1996.
-- it was concluded that FNA cytology was a safe and accurate test. The study concluded that fine-needle aspiration cytology, adopted as the initial test for diagnosing thyroid nodules reduced the use of imaging studies and substantially decreased the cost of thyroid nodule management.
Epstein, 1997 A review involving a search of Medline and Cancerlit 1990 to 1995. Evidence was sought on diagnostic tools to assist in biopsy site selection and subsequent diagnosis of patients at risk for oral cancer
Not stated. All articles identified from a Medline and Cancerlit search from 1990 to August 1995.
-- The identified studies indicated that there was consensus that oral examination of patients at risk for oral squamous cell carcinoma should be conducted on a regular basis. Toluidine blue has been shown to be useful as an adjunct to the clinical examination when used by experienced clinicians. Exfoliative cytology was not currently used as a routine measure for the evaluation of lesions of the oral mucosa, but further development and the application of biologic markers to cytologic specimens may increase its value. Fluorescent imaging of malignant lesions of the oral mucosa has been shown to be sensitive and specific in animal models but thus far has been reported in only one human trial. The sensitivity and specificity of these techniques when used by general practitioners have not been assessed.

Suspected Cancer: Appendix J2 (June 2015) Page 213 of 264
Author Setting Description No. Inclusion Exclusion Results Gold Std
Quality
Further, none of the above procedures has yet been shown to be a cost-effective public health measure in screening for oral cancer.
Johnson, 1998 Toludine blue staining as a screen for oral cancer was evaluated by systematically reviewing the evidence from trials (from 1964 to 1997). The trials were divided into those using a single application of the stain and those using a second application of the stain or a period for resolution of transient inflammatory lesions
Single application: 17 trials and a total of 2948 patients
Second application: five trials and 924 patients.
-- -- It was concluded that the sensitivity and specificity of toluidine blue as a test for early detection of oral cancer was adequate, but it must not be seen as a replacement for a detailed visual and digital examination. The use of a second test 14 days later was recommended, as was mandatory biopsy of clinically suspicious lesions/areas even if staining is negative. For clinicians in primary care settings specific training is required for correct application of the test and correct interpretation of the results.
Lawrence, 2002 USA A informal review 50 references -- -- Fewer than 5% of all adults will have a palpable thyroid nodule, but this is still a large number of individuals who require evaluation. Important aspects of history taking with a patient in whom a thyroid nodule has been noted include age, gender, family history of thyroid cancer, dysphagia, and presence of symptoms of hypermetabolism. Key features of evaluation by physical examination are the size and location of the thyroid abnormality, the degree of firmness of the nodule, the presence of other nodules in the thyroid, palpable cervical lymph nodes, vocal cord paralysis, and tachycardia and/or tremor. The major categories of thyroid abnormality in such patients include cysts, adenomas, thyroiditis and cancer. Fine needle aspiration biopsy (FNAB) has proved to be the most efficient diagnostic tool.
Warnakulasuriya, 1998
Asia The efficacy of 1% toluidine blue (TB) in the identification of oral malignancies and potentially malignant oral lesions was evaluated among a group of Asian patients with undiagnosed oral lesions and conditions The study involved patients who had all been referred to, or had attended specialist centres with unconfirmed
102 patients Patients who had all been referred to, or had attended specialist centres with unconfirmed oral mucosal lesions. The consultant dental sugeon in each centre approved the appropriateness of each included case.
-- 86 clinically detected lesions, dye retained or not, were biopsied. Microscopy diagnosis and, where relevant, degree of dysplasia were recorded independently by two experienced histopathologists blinded to the dye results. When there was disagreement, concordance was reached following consultation. All the histopathologically confirmed malignancies (N=18) demonstrated stain
In view of the small size of the study, caution in required in generalising from the findings.

Suspected Cancer: Appendix J2 (June 2015) Page 214 of 264
Author Setting Description No. Inclusion Exclusion Results Gold Std
Quality
oral mucosal lesions. uptake and there were no false negatives, yielding a test sensitivity of 100% for the detection of invasive carcinoma. Eight of 39 oral epithelial dysplasias were toluidine blue-negative, giving a false negative rate of 20.5% and a sensitivity of 79.5% for oral epithelial dysplasias

Suspected Cancer: Appendix J2 (June 2015) Page 215 of 264
Table 13 HEAD AND NECK CANCER INCLUDING THYROID CANCER: diagnostic difficulties
Author Setting Description No. Inclusion Exclusion Results Quality
Canto et al, 2002
USA A qualitative descriptive study on physicians’ knowledge, opinions and practices about oral cancer examination was undertaken in Maryland. The methods used included one focus group with ten physicians, and nine one-to-one interviews
Primary selection criteria: 1) general physicians, family physicians or internists practicing in the Baltimore Metropolitan area or the Eastern shore Region, and 2) physicians who were serving a population with a racial/ ethnic mix. Secondary selection criteria: 1) physicians who were working at least 20 hours per week, and 2) diverse practice settings including private 9solo or group practice), hospital outpatient clinic, and managed care organisations.
Physicians were not surprised that they detected more lesions than dentists, although most did not provide oral examination on a routine basis. Patients were more likely to see physicians than dentists because US health insurance coverage did not include dental care. Also, physicians’ opinions indicated that patients were afraid of going to a dentist and only associated them with pain in their teeth or gums. Patients also consulted the doctor about the tongue or buccal mucosa. Patients consulted physicians for other medical problems that enabled them to raise additional issues such as a sore in their mouth or throat. There was a misconception that oral cancer was painless and asymptomatic, and that early lesions were small. Physicians needed more information about how to conduct a comprehensive oral cancer examination. Their knowledge about this examination was based on their variable medical training. It was related to whether or not physicians had completed an ENT or oncology rotation, or on their residency experience and the location where training was received.
Clovis et al, 2002
Canada Dentists in British Columbia and Nova Scotia were surveyed about their knowledge and opinions on oral and pharyngeal cancer
670 dentists A systematic random sample of licensed dentists selected from the registrars’ 1997 listing of licensees in British Columbia.
only 56.7% of dentists agreed that their knowledge of the subject was current. Most dentists correctly identified tobacco use (99.4%) and alcohol use (90.4%) as risk factors, but fewer correctly identified factors such as the use of spicy foods (57.0%) and poor oral hygiene (46.3%) as not being risk factors, a finding that was attributed to a high level of misinformation. Only 42.5% identified both erythroplakia and leukoplakia, in that order, as the conditions most likely to be associated with oral cancer. It was stressed that early detection and screening during routine examination was the single most critical intervention influencing survival. Fewer than half knew that familial clustering of cancer and poor-fitting dentures were not real risk factors. Only a small proportion knew that a family history of cancer was not in itself a risk factor for oral cancer. The procedure for complete examination of the tongue, the fact that early oral cancer is asymptomatic, and the appearance of early oral cancer lesions were correctly identified by large numbers of respondents. Just over half knew that most oral cancer was diagnosed at an advanced stage.
Greenwood, UK A prospective study 420 doctors Randomly selected dentists were more likely to have diagnosed cases of oral cancer The article did not provide

Suspected Cancer: Appendix J2 (June 2015) Page 216 of 264
Author Setting Description No. Inclusion Exclusion Results Quality
2001 in which a questionnaire was sent to primary care clinicians (half dentists and half doctors) to assess the knowledge of both groups in examining patients with oral cancer
general medical and dental practioners from family health service authority lists in and around Newcastle upon Tyne and on Teeside.
than general practitioners (OR=2.68, 95% CI 1.6, 4.4). Important differences arose between the groups in terms of risk factor knowledge and clinical examination techniques. One explanation was that general practitioners had received less training in oral pathology than dentists and therefore might be expected to have less knowledge of oral cancer and related issues. Dentists were more likely to list alcohol as a risk factor than general practitioners (OR+6.9, 95% CI3.9, 12.1). The proportion of dentists and doctors identifying smoking as a risk factor was 93.7% and 90.7% respectively. This difference was not significant (OR =1.5, 95% CI 0.6, 3.6). Dentists were significantly less likely to state they would examine all sites in the mouth than general practitioners (OR=0.5, 95% CI 0.3, 0.8). Dentists showed a preference for examining areas relating to the tooth bearing or potential denture bearing tissues, rather than for some of the more high risk sites, for example, the floor of the mouth. Dentists were more likely to identify various presentations of oral cancer and premalignant disease than general practitioners (OR+13.6 and 25.7 respectively).
details of how many cancer cases were successfully identified by dentists and general practitioners.
Kamal, 1999
Jordan A retrospective study was undertaken to highlight some of the presenting features of nasopharyngeal carcinoma as seen in a large hospital over a period of 20 years.
91 cases of nasophayngeal carcinoma
All relevant data available to the department of Pathology and Otolaryngology, as well as medical records at the Jordan university hospital.
Tumours were detected at an advanced stage with 34% having metastasised most frequently to bone. Data collected during the period revealed that nasopharyngeal carcinoma accounted for 1% of all malignant tumours with an age range from six to 89 years, and a mean of 39.5 years. A high incidence of childhood nasopharyngeal carcinoma was also noticed (two percent of all childhood malignant tumours). The tumours were frequently symptomless or initially evoked symptoms that were common to other minor clinical conditions, and consequently did not attract serious patient attention. Some of these silent tumours were overlooked on clinical examination in the early stages. Seventy patients (77%) presented with a single complaint and 21 (23%) presented with multiple complaints. The most common single presenting symptom was neck swelling (45.5%). In 37 patients (41%) carcinoma affected one site of the nasopharynx, most frequently a lateral wall. Thirty-five patients (38%) had multifocal malignant involvement of the nasopharynx. In 19 patients (21%) the nasopharynx appeared normal and no site of involvement could be seen at the time of first diagnosis. Difficulties in early diagnosis by general practitioners included the small size of tumours, near normal appearance of nasopharyngeal mucosa or the inherent presence of massive lymphoid tissue obscuring the underlying lesions.
The findings of this study should be treated with caution since it was undertaken in Jordan where the incidence of this cancer is relatively high and the patient population was different to England and Wales. Consequently, the significance of the findings of this study to general practice in England and Wales is uncertain.
Teppo, 2003
Finland

Suspected Cancer: Appendix J2 (June 2015) Page 217 of 264
Table 14 HEAD AND NECK CANCER INCLUDING THYROID CANCER: delay
Author Setting Description No. Inclusion Exclusion Results Quality
Alllison et al 1998
Review of diagnostic delays and prognosis of oral cancer
Focuses mainly on factors that affect the diagnostic process, and the consequences that diagnostic delay has on the prognosis of oral cancer patients.
Narrative review that notes lack of evidence
Allison et al, 1998b
Canada, Secondary care
The aim of the study was to investigate the relationship between patient and professional diagnostic delays, and patient prognosis in a group of upper aerodigestive tract cancer patients. Patients were interviewed and data elicited on socio-economic and demographic variables, information concerning the cancer development and symptomatology, health care professionals consulted and the period of time taken for each stage in the diagnostic process.
188 patients Patients diagnosed with squamous cell carcinoma of oral cavity sites, oro-, naso- and hypopharynx, and larynx.
Not explicitly mentioned 77% of the sample presented initially to a family physician and 16.5% consulted a dentist. Patients under the age of 65 years have a significantly increased risk of being diagnosed with late stage disease when compared with those 65 years and older (OR=1.91, 95% CI= 1.07-3.41). Gender and education were not associated with disease stage. The risk of late stage disease appears to be increased among those who live alone, although the significance of this is marginal (OR=1.97, 95% CI= 0.93-4.17). The general health status indicators of comorbidity and dental status at the time of diagnosis were not associated with disease stage. Those subjects who had a mucosal lesion or voice change as their presenting symptom had a significantly reduced risk of being diagnosed with late stage disease when compared with those subjects presenting with a swelling. Subjects with a pharyngeal cancer had odds of being diagnosed with late stage disease eight times those of subjects with oral cancer. No association was found between increased
Multivariate analysis. Questionnaire was validated by randomising a subset, and checking their responses against primary physician or dentist and hospital charts. No particular pattern for laryngeal cancers was found throughout the analysis, probably as a result of categorising all laryngeal cancers together (instead of categorising them as supraglottic, glottic and subglottic cancers). Small sample.Delay data is largely dependent upon subject recall, although the authors’ random validity check for professional delay demonstrated 100% accuracy. However, misclassification of the patient delay information may have led to a decreased statistical association between this variable and late stage.
Good overall quality. Retrospective observational study. Grade III.

Suspected Cancer: Appendix J2 (June 2015) Page 218 of 264
patient delay and risk of late stage disease. However, there was a pattern of increased odds for late stage disease with increased professional delay, with these odds being three times greater among those subjects delayed more than 3 months compared to those with less than 1 month’s professional delay. (p for trend 0.03). Those subjects who first consulted a dentist, rather than a family physician, had a reduced risk of late stage disease of borderline significance. Stepwise multiple logistic regression demonstrated that: (i) pharyngeal cancers have nine times the odds of oral or laryngeal cancers for late stage disease; (ii) professional delay > 1 month has approximately twice the odds for late stage of professional delay < 1 month; (iii) older patients (>65 years) have approximately half the odds for late stage cancer of those < 65 years). The type of primary health care professional first consulted no longer remained a significant predictor of disease stage in the multiple regression analysis.

Suspected Cancer: Appendix J2 (June 2015) Page 219 of 264
Cooke BED and Tapper- Jones L, 1977
UK, Secondary Care
The study is an attempt to analyse the factors underlying delay between the patient’s first symptom and the institution of treatment. The authors examined the case histories of patients attending a teaching hospital to ascertain information on factors underlying delay in diagnosis (patient and professional delay).
50 patients (all with squamous cell carcinoma). 84% of the patients were 60 years of age and above.
Patients suffering from oral cancer
Patients whose case studies failed to reveal detailed information prior to their diagnosis of oral cancer
The most common reason given by the patient for failing to see early advice was that the lesion did not hurt. The major presenting symptom was ulceration (60%) and only 10 per cent of patients experienced pain. 50% of patients were referred from general medical practitioners and 30% from general dental practitioners. There was only a degree of urgency in the referral letter or card for these patients from 56% of the GPs and 53% from the general dental practitioners. The delay in patients being referred to hospital for confirmation of diagnosis is mainly caused by a low degree of suspicion, it appeared as if the general medical practitioner did this more often than the general dental practitioner.
Small size study, mainly descriptive without analysis of causation. No enough socio-demographic variables were included in the study. Inclusion bias likely, doubts remain on quality of information extracted from case histories. Old study, dynamics of society and communications/transport greatly transformed since.
Retrospective observational study. Grade III.
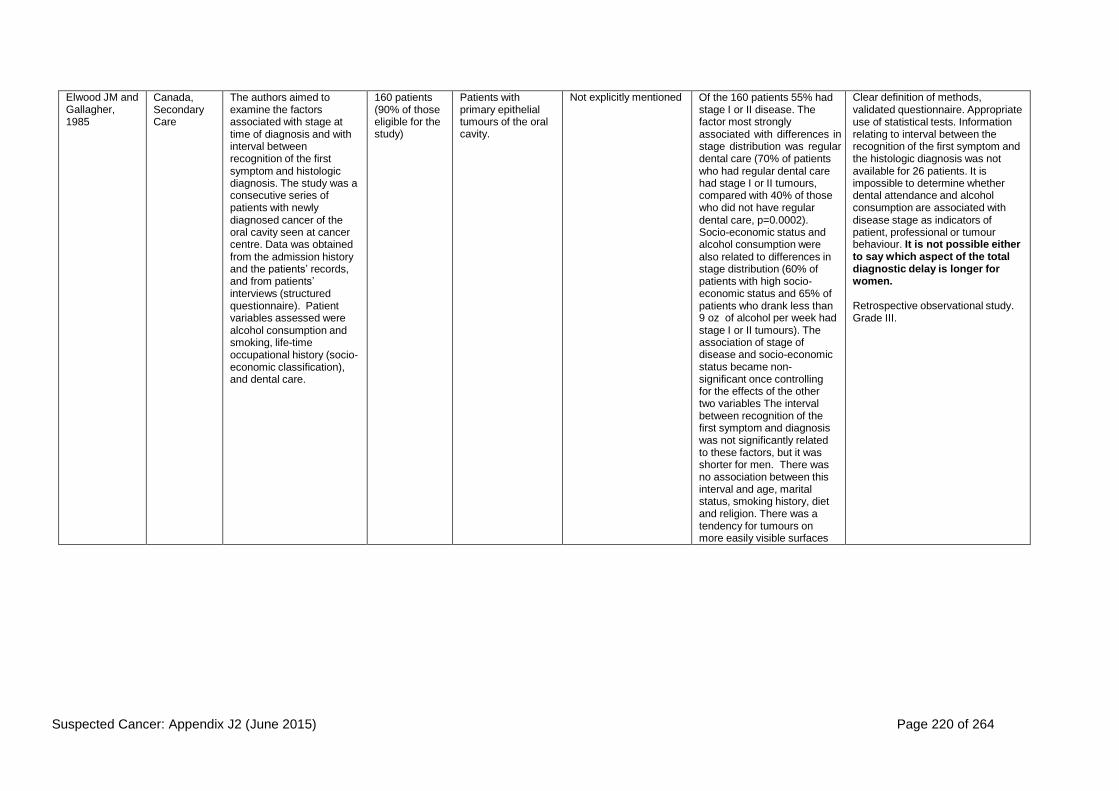
Suspected Cancer: Appendix J2 (June 2015) Page 220 of 264
Elwood JM and Gallagher, 1985
Canada, Secondary Care
The authors aimed to examine the factors associated with stage at time of diagnosis and with interval between recognition of the first symptom and histologic diagnosis. The study was a consecutive series of patients with newly diagnosed cancer of the oral cavity seen at cancer centre. Data was obtained from the admission history and the patients’ records, and from patients’ interviews (structured questionnaire). Patient variables assessed were alcohol consumption and smoking, life-time occupational history (socio- economic classification), and dental care.
160 patients (90% of those eligible for the study)
Patients with primary epithelial tumours of the oral cavity.
Not explicitly mentioned Of the 160 patients 55% had stage I or II disease. The factor most strongly associated with differences in stage distribution was regular dental care (70% of patients who had regular dental care had stage I or II tumours, compared with 40% of those who did not have regular dental care, p=0.0002). Socio-economic status and alcohol consumption were also related to differences in stage distribution (60% of patients with high socio- economic status and 65% of patients who drank less than 9 oz of alcohol per week had stage I or II tumours). The association of stage of disease and socio-economic status became non- significant once controlling for the effects of the other two variables The interval between recognition of the first symptom and diagnosis was not significantly related to these factors, but it was shorter for men. There was no association between this interval and age, marital status, smoking history, diet and religion. There was a tendency for tumours on more easily visible surfaces
Clear definition of methods, validated questionnaire. Appropriate use of statistical tests. Information relating to interval between the recognition of the first symptom and the histologic diagnosis was not available for 26 patients. It is impossible to determine whether dental attendance and alcohol consumption are associated with disease stage as indicators of patient, professional or tumour behaviour. It is not possible either to say which aspect of the total diagnostic delay is longer for women.
Retrospective observational study. Grade III.

Suspected Cancer: Appendix J2 (June 2015) Page 221 of 264
to be diagnosed earlier. The interval between recognition of the first symptom and histologic diagnosis did not differ significantly with the site of the tumour. These relations were specific to the patients with cancer of the oral cavity, not being seen in those with other head and neck tumours.
Guggenheimer J et al, 1989
Unclear (presumably USA, Secondary care)
The study was undertaken to identify possible bases for patient and/or professional delays and to determine whether or not these delays were related to tumour stage at diagnosis. In addition, the authors also assessed the relationship between delay and several other variables. Delay was compared against age, gender, education, alcohol consumption, and tumour T stage at the time of diagnosis. A personal interview questionnaire was administered by three of the investigators.
149 patients (out of 151 eligible)
Patients with oral and oropharyngeal squamous cell carcinoma.
Not explicitly mentioned Delay by doctors occurred in 30% of cases. Neither short nor long delays had a statistically significant relationship to tumour T stage at time of diagnosis. The length of patient delay was also not related to age, gender, amount of education, or history of alcohol consumption. Physician delays were most often associated with base of tongue and tonsil primaries. Tongue and floor of mouth tumours accounted for the major share of dentist’s misdiagnoses.
Patient delay was determined by the patients recollection of the approximate dates of events. Appropriate use of statistical tests. Setting of study is not described by the authors, questionnaire is not available for inspection either. Methods not described clearly enough, including eligibility criteria
Retrospective observational study. Grade III.
Jones TM et al, 2002
UK, Secondary care
The authors undertook an audit of the management of patients with suspected head and neck malignancy, referred by GPs to an ENT hospital department. Their aim was to compare the authors’ local services with the nationally stipulated targets, and to identify any specific problem areas during the diagnosis and treatment of head and neck cancer patients. Data were recorded from case-notes and hospital and GP records.
75 consecutive patients attending for post-treatment follow-up
Patients with a solid head and neck malignancy
Not explicitly mentioned Thirty-seven patients presented with hoarseness, 15 with a neck lump, 14 with pain, three with haemoptysis and two with a visible ulcerative lesion. The longest delay was due to late presentation of the patient (mean waiting time = 4.9 months, range = 1-20), and late referral by the GP (mean waiting time = 5.1 weeks, range = 2-12).
Retrospective observational study. Poor description of methods and data analysis, small sample for quantitative analysis. Insufficient demographic data to address question, purely descriptive analysis of delays in diagnosis without analysis of causality. Poor presentation results. Very likely inclusion bias.
Poor quality study. Grade IIIC evidence.
Kantola S et al, Finland, The study aim was to 75 patients Patients with a new Patients with a At the initial visit, the tongue Definition of measurable outcomes,

Suspected Cancer: Appendix J2 (June 2015) Page 222 of 264
2001 Primary Care
investigate the detection of tongue cancer in primary care and to examine the consultation prevalence of oral symptoms in primary care. The authors identified all patients who lived in an area and who had been diagnosed for tongue cancer from population databases. They then recorded detailed data on the first medical visit from the patient medical files (primary health centres, private medical or dental practitioners), and finally collected data on demographic and clinical variables from the cancer centre.
(78%) with a diagnosis of tongue cancer (out of 108 initially eligible)
diagnosis of tongue cancer detected in the period 1974- 1994.
premalignant oral lesion that underwent a cancerous change during the hospital follow up (10), cases discovered incidentally at the tertiary centre (2), and patients whose primary care patient files were missing (21)
cancer patient was correctly referred for further examinations in 49 (65%) cases. In 12 (16%) of cases the patient was not referred but was scheduled for a follow-up visit, and was neither referred nor followed up in 14 (19%). When compared with the referred patients the median professional delay was somewhat longer for the unreferred but increased dramatically if no follow up was arranged (0.6 months, range=0.1-2.4; versus 1.2, range=0.3-2; versus 5.2, range=0.7-18.2; p<0.001). Adjusted relative hazards of death were significantly increased for those non- referred followed up patients (1.4), and the non- referred/non-followed up patients (6.3). The high-risk patients included those who sought an early professional evaluation, those who made the appointment for a completely different reason and only mentioned the symptom suggestive of cancer incidentally,those that had a small ulcerative lesion, those with an inability to live alone at home, rural domicile, and blue-collar workers (low occupational status, P=0.009). There were no statistically significant differences in the ability to refer cancer patients correctly between physicians and dentists. The referred patients tended to have exophytic tumours located on the marginal edge of the tongue, which are more
multivariate analyses. Sample small with limited statistical power. Generalisability may be limited because of patients having been drawn from a relatively small geographical area. Information on the initial visit was not available for all patients, which gives rise to the possibility of small selection bias. Only cancer cases were recorded (no information available on overdiagnoses or false positive rates)
Retrospective sample, observational study, good overall quality. Grade III.

Suspected Cancer: Appendix J2 (June 2015) Page 223 of 264
readily visible (p=0.02). The lesions suspected to be cancer tended to be palpated more often than the unsuspected ones (p=0.04).
Kerdpon D and Sriplung H, 2001
Thailand, Secondary Care
The purpose of the study was to identify the factors related to the patient and professional delay in diagnosis of oral squamous cell carcinoma in southern Thailand. The authors interviewed all participants using a structured questionnaire. Interview questions covered demographic variables (age at diagnosis, area of residence, occupation, marital status and religion) amongst other factors underlying patient and professional delay. Demographic variables were confirmed with the hospital record before filling in the questionnaire.
161 patients Patients with squamous cell carcinoma of the lip and oral cavity sites (with histopathological confirmation)
Not explicitly mentioned.
Patient delay mean was 90.6 days, professional delay 51.2 days and total delay 141.8 days. About half of the patients who sought professional consultation had proper management by biopsy or were referred to a higher level hospital. 82.6% of patients sought consultation from doctors, 15.5% from dentists and 1.9% from community health workers. Out of all the variables examined (sex, age, marital status, tumour size, lymph node metastasis, TNM stage, religion, area of residence, occupation, initial sign or symptom, site of lesion, type of health care professional, treatment- seeking before professional consultation, traditional herbal medication received before professional consultation and habit of smoking, alcohol drinking and betel quid chewing) only traditional herbal medication was a significant predictor for patient delay. Those who received traditional herbal medication before health care professional consultation had a longer patient delay (HR 0.46, 95% CI 0.28-0.76). There was no significant association between any of the variables investigated and professional delay. Total delay was significantly influenced by religion and traditional herb medication. Buddhists had less total delay than Muslims (HR 0.68, 95% CI 0.49-0.95). Patients who used traditional herb medication had a longer total delay.
Non-validated questionnaire. Multivariate analyses. Positive findings cannot be extrapolated to western countries population because of different cultural beliefs and different health care systems. Extrapolation of negative findings requires caution for same reason. Small sample. More investigation is needed to identify the factors associated with a longer delay in Muslims.
Retrospective observational study. Grade III.

Suspected Cancer: Appendix J2 (June 2015) Page 224 of 264
Kowalski LP et al, 1994
Brazil, Secondary Care
The study analyses the importance of various pre- treatment factors such as demographic and socio- economic factors and lateness of case referrals. Prior to any medical treatment patients were submitted to a structured questionnaire-based, standardised interview. Variables included were socio-economic and demographic, history of tobacco smoking and alcoholic beverage consumption.
336 patients Patients with newly diagnosed carcinomas of the oral cavity and oropharynx.
Lesions that could not be accessible to self- examination (not on the lip, other parts of the oral cavity, tonsillar fossa and posterior wall of the oropharynx). Also patients with malignant neoplasms of minor salivary glands, related structures such as bone and soft parts or cases of base of the tongue and vallecula. Patients who had difficulty in communication due to pain or speech problems.
There was no delay on the referral to a head and neck service of 59 patients (17.6%). The patient was only responsible for the delay in reaching a head and neck service in 196 cases (58.3%). A medical doctor delayed the referral for a median of 12.3 months in 19 cases (5.7%), a dentist for 6.5 months in 11 cases (3.3%), a pharmacist or drug store clerk for 3.5 months in 13 cases (3.9%). In 38 cases (11.3%) there was a delay for 8.5 months because patients were seen by more than one health professional. Duration of symptoms and patient and professional delays were not associated with the risk of advanced disease in unifactorial analysis. The risk of having advanced disease was moderately lower in females (RR=0.45, 95% CI=0.24-0.86), marginally lower in older patients (RR=0.54, 95% CI=0.27- 1.08), and not dependent upon family income and educational levels. Alcoholism was not associated with the stage of disease at diagnosis. A significant reduction in risk for advanced stage was seen when a painful ulcer as the first symptom (RR=0.24, 95% CI=0.13-0.45). A substantial increase in risk was observed in cases with odynophagia and/or dysphagia (RR=4.52, 95% CI=1.99-10.26). Tumours on less visible surfaces or oral
Prospective study. Multivariate analyses. Clear definition of methods and measurable outcomes. The absence of correlation between income and educational levels is probably because the study includes few patients of high income and educational levels and the effects of these variables could not be fully appreciated.
Grade III.

Suspected Cancer: Appendix J2 (June 2015) Page 225 of 264
cavity or oropharynx tended to be advanced at time of diagnosis.
Pitiphat et al, 2002
Greece, Secondary Care
The authors attempted to evaluate factors associated with delay in the diagnosis of oral cancer by interviewing patients attending three teaching hospital-based clinics (structured, pre-tested questionnaire). Risk factor data included demographic and socio-economic characteristics, information on tobacco use, alcohol drinking, family history of cancer, intra-oral status, and weight change. Tumour size and TNM stage at time of diagnosis were also assessed. The authors recorded the time interval from the self- reported date when oral cancer signs and/or symptoms were first noted to the date of definite diagnosis
105 respondents
Patients aged 26 to 91 years, with no prior history of oral cancer, who were diagnosed with histopatholog. confirmed squamous cell oral or pharyngeal cancer
Not explicitly mentioned The time from initial diagnosis to definitive diagnosis ranged between 0 and 780 days, with a median of 30 days. Fifty-five patients exhibited a delay of 21 days or more (52.4%). Length of delay was significantly longer among single patients, non- smokers, or those with stage IV tumours. There was no significant association between age and diagnostic delay. The authors found no association between gender and delay in diagnosis. Surrogate measures for socio-economic status, such as education level and unemployment, were found not to affect the timing to diagnosis. Findings suggest a strong association between history of sexually transmitted disease and delay in diagnosis. There was no significant association between delay in diagnosis and alcohol use.
Case-control study. Clear definition of methods and measurable outcomes. Univariate and multivariate analyses. No distinction between the different types of delay (patient or professional delay), difficulty on inferring the true causes of observed delays as a result. Residual confounding for socio- economic status cannot be ruled out. Residual confounding and limited statistical power may have also influenced association of delay with history of sexually transmitted disease. Assessment of the time to diagnosis depended on patients’ recollection of their first symptoms (limitation). Reflective discussion with good overview of findings from other published papers.
Good overall quality. Grade III.

Suspected Cancer: Appendix J2 (June 2015) Page 226 of 264
Shira RB, 1976 Denmark, Secondary Care
The purpose of the study was to outline the two time factors (patient and professional delay) that intervene in reaching a diagnosis of oral cavity malignancy. The authors surveyed 34 patients who had been referred to a Department of Oral Surgery, additional information was extracted from the patients’ hospital records. Parameters evaluated in the study were: sex, age, referral from physician or dentist, symptoms, referral diagnosis, time lapse from first symptoms until consultation with physician or dentist, time lapse from the first consultation with physician or dentist to referral and final diagnosis, previous treatment, localisation, bone involvement, final treatment, control period, survival period.
34 patients (20 patients had squamous cell carcinomas)
Patients suffering from malignant tumours of the oral cavity
Not explicitly mentioned The tumours occurred more often in men than in women, and most often in the group aged 50 to 70 years. Twenty- four patients consulted a physician or dentist within 3 months after the appearance of the first three symptoms. The average period from the time that the patient first observed the symptoms until he consulted a physician or dentist was 4.9 months. Twenty of 32 patients were referred within 3 months, the average period for all patients was 5.6 months.
Small sample. As with previous studies, patients’ own recollection of time elapsed between first symptoms until contacting a physician or dentist may lead to underestimates. A purely descriptive analysis that does not examine causal relationship between delay in diagnosis and patient or health professional characteristics.
Retrospective observational study. Grade III.

Suspected Cancer: Appendix J2 (June 2015) Page 227 of 264
Wildt J et al, 1995
Denmark, Secondary care
The purpose of the study was, firstly, to assess and describe the importance of the different elements of the delay. Secondly, to investigate the possible correlation between the delay and some tumour and patient factors, and thirdly, to examine whether the delay can be used as an independent prognostic factor. The authors examined patient delay, professional delay, and total delay.
167 patients with an oral squamous cell carcinoma. Ratio of men to women was 1.5:1 and the median age was 66 years.
All patients with an oral squamous carcinoma seen at a hospital clinic between 1 January 1986 and 1 November 1990
Not explicitly mentioned The patient’s choice of primary medical contact was a GP in 45% of cases, ENT specialist (14%), dentist (35%) and others (7%). The median total delay was 4 months, of which 71 days was patient delay. Tumour size correlated significantly with the professional delay but not with the patient delay, the proportion of patients with a professional delay above the median value (45 days) increased with decreasing tumour size. Tumour site, STAGE grouping and histological score did not correlate significantly with either patient delay or professional delay. The patient delay did not correlate significantly with any of the patient-related factors. In contrast, the professional delay was significantly correlated with sex as women had a longer professional delay than men (r=0.26). It also correlated with age, as the oldest age groups had the longest professional delay (r=o.19). The professional delay was not significantly related to the type of professional advice sought, be it GP, ENT specialist or dentist.
The only two patient socio- demographic factors were age and sex. Relies on patients’ account to estimate patient delay, data must be interpreted cautiously. Professional delay correlates were the products of series of univariate analyses and, although the correlations were statistically significant, they were weak. The use of Spearman’s rank correlation test with a nominal variable such as gender is inappropriate.
Prospective observational study. Grade III.

Suspected Cancer: Appendix J2 (June 2015) Page 228 of 264
Table 15 BRAIN AND CNS CANCER: signs and symptoms, including risk factors
Author Setting Description No. Inclusion Exclusion Results Gold Std Quality
Ambulatory Sentinel Practice Network, 1987
USA and Canada
The clinical characteristics of patients making consecutive visits for headache and the therapeutic strategies employed by the doctors in primary care practices were investigated. . Data were recorded between November 1982 and December 1983 about each consultation at which headache was discussed, investigated or treated.
3847 patients
38 primary care practices.
Tension headaches and vascular heachaches were the most frequent diagnoses (30.4% and 23.8% respectively). (31.6%) of visits were for headaches associated with a variety of other causes such as sinusitis, influenza, trauma and mass lesions. (47.2%) were for headaches which were new or changed in character. (13.7%) were for headaches associated with febrile illnesses. Vascular headache was more likely to be diagnosed in patients who had unilateral symptoms, or if nausea or aura accompanied their headaches than in patients with none of these symptoms. Of 690 patients who made a second visit only 56.4% presented with the same combination of symptoms on both occasions. (27.0%) of the 37 patients with all three migraine like symptoms at the first visit who made a second visit, and 30.4% of the 92 patients who initially presented with two migraine like symptoms, had none of these symptoms when they returned. Headache intensity changed for 42.9% of the 690 patients making a second visit. Changes in diagnosis accompanied these symptom changes.
Investigation of headache was limited to history and physical examination. Only a small minority of headache patients underwent an x-ray examination (4.5%), electroencephalogram (1.1%) or computerised tomographic scan (3.0%). The rate of computerised tomographic scanning was greater at second and third visits than first visits (3.8% and 4.5% vs. 2.2%). Referral to consultants and hospitalisation were also infrequent. Nearly three quarters of patients (71.0%) had no investigations at any visit and were never referred to consultants or hospitalised. Only 35.9% of patients were advised to make a return visit; half of these did so.
Becker et al, 1988
US and Canada
The study aimed to examine the clinical characteristics of new headaches and document the diagnostic and management strategies employed by primary care clinicians.
120 primary care physicians in 38 practices. The final study group consisted of 1,331 patients
A total of 332,818 office visits were recorded during the period, of which 0.4% were fist visits for new headaches. At first visit, most patients (76.6%) were managed without diagnostic tests. Drugs were prescribed for 73.6%, and advice was given for 58.6%. Only 2.0% of patients had computerised tomographic scanning ordered at first visit. Of persons with a new headache presenting at first visit, 23.8% were diagnosed as having tension and

Suspected Cancer: Appendix J2 (June 2015) Page 229 of 264
Author Setting Description No. Inclusion Exclusion Results Gold Std Quality
12.8% as having vascular headaches. Nearly one half (47.8%) were classified as having headaches other than tension or vascular. A total of 15.3% were undiagnosed. Patients with vascular headaches were more likely than those diagnosed as having tension headaches to report occurrence of aura (24.7% vs. 1.3%), nausea or vomiting (46.5% vs. 18.9%) and unilateral focus (50.0% vs. 13.2%). These differences were significant (p<.05). Headache severity was related to the ordering of CT scan (P<.001) and x-ray examinations (P<.007) at first visit. X-ray examinations were ordered most frequently for patients with other or undiagnosed-mixed headaches (P<.006); CT scan and blood tests were also used mostly (P<.0001) for patients with undiagnosed-mixed headaches. Patients with disabling headaches at first visit were more likely to be hospitalised (P<.001); referral was not related to headache intensity. Patients were 2.05 times as likely to be referred at the second visit than the first (P<.05), and the percentage of those hospitalised similarly increased (2.0%). Primary care clinicians in this study were two thirds as likely to order an x- ray examination as were physicians. Expensive tests were seldom ordered at first or subsequent visits, even when headaches were classified as severe or disabling.

Suspected Cancer: Appendix J2 (June 2015) Page 230 of 264
Christiaans et al, 2002
A prospective study to assess the diagnostic value of neurologic evaluation in cancer patients with new or changed headache in identifying intracranial metastases. All patients referred by their general practioners and specialist to a department of
68 patients. The mean age of the patients was 57 years (range 24-88 years; standard
deviation ± 13.3 years). Breast carcinoma was the primary tumour in 32 patients (47.1%) and lung carcinoma was the primary tumour in 12 patients (17.6%). MRI scans demonstrated intracranial metastases in 22 patients (32.4%). An association was found between
MRI of the brain within 1 week of the neurologic examination.

Suspected Cancer: Appendix J2 (June 2015) Page 231 of 264
Author Setting Description No. Inclusion Exclusion Results Gold Std Quality
neurology underwent a structured history and neurologic examination.
intracranial metastases and seven variables: interval between headache onset and neurologic consultation of
≤10 weeks (odds ratio [OR] of 11.2; 95% confidence interval [95% CI], 1.4-91.1), emesis (OR of 4.93; 95% CI, 1.6-15), pain not of tension type (OR of 5.7; 95% CI, 1.8-17.7), Mini-
mental state examination score of ≤
23 (OR of 11.0; 95% CI, 1.1-105.9), apathy (OR of 10.0; 95% CI, 1.0- 95.7), coordination disturbance (OR of 3.43; 95% CI, 1.1-4.3), and Babinski sign (OR of 6.47; 95% CI, 1.1-36.6). In multiple regression, three variables were found to be significant independent predictors:
headache duration of ≤10 weeks (OR of 11.0; 95% CI, 1.1-108.2), pain not of tension type (OR of 6.7; 95% CI, 1.8-25.1), and emesis (OR of 4.0; 95% CI, 1.1-14.3). When at least one of the three predictors were present, all patients with intracranial metastases could be identified. If this rule had been applied, 12 MRI scans (26%) could have been omitted in patients without intracranial metastases. As a single predictor, emesis predicted one of the 22 cases of metastases (5%) and there were no negative MRI findings. As a single
predictor, a headache duration of ≤10 weeks predicted four of the 22 positive MRI scans (18%) (with metastases) and 19 of 46 negative MRI scans (41%). The combined presence of the predictors of emesis
and headache of a duration ≤10 weeks predicted five of the 22 positive MRI scans (23%) and seven of 46 negative MRI scans (15%). The combined presence of pain not of tension type and a headache duration
of ≤10 weeks predicted 6 of the 22 cases of metastases (27%) and three of 46 negative MRI scans (7%). The combined presence of emesis and

Suspected Cancer: Appendix J2 (June 2015) Page 232 of 264
Author Setting Description No. Inclusion Exclusion Results Gold Std Quality
pain not of tension type predicted none of the 22 positive MRI scans and one of 46 negative MRI scans and one of 46 negative MRI scans (2%).
Counsell and Grant 1998
The incidence of intracranial tumours was investigated in a review of studies identified in a search from Medline (1966-1995).
20 studies The studies included over 20,000 primary tumours. Higher incidences of primary tumours were found in studies that: used many methods to identify cases (OR 1.92); included a higher percentage of asymptomatic patients (OR 2.03); and did not require histologic confirmation of the diagnosis (OR 1.69). Studies from the 1980s onwards reported higher incidences than in previous decades (OR 1.51), a finding assumed to be due to improved methodology of diagnosis.
DoH, Referral Guidelines for Suspected Cancer, 2000
Hoffman et al, 1999
A structured literature review was undertaken of studies identified from Medline searches (1966- 1996) on the aetiology, prognosis and diagnostic evaluation of dizziness.
Studies that presented original data on at least ten dizzy or vertiginous patients 18 years of age or older with diagnostic test results comparable with a gold standard or applied to a control group
The most common aetiologies for dizziness were peripheral vestibulopathies (35% to 55% of patients) and psychiatric disorders (10% to 25% of patients). Cerebrovascular disease (5%) and brain tumours (<1%) were infrequent. The history and physical examination were stated as leading to a diagnosis in about 75% of patients. The most common central nervous system cause of dizziness in primary care patients was cerebrovascular ischemia or infarction (median 5%, range 2% to 10%); tumours were found in <1% of dizzy patients. Tumour rates were higher (2% to 3%) in older patients referred to neurologists. Acoustic neuromas typically presented with gradual hearing loss. Nonetheless, investigators have reported normal hearing in 7% of patients with

Suspected Cancer: Appendix J2 (June 2015) Page 233 of 264
Author Setting Description No. Inclusion Exclusion Results Gold Std Quality
acoustic neuromas smaller than 1cm in diameter. For acoustic neuromas between 1cm and 3cm, normal hearing was found in 3%; no patients with tumours greater than 3cm had normal hearing.
Kroenke, 2000
A Medline search between 1966 and 1996 identified studies of the presentation of dizziness in consecutive patients
12 studies Dizziness was attributed to peripheral vestibulopathy in 44% of patients, a central vestibulopathy in 11%, psychiatric causes in 16%, other conditions in 26%, and an unknown cause in 13%. Certain serious causes were relatively uncommon including cerebrovascular disease (6%), cardiac arrhythmia (1.5%), and a brain tumour (<1%). Dizziness was ascribed to vestibular or psychiatric problems in more than 70% of cases. Brain tumour was detected in 32 patients (0.7% of the 4,536 patients assessed). Seven studies reported one or more cases whereas five studies reported no tumours. Other central vestibular explanations were reported in 57 patients (1.2%), including 18 patients with abnormal examination findings (vertical nystagmus, abnormal brain stem evoked potentials) without a specific diagnosis, 17 with cerebellar atrophy, seven with migraine, six with multiple sclerosis, three with epilepsy, and six with other diagnoses.
Since only two studies were primary care based, it was difficult to draw precise conclusions about the frequency of various causes of dizziness in unselected patients in the primary care setting.
Office of National Statistics, 2001
The majority of malignant brain tumours are gliomas, including astrocytoma, oligodendroglioma, and ependymoma. The other most common histological types, meningiomas and neuromas, are predominantly benign. The disease was more common in males than females. The male:female ratio in the age standardised rates were in the region of 1.5:1. There is a bimodal age distribution in tumours of the brain with a small peak in children under 10 and a much larger peak in adults at ages 55 to 80. Most tumours are gliomas (85%): 30% (of all brain

Suspected Cancer: Appendix J2 (June 2015) Page 234 of 264
Author Setting Description No. Inclusion Exclusion Results Gold Std Quality
cancer cases) are astrocytomas, 22% glioblastomas, 3% oligodendroblastomas, and 30% other or unspecified gliomas; the remainder were of poor histological specification. The incidence of brain tumours is 25%-30% higher in affluent groups compared to the most deprived groups, but no consistent regional variation was reported, although the incidence and mortality rates are higher in developed countries. Survival from brain cancer was poor. One year relative survival rates were approximately 30% in men and women diagnosed in 1991-93, and five year survival was in the region of 13%. Survival fell rapidly with age. Five year relative survival was above 40% for men and women aged 15-39, but fell to 20% in men and 23% in women aged 40-49. Survival was 3% or less in adults aged 60 or over at diagnosis. Regional variation in survival was not marked. One year survival was 4% points higher in the most affluent group diagnosed in 1986-90 compared with the most deprived group, but there was no difference across the deprivation categories in five year survival.

Suspected Cancer: Appendix J2 (June 2015) Page 235 of 264
Table 16 BRAIN AND CNS CANCER: investigations
Author Setting Description No. Inclusion Exclusion Results Gold Std Quality
Becker et al Part 1 1993
US and Canada
A study to investigate the reasons for clinicians in primary care ordering CT scans and the results obtained.
58 practices
349 CT scans were ordered.
Most scans were ordered because the clinician believed that a tumour (49%) or a subarachnoid haemorrhage (9%) might be present. 59 were ordered because of patient expectation or medicolegal concerns. Of the 293 reports reviewed, 14 indicated a tumour, a subarachnoid haemorrhage, or a subdural haematoma. Two of the 14 (14%) were false positives. 44 (15%) of the reports noted incidental findings of questionable significance. It was concluded that because there are no clear guidelines for the use of CT for the investigation of headache, physicians must exercise good clinical judgement in their attempts to identify treatable disease in a cost-effective manner.
Becker et al Part 2 1993
This study was undertaken to determine the incidence and presenting signs and symptoms of intracranial tumour, subarachnoid haemorrhage, and subdural haematoma in primary care settings, and to determine whether a more aggressive investigative strategy for patients with headache is justifiable. Weekly return cards and a chart audit were used to collect data over a 19 month period on every patient who had a new diagnosis of intracranial tumour, subarachnoid haemorrhage, or subdural haematoma
25 new tumours, 17 subarachnoid haemorrhages, and eight subdural haematomas were reported in 58 practices (a rate of 12/100,000 patients per year). Only half of these patients had headaches, and no abnormalities were found on neurological examination of many. Diagnosis was delayed in only four patients with headache caused by a brain tumour and in three patients with subarachnoid haemorrhages. Diagnosis was delayed in two of the latter because of false negative CT scans.
Consensus Conference 1982
At the National Institutes of Health (NIH), the Consensus Development Conference brings together investigators in the biomedical sciences, clinical investigators, practising physicians, and consumer and special-interest groups to make a scientific assessment of technologies, including drugs, devices, and procedures, and to seek agreement on their safety and effectiveness
It was concluded that CT should not be employed as a routine screening procedure when a low diagnostic yield is anticipated. In general, patients with headache should be considered for CT scanning only if the symptom is severe, constant, unusual, or associated with abnormal neurological signs. In infants and children, CT is useful as a primary diagnostic tool in the evaluation of intracranial haemorrhage and mass lesions. CT is not necessary in evaluating conditions of the majority of children with headaches because the occurrence of a surgically treatable lesion is extremely low. The clinical situation must, in each case, be considered individually.
Larson et al 1980
A careful history and physical and neurological examinations were adequate screens to detect intracranial mass lesions or systematic disease associated
161 patients
In patients with normal findings from neurological examination, no clinically important abnormalities were detected by CT, skull X-ray, angiography, or nuclide brain scan. The cost of finding a case of
A careful history and physical and neurological examinations were adequate screens to

Suspected Cancer: Appendix J2 (June 2015) Page 236 of 264
Author Setting Description No. Inclusion Exclusion Results Gold Std Quality
with headache brain tumour was estimated to be at least $1,265 for patients with abnormalities on neurological examination and $11,901 for patients with normal findings on neurological examination. Neurodiagnostic evaluation of headache patients with normal findings from neurological examination is expensive and was clinically unrewarding in this series.
detect intracranial mass lesions or systematic disease associated with headache

Suspected Cancer: Appendix J2 (June 2015) Page 237 of 264
Table 17 BRAIN AND CNS CANCER: delay and diagnostic difficulties
Author Setting Description No. Inclusion Exclusion Results Quality
Becker et al 1993
USA and Canada
The presenting signs and symptoms of intracranial disorders in primary care settings in the US and Canada were reported in this study to determine whether a more aggressive investigative strategy for patients with headache was justifiable. It aimed to study the signs and symptoms with which patients presented to primary care physicians and to estimate the extent to which a more aggressive investigation strategy for patients with headaches would have led to earlier diagnosis. Weekly return cards and a chart audit were used to collect data over 19 months on every patient who had a new diagnosis of intracranial tumour, subarachnoid haemorrhage, or subdural haematoma. Information was obtained concerning the severity and symptom characteristics of the headache, presence or absence of papilloedema, abnormalities on neurological examination, and presence or absence of other symptoms that could indicate the presence of intracranial problems (such as seizures, loss of consciousness, changes in strength, sensation, or neurological function, changes in headache pattern or severity that awakened the patient from sleep.
58 practices
A total of 25 new intracranial tumours, 17 new cases of subarachnoid haemorrhages, and 8 newly diagnosed subdural haematomas were reported during the recording period. Only 26 of the 50 patients with a subarachnoid haemorrhage, subdural haematoma, or tumour in this study reported a headache. Only one half of these patients had headaches, and no abnormalities were found on neurological examination of many. Many of the patients with headache had no abnormalities noted on neurological or fundoscopic examination. This was the case for nine (75%) of the patients with headache and intracranial neoplasms, five (45%) of those with a subarachnoid haemorrhage, and two of the three patients with an subdural haematoma. An additional three patients with tumours and three with subarachnoid haemorrhages had symptoms such as new seizures, or changes in function suggesting a neurological problem prior to their diagnosis. Three patients (one with a primary malignancy and two with benign tumours) had a change in headache pattern as their only ominous symptom.
This study based in primary care practices, did not identify a large number of patients for whom a clinically significant delay in diagnosis occurred. Instead, it revealed a highly selective clinical approach that correctly identified over 70% of the patients with headaches due to subarachnoid haemorrhage, tumour, or subdural haematoma.
Husband 1998
UK Study of the delay in presentation, diagnosis and treatment of malignant spinal cord compression
301 patients
Unacceptable delay in diagnosis, investigation, and referral occurs in most patients with malignant spinal cord compression and results in preventable loss of function before treatment. Improvement in the outcome of such patients requires earlier diagnosis and treatment
Prospective
Levack et al 2002
UK o report details concerning symptoms (especially pain) preceding the development of malignant cord compression (MCC); delays between onset/reporting of symptoms and confirmed diagnosis of MCC; accuracy of investigations carried out
319 patients
At diagnosis, most patients (82%) were either unable to walk or only able to do so with help. Pain was reported by nearly all patients interviewed (94%) and had been present for approximately 3 months (median=90 days). It was severe in 84% of cases, with the distribution and characteristics of nerve root pain in 79%. The site of pain did not correspond to the site of compression. Where reported, weakness and/or sensory problems had been noticed by the patient for some time before diagnosis (median intervals 20 and 12 days, respectively). Most patients reported
Prospective

Suspected Cancer: Appendix J2 (June 2015) Page 238 of 264
Author Setting Description No. Inclusion Exclusion Results Quality
early symptoms to their General Practitioner (GP) and diagnosis was established, following referral and investigation, approximately 2 months (median=66 days) later.
Salander et al 1999
Sweden A study of symptom development and obstacles to early diagnosis. A consecutive sample of patients with the diagnosis of malignant glioma and their spouses were interviewed about symptom development, help seeking and experiences of medical care in order to study the psychological aspects of brain tumour in patients
28 patients
Patients aged 17- 80
Headache Seizure/falling Motor or sensory dysfunction Obstacles on the pathway to medical care

Suspected Cancer: Appendix J2 (June 2015) Page 239 of 264
Table 18 BONE CANCER AND SARCOMA: signs and symptoms, including risk factors
Author Setting Description No. Inclusion Exclusion Results Gold
Std Quality
Bauer et al, 1999
Data from Norway Sweden and Finland.
This article summarised data from the Scandinavian Sarcoma Group Register for cases notified to the register 1986-1993.
3152 Among bone sarcomas, the commonest sites were the femur (34%), tibia (13%) and humerus (9%), and among soft tissue sarcomas the thigh (33%), trunk wall (15%) and lower leg (12%). 84% of patients with bone sarcoma and 58% of patients with soft tissue sarcoma had been referred to a sarcoma centre before open biopsy or surgical treatment.
Bauer et al, 2001
Series of 1851 cases of adults (aged 16 or over) with soft tissue sarcoma of the limbs or trunk wall notified to the Scandinavian Sarcoma Group Register 1986- 1997
The median age at diagnosis was 65 years. 41% of tumours were in the thigh, 14% the trunk wall, and 11% the lower leg. 32% were subcutaneous, 32% intramuscular, and 32% deep, extramuscular. The median recorded size was 7cm (six 6 cm among those under aged 40 increasing to 8cm in those aged over 80).
DoH Referral guidelines 2000
Guidelines for referral of suspected cancer
Nationally recognised
Lawrence et al, 1987
USA A national survey of the presentation of soft tissue sarcoma in adults (aged 18 or over).
Data from 504 hospital and involving 2355 patients.
In the second study from 645 institutions and involving 3457 patients.
8.9% of the sarcomas were in the head and neck, 17.9% trunk, 13.1% the upper limbs, 46.4% the lower limbs, 12.5% retroperitoneal, and 1.3% in the mediastinum. The female to male ratio was 1.0:1.1 (the ratio in the entire US population was 1.0:0.95). 86% of patients were described as white, 10% black and 1% orientals (the same as the race distribution of the US population). Among this adult population, 20.7% were under 40 years, 27.6% 40-60 years, and 51.8% over 60. The major presenting symptom was the presence of a mass (64%); one third had pain or discomfort as the initial symptom. A family history of sarcoma occurred in 0.8% of patients, and a family histpry of other cancer was not unusually high in comparison with the general population.
Rosenthal and Kraybill, 1999
USA An authoritative review of soft tissue sarcomas in the context of primary care. The study examine a series of malignant soft tissue tumours treated in one centre in the years 1980-1989
24% of the tumours were malignant fibrous histiocytomas, 14% liposarcomas, 12% undifferentiated sarcomas, 8% leiomyosarcomas, 6% malignant schwannomas, 6% dermatofibrosarcomas, 5% synovial sarcomas, 5% fibrosarcomas, and 20% other. The review reported that soft tissue sarcomas usually present as an asymptomatic mass. Patients often wait an average of four months before seeking medical attention, and a definitive diagnosis may be delayed for another six months in 20% of patients. No one feature reliably indicates if a mass is a sarcoma. Two

Suspected Cancer: Appendix J2 (June 2015) Page 240 of 264
Author Setting Description No. Inclusion Exclusion Results Gold Std
Quality
thirds are deep seated and larger than most subcutaneous tumours. The physical examination may reveal a firm, non-tender mass that may seem well defined as a result of compression by surrounding tissues.
Rydholm, 1997 Sweden This article reported experience from a population-based case series of people with sarcoma. and the findings in patients with lipoma were compared to those with sarcoma.
Lipomas were almost non-existent in children, and in adults were uncommon in the hand, thigh, lower leg and foot. The median size of solitary subcutaneous lipomas was 3 cm, 80% being smaller than 5 cm. The annual incidence of lipoma was estimated at 1/1000. In comparing these findings with findings relating to the sarcoma case series, patient age and duration of symptoms did not differentiate patients with lipoma from those with sarcoma. The median sizes of subcutaneous and deep-seated sarcomas were 4 cm and 8 cm respectively. The solitary lipoma:sarcoma ratio was 150:1 for tumours <5 cm, 20:1 for tumours >5 cm, and 6:1 for tumours >10 cm. For deep-seated tumours, the lipoma:sarcoma ratio was 4:1. One third of the soft tissue sarcomas were in the thigh.
Stefanovski et al, 2002
Italy 395 Patients treated for primary soft tissue sarcoma between 1985- 1997 were identified using a cancer centre database.
The median age at diagnosis was 53 years (range 10- 94 years). There were 172 females (43.5%) and 223 males (56.5%). The most common sites were lower limb (44.8%), upper limb (12.4%), and superficial trunk (12.2%). Fifty-nine % of the patients had lesions >5cm.
Welsh Cancer Intelligence and Surveillance Network, 2002
Sarcomas are relatively rare cancers. The age- standardised incidence of primary bone cancer in Wales per 100,000 population in 2001 was 1.18 in males and 1.01 in females.
Widhe and Widhe, 2000
102 patients with osteosarcoma and 47 patients with Ewing’s sarcoma.
Patients aged up to 30 years old were identified from the Swedish cancer registry and records were obtained for those with osteosarcoma and with Ewing’s sarcoma.
Eighty-six (58%) patients’ first consultation had been with a general practitioner, and 42 (28%) with a doctor at an emergency ward. Eleven (7%) had presented to a school doctor, and eight (5%) a military doctor. Seventy-one (70%) patients with osteosarcoma and 34 (72%) with Ewing’s sarcoma consulted because of regional pain. Twenty-six (25%) of those with osteosarcoma consulted with pain and a palpable mass, and seven (15%) of those with Ewing’s sarcomas consulted with pain and a mass. Only four (4%) of those with osteosarcoma and five (11%) of those with Ewing’s sarcoma did not report pain at the first medical visit. These patients all had a palpable mass only. Only twenty-one (21%) of those with osteosarcoma and nine (19%) of those with Ewing’s sarcoma had pain at night. However, 87 (85%) of those with osteosarcoma and 30 (64%) of those with

Suspected Cancer: Appendix J2 (June 2015) Page 241 of 264
Author Setting Description No. Inclusion Exclusion Results Gold Std
Quality
Ewing’s sarcoma reported pain related to strain. Intermittent pain at rest was reported by 57 (56%) of those with osteosarcoma and 27 (57%) of those with Ewing’s sarcoma. Forty-eight (47%) of patients with osteosarcoma and 12 (26%) of those with Ewing’s sarcoma related the onset of symptoms to trauma occurring at about the time the symptoms began. The majority of the traumatic incidents were of a similar type and magnitude to those regularly experienced by participants in common sports.

Suspected Cancer: Appendix J2 (June 2015) Page 242 of 264
Table 19 BONE CANCER AND SARCOMA: investigations
Author Setting Description No. Inclusion Exclusion Results Gold
Std Quality
American College of Radiology, 1999
Evidence review presented appropriateness criteria for imaging techniques for evaluating bone tumours. A routine X-ray was given the highest rating of appropriateness for investigation of patients with suspected bone lesions
When a classically benign-appearing lesion is detected on routine X-ray, additional studies may not be necessary unless surgical intervention is contemplated. When routine X-ray features are indeterminate or the lesion is more aggressive and considered to be potentially malignant, additional imaging studies are frequently required. MRI has been demonstrated to be superior to CT for staging bone tumours before treatment.
Widhe and Widhe, 2000
102 patients with osteosarcoma and 47 patients with Ewing’s sarcoma.
Patients aged up to 30 years old were identified from the Swedish cancer registry and records were obtained for those with osteosarcoma and with Ewing’s sarcoma.
68 (67%) of patients with osteosarcoma and 28 (60%) of those with Ewing sarcoma had a radiograph organised at the first medical visit. However, the correct diagnosis was not established for all patients who had a radiograph. The radiograph was misinterpreted by the radiologist as normal or inconclusive for six (9%) of those with osteosarcoma and 12 (43%) of those with Ewing’s sarcoma. When a radiograph was ordered at the first visit, the doctor’s delay to diagnosis averaged eight weeks, compared to 19 weeks when a radiograph was not ordered (p <0.0001).

Suspected Cancer: Appendix J2 (June 2015) Page 243 of 264
Table 20 BONE CANCER AND SARCOMA: delay
Author Setting Description No. Inclusion Exclusion Results Quality
Brouns et al, 2003
A retrospective review of patients with soft tissue sarcomas. The aim was to determine patient and doctor related delay in diagnosis and treatment of soft tissue sarcomas, as well as the reasons for this delay.
100 Consecutive hospital patients in Belgium referred for treatment of soft tissue sarcomas between May 1999 and May 2001. Only primary tumours were considered
Patients with sarcomas of the bone
Patient delay 93 patients discovered the mass themselves: 53 % showed no delay, the median delay of the other 47 patients was 4 months (ranging from 1 to 240 months). Of the 93 patients, 16 had pain as a symptom: 31% (n = 5) of the patients who had pain as a symptom delayed, whereas 55% (n = 42) of the patients who had no pain delayed. No correlation with age or location was found. Doctor delay Doctor delay occurred in 27% with median of 6 months (range, 2 to 79 months). Most frequent reason for delay was misdiagnosis from the start, based only on clinical examination in 59%, on clinical examination and radiology (34%), or on biopsy (7%). Total delay Of the high-grade tumours, 85% were diagnosed within 6 months, 50% without delay. Low-grade tumours either had no delay (50%) or a delay longer than 6 months (45%).
Sneppen and Hansen, 1983
84 cases of osteosarcoma and 40 cases of Ewing’s sarcoma
consecutive cases of osteosarcoma and consecutive cases of Ewing’s sarcoma admitted to a specialist tumour centre in Denmark between 1962 and 1979
Parosteal osteosarcomas and extraskeletal osteosarcomas were primarily excluded
In the osteosarcoma group, the total delay averaged 6.4 months, ranging from two weeks to three years. Total delay was not influenced by gender, or anatomical site. Total delay was shorter for patients under 20 years old (4.7 months vs. 9.1 months, p<0.001). For the Ewing’s group the total delay averaged 9.6 months, ranging from four weeks to four years. Total delay was not influenced by gender or age. Tumours involving the upper limbs were diagnosed earlier than tumours involving the legs (2.6 months vs. 14.3 months, p=0.02-0.01). In both groups patients with constant pain had relatively short delay, although the difference was only significant for patients in the Ewing group (3 months delay vs. 12.6 months, p=0.05-0.02). The presence of a swelling was also associated with a shorter total delay both for osteosarcomas and Ewing’s sarcomas (p=0.05-0.02, and p=0.10-0.05 respectively). Patients with a relatively long or relatively short delay had the same prognosis.
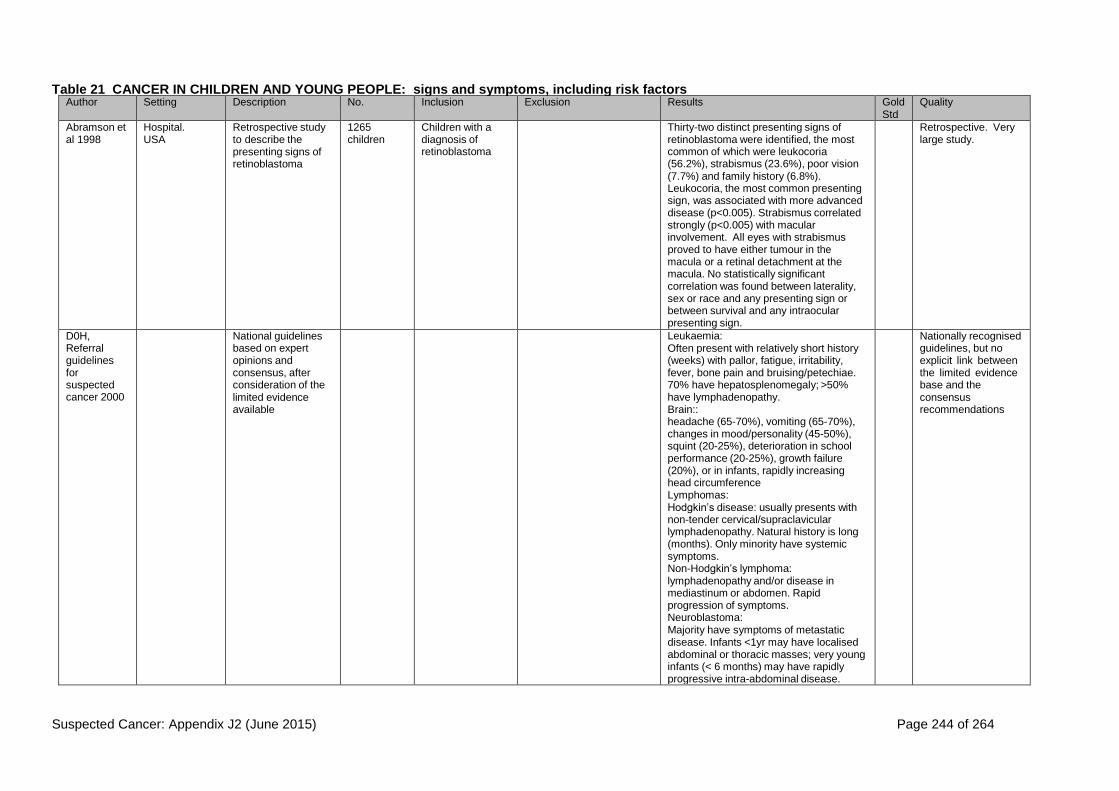
Suspected Cancer: Appendix J2 (June 2015) Page 244 of 264
Table 21 CANCER IN CHILDREN AND YOUNG PEOPLE: signs and symptoms, including risk factors Author Setting Description No. Inclusion Exclusion Results Gold
Std Quality
Abramson et al 1998
Hospital. USA
Retrospective study to describe the presenting signs of retinoblastoma
1265 children
Children with a diagnosis of retinoblastoma
Thirty-two distinct presenting signs of retinoblastoma were identified, the most common of which were leukocoria (56.2%), strabismus (23.6%), poor vision (7.7%) and family history (6.8%). Leukocoria, the most common presenting sign, was associated with more advanced disease (p<0.005). Strabismus correlated strongly (p<0.005) with macular involvement. All eyes with strabismus proved to have either tumour in the macula or a retinal detachment at the macula. No statistically significant correlation was found between laterality, sex or race and any presenting sign or between survival and any intraocular presenting sign.
Retrospective. Very large study.
D0H, Referral guidelines for suspected cancer 2000
National guidelines based on expert opinions and consensus, after consideration of the limited evidence available
Leukaemia: Often present with relatively short history (weeks) with pallor, fatigue, irritability, fever, bone pain and bruising/petechiae. 70% have hepatosplenomegaly; >50% have lymphadenopathy. Brain:: headache (65-70%), vomiting (65-70%), changes in mood/personality (45-50%), squint (20-25%), deterioration in school performance (20-25%), growth failure (20%), or in infants, rapidly increasing head circumference Lymphomas: Hodgkin’s disease: usually presents with non-tender cervical/supraclavicular lymphadenopathy. Natural history is long (months). Only minority have systemic symptoms. Non-Hodgkin’s lymphoma: lymphadenopathy and/or disease in mediastinum or abdomen. Rapid progression of symptoms. Neuroblastoma: Majority have symptoms of metastatic disease. Infants <1yr may have localised abdominal or thoracic masses; very young infants (< 6 months) may have rapidly progressive intra-abdominal disease.
Nationally recognised guidelines, but no explicit link between the limited evidence base and the consensus recommendations

Suspected Cancer: Appendix J2 (June 2015) Page 245 of 264
Author Setting Description No. Inclusion Exclusion Results Gold Std
Quality
Wilms’ tumour (nephroblastoma) Unilateral abdominal mass +/- pain. Haematuria (rare) Soft tissue sarcoma Mass at almost any site Bone tumours Limbs are most common sites. Persistent localised bone pain. Retinoblastoma Family history (in approximately 15% cases). White pupillary reflex. Squint Gonadal tumours Testicular/paratesticular masses can be difficult to differentiate – any non transilluminable mass associated with the testis is significant. Ovarian tumours can be associated with precocious puberty. abnormal blood count If reported as requiring urgent further investigation. Petechiae/purpura. Fatigue in a previously healthy child when combined with either of the following: generalised lymphadenopathy, hepatosplenomegaly. Bone pain especially if it is: diffuse or involves the back, persistently localised at any site, requiring analgesia, limiting activity. Lymphadenopathy: non tender, firm/hard and >3 cms in maximum diameter progressively enlarging associated with other signs of general ill health, fever and/or weight loss involves axillary nodes (in the absence of any local infection or dermatitis)or supraclavicular nodes seen as a mediastinal or hilar mass on chest x-ray (particularly if no evidence of previous local infection) Headache of recent origin with one or more of the following features increasing in severity or frequency noted to be worse in the mornings or causing early wakening associated with vomiting associated with neurological signs (e.g.

Suspected Cancer: Appendix J2 (June 2015) Page 246 of 264
squint, ataxia) associated with behavioural change or deterioration in school performance. Soft tissue mass: any mass which occurs in an unusual location particularly if associated with one or more of these: shows rapid or progressive growth -size > 3 cms in maximum diameter fixed or deep to fascia associated with regional lymph node enlargement
Dobrovoljac et al 2002
Childrens’ hospital. Switzerland
Retrospective study to identify factors related to delays in diagnosis
252 children Children admitted with primary brain tumours
Intiial symptoms were (in decreasing order of frequency) headache, nausea/vomiting, seizures, behavioural changes, ataxia, squint/diplopia, lethargy, hemiparesis/quadriparesis, head tilt, anorexia, growth failure, sleep disturbance, polyuria/polydipsia, visual loss, weight loss, facial nerve palsy, enlargement of the head, cranial neuropathies other than III, IV, VI, VII, gaze depression/separation of cranial sutures/bulging fontanelle, dizziness, nystagmus, papilloedema, amenorrhoea, proptosis. Symptoms and frequencies changed when analysed by age of the child
Retrospective. Large study. Symptoms at initial presentation described.
Farwell at al 1984
Community – regional tumour registry. USA
Retrospective study of CNS tumours in adolescents compared with younger children
144 adolescents
Children aged 13 to 19 yrs with diagnosis of CNS tumour (intracranial or intraspinal)
Presenting symptoms included those that resulted from increased intracranial pressure as well as those that were local effects of tumours. The most common symptoms were headache (N=65), nausea or vomiting (N=53) and diplopia (30). Visual disturbances such as blurred vision (N=18), dim vision or field deficits were next in frequency followed by ataxia (N=15) and then mental status change (N=8) or longstanding retardation. Less common symptoms included paresis (N=7) and vertigo (N=7). At the time of diagnosis, papilloedema was present in 41 patients.
Retrospective. Population based.
Farwell et al 1978
Community – regional tumour registry. USA
Retrospective study of intracranial neoplasms, including presenting symptoms
54 infants Infants ≤18 months at diagnosis of intracranial neoplasm
nfants presented at diagnosis with vomiting (47%), increasing head size (32%), lethargy (19%), convulsions (13%), paresis (9%), cranial nerve palsies (9%) and ataxia (6%). The physical findings at diagnosis indicated that 20 patients had
Retrospective. Population based.

Suspected Cancer: Appendix J2 (June 2015) Page 247 of 264
Author Setting Description No. Inclusion Exclusion Results Gold Std
Quality
an increased head circumference. A bulging fontanelle was reported in 12 cases (27%). Eleven infants (25%) had cranial nerve palsies. Papilloedema (16%) and nuchal rigidity (16%) were each seen in seven instances. Two patients (4%) were comatose and another five (16%) had a diminished level of consciousness. Other findings included ataxia (7%), nystagmus (11%), hemiparesis (9%), hyperreflexia (16%), hypertonia (9%), irritability (6%), hyptonia (11%), extracranial masses (4%) and hyperalertness (6%). Vomiting was the only symptom, besides enlargement of the head that occurred in more than six children. The loss of a previously acquired skill such as rolling over, sitting or crawling was a symptom observed in seven patients, and in two of these, it was the only symptom in addition to abnormal growth of the head. The physical findings were more varied than the symptoms. Nearly half of the children had an increased head circumference, often accompanied by a bulging fotanelle or prominent veins over the scalp. Papilloedema was noted in two children. Cranial nerve palsies occurred in infants with tumours in all locations. However, nystagmus occurred in cerebral hemisphere or brain stem tumours only and was not found in cerebellar tumours.
Flores et al 1986
University hospital;. USA
Retrospective study to compare time to diagnosis in children with primary brain tumours, Wilms’ tumour, or leukaemia
79 children Children diagnosed with primary brain tumours
Common presenting symptoms and signs in children with brain tumours were ataxia and abnormalities in gait observed in the zero to five year old patients. Headaches were described more frequently in the six to 20 year old age group. Seizures were observed in the six to 20 year old group, while none were recorded among children 0 to 5 years of age. Nausea and vomiting frequently occurred in all groups.
Retrospective
Golden and Feusner 2002
Children’s hospital. USA
Retrospective study to give guidance on evaluation and diagnosis of malignant abdominal
150 children Children diagnosed with malignancy of the abdomen
Of children either younger than one year or older than ten years, 26% (11/43) had normal abdominal examinations at diagnosis, compared with only 9% (7/78) of all the remaining children. The authors
Retrospective.

Suspected Cancer: Appendix J2 (June 2015) Page 248 of 264
Author Setting Description No. Inclusion Exclusion Results Gold Std
Quality
masses in children investigated how these masses were characterised on physical examination. Not all children had every aspect of their masses described fully, but patterns could be identified: 70% (49/70) were distinguished as nontender, 79% (11/14) were recorded as being nonmobile, and at least 87% (61/70) were firm. Not all malignant masses were defined as nontender.
Hasle 2001 Narrative review of malignancies in children with Down’s syndrome
Overall risk of cancer was not significantly increased in individuals Down’s syndrome. However, the distribution of tumour types in Down’s syndrome differed from the pattern in non-Down’s children. Leukaemia constituted 95% of cases of cancer in children with Down’s but only 34% of non-Down’s children.
Narrative review.
Honig and Charney 1982
Children’s hospital. USA
Retrospective stuffy to establish practice guidelines
105 children Children with a final diagnosis of brain tumour
Headaches were occipital in location in 16 children (28%), unilateral in 13 (22%) and diffuse in 29 (50%). 32 children (67%) were either awakened from sleep by the pain or were in pain on arising. Eight of 61 children had unusually severe or prolonged headaches and 19 (31%) had changes in headache frequency or severity. Vomiting was described as intermittent in 26 of 72 (36%), daily in eight of 72 (11%) and pernicious in two of 72 (3%). The vomiting was described as intermittent in 26 of 72 (36%), daily in eight of 72 (11%) and pernicious in two of 72 (3%). The vomiting increased in frequency (four patients) or first began (11 patients) following the onset of the headaches in 15 of 72 children (21%). In nine of these 15, the change coincided with increased frequency or severity of the existing headache pattern. Five patients were vomiting prior to the onset of their headaches. 68 children (94%) with headaches had neurologic and/or ocular signs at the time of diagnosis. In 60 of these, signs developed following the onset of their headaches. Thirty-three of 60 (55%) had findings within two weeks and 51 (85%) had an abnormality on physical
Retrospective.

Suspected Cancer: Appendix J2 (June 2015) Page 249 of 264
Author Setting Description No. Inclusion Exclusion Results Gold Std
Quality
examination within two months of the onset of their headaches. Within four months, 53 of 60 (88%) had neurological and/or ocular signs. The numbers of patients with ocular signs and symptoms were papilloedema (42), diplopia (11), decreased acuity (8), squint (9), nystagmus (5), optic atrophy (4), blurred vision (3), blindness (2), failure of upward gaze (2), anisocoria (1), optic atrophy on side of tumour and papilloedema of the opposite disc (1).
Jonsson et al 1990
Children’s medical centre. USA
Retrospective study to assess relationship between bone pain and haematological findings at diagnosis of acute lymphoblastic leukaemia (ALL)
296 children Children diagnosed with ALL
Haematologic indices were relatively normal in patients presenting with musculoskeletal signs and symptoms as prominent presenting manifestation. Patients with prominent bone pain could experience diagnostic delay because haematological values appeared normal. Haemoglobin and platelets were higher, blast cell and leucocyte counts lower among children with severe bone pain. Statistically significant differences found between groups for haemoglobin concentration (p<0.001), leukocyte count (p=0.014), absolute neutrophil count (p=0.001), percentage circulating blast cells (p=0.009) and platelet count (p<0.001).
Retrospective. Not primary care population based. Large study.
Jooma et al 1984
Children’s hospital. UK
Retrospective study to analyse cases of children with intracranial tumours
100 infants aged under 1 yr
Infants admitted with intracranial tumours.
Infants with posterior fossa dermoid tumours, and orbital tumours
Most common symptoms reported by parents were vomiting and alteration of psychomotor development. In 7 patients a febrile illness preceded more specific symptoms of raised intracracranial pressure, whereas in 6 a head injury had recently occurred. A head tilt was noted in 7 infants with infratentorial tumours and in 2 each of the infants with hemispheric and axial lesions. Macrocrania and signs of raised intracranial pressure were recognised in a majority of the children. 10 patients with suprasellar tumours had rotary nystagmus or bizarre eye movements. Behavioural disturbances with irritability, somnolence and indifference to surroundings were commonly reported and were important if combined with loss of a previously
Retrospective.

Suspected Cancer: Appendix J2 (June 2015) Page 250 of 264
Author Setting Description No. Inclusion Exclusion Results Gold Std
Quality
acquired motor skill or arrest of development. The following signs were observed in infants: papilloedema (n=36), optic atrophy (n =10), nystagmus or abnormal eye movements (n =22), sixth nerve palsy (n =17), seventh nerve palsy (n =13), altered limb tone (n =35), hemiparesis (n =16), truncal ataxia (n =10), abnormal neck posture (n =20), neck stiffness (n =9).

Suspected Cancer: Appendix J2 (June 2015) Page 251 of 264
Keene et al 1999
Children’s hospital. Canada
Retrospective study to describe the clinical patterns associated with childhood brain tumours
200 children Children aged under 18 years at diagnosis with primary intracranial neoplasm, and lined within the study catchment area
Hemispheric tumours occurred in 52 patients. The presenting signs were seizures 60%, headache 37%, vomiting 23%, changes in behaviour or personality 11%, facial asymmetry 9% and visual difficulties 6%. Initial findings on examination included one or more of the following: no abnormalities (51%), hemiplegia 34%, signs of increased intracranial pressure 23%, cranial nerve dysfunction 3% and macrocrania 3%. Supratentorial axial or midline tumours occurred in 50 patients. The presenting signs for tumours arising from axial structures included one or more of the following: non-specific headache 60%, polyuria 35%, non-specific malaise 10%, short stature 10% and visual difficulties 5%. Initial examination at the time of diagnosis included signs of increased intracranial pressure 30%, visual field disturbances 25%, optic atrophy 15% and Parinaud’s sign 15%. Cerebellar tumours were present in 74 patients. The presenting symptoms included vomiting, headache 62%, and incoordination 55%. The frequency of clinical signs included ataxia 69%, increased intracranial pressure 57%, nystagmus 31%, head tilt 14%, cranial nerve palsies 28% and macrocrania 10%. Brainstem tumours affected 19 children. Patients experienced gait difficulties 83%, squint 50%, headaches 25%, vomiting 25% and swallowing difficulties 8%. The initial examination included findings of cranial nerve VI dysfunction 67%, ataxia 50%, cranial nerve VII dysfunction 42%, nystagmus 33%, hemiplegia 33% and head tilt 33%.
Retrospective. Large study.
Linet et al 2003
Review of risk factors for sarcomas, brain and haematological cancers
See tables in full guideline Narrative review, linked with evidence base

Suspected Cancer: Appendix J2 (June 2015) Page 252 of 264
Mag et al 1999
University hospital. Malaysia
Retrospective study to describe presenting features and prognostic significance
78 children Children ≤12 yrs admitted with new diagnosis of neuroblastoma
The main presenting signs and symptoms in decreasing order were pallor, fever, abdominal mass, weight loss and bone/joint pain. Weight loss was reported in 36% and bone or joint pain in 33% of patients. Other presenting symptoms or signs were bleeding, infection or sepsis, seventh nerve palsy and bilateral leg swelling.
Retrospective.
Mehta et al 2002
Paediatric neurosurgical centres. Canada
Retrospective and prospective study to determine the tiem required for diagnosis and important associated factors
104 children Children ≤17 yrs diagnosed with brain tumour, and lived in the study area
Children referred from outside the region. Neoplastis lesions that involved the spinal cord/leptomeninges. Children with Neurofibromatosis Type I, and only an optic pathway tumour that did not need treatment
9 children (66%) exhibited vomiting or nausea as a presenting symptom. Nine of those children did not experience associated headaches. Five of these nine patients experienced vomiting for more than one month. 66 of the children (63%) complained of headaches or exhibited behaviour that indicated its presence (such as clutching the head). 37% (seven of 19) children less than four years of age exhibited behaviour that could be positively confirmed as indicating headaches. Among older children, 76% (28 of 37 children) and 67% (31 of 46 children) of those four to eight and nine to 17 years of age respectively had complaints of headaches as one of their presenting symptoms. Among the 66 children with histories of headaches, 85% (56 of 66 children) exhibited evidence of either nausea or vomiting at some point during their histories. Many did not experience headaches that increased in intensity, duration or frequency. 23 patients (22%) did not exhibit evidence of headaches, nausea or vomiting. Among these 23 cases, 18 presented with either a seizure or a focal neurological deficit. The most common neurological findings were focal weakness and cranial nerve dysfunction. Behavioural changes, failure to reach certain milestones and incidental imaging findings were responsible for identification in the remaining five cases. Of the 104 children, 52 exhibited behavioural changes, which were most often described as changes in temperament.
Some prospective element.

Suspected Cancer: Appendix J2 (June 2015) Page 253 of 264
Soule and Pritchard 1977
Selected review of cases from literature and personal practice (clinic based). USA
Retrospective study to describe clinicopathologic results in children with fibrosarcoma
110 children Children with a diagnosis of fibrosarcoma with histological results
Children with revised histological diagnosis. Lesion located in the orbit, dura, or base of the skull
The primary symptom of most patients was that of a mass or swelling in the soft tissues. Most of the lesions were enlarging, and with the exception of the congenital tumours were known to have been present from a few weeks to four years. Four patients first complained of discomfort or pain before a tumour was apparent. In some the skin had become tense, shiny and red. One congenital lesion became ulcerated and exhibited partial destruction of the adjacent tibia and fibula by the 13th day of life.
Retrospective. Selected cases from literature.
Stiller 2002 Narrative review of the epidemiology of cancer in adolescents
The risk of both acute lymphoblastic leukaemia and acute non-lymphocytic leukaemia throughout the age range 5-29 years among people with Down’s syndrome is approximately 10 times that in the non-Down population. Down’s syndrome also appears to be associated with an increased risk of germ cell tumours of the testis and brain and possibly of other sites but the risk of most other solid tumours is lower than in the general population. Neurofibromatosis carries an increased risk for central nervous system tumours and soft tissue sarcomas. The considerable variation in the incidence of Ewing sarcoma, with its extreme rarity among black and east Asian populations suggesting a strong genetic component to its aetiology. The risk of Hodgkin’s disease in adolescents and young adults who have an affected sibling is approximately seven times that in the general population. Epstein-Barr virus has a role in the development of some cases, though its relations with histologic subtype, age and ethnic group are complex. Hodgkin’s disease is more common among
Narrative review,

Suspected Cancer: Appendix J2 (June 2015) Page 254 of 264
Author Setting Description No. Inclusion Exclusion Results Gold Std
Quality
adolescents in populations of higher socio-economic status. The thyroid gland is especially sensitive to the carcinogenic effects of ionising radiation, with the highest risk for young age at exposure; the excess risk of thyroid cancer persists for at least 40 years after irradiation.
Thulesius et al 2000
Community - regional tumour registry. Sweden
Retrospective study to describe the diagnostic process of childhood malignancies, from initial symoptoms until diagnosis and treatment.
68 children Children with tumours reported to the regional tumour registry
Excluded if tumours could not be classified as malignant, disease was congenital, child diagnosed outside the study area, or incomplete records
Initial symptoms were for Leukaemia (in decreasing order of frequency) fatigue, upper respiratory tract infection, fever, abdominal pain, joint pain, lympadenopathy, headache, anorexia Brain tumours (in decreasing order of frequency) headache, vomiting, visual problems, convulsions, other neurological symptoms
Retrospective. Small sample, But primary care perspective.
Tomita and McLone 1985
Children’s hospital. USA
Retrospective study to decscribe the distribution of brain tumours, their presentation and results of treatment
100 infants Infants diagnosed with intracranial tumours in the first 24 months of life
Approximately 50% of group 1 with either infratentorial or supratentorial tumours showed macrocephaly beyond the 95th percentile, whereas 25% of group 2 had macrocephaly. Approximately 72% of the anterior fontanelles of the patients harbouring either infratentorial or supratentorial tumours were full, bulging or tense. Hydrocephalus was almost invariably present in association with infratentorial tumours, but its incidence was less in cases with supratentorial tumours (62%). Papilloedema was infrequent despite the high incidence of hydrocephalus and macrocephaly. The incidence of papilloedema was 26.3% in the cases with infratentorial tumours and 18.4% in the cases with supratentorial tumours in group 1, and was 52.6% and 25.0% respectively in group 2.
Retrospective
Wdhe and Widhe 2000
Community – national cancer registry. Sweden
Retrospective study to identify early symptoms of osteosarcoma and Ewing’s sarcoma
149 individuals
People ≤30 yrs with diagnosis of osteosarcoma or Ewing;s sarcoma
People with tumours in the skull or ribs
Most patients consulted because of regional pain alone or in combination with a palpable mass. A palpable mass was reported at the first visit in 40 (39%) of the patients with osteosarcoma and 16 (34%) of those with Ewing’s sarcoma. Four patients with osteosarcoma and five with Ewing’s sarcoma did not report pain at the first medical visit and had a palpable mass only. 21 (21%) of the osteosarcomas and
Retrospective. Population based

Suspected Cancer: Appendix J2 (June 2015) Page 255 of 264
Author Setting Description No. Inclusion Exclusion Results Gold Std
Quality
nine (19%) of the Ewing’s sarcomas caused pain at night. 87 (85%) of the patients with osteosarcoma and 30 (64%) of those with Ewing’s sarcoma reported pain related to strain. Intermittent pain at rest was reported by 57 (56%) and 27 (57%) patients respectively. 48 (47%) of the patients with osteosarcoma and 12 (26%) of those with Ewing’s sarcoma related the onset of symptoms to trauma occurring at about the time the symptoms began that were of a similar type and magnitude as those experienced regularly in common sports. Tendinitus was the most common initial misdiagnosis for 32 (31%) of the osteosarcomas. Patients with Ewing’s sarcoma often reported relapsing fever and periods of pain that were followed by few or no symptoms, which misled doctors into believing the condition, was resolving spontaneously.
Wilson and Draper 1974
Community – national cancer registry. UK
Retrospective? study to describe the natural history and prognosis for neuroblastoma
487 children Children <15yrs with diagnosis of neuroblastoma with histological confirmation
The signs and tumours were varied because they arose in a range of sites. Up to three symptoms were recorded for each case. Abdominal swelling was most commonly a symptom in the youngest age group, its frequency decreasing with increasing age. The same relationship was evident to a lesser extent for the symptoms of breathlessness and stridor. Conversely, pain was a relatively uncommon symptom in very young children. It was more often reported by older children though this was presumably partly due to the greater ease in eliciting this symptom. Those symptoms related to nerve involvement were also more often reported for older children. There was little difference between the two sexes in the type of symptom reported. The figures reflected the infrequent incidence of abdominal tumours (of the adrenal, abdominal sympathetic ganglia and liver) and thoracic tumours in the youngest age groups while those occurring in the spinal canal and brain were more frequent among older children.
Retrospective? Some of the analysis did include data on 152 children without histological confirmation

Suspected Cancer: Appendix J2 (June 2015) Page 256 of 264
Table 22 CANCER IN CHILDREN AND YOUNG PEOPLE: delay
Author Setting Description No. Inclusion Exclusion Results Quality
Butros et al 2002
Specialist cancer centre. USA
Retrospective study to identify reasons for delayed diagnosis of retinoblastoma
57 children
Children presenting with newly diagnosed retinoblastoma
Children with a family history of retinoblastoma.
77% of patients delayed seeking treatment. Primary care physicians delayed referral in 30% of cases (n=14); in all of these patients, parents stated that they reported the presenting signs to the child’s physician, who reassured the parents of normalcy or made a diagnosis different from retinoblastoma, neither of which led to an immediate referral to ophthalmology; 13 (925) of these patients had a median delay of 3.75 months. No adverse consequence of delayed diagnosis could be clearly established, but a trend towards eye loss being associated with longer delays in patients with bilateral retinoblastoma was noted.
Retrospective.
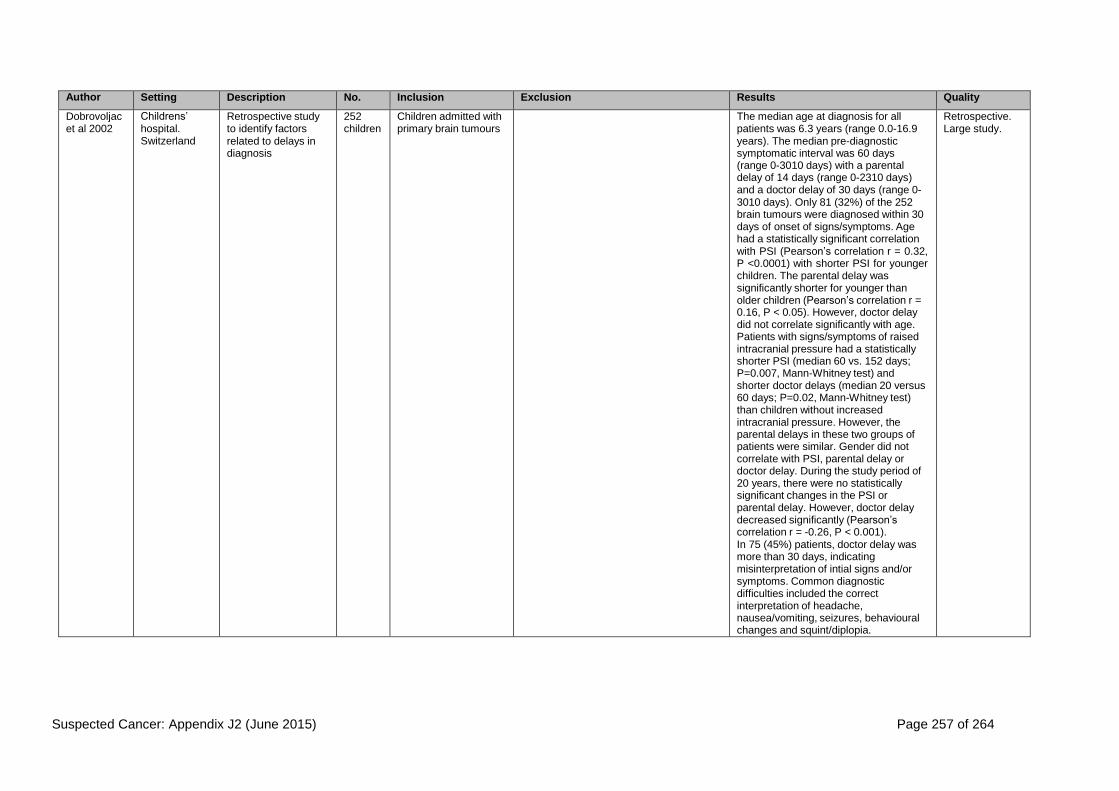
Suspected Cancer: Appendix J2 (June 2015) Page 257 of 264
Author Setting Description No. Inclusion Exclusion Results Quality
Dobrovoljac et al 2002
Childrens’ hospital. Switzerland
Retrospective study to identify factors related to delays in diagnosis
252 children
Children admitted with primary brain tumours
The median age at diagnosis for all patients was 6.3 years (range 0.0-16.9 years). The median pre-diagnostic symptomatic interval was 60 days (range 0-3010 days) with a parental delay of 14 days (range 0-2310 days) and a doctor delay of 30 days (range 0- 3010 days). Only 81 (32%) of the 252 brain tumours were diagnosed within 30 days of onset of signs/symptoms. Age had a statistically significant correlation with PSI (Pearson’s correlation r = 0.32, P <0.0001) with shorter PSI for younger children. The parental delay was significantly shorter for younger than older children (Pearson’s correlation r = 0.16, P < 0.05). However, doctor delay did not correlate significantly with age. Patients with signs/symptoms of raised intracranial pressure had a statistically shorter PSI (median 60 vs. 152 days; P=0.007, Mann-Whitney test) and shorter doctor delays (median 20 versus 60 days; P=0.02, Mann-Whitney test) than children without increased intracranial pressure. However, the parental delays in these two groups of patients were similar. Gender did not correlate with PSI, parental delay or doctor delay. During the study period of 20 years, there were no statistically significant changes in the PSI or parental delay. However, doctor delay decreased significantly (Pearson’s correlation r = -0.26, P < 0.001). In 75 (45%) patients, doctor delay was more than 30 days, indicating misinterpretation of intial signs and/or symptoms. Common diagnostic difficulties included the correct interpretation of headache, nausea/vomiting, seizures, behavioural changes and squint/diplopia.
Retrospective. Large study.

Suspected Cancer: Appendix J2 (June 2015) Page 258 of 264
Author Setting Description No. Inclusion Exclusion Results Quality
Edgeworth et al 1996
Neurosurgical unit. UK
Retrospective study to identify where and how delay in diagnosis occurs
74 children
Children with primary brain tumours aged 0 to 16 yrs
One month after symptom onset 68% had not at that stage been correctly diagnosed, and after 6 months 20% were still not diagnosed. The interval between symptom onset and diagnosis was shortest for children aged 0-2 years. The mean (SD) duration of signs and symptoms before parents consulted a health professional was 3.0 (13.4) weeks (range 0-104 weeks). In 92% of cases parents took their child to a doctor within one month of symptom onset. The mean (SD) duration of clinical history between initial consultation with a health professionals and clinical diagnosis was 16.0 (24.4) weeks (range 0-130 weeks). One month after initial consultation 58% of children had not yet been diagnosed and 18% were yet to be diagnosed six months after initial consultation. Before diagnosis, there were a total of 257 (mean 4.6, range 1-12) consultations with professionals in the 56 children for whom this information was available. Of these, 45.5% were with a general practitioner and 9% with an accident and emergency department. 62% of children were seen on four or more occasions before the correct diagnosis was made. Doctors were unable to make a diagnosis in 19% of children and in a further 15% could find nothing wrong. Symptoms and signs were confused with those of migraine in 14 children. Vomiting occurred in 65% and headache in 64% of the children. There was no relationship between site of tumour or duration of clinical history and incidence of psychological difficulty for any age group. Some parents felt that poor communication between professionals including opticians, psychologists and teachers) had contributed to the delay in diagnosis. Many parents reported that professionals looked at the presenting symptoms of each consultation in isolation.
Retrospective

Suspected Cancer: Appendix J2 (June 2015) Page 259 of 264
Author Setting Description No. Inclusion Exclusion Results Quality
Fajardo- Gutierrez et al 2002
City hospitals. Mexico
Retrospective study to assess time to diagnosis in children with cancer
4,940 children
Children with diagnosis of cancer
Records that were illegible The time to diagnosis for all types of cancer ranged from one to five months. The shortest was for leukaemia (median = one month) and the longest for Hodgkin’s disease, retinoblastoma and unspecified malignant neoplasms (median = five months). The association between time to diagnosis and age at diagnosis was different. When grouped by age in years as < 1 (the reference age), 1-4, 5-9, and 10-14; the risk of a delayed time to diagnosis increased with age (x² = 29.12; P = 0.0001), the highest being for the 10-14 group (OR= 1.8; 95% CI = 1.4-2.3). Risk for masculine gender and delayed time to diagnosis was low (OR = 1.1; 95% CI = 1.0-1.3). Parental educational level also influenced time to delay, and there was risk of delayed time to diagnosis in the lower compared to the higher educational level group (OR = 1.4; 95% CI = 1.1-1.8 for fathers, and OR = 1.5; 95% CI = 1.2-2.1 for mothers). The population without National Social Security had greater risk of delayed time to diagnosis (OR = 1.3; 95% CI = 1.1- 1.4). The risk of delayed time to diagnosis varied among the different cancer types, but in general, age at diagnosis was the variable with greatest influence. Extrapolation of results to a UK setting requires caution because of differences between health care systems. However, findings on influence of age in diagnostic delay support findings from other studies.
Retrospective

Suspected Cancer: Appendix J2 (June 2015) Page 260 of 264
Author Setting Description No. Inclusion Exclusion Results Quality
Flores et al 1986
University hospital;. USA
Retrospective study to compare time to diagnosis in children with primary brain tumours, Wilms’ tumour, or leukaemia
79 children
Children diagnosed with primary brain tumours
The mean interval from the appearance of symptoms to diagnosis in patients with brain tumours was 26 weeks, with a median of six weeks. Patients less than five years of age who had infratentorial tumours and patients with more severe grades of signs and symptoms were diagnosed earlier. For patients with acute leukaemia the mean time to diagnosis was 4.5 weeks. Of 123 patients with acute leukaemia, 100 (80%) were diagnosed within four weeks. Of the patients with Wilm’s tumour, 38 (84%) were diagnosed within four weeks, and 25 (55%) in the first week. The mean duration of symptoms for patients with Wilm’s tumour was 2.8 weeks. Of the three types of malignant neoplasms, the primary brain tumour had the longest delays in diagnosis (P<0.0001).
Retrospective
Goddard et al 1999
Hospital. UK
Retrospective study to establish the extent of diagnostic delay and associated risk factors
100 children
Children with retinoblastoma
Children with family history of retinoblastoma. Those with dysmorphic features noted before diagnosis, or lived outside the UK
Older children were referred more rapidly than younger children. In children who presented to a health visitor with a squint, there was a significantly greater delay in diagnosis. Delay was associated with parental distress and increased the risk of local tumour invasion.
Retrospective.
Haik et al 1985
Specialist centre. USA
Retrospective study to describe the diagnostic delays in diagnosis of retinoblastoma
250 children
Children with diagnosis of retinoblastoma
Insufficient data Significant percentages of primary care physicians (47% for children with no positive family history, and 25% for children with positive family history) delayed referral for a significant period of time (19 weeks for both groups). The mean time from first symptom to seeking the opinion of a primary care physician was two weeks (range 1-8 weeks) for children with a positive family history, and five weeks (range 1-100 weeks) for children with a negative family history.
Retrospective

Suspected Cancer: Appendix J2 (June 2015) Page 261 of 264
Author Setting Description No. Inclusion Exclusion Results Quality
Mehta et al 2002
Paediatric neurosurgical centres. Canada
Retrospective and prospective study to determine the tiem required for diagnosis and important associated factors
104 children
Children ≤17 yrs diagnosed with brain tumour, and lived in the study area
Children referred from outside the region. Neoplastis lesions that involved the spinal cord/leptomeninges. Children with Neurofibromatosis Type I, and only an optic pathway tumour that did not need treatment
The median time from symptom onset to diagnosis was 3 months. The mean time to diagnosis was 7.3 months (95% confidence interval [CI], 5.0-9.7 months), and only 41% of cases were correctly diagnosed within three visits to various physicians. At least 30% of children required more than seven visits to physicians. Time to diagnosis was not significantly affected by either sex or age. Tumours located in the brainstem required significantly longer times for diagnosis, compared with those located elsewhere (mean = 11.8 months [95% CI, 3.1 -20.4 months] versus 6.6 months [95% CI, 4.2 -9.0 months], P=0.014). Medulloblastomas as a group exhibited significantly shorter diagnostic times, compared with other pathological subtypes (mean = 3.8 months [95% CI, 2.0-5.6 months] versus 8.4 months [95% CI, 5.4-11.3 months], P = 0.006).
Some prospective element.

Suspected Cancer: Appendix J2 (June 2015) Page 262 of 264
Author Setting Description No. Inclusion Exclusion Results Quality
Pollock et al 1991
Unclear. USA
Retrospective stuffy to assess the relationship between delay in diagnosis and associated factors
2665 children
Children with newly diagnosed lymphomas or solid tumous who were treated using defined protocols
Children with no symptoms at diagnosis, symptom information was incomplete.
Median lag time ranged from a low of 21 days for children with neuroblastoma to a high of 72 days for those with Ewing’s sarcoma. A statistically significant difference was found among tumour types (P <0.001). Age was positively and significantly correlated with lag time (P <0.001) for all tumour types except Hodgkin’s disease (P=0.58); that is, as age increased, lag time increased. Gender was significantly associated with lag time only for non-Hodgkin’s lymphoma (P=0.02), for which girls had longer lag times. Race was significantly associated with lag time only for osteosarcoma (P=0.002), for which white children had longer lag times. With the exception of the Hodgkin’s disease group, age remained a significant independent predictor of lag time for all diagnostic groups (P<0.05). Gender remained significantly associated with lag time for non- Hodgkin’s lymphoma (P=0.02). The multivariate analysis also revealed a significant association between gender and lag time for Ewing’s sarcoma (P=0.02). The association differed in these two tumour groups; girls had longer lag times in the non-Hodgkin’s lymphoma group but shorter lag times in the Ewing’s sarcoma group. Race also continued to have a statistically significant association with lag time only for osteosarcoma (P=0.02). Patients with shorter lag time for brain tumour had a 67% frequency of gait abnormalities and ataxia, compared with 59% for those with a longer lag time (P=0.13), but were similar with respect to other common symptoms of brain tumour. For neuroblastoma, abdominal masses were more common in patients with shorter lag times (31% vs. 19%; P = 0.037). Patients with shorter lag time for non-Hodgkin’s lymphoma had a higher frequency of abdominal masses (13% vs. 5%; P=0.06) and of breathing difficulty and coughing (32% vs. 15%,
Retrospective

Suspected Cancer: Appendix J2 (June 2015) Page 263 of 264
P=0.007).
Saha et al 1993
Childrens’ hospital. UK
Retrospective study to examine the time to diagnosis and associated factors
236 children
Children aged 0 to 15 yrs with a diagnosis of cancer
There was no significant difference in the lag time between males and females. Age was a significant predictor for lag time, with older children having a longer lag time. The mean lag time varied from 2.8 weeks for nephroblastoma to 13.3 weeks in brain tumour. One way analysis of variance showed diagnostic group to be significant for length of lag time, (P <0.001). Both age and diagnostic group remained individually significant in a multivariate analysis. The difference in lag time for children with acute leukaemia was not significantly related to a presenting white cell count of ≥ 50×1000³/l compared to those presenting with a lower count. The difference in lag time between the stages in all diagnostic cancer groups was not significant either. The authors failed to find a positive correlation between lag time and outcome.
Retrospective
Sloper 1996 Specialist hospitals. UK
Study (interviews and questionnaires) to investigate parents’ responses to a diagnosis and treatment of cancer in their child
98 families
Chldren with cancer aged <18yrs, living at home, diagnosed in part 6 months. Parents could speak adequate English. Family included a sibling aged between 8 and 16 yrs.
Over half the families (57%) reported a delay in diagnosis. There were differences in delay between different diagnostic groups: the mean interval was shortest for children with leukaemia (4.8 weeks); longer intervals were reported for lymphomas (17.4 weeks), solid tumours (19.4 weeks) and central nervous system tumours (24.2 weeks). There was a significant relationship between age of the child and reported delay, with older children experiencing more delay (r = 0.243, p=0.018, n= 94), but no significant associations with other demographic variables of social class or single parenthood. A common theme was the feeling that parents’ own concerns and knowledge of their child were not listened to or accepted by health professionals. Parents also voiced concerns in cases where an initial misdiagnosis was made and this was not fully re-assessed in view of continuing or increasing symptoms.
Qualitative description. No link with clinical perspective.

Suspected Cancer: Appendix J2 (June 2015) Page 264 of 264
Author Setting Description No. Inclusion Exclusion Results Quality
Thulesius et al 2000
Community - regional tumour registry. Sweden
Retrospective study to describe the diagnostic process of childhood malignancies, from initial symoptoms until diagnosis and treatment.
68 children
Children with tumours reported to the regional tumour registry
Excluded if tumours could not be classified as malignant, disease was congenital, child diagnosed outside the study area, or incomplete records
Mean age at diagnosis was 7.8 years. Leukaemia was the diagnosis in 25 children (39%), and brain tumours in 22 children (34%). Parent’s delay was shorter than four weeks in 22 of 25 children with leukaemia, compared with nine of 20 children with brain tumours (x² = 9.59, P = 0.002). For two children with leukaemia, parent’s delay was three months or more with a common feature of diffuse and gradually aggravating symptoms and signs such as fatigue, diarrhoea and upper respiratory tract infections. Doctor’s delay was <two weeks for 17 of 25 children with leukaemia, compared with 7 of 21 children with a brain tumour (x² = 5.50, P = 0.019). Lag time was four weeks or less for 19 of 25 children with leukaemia, compared with 6 of 20 children with a brain tumour (x² = 9.52, P= 0.002). Median lag time also was 3 weeks (r=0- 15) for children with leukaemia, and 9 weeks (range 1-199) for children with brain tumours (mean lag time was 3.8 [SD = 3.8] and 19.8 weeks [SD = 43.0], respectively). The mean number of visits to a general practitioner in the year prior to tumour diagnosis was 2.3 for the children with leukaemia and 1.5 for the children with brain tumour (visits leading to diagnosis were included), and 0.2 and 0.6, respectively, the year after diagnosis. In the control group, the mean number of visits to a general practitioner was 1.0 in both years.
Retrospective. Small sample, But primary care perspective.