E2F5 Status Significantly Improves Malignancy Diagnosis of Epithelial Ovarian Cancer
13
RESEARCH ARTICLE Open Access E2F5 status significantly improves malignancy diagnosis of epithelial ovarian cancer Narasimhan Kothandaraman 1† , Vladimir B Bajic 2*† , Pang NK Brendan 3 , Chan Y Huak 4 , Peh B Keow 3 , Khalil Razvi 5,6 , Manuel Salto-Tellez 3 , Mahesh Choolani 1*† Abstract Background: Ovarian epithelial cancer (OEC) usually presents in the later stages of the disease. Factors, especially those associated with cell-cycle genes, affecting the genesis and tumour progression for ovarian cancer are largely unknown. We hypothesized that over-expressed transcription factors (TFs), as well as those that are driving the expression of the OEC over-expressed genes, could be the key for OEC genesis and potentially useful tissue and serum markers for malignancy associated with OEC. Methods: Using a combination of computational (selection of candidate TF markers and malignancy prediction) and experimental approaches (tissue microarray and western blotting on patient samples) we identified and evaluated E2F5 transcription factor involved in cell proliferation, as a promising candidate regulatory target in early stage disease. Our hypothesis was supported by our tissue array experiments that showed E2F5 expression only in OEC samples but not in normal and benign tissues, and by significantly positively biased expression in serum samples done using western blotting studies. Results: Analysis of clinical cases shows that of the E2F5 status is characteristic for a different population group than one covered by CA125, a conventional OEC biomarker. E2F5 used in different combinations with CA125 for distinguishing malignant cyst from benign cyst shows that the presence of CA125 or E2F5 increases sensitivity of OEC detection to 97.9% (an increase from 87.5% if only CA125 is used) and, more importantly, the presence of both CA125 and E2F5 increases specificity of OEC to 72.5% (an increase from 55% if only CA125 is used). This significantly improved accuracy suggests possibility of an improved diagnostics of OEC. Furthermore, detection of malignancy status in 86 cases (38 benign, 48 early and late OEC) shows that the use of E2F5 status in combination with other clinical characteristics allows for an improved detection of malignant cases with sensitivity, specificity, F-measure and accuracy of 97.92%, 97.37%, 97.92% and 97.67%, respectively. Conclusions: Overall, our findings, in addition to opening a realistic possibility for improved OEC diagnosis, provide an indirect evidence that a cell-cycle regulatory protein E2F5 might play a significant role in OEC pathogenesis. Background Ovarian epithelial cancer (OEC) remains the most lethal gynecological malignancy in Western countries [1,2]. Poor prognosis is due to the late stage at first presenta- tion, and advances in surgery and chemotherapy have had small impact on survival. In contrast, patients who present with early-stage disease have a five-year survival of up to 95% after surgery alone, and may even be spared the toxic side effects of postoperative adjuvant chemotherapy [3]. Early detection of this lethal disease remains the most promising approach to improve the long-term survival and quality of life of patients with OEC [4]. Serum CA125 is a good tumor marker for monitoring patients with ovarian cancer after they have been appropriately treated, but is a poor biomarker for screening and detection of early OEC [5]. Screening strategies are being explored for the early detection of epithelial ovarian cancer, but these appear to still have limitations in their detection and high false positive * Correspondence: [email protected]; [email protected] † Contributed equally 1 Diagnostic Biomarker Discovery Laboratory, Department of Obstetrics and Gynaecology, Yong Loo Lin School of Medicine, National University Health System, 5 Lower Kent Ridge Road, 119074, Singapore 2 Computational Bioscience Research Center (CBRC), 4700 King Abdullah University of Science and Technology (KAUST), Thuwal 23955-6900, Kingdom of Saudi Arabia Kothandaraman et al. BMC Cancer 2010, 10:64 http://www.biomedcentral.com/1471-2407/10/64 © 2010 Kothandaraman et al; licensee BioMed Central Ltd. This is an Open Access article distributed under the terms of the Creative Commons Attribution License (http://creativecommons.org/licenses/by/2.0), which permits unrestricted use, distribution, and reproduction in any medium, provided the original work is properly cited.
Transcript of E2F5 Status Significantly Improves Malignancy Diagnosis of Epithelial Ovarian Cancer
RESEARCH ARTICLE Open Access
E2F5 status significantly improves malignancydiagnosis of epithelial ovarian cancerNarasimhan Kothandaraman1†, Vladimir B Bajic2*†, Pang NK Brendan3, Chan Y Huak4, Peh B Keow3, Khalil Razvi5,6,Manuel Salto-Tellez3, Mahesh Choolani1*†
Abstract
Background: Ovarian epithelial cancer (OEC) usually presents in the later stages of the disease. Factors, especiallythose associated with cell-cycle genes, affecting the genesis and tumour progression for ovarian cancer are largelyunknown. We hypothesized that over-expressed transcription factors (TFs), as well as those that are driving theexpression of the OEC over-expressed genes, could be the key for OEC genesis and potentially useful tissue andserum markers for malignancy associated with OEC.
Methods: Using a combination of computational (selection of candidate TF markers and malignancy prediction)and experimental approaches (tissue microarray and western blotting on patient samples) we identified andevaluated E2F5 transcription factor involved in cell proliferation, as a promising candidate regulatory target in earlystage disease. Our hypothesis was supported by our tissue array experiments that showed E2F5 expression only inOEC samples but not in normal and benign tissues, and by significantly positively biased expression in serumsamples done using western blotting studies.
Results: Analysis of clinical cases shows that of the E2F5 status is characteristic for a different population groupthan one covered by CA125, a conventional OEC biomarker. E2F5 used in different combinations with CA125 fordistinguishing malignant cyst from benign cyst shows that the presence of CA125 or E2F5 increases sensitivity ofOEC detection to 97.9% (an increase from 87.5% if only CA125 is used) and, more importantly, the presence ofboth CA125 and E2F5 increases specificity of OEC to 72.5% (an increase from 55% if only CA125 is used). Thissignificantly improved accuracy suggests possibility of an improved diagnostics of OEC. Furthermore, detection ofmalignancy status in 86 cases (38 benign, 48 early and late OEC) shows that the use of E2F5 status in combinationwith other clinical characteristics allows for an improved detection of malignant cases with sensitivity, specificity,F-measure and accuracy of 97.92%, 97.37%, 97.92% and 97.67%, respectively.
Conclusions: Overall, our findings, in addition to opening a realistic possibility for improved OEC diagnosis, provide anindirect evidence that a cell-cycle regulatory protein E2F5 might play a significant role in OEC pathogenesis.
BackgroundOvarian epithelial cancer (OEC) remains the most lethalgynecological malignancy in Western countries [1,2].Poor prognosis is due to the late stage at first presenta-tion, and advances in surgery and chemotherapy havehad small impact on survival. In contrast, patients who
present with early-stage disease have a five-year survivalof up to 95% after surgery alone, and may even bespared the toxic side effects of postoperative adjuvantchemotherapy [3]. Early detection of this lethal diseaseremains the most promising approach to improve thelong-term survival and quality of life of patients withOEC [4]. Serum CA125 is a good tumor marker formonitoring patients with ovarian cancer after they havebeen appropriately treated, but is a poor biomarker forscreening and detection of early OEC [5]. Screeningstrategies are being explored for the early detection ofepithelial ovarian cancer, but these appear to still havelimitations in their detection and high false positive
* Correspondence: [email protected]; [email protected]† Contributed equally1Diagnostic Biomarker Discovery Laboratory, Department of Obstetrics andGynaecology, Yong Loo Lin School of Medicine, National University HealthSystem, 5 Lower Kent Ridge Road, 119074, Singapore2Computational Bioscience Research Center (CBRC), 4700 King AbdullahUniversity of Science and Technology (KAUST), Thuwal 23955-6900, Kingdomof Saudi Arabia
Kothandaraman et al. BMC Cancer 2010, 10:64http://www.biomedcentral.com/1471-2407/10/64
© 2010 Kothandaraman et al; licensee BioMed Central Ltd. This is an Open Access article distributed under the terms of the CreativeCommons Attribution License (http://creativecommons.org/licenses/by/2.0), which permits unrestricted use, distribution, andreproduction in any medium, provided the original work is properly cited.

rates [6,7]. Although susceptibility genes, such asBRCA1 and BRCA2, have been identified, a majority ofovarian cancers occur sporadically without known riskfactors [8].Over the past few years several groups have reported
potential of gene expression profiling based on microar-rays to study the expression patterns of different genesduring onset of ovarian cancer [9,10]. Some of thesemarkers identified using this technique are: (1) prostasina serum marker for ovarian cancer [11]; (2) Mesothelin(MSLN) [12,13], (3) WFDC2 (HE4) a glycoprotein [14](4) osteopontin [15]; (5) Bikunin [16]; (6) mammaglo-bin-2 (MGB2) [17]; (7) discoidin domain receptor 1(DDR1) [18]; (8) claudin 3 (CLDN3) [18]; (9) epithelialcell adhesion molecule (Ep-CAM) [18]; and (10) E-cad-herin [18]. These markers were studied individually andnot examined as part of the whole process of oncogen-esis that would provide compelling evidence of theirrole in the disease process, and their utility as potentialOEC biomarkers.There is vast amount of gene expression profiling data
available in the public domain, as well as in various pri-vate databases for ovarian cancer [9]. More recently,focused efforts were made to exploit these vast valuableresources to identify potential markers for various can-cers [19,20]. These strategies save precious time andavoid unnecessary duplication of experiments and,moreover, can help focus on the most promisingexperiments.Cell-cycle genes and associated regulatory factors
which play a key role in cancers are a key target formost of biomarker discovery efforts [21-23]. Cell-cyclemachinery controls cell proliferation, and cancer is amanifestation of disrupted cell proliferation. Differentphases in cell-cycle (G1, G1-S, S, and G2-M), showactivities of several oncogenes and tumor suppressorgenes that display a range of abnormalities with poten-tial usefulness as markers of genesis and as prognosticmarkers for ovarian cancer [22]. Transcription factors(TFs) control the expression of various genes duringthese different phases of cell-cycle.Previous reports have focused mostly on secretory
proteins as markers of OEC. However, most of such
proteins were ineffective in diagnosing the disease early.More recently, the use of TFs as markers for the diseaseitself have been reported and they have been detected inthe blood [24-26]. In our study, the strategy was toinvestigate the regulatory mechanism of genes impli-cated by expression data as specific to OC and in thisway to identify the key TFs associated with this malig-nancy which could aid in discriminating malignant con-dition from benign and healthy conditions. Wehypothesized that over-expressed TFs, as well as thosethat are driving the expression of the OEC over-expressed genes, could be the key for OEC genesis andpotentially useful tissue and serum markers for malig-nancy associated with OEC. The identified TFs in thisstudy participate in a common control mechanism ofseveral key over-expressed genes, such as keratins whichare themselves involved in the cell structural integrity.The molecular processes during OEC might ultimatelyresult in the release of oncoproteins into blood stream,particularly if implicated TFs are involved in the regula-tion of genes responsible for structural properties ofextracellular matrix as are keratin encoding genes, or ifthey are themselves controlled in the similar fashion assuch genes. The results of our bioinformatics analysis todetermine relevant TFs guided by the gene expressionresults, is followed up by extensive experiments basedon clinically relevant cases and revealed among theidentified TFs, E2F5 that demonstrates a strong poten-tial to improve diagnostics of OEC.
MethodsPatient serum samplesA total of 88 women, aged between 20 and 72 years, 40benign, and 48 malignant cases (16 early, and 32 latecases) (Table 1) were recruited for open surgical orlaparoscopic treatment at the Department of Obstetricsand Gynecology, National University Hospital, Singa-pore), from 1998 to 2006. The histologic type of ovariancancer were classified as defined by International Fed-eration of Gynecology and Obstetrics [27] staging [27][FIGO Cancer Committee (1986).]. A total of 56 normalvolunteers were recruited as controls that were diag-nosed to have no cyst or any other type of malignancy.
Table 1 Clinical characteristics and age distribution of study samples (serum samples) used for E2F5 and CA125expression studies.
Number of cases Age Cancer subtypes
Serouscarcinoma
Mucinouscarcinoma
Endometroidcarcinoma
Clear cellcarcinoma
Others*
Normal 56 45.00 ± 15.00
Benign 40 42.80 ± 16.65 5 11 14 0 10
Stage I/II 16 50.94 ± 12.16 2 4 6 3 1
Stage III/IV 32 52.32 ± 10.11 19 1 9 3 0
Kothandaraman et al. BMC Cancer 2010, 10:64http://www.biomedcentral.com/1471-2407/10/64
Page 2 of 13
Venous blood from case and control groups (normalvolunteers) were collected in 8-ml Vacuette serum tubescontaining clot activating factor (Greiner Bio-One,Kremsmuenster, Austria). Tissue samples from cysts ofovarian carcinomas and benign ovarian cysts were col-lected during surgery without intraoperative spillage,and the histology confirmed by a pathologist. All sam-ples were transported on ice to the laboratory, centri-fuged immediately at 4°C for 10 minutes at 1500 g, andstored at -80°C until analysis. All samples were collectedwith informed consent process which was cleared by theEthical approval from the National Healthcare GroupDomain Specific Review Board (DSRB, Singapore).Computational selection of candidate TFs markersWe examined a representative set of OEC microarrayexpression data [28], which implicates 19 genes thatwere at least 5-fold over-expressed. Among these 19genes, several were encoding for TFs and three geneswere from the keratin group. Since keratins areinvolved in the cell integrity, we were interested tofind if the over-expressed TF encoding genes are sub-jected to the same control mechanism as keratins or ifthe corresponding TFs are involved in the control ofkeratin genes. This would suggest a possibility that anover-expressed TF encoding genes may result in over-production of the corresponding TFs that may leak outof cell in case of cell damage, making them available inbody fluids, such as blood. Through analysis of promo-ter content of these 19 genes, we found genes thatshare a common promoter model and thus share com-mon promoter elements (PEs). By a PE we consider aTF binding site (TFBS) and the DNA strand whereTFBS is found. For example, in our notation “AREB6/-1” represents a PE that involves AREB6 binding sitefound on the reverse complement DNA strand. Tran-scription start sites (TSSs) of the analyzed promoterswere determined using the same procedure asdescribed by [29]. The procedure resulted in 10,255highly accurate human promoters and we considered aregion of [-800, +200] relative to the experimentallyconfirmed TSSs. Promoters’ genomic sequences wereextracted from the human genome release hg17 fromhttp://hgdownload.cse.ucsc.edu/downloads.html#hu-man. We used all available mammalian matrix modelsfor TFBSs contained in TRANSFAC Professional data-base ver. 7.4, and mapped them to the promotersequences. The minSUM profiles were used for thresh-old of the matrix models since these are based on theoptimization that provides the minimum sum of falsepositive and false negative predictions of putativeTFBSs. We compared promoter content of 19 overex-pressed genes against the remaining human promoters,and calculated the overrepresentation index (ORI)
based on the method introduced by [29,30]. Themethod has been successfully applied in several studies[29,31] and others. All TFBSs mapped to promoterswere ranked according to decreasing ORI values. Weanalyzed content of promoters of 19 over-expressedgenes based on mapped TFBSs that had ORI not lessthan 1.5. Based on that analysis we found the promotermodel characteristic of the keratin gene group andrespective PEs. The promoter model was characterizedby the presence of AREB6/-1 PE, and one or more ofthe following three PEs: GBF/-1, Kr/+1 and XPF-1/-1.Additional six genes (E2F5, PAX8, ELF3, WFDC2(HE4), MUC1, LCN2) from the 19 analyzed shared thispromoter model, while the other 10 were void of suchcombinations. Thus, three genes encoding for TFs,E2F5, PAX8 and ELF3 were subjected to the sameputative control model and also were found over-expressed in OEC. Consequently, we found four candi-date TFs (AREB6, E2F5, PAX8, ELF3) that have apotential to play a role in OEC. More details on themodalities followed for analyzing over expressed genesin ovarian cancer and potential utility of transcriptionfactors as therapeutic application is described in Addi-tional file 1.Malignancy predictionWe analyzed how well malignant cases can be predictedusing Risk Malignancy Index (RMI), other clinical indi-cators and E2F5 status. In total, we considered 38benign cases, and 48 malignant cases (16 early and 32late). We had 13 features associated with each of thecases. The thirteen features we used include (1) age (2)stage of ovarian cancer at the time of detection (3)serum CA125 levels (4) size(cm) (5) ascites (6) metas-tases (7) presence of multilocular cyst (8) solid area (9)bilateral (10) ultrasound score (11) menopause score(12) RMI and (13) E2F5 status. Due to relatively smallnumber of cases we first generated a set of 602 artificialcases based on the set of 86 benign and malignant ones,using the so-called The Synthetic Minority Oversam-pling Technique (SMOTE) algorithm [32]. We thenapplied the Kstar algorithm [33] to train the machinelearning system to distinguish between malignant andbenign cases using the artificial set of 602 cases. Thenwe applied the trained system to the original 86 cases.We conducted three experiments. In the first one weused all 13 features. In the second one we excludedfrom the original 13 features CA125 information. In thethird one we excluded from the original 13 features theE2F5 status.The classification performance was expressed using
the accuracy and F-measure (for other measures of pre-diction quality see [34]). In what follows tp, tn, fp, fnstand for true positive, true negative, false positive, and
Kothandaraman et al. BMC Cancer 2010, 10:64http://www.biomedcentral.com/1471-2407/10/64
Page 3 of 13
false negative predictions, respectively. Accuracy isdefined as:
Accuracy tp tn tp tn fp tn= + + +* / ( ),
while F-measure is defined as
F-measure sensitivity ppv sensitivity ppv= +2* * / (( ),
where sensitivity and ppv (positive predictive value)are
sensitivity tp tp fn= +/ ( ),
ppv tp tp fp= +/ ( ).
Tissue microarray studies (TMA) studiesA total of 135 formalin-fixed, paraffin-embedded ovariantissue samples (111 (43 + 68) benign and malignanttumors and 24 normal) from the National University Hos-pital of Singapore were arrayed as previously described[35]. These cases represented a cross-section of normal/physiological ovarian tissue-types, benign neoplasms andovarian malignancies (see Table 2 for details). Briefly,hematoxylin and eosin-stained sections were reviewed toannotate representative tumor and normal areas. Thesewere sampled with a 1.0-mm diameter tissue cylinder fornormals and benign tumors and a 2.0-mm diameter tissuecylinder for borderline and malignant tumors and depos-ited into a “recipient” block using a tissue arraying instru-ment (ATA100, CHEMICON International Inc,
Temecula, CA). Of the 68 malignant tumours, 7 seroustumours, 4 endometroid tumours, 2 clear cell tumours, 2high grade adenocarcinomas not further characterized and3 mixed epithelial tumours were arrayed in doublepunches due to bilateral ovarian involvement and toaccount for tumour heterogeneity. After TMA construc-tion, 4-μm sections were prepared for hematoxylin andeosin staining verification of the accuracy of the TMAconstruction, and for E2F5 antibody analysis. Thisapproach, in our hands, ensures a reliable representationof the biology of the tumour, when compared with fullsection analysis, and has been tested before in the confir-mation of other novel biomarkers [36]. Immunohisto-chemistry was performed using the polyclonal antibody tothe E2F5 transcription factor (ACRIS Antibodies GmbH,Germany), optimized in our laboratory for immunohisto-chemistry on full sections and TMA slides of formalinfixed, paraffin embedded tissues with a protocol thatincludes microwaving for heat induced epitope retrieval inDAKO Target Retrieval Solution at pH9 for 20 minutes.Our positive control cases used for the optimization of theantibody, comprising normal epidermis, showed expectedstaining for E2F5 in the basal and granular layers [37].Our negative control was a sample from normal ovary.Not only was the sample negative throughout, there wasalso no background staining. The expression of E2F5 anti-body was found to be cytoplasmic. While the expressionfor the antibody was not very strong, there was indeed asignificant difference from normal and benign ovarian tis-sue. The results were independently scored by an experi-enced observer (BP) and confirmed by a second one(MST). The scoring system suggested a positive result if
Table 2 Summary of Immunohistochemistry results for E2F5 antibody tested on OEC
Type of tissue Number of cases Number positive Percentage positive
Fimbrial/Paratubal/Paraovarian cyst 6 0 0
Surface epithelium/inclusion cysts 14 0 0
Endometriotic cyst 4 0 0
Serous cystadenoma 8 0 0
Mucinous cystadenoma 5 0 0
Benign stromal tumour 4 0 0
Dermoid tumour (mature) 12 0 0
Total 67 0 0
Early and late malignant cases
Serous borderline and malignant E6; L8 24 (4+20) 11(2+9) 45.8
Mucinous borderline and malignant E11; L1 13 (6+7) 4(1+3) 30.77
Endometroid borderline and malignant E7; L5 16 (2+14) 8(1+7) 50
Clear cell carcinoma E2; L1 4 0 0
Adenocarcinoma (not further specified) E2; L2 4 2 50
Mixed adenocarcinoma E3; L1 7 6 85.7
Total 68 31 45.6
Note: Stage I/II (E); Stage III/IV (L) and data not available 5
Kothandaraman et al. BMC Cancer 2010, 10:64http://www.biomedcentral.com/1471-2407/10/64
Page 4 of 13
there was any detectable cytoplasmic staining in thelesional cells of interest as can be seen from representativephotomicrographs. The concordance between the twoindependent observers was 100%, highlighting the robust-ness of the analysis.Measurement of CA-125 level in serum and cyst fluid usingsandwich ELISA methodThe CA-125 levels were determined using a CA-125ELISA kit (Alpha Diagnostic International, San Antonio,Texas, USA). The samples were diluted ten times usingwash buffer and 25 μl of standards, control, and sampleswere pipetted into a 96-well plate in duplicate. Next,100 μl of biotinylated anti-CA-125 capture antibody wasloaded and the plate was incubated for 2 hours at roomtemperature. After washing, 100 μl of HRP conjugatedanti-CA-125 antibody was added and the plate wasincubated for 1 hour at room temperature followed byaddition of substrate and the stop solution. The absor-bance was read at 450 nm using the ELISA reader(Tecan, Seestrasse, Männedorf, Switzerland).Western blottingOnce blood was collected it was allowed to clot. After cen-trifugation, the supernatant was collected and protein con-tent was evaluated by the Bradford assay. To performWestern blot analysis for AREB6, ELF3, PAX8 and E2F5,20 μg of protein from each sample was separated using10% sodium dodecyl sulfate-polyacrylamide gel electro-phoresis. Following electrophoresis proteins bands weretransferred onto nitrocellulose membranes (Hybond-CExtra) (Amersham Biosciences UK Limited Buckingham-shire, UK). Filters were blocked in TBST containing 5%dried skimmed milk and 0.05% Tween-20 for 1 hr at roomtemperature. Thereafter, the filters were incubated overnight at 4°C with primary antibodies diluted in TBST con-taining 5% skimmed milk and 0.05% Tween-20. Primaryantibodies directed against the AREB6 (AVIVA SystemsBiology, San Diego, California, USA), E2F5 (Acris GmbH,Hiddenhausen, Germany), PAX8 (Abcam Limited, Cam-bridge, UK), and ELF3 (Orbigen Inc, San Diego, CA) werechosen as the four TFs suggested by the bioinformaticsanalysis. Filters were washed 3 times 10 minutes each withTBST (0.05% Tween-20). They were subsequently incu-bated with HRP conjugated secondary antibody diluted1:5000 in TBST containing 5% dried skimmed milk and0.05% Tween-20 for 45 minutes at room temperature.Immunoreactivity was detected using the SuperSignalWest Pico Chemiluminescent Substrate (Pierce biotech-nology Inc, Rockford, USA) and once blotted the mem-branes were exposed to Pierce CLXPosure Film (Piercebiotechnology Inc, Rockford, USA).
Statistical AnalysisThe usefulness of E2F5, CA125, and their combinationsas diagnostic markers to differentiate normal cases,
benign, early and late malignant tumors were assessedusing ROC analysis with sensitivity, specificity, positive& negative predictive values (PPV & NPV) presented.Analyses were performed using SPSS 15.0 (SPSS Inc.,Wacker Drive, Chicago, Illinois) with statistical signifi-cance set at p < 0.05.
ResultsBioinformatics analysisWe identified TF encoding genes that were putativelycontrolled by PEs common to the keratin group (KRT8,KRT13, KRT18) (Figure 1), and are also previouslyreported to be at least 5-fold over-expressed in earlyand late stage ovarian cancer. Analysis suggests thatthese three keratin genes are controlled by AREB6/-1,and at least one of GBF/-1, Kr/+1, or XPG-11/-1 PEs.This keratin ‘promoter model’ is also shared with thethree TF encoding genes (E2F5, PAX8, ELF3) and theother three genes (from the group of 19 analyzed).These other three genes are MUC1 (GeneID 4582, cellsurface mucin glycoprotein, epithelial membrane anti-gen) which is elevated in the serum of patients withbreast cancer [38]; WFDC6 (HE4) (GeneID 140870) asmall serine proteinase inhibitor [39] that is part of afamily thought to be a potential OEC marker [40] andLCN2 (GeneID 3934, lipocalin 2, oncogene 24p3) whichhas been shown to be an epithelial inducer in Ras malig-nancy and a suppressor of metastasis [41]. The outcomeof our analysis suggested four TFs as potential diagnos-tic markers for OEC: E2F5, PAX8, ELF3 and AREB6.The logic of selecting these four TFs is as follows. Kera-tins are proteins involved in cellular integrity. Theirabnormal expression may cause cell brake, thus allowingcell content to leak out and enter into body fluids[42-44]. Consequently, over-expressed TF encodinggenes could result in overexpressed TFs that could thusenter blood and may be detectable there. This suggeststhat E2F5, PAX8 and ELF3 are candidates for this typeof test as they are likely to be controlled in a similarfashion as the three keratin genes we considered and arealso highly co-expressing with them in OEC conditions.AREB6 is the compulsory component of our putative‘keratin promoter model’. Although not over-expressedin OEC it could be the trigger of over-expression of ker-atins and the implicated three TFs. Thus we included itin our test list of potential markers.
Tissue array studiesIHC on ovarian TMA constructs of normal ovarianepithelium, benign ovarian cysts, and early and lateOECs showed that E2F5 expression was completelyabsent in all normal and benign samples tested (Figure2; Table 2). Most of the E2F5 activity was localized inthe cytoplasm with occasional nuclear membrane
Kothandaraman et al. BMC Cancer 2010, 10:64http://www.biomedcentral.com/1471-2407/10/64
Page 5 of 13

accentuation (See figure 2). In approximately half of allepithelial ovarian borderline and malignant tumours,which included serous, mucinous, endometroid andother subtypes, E2F5 expression was demonstrable byIHC, compared with none of the normal and benigncases (z = 6.1; p < 0.001; n = 135) (Table 2). The follow-ing expression pattern was observed for the differentclasses of OEC used for the current study (Table 2); Ser-ous borderline and malignancy (11/24), Mucinous bor-derline and malignancy (4/13), Endometroid borderlineand malignancy (8/16), Clear cell carcinoma (0/4); Ade-nocarcinoma NOS (2/4); and Mixed adenocarcinoma (6/7). Relatively high expression of E2F5 was found inendometroid and serous carcinoma than in other typesof OEC. There was no difference in the IHC expressionpattern observed between the right and left ovarieswhere tumour was bilateral.
Detection of candidate proteins in serum usingwestern blotPotential markers identified though bioinformaticapproach were validated using western blotting approach.
Transcription factors AREB6, PAX8, and ELF3 (Figure3A) showed inconsistent patterns of expression when thestudy was carried on a limited number of samples. ForTF AREB6, expression was found only in one malignantsample, while for PAX8 and ELF3 the expression patternwas present in normal and cancer samples. E2F5 expres-sion was found to be prominent in cancer samples (earlyand late malignant cases) and not in normal serum sam-ples. Hence, we carried out a comprehensive testing forE2F5 expression pattern on a total of 144 samples com-prising of 56 normal; 40 benign, 16 early, and 32 latecases (Figure 3B). E2F5 expression (Table 3) was foundin 23.21% (13 out of 56) healthy volunteers, but was pre-sent in 81.25% (39 out of 48: 16 early and 32 late cases; n= 48) of OEC patient serum. There was only 42.5% (17/40) expression of E2F5 in benign cases. Our data suggestthat E2F5 could prove a highly discriminatory marker fordetection of OEC, and in particular early OEC. Amongthe different subtypes of OEC, different expression pat-tern was observed between early and late types. In theearly stage carcinoma, stage I/II endometroid (5/6); ser-ous carcinoma (1/2); mucinous carcinoma (4/4); clear
Figure 1 Genes putatively controlled by tentative promoter model of keratin group. Summary of the main finding in analysis of 19 genesover-expressed in ovarian cancer.
Kothandaraman et al. BMC Cancer 2010, 10:64http://www.biomedcentral.com/1471-2407/10/64
Page 6 of 13

Figure 2 Differential expression pattern of E2F5 in ovarian tumour specimens examined by immunohistochemistry. A, benign serouscystadenoma, B, epithelial inclusion cyst, C, cystic serous carcinoma, and D, endometrioid adenocarcinoma samples. The low powerphotomicrograph in each section shows the full tissue microarray “punch” (x100), while the high power photomicrograph shows detail of theantibody expression (x600). There is no E2F5 expression in normal and benign tissue (A, B), but significant expression in ovarian epithelial cancer(C, D).
Kothandaraman et al. BMC Cancer 2010, 10:64http://www.biomedcentral.com/1471-2407/10/64
Page 7 of 13
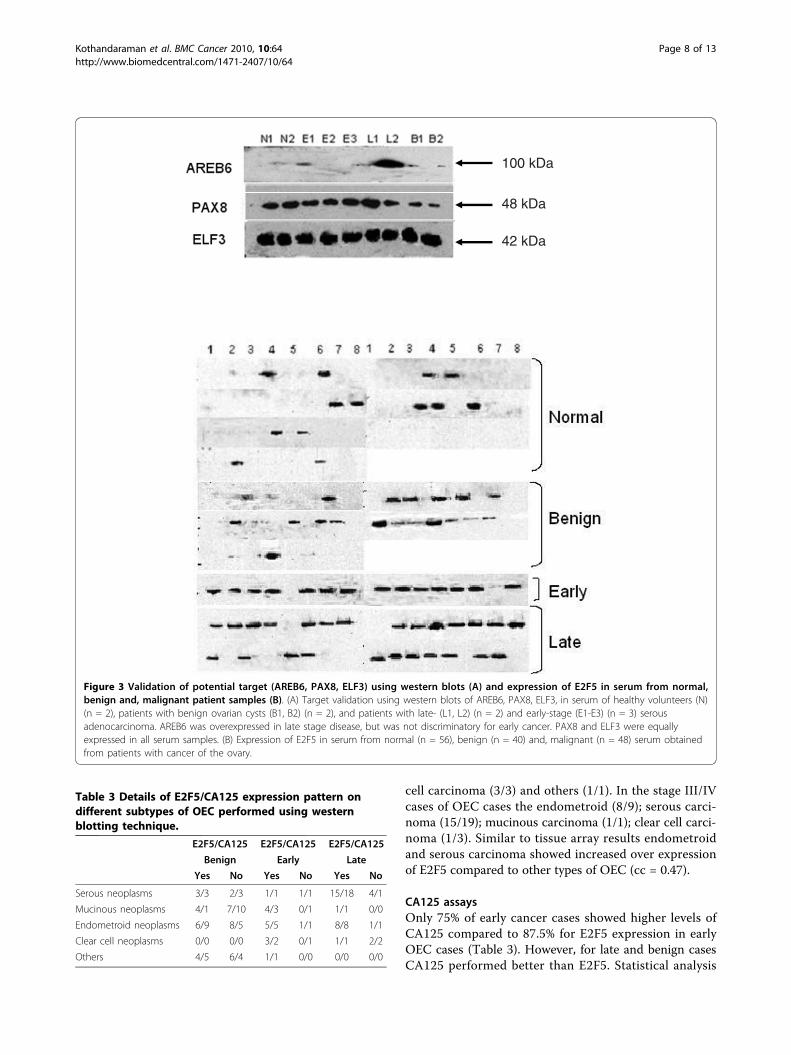
cell carcinoma (3/3) and others (1/1). In the stage III/IVcases of OEC cases the endometroid (8/9); serous carci-noma (15/19); mucinous carcinoma (1/1); clear cell carci-noma (1/3). Similar to tissue array results endometroidand serous carcinoma showed increased over expressionof E2F5 compared to other types of OEC (cc = 0.47).
CA125 assaysOnly 75% of early cancer cases showed higher levels ofCA125 compared to 87.5% for E2F5 expression in earlyOEC cases (Table 3). However, for late and benign casesCA125 performed better than E2F5. Statistical analysis
100 kDa
48 kDa
42 kDa
Figure 3 Validation of potential target (AREB6, PAX8, ELF3) using western blots (A) and expression of E2F5 in serum from normal,benign and, malignant patient samples (B). (A) Target validation using western blots of AREB6, PAX8, ELF3, in serum of healthy volunteers (N)(n = 2), patients with benign ovarian cysts (B1, B2) (n = 2), and patients with late- (L1, L2) (n = 2) and early-stage (E1-E3) (n = 3) serousadenocarcinoma. AREB6 was overexpressed in late stage disease, but was not discriminatory for early cancer. PAX8 and ELF3 were equallyexpressed in all serum samples. (B) Expression of E2F5 in serum from normal (n = 56), benign (n = 40) and, malignant (n = 48) serum obtainedfrom patients with cancer of the ovary.
Table 3 Details of E2F5/CA125 expression pattern ondifferent subtypes of OEC performed using westernblotting technique.
E2F5/CA125 E2F5/CA125 E2F5/CA125
Benign Early Late
Yes No Yes No Yes No
Serous neoplasms 3/3 2/3 1/1 1/1 15/18 4/1
Mucinous neoplasms 4/1 7/10 4/3 0/1 1/1 0/0
Endometroid neoplasms 6/9 8/5 5/5 1/1 8/8 1/1
Clear cell neoplasms 0/0 0/0 3/2 0/1 1/1 2/2
Others 4/5 6/4 1/1 0/0 0/0 0/0
Kothandaraman et al. BMC Cancer 2010, 10:64http://www.biomedcentral.com/1471-2407/10/64
Page 8 of 13
showed no correlation between CA125 and E2F5expression pattern (between different subtypes andbetween early and late in E2F5 and CA125).
Statistical inference on CA125 and E2F5 expression innormal and malignant casesUsing data from 144 samples we checked the expres-sion for both E2F5 and CA125 on serum from normalcondition, benign cyst, malignant cyst (early and lateconditions). We evaluated E2F5 either alone or incombination with CA125 for their efficacy in monitor-ing the malignancy status for OEC. We looked at thefollowing conditions for their efficacy in diagnosingOEC and for accessing the sensitivity as well as specifi-city in diagnosing the malignancy associated with ovar-ian cancer: (1) CA125 used alone; (2) E2F5 used alone;(3) both E2F5 and CA125 negative; (4) at least onepositive for either CA125 or E2F5; (5) at least onenegative for either CA125 or E2F5; and (6) both posi-tive for CA125 and E2F5,. A unique trend in the pat-tern of expression was observed for E2F5 along withCA125. Presence of CA125 or E2F5 in sera resulted inthe increase in sensitivity, while a test positive for bothCA125 and E2F5 led to a major increase in the specifi-city, PPV and NPV. This demonstrates that E2F5 ischaracteristic for a different subclass of individualscompared to CA125 which justifies utilization of E2F5jointly with CA125.From a clinical stand point, the key issue is to know
the malignancy status of a cyst following a positiveultrasound scan for a cyst. To answer the question, afteridentification of a cyst using ultrasound, we used a com-bination of CA125 and E2F5. If both were absent, itcould be considered as non-cancer case with 93.75%NPV, while the presence of either CA125 or E2F5 iscapable of detecting OEC in 97.92% of the actual cancercases (sensitivity). The presence of both CA125 andE2F5 makes the specificity as high as 72.50% as com-pared to CA125 alone (55%), E2F5 alone (55%) or“CA125 or E2F5” (37.5%). However, more samples haveto be tested to assess real clinical utility of E2F5 as abiomarker for OEC.The mixture of samples obtained from different ethnic
populations prompted us to look into the association ofrace with the incidence of disease. The study showedthat race did not have a role in the incidence of diseasewhile considering expression pattern of both E2F5 andCA125. Similarly, while taking into account the age >40,as well as factors such as ethnicity and age >40, wasalso found to have no correlation with the occurrence ofthe disease. Our retrospective analysis therefore providesevidence that E2F5 could also be a useful independentprognostic indicator in patients with OEC as it targetsdifferent phenotypes compared to CA125. Moreover, the
combined use of E2F5 and CA125 increases accuracy ofOEC diagnosis significantly. Overall, our data suggestthat presence of E2F5 in preoperative sera is associatedwith better survival outcome. More studies are, however,warranted to confirm these findings.
Malignancy predictionUsing 38 benign and 48 malignant cases, we generatedan additional artificial set of 602 cases using SMOTEalgorithm. We trained the Kstar classification model onthis artificial data set of 602 cases and then applied sotrained model to the original 86 cases (48 malignantand 38 benign). The goal is to identify malignant cases.Our method was able to predict 47 out of 48 malignantcases as malignant, and had one benign case predictedwrongly as being malignant. This produced sensitivity of97.92% (47/48), ppv of 97.92%, and specificity of 97.37%(37/38) (Table 4). At the same time, RMI > 200 criter-ion produces sensitivity of 77.08% (37/48) and specificityof 92.11% (35/38) (Table 5). Consequently, the F-measure and accuracy of the new method for assessingmalignancy is increased from 84.08% and 83.72% basedon RMI > 200 criterion up to 97.92% and 97.67%,respectively. Moreover, there is an increase of 20.84% ofabsolute scale in sensitivity with the new method, whilesimultaneously it increased specificity by 5.56% of abso-lute scale. Overall, this is a significant increase in accu-racy. We evaluated the contribution of both CA125biomarker and E2F5 status to the accuracy of separationof malignant from benign cases (Table 5). For that, wefirst excluded information about CA125 from the set of13 features we considered. The sensitivity remained thesame as with the all 13 features, but specificity wasreduced to 94.74%. In another experiment we excludedfrom the original 13 features the E2F5 status. The sensi-tivity remained the same as when the original 13 featureare used, but specificity reduced to 92.11%. Thus, theaddition of E2F5 to the set of features that we usedreduces the false positive cases 3-fold (from 7.89% to2.63%). These results demonstrated that only by the useof both CA125 and E2F5 information in combinationwith the other clinical features, one achieves the bestclassification performance. Thus the information aboutE2F5 status has proved to be beneficial for predictingmalignancy.
Table 4 Malignancy prediction using Kstar classificationas well as using RMI index for ovarian cancer.
Kstar classification(Our method)
RMI > 200criterion
Sensitivity 97.92% (47/48) 77.08%(37/48)
Specificity 97.37% (37/38) 92.11%(35/38)
PPV 97.92% 92.5%
Kothandaraman et al. BMC Cancer 2010, 10:64http://www.biomedcentral.com/1471-2407/10/64
Page 9 of 13
DiscussionThere is increasing evidence on the role of TFs as mar-kers for cancer [24-26], as potential prognostic markers[45], and as targets for drug therapy [46]. Our assump-tion was that regulatory genes that are differentiallyover-expressed during the development and progressionof OEC are likely to alter simultaneously the expressionof many genes in the considered disease state, and thatupregulation of gene clusters and an abnormal elevatedexpression of several unrelated genes could be explainedif they shared similar promoter model, thus beingpotentially subjected to the similar regulatory mechan-ism. If the identified TFs are to have any utility as clini-cal markers, the ability to differentiate healthy controlsand patients with benign conditions from patients withearly-stage disease (as opposed to advanced-stage dis-ease) is essential.Regarding E2F5 we have unambiguously shown that it
is characteristic for a group of patients different fromthose that have elevated CA125. This means that casesthat will slip through CA125 test could be captured byE2F5 status. Second, we did show that E2F5 status hasbeen remarkably specific and indicative on the tissuearray tests. Thirdly, using E2F5 status in addition ofother clinical indicators, enabled us to obtain extremelyhigh accuracy in separation of malignant from benigncases that was not possible without E2F5.Given the higher E2F5 levels in malignant tissues,
approximately half of all malignant tissues showedexpression for E2F5 while none of the normal andbenign samples showed expression for E2F5. E2F5belongs to the family of E2F TFs which are both prolif-eration promoting and proliferation inhibiting TFs, andE2F5 falls in the later category [47]. It is likely that ele-vated E2F5 levels might be attributed to its increasedproduction during cancer as a means by the body toarrest the proliferation of tumour cells during the earlystage of the disease. Our study on E2F5 in tissues andserum establishes the importance of E2F5 (a prolifera-tion inhibiting gene), [48] as a potential marker for earlyOEC. Other studies also showed similar observations forthis protein. E2F5 was found to be upregulated (5 fold)in early and late stage ovarian tumours [28]. Also, stu-dies conducted using custom made microarray specificfor OEC (Ovachip) showed upregulation of E2F5 inOEC [49], and it is found to play a key role in the neo-plastic transformation of various cancer tissues as
identified using microarray analysis [19]. Similar obser-vations were recently highlighted by microarray experi-ments conducted on sporadic colorectal carcinomatissues showed upregulation of E2F5 genes duringmalignancy [50,51]. The oncogenic property of E2F5was discovered by the amplified E2F5 expression in pri-mary rodent cells as well as in breast cancer tumours[52]. While in other cancers, a high molecular weightE2F complex is detected within human colon carcinomacells when the cell-cycle is disrupted [53]. It was foundthat interferon-gamma treatment for ovarian cancercaused a reduction of the proliferation-promoting TFsE2F1 and E2F2, at the same time it also increased theinhibiting TFs E2F4 and E2F5[54]. This observationhighlights the significance of E2F cross-talk in the anti-proliferative function of interferon-gamma [54].E2F class of cell-cycle genes happen to be the key
transcription factors involved in the transition from Gto G1 phase have been recently the focus of attentionfor gynecological cancers [55]. E2F genes are a family ofgenes comprising 8 different genes identified till to-date[48]. G1-S-phase transition in normal cells requiresphosphorylation of the retinoblastoma protein pRb andthe related proteins pRb2/p130 and p107 by CDKs. Thisprocess results in the release of E2F transcription factorscontrolling various genes required for DNA synthesisand cell-cycle control. Role of cell-cycle genes [22] andimbalance in the regulation of genes promoting andinhibiting cellular proliferation and apoptosis has beenimplicated in the oncogenesis of OEC [56]. Alteration ingenetic control in cancers is usually attributed to basepair mutations, but may also occur due to TF deregula-tion [55]. Deregulation of both proliferation-promotingand proliferation-inhibiting E2F TFs and their cross-talkwere reported to influence the clinical outcome [55].DNA amplifications for E2F5 (8p22-q21.3) has beenobserved during sporadic colorectal cancers [51]. Theabove evidence suggests that E2F5 is similar to MYC-type cooperating oncogene and persistent unregulatedexpression of E2F5 can assist other oncogenes to pro-mote cell transformation. Along with chromosomalamplifications and overexpression of the E2F5 gene asdetected in breast tumors suggests that E2F5 deregula-tion may have a role in human tumor development [52].TFs have been described as markers for cancer as well
as markers for prognostication [26,45,46]. TF Ets-1 hasbeen found to have significant prognostic value for
Table 5 Diagnostic accuracy developed for ovarian cancer detection with 13 features using Kstar classification basedon SMOTE algorithms.
With 13 features CA125 excluded from 13 features E2F5 excluded from 13 features RMI > 200
Sensitivity 97.92% 97.92% 97.92% 77.08%
Specificity 97.67% 94.74% 92.11% 92.11%
Kothandaraman et al. BMC Cancer 2010, 10:64http://www.biomedcentral.com/1471-2407/10/64
Page 10 of 13
relapse-free survival as an independent predictor of poorprognosis in breast cancer. This observation correlatesto its role in transcriptional regulation of factorsinvolved in angiogenesis such as VEGF and extracellularmatrix remodeling (PAI-1) [57]. Another TF, thyroidtranscription factor 1 (TTF-1) has been found as a goodprognostic factor for survival in non-small-cell lung can-cer (NSCLC). Its effect appears also significant when theanalysis is restricted to patients with adenocarcinoma[45]. Similarly microphthalmia TF has been reported asa marker for circulating tumor cell detection in blood ofmelanoma patients [26].One can raise a question why it should be possible to
look for TF in sera as biomarkers of ovarian cancer.Our methodology has been to look for those TFs thatpotentially affect genes producing proteins that influenceextracellular matrix, or to those TFs that are both co-regulated and co-expressed with such genes. In our casewe focused on keratins. We hypothesize that interplayof extracellular matrix and cancerous cells makes themmore prone to braking so that cancer cell content leaksout and enters lymph and blood systems[42]. For thisreason we expect to be able to find E2F5 in serum ofpatients with early and late stage OEC and our experi-mental results suggest that this may be the case.Finally, one may argue that it was not necessary to do
any bioinformatic analysis of gene expression data anddirectly test all over-expressed TFs. It is true that it waspossible to make such tests directly, but our analysisenabled us focus on specific TFs, and also has provided apotential explanation for the co-expression of E2F5 andkeratin genes in OEC based on the putative co-regulationmechanism suggested by our derived promoter model.
ConclusionOur findings provide additional support for the involve-ment of the E2F5 gene which belongs to the E2F familyof genes in human OEC development and progression.While additional larger prospective studies are essentialto validate our findings, we have demonstrated that theapplication of microarray analysis can facilitate the iden-tification of genes, genetic pathways, and proteins thatare not only involved in the pathogenesis of OEC butalso may represent potential serum markers.
Additional file 1: Details of the modalities followed for analyzingover expressed genes in ovarian cancer. (1) the details of themodalities performed for analyzing overexpressed genes in ovariancancer (2) information on transcription factors AREB6 and PAX8 (3) adescription on the potential utility of transcription factors in therapeuticapplications and (4) relevant references for this section.Click here for file[ http://www.biomedcentral.com/content/supplementary/1471-2407-10-64-S1.PDF ]
AbbreviationsCA125: Cancer antigen 125; OEC: Ovarian Epithelial Cancer; FIGO;International Federation of Gynecology and Obstetrics; ORI: OverRepresentation Index; PE: Promoter Element; PPV: Positive Predictive Value;NPV: Negative Predictive Value; SMOTE: Synthetic Minority OversamplingTechnique; TMA: Tissue Microarray; IHC: Immunohistochemistry; TF:Transcription Factor; TFBS: Transcription Factor Binding Site; TSS:Transcription Start Site
AcknowledgementsWe would like to thank the National Medical Research Council (NMRC),Singapore (Grant number: R173-000-071-213) and the Singapore CancerSyndicate, Agency for Science, Technology and Research, Singapore (GrantNumber MN-05) for providing funds to carry out this project.
Author details1Diagnostic Biomarker Discovery Laboratory, Department of Obstetrics andGynaecology, Yong Loo Lin School of Medicine, National University HealthSystem, 5 Lower Kent Ridge Road, 119074, Singapore. 2ComputationalBioscience Research Center (CBRC), 4700 King Abdullah University of Scienceand Technology (KAUST), Thuwal 23955-6900, Kingdom of Saudi Arabia.3Department of Pathology, National University Health System, Yong Loo LinSchool of Medicine, 119074, Singapore. 4National University MedicalInstitutes, Yong Loo Lin School of Medicine, National University HealthSystem, 119074 Singapore. 5Southend Hospital NHS Trust, Westcliff-on-Sea,Essex, UK. 6 Basildon & Thurrock University Hospital NHS, Foundation Trust,Basildon, Essex, UK.
Authors’ contributionsAuthor 1 (NK), Author 2 (VBB), and Author 6 (MC), were involved in theconcept, design and writing of the manuscript. Bioinformatics analysis andstatistical analysis were carried out by Author 2 (VBB) and Author 4 (CYH).Author 6 (KR) was involved with sample procurement. Author 1 (NK), Author3 (PNKB), Author 4 (PBK), and Author 5 (MST) carried out the validationstudies including tissue microarray and western blotting studies. All authorsread and approved the final manuscript.
Competing interestsThe authors declare that they have no competing interests.
Received: 21 July 2009Accepted: 24 February 2010 Published: 24 February 2010
References1. Bristow RE, Berek JS: Surgery for ovarian cancer: how to improve survival.
Lancet 2006, 367(9522):1558-1560.2. Jemal A, Siegel R, Ward E, Hao Y, Xu J, Murray T, Thun MJ: Cancer statistics,
2008. CA Cancer J Clin 2008, 58(2):71-96.3. Holschneider CH, Berek JS: Ovarian cancer: epidemiology, biology, and
prognostic factors. Semin Surg Oncol 2000, 19(1):3-10.4. Kristensen GB, Trope C: Epithelial ovarian carcinoma. Lancet 1997,
349(9045):113-117.5. Bast RC Jr, Xu FJ, Yu YH, Barnhill S, Zhang Z, Mills GB: CA 125: the past and
the future. Int J Biol Markers 1998, 13(4):179-187.6. Partridge E, Kreimer AR, Greenlee RT, Williams C, Xu JL, Church TR, Kessel B,
Johnson CC, Weissfeld JL, Isaacs C, et al: Results from four rounds ofovarian cancer screening in a randomized trial. Obstet Gynecol 2009,113(4):775-782.
7. Menon U, Gentry-Maharaj A, Hallett R, Ryan A, Burnell M, Sharma A, Lewis S,Davies S, Philpott S, Lopes A, et al: Sensitivity and specificity ofmultimodal and ultrasound screening for ovarian cancer, and stagedistribution of detected cancers: results of the prevalence screen of theUK Collaborative Trial of Ovarian Cancer Screening (UKCTOCS). LancetOncol 2009, 10(4):327-340.
8. Liu Y, Ganesan TS: Tumour suppressor genes in sporadic epithelialovarian cancer. Reproduction 2002, 123(3):341-353.
9. Fehrmann RS, Li XY, Zee van der AG, de Jong S, Te Meerman GJ, deVries EG, Crijns AP: Profiling studies in ovarian cancer: a review. Oncologist2007, 12(8):960-966.
Kothandaraman et al. BMC Cancer 2010, 10:64http://www.biomedcentral.com/1471-2407/10/64
Page 11 of 13

10. Lu KH, Patterson AP, Wang L, Marquez RT, Atkinson EN, Baggerly KA,Ramoth LR, Rosen DG, Liu J, Hellstrom I, et al: Selection of potentialmarkers for epithelial ovarian cancer with gene expression arrays andrecursive descent partition analysis. Clin Cancer Res 2004,10(10):3291-3300.
11. Mok SC, Chao J, Skates S, Wong K, Yiu GK, Muto MG, Berkowitz RS,Cramer DW: Prostasin, a potential serum marker for ovarian cancer:identification through microarray technology. J Natl Cancer Inst 2001,93(19):1458-1464.
12. Hough CD, Sherman-Baust CA, Pizer ES, Montz FJ, Im DD, Rosenshein NB,Cho KR, Riggins GJ, Morin PJ: Large-scale serial analysis of geneexpression reveals genes differentially expressed in ovarian cancer.Cancer Res 2000, 60(22):6281-6287.
13. Welsh JB, Zarrinkar PP, Sapinoso LM, Kern SG, Behling CA, Monk BJ,Lockhart DJ, Burger RA, Hampton GM: Analysis of gene expression profilesin normal and neoplastic ovarian tissue samples identifies candidatemolecular markers of epithelial ovarian cancer. Proc Natl Acad Sci USA2001, 98(3):1176-1181.
14. Ono K, Tanaka T, Tsunoda T, Kitahara O, Kihara C, Okamoto A, Ochiai K,Takagi T, Nakamura Y: Identification by cDNA microarray of genesinvolved in ovarian carcinogenesis. Cancer Res 2000, 60(18):5007-5011.
15. Kim JH, Skates SJ, Uede T, Wong KK, Schorge JO, Feltmate CM,Berkowitz RS, Cramer DW, Mok SC: Osteopontin as a potential diagnosticbiomarker for ovarian cancer. JAMA 2002, 287(13):1671-1679.
16. Suzuki M, Kobayashi H, Tanaka Y, Hirashima Y, Kanayama N, Takei Y, Saga Y,Itoh H, Terao T: Bikunin target genes in ovarian cancer cells identified bymicroarray analysis. J Biol Chem 2003, 278(17):14640-14646.
17. Adib TR, Henderson S, Perrett C, Hewitt D, Bourmpoulia D, Ledermann J,Boshoff C: Predicting biomarkers for ovarian cancer using gene-expression microarrays. Br J Cancer 2004, 90(3):686-692.
18. Heinzelmann-Schwarz VA, Gardiner-Garden M, Henshall SM, Scurry J,Scolyer RA, Davies MJ, Heinzelmann M, Kalish LH, Bali A, Kench JG, et al:Overexpression of the cell adhesion molecules DDR1, Claudin 3, and Ep-CAM in metaplastic ovarian epithelium and ovarian cancer. Clin CancerRes 2004, 10(13):4427-4436.
19. Rhodes DR, Yu J, Shanker K, Deshpande N, Varambally R, Ghosh D,Barrette T, Pandey A, Chinnaiyan AM: Large-scale meta-analysis of cancermicroarray data identifies common transcriptional profiles of neoplastictransformation and progression. Proc Natl Acad Sci USA 2004,101(25):9309-9314.
20. Tchagang ABTA, DeRycke MS, Skubitz KM, Skubitz AP: Early detection ofovarian cancer using group biomarkers. Molecular Cancer Therapeutics2008, 7(1):27-37.
21. Milde-Langosch K, Riethdorf S: Role of cell-cycle regulatory proteins ingynecological cancer. J Cell Physiol 2003, 196(2):224-244.
22. D’Andrilli G, Kumar C, Scambia G, Giordano A: Cell cycle genes in ovariancancer: steps toward earlier diagnosis and novel therapies. Clin CancerRes 2004, 10(24):8132-8141.
23. Crijns AP, Fehrmann RS, de Jong S, Gerbens F, Meersma GJ, Klip HG,Hollema H, Hofstra RM, te Meerman GJ, de Vries EG, et al: Survival-relatedprofile, pathways, and transcription factors in ovarian cancer. PLoS Med2009, 6(2):e24.
24. Pipinikas CP, Nair SB, Kirby RS, Carter ND, Fenske CD: Measurement ofblood E2F3 mRNA in prostate cancer by quantitative RT-PCR: apreliminary study. Biomarkers 2007, 12(5):541-557.
25. Pipinikas CP, Carter ND, Corbishley CM, Fenske CD: HIF-1alpha mRNA geneexpression levels in improved diagnosis of early stages of prostatecancer. Biomarkers 2008, 13(7):680-691.
26. Koyanagi K, O’Day SJ, Gonzalez R, Lewis K, Robinson WA, Amatruda TT,Kuo C, Wang HJ, Milford R, Morton DL, et al: Microphthalmia transcriptionfactor as a molecular marker for circulating tumor cell detection inblood of melanoma patients. Clin Cancer Res 2006, 12(4):1137-1143.
27. FIGO: FIGO Cancer Committee. Staging announcement. Gynecol Oncol1986, 25.
28. Shridhar V, Lee J, Pandita A, Iturria S, Avula R, Staub J, Morrissey M,Calhoun E, Sen A, Kalli K, et al: Genetic analysis of early- versus late-stageovarian tumors. Cancer Res 2001, 61(15):5895-5904.
29. Bajic VB, Tan SL, Christoffels A, Schonbach C, Lipovich L, Yang L,Hofmann O, Kruger A, Hide W, Kai C, et al: Mice and men: their promoterproperties. PLoS Genet 2006, 2(4):e54.
30. Bajic VB, Choudhary V, Hock CK: Content analysis of the core promoterregion of human genes. In Silico Biol 2004, 4(2):109-125.
31. Chong A, Zhang Z, Choi KP, Choudhary V, Djamgoz MB, Zhang G, Bajic VB:Promoter profiling and coexpression data analysis identifies 24 novelgenes that are coregulated with AMPA receptor genes, GRIAs. Genomics2007, 89(3):378-384.
32. KWB NVChawla, Hall OLawrence, Kegelmeyer W Philip: SMOTE: SyntheticMinority Over-sampling TEchnique. Journal of Articial Intelligence Research2002, 16:37.
33. Cleary JGTL: An instance-based learner using an entropic distancemeasure. Proceedings of the 12th International Conference on MachineLearning 1995, 6.
34. Bajic VB: Comparing the success of different prediction software insequence analysis: a review. Brief Bioinform 2000, 1(2):14.
35. Salto-Tellez M, Lee SC, Chiu LL, Lee CK, Yong MC, Koay ES: Microsatelliteinstability in colorectal cancer: considerations for molecular diagnosisand high-throughput screening of archival tissues. Clin Chem 2004,50(6):1082-1086.
36. Ito QL K, Salto-Tellez M, Yano T, Tada K, Ida H, Huang C, Shah N, Inoue M,Rajnakova A, Hiong KC, Peh BK, Han TI HC, Ming T, Yeoh KG, Ito Y:Frequent cytoplasmic retention of RUNX3 in gastric cancer cells: A novelmechanism of inactivation. Cancer Research 2005, 65:7743-7750.
37. Apostolova MD, Ivanova IA, Dagnino C, D’Souza SJ, Dagnino L: Activenuclear import and export pathways regulate E2F-5 subcellularlocalization. J Biol Chem 2002, 277(37):34471-34479.
38. Croce MV, Isla-Larrain MT, Demichelis SO, Gori JR, Price MR, Segal-Eiras A:Tissue and serum MUC1 mucin detection in breast cancer patients.Breast Cancer Res Treat 2003, 81(3):195-207.
39. Clauss A, Lilja H, Lundwall A: The evolution of a genetic locus encodingsmall serine proteinase inhibitors. Biochem Biophys Res Commun 2005,333(2):383-389.
40. Hellstrom I, Raycraft J, Hayden-Ledbetter M, Ledbetter JA, Schummer M,McIntosh M, Drescher C, Urban N, Hellstrom KE: The HE4 (WFDC2) proteinis a biomarker for ovarian carcinoma. Cancer Res 2003, 63(13):3695-3700.
41. Hanai J, Mammoto T, Seth P, Mori K, Karumanchi SA, Barasch J,Sukhatme VP: Lipocalin 2 diminishes invasiveness and metastasis of Ras-transformed cells. J Biol Chem 2005, 280(14):13641-13647.
42. Linder S, Havelka AM, Ueno T, Shoshan MC: Determining tumor apoptosisand necrosis in patient serum using cytokeratin 18 as a biomarker.Cancer Lett 2004, 214(1):1-9.
43. Sheard MA, Vojtesek B, Simickova M, Valik D: Release of cytokeratin-18 and-19 fragments (TPS and CYFRA 21-1) into the extracellular space duringapoptosis. J Cell Biochem 2002, 85(4):670-677.
44. Stigbrand T: The versatility of cytokeratins as tumor markers. Tumour Biol2001, 22(1):1-3.
45. Berghmans T, Paesmans M, Mascaux C, Martin B, Meert AP, Haller A,Lafitte JJ, Sculier JP: Thyroid transcription factor 1–a new prognosticfactor in lung cancer: a meta-analysis. Ann Oncol 2006, 17(11):1673-1676.
46. Redell MS, Tweardy DJ: Targeting transcription factors for cancer therapy.Curr Pharm Des 2005, 11(22):2873-2887.
47. Attwooll C, Lazzerini Denchi E, Helin K: The E2F family: specific functionsand overlapping interests. EMBO J 2004, 23(24):4709-4716.
48. Chen C, Wells AD: Comparative analysis of E2F family member oncogenicactivity. PLoS ONE 2007, 2(9):e912.
49. Sawiris GP, Sherman-Baust CA, Becker KG, Cheadle C, Teichberg D, Morin PJ:Development of a highly specialized cDNA array for the study anddiagnosis of epithelial ovarian cancer. Cancer Res 2002, 62(10):2923-2928.
50. Pierce AM, Schneider-Broussard R, Philhower JL, Johnson DG: Differentialactivities of E2F family members: unique functions in regulatingtranscription. Mol Carcinog 1998, 22(3):190-198.
51. Lassmann S, Weis R, Makowiec F, Roth J, Danciu M, Hopt U, Werner M:Array CGH identifies distinct DNA copy number profiles of oncogenesand tumor suppressor genes in chromosomal- and microsatellite-unstable sporadic colorectal carcinomas. J Mol Med 2007, 85(3):293-304.
52. Polanowska J, Le Cam L, Orsetti B, Valles H, Fabbrizio E, Fajas L, Taviaux S,Theillet C, Sardet C: Human E2F5 gene is oncogenic in primary rodentcells and is amplified in human breast tumors. Genes ChromosomesCancer 2000, 28(1):126-130.
53. Yu B, Lane ME, Wadler S: SU a cyclin-dependent kinase 2 inhibitor,promotes accumulation of high molecular weight E2F complexes inhuman colon carcinoma cells. Biochem Pharmacol 9516, 64(7):1091-1100.
Kothandaraman et al. BMC Cancer 2010, 10:64http://www.biomedcentral.com/1471-2407/10/64
Page 12 of 13
54. Reimer D, Sadr S, Wiedemair A, Goebel G, Concin N, Hofstetter G, Marth C,Zeimet AG: Expression of the E2F family of transcription factors and itsclinical relevance in ovarian cancer. Ann N Y Acad Sci 2006, 1091:270-281.
55. Reimer D, Sadr S, Wiedemair A, Stadlmann S, Concin N, Hofstetter G,Muller-Holzner E, Marth C, Zeimet AG: Clinical relevance of E2F familymembers in ovarian cancer–an evaluation in a training set of 77patients. Clin Cancer Res 2007, 13(1):144-151.
56. Davidson B, Espina V, Steinberg SM, Florenes VA, Liotta LA, Kristensen GB,Trope CG, Berner A, Kohn EC: Proteomic analysis of malignant ovariancancer effusions as a tool for biologic and prognostic profiling. ClinCancer Res 2006, 12(3 Pt 1):791-799.
57. Span PN, Manders P, Heuvel JJ, Thomas CM, Bosch RR, Beex LV, Sweep CG:Expression of the transcription factor Ets-1 is an independent prognosticmarker for relapse-free survival in breast cancer. Oncogene 2002,21(55):8506-8509.
Pre-publication historyThe pre-publication history for this paper can be accessed here:http://www.biomedcentral.com/1471-2407/10/64/prepub
doi:10.1186/1471-2407-10-64Cite this article as: Kothandaraman et al.: E2F5 status significantlyimproves malignancy diagnosis of epithelial ovarian cancer. BMC Cancer2010 10:64.
Submit your next manuscript to BioMed Centraland take full advantage of:
• Convenient online submission
• Thorough peer review
• No space constraints or color figure charges
• Immediate publication on acceptance
• Inclusion in PubMed, CAS, Scopus and Google Scholar
• Research which is freely available for redistribution
Submit your manuscript at www.biomedcentral.com/submit
Kothandaraman et al. BMC Cancer 2010, 10:64http://www.biomedcentral.com/1471-2407/10/64
Page 13 of 13