Cochlear Implantation Improves Both Speech Perception and ...
15
Citation: Rasmussen, K.M.B.; West, N.C.; Bille, M.; Sandvej, M.G.; Cayé-Thomasen, P. Cochlear Implantation Improves Both Speech Perception and Patient-Reported Outcomes: A Prospective Follow-Up Study of Treatment Benefits among Adult Cochlear Implant Recipients. J. Clin. Med. 2022, 11, 2257. https:// doi.org/10.3390/jcm11082257 Academic Editor: Christof Röösli Received: 4 April 2022 Accepted: 14 April 2022 Published: 18 April 2022 Publisher’s Note: MDPI stays neutral with regard to jurisdictional claims in published maps and institutional affil- iations. Copyright: © 2022 by the authors. Licensee MDPI, Basel, Switzerland. This article is an open access article distributed under the terms and conditions of the Creative Commons Attribution (CC BY) license (https:// creativecommons.org/licenses/by/ 4.0/). Journal of Clinical Medicine Article Cochlear Implantation Improves Both Speech Perception and Patient-Reported Outcomes: A Prospective Follow-Up Study of Treatment Benefits among Adult Cochlear Implant Recipients Kasper Møller Boje Rasmussen 1,2, * , Niels Cramer West 1,2 , Michael Bille 1 , Matilde Grønborg Sandvej 1 and Per Cayé-Thomasen 1,2 1 Department of Otorhinolaryngology, Head and Neck Surgery and Audiology, Rigshospitalet University Hospital of Copenhagen, 2100 Copenhagen, Denmark; [email protected] (N.C.W.); [email protected] (M.B.); [email protected] (M.G.S.); [email protected] (P.C.-T.) 2 Faculty of Health and Medical Sciences, University of Copenhagen, 2200 Copenhagen, Denmark * Correspondence: [email protected]; Tel.: +45-515-10708 Abstract: Cochlear implantation is considered the best treatment option for patients with severe- to-profound sensorineural hearing loss for whom conventional hearing aids are insufficient. We used a repeated measures longitudinal approach to evaluate speech recognition and patient-reported outcomes after cochlear implantation in an unbiased cohort of Danish adult patients in a prospective cohort study. We assessed 39 recipients before and two times after implantation using a battery of tests that included Dantale I, the Danish Hearing in Noise Test, the Nijmegen Cochlear Implant Questionnaire, and the Speech, Spatial, and Qualities of Hearing Scale. The study group improved significantly on all outcome measures following implantation. On average, Dantale I scores improved by 29 percentage points and Hearing in Noise Test scores improved by 22 percentage points. Most notably, the average Dantale score improved from 26 to 70% in the CI in quiet condition and from 12 to 42% in the cochlear implantation in noise condition when tested monaurally. Dantale demonstrated a significant positive correlation with Nijmegen Cochlear Implant Questionnaire and Speech, Spatial, and Qualities of Hearing Scale scores, while Hearing in Noise Test had no significant correlation with the patient-reported outcome measures. Patients improved significantly at 4 months and marginally improved further at 14 months, indicating that they were approaching a plateau. Our study’s use of audiometric and patient-reported outcome measures provides evidence of the treatment benefits of cochlear implantation in adults, which may help physicians advise patients on treatment decisions and align treatment benefit expectations, as well as serve as a foundation for the development of new cochlear implantation selection criteria. Keywords: treatment; hearing rehabilitation; hearing loss; outcome; patient-reported outcome measures; PROM; cochlear implant 1. Introduction The great majority of patients with sensorineural hearing loss (SNHL) benefit from conventional hearing aids (HA), but for those with severe-to-profound SNHL for whom HAs are insufficient, cochlear implantation (CI) is currently the standard treatment for rehabilitation. Hearing loss has a wide range of consequences, including impaired verbal communication and social isolation, and has been linked to worsening cognitive function- ing and dementia [1]. Patients are also at a higher risk of developing physical and mental illnesses [2]. Improved speech recognition may be achieved with cochlear implants, but they do not restore normal hearing. However, cochlear implantation improves speech understanding [3–6], can provide spatial hearing and music appreciation, suppresses tinni- tus [7], improves quality of life [8,9], and reduces hearing loss-related comorbidities [10]. A J. Clin. Med. 2022, 11, 2257. https://doi.org/10.3390/jcm11082257 https://www.mdpi.com/journal/jcm
-
Upload
khangminh22 -
Category
Documents
-
view
0 -
download
0
Transcript of Cochlear Implantation Improves Both Speech Perception and ...
�����������������
Citation: Rasmussen, K.M.B.; West,
N.C.; Bille, M.; Sandvej, M.G.;
Cayé-Thomasen, P. Cochlear
Implantation Improves Both Speech
Perception and Patient-Reported
Outcomes: A Prospective Follow-Up
Study of Treatment Benefits among
Adult Cochlear Implant Recipients. J.
Clin. Med. 2022, 11, 2257. https://
doi.org/10.3390/jcm11082257
Academic Editor: Christof Röösli
Received: 4 April 2022
Accepted: 14 April 2022
Published: 18 April 2022
Publisher’s Note: MDPI stays neutral
with regard to jurisdictional claims in
published maps and institutional affil-
iations.
Copyright: © 2022 by the authors.
Licensee MDPI, Basel, Switzerland.
This article is an open access article
distributed under the terms and
conditions of the Creative Commons
Attribution (CC BY) license (https://
creativecommons.org/licenses/by/
4.0/).
Journal of
Clinical Medicine
Article
Cochlear Implantation Improves Both Speech Perception andPatient-Reported Outcomes: A Prospective Follow-Up Study ofTreatment Benefits among Adult Cochlear Implant RecipientsKasper Møller Boje Rasmussen 1,2,* , Niels Cramer West 1,2, Michael Bille 1, Matilde Grønborg Sandvej 1
and Per Cayé-Thomasen 1,2
1 Department of Otorhinolaryngology, Head and Neck Surgery and Audiology, Rigshospitalet UniversityHospital of Copenhagen, 2100 Copenhagen, Denmark; [email protected] (N.C.W.);[email protected] (M.B.); [email protected] (M.G.S.);[email protected] (P.C.-T.)
2 Faculty of Health and Medical Sciences, University of Copenhagen, 2200 Copenhagen, Denmark* Correspondence: [email protected]; Tel.: +45-515-10708
Abstract: Cochlear implantation is considered the best treatment option for patients with severe-to-profound sensorineural hearing loss for whom conventional hearing aids are insufficient. Weused a repeated measures longitudinal approach to evaluate speech recognition and patient-reportedoutcomes after cochlear implantation in an unbiased cohort of Danish adult patients in a prospectivecohort study. We assessed 39 recipients before and two times after implantation using a batteryof tests that included Dantale I, the Danish Hearing in Noise Test, the Nijmegen Cochlear ImplantQuestionnaire, and the Speech, Spatial, and Qualities of Hearing Scale. The study group improvedsignificantly on all outcome measures following implantation. On average, Dantale I scores improvedby 29 percentage points and Hearing in Noise Test scores improved by 22 percentage points. Mostnotably, the average Dantale score improved from 26 to 70% in the CI in quiet condition and from 12to 42% in the cochlear implantation in noise condition when tested monaurally. Dantale demonstrateda significant positive correlation with Nijmegen Cochlear Implant Questionnaire and Speech, Spatial,and Qualities of Hearing Scale scores, while Hearing in Noise Test had no significant correlation withthe patient-reported outcome measures. Patients improved significantly at 4 months and marginallyimproved further at 14 months, indicating that they were approaching a plateau. Our study’s use ofaudiometric and patient-reported outcome measures provides evidence of the treatment benefits ofcochlear implantation in adults, which may help physicians advise patients on treatment decisionsand align treatment benefit expectations, as well as serve as a foundation for the development of newcochlear implantation selection criteria.
Keywords: treatment; hearing rehabilitation; hearing loss; outcome; patient-reported outcomemeasures; PROM; cochlear implant
1. Introduction
The great majority of patients with sensorineural hearing loss (SNHL) benefit fromconventional hearing aids (HA), but for those with severe-to-profound SNHL for whomHAs are insufficient, cochlear implantation (CI) is currently the standard treatment forrehabilitation. Hearing loss has a wide range of consequences, including impaired verbalcommunication and social isolation, and has been linked to worsening cognitive function-ing and dementia [1]. Patients are also at a higher risk of developing physical and mentalillnesses [2]. Improved speech recognition may be achieved with cochlear implants, butthey do not restore normal hearing. However, cochlear implantation improves speechunderstanding [3–6], can provide spatial hearing and music appreciation, suppresses tinni-tus [7], improves quality of life [8,9], and reduces hearing loss-related comorbidities [10]. A
J. Clin. Med. 2022, 11, 2257. https://doi.org/10.3390/jcm11082257 https://www.mdpi.com/journal/jcm

J. Clin. Med. 2022, 11, 2257 2 of 15
meta-analysis by McRackan et al. found that all included studies (n = 14) showed significantimprovements in both QOL and speech recognition following cochlear implantation [11].
Since the first Danish cochlear implantation in 1982, approximately 4500 patientshave been implanted. At the three Danish cochlear implantation centers, nearly 400 im-plantations are conducted each year [12]. The Danish selection criteria for CI participantswere revised in 2014, which builds on criteria described by Dowell et al. [13]. We arecurrently working to revise the criteria, since CI indications for adult patients have grownconsiderably since then, making CI an increasingly popular treatment option. It is currentlyrecommended that any adult with a moderate-to-severe sensorineural hearing loss whois unable to comprehend what is said in a quiet conversation without the assistance ofmouth reading or in background noise with the assistance of mouth reading be referred forroutine assessment for CI candidacy at a CI center. If a patient’s speech recognition score(SRS) is less than 65 percent in a quiet free field setting without the option of lipreadingwith optimally fitted HAs and/or if the patient’s SRS is less than 45 percent in the CI candi-date ear, the patient meets the current Danish national selection criteria for CI. Poor SRS(less than 20%) in a free-field setting with optimally fitted HAs in moderately loud noise(SNR = 0 dB) can also support a candidacy. An otolaryngologist specializing in audiologyrecommends the patient for implantation when the medical evaluation is completed. Somepatients are still eligible even though their speech recognition scores are higher than theabove criteria, and they are still considered for CI.
This research aims to provide further evidence on postimplant outcomes using stan-dard speech audiometry and patient-reported outcome measures, allowing evidence-basedCI candidate counselling in our department. We are conducting a prospective repeated-measures within-subjects study at our tertiary referral hospital with a cohort of adult CIpatients for whom HAs were inadequate to examine the treatment benefits of unilateralCI. Our patient cohort is unbiased and is representative of the patients we encounter atour clinic in terms of etiology, age, and degree of hearing loss. So far, data have beenevaluated at 4 months post-implantation, which showed significant improvements in bothaudiometric and patient-reported outcome measures (PROMs) [5]. Beyond the first post-implantation follow-up, we will investigate whether the speech recognition and PROMoutcomes improve, plateau, or deteriorate. We found strong correlations between thePROMs NCIQ and SSQ and a moderate correlation between speech recognition (Dantale)and the PROMs [5]. The current study also aims to find potential correlations betweenaudiometric measures and PROMs at the second post-implantation follow-up.
2. Materials and Methods
This study is a prospective longitudinal cohort study with a repeated measures designconducted at our department, the Department of Otorhinolaryngology, Head and NeckSurgery & Audiology, Rigshospitalet. The study included adult patients (aged 18 andabove) with SNHL who met the Danish national candidacy criteria [14]. If there were nocontraindications, the ear with the worst hearing was selected for implantation. Patientswere not included if CI had been performed previously or if the patient could not speakDanish fluently. When CI candidates were offered CI, they were invited to participatein the study. Prior to participation, all patients were informed verbally and in writingand completed informed consent forms. The Danish Data Protection Agency (Referencenumber: RH-2017-308) and the Danish National Committee on Health Research Ethics(Reference number: H-17034918) approved the study. Between February 2018 and May2019, patients were enrolled.
2.1. Cochlear Implantation
Unilateral cochlear implantation was performed using the round window techniquewith mastoidectomy and posterior tympanometry. The patient and the speech and lan-guage pathologist collaborate to select the implant device brand. However, the electrodetype is usually decided upon by the surgeon. All surgery and post-operative procedures

J. Clin. Med. 2022, 11, 2257 3 of 15
were performed by the Department of Otorhinolaryngology, Head and Neck Surgery &Audiology at Rigshospitalet. The patients had three auditory counseling sessions with CItechnicians and speech-language pathologists post-operatively.
2.2. Main Outcome Measures
Pure-tone audiometry was performed at baseline (T0) to determine pre-implant hear-ing capabilities and study eligibility. Patients were also tested at baseline and at twopost-implantation follow-ups (T1 and T2) with a test battery including two audiometrictests, Dantale I and Hearing in Noise Test (HINT), as well as two PROMs, a NijmegenCochlear Implant Questionnaire (NCIQ), and the 12 items of the Speech, Spatial, andQualities of Hearing Scale (SSQ-12). The evaluation intervals for T0, T1, and T2 coincidedwith routine clinical follow-up visits.
2.3. Audiometric Test Measures2.3.1. Pure-Tone Audiometry (PTA) and Speech Recognition Score (SRS)
PTA and SRS were measured at baseline (T0). A pure tone average (PTA6) consistedof six frequencies: 0.25, 0.5, 1, 2, 4, 8 kHz. SRS was measured by the percentage ofcorrectly repeated phonemes from one list of 25 monosyllabic words (Dantale I) containing80 phonemes. The PTA and SRS were measured in a double-walled, sound-attenuatedbooth with headsets and without HAs.
2.3.2. Dantale I
Dantale I assesses the speech reception threshold (SRT) measured by means of mono-syllabic digit triplets, and a speech recognition score (SRS), measured by the percentage ofcorrectly repeated phonemes from one of eight lists of 25 monosyllabic words containing 80phonemes [15]. According to ISO 8253-3, the speech recognition material was presented ina quasi-free sound field from a single loudspeaker one meter in front of the patient, whilenoise was presented from two loudspeakers 45 degrees from the center [16]. Speech waspresented at a sound pressure level of 65 dB SPL in quiet and in noise at a signal-to-noise ra-tio (SNR) of 0 dB. A 1-kHz warble tone was used to calibrate the presentation level. DantaleI is comparable to the consonant-nucleus-consonant (CNC) test used in native English-speaking countries. Data from speech recognition tests in free field in five different listeningconditions were included in the study: (1) best aided with possibility of lip-reading, (2) bestaided in quiet, (3) best aided in a noise, (4) best aided CI ear only in quiet, (5) best aidedCI ear only in noise. Lip movements were visible on a video screen one meter in frontof the patient in the audiovisual setting. For unilateral CI testing, contralateral ears wereplugged. Preoperative aided tests were with HA to the candidate ear, postoperative testswere with CI.
2.3.3. Hearing in Noise Test (HINT)
HINT consists of ten lists of twenty sentences each, and it assesses both word andsentence recognition [17]. A Danish version of the HINT was used [18]. The HINT setupwas identical to Dantale I. Patients were assessed in four different conditions: best aidedin both quiet and noise, with word and sentence scoring for each condition. Speech wasdelivered at 60 dB SPL in quiet and 65 dB SPL in noise. A SNR of +10 dB was used in thesetting with background noise. Thus, HINT testing generated scores for the percentage ofcorrectly perceived words and sentences.
If a patient was unable to respond in Dantale I or HINT owing to hearing loss, or if thepatient could not attend the posttest due to COVID-19, the results were declared as missingvalues (NA).

J. Clin. Med. 2022, 11, 2257 4 of 15
2.4. Patient-Reported Outcome Measures2.4.1. Nijmegen Cochlear Implant Questionnaire (NCIQ)
The NCIQ is a 60-item questionnaire that assesses hearing ability and quality of lifedivided in six subdomains: (1) basic sound perception, (2) advanced sound perception,(3) speech production, (4) self-esteem, (5) activity limitations, and (6) social interactions [19].On a Likert scale, each item may be answered as never, sometimes, rarely, often, and always,with a corresponding score of 1 to 5, respectively, or with no relevance. All subdomainswere checked for the number of no relevance-responds, and those with four or more norelevance-responses were omitted. A high NCIQ score is associated with a good self-perceived quality-of-life.
2.4.2. Speech, Spatial, and Qualities of Hearing Scale (SSQ)
The SSQ is a 49-item questionnaire that examines speech perception, sound local-ization, and sound quality [20]. Noble et al. demonstrated that a simplified version of12 questions (SSQ12, referred to as SSQ in this study) reflects the original form (SSQ49) andis more practical to use in a clinical context; hence, SSQ12 is used in this study. The SSQis divided into three subdomains: speech comprehension, spatial hearing, and quality ofsound. The SSQ was presented with 10-cm visual analogue scales (VAS). A high SSQ scoreindicates less limitations in self-reported activity, as well as better speech perception andsound localization.
Patients completed both questionnaires on paper at T0, T1, and T2. If no informationwas provided in the NCIQ or SSQ, or if the patients did not attend the posttest due toCOVID-19, or if the information provided was ambiguous, the scores on the two instru-ments were declared as missing values (NA).
2.5. Statistical Analysis
SPSS [21] was used for statistical analysis, and a GraphPad Prism was used to producegraphs [22]. Demographic data were examined using means, ranges, and percentages.PTA6 and SRS are reported as decibels hearing level (dB HL) and percentage, respectively.Summary audiometric results and patient-reported results were presented as means with95% confidence intervals and medians with 25 and 75% percentiles at each time point,respectively. Analyses were performed to identify statistically significant differences inthe outcome measures between pre-implantation (T0) and post-implantation (T1 and T2).Audiometric measures were analyzed using a repeated measures analysis of variance(ANOVA) to examine changes over time through repeated measures on the same patients.PROMs were analyzed using the Wilcoxon signed-rank test. The Spearman rank correlationanalysis, a non-parametric measure of rank correlation (ρ), was used to characterize therelationship between audiometric results and PROMs. All p values provided are two-tailed,with a significance level of 0.05.
3. Results3.1. Study Subjects
In all, 49 patients were enrolled in the study. Table 1 shows the patient demographics.Due to the circumstances of the COVID-19 pandemic, three patients later withdrew fromthe study. Another seven patients were excluded: one patient had a bilateral CI performedsimultaneously, one patient relocated abroad, one patient was later explanted due to painand infection around the implanted device, two patients died before the last follow-up,and two patients had comorbidities that excluded them from the study. The remaining39 patients were between the ages of 28 and 90 at the time of implantation (mean 63),with approximately one-third being female (36%). Twenty-three patients (59%) receivedimplants in their left ear, while 16 (41%) had implants placed in their right ear. Patientsreported using HAs on the CI ear for an average of 18 years, ranging from 0 to 57 years, andon the contralateral ear for 19 years (range 0–57 years). A Nucleus CI device was implantedin the majority of patients (Cochlear LTD; n = 28; 69%), subdivided between the Nucleus

J. Clin. Med. 2022, 11, 2257 5 of 15
Cochlear CI522 (n = 22, 56%) and CI622 (n = 6; 13%). Six patients were implanted withAdvanced Bionics devices (n = 6, 16%), subdivided between ULTRA 3D Midscale (n = 3;8%), 2 (5%) HiRes90K Midscale (n = 2, 5%), and HiRes Ultra 3D SlimJ (n = 1; 3%). Fourpatients (10%) received the Oticon Medical Zti EVO, and one (3%) patient received MEDElFlex 28 Synchrony. Audiometric tests at T1 and T2 were carried out after an average of 235days and 440 days, respectively. Questionnaires (NCIQ and SSQ) at T1 and T2 were filledout and handed in after an average of 124 days and 426 days, respectively (Table 1).
Table 1. Demographic characteristics of the 39 study patients.
Age at Implantation 28–90 Years (Mean 64)
Gender 15 females (38%), 24 males (62%)
Implanted side 23 left (59%), 16 right (41%)
Duration of hearing aidsCI ear 18 years (range 0–57 years)Contralateral ear 19 years (range 0–57 years)
Hearing loss degreeCI ear
Moderate–severe (56–90 dB) 24 (62%)Profound (91+ dB) 15 (38%)
Contralateral earModerate–severe (56–90 dB) 31 (79%)Profound (91+ dB) 8 (21%)
Type of implant
1 (3%) Advanced Bionics HiRes Ultra 3D SlimJ2 (5%) Advanced Bionics HiRes90K Midscale3 (8%) Advanced Bionics ULTRA 3D Midscale1 (3%) MED-EL Flex 28 Synchrony22 (56%) Nucleus Cochlear CI5226 (13%) Nucleus Cochlear CI6224 (10%) Oticon Medical Zti EVO
Audiometric test—days after implantationT1 235 days, 110–330 (mean, range) ~ 8 monthsT2 440 days, 343–636 (mean, range) ~ 15 months
PROMs—days after implantationT1 124 days, 66–241 (mean, range) ~ 4 monthsT2 426 days, 301–569 (mean, range) ~ 14 months
Table 2 presents individual data on hearing loss etiology, pre-implantation pure-toneaudiometry, and speech recognition scores. Fourteen different etiologies were reported,and unknown etiology was most frequently reported (n = 14; 36%), followed by late-onsetprogressive hereditary SNHL (n = 9; 23%), hereditary congenital (n = 3; 8%), unknowncongenital etiology (n = 2; 5%), and otosclerosis (n = 2; 5%). An additional nine etiologiesmade up the remaining 27%. Etiology was not considered for further analysis.
3.2. Speech Perception Outcomes3.2.1. Baseline PTA6 and SRS Results
A pre-implant pure-tone audiometry revealed that 24 patients (62%) had moderateto severe SNHL and 15 (38%) had profound SNHL on the CI ear. Thirty-one patients(79%) had moderate to severe SNHL, and 8 (21%) had profound SNHL on the contralateralear (Tables 1 and 2). The average pure-tone audiometry for the CI ear was 87 dB HL,whereas the contralateral ear was 80 dB HL. The average speech recognition score (SRS)measured with monosyllable word recognition was 27% (range 0–78) in the CI ears and41% (range 0–85) in the non-implanted ears. In 22 patients (56%), the SRS was below 65%in the best-aided condition and below 45% in the CI ear. Three patients (8%) had an SRS inbest-aided condition higher than 65% and higher than 45% on the CI ear (patient-ID 18, 39,

J. Clin. Med. 2022, 11, 2257 6 of 15
and 42). Bilateral HAs were the best-aided preimplant hearing condition in 33 cases (85%),and unilateral HAs in six cases (15%, three on either side).
Table 2. The baseline info on hearing loss etiology and pre-operative hearing for the 39 patients.
ID Etiology Gender Age PTA6Operated Ear
PTA6Contralateral Ear
SRSCI Ear
SRSContralateral Ear
(Years) (dB HL) (dB HL) (%) (%)
1 Ménière’s disease M 77 77 52 45 802 Otitis media M 73 110 106 9 533 Otosclerosis F 53 120 78 0 684 Congenital (unknown etiology) F 46 108 115 0 05 Unknown M 70 98 70 0 286 Unknown M 74 98 86 48 337 Late-onset progressive hereditary F 69 77 83 60 608 Superficial Siderosis F 67 68 59 24 249 Late-onset progressive hereditary M 69 87 89 24 3210 Hereditary congenital M 69 111 90 0 4511 Unknown M 81 78 69 14 5612 Unknown M 70 108 78 0 8513 Usher syndrome F 60 92 86 50 6814 Late-onset progressive hereditary F 62 76 71 29 2815 Late-onset progressive hereditary M 60 75 78 45 5516 Unknown F 75 103 82 0 917 Late-onset progressive hereditary M 59 108 108 0 018 Unknown M 88 67 64 56 4919 Ototoxicity F 90 79 77 0 020 Unknown M 74 75 63 14 2121 Late-onset progressive hereditary M 80 63 55 20 3522 Unknown M 73 78 77 39 2823 Unknown M 56 99 74 0 7724 Neurofibromatosis M 56 68 72 15 3525 Congenital (unknown etiology) M 53 103 84 35 8526 Vestibular schwannoma M 75 83 118 50 027 Pendred syndrome F 28 84 70 33 7028 Hereditary congenital F 43 96 87 48 6029 Unknown F 40 86 118 40 030 Late-onset progressive hereditary M 72 78 74 35 6531 Unknown F 85 115 82 0 1032 Unknown F 30 88 63 31 6833 Otosclerosis M 81 88 86 20 3034 Pneumococcal meningitis M 69 56 53 30 4035 Late-onset progressive hereditary M 87 79 59 55 4039 Unknown F 38 73 118 75 040 Unknown M 79 73 67 41 6842 Late-onset progressive hereditary F 36 73 68 78 7243 Hereditary congenital M 33 104 91 8 40
F: female; M: male; PTA6: pure-tone average of frequencies 0.25, 0.5, 1, 2, 4, 8 kHz (headphone based); SRS, speechrecognition score (in a quiet setting at individually determined most comfortable loudness levels using headphones).
Table 3 includes all of the raw data for each subject. While most patients have completedata sets of all their tests, some patients have missing values. Missing values in Dantale Idata are due to incomplete testing sequences, meaning that on some occasions the CI ear orcontralateral ear was not tested. In the HINT data set, seven patients (18%) had missingtests at all time points. HINT was not performed in these cases because it was too difficultfor the patient to complete the test due to poor SRS. Six patients (15%) and eleven patients(28%) had missing values at T2 in the NCIQ and SSQ tests, respectively. Due to COVID-19,several PROM results at T2 were not available during data extraction.

J. Clin. Med. 2022, 11, 2257 7 of 15
Table 3. Individual patient outcomes for audiometric test measures (Dantale I and HINT) and patient-reported outcome measures (NCIQ and SSQ) at T0/T1/T2.
ID Dantale I HINT NCIQ SSQ
Best Aidedwith
Lipreading
Best Aided inQuiet without
Lipreading
Best Aided inNoise without
LipreadingCI Ear in
QuietCI Ear in
NoiseHINT-Q:
SentencesHINT-Q:Words
HINT-N:Sentences
HINT-N:Words
(%) (%) (%) (%) (%) (%) (%) (%) (%) Total Score Total Score
1 85/94/89 85/89/84 51/43/60 46/53/51 29/21/38 50/75/100 80/92/100 35/68/80 62/79/88 257/293/265 NA/42/422 86/98/90 65/81/88 28/49/54 NA/81/76 NA/45/54 45/85/90 69/96/98 15/45/70 18/67/78 232/268/273 30/37/323 59/94/91 34/91/96 21/53/59 NA/71/76 NA/44/59 NA/95/100 NA/98/100 NA/60/80 NA/83/90 239/289/377 27/34/NA4 40/63/86 2/44/59 NA/NA/NA 2/44/59 NA/NA/NA NA/NA/NA NA/NA/NA NA/NA/NA NA/NA/NA 329/323/348 25/16/475 41/94/99 31/88/96 NA/49/55 9/71/88 NA/49/55 NA/95/80 NA/98/91 NA/65/90 NA/83/96 246/448/487 26/77/846 86/86/84 49/75/78 NA/19/33 8/48/58 NA/19/33 10/NA/65 28/NA/87 NA/NA/20 8/NA/44 263/425/410 23/50/567 NA/98/96 45/93/83 40/71/74 45/91/83 36/65/74 70/95/90 86/99/98 35/75/80 63/91/93 377/423/435 64/57/628 88/79/84 78/46/65 30/30/21 48/46/65 NA/30/21 35/20/20 46/33/33 15/NA/NA 33/NA/NA 171/248/185 5/20/59 70/86/94 30/76/78 10/36/14 16/73/78 4/36/14 NA/60/60 NA/78/80 NA/25/40 NA/56/65 253/418/403 39/65/5910 62/93/90 34/68/75 3/58/53 NA/68/75 NA/58/53 NA/20/40 14/42/68 NA/10/20 NA/34/51 486/533/533 54/90/7411 84/99/99 75/91/95 64/54/54 29/74/90 26/40/53 NA/NA/NA NA/NA/NA NA/NA/NA NA/NA/NA 266/412/328 27/56/4212 89/98/96 77/88/89 36/58/55 35/88/86 NA/56/55 70/100/100 92/100/100 60/75/80 81/91/92 234/328/315 18/31/4113 86/94/95 63/91/88 24/36/39 18/74/79 18/36/30 55/100/100 80/100/100 55/75/85 73/84/96 373/487/NA 46/72/7414 66/88/98 70/93/91 27/60/63 70/86/81 27/60/55 60/90/95 80/96/99 30/60/65 61/76/84 293/434/447 16/57/3715 92/100/99 69/83/89 21/64/69 36/83/89 13/64/69 75/100/85 88/100/95 45/70/60 65/82/78 240/385/425 20/58/9016 38/53/61 8/40/54 NA/5/4 1/28/26 NA/5/NA NA/NA/5 NA/NA/22 NA/NA/NA NA/NA/NA NA/226/NA NA/NA/NA17 58/NA/63 28/NA/21 NA/NA/1 10/NA/15 NA/NA/1 NA/NA/NA 5/NA/NA NA/NA/NA NA/NA/NA 261/341/NA 29/9/NA18 83/88/NA 66/85/85 14/44/51 40/69/73 6/33/41 NA/NA/NA NA/NA/NA NA/NA/NA NA/NA/NA 373/508/549 32/71/7119 26/76/84 7/73/76 NA/NA/11 NA/65/76 NA/NA/NA NA/NA/NA NA/NA/NA NA/NA/NA NA/NA/NA 256/341/364 17/45/NA20 57/88/86 39/66/74 15/30/30 9/46/45 4/19/28 NA/NA/NA NA/NA/NA NA/NA/NA NA/NA/NA 311/355/360 16/25/NA21 94/96/91 70/84/80 21/43/45 31/84/68 3/43/33 95/90/85 99/98/93 80/85/75 91/93/88 325/396/368 52/56/7222 79/96/95 65/98/94 13/73/69 23/98/88 13/73/61 40/85/NA 74/96/NA 40/NA/NA 64/NA/NA 444/547/532 66/64/NA23 89/98/98 61/96/93 31/49/68 NA/78/90 NA/49/59 85/100/NA 95/100/NA 35/90/NA 61/98/NA 238/308/NA 19/16/NA24 65/88/85 59/81/78 14/38/36 NA/81/78 NA/38/36 NA/84/75 NA/94/93 NA/49/65 NA/65/87 259/371/404 9/19/NA25 87/100/96 70/81/91 44/60/54 NA/61/73 NA/31/26 35/70/85 59/86/93 40/40/15 56/66/44 310/414/433 38/49/6926 40/75/86 29/84/84 8/46/55 29/84/84 8/46/55 NA/70/75 NA/85/90 NA/20/50 NA/42/72 340/339/374 32/16/4027 88/93/91 74/89/95 40/75/45 41/68/69 11/33/44 50/65/80 72/87/89 15/45/60 42/78/78 384/461/478 47/99/NA28 88/96/99 79/98/91 20/66/73 33/91/88 16/66/73 75/80/100 85/95/100 20/93/90 47/80/92 332/526/529 18/74/6029 39/83/93 34/54/69 16/30/51 NA/54/69 NA/30/51 NA/5/15 NA/35/54 NA/NA/NA NA/NA/21 177/239/291 9/NA/1930 73/NA/96 64/91/93 24/85/63 41/85/89 4/85/63 80/85/100 90/99/100 75/80/90 80/94/98 340/487/432 24/73/5131 20/48/69 6/23/33 NA/NA/NA NA/23/33 NA/NA/NA NA/NA/NA NA/NA/NA NA/NA/NA NA/NA/NA 315/384/332 24/19/2232 70/93/98 49/75/90 46/28/49 NA/75/85 NA/28/49 30/95/95 74/95/99 15/45/90 63/66/98 206/385/474 18/35/6633 85/96/90 58/74/73 29/43/41 NA/65/73 NA/43/30 NA/78/85 NA/87/90 NA/60/35 NA/88/61 194/495/421 7/86/5234 52/53/64 50/40/30 45/45/24 25/40/30 16/45/24 NA/NA/NA 9/15/NA NA/NA/NA NA/NA/NA 288/287/304 29/34/2635 43/65/69 23/48/41 10/18/1 10/44/31 8/18/NA NA/NA/NA NA/NA/NA NA/NA/NA NA/NA/NA 235/308/290 19/31/1839 74/79/90 74/79/81 44/45/39 74/79/81 44/45/39 55/25/30 80/71/67 55/5/NA 73/35/35 210/355/351 21/51/7640 70/58/80 56/53/69 17/30/16 19/43/64 15/30/14 40/75/NA 65/86/NA 25/35/NA 50/65/NA 242/329/308 20/15/4042 85/98/100 72/94/95 42/70/74 57/86/86 36/70/68 35/NA/NA 65/NA/NA 20/NA/NA 54/NA/NA 322/NA/NA 40/50/NA43 58/86/85 59/88/91 10/53/69 19/63/73 NA/46/55 10/NA/NA 41/NA/NA NA/NA/NA 16/NA/NA 328/418/NA 2/41/NA
Test scores for all patients enrolled presented as T0/T1/T2; HINT: Hearing in Noise Test; NCIQ: Nijmegen Cochlear Implant Questionnaire; SSQ: Speech, Spatial, and Qualities ofHearing Scale; NA: Not available.
J. Clin. Med. 2022, 11, 2257 8 of 15
3.2.2. Dantale I Results
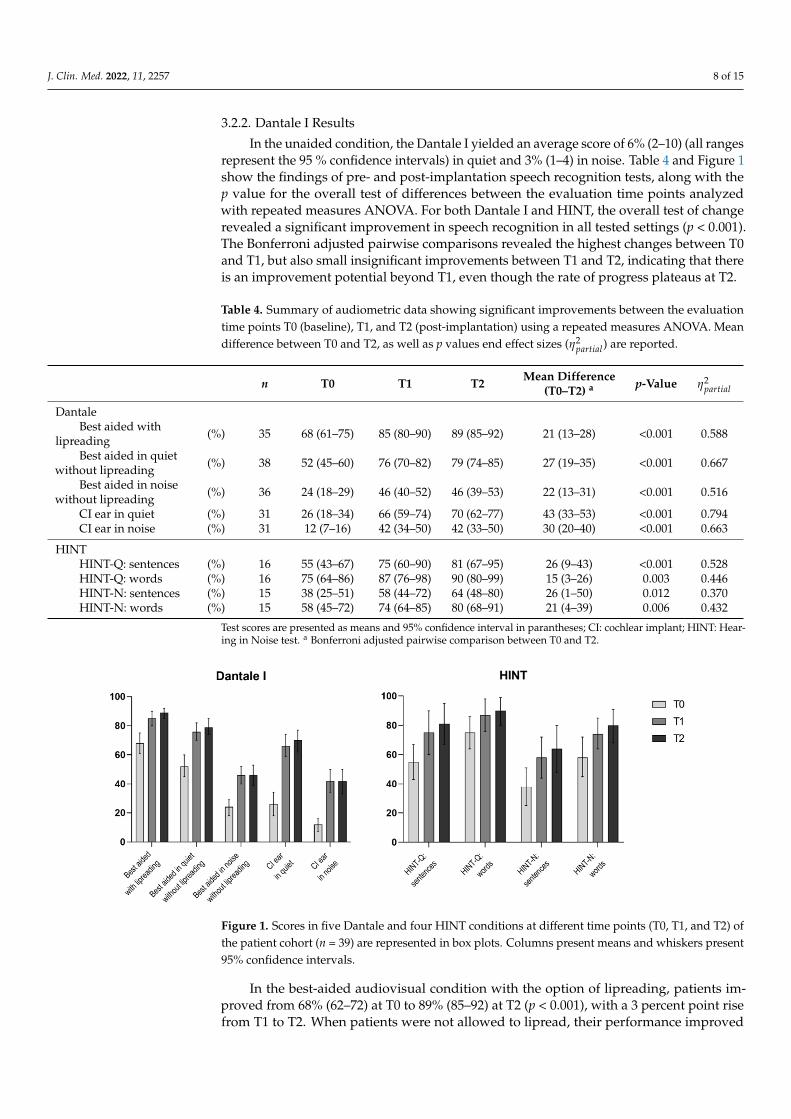
In the unaided condition, the Dantale I yielded an average score of 6% (2–10) (all rangesrepresent the 95 % confidence intervals) in quiet and 3% (1–4) in noise. Table 4 and Figure 1show the findings of pre- and post-implantation speech recognition tests, along with thep value for the overall test of differences between the evaluation time points analyzedwith repeated measures ANOVA. For both Dantale I and HINT, the overall test of changerevealed a significant improvement in speech recognition in all tested settings (p < 0.001).The Bonferroni adjusted pairwise comparisons revealed the highest changes between T0and T1, but also small insignificant improvements between T1 and T2, indicating that thereis an improvement potential beyond T1, even though the rate of progress plateaus at T2.
Table 4. Summary of audiometric data showing significant improvements between the evaluationtime points T0 (baseline), T1, and T2 (post-implantation) using a repeated measures ANOVA. Meandifference between T0 and T2, as well as p values end effect sizes (η2
partial) are reported.
n T0 T1 T2 Mean Difference(T0–T2) a p-Value η2
partial
DantaleBest aided with
lipreading (%) 35 68 (61–75) 85 (80–90) 89 (85–92) 21 (13–28) <0.001 0.588
Best aided in quietwithout lipreading (%) 38 52 (45–60) 76 (70–82) 79 (74–85) 27 (19–35) <0.001 0.667
Best aided in noisewithout lipreading (%) 36 24 (18–29) 46 (40–52) 46 (39–53) 22 (13–31) <0.001 0.516
CI ear in quiet (%) 31 26 (18–34) 66 (59–74) 70 (62–77) 43 (33–53) <0.001 0.794CI ear in noise (%) 31 12 (7–16) 42 (34–50) 42 (33–50) 30 (20–40) <0.001 0.663
HINTHINT-Q: sentences (%) 16 55 (43–67) 75 (60–90) 81 (67–95) 26 (9–43) <0.001 0.528HINT-Q: words (%) 16 75 (64–86) 87 (76–98) 90 (80–99) 15 (3–26) 0.003 0.446HINT-N: sentences (%) 15 38 (25–51) 58 (44–72) 64 (48–80) 26 (1–50) 0.012 0.370HINT-N: words (%) 15 58 (45–72) 74 (64–85) 80 (68–91) 21 (4–39) 0.006 0.432
Test scores are presented as means and 95% confidence interval in parantheses; CI: cochlear implant; HINT: Hear-ing in Noise test. a Bonferroni adjusted pairwise comparison between T0 and T2.
J. Clin. Med. 2022, 11, x FOR PEER REVIEW 10 of 17
3.2.2. Dantale I Results
In the unaided condition, the Dantale I yielded an average score of 6% (2–10) (all
ranges represent the 95 % confidence intervals) in quiet and 3% (1–4) in noise. Table 4 and
Figure 1 show the findings of pre- and post-implantation speech recognition tests, along
with the p value for the overall test of differences between the evaluation time points
analyzed with repeated measures ANOVA. For both Dantale I and HINT, the overall test
of change revealed a significant improvement in speech recognition in all tested settings
(p < 0.001). The Bonferroni adjusted pairwise comparisons revealed the highest changes
between T0 and T1, but also small insignificant improvements between T1 and T2,
indicating that there is an improvement potential beyond T1, even though the rate of
progress plateaus at T2.
Table 4. Summary of audiometric data showing significant improvements between the evaluation
time points T0 (baseline), T1, and T2 (post-implantation) using a repeated measures ANOVA. Mean
difference between T0 and T2, as well as p values end effect sizes (��������� ) are reported.
n T0 T1 T2 Mean Difference
(T0–T2) a p-Value ��������
�
Dantale
Best aided with lipreading (%) 35 68 (61–75) 85 (80–90) 89 (85–92) 21 (13–28) <0.001 0.588
Best aided in quiet
without lipreading (%) 38 52 (45–60) 76 (70–82) 79 (74–85) 27 (19–35) <0.001 0.667
Best aided in noise
without lipreading (%) 36 24 (18–29) 46 (40–52) 46 (39–53) 22 (13–31) <0.001 0.516
CI ear in quiet (%) 31 26 (18–34) 66 (59–74) 70 (62–77) 43 (33–53) <0.001 0.794
CI ear in noise (%) 31 12 (7–16) 42 (34–50) 42 (33–50) 30 (20–40) <0.001 0.663
HINT
HINT-Q: sentences (%) 16 55 (43–67) 75 (60–90) 81 (67–95) 26 (9–43) <0.001 0.528
HINT-Q: words (%) 16 75 (64–86) 87 (76–98) 90 (80–99) 15 (3–26) 0.003 0.446
HINT-N: sentences (%) 15 38 (25–51) 58 (44–72) 64 (48–80) 26 (1–50) 0.012 0.370
HINT-N: words (%) 15 58 (45–72) 74 (64–85) 80 (68–91) 21 (4–39) 0.006 0.432
Test scores are presented as means and 95% confidence interval in parantheses; CI: cochlear implant;
HINT: Hearing in Noise test. a Bonferroni adjusted pairwise comparison between T0 and T2.
Figure 1. Scores in five Dantale and four HINT conditions at different time points (T0, T1, and T2)
of the patient cohort (n = 39) are represented in box plots. Columns present means and whiskers
present 95% confidence intervals.
In the best-aided audiovisual condition with the option of lipreading, patients
improved from 68% (62–72) at T0 to 89% (85–92) at T2 (p < 0.001), with a 3 percent point
rise from T1 to T2. When patients were not allowed to lipread, their performance
improved from 52% (45–60) to 79% (74–85) in the quiet condition and from 24% (18–29) to
46% (39–53) in the noise condition. When the CI ear was tested monaurally in both quiet
and noise, significant improvements were reported. In quiet, the patients improved from
Figure 1. Scores in five Dantale and four HINT conditions at different time points (T0, T1, and T2) ofthe patient cohort (n = 39) are represented in box plots. Columns present means and whiskers present95% confidence intervals.
In the best-aided audiovisual condition with the option of lipreading, patients im-proved from 68% (62–72) at T0 to 89% (85–92) at T2 (p < 0.001), with a 3 percent point risefrom T1 to T2. When patients were not allowed to lipread, their performance improved

J. Clin. Med. 2022, 11, 2257 9 of 15
from 52% (45–60) to 79% (74–85) in the quiet condition and from 24% (18–29) to 46% (39–53)in the noise condition. When the CI ear was tested monaurally in both quiet and noise,significant improvements were reported. In quiet, the patients improved from 26% (18–34)at T0 to 70% (62–77) at T2, which was the largest mean difference increase found across alltests, with a 43% (33–53) improvement from T0 to T2 (p < 0.001). In noise, patients scored12% (7–16) at T0 and 42% (33–50) at T2. All Dantale I test conditions showed significantimprovements (p < 0.001).
3.2.3. HINT Results
The average pre-implantation sentence score for HINT in quiet was 55% (43–67), whilethe average post-implantation score at T2 was 81 (67–95). The average pre-implantationsentence score for HINT in noise was 38% (25–51) and 64% (48–80) at T2. The averagepre-implantation word score for HINT in quiet was 75% (64–86) and the post-implantationscore at T2 was 90% (80–99). The average pre-implantation word scores for HINT in noisewas 58% (45–72) and the post-implantation score at T2 was 80% (68–91). All HINT testconditions showed significant improvements (p < 0.05)
In summary, when pre- and post-implantation tests are compared, patients showsignificantly better speech perception scores on all audiometric outcome measures (Table 4),with the greatest improvement in the monaural CI ear only test conditions. Between pre-implantation and the first post-implantation follow-up, the greatest significant change inspeech perception scores occurred.
3.3. Patient-Reported Outcomes
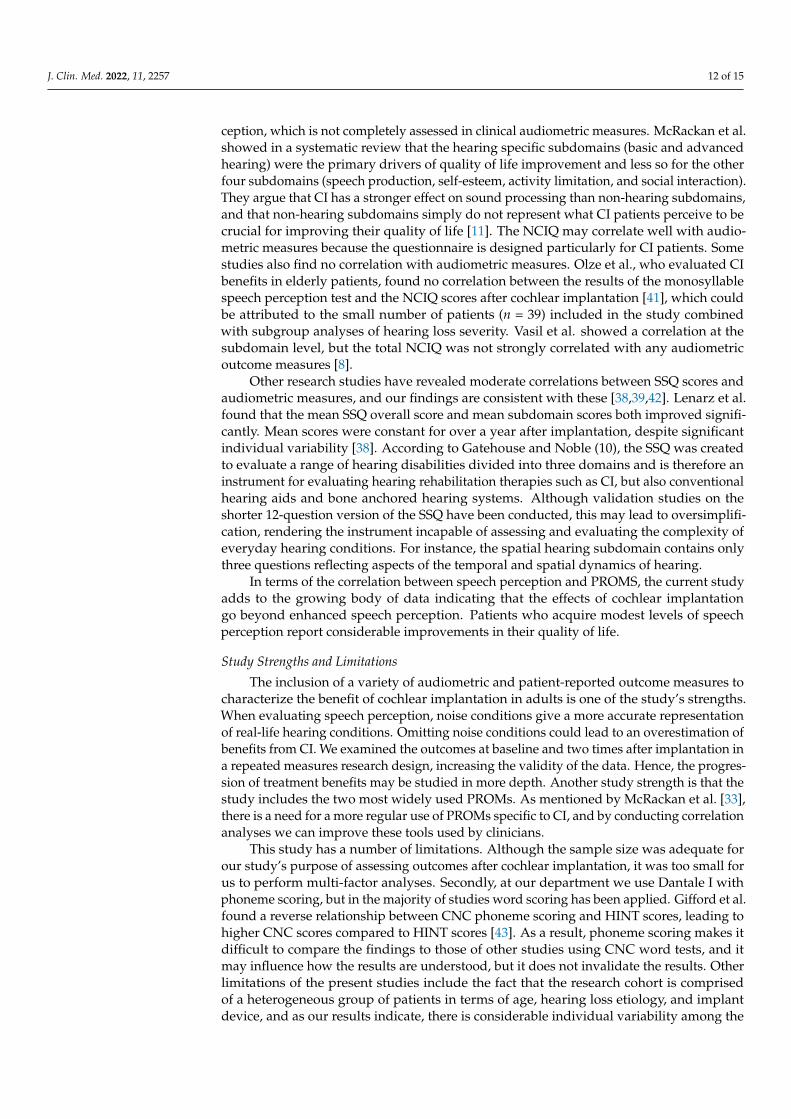
Table 5 and Figure 2 present PROM results from pre-implantation to post-implantation.
Table 5. Summary of patient-reported outcome measures showing significant improvements betweenthe evaluation time points T0 (baseline), T1, and T2 (post-implantation) using a Wilcoxon signed ranktest. Z-statistics and p values are reported.
T0 T1 T2
Wilcoxon Signed Rank Test
T0–T1 T0–T2Z p-Value Z p-Value
NCIQ total score 264 (239–330) 384 (324–437) 377 (321–441) −5.2 <0.001 −5.0 <0.001
Physical subdomainsBasic sound perception 35 (28–51) 63 (49–78) 63 (60–72) −5.2 <0.001 −4.9 <0.001Advanced sound perception 38 (28–53) 56 (40–71) 58 (44–74) −4.8 <0.001 −4.4 <0.001Speech production 68 (58–85) 75 (64–90) 78 (65–86) −2.6 0.009 −2.1 0.024
Psychological subdomainSelf-esteem 45 (33–58) 61 (48–76) 58 (50–74) −4.5 <0.001 −4.1 <0.001
Social subdomainsActivity limitations 45 (37–53) 67 (54–80) 67 (52–77) −5.2 <0.001 −4.8 <0.001Social interactions 50 (33–60) 69 (53–78) 65 (50–79) −4.8 <0.001 −4.7 <0.001
SSQ total score 24 (18–35) 47 (23–64) 51 (37–70) −3.7 <0.001 −4.1 <0.001
Speech 7 (4–14) 15 (8–26) 18 (10–26) −4.4 <0.001 −4.4 <0.001Spatial 6 (3–10) 12 (6–17) 11 (7–21) −3.6 <0.001 −3.2 0.002Qualities 10 (6–16) 22 (9–25) 20 (15–29) −2.9 0.004 −4.0 <0.001
Test scores are presented as medians and 25th and 75th percentiles in parentheses; NCIQ, Nijmegen CochlearImplant Questionnaire; SSQ, Speech, Spatial, and Qualities of Hearing Scale.

J. Clin. Med. 2022, 11, 2257 10 of 15J. Clin. Med. 2022, 11, x FOR PEER REVIEW 12 of 17
Figure 2. Subdomain percentile scores for the Nijmegen Cochlear Implant Questionnaire (NCIQ)
and the Speech, Spatial, and Qualities of Hearing Scale (SSQ) at T0, T1 and T2. Boxes present the
median and the 25th and 75th percentiles. Whiskers present the maximum and minimum values.
Total scores are presented on the right y axis.
3.3.1. NCIQ Results
The median NCIQ total score improved by 113 points (264 (239–330) at T0 vs. 377
(321–441) at T2, p < 0.001). All NCIQ subdomain scores improved significantly from T0 to
T2 (p < 0.05) (Table 5 and Figure 2). The greatest significant improvements were seen in
the basic and advanced sound perception subdomains, whereas the least improvement
was seen in the speech production subdomain. These findings suggest that after being
implanted, patients had enhanced basic and advanced sound perception, less limitations
in activity level and social interaction, as well as higher self-esteem. This also strongly
suggests that patients’ general quality of life improves after being implanted.
3.3.2. SSQ12 Results
The SSQ total score increased with 27 points (24 (18–33) at T0 vs. 51 (37–70) at T2, p <
0.001). The scores on all SSQ subdomains improved significantly (Table 5 and Figure 2).
While there is a significant increase in NCIQ and SSQ scores between baseline and
post-implantation, there is only little improvement between 4 and 14 months after
implantation. After the first post-implantation follow-up, both audiometric and patient-
reported outcome measures, as assessed by NCIQ and SSQ, begin to plateau.
3.4. Comparisons between Audiometric and Patient-Reported Outcome Measures
At the second post-implantation follow-up (T2), the four Dantale conditions (without
the best-aided audiovisual condition), have significant positive correlations with the
NCIQ total score (ρ = 0.44–0.53, Table 6). The SSQ total score and Dantale I scores showed
significant correlations (range, ρ = 0.30–0.44), however best-aided in noise without
lipreading and the CI ear in noise conditions were insignificant (p = 0.124 and p = 0.102,
respectively). Dantale I and NCIQ revealed a statistically significant correlation at the 14-
month evaluation, meaning that patients who do well on Dantale also perform well on
NCIQ and, to some extent, on SSQ, and vice versa. HINT results do not correlate with
NCIQ and SSQ results (p > 0.05).
Table 6. Correlations between audiometric and patient-reported outcome measures at the second
post-implantation follow-up (T2) using Spearman coefficients.
Dantale HINT
Test Condition
Best Aided in
Quiet without
Lipreading
Best Aided in
Noise without
Lipreading
CI Ear in
Quiet
CI Ear in
Noise
HINT-Q:
Sentences
HINT-Q:
Words
HINT-N:
Sentences
HINT-N:
Words
NCIQ total score 0.53 *** 0.44 ** 0.48 ** 0.47 ** 0.15 0.13 0.21 0.26
SSQ total score 0.45 * 0.30 0.45 * 0.32 −0.02 0.02 0.07 0.12
Figure 2. Subdomain percentile scores for the Nijmegen Cochlear Implant Questionnaire (NCIQ) andthe Speech, Spatial, and Qualities of Hearing Scale (SSQ) at T0, T1 and T2. Boxes present the medianand the 25th and 75th percentiles. Whiskers present the maximum and minimum values. Total scoresare presented on the right y axis.
3.3.1. NCIQ Results
The median NCIQ total score improved by 113 points (264 (239–330) at T0 vs. 377(321–441) at T2, p < 0.001). All NCIQ subdomain scores improved significantly from T0 toT2 (p < 0.05) (Table 5 and Figure 2). The greatest significant improvements were seen inthe basic and advanced sound perception subdomains, whereas the least improvementwas seen in the speech production subdomain. These findings suggest that after beingimplanted, patients had enhanced basic and advanced sound perception, less limitationsin activity level and social interaction, as well as higher self-esteem. This also stronglysuggests that patients’ general quality of life improves after being implanted.
3.3.2. SSQ12 Results
The SSQ total score increased with 27 points (24 (18–33) at T0 vs. 51 (37–70) at T2,p < 0.001). The scores on all SSQ subdomains improved significantly (Table 5 and Figure 2).
While there is a significant increase in NCIQ and SSQ scores between baseline and post-implantation, there is only little improvement between 4 and 14 months after implantation.After the first post-implantation follow-up, both audiometric and patient-reported outcomemeasures, as assessed by NCIQ and SSQ, begin to plateau.
3.4. Comparisons between Audiometric and Patient-Reported Outcome Measures
At the second post-implantation follow-up (T2), the four Dantale conditions (withoutthe best-aided audiovisual condition), have significant positive correlations with the NCIQtotal score (ρ = 0.44–0.53, Table 6). The SSQ total score and Dantale I scores showed signif-icant correlations (range, ρ = 0.30–0.44), however best-aided in noise without lipreadingand the CI ear in noise conditions were insignificant (p = 0.124 and p = 0.102, respectively).Dantale I and NCIQ revealed a statistically significant correlation at the 14-month evalua-tion, meaning that patients who do well on Dantale also perform well on NCIQ and, tosome extent, on SSQ, and vice versa. HINT results do not correlate with NCIQ and SSQresults (p > 0.05).

J. Clin. Med. 2022, 11, 2257 11 of 15
Table 6. Correlations between audiometric and patient-reported outcome measures at the secondpost-implantation follow-up (T2) using Spearman coefficients.
Dantale HINT
Test ConditionBest Aided inQuiet without
Lipreading
Best Aided inNoise without
LipreadingCI Ear in
QuietCI Ear in
NoiseHINT-Q:
SentencesHINT-Q:Words
HINT-N:Sentences
HINT-N:
Words
NCIQ total score 0.53 *** 0.44 ** 0.48 ** 0.47 ** 0.15 0.13 0.21 0.26SSQ total score 0.45 * 0.30 0.45 * 0.32 −0.02 0.02 0.07 0.12
CI: cochlear implant; HINT-Q/N: Hearing in noise test quiet/noise; NCIQ: Nijmegen cochlear implant question-naire; SSQ: Speech, spatial, and qualities of hearing. * p < 0.05; ** p < 0.01; *** p < 0.001.
4. Discussion
In this prospective follow-up study, we combined audiometric test results (Dantaleand HINT) and PROMs (NCIQ and SSQ) to investigate whether statistically significantchanges had occurred over time and if there was a correlation between the measures. Inthe previous study, patients showed excellent improvement in Dantale and moderately toexcellent improvements in HINT, and the NCIQ showed a moderate positive correlationwith audiometric test scores. When compared to HA in the best-aided condition priorto implantation, speech recognition scores assessed with Dantale I and HINT in quietand noise were significantly improved at 4 and 14 months following implantation. Thegreatest improvements occurred before T1, albeit non-significant minor improvementswere reported at T2, and we observed considerable individual variation in the test results.
Speech perception improved significantly between the baseline and the 14-monthfollow-up, with excellent improvements in the CI-monaurally-aided condition in both quietand noise. On average, Dantale I scores improved by 29 percentage points, and HINTscores improved by 22 percentage points. Our results agree with previous studies in thefield [3,23–25]. Sladen et al., Kelsall et al., and Buchman et al. reported average improve-ments in speech recognition on the CNC word test of 57 percent, 51 percent, and 41 percent,respectively [3,6,25], at 12 months post-implantation. Firszt et al. found that half of theindividuals scored 80 percent or better on the HINT sentences in a quiet setting. Severalother research studies have found comparable improvements in audiometric outcomesover time [23,26–31], with most of the improvements happing before 6 months of CI usage.Cusumano et al. reported that word scores continued to improve 3 years after implantation,but at a slower rate [23].
In addition to improved speech recognition, the present study also demonstratessignificant improvements in quality of life measured by NCIQ and SSQ total scores as wellas subdomain scores. The NCIQ total score improved by 43 percent from 264 (239–330)to 377 (321–441), whereas the SSQ total score improved by 113 percent from 24 (18–35)to 51 (37–70). All NCIQ subdomains, including basic sound perception, advanced soundperception, speech production, self-esteem, activity, and social interactions also improvedsignificantly between the baseline and 14 months of follow-up. The same is observed for theSSQ: The three subdomains (speech, spatial, and qualities) all improved significantly. BothPROMs are frequently utilized in other studies, with the NCIQ being the more common,and several studies have reported similar results on both the NCIQ [8,23,26,28,31–36] andthe SSQ [27,30,37–39].
Boisvert et al. discovered 16 different PROMs being used to evaluate the benefits of CI.The NCIQ and SSQ were the most utilized across 52 research studies, with 17 percent usingthe NCIQ and 15 percent using the SSQ. Our findings are consistent with those of otherstudies that found a significant correlation between NCIQ scores and speech perceptiontest scores [26,28,32,36]. A systematic review and a scoping review both reveal moderatecorrelations between PROM outcomes and audiometric outcomes [4,40]. In recent studies,Vasil et al., Plath et al., and Sladen et al. show moderate correlations between the NCIQsubdomains and audiometric measures, and the physical subdomain, especially, stands out,comprising basic and advanced speech perception and speech production [8,25,34]. Thisfinding illustrates that CI patients have increased their capacity for audiovisual speech per-
J. Clin. Med. 2022, 11, 2257 12 of 15
ception, which is not completely assessed in clinical audiometric measures. McRackan et al.showed in a systematic review that the hearing specific subdomains (basic and advancedhearing) were the primary drivers of quality of life improvement and less so for the otherfour subdomains (speech production, self-esteem, activity limitation, and social interaction).They argue that CI has a stronger effect on sound processing than non-hearing subdomains,and that non-hearing subdomains simply do not represent what CI patients perceive to becrucial for improving their quality of life [11]. The NCIQ may correlate well with audio-metric measures because the questionnaire is designed particularly for CI patients. Somestudies also find no correlation with audiometric measures. Olze et al., who evaluated CIbenefits in elderly patients, found no correlation between the results of the monosyllablespeech perception test and the NCIQ scores after cochlear implantation [41], which couldbe attributed to the small number of patients (n = 39) included in the study combinedwith subgroup analyses of hearing loss severity. Vasil et al. showed a correlation at thesubdomain level, but the total NCIQ was not strongly correlated with any audiometricoutcome measures [8].
Other research studies have revealed moderate correlations between SSQ scores andaudiometric measures, and our findings are consistent with these [38,39,42]. Lenarz et al.found that the mean SSQ overall score and mean subdomain scores both improved signifi-cantly. Mean scores were constant for over a year after implantation, despite significantindividual variability [38]. According to Gatehouse and Noble (10), the SSQ was createdto evaluate a range of hearing disabilities divided into three domains and is therefore aninstrument for evaluating hearing rehabilitation therapies such as CI, but also conventionalhearing aids and bone anchored hearing systems. Although validation studies on theshorter 12-question version of the SSQ have been conducted, this may lead to oversimplifi-cation, rendering the instrument incapable of assessing and evaluating the complexity ofeveryday hearing conditions. For instance, the spatial hearing subdomain contains onlythree questions reflecting aspects of the temporal and spatial dynamics of hearing.
In terms of the correlation between speech perception and PROMS, the current studyadds to the growing body of data indicating that the effects of cochlear implantationgo beyond enhanced speech perception. Patients who acquire modest levels of speechperception report considerable improvements in their quality of life.
Study Strengths and Limitations
The inclusion of a variety of audiometric and patient-reported outcome measures tocharacterize the benefit of cochlear implantation in adults is one of the study’s strengths.When evaluating speech perception, noise conditions give a more accurate representationof real-life hearing conditions. Omitting noise conditions could lead to an overestimation ofbenefits from CI. We examined the outcomes at baseline and two times after implantation ina repeated measures research design, increasing the validity of the data. Hence, the progres-sion of treatment benefits may be studied in more depth. Another study strength is that thestudy includes the two most widely used PROMs. As mentioned by McRackan et al. [33],there is a need for a more regular use of PROMs specific to CI, and by conducting correlationanalyses we can improve these tools used by clinicians.
This study has a number of limitations. Although the sample size was adequate forour study’s purpose of assessing outcomes after cochlear implantation, it was too small forus to perform multi-factor analyses. Secondly, at our department we use Dantale I withphoneme scoring, but in the majority of studies word scoring has been applied. Gifford et al.found a reverse relationship between CNC phoneme scoring and HINT scores, leading tohigher CNC scores compared to HINT scores [43]. As a result, phoneme scoring makes itdifficult to compare the findings to those of other studies using CNC word tests, and itmay influence how the results are understood, but it does not invalidate the results. Otherlimitations of the present studies include the fact that the research cohort is comprisedof a heterogeneous group of patients in terms of age, hearing loss etiology, and implantdevice, and as our results indicate, there is considerable individual variability among the

J. Clin. Med. 2022, 11, 2257 13 of 15
study subjects. The almost overlapping test intervals in time between each follow-upexamination in the clinic may potentially contribute to this variability. This can contributeto non-significant differences between T1 and T2. Another limitation of the present studyis the missing data, especially on the follow-up and mostly seen in HINT and SSQ results.Some HINT data were missing either because they were omitted owing to poor Dantaleresults, poor cooperation from elderly patients who struggled with fatigue or attentionthroughout the examination, or department lockdown during the COVID-19 pandemics, toname a few reasons. HINT results may then be overestimated as poorer performers areexcluded. Some SSQ data were lost to follow-up. We did not examine the possible impactof reduced cognitive capacity and comorbidities, nor did we include data on cigaretteand alcohol consumption, as well as physical activity. A better understanding of theseaspects in future studies may allow us to distinguish between low-performing and high-performing patients.
5. Conclusions
The majority of patients in our study benefited from CI in terms of speech perceptionand quality of life, and they experienced considerable improvements during the firstpostoperative follow-up, which remained stable and plateaued at the second follow-up. Inthis longitudinal study of a cohort of adult SNHL patients treated with unilateral CI, DantaleI and HINT audiometric tests, as well as patient-reported outcome measures includingthe NCIQ and SSQ, revealed significant improvements in speech perception and qualityof life. In most conditions, NCIQ and SSQ showed a moderate correlation with DantaleI. HINT showed no correlation with NCIQ or SSQ 14 months after implantation. The useof audiometric and CI-specific patient-reported outcome measures in our study providesdetailed evidence of the treatment benefits of cochlear implantation in adults, which mayhelp physicians to advise patients in their treatment decision and align treatment benefitexpectations. This study, along with other recent studies on the benefits of CI on hearing, ishelping to establish the framework for the development of new Danish CI selection criteria.
Author Contributions: Conceptualization, N.C.W. and P.C.-T.; methodology, N.C.W. and P.C.-T.;formal analysis, K.M.B.R.; data curation, N.C.W.; writing—original draft preparation, K.M.B.R.;writing—review and editing, K.M.B.R., N.C.W., M.B., M.G.S. and P.C.-T. All authors have read andagreed to the published version of the manuscript.
Funding: K.M.B.R. has received a research grant from the William Demant Foundation, whichwas donated to Copenhagen Hearing and Balance Centre at Rigshospitalet, University Hospitalof Copenhagen.
Institutional Review Board Statement: The study was approved by The Danish National Committeeon Health Research Ethics (H-17034918) and The Danish Data Protection Agency (RH-2017-308).
Informed Consent Statement: Informed consent was obtained from all subjects involved in the study.
Data Availability Statement: The raw data supporting the conclusions of this article will be madeavailable by the authors, without undue reservation.
Conflicts of Interest: The authors declare no conflict of interest.
Abbreviations
CI cochlear implantdB decibelHA hearing aidHINT hearing in noise testNCIQ Nijmegen Cochlear Implant QuestionnairePROM patient-reported outcome measure

J. Clin. Med. 2022, 11, 2257 14 of 15
PTA6 pure-tone audiometry average for six frequenciesSNHL sensorineural hearing lossSNR signal-to-noise ratioSRS speech recognition scoreSSQ Speech, Spatial, and Qualities of Hearing Scale
References1. Choi, J.S.; Contrera, K.J.; Betz, J.F.; Blake, C.R.; Niparko, J.K.; Lin, F.R. Long-Term Use of Cochlear Implants in Older Adults. Otol.
Neurotol. 2014, 35, 815–820. [CrossRef] [PubMed]2. Contrera, K.J.; Sung, Y.K.; Betz, J.; Li, L.; Lin, F.R. Change in loneliness after intervention with cochlear implants or hearing aids.
Laryngoscope 2017, 127, 1885–1889. [CrossRef] [PubMed]3. Kelsall, D.; Lupo, J.; Biever, A. Longitudinal outcomes of cochlear implantation and bimodal hearing in a large group of adults: A
multicenter clinical study. Am. J. Otolaryngol. 2021, 42, 102773. [CrossRef] [PubMed]4. Gaylor, J.M.; Raman, G.; Chung, M.; Lee, J.; Rao, M.; Lau, J.; Poe, D.S. Cochlear Implantation in Adults: A Systematic Review and
Meta-analysis. JAMA Otolaryngol. Head Neck Surg. 2013, 139, 265. [CrossRef]5. West, N.C.; Kressner, A.A.; Baungaard, L.H.; Sandvej, M.G.; Bille, M.; Cayé-Thomasen, P. Nordic results of cochlear implantation
in adults: Speech perception and patient reported outcomes. Acta Oto-Laryngol. 2020, 140, 939–947. [CrossRef]6. Buchman, C.A.; Herzog, J.A.; McJunkin, J.L.; Wick, C.C.; Durakovic, N.; Firszt, J.B.; Kallogjeri, D. Assessment of Speech
Understanding After Cochlear Implantation in Adult Hearing Aid Users. JAMA Otolaryngol. Head Neck Surg. 2020, 146, 916.[CrossRef]
7. Yuen, E.; Ma, C.; Nguyen, S.A.; Meyer, T.A.; Lambert, P.R. The Effect of Cochlear Implantation on Tinnitus and Quality of Life: ASystematic Review and Meta-analysis. Otol. Neurotol. 2021, 42, 1113–1122. [CrossRef]
8. Vasil, K.J.; Lewis, J.; Tamati, T.; Ray, C.; Moberly, A.C. How Does Quality of Life Relate to Auditory Abilities? A Subitem Analysisof the Nijmegen Cochlear Implant Questionnaire. J. Am. Acad. Audiol. 2020, 31, 292–301. [CrossRef]
9. Olze, H.; Szczepek, A.J.; Haupt, H.; Zirke, N.; Graebel, S.; Mazurek, B. The impact of cochlear implantation on tinnitus, stress andquality of life in postlingually deafened patients. Audiol. Neurootol. 2012, 17, 2–11. [CrossRef]
10. Dammeyer, J.; Chapman, M. Prevalence and characteristics of self-reported physical and mental disorders among adults withhearing loss in Denmark: A national survey. Soc. Psychiatry Psychiatr. Epidemiol. 2017, 52, 807–813. [CrossRef]
11. McRackan, T.R.; Bauschard, M.; Hatch, J.L.; Franko-Tobin, E.; Droghini, H.R.; Velozo, C.A.; Nguyen, S.A.; Dubno, J.R. Meta-analysis of Cochlear Implantation Outcomes Evaluated With General Health-related Patient-reported Outcome Measures. Otol.Neurotol. 2018, 39, 29–36. [CrossRef] [PubMed]
12. Sundhedsdatastyrelsen. Cochlear Implant in Denmark 2005–2018; Sundhedsdatastyrelsen: Copenhagen, Danmark, 2020.13. Dowell, R.C.; Hollow, R.; Winton, E. Outcomes for Cochlear Implant Users With Significant Residual Hearing: Implications for
Selection Criteria in Children. Arch. Otolaryngol. Head Neck Surg. 2004, 130, 575–581. [CrossRef] [PubMed]14. Danish Society of Otorhinolaryngology Head and Neck Surgery. Udredning af voksne til CI. 2014, Volume 1. Available online:
http://dsohh.dk/wp-content/uploads/2015/04/DSOHH-KKR-CI-voksne1.pdf (accessed on 4 April 2022).15. Elberling, C.; Ludvigsen, C.; Lyregaard, P.E. Dantale: A new danish speech material. Scand. Audiol. 1989, 18, 169–175. [CrossRef]
[PubMed]16. FORCE Technology, Teknisk Audiologisk Laboratorium. Instructions for Setting Up and Calibrating Equipment for Audiometry in Free
Field Translated from Danish. FORCE Technology; Teknisk Audiologisk Laboratorium: Odense, Denmark, 2020; Available online:https://audiologi.dk/wp-content/uploads/2021/01/FF-Vejledning-3ed2.pdf (accessed on 4 April 2022).
17. Nilsson, M.; Soli, S.D.; Sullivan, J.A. Development of the Hearing In Noise Test for the measurement of speech reception thresholdsin quiet and in noise. J. Acoust. Soc. Am. 1994, 95, 1085–1099. [CrossRef]
18. Nielsen, J.B.; Dau, T. The Danish hearing in noise test. Int. J. Audiol. 2011, 50, 202–208. [CrossRef]19. Hinderink, J.B.; Krabbe, P.F.M.; Van Den Broek, P. Development and application of a health-related quality-of-life instrument for
adults with cochlear implants: The Nijmegen Cochlear Implant Questionnaire. Otolaryngol. Head Neck Surg. 2000, 123, 756–765.[CrossRef]
20. Gatehouse, S.; Noble, W. The Speech, Spatial and Qualities of Hearing Scale (SSQ). Int. J. Audiol. 2004, 43, 85–99. [CrossRef]21. IBM Corp. IBM SPSS Statistics for Windows; Version 25.0; IBM CorpReleased: Armonk, NY, USA, 2017.22. Graphpad Prism Softare. Graphpad Prism, Version 9.0.0 for Windows; Graphpad Prism Softare: San Diego, CA, USA, 2020; Available
online: https://www.graphpad.com (accessed on 4 April 2022).23. Cusumano, C.; Friedmann, D.R.; Fang, Y.; Wang, B.; Roland, J.T.J.; Waltzman, S.B. Performance Plateau in Prelingually and
Postlingually Deafened Adult Cochlear Implant Recipients. Otol. Neurotol. 2017, 38, 334–338. [CrossRef]24. Budenz, C.L.; Cosetti, M.K.; Coelho, D.H.; Birenbaum, B.; Babb, J.; Waltzman, S.; Roehm, P.C. The Effects of Cochlear Implantation
on Speech Perception in Older Adults. J. Am. Geriatr. Soc. 2011, 59, 446–453. [CrossRef]25. Sladen, D.P.; Peterson, A.; Schmitt, M.; Olund, A.; Teece, K.; Dowling, B.; DeJong, M.; Breneman, A.; Beatty, C.W.; Carlson, M.L.;
et al. Health-related quality of life outcomes following adult cochlear implantation: A prospective cohort study. Cochlear Implant.Int. 2017, 18, 130–135. [CrossRef]

J. Clin. Med. 2022, 11, 2257 15 of 15
26. Häußler, S.M.; Knopke, S.; Wiltner, P.; Ketterer, M.; Grabel, S.; Olze, H. Long-term Benefit of Unilateral Cochlear Implantation onQuality of Life and Speech Perception in Bilaterally Deafened Patients. Otol. Neurotol. 2019, 40, e430–e440. [CrossRef]
27. Wallhäusser-Franke, E.; Balkenhol, T.; Hetjens, S.; Rotter, N.; Servais, J.J. Patient Benefit Following Bimodal CI-provision:Self-reported Abilities vs. Hearing Status. Front. Neurol. 2018, 9, 753. [CrossRef] [PubMed]
28. Hirschfelder, A.; Gräbel, S.; Olze, H. The impact of cochlear implantation on quality of life: The role of audiologic performanceand variables. Otolaryngol. Head Neck Surg. 2008, 138, 357–362. [CrossRef] [PubMed]
29. Olze, H.; Gräbel, S.; Förster, U.; Zirke, N.; Huhnd, L.E.; Haupt, H.; Mazurek, B. Elderly patients benefit from cochlear implantationregarding auditory rehabilitation, quality of life, tinnitus, and stress. Laryngoscope 2012, 122, 196–203. [CrossRef] [PubMed]
30. Tavora-Vieira, D.; Marino, R.; Acharya, A.; Rajan, G.P. The impact of cochlear implantation on speech understanding, subjectivehearing performance, and tinnitus perception in patients with unilateral severe to profound hearing loss. Otol. Neurotol. 2015, 36,430–436. [CrossRef]
31. Carlson, M.L.; Driscoll, C.L.W.; Gifford, R.H.; McMenomey, S.O. Cochlear implantation: Current and future device options.Otolaryngol. Clin. N. Am. 2012, 45, 221–248. [CrossRef]
32. Cohen, S.M.; Labadie, R.F.; Dietrich, M.S.; Haynes, D.S. Quality of Life in Hearing-Impaired Adults: The Role of CochlearImplants and Hearing Aids. Otolaryngol. Head Neck Surg. 2004, 131, 413–422. [CrossRef]
33. McRackan, T.R.; Bauschard, M.; Hatch, J.L.; Franko-Tobin, E.; Droghini, H.R.; Nguyen, S.A.; Dubno, J.R. Meta-analysis ofquality-of-life improvement after cochlear implantation and associations with speech recognition abilities. Laryngoscope 2018, 128,982–990. [CrossRef]
34. Plath, M.; Marienfeld, T.; Sand, M.; van de Weyer, P.S.; Praetorius, M.; Plinkert, P.K.; Baumann, I.; Zaoui, K. Prospective study onhealth-related quality of life in patients before and after cochlear implantation. Eur. Arch. Oto-Rhino-Laryngol. 2021, 279, 115–125.[CrossRef]
35. Hänsel, T.; Gauger, U.; Bernhard, N.; Behzadi, N.; Ventura, M.E.R.; Hofmann, V.; Olze, H.; Knopke, S.; Todt, I.; Coordes,A. Meta-analysis of subjective complaints of vertigo and vestibular tests after cochlear implantation. Laryngoscope 2018, 128,2110–2123. [CrossRef]
36. Damen, G.W.J.A.; Beynon, A.J.; Krabbe, P.F.M.; Mulder, J.J.S.; Mylanus, E.A.M. Cochlear implantation and quality of life inpostlingually deaf adults: Long-term follow-up. Otolaryngol. Head Neck Surg. 2007, 136, 597–604. [CrossRef] [PubMed]
37. Fuller, C.; Free, R.; Maat, B.; Baskent, D. Musical background not associated with self-perceived hearing performance or speechperception in postlingual cochlear-implant users. J. Acoust. Soc. Am. 2012, 132, 1009–1016. [CrossRef] [PubMed]
38. Lenarz, T.; Muller, L.; Czerniejewska-Wolska, H.; Varela, H.V.; Dotú, C.O.; Durko, M.; Irujo, A.H.; Piszczatowski, B.; Zadrozniak,M.; Irwin, C.; et al. Patient-Related Benefits for Adults with Cochlear Implantation: A Multicultural Longitudinal ObservationalStudy. Audiol. Neurootol. 2017, 22, 61–73. [CrossRef] [PubMed]
39. Dingemanse, G.; Goedegebure, A. The relation of hearing-specific patient-reported outcome measures with speech perceptionmeasures and acceptable noise levels in cochlear implant users. Int. J. Audiol. 2020, 59, 416–426. [CrossRef]
40. Boisvert, I.; Reis, M.; Au, A.; Cowan, R.; Dowell, R.C. Cochlear implantation outcomes in adults: A scoping review. PLoS ONE.2020, 15, e0232421. [CrossRef]
41. Olze, H.; Szczepek, A.J.; Haupt, H.; Förster, U.; Zirke, N.; Gräbel, S.; Mazurek, B. Cochlear implantation has a positive influenceon quality of life, tinnitus, and psychological comorbidity. Laryngoscope 2011, 121, 2220–2227. [CrossRef]
42. Noble, W.; Tyler, R.; Dunn, C.; Bhullar, N. Unilateral and bilateral cochlear implants and the implant-plus-hearing-aid profile:Comparing self-assessed and measured abilities. Int. J. Audiol. 2008, 47, 505–514. [CrossRef]
43. Gifford, R.H.; Shallop, J.K.; Peterson, A.M. Speech recognition materials and ceiling effects: Considerations for cochlear implantprograms. Audiol. Neurootol. 2008, 13, 193–205. [CrossRef]