Multiple Meningioma Resection by Bilateral Extended ... - MDPI
Upload
independentCategory
view
0download
0
Long-Term Interaction Between Microglial Cells andCochlear Nucleus Neurons After Bilateral CochlearAblation
Ver�onica Fuentes-Santamarı́a,* Juan Carlos Alvarado, and Jos�e Manuel Juiz
Facultad de Medicina e Instituto de Investigaci�on en Discapacidades Neurol�ogicas (IDINE), Universidad de Castilla—La Mancha,
02006 Albacete, Spain
ABSTRACTThe removal of afferent activity has been reported to
modify neuronal activity in the cochlear nucleus of adult
rats. After cell damage, microglial cells are rapidly acti-
vated, initiating a series of cellular responses that influ-
ences neuronal function and survival. To investigate
how this glial response occurs and how it might influ-
ence injured neurons, bilateral cochlear ablations were
performed on adult rats to examine the short-term (16
and 24 hours and 4 and 7 days) and long-term (15, 30,
and 100 days) changes in the distribution and morphol-
ogy of microglial cells (immunostained with the ionized
calcium-binding adaptor molecule 1; Iba-1) and the
interaction of microglial cells with deafferented neurons
in the ventral cochlear nucleus. A significant increase in
the mean cross-sectional area and Iba-1 immunostain-
ing of microglial cells in the cochlear nucleus was
observed at all survival times after the ablation com-
pared with control animals. These increases were
concomitant with an increase in the area of Iba-1 im-
munostaining at 24 hours and 4, 7, and 15 days posta-
blation. Additionally, microglial cells were frequently
seen apposing the cell bodies and dendrites of auditory
neurons at 7, 15, and 30 days postablation. In sum-
mary, these results provide evidence for persistent glial
activation in the ventral cochlear nucleus and suggest
that long-term interaction occurs between microglial
cells and deafferented cochlear nucleus neurons follow-
ing bilateral cochlear ablation, which could facilitate the
remodeling of the affected neuronal circuits. J. Comp.
Neurol. 520:2974–2990, 2012.
VC 2012 Wiley Periodicals, Inc.
INDEXING TERMS: glia; deafferentation; neural plasticity; image analysis
Sensorineural hearing loss resulting from cochlear
ablation is a model commonly used to study the degener-
ative and reparative mechanisms that occur in the adult
central auditory system in response to damage to audi-
tory hair cells and their cochlear innervation (Bilak et al.,
1997; F€orster and Illing, 2000; Alvarado et al., 2007;
Fuentes-Santamaria et al., 2007). Studies performed with
different animal models have shown that, when the coch-
lea is damaged by a mechanical lesion or noise exposure,
the resulting loss of sensory cells is associated with a
gradual degeneration of the spiral ganglion neurons;
these neurons, when deprived of continuous neurotrophic
support (which is crucial to maintain appropriate neuronal
function), initiate a complex series of activity-dependent
changes in the auditory neurons found at subcortical and
cortical levels (for review see Syka, 2002). More specifi-
cally, in some neurons of the cochlear nucleus, these re-
gressive changes include cell atrophy (Moore, 1990; Tier-
ney et al., 1997), abnormalities in intracellular calcium
signaling pathways (Lohmann and Friauf, 1996; Caicedo
et al., 1997; Fuentes-Santamaria et al., 2005), and synap-
tic rearrangements (Potashner et al., 1997; Muly et al.,
2002), which may occur as early as 30 minutes postle-
sion (Sie and Rubel, 1992). These changes can result in
long-term degenerative processes that may develop into
Additional Supporting Information may be found in the online version ofthis article.
Grant sponsor: Programa I3 del Ministerio de Ciencia e Innovaci�on;Grant number: I320101590 (to V.F.-S.); Grant number: I320101589 (toJ.C.A.); Grant sponsor: Gobierno de Castilla—La Mancha; Grant number:PE110901526233; Grant sponsor: Ministerio de Ciencia e Innovaci�on;Grant number: BFU2009-13754-C02-01.
*CORRESPONDENCE TO: Ver�onica Fuentes-Santamarı́a, PhD, Facultadde Medicina, Universidad de Castilla—La Mancha, Campus de Albacete,C/ Almansa 14, 02006 Albacete, Spain. E-mail: [email protected]
VC 2012 Wiley Periodicals, Inc.
Received November 22, 2011; Revised December 23, 2011; AcceptedFebruary 15, 2012
DOI 10.1002/cne.23088
Published online February 20, 2012 in Wiley Online Library(wileyonlinelibrary.com)
2974 The Journal of Comparative Neurology | Research in Systems Neuroscience 520:2974–2990 (2012)
RESEARCH ARTICLE

neurodegenerative disorders under chronic conditions
(Morest et al., 1998).
A growing body of evidence suggests that microglial
activation is a hallmark of several neurological disorders
that feature neuronal degeneration (for reviews see Mrak
and Griffin, 2005; Dheen et al., 2007). In response to neu-
ronal injury, microglial cells (the macrophage population
of the central nervous system) concentrate at the site of
injury, become rapidly activated, and initiate a series of
cellular responses, including morphological transforma-
tion and proliferation and the synthesis and release of
growth factors and cytokines, which may play a pivotal
role in promoting the remodeling of affected neuronal cir-
cuits (for reviews see Bruce-Keller, 1999; Hanisch and
Kettenmann, 2007; Cullheim and Thams, 2007). Although
these nonneuronal elements appear to exert primarily
neuroprotective effects (especially following localized
damage), when injury is sustained and irreversible they
become persistently activated and can have deleterious
effects on neuronal function and survival (Streit, 2000;
Nakajima and Kohsaka, 2001).
Within the auditory system, the unilateral removal of
afferent activity results in a reactive microglial and astro-
cytic response in the cochlear nucleus, the magnitude
and intensity of which decreases over time, depending on
a combination of factors, such as the species, the age at
which deafferentation occurred, survival time, and type of
deprivation (Lurie and Rubel, 1994; De Waele et al.,
1996; Campos-Torres et al., 1999; Insausti et al., 1999;
Lurie and Durham, 2000; Zhao and Lurie, 2004). The
importance of such glial activation in modulating cell sur-
vival is highlighted by the fact that blockage of certain
cytokines released by microglial cells under normal condi-
tions (Fujioka et al., 2006) eliminates the inflammatory
response that occurs in the cochlea after noise exposure
and decreases hearing impairment in mice (Wakabayashi
et al., 2010). Despite the increasing evidence suggesting
the involvement of glial-related mechanisms in restoring
neuronal function after injury, none of these studies has
addressed how microglial cells become activated in the
cochlear nucleus following bilateral sensorineural hearing
loss. In the present study, we performed bilateral coch-
lear ablations in adult rats to examine short-term (16 and
24 hours and 4 and 7 days) and long-term (15, 30, and
100 days) changes in the distribution and morphology of
microglial cells immunostained with the ionized calcium-
binding adaptor molecule 1 (Iba-1).
MATERIALS AND METHODS
Animal subjectsAll animal protocols were approved by the Institutional
Animal Care and Use Committee at the University of Cas-
tilla—La Mancha. These protocols were in accordance
with the guidelines of the European Communities Council
(directive 2010/63/EU) and current national legislation
(R.D. 1201/2005) for the care and use of research ani-
mals. Data were obtained from 35 adult rats (28 experi-
mental and seven age-matched unoperated control rats).
After bilateral cochlear ablation, the experimental animals
survived for 16 hours (PA16h; n ¼ 4), 24 hours (PA24h; n
¼ 4), 4 days (PA4d; n ¼ 4), 7 days (PA7d; n ¼ 4), 15 days
(PA15d; n ¼ 4), 30 days (PA30d; n ¼ 4), or 100 days
(PA100d; n ¼ 4).
Auditory brainstem responsesThe auditory brainstem response (ABR) recordings
were performed on the day before the bilateral cochlear
ablation and at the end of each survival time. Rats were
anesthetized with isoflurane (4% for induction, 1.5–2% for
maintenance with a 1 L/minute O2 flow rate) and placed
in a sound-attenuating, electrically shielded booth
(Eymasa/Incotron S.L., Barcelona, Spain), which was
located inside of a sound-attenuating room. Subdermal
needle electrodes (Rochester Electro-Medical, Tampa,
FL) were placed at the vertex (positive) and behind the
right (negative) and left (ground) ears. The stimulation
and recording were performed with a Tucker-Davis (TDT)
BioSig System III (Tucker-Davis Technologies, Alachua,
FL). The stimuli were generated digitally using the Sig-
GenRP software (Tucker-Davis Technologies) and the RX6
Piranha Multifunction Processor hardware (Tucker-Davis
Technologies) and consisted of tones (5 msec rise/fall
time with no plateau, with a cos2 envelope, at 20/sec-
ond) at different frequencies across seven octaves from
0.5 to 32 KHz. They were delivered monaurally (right ear)
using the EDC1 electrostatic speaker driver (Tucker-Davis
Technologies) and the EC-1 electrostatic speaker
(Tucker-Davis Technologies), which was placed into the
external auditory meatus of the rat. Prior to the experi-
ments, stimuli were calibrated with SigCal software
(Tucker-Davis Technologies) and the ER-10Bþ low-noise
microphone system (Etymotic Research, Elk Groove, IL).
The evoked potentials were filtered (0.3–3.0 kHz), aver-
aged (500 waveforms), and stored for later analyses on a
computer.
Procedure of bilateral cochlear ablationExperimental animals were anesthetized with isoflur-
ane as described above (4% for induction, 1.5–2% for
maintenance). Under aseptic conditions and as previously
described (Fuentes-Santamaria et al., 2003; Alvarado
et al., 2004), the skin behind the ears was shaved, and a
retroauricular incision was made to identify the external
auditory canal, which was followed to the tympanic mem-
brane. Once the tympanic membrane and the auditory
Glial activation in the cochlear nucleus after deafferentation
The Journal of Comparative Neurology | Research in Systems Neuroscience 2975

ossicles had been removed, the bulla was exposed, the
cochleus was removed with a fine forceps, and any
remaining cochlear contents were aspirated by using a
vacuum aspiration system. During the surgical procedure,
a heating pad was used to maintain normal body temper-
ature and for recovery from anesthesia. Once awake, ani-
mals were returned to their cages and maintained with
free access to food and water for the survival period.
After the appropriate survival time, the animals were
perfused (see below), and the extent of the cochlear abla-
tions was microscopically assessed.
Characterization of antibodiesThe monoclonal and polyclonal antibodies used in this
study were obtained from commercial sources and are
listed in Table 1.
Iba-1Rabbit polyclonal anti-Iba-1 was raised against a syn-
thetic peptide corresponding to the C-terminal fragment
of rat Iba-1 (manufacturer’s technical information; see
also Table 1). This antibody was purified by using antigen-
affinity chromatography from rabbit antisera and recog-
nizes a single 17-kD band that corresponds to Iba protein
on Western blot analysis of rat brain (Imai et al., 1996). It
specifically labels ramified and activated microglia and
macrophages but not neurons and astrocytes by immuno-
histochemistry in both primary mixed brain cell cultures
and fixed rat brain sections (Ito et al., 1998). In this study,
the staining pattern of this antibody was in accordance
with previous observations for the auditory system
(Okano et al., 2008) as well as for the hippocampus (Su
et al., 2010), spinal cord (Benton et al., 2008; Yamanaka
et al., 2011) and retina (Bosco et al., 2011). This antibody
is included in the Journal of Comparative Neurology
primary antibody database (ID No. AB 839504).
NeuNThe mouse monoclonal antineuronal nuclei antibody
(NeuN) was produced by using purified cell nuclei from
mouse brain (manufacturer’s technical information; see
also Table 1). This antibody recognizes the neuron-spe-
cific protein NeuN, which is present in most neuronal cell
types of the central and peripheral nervous systems (Ras-
mussen et al., 2007; Ravizza et al., 2008). It does not
stain glial cells (Todd et al., 1998). According to the man-
ufacturer and previous studies (Mullen et al., 1992; Lind
et al., 2005), it recognizes four bands between 45 and 75
kDa on Western blots of rat brain, which may represent
multiple phosphorylation states of the protein. The stain-
ing pattern of this antibody agrees with previous observa-
tions from our region of interest, the adult cochlear nu-
cleus (Zheng et al., 2011), and also from the auditory
cortex (Hackett and de la Mothe, 2009). This antibody is
also included in the Journal of Comparative Neurology pri-
mary antibody database (ID No. AB-2298770).
Iba-1 immunohistochemistryAfter the appropriate postoperative survival time, con-
trol and experimental rats were anesthetized with an
intraperitoneal injection of ketamine (100 mg/kg) and
xylazine (5 mg/kg) and perfused transcardially with a
0.9% saline wash, followed by a fixative solution of 4% par-
aformadehyde in 0.1 M phosphate buffer (PB; pH 7.3).
The brains were removed from the cranium, and frozen
sections 40 lm thick were cut on a sliding microtome in
a coronal plane. Free-floating sections were processed in
three alternating series; the first series of sections was
processed for Iba-1 immunostaining, and the other two
series were used for double-labeling studies (see below)
and NeuN immunohistochemistry, respectively. After
blocking for 1 hour in a solution containing 10% normal
horse serum diluted in Tris-buffered saline (TBS; pH 7.4)
with 0.2% Triton X-100 (TBS-Tx 0.2%), sections were incu-
bated overnight at 4�C in the same buffer solution with
rabbit anti-Iba-1 primary antibody. On the next day, sec-
tions were washed in TBS-Tx 0.2% solution and incubated
for 2 hours at room temperature in biotinylated anti-rab-
bit secondary antibody (1:200; Vector Laboratories, Bur-
lingame, CA). Then, after several rinses in TBS-Tx (0.2%),
sections were incubated with the avidin-biotin complex
for 1 hour, rinsed in TBS, and treated with diaminobenzi-
dine (DAB) histochemistry. The exposure time to DAB was
similar across control and experimental cases. Finally,
the sections were washed thoroughly, mounted on gela-
tin-coated slides, air dried, dehydrated in ethanol, cleared
in xylene, and coverslipped with Cytoseal (Stephens Sci-
entific, Wayne, NJ). Three sets of control experiments
TABLE 1.
Antibodies Used for Immunohistochemistry
Primary antibody Immunogen Host Code/clone Dilution Manufacturer
Iba-1 C-terminus of Iba10
(N0-PTGPPAKKAISELP-C0)Rabbit 019-19741, lot No. CDQ5232 1:2,000 Wako Pure Chemical Industries,
Neuss, GermanyNeuN Purified cell nuclei
from mouse brainMouse MAB337, lot No. LV1825845 1:200 Millipore, Billerica, MA
Fuentes-Santamarı́a et al.
2976 The Journal of Comparative Neurology |Research in Systems Neuroscience
were performed to test the specificity of the immunohis-
tochemical detection system: 1) omission of the primary
antibody by replacement with TBS-BSA, 2) omission of
secondary antibodies, and 3) omission of ABC reagent.
No immunostaining was detected under these conditions.
Double labeling for glial and neuronalmarkers
Sections were rinsed four times in TBS-Tx (0.2%) and
blocked for 1 hour in the same buffer solution containing
10% normal goat serum. Next, sections were incubated
overnight in a solution of primary antibodies containing
Iba and NeuN. After four 15-minute rinses in TBS-Tx
(0.2%), sections were incubated in a cocktail of fluores-
cently labeled secondary antibodies for 2 hours at room
temperature (1:200, anti-mouse conjugated to Alexa 594
for NeuN and anti-rabbit conjugated to Alexa 488 for Iba-
1; Molecular Probes, Eugene, OR), and after several
rinses in TBS they were mounted, counterstained with
DAPI, coverslipped, and maintained overnight at 4�C.
Measurements of the cross-sectional area ofIba-immunostained cells
The cross-sectional area of Iba-immunostained cells in
both control and ablated animals was measured using the
public-domain image analysis software Scion Image for
Windows (Scion, Frederick, MD; beta 4.0.2). With a �60
objective, three fields (25.16 � 103 lm2; dorsal, middle,
and ventral) were sampled randomly in every third section
throughout the rostrocaudal extent of the anteroventral
cochlear nucleus (AVCN) and the posteroventral cochlear
nucleus (PVCN). Only cells with a well-defined cell body
were measured and included in the analysis.
Evaluation of Iba-1 immunostainingDigital image capture
Iba-1-immunostained sections from control and experi-
mental animals were examined with brightfield illumina-
tion using a Nikon Eclipse photomicroscope with a �40
objective, and images were captured with a DXM 1200C
digital camera attached to the microscope. Color images
of each field were digitized, and the resultant eight-bit
image contained a gray scale of pixel intensities that
ranged from 0 (white) to 255 (black).
Densitometric analysisThe densitometric procedure for the evaluation of the
immunostaining was performed by using Scion Image for
Windows (beta 4.0.2; developed by Scion Corp.), as previ-
ously described (Fuentes-Santamaria et al., 2003, 2005,
2007; Alvarado et al., 2004, 2005, 2007). Cochlear nu-
cleus subdivisions were defined in accordance with previ-
ous terminology (for review see Cant and Benson, 2003).
The analysis of Iba-1 immunostaining was performed in
six equally spaced coronal sections, 120 lm apart,
extending throughout the rostrocaudal dimension of the
AVCN and PVCN. In each section, three fields (55.25 �103 lm2; dorsal, middle, and ventral) were sampled using
a �40 objective, for a total of 36 fields for each nucleus
in each animal. To perform an appropriate comparison of
Iba-1 immunostaining among cases, a macro was
designed to process and analyze the captured images
(Alvarado et al., 2004). Images were normalized by using
an algorithm based on the signal-to-noise ratio that nor-
malizes each pixel, adjusting the gray-scale range of the
image (Herborn et al., 2002; Alvarado et al., 2004). After
normalization, the threshold level was set as 2 standard
deviations above the mean gray level of the field, and im-
munostained cells exceeding this threshold were identi-
fied as labeled. For each field, two quantitative indexes
were measured in the cochlear nucleus. 1) The mean
gray of Iba-1 immunostaining was used as an indirect in-
dicator of the levels of Iba-1 within cells. Modifications in
antigen concentration (Iba-1) are reflected in changes in
the intensity of the immunostaining, so this index pro-
vides a general estimation of the effect of bilateral coch-
lear ablation on the immunostaining of glial cells. 2) The
immunostained area of Iba-1 immunostaining was calcu-
lated as the summed area of all profiles (cells and proc-
esses) labeled as being above the threshold in each field
and gives us an estimate of the area occupied by micro-
glial cells at each survival time in comparison with control
rats.
Preparation of figures and statisticalanalysis
Adobe Photoshop 5.5 and Deneba Canvas 6.0 were
used to adjust size, brightness, and contrast of images
for publication. All the data were expressed as mean 6
standard error. Comparisons among groups were ana-
lyzed statistically by using the one-factor analysis of var-
iance and the Duncan’s post hoc analysis to evaluate the
effect of the survival time after the cochlear ablation over
the microglial immunostaining in the cochlear nucleus.
Statistical significance was set at P < 0.05.
RESULTS
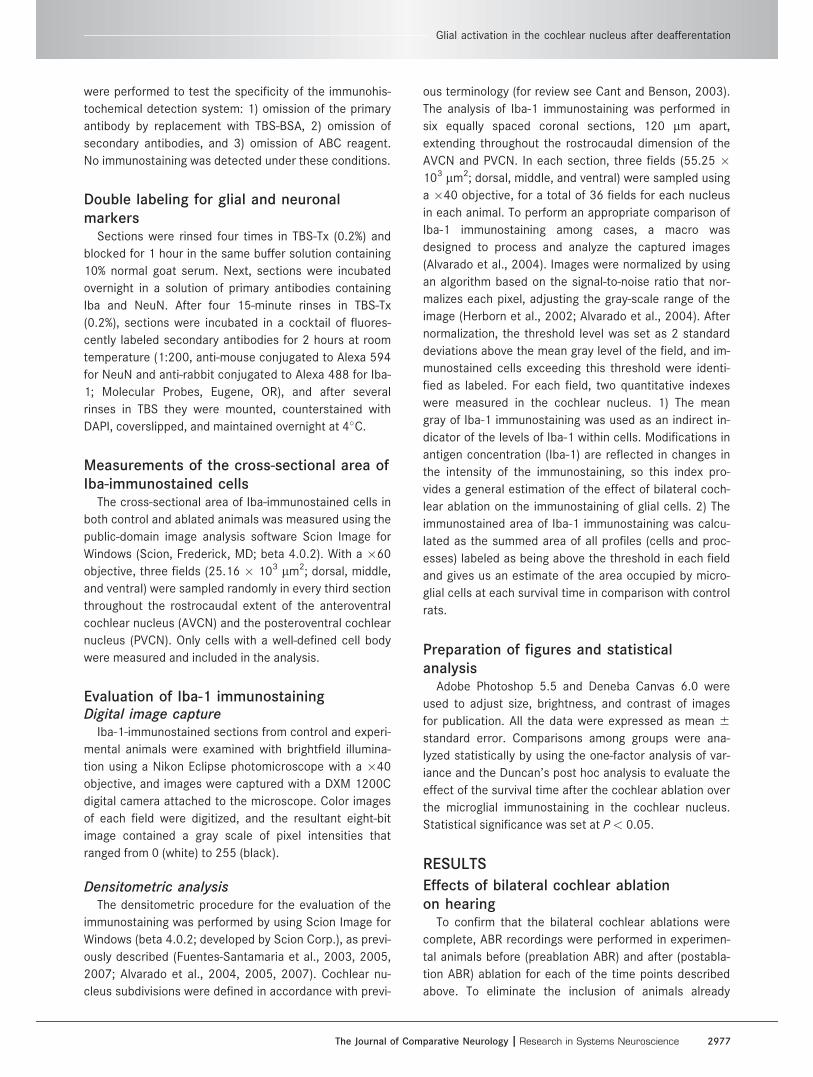
Effects of bilateral cochlear ablationon hearing
To confirm that the bilateral cochlear ablations were
complete, ABR recordings were performed in experimen-
tal animals before (preablation ABR) and after (postabla-
tion ABR) ablation for each of the time points described
above. To eliminate the inclusion of animals already
Glial activation in the cochlear nucleus after deafferentation
The Journal of Comparative Neurology | Research in Systems Neuroscience 2977
suffering from hearing disorders, basal patterns for the
ABR recordings were established for each experimental
group. Preablation recordings showed a distinctive wave
pattern characterized by positive peaks generated after
a stimulus (left column in Fig. 1). The postablation ABRs
showed a complete elimination of the waves evoked af-
ter stimulus onset at all of the frequencies tested, indi-
cating that the auditory brainstem nuclei were not
receiving inputs from the cochlea (right column in Fig.
1). Figure 1 shows an example of an ABR after a short
(16 hours; Fig. 1A) or long (100 days; Fig. 1B) period fol-
lowing bilateral cochlear ablation. In both cases, the
normal preablation ABR was replaced by a nearly flat
postablation ABR.
Figure 1. ABR recordings depicting the effects of bilateral cochlear ablation in adult rats. In the experimental animals, ABR recordings
were performed before (ABR preablation, left column) and after (ABR postablation, right column) each survival time following bilateral
cochlear ablation. Note that at short-term (16 hours; A) and long-term (100 days; B) survival times following bilateral cochlear ablation,
the ABRs postablation showed a complete loss of response waves after stimulus onset at all of the frequencies tested, indicating that the
auditory brainstem nuclei did not receive any electrical stimulation arising from the cochlea. The dashed lines indicate stimulus onset.
[Color figure can be viewed in the online issue, which is available at wileyonlinelibrary.com.]
Fuentes-Santamarı́a et al.
2978 The Journal of Comparative Neurology |Research in Systems Neuroscience
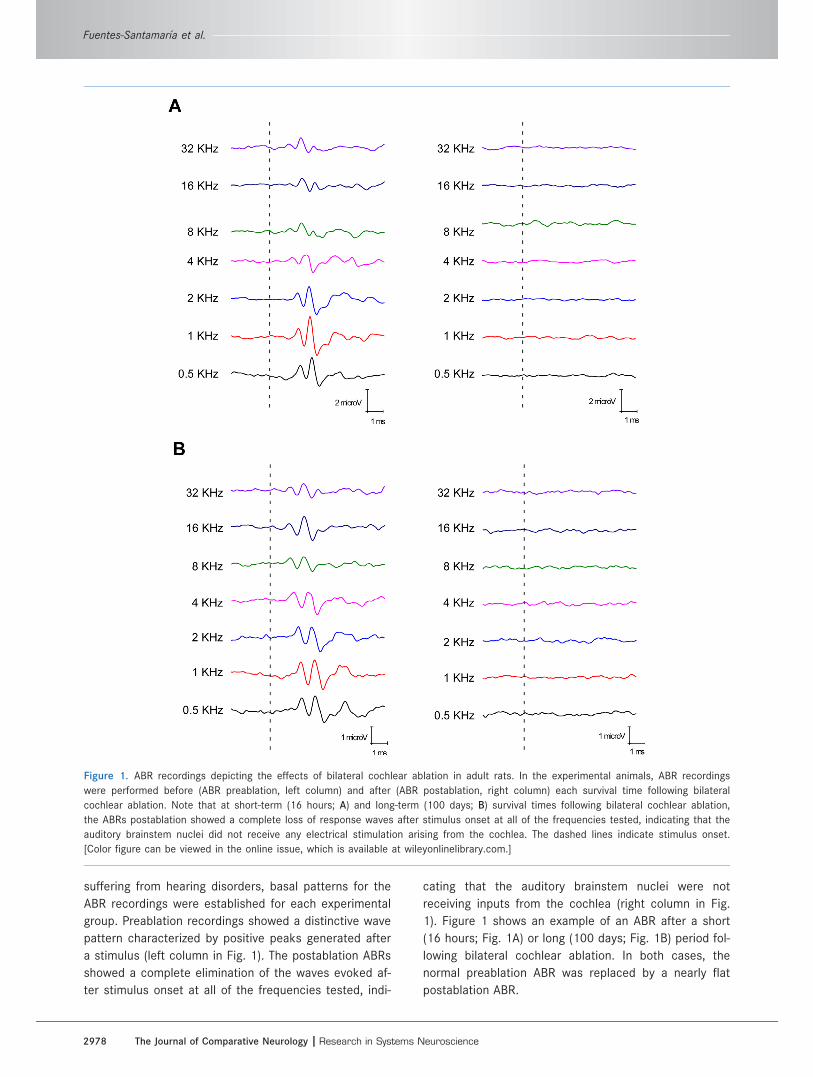
Distribution and quantification ofIba-immunostaining in the cochlear nucleusControl animals
In the control animals, analysis of coronal sections im-
munostained for Iba-1 showed that microglial cells were
distributed in both the AVCN (Fig. 2B) and the PVCN
(Fig. 3B). These cells had small, oval cell bodies (Fig. 4A,B,
Tables 2, 3) with processes that were highly ramified,
reflecting the typical staining pattern of resting microglia
(i.e., multipolar or, less frequently, bipolar morphology;
Fig. 5A,I). The distribution and morphology of these cells
were consistent with previously reported observations of
microglia in auditory nuclei (Campos-Torres et al., 1999).
Densitometric analysis of the immunostaining is shown in
Figure 6C,D and Tables 2 and 3.
Ablated animalsAfter bilateral cochlear ablation, the distribution and
morphology of Iba-1-immunostained cells observed in the
cochlear nucleus were different compared with control
Figure 2. Digital images depicting Iba-1 immunostaining in the AVCN in control (B), PA16h (C), PA24h (D), PA4d (E), PA7d (F), PA15d (G),
PA30d (H), and PA100d (I) rats. Iba-1 immunostaining was observed to increase by 16 hours postlesion (arrows in C); peaked at about 24
hours (arrows in D); and remained elevated at 4 (arrows in E), 7 (arrows in F), and 15 (arrows in G) days postlesion. Iba-1 levels began to
decline gradually by 30 and 100 days postlesion, without reaching normal levels (arrows in H,I). In A, the drawing indicates the location of
the AVCN, and the square boxes indicate the approximate locations of the fields represented in B–I. stt, Spinal trigeminal tract. Scale bar
¼ 500 lm in A; 50 lm in I (applies to B–I). [Color figure can be viewed in the online issue, which is available at wileyonlinelibrary.com.]
Glial activation in the cochlear nucleus after deafferentation
The Journal of Comparative Neurology | Research in Systems Neuroscience 2979
animals (Figs. 2, 3). To characterize and quantify the
changes in microglial activation following bilateral coch-
lear ablation, three quantitative indices of Iba-1 immuno-
staining were evaluated in both the experimental and the
control animals: 1) the cross-sectional area of Iba-1-im-
munostained cells, as a measure of hypertrophic changes
occurring during microglial activation; 2) the mean gray
level of Iba-1 immunostaining, as an indirect indicator of
the levels of Iba-1 within cells; and 3) the Iba-1-immuno-
stained area, as an estimate of the area occupied by
microglial cell bodies and their processes in the cochlear
nucleus (for technical details see Materials and Methods).
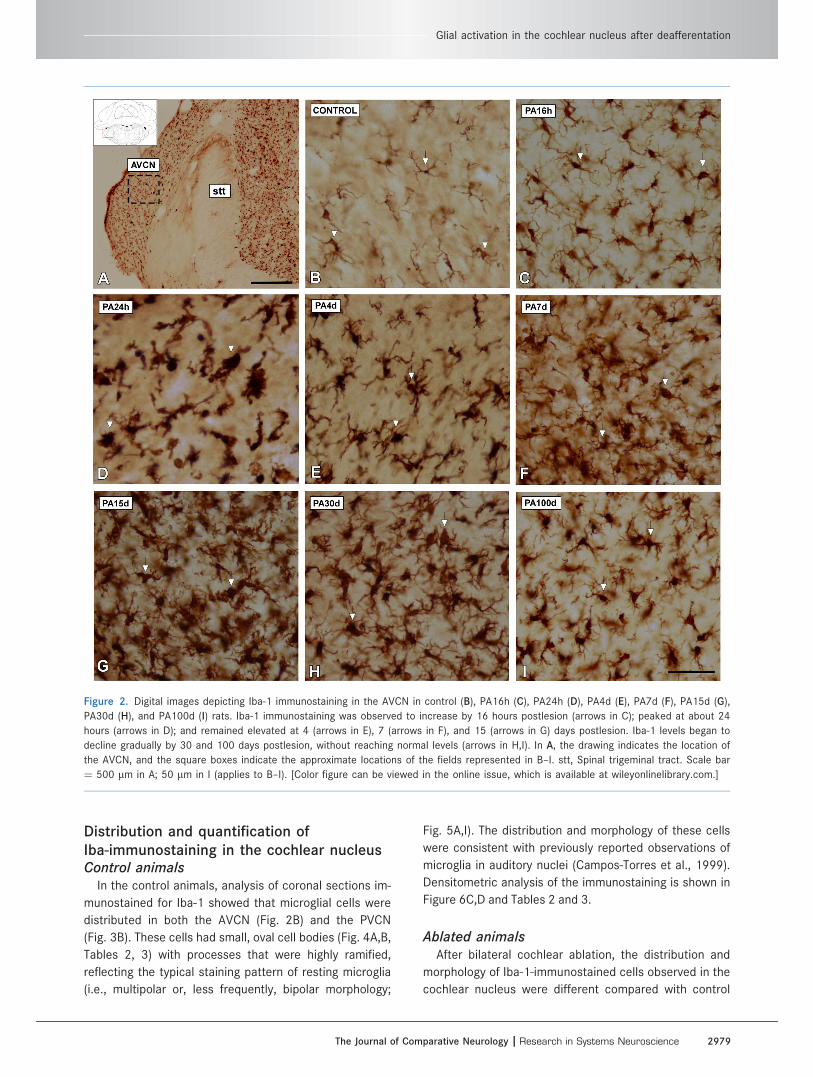
Postablation 16 hoursA transition from resting-state to active-state microglia
was observed at 16 hours following bilateral cochlear
ablation. Microglial cells in the AVCN (Fig. 2C) and PVCN
(Fig. 3C) had larger cell bodies and thicker processes in
comparison with control rats (compare Figure 2C with B
in the AVCN and Figure 3C with B in the PVCN; see also
Figure 3. Digital images depicting Iba-1 immunostaining in the PVCN in control (B), PA16h (C), PA24h (D), PA4d (E), PA7d (F), PA15d (G),
PA30d (H), and PA100d (I) rats. Similar to the increase observed in the AVCN, an increase in Iba-1 immunostaining was first noticeable in
PA16h animals (arrows in C), although the highest levels were observed at about 24 hours postlesion (arrows in D). The immunostaining
remained elevated at 4 (arrows in E), 7 (arrows in F), and 15 (arrows in G) days postlesion, and staining began to decline gradually at lon-
ger survival times, compared with control animals (arrows in H,I). The boxed area in A indicates the approximate location of the fields rep-
resented in B–I. stt, Spinal trigeminal tract; icp, inferior cerebellar peduncle. Scale bar ¼ 500 lm in A; 50 lm in I (applies to B–I). [Color
figure can be viewed in the online issue, which is available at wileyonlinelibrary.com.]
Fuentes-Santamarı́a et al.
2980 The Journal of Comparative Neurology |Research in Systems Neuroscience
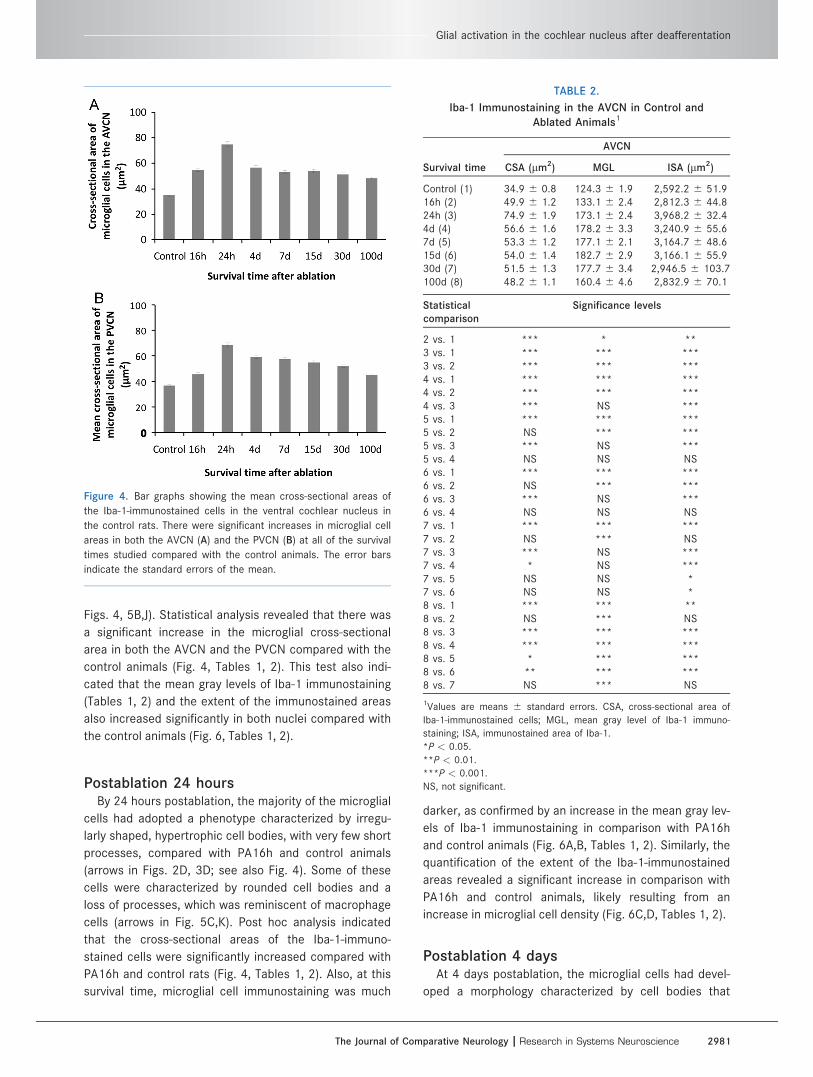
Figs. 4, 5B,J). Statistical analysis revealed that there was
a significant increase in the microglial cross-sectional
area in both the AVCN and the PVCN compared with the
control animals (Fig. 4, Tables 1, 2). This test also indi-
cated that the mean gray levels of Iba-1 immunostaining
(Tables 1, 2) and the extent of the immunostained areas
also increased significantly in both nuclei compared with
the control animals (Fig. 6, Tables 1, 2).
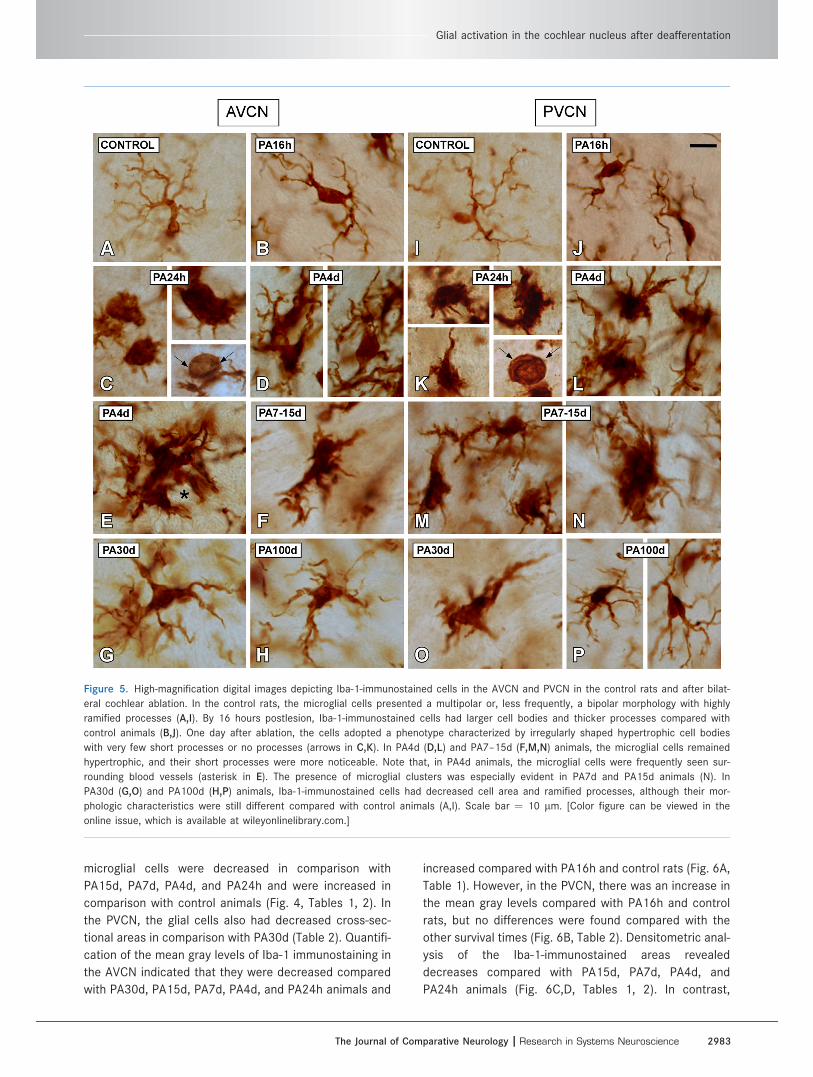
Postablation 24 hoursBy 24 hours postablation, the majority of the microglial
cells had adopted a phenotype characterized by irregu-
larly shaped, hypertrophic cell bodies, with very few short
processes, compared with PA16h and control animals
(arrows in Figs. 2D, 3D; see also Fig. 4). Some of these
cells were characterized by rounded cell bodies and a
loss of processes, which was reminiscent of macrophage
cells (arrows in Fig. 5C,K). Post hoc analysis indicated
that the cross-sectional areas of the Iba-1-immuno-
stained cells were significantly increased compared with
PA16h and control rats (Fig. 4, Tables 1, 2). Also, at this
survival time, microglial cell immunostaining was much
darker, as confirmed by an increase in the mean gray lev-
els of Iba-1 immunostaining in comparison with PA16h
and control animals (Fig. 6A,B, Tables 1, 2). Similarly, the
quantification of the extent of the Iba-1-immunostained
areas revealed a significant increase in comparison with
PA16h and control animals, likely resulting from an
increase in microglial cell density (Fig. 6C,D, Tables 1, 2).
Postablation 4 daysAt 4 days postablation, the microglial cells had devel-
oped a morphology characterized by cell bodies that
Figure 4. Bar graphs showing the mean cross-sectional areas of
the Iba-1-immunostained cells in the ventral cochlear nucleus in
the control rats. There were significant increases in microglial cell
areas in both the AVCN (A) and the PVCN (B) at all of the survival
times studied compared with the control animals. The error bars
indicate the standard errors of the mean.
TABLE 2.
Iba-1 Immunostaining in the AVCN in Control and
Ablated Animals1
AVCN
Survival time CSA (lm2) MGL ISA (lm2)
Control (1) 34.9 6 0.8 124.3 6 1.9 2,592.2 6 51.916h (2) 49.9 6 1.2 133.1 6 2.4 2,812.3 6 44.824h (3) 74.9 6 1.9 173.1 6 2.4 3,968.2 6 32.44d (4) 56.6 6 1.6 178.2 6 3.3 3,240.9 6 55.67d (5) 53.3 6 1.2 177.1 6 2.1 3,164.7 6 48.615d (6) 54.0 6 1.4 182.7 6 2.9 3,166.1 6 55.930d (7) 51.5 6 1.3 177.7 6 3.4 2,946.5 6 103.7100d (8) 48.2 6 1.1 160.4 6 4.6 2,832.9 6 70.1
Statisticalcomparison
Significance levels
2 vs. 1 *** * **3 vs. 1 *** *** ***3 vs. 2 *** *** ***4 vs. 1 *** *** ***4 vs. 2 *** *** ***4 vs. 3 *** NS ***5 vs. 1 *** *** ***5 vs. 2 NS *** ***5 vs. 3 *** NS ***5 vs. 4 NS NS NS6 vs. 1 *** *** ***6 vs. 2 NS *** ***6 vs. 3 *** NS ***6 vs. 4 NS NS NS7 vs. 1 *** *** ***7 vs. 2 NS *** NS7 vs. 3 *** NS ***7 vs. 4 * NS ***7 vs. 5 NS NS *7 vs. 6 NS NS *8 vs. 1 *** *** **8 vs. 2 NS *** NS8 vs. 3 *** *** ***8 vs. 4 *** *** ***8 vs. 5 * *** ***8 vs. 6 ** *** ***8 vs. 7 NS *** NS
1Values are means 6 standard errors. CSA, cross-sectional area of
Iba-1-immunostained cells; MGL, mean gray level of Iba-1 immuno-
staining; ISA, immunostained area of Iba-1.
*P < 0.05.
**P < 0.01.
***P < 0.001.
NS, not significant.
Glial activation in the cochlear nucleus after deafferentation
The Journal of Comparative Neurology | Research in Systems Neuroscience 2981

were hypertrophic and from which emanated stout short
processes (Figs. 2–5). The Iba-1-immunostained cells
were often observed surrounding blood vessels (asterisk
in Fig. 5E). Quantitative analysis revealed a significant
decrease in the cross-sectional area of the cells com-
pared with PA24h rats and a significant increase com-
pared with PA16h and control animals (Fig. 4, Tables 1,
2). Analysis of the mean gray levels of Iba-1 immunostain-
ing indicated that there were significant increases in com-
parison with PA16h and control animals, but no changes
were observed compared with PA24h animals (Fig. 6A,B,
Tables 1, 2). However, the immunostained areas were sig-
nificantly decreased compared with PA24h animals and
were increased compared with PA16h and control rats
(Fig. 6C,D, Tables 1, 2).
Postablation 7 and 15 daysIn PA7d and PA15d rats, most of the microglial cells
still had relatively large cell bodies with thick, short proc-
esses (Figs. 2F,G, 3F,G). Statistical analysis demon-
strated that the cross-sectional area of these cells was
significantly decreased in PA7d and PA15d animals com-
pared with PA24h rats (Fig. 4, Tables 1, 2). Conversely,
there was an increase in size compared with control ani-
mals (Fig. 4, Tables 1, 2). At 7 and 15 days postablation,
the microglial cells were still darkly immunostained, as
indicated by significant increases in the mean gray levels,
in comparison with PA16h and control animals (Fig. 6A,B,
Tables 1, 2). With respect to the immunostained areas in
the AVCN at 7 and 15 days postlesion, significant
decreases were observed compared with PA24h rats, and
significant increases were observed compared with
PA16h and control animals (Fig. 6C,D, Tables 1, 2). In the
PVCN, there were also significant decreases in the immu-
nostained areas compared with PA24h animals and signif-
icant increases compared with control rats (Tables 1, 2).
Although microglial clusters were observed at all of the
survival times evaluated, they were particularly evident at
7 and 15 days postablation (Fig. 5N).
Postablation 30 daysIn PA30 animals, microglial cells with longer processes
showed statistically significant decreases in cross-sec-
tional area in the AVCN in comparison with PA4d and
PA24h cells but showed significant increases in cross-
sectional area compared with control animals (Fig. 4,
Tables 1, 2). In the PVCN, the microglial cross-sectional
area was significantly decreased compared with PA7d,
PA4d, and PA24h animals and significantly increased
compared with PA16h and control rats (Fig. 4, Tables 1,
2). At both survival times, the mean gray levels of Iba im-
munostaining were significantly higher in comparison
with PA16h and control animals (Fig. 6A,B, Tables 1, 2).
With respect to the extents of the immunostained areas
at 30 days postlesion, significant decreases were
observed compared with PA15d, PA7d, PA4d, and PA24h
animals; this was especially evident in the AVCN, in which
the cross-sectional area was greater than that of control
animals (Fig. 6C,D, Tables 1, 2).
Postablation 100 daysIn PA100d animals, the staining and morphologic char-
acteristics of the microglial cells had returned nearly to
normal (Figs. 2I, 3I). The cross-sectional areas of the
TABLE 3.
Iba-1 Immunostaining in the PVCN in Control and
Ablated Animals1
AVCN
Survival time CSA (lm2) MGL ISA (lm2)
Control (1) 36.7 6 0.8 129.9 6 7.4 2,612.3 6 58.716h (2) 45.6 6 1.4 142.3 6 1.4 2,851.6 6 28.224h (3) 68.4 6 1.9 189.4 6 2.8 4,095.1 6 71.44d (4) 59.2 6 1.3 185.7 6 2.7 3,367.8 6 60.67d (5) 57.7 6 1.3 184.8 6 3.0 2,982.4 6 68.215d (6) 54.9 6 1.3 193.7 6 2.6 3,039.6 6 80.730d (7) 52.4 6 1.2 194.1 6 3.2 2,740.8 6 148.8100d (8) 45.3 6 1.0 193.2 6 2.2 2,635.6 6 74.6
Statisticalcomparison
Significance levels
2 vs. 1 *** ** *3 vs. 1 *** *** ***3 vs. 2 *** *** ***4 vs. 1 *** *** ***4 vs. 2 *** *** ***4 vs. 3 *** NS ***5 vs. 1 *** *** ***5 vs. 2 NS *** NS5 vs. 3 *** NS ***5 vs. 4 NS NS NS6 vs. 1 *** *** ***6 vs. 2 NS *** NS6 vs. 3 *** NS ***6 vs. 4 NS NS NS7 vs. 1 *** *** NS7 vs. 2 *** *** NS7 vs. 3 *** NS ***7 vs. 4 *** NS ***7 vs. 5 *** NS *7 vs. 6 NS NS ***8 vs. 1 *** *** NS8 vs. 2 NS *** NS8 vs. 3 *** NS ***8 vs. 4 *** NS ***8 vs. 5 *** NS *8 vs. 6 *** NS ***8 vs. 7 *** NS NS
1Values are means 6 standard errors. CSA, cross-sectional area of
Iba-1-immunostained cells; MGL, mean gray level of Iba-1 immuno-
staining; ISA, immunostained area of Iba-1.
**P < 0.05.
**P < 0.01.
***P < 0.001.
NS, not significant.
Fuentes-Santamarı́a et al.
2982 The Journal of Comparative Neurology |Research in Systems Neuroscience
microglial cells were decreased in comparison with
PA15d, PA7d, PA4d, and PA24h and were increased in
comparison with control animals (Fig. 4, Tables 1, 2). In
the PVCN, the glial cells also had decreased cross-sec-
tional areas in comparison with PA30d (Table 2). Quantifi-
cation of the mean gray levels of Iba-1 immunostaining in
the AVCN indicated that they were decreased compared
with PA30d, PA15d, PA7d, PA4d, and PA24h animals and
increased compared with PA16h and control rats (Fig. 6A,
Table 1). However, in the PVCN, there was an increase in
the mean gray levels compared with PA16h and control
rats, but no differences were found compared with the
other survival times (Fig. 6B, Table 2). Densitometric anal-
ysis of the Iba-1-immunostained areas revealed
decreases compared with PA15d, PA7d, PA4d, and
PA24h animals (Fig. 6C,D, Tables 1, 2). In contrast,
Figure 5. High-magnification digital images depicting Iba-1-immunostained cells in the AVCN and PVCN in the control rats and after bilat-
eral cochlear ablation. In the control rats, the microglial cells presented a multipolar or, less frequently, a bipolar morphology with highly
ramified processes (A,I). By 16 hours postlesion, Iba-1-immunostained cells had larger cell bodies and thicker processes compared with
control animals (B,J). One day after ablation, the cells adopted a phenotype characterized by irregularly shaped hypertrophic cell bodies
with very few short processes or no processes (arrows in C,K). In PA4d (D,L) and PA7–15d (F,M,N) animals, the microglial cells remained
hypertrophic, and their short processes were more noticeable. Note that, in PA4d animals, the microglial cells were frequently seen sur-
rounding blood vessels (asterisk in E). The presence of microglial clusters was especially evident in PA7d and PA15d animals (N). In
PA30d (G,O) and PA100d (H,P) animals, Iba-1-immunostained cells had decreased cell area and ramified processes, although their mor-
phologic characteristics were still different compared with control animals (A,I). Scale bar ¼ 10 lm. [Color figure can be viewed in the
online issue, which is available at wileyonlinelibrary.com.]
Glial activation in the cochlear nucleus after deafferentation
The Journal of Comparative Neurology | Research in Systems Neuroscience 2983

densitometric analysis of the Iba-1-immunostained areas
revealed increases in the AVCN compared with control
animals (Fig. 6C,D, Table 1).
Long-term appositions between microglialcells and cochlear nucleus neurons afterbilateral cochlear ablation
To determine the spatial relationship between micro-
glial cells and deafferented cochlear nucleus neurons, we
performed double-labeling experiments for microglial and
neuronal markers in both control and experimental ani-
mals. In control (white arrows and yellow asterisks in
Figs. 7B, 8B) and PA16h (white arrows and yellow aster-
isks in Figs. 7C, 8C) rats, microglial processes in both the
AVCN and the PVCN were rarely seen apposing cochlear
nucleus neurons. However, by 24 hours postablation,
activated microglial cell bodies were observed in close
apposition with the cochlear nucleus neurons (white
arrows and yellow asterisks in Figs. 7D, 8D). Such cellular
appositions were particularly evident at later survival
times and were found in PA4d (Figs. 7E, 8E), PA7d (Figs.
7F, 8F), and PA15d (Figs. 7G, 8G) animals, in which the
microglial cells (perineuronal microglia) with short or no
processes were most frequently observed apposing the
soma and dendrites of deafferented cochlear nucleus
neurons in both the AVCN and the PVCN. It is important
to note that these microglial–neuronal appositions
decreased in frequency by day 30 (Figs. 7H, 8H) but per-
sisted for at least 100 days (Figs. 7I, 8I) following bilateral
cochlear ablation in comparison with control animals, at
which time the staining and morphological characteristics
of the microglial cells had not yet returned to normal.
However, at all of the time points studied, the microglia
cells were also found in the neuropil without being closely
associated with cochlear nucleus neurons (Figs. 7, 8).
DISCUSSION
The process of microglial activation in the ventral coch-
lear nucleus of the adult rat was investigated after bilat-
eral cochlear ablation, which results in the loss of hair
cells, degeneration of spiral ganglion neurons, and regres-
sive changes in the auditory nucleus. The present study
demonstrated an increase in microglial activation in the
AVCN and PVCN in rats as a consequence of bilateral
Figure 6. Bar graphs showing the mean gray levels of Iba-1 immunostaining (A,B) and the immunostained areas (C,D) in control and
ablated animals. At all of the survival times studied, there were significant increases in the mean gray levels of Iba-1 immunostaining in
the cochlear nucleus compared with the control animals. Concomitant with these changes were increases in the extent of the Iba-1-immu-
nostained areas at 24 hours and 4, 7, and 15 days following ablation in the AVCN and PVCN compared with the control animals. At 30
and 100 days postlesion, the immunostained areas were greater in the AVCN but not in the PVCN compared with the control rats. The
error bars indicate the standard errors of the mean.
Fuentes-Santamarı́a et al.
2984 The Journal of Comparative Neurology |Research in Systems Neuroscience

deprivation of presynaptic cochlear activity. Specifically,
our data showed significant increases in the mean cross-
sectional areas of Iba-1-immunostained cells and
increases in the mean gray levels of Iba-1 immunostaining
within the AVCN and PVCN at all of the survival times
studied after bilateral cochlear ablation compared with
control animals. Correlated with these increases were
increases in the extent of the Iba-1-immunostained areas
at 24 hours and 4, 7, and 15 days following ablation in
both nuclei compared with the control animals. The im-
munostained areas were still increased at later survival
times in the AVCN but not in the PVCN compared with
the control animals. Double-labeling studies for Iba-1 and
the neuronal marker NeuN showed that, as early as 24
Figure 7. Appositions between microglial cells and neurons in the AVCN after bilateral cochlear ablation. In the control (arrows and aster-
isks in B) and PA16h (arrows and asterisks in C) rats, microglial processes in both the AVCN and the PVCN were rarely seen apposing
cochlear nucleus neurons. The frequency of appositions between microglial cells and neurons increased in PA4d (arrows and asterisks in
E), PA7d (arrows and asterisks in F), and PA15d (arrows and asterisks in G) animals, where microglial cell bodies were frequently observed
apposing the soma and dendrites of deafferented cochlear nucleus neurons. Although the number of appositions between the microglial
cells and the cochlear nucleus neurons decreased at later survival times (arrows and asterisks in H,I), these appositions were still present
100 days following bilateral cochlear ablation. The drawing in A indicates the location of the AVCN, and the boxed areas (A0,A00) indicate
the approximate locations of the high-magnification images shown in B–I. The dashed lines and asterisks indicate cochlear nucleus neu-
rons apposing (arrows) microglial cells. A magenta-green copy of this figure is available online as Supporting Information. Scale bars ¼250 lm in A; 50 lm in C (applies to C–I).
Glial activation in the cochlear nucleus after deafferentation
The Journal of Comparative Neurology | Research in Systems Neuroscience 2985

hours postablation, microglial cells were observed appos-
ing the presynaptically deprived cochlear nucleus neu-
rons and that such appositions, which peaked between 7
and 30 days postlesion, were still present 100 days later.
These findings demonstrate that there is persistent glial
activation in the ventral cochlear nucleus and indicate
that long-term interactions between microglial cells and
deafferented cochlear nucleus exist following bilateral
cochlear ablation.
Several lines of evidence suggest that, in the healthy
adult brain, glial cells are directly involved in the mainte-
nance of normal functionality and neuroplasticity (for
review see Todd et al., 2006). In particular, these dynamic
glial cells, whose processes and arborizations are highly
mobile (Nimmerjahn et al., 2005), are actively involved in
the control of neuronal activity and in the regulation of
synaptic strength and synaptogenesis (Araque et al.,
1999; Fields and Stevens-Graham, 2002). In this respect,
microglial cells are constantly screening their own envi-
ronment, receiving continuous information from neurons
and delivering the appropriate signals required for normal
functioning of the brain. After neuronal injury, microglial
Figure 8. Appositions between microglial cells and neurons in the PVCN after bilateral cochlear ablation. Similar to those observed in the
AVCN, microglial–neuronal appositions were most frequently observed at 4 (arrows and asterisks in E), 7 (arrows and asterisks in F), and
15 (arrows and asterisks in G) days postablation, although they were still present in PA30d (H) and PA100d (I) animals. The drawing in A
indicates the location of the PVCN, and the boxed areas (A0,A00) indicate the approximate locations of the high-magnification images shown
in B–I. The dashed lines, asterisks, and arrows indicate points of apposition between the glial cells and the cochlear nucleus neurons. A
magenta-green copy of this figure is available online as Supporting Information. Scale bars ¼ 250 lm in A; 50 lm in I (applies to B–I).
Fuentes-Santamarı́a et al.
2986 The Journal of Comparative Neurology |Research in Systems Neuroscience

sensing arms detect subtle disturbances in the brain envi-
ronment, rapidly change to an active phenotype, and
elicit a complex series of events, potentially lasting for
months, to prevent further impairment (for reviews see
Bruce-Keller, 1999; Hanisch and Kettenmann, 2007).
Particularly in the auditory system, removal of afferent
activity by means of unilateral cochlear ablation has been
shown to induce astroglial and microglial proliferation as
well as hypertrophy in the cochlear nucleus of rats (De
Waele et al., 1996; Campos-Torres et al., 1999), monkeys
(Insausti et al., 1999), and chickens (Lurie and Rubel,
1994; Lurie and Durham, 2000). In rats, this microglial
response was first evident at 24 hours postlesion, peaked
at about 7–15 days, and persisted for at least 42 days
(Campos-Torres et al., 1999). Consistent with these find-
ings, the present study demonstrated similar timing of
microglial activation, although our data indicate that
microglial activation occurs within the first 16 hours fol-
lowing ablation and persists for at least 100 days in the
cochlear nucleus. Nevertheless, it is important to empha-
size that the conclusions drawn by the authors cited
above with respect to the effect of unilateral cochlear
ablation on microglial activation in the cochlear nucleus
are based on qualitative interpretations of immunostain-
ing at each time point. In the present study, we have char-
acterized these responses in detail by quantifying the
cross-sectional areas of the Iba-1-immunostained cells as
a measure of cell hypertrophy following lesion. Consistent
with an increased microglial response after deafferenta-
tion and in agreement with previous studies (Campos-
Torres et al., 1999), our results demonstrate clear hyper-
trophy in microglial cells at all of the survival times stud-
ied, but in particular 24 hours postlesion, compared with
the control animals. These increases in the microglial
cross-sectional areas were concomitant with increases in
the mean gray levels of Iba-1 immunostaining, which
were used as an index of intracellular levels of the
antigen Iba1.
Iba-1 is an EF hand calcium-binding protein that is
expressed specifically in cells from monocytic lineages
(Ito et al., 1998). Several studies have demonstrated that
the expression levels of Iba-1 within microglial cells are
increased during microglial activation following neuronal
damage. In particular, after facial nerve axotomy (Ito
et al., 1998) and ischemia (Ito et al., 2001), this protein is
highly up-regulated in the facial nucleus of the rat, which
suggests that Iba-1 may participate in calcium-related
mechanisms following injury. Consistent with this, in vivo
two-photon imaging studies monitoring intracellular Ca2þ
levels in cortical microglia have demonstrated that micro-
glial cells typically respond with large, generalized Ca2þ
transients that modify microglial activity as a result of
neuronal injury (Eichhoff et al., 2011). Therefore, changes
in the levels of Iba-1, similar to changes in other calcium-
binding proteins, might be related to changes in synaptic
activity. Deprivation of afferent activity produces an
imbalance in the normal levels of calcium-binding pro-
teins in auditory neurons, because unilateral cochlear
ablation at the time of hearing onset in ferrets results in a
significant up-regulation in calretinin immunostaining in
the cochlear nucleus (Fuentes-Santamaria et al., 2005),
superior olivary complex (Alvarado et al., 2004), and infe-
rior colliculus (Fuentes-Santamaria et al., 2003).
These observations, together with the observed
increases in the mean gray levels of Iba-1 immunostaining
within microglial cells in the cochlear nucleus reported in
the present study, are consistent with activity-dependent
changes resulting from deafferentation, and they suggest
that Iba-1 may play a crucial role in the regulation of
microglial activation following bilateral cochlear ablation.
Consistent with this possibility, recent reports suggest
that Iba-1, apart from its calcium-buffering capacity, also
has an actin cross-linking function, which could allow it to
function in the reorganization of the actin cytoskeleton
that accompanies the microglial reaction following injury
(Sasaki et al., 2001). Iba-1 has also been proposed to
facilitate microglial migration, proliferation, and phagocy-
tosis following injury (Ohsawa et al., 2000, 2004). Taken
together, these results strongly suggest that up-regula-
tion of Iba-1 within microglial cells may play a pivotal role
in the mechanisms and signaling pathways underlying
microglial activation after injury.
Our results also demonstrated increases in the extent
of the Iba-1-immunostained areas at 24 hours and 4, 7,
and 15 days postablation in the AVCN and PVCN com-
pared with the control animals. These increases in the im-
munostained area peaked at 24 hours when Iba-1-immu-
nostained cells increased in cell area, rather than density
(which was observed at 4, 7, and 15 d), compared with
the control animals. These results provide evidence that
the process of microglial activation in the cochlear
nucleus occurs as early as 16 hours postlesion, when the
intracellular levels of Iba-1 are first up-regulated, and
reaches an initial peak at 24 hours. Several lines of evi-
dence suggest that the activation of microglial cells can
be observed as early as 20 minutes following transient
cerebral ischemia in the rat hippocampus (Morioka et al.,
1991; Jørgensen et al., 1993; Abrah�am and L�az�ar, 2000);
however, it is unlikely that such an initial activation could
be caused by a degenerative process. It is more likely
that this early activation is caused by an initial shift in
microglial morphology resulting from imbalances in ion
homeostasis or a lack of neurotrophic support, leading to
modified neuronal activity (Jørgensen et al., 1993). Con-
sistent with this hypothesis, our double-labeling studies
demonstrated that, by 24 hours postlesion, activated
Glial activation in the cochlear nucleus after deafferentation
The Journal of Comparative Neurology | Research in Systems Neuroscience 2987

microglial cells are first seen in close apposition to coch-
lear nucleus neurons. Although the exact role of this inter-
action is unknown, it might reflect an initial attempt by
glial cells to respond quickly to the signals released by
injured neurons to prevent further neuronal damage and
to reestablish homeostasis following bilateral cochlear
ablation.
Degeneration of synaptic endings after cochlear abla-
tion has been shown to occur in the cochlear nucleus as
early as 7 days postlesion (Benson et al., 1997), and
these effects have been shown to last for at least 8
months following acoustic overstimulation in adult guinea
pigs (Bilak et al., 1997; Kim et al., 2004). Evidence sug-
gests that this degenerative process occurs simultane-
ously with the growth of new synaptic endings, suggest-
ing a synaptic reorganization after cochlear
deafferentation (Muly et al., 2002; Hildebrandt et al.,
2011). It has been suggested that activated microglia
contribute to synaptic recovery and remodeling following
brain damage (for review see Bruce-Keller, 1999). Along
these lines, it has been proposed that microglial cells par-
ticipate in a synaptic stripping process in which damaged
synaptic boutons are detached from postsynaptic neu-
rons by the intercalation of microglial processes (Cull-
heim and Thams, 2007). Although it is unclear why micro-
glial cells strip off synapses from the cell surface of
injured neurons, it has been hypothesized that this pro-
cess may facilitate axonal sprouting and synaptic recov-
ery. Our findings showed that, by 7 days postablation, the
time point at which degeneration and synaptogenesis
occur, there was an increase in the number of appositions
between microglial cells and the presumptive injured au-
ditory neurons and that such interactions were still pres-
ent 100 days after bilateral cochlear ablation. These
results indicate that direct microglial apposition with
cochlear nucleus neurons may reflect a two-way mecha-
nism to facilitate the exchange of cellular signals to
restore neuronal function following brain damage.
In summary, our results provide additional information
concerning the microglial activation that takes place in
the cochlear nucleus after bilateral deprivation of afferent
activity. Our findings are consistent with early (by 16
hours) and long-lasting (over a period of 100 days) micro-
glial activation that may act to minimize damage and pro-
mote neuronal repair. In addition, these results suggest
that interactions between microglial cells and cochlear
nucleus neurons are critical to facilitate the remodeling of
the affected neuronal circuits involved in auditory
processing.
ACKNOWLEDGMENTS
The authors thank Tania Jare~no, Mari Cruz Gabald�on,
and Jos�e Julio Cabanes for excellent technical assistance
and also Jos�e Ram�on Marı́n for valuable confocal micros-
copy support.
LITERATURE CITEDAbrah�am H, L�az�ar G. 2000. Early microglial reaction following
mild forebrain ischemia induced by common carotid arteryocclusion in rats. Brain Res 862:63–73.
Alvarado JC, Fuentes-Santamaria V, Brunso-Bechtold J, HenkelCK. 2004. Alterations in calretinin immunostaining in theferret superior olivary complex after cochlear ablation.J Comp Neurol 470:63–79.
Alvarado JC, Fuentes-Santamaria V, Franklin SR, Brunso-Bech-told JK, Henkel CK. 2005. Unilateral cochlear ablation inadult ferrets results in upregulation in calretinin immuno-staining in the central nucleus of the inferior colliculus.Neuroscience 136:957–969.
Alvarado JC, Fuentes-Santamaria V, Franklin SR, Brunso-Bech-told JK, Henkel CK. 2007. Synaptophysin and insulin-likegrowth factor-1 immunostaining in the central nucleus ofthe inferior colliculus in adult ferrets following unilateralcochlear removal: a densitometric analysis. Synapse 61:288–302.
Araque A, Sanzgiri RP, Parpura V, Haydon PG. 1999. Astro-cyte-induced modulation of synaptic transmission. Can JPhysiol Pharmacol 77:699–706.
Benton RL, Maddie MA, Minnillo DR, Hagg T, Whittemore SR.2008. Griffonia simplicifolia isolectin B4 identifies a specificsubpopulation ofangiogenic blood vessels following contu-sive spinal cord injury in the adult mouse. J Comp Neurol507:1031–1052.
Benson CG, Gross JS, Suneja SJ, Potashner SJ. 1997. Synap-tophysin immunoreactivity in the cochlear nucleus afterunilateral cochlear or ossicular removal. Synapse 25:243–257.
Bilak M, Kim J, Potashner SJ, Bohne BA, Morest DK. 1997.New growth of axons in the cochlear nucleus of adult chin-chillas after acoustic trauma. Exp Neurol 147:256–268.
Bosco A, Steele MR, Vetter ML. 2011. Early microglia activa-tion in a mouse model of chronic glaucoma. J Comp Neu-rol 519:599–620.
Bruce-Keller AJ. 1999. Microglial–neuronal interactions in syn-aptic damage and recovery. J Neurosci Res 58:191–201.
Caicedo A, D’Aldin C, Eybalin M, Puel JL. 1997. Temporarysensory deprivation changes calcium-binding proteins lev-els in the auditory brainstem. J Comp Neurol 378:1–15.
Cant NB, Benson CG. 2003. Parallel auditory pathways: projec-tion patterns of the different neuronal populations in the dor-sal and ventral cochlear nuclei. Brain Res Bull 60:457–474.
Campos-Torres A, Vidal PP, de Waele C. 1999. Evidence for amicroglial reaction within the vestibular and cochlearnuclei following inner ear lesion in the rat. Neuroscience92:1475–1490.
Cullheim S, Thams S. 2007. The microglial networks of thebrain and their role in neuronal network plasticity afterlesion. Brain Res Rev 55:89–96.
De Waele C, Campos-Torres A, Josset P, Vidal PP. 1996. Evi-dence for reactive astrocytes in rat vestibular and cochlearnuclei following unilateral inner ear lesion. Eur J Neurosci8:2006–2018.
Dheen ST, Kaur C, Ling EA. 2007. Microglial activation and itsimplications in the brain diseases. Curr Med Chem 14:1189–1197.
Eichhoff G, Brawek B, Garaschuk O. 2011. Microglial calciumsignal acts as a rapid sensor of single neuron damage invivo. Biochim Biophys Acta 1813:1014–1024.
Fields RD, Stevens-Graham B. 2002. New insights into neu-ron–glia communication. Science 298:556–562.
Fuentes-Santamarı́a et al.
2988 The Journal of Comparative Neurology |Research in Systems Neuroscience

F€orster CR, Illing RB. 2000. Plasticity of the auditory brain-stem: cochleotomy-induced changes of calbindin-D28Kexpression in the rat. J Comp Neurol 416:173–187.
Fuentes-Santamaria V, Alvarado JC, Brunso-Bechtold JK, Hen-kel CK. 2003. Upregulation of calretinin immunostaining inthe ferret inferior colliculus after cochlear ablation. J CompNeurol 460:585–596.
Fuentes-Santamaria V, Alvarado JC, Taylor AR, Brunso-BechtoldJK, Henkel CK. 2005. Quantitative changes in calretinin im-munostaining in the cochlear nuclei after unilateral cochlearremoval in young ferrets. J Comp Neurol 483:458–475.
Fuentes-Santamarı́a V, Alvarado JC, Henkel CK, Brunso-Bech-told JK. 2007. Cochlearablation in adult ferrets results inchanges in insulin-like growth factor-1 and synaptophysinimmunostaining in the cochlear nucleus. Neuroscience148:1033–1047.
Fujioka M, Kanzaki S, Okano HJ, Masuda M, Ogawa K, OkanoH. 2006. Proinflammatory cytokines expression in noise-induced damaged cochlea. J Neurosci Res 83:575–583.
Hackett TA, de la Mothe LA. 2009. Regional and laminar dis-tribution of the vesicular glutamate transporter, VGluT2, inthe macaque monkey auditory cortex. J Chem Neuroanat38:106–116.
Hanisch UK, Kettenmann H. 2007. Microglia: active sensorand versatile effector cells in the normal and pathologicbrain. Nat Neurosci 10:1387–1394.
Herborn CU, Waldschuetz R, Lauenstein TC, Goyen M, LaufferRB, Moeroey T, Debatin JF, Ruehm SG. 2002. Contrast-enhanced magnetic resonance imaging (MS-325) in a mu-rine model of systemic lupus erythematosus. Invest Radiol37:464–469.
Hildebrandt H, Hoffmann NA, Illing RB. 2011. Synaptic reor-ganization in the adult rat’s ventral cochlear nucleus fol-lowing its total sensory deafferentation. PLoS One 6:e23686 [doi: 10.1371/journal.pone.0023686].
Imai Y, Ibata I, Ito D, Ohsawa K, Kohsaka S. 1996. A novelgene iba1 in the major histocompatibility complex class IIIregion encoding an EF hand protein expressed in a mono-cytic lineage. Biochem Biophys Res Commun 224:855–862.
Insausti AM, Cruz-Orive LM, J�auregui I, Manrique M, InsaustiR. 1999. Stereological assessment of the glial reaction tochronic deafferentation of the cochlear nuclei in the maca-que monkey (Macaca fascicularis). J Comp Neurol 414:485–494.
Ito D, Imai Y, Ohsawa K, Nakajima K, Fukuuchi Y, Kohsaka S.1998. Microglia-specific localisation of a novel calciumbinding protein, Iba1. Brain Res Mol Brain Res 57:1–9.
Ito D, Tanaka K, Suzuki S, Dembo T, Fukuuchi Y. 2001.Enhanced expression of Iba1, ionized calcium-bindingadapter molecule 1, after transient focal cerebral ischemiain rat brain. Stroke 32:1208–1215.
Jørgensen MB, Finsen BR, Jensen MB, Castellano B, DiemerNH, Zimmer J. 1993. Microglial and astroglial reactions toischemic and kainic acid-induced lesions of the adult rathippocampus. Exp Neurol 120:70–88.
Kim JJ, Gross J, Potashner SJ, Morest DK. 2004. Fine structureof long-term changes in the cochlear nucleus after acousticoverstimulation: chronic degeneration and new growth ofsynaptic endings. J Neurosci Res 77:817–828.
Lind D, Franken S, Kappler J, Jankowski J, Schilling K. 2005.Characterization of the neuronal marker NeuN as a multi-ply phosphorylated antigen with discrete subcellular local-ization. J Neurosci Res 79:295–302.
Lohman C, Friauf E. 1996. Distribution of the calcium-bindingproteins parvalbumin and calretinin in the auditory brain-stem of adult and developing rats. J Comp Neurol 367:90–109.
Lurie DI, Durham D. 2000. Neuronal death, not axonal degen-eration, results in significant gliosis within the cochlear nu-cleus of adult chickens. Hear Res 149:178–188.
Lurie DI, Rubel EW. 1994. Astrocyte proliferation in the chickauditory brainstem following cochlea removal. J Comp Neu-rol 346:276–288.
Moore DR. 1990. Auditory brainstem of the ferret: early ces-sation of developmental sensitivity of neurons in the coch-lear nucleus to removal of the cochlea. J Comp Neurol302:810–823.
Morest DK, Kim J, Potashner SJ, Bohne BA. 1998. Long-termdegeneration in the cochlear nerve and cochlear nucleusof the adult chinchilla following acoustic overstimulation.Microsc Res Techniq 41:205–216.
Morioka T, Kalehua AN, Streit WJ. 1991. The microglial reac-tion in the rat dorsal hippocampus following transient fore-brain ischemia. J Cereb Blood Flow Metab 11:966–973.
Mrak RE, Griffin WS. 2005. Glia and their cytokines in pro-gression of neurodegeneration. Neurobiol Aging 26:349–354.
Mullen RJ, Buck CR, Smith AM. 1992. NeuN, a neuronal spe-cific nuclear protein in vertebrates. Development 116:201–211.
Muly SM, Gross JS, Morest DK, Potashner SJ. 2002. Synapto-physin in the cochlear nucleus following acoustic trauma.Exp Neurol 177:202–221.
Nakajima K, Kohsaka S. 2001. Microglia: activation and theirsignificance in the central nervous system. J Biochem 130:169–175.
Nimmerjahn A, Kirchhoff F, Helmchen F. 2005. Resting micro-glial cells are highly dynamic surveillants of brain paren-chyma in vivo. Science 308:1314–1318.
Ohsawa K, Imai Y, Kanazawa H, Sasaki Y, Kohsaka S. 2000.Involvement of Iba1 in membrane ruffling and phagocytosisof macrophages/microglia. J Cell Sci 113:3073–3084.
Ohsawa K, Imai Y, Sasaki Y, Kohsaka S. 2004. Microglia/mac-rophage-specific protein Iba1 binds to fimbrin and enhan-ces its actin-bundling activity. J Neurochem 88:844–856.
Okano T, Nakagawa T, Kita T, Kada S, Yoshimoto M, NakahataT, Ito J. 2008. Bone marrow-derived cells expressing Iba1are constitutively present as resident tissue macrophagesin the mouse cochlea. J Neurosci Res 86:1758–1767.
Potashner SJ, Suneja SK, Benson CG. 1997. Regulation of D-aspartate release and uptake in adult brain stem auditorynuclei after unilateral middle ossicle removal and cochlearablation. Exp Neurol 148:222–235.
Rasmussen S, Wang Y, Kivis€akk P, Bronson RT, Meyer M, Imi-tola J, Khoury SJ. 2007. Persistent activation of microgliais associated with neuronal dysfunction of callosal projec-ting pathways and multiple sclerosis-like lesions in relaps-ing-remitting experimental autoimmune encephalomyelitis.Brain 130:2816–2829.
Ravizza T, Gagliardi B, No�e F, Boer K, Aronica E, Vezzani A.2008. Innate and adaptive immunity during epileptogenesisand spontaneous seizures: evidence from experimentalmodels and human temporal lobe epilepsy. Neurobiol Dis29:142–160.
Sasaki Y, Ohsawa K, Kanazawa H, Kohsaka S, Imai Y. 2001.Iba1 is an actin-cross-linking protein in macrophages/microglia. Biochem Biophys Res Commun 286:292–297.
Sie KC, Rubel EW. 1992. Rapid changes in protein synthesis andcell size in the cochlear nucleus following eighth nerve activityblockade or cochlea ablation. J Comp Neurol 320:501–508.
Streit WJ. 2000. Microglial response to brain injury: a briefsynopsis. Toxicol Pathol 28:28–30.
Su J, Gorse K, Ramirez F, Fox MA. 2010. Collagen XIX isexpressed by interneurons and contributes to the formationof hippocampal synapses. J Comp Neurol 518:229–253.
Glial activation in the cochlear nucleus after deafferentation
The Journal of Comparative Neurology | Research in Systems Neuroscience 2989
Syka J. 2002. Plastic changes in the central auditory systemafter hearing loss, restoration of function, and during learn-ing. Physiol Rev 82:601–636.
Tierney TS, Russel FA, Moore DR. 1997. Susceptibility ofdeveloping cochlear nucleus neurons to deafferentation-induced death abruptly ends just before the onset of hear-ing. J Comp Neurol 378:295–306.
Todd KJ, Serrano A, Lacaille JC, Robitaille R. 2006. Glial cellsin synaptic plasticity. J Physiol Paris 99:75–83.
Yamanaka H, Kobayashi K, Okubo M, Fukuoka T, Noguchi K.2011. Increase of close homolog of cell adhesion mole-cule L1 in primary afferent by nerve injury and the con-tribution to neuropathic pain. J Comp Neurol 519:1597–1615.
Wakabayashi K, Fujioka M, Kanzaki S, Okano HJ, Shibata S,Yamashita D, Masuda M, Mihara M, Ohsugi Y, Ogawa K,Okano H. 2010. Blockade of interleukin-6 signaling sup-pressed cochlear inflammatory response and improvedhearing impairment in noise-damaged mice cochlea. Neu-rosci Res 66:345–352.
Zhao J, Lurie DI. 2004. Loss of SHP-1 phosphatase alterscytokine expression in the mouse hindbrain following coch-lear ablation. Cytokine 28:1–9.
Zheng Y, Begum S, Zhang C, Fleming K, Masumura C, Zhang M,Smith P, Darlington C. 2011. Increased BrdU incorporationreflecting DNA repair, neuronal de-differentiation or possibleneurogenesis in the adult cochlear nucleus following bilat-eral cochlear lesions in the rat. Exp Brain Res 210:477–487.
Fuentes-Santamarı́a et al.
2990 The Journal of Comparative Neurology |Research in Systems Neuroscience
Copyright © 2022 FDOKUMEN