Gender Categorization Is Abnormal in Cochlear Implant Users
12
Research Article Gender Categorization Is Abnormal in Cochlear Implant Users CHRISTINA D. FULLER, 1,3 ETIENNE GAUDRAIN, 1,3 JEANNE N. CLARKE, 1,3 JOHN J. GALVIN, 2 QIAN-JIE FU, 2 ROLIEN H. FREE, 1,3 AND DENIZ BAŞKENT 1,3 1 Department of Otorhinolaryngology/Head and Neck Surgery, University Medical Center Groningen, University of Groningen, P.O. Box 30.001, BB21, 9700 RB, Groningen, The Netherlands 2 David Geffen School of Medicine, Department of Head and Neck Surgery, University of California, Los Angeles, Los Angeles, CA, USA 3 University of Groningen, Graduate School of Medical Sciences, Research School of Behavioral and Cognitive Neurosciences, Groningen, The Netherlands Received: 11 September 2013; Accepted: 29 July 2014; Online publication: 30 August 2014 ABSTRACT In normal hearing (NH), the perception of the gender of a speaker is strongly affected by two anatomically related vocal characteristics: the funda- mental frequency (F0), related to vocal pitch, and the vocal tract length (VTL), related to the height of the speaker. Previous studies on gender categorization in cochlear implant (CI) users found that performance was variable, with few CI users performing at the level of NH listeners. Data collected with recorded speech produced by multiple talkers suggests that CI users might rely more on F0 and less on VTL than NH listeners. However, because VTL cannot be accurately estimated from recordings, it is difficult to know how VTL contributes to gender categorization. In the present study, speech was synthesized to systematically vary F0, VTL, or both. Gender categorization was measured in CI users, as well as in NH participants listening to unprocessed (only synthesized) and vocoded (and synthesized) speech. Perceptual weights for F0 and VTL were derived from the performance data. With unprocessed speech, NH listeners used both cues (normalized perceptual weight: F0=3.76, VTL=5.56). With vocoded speech, NH listeners still made use of both cues but less efficiently (normalized perceptual weight: F0=1.68, VTL=0.63). CI users relied almost exclusively on F0 while VTL perception was profoundly impaired (normalized perceptual weight: F0=6.88, VTL=0.59). As a result, CI users’ gender categorization was abnormal compared to NH listeners. Future CI signal processing should aim to improve the transmission of both F0 cues and VTL cues, as a normal gender categorization may benefit speech understanding in competing talker situations. Keywords: cochlear implants, gender categorization, fundamental frequency, vocal tract length, vocal characteristics INTRODUCTION In “cocktail party” listening conditions, normal hear- ing (NH) listeners use the voice characteristics of different talkers to track and listen to a target talker. The ability to identify the gender of a voice may help to sort out various talkers in a multi-talker environ- ment, especially when two talkers are speaking at the same time. Voice differences across speakers of the same gender can improve intelligibility of the target speech by more than 20 percentage points (Brungart 2001). Voice differences across gender can increase intelligibility by 50 percentage points (Brungart 2001; Festen and Plomp 1990). NH listeners use two anatomically related vocal characteristics to identify the gender of a talker: (i) the fundamental frequency (F0) of the voice, related to perceived vocal pitch and determined by the glottal Correspondence to : Christina Fuller & Department of Otorhinolaryngology/Head and Neck Surgery, University Medical Center Groningen & University of Groningen & P.O. Box 30.001, BB21, 9700 RB, Groningen, The Netherlands. email: c.d.fuller@ umcg.nl JARO 15: 1037–1048 (2014) DOI: 10.1007/s10162-014-0483-7 D 2014 Association for Research in Otolaryngology 1037 JARO Journal of the Association for Research in Otolaryngology
Transcript of Gender Categorization Is Abnormal in Cochlear Implant Users

Research Article
Gender Categorization Is Abnormal in Cochlear Implant Users
CHRISTINA D. FULLER,1,3 ETIENNE GAUDRAIN,1,3 JEANNE N. CLARKE,1,3 JOHN J. GALVIN,2 QIAN-JIE FU,2ROLIEN H. FREE,1,3 AND DENIZ BAŞKENT
1,3
1Department of Otorhinolaryngology/Head and Neck Surgery, University Medical Center Groningen, University of Groningen,P.O. Box 30.001, BB21, 9700 RB, Groningen, The Netherlands2David Geffen School of Medicine, Department of Head and Neck Surgery, University of California, Los Angeles, Los Angeles,CA, USA3University of Groningen, Graduate School of Medical Sciences, Research School of Behavioral and Cognitive Neurosciences,Groningen, The Netherlands
Received: 11 September 2013; Accepted: 29 July 2014; Online publication: 30 August 2014
ABSTRACT
In normal hearing (NH), the perception of thegender of a speaker is strongly affected by twoanatomically related vocal characteristics: the funda-mental frequency (F0), related to vocal pitch, and thevocal tract length (VTL), related to the height of thespeaker. Previous studies on gender categorization incochlear implant (CI) users found that performancewas variable, with few CI users performing at the levelof NH listeners. Data collected with recorded speechproduced by multiple talkers suggests that CI usersmight rely more on F0 and less on VTL than NHlisteners. However, because VTL cannot be accuratelyestimated from recordings, it is difficult to know howVTL contributes to gender categorization. In thepresent study, speech was synthesized to systematicallyvary F0, VTL, or both. Gender categorization wasmeasured in CI users, as well as in NH participantslistening to unprocessed (only synthesized) andvocoded (and synthesized) speech. Perceptual weightsfor F0 and VTL were derived from the performancedata. With unprocessed speech, NH listeners usedboth cues (normalized perceptual weight: F0=3.76,VTL=5.56). With vocoded speech, NH listeners stillmade use of both cues but less efficiently (normalizedperceptual weight: F0=1.68, VTL=0.63). CI usersrelied almost exclusively on F0 while VTL perception
was profoundly impaired (normalized perceptualweight: F0=6.88, VTL=0.59). As a result, CI users’gender categorization was abnormal compared to NHlisteners. Future CI signal processing should aim toimprove the transmission of both F0 cues and VTLcues, as a normal gender categorization may benefitspeech understanding in competing talker situations.
Keywo rd s : co ch l e a r imp l an t s , g ende rcategorization, fundamental frequency, vocal tractlength, vocal characteristics
INTRODUCTION
In “cocktail party” listening conditions, normal hear-ing (NH) listeners use the voice characteristics ofdifferent talkers to track and listen to a target talker.The ability to identify the gender of a voice may helpto sort out various talkers in a multi-talker environ-ment, especially when two talkers are speaking at thesame time. Voice differences across speakers of thesame gender can improve intelligibility of the targetspeech by more than 20 percentage points (Brungart2001). Voice differences across gender can increaseintelligibility by 50 percentage points (Brungart 2001;Festen and Plomp 1990).
NH listeners use two anatomically related vocalcharacteristics to identify the gender of a talker: (i)the fundamental frequency (F0) of the voice, relatedto perceived vocal pitch and determined by the glottal
Cor r e spondenc e t o : Chr i s t ina Ful ler & Depar tment ofOtorhinolaryngology/Head and Neck Surgery, University MedicalCenter Groningen & University of Groningen & P.O. Box 30.001,BB21, 9700 RB, Groningen, The Netherlands. email: [email protected]
JARO 15: 1037–1048 (2014)DOI: 10.1007/s10162-014-0483-7D 2014 Association for Research in Otolaryngology
1037
JAROJournal of the Association for Research in Otolaryngology

pulse rate, and (ii) vocal tract length (VTL),1 mainlyrelated to the height of the speaker (Fitch and Giedd1999). F0 and VTL have been shown to similarlyinfluence NH listeners’ voice gender identification(Skuk and Schweinberger 2013) and concurrentspeech perception (Darwin et al. 2003).
Unlike NH listeners, cochlear implant (CI) usersdo not benefit from differences in speaker’s gender incompeting talker situations (Luo et al. 2009; Stickneyet al. 2004). This may be partly due to poorrepresentation and/or perception of voice character-istics. Previous studies have shown that CI users’gender categorization performance is highly variableand generally poorer than that of NH listeners (Fuet al. 2004, 2005; Kovačić and Balaban 2009, 2010;Massida et al. 2013; Wilkinson et al. 2013). It wasargued in these studies that CI users might rely moreon F0 than NH listeners. In Fu et al. (2005), when theF0s of the talkers were overlapping, CI users’ gendercategorization performance was poorer than that ofNH participants listening to sinewave-vocoded stimuli(68 vs. 92 % correct). Subsequently, Kovačić andBalaban (2009) also observed that gender categoriza-tion was particularly difficult for CI listeners when theF0 was within the overlap region between the maleand female ranges. Recently, Massida et al. (2013)created a continuum between a typical female voiceand a typical male voice using a morphing technique.They observed that CI users had shallower psycho-metric functions than NH listeners and concludedthat categorization of ambiguous voices, around themiddle point of the continuum, was more difficult forCI users than for NH listeners.
However, the origins of these difficulties are, as yet,unknown. The studies cited above essentially focus onthe role of F0, but VTL could also play a crucial rolein the categorization of voices, especially when the F0cue is ambiguous. For instance, although F0 valueswere estimated and reported in Fu et al. (2005), therewas no attempt to estimate talker VTL values. This isprobably explained by the fact that, unlike F0, it isdifficult to estimate VTL from recordings. To date,the best estimators only achieve between 10 and 30 %root-mean-square-error accuracy (Lammert et al.2013), which is similar to differences between males
and females when measured anatomically (15 %,according to Fant 1970). Thus, it is unclear in Fuet al. (2005) and Massida et al. (2013) to what degreeVTL cues might have contributed to CI and NHperformance. Moreover, although F0 and VTL seemto be the most important cues for gender categoriza-tion in NH listeners (Skuk and Schweinberger 2013),other cues also contribute to gender categorization inrecordings of real speech, such as breathiness(Holmberg et al. 1988; Van Borsel et al. 2009) orintonation (Fitzsimons et al. 2001). These cues may beused differently by CI users, further complicating theinterpretation of past studies based on natural utter-ances by male and female speakers. One indicationthat VTL cues might be particularly degraded comesfrom a study by Mackersie et al. (2011) who observedthat listeners with mild to severe hearing loss above 1kHz could not benefit from VTL differences in aconcurrent sentence experiment. By extension, itseems likely that CI listeners might also have difficul-ties with this cue, but this remains to be shown.
In the present study, we focused on the role of F0and VTL for gender categorization in NH and CIlisteners, by artificially manipulating these two dimen-sions in stimuli resynthesized from one single femalevoice. Although the reduced spectral resolutioninherent to CI sound transmission notoriously de-grades the F0 representation, pitch percept remainspossible on the basis of temporal cues (see Moore andCarlyon 2005 for a review). In particular, it can beexpected that F0 differences of about one octave thatseparate typical male from typical female voices wouldbe accessible. However, when the F0 difference issmaller, this cue might become more ambiguous andless useful. VTL, on the other hand, affects thelocation of the formants (see Fig. 1). In other words,accurate perceptual estimates of VTL rely on accurateperception of the formant peak locations. The limitedspectral resolution of the implant, therefore, would beexpected to severely hinder the perception of thiscue, although such an effect has not been document-ed. The electrodograms in Fig. 1 suggest that thetypical VTL difference between a male and a femalevoice results in a shift of the electrical stimulationpattern by one electrode. Different spectral resolu-tion measures yield slightly different predictionsregarding the detectability of such a shift (see“DISCUSSION” for more details). It could thus alsobe the case that impaired VTL perception preventsvoices with ambiguous F0s from being properlycategorized.
The purpose of the present study was to directlymeasure and characterize the contribution of F0 andVTL cues to gender categorization by CI users ascompared to NH listeners. Because VTL cannot beeasily estimated from recordings of real speech,
1 VTL affects the center frequency of the formants and issometimes referred to as ‘formant dispersion’: lengthening thevocal tract by a given factor results in dividing all formantfrequencies by that same factor, equivalent to an homothetictranslation of the spectral envelope on a log-frequency axis (adetailed explanation can be found in Patterson et al. 2010). One ofthe main differences between VTL and F0, unlike for glottal pulserate, F0, and pitch, there are no commonly defined terms to denotethe acoustic and perceptual analogs of VTL. In the present study,we therefore used the term VTL to refer to the physical dimension,the apparent acoustic dimension, as well as the perceived quantityrelated to this anatomical property.
1038 FULLER ET AL.: Gender Categorization in Cochlear Implants

speech stimuli were resynthesized to effect systematicmanipulation of F0 and apparent VTL cues. Gendercategorization with resynthesized speech was mea-sured as a function of VTL and F0 in CI users and inNH subjects listening to non-vocoded and vocodedversions of the synthesized stimuli. Perceptual weightsfor F0 and VTL were derived from the CI, NH, andNH-vocoded gender categorization data. We predict-ed that the poor spectral resolution of the implantwould affect the relative weights attributed to VTLand F0. A similar prediction was also made for NHlisteners tested with degraded spectral cues in thevocoded condition.
METHODS
Participants
Nineteen postlingually deafened CI users (11 maleand 8 female, mean age=64.6 years, range=28–78
years) with more than 1 year of CI experience (meanexperience=4.6 years, range=1–12 years) were recruit-ed. One CI user was bilaterally implanted. The detailsof all CI participants are shown in Table 1.
This study was conducted in parallel with Fulleret al. (2014), where a musician effect was exploredon gender categorization, and the same non-musician NH listeners comprised the control groupin both studies. The criterion for non-musician wasto have not received musical training within the 7years preceding the study. The motivation forexcluding musicians was that it was suspected thatmusicians might make different use of voice cuesthan non-musicians, especially in degraded condi-tions (which was confirmed by Fuller et al. 2014).As such, non-musician NH listeners were thoughtto be a better control group for CI listeners, whoalso tend to be not musically involved post-implantation (e.g., Fuller et al. 2012), than NHlisteners with extensive musical expertise.
Mag
nitu
de (
dB)
Original
−120
−100
−80
−60
−40
22
12
1
Ele
ctro
de #
Electrodogram
0
2
4
6
8
Am
ount
of c
urre
nt (
A.U
.)
Current distributionVocodedM
agni
tude
(dB
)
−120
−100
−80
−60
−40
22
12
1
Ele
ctro
de #
0
2
4
6
8
Am
ount
of c
urre
nt (
A.U
.)
Frequency (Hz)
Mag
nitu
de (
dB)
100 300 1k 3k 7k−120
−100
−80
−60
−40
100 200 300 400 500 600 700
22
12
1
Time (ms)
Ele
ctro
de #
22 12 1
0
2
4
6
8
Electrode #
Am
ount
of c
urre
nt (
A.U
.)
Frequency (Hz)100 300 1k 3k 7k
12 st.
3.6 st.
Ref
eren
ce fe
mal
e vo
ice
Power spectrum Electrical stimulation (ACE strategy)F
0 do
wn
1 oc
tave
VT
L 23
% lo
nger
FIG. 1. Power spectrum, waveform, and electrodogram of thevowel/aa/in “Vaak.” A different voice is represented per row. Thestimulus resynthesized with the original parameters of the femalevoice is shown in the middle row. The top row shows the F0changes only, by an octave down. The bottom row shows theVTL changed to be made 23 % longer, which results in shiftingall the formants down by 3.6 semitones (st). The left panelshows, over the duration of the vowel, the spectra, for the non-vocoded (left column, noted “Original”) and vocoded (rightcolumn) versions of the stimulus. The spectrum itself is shownby the solid black line, visualizing the harmonics and/or thesinusoidal carriers of the vocoder. The spectral envelope isrepresented by the dashed gray line as extracted by STRAIGHT forthe non-vocoded sounds on the left and as an interpolation
between the carriers for the vocoded sounds on the right. Thelocations of the first three formants, based on a visual inspectionof the envelope, are pointed out by the triangles and stems, forboth the left and the right columns. The analysis filter bands ofthe vocoder are shown in the gray areas in the right column,whereas the sinewave carrier’s frequency is shown with a dottedline. The right panel shows the electrical stimulation as obtainedwith the Nucleus Matlab Toolbox (v4.31, Cochlear Limited,Australia) using an ACE strategy with a default frequency map.The left column shows the electrodogram for the whole word,while the right column shows the total amount of current perchannel accumulated over the duration of the vowel. Thevertical dashed line in this column locates the middleelectrode.
FULLER ET AL.: Gender Categorization in Cochlear Implants 1039

The NH control group of the present studycomprised 19 NH participants (3 male and 16 female;mean age=22.1 years, range=19–28 years), who were asubset of the 25 NH non-musician listeners reportedin Fuller et al. (2014). NH participants wereaudiometrically selected to have pure tone thresholdsbetter than 20 dB HL at frequencies between 250 and4,000 Hz. All participants were native Dutch speakers,with no neurological disorders.
The study protocol was approved by the MedicalEthical Committee of the University Medical CenterGroningen. Detailed information about the study wasprovided to the participants before data collection,and written informed consent was obtained. Allsubjects received financial reimbursement for theirparticipation.
Stimuli
Speech Synthesis. The sources for subsequent speechsynthesis were four meaningful Dutch words in CVCformat (“bus,” “vaak,” “leeg” and “pen,” meaning“bus,” “often,” “empty,” and “pencil,” respectively),taken from the NVA corpus (Bosman andSmoorenburg 1995). The source speech tokens werespoken by a single Dutch female talker. The averageword duration was 0.83 s and the average F0 was 201Hz. The VTL was estimated to be 13.5 cm, based onan average height of 169 cm for Dutch women andthe regression between VTL and height reported byFitch and Giedd (1999).
The source speech tokens were manipulated usingthe STRAIGHT software (v40.006b; Kawahara et al.
1999), implemented in MATLAB. Both the F0 and theVTL of the source female voice were manipulated toobtain a male voice at the extreme parameter values,where the F0 was decreased by an octave and the VTLwas increased by 23 % (resulting in a downwardspectral shift of 3.6 semitones). To achieve this inSTRAIGHT, the speech signal was first decomposed intothe F0 contour and the spectral envelope. All values ofthe F0 contour were then multiplied by a specificfactor, resulting in a change in the average F0 whilepreserving the relative fluctuations. The VTL length-ening was effected by compressing the extractedspectral envelope toward the low frequencies. Themodified components were then recombined via apitch synchronous overlap-add resynthesis method. Inprevious studies with similar manipulations, Clarkeet al. (2014) confirmed that the chosen F0 and VTLvalues, applied together, indeed made the listenersperceive a talker of a different gender than theoriginal one, and Fuller et al. (2014) confirmed thesevalues provided a full characterization of gendercategorization from the female’s voice to that of aman’s.
In the present study, similar to the studies byClarke et al. and Fuller et al., intermediate steps werecreated between the source female voice and thetarget male talker. The F0 was varied to be 0, 3, 6, 9,or 12 semitones below the F0 of the original femalesource, which corresponds to changes of 0, 19, 41, 68,and 100 % or average F0 values of 201, 169, 142, 119,and 100 Hz. The VTL was varied to be 0.0, 0.7, 1.6,2.4, 3.0, or 3.6 semitones, i.e., 0, 4, 7, 14, 19, and 23 %longer than the VTL of the female source, corre-
TABLE 1Details of the CI participants
Subject number Gender Years of CI use Cochlear implant Speech processor Rate of stimulation
1 Male 9 CI24R CS CP810 9002 Male 5 HiRes 90K Helix Harmony 3,7123 Male 4 HiRes 90K Helix Harmony 8494 Male 1 CI24RE CA CP810 9005 Female 4 HiRes 90K Helix Harmony 2,1846 Female 12 CI24R k CP810 9007 Male 2 CI24RE CA CP810 9008 Male 5 CI24RE CA Freedom 9009 Female 2 CI24RE CA CP810 90010 Female 3 CI512 CP810 90011 Male 6 HiRes 90K Helix Harmony 2,90012 Male 4 HiRes 90K Helix Harmony 1,74013 Female 3 CI24RE CA CP810 90014 Male 8 CI24R CA CP810 90015 Male 5 CI 11+11+2M Freedom 90016 Female 2 CI24RE H CP810 90017 Male 2 CI24RE CA CP810 90018 Female 1 CI24RE CA CP810 90019 Female 9 CI24R CA Freedom 900
1040 FULLER ET AL.: Gender Categorization in Cochlear Implants

sponding to lengths of 13.5, 14.1, 14.8, 15.5, 16.1, and16.6 cm. These combinations produced 30 differentvoices and resulted in a total of 120 stimuli (5 F0values×6 VTL values×4 words). All stimuli wereresynthesized, even when the original values of F0and VTL were used. Smith et al. (2007) estimateddistributions of natural voices in the F0–VTL planebased on Peterson and Barney (March 1952) andFitch and Giedd (1999). Using these estimates, wecalculated that all the synthesized voices were within99.7 % of the adult population, and 22 of the 30voices were within 95 %.
Vocoder Processing. Similar to the studies by Fu et al.(2004, 2005), a simple acoustic CI simulation was used inthe form of an eight-channel, sinewave vocoder. Thevocoder was based on the continuous interleavedsampling strategy (Wilson et al. 1991) and was imple-mented using the Angelsound™ software (EmilyS h a n n o n F u F o u n d a t i o n , h t t p : / /www.angelsound.tigerspeech.com/). An eight-channelvocoder was used because it has been shown to yieldboth gender categorization and speech intelligibilityperformance similar to that of the best performing CIusers (Fu et al. 2004, 2005; Friesen et al. 2001). Both ofthese are an indication that the eight-band vocoderlikely delivers spectral resolution functionally similar tothat of better-performing CI users. Despite this func-tional similarity, it should be noted that this type ofvocoder does not accurately reflect the processeshappening in actual implants and is here merely usedto provide an indication of how degraded spectral cuescan affect the task in normal hearing.
The input frequency range was 200–7,000 Hz. Theacoustic input was bandpass-filtered into eight frequen-cy analysis bands using fourth order Butterworth filters.The band cutoff frequencies were distributed accordingto Greenwood (1990) frequency-place formula. Foreach band, a sinusoidal carrier was generated; thefrequency of the sinewave carrier was equal to thecenter frequency of the analysis filter (i.e., the geometricmean of the band cutoff frequencies). The temporalenvelope was extracted from each band using half-waverectification and lowpass filtering with a Butterworthfilter (cutoff frequency=160 Hz, fourth order). Theseenvelopes modulated the corresponding sinusoidalcarriers. Finally, the modulated carriers were summedand the overall level was adjusted to be the same level asthe original speech token. Figure 1 shows from the leftto the right panel the spectra of the generated sounds,the electrodograms, and the total amount of current perchannel accumulated over the duration of the vowel,respectively. The middle row shows the stimulusresynthesized in STRAIGHT, with the F0 and VTL of theoriginal female voice. The top row shows the stimulusresynthesized with only the F0 shifted by an octavedown. The bottom row shows the stimulus with only the
VTL made 23 % longer, which resulted in all formantsbeing shifted down by 3.6 semitones.
Procedure
All synthesized stimuli, with or without vocoding, werepresented using AngelSound™ software (EmilyS h a n n o n F u F o u n d a t i o n , h t t p : / /www.angelsound.tigerspeech.com/). The stimuli wererouted via a PC with an Asus Virtuoso Audio Devicesoundcard (ASUSTeK Computer Inc, Fremont, USA),converted to an analog signal via a DA10 digital-to-analog converter of Lavry Engineering Inc.(Washington, USA), and then played at 65 dB SPLin free field in an anechoic chamber. The participantswere seated at a distance of 1 m from the speaker(Tannoy Precision 8D; Tannoy Ltd., NorthLanarkshire, UK). During testing, the participantheard a randomly selected stimulus, and their taskwas to select one of two response buttons shown onscreen labeled “man” or “vrouw” (i.e., “man” or“woman,” in Dutch), to indicate the gender of thetalker. The participants replied on an A1 AOD 1908touch screen (GPEG International, Woolwich, UK).CI users were tested with their own clinical processor.The CI participants were instructed to use theireveryday clinical volume and sensitivity settings andto use these settings throughout testing. CI listenerswere tested with non-vocoded stimuli. NH listenerswere tested first with non-vocoded stimuli and thenwith vocoded stimuli.
Participant responses were directly scored by theprogram. NH listeners were not naïve to the vocodingprocessing as they had participated in similar exper-iments before. No training was provided to eitherparticipant group for the gender recognition task.The gender categorization task lasted for 10 min. Thisresulted in a total testing time of approximately 20min for NH participants and 10 min for CI users.
Statistical Analysis
All statistical analyses were done in R (version 3.01, RFoundation for Statistical Computing, Vienna, Austria)using the lme4 package (version 1.0-5, Bates et al. 2013).A generalized linear mixed effects model with a logitlink function was used following the method describedby Jaeger (2008). The model selection started from thefull factorial model in lme4 syntax:
score e f 0 � vtl �moh þ 1 þ f 0 � vtl j subjectð Þ
The variable score is the proportion of “man”responses. The f0 and vtl factors are normalizeddimensions defined as f0=−ΔF0/12−1/2 andvtl=ΔVTL/3.6−1/2 where ΔF0 and ΔVTL represent
FULLER ET AL.: Gender Categorization in Cochlear Implants 1041

the F0 and VTL difference in semitones relative to theoriginal voice. With these normalized dimensions, thepoint (f0=−0.5, vtl=−0.5) represents the original femalevoice, while the point ( f0=0.5, vtl=0.5) represents theartificially created male voice. The factor moh codes themode of hearing (NH,NH-vocoded, or CI). The notation“(…|…)” denotes the random effect, here per subject,with “1” thus representing a random intercept persubject. The full factorial model had an Akaike informa-tion criterion (AIC)=6,342, a Bayesian informationcriterion (BIC)=6,492, and a log-likelihood=−3,149.The full factorial model was not significantly differentfrom the simpler model below [χ2(7)=13.45, p=0.062],which was then retained as reference:
score e f 0þ vtlð Þ �mohþ 1 þ f 0 þ vtlð Þ j subjectð Þ
This model had an AIC=6,341, a BIC=6,443, and alog-likelihood=−3,155. This model has random interceptper subject, as well as random slopes for f0 and vtl, alsoper subject. Effects for each factor were then tested usingthe χ2 statistic and p values obtained from the likelihoodratio test comparing the model without the factor ofinterest against the reference model. In order to
comparemodes of hearing, themodel above was appliedto subsets of the data, excluding onemode of hearing at atime and testing themoh effect and its interactions withinthe remaining dataset. Because there were only threecomparisons, no correction formultiple comparisons wasapplied but note that none of the obtained statisticswould have changed significance even with a correctionas stringent as the Bonferroni correction.
To quantify the contribution of the F0 and VTL, asimpler logistic regression model was used (as de-scribed, for instance, by Peng et al. 2009). The“perceptual weights” for each cue were estimated asthe coefficients for the f0 and vtl factors in the logisticregression model. In other words, the cue weights areexpressed as a and b in the equation logit(score)=a f0+b vtl+ε, where ε is the subject-dependent randomintercept. Given the coding of the f0 and vtl variables,the cue weights represent variations in log odd ratiosover the entire course of change along each of thecues. Cue weights for groups of subjects are accom-panied with their associated Wald statistic z. Individualcue weights were also obtained using the model usedfor the statistical analyses, i.e., with random f0 and vtleffects. These are reported in Table 2.
TABLE 2Individual logistic regression coefficients for each subject in each mode of hearing. The “Intercept,” “F0,” and “VTL” columnscorrespond, respectively, to ε, a, and b coefficients of the regression equation given in the “METHODS” section. Summarystatistics are given at the bottom of the table. See the section on statistical analyses for details about the calculation of these
coefficients. Note that the average of the individual coefficients do not exactly match the coefficients reported in text which resultfrom fitting the logistic regression model to the group data (i.e., without F0 and VTL as random effects)
NH
CINon-vocoded Vocoded
Intercept F0 VTL Intercept F0 VTL Intercept F0 VTL
1 −0.79 1.52 6.17 0.12 3.55 −0.34 −0.75 7.41 0.442 −0.43 4.44 5.68 0.09 3.77 1.31 −0.17 5.41 1.193 −0.48 5.29 5.29 0.96 0.30 2.03 0.01 3.96 1.334 −1.01 3.70 6.13 0.14 1.23 1.44 −1.19 10.33 0.055 −1.36 2.50 6.21 0.34 0.44 0.93 −1.08 8.62 0.076 −1.04 2.39 5.77 0.25 3.07 −0.08 −0.88 10.03 0.397 −1.72 4.45 5.87 −0.19 4.83 0.68 −0.78 7.73 0.428 −2.17 4.30 5.75 0.48 0.71 −0.01 −0.66 9.16 0.599 −1.29 6.31 5.42 0.14 1.48 0.20 −0.28 6.80 0.9310 −0.51 3.42 6.07 0.05 0.35 0.78 −0.16 8.28 1.2411 −3.16 5.36 5.52 −0.33 1.31 1.48 −1.52 9.15 −0.3212 −1.39 3.92 6.05 0.46 2.68 0.59 −0.08 5.90 1.2313 0.21 5.55 5.23 0.04 4.38 0.45 −1.04 7.75 0.2314 −0.50 2.40 6.10 0.17 0.96 0.41 −0.34 5.99 0.8815 −2.35 6.04 5.36 1.63 0.50 −0.24 −1.01 2.42 0.0516 −0.30 3.10 5.86 0.02 −0.23 0.23 −1.19 10.33 0.0517 −0.42 4.33 5.62 0.03 2.48 0.52 −0.49 8.18 0.7418 −0.98 3.92 5.41 0.20 0.83 1.39 −0.45 7.86 0.8319 −0.74 2.83 6.07 0.48 1.84 0.54 −0.76 9.09 0.61Min −3.16 1.52 5.23 −0.33 −0.23 −0.34 −1.52 2.42 −0.32Max 0.21 6.31 6.21 1.63 4.84 2.03 0.01 10.33 1.33Mean −1.08 3.99 5.77 0.27 1.82 0.65 −0.68 7.60 0.58Std. dev. 0.82 1.34 0.33 0.43 1.51 0.65 0.44 2.12 0.48
1042 FULLER ET AL.: Gender Categorization in Cochlear Implants

RESULTS
In this study, there was no “correct” answer for gendercategorization, as all stimuli were resynthesized to bebetween a woman’s voice and a man’s voice.Therefore, the categorization judgment of NH groupwas considered to be the “normal” gender categoriza-tion, and CI and NH-vocoded performance wereevaluated with respect to this normal performance.Figure 2 shows the results for the three modes ofhearing in relation to the normal performance in thistest, as is defined by the performance of NH listeners.The normal data are the NH results that are orderedfrom most strongly judged female voice conditions inthe left to most strongly judged male voice conditionsin the right. The figure clearly shows a more variableand abnormal pattern for the gender categorizationin CI users compared to both the NH and the NH-vocoded modes of hearing. The NH-vocoded mode ofhearing also differs from the normal categorization,but there was less variation in their judgment than thereal CI users.
Figure 3 shows the average and individual results inmore detail, for all conditions tested, and separatelyfor the NH (top), the NH-vocoded (middle), and CI(bottom) modes of hearing. The comparison betweenthe top and bottom panels again shows the discrep-ancy between NH and CI listeners. With non-vocodedspeech (top panel), NH responses gradually shift fromfemale to male as the VTL or F0 are increased. Withthe vocoded speech (middle panel) or with real CI
users (bottom panel), VTL had little effect on gendercategorization. Compared to VTL, F0 had a stronger
FIG. 2. Gender categorization results of NH listeners (red squares),NH listeners tested with vocoded stimuli (CIsim, yellow diamonds),and CI users (blue circles). The x-axis represents the 30 voiceconditions ordered according to the NH listeners’ average gendercategorization, from female on the left to male on the right. Thecircles and diamonds show the data for the actual and simulated CIlisteners for the same voice conditions. The error bars represent thestandard error.
FIG. 3. Individual and average gender categorization judgments,presented as maps in the F0–VTL plane. For each mode of hearing,the smaller panels numbered 1 to 19 show the individual mapswhere each pixel corresponds to a combination of F0 and VTL, whileblue corresponds to 100 % “man” responses and red corresponds to100 % “woman” responses.
FULLER ET AL.: Gender Categorization in Cochlear Implants 1043
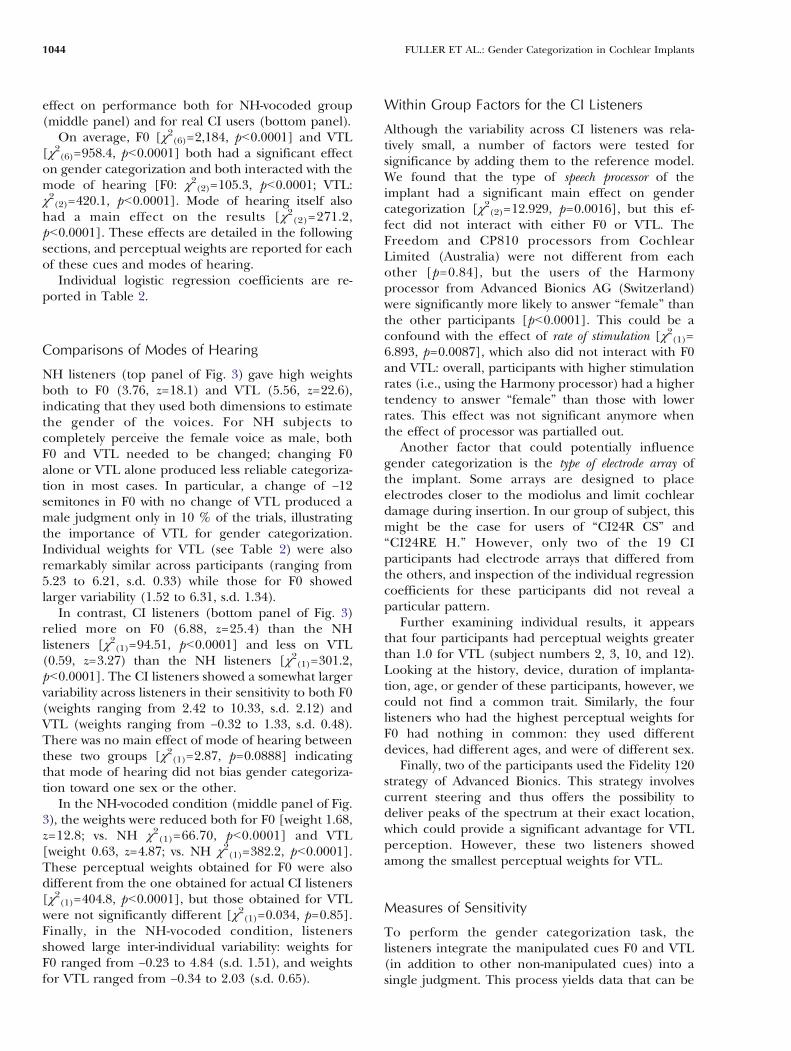
effect on performance both for NH-vocoded group(middle panel) and for real CI users (bottom panel).
On average, F0 [χ2(6)=2,184, pG0.0001] and VTL[χ2(6)=958.4, pG0.0001] both had a significant effecton gender categorization and both interacted with themode of hearing [F0: χ2(2)=105.3, pG0.0001; VTL:χ2(2)=420.1, pG0.0001]. Mode of hearing itself alsohad a main effect on the results [χ2(2)=271.2,pG0.0001]. These effects are detailed in the followingsections, and perceptual weights are reported for eachof these cues and modes of hearing.
Individual logistic regression coefficients are re-ported in Table 2.
Comparisons of Modes of Hearing
NH listeners (top panel of Fig. 3) gave high weightsboth to F0 (3.76, z=18.1) and VTL (5.56, z=22.6),indicating that they used both dimensions to estimatethe gender of the voices. For NH subjects tocompletely perceive the female voice as male, bothF0 and VTL needed to be changed; changing F0alone or VTL alone produced less reliable categoriza-tion in most cases. In particular, a change of −12semitones in F0 with no change of VTL produced amale judgment only in 10 % of the trials, illustratingthe importance of VTL for gender categorization.Individual weights for VTL (see Table 2) were alsoremarkably similar across participants (ranging from5.23 to 6.21, s.d. 0.33) while those for F0 showedlarger variability (1.52 to 6.31, s.d. 1.34).
In contrast, CI listeners (bottom panel of Fig. 3)relied more on F0 (6.88, z=25.4) than the NHlisteners [χ2(1)=94.51, pG0.0001] and less on VTL(0.59, z=3.27) than the NH listeners [χ2(1)=301.2,pG0.0001]. The CI listeners showed a somewhat largervariability across listeners in their sensitivity to both F0(weights ranging from 2.42 to 10.33, s.d. 2.12) andVTL (weights ranging from −0.32 to 1.33, s.d. 0.48).There was no main effect of mode of hearing betweenthese two groups [χ2(1)=2.87, p=0.0888] indicatingthat mode of hearing did not bias gender categoriza-tion toward one sex or the other.
In the NH-vocoded condition (middle panel of Fig.3), the weights were reduced both for F0 [weight 1.68,z=12.8; vs. NH χ2(1)=66.70, pG0.0001] and VTL[weight 0.63, z=4.87; vs. NH χ2(1)=382.2, pG0.0001].These perceptual weights obtained for F0 were alsodifferent from the one obtained for actual CI listeners[χ2(1)=404.8, pG0.0001], but those obtained for VTLwere not significantly different [χ2(1)=0.034, p=0.85].Finally, in the NH-vocoded condition, listenersshowed large inter-individual variability: weights forF0 ranged from −0.23 to 4.84 (s.d. 1.51), and weightsfor VTL ranged from −0.34 to 2.03 (s.d. 0.65).
Within Group Factors for the CI Listeners
Although the variability across CI listeners was rela-tively small, a number of factors were tested forsignificance by adding them to the reference model.We found that the type of speech processor of theimplant had a significant main effect on gendercategorization [χ2(2)=12.929, p=0.0016], but this ef-fect did not interact with either F0 or VTL. TheFreedom and CP810 processors from CochlearLimited (Australia) were not different from eachother [p=0.84], but the users of the Harmonyprocessor from Advanced Bionics AG (Switzerland)were significantly more likely to answer “female” thanthe other participants [pG0.0001]. This could be aconfound with the effect of rate of stimulation [χ2(1)=6.893, p=0.0087], which also did not interact with F0and VTL: overall, participants with higher stimulationrates (i.e., using the Harmony processor) had a highertendency to answer “female” than those with lowerrates. This effect was not significant anymore whenthe effect of processor was partialled out.
Another factor that could potentially influencegender categorization is the type of electrode array ofthe implant. Some arrays are designed to placeelectrodes closer to the modiolus and limit cochleardamage during insertion. In our group of subject, thismight be the case for users of “CI24R CS” and“CI24RE H.” However, only two of the 19 CIparticipants had electrode arrays that differed fromthe others, and inspection of the individual regressioncoefficients for these participants did not reveal aparticular pattern.
Further examining individual results, it appearsthat four participants had perceptual weights greaterthan 1.0 for VTL (subject numbers 2, 3, 10, and 12).Looking at the history, device, duration of implanta-tion, age, or gender of these participants, however, wecould not find a common trait. Similarly, the fourlisteners who had the highest perceptual weights forF0 had nothing in common: they used differentdevices, had different ages, and were of different sex.
Finally, two of the participants used the Fidelity 120strategy of Advanced Bionics. This strategy involvescurrent steering and thus offers the possibility todeliver peaks of the spectrum at their exact location,which could provide a significant advantage for VTLperception. However, these two listeners showedamong the smallest perceptual weights for VTL.
Measures of Sensitivity
To perform the gender categorization task, thelisteners integrate the manipulated cues F0 and VTL(in addition to other non-manipulated cues) into asingle judgment. This process yields data that can be
1044 FULLER ET AL.: Gender Categorization in Cochlear Implants

represented in a three-dimensional space with F0,VTL, and gender categorization as the three dimen-sions (as displayed in Fig. 3). For each participant, thetwo perceptual weights, resulting from the cueweighting analysis, define a plane in the logit F0–VTL space. The slope of this surface represents thesensitivity in perceiving the gender difference instimuli. The maximal slope, or the score gradient,represents the absolute sensitivity independent of the
cue that is used and can be calculated as smax
¼ffiffiffiffiffiffiffiffiffiffiffiffiffiffiffia2 þ b2
pwhere a and b are the coefficients for f0
and vtl as defined in the logistic regression. Anotherslope can be calculated along the straight line betweenthemale and the female voice. This diagonal is similar tothe line followed by the continuum of voices usedin Massida et al. (2013). The slope along this line,calculated as sdiag ¼ a þ bð Þ= ffiffiffi
2p
, thus reflects thesensitivity in a way that is comparable to that ofMassida et al. (2013). Note that none of theseslopes give any indication about the normalbehavior by themselves, and they only bear infor-mation about how sensitive participants are to anyof the cues used in a specific task.
The values for smax and sdiag were calculated foreach participant and compared across groups. Wefound that maximal slopes smax were similar for NH(7.12, s.d. 0.56) and CI (7.65, s.d. 2.09) listeners[t(20.6)=1.06, p=0.29]. However, when comparingslopes along the diagonal, CI users (5.78, s.d. 1.39)did show lower slopes than NH listeners [6.90, s.d.0.77; t(28.07)=−3.07, p=0.0048].
DISCUSSION
In this study, gender categorization by CI users wasshown to be abnormal relative to NH performancewith unprocessed speech. By systematically varying F0and VTL cues with synthesized stimuli, we found thatCI users’ gender categorization mainly depends on F0cues, with nearly no contribution of VTL cues. This isan important finding, as F0 alone or VTL alone is notsufficient for the normal categorization of gender.
Normal Gender Categorization
In this study, “normal” gender categorization wasdefined as NH performance with non-vocodedspeech. These results are in accordance with datapreviously reported in literature that also showed NHsubjects to rely equally strongly on both F0 and VTLcues for gender categorizat ion (Skuk andSchweinberger 2013; Smith and Patterson 2005;Smith et al. 2007). Only when both VTL and F0 werechanged was the source female voice completely
perceived as male. When the source female VTL wasretained, even the largest F0 change (−12 semitones)only resulted in a “male” judgment in less than 10 %of the trials. Reciprocally, when the source female F0was retained and only VTL was changed (by 3.6semitones), the voice was judged as “male” only inabout 30 % of the trials. These results are comparableto those obtained in previous gender categorizationstudies (Smith and Patterson 2005; Smith et al. 2007)and emphasize the importance of both vocal charac-teristics.
Gender Categorization by CI Listeners
CI gender categorization was abnormal relative to NHperformance with unprocessed speech. Differentfrom NH performance, CI users’ weighted F0 cuesvery strongly and VTL cues almost not at all in thecategorization. These results therefore bring strongevidence to what was indirectly suggested in previousstudies, namely, that CI users primarily rely on F0 cuesfor gender categorization (Fu et al. 2004, 2005;Kovačić and Balaban 2009, 2010). However, further,the present results also showed that overreliance onF0 cues may cause CI users to make abnormaljudgments of a talker’s gender.
Unlike for the NH listeners, the voice presented inthe experiment never seemed to be ambiguous to theCI participants. For NH listeners, 7 of the 30 voicesproduced average male judgments between 35 and 65%. For the CI listeners, none of the voices produced ajudgment in that range. This is in apparent contrastwith the results of Massida et al. (2013) who reportedthat the gender categorization deficit in CI comparedto NH listeners was “stronger for ambiguous stimuli”in the continuum between a male and a female voice.This conclusion was supported by the fact that thepsychometric functions for their CI participants were58 % shallower than for their NH participants. In ourstudy, instead of using a unidimensional continuum,we measured gender categor izat ion on abidimensional space. Sensitivity in such a space iscaptured by the maximal slope of the two-dimensionalpsychometric function, i.e., the norm of the gradientof the plane fitted to the logit scores as described inthe last part of the “RESULTS” section. With thissensitivity measure, we found that CI listeners showedat least as high sensitivity as NH listeners on average.In other words, the psychometric functions wereequally steep for CI and NH listeners, but theirorientation in the F0–VTL plane was different.However, when measuring sensitivity along a unidi-mensional continuum between our female and malevoices similar to the one used by Massida et al. (2013),we found results consistent with their findings: thatsensitivity along that continuum was smaller for CI
FULLER ET AL.: Gender Categorization in Cochlear Implants 1045
listeners than for NH listeners. Our results now bringfurther explanation that this weaker sensitivity to voicegender is due to a deficit in VTL perception.
It is perhaps surprising that CI listeners showedsuch a strong reliance on F0 cues when pitchperception has been repeatedly reported as defective,or at best, weak, with an implant (see Moore andCarlyon 2005 for a review). However, it is worth notingthat the F0 difference separating our male and femalevoices—one octave—is extremely large compared toF0 difference limens in NH listeners (e.g., Rogerset al. 2006, report F0 difference limens in words ofabout half a semitone) or even in CI listeners (3.4semitones, reported in that same study). In otherwords, while F0 perception is indeed degraded in CIlisteners, it remains sufficiently robust to discriminatethe pitch of a male voice from that of a female voice.
VTL, on the other hand, could be expected to bemore clearly perceived in CIs, as changes along thisdimension do not affect the spectral fine structure butthe spectral envelope, which is better preserved in theimplant. The right-most column of Figure 1 showselectrical stimulation patterns for the voice with theunmodified VTL and the elongated VTL of the malevoice. Frequency channels in CIs are typically separat-ed by 2.5 to 3.0 semitones. The VTL separationbetween the male and female voice, 3.6 semitones,thus results in a shift of the stimulation pattern alongthe electrode array of about one electrode (Fig. 1,right-most column). Using stimulation patterns com-prising one to eight adjacent electrodes (the latter isrelatively similar to the stimulation pattern of thevowels in our experiment), Laneau and Wouters(2004) found that CI listeners have just-noticeabledifferences for place shifts of about 0.5 electrodes. Yet,the CI users in our experiment did not use the VTLcue for gender categorization. Another measure ofspectral resolution uses broadband spectral ripplediscrimination, where listeners have to discriminatebetween a spectral ripple pattern and its inverse-phasecounterpart. With this method, Anderson et al. (2011)showed that, on average, CI listeners could discrimi-nate phase-inverted spectral ripples up to 1.68 ripple/octave. The detection of the 3.6-semitone shift in ourexperiment would require discrimination of 1.67ripple/octave, so average CI listeners could perhapsjust detect this VTL shift. However, on a largerpopulation of CI users, Won et al. (2007) observedthat only about 35 % of their participants haddiscrimination thresholds above 1.44 ripple/octave.Therefore, it remains unclear whether the VTL shiftcould be detected at all by the CI listeners.
From these considerations, two hypotheses canthus be formulated. The first one is that althoughthe difference of VTL is visible on the electrodogram,the wide spread of excitation of electrical stimulation
prevents this cue from being available in the neuralactivity pattern. In other words, the effective spectralresolution of electrical stimulation is not sufficient forthis cue to be perceived. A direct way to test thishypothesis would be to measure VTL differencelimens in CI listeners. The second hypothesis is thatthis cue remains available to some extent in theneural representation but is either too weak or toodistorted to be reliably used for gender categorization.The place–frequency mismatch that results from thefact that electrode arrays cannot be inserted all theway to the apex, for instance, could distort (withoutremoving) the representation of this cue, as previouslysuggested by Kovačić and Balaban (2009, 2010). Insuch a context, CI listeners would overly rely on themore robust cue that is available, i.e., pitch. If thishypothesis was verified, i.e., the VTL cue was onlydistorted but not entirely destroyed, specific trainingcould improve its usability.
Gender Categorization with Vocoded Stimuli
Compared to NH performance with non-vocodedspeech, the NH-vocoded performance was muchpoorer, hewing close to 50 % “man”/“woman”responses at all F0–VTL combinations. Such a patterncan be interpreted as increased uncertainty in theresponses or lack of agreement across participants.Examination of the logistic regression coefficientsshowed that F0 and VTL were used less efficientlythan in the non-vocoded condition. This is expectedsince the sinewave vocoder weakened both F0 andVTL cues, compared to unprocessed speech.
However, performance in the NH-vocoded condi-tion was markedly different from real CI users’performance, suggesting that sinewave vocodingmight be too simple a simulation for gender catego-rization tasks. A notable difference between actualand simulated CI hearing is that, for conditions wherethe F0 was below 160 Hz, the sinewave vocoderprovided not only temporal but also spectral F0 cuesto the NH listeners, which are not available to actualCI users. Nevertheless, NH participants did not seemto make a strong use of these F0 cues as the resultsbelow and above F0=160 Hz are not markedlydifferent. More importantly, even when F0 cues werepresent (below 160 Hz), these cues were weaker thanin the non-vocoded condition. Because the same NHsubjects did the task first with non-vocoded stimuliand then with the vocoded set, they were aware thatthe voice cues were weaker in the vocoded caserelative to the non-vocoded condition, and this couldhave, in turn, resulted in them relying less on thesecues.
Regarding VTL, as the carrier center frequenciesof the vocoder were separated by 7.5 semitones on
1046 FULLER ET AL.: Gender Categorization in Cochlear Implants

average (or 2.7 mm in cochlear distance, according toGreenwood 1990), VTL differences as small as 3.6semitones were not expected to be detectable in thevocoded stimuli. Yet, the cue weight for VTL waslarger in the NH-vocoded condition than for CI users.This suggests that CI users’ functional spectral resolu-tion was probably poorer than that achieved by theeight independent frequency channels of the vocod-er. The specific role of channel interaction in CIscould be investigated in NH listeners using a moreelaborate vocoder (e.g., Churchill et al. 2014).
CONCLUSION
The main finding of our study is that CI users have anabnormal gender categorization compared to NHlisteners. CI users strongly and almost exclusively usethe F0 cue, while NH listeners use both vocalcharacteristics, F0 and VTL, for gender categoriza-tion. This can have practical consequences on every-day situations for CI users as, for a given voice, theymay judge gender differently than what it should be.Further, this could also mean that CI users may not beable to use VTL differences to segregate competingtalkers, thus contributing to difficulties understandingspeech in multi-talker environments. Consequently,although the CI users achieve some gender categori-zation, as was also shown previously, the present studyemphasizes that their ability to do so is not completeand must be considered impaired.
At this point, it remains unclear whether theobserved deficiency in VTL perception is becauseVTL differences are not transmitted by the CI to theauditory nerve (e.g., because of spread of exCitationand channel interaction) or, alternatively, whetherthey are actually transmitted and detected but notreliable enough for accurate gender categorization.Further research is therefore needed to explorewhether VTL differences can be detected at all orwhether they are simply not interpreted as talker-sizedifferences. Based on such knowledge, appropriatecoding schemes or better fitting algorithms for CIscan be developed and abnormal judgment of genderidentification can perhaps be corrected.
Another point that will require further investiga-tion is the extent to which other cues may contributeto gender categorization. Although F0 and VTL seemto be the most important factors for gender categori-zation in NH listeners (Skuk and Schweinberger2013), other cues such as breathiness (Holmberget al. 1988; Van Borsel et al. 2009) or intonation(Fitzsimons et al. 2001) could play a more importantrole in CI listeners.
Finally, the protocol used in the present study was aquick test (10 min only) that characterized how CI
users’ gender categorization deviates from normaland what specific vocal cues are underutilized. Usingsuch a quick test, new coding strategies or fittingalgorithms can be improved to achieve a normalgender categorization, which will likely indicate thatvocal characteristics are fully utilized. Because gendercategorization and specifically F0 and VTL differenceshave been shown to facilitate concurrent speechperception, improving their representation in theimplant could, in turn, lead to improved speech-in-noise perception by CI users.
ACKNOWLEDGMENTS
We would like to thank the participants in this study.Furthermore, we would like to thank Joeri Smit and Karinvan der Velde for their help with collecting the data, as wellas Anita Wagner for her advice regarding statisticalmethods. The fourth author is supported by a NIH R01-DC004792 grant. The sixth author is supported by anotological/neurotological stipendium from the Heinsius-Houbolt Foundation. The last author is supported by aRosalind Franklin Fellowship from the University MedicalCenter Groningen, University of Groningen and the VIDIgrant 016.096.397 from the Netherlands Organization forScientific Research (NWO) and the Netherlands Organiza-tion for Health Research and Development (ZonMw). Thestudy is part of the research program of our department:Healthy Aging and Communication.
Conflict of Interest
There is no conflict of interest regarding thismanuscript.
REFERENCES
ANDERSON ES, NELSON DA, KREFT H, NELSON PB, OXENHAM AJ (2011)Comparing spatial tuning curves, spectral ripple resolution, andspeech perception in cochlear implant users. J Acoust Soc Am130:364–375. doi:10.1121/1.3589255
BATES D, MAECHLER M, BOLKER B, WALKER S (2013) lme4: Linearmixed-effects models using Eigen and S4. http://cran. r-project.org/package=lme4. Version 1.1-6
BOSMAN AJ, SMOORENBURG GF (1995) Intelligibility of Dutch CVCsyllables and sentences for listeners with normal hearing andwith three types of hearing impairment. Audiology 34:260–284
BRUNGART DS (2001) Informational and energetic masking effects inthe perception of two simultaneous talkers. J Acoust Soc Am109:1101–1109
CHURCHILL TH, KAN A, GOUPELL MJ, IHLEFELD A, LITOVSKY RY (2014)Speech perception in noise with a harmonic complex excitedvocoder. J Assoc Res Otolaryngol 15:265–278. doi:10.1007/s10162-013-0435-7
FULLER ET AL.: Gender Categorization in Cochlear Implants 1047

CLARKE J., GAUDRAIN E., CHATTERJEE M., BAŞKENT D (2014) T’ain’t theway you say it, it’s what you say—perceptual continuity and top-down restoration of speech. Hear Res, 315:80–387.
DARWIN CJ, BRUNGART DS, SIMPSON BD (2003) Effects of fundamentalfrequency and vocal-tract length changes on attention to one oftwo simultaneous talkers. J Acoust Soc Am 114:2913–2922
FANT G (1970) Acoustic theory of speech production. Walter deGruyter, The Hague
FESTEN JM, PLOMP R (1990) Effects of fluctuating noise andinterfering speech on the speech-reception threshold forimpaired and normal hearing. J Acoust Soc Am 88:1725–1736
FITCH WT, GIEDD J (1999) Morphology and development of thehuman vocal tract: a study using magnetic resonance imaging. JAcoust Soc Am 106:1511–1522
FITZSIMONS M, SHEAHAN N, STAUNTON H (2001) Gender and theintegration of acoustic dimensions of prosody: implications forclinical studies. Brain Lang 78:94–108
FRIESEN LM, SHANNON RV, BAŞKENT D, WANG X (2001) Speechrecognition in noise as a function of the number of spectralchannels: comparison of acoustic hearing and cochlear im-plants. J Acoust Soc Am 110:1150–1163
FUQJ, CHINCHILLA S, GALVIN JJ III (2004) The role of spectral and temporalcues in voice gender discrimination by normal-hearing listeners andcochlear implant users. J Assoc Res Otolaryngol 5:253–260
FU QJ, CHINCHILLA S, NOGAKI G, GALVIN JJ III (2005) Voice genderidentification by cochlear implant users: the role of spectral andtemporal resolution. J Acoust Soc Am 118:1711–1718
FULLER CD, FREE RH, MAAT B, BAŞKENT D (2012) Musical backgroundnot associated with self-perceived hearing performance orspeech perception in postlingual cochlear-implant users. JAcoust Soc Am 132:1009–1016. doi:10.1121/1.4730910
FULLER CD, GALVIN JJ III, FREE RH, BAŞKENT D (2014) Musician effectin cochlear implant simulated gender categorization. J AcoustSoc Am 135:EL159–EL165
GREENWOOD DD (1990) A cochlear frequency‐position function forseveral species—29 years later. J Acoust Soc Am 87:2592
HOLMBERG EB, HILLMAN RE, PERKELL JS (1988) Glottal airflow andtransglottal air pressure measurements for male and femalespeakers in soft, normal, and loud voice. J Acoust Soc Am 84:511
JAEGER TF (2008) Categorical data analysis: away from ANOVAs(transformation or not) and towards logit mixed models. J MemLang 59:434–446. doi:10.1016/j.jml.2007.11.007
KAWAHARA H, MASUDA-KATSUSE I, DE CHEVEIGNÉ A (1999) Restructuringspeech representations using a pitch-adaptive time–frequency smooth-ing and an instantaneous-frequency-based F0 extraction: possible roleof a repetitive structure in sounds. Speech Commun 27:187–207
KOVAČIĆ D, BALABAN E (2009) Voice gender perception by cochlearimplantees. J Acoust Soc Am 126:762–775
KOVAČIĆ D, BALABAN E (2010) Hearing history influences voicegender perceptual performance in cochlear implant users. EarHear 31:806–814
LAMMERT A, PROCTOR M, NARAYANAN S (2013) Morphological variationin the adult hard palate and posterior pharyngeal wall. J SpeechLang Hear Res 56:521–530
LANEAU J, WOUTERS J (2004) Multichannel place pitch sensitivity incochlear implant recipients. J Assoc Res Otolaryngol 5:285–294.doi:10.1007/s10162-004-4049-y
LUO X, FU QJ, WU HP, HSU CJ (2009) Concurrent-vowel and tonerecognition by Mandarin-speaking cochlear implant users. HearRes 256:75–84
MACKERSIE CL, DEWEY J, GUTHRIE LA (2011) Effects of fundamentalfrequency and vocal-tract length cues on sentence segregationby listeners with hearing loss. J Acoust Soc Am 130:1006–1019.doi:10.1121/1.3605548
MASSIDA Z, MARX M, BELIN P ET AL (2013) Gender categorization incochlear implant users. J Speech Lang Hear Res 56:1389–1401.doi:10.1044/1092-4388(2013/12-0132)
MOORE BC, CARLYON RP (2005) Perception of pitch by people withcochlear hearing loss and by cochlear implant users. In: Pitch.Springer, pp 234-277
PATTERSON RD, GAUDRAIN E, WALTERS TC (2010) The perception offamily and register in musical notes. In: Jones MR, Fay RR,Popper AN (eds) Music perception, 1st Edition. Springer, pp13–50
PENG S-C, LU N, CHATTERJEE M (2009) Effects of cooperating andconflicting cues on speech intonation recognition by cochlearimplant users and normal hearing listeners. Audiol Neurotol14:327–337. doi:10.1159/000212112
PETERSON GE, BARNEY HL (1952) Control methods used in a study ofthe vowels. J Acoust Soc Am 24:175–184
ROGERS CF, HEALY EW, MONTGOMERY AA (2006) Sensitivity to isolatedand concurrent intensity and fundamental frequency incre-ments by cochlear implant users under natural listeningconditions. J Acoust Soc Am 119:2276–2287
SKUK VG, SCHWEINBERGER SR (2013) Influences of fundamentalfrequency, formant frequencies, aperiodicity and spectrum levelon the perception of voice gender. J Speech Lang Hear Res. doi:10.1044/1092-4388(2013/12-0314)
SMITH DR, PATTERSON RD (2005) The interaction of glottal-pulse rateand vocal-tract length in judgements of speaker size, sex, andage. J Acoust Soc Am 118:3177–3186
SMITH DR, WALTERS TC, PATTERSON RD (2007) Discrimination ofspeaker sex and size when glottal-pulse rate and vocal-tractlength are controlled. J Acoust Soc Am 122:3628–3639
STICKNEY GS, ZENG F, LITOVSKY R, ASSMANN P (2004) Cochlear implantspeech recognition with speech maskers. J Acoust Soc Am116:1081
VAN BORSEL J, JANSSENS J, DE BODT M (2009) Breathiness as a femininevoice characteristic: a perceptual approach. J Voice 23:291–294
WILKINSON EP, ABDEL-HAMID O, GALVIN JJ III, JIANG H, FU QJ (2013)Voice conversion in cochlear implantation. Laryngoscope123(Suppl 3):S29–S43
WILSON BS, FINLEY CC, LAWSON DT ET AL (1991) Better speechrecognition with cochlear implants. Nature 352:236–238.doi:10.1038/352236a0
WON JH, DRENNAN WR, RUBINSTEIN JT (2007) Spectral-ripple resolu-tion correlates with speech reception in noise in cochlearimplant users. J Assoc Res Otolaryngol 8:384–392. doi:10.1007/s10162-007-0085-8
1048 FULLER ET AL.: Gender Categorization in Cochlear Implants