Modulation masking in cochlear implant listeners: envelope versus tonotopic components
12
Modulation masking in cochlear implant listeners: envelope versus tonotopic components Monita Chatterjee a) Department of Auditory Implants and Perception, House Ear Institute, 2100 West Third Street, Los Angeles, California 90057 ~Received 27 December 2001; revised 31 December 2002; accepted 6 January 2003! It is hypothesized that channel-interaction in cochlear implant listeners as measured in a modulation-masking experiment would be influenced by both the tonotopic overlap between masker and signal as well as an interaction between their envelopes. Two experiments were conducted to measure the effects of maskers with noisy and steady-state envelopes on modulation detection by four adult Nucleus-22 cochlear implant listeners, as a function of tonotopic distance between the masker and the signal. In the first experiment, we measured detection thresholds for a 50-Hz modulation in the envelope of a 500-Hz carrier pulse train, in the presence of a masker stimulating regions basal and apical to, as well as overlapping with, the signal. The maskers had two kinds of envelopes: ~i! amplitude-modulated by flat-spectrum noise ~NAM! and ( ii ) steady-state (SS peak ) at a level corresponding to the maximum of the noise fluctuation range. In general, modulation thresholds obtained in the presence of the NAM maskers significantly exceeded thresholds obtained with the corresponding SS peak maskers. The ratio r of the threshold modulation depth m obtained with the NAM masker to that obtained with the SS peak masker was defined as a conservative index of ‘‘envelope masking.’’ In the second experiment, r was determined for two different tasks: the detection of modulation at 20 Hz and steady-state intensity increment detection. Compared to the 50-Hz modulation detection results, the ratio r was reduced for the 20-Hz modulation detection task and even more so for the steady-state increment detection task. It is concluded that channel-interaction can be significantly increased in cochlear implant listeners when dynamic stimuli are used in place of steady-state stimuli. © 2003 Acoustical Society of America. @DOI: 10.1121/1.1555613# PACS numbers: 43.66.Ts, 43.66.Ba, 43.66.Dc @NFV# I. INTRODUCTION Present-day cochlear implants are capable of transmit- ting a great deal of information to the brain. The electrical signals stimulating the auditory nerve are delivered to mul- tiple channels at a rapid rate. The perceptual consequences of multi-channel, concurrent stimulation are likely to arise from interactions at various levels of the auditory system. At the most peripheral level, summations and cancellations will oc- cur instantaneously between overlapping electric fields. One commonly used method to avoid this is to stagger pulses in time across channels, or ‘‘interleave’’ them. Even with inter- leaving, if the pulse rate is fast enough, residual charge on the auditory-nerve membrane from prior stimuli is likely to interact with the charge from future stimuli. For auditory neurons responding to stimuli on adjacent channels, recovery from stimulation on one channel will influence the response to the second. This kind of peripheral interaction is expected to accumulate over time for very rapid stimulation rates. At a more central processing stage, interactions may occur be- tween stimuli that do not necessarily generate overlapping excitation patterns, but have coherent fluctuations or similar temporal envelopes. The net interaction between concurrent stimuli on two channels of a cochlear implant is likely to be a composite of their mutual distance in tonotopic ~more pe- ripheral! and temporal ~more central! domains. Speech processors in cochlear implant devices deliver acoustic information in the form of amplitude modulations in carrier signals stimulating tonotopically appropriate elec- trodes in the implanted array. It is therefore of some impor- tance to understand the processing of such modulation by cochlear implant listeners. We are particularly interested in quantifying how modulation is processed in the presence of competing fluctuations, a common everyday challenge for cochlear implant listeners. In a task involving the detection of envelope modulation on a ‘‘signal’’ channel in the presence of a competing fluc- tuation on a ‘‘noise’’ channel, masking may occur in both tonotopic and envelope domains. A masker having more tonotopic overlap with the signal may be expected to pro- duce more masking than a tonotopically remote masker: we define this as ‘‘tonotopic masking.’’ In the second kind of interaction considered here, a masker with a temporal enve- lope that is similar to the signal envelope will have a greater effect on modulation detection than a masker with a percep- tually distinct temporal envelope: we define this as ‘‘enve- lope masking.’’ Whereas tonotopic interactions can be ex- plained by overlap at the level of the auditory nerve, temporal envelope interactions are likely to involve more central processes. a! Electronic mail: [email protected] 2042 J. Acoust. Soc. Am. 113 (4), Pt. 1, April 2003 0001-4966/2003/113(4)/2042/12/$19.00 © 2003 Acoustical Society of America
-
Upload
boystownhospital -
Category
Documents
-
view
6 -
download
0
Transcript of Modulation masking in cochlear implant listeners: envelope versus tonotopic components
Modulation masking in cochlear implant listeners: envelopeversus tonotopic components
Monita Chatterjeea)
Department of Auditory Implants and Perception, House Ear Institute, 2100 West Third Street, Los Angeles,California 90057
~Received 27 December 2001; revised 31 December 2002; accepted 6 January 2003!
It is hypothesized that channel-interaction in cochlear implant listeners as measured in amodulation-masking experiment would be influenced by both the tonotopic overlap between maskerand signal as well as an interaction between their envelopes. Two experiments were conducted tomeasure the effects of maskers with noisy and steady-state envelopes on modulation detection byfour adult Nucleus-22 cochlear implant listeners, as a function of tonotopic distance between themasker and the signal. In the first experiment, we measured detection thresholds for a 50-Hzmodulation in the envelope of a 500-Hz carrier pulse train, in the presence of a masker stimulatingregions basal and apical to, as well as overlapping with, the signal. The maskers had two kinds ofenvelopes:~i! amplitude-modulated by flat-spectrum noise~NAM ! and (i i ) steady-state (SSpeak) ata level corresponding to the maximum of the noise fluctuation range. In general, modulationthresholds obtained in the presence of the NAM maskers significantly exceeded thresholds obtainedwith the corresponding SSpeak maskers. The ratior of the threshold modulation depthm obtainedwith the NAM masker to that obtained with the SSpeakmasker was defined as a conservative indexof ‘‘envelope masking.’’ In the second experiment,r was determined for two different tasks: thedetection of modulation at 20 Hz and steady-state intensity increment detection. Compared to the50-Hz modulation detection results, the ratior was reduced for the 20-Hz modulation detection taskand even more so for the steady-state increment detection task. It is concluded thatchannel-interaction can be significantly increased in cochlear implant listeners when dynamicstimuli are used in place of steady-state stimuli. ©2003 Acoustical Society of America.@DOI: 10.1121/1.1555613#
PACS numbers: 43.66.Ts, 43.66.Ba, 43.66.Dc@NFV#
mauesm
thoc
nsro
toryvestetbinilarebe
iverinc-
or-byinof
for
onc-thorero-we
ofve-terep-e-ex-e,re
I. INTRODUCTION
Present-day cochlear implants are capable of transting a great deal of information to the brain. The electricsignals stimulating the auditory nerve are delivered to mtiple channels at a rapid rate. The perceptual consequencmulti-channel, concurrent stimulation are likely to arise frointeractions at various levels of the auditory system. Atmost peripheral level, summations and cancellations willcur instantaneously between overlapping electric fields. Ocommonly used method to avoid this is to stagger pulsetime across channels, or ‘‘interleave’’ them. Even with inteleaving, if the pulse rate is fast enough, residual chargethe auditory-nerve membrane from prior stimuli is likelyinteract with the charge from future stimuli. For auditoneurons responding to stimuli on adjacent channels, recofrom stimulation on one channel will influence the responto the second. This kind of peripheral interaction is expecto accumulate over time for very rapid stimulation rates. Amore central processing stage, interactions may occurtween stimuli that do not necessarily generate overlappexcitation patterns, but have coherent fluctuations or simtemporal envelopes. The net interaction between concurstimuli on two channels of a cochlear implant is likely to
a!Electronic mail: [email protected]
2042 J. Acoust. Soc. Am. 113 (4), Pt. 1, April 2003 0001-4966/2003/1
it-ll-
of
e-e
in-n
ryed
ae-grnt
a composite of their mutual distance in tonotopic~more pe-ripheral! and temporal~more central! domains.
Speech processors in cochlear implant devices delacoustic information in the form of amplitude modulationscarrier signals stimulating tonotopically appropriate eletrodes in the implanted array. It is therefore of some imptance to understand the processing of such modulationcochlear implant listeners. We are particularly interestedquantifying how modulation is processed in the presencecompeting fluctuations, a common everyday challengecochlear implant listeners.
In a task involving the detection of envelope modulation a ‘‘signal’’ channel in the presence of a competing flutuation on a ‘‘noise’’ channel, masking may occur in botonotopic and envelope domains. A masker having mtonotopic overlap with the signal may be expected to pduce more masking than a tonotopically remote masker:define this as ‘‘tonotopic masking.’’ In the second kindinteraction considered here, a masker with a temporal enlope that is similar to the signal envelope will have a greaeffect on modulation detection than a masker with a perctually distinct temporal envelope: we define this as ‘‘envlope masking.’’ Whereas tonotopic interactions can beplained by overlap at the level of the auditory nervtemporal envelope interactions are likely to involve mocentral processes.
13(4)/2042/12/$19.00 © 2003 Acoustical Society of America
on
’’nedna
ssd3
in
tsenng;
auis
teali
lisds
ro,ha
ymec
leas
ngaa
atjen
erpth
ret
n,eely
g’’r
nm
ker-atcegnalrmu-
thet ofhatersob-
ts ofde-
neweree it
tso-lsenalner-s isindere
c-vel,onsopethedy-
peakdu-ted
isy
theoneferese
im-ho-hlyri-ed
l onrom
-
In the psychoacoustics literature, envelope interactihave been referred to as ‘‘modulation masking’’~Bacon andGrantham, 1989! or as ‘‘modulation detection interference~MDI ! ~Yost and Sheft, 1989!. When the carriers have beebroadband, the term ‘‘modulation masking’’ has been uswhile ‘‘MDI’’ refers more to envelope interactions betweenarrow-band carriers. However, the distinction is uncleMDI may be attributed to both within-channel and acrochannel interactions~Bacon and Grantham, 1989; Yost anSheft, 1989; Houtgast, 1989; Bacon and Konrad, 199!.Across-channel MDI has been demonstrated in hearimpaired listeners~Grose and Hall, 1994!, suggesting thatthe central processing necessary to produce such effecpreserved in listeners with cochlear loss. Recent experimin acoustic hearing have implicated auditory groupimechanisms in across-channel MDI~Hall and Grose, 1991Oxenham and Dau, 2001; Gockel and Carlyon, 2000!. It ispossible that within-channel MDI effects are due to theditory system essentially performing a temporal pattern dcrimination task~a modulation depth discrimination task! be-tween the signal-modulated and the signal-unmodulaintervals. Auditory grouping of the masker and signal malso play a role in within-channel MDI, as both stimuwould excite the same peripheral channel.
Several researchers working with cochlear implantteners have studied channel-interactions in the tonotopicmain using forward-masked excitation patterns, acrochannel gap-detection, and pitch comparisons acelectrodes~Shannon, 1983; Limet al., 1989; Tong and Clark1986; Hanekom and Shannon, 1998; Chatterjee and Snon, 1998; Throckmorton and Collins 1999!. McKay andMcDermott ~1996! studied spatio-temporal interactions bmeasuring discriminability and perceptual fusion of the teporal patterns of interleaved pulse trains on different eltrode pairs. A general result of these studies is that informtion is integrated across electrode locations spanning at3 mm on the cochlea~for the Nucleus-22 device, this meana distance of four electrode separations!. More recently, Ri-chardsonet al. ~1998! have shown the presence of maskiin the temporal domain in cochlear implant listeners inMDI experiment. They found that the masking due tomodulated masker exceeded that due to an unmodulmasker by amounts that depended on the individual subthe tonotopic distance between the masker and the sigand the modulation depth in the masker envelope. In genthe magnitude of MDI depended on masker-signal tonotodistance, being larger for maskers that were closer tosignal.
In experiments with cochlear implants, ‘‘channels’’ anot as easily defined as in normal hearing. To sidestepambiguity, we will refer to the net masking of modulatiowithin- or across-channel, as ‘‘modulation masking.’’ Wspeculate that both ‘‘tonotopic masking’’ and ‘‘envelopmasking’’ contribute to modulation masking. We tentativesuggest that ‘‘tonotopic masking’’ and ‘‘envelope maskinrespectively correspond to within- and across-channel pcesses yielding MDI in acoustic experiments.
Here, we explore in some detail the relative modulatiomasking effects of steady-state maskers versus dyna
J. Acoust. Soc. Am., Vol. 113, No. 4, Pt. 1, April 2003 Monit
s
,
r:-
g-
ists
--
dy
-o-s-ss
n-
--
a-st
n
edct,al,al,ice
he
o-
-ic
maskers with noisy envelopes, as a function of the massignal tonotopic distance. We initially hypothesized thtonotopic masking would be maximum when this distanwas zero, and that it would decrease as the masker-sielectrode distance was increased. It was less easy to folate a hypothesis about envelope masking. We began withassumption that envelope masking would be independenmasker-signal electrode distance: this would predict tmasked modulation thresholds with the fluctuating maskwould be elevated by a constant amount over thresholdstained with the steady-state maskers. However, the resulthe experiments showed that, in fact, envelope maskingpends on masker-signal distance in a complex manner.
In these experiments, the cochlear implant microphoand speech processor were bypassed and the stimulidelivered through a custom research interface. This madpossible to control the ‘‘tonotopic’’ and ‘‘envelope’’ aspecof the stimuli precisely, without any intervening spectral prcessing. When fluctuations were applied to a carrier putrain, they changed only the temporal envelope of the sigat the desired electrode location: no sidebands were geated on the excitation pattern in the electrode array. Thian important factor of such experiments to keep in mwhen comparing the experimental conditions described hwith those in similar acoustic experiments.
However, fluctuations in the excitation pattern might acompany envelope fluctuations at the auditory-nerve lei.e., the peaks of the envelope might excite more neurthan the valleys. To ensure that our measure of envelmasking did not stem from such spread of excitation atpeaks of the masker envelope, the amplitude of the steastate masker we used as our reference was fixed at theof the corresponding noisy envelope. A comparison of molation masking with these two kinds of maskers is expecto yield a conservative measure of envelope masking.
II. EXPERIMENT 1
In experiment 1, we measured the effects of nomaskers~i.e., masker pulse trains with noisy envelopes! onthe detection of a 50-Hz modulation in the envelope ofsignal. The 50-Hz modulation frequency was selected asthat is in the most sensitive region of the modulation transfunction for these subjects at the carrier level used in thexperiments.
A. Subjects
The subjects~S1, S2, S3, and S4! were four postlin-gually deafened adult users of the Nucleus-22 cochlearplant device. They have participated in numerous psycphysical experiments and may be considered to be higtrained. They also participated in the preliminary expements leading up to this study and were specifically trainin modulation masking tasks. These subjects perform welspeech recognition tests in the laboratory: scores range f80% to 100% in easy sentence recognition tests~CUNY,sound-only!. Table I lists other potentially relevant information.
2043a Chatterjee: Modulation masking in cochlear implant listeners
H
laftte
re-2
our-n is
n tothe
and
A.om-d athas–22
mnd
lairs
B. Stimuli
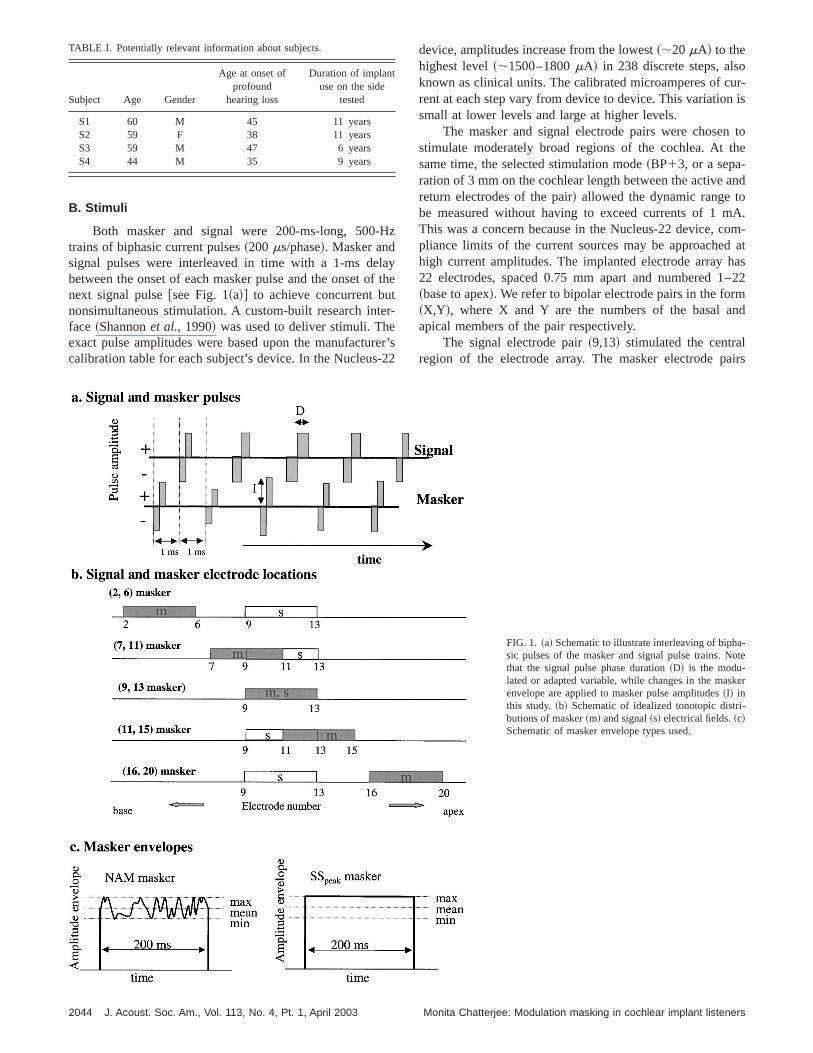
Both masker and signal were 200-ms-long, 500-trains of biphasic current pulses~200ms/phase!. Masker andsignal pulses were interleaved in time with a 1-ms debetween the onset of each masker pulse and the onset onext signal pulse@see Fig. 1~a!# to achieve concurrent bunonsimultaneous stimulation. A custom-built research inface ~Shannonet al., 1990! was used to deliver stimuli. Theexact pulse amplitudes were based upon the manufactucalibration table for each subject’s device. In the Nucleus
TABLE I. Potentially relevant information about subjects.
Subject Age Gender
Age at onset ofprofound
hearing loss
Duration of implantuse on the side
tested
S1 60 M 45 11 yearsS2 59 F 38 11 yearsS3 59 M 47 6 yearsS4 44 M 35 9 years
2044 J. Acoust. Soc. Am., Vol. 113, No. 4, Pt. 1, April 2003
z
ythe
r-
r’s2
device, amplitudes increase from the lowest~;20 mA! to thehighest level~;1500–1800mA! in 238 discrete steps, alsknown as clinical units. The calibrated microamperes of crent at each step vary from device to device. This variatiosmall at lower levels and large at higher levels.
The masker and signal electrode pairs were chosestimulate moderately broad regions of the cochlea. Atsame time, the selected stimulation mode~BP13, or a sepa-ration of 3 mm on the cochlear length between the activereturn electrodes of the pair! allowed the dynamic range tobe measured without having to exceed currents of 1 mThis was a concern because in the Nucleus-22 device, cpliance limits of the current sources may be approachehigh current amplitudes. The implanted electrode array22 electrodes, spaced 0.75 mm apart and numbered 1~base to apex!. We refer to bipolar electrode pairs in the for~X,Y!, where X and Y are the numbers of the basal aapical members of the pair respectively.
The signal electrode pair~9,13! stimulated the centraregion of the electrode array. The masker electrode p
-ote
ker
-
FIG. 1. ~a! Schematic to illustrate interleaving of biphasic pulses of the masker and signal pulse trains. Nthat the signal pulse phase duration~D! is the modu-lated or adapted variable, while changes in the masenvelope are applied to masker pulse amplitudes~I! inthis study.~b! Schematic of idealized tonotopic distributions of masker~m! and signal~s! electrical fields.~c!Schematic of masker envelope types used.
Monita Chatterjee: Modulation masking in cochlear implant listeners
innagn
guth
arseulis
t,ho
eldt
udl oae
oithti-ne
neus
elo
xeesldv
toanosum
o
imsostastio
thee tod inly.ions
lyon-edm-tooiseple.angeross
ate
atise
. Atandwnorv-
sificthefall-of
the
icsub-
~2,6!, ~7,11!, ~9,13!, ~11,15!, and ~16,20! were chosen tostimulate regions basal to, overlapping basally, overlappcompletely, overlapping apically, and apical to the sigelectrical field. The distances between the masker and sielectrode pairs were 5.25, 1.5, 0,21.5, and25.25 mm alonga distance scale centered on the signal electrode 9. Fi1~b! shows a schematic of the electrode locations fordifferent maskers and the signal.
Modulation detection thresholds were measured for vous levels of noise on each masker electrode pair. ‘‘Noiwas applied by scaling successive pulses of a periodic ptrain by numbers drawn from a pseudorandom uniform dtribution with a mean of 1.0 and a range 1.06r (0,r ,1),where r is the factor that determines the noise level~Chat-terjee and Robert, 2001!. We refer to noise level in percenthus, whenr is 0.20, noise level is 20%, and the pulses in tpulse train have amplitudes ranging from 80% to 120%the reference amplitude.1 For each level of noise on thmasker, a measurement was made of modulation threshothe presence of a similar masker pulse train presented tosame electrode pair, but with a fixed steady-state amplitat the peak of the noise fluctuation. Thus, when the levenoise was 20%, the corresponding steady-state masker hfixed pulse amplitude corresponding to 120% of the refence amplitude. The two maskers are labeled ‘‘NAM’’~noiseamplitude modulated! and ‘‘SSpeak’’ @see Fig. 1~c!#. The dif-ference in dB between modulation detection thresholdstained with each NAM masker to thresholds obtained wthe corresponding SSpeak masker gives a conservative esmate of the contribution of the noise envelope to themasking.
Dynamic range for each electrode pair was determias follows. Detection thresholds were obtained for eachmodulated carrier as described under ‘‘Procedure for threold measurements’’ below. Maximum acceptable lev~MALs! were measured using loudness estimation methdescribed previously~Chatterjee, 1999!. Dynamic range isdefined as the difference between the MAL and thresholdmicroamperes.
The reference levels of the masker and signal were fiat 50% of their individual dynamic ranges in microamperTable II lists the actual microampere levels for threshomaximum acceptable level, and the 50% dynamic range lefor each stimulus and subject. This level correspondedcomfortable listening level per channel. When the two chnels of stimulation were combined, loudness of the compite increased. The 50% dynamic range level was set baupon pilot studies conducted to ensure that at the maximnoise level for the masker, the overall loudness for the coposite masker1signal was still within the comfortably loudrange.
Modulation was applied to the pulse phase durationthe signal. This is because the discrete amplitude stepscrease logarithmically in the Nucleus device; as cochlearplant listeners are very sensitive to modulation abovelistening levels, in some cases the size of the amplitudemay be larger than the resolution of the subject. In contrthe device allows fine resolution in the pulse phase dura~steps of 0.4ms!.
J. Acoust. Soc. Am., Vol. 113, No. 4, Pt. 1, April 2003 Monit
glal
ree
i-’’se-
ef
inheefd ar-
b-
t
dn-h-sds
in
d.,ela-
s-edm-
fin--ftept,n
The noise, however, was applied to the amplitudes ofpulses and not to the pulse phase durations. This was donensure that masker and signal pulses could be interleavetime without reducing the interpulse interval excessiveThe noise was applied at levels that exceeded the restrictimposed by the amplitude steps.
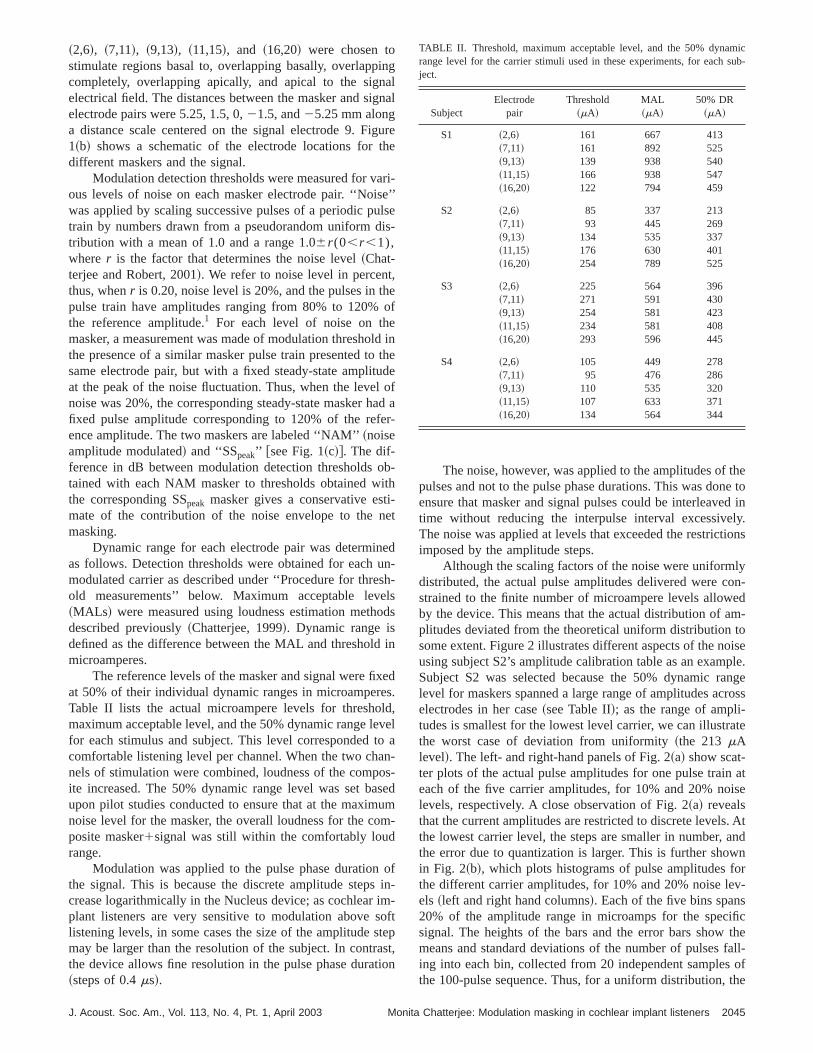
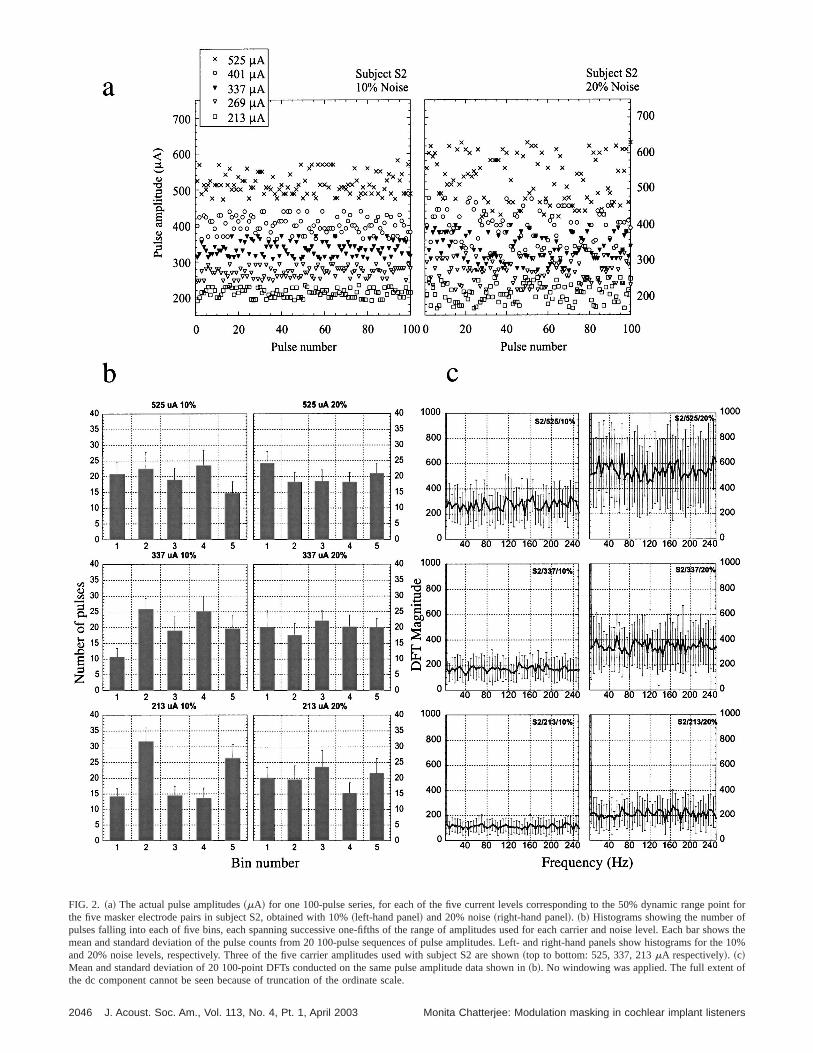
Although the scaling factors of the noise were uniformdistributed, the actual pulse amplitudes delivered were cstrained to the finite number of microampere levels allowby the device. This means that the actual distribution of aplitudes deviated from the theoretical uniform distributionsome extent. Figure 2 illustrates different aspects of the nusing subject S2’s amplitude calibration table as an examSubject S2 was selected because the 50% dynamic rlevel for maskers spanned a large range of amplitudes acelectrodes in her case~see Table II!; as the range of ampli-tudes is smallest for the lowest level carrier, we can illustrthe worst case of deviation from uniformity~the 213mAlevel!. The left- and right-hand panels of Fig. 2~a! show scat-ter plots of the actual pulse amplitudes for one pulse traineach of the five carrier amplitudes, for 10% and 20% nolevels, respectively. A close observation of Fig. 2~a! revealsthat the current amplitudes are restricted to discrete levelsthe lowest carrier level, the steps are smaller in number,the error due to quantization is larger. This is further shoin Fig. 2~b!, which plots histograms of pulse amplitudes fthe different carrier amplitudes, for 10% and 20% noise leels ~left and right hand columns!. Each of the five bins span20% of the amplitude range in microamps for the specsignal. The heights of the bars and the error bars showmeans and standard deviations of the number of pulsesing into each bin, collected from 20 independent samplesthe 100-pulse sequence. Thus, for a uniform distribution,
TABLE II. Threshold, maximum acceptable level, and the 50% dynamrange level for the carrier stimuli used in these experiments, for eachject.
SubjectElectrode
pairThreshold
~mA!MAL~mA!
50% DR~mA!
S1 ~2,6! 161 667 413~7,11! 161 892 525~9,13! 139 938 540~11,15! 166 938 547~16,20! 122 794 459
S2 ~2,6! 85 337 213~7,11! 93 445 269~9,13! 134 535 337~11,15! 176 630 401~16,20! 254 789 525
S3 ~2,6! 225 564 396~7,11! 271 591 430~9,13! 254 581 423~11,15! 234 581 408~16,20! 293 596 445
S4 ~2,6! 105 449 278~7,11! 95 476 286~9,13! 110 535 320~11,15! 107 633 371~16,20! 134 564 344
2045a Chatterjee: Modulation masking in cochlear implant listeners
oint forfr showfor the 1
f
FIG. 2. ~a! The actual pulse amplitudes~mA! for one 100-pulse series, for each of the five current levels corresponding to the 50% dynamic range pthe five masker electrode pairs in subject S2, obtained with 10%~left-hand panel! and 20% noise~right-hand panel!. ~b! Histograms showing the number opulses falling into each of five bins, each spanning successive one-fifths of the range of amplitudes used for each carrier and noise level. Each bas themean and standard deviation of the pulse counts from 20 100-pulse sequences of pulse amplitudes. Left- and right-hand panels show histograms0%and 20% noise levels, respectively. Three of the five carrier amplitudes used with subject S2 are shown~top to bottom: 525, 337, 213mA respectively!. ~c!Mean and standard deviation of 20 100-point DFTs conducted on the same pulse amplitude data shown in~b!. No windowing was applied. The full extent othe dc component cannot be seen because of truncation of the ordinate scale.
2046 J. Acoust. Soc. Am., Vol. 113, No. 4, Pt. 1, April 2003 Monita Chatterjee: Modulation masking in cochlear implant listeners
n.oisis, td
oe
5wm
ththl
-u.4
dheee
pr
aB
cuhed
reldx
ub
eri-ls
-
dalrek
on
in
-ve-
owowachMsh-
s.erdre-
fng.o-ofehe
dore
l is
rmeifi-ith
thehethe
olsels
g act’sl is
iontion
ineft-in-
the
mean should correspond to 20 pulses overall for each biis apparent that the lowest carrier level and the lowest nlevel results in the least uniform distribution: when the nodepth is increased or when the carrier level is increasednumber of amplitude steps available increases, and thetribution becomes more uniform. Figure 2~c! shows themeans and standard deviations of 20 100-point discrete Frier transforms~DFTs! applied to the amplitude series of thsame pulse trains shown in Fig. 2~b!: it is apparent that thenoise has a flat spectrum up to the Nyquist frequency~250Hz!.
C. Procedure for threshold measurements
The task in experiment 1 was to detect modulation atHz in the signal carrier. For each of the five maskers,varied the noise level from 0% to 20% of the reference aplitude, in steps of 5%. When noise was applied tomasker, within a given trial, all three intervals containedsame masker noise. The noise was refreshed from triatrial.
All thresholds were measured using three-down, oneadaptive procedures, theoretically converging at the 79correct point on the psychometric function~Levitt, 1971!.Each run consisted of a maximum of ten reversals anminimum of eight, and was terminated after 55 trials. Tstep size was reduced after the first four reversals. The mand standard deviation of the last five to seven reversals wcalculated~i.e., the first three reversals were discarded! toobtain the result of each run. In all cases, feedback wasvided to the subject~correct/incorrect! on a trial by trial ba-sis.
~i! Absolute detection thresholds: A 2IFC procedure wused. Initial and final step sizes were 2 and 0.5 drespectively. The mean of two such runs was callated to obtain the final threshold. Table II shows tmean values of the thresholds, corrected to the invidual subject’s amplitude calibration table.
~ii ! Modulation detection thresholds: A 3IFC proceduwas used to obtain modulation detection threshoThe ~linearly! adapted variable was modulation inde~m!. Initial and final step sizes depended on the sject’s sensitivity based on pilot data. Typically, ifm atthreshold was less than 0.1, initial and final steps w0.02 and 0.005. Ifm exceeded 0.1, steps were typcally 0.04 and 0.01. The reference per-phase puduration was fixed at 200ms/phase~the minimummeasurable value ofm for this reference is 0.002, corresponding to the 0.4-ms minimum increment in du-ration allowed by the device!. The mean and standardeviation of the results of at least four runs were cculated to obtain the final threshold. These proceduwere used to measure both masked and unmasthresholds.
D. Results
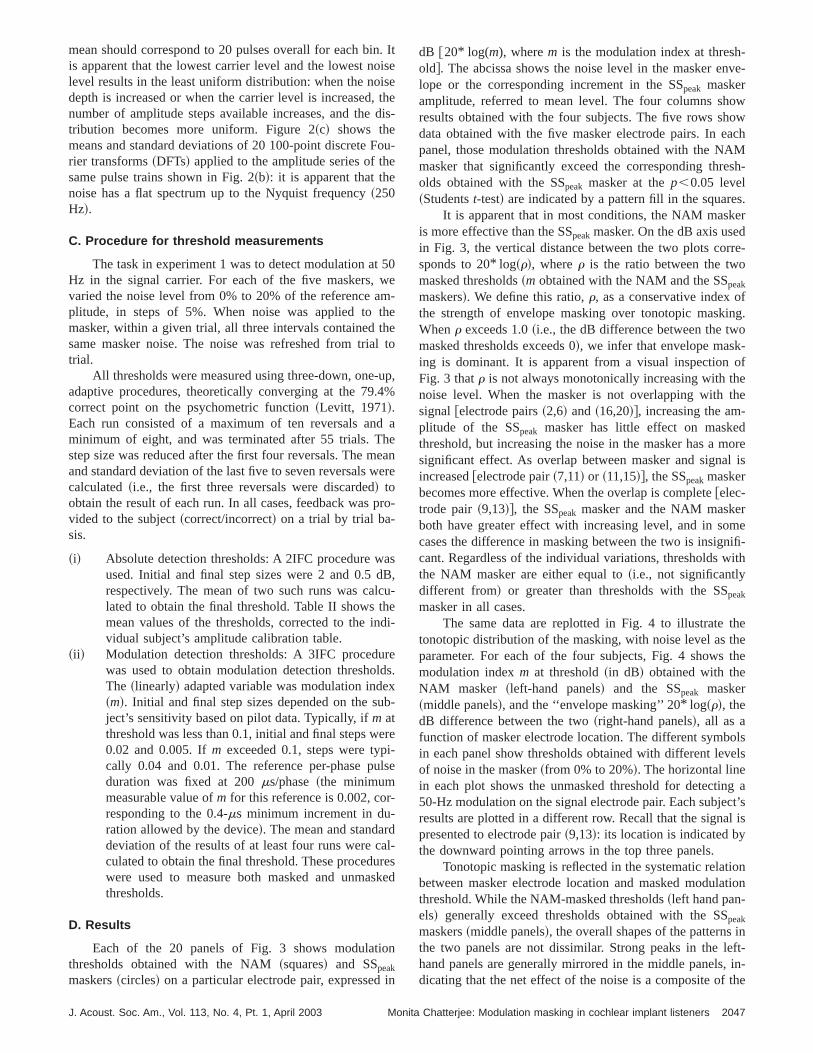
Each of the 20 panels of Fig. 3 shows modulatithresholds obtained with the NAM~squares! and SSpeak
maskers~circles! on a particular electrode pair, expressed
J. Acoust. Soc. Am., Vol. 113, No. 4, Pt. 1, April 2003 Monit
Ite
eheis-
u-
0e-
eeto
p,%
a
anre
o-
s,-
i-
s.
-
e
e
-s
ed
dB @20* log(m), wherem is the modulation index at threshold#. The abcissa shows the noise level in the masker enlope or the corresponding increment in the SSpeak maskeramplitude, referred to mean level. The four columns shresults obtained with the four subjects. The five rows shdata obtained with the five masker electrode pairs. In epanel, those modulation thresholds obtained with the NAmasker that significantly exceed the corresponding threolds obtained with the SSpeak masker at thep,0.05 level~Studentst-test! are indicated by a pattern fill in the square
It is apparent that in most conditions, the NAM maskis more effective than the SSpeakmasker. On the dB axis usein Fig. 3, the vertical distance between the two plots corsponds to 20* log~r!, wherer is the ratio between the twomasked thresholds~m obtained with the NAM and the SSpeak
maskers!. We define this ratio,r, as a conservative index othe strength of envelope masking over tonotopic maskiWhenr exceeds 1.0~i.e., the dB difference between the twmasked thresholds exceeds 0!, we infer that envelope masking is dominant. It is apparent from a visual inspectionFig. 3 thatr is not always monotonically increasing with thnoise level. When the masker is not overlapping with tsignal@electrode pairs~2,6! and~16,20!#, increasing the am-plitude of the SSpeak masker has little effect on maskethreshold, but increasing the noise in the masker has a msignificant effect. As overlap between masker and signaincreased@electrode pair~7,11! or ~11,15!#, the SSpeakmaskerbecomes more effective. When the overlap is complete@elec-trode pair~9,13!#, the SSpeak masker and the NAM maskeboth have greater effect with increasing level, and in socases the difference in masking between the two is insigncant. Regardless of the individual variations, thresholds wthe NAM masker are either equal to~i.e., not significantlydifferent from! or greater than thresholds with the SSpeak
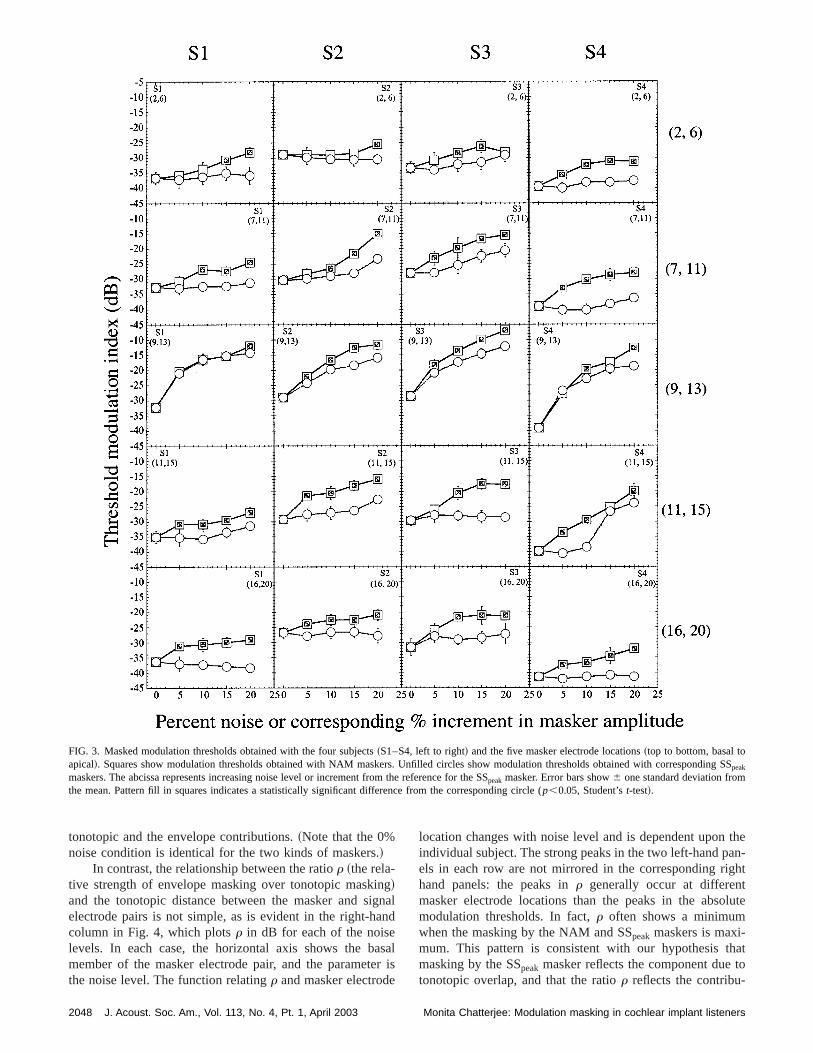
masker in all cases.The same data are replotted in Fig. 4 to illustrate
tonotopic distribution of the masking, with noise level as tparameter. For each of the four subjects, Fig. 4 showsmodulation indexm at threshold~in dB! obtained with theNAM masker ~left-hand panels! and the SSpeak masker~middle panels!, and the ‘‘envelope masking’’ 20* log~r!, thedB difference between the two~right-hand panels!, all as afunction of masker electrode location. The different symbin each panel show thresholds obtained with different levof noise in the masker~from 0% to 20%!. The horizontal linein each plot shows the unmasked threshold for detectin50-Hz modulation on the signal electrode pair. Each subjeresults are plotted in a different row. Recall that the signapresented to electrode pair~9,13!: its location is indicated bythe downward pointing arrows in the top three panels.
Tonotopic masking is reflected in the systematic relatbetween masker electrode location and masked modulathreshold. While the NAM-masked thresholds~left hand pan-els! generally exceed thresholds obtained with the SSpeak
maskers~middle panels!, the overall shapes of the patternsthe two panels are not dissimilar. Strong peaks in the lhand panels are generally mirrored in the middle panels,dicating that the net effect of the noise is a composite of
2047a Chatterjee: Modulation masking in cochlear implant listeners
ing SS
FIG. 3. Masked modulation thresholds obtained with the four subjects~S1–S4, left to right! and the five masker electrode locations~top to bottom, basal toapical!. Squares show modulation thresholds obtained with NAM maskers. Unfilled circles show modulation thresholds obtained with correspondpeakmaskers. The abcissa represents increasing noise level or increment from the reference for the SSpeakmasker. Error bars show6 one standard deviation fromthe mean. Pattern fill in squares indicates a statistically significant difference from the corresponding circle (p,0.05, Student’st-test!.
nggnn
asere
thean-ghttlute
hatto
tonotopic and the envelope contributions.~Note that the 0%noise condition is identical for the two kinds of maskers.!
In contrast, the relationship between the ratior ~the rela-tive strength of envelope masking over tonotopic maski!and the tonotopic distance between the masker and sielectrode pairs is not simple, as is evident in the right-hacolumn in Fig. 4, which plotsr in dB for each of the noiselevels. In each case, the horizontal axis shows the bmember of the masker electrode pair, and the parametthe noise level. The function relatingr and masker electrod
2048 J. Acoust. Soc. Am., Vol. 113, No. 4, Pt. 1, April 2003
ald
alis
location changes with noise level and is dependent uponindividual subject. The strong peaks in the two left-hand pels in each row are not mirrored in the corresponding rihand panels: the peaks inr generally occur at differenmasker electrode locations than the peaks in the absomodulation thresholds. In fact,r often shows a minimumwhen the masking by the NAM and SSpeakmaskers is maxi-mum. This pattern is consistent with our hypothesis tmasking by the SSpeak masker reflects the component duetonotopic overlap, and that the ratior reflects the contribu-
Monita Chatterjee: Modulation masking in cochlear implant listeners
left-henvelope
FIG. 4. Tonotopic distribution of masked thresholds with the NAM masker~left-hand panels! and the SSpeak masker~middle panels! for each of the foursubjects. The right-hand panels show ‘‘envelope masking’’@dB difference between NAM- and SSpeak-masked thresholds, or 20* log~r!#. The symbols show thenoise level. The downward pointing arrows in the top three panels show the location of the signal. Solid horizontal lines in each panel of the twoandcolumns show unmasked threshold for detecting the 50-Hz modulation. Solid horizontal line in each panel in the right hand column shows 0 dB ofmasking.
arrou
dete
elyl to
ee,no-
plex
tion of envelope interaction. We would expect the SSpeak
masking pattern to have peaks near the signal electrodecation: however, the envelope component is not necessexpected to show the same pattern. The results show stdependence on tonotopic distance between the two. Althothe nature of this dependence is complex, subject-depenand also dependent on the level of the noise, the pat
J. Acoust. Soc. Am., Vol. 113, No. 4, Pt. 1, April 2003 Monit
lo-ilyngghnt,rn
suggests that the masking by the NAM masker can be largattributed to envelope masking when the masker is apicaor basal to the signal@electrode pairs~2,6! and ~16,20!# andtonotopic masking is minimal. In the case of the other thrmore overlapping maskers, the relative strengths of the totopic and envelope components change in a more commanner with noise level.
2049a Chatterjee: Modulation masking in cochlear implant listeners
ntt oyk
l o-ta
osotia
erkeasncthare
attofothit2
we
thte-thne-H
iod
owke0%o
%la
ifi-
s
tin
p
thedes.ion
in
ndear
a-ofM
the
tionk0ss
ngx-
re
testdu-sed
po-picandon,ope.eed. Indsk-
ionspicightte
eofinnd
his
ch-
III. EXPERIMENT 2
One question that arises from the results of experimeconcerns the possibility that some of the masking effecthe noise may be simply explained by greater uncertaintthe task in the presence of random fluctuations in the masIf this is the case, we would expect to observe identicasimilar effects when the task is changed~making the reasonable assumption that increasing the uncertainty by a ceramount results in similar elevation in thresholds acrtasks!. On the other hand, if the effect is truly due to tempral interactions between the envelopes, we might expecobserve some task-related differences in the effect, especif we changed the task along a temporal dimension suchthe modulation rate.
The specific objective of this experiment was to detmine whether the greater masking effect of the NAM masover the SSpeak masker would persist when the task wchanged to the detection of a slower modulation freque~20 Hz! or to the detection of a steady-state increment incharge per pulse in an unmodulated carrier. We did not pmetrically vary the masker noise level, but rather chosfixed noise level of 20% for this experiment.
A. Subjects, stimuli, and procedures
The same four subjects S1, S2, S3, and S4 participin experiment 2. Masker and signal stimuli were identicalthose in experiment 1. Modulation detection thresholds20-Hz modulation were measured in the same way as inprevious experiment. When measuring the just detectabletensity increment, the task was to detect a static incrementhe pulse phase duration in the signal over the standardms/phase pulse phase duration. Experimental methodsidentical to those used in experiment 1.
B. Results
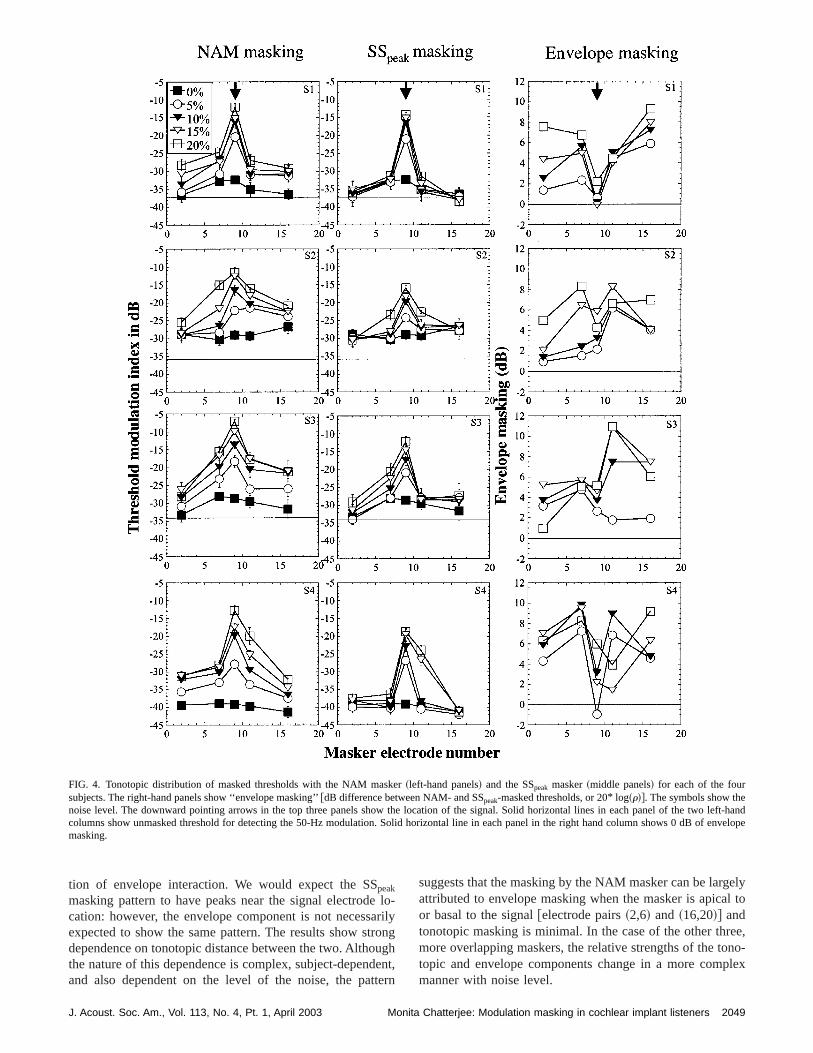
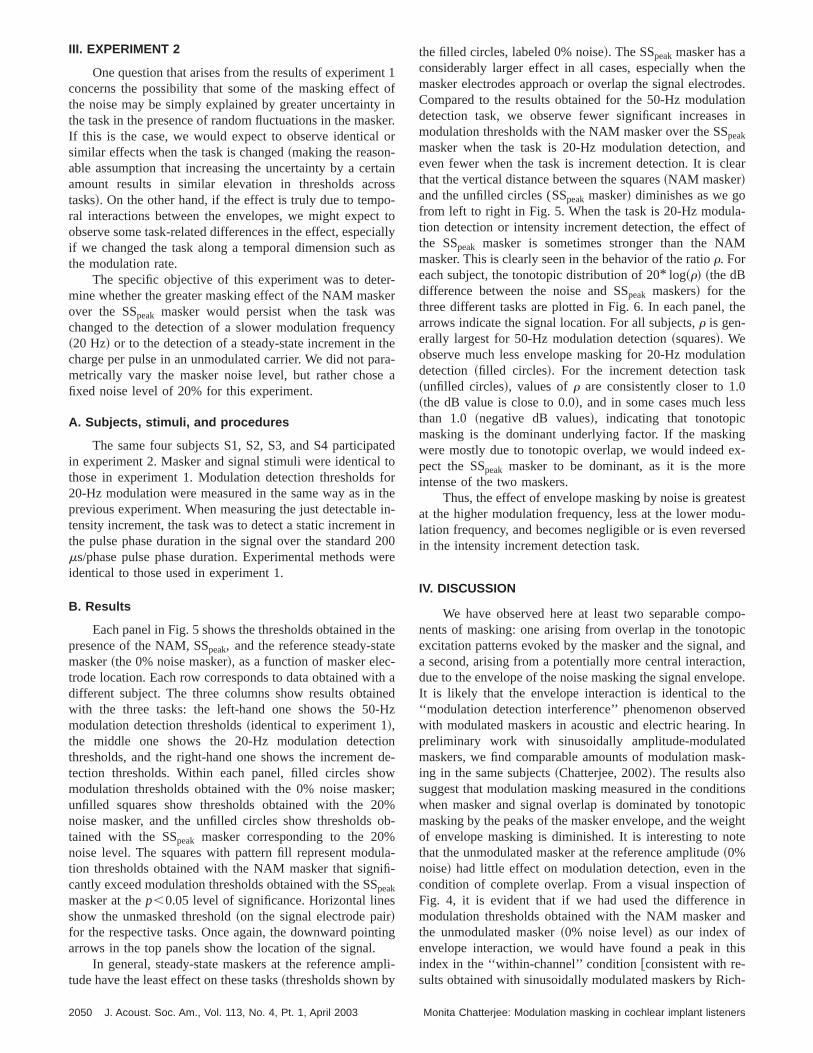
Each panel in Fig. 5 shows the thresholds obtained inpresence of the NAM, SSpeak, and the reference steady-stamasker~the 0% noise masker!, as a function of masker electrode location. Each row corresponds to data obtained widifferent subject. The three columns show results obtaiwith the three tasks: the left-hand one shows the 50modulation detection thresholds~identical to experiment 1!,the middle one shows the 20-Hz modulation detectthresholds, and the right-hand one shows the incrementtection thresholds. Within each panel, filled circles shmodulation thresholds obtained with the 0% noise masunfilled squares show thresholds obtained with the 2noise masker, and the unfilled circles show thresholdstained with the SSpeak masker corresponding to the 20noise level. The squares with pattern fill represent modution thresholds obtained with the NAM masker that signcantly exceed modulation thresholds obtained with the SSpeak
masker at thep,0.05 level of significance. Horizontal lineshow the unmasked threshold~on the signal electrode pair!for the respective tasks. Once again, the downward poinarrows in the top panels show the location of the signal.
In general, steady-state maskers at the reference amtude have the least effect on these tasks~thresholds shown by
2050 J. Acoust. Soc. Am., Vol. 113, No. 4, Pt. 1, April 2003
1f
iner.r
ins-tollyas
-r
yea-a
ed
re
n-in00re
e
adz
ne-
r;
b-
-
g
li-
the filled circles, labeled 0% noise!. The SSpeakmasker has aconsiderably larger effect in all cases, especially whenmasker electrodes approach or overlap the signal electroCompared to the results obtained for the 50-Hz modulatdetection task, we observe fewer significant increasesmodulation thresholds with the NAM masker over the SSpeak
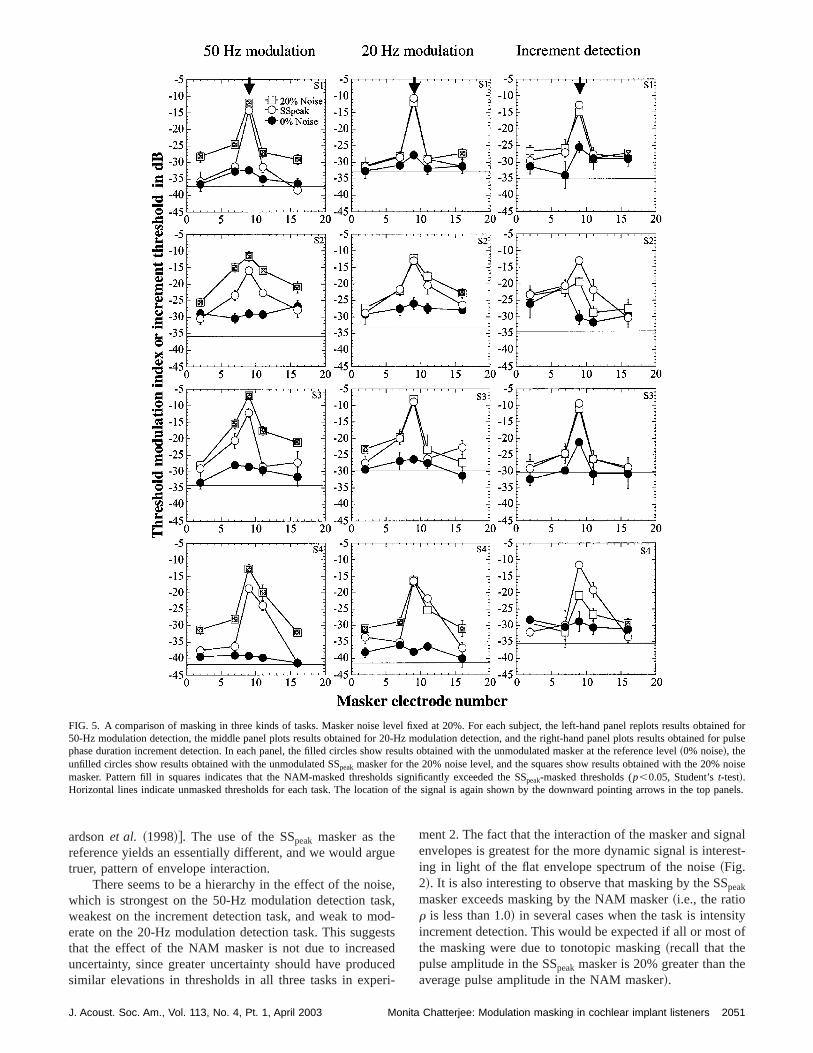
masker when the task is 20-Hz modulation detection, aeven fewer when the task is increment detection. It is clthat the vertical distance between the squares~NAM masker!and the unfilled circles (SSpeak masker! diminishes as we gofrom left to right in Fig. 5. When the task is 20-Hz modultion detection or intensity increment detection, the effectthe SSpeak masker is sometimes stronger than the NAmasker. This is clearly seen in the behavior of the ratior. Foreach subject, the tonotopic distribution of 20* log~r! ~the dBdifference between the noise and SSpeak maskers! for thethree different tasks are plotted in Fig. 6. In each panel,arrows indicate the signal location. For all subjects,r is gen-erally largest for 50-Hz modulation detection~squares!. Weobserve much less envelope masking for 20-Hz moduladetection ~filled circles!. For the increment detection tas~unfilled circles!, values ofr are consistently closer to 1.~the dB value is close to 0.0!, and in some cases much lethan 1.0 ~negative dB values!, indicating that tonotopicmasking is the dominant underlying factor. If the maskiwere mostly due to tonotopic overlap, we would indeed epect the SSpeak masker to be dominant, as it is the mointense of the two maskers.
Thus, the effect of envelope masking by noise is greaat the higher modulation frequency, less at the lower molation frequency, and becomes negligible or is even reverin the intensity increment detection task.
IV. DISCUSSION
We have observed here at least two separable comnents of masking: one arising from overlap in the tonotoexcitation patterns evoked by the masker and the signal,a second, arising from a potentially more central interactidue to the envelope of the noise masking the signal envelIt is likely that the envelope interaction is identical to th‘‘modulation detection interference’’ phenomenon observwith modulated maskers in acoustic and electric hearingpreliminary work with sinusoidally amplitude-modulatemaskers, we find comparable amounts of modulation maing in the same subjects~Chatterjee, 2002!. The results alsosuggest that modulation masking measured in the conditwhen masker and signal overlap is dominated by tonotomasking by the peaks of the masker envelope, and the weof envelope masking is diminished. It is interesting to nothat the unmodulated masker at the reference amplitude~0%noise! had little effect on modulation detection, even in thcondition of complete overlap. From a visual inspectionFig. 4, it is evident that if we had used the differencemodulation thresholds obtained with the NAM masker athe unmodulated masker~0% noise level! as our index ofenvelope interaction, we would have found a peak in tindex in the ‘‘within-channel’’ condition@consistent with re-sults obtained with sinusoidally modulated maskers by Ri
Monita Chatterjee: Modulation masking in cochlear implant listeners
tained f
noise
p panel
FIG. 5. A comparison of masking in three kinds of tasks. Masker noise level fixed at 20%. For each subject, the left-hand panel replots results obor50-Hz modulation detection, the middle panel plots results obtained for 20-Hz modulation detection, and the right-hand panel plots results obtained for pulsephase duration increment detection. In each panel, the filled circles show results obtained with the unmodulated masker at the reference level~0% noise!, theunfilled circles show results obtained with the unmodulated SSpeakmasker for the 20% noise level, and the squares show results obtained with the 20%masker. Pattern fill in squares indicates that the NAM-masked thresholds significantly exceeded the SSpeak-masked thresholds (p,0.05, Student’st-test!.Horizontal lines indicate unmasked thresholds for each task. The location of the signal is again shown by the downward pointing arrows in the tos.
gu
isso
esecr
nalest-
ityof
e
ardsonet al. ~1998!#. The use of the SSpeak masker as thereference yields an essentially different, and we would artruer, pattern of envelope interaction.
There seems to be a hierarchy in the effect of the nowhich is strongest on the 50-Hz modulation detection taweakest on the increment detection task, and weak to merate on the 20-Hz modulation detection task. This suggthat the effect of the NAM masker is not due to increasuncertainty, since greater uncertainty should have produsimilar elevations in thresholds in all three tasks in expe
J. Acoust. Soc. Am., Vol. 113, No. 4, Pt. 1, April 2003 Monit
e
e,k,d-ts
dedi-
ment 2. The fact that the interaction of the masker and sigenvelopes is greatest for the more dynamic signal is intering in light of the flat envelope spectrum of the noise~Fig.2!. It is also interesting to observe that masking by the SSpeak
masker exceeds masking by the NAM masker~i.e., the ratior is less than 1.0! in several cases when the task is intensincrement detection. This would be expected if all or mostthe masking were due to tonotopic masking~recall that thepulse amplitude in the SSpeakmasker is 20% greater than thaverage pulse amplitude in the NAM masker!.
2051a Chatterjee: Modulation masking in cochlear implant listeners
sm
a
ven
, i
veak
mucthe
ioa
dltio
znd
raismotrulnc
neluce
n-au
hatr-b-ve-on
in-
ndonde-ignaltheapsncet onthattrib-hen
edse-en-rspic
d inldin
s.at
en-fluc-ro-n,us,y-
hatom--
inse
no-ug-ro-een
ori-re
sinth
It seems reasonable to speculate that the two kindmasking observed here originate in different mechanisTonotopic masking can be explained in the classical way—due to the overlap of neural populations~relatively periph-eral in locus! responding to the masker and the probe. Enlope masking by the noise, as a phenomenon that doesrequire tonotopic proximity between masker and signallikely to arise in more central processes.
Two aspects of the noise might contribute to the enlope masking that we observe. One contributing factor mbe that the intrinsic envelope fluctuations in the noise masinteract in some way with the signal modulation at soconvergent point of processing. It is also possible that sinteraction is due to spectral processing of the envelope—noise might excite hypothetical modulation detectors tunto several modulation frequencies~Dau et al., 1997!. Theresults of experiment 2 are consistent with the modulatfilterbank model and related experimental results of Det al. ~1997!, assuming more sharply tuned~along a linearmodulation frequency scale! modulation filters centeredaround lower modulation frequencies and more broatuned modulation filters centered around higher modulafrequencies. The NAM masker would excite the 20-Hmodulation filter less than the 50-Hz modulation filter, athereby cause more interference with the latter.
Whatever the precise mechanism—a temporal intetion between the envelopes or a specific spectral analysthe envelopes—consistent with results obtained in norhearing listeners, it seems that a model incorporating cverging inputs from peripheral channels onto some cen‘‘envelope’’ processor is necessary to account for the resobtained in cochlear implant listeners. How this converge
FIG. 6. A comparison of the amount of envelope masking~the ratior in dBunits! obtained in the three kinds of tasks in experiment 2, plotted afunction of masker electrode location. Each panel shows results obtawith a different subject. In each panel, the signal location is shown bydownward pointing arrow.
2052 J. Acoust. Soc. Am., Vol. 113, No. 4, Pt. 1, April 2003
ofs.s
-ot
s
-yerehe
d
nu
yn
c-ofaln-altse
might occur is unclear. In experiments in across-chanMDI, it has been shown that asynchronous gating can redthe amount of MDI in normal hearing listeners~Hall andGrose, 1991!, suggesting that auditory grouping may be ivolved in the phenomenon. Recently, Oxenham and D~2001! have confirmed these results and further shown twhen the masker is one of a ‘‘stream’’ of identical precusors, MDI is reduced significantly in normal-hearing sujects. This finding strengthens the argument for the involment of central, grouping phenomena in modulatidetection interference. Whether such phenomena alsovolve the kind of processing suggested by Dauet al.’s ~1997!modulation filterbank model is not known.
Recent work by Gockel and Carlyon~2000! suggeststhat such ‘‘grouping’’ may not always require the masker asignal to be concurrent. In experiments with FM detecti~15 Hz!, the authors have shown that some modulationtection interference persists even when the masker and sare not simultaneous, but the signal is flanked in time bymasker: further, the authors found that increasing the gbetween masker and signal up to 200 ms did not influethe effect. In contrast, steady-state maskers had no effecthe FM detection thresholds. The authors hypothesizedthe greater perceptual salience of fluctuating signals conutes to the strong masking effect, which persists even wmasker and signal are nonsimultaneous.
In recent preliminary experiments, we have observstrong streaming effects in cochlear implant listeners, forquential patterns of carriers that are either tonotopically idtical, but very different in temporal envelope, or for carriethat have identical envelopes but are different in tonotolocation~Chatterjee and Galvin, 2002!. These results indicatethat mechanisms for perceptual organization are preserveauditory perception through a cochlear implant. It woutherefore not be surprising to find that envelope maskingcochlear implant perception arises from such mechanism
The majority of cochlear implant listeners have gredifficulty understanding speech in noisy or multi-speakervironments. The present results suggest that competingtuations on concurrently stimulated channels may compmise the listener’s ability to process temporal informatioeven when the electrodes are tonotopically distant. Th‘‘channel-interaction’’ can be much larger in the case of dnamic stimuli than steady-state stimuli. It is apparent tfuture work needs to consider the dynamic aspects of cponent stimuli in multi-channel stimulation of cochlear implants.
V. CONCLUSION
This study has shown that channel-interactioncochlear-implant listeners is altered significantly in the caof dynamic stimuli. The use of the SSpeak masker in theseexperiments was important in separating the effects of totopic masking from true envelope masking. The results sgest that envelope interactions are likely to arise from pcesses that are distinct from tonotopic interactions betwsignals. We speculate that these processes are central ingin. Much further work needs to be done to explore mo
aede
Monita Chatterjee: Modulation masking in cochlear implant listeners
Fc
ecrya
cee
asnuosa
tivb-leh-8
lede
J
-m
:
-et
ith
ers,’’
f
c-
J.
lec-
lear
m.
nd-ch
s in
dtwo
f
precisely the mechanisms underlying such interactions.nally, it appears that measures of channel-interaction inchlear implant listeners should incorporate dynamic aspof signals: steady-state stimuli do not tell the entire stoeven in a relatively simple experimental paradigm suchthe one employed in this study.
ACKNOWLEDGMENTS
We thank Mark E. Robert for programming the interfaused in these experiments, and John J. Galvin III for his hwith pilot-data collection. We thank Sandra Oba for hersistance in running experiments and her help with mascript preparation, editing, and proofing, and Cochlear Cporation for providing us with the calibration tablenecessary to conduct these experiments. Neal Viemeistertwo anonymous reviewers are thanked for their construccriticisms of an earlier version of this work, resulting in sustantial changes to the manuscript. We are very gratefuthe cochlear implant listeners who participated in theseperiments for their continued support of this research. Twork was supported by NIDCD~Grant Nos. R03DC0351903, N01DC92100-03, R01DC01526-S1, and R01DC004701!.
1Note that with uniformly distributed noise, the mean is constant regardof the level of the noise. However, the variance of the pulse amplituchanges with changing noise level.
Bacon, S. P., and Grantham, D. W.~1989!. ‘‘Modulation masking: effects ofmodulation frequency, depth and phase,’’ J. Acoust. Soc. Am.85, 2575–2580.
Bacon, S. P., and Konrad, D. L.~1993!. ‘‘Modulation detection interferenceunder conditions favoring within- or across-channel processing,’’Acoust. Soc. Am.93, 1012–1022.
Chatterjee, M.~1999!. ‘‘Effects of stimulation mode on threshold and loudness growth in multielectrode cochlear implants,’’ J. Acoust. Soc. A105, 850–860.
Chatterjee, M.~2002!. ‘‘Modulation masking in cochlear implant listenerseffects of masker envelope,’’ J. Acoust. Soc. Am.111, 2338~A!.
Chatterjee, M., and Galvin III, J. J.~2002!. ‘‘Auditory streaming in cochlearimplant listeners,’’ J. Acoust. Soc. Am.111, 2429~A!.
Chatterjee, M., and Robert, M. E.~2001!. ‘‘Noise enhances modulation sensitivity in cochlear implant listeners: stochastic resonance in a prosthsensory system?’’ J. Assoc. Res. Otolaryngol.2~2!, 159–171.
J. Acoust. Soc. Am., Vol. 113, No. 4, Pt. 1, April 2003 Monit
i-o-ts,s
lp--
r-
nde
tox-is
6-
sss
.
.
ic
Chatterjee, M., and Shannon, R. V.~1998!. ‘‘Forward masked excitationpatterns in multielectrode electrical stimulation,’’ J. Acoust. Soc. Am.103,2565–2572.
Dau, T., Kollmeier, B., and Kohlrausch, A.~1997!. ‘‘Modeling auditoryprocessing of amplitude modulation. I. Detection and masking wnarrow-band carriers,’’ J. Acoust. Soc. Am.102, 2892–2905.
Gockel, H., and Carlyon, R. P.~2000!. ‘‘Frequency modulation detectioninterference produced by asynchronous and nonsimultaneous interferJ. Acoust. Soc. Am.108, 2329–2336.
Grose, J. H., and Hall III, J. W.~1994!. ‘‘Modulation Detection Interference~MDI ! in listeners with cochlear hearing loss,’’ J. Speech Hear. Res.37~3!,680–686.
Hall III, J. W., and Grose, J. H.~1991!. ‘‘Some effects of auditory groupingfactors on modulation detection interference~MDI !,’’ J. Acoust. Soc. Am.90, 3028–3035.
Hanekom, J. J., and Shannon, R. V.~1998!. ‘‘Gap detection as a measure oelectrode interaction in cochlear implants,’’ J. Acoust. Soc. Am.104,2372–2384.
Houtgast, T.~1989!. ‘‘Frequency selectivity in amplitude-modulation detetion,’’ J. Acoust. Soc. Am.85, 1676–1680.
Levitt, H. ~1971!. ‘‘Transformed up-down methods in psychoacoustics,’’Acoust. Soc. Am. Suppl. 149, 467.
Lim, H. H., Tong, Y. C., and Clark, G. M.~1989!. ‘‘Forward masking pat-terns produced by intracochlear electrical stimulation of one and two etrode pairs in the human cochlea,’’ J. Acoust. Soc. Am.86, 971–980.
McKay, C. M., and McDermott, H. J.~1996!. ‘‘The perception of temporalpatterns for electrical stimulation presented at one or two intracochsites,’’ J. Acoust. Soc. Am.100, 1081–1092.
Oxenham, A. J., and Dau, T.~2001!. ‘‘Modulation detection interference:Effects of concurrent and sequential streaming,’’ J. Acoust. Soc. Am.110,402–408.
Richardson, L. M., Busby, P. A., and Clark, G. M.~1998!. ‘‘Modulationdetection interference in cochlear implant subjects,’’ J. Acoust. Soc. A104, 442–452.
Shannon, R. V.~1983!. ‘‘Multichannel electrical stimulation of the auditorynerve in man. II. Channel interaction,’’ Hear. Res.12, 1–16.
Shannon, R. V., Adams, D. D., Ferrel, R. L., Palumbo, R. L., and Gragenett, M.~1990!. ‘‘A computer interface for psychophysical and speeresearch with the Nucleus cochlear implant,’’ J. Acoust. Soc. Am.87,905–907.
Throckmorton, C. S., and Collins, L. M.~1999!. ‘‘Investigation of the ef-fects of temporal and spatial interactions on speech-recognition skillcochlear-implant subjects,’’ J. Acoust. Soc. Am.105, 861–873.
Tong, Y. C., and Clark, G. M.~1986!. ‘‘Loudness summation, masking, antemporal interaction for sensations produced by electric stimulation ofsites in the human cochlea,’’ J. Acoust. Soc. Am.79, 1958–1966.
Yost, W. A., and Sheft, S.~1989!. ‘‘Across-critical-band processing oamplitude-modulated tones,’’ J. Acoust. Soc. Am.85, 848–857.
2053a Chatterjee: Modulation masking in cochlear implant listeners