Efficacy of Ventilation, HEPA Air Cleaners, Universal Masking ...
20
viruses Article Efficacy of Ventilation, HEPA Air Cleaners, Universal Masking, and Physical Distancing for Reducing Exposure to Simulated Exhaled Aerosols in a Meeting Room Jayme P. Coyle 1 , Raymond C. Derk 1 , William G. Lindsley 1, * , Francoise M. Blachere 1 , Theresa Boots 1 , Angela R. Lemons 1 , Stephen B. Martin, Jr. 2 , Kenneth R. Mead 3 , Steven A. Fotta 4 , Jeffrey S. Reynolds 1 , Walter G. McKinney 1 , Erik W. Sinsel 1 , Donald H. Beezhold 1 and John D. Noti 1 Citation: Coyle, J.P.; Derk, R.C.; Lindsley, W.G.; Blachere, F.M.; Boots, T.; Lemons, A.R.; Martin, S.B., Jr.; Mead, K.R.; Fotta, S.A.; Reynolds, J.S.; et al. Efficacy of Ventilation, HEPA Air Cleaners, Universal Masking, and Physical Distancing for Reducing Exposure to Simulated Exhaled Aerosols in a Meeting Room. Viruses 2021, 13, 2536. https://doi.org/ 10.3390/v13122536 Academic Editors: Joshua L. Santarpia, Mark Stephen Lever and Shanna A. Ratnesar-Shumate Received: 29 October 2021 Accepted: 14 December 2021 Published: 17 December 2021 Publisher’s Note: MDPI stays neutral with regard to jurisdictional claims in published maps and institutional affil- iations. Copyright: © 2021 by the authors. Licensee MDPI, Basel, Switzerland. This article is an open access article distributed under the terms and conditions of the Creative Commons Attribution (CC BY) license (https:// creativecommons.org/licenses/by/ 4.0/). 1 Health Effects Laboratory Division, National Institute for Occupational Safety and Health, Centers for Disease Control and Prevention, Morgantown, WV 26505, USA; [email protected] (J.P.C.); [email protected] (R.C.D.); [email protected] (F.M.B.); [email protected] (T.B.); [email protected] (A.R.L.); [email protected] (J.S.R.); [email protected] (W.G.M.); [email protected] (E.W.S.); [email protected] (D.H.B.); [email protected] (J.D.N.) 2 Respiratory Health Division, National Institute for Occupational Safety and Health, Centers for Disease Control and Prevention, Morgantown, WV 26505, USA; [email protected] 3 Division of Field Studies and Engineering, National Institute for Occupational Safety and Health, Centers for Disease Control and Prevention, Cincinnati, OH 45226, USA; [email protected] 4 Facilities Management Office, National Institute for Occupational Safety and Health, Centers for Disease Control and Prevention, Morgantown, WV 26505, USA; [email protected] * Correspondence: [email protected]; Tel.: +1-304-285-6336 Abstract: There is strong evidence associating the indoor environment with transmission of SARS- CoV-2, the virus that causes COVID-19. SARS-CoV-2 can spread by exposure to droplets and very fine aerosol particles from respiratory fluids that are released by infected persons. Layered mitiga- tion strategies, including but not limited to maintaining physical distancing, adequate ventilation, universal masking, avoiding overcrowding, and vaccination, have shown to be effective in reducing the spread of SARS-CoV-2 within the indoor environment. Here, we examine the effect of mitiga- tion strategies on reducing the risk of exposure to simulated respiratory aerosol particles within a classroom-style meeting room. To quantify exposure of uninfected individuals (Recipients), surrogate respiratory aerosol particles were generated by a breathing simulator with a headform (Source) that mimicked breath exhalations. Recipients, represented by three breathing simulators with manikin headforms, were placed in a meeting room and affixed with optical particle counters to measure 0.3–3 μm aerosol particles. Universal masking of all breathing simulators with a 3-ply cotton mask reduced aerosol exposure by 50% or more compared to scenarios with simulators unmasked. While evaluating the effect of Source placement, Recipients had the highest exposure at 0.9 m in a face-to- face orientation. Ventilation reduced exposure by approximately 5% per unit increase in air change per hour (ACH), irrespective of whether increases in ACH were by the HVAC system or portable HEPA air cleaners. The results demonstrate that mitigation strategies, such as universal masking and increasing ventilation, reduce personal exposure to respiratory aerosols within a meeting room. While universal masking remains a key component of a layered mitigation strategy of exposure reduction, increasing ventilation via system HVAC or portable HEPA air cleaners further reduces exposure. Keywords: indoor exposure; ventilation; universal masking; physical distancing; HEPA air cleaner; SARS-CoV-2 1. Introduction SARS-CoV-2, the virus that causes COVID-19, can spread between humans by respi- ratory fluid aerosols and droplets released during exhalatory events, such as breathing, coughing, talking, singing, and sneezing [1–3]. Aerosols have been defined as airborne Viruses 2021, 13, 2536. https://doi.org/10.3390/v13122536 https://www.mdpi.com/journal/viruses
-
Upload
khangminh22 -
Category
Documents
-
view
1 -
download
0
Transcript of Efficacy of Ventilation, HEPA Air Cleaners, Universal Masking ...
viruses
Article
Efficacy of Ventilation, HEPA Air Cleaners, Universal Masking,and Physical Distancing for Reducing Exposure to SimulatedExhaled Aerosols in a Meeting Room
Jayme P. Coyle 1 , Raymond C. Derk 1 , William G. Lindsley 1,* , Francoise M. Blachere 1 , Theresa Boots 1,Angela R. Lemons 1 , Stephen B. Martin, Jr. 2, Kenneth R. Mead 3 , Steven A. Fotta 4, Jeffrey S. Reynolds 1,Walter G. McKinney 1 , Erik W. Sinsel 1, Donald H. Beezhold 1 and John D. Noti 1
�����������������
Citation: Coyle, J.P.; Derk, R.C.;
Lindsley, W.G.; Blachere, F.M.; Boots,
T.; Lemons, A.R.; Martin, S.B., Jr.;
Mead, K.R.; Fotta, S.A.; Reynolds, J.S.;
et al. Efficacy of Ventilation, HEPA
Air Cleaners, Universal Masking, and
Physical Distancing for Reducing
Exposure to Simulated Exhaled
Aerosols in a Meeting Room. Viruses
2021, 13, 2536. https://doi.org/
10.3390/v13122536
Academic Editors: Joshua
L. Santarpia, Mark Stephen Lever and
Shanna A. Ratnesar-Shumate
Received: 29 October 2021
Accepted: 14 December 2021
Published: 17 December 2021
Publisher’s Note: MDPI stays neutral
with regard to jurisdictional claims in
published maps and institutional affil-
iations.
Copyright: © 2021 by the authors.
Licensee MDPI, Basel, Switzerland.
This article is an open access article
distributed under the terms and
conditions of the Creative Commons
Attribution (CC BY) license (https://
creativecommons.org/licenses/by/
4.0/).
1 Health Effects Laboratory Division, National Institute for Occupational Safety and Health,Centers for Disease Control and Prevention, Morgantown, WV 26505, USA; [email protected] (J.P.C.);[email protected] (R.C.D.); [email protected] (F.M.B.); [email protected] (T.B.); [email protected] (A.R.L.);[email protected] (J.S.R.); [email protected] (W.G.M.); [email protected] (E.W.S.); [email protected] (D.H.B.);[email protected] (J.D.N.)
2 Respiratory Health Division, National Institute for Occupational Safety and Health,Centers for Disease Control and Prevention, Morgantown, WV 26505, USA; [email protected]
3 Division of Field Studies and Engineering, National Institute for Occupational Safety and Health,Centers for Disease Control and Prevention, Cincinnati, OH 45226, USA; [email protected]
4 Facilities Management Office, National Institute for Occupational Safety and Health,Centers for Disease Control and Prevention, Morgantown, WV 26505, USA; [email protected]
* Correspondence: [email protected]; Tel.: +1-304-285-6336
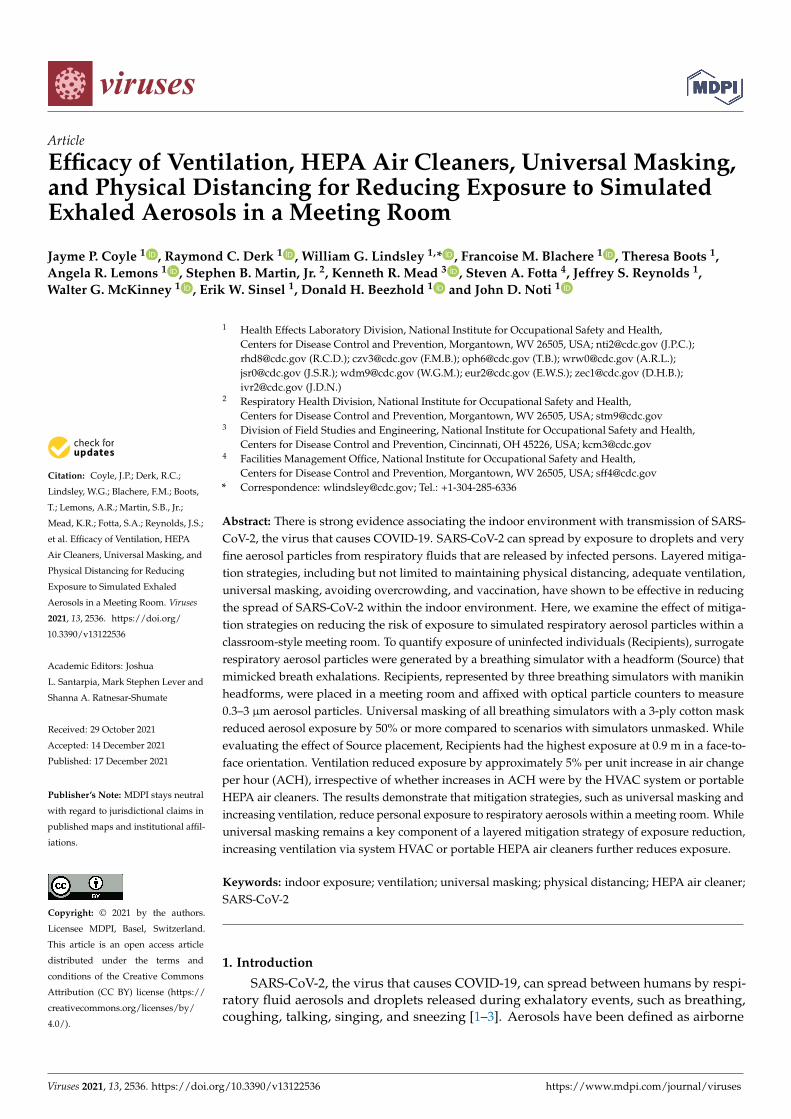
Abstract: There is strong evidence associating the indoor environment with transmission of SARS-CoV-2, the virus that causes COVID-19. SARS-CoV-2 can spread by exposure to droplets and veryfine aerosol particles from respiratory fluids that are released by infected persons. Layered mitiga-tion strategies, including but not limited to maintaining physical distancing, adequate ventilation,universal masking, avoiding overcrowding, and vaccination, have shown to be effective in reducingthe spread of SARS-CoV-2 within the indoor environment. Here, we examine the effect of mitiga-tion strategies on reducing the risk of exposure to simulated respiratory aerosol particles within aclassroom-style meeting room. To quantify exposure of uninfected individuals (Recipients), surrogaterespiratory aerosol particles were generated by a breathing simulator with a headform (Source) thatmimicked breath exhalations. Recipients, represented by three breathing simulators with manikinheadforms, were placed in a meeting room and affixed with optical particle counters to measure0.3–3 µm aerosol particles. Universal masking of all breathing simulators with a 3-ply cotton maskreduced aerosol exposure by 50% or more compared to scenarios with simulators unmasked. Whileevaluating the effect of Source placement, Recipients had the highest exposure at 0.9 m in a face-to-face orientation. Ventilation reduced exposure by approximately 5% per unit increase in air changeper hour (ACH), irrespective of whether increases in ACH were by the HVAC system or portableHEPA air cleaners. The results demonstrate that mitigation strategies, such as universal masking andincreasing ventilation, reduce personal exposure to respiratory aerosols within a meeting room. Whileuniversal masking remains a key component of a layered mitigation strategy of exposure reduction,increasing ventilation via system HVAC or portable HEPA air cleaners further reduces exposure.
Keywords: indoor exposure; ventilation; universal masking; physical distancing; HEPA air cleaner;SARS-CoV-2
1. Introduction
SARS-CoV-2, the virus that causes COVID-19, can spread between humans by respi-ratory fluid aerosols and droplets released during exhalatory events, such as breathing,coughing, talking, singing, and sneezing [1–3]. Aerosols have been defined as airborne
Viruses 2021, 13, 2536. https://doi.org/10.3390/v13122536 https://www.mdpi.com/journal/viruses
Viruses 2021, 13, 2536 2 of 20
particles <5 µm in diameter and droplets as ≥5 µm in diameter [4]; however, more recentwork based on a better understanding of aerosol physics defines aerosols as <100 µmwith droplets being >100 µm [5], which is the definition used in this investigation. Theserespiratory aerosols and droplets, the smallest of which may remain suspended in the airfor several minutes to several hours, can disperse throughout the indoor environment [6].During that time, potentially infectious aerosols suspended in the indoor environmentmay translate to exposure and possible transmission. The risk of infection increases withthe intensity and duration of exposure, as well as the concentration of active virus-ladenrespirable aerosols [7]. Since the critical dose threshold for SARS-CoV-2 infection is un-known, one goal of exposure mitigation is to reduce intensity, duration, or both as muchas feasible. To reduce the risk of SARS-CoV-2 transmission in indoor spaces, the U.S.Centers for Disease Control and Prevention (CDC) recommends a combination of measuresincluding universal mask wearing, increased room ventilation and filtration, and physicaldistancing [8].
Masking reduces the expulsion of respiratory aerosols and droplets from the pointof generation [9–11]. Donning a mask can reduce the release of respiratory aerosols anddroplets by 85% or more, depending on the mask and exhalatory event [12–14]. Donning amask also may reduce the exposure of an uninfected wearer to aerosols from a potentiallyinfectious source [15,16]. The combination of source masking and recipient masking forall individuals (called “universal masking”) can reduce exposure significantly more thanwhen masks are just worn by a source or recipient. Modifications aimed to improve facemask fit can improve their performance. Double masking, such as by wearing a 3-plycotton cloth mask over a medical mask, can provide up to a 96% reduction in aerosolexposure compared to no masking [14], thus providing significant protection againstthe transmission of SARS-CoV-2. Reduction in infectious transmission of SARS-CoV-2by universal masking has been examined using computational modeling [17]. Further,population-level community infection studies lend support to universal masking as amanner to reduce infectious disease transmission [18,19].
Ventilation in the indoor environment may also play a role in infectious diseasetransmission. Since the average individual spends greater than 90% of the day withinan indoor environment [20], investigations have focused on indoor transmission. Anexamination of 318 case clusters in China showed that all but one likely occurred withindoor settings while one cluster of two cases was attributed to interaction outdoors [21].More granular case cluster investigations noted an increasing association between poorlyventilated indoor environments and infectious transmission [22,23]. Therefore, increasingthe ventilation in a room or building provides a method for reducing exposure to potentiallyinfectious aerosols and droplets.
A sample of classrooms among 37 U.S. schools were used to estimate effective airexchange rates typically below 2.0 air changes/hour (ACH) during daytime occupation,depending on the heating, ventilation, and air conditioning (HVAC) system configurationand ACH estimation method [24]. Since existing HVAC systems within a given structuretypically have a limited capacity for increased air exchange rates, the CDC and Ameri-can Society of Heating, Refrigerating and Air-Conditioning Engineers (ASHRAE) haverecommended the use of portable high efficiency particulate air (HEPA) cleaning units toaugment the clearance of potentially infectious aerosols [25,26]. HEPA air cleaners can pro-vide a rapid, relatively inexpensive solution to increasing ACH as opposed to the option ofrenovating an existing HVAC system. Indeed, portable HEPA air-cleaning units have beenshown effective in significantly reducing particle concentrations, while also contributing tochanges in aerosol dispersal and distribution due to changes in room airflow patterns [27].Further, it must be noted that the efficacy of portable HEPA air cleaners can be influencedby the airflow setting, placement position, and room occupancy [28].
Physical distancing is a behavioral mitigation strategy with the focus of limitingaerosol and droplet transmission between individuals by creating physical space betweena transmission source and recipient. The physical distancing recommendation varies by
Viruses 2021, 13, 2536 3 of 20
jurisdiction, i.e., 1 to 2 m [29,30]. The concept of physical distancing is partially basedon the assumption that droplets of respiratory fluids follow a ballistic trajectory from thepoint of generation and fall out of the exposure path within 2 m [31,32]. As the particlediameter decreases below 100 µm, however, a gradual transition occurs where the settlingvelocity rapidly decreases and the particles remain airborne longer [33]. Air currents suchas plumes of warm air rising from the body can lift these particles and extend the time forwhich they stay in the air. Aerosols produced by coughing may travel up to 8 m [34], wellbeyond the often-cited short-range distance limit of 2 m. Depending upon environmentalconditions, respiratory aerosols and droplets can evaporate within seconds [35], leadingto increases in the airborne residency time. Further, room airflow patterns and physicalorientation, e.g., face-to-face, side-by-side, or front-to-back, between two individuals canalso influence exposure, thus complicating the relationship between physical distancingand exposure reduction. This improved understanding of the behavior of aerosols anddroplets during exhalation plume dispersion over distance [36,37] and the volumetricdilution that occurs during mixing by ventilation and air currents has prompted a re-examination of the mechanisms by which physical distancing and exposure reduction areassociated [38].
The purpose of the current investigation is to examine the efficacy of a matrix of phys-ical distance, increasing ventilation (HVAC and HEPA purifiers), and universal masking toreduce aerosol exposure within a classroom-style meeting room. The results of the currentinvestigation will add to the understanding of the influence of each mitigation strategy, aswell as the combination thereof, to potentially reduce exposure to infectious respiratoryaerosols such as those which transmit SARS-CoV-2.
2. Materials and Methods2.1. Simulators, Masking, and Aerosol Measurement
To better understand the effects of physical distancing, masking, and ventilation,experimentation was conducted simulating a classroom-style meeting room setup witha speaker being positioned at the front of the room and multiple participants (Figure 1).Each experiment simulates a scenario of one respiratory aerosol simulator (Source) as aninfected individual and three noninfected breathing simulators (Recipients). The distancefrom floor to mouth of the breathing simulator at the speaker’s position was 152 cm tosimulate an adult standing, while the mouths of the participant breathing simulators were76 cm from the floor. Four different scenarios of the simulators were examined and areshown in Figures 2 and 3 for reference. For an additional position scenario, Recipient C wasrepositioned into the audience and the Source simulator was placed in the speaker position.
Recipient C was purchased from Warwick Technologies Ltd. (Warwick, UK) while theremaining simulators (Source and Recipients A and B) were custom-built. The Warwickbreathing simulator has been described in detail elsewhere [39]. The Source simulatorheadform was purchased from Hanson Robotics (Plano, TX, USA) while Recipients A andB simulator headforms were from Crawley Creatures Ltd. (Model: Respirator Testing HeadForm 1; Buckingham, UK); all simulator headforms were composed of a shell of elastomerto mimic human skin.
The Recipient C used a sinusoidal breathing waveform with a respiration rate of21.5 breaths/min and a ventilation rate of 27 L/min, which is approximately the averageof the International Organization for Standards (ISO) standards for males and femalesengaged in moderate work [40]. Participant A and Participant B used an elastomericbellows controlled by a computer-enabled linear motor and breathed with a constantsinusoidal waveform calibrated to 12 breaths/min at a tidal volume of 1.25 L/breath,resulting in a breathing ventilation rate of 15 L/min. The breathing parameters for thesetwo simulators correspond to females performing light work [40]. The aerosol exhaled bythe source simulator has a mass median aerodynamic diameter (MMAD) of 1.3 µm with ageometric standard deviation (GSD) of 2.3 [13].
Viruses 2021, 13, 2536 4 of 20Viruses 2021, 13, x FOR PEER REVIEW 4 of 23
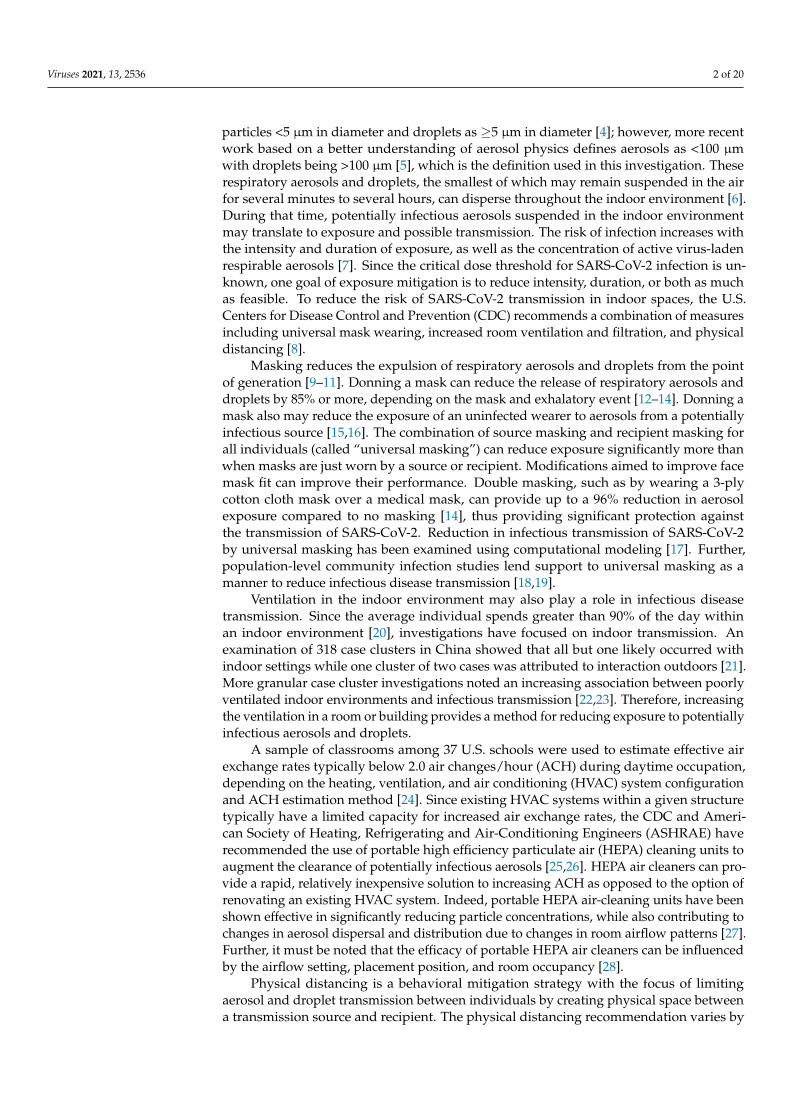
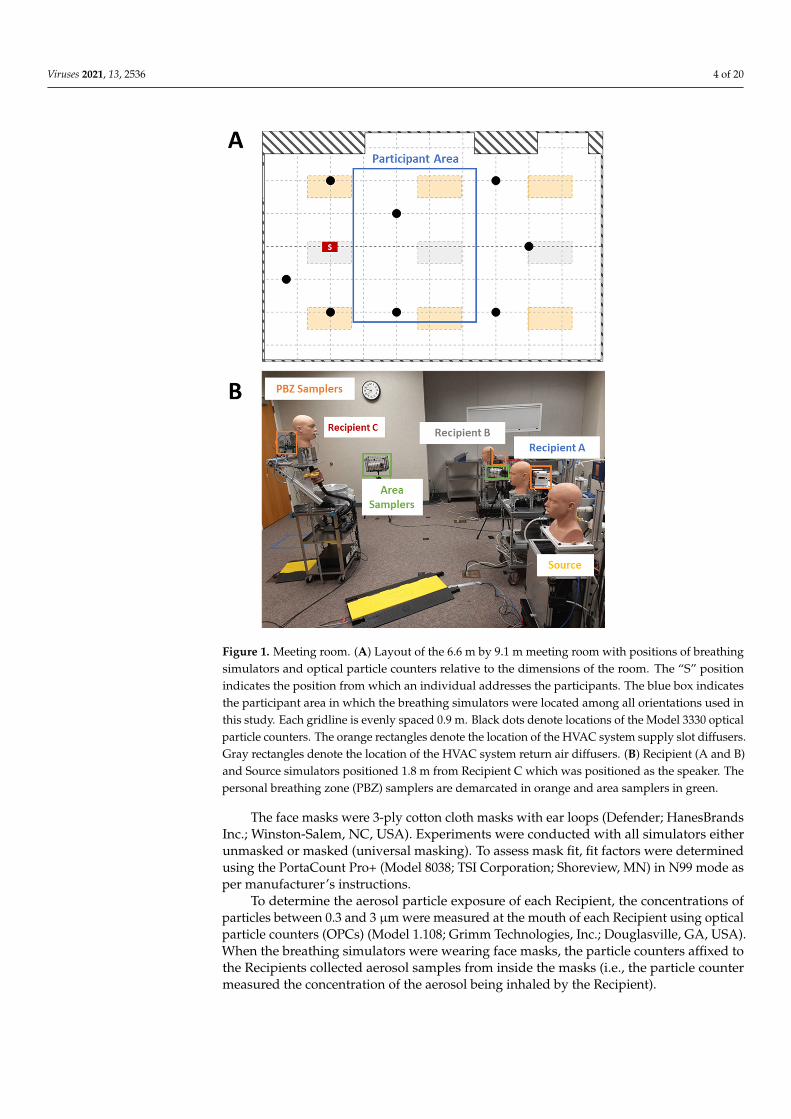
Figure 1. Meeting room. (A) Layout of the 6.6 m by 9.1 m meeting room with positions of breathing simulators and optical particle counters relative to the dimensions of the room. The “S” position indicates the position from which an individual addresses the participants. The blue box indicates the participant area in which the breathing simulators were located among all orientations used in this study. Each gridline is evenly spaced 0.9 m. Black dots denote locations of the Model 3330 op-tical particle counters. The orange rectangles denote the location of the HVAC system supply slot diffusers. Gray rectangles denote the location of the HVAC system return air diffusers. (B) Recipient (A and B) and Source simulators positioned 1.8 m from Recipient C which was positioned as the speaker. The personal breathing zone (PBZ) samplers are demarcated in orange and area samplers in green.
Figure 1. Meeting room. (A) Layout of the 6.6 m by 9.1 m meeting room with positions of breathingsimulators and optical particle counters relative to the dimensions of the room. The “S” positionindicates the position from which an individual addresses the participants. The blue box indicatesthe participant area in which the breathing simulators were located among all orientations used inthis study. Each gridline is evenly spaced 0.9 m. Black dots denote locations of the Model 3330 opticalparticle counters. The orange rectangles denote the location of the HVAC system supply slot diffusers.Gray rectangles denote the location of the HVAC system return air diffusers. (B) Recipient (A and B)and Source simulators positioned 1.8 m from Recipient C which was positioned as the speaker. Thepersonal breathing zone (PBZ) samplers are demarcated in orange and area samplers in green.
The face masks were 3-ply cotton cloth masks with ear loops (Defender; HanesBrandsInc.; Winston-Salem, NC, USA). Experiments were conducted with all simulators eitherunmasked or masked (universal masking). To assess mask fit, fit factors were determinedusing the PortaCount Pro+ (Model 8038; TSI Corporation; Shoreview, MN) in N99 mode asper manufacturer’s instructions.
To determine the aerosol particle exposure of each Recipient, the concentrations ofparticles between 0.3 and 3 µm were measured at the mouth of each Recipient using opticalparticle counters (OPCs) (Model 1.108; Grimm Technologies, Inc.; Douglasville, GA, USA).When the breathing simulators were wearing face masks, the particle counters affixed tothe Recipients collected aerosol samples from inside the masks (i.e., the particle countermeasured the concentration of the aerosol being inhaled by the Recipient).
Viruses 2021, 13, 2536 5 of 20Viruses 2021, 13, x FOR PEER REVIEW 5 of 23
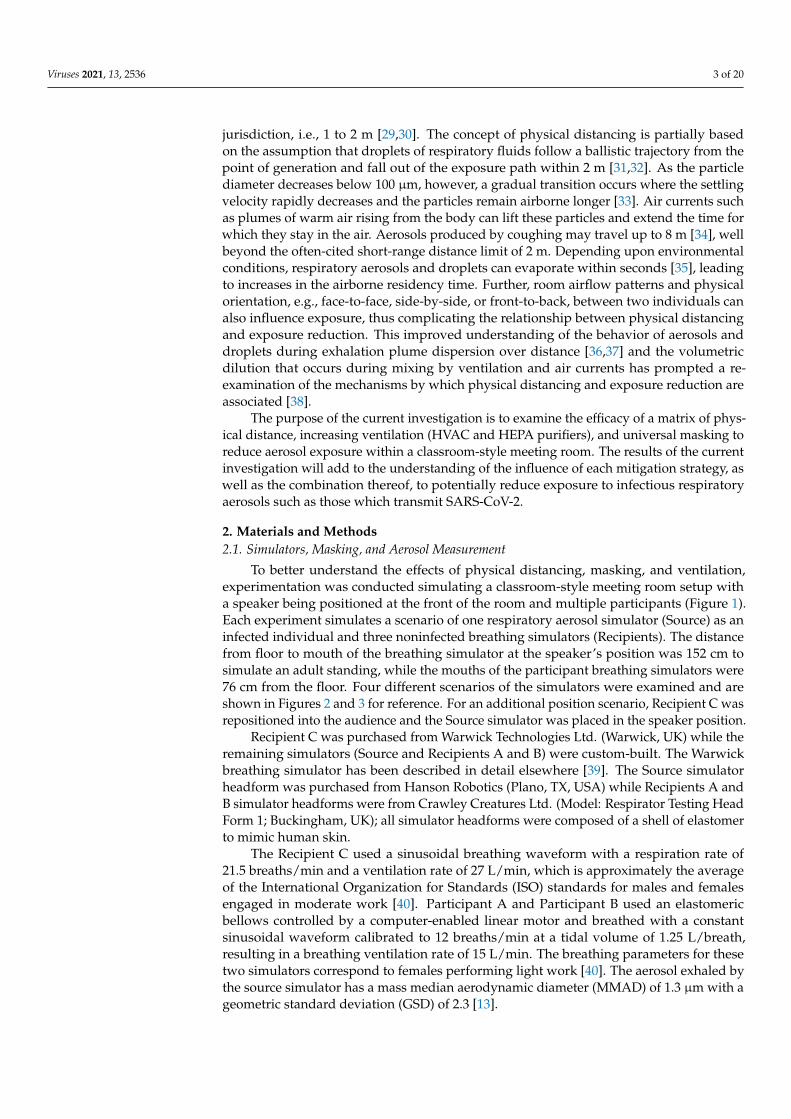
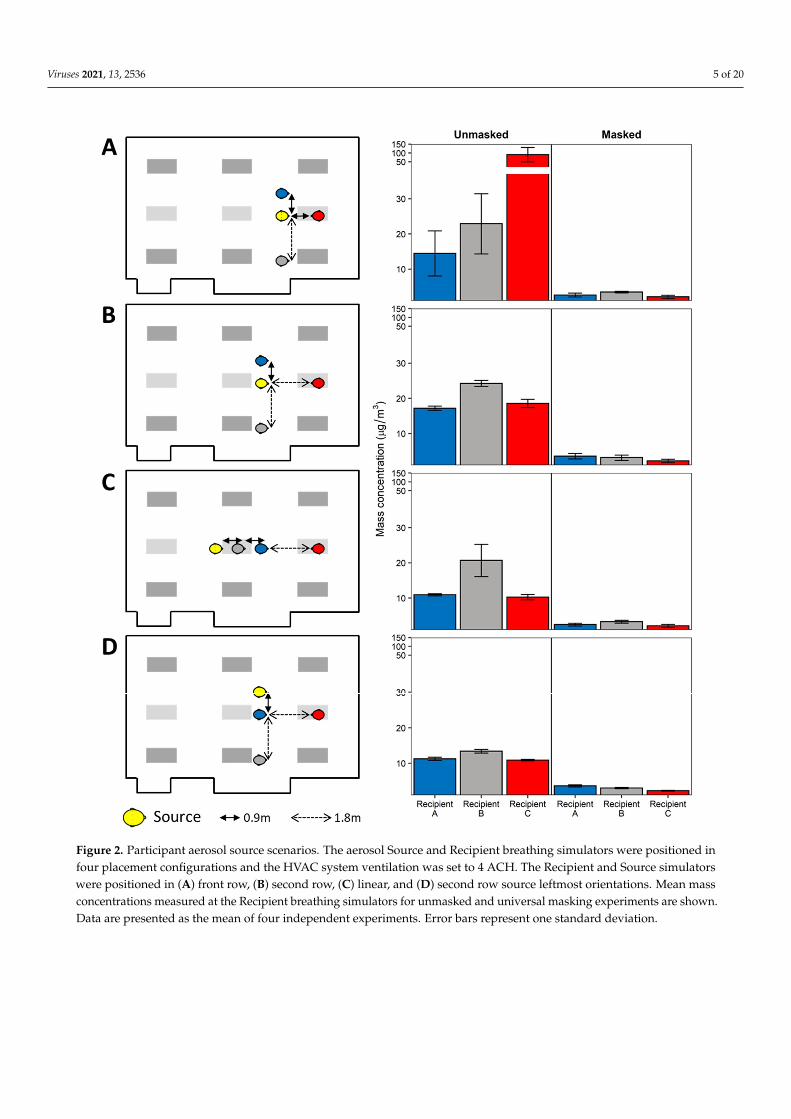
Figure 2. Participant aerosol source scenarios. The aerosol Source and Recipient breathing simulators were positioned in four placement configurations and the HVAC system ventilation was set to 4 ACH. The Recipient and Source simulators were positioned in (A) front row, (B) second row, (C) linear, and (D) second row source leftmost orientations. Mean mass concentrations measured at the Recipient breathing simulators for unmasked and universal masking experiments are shown. Data are presented as the mean of four independent experiments. Error bars represent one standard deviation.
Figure 2. Participant aerosol source scenarios. The aerosol Source and Recipient breathing simulators were positioned infour placement configurations and the HVAC system ventilation was set to 4 ACH. The Recipient and Source simulatorswere positioned in (A) front row, (B) second row, (C) linear, and (D) second row source leftmost orientations. Mean massconcentrations measured at the Recipient breathing simulators for unmasked and universal masking experiments are shown.Data are presented as the mean of four independent experiments. Error bars represent one standard deviation.
Viruses 2021, 13, 2536 6 of 20Viruses 2021, 13, x FOR PEER REVIEW 6 of 23
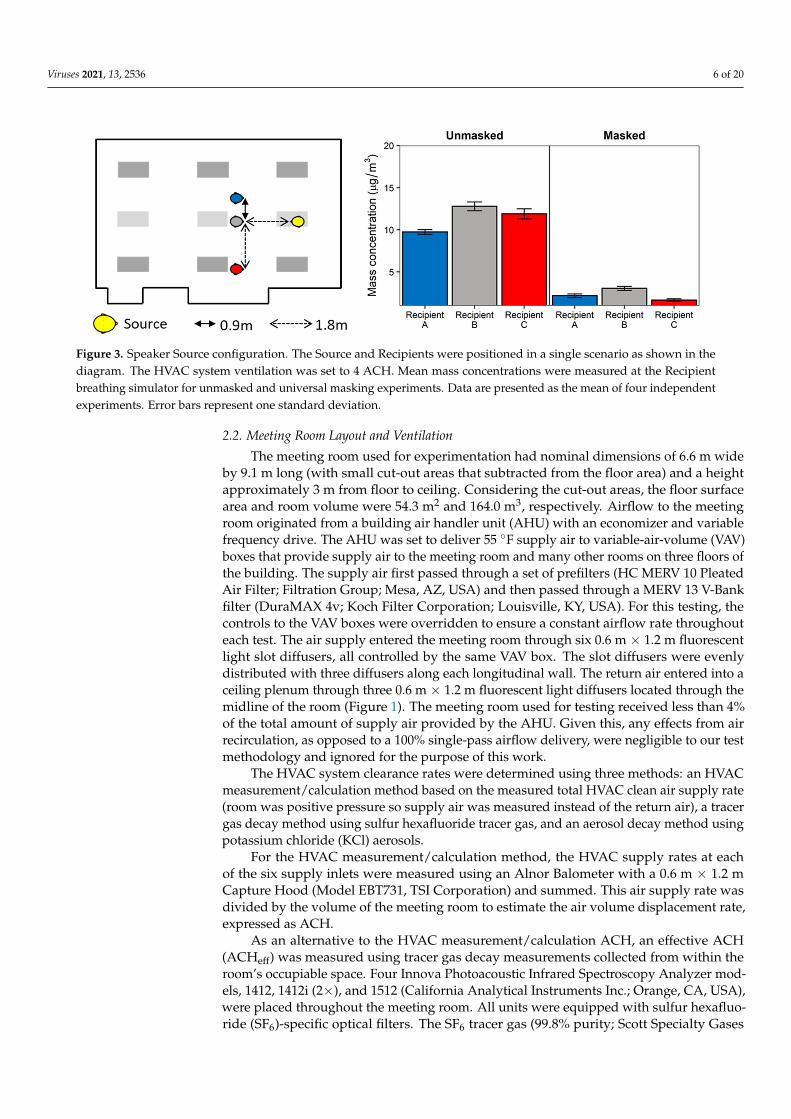
Figure 3. Speaker Source configuration. The Source and Recipients were positioned in a single scenario as shown in the diagram. The HVAC system ventilation was set to 4 ACH. Mean mass concentrations were measured at the Recipient breathing simulator for unmasked and universal masking experiments. Data are presented as the mean of four independ-ent experiments. Error bars represent one standard deviation.
Recipient C was purchased from Warwick Technologies Ltd. (Warwick, UK) while the remaining simulators (Source and Recipients A and B) were custom-built. The War-wick breathing simulator has been described in detail elsewhere [39]. The Source simula-tor headform was purchased from Hanson Robotics (Plano, TX) while Recipients A and B simulator headforms were from Crawley Creatures Ltd. (Model: Respirator Testing Head Form 1; Buckingham, UK); all simulator headforms were composed of a shell of elastomer to mimic human skin.
The Recipient C used a sinusoidal breathing waveform with a respiration rate of 21.5 breaths/minute and a ventilation rate of 27 L/minute, which is approximately the average of the International Organization for Standards (ISO) standards for males and females engaged in moderate work [40]. Participant A and Participant B used an elastomeric bel-lows controlled by a computer-enabled linear motor and breathed with a constant sinus-oidal waveform calibrated to 12 breaths/minute at a tidal volume of 1.25 L/breath, result-ing in a breathing ventilation rate of 15 L/minute. The breathing parameters for these two simulators correspond to females performing light work [40]. The aerosol exhaled by the source simulator has a mass median aerodynamic diameter (MMAD) of 1.3 µm with a geometric standard deviation (GSD) of 2.3 [13].
The face masks were 3-ply cotton cloth masks with ear loops (Defender; HanesBrands Inc.; Winston-Salem, NC, USA). Experiments were conducted with all simulators either unmasked or masked (universal masking). To assess mask fit, fit factors were determined using the PortaCount Pro+ (Model 8038; TSI Corporation; Shoreview, MN) in N99 mode as per manufacturer’s instructions.
To determine the aerosol particle exposure of each Recipient, the concentrations of particles between 0.3 and 3 µm were measured at the mouth of each Recipient using op-tical particle counters (OPCs) (Model 1.108; Grimm Technologies, Inc.; Douglasville, GA, USA). When the breathing simulators were wearing face masks, the particle counters af-fixed to the Recipients collected aerosol samples from inside the masks (i.e., the particle counter measured the concentration of the aerosol being inhaled by the Recipient).
2.2. Meeting Room Layout and Ventilation The meeting room used for experimentation had nominal dimensions of 6.6 m wide
by 9.1 m long (with small cut-out areas that subtracted from the floor area) and a height approximately 3 m from floor to ceiling. Considering the cut-out areas, the floor surface area and room volume were 54.3 m2 and 164.0 m3, respectively. Airflow to the meeting room originated from a building air handler unit (AHU) with an economizer and variable
Figure 3. Speaker Source configuration. The Source and Recipients were positioned in a single scenario as shown in thediagram. The HVAC system ventilation was set to 4 ACH. Mean mass concentrations were measured at the Recipientbreathing simulator for unmasked and universal masking experiments. Data are presented as the mean of four independentexperiments. Error bars represent one standard deviation.
2.2. Meeting Room Layout and Ventilation
The meeting room used for experimentation had nominal dimensions of 6.6 m wideby 9.1 m long (with small cut-out areas that subtracted from the floor area) and a heightapproximately 3 m from floor to ceiling. Considering the cut-out areas, the floor surfacearea and room volume were 54.3 m2 and 164.0 m3, respectively. Airflow to the meetingroom originated from a building air handler unit (AHU) with an economizer and variablefrequency drive. The AHU was set to deliver 55 ◦F supply air to variable-air-volume (VAV)boxes that provide supply air to the meeting room and many other rooms on three floors ofthe building. The supply air first passed through a set of prefilters (HC MERV 10 PleatedAir Filter; Filtration Group; Mesa, AZ, USA) and then passed through a MERV 13 V-Bankfilter (DuraMAX 4v; Koch Filter Corporation; Louisville, KY, USA). For this testing, thecontrols to the VAV boxes were overridden to ensure a constant airflow rate throughouteach test. The air supply entered the meeting room through six 0.6 m × 1.2 m fluorescentlight slot diffusers, all controlled by the same VAV box. The slot diffusers were evenlydistributed with three diffusers along each longitudinal wall. The return air entered into aceiling plenum through three 0.6 m × 1.2 m fluorescent light diffusers located through themidline of the room (Figure 1). The meeting room used for testing received less than 4%of the total amount of supply air provided by the AHU. Given this, any effects from airrecirculation, as opposed to a 100% single-pass airflow delivery, were negligible to our testmethodology and ignored for the purpose of this work.
The HVAC system clearance rates were determined using three methods: an HVACmeasurement/calculation method based on the measured total HVAC clean air supply rate(room was positive pressure so supply air was measured instead of the return air), a tracergas decay method using sulfur hexafluoride tracer gas, and an aerosol decay method usingpotassium chloride (KCl) aerosols.
For the HVAC measurement/calculation method, the HVAC supply rates at eachof the six supply inlets were measured using an Alnor Balometer with a 0.6 m × 1.2 mCapture Hood (Model EBT731, TSI Corporation) and summed. This air supply rate wasdivided by the volume of the meeting room to estimate the air volume displacement rate,expressed as ACH.
As an alternative to the HVAC measurement/calculation ACH, an effective ACH(ACHeff) was measured using tracer gas decay measurements collected from within theroom’s occupiable space. Four Innova Photoacoustic Infrared Spectroscopy Analyzer mod-els, 1412, 1412i (2×), and 1512 (California Analytical Instruments Inc.; Orange, CA, USA),were placed throughout the meeting room. All units were equipped with sulfur hexafluo-ride (SF6)-specific optical filters. The SF6 tracer gas (99.8% purity; Scott Specialty Gases
Viruses 2021, 13, 2536 7 of 20
Inc.; Plumsteadville, PA, USA) was released into the meeting room and allowed to mix toa target concentration of approximately 10 ppm. Mixing was aided by one 12′′ diameterdesktop vane axial fan and one larger 24′′ diameter pedestal-base vane axial fan, in additionto the HVAC system ventilation. The fans were then turned off, and SF6 concentrationswere continuously measured at a sample frequency of approximately 1.2–1.5 samples/min(each instrument was slightly different) for at least 30 min to document the decay rateat each of the four sample positions. After each test, the four analyzers were randomlyshuffled among the four analyzer locations to reduce the potential impact of any instrumentbias. Since the tracer gas could be recirculated by the AHU (although it was highly diluted),a concentration of 50 ppb SF6 was considered an acceptable background concentrationprior to initiating the next test. The SF6 concentration decays for the four analyzers wereindividually plotted as a simple exponential decay using Microsoft Excel (Redmond, WA,USA). The slope of each decay curve represented the air exchange rate for each instrumentlocation. The tracer gas-based overall room ACHeff was determined by averaging the fourlocalized air exchange rates.
Similar to the tracer gas decay method, the aerosol concentration decay methodwas also used to determine an ACHeff rate. The meeting room was dosed with aerosolsfrom a 14% KCl solution atomized using a 3-jet Collison jet atomizer for 20 min; a 24′′
diameter pedestal-base vane axial fan provided mixing prior to aerosol measurement.Aerosol concentrations were quantitated for a minimum of 20 min during the aerosoldecay phase using eight symmetrically spaced optical particle counters (Model 3330, TSICorp.) throughout the room—each sampling at 1 s intervals. Particle counts for the threemeasurement size bins, 0.3–0.4 µm, 0.4–0.5 µm, and 0.5–0.65 µm, were aggregated togetherfor each instrument and plotted as a simple exponential decay using the R statisticalenvironment v. 4.0.2 (R Project for Statistical Computing; Vienna, Austria). The slopeof each decay curve represented the air exchange rate for each OPC location and wasaveraged among all OPCs for the particle-based overall room ACHeff.
2.3. HEPA Air Cleaners
The HEPA air cleaners were selected using three criteria: (1) units were listed on theAssociation of Home Appliance Manufacturers (AHAM) certified room air cleaners list;(2) units were readily available to the public from local suppliers or available by purchaseonline; and (3) units were selected based on the size of the room (including an adjustmentfor ceiling height above 8′) using the clean air delivery rate (CADR) for smoke particles. Toaugment the HVAC system, two portable HEPA air cleaners (Honeywell 50250-S; Kaz Inc.;Memphis, TN, USA) were placed in various positions throughout the meeting room. Thisstyle of unit has a 360◦ air intake around the sides, draws air through an activated carbonprefilter and then a HEPA filter, and expels air through the top at 360◦. Each selected HEPAair cleaner was CADR-smoke rated to provide 0.12 m3/s (250 ft3/min) of air filtrationwhich corresponded to an equivalent ACH (ACHequiv) rate of 2.6. The number of HEPAair cleaners determined for examination was based on meeting or exceeding the clean airdelivery rate “2/3 Rule” as recommended by the Environmental Protection Agency [25,41].For the size of the meeting room, the minimum recommended total CADR of 0.229 m3/s(485 ft3/min) was exceeded with two of the selected HEPA air cleaners, which collectivelyprovided a CADR of 0.24 m3/s (500 ft3/min) on the maximal airflow setting. Experimentsusing a single HEPA air cleaner were below the recommended CADR but representedscenarios of units not meeting the “2/3 Rule” recommendation.
One or two HEPA air cleaners were placed on the floor of the meeting room, exceptfor the raised configuration in which the HEPAs were placed on 0.8 m high tables. Forall HEPA air cleaner augmentation studies, the HVAC system supply was fixed at 2 ACHwhich is a ventilation rate representative of office buildings [42]. The ACHequiv rates of theHEPA augmentation studies were conducted using the KCl aerosol decay rates as describedabove, yielding a total ACH (ACHtot) which reflected the contributions of both the HVACACH and the HEPA ACHequiv for each configuration. A Real Time Octave Band Analyzer
Viruses 2021, 13, 2536 8 of 20
(Model 407790; Extech Instrument; Nashua, MA, USA) was used to assess backgroundnoise levels during HEPA operation. Noise measurements were taken at the location ofthe eight area samplers between aerosol testing since the breathing simulators and aerosolsource generate significant levels of noise.
2.4. Test Procedure
The HVAC system and HEPA air cleaners were run at the test flowrates for approxi-mately 10 min prior to initialization of the Recipient breathing simulators and their personalbreathing zone OPC sampling (Grimm samplers). The area samplers (Model 3330 TSI)were initialized concomitantly with the personal breathing zone samplers (colocated ateach Recipient breathing simulator location). Background particle concentrations for thethree minutes preceding the start of the source aerosol generation were used to determinebackground aerosol concentrations. At test time zero, the Source breathing simulatorwas activated and executed the aerosol generation cycle. For these experiments, a 14%w/v solution of KCl in distilled water was nebulized on a 1 min cycle comprising 20 s ofconstant nebulization via a single jet Collison jet atomizer (BGI Sciences), followed by 40 swithout nebulization; this cycle continued for the 60 min duration of the test. The aerosolwas passed into the elastomer bellows of the Source that breathed continuously at a rate of15 L/min and exhaled through the mouth simulator into the meeting room. At the endof each test, the meeting room doors were opened, the HVAC system was set to 8 ACH,and the HEPA air cleaners were turned on, to reduce particle concentrations back to roombaseline prior to starting the next test. Each experimental condition was repeated fourtimes. Ambient conditions were measured using a temperature and relative humidityprobe and data logger (Vaisala Oyj; Vantaa, Finland).
2.5. Data Processing and Statistical Analysis
Size-binned particle count data and elapsed time reported by each Grimm and Model3330 OPC were imported and processed using the R statistical environment. Bin-specificparticle counts for the 180 s observed at each OPC preceding the start of aerosol generationwere used to estimate the background aerosol concentration, which was then subtractedfrom the subsequent OPC particle counts, prior to conversion to OPC-specific bin aggre-gation. The mass of the aerosol in each size bin per m3 of air (mass concentration) wascalculated by multiplying the particle count by the volume of an individual particle with themean diameter of the size bin (assuming the particles were spherical) and by 1.984 g/cm3
(the density of KCl). Note that this conversion from particle counts to particle mass iscommonly used but is an approximation. For each OPC, the background-corrected, totalaerosol mass concentration was averaged over 60 min to determine the mean aerosol massconcentration (mean aerosol exposure) to which each Recipient was exposed. For regres-sion analysis, mean mass concentration was regressed against the experimental variablesof physical distance from the source; relative positional orientation from the source, i.e.,face-to-face, side-by-side, or front-to-back; ACHtot; and masking status, i.e., no masks oruniversal masking, using a multivariate linear model robust against heavy-tailed residualdistributions [43] in R using the “heavy” package after outlier detection and removal. Posthoc two-sample significance tests were conducted using the Wilcoxon rank-sum test inR. Point estimates presented in the text, figures, and tables are the arithmetic mean ± 1standard deviation of the mean aerosol exposure in units of µg/m3. Statistical significancewas set at p < 0.05.
Area samples measured from the Model 3330 OPCs provided the data to generatemean mass concentration spatial interpolated overlays by inverse distance weight modelingusing the “gstat” package in R. First, a grid of evenly spaced points throughout the exposureplane was constructed, over which predicted OPC mean mass concentrations were fittedfrom the observed data. The mean mass concentration range was fixed between 2.9 and≥28 µg/m3. Values greater than 28 µg/m3 were colorized analogous to the maximumvalue in order to increase resolution at the lower concentrations.
Viruses 2021, 13, 2536 9 of 20
3. Results3.1. Meeting Room Conditions and Mask Fit
Across all experiments, the temperature of the meeting room was 22.6 ◦C ± 1.1 ◦Cwith a relative humidity of 36.7% ± 9.6%. Using the previously described HVAC mea-surement/calculation method, the HVAC system was determined to provide three airexchange rates to the meeting room, depending on the HVAC fan setpoint: 2.09 ACH(0.095 m3/second, denoted as 2 ACH), 4.07 ACH (0.185 m3/second, denoted as 4 ACH),and 6.08 ACH (0.277 m3/second, denoted as 6 ACH). At the same three HVAC oper-ational setpoints, the average effective ACH rates (ACHeff) determined by the particledecay were 1.89 ACH, 3.45 ACH, and 5.03 ACH, respectively. The average ACHeff re-sults determined from the tracer gas decay measurements fell between the particle decayACHeff determination and the HVAC measurement/calculation ACH determinations(Supplemental Table S1).
When operating the HVAC system ventilation at 2 ACH, inclusion of HEPA aircleaners increased the particle decay rate by approximately 2.4–2.6 ACH per HEPA aircleaner, with slight variation in ACHtot observed across all HEPA placements (Table 1).For example, the ACHtot rate when a single HEPA air cleaner was placed at the front ofthe room, i.e., close to the aerosol source, was 0.25 ACH higher than when a single HEPAair cleaner was placed at the rear of the room. Two HEPA air cleaners further increasedthe total particle clearance compared to one unit, with the highest ACHtot (7.14 ACH)occurring when the HEPA air cleaners were at the front and back of the room. Placement ofboth HEPA air cleaners at the opposing sides and within the center of the room increasedthe overall ACHtot to 7.03 and 6.94 ACH, respectively, while raising the HEPA air cleanersonto a 0.8 m table at the opposing sides of the meeting room resulted in the lowest ACHtotfor two air cleaners of 6.74.
Table 1. Effective air change rates by particle decay and noise.
HVACACH Setting
HEPAConfiguration ACH ± SD Noise ± SD
(dB)
2 Air Changes/Hour None 1.89 ± 0.14 35 ± 01 HEPA—Front 4.56 ± 0.01 61 ± 11 HEPA—Back 4.31 ± 0.02 59 ± 1
2 HEPAs—Front and Back 7.14 ± 0.11 63 ± 12 HEPAs—Sides 7.03 ± 0.05 63 ± 1
2 HEPAs—Sides Raised 6.74 ± 0.16 N.D.2 HEPAs—Center 6.94 ± 0.03 64 ± 1
4 Air Changes/Hour None 3.45 ± 0.31 376 Air Changes/Hour None 5.03 ± 0.17 38
Point estimates are the mean and one standard deviation of three independent measurements. N.D. = not determined. ACH = airchanges/hour.
Since the procedure for mask fit testing was consistent among all experimental condi-tions, the results for all fit tests were summarized across all fit tests performed. Fit factor forthe Source was 1.9 ± 0.3 (mean ± SD). Fit factors for Recipients A, B, and C were 3.5 ± 1.2,3.8 ± 0.7, and 4.5 ± 1.8, respectively.
3.2. Source Placement
The effect of physical distance, breathing simulator orientation (i.e., face-to-face vs.side-by-side), and universal masking on exposure reduction with the HVAC system ven-tilation at 4 ACH are presented in Figures 2 and 3. When the aerosol Source breathingsimulator was positioned 0.9 m in a face-to-face orientation with the Recipient in thespeaker position and all breathing simulators were unmasked, the OPC at the mouthof the Recipient in the speaker position registered the highest mean mass concentrationamong all scenarios (Figure 2A). In the unmasked condition, increasing the distance be-tween the Source and the speaker (Recipient C) to 1.8 m from 0.9 m significantly reduced
Viruses 2021, 13, 2536 10 of 20
exposure by 79.4% (p = 0.029). Beyond 1.8 m, no perceptible exposure differences werenoted (Figure 2B–D). When the positions of the remaining Recipients relative to the Sourcechanged, no consistent overall pattern was noted with the exception that Recipient B tendedto receive higher exposures compared to Recipient A, despite being positioned furtheraway from the Source. When adjusting for physical distance and orientation, universalmasking significantly reduced exposure by 81.6% (SD 5.9%, p < 0.001) compared to un-masked scenarios (Supplemental Table S2). Likewise, increasing physical distance reducedexposure by 7.9% per meter (SD 3.9%, p = 0.047), while orientation was not a significantpredictor of overall exposure.
Placing the Source in the speaker’s position resulted in similar exposure reduction asthat observed when Source placement was among the Recipients, though orientation wasnot investigated since all breathing simulators were face-to-face with the Source breathingsimulator (Figure 3). Adjusting for physical distancing, the effect of masking remained thestrongest predictor of exposure reduction (72.0% ± 1.4%, p < 0.001). Physical distancingwith the Source as the speaker reduced exposure to a similar extent as the Recipient sourcescenarios (9.5% ± 1.9%, p < 0.001, Supplemental Table S3).
3.3. Ventilation
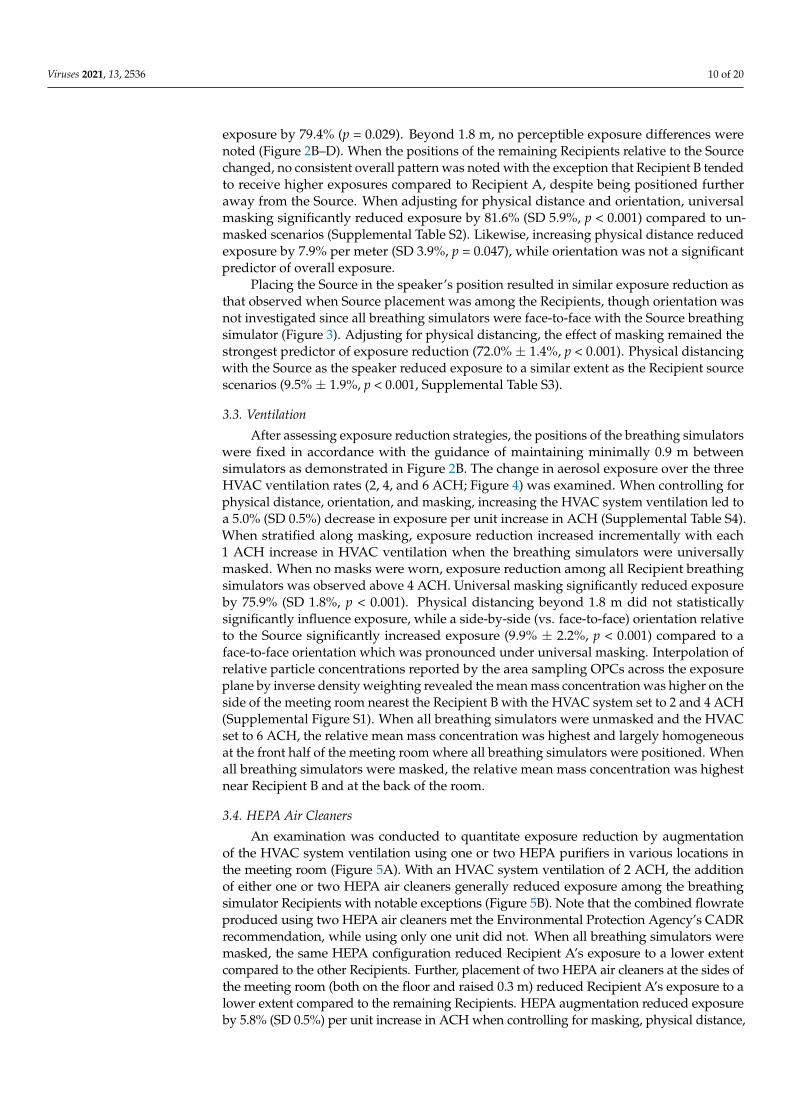
After assessing exposure reduction strategies, the positions of the breathing simulatorswere fixed in accordance with the guidance of maintaining minimally 0.9 m betweensimulators as demonstrated in Figure 2B. The change in aerosol exposure over the threeHVAC ventilation rates (2, 4, and 6 ACH; Figure 4) was examined. When controlling forphysical distance, orientation, and masking, increasing the HVAC system ventilation led toa 5.0% (SD 0.5%) decrease in exposure per unit increase in ACH (Supplemental Table S4).When stratified along masking, exposure reduction increased incrementally with each1 ACH increase in HVAC ventilation when the breathing simulators were universallymasked. When no masks were worn, exposure reduction among all Recipient breathingsimulators was observed above 4 ACH. Universal masking significantly reduced exposureby 75.9% (SD 1.8%, p < 0.001). Physical distancing beyond 1.8 m did not statisticallysignificantly influence exposure, while a side-by-side (vs. face-to-face) orientation relativeto the Source significantly increased exposure (9.9% ± 2.2%, p < 0.001) compared to aface-to-face orientation which was pronounced under universal masking. Interpolation ofrelative particle concentrations reported by the area sampling OPCs across the exposureplane by inverse density weighting revealed the mean mass concentration was higher on theside of the meeting room nearest the Recipient B with the HVAC system set to 2 and 4 ACH(Supplemental Figure S1). When all breathing simulators were unmasked and the HVACset to 6 ACH, the relative mean mass concentration was highest and largely homogeneousat the front half of the meeting room where all breathing simulators were positioned. Whenall breathing simulators were masked, the relative mean mass concentration was highestnear Recipient B and at the back of the room.
3.4. HEPA Air Cleaners
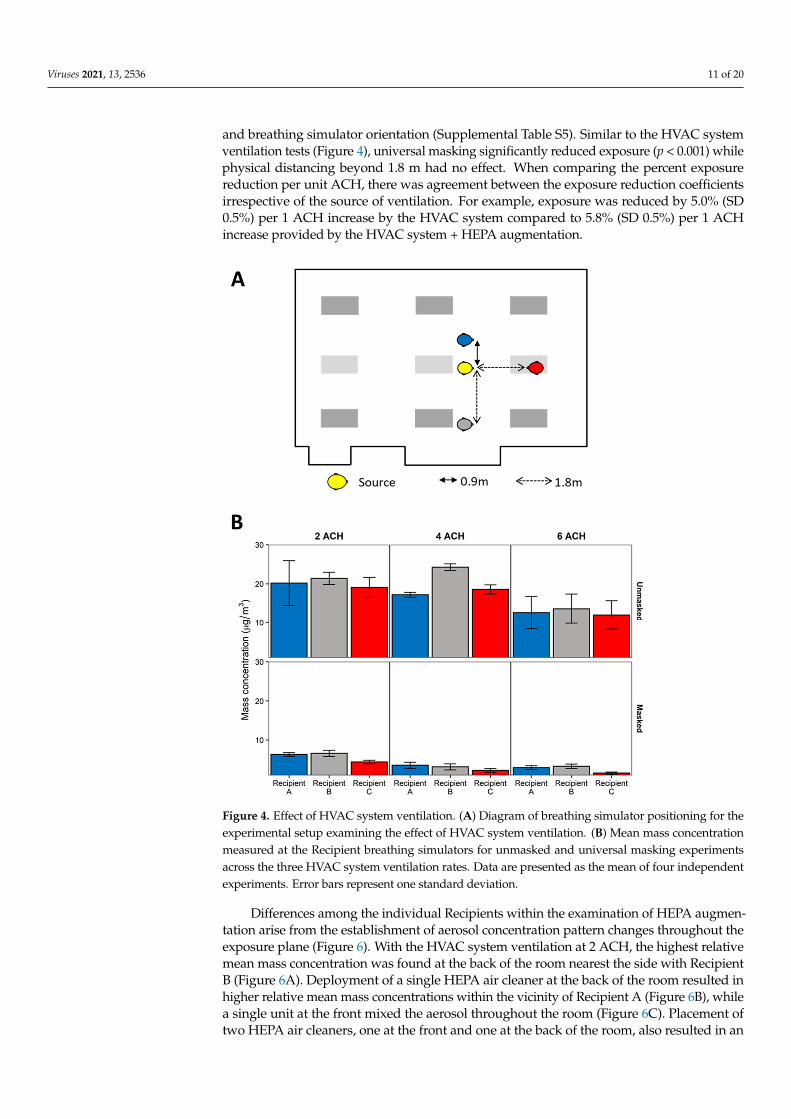
An examination was conducted to quantitate exposure reduction by augmentationof the HVAC system ventilation using one or two HEPA purifiers in various locations inthe meeting room (Figure 5A). With an HVAC system ventilation of 2 ACH, the additionof either one or two HEPA air cleaners generally reduced exposure among the breathingsimulator Recipients with notable exceptions (Figure 5B). Note that the combined flowrateproduced using two HEPA air cleaners met the Environmental Protection Agency’s CADRrecommendation, while using only one unit did not. When all breathing simulators weremasked, the same HEPA configuration reduced Recipient A’s exposure to a lower extentcompared to the other Recipients. Further, placement of two HEPA air cleaners at the sides ofthe meeting room (both on the floor and raised 0.3 m) reduced Recipient A’s exposure to alower extent compared to the remaining Recipients. HEPA augmentation reduced exposureby 5.8% (SD 0.5%) per unit increase in ACH when controlling for masking, physical distance,
Viruses 2021, 13, 2536 11 of 20
and breathing simulator orientation (Supplemental Table S5). Similar to the HVAC systemventilation tests (Figure 4), universal masking significantly reduced exposure (p < 0.001) whilephysical distancing beyond 1.8 m had no effect. When comparing the percent exposurereduction per unit ACH, there was agreement between the exposure reduction coefficientsirrespective of the source of ventilation. For example, exposure was reduced by 5.0% (SD0.5%) per 1 ACH increase by the HVAC system compared to 5.8% (SD 0.5%) per 1 ACHincrease provided by the HVAC system + HEPA augmentation.
Viruses 2021, 13, x FOR PEER REVIEW 12 of 23
Figure 4. Effect of HVAC system ventilation. (A) Diagram of breathing simulator positioning for the experimental setup examining the effect of HVAC system ventilation. (B) Mean mass concentration measured at the Recipient breathing simulators for unmasked and universal masking experiments across the three HVAC system ventilation rates. Data are presented as the mean of four independent experiments. Error bars represent one standard deviation.
3.4. HEPA Air Cleaners An examination was conducted to quantitate exposure reduction by augmentation
of the HVAC system ventilation using one or two HEPA purifiers in various locations in the meeting room (Figure 5A). With an HVAC system ventilation of 2 ACH, the addition of either one or two HEPA air cleaners generally reduced exposure among the breathing simulator Recipients with notable exceptions (Figure 5B). Note that the combined flowrate produced using two HEPA air cleaners met the Environmental Protection Agency’s CADR recommendation, while using only one unit did not. When all breathing simulators were masked, the same HEPA configuration reduced Recipient A’s exposure to a lower extent compared to the other Recipients. Further, placement of two HEPA air cleaners at the sides of the meeting room (both on the floor and raised 0.3 m) reduced Recipient A’s
Figure 4. Effect of HVAC system ventilation. (A) Diagram of breathing simulator positioning for theexperimental setup examining the effect of HVAC system ventilation. (B) Mean mass concentrationmeasured at the Recipient breathing simulators for unmasked and universal masking experimentsacross the three HVAC system ventilation rates. Data are presented as the mean of four independentexperiments. Error bars represent one standard deviation.
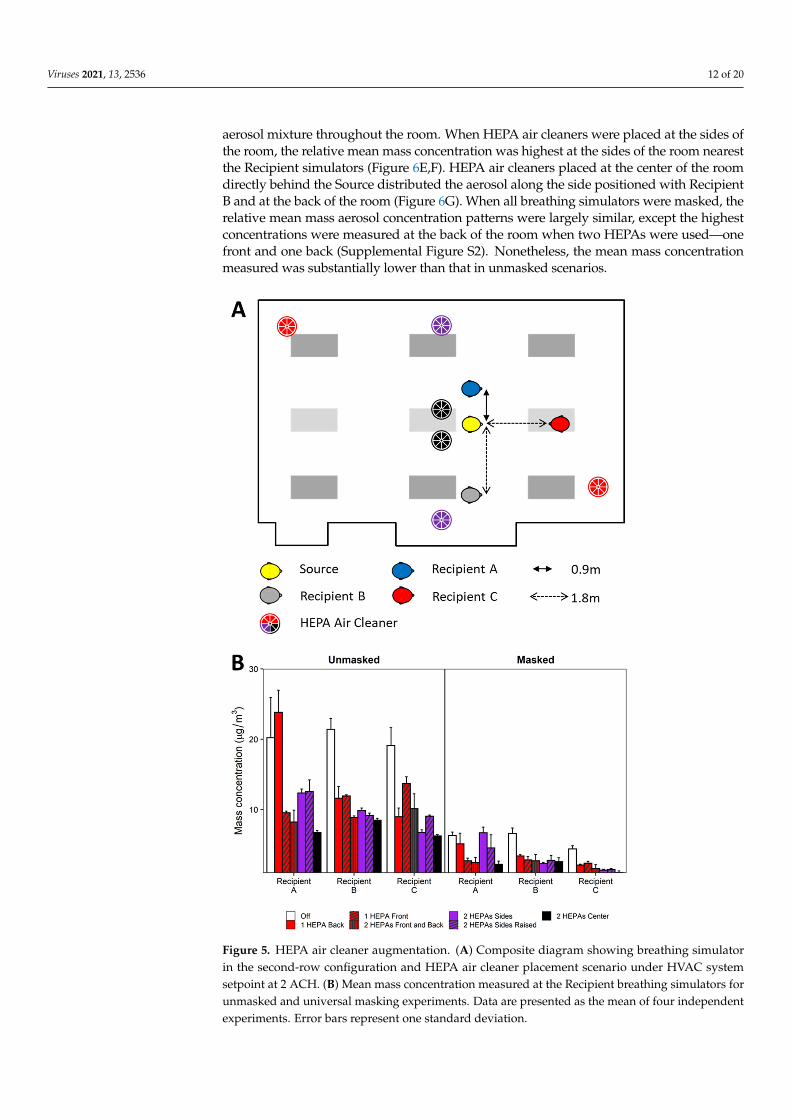
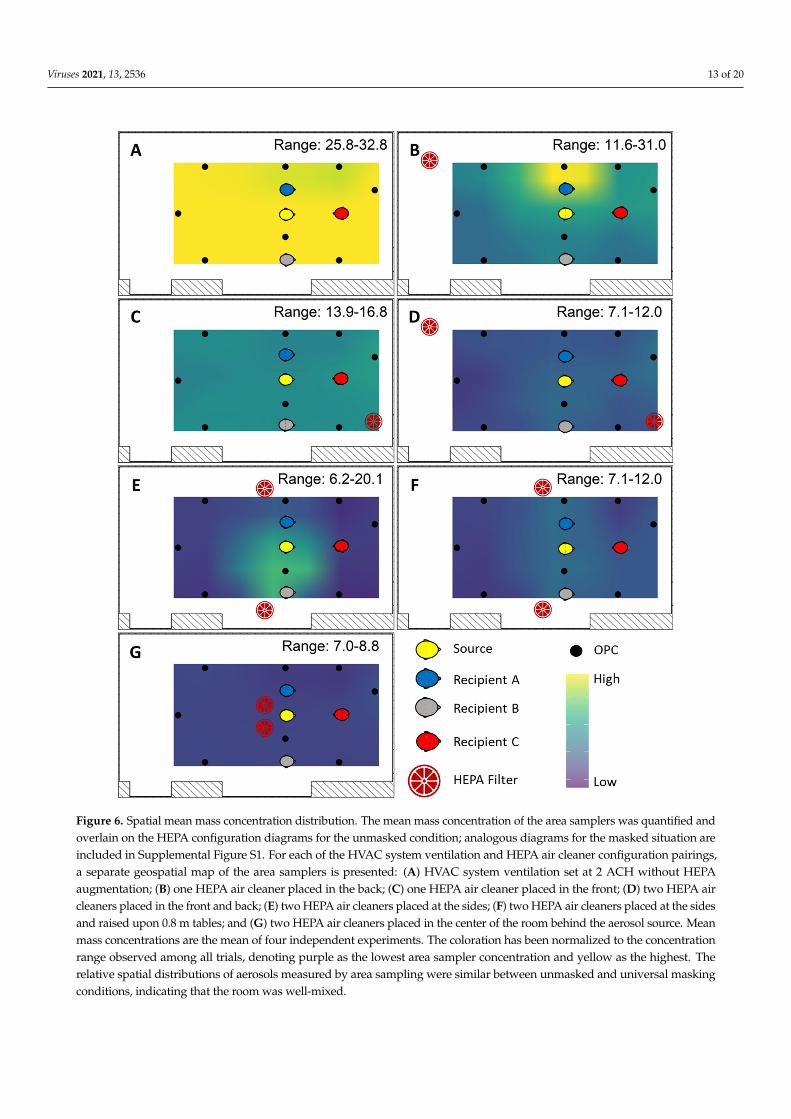
Differences among the individual Recipients within the examination of HEPA augmen-tation arise from the establishment of aerosol concentration pattern changes throughout theexposure plane (Figure 6). With the HVAC system ventilation at 2 ACH, the highest relativemean mass concentration was found at the back of the room nearest the side with RecipientB (Figure 6A). Deployment of a single HEPA air cleaner at the back of the room resulted inhigher relative mean mass concentrations within the vicinity of Recipient A (Figure 6B), whilea single unit at the front mixed the aerosol throughout the room (Figure 6C). Placement oftwo HEPA air cleaners, one at the front and one at the back of the room, also resulted in an
Viruses 2021, 13, 2536 12 of 20
aerosol mixture throughout the room. When HEPA air cleaners were placed at the sides ofthe room, the relative mean mass concentration was highest at the sides of the room nearestthe Recipient simulators (Figure 6E,F). HEPA air cleaners placed at the center of the roomdirectly behind the Source distributed the aerosol along the side positioned with RecipientB and at the back of the room (Figure 6G). When all breathing simulators were masked, therelative mean mass aerosol concentration patterns were largely similar, except the highestconcentrations were measured at the back of the room when two HEPAs were used—onefront and one back (Supplemental Figure S2). Nonetheless, the mean mass concentrationmeasured was substantially lower than that in unmasked scenarios.
Viruses 2021, 13, x FOR PEER REVIEW 14 of 23
Figure 5. HEPA air cleaner augmentation. (A) Composite diagram showing breathing simulator in the second-row configuration and HEPA air cleaner placement scenario under HVAC system set-point at 2 ACH. (B) Mean mass concentration measured at the Recipient breathing simulators for unmasked and universal masking experiments. Data are presented as the mean of four independent experiments. Error bars represent one standard deviation.
Differences among the individual Recipients within the examination of HEPA aug-mentation arise from the establishment of aerosol concentration pattern changes through-out the exposure plane (Figure 6). With the HVAC system ventilation at 2 ACH, the high-est relative mean mass concentration was found at the back of the room nearest the side
Figure 5. HEPA air cleaner augmentation. (A) Composite diagram showing breathing simulatorin the second-row configuration and HEPA air cleaner placement scenario under HVAC systemsetpoint at 2 ACH. (B) Mean mass concentration measured at the Recipient breathing simulators forunmasked and universal masking experiments. Data are presented as the mean of four independentexperiments. Error bars represent one standard deviation.
Viruses 2021, 13, 2536 13 of 20Viruses 2021, 13, x FOR PEER REVIEW 16 of 23
Figure 6. Spatial mean mass concentration distribution. The mean mass concentration of the area samplers was quantified and overlain on the HEPA configuration diagrams for the unmasked condition; analogous diagrams for the masked situ-ation are included in Supplemental Figure S1. For each of the HVAC system ventilation and HEPA air cleaner configura-tion pairings, a separate geospatial map of the area samplers is presented: (A) HVAC system ventilation set at 2 ACH without HEPA augmentation; (B) one HEPA air cleaner placed in the back; (C) one HEPA air cleaner placed in the front; (D) two HEPA air cleaners placed in the front and back; (E) two HEPA air cleaners placed at the sides; (F) two HEPA air cleaners placed at the sides and raised upon 0.8 m tables; and (G) two HEPA air cleaners placed in the center of the room behind the aerosol source. Mean mass concentrations are the mean of four independent experiments. The coloration has been normalized to the concentration range observed among all trials, denoting purple as the lowest area sampler concen-tration and yellow as the highest. The relative spatial distributions of aerosols measured by area sampling were similar between unmasked and universal masking conditions, indicating that the room was well-mixed.
Figure 6. Spatial mean mass concentration distribution. The mean mass concentration of the area samplers was quantified andoverlain on the HEPA configuration diagrams for the unmasked condition; analogous diagrams for the masked situation areincluded in Supplemental Figure S1. For each of the HVAC system ventilation and HEPA air cleaner configuration pairings,a separate geospatial map of the area samplers is presented: (A) HVAC system ventilation set at 2 ACH without HEPAaugmentation; (B) one HEPA air cleaner placed in the back; (C) one HEPA air cleaner placed in the front; (D) two HEPA aircleaners placed in the front and back; (E) two HEPA air cleaners placed at the sides; (F) two HEPA air cleaners placed at the sidesand raised upon 0.8 m tables; and (G) two HEPA air cleaners placed in the center of the room behind the aerosol source. Meanmass concentrations are the mean of four independent experiments. The coloration has been normalized to the concentrationrange observed among all trials, denoting purple as the lowest area sampler concentration and yellow as the highest. Therelative spatial distributions of aerosols measured by area sampling were similar between unmasked and universal maskingconditions, indicating that the room was well-mixed.

Viruses 2021, 13, 2536 14 of 20
4. Discussion
Increases in HVAC ventilation, the use of HEPA air cleaners, universal masking, andphysical distancing are all recommended interventions to reduce exposure to airborneparticles carrying the SARS-CoV-2 virus. Many studies have looked at these interventionsindividually, but few have examined them in combination with each other. Assessmentsof the total effects of different combinations of ventilation, HEPA filtration, masking,and distancing are needed because these interventions can interact in ways that are notalways obvious.
Increasing the HVAC system ventilation rate is an effective engineering control forreducing exposure to potentially infectious respiratory aerosols. For traditional HVACsystems, the highest removal rates generally occur when the air is well-mixed [44,45]. Weobserved reductions in the mass aerosol concentrations at the Recipients with increasing airexchange rates. These results are in line with the notion that released aerosols disperse morerapidly throughout the room at higher ACH rates because increases in ventilation providemore extensive air mixing in addition to increased aerosol clearance [46–48]. In additionto ventilation rates, room air currents can also affect exposure to aerosols and droplets,depending upon the position and orientation of a Recipient relative to the Source’s plume.This was especially notable for the Source within the participant area and the speaker whenthey were face-to-face. Since the relative aerosol concentration tended to be higher nearRecipient B (a product of room airflow dynamics) and the speaker was directly in the pathof the aerosol plume, the exposure for these two Recipients did not decrease until 6 ACHwhen no masks were worn (Figure 4).
Recognizing that the ventilation and airflow patterns observed are unique to the meet-ing room in which the experimentation was conducted, some generalizations can be drawnfrom the simulated scenario within the context of classroom-style room configurations,such as the meeting room simulation in the current investigation as well as classrooms.Examinations of air change rates in meeting rooms specifically are generally lacking, andmeasured ventilation rates for general office buildings and schools are generally under2 ACH in the United States [24,49]. To address situations where simply increasing ven-tilation via the HVAC system is not possible, portable HEPA air cleaners offer a simple,relatively inexpensive option to increase indoor room ACH rates without modification tobuilding infrastructure. Augmentation using either one or two HEPA air cleaners generallyreduced Recipient mass aerosol concentrations by an additional 50% compared to 2 ACHby the HVAC ventilation alone. Overall, our results demonstrated that augmentation ofthe HVAC system with two HEPA air cleaners significantly decreased exposure, consistentwith previous findings [27], though the position was an important factor in Recipientexposure. Mean mass concentrations were consistently lowest when two HEPA air cleanerswere positioned with one unit in the front and one in the back of the room, both unitsraised on a table at the sides of the room, and both units in the center of the room. Thesethree HEPA placements also dispersed aerosols homogeneously throughout the room, thusreducing the possibility of observing localized, high concentration areas as observed forthe single HEPA air cleaner at the back of the room and two air cleaners placed on thefloor at the sides of the room. The center placement, however, may not be feasible forall configurations and introduces considerations regarding space availability within theparticipant area for the HEPA air cleaners, noise, and power supply.
Overall, HEPA deployment resulted in significant reduction in Recipient exposure,showing that the increase in total ACH provided by the HEPA air cleaners can reduceexposure to potentially infectious aerosols. However, it should be noted that the HEPA aircleaner units did not provide exposure reductions at all locations in all scenarios. IndividualRecipient exposure metrics were dependent upon relative position of the Recipient to boththe Source and the HEPA air cleaner(s). The addition of HEPA air cleaners will affectroom air dynamics that, depending on Source and Recipient locations, could impact anindividual Recipient’s exposures under certain scenarios. To reduce the likelihood of suchan occurrence, HEPA positioning should be evaluated carefully to prevent the potential of
Viruses 2021, 13, 2536 15 of 20
drawing directed air currents from one occupant over another. Such an evaluation can beaided using handheld tracer “smoke” or “fog” generators. The use of multiple HEPA aircleaners spread out around the room provides a faster and better mixing and cleaning ofthe room air, thereby reducing the overall concentrations for participants in the room andreducing the probability of SARS-CoV-2 transmission.
For the scenarios with universal masking, the redirection of the exhalation airflow bythe masks meant that the dispersion of the aerosol depended more upon the air currentsinduced by the combination of HVAC system and HEPA air cleaners and less on the aircurrents generated by breathing. This was readily observed when two HEPA air cleanerswere placed at the sides of the room, wherein the HEPA air cleaners drew the aerosolstowards the two Recipients adjacent to the Source. Here, Recipient A was positionedbetween the Source and the HEPA air cleaner while Recipient B was slightly to the side.This once again demonstrates the importance of evaluating HEPA placement to avoidunintended consequences. Nonetheless, overall, augmentation of the HVAC system withtwo HEPA air cleaners in addition to universal masking provided significant reductions inaerosol mean mass concentrations compared to no mitigation strategies.
Masking reduces aerosol release into the indoor environment during coughs andexhalations (called source control). Considerable research has focused on masks both assource control devices [13] and personal protective devices for a recipient [50,51]. When amask is worn, exhaled aerosols may travel through the mask material and be partially orcompletely filtered out, or they may escape through gaps between the mask and the face(called face seal leaks) [52]. Aerosols that pass through or around the mask will dispersein the room and lead to changes in the relative aerosol concentration pattern. Previouswork by our group has shown that with a face-to-face orientation at 1.8 m during breathing,universal masking reduced the mean aerosol exposure of a Recipient breathing simulatorby 76% [39]. The results from the current investigation also showed similar aerosol massconcentration reduction by universal masking among the Recipients.
To date, epidemiological studies have examined physical distancing effectivenessin schools, while those in office settings are lacking. Some schools, for example, hadimplemented recommendations of varying physical distance, thus setting up naturalexperiments for which the effect of physical distancing on class incidence rates may beexamined. A retrospective cohort study comparing SAR-CoV-2 incidence rates betweenschool districts adhering to≥0.9 m and≥1.8 m physical distancing during a 16-week studyperiod reported no difference in incidence rate between the two districts [53]. Since thatstudy, the CDC and the American Academy of Pediatrics have recommended maintaininga physical distance of ≥0.9 m between students, while physical distance recommendationsbetween adults and students and between adults remain ≥1.8 m [54,55]. In our study,among the scenarios where the Source was a meeting participant, aerosol reduction byincreasing physical distance was significant when controlling for orientation and masking(Figure 2). These results were likely influenced by the high exposures of the Recipient inthe speaker position when the Source was placed at a distance of 0.9 m in a front-to-frontorientation with the Recipient in the speaker position (Figure 2A) compared to 1.8 m(Figure 2B). While orientation itself was not an overall significant predictor of exposure,the combination of a front-to-front orientation and 0.9 m separation distance was theworst-case exposure scenario for a Recipient in the speaker position. Therefore, our resultslend support to the ≥1.8 m physical distancing recommendations when the Source anda Recipient are oriented face-to-face. The results demonstrate that a complex interplaybetween physical distance, orientation, and room air currents exists. Within a close physicaldistance, i.e., 0.9 m, and without universal masking, a face-to-face orientation contributessignificantly to the mean mass concentration exposure, as shown for the Recipient in thespeaker position in Figure 2A compared to Recipient A that was side-by-side with theSource. However, when increasing physical distancing to 1.8 m or greater, the resultingface-to-face orientation exposure was similar to exposures observed for the two side-by-side Recipients. Thus, the interaction between orientation and physical distance should be
Viruses 2021, 13, 2536 16 of 20
understood within the context of exhalation plume volumetric dynamics. With increasingdistance, the exhalation plume dissipates volumetrically, thus reducing the concentrationof aerosols and subsequent exposure [36]. In the current investigation, we observed thatthe exhalation plume largely diluted the exposure of a face-to-face Recipient at 1.8 m andfurther to the general room mean mass aerosol concentration. For a Recipient with a side-by-side orientation to the Source, the air currents induced by the ventilation dominated theindividual Recipient exposure, thus negating the effects of physical distancing for side-by-side orientations relative to the Source. Area monitoring revealed that with the ventilationACH under 4.0, aerosols from the Source tended to accumulate on the side of the roomwhere Recipient B was located, indicating that Recipients at any distance along this side ofthe experimental meeting room would have a higher exposure than comparable positionson the opposing side. In effect, for individuals in other than face-to-face orientations, theairflow patterns of the room may dictate the magnitude of exposure more readily thanphysical distancing alone. Since the room airflow patterns will be unique to the specificindoor environment, effective exposure mitigation by physical distancing greater than0.9 m cannot be assured simply by modification of interpersonal distance alone.
Comparisons of the results in the current investigation to epidemiological findingsmust be made with caution. However, epidemiological findings examining the effectsof masking, physical distancing, and/or ventilation generally support the findings fromthese simulations. For example, the relative risk of COVID-19 infections was significantlyreduced among a cohort of elementary school students in Georgia by broad modificationsof ventilation including dilution with fresh air and HEPA filtration, ultraviolet germi-cidal irradiation, and combinations thereof, as well as mandatory masking of teachersand staff. Physical distancing was not a significant determinant of case incidence [56].These results agree with another examination of COVID-19 case incidence rates amongpublic-school children in Massachusetts [53], though these results may be confoundedthrough differential adherence to mask mandates and heterogeneities in ventilation amongthe schools [57]. Overall, our results support the general findings of the cohort studiesdemonstrating that masking and ventilation are strongly associated with aerosol reductionin the indoor environment and are reinforced by computational modeling [58,59]. Whilephysical distancing may provide relatively minor reductions in exposure to very smallaerosols, it still may provide an additional layer in a mitigation strategy.
There are several limitations to our investigation. First, our study was limited to air-borne particles from 0.3 to 3 µm in diameter, which is a size range that includes bioaerosolparticles that are small enough to remain airborne for an extended time but large enough tocarry pathogens. However, humans produce aerosol particles across a broad size distribu-tion [60,61], and particles and droplets larger than the size range in our experiments wouldbehave differently, especially regarding the distancing variable. Second, the simulatorsused in the study were static and did not contain heating sources for either the air exhaledor the area around the breathing simulator to resemble body heat. More than one source aswell as a moving index case throughout a room could change the aerosol dispersion pattern,leading to changes in exposures. The action of body movement has been shown to affectan individual’s personal exposure [62,63], which is a factor unaccounted for in the currentinvestigation. Anthropogenic thermal air currents and movement can alter how aerosolsare dispersed around the personal breathing zone and subsequently inhaled. Additionally,human-exhaled breath is also warm and humid which can affect how aerosols interact withthe room airflow [37]. Third, the effect of physical distancing among individuals adjacentto the source in the current investigation remains difficult to separate from the influencesof air currents induced by the HVAC system, the HEPA air purifiers, or both. In the mostcommon configuration, we noted air currents of the HVAC caused increases in mean massconcentrations nearest Recipient B. Therefore, the effect of HVAC air currents confoundedthe effect of physical distancing on mean mass concentration in the experimental meetingroom. Fourth, the current investigation was conducted in one classroom-style meetingroom with a unique HVAC setup that cannot be generalized to other rooms. As such,
Viruses 2021, 13, 2536 17 of 20
the exposure reduction effect of ventilation and HEPA air cleaner placement would beexpected to change, depending upon the room examined. Finally, the choice of HEPA aircleaners for a classroom-style meeting requires consideration of their noise level duringoperation [28]. In our study, the use of one or two HEPA air cleaners, in addition to theHVAC system, exceeded 60 dB which may, in certain environments, be too excessive. Fifth,a mitigation strategy not considered in this study was the use of windows to introduceoutside air to the room for increased ventilation. It has been demonstrated that openingwindows to create cross ventilation in buildings and rooms with poor ventilation from thebuilding HVAC system can help reduce SARS-CoV-2 transmission [64]. The conferenceroom setup used for this study was an interior room with no windows to the outside toallow natural ventilation into the room. Therefore, the effect of natural ventilation couldnot be examined.
5. Conclusions
Reducing the spread of COVID-19 requires reducing exposure of people to human-generated respiratory aerosols carrying the SARS-CoV-2 virus. Our results support theuse of a combination of strategies to reduce the concentration of these infectious aerosolsin indoor environments. Increases in ventilation rates, the use of HEPA air cleaners,the implementation of universal masking, and physical distancing can all play a role indecreasing the exposure of room occupants to airborne SARS-CoV-2. In this investigation,universal masking was the most consistent and efficacious mitigation strategy. Maskingreduced exposure by 50% or more compared to no masking. Ventilation reduced exposureby approximately 5% per 1 ACH increase, irrespective of whether increasing ventilationwas achieved by increasing system HVAC or by the use of portable HEPA air cleaners. Theplacement of portable HEPA air cleaners was a factor in determining a Recipient’s exposurereduction. Nonetheless, the most effective portable HEPA air cleaner configuration was theuse of two units at opposing sides of the room, e.g., one at the front and one at the back orone each at the sides of the room, or two units in the center of the room. Increasing physicaldistance between the Source and Recipients beyond 0.9 m provided minimal exposurereduction when oriented side-by-side. However, maintaining a physical distance of 1.8 mor more between the Source and a Recipient in the face-to-face orientation was critical.
Supplementary Materials: The following are available online at https://www.mdpi.com/article/10.3390/v13122536/s1, Figure S1: Spatial mean mass concentration distribution of system ventila-tion, Figure S2: Spatial mean mass concentration distribution with HEPA augmentation, Table S1:Comparative ACH measurement methods, Table S2: Regression coefficients for Figure 2, Table S3:Regression coefficients for Figure 3, Table S4: Regression coefficients for Figure 4, Table S5: Regressioncoefficients for Figure 5.
Author Contributions: Conceptualization, J.P.C., R.C.D., W.G.L., S.B.M.J. and K.R.M.; data curation,J.P.C.; formal analysis, J.P.C., T.B. and S.B.M.J.; funding acquisition, F.M.B., D.H.B. and J.D.N.;investigation, J.P.C., R.C.D., W.G.L., F.M.B., A.R.L., S.B.M.J. and S.A.F.; methodology, J.P.C., R.C.D.,W.G.L., F.M.B., A.R.L., S.B.M.J., K.R.M., J.S.R., W.G.M. and E.W.S.; project administration, D.H.B. andJ.D.N.; supervision, D.H.B. and J.D.N.; visualization, J.P.C.; writing—original draft, J.P.C., R.C.D.,W.G.L., S.B.M.J., K.R.M. and S.A.F.; writing—review and editing, J.P.C., R.C.D., W.G.L., F.M.B., T.B.,A.R.L., S.B.M.J., K.R.M., S.A.F., J.S.R., W.G.M., E.W.S., D.H.B. and J.D.N. All authors have read andagreed to the published version of the manuscript.
Funding: This research was financially supported by the Centers for Disease Control and Prevention.
Institutional Review Board Statement: Not applicable.
Informed Consent Statement: Not applicable.
Data Availability Statement: Data are available from the authors upon reasonable request.
Acknowledgments: The authors wish to acknowledge the facilities, maintenance, and securitypersonnel of NIOSH Morgantown for the hard work and dedication they provided which wasintegral in the completion of this work.
Viruses 2021, 13, 2536 18 of 20
Conflicts of Interest: The authors declare no conflict of interest.
Disclaimer: The findings and conclusions in this report are those of the authors and do not necessarilyrepresent the official position of the National Institute for Occupational Safety and Health, Centersfor Disease Control and Prevention. Mention of any company or product does not constituteendorsement by the National Institute for Occupational Safety and Health, Centers for DiseaseControl and Prevention.
References1. Anderson, E.L.; Turnham, P.; Griffin, J.R.; Clarke, C.C. Consideration of the Aerosol Transmission for COVID-19 and Public
Health. Risk Anal. 2020, 40, 902–907. [CrossRef] [PubMed]2. Hamner, L.; Dubbel, P.; Capron, I.; Ross, A.; Jordan, A.; Lee, J.; Lynn, J.; Ball, A.; Narwal, S.; Russell, S.; et al. High SARS-CoV-2
Attack Rate Following Exposure at a Choir Practice—Skagit County, Washington, March 2020. MMWR Morb. Mortal. Wkly. Rep.2020, 69, 606–610. [CrossRef] [PubMed]
3. Morawska, L.; Milton, D.K. It Is Time to Address Airborne Transmission of Coronavirus Disease 2019 (COVID-19). Clin. Infect.Dis. 2020, 71, 2311–2313. [CrossRef]
4. Wei, J.; Li, Y. Airborne spread of infectious agents in the indoor environment. Am. J. Infect. Control 2016, 44 (Suppl. 9), S102–S108.[CrossRef] [PubMed]
5. Wang, C.C.; Prather, K.A.; Sznitman, J.; Jimenez, J.L.; Lakdawala, S.S.; Tufekci, Z.; Marr, L.C. Airborne transmission of respiratoryviruses. Science 2021, 373, 6558. [CrossRef]
6. Chen, C.; Zhao, B. Some questions on dispersion of human exhaled droplets in ventilation room: Answers from numericalinvestigation. Indoor Air 2010, 20, 95–111. [CrossRef]
7. Dinoi, A.; Feltracco, M.; Chirizzi, D.; Trabucco, S.; Conte, M.; Gregoris, E.; Barbaro, E.; La Bella, G.; Ciccarese, G.; Belosi, F.; et al. Areview on measurements of SARS-CoV-2 genetic material in air in outdoor and indoor environments: Implication for airbornetransmission. Sci. Total Environ. 2021, 151137. [CrossRef]
8. CDC Scientific Brief: SARS-CoV-2 Transmission. Atlanta, GA: Centers for Disease Control and Prevention. 2021. Available online:https://www.cdc.gov/coronavirus/2019-ncov/science/science-briefs/sars-cov-2-transmission.html (accessed on 1 June 2021).
9. Howard, J.; Huang, A.; Li, Z.; Tufekci, Z.; Zdimal, V.; van der Westhuizen, H.M.; von Delft, A.; Price, A.; Fridman, L.; Tang, L.H.;et al. An evidence review of face masks against COVID-19. Proc. Natl. Acad. Sci. USA 2021, 118, e2014564118. [CrossRef]
10. Asadi, S.; Cappa, C.D.; Barreda, S.; Wexler, A.S.; Bouvier, N.M.; Ristenpart, W.D. Efficacy of masks and face coverings incontrolling outward aerosol particle emission from expiratory activities. Sci. Rep. 2020, 10, 15665. [CrossRef]
11. Davies, A.; Thompson, K.A.; Giri, K.; Kafatos, G.; Walker, J.; Bennett, A. Testing the efficacy of homemade masks: Would theyprotect in an influenza pandemic? Disast. Med. Public Health Prep. 2013, 7, 413–418. [CrossRef]
12. Lindsley, W.G.; Blachere, F.M.; Law, B.F.; Beezhold, D.H.; Noti, J.D. Efficacy of face masks, neck gaiters and face shields forreducing the expulsion of simulated cough-generated aerosols. Aerosol Sci. Technol. 2021, 55, 1–9. [CrossRef]
13. Lindsley, W.G.; Blachere, F.M.; Beezhold, D.H.; Law, B.F.; Derk, R.C.; Hettick, J.M.; Woodfork, K.; Goldsmith, W.T.; Harris, J.R.;Duling, M.G.; et al. A comparison of performance metrics for cloth face masks as source control devices for simulated cough andexhalation aerosols. Aerosol Sci. Technol. 2021, 55, 1125–1142. [CrossRef]
14. Brooks, J.T.; Beezhold, D.H.; Noti, J.D.; Coyle, J.P.; Derk, R.C.; Blachere, F.M.; Lindsley, W.G. Maximizing Fit for Cloth and MedicalProcedure Masks to Improve Performance and Reduce SARS-CoV-2 Transmission and Exposure, 2021. MMWR Morbid. Mortal.Wkly. Rep. 2021, 70, 254–257. [CrossRef]
15. Lawrence, R.B.; Duling, M.G.; Calvert, C.A.; Coffey, C.C. Comparison of performance of three different types of respiratoryprotection devices. J. Occup. Environ. Hyg. 2006, 3, 465–474. [CrossRef]
16. Oberg, T.; Brosseau, L.M. Surgical mask filter and fit performance. Am. J. Infect. Control 2008, 36, 276–282. [CrossRef] [PubMed]17. Conte, M.; Feltracco, M.; Chirizzi, D.; Trabucco, S.; Dinoi, A.; Gregoris, E.; Barbaro, E.; La Bella, G.; Ciccarese, G.; Belosi, F.; et al.
Airborne concentrations of SARS-CoV-2 in indoor community environments in Italy. Environ. Sci. Pollut. Res. Int. 2021, 1–12.[CrossRef] [PubMed]
18. Lyu, W.; Wehby, G.L. Community Use Of Face Masks And COVID-19: Evidence From A Natural Experiment Of State MandatesIn The US. Health Aff. 2020, 39, 1419–1425. [CrossRef]
19. Van Dyke, M.E.; Rogers, T.M.; Pevzner, E.; Satterwhite, C.L.; Shah, H.B.; Beckman, W.J.; Ahmed, F.; Hunt, D.C.; Rule, J. Trends inCounty-Level COVID-19 Incidence in Counties with and without a Mask Mandate—Kansas, 1 June–23 August 2020. MMWRMorb. Mortal. Wkly. Rep. 2020, 69, 1777–1781. [CrossRef]
20. Leech, J.A.; Nelson, W.C.; Burnett, R.T.; Aaron, S.; Raizenne, M.E. It’s about time: A comparison of Canadian and Americantime-activity patterns. J. Expo. Anal. Environ. Epidemiol. 2002, 12, 427–432. [CrossRef] [PubMed]
21. Qian, H.; Miao, T.; Liu, L.; Zheng, X.; Luo, D.; Li, Y. Indoor transmission of SARS-CoV-2. Indoor Air 2021, 31, 639–645. [CrossRef]22. Li, Y.; Qian, H.; Hang, J.; Chen, X.; Cheng, P.; Ling, H.; Wang, S.; Liang, P.; Li, J.; Xiao, S.; et al. Probable airborne transmission of
SARS-CoV-2 in a poorly ventilated restaurant. Build Environ. 2021, 196, 107788. [CrossRef]23. Lu, J.; Gu, J.; Li, K.; Xu, C.; Su, W.; Lai, Z.; Zhou, D.; Yu, C.; Xu, B.; Yang, Z. COVID-19 Outbreak Associated with Air Conditioning
in Restaurant, Guangzhou, China, 2020. Emerg. Infect. Dis. 2020, 26, 1628–1631. [CrossRef]
Viruses 2021, 13, 2536 19 of 20
24. Batterman, S.; Su, F.C.; Wald, A.; Watkins, F.; Godwin, C.; Thun, G. Ventilation rates in recently constructed U.S. school classrooms.Indoor Air 2017, 27, 880–890. [CrossRef]
25. CDC Ventilation in Buildings. Available online: https://www.cdc.gov/coronavirus/2019-ncov/community/ventilation.html(accessed on 10 June 2021).
26. ASHRAE In-Room Air Cleaner Guidance for Reducing Covid-19 in Air in Your Space/Room. Available online: https://www.ashrae.org/technical-resources/resources (accessed on 15 June 2021).
27. Mousavi, E.S.; Godri Pollitt, K.J.; Sherman, J.; Martinello, R.A. Performance analysis of portable HEPA filters and temporaryplastic anterooms on the spread of surrogate coronavirus. Build. Environ. 2020, 183, 107186. [CrossRef]
28. Bluyssen, P.M.; Ortiz, M.; Zhang, D. The effect of a mobile HEPA filter system on ’infectious’ aerosols, sound and air velocity inthe SenseLab. Build. Environ. 2021, 188, 107475. [CrossRef] [PubMed]
29. CDC Social Distancing: Keep a Safe Distance to Slow the Spread. Available online: https://www.cdc.gov/coronavirus/2019-ncov/prevent-getting-sick/social-distancing.html (accessed on 1 June 2021).
30. WHO Coronavirus Disease (COVID-19) Advice for the Public: What to Do to Keep Yourself and Others Safe fromCOVID-19. Available online: https://www.who.int/emergencies/diseases/novel-coronavirus-2019/advice-for-public(accessed on 10 June 2021).
31. Siegel, J.D.; Rhinehart, E.; Jackson, M.; Chiarello, L. Health Care Infection Control Practices Advisory, C.; 2007 Guideline forIsolation Precautions: Preventing Transmission of Infectious Agents in Health Care Settings. Am. J. Infect. Control 2007, 35(Suppl 2), S65–S164. [CrossRef]
32. Xie, X.; Li, Y.; Chwang, A.T.; Ho, P.L.; Seto, W.H. How far droplets can move in indoor environments—Revisiting the Wellsevaporation-falling curve. Indoor Air 2007, 17, 211–225. [CrossRef] [PubMed]
33. Haynes, W.M. CRC Handbook of Chemistry and Physics, 94th ed.; CRC Press: Boca Raton, FL, USA, 2014.34. Bourouiba, L.; Dehandschoewercker, E.; Bush, J.W.M. Violent expiratory events: On coughing and sneezing. J. Fluid Mech. 2014,
745, 537–563. [CrossRef]35. Liu, L.; Wei, J.; Li, Y.; Ooi, A. Evaporation and dispersion of respiratory droplets from coughing. Indoor Air 2017, 27, 179–190.
[CrossRef] [PubMed]36. Halloran, S.K.; Wexler, A.S.; Ristenpart, W.D. A comprehensive breath plume model for disease transmission via expiratory
aerosols. PLoS ONE 2012, 7, e37088. [CrossRef]37. Sun, S.; Li, J.; Han, J. How human thermal plume influences near-human transport of respiratory droplets and airborne particles:
A review. Environ. Chem. Lett. 2021, 19, 1971–1982. [CrossRef] [PubMed]38. Liu, F.; Luo, Z.; Li, Y.; Zheng, X.; Zhang, C.; Qian, H. Revisiting physical distancing threshold in indoor environment using
infection-risk-based modeling. Environ. Int. 2021, 153, 106542. [CrossRef]39. Lindsley, W.G.; Beezhold, D.H.; Coyle, J.; Derk, R.C.; Blachere, F.M.; Boots, T.; Reynolds, J.S.; McKinney, W.G.; Sinsel, E.; Noti, J.D.
Efficacy of universal masking for source control and personal protection from simulated cough and exhaled aerosols in a room.medRxiv 2021, 18, 409–422. [CrossRef]
40. ISO. Respiratory Protective Devices—Human Factors—Part. 1: Metabolic Rates and Respiratory Flow Rates; International Organizationfor Standardization: Geneva, Switzerland, 2015; Standard ISO/TS 16976–1:2015; p. 19.
41. EPA. Guide to Air Cleaners in the Home: Portable Air Cleaners. Furnace and HVAC Filters; Environmental Protection Agency:Washington, DC, USA, 2018.
42. Dols, W.S.; Persily, A.K. A study of ventilation measurement in an office building. In Airflow Performance of Building Envelopes,Components, and Systems; ASTM International: Conshohocken, PA, USA, 1995.
43. Lange, K.; Sinsheimer, J.S. Normal/independent distributions and their applications in robust regression. J. Comput. Graph. Stat.1993, 2, 175–198.
44. Melikov, A.K.; Ai, Z.T.; Markov, D.G. Intermittent occupancy combined with ventilation: An efficient strategy for the reduction ofairborne transmission indoors. Sci. Total Environ. 2020, 744, 140908. [CrossRef] [PubMed]
45. Qian, H.; Zheng, X. Ventilation control for airborne transmission of human exhaled bio-aerosols in buildings. J. Thorac. Dis. 2018,10 (Suppl. 19), S2295–S2304. [CrossRef] [PubMed]
46. Pease, L.F.; Wang, N.; Salsbury, T.I.; Underhill, R.M.; Flaherty, J.E.; Vlachokostas, A.; Kulkarni, G.; James, D.P. Investigation ofpotential aerosol transmission and infectivity of SARS-CoV-2 through central ventilation systems. Build. Environ. 2021, 197,107633. [CrossRef] [PubMed]
47. Tang, J.W.; Li, Y.; Eames, I.; Chan, P.K.; Ridgway, G.L. Factors involved in the aerosol transmission of infection and control ofventilation in healthcare premises. J. Hosp. Infect. 2006, 64, 100–114. [CrossRef]
48. Li, Y.; Leung, G.M.; Tang, J.W.; Yang, X.; Chao, C.Y.; Lin, J.Z.; Lu, J.W.; Nielsen, P.V.; Niu, J.; Qian, H.; et al. Role of ventilation inairborne transmission of infectious agents in the built environment—A multidisciplinary systematic review. Indoor Air 2007, 17,2–18. [CrossRef]
49. Persily, A. Ventilation Rates in Office Buildings. In Proceedings of the IAQ’89 Conference The Human Equation: Health andComfort, Lexington, MA, USA, 17–20 April 1989; pp. 128–136.
50. Clapp, P.W.; Sickbert-Bennett, E.E.; Samet, J.M.; Berntsen, J.; Zeman, K.L.; Anderson, D.J.; Weber, D.J.; Bennett, W.D.; US Centers forDisease Control and Prevention Epicenters Program. Prevention Epicenters, P.; Evaluation of Cloth Masks and Modified ProcedureMasks as Personal Protective Equipment for the Public During the COVID-19 Pandemic. JAMA Intern. Med. 2020, 1, 570.
Viruses 2021, 13, 2536 20 of 20
51. Sickbert-Bennett, E.E.; Samet, J.M.; Clapp, P.W.; Chen, H.; Berntsen, J.; Zeman, K.L.; Tong, H.; Weber, D.J.; Bennett, W.D. FiltrationEfficiency of Hospital Face Mask Alternatives Available for Use During the COVID-19 Pandemic. JAMA Intern. Med. 2020, 1,1607–1612. [CrossRef] [PubMed]
52. Verma, S.; Dhanak, M.; Frankenfield, J. Visualizing the effectiveness of face masks in obstructing respiratory jets. Phys. Fluids2020, 32, 061708. [CrossRef] [PubMed]
53. Van den Berg, P.; Schechter-Perkins, E.M.; Jack, R.S.; Epshtein, I.; Nelson, R.; Oster, E.; Branch-Elliman, W. Effectiveness of threeversus six feet of physical distancing for controlling spread of COVID-19 among primary and secondary students and staff: Aretrospective, state-wide cohort study. Clin. Infect. Dis. 2021, 16, 1871–1878. [CrossRef] [PubMed]
54. AAP COVID-19 Guidance for Safe Schools. Available online: https://services.aap.org/en/pages/2019-novel-coronavirus-covid-19-infections/clinical-guidance/covid-19-planning-considerations-return-to-in-person-education-in-schools/(accessed on 10 June 2021).
55. CDC Operational Strategy for K-12 Schools through Phased Prevention. Available online: https://www.cdc.gov/coronavirus/2019-ncov/community/schools-childcare/operation-strategy.html (accessed on 1 June 2021).
56. Gettings, J.; Czarnik, M.; Morris, E.; Haller, E.; Thompson-Paul, A.M.; Rasberry, C.; Lanzieri, T.M.; Smith-Grant, J.; Aholou, T.M.;Thomas, E.; et al. Mask Use and Ventilation Improvements to Reduce COVID-19 Incidence in Elementary Schools—Georgia,16 November–11 December 2020. MMWR Morb. Mortal. Wkly. Rep. 2021, 70, 779–784. [CrossRef] [PubMed]
57. Lynch, R.M.; Favata, E.; Gochfeld, M. Assess Ventilation When Determining Safe Distancing in Schools to Control COVID-19Transmission. Clin. Infect. Dis. 2021, 15, e1404–e1405. [CrossRef]
58. Park, S.; Choi, Y.; Song, D.; Kim, E.K. Natural ventilation strategy and related issues to prevent coronavirus disease 2019(COVID-19) airborne transmission in a school building. Sci. Total Environ. 2021, 789, 147764. [CrossRef]
59. Dai, H.; Zhao, B. Association of the infection probability of COVID-19 with ventilation rates in confined spaces. Build. Simul.2020, 4, 1–7. [CrossRef] [PubMed]
60. Gralton, J.; Tovey, E.; McLaws, M.L.; Rawlinson, W.D. The role of particle size in aerosolised pathogen transmission: A review. J.Infect. 2011, 62, 1–13. [CrossRef]
61. Fennelly, K.P. Particle sizes of infectious aerosols: Implications for infection control. Lancet Respir. Med. 2020, 8, 914–924.[CrossRef]
62. Han, Z.; To, G.N.; Fu, S.C.; Chao, C.Y.; Weng, W.; Huang, Q. Effect of human movement on airborne disease transmission inan airplane cabin: Study using numerical modeling and quantitative risk analysis. BMC Infect. Dis. 2014, 14, 434. [CrossRef][PubMed]
63. Poussou, S.B.; Mazumdar, S.; Plesniak, M.W.; Sojka, P.E.; Chen, Q. Flow and contaminant transport in an airliner cabin inducedby a moving body: Model experiments and CFD predictions. Atmos. Environ. 2010, 44, 2830–2839. [CrossRef]
64. Duill, F.; Schulz, F.; Jain, A.; Krieger, L.; Wachem, B.; Beyrau, F. The impact of large mobile air purifiers on aerosol concentrationin classrooms and the reduction of airborne transmission of SARS-CoV-2. Int. J. Environ. Res. Public Health 2021, 18, 11523.[CrossRef] [PubMed]