Using channel-specific statistical models to detect reverberation in cochlear implant stimuli
9
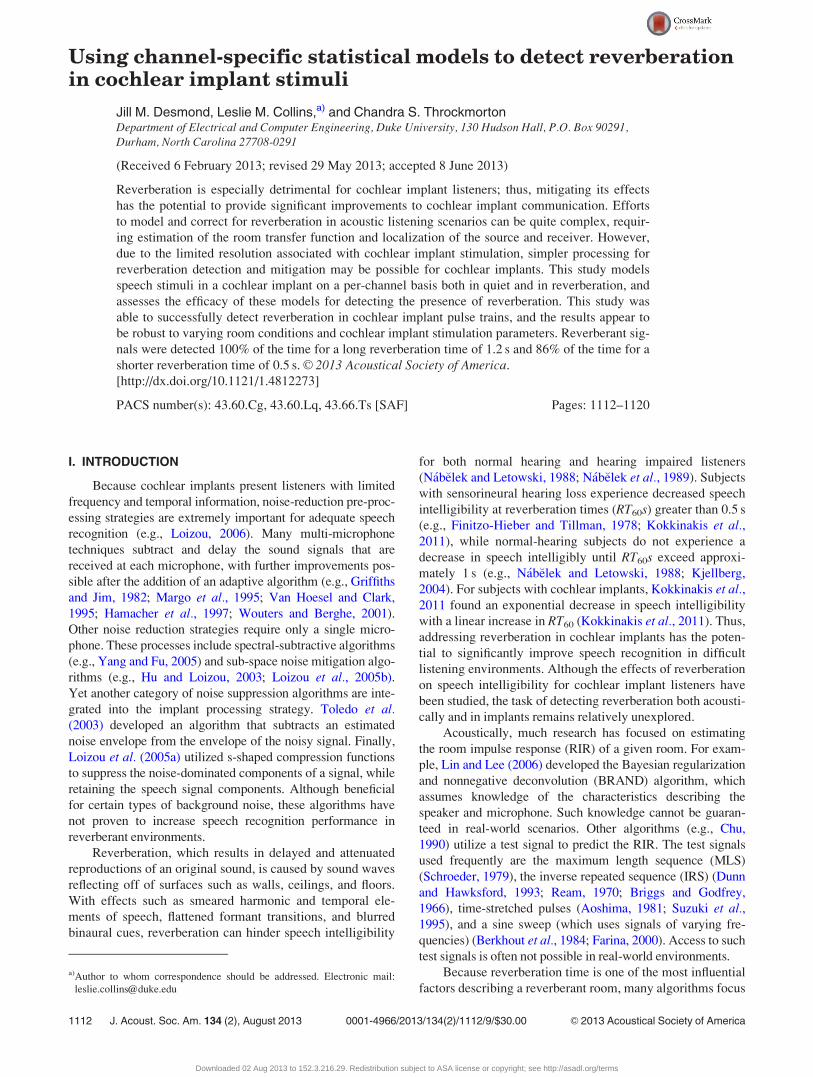
Using channel-specific statistical models to detect reverberation in cochlear implant stimuli Jill M. Desmond, Leslie M. Collins, a) and Chandra S. Throckmorton Department of Electrical and Computer Engineering, Duke University, 130 Hudson Hall, P.O. Box 90291, Durham, North Carolina 27708-0291 (Received 6 February 2013; revised 29 May 2013; accepted 8 June 2013) Reverberation is especially detrimental for cochlear implant listeners; thus, mitigating its effects has the potential to provide significant improvements to cochlear implant communication. Efforts to model and correct for reverberation in acoustic listening scenarios can be quite complex, requir- ing estimation of the room transfer function and localization of the source and receiver. However, due to the limited resolution associated with cochlear implant stimulation, simpler processing for reverberation detection and mitigation may be possible for cochlear implants. This study models speech stimuli in a cochlear implant on a per-channel basis both in quiet and in reverberation, and assesses the efficacy of these models for detecting the presence of reverberation. This study was able to successfully detect reverberation in cochlear implant pulse trains, and the results appear to be robust to varying room conditions and cochlear implant stimulation parameters. Reverberant sig- nals were detected 100% of the time for a long reverberation time of 1.2 s and 86% of the time for a shorter reverberation time of 0.5 s. V C 2013 Acoustical Society of America. [http://dx.doi.org/10.1121/1.4812273] PACS number(s): 43.60.Cg, 43.60.Lq, 43.66.Ts [SAF] Pages: 1112–1120 I. INTRODUCTION Because cochlear implants present listeners with limited frequency and temporal information, noise-reduction pre-proc- essing strategies are extremely important for adequate speech recognition (e.g., Loizou, 2006). Many multi-microphone techniques subtract and delay the sound signals that are received at each microphone, with further improvements pos- sible after the addition of an adaptive algorithm (e.g., Griffiths and Jim, 1982; Margo et al., 1995; Van Hoesel and Clark, 1995; Hamacher et al., 1997; Wouters and Berghe, 2001). Other noise reduction strategies require only a single micro- phone. These processes include spectral-subtractive algorithms (e.g., Yang and Fu, 2005) and sub-space noise mitigation algo- rithms (e.g., Hu and Loizou, 2003; Loizou et al., 2005b). Yet another category of noise suppression algorithms are inte- grated into the implant processing strategy. Toledo et al. (2003) developed an algorithm that subtracts an estimated noise envelope from the envelope of the noisy signal. Finally, Loizou et al. (2005a) utilized s-shaped compression functions to suppress the noise-dominated components of a signal, while retaining the speech signal components. Although beneficial for certain types of background noise, these algorithms have not proven to increase speech recognition performance in reverberant environments. Reverberation, which results in delayed and attenuated reproductions of an original sound, is caused by sound waves reflecting off of surfaces such as walls, ceilings, and floors. With effects such as smeared harmonic and temporal ele- ments of speech, flattened formant transitions, and blurred binaural cues, reverberation can hinder speech intelligibility for both normal hearing and hearing impaired listeners (N ab elek and Letowski, 1988; N ab elek et al., 1989). Subjects with sensorineural hearing loss experience decreased speech intelligibility at reverberation times (RT 60 s) greater than 0.5 s (e.g., Finitzo-Hieber and Tillman, 1978; Kokkinakis et al., 2011), while normal-hearing subjects do not experience a decrease in speech intelligibly until RT 60 s exceed approxi- mately 1 s (e.g., N ab elek and Letowski, 1988; Kjellberg, 2004). For subjects with cochlear implants, Kokkinakis et al., 2011 found an exponential decrease in speech intelligibility with a linear increase in RT 60 (Kokkinakis et al., 2011). Thus, addressing reverberation in cochlear implants has the poten- tial to significantly improve speech recognition in difficult listening environments. Although the effects of reverberation on speech intelligibility for cochlear implant listeners have been studied, the task of detecting reverberation both acousti- cally and in implants remains relatively unexplored. Acoustically, much research has focused on estimating the room impulse response (RIR) of a given room. For exam- ple, Lin and Lee (2006) developed the Bayesian regularization and nonnegative deconvolution (BRAND) algorithm, which assumes knowledge of the characteristics describing the speaker and microphone. Such knowledge cannot be guaran- teed in real-world scenarios. Other algorithms (e.g., Chu, 1990) utilize a test signal to predict the RIR. The test signals used frequently are the maximum length sequence (MLS) (Schroeder, 1979), the inverse repeated sequence (IRS) (Dunn and Hawksford, 1993; Ream, 1970; Briggs and Godfrey, 1966), time-stretched pulses (Aoshima, 1981; Suzuki et al., 1995), and a sine sweep (which uses signals of varying fre- quencies) (Berkhout et al., 1984; Farina, 2000). Access to such test signals is often not possible in real-world environments. Because reverberation time is one of the most influential factors describing a reverberant room, many algorithms focus a) Author to whom correspondence should be addressed. Electronic mail: [email protected] 1112 J. Acoust. Soc. Am. 134 (2), August 2013 0001-4966/2013/134(2)/1112/9/$30.00 V C 2013 Acoustical Society of America Downloaded 02 Aug 2013 to 152.3.216.29. Redistribution subject to ASA license or copyright; see http://asadl.org/terms
Transcript of Using channel-specific statistical models to detect reverberation in cochlear implant stimuli
Using channel-specific statistical models to detect reverberationin cochlear implant stimuli
Jill M. Desmond, Leslie M. Collins,a) and Chandra S. ThrockmortonDepartment of Electrical and Computer Engineering, Duke University, 130 Hudson Hall, P.O. Box 90291,Durham, North Carolina 27708-0291
(Received 6 February 2013; revised 29 May 2013; accepted 8 June 2013)
Reverberation is especially detrimental for cochlear implant listeners; thus, mitigating its effects
has the potential to provide significant improvements to cochlear implant communication. Efforts
to model and correct for reverberation in acoustic listening scenarios can be quite complex, requir-
ing estimation of the room transfer function and localization of the source and receiver. However,
due to the limited resolution associated with cochlear implant stimulation, simpler processing for
reverberation detection and mitigation may be possible for cochlear implants. This study models
speech stimuli in a cochlear implant on a per-channel basis both in quiet and in reverberation, and
assesses the efficacy of these models for detecting the presence of reverberation. This study was
able to successfully detect reverberation in cochlear implant pulse trains, and the results appear to
be robust to varying room conditions and cochlear implant stimulation parameters. Reverberant sig-
nals were detected 100% of the time for a long reverberation time of 1.2 s and 86% of the time for a
shorter reverberation time of 0.5 s. VC 2013 Acoustical Society of America.
[http://dx.doi.org/10.1121/1.4812273]
PACS number(s): 43.60.Cg, 43.60.Lq, 43.66.Ts [SAF] Pages: 1112–1120
I. INTRODUCTION
Because cochlear implants present listeners with limited
frequency and temporal information, noise-reduction pre-proc-
essing strategies are extremely important for adequate speech
recognition (e.g., Loizou, 2006). Many multi-microphone
techniques subtract and delay the sound signals that are
received at each microphone, with further improvements pos-
sible after the addition of an adaptive algorithm (e.g., Griffiths
and Jim, 1982; Margo et al., 1995; Van Hoesel and Clark,
1995; Hamacher et al., 1997; Wouters and Berghe, 2001).
Other noise reduction strategies require only a single micro-
phone. These processes include spectral-subtractive algorithms
(e.g., Yang and Fu, 2005) and sub-space noise mitigation algo-
rithms (e.g., Hu and Loizou, 2003; Loizou et al., 2005b).
Yet another category of noise suppression algorithms are inte-
grated into the implant processing strategy. Toledo et al.(2003) developed an algorithm that subtracts an estimated
noise envelope from the envelope of the noisy signal. Finally,
Loizou et al. (2005a) utilized s-shaped compression functions
to suppress the noise-dominated components of a signal, while
retaining the speech signal components. Although beneficial
for certain types of background noise, these algorithms have
not proven to increase speech recognition performance in
reverberant environments.
Reverberation, which results in delayed and attenuated
reproductions of an original sound, is caused by sound waves
reflecting off of surfaces such as walls, ceilings, and floors.
With effects such as smeared harmonic and temporal ele-
ments of speech, flattened formant transitions, and blurred
binaural cues, reverberation can hinder speech intelligibility
for both normal hearing and hearing impaired listeners
(N�ab�elek and Letowski, 1988; N�ab�elek et al., 1989). Subjects
with sensorineural hearing loss experience decreased speech
intelligibility at reverberation times (RT60s) greater than 0.5 s
(e.g., Finitzo-Hieber and Tillman, 1978; Kokkinakis et al.,2011), while normal-hearing subjects do not experience a
decrease in speech intelligibly until RT60s exceed approxi-
mately 1 s (e.g., N�ab�elek and Letowski, 1988; Kjellberg,
2004). For subjects with cochlear implants, Kokkinakis et al.,2011 found an exponential decrease in speech intelligibility
with a linear increase in RT60 (Kokkinakis et al., 2011). Thus,
addressing reverberation in cochlear implants has the poten-
tial to significantly improve speech recognition in difficult
listening environments. Although the effects of reverberation
on speech intelligibility for cochlear implant listeners have
been studied, the task of detecting reverberation both acousti-
cally and in implants remains relatively unexplored.
Acoustically, much research has focused on estimating
the room impulse response (RIR) of a given room. For exam-
ple, Lin and Lee (2006) developed the Bayesian regularization
and nonnegative deconvolution (BRAND) algorithm, which
assumes knowledge of the characteristics describing the
speaker and microphone. Such knowledge cannot be guaran-
teed in real-world scenarios. Other algorithms (e.g., Chu,
1990) utilize a test signal to predict the RIR. The test signals
used frequently are the maximum length sequence (MLS)
(Schroeder, 1979), the inverse repeated sequence (IRS) (Dunn
and Hawksford, 1993; Ream, 1970; Briggs and Godfrey,
1966), time-stretched pulses (Aoshima, 1981; Suzuki et al.,1995), and a sine sweep (which uses signals of varying fre-
quencies) (Berkhout et al., 1984; Farina, 2000). Access to such
test signals is often not possible in real-world environments.
Because reverberation time is one of the most influential
factors describing a reverberant room, many algorithms focus
a)Author to whom correspondence should be addressed. Electronic mail:
1112 J. Acoust. Soc. Am. 134 (2), August 2013 0001-4966/2013/134(2)/1112/9/$30.00 VC 2013 Acoustical Society of America
Downloaded 02 Aug 2013 to 152.3.216.29. Redistribution subject to ASA license or copyright; see http://asadl.org/terms

on estimating this single parameter. A study conducted by
Keshavarz et al. (2012) successfully estimates the reverbera-
tion time of a signal received by a microphone, using the lin-
ear predictive residuals and a maximum likelihood estimator.
Other acoustic methods for estimating the reverberation time
measure the rate of decay after switching off a test signal
(e.g., Schroeder, 1965). As previously mentioned, test signals
are not present in everyday situations, resulting in challeng-
ing real-time implementations. Additional methods have
been developed to determine the reverberation time, but
many experience sensitivities to certain parameters. For
example, Wu and Wang (2006) estimates the RT60 value by
utilizing a signal’s periodicity, but the algorithm is not robust
to gender. Another reverberation time estimator, developed
by Unoki and Hiramatsu (2008), estimates the power of a sig-
nal’s envelope, but this algorithm is too complex to be imple-
mented in a real-time system. Wen et al. (2008) developed a
reverberation time estimation algorithm which utilizes a
time-frequency decay model. However, for this algorithm to
be implemented both a long speech sample and speech origi-
nating after a pause are required. Neither of these require-
ments are guaranteed in real-time situations. Yet another
algorithm, developed by Ratnam et al. (2004), suffers when
background noise is present.
The current study aims to detect the presence of rever-
beration, rather than estimating the reverberation time specif-
ically. In many aspects, the cochlear implant pulse train is
much less complex than the corresponding acoustic signal,
and this study utilizes the simplified signal to detect reverber-
ation. The limited information that is provided to the device
is hypothesized to be relatively insensitive to reverberation
condition changes such as head location and room dynamics,
potentially allowing one detector for a variety of room con-
figurations. Although parameters such as reverberation time
are expected to affect classifier performance, the detection
algorithms aim to operate on reverberant speech without
prior knowledge of characteristics such as reverberation
time, room dimensions, and source and microphone posi-
tions. Knowledge of the specific characteristics of the RIR is
not required because the detector is being developed as a
first step towards controlling the use of a reverberation miti-
gation algorithm. The mitigation algorithm, when completed,
will be responsible not only for removing the effects of rever-
beration from the pulse train, but also for estimating the pa-
rameters that are necessary for successful mitigation. A
reverberation detection algorithm would be beneficial to the
cochlear implant community because it would enable the
reverberation mitigation algorithm to be specifically tailored
to reverberant speech. The reverberation mitigation algo-
rithm will most likely perform imperfectly, and it may detri-
mentally affect the processing of quiet speech. To reduce the
algorithm’s effect on non-reverberant stimuli, this study aims
to detect reverberation such that the mitigation algorithm will
be initiated only when necessary.
To complete the goal of reverberation detection, reverber-
ation associated with various room conditions will be added to
speech. These reverberant signals will be processed according
to a cochlear implant speech processing strategy. Next, statisti-
cal models will be developed for speech in quiet and in
reverberation, as well as in other noise conditions. Finally,
classifiers will be applied to these signals, and their perform-
ance will be evaluated for the detection of reverberation.
II. METHODS
A. Reverberation room model
In order to simulate reverberation effects on an acoustic
signal, room impulse responses (RIRs) for predefined rooms
were calculated using the modified image source method
(modified ISM), created by Lehmann and Johansson (2008)
[based on the original ISM technique created by Allen and
Berkley (1979)]. In the original ISM technique, the power of
the transfer function from the source to the microphone is
calculated as the sum of the power from various image sour-
ces distributed around the receiver. These image sources
exist on a grid of “mirror rooms” that extend infinitely in all
directions. The modified ISM technique alters the original
technique by operating in the frequency domain, allowing
time delays that are not necessarily multiples of the sampling
rate. The modified ISM technique also utilizes the negative
definition of the reflection coefficient, defined as b in the
equation b ¼ 6ffiffiffiffiffiffiffiffiffiffiffiffi
1� a;p
where a represents the absorption
coefficient. Using the negative definition of the reflection
coefficient results in more accurate RIRs when the calcula-
tions are completed in the frequency domain (Allen and
Berkley, 1979; Lehmann and Johansson, 2008). The use of
simulated RIRs allowed this study to work with various
combinations of RT60s, room dimensions, and source and
microphone locations.
B. Modeling speech in cochlear implant pulse trains:Feature development
The ultimate goal of this study is to detect reverberation
in the signals that compose cochlear implant pulse trains. To
ensure that the algorithm is not simply detecting a change
from quiet, speech was classified according to four condi-
tions: speech in quiet, speech in white Gaussian noise
(WGN), speech in speech shaped noise (SSN, noise that dem-
onstrates the frequency characteristics of a long-term speech
signal), and speech in reverberation. This study utilized
sentences from the TIMIT database, created by Texas
Instruments (TI) and the Massachusetts Institute of
Technology (MIT) (Lamel et al., 1986). The sentences were
either left unaltered (existing in quiet), or were corrupted
with 3–15 dB SNR (in increments of 2 dB) of SSN, 3–15 dB
SNR (in increments of 2 dB) of WGN, or reverberation with
a reverberation time of 0.4–1.6 s (in increments of 0.2 s). For
this portion of the experiment, parameters were varied uni-
formly. SSN was created in MATLABVR
using a 78th order finite
impulse response (FIR) filter (Nilsson et al., 1994) with coef-
ficients derived from an SSN sample supplied by the House
Ear Institute. WGN was created by randomly generating sam-
ples from a normal distribution in MATLABVR
. Once generated,
different instances of SSN and WGN were added to different
TIMIT sentences. To simulate reverberation, RIRs were cre-
ated using a MATLABVR
implementation of the modified
ISM technique, provided by Lehmann and Johansson, 2008.
J. Acoust. Soc. Am., Vol. 134, No. 2, August 2013 Desmond et al.: Detecting reverberation in cochlear implants 1113
Downloaded 02 Aug 2013 to 152.3.216.29. Redistribution subject to ASA license or copyright; see http://asadl.org/terms

To create the reverberant signals, the RIRs were convolved
with the TIMIT sentences, via multiplication in the frequency
domain.
Prior to modeling speech, the quiet and noisy tokens
were processed according to the advanced combination
encoder (ACE) processing strategy (e.g., Vandali et al.,2005), which results in signals divided into as many as 22
frequency bins. However, the process was halted prior to
maxima selection, such that the stimuli from all active chan-
nels were utilized in the detection process. Additionally, the
stimuli used for classification were not yet scaled to be within
a subject-specific dynamic range. Therefore, this reverbera-
tion detection algorithm is independent of a given subjects’
thresholds, maximum comfortable levels, and the number of
stimuli within a given time window selected for stimulation.
To differentiate the noise conditions, activity was mod-
eled in the frequency regions using the timing between
pulses, or the inter-stimulus intervals (ISIs), and the
stimulation-lengths of each channel, or the duration in ms
over which each channel remained active (was “on”), in the
ACE-generated frequency-time matrices. If a given channel
was strongly affected by noise, that channel would experi-
ence increased activity and the ISIs should decrease. (ISIs
that are shorter correspond to channels that are more active,
as these channels do not remain off for substantial amounts
of time.) On the other hand, the stimulation-length distribu-
tions, which are expected to be negatively correlated with
the ISI distributions, experience increased values in locations
of increased activity. The number of stimuli in a given
frequency channel were assumed to follow a Poisson distri-
bution; therefore the probabilities of both features were mod-
eled as geometric distributions.
The aforementioned features were selected with the
assumption that different scenarios would result in different
activation patterns. SSN is concentrated in the frequency
regions associated with speech; therefore it was hypothe-
sized that its presence would increase the amount of activity
in the lower frequency regions. WGN, on the other hand, is
equally distributed across all frequencies. However, because
the channels in a cochlear implant array are assigned to fre-
quency bins logarithmically to mimic the arrangement in the
cochlea, the high frequency channels cover a wider range of
frequencies, and would thus be expected to contain more ac-
tivity resulting from the addition of WGN. Finally reverbera-
tion, which consists of delayed and attenuated versions of
the original signal, experiences excitation trends similar to
quiet speech. However, as more versions of the original
stimuli are present in the reverberant speech, it is expected
that more activity would exist in the channels associated
with quiet speech.
To demonstrate the differences in activation, Fig. 1 dis-
plays normalized histograms of the ISIs for a high frequency
channel (left column) and a low frequency channel (right
column). These histograms were created using all sentences
from the TIMIT database for speech in quiet (top row), as
well as speech with an SNR of 0 dB of either SSN (second
row) or WGN (third row), and reverberation with an RT60 of
1.2 s (bottom row). As expected, SSN increases activity
(decreases ISIs, resulting in more ISI values closer to zero)
in the speech-related low frequency regions, WGN increases
activity in the high frequency channels, and reverberant
speech experiences trends similar to quiet speech, with
slightly shorter ISIs overall due to the presence of additional
reverberant stimuli.
The normalized histograms corresponding to the
stimulation-lengths for a high frequency channel and a low
frequency channel can be seen in Fig. 2. (Note the y axis is
scaled between 0 and 0.5). Because these features are
expected to be negatively correlated with the aforementioned
ISI distributions, which modeled the duration during which
each channel remained “off,” the trends of the two models
are expected to oppose each other. This is strongly evident
for the low frequency channel in SSN (row 2, column 2), in
which the sharp ISI distribution becomes a smeared
stimulation-length distribution. The same effect is apparent
for the high frequency channel in WGN (row 3, column 1).
Although the two features are related, including the
stimulation-length models improved the performance of the
classifiers, indicating that some independent information is
present in both models.
C. Classification algorithms
In an effort to detect reverberation in cochlear implant
stimulation patterns, statistical classification algorithms were
applied to the channel-specific models outlined in Sec. II B.
Specifically, the p-values that describe the geometric distri-
butions fit to each channel’s ISI and stimulation-length data
were used to describe the speech models. Features were all
processed to have zero mean and unit variance prior to
classification.
This study considered two classifiers: a maximum a poste-
riori (MAP) classifier (e.g., Bishop, 2006) and a kernel-based
classifier (relevance vector machine, RVM) (Tipping, 2001).
FIG. 1. (Color online) Normalized histograms of the ISIs for a high fre-
quency channel (left column) and a low frequency channel (right column)
for speech in quiet (top row), SSN (second row), WGN (third row), and
reverberation (bottom row).
1114 J. Acoust. Soc. Am., Vol. 134, No. 2, August 2013 Desmond et al.: Detecting reverberation in cochlear implants
Downloaded 02 Aug 2013 to 152.3.216.29. Redistribution subject to ASA license or copyright; see http://asadl.org/terms

The MAP classifier selects the hypothesis that results in the
maximum posterior distribution given the features. A multivar-
iate normal distribution was assumed to describe the features
within each class, and the mean and covariance matrices were
estimated using a maximum likelihood estimate. The RVM
classifier, on the other hand, places kernel functions at the
locations of the training data points and removes or “prunes”
some of the kernel functions to create sparsity. The kernels
used for the RVM were Gaussian radial basis functions of
width one, with the addition of DC kernels to account for any
offsets in the data. Tenfold cross-validation was used through-
out training and testing.
The two classifiers were selected in order to test a gener-
alized classifier (MAP) and a customized classifier (RVM).
The MAP classifier assumes that the features can be described
with a multivariate normal distribution. Although this could
allow the classifier to be more flexible when presented with
varying training and testing data, the model may suffer if the
features do not fit the assumed distribution. The RVM, on the
other hand, was selected because its use of kernel functions
placed at the feature locations results in a more precise distri-
bution describing the data. Provided that the training and the
testing data do not vary a great deal, the precision provided by
the kernel functions in the RVM may be beneficial.
III. REVERBERATION DETECTION EXPERIMENT
The classifiers were first tested using general cochlear
implant parameters with a pulse rate of 800 pulses per sec-
ond (pps) and 22 active channels. The speech samples were
created in quiet or with the addition of either SSN, WGN,
or reverberation. The SNR of the SSN and WGN varied
from 3 to 15 dB, in intervals of 2 dB, and reverberation con-
tained an RT60 that varied between 0.4 and 1.6 s, in intervals
of 0.2 s. The RIRs were created with room dimensions set
to (10.0� 6.6� 3.0)m, a source location of (2.4835� 2.0
� 1.8)m, and a microphone positioned at (6.5� 3.8� 1.8)m,
as seen in Champagne et al., 1996.
To apply cross-validation to the data, the resulting sen-
tences were divided into 10 groups, or folds, and each noise
condition was approximately equally represented in each
fold. During one iteration, nine of the folds were presented
to the algorithms as training data, and the remaining fold
was reserved to test the algorithms’ performances. The pro-
cess was completed ten times, with each fold acting as the
testing data in one iteration. The results were scored for ac-
curacy based on the labels estimated by the classifiers and
the known class labels.
The classification results generated by the MAP classi-
fier are shown in a confusion matrix in the left subplot of
Fig. 3, while the RVM results are shown in the right subplot.
In a confusion matrix, rows represent the correct classifica-
tion categories (from top to bottom: speech in quiet, speech
in SSN, speech in WGN, and speech containing reverbera-
tion), while the columns represent the classification catego-
ries assigned by the classifier (from left to right: speech in
quiet, speech in SSN, speech in WGN, and speech contain-
ing reverberation). Correct classifications are displayed, in
percent correct, across the diagonal of the figure, while
incorrect classifications are displayed in the remaining
squares. As seen in Fig. 3, reverberation was detected using
the MAP classifier 91.7% of the time it was present, and the
classifier had an overall detection accuracy of 91.14% across
all signal classes. Using the RVM, reverberation was cor-
rectly identified 96.2% of the time it was present, with an
overall accuracy across all signal categories of 91.48%.
Performance for the two classifiers was similar, and detec-
tion of reverberation was not overly confused with other
noise types. Discrimination was good using the ISI and
FIG. 2. (Color online) Normalized histograms of the stimulation-lengths for
a high frequency channel (left column) and a low frequency channel (right
column) for speech in quiet (top row), SSN (second row), WGN (third row),
and reverberation (bottom row).
FIG. 3. Confusion matrix displaying the
MAP classification results (left) and
RVM classification results (right) for
reverberant data created with RT60 vary-
ing between 0.4 and 1.6 s, and room
dimensions set to (10.0� 6.6� 3.0)m,
source location set to (2.4835� 2.0
� 1.8)m, and microphone position set to
(6.5� 3.8� 1.8)m, as seen in
Champagne et al., 1996.
J. Acoust. Soc. Am., Vol. 134, No. 2, August 2013 Desmond et al.: Detecting reverberation in cochlear implants 1115
Downloaded 02 Aug 2013 to 152.3.216.29. Redistribution subject to ASA license or copyright; see http://asadl.org/terms
stimulation-length features under the specific listening con-
ditions presented. However, in this section many of the
reverberation parameters were fixed, meaning that the room
characteristics were assumed known.
In the real-world, other parameters such as the room
dimensions and source and microphone locations would be
unknown. Therefore, the next set of experiments looked at
the performance given different room parameters.
IV. SENSITIVITY ANALYSIS
In order to ensure that the reverberation detection algo-
rithms presented could be generalized across subjects and
room conditions, a sensitivity analysis was conducted. Initially,
the implant subjects’ stimulation parameters, such as number
of active channels, stimulation rate, and implant type, were ran-
domly varied and the detection algorithms’ performances were
studied. Next, the parameters describing the reverberant rooms
(the reverberation time, room dimensions, microphone posi-
tion, and source position) were randomly varied and the detec-
tion algorithms’ robustness was analyzed. Finally, each room
variable was adjusted separately to study its impact on the
detection algorithms’ performances.
A. Robustness to subject clinical program parameters
Cochlear implant listeners each have unique parameters
driving the generation of their stimulation pulse trains. Some
parameters, such as the subjects’ dynamic ranges and the
number of channels stimulated per time window, could not
affect the reverberation detection algorithms, as the implant
pulse train was considered before these variables were
applied to the stimulation patterns. Other parameters alter
the signal presented to the classifiers, and could therefore
affect performance. These parameters include the set of
channels, the channel stimulation rate, and the equation map-
ping current in lA to cochlear implant current steps [see
Eqs. (1) and (2)]. Current steps are units utilized by Cochlear
Corporation to define the amount of current presented to the
electrodes, and they are represented by CL in Eqs. (1) and
(2). To test the algorithms’ sensitivity to different clinical
parameters, 100 sets of common parameters were created
with randomly varying values. Between 18 and 22 channels
were randomly selected (the number of channels and the
channels themselves were selected at random), the channel
stimulation rate was randomly set between 500 and 1200 pps
(in increments of 100 pps), and the current-mapping equation
was randomly selected. Because the values were varied
randomly, duplicate sets of parameters may exist. Each
resulting set of parameters was used to process all sentences
in the TIMIT database, and the reverberation detection algo-
rithms were run using 10-fold cross-validation for each pa-
rameter set separately. Results were compared to the original
results presented in Fig. 3, in which 22 channels were used,
the stimulation rate was 800 pps, and Eq. (2) was used to
map the current in lA to current steps.
IðlAÞ ¼ 10eCL�lnð175Þ=255; (1)
IðlAÞ ¼ 17:5 � 100CL=255: (2)
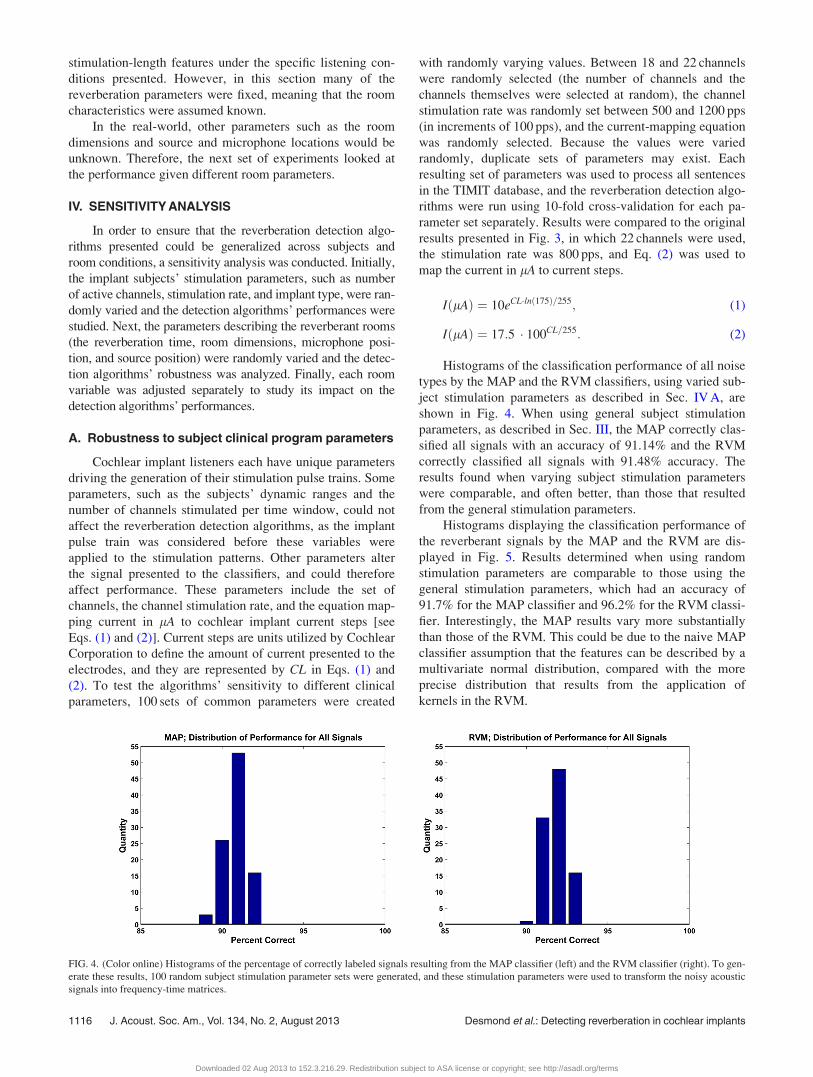
Histograms of the classification performance of all noise
types by the MAP and the RVM classifiers, using varied sub-
ject stimulation parameters as described in Sec. IV A, are
shown in Fig. 4. When using general subject stimulation
parameters, as described in Sec. III, the MAP correctly clas-
sified all signals with an accuracy of 91.14% and the RVM
correctly classified all signals with 91.48% accuracy. The
results found when varying subject stimulation parameters
were comparable, and often better, than those that resulted
from the general stimulation parameters.
Histograms displaying the classification performance of
the reverberant signals by the MAP and the RVM are dis-
played in Fig. 5. Results determined when using random
stimulation parameters are comparable to those using the
general stimulation parameters, which had an accuracy of
91.7% for the MAP classifier and 96.2% for the RVM classi-
fier. Interestingly, the MAP results vary more substantially
than those of the RVM. This could be due to the naive MAP
classifier assumption that the features can be described by a
multivariate normal distribution, compared with the more
precise distribution that results from the application of
kernels in the RVM.
FIG. 4. (Color online) Histograms of the percentage of correctly labeled signals resulting from the MAP classifier (left) and the RVM classifier (right). To gen-
erate these results, 100 random subject stimulation parameter sets were generated, and these stimulation parameters were used to transform the noisy acoustic
signals into frequency-time matrices.
1116 J. Acoust. Soc. Am., Vol. 134, No. 2, August 2013 Desmond et al.: Detecting reverberation in cochlear implants
Downloaded 02 Aug 2013 to 152.3.216.29. Redistribution subject to ASA license or copyright; see http://asadl.org/terms

As Figs. 4 and 5 demonstrate, performance does not suf-
fer when signals are generated using varying cochlear
implant subject parameters. These results suggest that the
reverberation detection algorithms are, in fact, robust to
varying stimulation parameters and that the detection algo-
rithms would not necessarily need to be tuned on a subject
by subject basis.
B. Robustness to room configurations
To test the algorithms’ robustness to changing room
configurations, the parameters used to generate the RIRs
were varied randomly. Initially, as will be discussed in Sec.
IV B 1, the room dimensions, source and microphone posi-
tions, and RT60 were all varied. Next, to test the impact of
each parameter on the classification algorithms, various sce-
narios were created in which each parameter was set to a
constant while the remaining parameters remained random.
Varying the reverberation parameters introduces an
increased level of difficulty into the classification problem.
To ensure that enough data was present to offset this
increased challenge, three sentences from the TIMIT data-
base were concatenated for each training and testing speech
token in the following sections. Note that including addi-
tional sentences in each training and testing point results in
classifications that cannot be directly compared with those
reported previously. Using 10-fold cross-validation and
concatenated sentences, 675 training sentence groups and
75 testing groups were presented to the classifiers in each
fold, and there was no overlap between training and testing
sentences. Classifications from all folds were concatenated
to produce the final results.
1. Varying all parameters
Room dimensions were varied between (2� 2� 2)m
and (50� 50� 50)m (length and width were constrained to
be within a factor of 2 of each other, and the height did not
exceed twice the length or width, in an effort to create realis-
tic room configurations). Additionally, the source and the
microphone were randomly positioned within the dimen-
sions of the room, and the RT60 value was varied between
0.4 s and 1.6 s, in increments of 0.2 s.
The confusion matrix that resulted from the application
of the MAP classifier to this data is shown in the left column
of Fig. 6. Reverberation was correctly detected in 93.7% of
the signals in which it was present, and the classifier had an
overall accuracy of 90.48%. The RVM (right, Fig. 6), on the
other hand, was not as successful at detecting reverberation
when all parameters were varied, resulting in an 86.8% accu-
racy. However, the parameters controlling the RVM, such as
the radial basis functions selected to describe the kernel
functions, were not optimized and it is possible that with
post hoc optimization, the performance difference would be
minimized. The advantage of the MAP is that parameters do
not require optimization.
FIG. 5. (Color online) Histograms of the percentage of correctly labeled reverberant signals resulting from the MAP classifier (left) and the RVM classifier
(right). The classifiers were used to detect reverberation in the frequency-time matrices that resulted from cochlear-implant-processing with 100 randomly gen-
erated subject stimulation parameters.
FIG. 6. Confusion matrix resulting
from the application of the MAP clas-
sifier (left) and the RVM classifier
(right) to reverberant conditions in
which the room dimensions varied
from (2� 2� 2)m to (50� 50� 50)m,
the source and microphone locations
were randomly assigned within the
given room, and RT60 varied from 0.4
to 1.6 s.
J. Acoust. Soc. Am., Vol. 134, No. 2, August 2013 Desmond et al.: Detecting reverberation in cochlear implants 1117
Downloaded 02 Aug 2013 to 152.3.216.29. Redistribution subject to ASA license or copyright; see http://asadl.org/terms

2. Impact of each parameter on classification
The impact of reverberation time was explored by
applying the RVM and MAP classifiers to data in which
RT60 was held constant while the remaining parameters were
varied as described in Sec. IV B 1. RT60 was set to either
0.5 or 1.2 s, to test a relatively low and a relatively high level
of reverberation. The classification resulting from an RT60 of
0.5 s is presented in the top row of Fig. 7. The low RT60
results in notably worse performance than seen previously,
with the MAP classifier correctly detecting reverberation in
85.7% of signals (left), and the RVM correctly detecting
reverberation in 72.5% of signals (right). Reverberation with
a high RT60 of 1.2 s, however, resulted in very good perform-
ance from both the MAP and RVM classifiers, as can be
seen in the second row of Fig. 7. The difference in detection
accuracy between the low and high reverberation times sug-
gests that the RT60 value has a large impact on detection
performance.
Next, the room dimensions were fixed to
(10.0� 6.6� 3.0)m, as used by Champagne et al., 1996
while the remaining parameters were varied as outlined in
Sec. IV B 1. The results are shown in the third row of Fig. 7.
Performance improved over varying all room parameters,
shown in Fig. 6. The improvement in performance resulting
from fixing the room dimensions suggests that knowledge of
the room layout improves the accuracy of the reverberation
detectors. Fixing the microphone position (row 4, Fig. 7),
however, had little benefit compared to varying all room pa-
rameters (Fig. 6). Similarly, fixing the source position had
little impact on performance (row 5, Fig. 7). Although
microphone and source position are known to affect the
room impulse response, their impact appears to be reduced
when considering cochlear implant pulse train stimuli.
V. PERFORMANCE IN THE PRESENCE OF COMBINEDREVERBERATION AND NOISE
Because real-world listening environments often contain
additional noise in the presence of reverberation, this study
investigated the classification performance when either SSN
or WGN was added to speech signals prior to the addition of
reverberation. Speech signals were grouped into three cate-
gories: quiet speech, noisy speech, or noisy speech in the
presence of reverberation. Speech tokens for all three catego-
ries consisted of three concatenated sentences from the
TIMIT database. To generate the speech samples for
the “noisy speech” category, WGN or SSN with SNRs in the
FIG. 7. Confusion matrices resulting
from the application of the MAP clas-
sifier (left column) and the RVM clas-
sifier (right column) to data in which
reverberant signals were created with
RT60 set to 0.5 s (top row), RT60 set to
1.2 s (second row), room dimensions
set to (10.0� 6.6� 3.0)m, as used by
Champagne et al., 1996 (third row),
microphone location fixed at the center
of the room (fourth row), and source
location fixed at the room’s center
(fifth row).
1118 J. Acoust. Soc. Am., Vol. 134, No. 2, August 2013 Desmond et al.: Detecting reverberation in cochlear implants
Downloaded 02 Aug 2013 to 152.3.216.29. Redistribution subject to ASA license or copyright; see http://asadl.org/terms
range of 3–15 dB (in increments of 2 dB) was added to the
quiet speech samples. Speech samples for the “noisy speech
in the presence of reverberation” category were created by
introducing 3–15 dB SNR (in increments of 2 dB) of either
SSN or WGN to the quiet tokens, followed by the applica-
tion of reverberation with randomized room characteristics.
Reverberation parameters were allowed to vary as previously
mentioned in Sec. IV B 1.
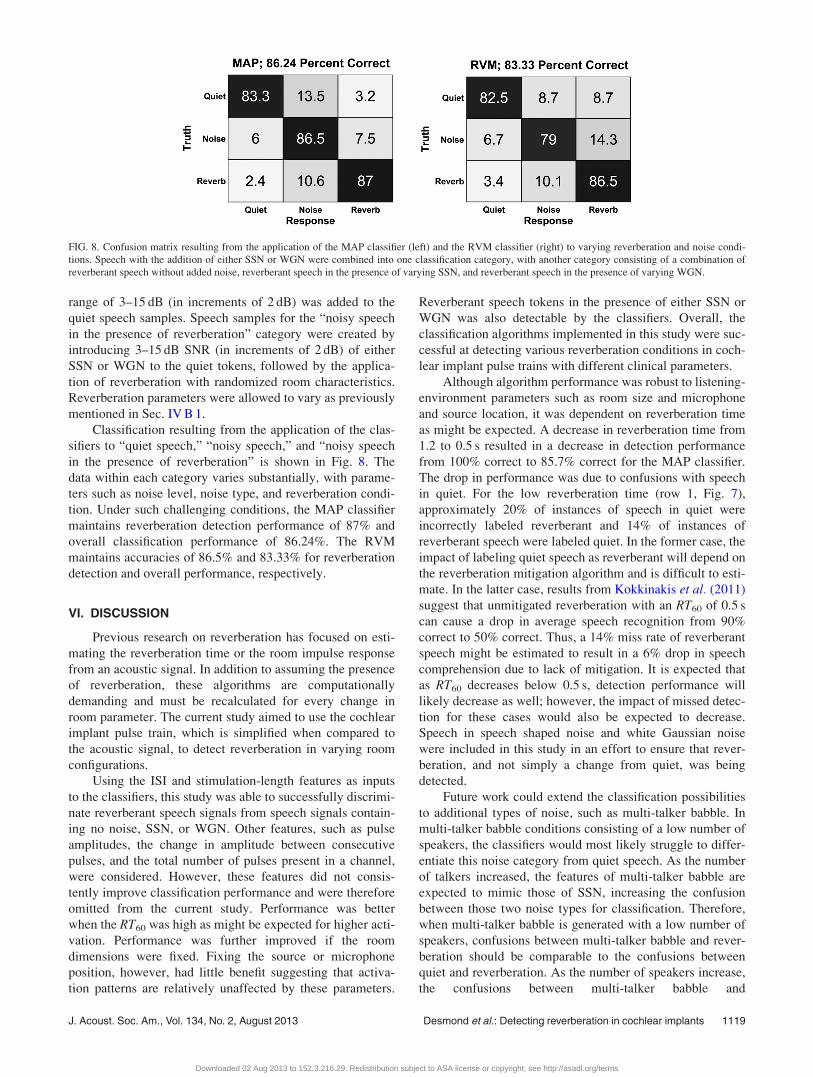
Classification resulting from the application of the clas-
sifiers to “quiet speech,” “noisy speech,” and “noisy speech
in the presence of reverberation” is shown in Fig. 8. The
data within each category varies substantially, with parame-
ters such as noise level, noise type, and reverberation condi-
tion. Under such challenging conditions, the MAP classifier
maintains reverberation detection performance of 87% and
overall classification performance of 86.24%. The RVM
maintains accuracies of 86.5% and 83.33% for reverberation
detection and overall performance, respectively.
VI. DISCUSSION
Previous research on reverberation has focused on esti-
mating the reverberation time or the room impulse response
from an acoustic signal. In addition to assuming the presence
of reverberation, these algorithms are computationally
demanding and must be recalculated for every change in
room parameter. The current study aimed to use the cochlear
implant pulse train, which is simplified when compared to
the acoustic signal, to detect reverberation in varying room
configurations.
Using the ISI and stimulation-length features as inputs
to the classifiers, this study was able to successfully discrimi-
nate reverberant speech signals from speech signals contain-
ing no noise, SSN, or WGN. Other features, such as pulse
amplitudes, the change in amplitude between consecutive
pulses, and the total number of pulses present in a channel,
were considered. However, these features did not consis-
tently improve classification performance and were therefore
omitted from the current study. Performance was better
when the RT60 was high as might be expected for higher acti-
vation. Performance was further improved if the room
dimensions were fixed. Fixing the source or microphone
position, however, had little benefit suggesting that activa-
tion patterns are relatively unaffected by these parameters.
Reverberant speech tokens in the presence of either SSN or
WGN was also detectable by the classifiers. Overall, the
classification algorithms implemented in this study were suc-
cessful at detecting various reverberation conditions in coch-
lear implant pulse trains with different clinical parameters.
Although algorithm performance was robust to listening-
environment parameters such as room size and microphone
and source location, it was dependent on reverberation time
as might be expected. A decrease in reverberation time from
1.2 to 0.5 s resulted in a decrease in detection performance
from 100% correct to 85.7% correct for the MAP classifier.
The drop in performance was due to confusions with speech
in quiet. For the low reverberation time (row 1, Fig. 7),
approximately 20% of instances of speech in quiet were
incorrectly labeled reverberant and 14% of instances of
reverberant speech were labeled quiet. In the former case, the
impact of labeling quiet speech as reverberant will depend on
the reverberation mitigation algorithm and is difficult to esti-
mate. In the latter case, results from Kokkinakis et al. (2011)
suggest that unmitigated reverberation with an RT60 of 0.5 s
can cause a drop in average speech recognition from 90%
correct to 50% correct. Thus, a 14% miss rate of reverberant
speech might be estimated to result in a 6% drop in speech
comprehension due to lack of mitigation. It is expected that
as RT60 decreases below 0.5 s, detection performance will
likely decrease as well; however, the impact of missed detec-
tion for these cases would also be expected to decrease.
Speech in speech shaped noise and white Gaussian noise
were included in this study in an effort to ensure that rever-
beration, and not simply a change from quiet, was being
detected.
Future work could extend the classification possibilities
to additional types of noise, such as multi-talker babble. In
multi-talker babble conditions consisting of a low number of
speakers, the classifiers would most likely struggle to differ-
entiate this noise category from quiet speech. As the number
of talkers increased, the features of multi-talker babble are
expected to mimic those of SSN, increasing the confusion
between those two noise types for classification. Therefore,
when multi-talker babble is generated with a low number of
speakers, confusions between multi-talker babble and rever-
beration should be comparable to the confusions between
quiet and reverberation. As the number of speakers increase,
the confusions between multi-talker babble and
FIG. 8. Confusion matrix resulting from the application of the MAP classifier (left) and the RVM classifier (right) to varying reverberation and noise condi-
tions. Speech with the addition of either SSN or WGN were combined into one classification category, with another category consisting of a combination of
reverberant speech without added noise, reverberant speech in the presence of varying SSN, and reverberant speech in the presence of varying WGN.
J. Acoust. Soc. Am., Vol. 134, No. 2, August 2013 Desmond et al.: Detecting reverberation in cochlear implants 1119
Downloaded 02 Aug 2013 to 152.3.216.29. Redistribution subject to ASA license or copyright; see http://asadl.org/terms
reverberation are expected to be similar to those between
SSN and reverberation.
While the detection algorithms perform well under the
conditions tested, all the noise and reverberation scenarios
were generated through simulations. A next step to validate
these results would be to test the algorithms using real-world
recorded noise and room impulse responses. Real-world
recordings may provide more challenging conditions than
simulations due to their variable frequency responses. These
results, however, do suggest that reverberation detection
with an implant pulse train may be achieved and may be ro-
bust to environmental conditions. Detecting reverberation is
an important first step toward suppressing the effects of
reverberation for cochlear implant listeners with future work
leading to the development of a mitigation algorithm con-
trolled by detection. The reverberation mitigation algorithm,
which must operate in a causal fashion to be applicable to
real-time scenarios, has the potential to greatly improve the
speech recognition performance of cochlear implant listeners
in challenging reverberant environments.
ACKNOWLEDGMENTS
This research was supported by the National Institutes
of Health Grant R01-DC-007994-04.
Allen, J. B., and Berkley, D. A. (1979). “Image method for efficiently simu-
lating small-room acoustics,” J. Acoust. Soc. Am. 65(4), 943–950.
Aoshima, N. (1981). “Computer-generated pulse signal applied for sound
measurement,” J. Acoust. Soc. Am. 69(5), 1484–1488.
Berkhout, A. J., Boone, M. M., and Kesselman, C. (1984). “Acoustic
impulse response measurement: A new technique,” J. Audio Eng. Soc.
32(10), 740–746.
Bishop, C. M. (2006). Pattern Recognition and Machine Learning(Springer, New York), pp. 28–30.
Briggs, P. A. N., and Godfrey, K. R. (1966). “Pseudorandom signals for the
dynamic analysis of multivariable systems,” Proc. IEEE 113, 1259–1267.
Champagne, B., B�edard, S., and St�ephenne, A. (1996). “Performance of
time-delay estimation in the presence of room reverberation,” IEEE Trans.
Speech Audio Process. 4(2), 148–152.
Chu, W. T. (1990). “Impulse-response and reverberation-decay measure-
ments made by using a periodic pseudorandom sequence,” Appl. Acoust.
29, 193–205.
Dunn, C., and Hawksford, M. O. (1993). “Distortion immunity of MLS-
derived impulse response measurements,” J. Acoust. Eng. Soc. 41, 314–335.
Farina, A. “Simultaneous measurement of impulse response and distortion
with a swept-sine technique,” in 108th AES Convention, Paris, France
(February 2000).
Finitzo-Hieber, T., and Tillman, T. W. (1978). “Room acoustics effects on
monosyllabic word discrimination ability for normal and hearing-impaired
children,” J. Speech Hear. Res. 21(3), 440–458.
Griffiths, L. J., and Jim, C. W. (1982). “An alternative approach to linearly
constrained adaptive beamforming,” IEEE Trans. Antennas Propag. 30(1),
27–34.
Hamacher, V., Doering, W. H., Mauer, G., Fleischmann, H., and Hennecke,
J. (1997). “Evaluation of noise reduction systems for cochlear implant
users in different acoustic environments,” Am. J. Otol. 18(6), 546–549.
Hu, Y., and Loizou, P. C. (2003). “A generalized subspace approach for
enhancing speech corrupted by colored noise,” IEEE Trans. Speech Audio
Process. 11(4), 334–341.
Keshavarz, A., Mosayyebpour, S., Biguesh, M., Gulliver, T. A., and
Esmaeili, M. (2012). “Speech-model based accurate blind reverberation
time estimation using an LPC filter,” IEEE Trans. Audio Speech Lang.
Process. 20, 1884–1893.
Kjellberg, A. (2004). “Effects of reverberation time on the cognitive load in
speech communication: Theoretical considerations,” Noise Health 7(25),
11–21.
Kokkinakis, K., Hazrati, O., and Loizou, P. C. (2011). “A channel-selection
criterion for suppressing reverberation in cochlear implants,” J. Acoust.
Soc. Am. 129(5), 3221–3232.
Lamel, L. F., Kassel, R. H., and Seneff, S. (1986). “Speech database devel-
opment: Design and analysis of the acoustic-phonetic corpus,” Proc.
DARPA Speech Recog. Workshop, pp. 100–109.
Lehmann, E. A., and Johansson, A. M. (2008). “Prediction of energy decay
in room impulse responses simulated with an image-source model,”
J. Acoust. Soc. Am. 124(1), 269–277.
Lin, Y., and Lee, D. D. (2006). “Bayesian regularization and nonnegative
deconvolution for room impulse response estimation,” Noise Health 7(25),
11–21.
Loizou, P. C. (2006). “Speech processing in vocoder-centric cochlear
implants,” Adv. Oto-Rhino-Laryngol. 64, 109–143.
Loizou, P., Kasturi, L., Turicchia, R., Sarpeshkar, M., Dorman, M., and
Spahr, T. (2005a). “Evaluation of the companding and other strategies for
noise reduction in cochlear implants,” Abstr. of 2005 Conf. ImplantableAuditory Prostheses, Pacific Grove, CA, 2005.
Loizou, P. C., Lobo, A., and Hu, Y. (2005b). “Subspace algorithms for
noise reduction in cochlear implants,” J. Acoust. Soc. Am. 118(5),
2791–2793.
Margo, V., Terry, M., Schweitzer, C., and Shallop, J. (1995). “Results of a
take-home trial for a nonlinear beamformer used as a noise reduction strat-
egy for cochlear implants,” J. Acoust. Soc. Am. 98(5), 2984–2984.
N�ab�elek, A. K., and Letowski, T. R. (1988). “Similarities of vowels in non-
reverberant and reverberant fields,” J. Acoust. Soc. Am. 83(5),
1891–1899.
N�ab�elek, A. K., Letowski, T. R., and Tucker, F. M. (1989). “Reverberant
overlap- and self- masking in consonant identification,” J. Acoust. Soc.
Am. 86(4), 1259–1265.
Nilsson, M., Soli, S. D., and Sullivan, J. A. (1994). “Development of the
Hearing in Noise Test for the measurement of speech reception thresholds
in quiet and in noise,” J. Acoust. Soc. Am. 95(2), 1085–1099.
Ratnam, R., Jones, D. L., Wheeler, B. C., O’Brien, Jr., W. D., Lansing, C.
R., and Feng, A. S. (2004). “Blind estimation of reverberation time,”
J. Acoust. Soc. Am. 114(5), 2877–2892.
Ream, N. (1970). “Nonlinear identification using inverse-repeat m
sequences,” Proc. IEEE 117(1), 213–218.
Schroeder, M. R. (1965). “New method of measuring reverberation time,”
J. Acoust. Soc. Am. 37(6), 1187–1188.
Schroeder, M. R. (1979). “Integrated-impulse method for measuring sound
decay without using impulses,” J. Acoust. Soc. Am. 66, 497–500.
Suzuki, Y., Asano, F., Kim, H.-Y., and Sone, T. (1995). “An optimum
computer-generated pulse signal suitable for the measurement of very
long impulse responses,” J. Acoust. Soc. Am. 97(2), 1119–1123.
Tipping, M. E. (2001). “Sparse Bayesian learning and the relevance vector
machine,” J. Mach. Learn. Res. 1, 211–244.
Toledo, F., Loizou, P., and Lobo, A. (2003). “Subspace and envelope sub-
traction algorithms for noise reduction in cochlear implants,” Proceedingsof the 25th Annual International Conference of the IEEE-EMBC,
2002–2005.
Unoki, M., and Hiramatsu, S. (2008). “Blind estimation method of reverber-
ation time based on concept of modulation transfer function,” J. Acoust.
Soc. Am. 123(5), 3616–3616.
Vandali, A. E., Sucher, C., Tsang, D. J., McKay, C. M., Chew, J. W. D., and
McDermott, H. J. (2005). “Pitch ranking ability of cochlear implant recipi-
ents: A comparison of sound- processing strategies,” J. Acoust. Soc. Am.
177(5), 3126–3138.
Van Hoesel, R. J. M., and Clark, G. M. (1995). “Evaluation of a portable
two-microphone adaptive beamforming speech processor with cochlear
implant patients,” J. Acoust. Soc. Am. 97(4), 2498–2503.
Wen, J. Y. C., Habets, E. A. P., and Naylor, P. A., “Blind estimation of
reverberation time based on the distribution of signal decay rates,” Proc.IEEE Int. Conf. Acoust., Speech, Signal Process., March–April 2008, pp.
329–332.
Wouters, J., and Vanden Berghe, J. (2001). “Speech recognition in noise for
cochlear implantees with a two-microphone monaural adaptive noise
reduction system,” Ear Hear. 22(5), 420–430.
Wu, M., and Wang, D. (2006). “A pitch-based method for the
estimation of short reverberation time,” Acta Acust. 92,
337–339.
Yang, L. P., and Fu, Q. J. (2005). “Spectral subtraction-based speech
enhancement for cochlear implant patients in background noise,”
J. Acoust. Soc. Am. 117(3), 1001–1004.
1120 J. Acoust. Soc. Am., Vol. 134, No. 2, August 2013 Desmond et al.: Detecting reverberation in cochlear implants
Downloaded 02 Aug 2013 to 152.3.216.29. Redistribution subject to ASA license or copyright; see http://asadl.org/terms