Dexamethasone in Vietnamese Adolescents and Adults with Bacterial Meningitis
Upload
independentCategory
view
4download
0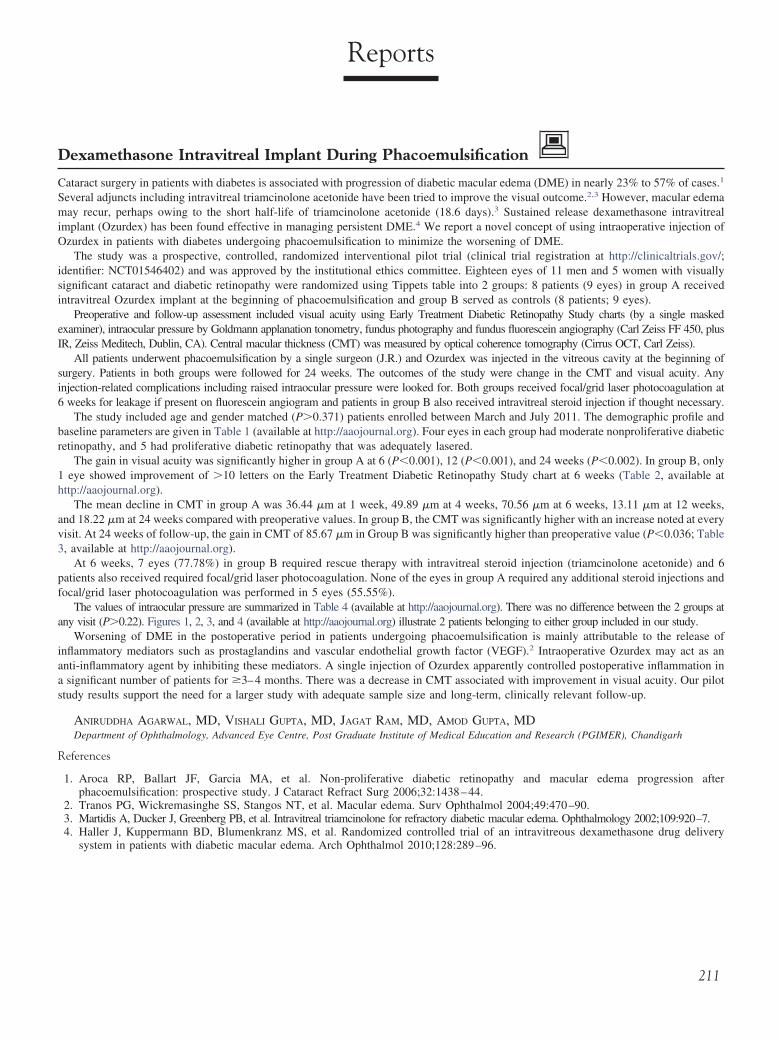
Reports
Dexamethasone Intravitreal Implant During Phacoemulsification
Cataract surgery in patients with diabetes is associated with progression of diabetic macular edema (DME) in nearly 23% to 57% of cases.1
Several adjuncts including intravitreal triamcinolone acetonide have been tried to improve the visual outcome.2,3 However, macular edemamay recur, perhaps owing to the short half-life of triamcinolone acetonide (18.6 days).3 Sustained release dexamethasone intravitrealimplant (Ozurdex) has been found effective in managing persistent DME.4 We report a novel concept of using intraoperative injection ofOzurdex in patients with diabetes undergoing phacoemulsification to minimize the worsening of DME.
The study was a prospective, controlled, randomized interventional pilot trial (clinical trial registration at http://clinicaltrials.gov/;identifier: NCT01546402) and was approved by the institutional ethics committee. Eighteen eyes of 11 men and 5 women with visuallysignificant cataract and diabetic retinopathy were randomized using Tippets table into 2 groups: 8 patients (9 eyes) in group A receivedintravitreal Ozurdex implant at the beginning of phacoemulsification and group B served as controls (8 patients; 9 eyes).
Preoperative and follow-up assessment included visual acuity using Early Treatment Diabetic Retinopathy Study charts (by a single maskedexaminer), intraocular pressure by Goldmann applanation tonometry, fundus photography and fundus fluorescein angiography (Carl Zeiss FF 450, plusIR, Zeiss Meditech, Dublin, CA). Central macular thickness (CMT) was measured by optical coherence tomography (Cirrus OCT, Carl Zeiss).
All patients underwent phacoemulsification by a single surgeon (J.R.) and Ozurdex was injected in the vitreous cavity at the beginning ofsurgery. Patients in both groups were followed for 24 weeks. The outcomes of the study were change in the CMT and visual acuity. Anyinjection-related complications including raised intraocular pressure were looked for. Both groups received focal/grid laser photocoagulation at6 weeks for leakage if present on fluorescein angiogram and patients in group B also received intravitreal steroid injection if thought necessary.
The study included age and gender matched (P�0.371) patients enrolled between March and July 2011. The demographic profile andbaseline parameters are given in Table 1 (available at http://aaojournal.org). Four eyes in each group had moderate nonproliferative diabeticretinopathy, and 5 had proliferative diabetic retinopathy that was adequately lasered.
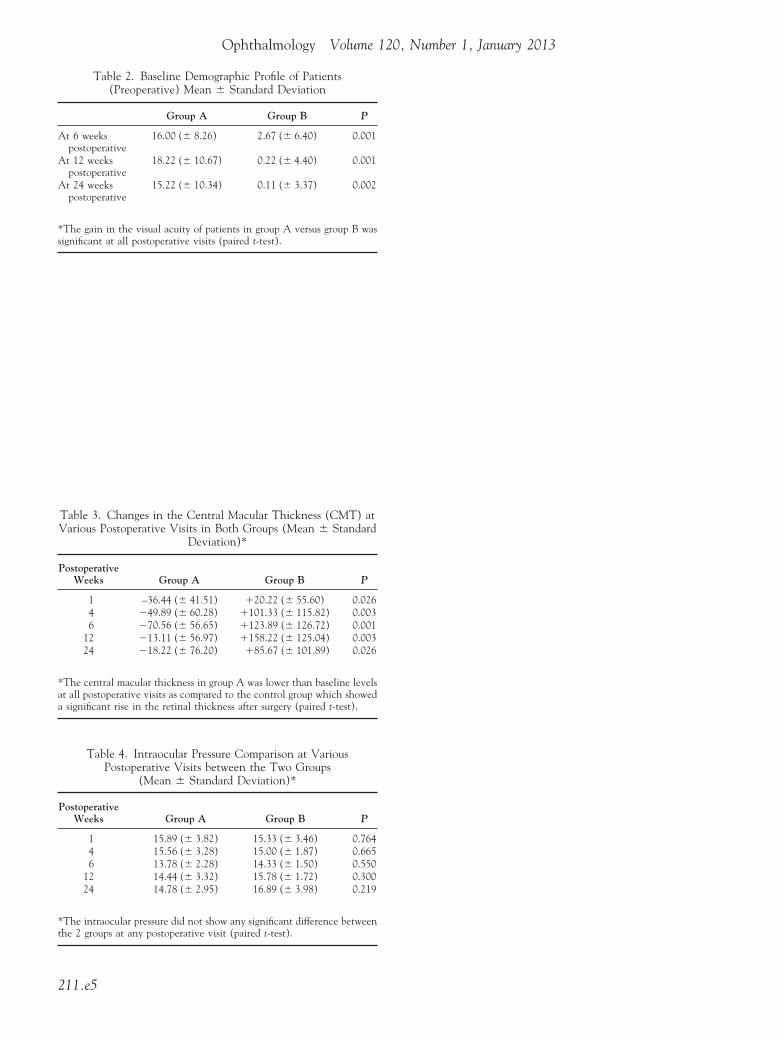
The gain in visual acuity was significantly higher in group A at 6 (P�0.001), 12 (P�0.001), and 24 weeks (P�0.002). In group B, only1 eye showed improvement of �10 letters on the Early Treatment Diabetic Retinopathy Study chart at 6 weeks (Table 2, available athttp://aaojournal.org).
The mean decline in CMT in group A was 36.44 �m at 1 week, 49.89 �m at 4 weeks, 70.56 �m at 6 weeks, 13.11 �m at 12 weeks,and 18.22 �m at 24 weeks compared with preoperative values. In group B, the CMT was significantly higher with an increase noted at everyvisit. At 24 weeks of follow-up, the gain in CMT of 85.67 �m in Group B was significantly higher than preoperative value (P�0.036; Table3, available at http://aaojournal.org).
At 6 weeks, 7 eyes (77.78%) in group B required rescue therapy with intravitreal steroid injection (triamcinolone acetonide) and 6patients also received required focal/grid laser photocoagulation. None of the eyes in group A required any additional steroid injections andfocal/grid laser photocoagulation was performed in 5 eyes (55.55%).
The values of intraocular pressure are summarized in Table 4 (available at http://aaojournal.org). There was no difference between the 2 groups atany visit (P�0.22). Figures 1, 2, 3, and 4 (available at http://aaojournal.org) illustrate 2 patients belonging to either group included in our study.
Worsening of DME in the postoperative period in patients undergoing phacoemulsification is mainly attributable to the release ofinflammatory mediators such as prostaglandins and vascular endothelial growth factor (VEGF).2 Intraoperative Ozurdex may act as ananti-inflammatory agent by inhibiting these mediators. A single injection of Ozurdex apparently controlled postoperative inflammation ina significant number of patients for �3–4 months. There was a decrease in CMT associated with improvement in visual acuity. Our pilotstudy results support the need for a larger study with adequate sample size and long-term, clinically relevant follow-up.
ANIRUDDHA AGARWAL, MD, VISHALI GUPTA, MD, JAGAT RAM, MD, AMOD GUPTA, MDDepartment of Ophthalmology, Advanced Eye Centre, Post Graduate Institute of Medical Education and Research (PGIMER), Chandigarh
References
1. Aroca RP, Ballart JF, Garcia MA, et al. Non-proliferative diabetic retinopathy and macular edema progression afterphacoemulsification: prospective study. J Cataract Refract Surg 2006;32:1438–44.
2. Tranos PG, Wickremasinghe SS, Stangos NT, et al. Macular edema. Surv Ophthalmol 2004;49:470–90.3. Martidis A, Ducker J, Greenberg PB, et al. Intravitreal triamcinolone for refractory diabetic macular edema. Ophthalmology 2002;109:920–7.4. Haller J, Kuppermann BD, Blumenkranz MS, et al. Randomized controlled trial of an intravitreous dexamethasone drug delivery
system in patients with diabetic macular edema. Arch Ophthalmol 2010;128:289–96.
211
implant.
Ophthalmology Volume 120, Number 1, January 2013
Figure 1. Patient 1. A, Fundus photograph right eye taken preoperativelyshows hyperfluorescent laser scars temporal to fovea with dye pooling indetached posterior hyaloid is seen attached to the fovea; however, 3-dimretina. This patient underwent cataract surgery with intravitreal Ozurdex
showing dull foveal reflex. B, Fundus fluorescein angiogram in the late phasethe cystoid spaces. C, Raster line scan shows cystoid macular edema. Partiallyensional viewing indicated that it was not causing any traction on underlying
211.e1
Reports
Figure 2. Patient 1. A, Fundus photograph of the right eye 12 weeks later shows good foveal reflex. Previous laser scars temporal to the fovea can nowbe better appreciated. B, Fundus fluorescein angiogram shows resolution of leakage contributing to cystoid macular edema compared with Figure 1B. C,
Raster line scan shows resolution of cystoid spaces with normal foveal contour.211.e2
Ophthalmology Volume 120, Number 1, January 2013
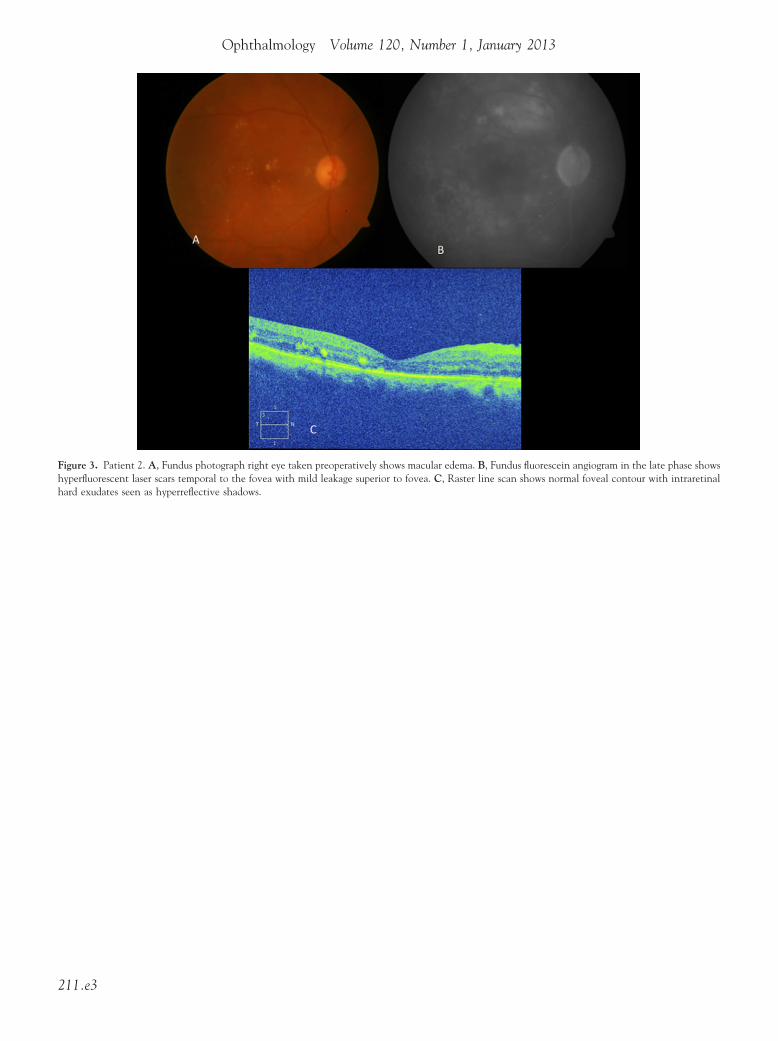
Figure 3. Patient 2. A, Fundus photograph right eye taken preoperatively shows macular edema. B, Fundus fluorescein angiogram in the late phase showshyperfluorescent laser scars temporal to the fovea with mild leakage superior to fovea. C, Raster line scan shows normal foveal contour with intraretinal
hard exudates seen as hyperreflective shadows.211.e3
Reports
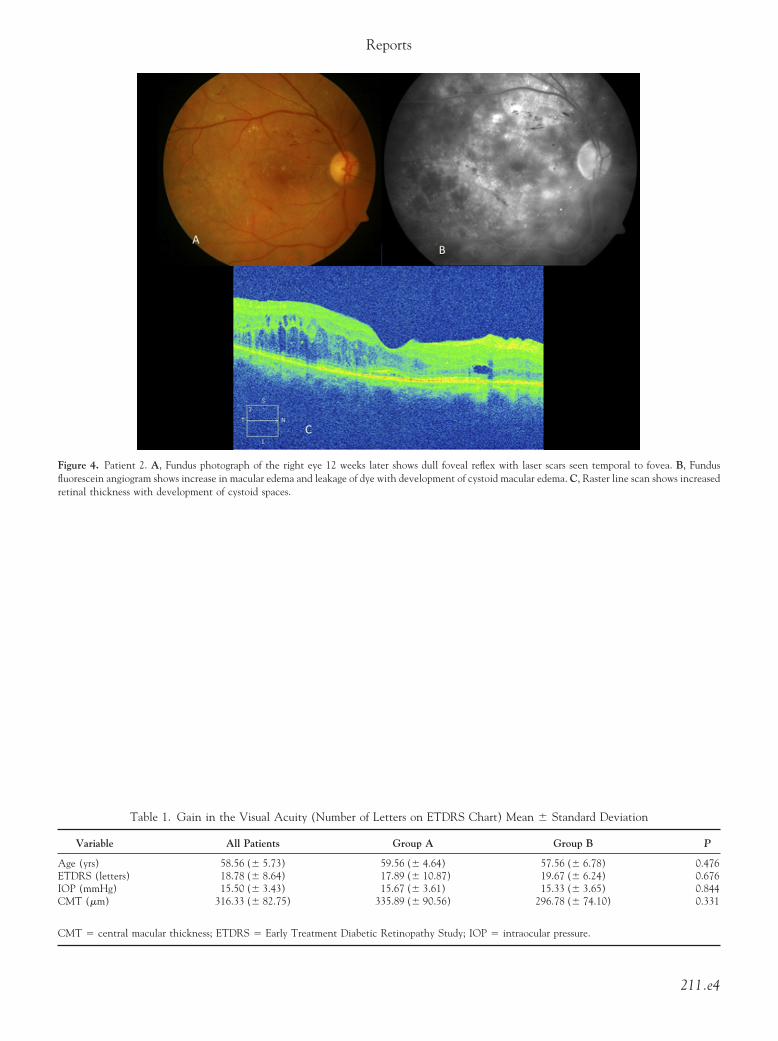
Figure 4. Patient 2. A, Fundus photograph of the right eye 12 weeks later shows dull foveal reflex with laser scars seen temporal to fovea. B, Fundusfluorescein angiogram shows increase in macular edema and leakage of dye with development of cystoid macular edema. C, Raster line scan shows increased
retinal thickness with development of cystoid spaces.Table 1. Gain in the Visual Acuity (Number of Letters on ETDRS Chart) Mean � Standard Deviation
Variable All Patients Group A Group B P
Age (yrs) 58.56 (� 5.73) 59.56 (� 4.64) 57.56 (� 6.78) 0.476ETDRS (letters) 18.78 (� 8.64) 17.89 (� 10.87) 19.67 (� 6.24) 0.676IOP (mmHg) 15.50 (� 3.43) 15.67 (� 3.61) 15.33 (� 3.65) 0.844CMT (�m) 316.33 (� 82.75) 335.89 (� 90.56) 296.78 (� 74.10) 0.331
CMT � central macular thickness; ETDRS � Early Treatment Diabetic Retinopathy Study; IOP � intraocular pressure.
211.e4
Ophthalmology Volume 120, Number 1, January 2013
Table 2. Baseline Demographic Profile of Patients(Preoperative) Mean � Standard Deviation
Group A Group B P
At 6 weekspostoperative
16.00 (� 8.26) 2.67 (� 6.40) 0.001
At 12 weekspostoperative
18.22 (� 10.67) 0.22 (� 4.40) 0.001
At 24 weekspostoperative
15.22 (� 10.34) 0.11 (� 3.37) 0.002
*The gain in the visual acuity of patients in group A versus group B was
significant at all postoperative visits (paired t-test).Table 3. Changes in the Central Macular Thickness (CMT) atVarious Postoperative Visits in Both Groups (Mean � Standard
Deviation)*
PostoperativeWeeks Group A Group B P
1 –36.44 (� 41.51) �20.22 (� 55.60) 0.0264 �49.89 (� 60.28) �101.33 (� 115.82) 0.0036 �70.56 (� 56.65) �123.89 (� 126.72) 0.001
12 �13.11 (� 56.97) �158.22 (� 125.04) 0.00324 �18.22 (� 76.20) �85.67 (� 101.89) 0.026
*The central macular thickness in group A was lower than baseline levelsat all postoperative visits as compared to the control group which showed
a significant rise in the retinal thickness after surgery (paired t-test).Table 4. Intraocular Pressure Comparison at VariousPostoperative Visits between the Two Groups
(Mean � Standard Deviation)*
PostoperativeWeeks Group A Group B P
1 15.89 (� 3.82) 15.33 (� 3.46) 0.7644 15.56 (� 3.28) 15.00 (� 1.87) 0.6656 13.78 (� 2.28) 14.33 (� 1.50) 0.550
12 14.44 (� 3.32) 15.78 (� 1.72) 0.30024 14.78 (� 2.95) 16.89 (� 3.98) 0.219
*The intraocular pressure did not show any significant difference between
the 2 groups at any postoperative visit (paired t-test).211.e5
Copyright © 2022 FDOKUMEN