Effects of low-dose dexamethasone and prednisolone long term administration in beef calf: Chemical...
10
Analytica Chimica Acta 700 (2011) 95–104 Contents lists available at ScienceDirect Analytica Chimica Acta j ourna l ho me page: www.elsevier.com/locate/aca Effects of low-dose dexamethasone and prednisolone long term administration in beef calf: Chemical and morphological investigation Francesca Tiziana Cannizzo a,∗ , Pierluigi Capra b , Sara Divari a , Valentina Ciccotelli b , Bartolomeo Biolatti a , Marco Vincenti c,d a Dipartimento di Patologia Animale, Facoltà di Medicina Veterinaria, via Leonardo da Vinci 44, 10095 Grugliasco (TO), Italy b Istituto Zooprofilattico Sperimentale del Piemonte, Liguria e Valle d’Aosta, Torino, Italy c Centro Regionale Antidoping e di Tossicologia “Alessandro Bertinaria”, Orbassano (TO), Italy d Dipartimento di Chimica Analitica, Università degli Studi di Torino, Torino, Italy a r t i c l e i n f o Article history: Received 6 September 2010 Received in revised form 25 November 2010 Accepted 6 December 2010 Available online 11 December 2010 Keywords: Cattle Dexamethasone Prednisolone Thymus High performance liquid chromatography–tandem mass spectrometry Urine a b s t r a c t An analytical, pharmacokinetic and histopathologic investigation was conducted by two experimental trials on beef cattle in order to determine fate and effects of dexamethasone and prednisolone, adminis- tered to distinct cattle groups at low dosage for long periods of time. In trial 1, eighteen Charolaise beef cattle, male, 17–22-months-old, were divided in three groups: to group A (n = 6) dexamethasone-21- sodium-phosphate 0.7 mg day −1 per os for 40 days was administered; group B (n = 6) was orally treated with prednisolone 15 mg day −1 for 30 days, while group C (n = 6) served as negative control. Urine was collected at days 0, 7, 15, 25 and 47 from groups A and C, and at days 0, 8, 18 and 42 from group B. In trial 2, sixteen Friesian cattle, male, 10–17-months-old, were randomly divided into two groups: group D (n = 8) was administered prednisolone 30 mg day −1 per os for 35 days, while group K (n = 8) served as control. In both trials, the animals were slaughtered after a 6-days drug withdrawal and thymus and livers were collected and properly stored until the analysis was performed. Quantitative determinations of dexamethasone, prednisolone and its main metabolite, prednisone, in urine and liver samples were conducted by HPLC–MS/MS, after the analytical procedure was optimized and fully validated. The method validation included the assessment of specificity, linearity, precision, trueness, robustness, CC and CC values. By a morphological point of view, severe atrophy of thymus parenchyma was observed in group A, together with a significant (P < 0.005) reduction of the mean thymus weight (217 ± 94 g), while group B (646 ± 215 g) presented normal thymus features and weights (group C, 415 ± 116 g). Accordingly, no differences were found in trial 2 for groups D (727 ± 275 g) and K (642 ± 173 g). Average dexamethasone concentrations in group A urine samples ranged from 1.4 to 3.0 g L −1 during the treatment, while no residue was detected in the urine samples collected 6–7 days after the end of the treatment. Low amounts of dexamethasone (<1 g L −1 ) were detected in liver samples of group A. All average prednisolone concentrations in group B urine samples (sum of conjugate and free form) turned out to be below 1.0 g L −1 during the treatment, despite the much higher concentration admin- istered (15–30 mg day −1 ) with respect to dexamethasone in group A (0.7 mg day −1 ). No prednisolone residues were found in the urine and liver samples taken at the slaughterhouse. The absence of any prednisolone residue in the urine samples of control group animals supports the the- ory that the origin of this molecule is fundamentally exogenous, at least for this cattle category maintained under unstressing conditions. Remarkable findings are represented by the absence of thymus atrophy in the prednisolone treated animals and the extremely low residue concentrations found in urine during the treatment. Both findings reveal that the detection of illegal growth-promoting treatments with this drug is difficult. © 2010 Elsevier B.V. All rights reserved. ∗ Corresponding author at: Dipartimento di Patologia Animale, Università di Torino, via Leonardo da Vinci 44, 10095 Grugliasco (TO), Italy. Tel.: +39 0116709037; fax: +39 0116709031. E-mail address: [email protected] (F.T. Cannizzo). 1. Introduction Dexamethasone and prednisolone are synthetic glucocorticoids extensively used as therapeutic agents in veterinary practice for the treatment of a wide range of metabolic diseases, shock, stress and inflammatory disorders in farm animals. Although their admin- 0003-2670/$ – see front matter © 2010 Elsevier B.V. All rights reserved. doi:10.1016/j.aca.2010.12.004
-
Upload
independent -
Category
Documents
-
view
2 -
download
0
Transcript of Effects of low-dose dexamethasone and prednisolone long term administration in beef calf: Chemical...
Ei
FBa
b
c
d
a
ARR2AA
KCDPTHcsU
Tf
0d
Analytica Chimica Acta 700 (2011) 95– 104
Contents lists available at ScienceDirect
Analytica Chimica Acta
j ourna l ho me page: www.elsev ier .com/ locate /aca
ffects of low-dose dexamethasone and prednisolone long term administrationn beef calf: Chemical and morphological investigation
rancesca Tiziana Cannizzoa,∗, Pierluigi Caprab, Sara Divari a, Valentina Ciccotelli b,artolomeo Biolatti a, Marco Vincenti c,d
Dipartimento di Patologia Animale, Facoltà di Medicina Veterinaria, via Leonardo da Vinci 44, 10095 Grugliasco (TO), ItalyIstituto Zooprofilattico Sperimentale del Piemonte, Liguria e Valle d’Aosta, Torino, ItalyCentro Regionale Antidoping e di Tossicologia “Alessandro Bertinaria”, Orbassano (TO), ItalyDipartimento di Chimica Analitica, Università degli Studi di Torino, Torino, Italy
r t i c l e i n f o
rticle history:eceived 6 September 2010eceived in revised form5 November 2010ccepted 6 December 2010vailable online 11 December 2010
eywords:attleexamethasonerednisolonehymusigh performance liquidhromatography–tandem masspectrometryrine
a b s t r a c t
An analytical, pharmacokinetic and histopathologic investigation was conducted by two experimentaltrials on beef cattle in order to determine fate and effects of dexamethasone and prednisolone, adminis-tered to distinct cattle groups at low dosage for long periods of time. In trial 1, eighteen Charolaise beefcattle, male, 17–22-months-old, were divided in three groups: to group A (n = 6) dexamethasone-21-sodium-phosphate 0.7 mg day−1 per os for 40 days was administered; group B (n = 6) was orally treatedwith prednisolone 15 mg day−1 for 30 days, while group C (n = 6) served as negative control. Urine wascollected at days 0, 7, 15, 25 and 47 from groups A and C, and at days 0, 8, 18 and 42 from group B. Intrial 2, sixteen Friesian cattle, male, 10–17-months-old, were randomly divided into two groups: groupD (n = 8) was administered prednisolone 30 mg day−1 per os for 35 days, while group K (n = 8) served ascontrol. In both trials, the animals were slaughtered after a 6-days drug withdrawal and thymus andlivers were collected and properly stored until the analysis was performed.
Quantitative determinations of dexamethasone, prednisolone and its main metabolite, prednisone, inurine and liver samples were conducted by HPLC–MS/MS, after the analytical procedure was optimizedand fully validated. The method validation included the assessment of specificity, linearity, precision,trueness, robustness, CC� and CC� values.
By a morphological point of view, severe atrophy of thymus parenchyma was observed in group A,together with a significant (P < 0.005) reduction of the mean thymus weight (217 ± 94 g), while groupB (646 ± 215 g) presented normal thymus features and weights (group C, 415 ± 116 g). Accordingly, nodifferences were found in trial 2 for groups D (727 ± 275 g) and K (642 ± 173 g).
Average dexamethasone concentrations in group A urine samples ranged from 1.4 to 3.0 �g L−1 duringthe treatment, while no residue was detected in the urine samples collected 6–7 days after the end of thetreatment. Low amounts of dexamethasone (<1 �g L−1) were detected in liver samples of group A.
All average prednisolone concentrations in group B urine samples (sum of conjugate and free form)turned out to be below 1.0 �g L−1 during the treatment, despite the much higher concentration admin-istered (15–30 mg day−1) with respect to dexamethasone in group A (0.7 mg day−1). No prednisolone
residues were found in the urine and liver samples taken at the slaughterhouse.The absence of any prednisolone residue in the urine samples of control group animals supports the the-ory that the origin of this molecule is fundamentally exogenous, at least for this cattle category maintainedunder unstressing conditions. Remarkable findings are represented by the absence of thymus atrophy inthe prednisolone treated animals and the extremely low residue concentrations found in urine during
ngs re
the treatment. Both findi drug is difficult.∗ Corresponding author at: Dipartimento di Patologia Animale, Università diorino, via Leonardo da Vinci 44, 10095 Grugliasco (TO), Italy. Tel.: +39 0116709037;ax: +39 0116709031.
E-mail address: [email protected] (F.T. Cannizzo).
003-2670/$ – see front matter © 2010 Elsevier B.V. All rights reserved.oi:10.1016/j.aca.2010.12.004
veal that the detection of illegal growth-promoting treatments with this
© 2010 Elsevier B.V. All rights reserved.
1. Introduction
Dexamethasone and prednisolone are synthetic glucocorticoidsextensively used as therapeutic agents in veterinary practice forthe treatment of a wide range of metabolic diseases, shock, stressand inflammatory disorders in farm animals. Although their admin-

96 F.T. Cannizzo et al. / Analytica Chimica Acta 700 (2011) 95– 104
F samplt
iCmid
tdtCtmwltppf
rhaaamgcaSf
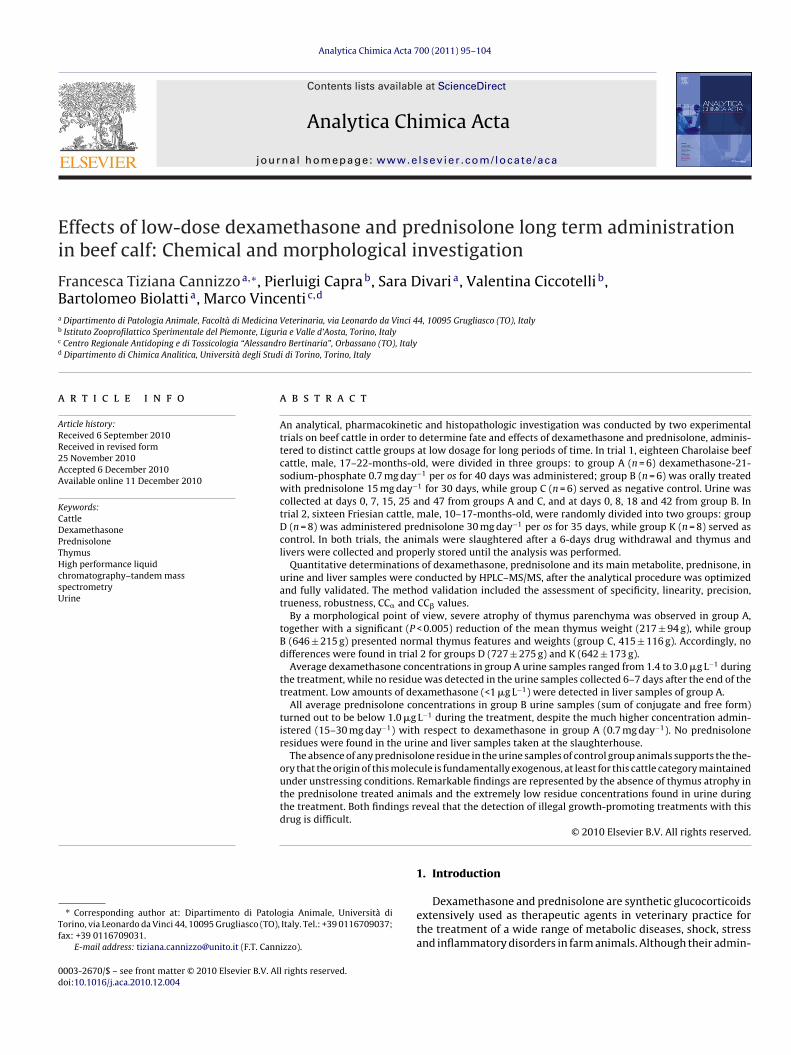
ig. 1. Selected reaction monitoring chromatograms, obtained from a blank urine
ration. The main (quantifier) transition is shown for each analyte.
stration in animals is primarily therapeutic, in some Europeanountries glucocorticoids are also utilized illegally as growth pro-oters, either alone or in association with anabolic steroids, to
mprove quality and quantity of meat in veal calves and beef pro-uction [1–3].
The strong pharmacological activity of most synthetic cor-icosteroids makes the residues of these molecules potentiallyangerous for meat consumers. As a consequence, their adminis-ration for growth-promoting purposes is banned in the EU by theouncil Directive 96/23/EC, and their use in livestock is restrictedo therapeutic indications requiring an official record of the treat-
ent by a licensed veterinarian and the application of appropriateithdrawal periods in order to comply with maximum residue
imits (MRLs) established for bovine edible tissues [4]. However,he illegal administration of low dosages of dexamethasone andrednisolone has considerably increased in the last years, with theurpose of enhancing the carcass and meat quality traits and reduceeed conversion ratio [5–8].
The assurance of safe and good quality food is a fundamentalequest of the consumers. Due to the risk of toxic effects on theuman organism by glucocorticoid residues [9], the developmentnd optimization of effective methods for detecting treatednimals is of primary importance [10]. When dexamethasone isdministered at low dosage, its rapid metabolism and excretionakes the residues determination difficult [11], even by using tar-
eted GC/MS and LC/MS/MS methods [12–19], as the urinary drugoncentration is very low during the treatment and completelybsent a short time after the interruption of the treatment [20].light thymus atrophy and presence of residues in urine rangingrom 3 to 400 �g L−1 in veal calves treated with low doses of
e spiked with dexamethasone, prednisone and prednisolone at 0.5 �g L−1 concen-
prednisolone have been described by Groot et al. [21], while littleis known at the moment about the prednisolone urinary excretionand the possible presence of residues in the liver after low-dose,long-term treatment of beef cattle.
Aim of the present work was to determine under compara-ble experimental conditions, dexamethasone and prednisoloneresidues in urine and liver samples arising from long-termorally treated beef cattle, together with their possible gross andhistopathological effects on the animals thymus. This study wasalso designed to investigate the kinetics of dexamethasone andprednisolone urinary excretion in beef cattle using a LC–MS/MSmethod, validated in agreement with the Commission Decision2002/657/EC. To this aim, the animals were experimentally treatedwith dexamethasone and prednisolone, according to a growthpromoting protocol, in order to provide useful chemical or morpho-logical evidence that could possibly discriminate legal from illegaldrug administration.
2. Materials and methods
2.1. Animal and experimental design
Two trials, 1 and 2, were carried out on beef cattleof different breeds. In trial 1, eighteen Charolaise beef cat-tle, male, 17–22-month-old, were divided into three groups:
dexamethasone-21-sodium-phosphate 0.7 mg day−1 was adminis-tered per os for 40 days to group A (n = 6), while group B (n = 6)was orally treated with prednisolone acetate 15 mg day−1 for 30days. Group C (n = 6) served as negative control. In trial 2, sixteenFriesian cattle, male, 10–17-months-old, were randomly divided
F.T. Cannizzo et al. / Analytica Chimica Acta 700 (2011) 95– 104 97
F sampd 8 aftes
iaadkiwtUAmnu
2
waowdsf
2
f2
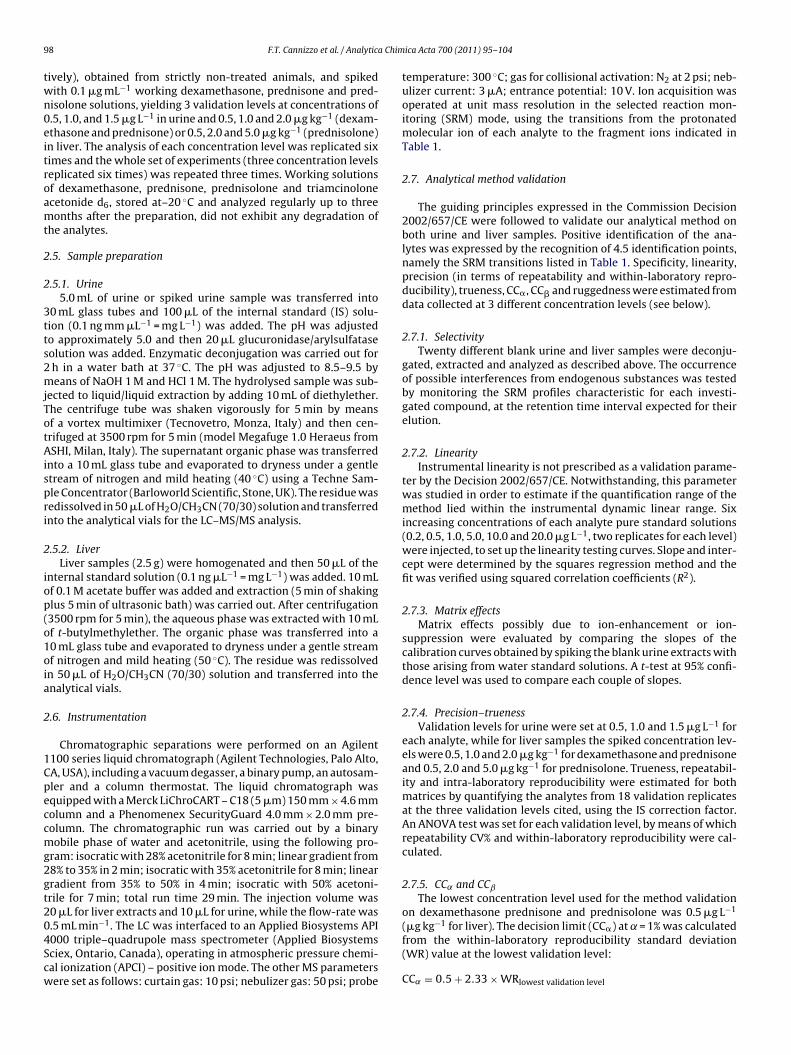
ig. 2. (a) Selected reaction monitoring chromatograms, obtained from the urine
examethasone. (b) SRM chromatograms, from animal 13B sample collected at daytandard is included at the bottom of the figures.
nto two groups: group D (n = 8) was administered prednisolonecetate 30 mg day−1 per os for 35 days, while group K (n = 8) serveds control. In both trials, the animals were slaughtered after a 6-ays drug withdrawal. All groups of experimental animals wereept in separate boxes, 10 m × 15 m, and fed with a diet consist-ng of corn silage, corn, hay and a commercial protein supplement;
ater was supplied ad libitum. The experiment was authorised byhe Italian Ministry of Health and the Ethics Committee of theniversity of Turin. Carcases of treated animals were destroyed.ll animals treated orally, before the distribution of the feed eachorning, were tied to the feeding trough, where two trained tech-
icians gave one capsule containing the compound per application,sing a drenching gun. Control animals were treated with a placebo.
.2. Processing of thymic tissue
Both cervical and thoracic portions of thymus of each animalere collected soon after slaughter and weighed. The thymus rel-
tive weight was calculated as the ratio between the weight ofrgan (g) and the body weight of beef cattle (kg). Tissue samplesere fixed in 10% neutral buffered formalin and paraffin embed-ed according to routine histological procedures. Representativeections of each sample were stained with haematoxylin and eosinor histological examination.
.3. Sample collection
Trial 1: urine samples were collected at days 0, 7, 15, 25 and 47rom groups A and C, and at days 0, 8, 18 and 42 from group B. Trial: urine were collected at days 0, 10, 31, 41. Urine samples were
le collected from animal 7A, at day 25, after the beginning of the treatment withr the beginning of the treatment with prednisolone. A single trace for the internal
collected at early morning after spontaneous micturition, dividedin aliquots and stored at −80 ◦C until the analysis was performed.The last sampling was carried out at the slaughter house for allgroups.
In both trials livers were collected at slaughter and stored at−80 ◦C until analysis.
2.4. Chemicals, reagents, standard solutions and calibrationcurves
Sodium hydroxide and hydrochloric acid were supplied byCarlo Erba Reagenti (Milan, Italy). Dexamethasone, prednisone,prednisolone, diethylether, acetonitrile, and t-butylmethyletherwere supplied by Sigma–Aldrich (St. Louis, MO, USA). Sodiumacetate was from Riedel-de-Haën (Seelze Germany). Beta-glucuronidase/aryl-sulfatase was supplied by Roche Diagnostics(Mannheim, Germany). Triamcinolone acetonide-d6 (Internal Stan-dard) was supplied by RIVM (Bilthoven, The Netherlands). Acetatebuffers at different pH values were prepared by adding hydrochloricacid to a 0.1 M sodium acetate solution.
Stock standard solutions of prednisone, prednisolone and dex-amethasone were prepared in acetonitrile at a concentration of1000 mg L−1 and stored at −20 ◦C in the dark.
Calibration curves were obtained by spiking blank bovine urinewith 0.1 �g mL−1 dexamethasone, prednisone and prednisolone
working solutions, at five concentration levels (0, 0.5, 1.0, 2.0 and5.0 �g L−1 for each analyte). Blank bovine liver samples were simi-larly spiked (0, 0.5, 2.0, 5.0 and 10.0 �g kg−1 for each analyte).Most validation experiments were performed using negativereference urine and liver samples (5.0 mL and 2.5 g, respec-
9 a Chim
twn0eitroamt
2
2
3tts2mjTotAispri
2
iop(o1oia
2
1Cpeccmg2gt204Scw
8 F.T. Cannizzo et al. / Analytic
ively), obtained from strictly non-treated animals, and spikedith 0.1 �g mL−1 working dexamethasone, prednisone and pred-isolone solutions, yielding 3 validation levels at concentrations of.5, 1.0, and 1.5 �g L−1 in urine and 0.5, 1.0 and 2.0 �g kg−1 (dexam-thasone and prednisone) or 0.5, 2.0 and 5.0 �g kg−1 (prednisolone)n liver. The analysis of each concentration level was replicated siximes and the whole set of experiments (three concentration levelseplicated six times) was repeated three times. Working solutionsf dexamethasone, prednisone, prednisolone and triamcinolonecetonide d6, stored at–20 ◦C and analyzed regularly up to threeonths after the preparation, did not exhibit any degradation of
he analytes.
.5. Sample preparation
.5.1. Urine5.0 mL of urine or spiked urine sample was transferred into
0 mL glass tubes and 100 �L of the internal standard (IS) solu-ion (0.1 ng mm �L−1 = mg L−1) was added. The pH was adjustedo approximately 5.0 and then 20 �L glucuronidase/arylsulfataseolution was added. Enzymatic deconjugation was carried out for
h in a water bath at 37 ◦C. The pH was adjusted to 8.5–9.5 byeans of NaOH 1 M and HCl 1 M. The hydrolysed sample was sub-
ected to liquid/liquid extraction by adding 10 mL of diethylether.he centrifuge tube was shaken vigorously for 5 min by meansf a vortex multimixer (Tecnovetro, Monza, Italy) and then cen-rifuged at 3500 rpm for 5 min (model Megafuge 1.0 Heraeus fromSHI, Milan, Italy). The supernatant organic phase was transferred
nto a 10 mL glass tube and evaporated to dryness under a gentletream of nitrogen and mild heating (40 ◦C) using a Techne Sam-le Concentrator (Barloworld Scientific, Stone, UK). The residue wasedissolved in 50 �L of H2O/CH3CN (70/30) solution and transferrednto the analytical vials for the LC–MS/MS analysis.
.5.2. LiverLiver samples (2.5 g) were homogenated and then 50 �L of the
nternal standard solution (0.1 ng �L−1 = mg L−1) was added. 10 mLf 0.1 M acetate buffer was added and extraction (5 min of shakinglus 5 min of ultrasonic bath) was carried out. After centrifugation3500 rpm for 5 min), the aqueous phase was extracted with 10 mLf t-butylmethylether. The organic phase was transferred into a0 mL glass tube and evaporated to dryness under a gentle streamf nitrogen and mild heating (50 ◦C). The residue was redissolvedn 50 �L of H2O/CH3CN (70/30) solution and transferred into thenalytical vials.
.6. Instrumentation
Chromatographic separations were performed on an Agilent100 series liquid chromatograph (Agilent Technologies, Palo Alto,A, USA), including a vacuum degasser, a binary pump, an autosam-ler and a column thermostat. The liquid chromatograph wasquipped with a Merck LiChroCART – C18 (5 �m) 150 mm × 4.6 mmolumn and a Phenomenex SecurityGuard 4.0 mm × 2.0 mm pre-olumn. The chromatographic run was carried out by a binaryobile phase of water and acetonitrile, using the following pro-
ram: isocratic with 28% acetonitrile for 8 min; linear gradient from8% to 35% in 2 min; isocratic with 35% acetonitrile for 8 min; linearradient from 35% to 50% in 4 min; isocratic with 50% acetoni-rile for 7 min; total run time 29 min. The injection volume was0 �L for liver extracts and 10 �L for urine, while the flow-rate was
.5 mL min−1. The LC was interfaced to an Applied Biosystems API000 triple–quadrupole mass spectrometer (Applied Biosystemsciex, Ontario, Canada), operating in atmospheric pressure chemi-al ionization (APCI) – positive ion mode. The other MS parametersere set as follows: curtain gas: 10 psi; nebulizer gas: 50 psi; probeica Acta 700 (2011) 95– 104
temperature: 300 ◦C; gas for collisional activation: N2 at 2 psi; neb-ulizer current: 3 �A; entrance potential: 10 V. Ion acquisition wasoperated at unit mass resolution in the selected reaction mon-itoring (SRM) mode, using the transitions from the protonatedmolecular ion of each analyte to the fragment ions indicated inTable 1.
2.7. Analytical method validation
The guiding principles expressed in the Commission Decision2002/657/CE were followed to validate our analytical method onboth urine and liver samples. Positive identification of the ana-lytes was expressed by the recognition of 4.5 identification points,namely the SRM transitions listed in Table 1. Specificity, linearity,precision (in terms of repeatability and within-laboratory repro-ducibility), trueness, CC�, CC� and ruggedness were estimated fromdata collected at 3 different concentration levels (see below).
2.7.1. SelectivityTwenty different blank urine and liver samples were deconju-
gated, extracted and analyzed as described above. The occurrenceof possible interferences from endogenous substances was testedby monitoring the SRM profiles characteristic for each investi-gated compound, at the retention time interval expected for theirelution.
2.7.2. LinearityInstrumental linearity is not prescribed as a validation parame-
ter by the Decision 2002/657/CE. Notwithstanding, this parameterwas studied in order to estimate if the quantification range of themethod lied within the instrumental dynamic linear range. Sixincreasing concentrations of each analyte pure standard solutions(0.2, 0.5, 1.0, 5.0, 10.0 and 20.0 �g L−1, two replicates for each level)were injected, to set up the linearity testing curves. Slope and inter-cept were determined by the squares regression method and thefit was verified using squared correlation coefficients (R2).
2.7.3. Matrix effectsMatrix effects possibly due to ion-enhancement or ion-
suppression were evaluated by comparing the slopes of thecalibration curves obtained by spiking the blank urine extracts withthose arising from water standard solutions. A t-test at 95% confi-dence level was used to compare each couple of slopes.
2.7.4. Precision–truenessValidation levels for urine were set at 0.5, 1.0 and 1.5 �g L−1 for
each analyte, while for liver samples the spiked concentration lev-els were 0.5, 1.0 and 2.0 �g kg−1 for dexamethasone and prednisoneand 0.5, 2.0 and 5.0 �g kg−1 for prednisolone. Trueness, repeatabil-ity and intra-laboratory reproducibility were estimated for bothmatrices by quantifying the analytes from 18 validation replicatesat the three validation levels cited, using the IS correction factor.An ANOVA test was set for each validation level, by means of whichrepeatability CV% and within-laboratory reproducibility were cal-culated.
2.7.5. CC˛ and CCˇ
The lowest concentration level used for the method validationon dexamethasone prednisone and prednisolone was 0.5 �g L−1
(�g kg−1 for liver). The decision limit (CC�) at ̨ = 1% was calculatedfrom the within-laboratory reproducibility standard deviation(WR) value at the lowest validation level:
CC˛ = 0.5 + 2.33 × WRlowest validation level

F.T. Cannizzo et al. / Analytica Chimica Acta 700 (2011) 95– 104 99
Table 1Mass spectrometric acquisition parameters for selected reaction monitoring operating mode.
Analyte Precursor ionm/z
Declustering potential (V) Product ions (Q = quantifier transition) Collision energy (V) Collision cell exit potential (V)
Prednisone 359.1 70359.0 → 313.2 Q 19 9359.1 → 295.2 20 9359.1 → 267.2 21 7
Prednisolone 361.3 55361.3 → 265.2 24 9361.3 → 279.2 Q 18 9361.3 → 223.2 29 9
Dexamethasone 393.3 55393.3 → 373.2 Q 15 11393.3 → 355.4 19 11
337.3
421.3 403.4
cdl
C
2
tvaral
2
(obAe
tusfwp
ptt
3
3
iaonaamt
393.3 →Triamcinoloneacetonide D6
441.4 65441.4 →441.4 →
Similarly, the detection capability (CC�) at ̌ = 5% was cal-ulated from the value obtained by pooling the standardeviations (WRpooled) from the first and second validation
evels:
Cˇ = CC˛ + 1.64 × WRpooled
.7.6. Extraction recoveryThe extraction recoveries were estimated for each analyte in
he urine matrix by quantifying (by external calibration) the 18alidation replicates for each validation level. For each level, theverage recovery and its respective CV% were calculated. Theecovery factor, for liver extraction was evaluated by means ofn identical procedure and calculated on the lowest validationevel.
.7.7. RuggednessRuggedness test was conducted by introducing slight variations
±10% maximum) to previously selected analytical parameters andbserving the resulting changes in term of quantitative response onlank liver and urine samples spiked at the lowest validation level.
Youden approach was used, in order to minimize the number ofxperiments required.
Parameters selected for the liver procedure were: extrac-ion buffer pH (4.5–5.5), weight of blank matrix (2.2–2.8 g)sed to set each point of the calibration curve, centrifugationpeed (3000–4000 rpm), extract drying temperature (45–55 ◦Cor liver; 35–45 ◦C for urine) and composition (65/35–75/25ater/acetonitrile) of the solution used to redissolve the extractrior of the LC–MS injection.
For urine analysis, the following parameters were tested: tem-erature and duration of the deconjugation step, extract dryingemperature and composition of the solution used to redissolvehe extract prior of the LC–MS injection.
. Results
.1. Gross and microscopic findings in the thymus
The absolute and relative thymus weights for the animalsncluded in the trials are reported in Table 2. From the data rel-tive to trial 1, it is evident that the thymus weight and volumef the animals treated with dexamethasone (group A) were sig-
ificantly (P = 0.0047) reduced with respect to the ones of controlnimals (group C). In fact, the thymus mean weight of groups And C was respectively of 217 ± 94 g and 415 ± 116 g (Table 2). Evenore significant (P = 0.0021) differences are found when the rela-ive thymus weights are compared, as the confidence intervals for
18 10
Q 15 14 21 13
groups A (0.16–0.42 g kg−1) and group C (0.46–0.92 g kg−1) do notoverlap at all.
Both cervical and thoracic portions of the thymuses of groupB animals appeared normal. Accordingly, their mean absolute andrelative weight were 646 ± 215 g and 0.91 ± 0.30, apparently evenhigher than in control group C. This slightly higher weight of groupB thymuses with respect to control group C was nonetheless notsignificant, particularly as their relative weights are comparedby a Student t-test at 95% confidence level, yielding an exper-imental value of 1.44 vs. a tabulated value of 2.31. Applicationof non-parametric Mann–Whitney statistic test to groups A, Band C data yielded the same conclusions drawn from parametrict-test.
By a morphological point of view, group A showed severe thy-mus atrophy, characterized by a serious volume reduction of theorgan, which in some animals almost disappeared and was replacedby fat tissue. Histologically, group A showed severe thymic corticalatrophy, while the medullary framework was still present thoughreduced, showing a pronounced rarefaction of lymphocytes. Thethymic cortex was almost completely replaced by fat tissue leavingonly scattered remnants localised close to the medulla. In contrast,group B thymuses appeared both macroscopically and histologi-cally normal. The histology of the thymus of the control beef cattle(group C) was similar to that of young calves. The parenchyma hadnormal features characterised by a cortex filled with proliferat-ing T cells with a smaller proportion of associated epithelial cells.More mature T cells were found in the medulla, where epithelialcells, dendritic cells and macrophages were more abundant. Almostnone, or very few, adipose cells were observed in the peripherallayers of the cortex.
The results of trial 2 confirmed the outcome of trial 1 forgroup B animals, even though the dose of prednisolone adminis-tered to group D animals was doubled with respect to group B.In fact, the thymus weight and volume of the control (group K:642 ± 173 g) and treated (group D: 727 ± 275 g) animals were notsignificantly different (t = 0.71; P = 0.4930). The mean relative thy-mus weight of groups K and D turned out even closer (1.12 ± 0.35vs. 1.18 ± 0.51 g kg−1; t = 0.26 vs. t0.95 = 2.15). Macroscopically andhistologically thymuses of group D were as normal like controls,showing similar findings of groups B and C of trial 1.
3.2. Validation and interpretation of results
An overview of the results obtained for the analytical method
validation is given in Table 3.3.2.1. SelectivityThe SRM chromatographic profiles obtained from 20 blank
matrix samples (urine and liver) did not show the presence of any

100 F.T. Cannizzo et al. / Analytica Chimica Acta 700 (2011) 95– 104
Table 2Absolute and relative thymus weight of treated (A, B, D) and control (C, K) animals.
Absolute weight (g) Trial 1 Trial 2
Groups A* B C* D K
Individualvalues (g)
247 552 358 612 508157 395 249 878 869194 976 600 555 641202 754 393 1323 535115 466 438 488 833387 732 451 569 464
809 §
580 §
Average 217 646 415 727 642Standard deviation 94 215 116 275 173Confidence intervals (c.l. 95%) 118–316 420–872 293–536 497–957 460–823Experimental (tabulated) A vs. C B vs. C A vs. B D vs Kt-Student value (c.l. 95%) 3.24 2.31 4.46 0.71
(2.31) (2.31) (2.31) (2.15)P-value for null-hypothesis 0.0047 0.0509 0.0015 0.4930
Relative weight (g kg−1) Trial 1 Trial 2
Groups A B C D K
Individual values(g kg−1)
0.31 0.84 0.62 1.212 0.9680.20 0.56 0.41 1.557 1.6400.28 1.38 1.07 0.925 0.9600.27 1.03 0.61 2.224 0.8430.15 0.65 0.69 0.683 1.4880.51 0.98 0.75 0.834 0.810
1.172 §
0.824 §
Average 0.29 0.91 0.69 1.18 1.12Standard deviation 0.12 0.30 0.22 0.51 0.35Confidence intervals (c.l. 95%) 0.16–0.42 0.60–1.22 0.46–0.92 0.76–1.60 0.75–1.49Experimental (tabulated) A vs. C B vs. C A Vs. B D vs. Kt-Student value (c.l. 95%) 3.95 1.44 4.75 0.26
(2.31) (2.31) (2.31) (2.15)
*§ drawa
stti
TI
P-value for null-hypothesis 0.0021 0.1842
Data partially published by Cannizzo et al. [22]. Two control animals of the K group were not slaughtered six days after drug with
ignificant signal (S/N < 3) at the relative retention time typical ofhe studied compounds and the internal standard, indicating thathe method is selective and no interfering substances are presentn the biological matrices.
able 3ntralaboratory precision (CV%), recovery (%), bias (%), CC� and CC� values (�g L−1) for the
Urine
Intralaboratory reproducibility (CV %) Reco
Analyte concentration 0.5 (�g L−1) 1.0 (�g L−1) 1.5 (�g L−1) 0.5 (
Dexamethasone 7.3 4.8 2.5 88 ±Prednisone 13.5 10.7 4.8 57 ±Prednisolone 14.4 9.1 7.1 39 ±
Liver
Intralaboratory reproducibility (CV%)
Analyte concentration 0.5 (�g kg−1) 1.0*–2.0** (�g kg−1) 2.0*–5.0** (�
Dexamethasone* 17.5 13.3 8.1
Prednisone* 17.4 15.7 10.7
Prednisolone** 9.2 12.7 7.9
Urine
Bias (%)
Analyte concentration 0.5 (�g L−1) 1.0 (�g L−1) 1.5 (�g L−1)
Dexamethasone* +1% −1% 0%
Prednisone* −8% +8% −3%
Prednisolone** +3% 0% 0%
0.0012 0.7963
l.
3.2.2. LinearityCalibration curves built from standard solution were linear in
the range 0.2–20 �g L−1. All analytes were visually checked for lin-ear fit. The calibration fit showed squared correlation coefficients
three analytes at three concentration values.
very (%) Mean ± St. dev. CC� (�g L−1) CC� (�g L−1)
�g L−1) 1.0 (�g L−1) 1.5 (�g L−1)
11 64 ± 14 57 ± 16 0.59 0.65 5 39 ± 4 30 ± 3 0.66 0.79 6 30 ± 9 26 ± 9 0.67 0.80
Recovery (%) Mean ± St. dev. CC� (�g L−1) CC� (�g L−1)
g kg−1) 0.5 (�g kg−1)
88 ± 24 0.70 0.8893 ± 6 0.70 0.9045 ± 7 0.61 0.75
Liver
Bias (%)
0.5 (�g kg−1) 1.0*–2.0** (�g kg−1) 2.0*–5.0** (�g kg−1)
+18% −6% −9%−12% +10% −2%+10% +14% 0%
Chim
(abesl
3
ftwddat
3
mfssis
btac
3
iteepsoectfeat
3
dpbpofcslq
3
mto
F.T. Cannizzo et al. / Analytica
R2) of 0.9999, 0.9993 and 0.9993 for dexamethasone, prednisonend prednisolone respectively. The quantification range lies, foroth liver and urine method, within the instrumental dynamic lin-ar range. Calibration curves, based on spiked blank urine and liveramples and created before each analytical session, also provedinear without exception.
.2.3. Matrix effectsThe slopes of the calibration curves built by spiking the extracts
rom either water or blank urine samples were compared andhe percent differences were used to test the matrix effect,hich appeared modest (≤4%) and statistically not significant forexamethasone, prednisolone and prednisone. Accordingly, theifferences are shared between positive (dexamethasone +4.0%)nd negative (prednisolone −2.2% and prednisone −3.3%). Uncer-ainties in slope values ranged from 1% to 3%.
.2.4. Precision and truenessIntra-laboratory reproducibility was expressed by the experi-
ental coefficients of variation, ranging between 2.5% and 14.4%or the spiked urine samples and between 7.9% and 17.5% for thepiked liver samples. Although the Decision 2002/657/CE does notet a fixed intra-laboratory CV limit at the concentration range usedn this study, precision values below 20% are considered entirelyatisfactory by any validation protocol.
Quite similarly, limited bias from true values were recorded foroth urine (0–8%) and liver (0–18%) samples. Taking into accounthat the IS correction factor compensated for extraction yields vari-bility, very reasonable and repeatable concentration assessmentould be obtained.
.2.5. Sensitivity, CC˛ and CCˇ
The present method was optimized with the purpose of detect-ng considerably small concentrations of the analytes: althoughhe quantification range yielding acceptable accuracy was notxpanded below 0.5 �g L−1, limit of detection (LOD) values werestimated around 0.05 �g L−1, one order-of-magnitude lower. Fig. 1resents the SRM chromatograms obtained from a blank urineample spiked with the three analytes at 0.5 �g L−1 concentration;nly the quantifier transition is shown for each analyte. S/N ratiosxceeding 35 were observed for all substances, from which theited LOD values were calculated. Accordingly, concentrations inhe range 0.05–0.5 �g L−1, occasionally detected in real samplesrom pharmacokinetic experiments (see below), have to be consid-red as reasonable estimations, not accurate determinations. CC�
nd CC� values, calculated from the lowest validation concentra-ion, homogeneously exceeded this limit of 0.5 �g L−1.
.2.6. Extraction recoveryThe extraction recoveries reported in Table 3 give evidence that
examethasone is more extensively extracted than prednisone andrednisolone, possibly due to the hydrophobic character impartedy its fluorine atom. Moreover, recoveries appear to be more com-lete from liver than from urine. Although the absolute recoveriesf prednisone and prednisolone from urine are not entirely satis-actory (ranging around 30–40%), the extraction yields are ratheronstant. This repeatability, together with the use of an internaltandard (i.e. triamcinolone acetonide-d6) in real sample analysis,argely compensate for incomplete recoveries, resulting in accurateuantitation of the analytes.
.2.7. RuggednessBy using the Youden approach, eight experiments for each
atrix were performed to test the method robustness. No statis-ically significant variation of the detected concentrations werebserved by changing by 10% the extraction buffer, pH, weight
ica Acta 700 (2011) 95– 104 101
of blank matrix, extract drying temperature and composition ofthe residue dissolving solution (liver), nor from temperature andduration of the deconjugation step, extract drying temperature andcomposition of the residue dissolving solution (urine).
3.3. Dexamethasone and prednisolone excretion kinetics
Quantitative determination results for the real urine samplesarising from the experimental trials are reported in Table 4. It isevident that dexamethasone was detected in all group A samplescollected during the period of drug administration, although at lowconcentration level, and was not detectable anymore six days afterthe end of the treatment. Average dexamethasone concentration(�g L−1) in group A samples was 0 (day 0), 1.27 (day 7), 1.94 (day15), 1.05 (day 25) and 0 (day 47) respectively. Fig. 2a reports theSRM chromatograms of the three transitions characteristic for dex-amethasone, obtained from animal 7A at day 25.
In contrast, prednisolone was detected in most, but not all, theurine samples collected when the drug treatment was going on(groups B and D), despite the significantly higher dose administeredwith respect to dexamethasone (20–40 times higher). Apparently,the detected concentrations do not depend on the administereddose, as they turned out lower for the higher dose (group D vs. groupB). Average prednisolone concentration in group B urines, repre-senting the sum of both conjugate and free form of the analyte, was0 (day 0), 0.66 (day 8), 0.95 (day 18) and 0 (day 42) �g L−1, respec-tively. Again, no detectable residues were found in the samplestaken at the slaughterhouse. An example of prednisolone excre-tion determination is reported in Fig. 2b, showing the three SRMprofiles for prednisolone, obtained from animal 13B at day 8 withapproximate concentration of 0.27 �g L−1. Prednisone was foundat even lower concentrations, as it is formed as a metabolite fromthe interconversion of prednisolone. Its average concentration was0.09 �g L−1 both at day 8 and day 18 samples.
It is worth noting that prednisolone and prednisone were notdetected in any urine of control animals nor in the ones of groupA animals and at day 0 (i.e. before the beginning of the drug treat-ments), supporting the theory that they are unlikely to be producedas endogenous substances, at least not for Charolaise and Friesianhealthy male cattle 10–22 months old, or are perhaps produced atextremely low and barely detectable concentrations.
All liver samples collected from the animals treated with dex-amethasone showed the presence of the drug at trace level, i.e.largely below the CC� value (0.70 �g L−1), whereas all liver sam-ples yielded negative results for the presence of both prednisoloneand prednisone.
4. Discussion
Gross and microscopic evidences noticed during the presentstudy in the thymus of beef cattle treated with synthetic cor-ticosteroids are quite clear. On one hand, thymus atrophyfollowing long term administration of low doses of dexametha-sone, already observed in previous studies [23,24], has been fullyconfirmed. Extensive thymus modifications induced by dexam-ethasone administration are testified by both highly significantvolume and weight reductions and severe histological modifica-tions. In particular, massive lymphoid depletion was observed,together with important fat infiltration into the parenchyma.
On the other hand, similar long term treatment of beef cattle
with prednisolone appears to have no effects on the thymus tissue,also when increasing doses are administered to different breeds, asdemonstrated by trials 1 and 2. Even more surprising is the absenceof any macroscopic reduction of the thymuses volume and weight:the average thymus weight of the cattle treated with prednisolone
102 F.T. Cannizzo et al. / Analytica Chimica Acta 700 (2011) 95– 104
Table 4Quantitative determinations of dexamethasone, prednisolone and prednisone on real urine samples from the experimental trials. All concentrations are expressed as �g L−1.“n.d.” stands for “not detected”.
Animal ID Dexamethasone Prednisone Prednisolone
Day 0 Day 7 Day 15 Day 25 Day 47 All samples All samples
7 A n.d. 2.19 2.54 2.51 n.d. n.d. n.d.8 A n.d. 2.03 3.07 2.38 n.d. n.d. n.d.9 A n.d. 1.19 2.37 0.10 n.d. n.d. n.d.10 A n.d. 1.03 0.11 0.06 n.d. n.d. n.d.11 A n.d. 0.10 3.43 0.13 n.d. n.d. n.d.12 A n.d. 1.08 0.13 1.15 n.d. n.d. n.d.
Animal ID Dexamethasone Prednisone Prednisolone
All samples Day 0 Day 8 Day 18 Day 42 Day 0 Day 8 Day 18 Day 42
13 B n.d. n.d. 0.10 0.12 n.d. n.d. 0.27 0.60 0.1014 B n.d. n.d. 0.16 n.d. n.d. n.d. 1.16 0.73 n.d.15 B n.d. n.d. 0.10 0.07 n.d. n.d. 0.91 0.96 n.d.16 B n.d. n.d. n.d. 0.09 n.d. n.d. n.d. 1.18 0.0917 B n.d. n.d. 0.06 0.15 n.d. n.d. 1.04 1.32 n.d.18 B n.d. n.d. 0.11 0.13 n.d. n.d. 0.59 0.92 n.d.
ID Dexamethasone Prednisone Prednisolone
19–24 C n.d. n.d. n.d.
Animal ID Dexamethasone Prednisone Prednisolone
All samples Day 0 Day 10 Day 31 Day 41 Day 0 Day 10 Day 31 Day 41
25 D n.d. n.d. <0.10 <0.10 n.d. n.d. 0.51 <0.10 n.d.26 D n.d. n.d. <0.10 n.d. <0.1 n.d. <0.10 n.d. n.d.27 D n.d. n.d. n.d. n.d. n.d. n.d. <0.10 <0.10 n.d.28 D n.d. n.d. n.d. <0.10 n.d. n.d. n.d. 0.68 n.d.29 D n.d. n.d. n.d. <0.10 n.d. n.d. n.d. 0.67 n.d.30 D n.d. n.d. n.d. n.d. n.d. n.d. n.d. n.d. n.d.31 D n.d. n.d. <0.10 n.d. n.d. n.d. n.d. n.d. n.d.32 D n.d. n.d. <0.10 n.d. n.d. n.d. n.d. n.d. n.d.
nison
ifoigscivedfns
tlibvaolpduida
ID Dexamethasone Pred
All K n.d. n.d.
s even higher than that of the control groups, although the dif-erences are not statistically significant. The direct consequencef the lack of any macroscopic and microscopic thymus changen the animals treated with prednisolone, following two differentrowth-promoting protocols, is that this fundamental and highlyuggestive biological marker cannot be used anymore to unequivo-ally detect the illegal treatments with this corticosteroid moleculen beef cattle. The thymus atrophy observed by Groot et al. [21] ineal calves treated with prednisolone may be related to the differ-nt age and metabolism of animals still having an inactive rumen,ue to the particular liquid alimentation lasting for the life-longattening cycle. Moreover, this preliminary study cited [21] didot involve a statistically significant number of animals (only 3),ufficient to draw ultimate conclusions.
The most traditional tool used to detect illegal drugs adminis-ration in animal breeding is the chemical analysis of urine and/oriver samples. The detection and quantification of undeclared drugsn these biological matrices represent a clear proof of illegal breederehaviour and is generally sufficient to produce his judiciary con-iction. However, decreased and minute doses of corticosteroidsre nowadays administered to the animals for quite long periodsf time to produce unnatural weight increase, making the ana-ytical identification of the drug progressively more difficult. Inarticular, the inadequacy of most immunochemical methods for
etecting illegal dexamethasone administrations has been recentlynderlined [20]. Consequently, LC–MS/MS techniques are increas-ngly developed and utilized also for screening purposes, allowingirect, rapid, selective and sensitive detection of corticosteroids in
variety of biological matrices [12–19], thanks to the continuous
e Prednisolone
n.d.
improvement of instrumentation technology.The LC–MS/MS method described in the present study was opti-
mized and validated for the objectives of this research, but can beused for a broader range of corticosteroids or their metabolites,as long as the parameters required by the Commission Decision2002/657/EC are positively verified. In fact, the results obtainedin the validation process assure that the protocol used is concur-rently selective, precise, sensitive, robust and provides reasonablyaccurate determination of dexamethasone, prednisolone and pred-nisone in the low �g L−1 concentration range for both urine andliver, but the sample extraction and deconjugation treatments aresufficiently unspecific to be profitably applicable to other corticos-teroids. Besides, the chromatographic conditions were designedand successfully tested for the separation of dexamethasone andbetamethasone, as this appears to be necessary whenever the iden-tity of one specific epimer has to be unquestionably ascertained.
The quantitative analysis of target corticosteroids in real tri-als samples produced quite surprising results, particularly for thegroups B and D, arising from prednisolone treatments. In a previ-ous study [20], we already observed that very low concentrations(below 2 �g L−1) of dexamethasone were observed in the urineof cattle, during the second half of a 60-days long treatmentwith 0.7 mg day−1 dexamethasone sodium phosphate. The resultspresented in Table 4 for group A fully confirm this observation,
as dexamethasone urinary concentrations around 2 �g L−1 weredetermined, as in the first 30 days of the previous study.Much more unexpected were the extremely low concentrations(0.5–1.0 �g L−1) of prednisolone found in the urine of cattle treatedwith either 15 or 30 mg day−1 of prednisolone acetate, despite the

Chim
htovrrmcpimuwoftp
dbtcibcdfqPwscmpadftc
5
itbhogwp
alTdutattrtip
[
[
[
[
[
[[
[
F.T. Cannizzo et al. / Analytica
igher administered dose with respect to dexamethasone (20–40imes higher). Although much higher drug concentrations werebserved by Groot et al. [21] in the urine of prednisolone treatedeal calves, again the difference with respect to our study may beelated to the different age and metabolism of animals, not yetuminant, as well as on the higher dose, relative to the animalass (120 �g kg day−1 vs. 30–60 �g kg day−1). The partial inter-
onversion to prednisone does not compensate for the missingarent drug excretion, but no other metabolite could be clearly
dentified in these urine samples. Extensive and targeted phar-acokinetic studies have to be undertaken in the future to fully
nderstand the fate of administered prednisolone and to clarifyhether its metabolites have to be looked for among the exogenous
r the endogenous steroids. At the moment, very little is knownrom the scientific literature about prednisolone metabolites excre-ion in cattle, as well as on the possible illegal use of exogenousrednisolone.
The evidence that prednisolone and dexamethasone tend toecrease from urine during the drug administration and disappearoth in urine and liver samples at the end of the treatment, makeshe detection of treated animals at the slaughterhouse more diffi-ult. On the other hand, the absence of any prednisolone residuen control samples, as well as in the urines collected before theeginning of the treatments and in group A samples, apparentlyonfirms the exogenous origin of this molecule, at least when it isetected in urine and/or liver samples of beef cattle. As a matter ofact, urine samples collected from cows at slaughterhouse are fre-uently found positive to prednisolone (Italian National Residuelan), raising the question if the use of such illegal treatments isidespread or if other possible origins besides drug administration,
hould also be considered, for example microbial transformation ofortisol to prednisolone in urine samples contaminated by faecalatter [25] or stressing conditions [26]. However, the low level of
rednisolone residues found in urine of treated beef during the drugdministration, and their complete absence at the abattoir after 6ays withdrawal, suggests to consider the low positivity, possiblyound during the in field control activity, as a significant indica-ion of prednisolone administration, at least for the beef cattleategory.
. Conclusions
The present study clearly demonstrates that long term admin-stration of low doses of prednisolone to beef cattle does not causehymus atrophy, while dexamethasone induces thymus atrophy ineef cattle which is clearly detectable both macroscopically andistologically at the slaughterhouse after a withdrawal time ofne week. Consequently the gross and histopathological investi-ations do not appear to be useful in detecting illegal treatmentith prednisolone at the dosages used in our growth-promotingrotocols.
On the other hand, long-term low dosage administration of dex-methasone or prednisolone to beef cattle resulted in extremelyow drug residue concentrations in the urine of treated animals.herefore, a selective, sensitive, accurate robust and fully vali-ated analytical method based on LC–MS/MS (SRM) has to besed to detect these residues, as in the present study. Corticos-eroids determination in the urine samples of 34 animals collectedt regular time intervals before, during and after experimentalreatments with dexamethasone or prednisolone, as well as in
heir liver after slaughter, surprisingly revealed that prednisoloneesidual concentrations in urine samples were even lower thathose of dexamethasone, despite the much higher dose admin-stered to obtain a comparable pharmacological effect. Neitherresence of prednisolone was detected in the urine samples col-[
[
[
ica Acta 700 (2011) 95– 104 103
lected from 14 control animals, nor in the samples collectedbefore the beginning of the treatments (106 negative samplesoverall).
Since at present the endogenous origin of prednisolonein beef cattle breaded under regular conditions has notbeen demonstrated yet, even modest positivity in the urineand liver chemical analysis should be treated as a strongevidence of recent suspiciously fraudulent prednisoloneadministration in this category, even if a few alternativehypotheses for possible endogenous production in cowsunder anomalous breeding situations have recently been sug-gested. Conversely, further studies are needed to identifyreliable biomarkers in order to detect illegally treated beefwith prednisolone, either at the farm or at the slaughter.In this respect, metabolic transformation, drug kinetics andgenomic studies appear to be necessary to establish the mosttrustworthy markers and to investigate the ultimate fate ofprednisolone.
Acknowledgements
The authors are grateful to the Centro di Referenza diPatologia Comparata ‘Bruno Maria Zaini’, and the technicalstaff of the Department of Animal Pathology for their skil-ful assistance. This work was partially supported by RegionePiemonte “Prevenzione dell’uso di anabolizzanti in zootecnia:le bioteconologie nello sviluppo di disciplinari per la qual-ità e salubrità della carne e derivati”, by Ministero dellePolitiche Agricole Alimentari e Forestali, project SAFORISK, andby the italian Ministry of Education, University and Research(MIUR).
References
[1] L. Istasse, V. de Haan, C. Van Eenaeme, B. Buts, P. Baldwin, M. Gielen, D. Demeyer,J.M. Benfait, J. Anim. Physiol. Anim. Nutr. 62 (1989) 150–158.
[2] J. Sabbe, T. Van der Beken, BUFALAW, The illegal use of growth promoters inEurope, in: Comparative Report, Brussels, Belgium, 2001, pp. 15–16.
[3] D. Courtheyn, B. Le Bizec, G. Brambilla, H.F. De Brabander, E. Cobbaert, M.Van de Wiele, J. Vercammen, K. De Wasch, Anal. Chim. Acta 473 (2002) 71–82.
[4] Commission of the European Communities, Regulation 1999/508/EC, Off. J. Eur.Communities, Legis, L60 (1999) 16–52.
[5] F. Gottardo, M. Brscic, G. Pozza, C. Ossensi, B. Costiero, A. Marin, G. Cozzi, Animal2 (2008) 1073–1079.
[6] M. Fiori, E. Pierdominici, F. Longo, G. Brambilla, J. Chromatogr. A 807 (1998)219–227.
[7] D. Courtheyn, J. Vercammen, H.F. De Brabander, I. Vandenreyt, P. Batjoens, K.Vanoosthuyze, C. Van Peteghem, Analyst 119 (1994) 2557–2564.
[8] R. Renaville, S. Massart, G. Lognay, A. Devolder, M. Sneyers, M. Marlier, M.Severing, A. Burny, D. Portetelle, Anim. Prod. 59 (1994) 189–196.
[9] S.W. Eisenberg, G. Cacciatore, S. Klarenbeek, A.A. Bergwerff, A.P. Koets, Res. Vet.Sci. 84 (2008) 199–205.
10] J.-P. Antignac, B. Le Bizec, F. Monteau, F. Poulain, F. Andre, J. Chromatogr. B 757(2001) 11–19.
11] M.J. Groot, R. Schilt, J.S. Ossenkoppele, P.L. Berende, W. Haasnoot, J. Vet. Med.A 45 (1998) 425–440.
12] S. Rhea Savu, L. Silvestro, A. Haag, F. Sorgel, J. Mass Spectrom. 31 (1996)1351–1363.
13] J.-P. Antignac, B. Le Bizec, F. Monteau, F. Poulain, F. André, Rapid Commun. MassSpectrom. 14 (2000) 33–39.
14] O. van den Hauwe, F. Dumoulin, J.-P. Antignac, M.P. Bouche, C. Elliott, C. vanPeteghem, Anal. Chim. Acta 473 (2002) 127–134.
15] J.-P. Antignac, B. Le Bizec, F. Monteau, F. André, Steroids 67 (2002) 873–882.16] K. Deventer, F.T. Delbeke, Rapid Commun. Mass Spectrom. 17 (2003)
2107–2114.17] O. van den Hauwe, K. Campbell, S.R.H. Crooks, R. Schilt, C.H. van Peteghem, J.
AOAC Int. 88 (2005) 87–94.
18] K. Croes, L. Goeyens, W. Baeyens, J. van Loco, S. Impens, J. Chromatogr. B 877(2009) 635–644.19] A. Tölgyesi, V.K. Sharma, L. Kovacsics, J. Fekete, J. Chromatogr. B 878 (2010)
1471–1479.20] M. Vincenti, F. Girolami, P. Capra, M. Pazzi, M. Carletti, G. Gardini, C. Nebbia, J.
Agric. Food Chem. 57 (2009) 1299–1306.

1 a Chim
[
[
[
[24] F.T. Cannizzo, B. Miniscalco, F. Riondato, E. Bollo, G. Barbarino, P. Giorgi, C.
04 F.T. Cannizzo et al. / Analytic
21] M. Groot, R. Schilt, W. Haasnoot, P.L.M. Berende, Proceedings of the Euroresidue
III Conference, Veldhoven, The Netherlands, 6–8 May, 1996, pp. 440–445.22] F.T. Cannizzo, F. Spada, R. Benevelli, C. Nebbia, P. Giorgi, N. Brina, E. Bollo, B.Biolatti, Vet. Rec. 167 (2010) 338–343.
23] B. Biolatti, E. Bollo, F.T. Cannizzo, G. Zancanaro, M. Tarantola, M. Dacasto, M.Cantiello, M. Carletti, P.G. Biolatti, G. Barbarino, J. Vet. Med. A – Physiol. Pathol.Clin. Med. 52 (2005) 202–208.
[
[
ica Acta 700 (2011) 95– 104
Mazzini, B. Biolatti, Vet. Rec. 163 (2008) 448–545.25] F. Arioli, M. Fidani, A. Casati, M.L. Fracchiolla, G. Pompa, Steroids 75 (2010)
350–354.26] G. Pompa, F. Arioli, A. Casati, M. Fidani, L. Bertocchi, G. Dusi, Steroids,
doi:10.1016/j.steroids.2010.09.005 [Epub ahead of print].