Simple staining method for differentiating live and dead marine zooplankton in field samples
Upload
independentCategory
view
0download
0
Journal of Neuroimmunology xxx (2013) xxx–xxx
JNI-475718; No of Pages 9
Contents lists available at SciVerse ScienceDirect
Journal of Neuroimmunology
j ourna l homepage: www.e lsev ie r .com/ locate / jneuro im
Dexamethasone-FITC staining application for measurement of circadian rhythmicityof glucocorticoid receptor expression in mouse living thymocyte subsets
Anna Kowalik a, Ewelina Kiernozek a, Mariusz Kulinczak a, Klaudia Brodaczewska c, Ewa Kozlowska a,Katarzyna Gieczewska d, Carlo Riccardi b, Nadzieja Drela a,⁎a Department of Immunology, Faculty of Biology, University of Warsaw, Miecznikowa 1, 02-096 Warsaw, Polandb Department of Clinical and Experimental Medicine, Section of Pharmacology, University of Perugia, Via del Giochetto, 06122 Perugia, Italyc Department of Parasitology, Faculty of Biology, University of Warsaw, Miecznikowa 1, 02-096 Warsaw, Polandd Department of Plant Anatomy and Cytology, Faculty of Biology, University of Warsaw, Miecznikowa 1, 02-096 Warsaw, Poland
⁎ Corresponding author. Tel.: +48 22 55 41 127; fax:E-mail address: [email protected] (N. Drela).
0165-5728/$ – see front matter © 2013 Elsevier B.V. Allhttp://dx.doi.org/10.1016/j.jneuroim.2013.04.024
Please cite this article as: Kowalik, A., et al., Dreceptor expression in mouse living thymoc
a b s t r a c t
a r t i c l e i n f oArticle history:Received 27 November 2012Received in revised form 5 April 2013Accepted 30 April 2013Available online xxxx
Keywords:Glucocorticoid receptorThymocytesThymocyte subsetsDexamethasoneCircadian rhythm
Glucocorticoids are involved in the regulation of immune homeostasis and thymopoiesis and the integrationof the thymus function with the neuroendocrine system. Their regulatory function is closely related to gluco-corticoid receptor (GCR) expression. The aim of this study was to develop a method for the measurement ofGCR expression in mouse living thymocytes by flow cytometry. Using dexamethasone binding we haveshown differences in GCR expression among thymocyte subsets and their dependence on the circadianrhythm.
© 2013 Elsevier B.V. All rights reserved.
1. Introduction
Endocrine hormones are involved in the regulation of the activityof immune cells. Circulating, adrenal-deriving glucocorticoids (GCs)are one of the most important molecules transmitting circadian infor-mation to the immune system and modulating the activity of innateand adaptive immune cells through the hypothalamic–pituitary–adrenal axis (Logan and Sarkar, 2012). They are a group of small lipo-philic steroid hormones, which take part in many biological functionsassociated with metabolism, development, differentiation, immunity,reproduction and neural activity (Orth et al., 1992; Kellendonk et al.,1999; Ashwell et al., 2000). In addition, local production of GCs bythymic epithelial cells (TECs) and by thymocytes themselves pointsto the pivotal role of these hormones in the development of thymo-cytes with special interest shed on regulatory T cells (Vacchio et al.,1994; Ashwell et al., 2000; Chen et al., 2004). The expression of ste-roidogenic enzymes involved in the biosynthesis of GCs occurs inthe thymus, but it has also been described in T and B cells (Ashwellet al., 2000; Zhang et al., 2005; Qiao et al., 2008).
Although studies on corticosteroids and their receptors have beencarried out intensively for over 70 years, nowadays research on theendogenous and numerous synthetic glucocorticoids in humans andlaboratory rodents still remains an interesting subject (van der Laan
+48 22 55 41 203.
rights reserved.
examethasone-FITC staining ayte subsets, J. Neuroimmunol
and Meijer, 2008). More than half a century ago, cortisone wasgiven to patients suffering from rheumatoid arthritis for the firsttime and had become a commonly used immunosuppressive agent.Glucocorticoids by interacting with their receptors regulate the ex-pression of numerous genes encoding proteins, which play an impor-tant role as mediators in the immune system by inhibiting orstimulating the production of various cytokines, chemokines, adhe-sion molecules and cytokine receptors (Baschant and Tuckermann,2010; Coutinho and Chapman, 2011).
At the cellular level, both natural and synthetic GCs mediate theirbiological actions through the specific, intracellular glucocorticoidreceptor, which acts by activating or repressing the expression oftarget genes (Vegiopoulos and Herzig, 2007). Glucocorticoids canexert also a number of rapid effects that are independent of genetranscription. The non-genomic mechanisms of action occurringwithin minutes or even seconds can be mediated via non-specificinteractions with cytosolic glucocorticoid receptors (cGCRs) or specif-ic binding to membrane-bound receptors (mGCRs). Non-genomic GCactivities, similar to genomic GC activities, have immunosuppressive,anti-inflammatory features. They take part in early GC effects oninflammatory signal transduction cascades, calcium and sodiuminflux, neutrophil degranulation, phagocytosis by macrophages,cellular adhesion and many others (Stahn et al., 2007; Löwenberg etal., 2008). A variety of studies on immune cells contribute to the cor-relation of GCR expression with a cell activity and influence by gluco-corticoid regulation.
pplication formeasurement of circadian rhythmicity of glucocorticoid. (2013), http://dx.doi.org/10.1016/j.jneuroim.2013.04.024

2 A. Kowalik et al. / Journal of Neuroimmunology xxx (2013) xxx–xxx
The aim of our study was to develop a simple and quick method,which would enable the investigation of GCR expression level in liv-ing cells, and tracking of GCR expression changes in phenotypicallydifferent cells while avoiding their permeabilization. The mainmethods of glucocorticoid receptor estimation include radio-ligandbinding assay and flow cytometry using anti-GCR antibodies conju-gated with fluorochrome. The flow cytometry method had been de-veloped almost 15 years ago by Berki et al. (1998); however, todetermine cytosolic GCR, it requires the cell membrane perme-abilization step, thus preventing its usage for living cells. WesternBlot is a commonly used technique for the determination of GCR ex-pression, which allows the measurement of both the cytosolic and ac-tivated nuclear fractions of the GCR protein (Spencer et al., 2000;Ordyan et al., 2008; Noguchi et al., 2010), but, obviously, it cannotbe used for the estimation of GCR expression in living cells. Brewerand colleagues generated GFP (green fluorescent protein)-GCRknockin mice to assess GCR expression in individual cells (Brewer etal., 2002). However the research carried out on transgenic mice re-stricts the use of this method only to a selected strain of mice whichhas been modified.
Here we describe a flow cytometry method to detect and analyzethe expression of GCR in different thymocyte subsets using dexameth-asone conjugated with fluorescein (Dex-FITC). A similar techniqueusing Dex-FITC or other steroid hormone-fluorochrome complexeshas been already used by other researchers (Marchetti et al., 1989; Duet al., 2009). We proposed a modification of this method, which com-prises the best conditions for Dex-FITC/GCR binding in freshly isolatedthymocytes to track changes in the expression of GCR dependently oftheir maturation stage and to follow circadian changes of such expres-sion. We have chosen thymocytes as our cells of interest because theyexpress the highest level of GCR among cells of the immune system,their development is influenced by glucocorticoids and they exhibit dif-ferent sensitivity to GC-induced apoptosis (Miller et al., 1998; Ashwellet al., 2000; Berki et al., 2002).
We verified our method according to the following steps:
1. Selection of the working Dex-FITC concentration, which did not in-duce a marked increase in thymocyte apoptosis;
2. Analysis of GCR expression in freshly isolated thymocytes by flowcytometry using a selected concentration of Dex-FITC and evalua-tion of the binding specificity by competitive binding of dexameth-asone alone;
3. Analysis of GCR expression in the main thymocyte subsets;4. Verification of the method by using fluorochrome-conjugated anti-
GCR monoclonal antibody staining of permeabilized thymocytes;5. Verification of the method by Western Blot technique;6. Analysis of circadian rhythmicity of GCR expression in the main
thymocyte subsets.
2. Materials and methods
2.1. Animals
8–10 weeks old male 57BL/6 mice were used in experiments. Micewere bred and maintained in the animal facility at the Department ofBiology, University of Warsaw in the individually ventilated cages(IVC) system at 22 °C ± 2 °C, under photoperiod light/dark:10/14 hwith the time of lights on at 6 a.m., and food andwater were providedad libitum. All the procedures involving animal studies have been ap-proved by the local ethic commission.
2.2. Isolation of thymocytes
Mice were sacrificed with carbon dioxide at selected time points:between 7 and 10 a.m. to establish Dex-FITC staining conditions andto compare GCR expression by different methods, and at 7–8 a.m.
Please cite this article as: Kowalik, A., et al., Dexamethasone-FITC staining areceptor expression in mouse living thymocyte subsets, J. Neuroimmunol
and 7–8 p.m. for the examination of circadian rhythmicity of GCR ex-pression. Freshly isolated thymus glands were placed in cold PBS andimmediately homogenized. The cells were filtered through 100 μmcell strainer to remove tissue debris. Thymocyte suspensions wereprepared at the density of 8 × 10⁷ cells/ml in 0.5% bovine serum al-bumin (BSA) in PBS for further use for Dex-FITC and cell surfacemarkers staining.
2.3. Setting conditions for measurement of GCR by Dex-FITC staining
The purpose of these preliminary experiments was to establishoptimal conditions allowing Dex-FITC labeling of GCR without the in-duction of apoptosis. Thymocytes have been incubated with dexa-methasone (Sigma-Aldrich; D4902) concentrations ranging from20 nM to 20 μM. After incubation, thymocytes were washed twiceand the percentage of apoptotic cells was determined by Annexin Vand Propidium Iodide staining. The sensitivity of thymocytes toDex-induced apoptosis was evaluated by FACSCalibur and analyzedwith BD CellQuest software. The influence of temperature (4 °C or37 °C) and time of incubation (5–60 min) on thymocyte viabilitywas examined.
2.4. Flow cytometry GCR expression determination by Dex-FITC staining
4 × 10⁶ thymocytes in 0.5 ml of PBS were incubated with selectedconcentrations of Dex-FITC (Invitrogen) ranging from 100 nM to100 μM for 5, 15, and 30 min in 4 °C. Incubation was stopped by 5×dilution of sample with PBS and washed twice. The expression ofGCR is presented as the mean fluorescence intensity value (MFI).The specificity of GCR/Dex-FITC binding was tested by competitiveblocking by dexamethasone alone at the Dex:Dex-FITC = 1:1 ratio.Blocking step of incubation with Dex has been carried out for15 min in 4 °C, and has been followed by Dex-FITC incubation for15 min in 4 °C. To decrease unspecific binding, thymocytes havebeen washed twice in medium containing 20% FBS or permeabilizedand washed using the permeabilization buffer of the eBioscienceFoxp3/Transcription Factor Staining Buffer Set.
2.5. Flow cytometric analysis of the main thymocyte subsets and nTregs
To analyze the expression of GCR in the main thymocyte subsetsspecific monoclonal antibodies against surface markers have beenused. Thymocyte suspensions (each containing 4 × 10⁶ cells) in 0.5%BSA in PBS were incubated with monoclonal antibodies: anti-CD4/PE,anti-CD8/PerCP, and anti-CD25/APC, all from BD Pharmingen, for30 min in 4 °C in darkness and washed twice after labeling. Classicfour main thymocyte subsets are characterized by the expression ofspecific surface markers: double negative CD4−CD8− (DN), doublepositive CD4+CD8+ (DP), single positive CD4−CD8+ and CD4+CD8−
(SP CD8+ and SP CD4+). Thymus-deriving natural regulatory T cells(nTregs) consist a population of CD4+CD25+ differing in the contentof Foxp3-positive cells depending on the level of CD25 expression.Dex-FITC incubation was performed after surface markers staining. Toestimate the percentage of fully differentiated nTregs PE anti-mouse/rat/human Foxp3 Flow Kit (BioLegend) was used to determine the in-tracellular expression of the transcription factor Foxp3. Markers stain-ing was done according to the protocols provided by the company.
2.6. Flow cytometry GCR expression determination by anti-GCR mAbstaining
After staining of cell surface markers thymocytes have been fixedand permeabilized using eBioscience Fixation/Permeabilization and10× Permeabilization Buffers. GC receptors were stained by anti-GCR/FITC monoclonal antibody purchased from AbD Serotec. The ex-pression of GCR in each of the thymocyte subsets has been presented
pplication formeasurement of circadian rhythmicity of glucocorticoid. (2013), http://dx.doi.org/10.1016/j.jneuroim.2013.04.024

Fig. 1. A: Thymocyte viability after incubation with dexamethasone at 4 °C. Statistically significant differences between Dex-treated and control thymocytes are depicted by a star.Three separate experiments on 2 mice in each group have been performed. B: Thymocyte viability after incubation with dexamethasone at 37 °C. Statistically significant differencesbetween Dex-treated and control thymocytes are depicted by a star. Three separate experiments on 2 mice in each group have been performed.
3A. Kowalik et al. / Journal of Neuroimmunology xxx (2013) xxx–xxx
as the mean fluorescence intensity value (MFI). Isotype control hasbeen used to cut off non-specific from specific fluorescence in testedsamples.
2.7. Thymocyte subsets sorting
The main thymocyte subsets DN, DP, SP CD4+ and SP CD8+ weresorted on the basis of CD4 and CD8 expression by FACSAria (Becton-Dickinson) and used for Western Blot test.
2.8. Western Blot analysis of GCR
Aliquots containing 40 μg of total protein from each sorted thymocytesubset were separated by sodium dodecyl sulphate-polyacrylamide gelelectrophoresis (SDS-PAGE) (5–15%) with SDS-PAGE running buffer.The gels were run for 1 h at room temperature at a constant 100 V. Pro-teins were blotted onto 0.45 mm Trans-blot nitrocellulose membranes(Bio-Rad Laboratories) and incubated with primary anti-GCR antibodyand secondary goat anti-rabbit antibodies (Santa Cruz Biotechnology).
Please cite this article as: Kowalik, A., et al., Dexamethasone-FITC staining areceptor expression in mouse living thymocyte subsets, J. Neuroimmunol
2.9. Statistical analysis
In experiments related to the selection of optimal conditions forGCR expression examination in living thymocytes the statistical sig-nificance has been calculated using Student's t-test for independentsamples. Differences among more than two experimental conditionswere tested by the ANOVA one-way test. P b 0.05 was considered sig-nificant. In experiments determining Dex-FITC specificity binding toGCR and circadian rhythmicity of GCR expression in nTregs, statisticalsignificance has been calculated using the nonparametric Kolmogo-rov–Smirnov test (K–S test). At least 3 experiments, 2–3 mice ineach experiment, have been performed for every point of the study.The results presented on figures are expressed as mean values ± SD.
3. Results
3.1. Selection of optimal conditions for the examination of GCR expressionin living freshly isolated thymocytes
In order to select the optimal conditions for GCR labeling withDex-FITC, we have examined the sensitivity of thymocytes to Dex-
pplication formeasurement of circadian rhythmicity of glucocorticoid. (2013), http://dx.doi.org/10.1016/j.jneuroim.2013.04.024
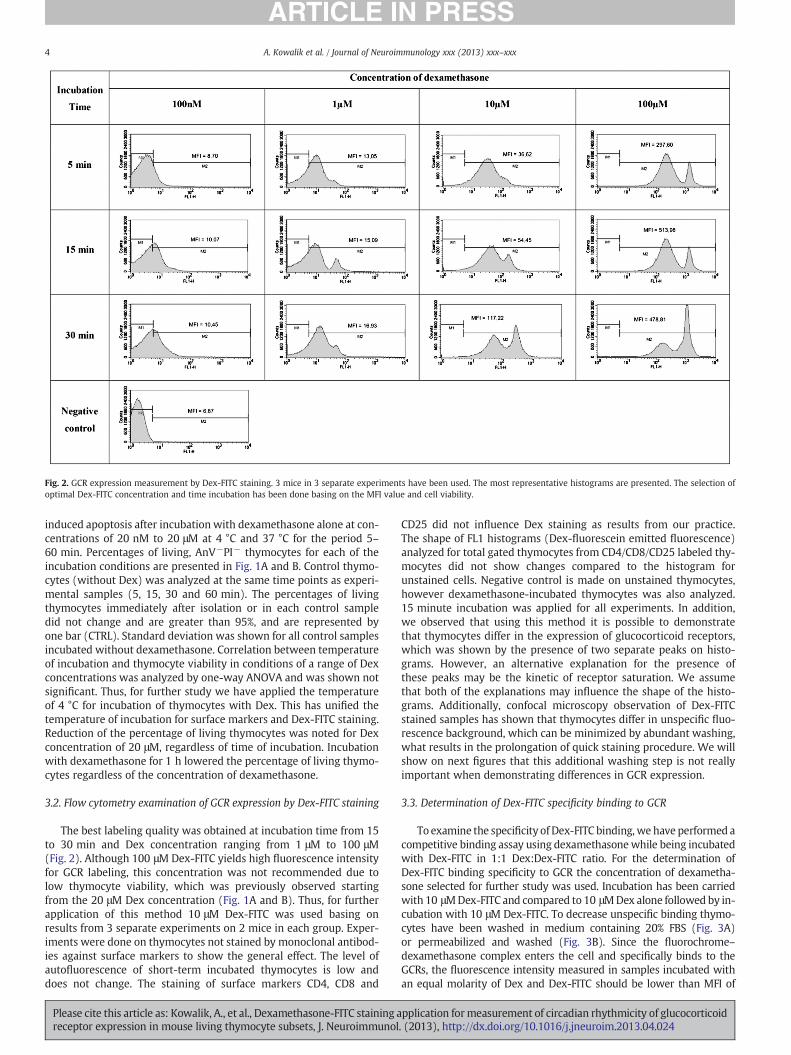
Fig. 2. GCR expression measurement by Dex-FITC staining. 3 mice in 3 separate experiments have been used. The most representative histograms are presented. The selection ofoptimal Dex-FITC concentration and time incubation has been done basing on the MFI value and cell viability.
4 A. Kowalik et al. / Journal of Neuroimmunology xxx (2013) xxx–xxx
induced apoptosis after incubation with dexamethasone alone at con-centrations of 20 nM to 20 μM at 4 °C and 37 °C for the period 5–60 min. Percentages of living, AnV−PI− thymocytes for each of theincubation conditions are presented in Fig. 1A and B. Control thymo-cytes (without Dex) was analyzed at the same time points as experi-mental samples (5, 15, 30 and 60 min). The percentages of livingthymocytes immediately after isolation or in each control sampledid not change and are greater than 95%, and are represented byone bar (CTRL). Standard deviation was shown for all control samplesincubated without dexamethasone. Correlation between temperatureof incubation and thymocyte viability in conditions of a range of Dexconcentrations was analyzed by one-way ANOVA and was shown notsignificant. Thus, for further study we have applied the temperatureof 4 °C for incubation of thymocytes with Dex. This has unified thetemperature of incubation for surface markers and Dex-FITC staining.Reduction of the percentage of living thymocytes was noted for Dexconcentration of 20 μM, regardless of time of incubation. Incubationwith dexamethasone for 1 h lowered the percentage of living thymo-cytes regardless of the concentration of dexamethasone.
3.2. Flow cytometry examination of GCR expression by Dex-FITC staining
The best labeling quality was obtained at incubation time from 15to 30 min and Dex concentration ranging from 1 μM to 100 μM(Fig. 2). Although 100 μM Dex-FITC yields high fluorescence intensityfor GCR labeling, this concentration was not recommended due tolow thymocyte viability, which was previously observed startingfrom the 20 μM Dex concentration (Fig. 1A and B). Thus, for furtherapplication of this method 10 μM Dex-FITC was used basing onresults from 3 separate experiments on 2 mice in each group. Exper-iments were done on thymocytes not stained by monoclonal antibod-ies against surface markers to show the general effect. The level ofautofluorescence of short-term incubated thymocytes is low anddoes not change. The staining of surface markers CD4, CD8 and
Please cite this article as: Kowalik, A., et al., Dexamethasone-FITC staining areceptor expression in mouse living thymocyte subsets, J. Neuroimmunol
CD25 did not influence Dex staining as results from our practice.The shape of FL1 histograms (Dex-fluorescein emitted fluorescence)analyzed for total gated thymocytes from CD4/CD8/CD25 labeled thy-mocytes did not show changes compared to the histogram forunstained cells. Negative control is made on unstained thymocytes,however dexamethasone-incubated thymocytes was also analyzed.15 minute incubation was applied for all experiments. In addition,we observed that using this method it is possible to demonstratethat thymocytes differ in the expression of glucocorticoid receptors,which was shown by the presence of two separate peaks on histo-grams. However, an alternative explanation for the presence ofthese peaks may be the kinetic of receptor saturation. We assumethat both of the explanations may influence the shape of the histo-grams. Additionally, confocal microscopy observation of Dex-FITCstained samples has shown that thymocytes differ in unspecific fluo-rescence background, which can be minimized by abundant washing,what results in the prolongation of quick staining procedure. We willshow on next figures that this additional washing step is not reallyimportant when demonstrating differences in GCR expression.
3.3. Determination of Dex-FITC specificity binding to GCR
To examine the specificity of Dex-FITC binding,we have performed acompetitive binding assay using dexamethasonewhile being incubatedwith Dex-FITC in 1:1 Dex:Dex-FITC ratio. For the determination ofDex-FITC binding specificity to GCR the concentration of dexametha-sone selected for further study was used. Incubation has been carriedwith 10 μMDex-FITC and compared to 10 μMDex alone followed by in-cubation with 10 μM Dex-FITC. To decrease unspecific binding thymo-cytes have been washed in medium containing 20% FBS (Fig. 3A)or permeabilized and washed (Fig. 3B). Since the fluorochrome–dexamethasone complex enters the cell and specifically binds to theGCRs, the fluorescence intensity measured in samples incubated withan equal molarity of Dex and Dex-FITC should be lower than MFI of
pplication formeasurement of circadian rhythmicity of glucocorticoid. (2013), http://dx.doi.org/10.1016/j.jneuroim.2013.04.024
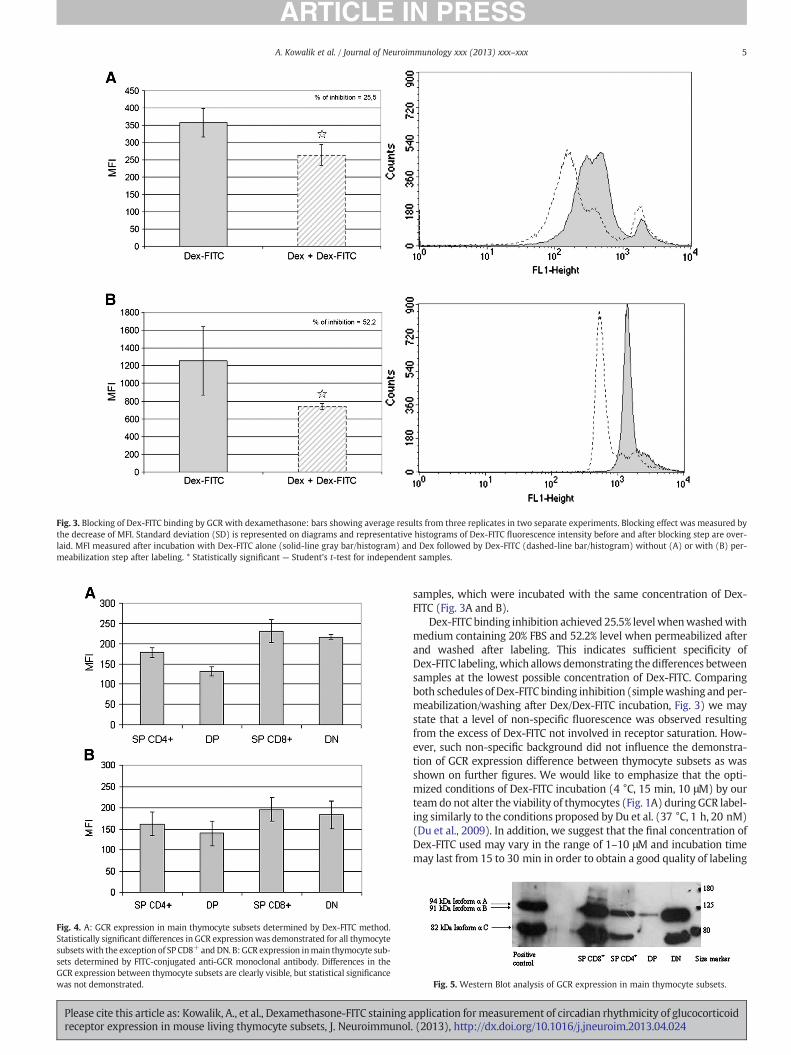
Fig. 3. Blocking of Dex-FITC binding by GCR with dexamethasone: bars showing average results from three replicates in two separate experiments. Blocking effect was measured bythe decrease of MFI. Standard deviation (SD) is represented on diagrams and representative histograms of Dex-FITC fluorescence intensity before and after blocking step are over-laid. MFI measured after incubation with Dex-FITC alone (solid-line gray bar/histogram) and Dex followed by Dex-FITC (dashed-line bar/histogram) without (A) or with (B) per-meabilization step after labeling. * Statistically significant — Student's t-test for independent samples.
Fig. 4. A: GCR expression in main thymocyte subsets determined by Dex-FITC method.Statistically significant differences in GCR expressionwas demonstrated for all thymocytesubsetswith the exception of SP CD8+ and DN. B: GCR expression inmain thymocyte sub-sets determined by FITC-conjugated anti-GCR monoclonal antibody. Differences in theGCR expression between thymocyte subsets are clearly visible, but statistical significancewas not demonstrated.
5A. Kowalik et al. / Journal of Neuroimmunology xxx (2013) xxx–xxx
Please cite this article as: Kowalik, A., et al., Dexamethasone-FITC staining areceptor expression in mouse living thymocyte subsets, J. Neuroimmunol
samples, which were incubated with the same concentration of Dex-FITC (Fig. 3A and B).
Dex-FITC binding inhibition achieved 25.5% levelwhenwashedwithmedium containing 20% FBS and 52.2% level when permeabilized afterand washed after labeling. This indicates sufficient specificity ofDex-FITC labeling, which allows demonstrating the differences betweensamples at the lowest possible concentration of Dex-FITC. Comparingboth schedules of Dex-FITC binding inhibition (simplewashing and per-meabilization/washing after Dex/Dex-FITC incubation, Fig. 3) we maystate that a level of non-specific fluorescence was observed resultingfrom the excess of Dex-FITC not involved in receptor saturation. How-ever, such non-specific background did not influence the demonstra-tion of GCR expression difference between thymocyte subsets as wasshown on further figures. We would like to emphasize that the opti-mized conditions of Dex-FITC incubation (4 °C, 15 min, 10 μM) by ourteam do not alter the viability of thymocytes (Fig. 1A) during GCR label-ing similarly to the conditions proposed by Du et al. (37 °C, 1 h, 20 nM)(Du et al., 2009). In addition, we suggest that the final concentration ofDex-FITC used may vary in the range of 1–10 μM and incubation timemay last from 15 to 30 min in order to obtain a good quality of labeling
Fig. 5. Western Blot analysis of GCR expression in main thymocyte subsets.
pplication formeasurement of circadian rhythmicity of glucocorticoid. (2013), http://dx.doi.org/10.1016/j.jneuroim.2013.04.024
6 A. Kowalik et al. / Journal of Neuroimmunology xxx (2013) xxx–xxx
without lowering thymocyte viability. Due to the practical aspect of ourresearchwe decided to use the shortest time of incubation and the con-centration of 10 μM,which allows the discrimination of thymocyte pop-ulations differing in GCR expression.
3.4. GCR expression in DN, DP and SP thymocytes estimated by differentmethods
Our results obtained using Dex-FITC staining for GCR expression inDN, DP, SP CD4+ and SP CD4− thymocyte subsets (Fig. 4A) correlatewith the results obtained by both the flow cytometry analysis usingmonoclonal anti-GCR antibodies (Fig. 4B) and Western Blot analysis(Fig. 5). All of these methods have shown that the highest expressionof the GCR was observed in SP CD8+ thymocytes, followed by DN andSP CD4+ populations, with the lowest level of GCR in DP thymocytes.
Comparing the GCR expression by different methods in the mainthymocyte subsets we stated that Dex-FITC method will be the bestmethod of choice to evaluate hormone receptor expression in veryrare population of T cells. Cell membrane permeabilization results insample cell loss during sequential washing and Western Blot requiresprevious cell sorting. Both techniques are poorly applicable to studyrare cell population. In addition, differences in GCR expressionobtained by Dex-FITC staining method were statistically significant,whereas those demonstrated by anti-GCR labeling showed the sametendency, but lack statistical significance.
3.5. Circadian rhythmicity of GCR expression
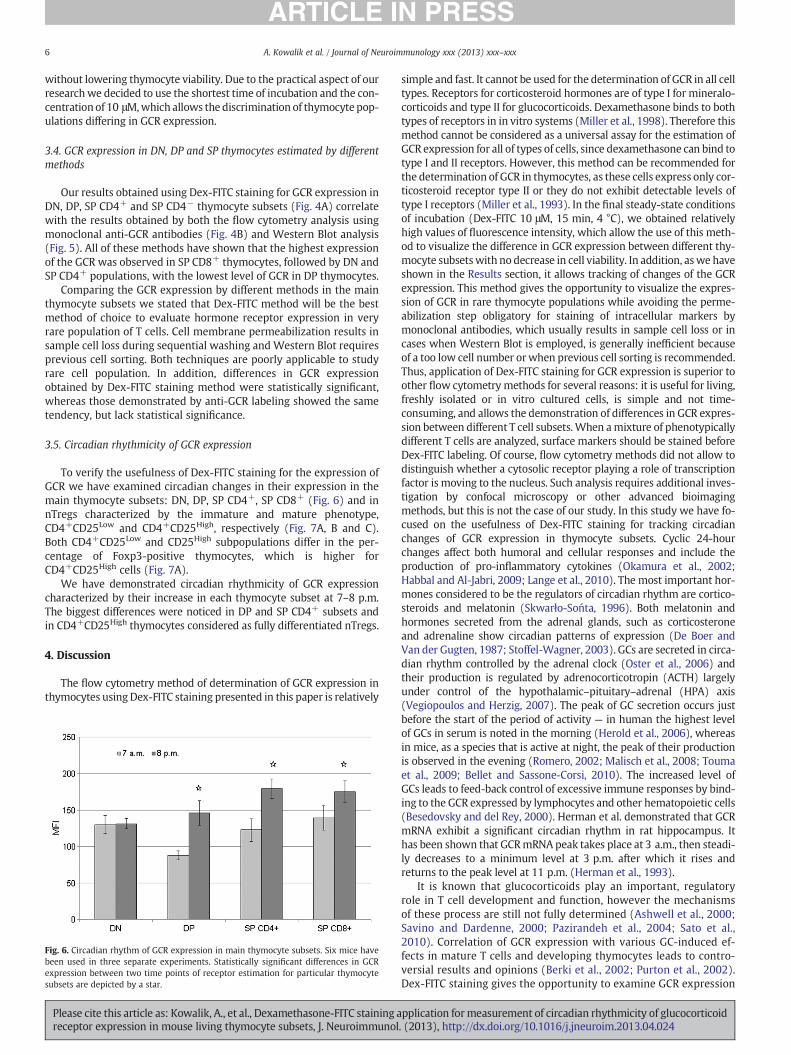
To verify the usefulness of Dex-FITC staining for the expression ofGCR we have examined circadian changes in their expression in themain thymocyte subsets: DN, DP, SP CD4+, SP CD8+ (Fig. 6) and innTregs characterized by the immature and mature phenotype,CD4+CD25Low and CD4+CD25High, respectively (Fig. 7A, B and C).Both CD4+CD25Low and CD25High subpopulations differ in the per-centage of Foxp3-positive thymocytes, which is higher forCD4+CD25High cells (Fig. 7A).
We have demonstrated circadian rhythmicity of GCR expressioncharacterized by their increase in each thymocyte subset at 7–8 p.m.The biggest differences were noticed in DP and SP CD4+ subsets andin CD4+CD25High thymocytes considered as fully differentiated nTregs.
4. Discussion
The flow cytometry method of determination of GCR expression inthymocytes using Dex-FITC staining presented in this paper is relatively
Fig. 6. Circadian rhythm of GCR expression in main thymocyte subsets. Six mice havebeen used in three separate experiments. Statistically significant differences in GCRexpression between two time points of receptor estimation for particular thymocytesubsets are depicted by a star.
Please cite this article as: Kowalik, A., et al., Dexamethasone-FITC staining areceptor expression in mouse living thymocyte subsets, J. Neuroimmunol
simple and fast. It cannot be used for the determination of GCR in all celltypes. Receptors for corticosteroid hormones are of type I for mineralo-corticoids and type II for glucocorticoids. Dexamethasone binds to bothtypes of receptors in in vitro systems (Miller et al., 1998). Therefore thismethod cannot be considered as a universal assay for the estimation ofGCR expression for all of types of cells, since dexamethasone can bind totype I and II receptors. However, this method can be recommended forthe determination of GCR in thymocytes, as these cells express only cor-ticosteroid receptor type II or they do not exhibit detectable levels oftype I receptors (Miller et al., 1993). In the final steady-state conditionsof incubation (Dex-FITC 10 μM, 15 min, 4 °C), we obtained relativelyhigh values of fluorescence intensity, which allow the use of this meth-od to visualize the difference in GCR expression between different thy-mocyte subsetswith no decrease in cell viability. In addition, aswe haveshown in the Results section, it allows tracking of changes of the GCRexpression. This method gives the opportunity to visualize the expres-sion of GCR in rare thymocyte populations while avoiding the perme-abilization step obligatory for staining of intracellular markers bymonoclonal antibodies, which usually results in sample cell loss or incases when Western Blot is employed, is generally inefficient becauseof a too low cell number orwhen previous cell sorting is recommended.Thus, application of Dex-FITC staining for GCR expression is superior toother flow cytometry methods for several reasons: it is useful for living,freshly isolated or in vitro cultured cells, is simple and not time-consuming, and allows the demonstration of differences in GCR expres-sion between different T cell subsets.When amixture of phenotypicallydifferent T cells are analyzed, surface markers should be stained beforeDex-FITC labeling. Of course, flow cytometry methods did not allow todistinguish whether a cytosolic receptor playing a role of transcriptionfactor is moving to the nucleus. Such analysis requires additional inves-tigation by confocal microscopy or other advanced bioimagingmethods, but this is not the case of our study. In this study we have fo-cused on the usefulness of Dex-FITC staining for tracking circadianchanges of GCR expression in thymocyte subsets. Cyclic 24-hourchanges affect both humoral and cellular responses and include theproduction of pro-inflammatory cytokines (Okamura et al., 2002;Habbal and Al-Jabri, 2009; Lange et al., 2010). The most important hor-mones considered to be the regulators of circadian rhythm are cortico-steroids and melatonin (Skwarło-Sońta, 1996). Both melatonin andhormones secreted from the adrenal glands, such as corticosteroneand adrenaline show circadian patterns of expression (De Boer andVan der Gugten, 1987; Stoffel-Wagner, 2003). GCs are secreted in circa-dian rhythm controlled by the adrenal clock (Oster et al., 2006) andtheir production is regulated by adrenocorticotropin (ACTH) largelyunder control of the hypothalamic–pituitary–adrenal (HPA) axis(Vegiopoulos and Herzig, 2007). The peak of GC secretion occurs justbefore the start of the period of activity — in human the highest levelof GCs in serum is noted in the morning (Herold et al., 2006), whereasin mice, as a species that is active at night, the peak of their productionis observed in the evening (Romero, 2002; Malisch et al., 2008; Toumaet al., 2009; Bellet and Sassone-Corsi, 2010). The increased level ofGCs leads to feed-back control of excessive immune responses by bind-ing to the GCR expressed by lymphocytes and other hematopoietic cells(Besedovsky and del Rey, 2000). Herman et al. demonstrated that GCRmRNA exhibit a significant circadian rhythm in rat hippocampus. Ithas been shown that GCRmRNA peak takes place at 3 a.m., then steadi-ly decreases to a minimum level at 3 p.m. after which it rises andreturns to the peak level at 11 p.m. (Herman et al., 1993).
It is known that glucocorticoids play an important, regulatoryrole in T cell development and function, however the mechanismsof these process are still not fully determined (Ashwell et al., 2000;Savino and Dardenne, 2000; Pazirandeh et al., 2004; Sato et al.,2010). Correlation of GCR expression with various GC-induced ef-fects in mature T cells and developing thymocytes leads to contro-versial results and opinions (Berki et al., 2002; Purton et al., 2002).Dex-FITC staining gives the opportunity to examine GCR expression
pplication formeasurement of circadian rhythmicity of glucocorticoid. (2013), http://dx.doi.org/10.1016/j.jneuroim.2013.04.024
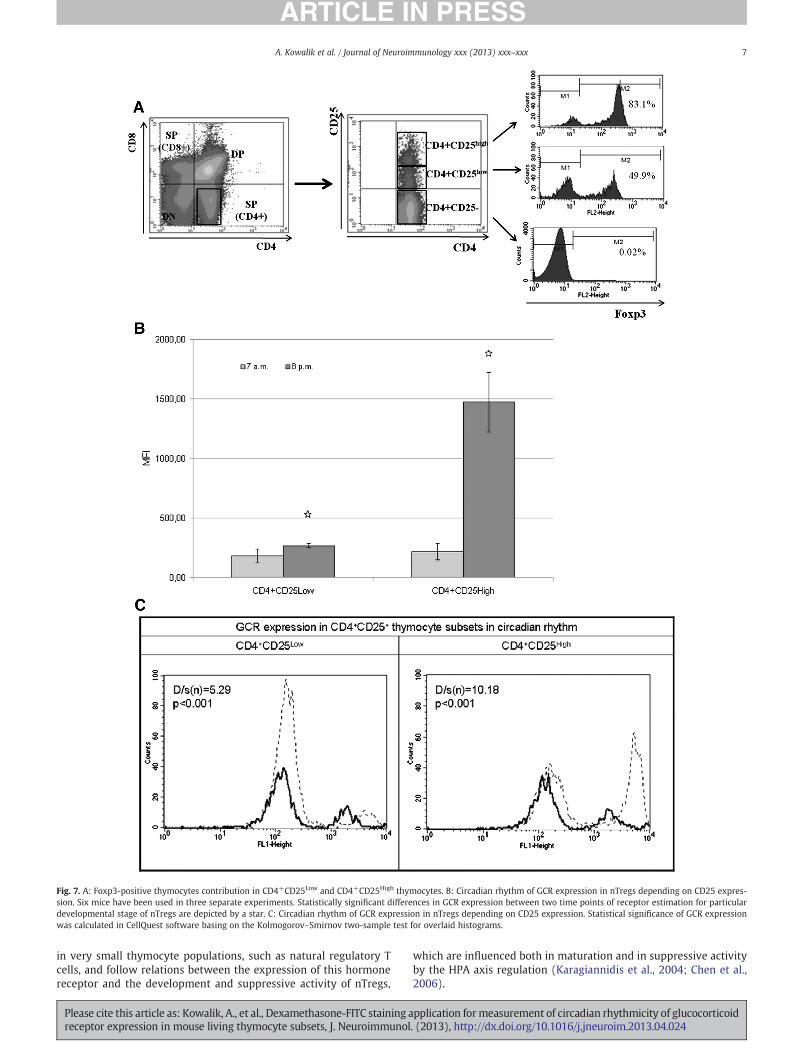
Fig. 7. A: Foxp3-positive thymocytes contribution in CD4+CD25Low and CD4+CD25High thymocytes. B: Circadian rhythm of GCR expression in nTregs depending on CD25 expres-sion. Six mice have been used in three separate experiments. Statistically significant differences in GCR expression between two time points of receptor estimation for particulardevelopmental stage of nTregs are depicted by a star. C: Circadian rhythm of GCR expression in nTregs depending on CD25 expression. Statistical significance of GCR expressionwas calculated in CellQuest software basing on the Kolmogorov–Smirnov two-sample test for overlaid histograms.
7A. Kowalik et al. / Journal of Neuroimmunology xxx (2013) xxx–xxx
in very small thymocyte populations, such as natural regulatory Tcells, and follow relations between the expression of this hormonereceptor and the development and suppressive activity of nTregs,
Please cite this article as: Kowalik, A., et al., Dexamethasone-FITC staining areceptor expression in mouse living thymocyte subsets, J. Neuroimmunol
which are influenced both in maturation and in suppressive activityby the HPA axis regulation (Karagiannidis et al., 2004; Chen et al.,2006).
pplication formeasurement of circadian rhythmicity of glucocorticoid. (2013), http://dx.doi.org/10.1016/j.jneuroim.2013.04.024
8 A. Kowalik et al. / Journal of Neuroimmunology xxx (2013) xxx–xxx
The involvement of glucocorticoids in the positive selection of thy-mocytes have been confirmed in a study showing that both low doseof GCs and the signal from CD3 can lead to positive selection, howeverwhen both signals occur at the same time, they affect the positive se-lection process (Boldizsár et al., 2003). On the other hand it seemsthat this cannot be the key process for the development of thymo-cytes, since mice with GCR gene knockout show no thymocyte devel-opment disorders (Herold et al., 2006).
The highest expression of GCR in lymphatic organs has been demon-strated in the thymus, followed by lymphatic nodes and spleen (Milleret al., 1998). Conflicting results related to the expression of GCR in thy-mocyte subsets may result not only from the method of detection, butalso from strain of mouse. Research carried out at thymocytes isolatedfrom BALB/cmice shows high GCR expression in DN and single positiveSP CD8+, and slightly lower in SP CD4+population,whereas DP thymo-cytes show low expression of GCR (Wiegers et al., 2001; Berki et al.,2002). Studies by other scientists have revealed additionally the highexpression of GCR in CD4+CD25+ regulatory T cells (Brewer et al.,2002). The expression Foxp3 transcription factor occurs in most of thy-mic CD4+CD25+ thymocytes and they constitute a population of natu-ral regulatory T cells (nTregs) (Sakaguchi et al., 2006). Moreover thesecells express not only higher levels of glucocorticoid receptor but alsoBcl-2, and are therefore more resistant to Dex-mediated cell deaththan CD4+CD25− T cells (Chen et al., 2004).
Using Dex-FITC staining method, we have demonstrated the highestexpressionofGCR in CD4+CD25+population of thymocytes,what is con-sistent with the data obtained by Brewer et al. (2002). High expression ofGCR has been also noted in a DN and SP CD8+ population, what is con-firmed by other authors (Wiegers et al., 2001). Moreover we havenoted, that expression of GCR differs according to maturation stage ofthymus-deriving nTregs measured by CD25 and Foxp3 expression(Fig. 7A). High GCR expression and its circadian rhythmicity is observedfor fully differentiated nTregs only (Fig. 7B and C). This elevated expres-sion of GCR in the evening correlates with the pattern of GC synthesisin mice. Our not yet published in full version results indicating circadianchanges in the content and suppressive activity of nTregs point on therole of glucocorticoids in these processes. We may state that there is apositive correlation in the content of nTregs in the thymus, their suppres-sive activity and plasma GC concentration (Kiernozek et al., 2010;Kiernozek et al., 2011). Circadian rhythm in the concentration of endog-enous glucocorticoids correlates with the changes in GCR expression inthymocyteswith the greatest difference related tomature CD4+CD25High
nTregs. It seems very likely that glucocorticoids and GCR play an impor-tant role in the generation of nTregs in the thymus considering the roleof these hormones in Foxp3 induction (Karagiannidis et al., 2004). It ispossible also that the role of glucocorticoids and their receptors differfor particular thymocyte subsets or stage of differentiation. Dex-FITCstaining for GCR estimation might be a good tool for correlating receptorexpression, hormone concentration and T cell function.
Conflict of interest
The authors declare no financial or commercial conflict of interest.
Acknowledgments
This study was supported by Grant Nos. N N303 395836 andBW-501/86-191113 from the Polish Ministry of Science and HigherEducation and Warsaw University Intramural Grant, respectively.
References
Ashwell, J.D., Lu, F.W., Vacchio, M.S., 2000. Glucocorticoids in T cell development andfunction. Annu. Rev. Immunol. 18, 309–345.
Baschant, U., Tuckermann, J., 2010. The role of the glucocorticoid receptor in inflamma-tion and immunity. J. Steroid Biochem. Mol. Biol. 120, 69–75.
Please cite this article as: Kowalik, A., et al., Dexamethasone-FITC staining areceptor expression in mouse living thymocyte subsets, J. Neuroimmunol
Bellet, M.M., Sassone-Corsi, P., 2010. Mammalian circadian clock and metabolism — theepigenetic link. J. Cell Sci. 123, 3837–3848.
Berki, T., Kumánovics, G., Kumánovics, A., Falus, A., Ujhelyi, E., Németh, P., 1998.Production and flow cytometric application of a monoclonal anti-glucocorticoid re-ceptor antibody. J. Immunol. Methods 214, 19–27.
Berki, T., Pálinkás, L., Boldizsár, F., Németh, P., 2002. Glucocorticoid (GC) sensitivity andGC receptor expression differ in thymocyte subpopulations. Int. Immunol. 14,463–469.
Besedovsky, H.O., del Rey, A., 2000. The cytokine-HPA axis feed-back circuit. Z.Rheumatol. 59 (Suppl. 2), 26–30.
Boldizsár, F., Pálinkás, L., Bartis, D., Németh, P., Berki, T., 2003. Antigen and glucocorti-coid hormone (GC) induce positive selection of DP thymocytes in a TcR transgenicmouse model. Immunol. Lett. 90, 97–102.
Brewer, J.A., Sleckman, B.P., Swat, W., Muglia, L.J., 2002. Green fluorescent protein-glucocorticoid receptor knockin mice reveal dynamic receptor modulation duringthymocyte development. J. Immunol. 169, 1309–1318.
Chen, X., Murakami, T., Oppenheim, J.J., Howard, O.M.Z., 2004. Differential response ofmurine CD4+CD25+ and CD4+CD25− T cells to dexamethasone-induced celldeath. Eur. J. Immunol. 34, 859–869.
Chen, X., Oppenheim, J.J., Winkler-Pickett, R.T., Ortaldo, J.R., Howard, O.M.Z., 2006. Glu-cocorticoid amplifies IL-2-dependent expansion of functional FoxP3(+)CD4(+)CD25(+) T regulatory cells in vivo and enhances their capacity to suppress EAE.Eur. J. Immunol. 36, 2139–2149.
Coutinho, A.E., Chapman, K.E., 2011. The anti-inflammatory and immunosuppressiveeffects of glucocorticoids, recent developments and mechanistic insights. Mol.Cell. Endocrinol. 335, 2–13.
De Boer, S.F., Van der Gugten, J., 1987. Daily variations in plasma noradrenaline, adren-aline and corticosterone concentrations in rats. Physiol. Behav. 40, 323–328.
Du, J., Li, M., Zhang, D., Zhu, X., Zhang, W., Gu, W., Feng, Y., Zhai, X., Ling, C., 2009. Flowcytometry analysis of glucocorticoid receptor expression and binding in steroid-sensitive and steroid-resistant patients with systemic lupus erythematosus. Arthri-tis Res. Ther. 11 (4), R108 (Epub 2009 Jul 14).
Habbal, O.A., Al-Jabri, A.A., 2009. Circadian rhythm and the immune response: a re-view. Int. Rev. Immunol. 28, 93–108.
Herman, J.P., Watson, S.J., Chao, H.M., Coirini, H., McEwen, B.S., 1993. Diurnal regulationof glucocorticoid receptor and mineralocorticoid receptor mRNAs in rat hippocam-pus. Mol. Cell. Neurosci. 4, 181–190.
Herold, M.J., McPherson, K.G., Reichardt, H.M., 2006. Glucocorticoids in T cell apoptosisand function. Cell. Mol. Life Sci. 63, 60–72.
Karagiannidis, C., Akdis, M., Holopainen, P., Woolley, N.J., Hense, G., Rückert, B., Mantel,P., Menz, G., Akdis, C.A., Blaser, K., Schmidt-Weber, C.B., 2004. Glucocorticoidsupregulate FOXP3 expression and regulatory T cells in asthma. J. Allergy Clin.Immunol. 114, 1425–1433.
Kellendonk, C., Tronche, F., Reichardt, H.M., Schütz, G., 1999. Mutagenesis of the gluco-corticoid receptor in mice. J. Steroid Biochem. Mol. Biol. 69, 253–259.
Kiernozek, E., Kozlowska, E., Markowska, M., Kowalik, A., Drela, N., 2010. The content ofnatural regulatory T cells in the thymus correlates with the circadian rhythm ofglucocorticoids synthesis. Immunology 131 (Suppl. 1), 54–55.
Kiernozek, E., Kozłowska, E., Markowska, M., Kowalik, A., Drela, N., 2011. Glucocorti-coid-dependent suppressive function and content of thymic natural regulatory Tcells in C57BL/6 mice. J. Physiol. Pharmacol. 62 (Suppl. 1), 180.
Lange, T., Dimitrov, S., Born, J., 2010. Effects of sleep and circadian rhythm on thehuman immune system. Ann. N. Y. Acad. Sci. 1193, 48–59.
Logan, R.W., Sarkar, D.K., 2012. Circadian nature of immune function. Mol. Cell.Endocrinol. 349, 82–90.
Löwenberg, M., Stahn, C., Hommes, D.W., Buttgereit, F., 2008. Novel insights into mech-anisms of glucocorticoid action and the development of new glucocorticoid recep-tor ligands. Steroids 73, 1025–1029.
Malisch, J.L., Breuner, C.W., Gomes, F.R., Chappell, M.A., Garland, T.J., 2008. Circadianpattern of total and free corticosterone concentrations, corticosteroid-bindingglobulin, and physical activity in mice selectively bred for high voluntary wheel-running behavior. Gen. Comp. Endocrinol. 156, 210–217.
Marchetti, D., Van, N.T., Gametchu, B., Thompson, E.B., Kobayashi, Y., Watanabe, F.,Barlogie, B., 1989. Flow cytometric analysis of glucocorticoid receptor using mono-clonal antibody and fluoresceinated ligand probes. Cancer Res. 49, 863–869.
Miller, A.H., Spencer, R.L., Husain, A., Rhee, R., McEwen, B.S., Stein, M., 1993. Differentialexpression of type I adrenal steroid receptors in immune tissues is associated withtissue-specific regulation of type II receptors by aldosterone. Endocrinology 133,2133–2140.
Miller, A., Spencer, R., Pearce, B., Pisell, T., Azrieli, Y., Tanapat, P., Moday, H., Rhee, R.,McEwen, B., McEwen, B., 1998. Glucocorticoid receptors are differentially expressedin the cells and tissues of the immune system. Cell. Immunol. 186 (1), 45–54.
Noguchi, T., Makino, S., Matsumoto, R., Nakayama, S., Nishiyama, M., Terada, Y., Hashimoto,K., 2010. Regulation of glucocorticoid receptor transcription and nuclear translocationduring single and repeated immobilization stress. Endocrinology 151, 4344–4355.
Okamura, H., Yamaguchi, S., Yagita, K., 2002. Molecular machinery of the circadianclock in mammals. Cell Tissue Res. 309, 47–56.
Ordyan, N.E., Galeeva, A.Y., Pivina, S.G., 2008. Expression of glucocorticoid receptor inthe brain of rats during postnatal ontogeny. Bull. Exp. Biol. Med. 146, 176–179.
Orth, D., Kovacs, W., DeBold, C., 1992. Williams Textbook of Endocrinology. WBSaunders Company (Edition).
Oster, H., Damerow, S., Kiessling, S., Jakubcakova, V., Abraham, D., Tian, J., Hoffmann,M.W., Eichele, G., 2006. The circadian rhythm of glucocorticoids is regulated by agating mechanism residing in the adrenal cortical clock. Cell Metab. 4, 163–173.
Pazirandeh, A., Jondal, M., Okret, S., 2004. Glucocorticoids delay age-associated thymic in-volution through directly affecting the thymocytes. Endocrinology 145, 2392–2401.
pplication formeasurement of circadian rhythmicity of glucocorticoid. (2013), http://dx.doi.org/10.1016/j.jneuroim.2013.04.024

9A. Kowalik et al. / Journal of Neuroimmunology xxx (2013) xxx–xxx
Purton, J.F., Zhan, Y., Liddicoat, D.R., Hardy, C.L., Lew, A.M., Cole, T.J., Godfrey, D.I., 2002.Glucocorticoid receptor deficient thymic and peripheral T cells develop normallyin adult mice. Eur. J. Immunol. 32, 3546–3555.
Qiao, S., Chen, L., Okret, S., Jondal, M., 2008. Age-related synthesis of glucocorticoids inthymocytes. Exp. Cell Res. 314, 3027–3035.
Romero, L.M., 2002. Seasonal changes in plasma glucocorticoid concentrations in free-living vertebrates. Gen. Comp. Endocrinol. 128, 1–24.
Sakaguchi, S., Ono, M., Setoguchi, R., Yagi, H., Hori, S., Fehervari, Z., Shimizu, J.,Takahashi, T., Nomura, T., 2006. Foxp3+ CD25+ CD4+ natural regulatory T cellsin dominant self-tolerance and autoimmune disease. Immunol. Rev. 212, 8–27.
Sato, Y., Suzuki, H., Sato, T., Suda, T., Yoda, T., Iwakura, Y., Chida, D., 2010. The role ofendogenous glucocorticoids in lymphocyte development in melanocortin receptor2-deficient mice. Biochem. Biophys. Res. Commun. 403, 253–257.
Savino, W., Dardenne, M., 2000. Neuroendocrine control of thymus physiology. Endocr.Rev. 21, 412–443.
Skwarło-Sońta, K., 1996. Functional connections between the pineal gland and im-mune system. Acta Neurobiol. Exp. (Wars) 56, 341–357.
Spencer, R.L., Kalman, B.A., Cotter, C.S., Deak, T., 2000. Discrimination between changesin glucocorticoid receptor expression and activation in rat brain using western blotanalysis. Brain Res. 868, 275–286.
Stahn, C., Löwenberg, M., Hommes, D.W., Buttgereit, F., 2007. Molecular mechanisms ofglucocorticoid action and selective glucocorticoid receptor agonists. Mol. Cell.Endocrinol. 275, 71–78.
Please cite this article as: Kowalik, A., et al., Dexamethasone-FITC staining areceptor expression in mouse living thymocyte subsets, J. Neuroimmunol
Stoffel-Wagner, B., 2003. Neurosteroid biosynthesis in the human brain and its clinicalimplications. Ann. N. Y. Acad. Sci. 1007, 64–78.
Touma, C., Fenzl, T., Ruschel, J., Palme, R., Holsboer, F., Kimura, M., Landgraf, R., 2009.Rhythmicity in mice selected for extremes in stress reactivity: behavioural, endo-crine and sleep changes resembling endophenotypes of major depression. PLoSOne 4, e4325.
Vacchio, M.S., Papadopoulos, V., Ashwell, J.D., 1994. Steroid production in the thymus:implications for thymocyte selection. J. Exp. Med. 179, 1835–1846.
van der Laan, S., Meijer, O.C., 2008. Pharmacology of glucocorticoids: beyond receptors.Eur. J. Pharmacol. 585, 483–491.
Vegiopoulos, A., Herzig, S., 2007. Glucocorticoids, metabolism and metabolic diseases.Mol. Cell. Endocrinol. 275, 43–61.
Wiegers, G.J., Knoflach, M., Böck, G., Niederegger, H., Dietrich, H., Falus, A., Boyd, R.,Wick, G., 2001. CD4(+)CD8(+)TCR(low) thymocytes express low levels of gluco-corticoid receptors while being sensitive to glucocorticoid-induced apoptosis. Eur.J. Immunol. 31, 2293–2301.
Zhang, T., Ding, X., Daynes, R., 2005. The expression of 11 beta-hydroxysteroid dehy-drogenase type I by lymphocytes provides a novel means for intracrine regulationof glucocorticoid activities. J. Immunol. 174 (2), 879–889.
pplication formeasurement of circadian rhythmicity of glucocorticoid. (2013), http://dx.doi.org/10.1016/j.jneuroim.2013.04.024
Copyright © 2022 FDOKUMEN