Deep brain stimulation of the mediodorsal thalamic nucleus and its ...
Upload
independentCategory
view
0download
0
JOURNALOFNEUROPHYSIOLOGY Vol. 72, No. 2, August 1994. Printed in C’.S.A.
A Model of Spindle Rhythmicity in the Isolated Thalamic Reticular Nucleus
A. DESTEXHE, D. CONTRERAS, T. J. SEJNOWSKI, AND M. STERIADE The Howard Hughes A4edical Institute and The Salk Institute, Computational Neurobiology Laboratory, 10010 North Torrey Pines Road, La Jolla, California 92037; Department of Biology, University of California, San Diego, California 92110; and Laboratoire de Neurophysiologie, Faculte de Mdecine, Universite Laval, Quebec GlK 7P4, Canada
SUMMARY AND CONCLUSIONS
1. The oscillatory properties of the isolated reticular (RE) thala- mus were modeled with the use of compartmental models of RE cells. Hodgkin-Huxley type kinetic models of ionic channels were derived from voltage- and current-clamp data from RE cells. In- teractions between interconnected RE cells were simulated with the use of a kinetic model of y-aminobutyric acid (GABA) inhibi- tory synapses.
2. The intrinsic bursting properties of RE cells in the model were due to the presence of a low-threshold Ca2+ current and two Ca2+-activated currents. The properties of these model RE cells were compared with RE neurons recorded intracellularly in vivo in cats.
3. Model RE cells densely interconnected with GABA, syn- apses produced synchronous oscillations at a frequency close to that of spindles (7- 14 Hz). Networks of RE neurons organized in a two-dimensional array with only proximal connectivity also exhib- ited synchronized oscillations in the spindle range. In addition, the proximally connected network showed periods of high and low synchronicity, giving rise to waxing and waning oscillations in the population of RE cells.
4. The spatiotemporal behavior of the network was investi- gated during waxing and waning oscillations. The waxing and waning emerged as an alternation between periods of desynchron- ized and synchronized activity, corresponding to periods of irregu- lar and coherent spatial activity. During synchronized periods, the network displayed propagating coherent waves of synchronous activity that had a tendency to form spirals.
5. Networks of model RE neurons fully connected through GABA, synapses exhibited perfectly synchronous oscillations at lower frequencies (OS- 1 Hz), but two-dimensional networks with proximal GABA, connectivity failed to synchronize.
6. These simulations demonstrate that networks of model neu- rons that include the main intrinsic currents found in RE cells can generate waxing and waning oscillatory activity similar to the spindle rhythmicity observed in the isolated RE nucleus in vivo. The model reveals the interplay between the intrinsic rhythmic properties of RE cells and the fast synaptic interactions in organiz- ing synchronized rhythmicity.
INTRODUCTION
Spindle waves are waxing and waning 7- to 14-Hz oscilla- tions commonly observed during the early phase of sleep. They have been shown to occur in most cortical territories (Andersen and Andersson 1968). Because spindle rhyth- micity survives in thalamic nuclei after decortication (Mor- ison and Bassett 1945), the thalamus is believed to generate these synchronized oscillations. Further experiments per- formed in cats in vivo showed that cortically projecting tha-
lamic nuclei loose their ability of generating spindle oscilla- tions if they are deprived of input from the reticular thala- mic (RE) neurons (Steriade et al. 1985) and that the isolated RE nucleus can itself generate spindle rhythmicity (Steriade et al. 1987).
Recently, spindle oscillations were also reported from ferret slices that contained both thalamocortical (TC) and RE neurons as well as their reciprocal connections (von Krosigk et al. 1993). This in vitro preparation allowed the synaptic components involved in the genesis of spindles to be investigated. The synchronized oscillations generated in vitro were shown to depend critically on the integrity of synaptic interactions between both types of cells (von Kro- sigk et al. 1993).
The intrinsic properties of TC and RE cells are also im- portant for the genesis of thalamic rhythms (Steriade and Llinas 1988). Both types of cells possess a low-threshold Ca2’ current (IT), whose activation and inactivation ki- netics have been characterized (Coulter et al. 1989; Hu- guenard and Prince 1992). In TC cells, it has been proposed that the interaction between IT and a hyperpolarization-ac- tivated inward current (1J may be responsible for the gener- ation of slow oscillations in the 0.5 to ~-HZ delta range (McCormick and Pape 1990; Soltesz et al. 199 1). Such oscillatory behavior has also been found in computer mod- els of TC cells (Destexhe et al. 1993a; Lytton and Sejnowski 1992; McCormick and Huguenard 1992; Toth and Crunelli 1992).
Rodent RE neurons display rhythmic oscillations at 7- 12 Hz after injection of current steps (Avanzini et al. 1989; Bal and McCormick 1993). They typically produce a few bursts followed by a short tonic tail before returning back to resting level. It has been suggested that this behavior arises from the interaction between IT and two Ca2+-acti- vated currents, a K+ current (1k& and a nonspecific cat- ion current (1&, both with slow kinetics (Bal and McCor- mick 1993).
In a recent series of papers (Destexhe and Babloyantz 1993; Destexhe et al. 1993a-c, 1994a,b), computer models were developed to test the hypothesis that the known intrin- sic properties of TC and RE cells, combined with their syn- aptic interaction, are sufficient to account for the character- istic properties of in vivo and in vitro spindle oscillations. In particular, a two-neuron model (Destexhe et al. 1993~) ac- counted for the generation of 8- to lo-Hz spindling from interacting TC and RE neurons, as observed in ferret slices in vitro (von Krosigk et al. 1993). However, this model did
0022-3077/94 $3.00 Copyright 0 1994 The American Physiological Society 803

804 A. DESTEXHE, D. CONTRERAS, T. J. SEJNOWSIU, AND M. STERIADE
not account for the observation of spindle rhythmicity in the deafferented RE nucleus (Steriade et al. 1987), because the GABAergic interactions between RE cells were not con- sidered.
Previous network models of RE cells used minimal ionic models of the RE cell (Destexhe and Babloyantz 1992; Wang and Rinzel 1993), based on the data available at that time (Avanzini et al. 1989; McCormick and Wang 199 1). More realistic models of RE cells are now possible, based on the recent characterization of intrinsic currents in RE cells (Bal and McCormick 1993) as well as of both types of syn- aptic GABAergic currents (Otis and Mody 1992; Otis et al. 1993). In this paper we introduce a model of RE cells and their synaptic interactions and show that an isolated net- work of such cells, endowed with appropriate intrinsic prop- erties and reciprocal synaptic inhibition, can produce syn- chronized rhythms similar to spindles observed in the deaf- ferented RE nucleus.
METHODS
Each RE thalamic cell was modeled by single compartment with a surface area of 1,000 pm2 and Hodgkin-Huxley type of kinetics for the intrinsic currents.
The equations used for describing the time evolution of the membrane potential were
crnv = -a( v - EL) - IT - IryCa] - ICAN - INa - k - IGABA (0 where Vis the membrane potential of the RE cell, Cm = 1 pF/cm2 is the specific capacity of the membrane, EL = -78 mV is the leakage reversal potential, and gL = 0.05 mS/cm2 is the leakage conductance. The input resistance of this single-compartment cell is of 2,000 Mfi. IT is the low-threshold Ca2+ current, IK[ca and IcAN are Ca2+-activated currents, INa and Ik are the fast Na -F and K+ currents responsible for the generation of action potentials, and loABA is the synaptic current corresponding to GABAergic syn- apses.
Although other currents were observed in RE neurons, we can account for most salient features of the dynamics of these cells with the use of the restricted set of currents described here. In this section we describe the models used for these currents.
Low-threshold Ca2’ current: IT
RE thalamic neurons have a rebound burst response, mediated by a low-threshold Ca2+ current (Avanzini et al. 1989; Bal and McCormick 1993), similar to that found in thalamocortical neu- rons. The characterization of this current by voltage-clamp meth- ods in RE cells (Huguenard and Prince 1992) showed that the kinetics were slower than in TC cells. The model for this current was
I,=&,m2h(V- Eta)
1 tic-- 7 m (13 [m - %AVl
&- +p-h,(Vl h
(2)
where & = 1.75 mS/cm2 is the maximum value of the conduc- The fast spikes in RE cells were modeled with the use of conven- tance of the Ca2+ current, ,?& is the Ca2+ reversal potential, given tional Hodgkin-Huxley kinetics (Hodgkin and Huxley 1952) for by the Nernst relation (see below), and m and h are, respectively, the sodium current (Na and the delayed rectifier rK. The kinetics the activation and inactivation variables. The activation function were taken from a model of hippocampal pyramidal cells (Traub and time constants were obtained from experimental data (J. Hu- and Miles 199 1 ), and the parameters used for the two currents guenard, personal communication) were as follows: maximal conductances of gNa = 100 mS/cm2 and
m,(V) = I/{ 1 + exp[-( V + 52)/7.4]}
TV = 0.44 + O.lS/{exp[(V+ 27)/10] + exp[-(V+ 102)/15]}
h,(v) = I/{ 1 + ev[( V + W/51) Th( V) = 22.7 + 0.27/{exp[( V + 48)/4] + exp[-( V + 407)/5O]}
These values correspond to a temperature of 36°C assuming Q,, values of 5 and 3 (Coulter et al. 1989) and an extracellular Ca2+ concentration of 2 mM.
Ca2+-dependent K+ current: Imcal Both in vivo (Contreras et al. 1993; Mulle et al. 1986) and in
vitro recordings (Avanzini et al. 1989) show the presence of a marked afterhyperpolarization (AHP) after each burst of the RE cell. This slow AHP is mediated by a slow Ca2+-dependent K+ current (Bal and McCormick 1993). We adopted a modified ver- sion of a model of lkica] introduced previously (Yamada et al. 1989) that requires the binding of y2 Ca2’ to open the channel
(closed) + n Cal+ = a (open) B
(3)
where Cq,+ is the intracellular calcium and cy and p are rate con- stants. The ionic current is then given by
I K[Cal = EK[ca] m2 ( v - m
)fj=-.- 1 ~ [m - m,([wi)l 7m([Cali)
(4)
where &]ca] = 10 mS/cm2 is the maximal conductance, EK = -95 mV is the reversal potential, m is the activation variable of IKIca] (related to the relative concentration of open channels), [Cal, is the intracellular calcium concentration, and the Ca2+-dependent functions are given by
m,(Dli> = 4Wi”l(&all + P)
Tm([Cali) = l/CaLCall + PI The rate constants are assumed to be independent of voltage so the activation of lkiCa] therefore depends solely on intracellular Ca2+. The values y2 = 2, CY = 48 ms-’ mMw2 and p = 0.03 ms-’ yielded AHPs very similar to those RE cells recorded in vivo and in vitro.
Ca2+-dependent nonspecijk cation current: ICAN Pharmacological studies of RE cells in vitro (Bal and McCor-
mick 1993) have revealed an afterdepolarization (ADP) mediated by a nonspecific cation current, activated by intracellular calcium, called IcAN. This current, encountered in many other cells in the nervous system (Partridge and Swandulla 1988), is voltage inde- pendent in most cases. Because there are no data for the voltage dependence of IcAN in RE neurons, we assumed the same activa- tion scheme as for I k[Ca] (see above), but with slower kinetics
LN = &4N n--l2 ( v - &!4iv~ (5) where gCAN = 0.25 mS/cm2 is the maximal conductance and &AN = -20 mV is the reversal potential. The values n = 2, cy = 20 ms-’ mMm2 and p = 0.002 ms-’ yielded ADPs very similar to those recorded in vitro (Fig. 2B).
Fast Na+ and K+ currents: INa and IK

MODEL OF RETICULAR THALAMIC OSCILLATIONS 805
& = 10 mS/cm2, and the sodium reversal potential was of 50 mV. Fast calcium currents may also contribute to the genesis of the fast spike, but this was not taken into account in our model.
Synaptic currents IGABA
Synaptic currents were modeled by a kinetic scheme of binding of transmitter to postsynaptic receptors (Destexhe et al. 1994a,b), similar in spirit to the models of active currents. The simplest possible kinetic scheme for such a process is
a (closed) + T = (open)
B (6)
where the transmitter molecule T binds to a closed form of the postsynaptic receptor, yielding to an open form, and a! and p are the forward and backward rate constants for transmitter binding. Let Y represent the fraction of bound receptors, then
dr - = a [TJ (1 - r) - pr dt
where [ 7’j is the concentration of transmitter.
(7)
This model was implemented by delivering a pulse of transmit- ter concentration when a presynaptic spike occurred. A pulse of [ rJ was delivered to Eq. 7 when the presynaptic voltage crossed 0 mV. The inhibitory synaptic current was then given by
km* = GLml( v - J%u3*) (8) where gGABA is the maximal synaptic conductance and EGABA is the reversal potential.
RE neurons typically produce bursts of action potentials that cause summated postsynaptic potentials (PSPs). This kinetic de- scription of the PSP provides a biophysically plausible mechanism for handling the summation of PSPs between neurons producing spikes (Destexhe et al. 1994b), which is a faster and more easily implemented alternative to a previously proposed kinetic model (Perkel et al. 198 1). Moreover, under the hypothesis that the time course of transmitter release T occurs as a pulse of fixed duration, the first-order equation can be solved analytically (Destexhe et al. 1994a,b). This yields an exact expression for the PSP and allows the computation to be performed highly efficiently.
The kinetics of the y-aminobutyric acid (GABA) synapses were fit to whole-cell currents obtained from hippocampal neurons (Otis and Mody 1992) for GABA, receptors. The GABA, reversal potential has been estimated to be -94 t 8.3 (SE) mV in rat TC cells (J. Huguenard, personal communication) and around -75 mV in guinea pig RE cells (Bal and McCormick 1993). In our model of the GABA* current, the reversal potential was -80 mV, the pulse of transmitter was 1 mM in amplitude and 1 ms in duration, and the rate constants were a~ = 0.53 ms-’ mM-’ and p = 0.184 ms-’ (see RESULTS and Fig. 4B).
For GABAB synapses, the binding of the receptor activates a G-protein, which opens a K+ channel (Gage 1992; VanDongen et al. 1988). In this scheme the opening of the K+ channel is slow compared with the time course of G-protein activation. If we let T represent G-protein activity rather than transmitter concentra- tion, and assume that it occurs as a pulse, then the same kinetic description can be applied to GABA, synapses. Fitting this kinetic scheme to whole-cell currents obtained from hippocampal neu- rons (Otis et al. 1993) yielded a value of 1 PM for the pulse ampli- tude, a pulse duration of 85 ms, and rate constants of Q! = 0.0 16 ms-’ PM-’ and p = 0.0047 ms-’ (see RESULTS and Fig. 12A). The reversal potential was -95 mV, according to values estimated from rat TC cells (- 103 ? 8 mV) (J. Huguenard, personal commu- nication) and guinea pig RE cells (-94 to -97 mV) (Bal and McCormick 1993).
Such a kinetic description can be used as well with more realistic kinetic schemes yielding an expression of the postsynaptic current,
which contains several components in the time course of decay (Destexhe et al. 1994b). Although the fit to the experimental re- cordings was better, we decided to use the first-order kinetic model for synaptic currents for simplicity and speed of simulation.
We investigated networks ranging in size from N = 2 to N = 1,600 RE neurons. To maintain comparable input currents as the number of synapses was varied, we resealed the synaptic conduc- tances so that the sum of the maximal conductances that could be activated at all efferent synapses from a single RE neuron was 1 PS for GABA, synapses and 0.01 PS for GABAB synapses. These values produced the typical behaviors of the networks reported here.
Intracellular calcium dynamics The dynamics of intracellular Ca2’ was modeled by a fast re-
moval process d ue to an active pump, and Ca2+ entry is due to the Ca2+ current I, as described previously in a model of the TC cell (Destexhe et al. 1993a). The influx of Ca2+ into a thin shell be- neath the membrane followed
. k [Cal, = - 2&j - IT (9)
where F = 96,489 C l mol-’ is the Faraday constant, d = 1 pm is the depth of the shell beneath the membrane, and the unit conver- sion constant is k = 0.1 for 1= in PA/cm2 and [Cali in millimolar. The contribution of the Ca2+ pump was
. &ICali [Ca1i = - [Cai] + & (10)
where KT = 10e4 mM/ms-’ and Kd = 10q4 mM are the rate con- stants obtained from a Michaelis-Menten approximation of the kinetics of the pump (Destexhe et al. 1993a). These time constants were chosen to obtain fast removal of the submembranal calcium, in the millisecond range (see Destexhe et al. 1993a).
The Ca2+ reversal potential strongly depends on the intracellu- lar Ca2+ concentration and was calculated according to the Nernst relation
where R = 8.31441 J l mol-’ ‘IS-‘, T = 309.15”K, and the con- stant for unit conversion is K = 1,000 for Eta in millivolts. For [Cali = 2.4 10m4 mM and [Cal, = 2 mM, which are typical values at rest in the simulations presented here, EC, was - 120 mV.
Network of RE cells A network of N RE cells was modeled by
where vi is the membrane potential of neuron i (i = 1 . l l N), the sum runs over all neuronsj sending a connection to neuron i, fx vi) represents the intrinsic currents to cell i (fi = 1T + Iwcal + ICAN + &, + 1k). The synaptic current is given by
where the variable r( vi) is the activity of the synapse and depends on presynaptic activity (vj) as described above.
The neurons were arranged on a two-dimensional square lattice (fix fw with uniform connectivity: the same pattern of connec- tivity was used for each neuron in the network, and all values of synaptic conductances were identical. Several types of connec- tivity were considered. The simplest case is the “nearest-neighbor” connectivity in which every cell connects to its four immediate neighbors. The most frequently used connectivity is here the “dense proximal” coupling in which every neuron connects to all

806 A. DESTEXHE, D. CONTRERAS, T. J. SEJNOWSKI, AND M. STERIADE
other neurons within some radius. Finally, we also used “fully connected” networks, sometimes called “all-to-all” connectivity, in which every cell connects to the whole array of cells in the network.
The connections near the boundaries of the square array were reflected back into the array to minimize boundary effects. That is, a connection to a neuron that lies outside the array was instead connected to the mirror image of that neuron in the array. This allowed every neuron in the network to receive the same number of synapses, therefore minimizing finite size effects.
In the network, all neurons were initially set at their resting membrane potential, which was around -70 mV. Because RE neurons only display bursts in response to an external stimulus, a network of RE cells will remain silent unless an external perturba- tion occurs. Oscillatory behavior was elicited by injecting a ran- dom hyperpolarizing pulse in each neuron, during the first 2 s of the simulation. These pulses had lOO-ms duration and amplitudes uniformly distributed between 0 and 0.05 nA, and they occurred at latencies uniformly distributed between 0 and 2 s. After the perturbation given by these pulses during the first 2 s, the network developed a self-sustained oscillatory activity (see RESULTS).
The average membrane potential was evaluated with the use of
W)
where the sum runs over a subset of N’ cells taken in the network (N’ I N). For N = 100, all cells were averaged (N’ = N), but for larger networks, a local average was performed by chasing a disk of N’ = 113 cells in the center of the network.
The variable (v> represents the averaged value of membrane potentials in the network and is a useful indicator of synchronized activity. This variable can be compared with field potentials re- corded in the isolated RE nucleus. Although the origin of the field potentials is still not clearly established, it is likely that they result from a spatial summation of current sources (Nunez 198 1). In a network of single compartment neurons, the estimates of the field potentials derived from current sources and from average mem- brane potential follow very similar time courses (Destexhe and Babloyantz 1992).
The average membrane potential (I’), is sensitive to synchro- nous activity in the network. We define a “synchronous” state as one in which several neurons, but not necessarily all, oscillate in phase. Note that neurons involved in a synchronized oscillation need not produce spikes, because subthreshold oscillations of membrane potentials also contribute to (I$ Systems in which all cells oscillate in phase are described here as “perfectly synchro- nized.”
Parameters and simulations The conductance values and reversal potentials were generally
estimated from published values provided by measurements in vitro. All kinetic data were scaled to a temperature of 36°C and an extracellular Ca2+ concentration of 2 mM. However, the data only provide approximate values for the parameters.
The values of the parameters also depended on the geometry of the model of the RE cells, which did not include dendrites. In more geometrically accurate models of these cells, different param- eter values might be needed to achieve the same performance of the model neuron.
The results are presented here for a typical set of parameter values and are robust to variation of the kinetic parameters for synaptic interactions, the values of the conductances of the various currents, and the architecture of the system. The simula- tions presented here therefore display the generic properties of the system.
All simulations were performed with the use of NEURON
(Hines 1993) on a Sun Spark 10 workstation. The typical time taken for simulating 1 s of a network of 100 RE neurons with 25 GABA, synapses each was 960 CPU s. The simulation time scaled approximately with the number of neurons and the number of synapses in the network.
Intracellular recordings In vivo intracellular recordings were performed on cats anesthe-
tized with ketamine-xylazine or barbiturates. Cells were located in the rostrolateral sector of the RE nucleus and were identified by their response to internal capsule stimulation, which consisted of an initial high-frequency burst followed by depolarizing spindle oscillation (see Contreras et al. 1993).
RESULTS
We start with the intrinsic properties of single RE neu- rons, which are fit to voltage-clamp and current-clamp data, and investigate networks of RE neurons of increasing complexity interconnected by either GABA, or GABAB synapses.
Intrinsic properties of RE neurons
Intracellular recordings of RE cells performed in vitro (Avanzini et al. 1989; Bal and McCormick 1993) demon- strated that a rebound sequence of rhythmic bursts can be elicited in the RE cell after current injection. This behavior was resistant to tetrodotoxin (TTX) (Bal and McCormick 1993) and was therefore intrinsic to the cell. An AHP after the burst was necessary for this oscillation to occur, because apamin, which is a blocker of lkLcal, abolished the rhythmic activity.
Rhythmic bursting activity at a frequency of 8-12 Hz occurred spontaneously, or followed internal capsule or thalamic stimulation, in intracellular recordings of cat RE cells in vivo (Fig. 1). Typically, this oscillatory behavior accompanied a depolarizing envelope and led to a tonic tail of spike activity (Domich et al. 1986).
Modeling studies have shown that the combination of the currents 1T and lkICal robustly generates oscillations (Destexhe et al. 1993~; Wang and Rinzel 1993) at low fre- quency (2-4 Hz), as shown in Fig 2A. These oscillations occurred as a rebound rhythmic bursting activity in re- sponse to a hyperpolarizing pulse. The 2- to ~-HZ frequency was mainly dependent on the level of the resting potential, and of the kinetics of IT and lkLcal. Despite the ease with which these low-frequency oscillations could be generated, none of the kinetic parameters tested for lkIcal were able to produce frequencies in the range 7-14 Hz.
Another outward current, IcAN, present in RE cells (Bal and McCormick 1993), produces a marked ADP after ap- plication of TTX and apamin. In the model, such an ADP can be produced in the presence of IT and IcAN in rebound to an hyperpolarizing pulse (Fig. 2B). The kinetic scheme used for describing ICAN was not voltage dependent (see METHODS).
Simulations of a single compartment containing the com- bination of currents IT, IKLcal, and IcAN are shown in Fig. 2, Cand D. The model cell produced a rebound bursting activ- ity at a frequency of 9- 11 Hz. The activation of I,,,acceler- ated the rising phase of the burst and increased the fre-

MODEL OF RETICULAR THALAMIC OSCILLATIONS
quency of the rebound burst sequence. The presence of IcAN also terminated the oscillatory behavior by producing a tonic tail of spikes before the membrane returned to its resting level. The relative values of gflc,] and gCAN modu- lated both the frequency and the relative importance of rhythmic bursting relative to tonic tail activity (compare Fig. 2, C and D). The tonic tail was always characterized by an initial increase of spike frequency followed by a de- crease. Such an accelerando-decelerando pattern of spikes has been described in bursts of RE neurons in vivo (Con- treras et al. 1993; Domich et al. 1986).
Oscillatory behavior in simple circuits with GABAA synapses
Intracellular recordings of inhibitory postsynaptic poten- tials (IPSPs) mediated by GABAA receptors in cat RE cells have been reported in vivo (Fig. 3). GABA, IPSPs were also found in RE neurons from ferret slices in vitro (von Krosigk et al. 1993). The effectiveness of GABA, agonists on RE neurons was reported previously (Bal and McCormick
-7OmV
- -75mV
-76mV
0.2 s
0.3 s
FIG. 1. Eight- to 12-Hz bursting properties of cat reticular thalamic (RE) neurons in vivo. Sequences of rhythmic bursts appear in RE cells spontaneously or evoked by electrical stimulation of the internal capsule. During spindle oscillations RE cells display spikes bursts at 8- 12 Hz riding on a depolarizing envelope. Top panel (Evoked): 2 different responses to electrical stimulation of the internal capsule in a RE cell from the rostrolat- era1 sector. The cell is progressively hyperpolarized by DC current injec- tion. For the more depolarized membrane potential, the cell displays a tonic tail of spikes. Bottom panel (Spontaneous): spontaneous spindle se- quence in a different RE cell.
FIG. 2. Intrinsic rebo und burst properties of single RE neurons in the model. Rebound bursts were evoked by injection of a hyperpolarizing pulse (arrow). A: rhythmic bursting following the interaction between I, and IK(ca] &xv = 0). B: afterdepolarization (ADP) in the model cell with only I, and IcAN present (&, = 0, &,, = 0, &AN = 0.25 mS/cm2). C: same simulation in the presence of all currents, with lktCal dominating (gCAN = 0.25 mS/cm2). The cell produced a few bursts at higher frequency and terminated with a short tonic tail of spikes. D: same simulation as in C, but with ICAN dominating (gCAN = 2 mS/cm2). The tonic tail activity is more prominent. All hyperpolarizing pulses were 2 pA (0.2 pA/cm2) amplitude and 100 ms duration. Same calibration for A, C, and D; for all traces, the initial voltage was of -70 mV.
A //I 40mV
250ms i /
250ms ! 1 ,/I \
C
1993; McCormick and Prince 1986; Spreafico et al. 1988) and were shown to have specific actions in the RE nucleus (Huguenard and Prince 1993). These lines of evidence sug- gest that synaptic interactions between RE cells are at least partially mediated by GABAA receptors.
A first-order kinetic model of an inhibitory synapse (see METHODS) was fit to digitized recordings of GABA* post- synaptic currents obtained from whole-cell recordings in granule cells of rat dentate gyrus (Otis and Mody 1992). Figure 4A compares the model of the synaptic current with the experimental data. Figure 4B shows the corresponding IPSP used for the model RE cell.
The first step in modeling the behavior of RE neurons interconnected with GABAA synapses was to study two in- terconnected neurons (Fig. 5). The strengths of the mutual inhibition was adjusted to produce inhibition sufficiently strong to produce oscillations. Two types of oscillatory be- havior were observed depending on the pattern of connec- tivity of the two cells. In the absence of inhibitory self-con- nections (Fig. 5A), the two model RE cells produced alter- nating multiple bursts. The first cell (cell 1) produced a series of bursts in the range 9-l 1 Hz, which induced a se- quence of IPSPs in the companion cell (cell 2). These IPSPs deinactivated IT in cell 2 and, when the bursts in cell 1 stopped, the release of the inhibition induced a series of bursts in cell 2. This cycle continued indefinitely with a repetition rate of - 1 Hz. Between the periods of rhythmic

808
A
A. DESTEXHE, D. CONTRERAS, T. J. SEJNOWSKI, AND M. STERIADE
“’ I I I
-7OmV FIG. 3. y-Aminobutyric acid-A (GABA,) in- -76mV
C
OnA 1 --InA
-60 mV
D
OnA
-1 nA
-95 mV
burst firing, the membrane was hyperpolarized below the range of IT activation, therefore preventing IAHp and IcAN from activating because Ca2+ entry could not occur.
In the following, we define as “Type 1 oscillations” multi- ple burst activity in which at least two groups of cells pro- duce sequences of bursts in alternation, separated by pe- riods where the membrane is hyperpolarized. This is a com- mon type of oscillatory mechanism for neurons coupled with mutual inhibition (see DISCUSSION). A very similar
10pA
4mV 50 ms
FIG. 4. Kinetic-based model of GABA, inhibitory synaptic potentials in RE cells. A: best fit obtained from the kinetic model of synaptic conduc- tances (smooth curve), compared with GABA, currents obtained from whole-cell recordings in granule cells of rat dentate gyrus (noisy trace) (from Otis and Mody 1992). The model was fit to the data with the use of a least-squares procedure. B: corresponding GABA, IPSP obtained from the model with a maximal conductance of gGABA = 25 nS.
I ‘i 0 r
hibitory synaptic potentials in RE cells in vivo. RE cells occasionally display short-lasting inhibi- tory postsynaptic potentials (IPSPs). A and B: an intracellular recording from a RE cell from the rostrolateral sector shows spontaneous short-last- ing IPSPs (*), lasting 20-40 ms. C and D: IPSPs were reverted by injection of hyperpolarizing current (indicated by * and - - -).
0.2 8
- - - - - - -
-d
oscillatory behavior was also described by Golomb and Rinzel (1994) for mutually inhibiting cells.
In the presence of self-inhibitory connections, another type of oscillatory behavior was seen (Fig. 5B). Cell 2 pro- duced a single burst that terminated the bursting in cell 1 and inhibited cell 2. A rebound burst was produced in celZ2, and the cycle repeated at a frequency of around 6.5 Hz. During the interburst period, the hyperpolarized mem- brane potential prevented IT, IAHP, and ZcAN from activat- ing. Single cells with an auto-GABA, synapse do not oscil- late (not shown). Although many combinations of parame-
0.5 s FIG. 5. Oscillatory behavior of 2 interconnected RE cells with GABA,
synapses. Diagram of connectivity is shown on the left, and traces from simulations of the 2 neurons are shown on the right. A: reciprocal interac- tions produce Type 1 oscillation. B: addition of self-connections produces Type 2 oscillation. gcABA = 1 PS (A) and 0.5 PS (B). Vertical calibration bars are from - 100 to -50 mV.

MODEL OF RETICULAR THALAMIC OSCILLATIONS 809
B n
D 200 mv n
0.5 s FIG. 6. Oscillatory behavior of systems of 5 RE neurons with GABA,
synapses. The patterns of connectivity are shown on the left, and the corre- sponding traces from the 5 neurons are shown on the right. A and B: the connectivity is to nearest neighbors along a circle. C and D: full reciprocal connectivity was used. Neurons in B and D have self-connections. Vertical calibration bars are 100 mV. gdABA = 0.5 pS (A), 0.33 pS (B), 0.25 pS (C), and 0.2 PS (D).
ter values were tested, synchronous bursting activity was never observed. This suggests that synchronous bursting might not exist in homogeneous systems of RE neurons with GABA* synapses.
In the following, we define as “Type 2 oscillations” single burst activity in which the whole system shows a phase- locked subthreshold oscillation, but individual cells fire bursts only occasionally. In the case shown in Fig. 5B, the Type 2 oscillations are periodic, and each of the two cells fires a single burst of spikes in alternation.
The two-neuron system is a simple model for two popula- tions of RE neurons. Within each population the neurons oscillate in phase, and the two populations as a group oscillate out-of-phase. This will be demonstrated in simula- tions of systems with 5 and 100 RE neurons coupled with GABA, synapses.
Figure 6 shows the oscillatory behavior for various types of connectivity in a system of five RE neurons. In a network with only nearest neighbors connected, an alternating multi- ple burst activity is seen similar to the Type 1 oscillations (Figure 64. However, the five neurons did not alternate in two populations, but burst sequentially in an ordered pat- tern. In particular, neurons that were separated from each other by one intervening neuron tended to fire in pairs, with one following the other after a single burst. The configura- tions with nearest-neighbor with auto-synapses (Fig. 6B) and full connectivity (Fig. 6, C and D) produced an oscilla- tory mode that was similar to the Type 2 oscillations seen in the two-cell model. There was a marked synchrony of the
membrane potential of the five cells at -6.5 Hz, although they never fired in unison.
Oscillatory behavior in two-dimensional networks with GABA, synapses
We investigated the dynamics of a system of 100 RE neu- rons whose connectivity was organized in a two-dimen- sional array, which better approximates the organization of the RE than full connectivity. The simplest type of connec- tivity in such a system is the nearest-neighbor configuration shown in Fig. 7A. This topology of the GABAA synapses favored alternating multiple burst activity in neighboring neurons (Fig. 7B), which was similar to the Type 1 oscilla- tions described in the two-neuron model. In addition, there was a tendency for waves of bursting activity to sweep across the network (Fig. 7B). The average membrane po- tential of the network did not show any evidence of synchrony (Fig. 7C).
A more realistic pattern of connectivity for RE neurons is “dense proximal connectivity” in which a given neuron connects to all other neurons within some radius, as shown in Fig. 8A. With connections from 25 neighboring neurons including an auto-synapse, the activity of the network showed a complex, oscillatory dynamics at a frequency of 6.5-9 Hz (Fig. 8B). There was little evidence of alternating multiple burst activity, and the dynamics of the oscillation were similar to the Type 2 oscillation observed in the two- and five-neuron models.
The main difference, however, was that the network with dense proximal connectivity produced a more disordered
A 0000000000 0 0 0 0 0 0 0 0
~00000000 ~000~0000 oo~mooo ocma@ooo 00c3@3000 00000000
- 0 0 0 0 0 0
000000000 000000000
0000000000
C
FIG. 7. Oscillatory behavior of a network of 100 RE neurons with near- est-neighbor GABA, connections. A: pattern of connectivity: a given RE neuron (black) connects to 4 immediately adjacent RE cells (dark gray). B: activity of the 10 cells along the diagonal of the network (vertical calibra- tion bar is of 200 mV). C: average value of the membrane potentials of all 100 RE neurons during the same simulation as in B (vertical calibration bar is from -90 to -80 mV). gGABA = 0.25 $3.
D. CONTRERAS, T. J. SEJNOWSKI, AND M. STERIADE 810
A
A. DESTEXHE,
C
2s 1 FIG. 8. Oscillatory behavior of a network of 100 RE neurons with
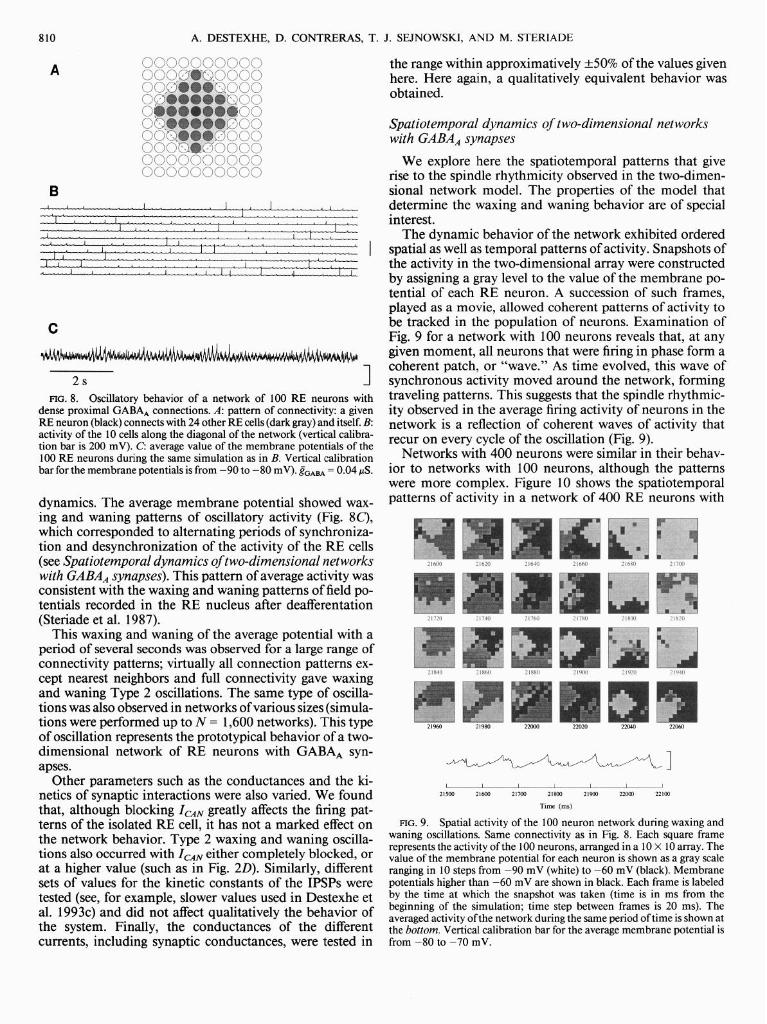
dense proximal GABA, connections. A: pattern of connectivity: a given RE neuron (black) connects with 24 other RE cells (dark gray) and itself. B: activity of the 10 cells along the diagonal of the network (vertical calibra- tion bar is 200 mV). C: average value of the membrane potentials of the 100 RE neurons during the same simulation as in B. Vertical calibration bar for the membrane potentials is from -90 to -80 mV). &aA = 0.04 P.S.
dynamics. The average membrane potential showed wax- ing and waning patterns of oscillatory activity (Fig. 8C), which corresponded to alternating periods of synchroniza- tion and desynchronization of the activity of the RE cells (see Spatiotemporal dynamics oftwo-dimensional networks with GABA, synapses). This pattern of average activity was consistent with the waxing and waning patterns of field po- tentials recorded in the RE nucleus after deafferentation (Steriade et al. 1987).
This waxing and waning of the average potential with a period of several seconds was observed for a large range of connectivity patterns; virtually all connection patterns ex- cept nearest neighbors and full connectivity gave waxing and waning Type 2 oscillations. The same type of oscilla- tions was also observed in networks of various sizes (simula- tions were performed up to N = 1,600 networks). This type of oscillation represents the prototypical behavior of a two- dimensional network of RE neurons with GABA, syn- apses.
Other parameters such as the conductances and the ki- netics of synaptic interactions were also varied. We found that, although blocking ZUN greatly affects the firing pat- terns of the isolated RE cell, it has not a marked effect on the network behavior. Type 2 waxing and waning oscilla- tions also occurred with ZCAN either completely blocked, or at a higher value (such as in Fig. 20). Similarly, different sets of values for the kinetic constants of the IPSPs were tested (see, for example, slower values used in Destexhe et al. 1993~) and did not affect qualitatively the behavior of the system. Finally, the conductances of the different currents, including synaptic conductances, were tested in
the range within approximatively +50% of the values given here. Here again, a qualitatively equivalent behavior was obtained.
Spatiotemporal dynamics of two-dimensional networks with GABA* synapses
We explore here the spatiotemporal patterns that give rise to the spindle rhythmicity observed in the two-dimen- sional network model. The properties of the model that determine the waxing and waning behavior are of special interest.
The dynamic behavior of the network exhibited ordered spatial as well as temporal patterns of activity. Snapshots of the activity in the two-dimensional array were constructed by assigning a gray level to the value of the membrane po- tential of each RE neuron. A succession of such frames, played as a movie, allowed coherent patterns of activity to be tracked in the population of neurons. Examination of Fig. 9 for a network with 100 neurons reveals that, at any given moment, all neurons that were firing in phase form a coherent patch, or “wave.” As time evolved, this wave of synchronous activity moved around the network, forming traveling patterns. This suggests that the spindle rhythmic- ity observed in the average firing activity of neurons in the network is a reflection of coherent waves of activity that recur on every cycle of the oscillation (Fig. 9).
Networks with 400 neurons were similar in their behav- ior to networks with 100 neurons, although the patterns were more complex. Figure 10 shows the spatiotemporal patterns of activity in a network of 400 RE neurons with
FIG. 9. Spatial activity of the 100 neuron network during waxing and waning oscillations. Same connectivity as in Fig. 8. Each square frame represents the activity of the 100 neurons, arranged in a 10 X 10 array. The value of the membrane potential for each neuron is shown as a gray scale ranging in 10 steps from -90 mV (white) to -60 mV (black). Membrane potentials higher than -60 mV are shown in black. Each frame is labeled by the time at which the snapshot was taken (time is in ms from the beginning of the simulation; time step between frames is 20 ms). The averaged activity of the network during the same period of time is shown at the bottom. Vertical calibration bar for the average membrane potential is from -80 to -70 mV.

MODEL OF RETICULAR THALAMIC OSCILLATIONS 811
dense proximal connectivity that produced waxing and waning Type 2 oscillations. The network displayed spatial patterns of propagating activity in the form of a clockwise rotating wave (Fig. 10).
Comparison of these snapshots with the averaged voltage and single cell traces of Fig. 8 reveals that the periodicity of the waves of activity, 1 lo- 150 ms, corresponds closely to the oscillations observed in the averaged voltage (6.5-9 Hz). For N = 400, the period of these oscillations was 120-140 ms (assuming that the spirallike wave is symmetrical), which is in the 6.5- to 9-Hz spindle range. The traveling wave of activity involved every cell in the network, but the oscillation was subthreshold, only occasionally giving rise to a burst of spikes, as indicated by black squares in Figs. 9 and 10. Thus, although the average activity was dominated by the subthreshold 6.5- to g-Hz oscillation, single cells fired irregularly, once every two or three cycles.
Waxing and waning has a longer time scale, lasting for several seconds, and is manifested in the spatiotemporal pattern as coherent waves that form and dissolve. The activ- ity of neurons in the network alternated between periods of coherent oscillatory activity, characterized by well defined traveling waves, and periods of less coherent activity, in which the pattern of spatiotemporal activity was less orga- nized (Fig. 11A).
As the size of the system increased, the spatiotemporal. patterns became more complex (Fig. lo), but traveling waves persisted with about the same wavelength. For large networks (N = 400, N = 1,600), domains formed within the spatial array that oscillated independently, giving rise to an average activity over the entire network that was weaker in amplitude because the phases tended to cancel out (not shown). However, local domains of - 100 neurons in a large network showed waxing and waning patterns very sim-
FIG. 10. Spatial activity of a 400 neuron network during waxing and waning oscillations. Same description as in Fig. 9 with nearest-neighbor connectivity and self-connections. In this case a clockwise rotating pattern of activity is seen transiently, as well as patterns similar to Fig. 9. Steps between frames are 10 ms, and the averaged activity was evaluated from an averaging over a disk of 113 neurons centered in the network.
*:m M] N=400 (1
N=lHXl # ]
2s
FIG. 11. Spatiotemporal patterns giving rise to waxing and waning ac- tivity. A: snapshots of activity in a 100 neuron network during waxing and waning oscillations corresponding to the regions of the averaged mem- brane potential indicated. Top series of snapshots was taken during the “desynchronized” phase and shows highly irregular spatiotemporal behav- ior. Bottom series of snapshots was taken during the “oscillatory” phase, when the network is more synchronized and coherent oscillations are found in the averaged activity. The time interval between frames was 40 ms. B: averaged membrane potentials for networks with N = 100, N = 400, and N = 1,600 neurons. For N = 400 and N = 1,600, the local average membrane potential was obtained by averaging over a disk of 113 neurons in the center of the network. All simulations were performed under condi- tions identical to those in Fig. 8. Vertical calibration bars for the average membrane potential traces are from -80 to -70 mV.
ilar to those observed in N = 100 networks (Fig. 11 B). Thus the waxing and waning patterns exhibited in small net- works (Fig. 8) may be closely related to similar patterns observed within the domains of larger networks. This is important in comparing our models with the much larger network of neurons found in RE, because the field potential recorded from RE in vivo is probably a local average of - 100 nearby neurons (see DISCUSSION).
Oscillatory behavior in the presence of GABAs synapses Application of GABA, antagonists has an insignificant
effect on spindle oscillations in vitro, suggesting that GABAB receptors are not essential to these oscillations (von Krosigk et al. 1993). However, a very weak GABAB compo- nent was seen in RE neurons (D. A. McCormick, personal communication). Indirect evidences also suggest a promi- nent GABA, IPSP with a much weaker GABA, compo- nent (Huguenard and Prince 1993). Although there is no evidence for purely GABA, synapses between RE cells, a modeling study has suggested that the 7- to 1 ~-HZ rhythmi- city could result from slow inhibition between RE cells (Wang and Rinzell993). In this section we explored simula- tions of RE neurons interacting by slow inhibition.
The first-order kinetic model of the synapse was adjusted

812 A. DESTEXHE, D. CONTRERAS, T. J. SEJNOWSKI, AND M. STERIADE
B
FIG. 12. Model of the GABA, IPSP. A: best fit obtained from the ki- netic-based model of synaptic currents (smooth curve), compared with GABA, currents obtained from whole-cell recordings in granule cells of rat dentate gyrus (noisy trace) (from Otis et al. 1993). The model was fit to the data with the use of a least-squares procedure. B: corresponding GABAB IPSP obtained from the model with a maximal conductance of gGABA = 0.25 nS.
by fitting the model to digitized recordings of GABA, post- synaptic currents obtained from whole-cell recordings in granule cells of rat dentate gyrus (Otis et al. 1993). We as- sumed that GABA,-mediated postsynaptic currents of RE cells are of similar time course as in dentate granule cells. Data are not yet available for RE cells, but preliminary data indicate that GABAB currents of TC cells have a time course comparable with that of dentate granule cells (J. Hu- guenard, personal communication). Figure 12A shows the best fit obtained by such a procedure, and the correspond- ing IPSP obtained by simulation of the RE cell is shown in Fig. 12B. To yield IPSPs comparable in amplitude with the GABA,-mediated IPSPs, the maximal conductance of the GABA, current was set IOO-fold lower to compensate for the longer duration of the GABA, current.
We explored the two-neuron model with GABA, syn- apses to compare it with our previous study of mutual GABA, inhibition. This simple system also allowed us to characterize the types of oscillatory behavior observed in more complex networks.
Two types of oscillations were observed (Fig. 13). In the absence of GABAB self-connections (Fig. 13A), there was an alternating multiple burst activity, very similar to the Type 1 oscillation of Fig. 5A. However, the IPSP produced by the sequence of bursts is longer lasting, and the period of the oscillation, -3 s, is much longer. In the presence of self-inhibitory connections, a new type of oscillatory behav- ior was observed (Fig. 13B). The two cells oscillated in perfect synchrony at a frequency of 0.5-l Hz. Variations of the conductances values of all currents present in the system failed to produce oscillation at a frequency higher than -2 Hz.
Unlike a single neuron with an auto-GABA, synapse, which does not oscillate, a single neuron with an auto- GABA, synapse displays oscillatory behavior (not sh .own).
This shows that a perfectly synchronized solution is possi- ble in a system of RE neurons with GABA, synapses. In the following we define such perfectly synchronized oscillation as “Type 3 oscillation.”
We also investigated networks with five neurons, similar to those shown in Fig. 6 (not shown here). Type 1 oscilla- tion only occurred for nearest-neighbor connectivity, as in Fig. 6A. Type 3 oscillations are only seen for full connec- tivity, in which each neuron connects to every other neuron (as in Fig. 6, C and D). The other types of connectivities gave asynchronous oscillations.
In a two-dimensional array of RE neurons interacting with GABAB synapses, the dynamics appeared to be much less synchronous than in the case of GABA* interactions. Networks with nearest-neighbor connections displayed a Type 1 oscillation (not shown) similar to what was observed for GABA*. The output from a network with dense proxi- mal connections is shown in Fig. 14. Unlike the same con- figuration with GABA* synapses (Fig. 8), only a few cells became synchronized, although a very slow oscillatory ten- dency was observed in the average value of the membrane potential (Fig. 14C’). Typically, a majority of cells were hy- perpolarized by GABAB IPSPs for a long time (several sec- onds), occasionally producing a rebound burst. At any given time most of the cells are silent, as shown by the average membrane potential, which rarely goes above -80 mV (by comparison, in the case of GABA, networks, the average potential oscillated around -75 mV). “Clusters” of perfectly synchronous cells (2-5) were sometimes seen. This behavior is similar to that found in another model (Golomb and Rinzel 1993); however, these clusters were not static and recurred randomly.
For a large range of parameters values, including differ- ent schemes of connectivity, different values for the con- ductances, and the decay rates of IPSPs, we could not ob- serve synchronized rhythmicity for proximally connected
B
n
A
1
1
FIG. 13. Oscillatory behavior of 2 interconnected RE cells with GA- BA, synapses. Identical configuration and parameters as Fig. 5, but with slow inhibitory synapses. A: reciprocal inhibitory connections produced Type 1 oscillations. B: reciprocal and self-connections produced Type 3 oscillations that were highly synchronized. gGABA = 10 nS (A) and 5 nS (B). Vertical calibration bars for the membrane potentials are from - 100 to -50 mV.

MODEL OF RETICULAR THALAMIC OSCILLATIONS 813
A
C
0.5 s FIG. 14. Oscillatory behavior of a network of 100 RE neurons with
dense proximal GABA, connections. Identical configuration and parame- ters as Fig. 8, but with slow inhibitory synapses. A: pattern of connectivity: a given RE neuron (black) connects to immediately adjacent RE cells (dark gray) including an auto-synapse. B: activity of the 10 cells along the diago- nal of the network (vertical calibration bar is 200 mV). C average value of the membrane potentials of all 100 RE neurons during the same simula- tion as in B. Vertical calibration bar for the membrane potential is from -90 to -80 mV. sCABA = 0.4 nS.
networks of RE neurons with GABA* synapses. For net- works with a high degree of connectivity, there is no syn- chronization unless all neurons are connected. For exam- ple, synchrony was not observed in a N = 400 network in which each neuron received inputs from 18 1 neighboring neurons, or 45% connectivity. However, Type 3 slow syn- chronized oscillations were observed in N = 100 networks with full connectivity, in which every neuron sends a con- nection to all other neurons in the network (not shown).
DISCUSSION
Bridging the gap between the intrinsic properties of neu- rons and the behavior of networks formed from these neu- rons is a difficult problem. The highly nonlinear properties of most of the neurons in the CNS (Llinas 1988) makes the dynamics exhibited by even simple networks highly com- plex. This is especially the case for thalamic neurons and networks within the thalamus. On the other hand, the thala- mus has relatively simple anatomy compared with cortical circuits, and there is hope that some progress can be made with the use of modeling techniques based on physiological and anatomic data.
Even when deprived from all afferents, neurons in the thalamic RE nucleus display a waxing and waning type of rhythmicity at a frequency of 7- 16 Hz (Steriade et al. 1987). This finding, along with the particular intrinsic properties of RE cells (Avanzini et al. 1989; Bal and McCormick 1993), and the inhibitory nature of intra-RE connections
(Steriade et al. 1990), suggest that the intrinsic properties of RE neurons and mutual inhibitory interactions between them may generate such rhythms. Our model of the iso- lated RE nucleus confirms this hypothesis and provides constraints on possible mechanisms that may be responsi- ble for the rhythmicity.
Our approach has been to start with realistic models for the currents found in RE neurons, based on Hodgkin-Hux- ley type of kinetics and plausible biophysical schemes. We considered only single compartment models that neglected dendritic contributions, which may be significant in shap- ing the bursting behavior observed in these neurons (see Contreras et al. 1993). The patterns of connectivity of the networks that were explored were always uniform and lim- ited in extent. Nonetheless, the behaviors exhibited were generic and already present in the simplest two-neuron model. In our investigation we explored both the contribu- tions of the synaptic interactions and intrinsic properties of the RE neurons to the generation of spindle rhythmicity (see also Destexhe et al. 1993b,c; Steriade et al. 1993).
Intrinsic properties of RE neurons and kinetics of GABAergic synapses
Previous models of RE cells, based on simplified ionic conductance models, showed that the combination of IT and IK[Ca] is very robust in generating oscillations (Wang and Rinzel 1993). We observe the same general behavior here with different models of these two currents, based on more recent data from voltage-clamp and current-clamp experiments. In addition, the presence of IcAN increased the frequency of the oscillation and terminated the sequence of bursts into a tonic tail of spikes, as observed in vitro (Avan- zini et al. 1989; Bal and McCormick 1993) and in vitro (Contreras et al. 1993). At the single cell level, the model presented here shows that relatively simple kinetic schemes of the lkiCal and ICAN channels activated by intracellular Ca2+ can account for the production of rhythmic bursts terminated by a tonic tail of spikes. At the network level, the behavior was insensitive to the details of the intrinsic properties of RE cells, provided they could produce re- bound bursting activity.
The present model of synaptic conductance change is based on the kinetics of postsynaptic channels (Destexhe et al. 1994a,b). A kinetic model of synaptic conductances can be fitted to experimental voltage-clamp data (as shown in Figs. 4 and 12) and provides a natural way to integrate suc- cessive PSPs (Destexhe et al. 1994b). This is particularly useful for modeling thalamic neurons, which typically fire bursts of spikes during oscillatory states. A kinetic model of synaptic conductance changes has already been used to study the properties of 8- to lo-Hz spindling in intercon- nected thalamic relay and RE cells (Destexhe et al. 1993b,c).
Preliminary electrophysiological data indicate that the synaptic interaction between RE neurons is predominantly through GABA, receptors (Fig. 3), with a weaker GABAB component. In this paper a first-order kinetic scheme for the GABA, and GABA, receptors was shown to be compu- tationally very efficient, while reproducing the main fea-

814 A. DESTEXHE, D. CONTRERAS, T. J. SEJNOWSKI, AND M. STERIADE
tures of the kinetic properties of the corresponding synaptic currents.
Mechanisms for synchronous oscillations between RE neurons
Networks of inhibitory neurons exhibiting postinhibitory rebound have been used to model central pattern genera- tors in motor systems (Perkel and Mulloney 1974). In our model of rhythmicity in the RE nucleus, which was also based on interacting inhibitory neurons, rhythmic activity occurred in the network even though none of the cells exhib- ited sustained oscillations. Similar behavior is observed in small networks of inhibitory neurons in the stomatogastric ganglion of the lobster (Rowat and Selverston 1993).
Simplified network models specific to the RE nucleus have already been explored (Destexhe and Babloyantz 1992; Wang and Rinzel 1992, 1993). In these cases the syn- aptic interaction was modeled with the use of sigmoid-type of coupling, which assumed a smooth transformation be- tween the presynaptic voltage and the postsynaptic conduc- tance in the synapse. One of these models (Wang and Rin- zel 1992, 1993) demonstrated the presence of synchronized oscillations if the decay of the synaptic current was suffi- ciently slow. Another model (Destexhe and Babloyantz 1992) showed that synchronized rhythms could be ob- served if the connectivity between neurons was not re- stricted to immediate neighbors, but rather to a more ex- tended population of neighboring cells.
We have approached the problem of interpreting large- scale network simulation by first examining a two-neuron model, which already exhibited some of the oscillatory be- haviors found in larger networks. The additional complex- ity introduced by the topology of the network was explored by varying the pattern of connectivity.
Type 1 oscillations, first found in the two-neuron model, is the “alternating multiple burst” activity in which the two cells produce a sequence of rhythmic bursts in alternation. This oscillation was present for both GABA, and GABAB synapses in the two-neuron model as well as in the 5 and 100 cell networks. This type of oscillation was found when cells were only connected to their nearest neighbors and not to themselves.
Type 2 oscillations occurred only in the presence of GABA, synapses in networks with dense proximal connec- tivity. For both the two-neuron model and the network, there is a synchronized oscillation of the membrane poten- tial at a frequency of -6.5-9 Hz. Although the membrane potentials oscillate in phase, the cells have a tendency to fire in alternation. Type 2 oscillations were the most common type of oscillation observed in networks with GABA, syn- apses and connectivity extending beyond the nearest neigh- bors.
Type 3 oscillations occurred in the presence of GABAB interaction with full connectivity. Like Type 2 oscillations, Type 3 oscillations were characterized by a high degree of synchrony between the model cells. However, during Type 3 oscillations, RE cells displayed a perfectly synchronized periodic bursting behavior; the frequency was much lower (0.5-l Hz) than for GABA, Type 2 oscillation (6.5-9 Hz). Finally, the Type 3 oscillations were sensitive to the archi-
tecture of the network and were only found for full recipro- cal connectivity.
Perfect synchronization between two inhibitory neurons is only possible if the inhibition outlasts the rebound burst (Wang and Rinzel 1992). In the case of Type 3 oscillations, the GABAB current peaks at - 100 ms after the onset of the presynaptic spike (Otis et al. 1993). Our results therefore provide further support that two neurons reciprocally con- nected with this type of synapse can develop a perfectly synchronized oscillation.
Type 3 oscillations probably correspond to the oscillatory behavior observed in another model (Wang and Rinzel 1992, 1993), which exhibited perfect synchrony and re- quired slow inhibition. The oscillatory phenomena re- ported here were typically of the “release” variety as de- fined by Wang and Rinzel ( 1992), for which the time course of inhibition determines the oscillatory period of the sys- tem. However, in the present case, the frequency did not depend simply on the time course of inhibition, but rather on the balance between IPSPs and other intrinsic currents, such as &HP (not shown).
In our model of the RE cell, we were not able to find parameter values that produced Type 3 oscillations in the range of spindle frequencies (7- 14 Hz) because of the slow decay of the GABAB IPSP that prevented the cell from pro- ducing a rebound burst for nearly 1 s after the IPSP. The decay time constant of our GABA, currents is -200 ms, which is of the same order as the value used by Wang and Rinzel (1992, 1993). The same behavior at a higher fre- quency was observed if GABAB synapses had faster decay time constants or lower conductances (not shown). It is possible that neither the Wang-Rinzel model nor ours has the correct parameters for the slow GABAB currents, be- cause there are at present no data on isolated GABAB currents in RE nucleus available to help constrain the models.
A possible candidate for spindle rhythmicity
Comparing the properties of these three basic oscillatory modes with those of the RE nucleus, we suggest that the GABA, (Type 2) oscillation is the best candidate for the spindle rhythmicity observed in the isolated RE nucleus. CONNECTIVITY. Anatomic studies of the RE nucleus show that RE cells are connected through GABAergic dendro- dendritic synapses, except for rodents (Deschenes et al. 1985; Yen et al. 1985). In addition, the axons emanating from RE cells give rise to collaterals in the RE nucleus be- fore projecting to relay nuclei (Jones 1985; Yen et al. 1985). Because these collaterals probably extend over larger dis- tances than the size of the dendritic tree, it is expected that a given RE cell receives inputs from cells outside its immedi- ate neighborhood. This observation makes Type 1 and Type 3 oscillations unlikely candidates for spindle rhythmi- city, because they rely on conditions of connectivity that are not found in the RE: that RE cells are only connected to their immediate neighbors for Type 1 oscillations or that all RE cells are reciprocally connected for Type 3 oscillations.
Type 2 oscillations were not found for nearest-neighbors connectivity (except if self-connections were added), nei- ther for full GABA, connectivitv. Virtuallv all other con-

MODEL OF RETICULAR THALAMIC OSCILLATIONS 815
nections schemes gave rise to waxing and waning Type 2 oscillations, with or without autosynapses. The only requi- site is that every neuron receives input from a neighbor- hood sufficiently extended (more than the nearest-neigh- bors) but still smaller than the size of the network. FREQUENCY. In all simulations the frequencies of waxing and waning Type 2 oscillations were always in the range 6-9 Hz. The frequency depended on the decay time con- stant of GABA, IPSPs, as well as other parameters. When GABA, postsynaptic currents are modeled with a slow time course, the frequencies of the network oscillations are neces- sarily very slow (0.5-l Hz), much slower than the actual 7- 16 Hz frequency of rhythmical oscillation in the isolated RE nucleus (Steriade et al. 1987). This would rule out Type 3 oscillations. TIME COURSE OF IPSPs. From in vivo intracellular record- ings of the spontaneous oscillatory activity of RE cells in anesthetized cats (n = 70), only the presence of fast IPSPs has been revealed in somatic impalements (Fig. 3) (Con- treras and Steriade, unpublished data). Fast IPSPs were also directly observed in RE cells recorded in vitro and were thought to arise from neighboring RE cells (von Krosigk et al. 1993). Pharmacological evidence for the existence of GABA, receptors in RE neurons is strong (Bal and McCor- mick 1993; Huguenard and Prince 1993; McCormick and Prince 1986; Spreafico et al. 1988; von Krosigk et al. 1993). ROBUSTNESS. Among the three types of oscillations, Type 2 were the most frequently observed. Unlike Type 3 oscilla- tions, which were sensitive to the details of the architecture of the network, Type 2 oscillations were remarkably robust. They occurred for a variety of sizes and architectures of the network (provided the connectivity was sufficiently ex- tended), for different values of the conductances and differ- ent kinetics of IPSPs. They were also insensitive to the pa- rameters characterizing the intrinsic properties of the RE cells, such as the dominant tonic tail activity controlled by I CAN (as in Fig. 20). We expect that Type 2 collective oscil- latory behavior will persist in more realistic models of the RE nucleus. We also suspect that some unusual properties of Type 2 oscillations, such as the spatiotemporal wave phe- nomena, may also be found in simpler models, such as that of Destexhe and Babloyantz (1992) and Wang and Rinzel (1992, 1993), which did not include spikes but depended instead on a synaptic activation function that depended smoothly on the presynaptic membrane potential.
Spatiotemporal correlates of waxing and waning oscillations
In our network models the waxing and waning observed in the population activity was a consequence of averaging over spatiotemporal patterns of activity. Before suggesting that something similar may be happening in the RE, we must consider the genesis of the spatiotemporal phenom- ena, possible boundary effects due to finite size, and how the size of the network may influence the spatiotemporal patterns.
The spatiotemporal phenomena underlying waxing and waning oscillations in the network are irregular propagating waves of activity that sometimes show spirallike patterns. Within the wave, a subset of the neurons burst synchro-
nously. Although the overall activity of every cell in the network is aperiodic, synchronization takes place, rather remarkably, through coherent structures that are apparent only at the network level. The waxing and waning emerges as the number of synchronized cells progressively increases, then decreases.
Several lines of evidence lead to the conclusion that boundary conditions are not important in the genesis of these spatiotemporal phenomena. First, local field poten- tials obtained by averaging a subset of cells in the center of a large network show the same waxing and waning patterns as observed in smaller networks. This suggests that the borders of the network do not dominate the dynamics, prob- ably because neurons on the border have the same number of synaptic connections as neurons in the interior and trav- eling waves are absorbed rather than reflected (see Figs. 9 and 10). Second, other types of boundary conditions were tested, such as periodic boundary conditions, and produced the same qualitative behavior.
It is possible that new phenomena could emerge as the size of the network is increased. The main evidence against this possibility is that the typical wavelength of propagating waves remained constant as the number of neurons in the model was increased 16-fold. Even though the activity aver- aged over the entire network diminished with the size of the network, waxing and waning was still observed within smaller clusters of neurons with undiminished amplitude. We found that groups of - 100 neighboring neurons in a iV = 400 or N = 1,600 network showed waxing and waning patterns very similar to the averaged potential of the N = 100 network. This suggests that similar phenomena take place in networks of different sizes.
There is evidence that some regions of the RE are not homogeneous, as we have assumed in our model. Steriade et al. (1987) have reported that the field potentials from the RE recorded in vivo can display waxing and waning oscilla- tions at one location but be silent if the electrode is slightly displaced to a neighboring location in the RE. During a single-electrode penetration, several clusters of spindle rhythmicity were encountered separated by quiescent re- gions. This may be related to anatomic data showing that the RE nucleus is organized in a nonhomogeneous fashion (Jones 1985). Although the density of neurons in most re- gions of the RE is relatively low, in the rostra1 pole of the RE nucleus, the dendrites are organized in tightly packed bun- dles (Scheibel and Scheibel 1972). These data suggest that a relatively small number of RE neurons, perhaps no more than a few dozen, can generate the field potentials observed in the RE nucleus with extracellular microelectrodes. If this is valid, then the small sizes of the networks we have studied here may in fact match the relevant scale for collective phe- nomena occurring in the RE.
In the present model we have not incorporated the inho- mogeneities of connectivity in the RE nucleus because pre- cise data are not yet available. We suggest, however, that the N= 100 network is prototypical of a cluster of RE cells producing waxing and waning oscillations. If we assume further that a small population of - 100 neurons contrib- utes to the local field potentials that have been reported, then the model suggests that the same mechanisms may underlie waxing and waning in larger homogeneous net-

816 A. DESTEXHE, D. CONTRERAS, T. J. SEJNOWSKI, AND M. STERIADE
works. We therefore predict that spindle rhythmicity in the RE is a collective effect that arises in a population of tens to a hundred RE neurons with dense proximal connections.
Mechanisms of thalamic oscillations Our network model of RE neurons with reciprocal inhibi-
tion has revealed several mechanisms that provide insights into the origin of the rhythmic spindling that has been ob- served in the RE nucleus.
First, the model of RE thalamic neurons produced rhyth- micity in the spindle range with the use of plausible intrin- sic properties, synaptic kinetics, and patterns of intercon- nectivity. Several features of the model were important for generating this rhythmicity: first, the RE cells needed to have an intrinsic ability to generate rebound bursts; second, the GABAergic inhibitory interactions between RE cells needed to be fast; and, third, the interconnectivity must reach beyond the nearest-neighbor neurons and include in- puts from neurons covering an extended region.
Second, the waxing and waning observed in the simula- tions was a population phenomenon. In the model the wax- ing and waning was produced by the alternation of partially synchronized periods of oscillatory behavior with de- synchronized periods. Therefore a waxing and waning type of oscillation in the average membrane potential of neurons in the network does not necessarily correspond to waxing and waning patterns in single cells (Fig. 8). The model pre- dicts that the isolated RE nucleus should produce a waxing and waning pattern due to a population phenomenon and that the intracellular recordings made in isolated RE nu- cleus should reveal an important difference with spindles in intact preparation. Unlike waxing and waning of spindle oscillations in the intact thalamocortical system that have been observed in the membrane potentials of single neu- rons (Steriade and Llinas 1988; von Krosigk et al. 1993), the waxing and waning of the spindles in the isolated RE nucleus has not been recorded intracellularly. The popula- tion spindling observed in the model is nonetheless consis- tent with the waxing and waning observed in single units and field potentials recordings of the isolated RE nucleus in vivo (Steriade et al. 1987).
Third, the present model addressed the contributions of synaptic inhibition and connectivity in a network of RE cells without dendrites and demonstrates that dendritic in- teractions are not strictly necessary for generating spindle rhythmicity. However, dendrites may still be involved in generating and modulating the rhythmicity, as suggested previously (Deschenes et al. 1985). Intracellular recordings of RE neurons in vivo provide evidence that dendrites may contain some of the active currents that are involved in spindling behavior (Contreras et al. 1993). Such dendrites with active currents and reciprocal inhibitory synapses con- stitute potentially a multitude of local oscillators in the den- dritic tree. This opens a wide range of possible mechanisms of interaction that should be addressed by a more realistic model.
Transformation of spindles into epileptic oscillations Numerous clinical, electrophysiological, and pharmaco-
logical studies suggest that some type of ge neralized spike- and-wave epilepsy could be a perversion of spindle oscilla-
tions (see Avoli et al. 1990 for a review; see also Steriade et al. 1993). Antagonists of the GABAB receptor were found effective in preventing the development of spike-and-wave discharges in animal models (Hosford et al. 1992; Liu et al. 1992), suggesting that GABA, receptors are critically in- volved in the cellular mechanisms of this rhythmicity. This hypothesis was further supported by recent experiments in thalamic slices in vitro, which reported the transformation of spindle oscillations into slower and more synchronized oscillations in the presence of GABA, antagonists (von Krosigk et al. 1993). These slow oscillations were abolished by GABA, antagonists, confirming that they were gener- ated by mechanisms involving GABA, receptors. Recent experiments (Huguenard and Prince 1993) further showed that clonazepam, an antiabsence drug, reduced GABA, IPSPs in TC cells through actions in the RE nucleus, pre- venting the development of the “GABA, synchrony.”
In the present model we observed a perfectly synchro- nized slow oscillation (Type 3) in the presence of GABA, synapses for systems with full connectivity. However, we could not observe this type of perfectly synchronized oscil- lations with realistic connectivity. This is nonetheless in agreement with the absence of epileptic oscillations in the isolated RE nucleus in vivo (Steriade, unpublished observa- tions). The RE nucleus alone may be unable to develop epileptic behavior: we suggest that TC-RE interactions are necessary to account for this pathology. Consistent with this hypothesis, a shift from spindle oscillation to 2.5- to 3.5-Hz oscillations was observed in a simplified model of TC-RE interaction when the IPSP decay time constant was slowed from 10 to 300 ms (Destexhe et al. 1993~). Models of interconnected networks of TC and RE cells are needed to explore the role of GABA, in transforming spindles into spike-and-wave discharges.
Interactions of RE cells with thalamocortical cells
Experiments performed in ferret slices (von Krosigk et al. 1993) showed that the spindle oscillations observed in vitro depended on the integrity of the synaptic connections be- tween TC and RE cells. Our present model of the RE may help to explain why spindle rhythmicity was not observed in vitro when the RE was isolated from the TC. We have shown that a high degree of connectivity must be present between the RE cells before there is sufficient interaction to produce Type 2 oscillations. The loss of lateral inhibitory interactions in the slice may reduce the connectivity below the minimum required (Steriade et al. 1993). This can be tested by recording from thicker slices or organ cultures of the thalamus.
In a model of interconnected TC and RE cells, spindles were shown to occur as a result of the interaction between the intrinsic properties of TC and RE cells (Destexhe et al. 1993b,c). In the model the waxing and waning pattern was generated primarily by the TC cell, whereas the 8- to IO-Hz frequency was due to the intrinsic oscillatory properties of RE cells and the kinetics of inhibition in synapses from RE to TC cells. An understanding for how spindling is orga- nized in the thalamus will require an integration of the pres- ent network model of the RE nucleus with the model of

MODEL OF RETICULAR THALAMIC OSCILLATIONS 817
TC-RE interactions. Interactions between the thalamus and the cortex should also be included (Lytton et al. 1992).
dl Although we do not yet have a complete picture of spin- .e rhythmicity in the thalamus, the existing data together
with our models suggest a working hypothesis. Both in vivo (Buzsaki et al. 1988; Pare et al. 1987; Steriade et al. 1985) and in vitro (von Krosigk et al. 1993) experiments show that no sp indlin .g can be observed in TC cells that are sev- ered from their connections with the RE nucleus. In vivo experiments (Steriade et al. 1987) demonstrated the pres- ence of spindle rhythmicity in the deafferented RE nucleus, suggesting an RE origin of this rhythmic activity. However, that study also suggested that, in the intact brain, TC neu- rons may drive RE cells and shape spindle rhythmicity, as is now indicated by in vitro data (von Krosigk et al. 1993). The generation of spindles may therefore depend both on mechanisms intrinsic to the RE nucleus and on the interac- tions between RE and TC cells. The investigation of the spatial and temporal properties of the spindle oscillations that emerge from these more accurate and more
interactions complete m
shoul .odels.
.d benefit from
NEURON programs that simulate the models of this article, as well as movies showing the propagating wave activity, are available on request or by anonymous ftp to SALKEDU in /pub/slain.
We acknowledge Drs. J. Huguenard, T. Otis, and I. Mody for use of data. After submitting this manuscript we received a paper by D. Golomb, X. J. Wang, and J. Rinzel (unpublished) on oscillatory behavior in fully connected networks of RE neurons that is in agreement with our model. We also thank the authors for useful comments on our paper that im- proved the present manuscript.
This research was supported by the Howard Hughes Medical Institute and the Medical Research Council of Canada.
Address for reprint requests: The Howard Hughes Medical Institute and The Salk Institute, Computational Neurobiology Lab., 100 10 North Torrey Pines Rd., La Jolla, CA 92037.
Received 9 December 1993; accepted in final form 30 March 1994.
REFERENCES
ANDERSEN, P. AND ANDERSSON, S. A. The Physiological Basis oftheAIpha Rhythm. New York: Appelton Century Crofts, 1968.
AVANZINI, G., DE CURTIS, M., PANZICA, F., AND SPREAFICO, R. Intrinsic properties of nucleus reticular-is thalami neurones of the rat studied in vitro. J. Physiol. Lond. 4 16: 111-122, 1989.
AVOLI, M., GLOOR, P., KOSTOPOULOS, G., AND NAQUET, R. (Editors). Generalized Epilepsy. Boston, MA: Birkhaiiser, 1990.
BAL, T. AND MCCORMICK, D. A. Mechanisms of oscillatory activity in guinea-pig nucleus reticularis thalami in vitro: a mammalian pace- maker. J. Physiol. Land. 468: 669-69 1, 1993.
BUZSAKI, G., BICKFORD, R. G., PONOMAREFF, G., THAL, L. J., MANDEL, R., AND GAGE, F. H. Nucleus basalis and thalamic control of neocortical activity in the freely moving rat. J. Neurosci. 8: 4007-4026, 1988.
CONTRERAS, D., CURRY DOSSI, R., AND STERIADE, M. Electrophysiologi- cal properties of cat reticular thalamic neurones in vivo. J. Physiol. Land. 470: 273-294, 1993.
COULTER, D. A., HUGUENARD, J. R., AND PRINCE, D. A. Calcium currents in rat thalamocortical relay neurones: kinetic properties of the transient, low-threshold current. J. Physiol. Lond. 4 14: 587-604, 1989.
DESCHENES, M., MADARIAGA-D~MICH, A., AND STERIADE, M. Dendro- dendritic synapses in the cat reticularis thalami nucleus: a structural basis for thalamic spindle synchronization. Brain Res. 334: 165- 168, 1985.
DESTEXHE, A. AND BABLOYANTZ, A. Cortical coherent activity induced by thalamic oscillations. In: Neural Network Dynamics, edited by J. G. Taylor, E. R. Caianello, R. M. J. Cotter-ill, and J. W. Clark. Berlin: Springer-Verlag, 1992, p. 234-249.
DESTEXHE, A. AND BABLOYANTZ, A. A model of the inward current 1h and its possible role in thalamocortical oscillations. NeuroReport 4: 223- 226, 1993.
DESTEXHE, A., BABLOYANTZ, A., AND SEJNOWSIU, T. J. Ionic mechanisms for intrinsic slow oscillations in thalamic relay neurons. Biophys. J. 65: 1538-1552, 1993a.
DESTEXHE, A., LYTTON, W. W., SEJNOWSKI, T. J., MCCORMICK, D. A., CONTRERAS, D., AND STERIADE, M. A model of 7-14 Hz spindling in the thalamus and thalamic reticular nucleus: interaction between intrin- sic and network properties. Sot. Neurosci. Abstr. 19: 5 16, 1993b.
DESTEXHE, A., MAINEN, Z., AND SETNOWSKI, T. J. An efficient method for computing synaptic conductances based on a kinetic model of receptor binding. Neural Computation 6: 14- 18, 1994a.
DESTEXHE, A., MAINEN, Z., AND SEJNOWSKI, T. J. Synthesis of models for excitable membranes, synaptic transmission and neuromodulation us- ing a common kinetic formalism. J. Computational Neurosci. 1994b. In press.
DESTEXHE, A., MCCORMICK, D. A., AND SEJNOWSKI, T. J. A model for 8- 10 Hz spindling in interconnected thalamic relay and reticular-is neu- rons. Biophys. J. 65: 2474-2478, 1993~.
DOMICH, L., OAKSON, G., AND STERIADE, M. Thalamic burst patterns in the naturally sleeping cat: a comparison between cortically projecting and reticularis neurones. J. Physiol. Lond. 379: 429-449, 1986.
GAGE, P. W. Activation and modulation of neuronal K+ channels by GABA. Trends Neurosci. 15: 46-5 1, 1992.
GOLOMB, D. AND RINZEL, J. Dynamics of globally coupled inhibitory neu- rons with heterogeneity. Phys. Rev. E 48: 48 lo-48 14, 1993.
GOLOMB, D. AND RINZEL, J. Clustering in globally coupled inhibitory neurons. Physica D. 72: 259-282, 1994.
HINES, M. NEURON-A program for simulation of nerve equations. In: Neural Systems: Analysis and Modeling, edited by F. Eeckman. Nor- well, MA: Kluwer Academic, 1993, p. 127-136.
HODGKIN, A. L. AND HUXLEY, A. F. A quantitative description of mem- brane current and its application to conduction and excitation in nerve. J. Physiol. Lond. 117: 500-544, 1952.
HOSFORD, D. A., CLARK, S., CAO, Z., WILSON, W. A., JR., LIN, F. H., MORRISETT, R. A., AND HUIN, A. The role of GABA, receptor activa- tion in absence seizures of lethargic ( 1 h/ 1 h) mice. Science Wash. DC 257: 398-40 1, 1992.
HUGUENARD, J. R. AND PRINCE, D. A. A novel T-type current underlies prolonged Ca2+-dependent bursts firing in GABAergic neurons of rat thalamic reticular nucleus. J. Neurosci. 12: 3804-38 17, 1992.
HUGUENARD, J. R. AND PRINCE, D. A. Clonazepam suppresses GABA, inhibition in relay cells through actions in the reticular nucleus. Sot. Neurosci. Abstr. 19: 1704, 1993.
JONES, E. G. The Thalamus. New York: Plenum, 1985. LIU, Z., VERGNES, M., DEPAULIS, A., AND MARESCAUX, C. Involvement
of intrathalamic GABA, neurotransmission in the control of absence seizures in the rat. Neuroscience 48: 87-93, 1992.
LLINA~, R. R. The intrinsic electrophysiological properties of mamma- lian neurons: a new insight into CNS function. Science Wash. DC 242: 1654-1664, 1988.
LYTTON, W. W. AND SEJNOWSKI, T. J. Computer model of ethosuximide’s effect on a thalamic cell. Ann. Neural. 32: 13 l-l 39, 1992.
LYTTON, W. W., SEJNOWSKI, T. J., AND STERIADE M. Simulated entrain- ment of thalamocortical cells by repetitive cortical shocks. Sot. Neuro- sci. Abstr. 18: 305, 1992.
MCCORMICK, D. A. AND HUGUENARD, J. R. A model ofthe electrophysio- logical properties of thalamocortical relay neurons. J. Neurophysiol. 68: 1384-1400, 1992.
MCCORMICK, D. A. AND PAPE, H. C. Properties of a hyperpolarization-ac- tivated cation current and its role in rhythmic oscillations in thalamic relay neurones. J. Physiol. Land. 43 1: 29 l-3 18, 1990.
MCCORMICK, D. A. AND PRINCE, D. A. Acetylcholine induces burst firing in thalamic reticular neurones by activating a potassium conductance. Nature Lond. 3 19: 402-405, 1986.
MCCORMICK, D. A. AND WANG, Z. Serotonin and noradrenalin excite GABAergic neurones of the guinea-pig and cat nucleus reticularis tha- lami. J. Physiol. Lond. 442: 235-255, 199 1.
MORISON, R. S. AND BASSETT, D. L. Electrical activity of the thalamus and basal ganglia in decorticate cats. J. Neurophysiol. 8: 309-3 14, 1945.
MULLE, C., MADARIAGA, A., AND DESCH~NES, M. Morphology and elec- trophysiological properties of reticularis thalami neurons in cat: in vivo study of a thalamic pacemaker. J. Neurosci. 6: 2 134-2 145, 1986.
NUNEZ, P. L. Electric Fields of the Brain. The Neurophysics of EEG. Ox- ford, UK: Oxford Univ. Press, 198 1.
OTIS, T. S., DEKONINCK, Y., AND MODY, I. Characterization of synapti-

818 A. DESTEXHE, D. CONTRERAS, T. J. SEJNOWSISI, AND M. STERIADE
tally elicited GABA, responses using patch-clamp recordings in rat hip- pocampal slices. J. physiol. Lo&. 463: 39 l-407, 1993.
OTIS, T. S. AND MODY, I. Modulation of decay kinetics and frequency of GABA, receptor-mediated spontaneous inhibitory postsynaptic currents in hippocampal neurons. Neuroscience 49: 13-32, 1992.
PAR& D., STERIADE, M., DESCH~NES, M., AND OAKSON, G. Physiologi- cal characteristics of anterior thalamic nuclei, a group devoid of inputs from reticular thalamic nucleus. J. Neurophysiol. 57: 1669- 1685, 1987.
PARTRIDGE, L. D. AND SWANDULLA, D. Calcium-activated non-specific cation channels. Trends Neurosci. 11: 69-72, 1988.
PERKEL, D. H. AND MULLONEY, B. Motor pattern production in recipro- cally inhibitory neurons exhibiting postinhibitory rebound. Science Wash. DC 185: 181-183, 1974.
PERKEL, D. H., MULLONEY, B., AND BUDELLI, R. W. Quantitative meth- ods for predicting neuronal behavior. Neuroscience 6: 823-827, 198 1.
ROWAT, P. F. AND SELVERSTON, A. I. Modeling the gastric mill central pattern generator of the lobster with a relaxation-oscillator network. J. Neurophysiol. 70: 1030-1053, 1993.
SCHEIBEL, M. E. AND SCHEIBEL, A. B. Specialized organization patterns within the nucleus reticularis thalami of the cat. Exp. Neural. 34: 3 16- 322, 1972.
SOLTESZ, I., LIGHTOWLER, S., LERESCHE, N., JASSIK-GERSCHENFELD, D., POLLARD, C. E., AND CRUNELLI, V. Two inward currents and the trans- formation of low frequency oscillations of rat and cat thalamocortical cells. J. Physiol. Lond. 44 1: 175- 197, 199 1.
SPREAFICO, R., DE CURTIS, M., FFUSSONI, C., AND AVANZINI, G. Electro- physiological characteristics of morphologically identified reticular tha- lamic neurons from rat slices. Neuroscience 27: 629-638, 1988.
STERIADE, M., DESCH~NES, M., DOMICH, L., AND MULLE, C. Abolition of spindle oscillations in thalamic neurons disconnected from nucleus reticularis thalami. J. Neurophysiol. 54: 1473- 1497, 1985.
STERIADE, M., DOMICH, L., OAKSON, G., AND DESCH~NES, M. The deaf-
ferented reticular thalamic nucleus generates spindle rhythmicity. J. Neurophysiol. 57: 260-273, 1987.
STERIADE, M., JONES, E. G., AND LLINA~, R. R. Thalamic Oscillations and SignalZing. New York: Wiley, 1990.
STERIADE, M. AND LLINA~, R. R. The functional states of the thalamus and the associated neuronal interplay. Physiol. Rev. 68: 649-742, 1988.
STERIADE, M., MCCORMICK, D. A., AND SETNOWSKI, T. J. Thalamocorti- cal oscillations in the sleeping and aroused brain. Science Wash. DC 262: 679-685, 1993.
TOTH, T. AND CRIJNELLI, V. Computer simulations of the pacemaker oscillations of thalamocortical cells. NeuroReport 3: 65-68, 1992.
TRAUB, R. D. AND MILES, R. Neuronal Networks of the Hippocampus. Cambridge, UK: Cambridge Univ. Press, 199 1.
VANDONGEN, A. M. J., CODINA, J., OLATE, J., MATTERA, R., JOHO, R., BIRNBAUMER, L., AND BROWN, A. M. Newly identified brain potassium channels gated by the guanine nucleotide binding protein G,. Science Wash. DC 242: 1433- 1437, 1988.
VON KROSIGK, M., BAL, T., AND MCCORMICK, D. A. Cellular mechanisms of a synchronized oscillation in the thalamus. Science Wash. DC 26 1: 361-364, 1993.
WANG, X. J. AND RINZEL, J. Alternating and synchronous rhythms in reciprocally inhibitory model neurons. Neural Computation 4: 84-97, 1992.
WANG, X. J. AND RINZEL, J. Spindle rhythmicity in the reticularis thalami nucleus-synchronization among inhibitory neurons. Neuroscience 53: 899-904, 1993.
YAMADA, W. M., KOCH, C., AND ADAMS, P. R. Multiple channels and calcium dynamics. In: Methods in Neuronal Modeling, edited by C. Koch and I. Segev. Cambridge, MA: MIT Press, 1989, p. 97- 134.
YEN, C. T., CONLEY, M., HENDRY, S. H., AND JONES, E. G. The morphol- ogy of physiologically identified GABAergic neurons in the somatic sen- sory part of the thalamic reticular nucleus in the cat. J. Neurosci. 5: 2254-2268, 1985.
Copyright © 2022 FDOKUMEN