
The CLEC-2–podoplanin axis controls the contractility of fibroblastic reticular cells and lymph...
12
NATURE IMMUNOLOGY VOLUME 16 NUMBER 1 JANUARY 2015 75 The CLEC-2–podoplanin axis controls the contractility of fibroblastic reticular cells and lymph node microarchitecture Jillian L Astarita 1,2 , Viviana Cremasco 2 , Jianxin Fu 3,4 , Max C Darnell 5,6 , James R Peck 2 , Janice M Nieves-Bonilla 2 , Kai Song 3,4 , Yuji Kondo 3,4 , Matthew C Woodruff 1,7 , Alvin Gogineni 8 , Lucas Onder 9 , Burkhard Ludewig 9 , Robby M Weimer 8 , Michael C Carroll 7 , David J Mooney 5,6 , Lijun Xia 3,4 & Shannon J Turley 2,10,11 In lymph nodes, fibroblastic reticular cells (FRCs) form a collagen-based reticular network that supports migratory dendritic cells (DCs) and T cells and transports lymph. A hallmark of FRCs is their propensity to contract collagen, yet this function is poorly understood. Here we demonstrate that podoplanin (PDPN) regulates actomyosin contractility in FRCs. Under resting conditions, when FRCs are unlikely to encounter mature DCs expressing the PDPN receptor CLEC-2, PDPN endowed FRCs with contractile function and exerted tension within the reticulum. Upon inflammation, CLEC-2 on mature DCs potently attenuated PDPN- mediated contractility, which resulted in FRC relaxation and reduced tissue stiffness. Disrupting PDPN function altered the homeostasis and spacing of FRCs and T cells, which resulted in an expanded reticular network and enhanced immunity. Lymph nodes (LNs) are highly organized structures that serve as ‘ren- dezvous points’ for dendritic cells (DCs), T lymphocytes and B lym- phocytes. The maintenance of LN structure and compartmentalization are critical for generating effective immune responses and controlling unwanted immunological activation 1 . LNs increase vastly in size dur- ing immune responses and then must contract again upon resolution. Although lymphocyte proliferation and vascular remodeling contribute to this swelling 2–4 , the contributions of the reticular network have not been elucidated. Fibroblastic reticular cells (FRCs) are LN-resident mesenchymal cells that secrete and remodel the extracellular matrix to create a dense reticular network. The FRC network serves as a scaffold for DCs and T cells to crawl on 5–9 and as a conduit for transporting lymph from the subcapsular sinus into the LN parenchyma 7,10,11 . A propensity to pull on collagen fibers and create tension is a hallmark of myofibroblasts. FRCs are specialized myofibroblasts in lymphoid organs with notable contractility 7,8 ; however, the mechanistic basis and functional effects of this hallmark characteristic remain unknown. We hypothesized that the contractile function of FRCs might have a role in ‘tuning’ LN microar- chitecture and immunity. Podoplanin (PDPN; also known as gp38, Aggrus and T1a) is a transmembrane glycoprotein with high expression by FRCs, lymphatic endothelial cells (LECs) and various other cell types outside LNs 12 . It is critical during fetal development for blood-lymph separation and lung organogenesis 12–14 , and its overexpression in cancer correlates with increased invasion and metastasis 15 . However, a cell-autonomous function of PDPN in healthy adults has yet to be elucidated. PDPN is the endogenous ligand for the C-type lectin receptor CLEC-2 (CLEC1b) 16 , which is expressed by platelets and DCs. CLEC-2 signaling is critical for platelet activation 17 , the migration of activated DCs to draining LNs 18 and maintenance of vascular integrity and LN structure 19–21 . However, whether the engagement of CLEC-2 by PDPN results in signaling into the PDPN-expressing cell is unknown. Here we elucidate the role of the PDPN–CLEC-2 interaction in FRC function. Under resting conditions, when FRCs are unlikely to encounter CLEC-2 in LNs due to a dearth of migratory DCs 22 , PDPN endows FRCs with the ability to exert tension within the reticular net- work. In this state, PDPN activates the actomyosin machinery of FRCs by engaging a neighboring transmembrane protein. Preventing PDPN signaling by the provision of CLEC-2, antibody blockade or genetic deficiency markedly attenuated the phosphorylation of myosin light chain (MLC) and contraction of FRCs. Loss of FRC contractility led to significant changes in the homeostasis and spacing of FRCs and T cells, with profound consequences for the LN microarchitecture and the population expansion of antigen-specific T cells following immunization. 1 Division of Medical Sciences, Harvard Medical School, Boston, Massachusetts, USA. 2 Department of Cancer Immunology and AIDS, Dana-Farber Cancer Institute, Boston, Massachusetts, USA. 3 Cardiovascular Biology Research Program, Oklahoma Medical Research Foundation, Oklahoma City, Oklahoma, USA. 4 Department of Biochemistry and Molecular Biology, University of Oklahoma Health Sciences Center, Oklahoma City, Oklahoma, USA. 5 School of Engineering and Applied Sciences, Harvard University, Cambridge, Massachusetts, USA. 6 Wyss Institute for Biologically Inspired Engineering at Harvard University, Cambridge, Massachusetts, USA. 7 Program in Cellular and Molecular Medicine, Children’s Hospital Boston, Harvard Medical School, Boston, Massachusetts, USA. 8 Department of Biomedical Imaging, Genentech, South San Francisco, California, USA. 9 Institute of Immunobiology, Kantonal Hospital St. Gallen, St. Gallen, Switzerland. 10 Department of Microbiology and Immunobiology, Harvard Medical School, Boston, Massachusetts, USA. 11 Department of Cancer Immunology, Genentech, South San Francisco, California, USA. Correspondence should be addressed to S.J.T. ([email protected]). Received 22 August; accepted 20 October; published online 27 October 2014; doi:10.1038/ni.3035. ARTICLES npg © 2015 Nature America, Inc. All rights reserved.
-
Upload
independent -
Category
Documents
-
view
1 -
download
0
Transcript of The CLEC-2–podoplanin axis controls the contractility of fibroblastic reticular cells and lymph...

NATURE IMMUNOLOGY VOLUME 16 NUMBER 1 JANUARY 2015 75
The CLEC-2–podoplanin axis controls the contractility of fibroblastic reticular cells and lymph node microarchitectureJillian L Astarita1,2, Viviana Cremasco2, Jianxin Fu3,4, Max C Darnell5,6, James R Peck2, Janice M Nieves-Bonilla2, Kai Song3,4, Yuji Kondo3,4, Matthew C Woodruff1,7, Alvin Gogineni8, Lucas Onder9, Burkhard Ludewig9, Robby M Weimer8, Michael C Carroll7, David J Mooney5,6, Lijun Xia3,4 & Shannon J Turley2,10,11
In lymph nodes, fibroblastic reticular cells (FRCs) form a collagen-based reticular network that supports migratory dendritic cells (DCs) and T cells and transports lymph. A hallmark of FRCs is their propensity to contract collagen, yet this function is poorly understood. Here we demonstrate that podoplanin (PDPN) regulates actomyosin contractility in FRCs. Under resting conditions, when FRCs are unlikely to encounter mature DCs expressing the PDPN receptor CLEC-2, PDPN endowed FRCs with contractile function and exerted tension within the reticulum. Upon inflammation, CLEC-2 on mature DCs potently attenuated PDPN-mediated contractility, which resulted in FRC relaxation and reduced tissue stiffness. Disrupting PDPN function altered the homeostasis and spacing of FRCs and T cells, which resulted in an expanded reticular network and enhanced immunity.
Lymph nodes (LNs) are highly organized structures that serve as ‘ren-dezvous points’ for dendritic cells (DCs), T lymphocytes and B lym-phocytes. The maintenance of LN structure and compartmentalization are critical for generating effective immune responses and controlling unwanted immunological activation1. LNs increase vastly in size dur-ing immune responses and then must contract again upon resolution. Although lymphocyte proliferation and vascular remodeling contribute to this swelling2–4, the contributions of the reticular network have not been elucidated.
Fibroblastic reticular cells (FRCs) are LN-resident mesenchymal cells that secrete and remodel the extracellular matrix to create a dense reticular network. The FRC network serves as a scaffold for DCs and T cells to crawl on5–9 and as a conduit for transporting lymph from the subcapsular sinus into the LN parenchyma7,10,11. A propensity to pull on collagen fibers and create tension is a hallmark of myofibroblasts. FRCs are specialized myofibroblasts in lymphoid organs with notable contractility7,8; however, the mechanistic basis and functional effects of this hallmark characteristic remain unknown. We hypothesized that the contractile function of FRCs might have a role in ‘tuning’ LN microar-chitecture and immunity.
Podoplanin (PDPN; also known as gp38, Aggrus and T1a) is a transmembrane glycoprotein with high expression by FRCs, lymphatic endothelial cells (LECs) and various other cell types outside LNs12. It
is critical during fetal development for blood-lymph separation and lung organogenesis12–14, and its overexpression in cancer correlates with increased invasion and metastasis15. However, a cell-autonomous function of PDPN in healthy adults has yet to be elucidated. PDPN is the endogenous ligand for the C-type lectin receptor CLEC-2 (CLEC1b)16, which is expressed by platelets and DCs. CLEC-2 signaling is critical for platelet activation17, the migration of activated DCs to draining LNs18 and maintenance of vascular integrity and LN structure19–21. However, whether the engagement of CLEC-2 by PDPN results in signaling into the PDPN-expressing cell is unknown.
Here we elucidate the role of the PDPN–CLEC-2 interaction in FRC function. Under resting conditions, when FRCs are unlikely to encounter CLEC-2 in LNs due to a dearth of migratory DCs22, PDPN endows FRCs with the ability to exert tension within the reticular net-work. In this state, PDPN activates the actomyosin machinery of FRCs by engaging a neighboring transmembrane protein. Preventing PDPN signaling by the provision of CLEC-2, antibody blockade or genetic deficiency markedly attenuated the phosphorylation of myosin light chain (MLC) and contraction of FRCs. Loss of FRC contractility led to significant changes in the homeostasis and spacing of FRCs and T cells, with profound consequences for the LN microarchitecture and the population expansion of antigen-specific T cells following immunization.
1Division of Medical Sciences, Harvard Medical School, Boston, Massachusetts, USA. 2Department of Cancer Immunology and AIDS, Dana-Farber Cancer Institute, Boston, Massachusetts, USA. 3Cardiovascular Biology Research Program, Oklahoma Medical Research Foundation, Oklahoma City, Oklahoma, USA. 4Department of Biochemistry and Molecular Biology, University of Oklahoma Health Sciences Center, Oklahoma City, Oklahoma, USA. 5School of Engineering and Applied Sciences, Harvard University, Cambridge, Massachusetts, USA. 6Wyss Institute for Biologically Inspired Engineering at Harvard University, Cambridge, Massachusetts, USA. 7Program in Cellular and Molecular Medicine, Children’s Hospital Boston, Harvard Medical School, Boston, Massachusetts, USA. 8Department of Biomedical Imaging, Genentech, South San Francisco, California, USA. 9Institute of Immunobiology, Kantonal Hospital St. Gallen, St. Gallen, Switzerland. 10Department of Microbiology and Immunobiology, Harvard Medical School, Boston, Massachusetts, USA. 11Department of Cancer Immunology, Genentech, South San Francisco, California, USA. Correspondence should be addressed to S.J.T. ([email protected]). Received 22 August; accepted 20 October; published online 27 October 2014; doi:10.1038/ni.3035.
ART ICLES
npg
© 2
015
Nat
ure
Am
eric
a, In
c. A
ll rig
hts
rese
rved
.
76 VOLUME 16 NUMBER 1 JANUARY 2015 NATURE IMMUNOLOGY
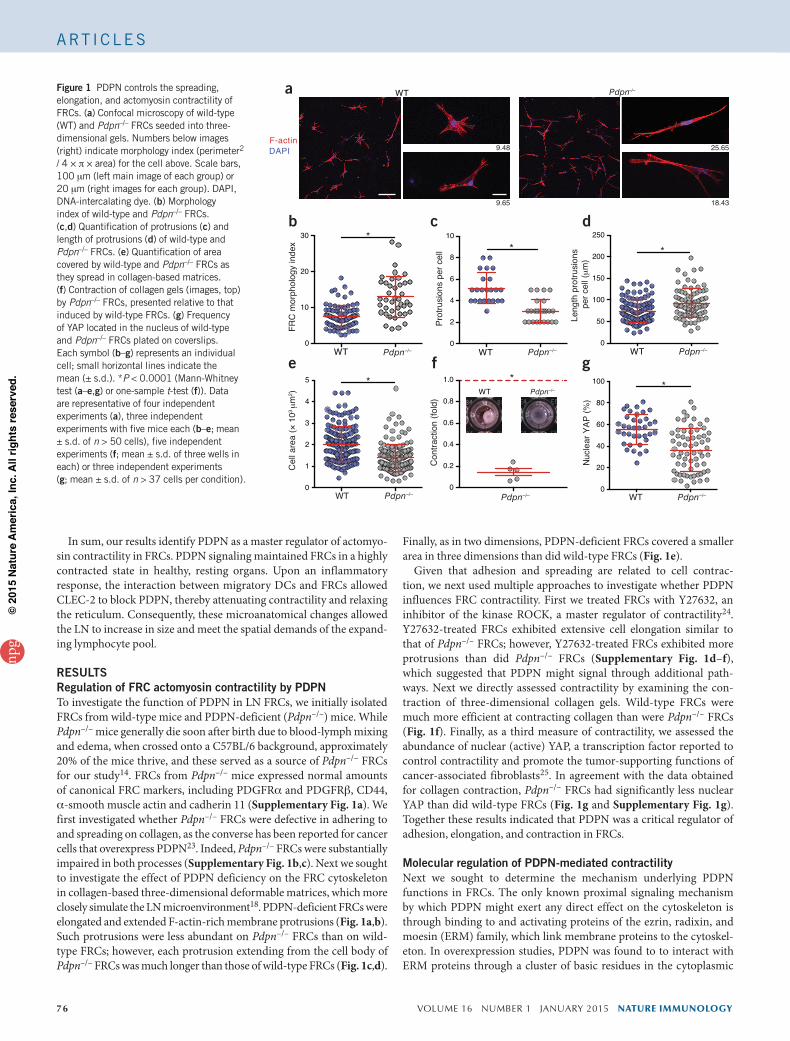
Finally, as in two dimensions, PDPN-deficient FRCs covered a smaller area in three dimensions than did wild-type FRCs (Fig. 1e).
Given that adhesion and spreading are related to cell contrac-tion, we next used multiple approaches to investigate whether PDPN influences FRC contractility. First we treated FRCs with Y27632, an inhibitor of the kinase ROCK, a master regulator of contractility24. Y27632-treated FRCs exhibited extensive cell elongation similar to that of Pdpn–/– FRCs; however, Y27632-treated FRCs exhibited more protrusions than did Pdpn–/– FRCs (Supplementary Fig. 1d–f), which suggested that PDPN might signal through additional path-ways. Next we directly assessed contractility by examining the con-traction of three-dimensional collagen gels. Wild-type FRCs were much more efficient at contracting collagen than were Pdpn–/– FRCs (Fig. 1f). Finally, as a third measure of contractility, we assessed the abundance of nuclear (active) YAP, a transcription factor reported to control contractility and promote the tumor-supporting functions of cancer-associated fibroblasts25. In agreement with the data obtained for collagen contraction, Pdpn–/– FRCs had significantly less nuclear YAP than did wild-type FRCs (Fig. 1g and Supplementary Fig. 1g). Together these results indicated that PDPN was a critical regulator of adhesion, elongation, and contraction in FRCs.
Molecular regulation of PDPN-mediated contractilityNext we sought to determine the mechanism underlying PDPN functions in FRCs. The only known proximal signaling mechanism by which PDPN might exert any direct effect on the cytoskeleton is through binding to and activating proteins of the ezrin, radixin, and moesin (ERM) family, which link membrane proteins to the cytoskel-eton. In overexpression studies, PDPN was found to to interact with ERM proteins through a cluster of basic residues in the cytoplasmic
In sum, our results identify PDPN as a master regulator of actomyo-sin contractility in FRCs. PDPN signaling maintained FRCs in a highly contracted state in healthy, resting organs. Upon an inflammatory response, the interaction between migratory DCs and FRCs allowed CLEC-2 to block PDPN, thereby attenuating contractility and relaxing the reticulum. Consequently, these microanatomical changes allowed the LN to increase in size and meet the spatial demands of the expand-ing lymphocyte pool.
RESULTSRegulation of FRC actomyosin contractility by PDPNTo investigate the function of PDPN in LN FRCs, we initially isolated FRCs from wild-type mice and PDPN-deficient (Pdpn–/–) mice. While Pdpn–/– mice generally die soon after birth due to blood-lymph mixing and edema, when crossed onto a C57BL/6 background, approximately 20% of the mice thrive, and these served as a source of Pdpn–/– FRCs for our study14. FRCs from Pdpn–/– mice expressed normal amounts of canonical FRC markers, including PDGFRa and PDGFRb, CD44, a-smooth muscle actin and cadherin 11 (Supplementary Fig. 1a). We first investigated whether Pdpn–/– FRCs were defective in adhering to and spreading on collagen, as the converse has been reported for cancer cells that overexpress PDPN23. Indeed, Pdpn–/– FRCs were substantially impaired in both processes (Supplementary Fig. 1b,c). Next we sought to investigate the effect of PDPN deficiency on the FRC cytoskeleton in collagen-based three-dimensional deformable matrices, which more closely simulate the LN microenvironment18. PDPN-deficient FRCs were elongated and extended F-actin-rich membrane protrusions (Fig. 1a,b). Such protrusions were less abundant on Pdpn–/– FRCs than on wild-type FRCs; however, each protrusion extending from the cell body of Pdpn–/– FRCs was much longer than those of wild-type FRCs (Fig. 1c,d).
d
Leng
th p
rotru
sion
s pe
r cel
l (μ
m)
WT0
50
100
150
200
250b
FRC
mor
phol
ogy
inde
x
0
10
20
30
WT
*
Prot
rusi
ons
per c
ell
WT
c
F-actinDAPI
WT
18.43
25.65
Nucl
ear Y
AP (%
)
WT
gf
a
e
0
1
2
3
4
5
Cel
l are
a (×
103
μm
2 )
WT
0
2
4
6
8
10
Pdpn–/–
0
0.2
0.4
0.6
0.8
1.0
Con
tract
ion
(fold
)
WT
0
20
40
60
80
100
Pdpn–/–
* *
***
9.65
9.48
Pdpn–/– Pdpn–/–
Pdpn–/–Pdpn–/–Pdpn–/–
Pdpn–/–
Figure 1 PDPN controls the spreading, elongation, and actomyosin contractility of FRCs. (a) Confocal microscopy of wild-type (WT) and Pdpn–/– FRCs seeded into three-dimensional gels. Numbers below images (right) indicate morphology index (perimeter2 / 4 × p × area) for the cell above. Scale bars, 100 mm (left main image of each group) or 20 mm (right images for each group). DAPI, DNA-intercalating dye. (b) Morphology index of wild-type and Pdpn–/– FRCs. (c,d) Quantification of protrusions (c) and length of protrusions (d) of wild-type and Pdpn–/– FRCs. (e) Quantification of area covered by wild-type and Pdpn–/– FRCs as they spread in collagen-based matrices. (f) Contraction of collagen gels (images, top) by Pdpn–/– FRCs, presented relative to that induced by wild-type FRCs. (g) Frequency of YAP located in the nucleus of wild-type and Pdpn–/– FRCs plated on coverslips. Each symbol (b–g) represents an individual cell; small horizontal lines indicate the mean (± s.d.). *P < 0.0001 (Mann-Whitney test (a–e,g) or one-sample t-test (f)). Data are representative of four independent experiments (a), three independent experiments with five mice each (b–e; mean ± s.d. of n > 50 cells), five independent experiments (f; mean ± s.d. of three wells in each) or three independent experiments (g; mean ± s.d. of n > 37 cells per condition).
ART ICLES
npg
© 2
015
Nat
ure
Am
eric
a, In
c. A
ll rig
hts
rese
rved
.

NATURE IMMUNOLOGY VOLUME 16 NUMBER 1 JANUARY 2015 77
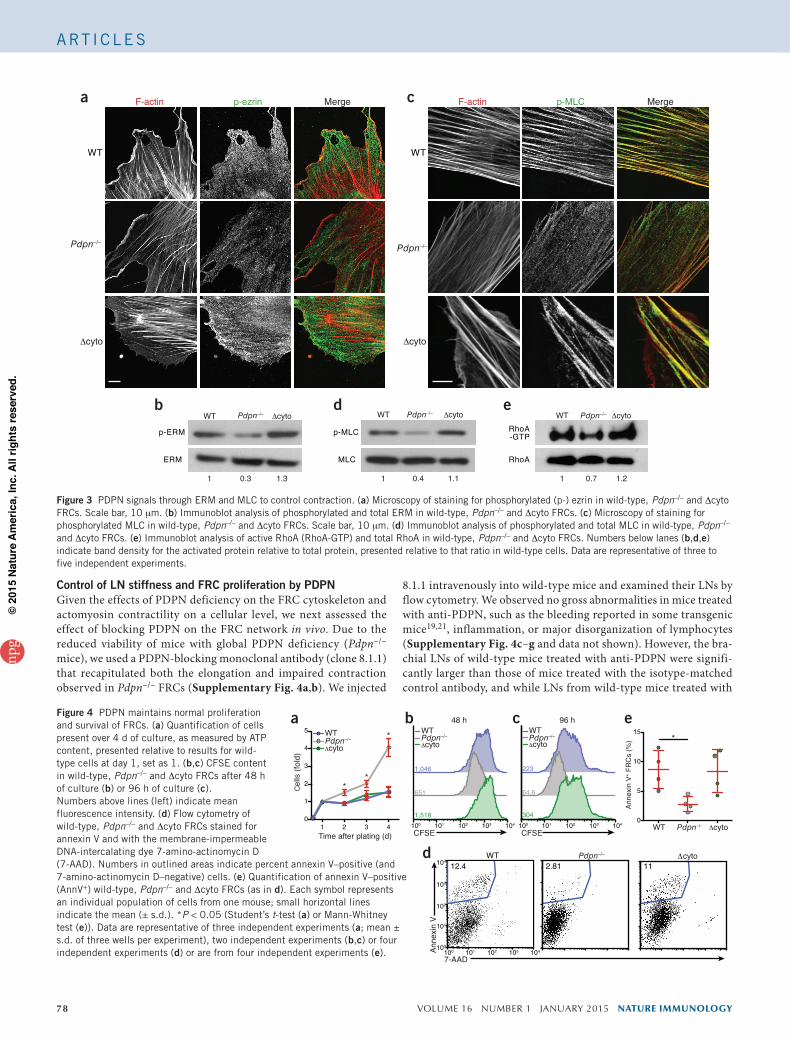
and Supplementary Fig. 3c). Together these results indicated that PDPN expression maintained large amounts of activated ERM, MLC and RhoA, which endowed FRCs with contractile ability. When PDPN was genetically ablated, the global abundance of these activated factors was considerably reduced and thus FRCs were no longer able to adhere to collagen or generate tension within the reticular network.
Control of the proliferation and survival of FRCs by PDPNStromal fibroblasts are exquisitely sensitive to the stiffness of the extracel-lular matrix they adhere to, which in turn affects their cytoskeletal con-traction. Greater substrate stiffness results in tension in fibroblasts, which can affect their growth and survival28. Thus, we investigated whether the attenuated contractility in Pdpn–/– FRCs affected their proliferation or sur-vival. Whereas the number of wild-type and Dcyto FRCs remained steady over a 4-day period, Pdpn–/– FRCs increased up to fourfold in number (Fig. 4a). Pdpn–/– FRCs proliferated more extensively than did wild-type FRCs (Fig. 4b,c) and survived better than either wild-type FRCs or Dcyto FRCs (Fig. 4d,e). Overall, these data demonstrated the involvement of PDPN signaling in regulating the growth and survival of FRCs.
tail of PDPN23,26. To ascertain whether the PDPN-mediated control of actomyosin contractility in primary FRCs was medi-ated via this ERM-binding site, we gener-ated knock-in mice in which PDPN lacking its cytoplasmic tail globally replaced full-length PDPN (called ‘Dcyto mice’ here) (Supplementary Fig. 2a,b). These mice were viable and did not exhibit any gross abnormalities. FRCs from LNs of Dcyto mice expressed normal amounts of PDPN, which did not become glycosylphosphatidylinositol anchored (Supplementary Fig. 2c–f). Upon culturing Dcyto FRCs in three-dimensional matrices, we found that deletion of the nine–amino acid cytoplasmic tail was suffi-cient to recapitulate the elongated phenotype of the Pdpn–/– FRCs, with fewer and longer membrane protrusions than those of wild-type FRCs (Fig. 2a–d). Unexpectedly, Dcyto FRCs were essentially identical to wild-type FRCs in contractility, showing no impair-ment in collagen contraction or difference in the amount of active YAP (Fig. 2e,f and Supplementary Fig. 2g).
Having shown that direct binding of the PDPN cytoplasmic tail to ERM proteins was dispensable for actomyosin contractility in FRCs, we next sought to determine whether and to what extent key mediators of acto-myosin contractility were affected by PDPN deficiency. Whereas localization of phos-phorylated ezrin was unchanged (Fig. 3a), the abundance of phosphorylated ERM in Pdpn–/– FRCs was 50% as much as that in wild-type or Dcyto FRCs (Fig. 3b and Supplementary Fig. 3a). The degree to which the abundance of phosphorylated ERM was reduced in Pdpn–/– FRCs was especially striking given that these cytoskeletal linkers associate with multiple abundantly expressed transmembrane proteins. This idea, together with the finding that phosphorylated ERM abundance was normal in Dcyto FRCs, indicated that other domains of PDPN were sufficient to maintain global activation of ERM.
Next we investigated the subcellular localization of phosphorylated MLC, a key regulator of contractility. In wild-type and Dcyto FRCs, phosphorylated MLC largely localized together with actin filaments (Fig. 3c). In contrast, and consistent with the data obtained for func-tional contraction, in Pdpn–/– FRCs, the phosphorylated MLC molecules were not associated with actin filaments; instead, they were more evenly distributed throughout the cell (Fig. 3c). We confirmed that finding by immunoblot analysis, which indicated that the amount of phosphory-lated MLC was diminished in Pdpn–/– FRCs but was similar in wild-type FRCs and Dcyto FRCs (Fig. 3d and Supplementary Fig. 3b).
Finally, we measured the abundance of active RhoA in FRCs. This small GTPase is downstream of ERM signaling but can also feed back to affect the activation of ERM proteins27. Additionally, RhoA func-tions upstream of MLC to control contraction24. Consistent with our contraction data, the amount of RhoA-GTP was lower in Pdpn–/– FRCs than in wild-type or Dcyto FRCs, which had similar amounts (Fig. 3e
a Δcyto
F-actinDAPI
12.90
8.04
WT
8.79
21.06
cb
Prot
rusi
ons
per c
ell
0
2
4
6
8 ****
0
10
20
30
40
50
FRC
mor
phol
ogy
inde
x ****
WT Δcyto WT Δcyto
e
d
Leng
th o
f pro
trusi
ons
per c
ell (μ
m)
****
0
50
100
150
200
250
** NS
fNS
*
WT Δcyto
WT ΔcytoPdpn–/– Δcyto0
0.5
1.0
1.5
2.0
Con
tract
ion
(fold
)
0
20
40
60
80
Nucl
ear Y
AP (%
)
WT Δcyto
Pdpn–/–
Pdpn–/–
Pdpn–/– Pdpn–/– Pdpn–/–
Figure 2 The PDPN cytoplasmic tail controls FRC elongation but is dispensable for contraction. (a) Confocal microscopy of wild-type and Dcyto FRCs seeded into three-dimensional gels (numbers as in Fig. 1a). Scale bars, 100 mm (left) or 20 mm (right). (b) Morphology index of wild-type, Pdpn–/– and Dcyto FRCs. (c,d) Quantification of protrusions (c) and length of protrusions (d) of wild-type, Pdpn–/– and Dcyto FRCs. (e) Contraction of collagen gels by Pdpn–/– and Dcyto FRCs, relative to that induced by wild-type FRCs. (f) Frequency of nuclear YAP in wild-type, Pdpn–/– and Dcyto FRCs. Each symbol (b–f) represents an individual cell; small horizontal lines indicate the mean (± s.d.). NS, not significant; *P < 0.01 and **P < 0.0001 (Mann-Whitney test (a–d,f) or one-sample t-test (e)). Data are representative of three independent experiments (a–d; mean ± s.d. of n > 50 cells in each in b–d), three to eight independent experiments (e; mean ± s.d.) or two independent experiments (f; n > 9 cells per experiment).
ART ICLES
npg
© 2
015
Nat
ure
Am
eric
a, In
c. A
ll rig
hts
rese
rved
.
78 VOLUME 16 NUMBER 1 JANUARY 2015 NATURE IMMUNOLOGY
8.1.1 intravenously into wild-type mice and examined their LNs by flow cytometry. We observed no gross abnormalities in mice treated with anti-PDPN, such as the bleeding reported in some transgenic mice19,21, inflammation, or major disorganization of lymphocytes (Supplementary Fig. 4c–g and data not shown). However, the bra-chial LNs of wild-type mice treated with anti-PDPN were signifi-cantly larger than those of mice treated with the isotype-matched control antibody, and while LNs from wild-type mice treated with
Control of LN stiffness and FRC proliferation by PDPNGiven the effects of PDPN deficiency on the FRC cytoskeleton and actomyosin contractility on a cellular level, we next assessed the effect of blocking PDPN on the FRC network in vivo. Due to the reduced viability of mice with global PDPN deficiency (Pdpn–/– mice), we used a PDPN-blocking monoclonal antibody (clone 8.1.1) that recapitulated both the elongation and impaired contraction observed in Pdpn–/– FRCs (Supplementary Fig. 4a,b). We injected
e
a
db
c F-actin p-MLC MergeF-actin p-ezrin Merge
WT WT
Δcyto Δcyto
p-MLC
MLC
WT Pdpn–/– Δcyto
1 0.4 1.1
p-ERM
ERM
WT Δcyto
1 0.3 1.3
RhoA
RhoA
1 0.7 1.2
-GTP
WT ΔcytoPdpn–/– Pdpn–/–
Pdpn–/–Pdpn–/–
Figure 3 PDPN signals through ERM and MLC to control contraction. (a) Microscopy of staining for phosphorylated (p-) ezrin in wild-type, Pdpn–/– and Dcyto FRCs. Scale bar, 10 mm. (b) Immunoblot analysis of phosphorylated and total ERM in wild-type, Pdpn–/– and Dcyto FRCs. (c) Microscopy of staining for phosphorylated MLC in wild-type, Pdpn–/– and Dcyto FRCs. Scale bar, 10 mm. (d) Immunoblot analysis of phosphorylated and total MLC in wild-type, Pdpn–/– and Dcyto FRCs. (e) Immunoblot analysis of active RhoA (RhoA-GTP) and total RhoA in wild-type, Pdpn–/– and Dcyto FRCs. Numbers below lanes (b,d,e) indicate band density for the activated protein relative to total protein, presented relative to that ratio in wild-type cells. Data are representative of three to five independent experiments.
a c eb
1 2 3 40
1
2
3
4
5
Cells
(fol
d)
Time after plating (d)
1,518
651
1,046
304
64.6
223
CFSE CFSE
100 101 102 103 104
12.4
7-AAD
Anne
xin
V
WT2.81
11d
Anne
xin
V+ FR
Cs
(%) *
WT Δcyto
WT
Δcyto
WTΔcyto
WTΔcyto
Pdpn–/– Δcyto
0
5
10
15
**
*48 h 96 h
101
102
103
104
100
Pdpn–/–100 101 102 103 104 100 101 102 103 104
Pdpn–/– Pdpn–/– Pdpn–/–
Figure 4 PDPN maintains normal proliferation and survival of FRCs. (a) Quantification of cells present over 4 d of culture, as measured by ATP content, presented relative to results for wild-type cells at day 1, set as 1. (b,c) CFSE content in wild-type, Pdpn–/– and Dcyto FRCs after 48 h of culture (b) or 96 h of culture (c). Numbers above lines (left) indicate mean fluorescence intensity. (d) Flow cytometry of wild-type, Pdpn–/– and Dcyto FRCs stained for annexin V and with the membrane-impermeable DNA-intercalating dye 7-amino-actinomycin D (7-AAD). Numbers in outlined areas indicate percent annexin V–positive (and 7-amino-actinomycin D–negative) cells. (e) Quantification of annexin V–positive (AnnV+) wild-type, Pdpn–/– and Dcyto FRCs (as in d). Each symbol represents an individual population of cells from one mouse; small horizontal lines indicate the mean (± s.d.). *P < 0.05 (Student’s t-test (a) or Mann-Whitney test (e)). Data are representative of three independent experiments (a; mean ± s.d. of three wells per experiment), two independent experiments (b,c) or four independent experiments (d) or are from four independent experiments (e).
ART ICLES
npg
© 2
015
Nat
ure
Am
eric
a, In
c. A
ll rig
hts
rese
rved
.

NATURE IMMUNOLOGY VOLUME 16 NUMBER 1 JANUARY 2015 79
We also assessed the effect of PDPN deficiency on FRCs with Pdpnfl/fl
Pdgfrb-Cre mice, in which loxP-flanked Pdpn alleles are deleted by Cre recombinase expressed from the gene encoding the receptor for platelet-derived growth factor-b (Pdgfrb) and thus their FRCs lack PDPN19. Consistent with results obtained for mice treated with anti-PDPN, Pdpnfl/flPdgfrb-Cre mice exhibited larger LNs with greater total cellular-ity and a greater number of FRCs than did Pdpnfl/fl control mice (with-out expression of Pdgfrb-Cre) (Supplementary Fig. 5a–c). However, we did not pursue additional studies of Pdpnfl/flPdgfrb-Cre mice due to their phenotype of bleeding related to a disruption in the integrity of high endothelial venules (HEVs) that has been previously reported19 (Supplementary Fig. 5d).
Finally, we observed no difference between Dcyto mice and wild-type mice in LN mass, total cellularity, or number of FRCs (Fig. 5f–h). Additionally, we did not observe bleeding around HEVs in Dcyto mice (Supplementary Fig. 5e). Given that FRCs cultured from these mice exhibited an elongation phenotype but normal contractility, these in vivo results indicated that FRC contractility was critical for maintaining normal LN size and number of FRCs.
anti-PDPN had slightly greater cellularity than those from mice treated with an isotype-matched control antibody, this was not con-comitant with the enhanced mass (Fig. 5a,b). These findings led us to question whether the stiffness of the LN was altered. Using a standard compression test, we found that LNs from wild-type mice were significantly less stiff and more deformable following antibody blockade of PDPN than after treatment with an isotype-matched control antibody (Fig. 5c).
Next we sought to determine whether FRCs would respond to the relaxation noted above by increasing in number as they did in vitro. Two days after the administration of antibody to wild-type mice, the number of FRCs that had incorporated the thymidine analog BrdU (proliferating FRCs) and, accordingly, the total number of FRCs were significantly greater in mice treated with monoclonal antibody 8.1.1 than in their counterparts treated with an isotype-matched control antibody (Fig. 5d,e). Additionally, FRCs in mice treated with anti-PDPN were much larger than those in mice treated with an isotype-matched control antibody (Supplementary Fig. 4h,i), consistent with a blasting phenotype.
a cNS
b**
e f g
j
h
i
***
Isotype α-PDPN Isotype α-PDPN
**
α-PDPN
d
0
5
10
15
LN s
tiffn
ess
(× 1
03 P
a)
***
Isotype α-PDPN
k
0
1
2
3
4
0
1
2
3
4
5
Tot
al e
YF
P s
urfa
ce a
rea
(× 1
04 μ
m2 )
Tot
al E
R-T
R7
surf
ace
area
(× 1
04 μ
m2 )
Isotype l
0
40
80
120
160
Dis
tanc
e to
nei
ghbo
r (μ
m)
Isotype α-PDPN
****
WT Δcyto
eYFP PDPN
0
50
100
150
Tot
al P
DP
N s
urfa
ce a
rea
(× 1
04 μ
m2 )
WT Δcyto0
20
40
60
80
100
Tot
al E
R-T
R7
surf
ace
area
(× 1
04 μ
m2 )
0
2
4
6
8
WT Δcyto0
5
10
15
WT Δcyto0
1
2
3
4
FR
Cs
(× 1
04 pe
r LN
)WT Δcyto
nm
o
0
10
20
30
***
2
3
4
5
6
0
5
10
15
Brd
U+ F
RC
s (×
103 )
Tot
al c
ells
(×
106
per
LN)
LN m
ass
(mg)
FR
Cs
(× 1
04 pe
r LN
)
Isotype α-PDPN Isotype α-PDPNIsotype α-PDPN
Isotype α-PDPN
0
5
10
15
*
WT Δcyto
ER-TR7 ER-TR7
LN m
ass
(mg)
Tot
al c
ells
(×
106
per
LN)
Figure 5 In vivo blockade of PDPN results in enlarged LNs, FRC proliferation and reorganization of the FRC network. (a) LN mass in in wild-type mice 48 h after intravenous injection of a PDPN-specific antibody (a-PDPN) or an isotype-matched control antibody (Isotype). (b) Total cellularity of LNs from mice as in a. (c) Stiffness of LNs from mice treated for 48 h as in a. (d) Quantification of BrdU+ FRCs in LNs from mice treated as in a. (e) Total FRCs (PI–CD45–CD31–PDPN+ cells) in LNs from mice treated as in a. (f) Mass of LNs from wild-type or Dcyto mice. (g,h) Total cellularity (g) and quantification of FRCs (h) in LNs from wild-type and Dcyto mice. (i) Isosurfaces of the FRC network in Rosa26-eYFPfl/flCcl19-Cre mice treated as in a, generated by analysis of confocal z-stacks in three dimensions. Scale bars, 20 mm. (j,k) Total surface area of the eYFP signal (j) or ER-TR7 signal (k) in LNs of mice treated as in a. (l) Isosurfaces of the FRC network in wild-type and Dcyto mice. Scale bars, 20 mm. (m,n) Total surface area of the PDPN signal (m) or ER-TR7 signal (n) in wild-type and Dcyto LNs. (o) Distance between the nuclei of neighboring FRCs in LNs from mice treated as in a. Each symbol represents an individual LN (a–h), field of view (j,k,m,n) or FRC nucleus (o); small horizontal lines indicate the mean (± s.d.). *P < 0.05, **P < 0.01, ***P < 0.001 and ****P < 0.0001 (Mann-Whitney test). Data are from four independent experiments with four mice in each (a; mean ± s.d) or are representative of four independent experiments (b; mean ± s.d. of n > 3 mice per group per experiment), three independent experiments (c–e,i–k,m,n; mean ± s.d. of n > 3 mice per group per experiment (c–e) or n > 8 fields from four mice per experiment (j,k,m,n)), two to three independent experiments (f–h; mean ± s.d. of n = 6–7 mice) or two independent experiments (l,o; n > 2,600 nuclei from over eight fields per mouse from two to three mice per experiment in o).
ART ICLES
npg
© 2
015
Nat
ure
Am
eric
a, In
c. A
ll rig
hts
rese
rved
.

80 VOLUME 16 NUMBER 1 JANUARY 2015 NATURE IMMUNOLOGY
binding of CLEC-2–Fc (CLEC-2 linked to a rabbit Fc fragment) to FRCs or affect DC numbers in steady-state or inflammatory conditions (Supplementary Fig. 6a–c). At 96 h after immunization with LPS and OVA, we found a significantly greater number of OT-I T cells in LNs treated with anti-PDPN than in those treated with an isotype-matched control antibody (Fig. 6a). Accordingly, at 48 h after immunization, divided OT-I T cells were more abundant in LNs treated with anti-PDPN than in those treated with the isotype-matched control antibody (Fig. 6b). FRCs suppress the proliferation of activated T cells through cell-cell contact30–33. Given that we observed greater spacing between FRCs after blockade of PDPN, we investigated whether there was a change in the number of T cells touching FRCs in the mice treated with anti-PDPN. Indeed, fewer T cells were in contact with the FRC network after blockade of PDPN than after treatment with the isotype-matched control antibody (Fig. 6c); this may have contributed to the increased T cell response. Overall, these findings indicated that PDPN-mediated control of FRC contractility was critical for restraining LN swelling and T cell responses.
Inhibition of FRC contraction by CLEC-2 engagement of PDPNPDPN+ FRCs come into contact with CLEC-2 on migratory DCs and platelets18,19,21, which raises the question of how binding of CLEC-2 to PDPN affects FRCs. To determine if CLEC-2 transmits a signal to FRCs, we cultured wild-type FRCs in three-dimensional matrices and incubated them with soluble CLEC-2–Fc or, as a control, rabbit immu-noglobulin G (IgG). Within 3 h, the FRCs became elongated, and by 12 h, they closely resembled Pdpn–/– FRCs (Fig. 7a,b). CLEC-2–Fc or rabbit IgG had no effect on the elongation of Pdpn–/– or Dcyto FRCs (Supplementary Fig. 7a), as expected, because FRCs do not express Fc receptors4. In addition, treatment with CLEC-2–Fc impaired the spread-ing of FRCs on collagen (Supplementary Fig. 7b). To determine whether the same effect could be achieved with CLEC-2 naturally expressed by cells, we cultured wild-type FRCs together with LPS-activated wild-type or CLEC-2-deficient (Clec1b–/–) bone marrow–derived DCs (BMDCs) or with wild-type or Clec1b–/– platelets. Notably, CLEC-2+ DCs and platelets induced elongation of FRCs to a degree similar to that induced by soluble CLEC-2–Fc (Fig. 7c,d). CLEC-2–Fc also induced clustering of PDPN and the formation of PDPN-rich protrusions (Fig. 7e,f). Thus, we investigated whether this elongation was dependent on actin polym-erization. Indeed, treatment with cytochalasin D at a concentration that preserved cytoskeletal integrity significantly diminished the elongation of FRCs elicited by CLEC-2–Fc (P = 0.0117; Supplementary Fig. 7c).
The finding that CLEC-2 had the same effect on FRCs as PDPN deficiency had prompted us to assess whether binding of CLEC-2 inhibited contractility. The binding of CLEC-2 to wild-type and Dcyto FRCs caused a significant reduction in collagen contraction and the
Expansion of the FRC network upon blockade of PDPNNext we sought to define the role of PDPN in the LN FRC network. First, we investigated conduit function by injecting the tracer fluorescein isothiocyanate into the footpads of mice treated with isotype-matched control antibody or anti-PDPN and collecting the popliteal LNs 4 h later. We noted no obvious abnormalities in access of the tracer to conduits in either the paracortex or cortical regions beneath the subcapsular sinus in mice treated with anti-PDPN (Supplementary Fig. 5f).
Next we investigated the effect of PDPN blockade on the structure of the FRC network. For this we used Rosa26-eYFPfl/flCcl19-Cre mice, in which Cre expressed by the locus encoding the chemokine CCL19 drives the excision of a transcriptional stop sequence before the gene encoding enhanced yellow fluorescent protein (eYFP) inserted into the ubiquitous Rosa26 locus, which results in expression of eYFP only in FRCs29. We treated these mice with anti-PDPN or an isotype-matched control antibody. Confocal microscopy combined with three-dimen-sional reconstruction and isosurface rendering revealed that the network had a finer appearance with more space between fibers in Rosa26- eYFPfl/flCcl19-Cre mice treated with anti-PDPN than in those treated with the isotype-matched control antibody (Fig. 5i). Quantitative analy-sis confirmed that the surface area of FRCs and an extracellular matrix component they secrete, ER-TR7, was lower in LNs from mice treated with anti-PDPN than in those from mice treated with isotype-matched control antibody (Fig. 5i–k). We observed changes to the FRC network in Pdpnfl/flPdgfrb-Cre mice that were similar to those in mice treated with anti-PDPN (Supplementary Fig. 5g–i). Finally, and consistent with our observations that LN mass and FRC numbers remained unchanged upon deletion of the PDPN cytoplasmic tail, the network structure in Dcyto LNs was similar to that in wild-type LNs (Fig. 5l–n).
To determine whether FRCs were further apart from each other, we analyzed nuclear distance by measuring the distance to the closest neighboring FRC nucleus. FRCs were closer to each other in LNs of mice treated with isotype-matched control antibody than in those of mice treated with anti-PDPN (Fig. 5o and Supplementary Fig. 5j,k). Thus, the stromal relaxation that occurred upon attenuation of PDPN-mediated contractility led to LN enlargement and expansion of the FRC network.
Restraint of T cell responses by PDPN-mediated contractilityWe next addressed how blocking PDPN function and FRC contractility would affect an immune response. For this, we treated wild-type mice with anti-PDPN or an isotope-matched control antibody, followed 2 d later by injection of OT-I CD8+ T cells (which have transgenic expres-sion of an ovalbumin (OVA)-specific T cell antigen receptor) labeled with the cytosolic dye CFSE and immunization with lipopolysaccharide (LPS) and OVA. Notably, the PDPN-specific antibody did not block
Figure 6 PDPN is needed to control lymph node swelling and T cell proliferation following immunization. (a) Quantification of donor OT-I T cells in recipient mice given injection of a PDPN-specific antibody or isotype-matched control antibody, followed by OT-I T cells, LPS and OVA 48 h later, assessed 96 h after immunization. (b) Frequency of OT-I cells that divided at least once at 48 h after immunization as in a. (c) Frequency of T cells in contact with the FRC network in LNs from mice given injection of PDPN-specific antibody or isotype-matched control antibody, assessed at 48 h. Each symbol represents an individual LN; small horizontal lines indicate the mean (± s.d.). *P < 0.05 and **P < 0.01 (Mann-Whitney test). Data are from three independent experiments (a) or are representative of four independent experiments (b; mean ± s.d. of n = 4 mice per group per experiment) or two independent experiments (c; n = 4-6 fields of view from three mice per group).
a cb
70
80
90
100
Div
ided
OT
-I c
ells
(%
) *
0
2
4
6
OT-
I cel
ls p
er L
N (×
105 p
er L
N)
*
Isotype α-PDPN T c
ells
in c
onta
ct w
ith F
RC
s (%
)
Isotype α-PDPN
**
0
20
40
60
80
100
Isotype α-PDPN
ART ICLES
npg
© 2
015
Nat
ure
Am
eric
a, In
c. A
ll rig
hts
rese
rved
.

NATURE IMMUNOLOGY VOLUME 16 NUMBER 1 JANUARY 2015 81
a CLEC-2 signal from DCs was necessary and sufficient to cause LN swelling. For this, we injected wild-type and Clec1b–/– BMDCs into the footpads of wild-type mice and measured LN mass 1, 2, and 5 d later. We found that injection of wild-type BMDCs significantly increased LN mass, as previously described33, but injection of Clec1b–/– BMDCs led to significantly less LN swelling in mice that received Clec1b–/– BMDCs than in those that received wild-type BMDCs, at each time point exam-ined (Fig. 8a). However, the impaired recruitment of CLEC-2-null cells is transient, and the number of wild-type DCs and Clec1b–/– DCs in draining LNs is no longer different as early as 3 d after injection18. Therefore, the finding that LN mass remained significantly lower 5 d after DC injection, when equal numbers of wild-type and Clec1b–/– migratory DCs are present in LNs, should be interpreted as an absence of CLEC-2 signaling, rather than impaired DC recruitment. This notion supports our hypothesis that an inhibitory signal from CLEC-2 on migratory DCs is required for LN expansion.
Next we hypothesized that a lack of CLEC-2 during an immune response would prevent the expansion of LNs and T cell proliferation.
amount of YAP localized to the nucleus, as we observed in Pdpn–/– FRCs (Fig. 7g–i and Supplementary Fig. 7d,e). The finding that CLEC-2 reduced contractility to the same extent in Dcyto FRCs and wild-type FRCs was consistent with the proposal that the extracellular domain of PDPN mediates contractility through lateral membrane interactions and that CLEC-2 disrupts these interactions to block PDPN function.
Finally, we assessed whether engagement of CLEC-2 by PDPN caused a decrease in active ERM and MLC similar to deficiency in PDPN. Treatment of wild-type FRCs with CLEC-2–Fc caused a rapid and sub-stantial decrease in both phosphorylated ERM and phosphorylated MLC (Fig. 7j,k and Supplementary Fig. 7f,g). Thus, the finding that CLEC-2 delivered a signal to FRCs that recapitulated the effects of genetic PDPN deficiency suggested that CLEC-2 acts as an inhibitor of PDPN function.
Requirement for CLEC-2 in LN expansion following immunizationHaving shown that antibody blockade of PDPN led to increased LN swelling in the steady state and T cell proliferation following immuniza-tion and that CLEC-2 inhibited PDPN, we sought to determine whether
Figure 7 Engagement of CLEC-2 by PDPN results in a phenocopy of the genetic deletion of PDPN. (a) Confocal microscopy of wild-type FRCs treated with rabbit IgG or CLEC-2–Fc (numbers as in Fig. 1a). Scale bars, 100 mm (left) or 20 mm (right). (b) Morphology index of wild-type FRCs treated for 0–12 h (horizontal axis) with CLEC-2–Fc. (c) Morphology index of FRCs cultured alone (FRC alone) or together with wild-type or Clec1b–/– BMDCs left untreated (–) or stimulated overnight with LPS (LPS). (d) Morphology index of FRCs cultured alone (left) or together with wild-type or Clec1b–/– platelets. (e) Microscopy of PDPN staining in wild-type FRCs treated with rabbit IgG (top) or CLEC-2–Fc (below), showing PDPN clustering (middle) and FRC-rich protrusions (bottom). Scale bar, 5 mm. (f) Frequency of FRCs with PDPN clustering or protrusions after no treatment (–) or treatment for 10 s or 5 min (5 m) with CLEC-2–Fc. (g) Contraction of collagen gels by wild-type, Pdpn–/– and Dcyto FRCs treated CLEC-2–Fc, relative to that elicited by their counterparts treated with treated with rabbit IgG, set as 1 (dashed horizontal line). (h,i) Frequency of nuclear YAP in in wild-type FRCs (h) or Dcyto FRCs (i) 24 h after treatment with rabbit IgG or CLEC-2–Fc. (j,k) Immunoblot analysis of phosphorylated and total ERM (j) and MLC (k) in wild-type FRCs treated for 0, 15 or 60 s (above lanes) with CLEC-2–Fc (numbers below lanes as in Fig. 3b–e). Each symbol represents an individual cell (b–d,h,i) or collagen gel (g); small horizontal lines indicate the mean (± s.d.). *P < 0.05, **P < 0.01, ***P < 0.001 and ****P < 0.0001 (Mann-Whitney test (b–d,f,h,i) or one-sample t-test (g)). Data are representative of four independent experiments (a), three independent experiments (b–f,h–k; mean ± s.d. of n > 60 cells from five mice per condition (b–d) or n > 10 cells per experiment (h,i) or three to five independent experiments (g; mean ± s.d., 3 wells per experiment).
a b
0
10
20
30
40 ********
***
12CLEC-2–Fc treatment (h)
0 3 6
ed
FR
C m
orph
olog
y in
dex
0
10
20
30
40
50
****NS
WT Clec1b–/–FRCalone platelet platelet
h
f
IgG
CLEC-2–Fc
PDPN
10 s 5 m 0
10
20
30
40
50
Cel
ls w
ith P
DP
N fe
atur
e (%
)
*
**
*
10 s 5 m Punctate Protrusion
F-actinDAPI 12.3
16.36.3
IgG CLEC-2–Fc
29.9
0
10
20
30
40
**
– LPS LPSWT DC
FRCalone
****
c
0
20
40
60**
Δcyto FRC
IgG
iWT FRC
IgG CLEC-2–Fc
p-ERM
ERM
15 600CLEC-2–Fc (s)
1 0.5 0.4
p-MLC
MLC
15 600CLEC-2–Fc (s)
1 0.6 0.3
kj
–
DC
–
Nuc
lear
YA
P (
%)
Clec1b–/–
FR
C m
orph
olog
y in
dex
FR
C m
orph
olog
y in
dex
Con
trac
tion
(fol
d)
g
******
WT Pdpn–/– Δcyto0
0.5
1.0
1.5
+ CLEC-2–Fc
0
20
40
60
80
100
Nuc
lear
YA
P (
%) ****
IgG CLEC-2–FcWT FRC
ART ICLES
npg
© 2
015
Nat
ure
Am
eric
a, In
c. A
ll rig
hts
rese
rved
.
82 VOLUME 16 NUMBER 1 JANUARY 2015 NATURE IMMUNOLOGY
with our hypothesis, after only 1 h, LNs of mice treated with CLEC-2–Fc were significantly larger than those of mice treated with rabbit IgG and, at 4 h, the LNs had already returned nearly to their baseline weight (Fig. 8j). This finding was not due to an influx of cells or inflamma-tion (Supplementary Fig. 7h–l). LECs also express PDPN, which raises the possibility that the CLEC-2 signal might alter vascular integrity. However, while Pdpn–/– LECs were elongated compared with wild-type LECs, unlike FRCs, wild-type LECs did not respond to soluble CLEC-2 by elongating (Supplementary Fig. 7m). Furthermore, injection of anti-PDPN did not lead to changes in lymphatic pulsatile activity at early (1 h) or late (48 h) time points (data not shown), which suggested that the in vivo effects of PDPN blockade were not attributable to global alterations in lymph flow. However, in LNs treated with CLEC-2–Fc, FRCs were disorganized, particularly around HEVs (Supplementary Fig. 7n). Thus, CLEC-2–Fc–induced relaxation of FRCs may alter HEV integrity and allow blood or plasma to enter LNs.
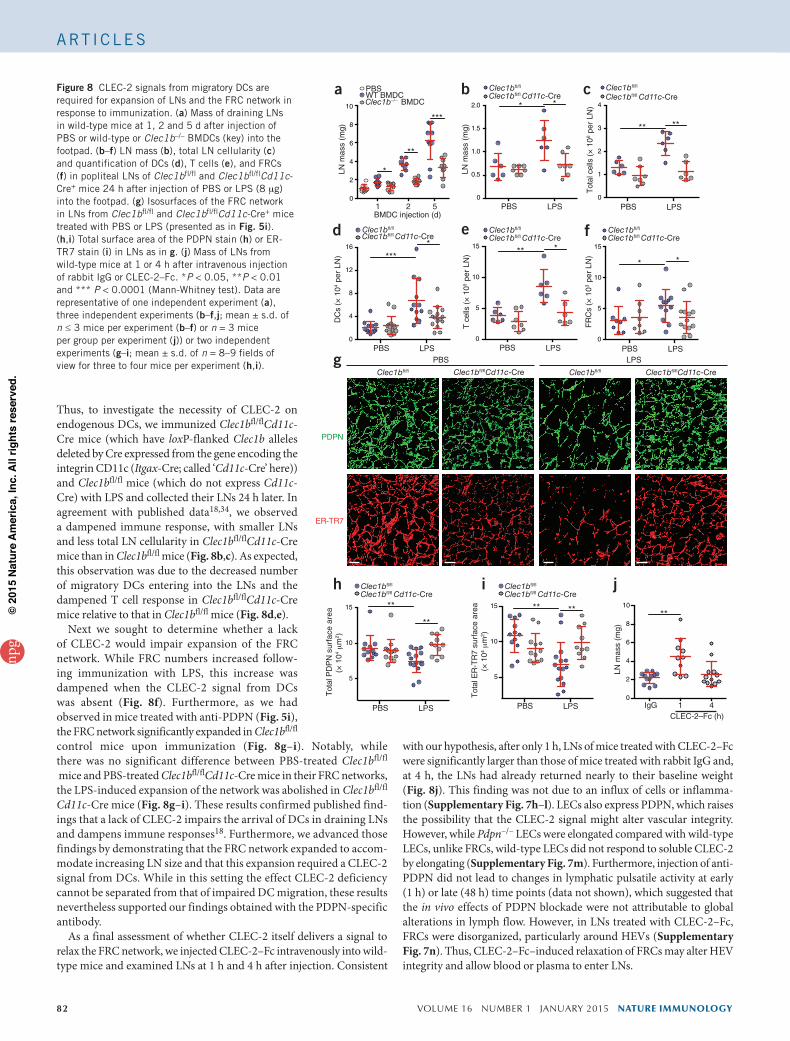
Thus, to investigate the necessity of CLEC-2 on endogenous DCs, we immunized Clec1bfl/flCd11c-Cre mice (which have loxP-flanked Clec1b alleles deleted by Cre expressed from the gene encoding the integrin CD11c (Itgax-Cre; called ‘Cd11c-Cre’ here)) and Clec1bfl/fl mice (which do not express Cd11c-Cre) with LPS and collected their LNs 24 h later. In agreement with published data18,34, we observed a dampened immune response, with smaller LNs and less total LN cellularity in Clec1bfl/flCd11c-Cre mice than in Clec1bfl/fl mice (Fig. 8b,c). As expected, this observation was due to the decreased number of migratory DCs entering into the LNs and the dampened T cell response in Clec1bfl/flCd11c-Cre mice relative to that in Clec1bfl/fl mice (Fig. 8d,e).
Next we sought to determine whether a lack of CLEC-2 would impair expansion of the FRC network. While FRC numbers increased follow-ing immunization with LPS, this increase was dampened when the CLEC-2 signal from DCs was absent (Fig. 8f). Furthermore, as we had observed in mice treated with anti-PDPN (Fig. 5i), the FRC network significantly expanded in Clec1bfl/fl control mice upon immunization (Fig. 8g–i). Notably, while there was no significant difference between PBS-treated Clec1bfl/fl
mice and PBS-treated Clec1bfl/flCd11c-Cre mice in their FRC networks, the LPS-induced expansion of the network was abolished in Clec1bfl/fl
Cd11c-Cre mice (Fig. 8g–i). These results confirmed published find-ings that a lack of CLEC-2 impairs the arrival of DCs in draining LNs and dampens immune responses18. Furthermore, we advanced those findings by demonstrating that the FRC network expanded to accom-modate increasing LN size and that this expansion required a CLEC-2 signal from DCs. While in this setting the effect CLEC-2 deficiency cannot be separated from that of impaired DC migration, these results nevertheless supported our findings obtained with the PDPN-specific antibody.
As a final assessment of whether CLEC-2 itself delivers a signal to relax the FRC network, we injected CLEC-2–Fc intravenously into wild-type mice and examined LNs at 1 h and 4 h after injection. Consistent
Figure 8 CLEC-2 signals from migratory DCs are required for expansion of LNs and the FRC network in response to immunization. (a) Mass of draining LNs in wild-type mice at 1, 2 and 5 d after injection of PBS or wild-type or Clec1b–/– BMDCs (key) into the footpad. (b–f) LN mass (b), total LN cellularity (c) and quantification of DCs (d), T cells (e), and FRCs (f) in popliteal LNs of Clec1bfl/fl and Clec1bfl/flCd11c-Cre+ mice 24 h after injection of PBS or LPS (8 mg) into the footpad. (g) Isosurfaces of the FRC network in LNs from Clec1bfl/fl and Clec1bfl/flCd11c-Cre+ mice treated with PBS or LPS (presented as in Fig. 5i). (h,i) Total surface area of the PDPN stain (h) or ER-TR7 stain (i) in LNs as in g. (j) Mass of LNs from wild-type mice at 1 or 4 h after intravenous injection of rabbit IgG or CLEC-2–Fc. *P < 0.05, **P < 0.01 and *** P < 0.0001 (Mann-Whitney test). Data are representative of one independent experiment (a), three independent experiments (b–f,j; mean ± s.d. of n ≤ 3 mice per experiment (b–f) or n = 3 mice per group per experiment (j)) or two independent experiments (g–i; mean ± s.d. of n = 8–9 fields of view for three to four mice per experiment (h,i).
a
0
2
4
6
8
10
LN m
ass
(mg)
IgG 1 4CLEC-2–Fc (h)
**
0
0.5
1.0
1.5
2.0
0
1
2
3
4
LN m
ass
(mg)
0
4
8
12
16
PBS LPS
Clec1bfl/fl Cd11c-CreClec1bfl/fl
PBS LPS
PBS LPS
*
**
*
5
10
15 **
**
PBS LPS
** **
PBS LPS
Tot
al E
R-T
R7
surf
ace
area
(× 1
04 μ
m2 )
5
10
15
Clec1bfl/fl
PDPN
ER-TR7
PBS LPS
***
0
5
10
15 ***
PBS LPS
*
**
b c
d e
h i j
Clec1bfl/fl
0
5
10
15
PBS LPS
**
g
0
2
4
6
8
10
PBSWT BMDCClec1b–/– BMDC
1 52
*
**
***
f
LN m
ass
(mg)
BMDC injection (d)
Clec1bfl/flCd11c-Cre Clec1bfl/flCd11c-Cre
Clec1bfl/fl Cd11c-CreClec1bfl/fl
Clec1bfl/fl Cd11c-CreClec1bfl/fl
Clec1bfl/fl Cd11c-CreClec1bfl/fl
Clec1bfl/fl Cd11c-CreClec1bfl/fl
Clec1bfl/fl Cd11c-CreClec1bfl/fl
Clec1bfl/fl Cd11c-CreClec1bfl/fl
Tot
al P
DP
N s
urfa
ce a
rea
(× 1
04 μ
m2 )
D
Cs
(× 1
04 pe
r LN
)
T c
ells
(×
105
per
LN)
FR
Cs
(× 1
03 pe
r LN
) T
otal
cel
ls (
× 1
06 pe
r LN
)
ART ICLES
npg
© 2
015
Nat
ure
Am
eric
a, In
c. A
ll rig
hts
rese
rved
.
NATURE IMMUNOLOGY VOLUME 16 NUMBER 1 JANUARY 2015 83
Inflammation is known to trigger FRC proliferation; however, the tim-ing and extent of division appears to vary between inflammatory stimuli, and the specific underlying mechanisms remain unknown4,34,47. Our data indicated that the relaxation of FRCs allowed early LN expansion in addition to providing a signal for proliferation, which caused FRCs to accumulate and accommodate the expanding organ. While a published study did not report changes in LN architecture47, we observed expan-sion of the FRC network upon immunization, as reported before34. This discrepancy could be due to differences in the timing or types of immu-nization used. It has been noted that PDPN amounts increase in response to select inflammatory stimuli47,48 (data not shown), which may restore high contractility to FRCs upon resolution of inflammation. Our results demonstrated that this process was crucial for FRC-mediated restraint of T cell proliferation.
Together, these data indicate that CLEC-2+ DCs provide a fast but reversible signal to PDPN+ FRCs. This allows transient relaxation of the FRC network that would persist only as long as CLEC-2+ DCs were crawling along the network. Ultimately, normal contraction of FRCs would resume shortly after removal of the CLEC-2 signal (and increased PDPN expression), which would occur as the immune response began to wane and migratory DCs perished in the draining LN. Reestablishment of FRC contractility would enable structural and functional homeostasis in the reticular network to be restored.
METHODSMethods and any associated references are available in the online version of the paper.
Note: Any Supplementary Information and Source Data files are available in the online version of the paper.
ACKNOWLEDGMENTSWe thank L. Cameron for assistance at the Dana-Farber Cancer Institute confocal microscopy core, and R. Gelman for help with statistical analyses. Supported by the US National Institutes of Health (R0I DK074500, P01 AI045757 and R21 CA182598 to S.J.T.; 5R01 AI039246 to M.C.C.; and P01 HL085607 and GM103441 to L.X.), the American Cancer Society (S.J.T.), the Claudia Adams Barr Program in Innovative Cancer Research (S.J.T.), the Cancer Research Institute (to V.C.), the American Heart Association (SDG7410022 to J.F.) and the National Science Foundation (J.L.A.).
AUTHOR CONTRIBUTIONS J.L.A. and S.J.T. designed experiments, analyzed results and wrote the manuscript; J.L.A., V.C., J.F., M.C.D., J.R.P., J.M.N.-B., A.G., M.C.W. and R.M.W. performed experiments; J.F., K.S., Y.K., and L.X. supplied reagents and mice; L.O. and B.L. provided mice; and V.C., B.L., M.C.C., D.J.M. and L.X. provided comments on the manuscript.
COMPETING FINANCIAL INTERESTSThe authors declare competing financial interests: details are available in the online version of the paper. Reprints and permissions information is available online at http://www.nature.com/reprints/index.html.
1. von Andrian, U.H. & Mempel, T.R. Homing and cellular traffic in lymph nodes. Nat. Rev. Immunol. 3, 867–878 (2003).
2. Kumamoto, Y., Mattei, L.M., Sellers, S., Payne, G.W. & Iwasaki, A. CD4+ T cells support cytotoxic T lymphocyte priming by controlling lymph node input. Proc. Natl. Acad. Sci. USA 108, 8749–8754 (2011).
3. Tzeng, T.C. et al. CD11chi dendritic cells regulate the re-establishment of vascular quiescence and stabilization after immune stimulation of lymph nodes. J. Immunol. 184, 4247–4257 (2010).
4. Chyou, S. et al. Coordinated regulation of lymph node vascular-stromal growth first by CD11c+ cells and then by T and B cells. J. Immunol. 187, 5558–5567 (2011).
5. Turley, S.J., Fletcher, A.L. & Elpek, K.G. The stromal and haematopoietic antigen-presenting cells that reside in secondary lymphoid organs. Nat. Rev. Immunol. 10, 813–825 (2010).
6. Malhotra, D., Fletcher, A.L. & Turley, S.J. Stromal and hematopoietic cells in secondary lymphoid organs: partners in immunity. Immunol. Rev. 251, 160–176 (2013).
Collectively, these data indicated that CLEC-2 inhibited PDPN func-tion and caused FRCs to relax. This relaxation led to increased spac-ing in the paracortical reticular network and allowed LNs to expand. However, upon attenuation of the CLEC-2 signal, FRCs regained their contractile ability, which restored normal LN size and microarchitecture (Supplementary Fig. 8).
DISCUSSIONHere we have identified PDPN as a master regulator of the contractile force generated by FRCs and have elucidated a critical function for FRC contractility in maintaining LN microarchitecture. Under non-inflam-matory conditions, PDPN maintained FRCs in a highly contracted state. Disruption of PDPN-mediated contractility caused LN enlargement in part via relaxation and expansion of the FRC network. Unexpectedly, these changes did not affect conduit permeability, in line with a published report demonstrating prolonged conduit function following ablation of FRCs35.
Notably, we discovered that CLEC-2 inhibited PDPN signaling in FRCs. Published studies of the PDPN–CLEC-2 interaction have focused on signaling downstream of CLEC-2 (refs. 18,19,21). Here we have dem-onstrated that signaling also occurred downstream of PDPN and that its engagement of CLEC-2 on DCs diminished FRC contractility. CLEC-2 seemed to deliver a rapid and transient inhibitory signal to FRCs. The affinity of the binding of CLEC-2 to PDPN is 24.5 mM (ref. 16), whereas a high-affinity antibody can be in the nanomolar or even picomolar range36. Furthermore, within minutes of engaging soluble PDPN, CLEC-2 is internalized18. Thus, the inhibition of PDPN caused by migratory DCs would probably be quickly relieved.
Our finding that the cytoplasmic tail of PDPN was dispensable for FRC contractility was unexpected and suggested that its extracellular or transmembrane domains mediate this hallmark function. Indeed, the interaction of PDPN with CD44 and galectin-8 regulates cell migration and adhesion37,38. Furthermore, PDPN interacts with CD9, a tetraspanin that modulates integrin signaling39. Furthermore, the transmembrane domain of PDPN is required for its localization to lipid rafts40, where CD44 is also retained upon the differentiation of fibroblasts into myo-fibroblasts mediated by transforming growth factor-b41. Additionally, our findings obtained with Dcyto FRCs indicating that the PDPN cyto-plasmic tail was required for FRC elongation despite the finding that Dcyto FRCs had normal levels of activated ERM proteins suggested that the cytoplasmic tail has other signaling mechanisms. In fact, two serine residues in the PDPN tail can be phosphorylated42. To what extent these interactions regulate FRC function and LN microarchitecture remains unclear. The finding that CLEC-2 inhibited contraction to the same extent in Dcyto FRCs and wild-type FRCs suggested that CLEC-2 medi-ates its effect by preventing the extracellular domain of PDPN from interacting in cis with a lateral binding partner.
Similar to its action in FRCs, PDPN controls elongation and activation of RhoA in LECs43; however, LECs differed from FRCs in that LECs did not elongate upon binding CLEC-2. Furthermore, we found that bulk lymph flow and access of lymph to conduits were not altered upon in vivo blockade of PDPN. Given our results and the fact that LECs are not highly contractile, it is unlikely that PDPN expressed by LECs has a role in LN expansion and reticular architecture.
Cell contractility and sensing of matrix stiffness regulate the differen-tiation, migration and survival of fibroblasts44. The balance between the adhesion of a cell to a substrate of a given stiffness and the resulting tension within that cell determines overall tensional homeostasis44,45. Disruption of this balance, whether by changes in matrix stiffness or by changes in contractile potential, alters fibroblast proliferation46. Thus, the increased proliferation and survival that we observed for Pdpn–/– FRCs might have stemmed from dysregulated adhesion or tension or both.
ART ICLES
npg
© 2
015
Nat
ure
Am
eric
a, In
c. A
ll rig
hts
rese
rved
.
84 VOLUME 16 NUMBER 1 JANUARY 2015 NATURE IMMUNOLOGY
30. Lukacs-Kornek, V. et al. Regulated release of nitric oxide by nonhematopoietic stroma controls expansion of the activated T cell pool in lymph nodes. Nat. Immunol. 12, 1096–1104 (2011).
31. Siegert, S. et al. Fibroblastic reticular cells from lymph nodes attenuate T cell expansion by producing nitric oxide. PLoS ONE 6, e27618 (2011).
32. Khan, O. et al. Regulation of T cell priming by lymphoid stroma. PLoS ONE 6, e26138 (2011).
33. Webster, B. et al. Regulation of lymph node vascular growth by dendritic cells. J. Exp. Med. 203, 1903–1913 (2006).
34. Acton, S.E. et al. Dendritic cells control lymph node expansion via modulation of fibroblastic reticular network tension through CLEC-2/Podoplanin interactions. Nature 514, 498–502 (2014).
35. Cremasco, V. et al. B cell homeostasis and follicle confines are governed by fibroblastic reticular cells. Nat. Immunol. 15, 973–981 (2014).
36. Andersson, K., Björkelund, H. & Malmqvist, M. Antibody-antigen interactions: what is the required time to equilibrium? Nature Precedings <http://hdl.handle.net/10101/npre.2010.5218.1> (2010).
37. Martín-Villar, E. et al. Podoplanin associates with CD44 to promote directional cell migration. Mol. Biol. Cell 21, 4387–4399 (2010).
38. Cueni, L.N. & Detmar, M. Galectin-8 interacts with podoplanin and modulates lym-phatic endothelial cell functions. Exp. Cell Res. 315, 1715–1723 (2009).
39. Nakazawa, Y. et al. Tetraspanin family member CD9 inhibits Aggrus/podoplanin-induced platelet aggregation and suppresses pulmonary metastasis. Blood 112, 1730–1739 (2008).
40. Fernández-Muñoz, B. et al. The transmembrane domain of podoplanin is required for its association with lipid rafts and the induction of epithelial-mesenchymal transition. Int. J. Biochem. Cell Biol. 43, 886–896 (2011).
41. Midgley, A.C. et al. Transforming growth factor-b1 (TGF-b1)-stimulated fibroblast to myofibroblast differentiation is mediated by hyaluronan (HA)-facilitated epidermal growth factor receptor (EGFR) and CD44 co-localization in lipid rafts. J. Biol. Chem. 288, 14824–14838 (2013).
42. Krishnan, H. et al. Serines in the intracellular tail of podoplanin (PDPN) regulate cell motility. J. Biol. Chem. 288, 12215–12221 (2013).
43. Navarro, A., Perez, R.E., Rezaiekhaligh, M., Mabry, S.M. & Ekekezie, I.I. T1 /podoplanin is essential for capillary morphogenesis in lymphatic endothelial cells. Am. J. Physiol. Lung Cell. Mol. Physiol. 295, L543–L551 (2008).
44. Paszek, M.J. et al. Tensional homeostasis and the malignant phenotype. Cancer Cell 8, 241–254 (2005).
45. Klein, E.A. et al. Cell-cycle control by physiological matrix elasticity and in vivo tissue stiffening. Curr. Biol. 19, 1511–1518 (2009).
46. Xia, H., Nho, R.S., Kahm, J., Kleidon, J. & Henke, C.A. Focal dhesion kinase Is upstream of phosphatidylinositol 3-kinase/Akt in regulating fibroblast survival in response to contraction of type I collagen matrices via a b1 integrin viability signaling pathway. J. Biol. Chem. 279, 33024–33034 (2004).
47. Yang, C.Y. et al. Trapping of naive lymphocytes triggers rapid growth and remodeling of the fibroblast network in reactive murine lymph nodes. Proc. Natl. Acad. Sci. USA 111, E109–E118 (2014).
48. Peduto, L. et al. Inflammation recapitulates the ontogeny of lymphoid stromal cells. J. Immunol. 182, 5789–5799 (2009).
7. Malhotra, D. et al. Transcriptional profiling of stroma from inflamed and resting lymph nodes defines immunological hallmarks. Nat. Immunol. 13, 499–510 (2012).
8. Link, A. et al. Fibroblastic reticular cells in lymph nodes regulate the homeostasis of naive T cells. Nat. Immunol. 8, 1255–1265 (2007).
9. Bajénoff, M. et al. Stromal cell networks regulate lymphocyte entry, migration, and territoriality in lymph nodes. Immunity 25, 989–1001 (2006).
10. Sixt, M. et al. The conduit system transports soluble antigens from the afferent lymph to resident dendritic cells in the T cell area of the lymph node. Immunity 22, 19–29 (2005).
11. Roozendaal, R. & Carroll, M.C. Complement receptors CD21 and CD35 in humoral immunity. Immunol. Rev. 219, 157–166 (2007).
12. Astarita, J.L., Acton, S.E. & Turley, S.J. Podoplanin: emerging functions in develop-ment, the immune system, and cancer. Front. Immunol. 3, 283 (2012).
13. Schacht, V. et al. T1a/podoplanin deficiency disrupts normal lymphatic vasculature formation and causes lymphedema. EMBO J. 22, 3546–3556 (2003).
14. Uhrin, P. et al. Novel function for blood platelets and podoplanin in developmental separation of blood and lymphatic circulation. Blood 115, 3997–4005 (2010).
15. Wicki, A. & Christofori, G. The potential role of podoplanin in tumour invasion. Br. J. Cancer 96, 1–5 (2007).
16. Christou, C.M. et al. Renal cells activate the platelet receptor CLEC-2 through podo-planin. Biochem. J. 411, 133–140 (2008).
17. Suzuki-Inoue, K., Inoue, O. & Ozaki, Y. Novel platelet activation receptor CLEC-2: from discovery to prospects. J. Thromb. Haemost. 9, 44–55 (2011).
18. Acton, S.E. et al. Podoplanin-rich stromal networks induce dendritic cell motility via activation of the C-type lectin receptor CLEC-2. Immunity 37, 276–289 (2012).
19. Herzog, B.H. et al. Podoplanin maintains high endothelial venule integrity by interacting with platelet CLEC-2. Nature 502, 105–109 (2014).
20. Hess, P.R. et al. Platelets mediate lymphovenous hemostasis to maintain blood-lym-phatic separation throughout life. J. Clin. Invest. 124, 273–284 (2014).
21. Bénézech, C. et al. CLEC-2 is required for development and maintenance of lymph nodes. Blood 123, 3200–3207 (2014).
22. Steinman, R.M. et al. Dendritic cell function in vivo during the steady state: a role in peripheral tolerance. Ann. NY Acad. Sci. 987, 15–25 (2003).
23. Martín-Villar, E. et al. Podoplanin binds ERM proteins to activate RhoA and promote epithelial-mesenchymal transition. J. Cell Sci. 119, 4541–4553 (2006).
24. Riento, K. & Ridley, A.J. Rocks: multifunctional kinases in cell behaviour. Nat. Rev. Mol. Cell Biol. 4, 446–456 (2003).
25. Calvo, F. et al. Mechanotransduction and YAP-dependent matrix remodelling is required for the generation and maintenance of cancer-associated fibroblasts. Nat. Cell Biol. 15, 637–646 (2013).
26. Wicki, A. et al. Tumor invasion in the absence of epithelial-mesenchymal transition: Podoplanin-mediated remodeling of the actin cytoskeleton. Cancer Cell 9, 261–272 (2006).
27. Fehon, R.G., McClatchey, A.I. & Bretscher, A. Organizing the cell cortex: the role of ERM proteins. Nat. Rev. Mol. Cell Biol. 11, 1–12 (2010).
28. Larsen, M., Artym, V.V., Green, J.A. & Yamada, K.M. The matrix reorganized: extracellular matrix remodeling and integrin signaling. Curr. Opin. Cell Biol. 18, 463–471 (2006).
29. Chai, Q. et al. Maturation of lymph node fibroblastic reticular cells from myofibroblastic precursors is critical for antiviral immunity. Immunity 38, 1013–1024 (2013).
ART ICLES
npg
© 2
015
Nat
ure
Am
eric
a, In
c. A
ll rig
hts
rese
rved
.
ONLINE METHODSMice. C57BL/6 mice were purchased from Jackson Laboratory (strain 000664). Ccl19-Cre mice were generated as described29 and were crossed to Rosa26-eYFP mice (strain 006148; Jackson Laboratory) to generate mice in which only FRCs express eYFP. The Ccl19-Cre mice were also mated to B6;129-Gt-Rosa26Sortm1Ytchn/J mice (strain 021847; Jackson Laboratory) for experiments analyzing nuclei distance. The Pdgfrb-Cre and Pdpn-flox mice were generated and initially characterized previously19.
To determine the cytoplasmic function of PDPN, we generated knock-in mice lacking the cytoplasmic tail of PDPN (Dcyto). To delete the cytoplasmic domain, we made a targeting construct that introduced three stop codons immediately after the sequence encoding its transmembrane domain. C57BL/6 embryonic stem (ES) cells were used for gene targeting. A neomycin-resistance cassette flanked by Frt (Flp1 recognition target) sites was used for selection of positive ES clones. Diphtheria toxin A was used for negative selection. Two positive ES clones were injected into C57BL/6J blastocytes, which were then implanted into pseudopregnant mice. Chimeras among the offspring were bred with C57BL/6J mice expressing Flp1 (FLP mice; B6.Cg-Tg (ACTFLEe)9205Dym/J; Jackson Laboratories) for deletion of the Frt-flanked neomycin-resistance cassette and for analysis of germline transmission. Genotypes of mice were determined by PCR analysis of DNA isolated from tail biopsies. Four chimeras transmitted the Pdpn knock-in mutation into their offspring. Breeding with the FLP mice also resulted in successful deletion of the Frt-flanked neomycin-resistance cassette in the F1 generation.
Mice were maintained under specific pathogen–free conditions as mandated by guidelines of the US National Institutes of Health. The mice were used between 4–7 weeks of age and were matched for age and sex for all experiments. Animal studies were approved by the Research Animal Care committees of Dana-Farber Cancer Institute and Genentech.
Stromal cell isolation. For cell culture or flow cytometry, stromal cells were isolated from LNs as described49. Skin-draining and mesenteric LNs were incu-bated in digestion medium (RPMI medium containing 0.1 mg/ml DNase I (Invitrogen), 0.2 mg/ml collagenase P (Roche) and 0.8 mg/ml dispase (Roche)), and cell fractions were collected every 10–15 min over a period of 45 min. The single-cell suspensions were filtered and were either plated in a-MEM containing 10% FBS and 1% penicillin-streptomycin or stained with antibodies for flow cytometry.
FRC purification. After digestion and plating of LNs, the non-adherent hema-topoietic cells were washed away and the remaining stromal cells were allowed to grow for 5–7 d. For purification of FRCs from this mixed culture, cells were removed from the culture plates with trypsin and then were incubated for 10 min with biotinylated anti-CD31 (MEC13.3; Biolegend) and anti-CD45 (30-F11; Biolegend). After being washed, the cells were incubated for 15 min with a-biotin microbeads. Then the cells were washed and then run through an LS MACS column (Miltenyi Biotech), and the flow-through containing FRCs was collected. FRCs used in experiments were over 85% pure.
Three-dimensional Matrigel cultures and imaging. For three-dimensional cul-tures, gels were prepared as described18. 1.5 × 10⁴ FRCs were mixed with 100 ml Matrigel mix (1.8 mg/ml reduced growth factor Matrigel (BD Biosciences) and 3.2 mg/ml type I collagen (BD Biosciences)) and were plated in glass-bottomed 24-well plates (MatTek). For treatment conditions, a final concentration of 10 mg/ml anti-PDPN ( 8.1.1; Biolegend), 7 mg/ml CLEC-2–Fc (made in-house18) or the appropriate controls (hamster IgG isotype-matched control antibody for anti-PDPN (SHG-1; Biolegend) or rabbit IgG (AB-105-C; R&D Systems)) were added to the cell suspensions 15 min before the addition of the Matrigel mix. For short-term treatment, the cells were allowed to populate the gels for 24 h and then 250 nM cytochalasin D (Sigma), 10 mM Y27632 (Sigma) or 7 mg/ml CLEC-2–Fc was added directly to the medium. For cell imaging, the medium was removed and the gels were washed twice in PBS. Next, cells were fixed in 4% paraformalde-hyde (PFA; Affymetrix), washed, and permeabilized in 0.25% Triton-X. Cells were then stained with the DNA-binding dye DAPI (4,6-diamidino-2-phenylindole) and rhodamine phalloidin (Invitrogen). The gels were washed with PBS and were imaged with a Leica SP5X laser-scanning confocal microscope. z-stack projec-tions were generated with ImageJ software (NIH), and the area and perimeter of
the cells were measured. The morphology index was calculated with the following equation: perimeter2 / 4 × p × area.
FRC spreading and adhesion. For analysis of spreading, 10 cm dishes were coated with type I collagen according to the manufacturer’s instructions (BD Biosciences). FRCs were plated and imaged with a light microscope at the appro-priate times. Cell area was determined with ImageJ software. For analysis of adhe-sion, 96-well plates were coated with collagen, and 2 × 10³ FRCs per well were added. At the appropriate times, the wells were washed three times with PBS for the removal of non-adherent cells, and the adherent cells were fixed in 4% PFA, then stained with crystal violet. After several washes for the removal of unbound crystal violet, the cells were lysed in 0.25% Triton-X, and the absorbance of crystal violet was determined with a spectrophotometer at 570 nm.
Immunoblot analysis. Purified FRCs were plated in 10 cm dishes at a density of 3 × 10⁵ cells per plate and incubated overnight. Cells were starved of serum for 5 h and then were lysed in lysis buffer (25 mM Tris-HCl, pH 7.4, 150 mM NaCl, 1 mM EDTA, 1% NP-40 and 5% glycerol; Thermo Scientific) containing protease and phosphatase inhibitor ‘cocktails’ (Thermo Scientific). Protein concentrations were determined with the BCA protein assay kit (Thermo Scientific). Equal amounts of protein were loaded onto 4–12% Bis-Tris gels (Life Technologies) and separated by electrophoresis, then were transferred to a nitrocellulose membrane. After nonspecific binding was blocked by incubation for 1 h in 5% nonfat milk, the membranes were incubated overnight with primary antibodies in 5% BSA. The following primary antibodies were used (all from Cell Signaling Technology): anti-ERM (3142), antibody to phosphorylated ERM (3149), anti-MLC (8505) and antibody to MLC phosphorylated at Ser19 (671). After three washes with TBS, the membranes were incubated for 2 h at 25 °C with horseradish peroxidase–conjugated rabbit-specific antibody (7074; Cell Signaling Technology). Finally, the signal was visualized with the SuperSignal WestDura Chemiluminescent Substrate (Fisher).
GTPase precipitation. For each condition, 7.5 × 10⁵ wild-type, Pdpn–/–, or Dcyto FRCs were plated in 10 cm dishes, and the activation of RhoA were determined with an Active RhoA Pull-Down and Detection kit according to the manufactur-er’s instructions (Thermo Scientific). Immunoblots were probed with anti-RhoA (Thermo Scientific) followed by horseradish peroxidase–conjugated anti-rabbit (secondary antibody) (identified above).
Gel contraction assay. For contraction assays, 1.0 × 10⁴ cells were mixed with 50 ml Matrigel mix and were plated in 96-well culture dishes. After the gels had polymerized for 30 min at 37 °C, 100 ml medium was added to the wells, and gels were detached from wells of the plate with a sterile pipette tip. After 24 h, images of the wells were obtained and dimensions of gels were measured relative to well diameter, with ImageJ software. Alternatively, cells were allowed to seed the gel overnight, then CLEC-2–Fc or antibody 8.1.1 was added every 4–8 h and contraction was measured 24 h later.
Proliferation assays. Wild-type, Pdpn–/–, and Dcyto FRCs were plated in tripli-cate at a density of 2 × 10³ cells per well in a 96-well plate, and viable cells were quantified daily over the course of 4 d with the CellTiter-Glo Luminescent Cell Viability Assay according to the manufacturer’s instructions (Promega). Data were normalized to the number of cells present on day 1 for each condition. For analysis of cell proliferation, 3.0 × 10⁴ FRCs were labeled with 1 mM CFSE (carboxyfluorescein succinimidyl ester; Invitrogen) and were plated in six-well plates. On days 1, 2, 3 and 4, the cells were incubated with trypsin and then were analyzed by flow cytometry for quantification of the mean fluorescent intensity of the CFSE dye.
YAP staining. Wild-type or Pdpn–/– FRCs were plated on eight-well chamber slides and were allowed to adhere for 12 h to minimize the influence of differences in cell spreading on the quantification of nuclear YAP. Where indicated, CLEC-2–Fc was added to the medium for 15 min before seeding. After 12 h, the medium was changed, and fresh medium was added that either contained CLEC-2–Fc or did not. At each time point, cells were fixed for 15 min with 4% PFA and were washed three times for 5 min in PBS. Cells were immunostained with rabbit antibody to mouse YAP and TAZ (8418; Cell Signaling) and were visualized
NATURE IMMUNOLOGY doi:10.1038/ni.3035
npg
© 2
015
Nat
ure
Am
eric
a, In
c. A
ll rig
hts
rese
rved
.
doi:10.1038/ni.3035 NATURE IMMUNOLOGY
they were washed with PBS, fixed for 10 min in 4% PFA and permeabilized with 0.25% Triton-X before being stained with anti-PDPN (8.1.1; Biolegend). LNs were collected, fixed for 4 h in 4% PFA and incubated overnight in 30% sucrose in PBS. LNs were frozen in optimal cutting temperature media (Fisher Scientific) on dry ice and then sections 20–80 mm in thickness were cut with a cryostat. Slides were stained immediately or were stored at –80 °C. Sections were fixed for 10 min in 4% PFA and permeabilized for 3 min with 0.25% Triton-X, and then nonspecific binding was blocked by incubation for 30 min with 2% BSA in PBS before incubation with antibodies. The sections were incubated for 1 h with anti-ER-TR7 (ab51824; AbCam), antibody to green fluorescent protein (identified above) and a biotin-conjugated antibody specific for peripheral node addressin (MECA-79; Biolegend), then were washed three times with 2% BSA. The secondary antibodies Alexa Fluor 555–conjugated anti-rat (A-21434), Alexa Fluor 488–conjugated anti-rabbit (A-11034) and streptavidin–Alexa Fluor 647 (S-21374; all from Invitrogen) were then added for 30 min. After a final wash step, the slides were imaged on either a Leica SP5X laser-scanning confocal microscope or a Zeiss 710 two-photon laser-scanning confocal microscope. Images were analyzed with ImageJ software. Surface area was analyzed with Imaris software (Bitplane). For each set of images acquired on the same day, the parameters for the surfaces module were set for the control samples and the same parameters were used for analysis of all images acquired in the same imaging session.
Tracer injection and conduit imaging. Wild-type mice were given an intra-venous injection of isotype-matched control antibody or anti-PDPN (both identified above). 4–8 h later, they were given a subcutaneous injection (into the footpad) of 10 ml saturated FITC solution (Sigma) in Hank’s balanced-salt solution (~0.1 mg/ml). Popliteal LNs were collected 4 h after injection and were fixed in 4% PFA. LNs were ‘optically cleared’ as described30 and were mounted as whole-organ explants for multiphoton microscopy. Cortical and paracortical regions were identified by collagen density and the presence or absence of stain-ing with CR1-specific antibody that recognizes follicular DCs (8C12; prepared in-house); 3 mg of this antibody was injected intravenously 6 h before the start of the experiment.
Isolation of platelets and BMDCs from fetal liver chimeric mice. Clec1b–/– fetal liver chimeras were generated as described18. Fetuses from pregnant Clec1b+/– mice were collected between embryonic day 14.5 and embryonic day 18.5, and 1 × 10⁶ of their fetal liver cells were then injected retro-orbitally into lethally irradiated B6.SJL-PtprcaPep3b/BoyJ mice (Jackson Laboratories). Mice were used 6–7 weeks later for experiments. BMDCs were generated as described18. Bone marrow was collected from the tibias and femurs of the fetal liver chime-ras and were cultured for 5–7 d in RPMI medium containing 10% FBS and 3% granulocyte-macrophage colony-stimulating factor. For studies in which BMDCs were injected, these cells were matured with 50 ng/ml LPS on day 7. Then, 1.4 × 10⁶ BMDCs were injected into the footpad and popliteal LNs were collected and weighed 1, 2 and 5 d later.
Platelets were isolated as described20. Approximately 500 ml whole blood was collected from the retro-orbital area of the fetal liver chimeras into 3.8% sodium citrate. Red blood cells were lysed in ACK lysing buffer (Fisher). Then, the cells were resuspended and centrifuged at 300g for 10 m with no brake. The super-natants were collected and were centrifuged again at 1,000g for collection of the platelet-rich fraction. BMDCs and platelets were seeded into three-dimensional gels at a ratio of 5:1 to the FRCs.
Statistical analysis. Prism software (GraphPad) was used for statistical analyses. If data were not normally distributed or did not have equal variance between con-ditions, a Mann-Whitney U-test was performed. For normally distributed data, Student’s t-test was used. In some cases, a one-sample t-test was used to calculate whether the result for a sample was significantly different from 1. Data with a P value of <0.05 were considered statistically significant. In cases in which multiple statistical tests were performed, a Bonferroni correction was used to determine a new a-cutoff for significance. Observers were not blinded to experimental conditions.
49. Fletcher, A.L. et al. Reproducible isolation of lymph node stromal cells reveals site-dependent differences in fibroblastic reticular cells. Front. Immunol. 2, 35–50 (2011).
50. Lamprecht, M., Sabatini, D. & Carpenter, A. CellProfiler™: free, versatile software for automated biological image analysis. Biotechniques 42, 71–75 (2007).
with Alexa Fluor 555–conjugated goat anti-rabbit (secondary antibody) (A-21428; Cell Signaling) according to the manufacturer’s instructions. Nuclei were counter-stained with DAPI. The frequency of nuclear YAP was quantified with MATLAB software by summing of the fluorescence intensity within the region masked by the nucleus and the total fluorescence intensity of YAP staining on a per-cell basis.
In vivo blockade of PDPN. Mice were given intravenous injection (into the tail vein) of 100 mg purified anti-PDPN (8.1.1; Biolegend) or the hamster IgG isotype-matched control antibody (SHG-1; Biolegend). After 48 or 96 h, mice were killed and skin-draining LNs were collected for either flow cytometry or imaging. For CLEC-2–Fc experiments, 100 mg CLEC-2–Fc or rabbit IgG isotype-matched control antibody (identified above) was injected intravenously and LNs were collected 1 and 4 h later. Generally, flow cytometry was conducted on brachial LNs and imaging was conducted with axillary and brachial LNs or inguinal LNs for immunization experiments.
Compression test. Mice were treated with the hamster IgG isotype-matched control antibody or anti-PDPN (both identified above) 48 h before collection of LNs. Cylindrical discs (1.3 mm2) were punched from LNs with a biopsy punch to ensure a consistent cross-sectional area. These samples were subjected to com-pression with an Instron mechanical tester at a strain rate of 0.5 mm/m, and the stiffness was calculated as the slope of the first 10% of the resulting stress/strain curve.
Nuclei distance analysis. Rosa26Sortm1Ytchn/Jfl/WTCcl19-Cre mice were given an intravenous injection of 100 mg anti-PDPN or the isotype-matched control antibody (both identified above), and axillary and brachial LNs were collected 48 h later. LN sections were stained with antibody to green fluorescent protein (A-11122; Life Technologies) and Alexa Fluor 488–conjugated anti-rabbit (sec-ondary antibody) (A-11034; Molecular Probes). Images of the FRC nuclei were collected and then were analyzed with CellProfiler software50 with the neighbor analysis module.
T cell–FRC interactions ex vivo. For quantification of T cells in contact with FRCs, Rosa26-eYFPfl/flCcl19-Cre mice were given an intravenous injection of anti-PDPN or an isotype-matched control antibody (both identified above). One day later, 5 × 10⁶ purified T cells labeled with Far Red cell tracker (Invitrogen) were injected intravenously. The mice were killed 24 h later, and LNs were fixed and imaged. Imaris software was used to generate isosurfaces for the T cells and the FRC network, and T cells in contact with the FRC network were quantified.
Immunization. For investigation of the role of PDPN during an immune response, BoyJ mice were first given an intravenous injection of anti-PDPN or an isotype-matched control antibody (both identified above). Two days later, 1 × 10⁶ CFSE-labeled CD45.2+ OT-I T cells were injected intravenously into each mouse. Four hours later, mice received 500 mg of OVA and 30 mg of LPS intravenously, and a second dose of the isotype-matched control antibody or anti-PDPN (both identified above) was administered 24 h later. Mice were analyzed 24 and 48 h after administration of the OT-I T cells, LPS, and OVA. Brachial LNs were collected and digested for flow cytometry analysis, while inguinal LNs were collected and fixed for imaging.
For immunization of Clec1bfl/flCd11c-Cre mice, PBS or 8 mg LPS was injected subcutaneously into the hind and fore footpads. LNs were collected 24 h later for flow cytometry (popliteal) or imaging (axillary and brachial).
Flow cytometry and antibodies. After the enzymatic digestion of LNs, cells were resuspended in flow cytometry buffer (PBS containing 2% FBS and 2 mM EDTA) and were incubated for 15 min with antibodies to the following surface markers: PDPN (8.1.1; Biolegend), CD31 (MEC13.3; Biolegend), CD45 (30-F11; Biolegend), B220 (RA3-6B2; eBioscience), CD3e (17A2; Biolegend), CD4 (RM 4-5; eBioscience) and CD8 (53-6.7; Biolegend). For BrdU labeling, mice were given intraperitoneal injection of 2 mg BrdU 24 h before analysis. Cells were stained with a BrdU Flow Kit according to the manufacturer’s instructions (BD Pharmingen). Cells were then analyzed on a FACSCalibur or FACSAria (both from BD Biosciences). Flow cytometry data were analyzed with FlowJo software.
Immunofluorescence staining of cells and tissue sections. Cells were plated on collagen-coated coverslips and were allowed to adhere overnight. Then,
npg
© 2
015
Nat
ure
Am
eric
a, In
c. A
ll rig
hts
rese
rved
.