A Comparison of the Sensitivity of Immunoperoxidase Staining Methods with High-Sensitivity...
6
http://jhc.sagepub.com/ Journal of Histochemistry & Cytochemistry http://jhc.sagepub.com/content/42/8/1143 The online version of this article can be found at: DOI: 10.1177/42.8.8027533 1994 42: 1143 J Histochem Cytochem B J Coventry, S H Neoh, B X Mantzioris, J M Skinner, H Zola and J Bradley fluorescence flow cytometry-antibody quantitation on the cell surface. A comparison of the sensitivity of immunoperoxidase staining methods with high-sensitivity Published by: http://www.sagepublications.com On behalf of: Official Journal of The Histochemical Society can be found at: Journal of Histochemistry & Cytochemistry Additional services and information for http://jhc.sagepub.com/cgi/alerts Email Alerts: http://jhc.sagepub.com/subscriptions Subscriptions: http://www.sagepub.com/journalsReprints.nav Reprints: http://www.sagepub.com/journalsPermissions.nav Permissions: What is This? - Aug 1, 1994 Version of Record >> by guest on January 9, 2014 jhc.sagepub.com Downloaded from by guest on January 9, 2014 jhc.sagepub.com Downloaded from
Transcript of A Comparison of the Sensitivity of Immunoperoxidase Staining Methods with High-Sensitivity...

http://jhc.sagepub.com/Journal of Histochemistry & Cytochemistry
http://jhc.sagepub.com/content/42/8/1143The online version of this article can be found at:
DOI: 10.1177/42.8.8027533
1994 42: 1143J Histochem CytochemB J Coventry, S H Neoh, B X Mantzioris, J M Skinner, H Zola and J Bradley
fluorescence flow cytometry-antibody quantitation on the cell surface.A comparison of the sensitivity of immunoperoxidase staining methods with high-sensitivity
Published by:
http://www.sagepublications.com
On behalf of:
Official Journal of The Histochemical Society
can be found at:Journal of Histochemistry & CytochemistryAdditional services and information for
http://jhc.sagepub.com/cgi/alertsEmail Alerts:
http://jhc.sagepub.com/subscriptionsSubscriptions:
http://www.sagepub.com/journalsReprints.navReprints:
http://www.sagepub.com/journalsPermissions.navPermissions:
What is This?
- Aug 1, 1994Version of Record >>
by guest on January 9, 2014jhc.sagepub.comDownloaded from by guest on January 9, 2014jhc.sagepub.comDownloaded from
0022-1554/94/$3.30 The journal of Histochemistry and Cytochemistry Copyright 0 1994 by The Histochemical Society, Inc.
Original Article
Vol. 42, NO. 8, pp. 1143-1147, 1994 Printed in U A .
A Comparison of the Sensitivity of Immunoperoxidase Staining Methods with High-Sensitivity Fluorescence Flow Cytometry-Antibody Quantitation on the Cell Surface'
BRENDON J. COVENTRY, SIM H. NEOH, BASIL X. MANTZIORIS, JOHN M. SKINNER, HEDDY ZOLA, and JOHN BRADLEY2 Departments of Clinical Immunology (BJC,SHN,BXM,HZJB) and Pathology (BJC JMS), Flinders Medzcal Centre and Flinders University of South Australiz, Adelaide, South Amtraliz.
Received for publication August 21, 1993 and in revised form February 23, 1994; accepted March 9, 1994 (3A3131).
Surface molecules present in low copy numbers can be de- tected with high-sensitivity fluorescence flow cytometry. Many cells previously thought not to express certain molecules on their surface can now be shown to have these molecules in very low copy numbers by high-sensitivity fluorescent cyto- metric methods. Detection of molecules by immunoperoxi- dase staining methods has not previously been compared with high-sensitivity flow cytometry techniques. Computerized video image analysis (VIA) is a method that allows measure- ment of area and density of the immunostain chromogen reaction product in a standardized fashion analogous to flow cytometry. In this study, we compared immunoperoxidase reaction products measured by VIA methods with high-
Introduction The sensitivity of immunostaining methods has been assumed by many investigators to be at least as high as the standard flow cyto- metric fluorescent detection methods. Heavy metal-enhancement methods using salts of base metals such as cobalt, copper, osmium, and nickel were described initially in 1981 (Hsu et al., 1982; Adams, 1981), and a number of enhanced fluorochrome techniques have been described (Podkletnova and Alho, 1993; Seveus et al., 1992), but most immunohistochemical studies have used standard non- enhanced diaminobenzidine (DAB) methods, despite the increased ability of the human eye to detect heavy metal-enhanced staining as a result of the increased contrast obtained with the dense reac- tion product formed by heavy metal complexes.
Flow cytomeuy is a well-standardized method of measurement
Supported by the NH and MRC and by the Anti-Cancer Foundation of The Universities of South Australia.
Correspondence to: Prof. John Bradley, Dept. of Clinical Immunol- ogy, Flinders University, GPO Box 2100, Adelaide, South Australia 5001.
sensitivity flow cytomeaic measurements for cells with 10,000 down to 50 antibody molecules bound to their surfaces. De- tection of 100-200 surface molecules was possible with heavy metal-enhanced immunoperoxidase methods, whereas stan- dard immunoperoxidase methods were not as sensitive. The sensitivity of the nickel-enhanced immunoperoxidase stain- ing method was confiied for detection of an epitope (Tac- IL2 receptor a-chain) present in low numbers on the surface of peripheral blood lymphocytes. (JHis tdem Cgtochem 42:1143-1147, 1994) KEY WORDS: Immunoperoxidase; Nickel-enhanced; Image analy- sis; High-sensitivity flow cytometry; Sensitivity.
of fluorescently labeled cells in suspension but not within intact tissue sections. Video image analysis (VIA) enables measurement on cells in tissue sections. The structure of image analysis system is reviewed in detail elsewhere (Skinner et al., 1993; Jarvis, 1988,1992) but generally comprises a video camera mounted at the head of a microscope, a microcomputer with digitizer card and relevant soft- ware, a video screen, and a pointer (mouse) or digitizer pad. The microscopic image of immunostained cells is digitized and cap- tured on the video screen and a threshold set so that the reaction product is shown highlighted on the screen. The area in pixel units of the captured, thresholded, and edited image can be measured and the optical density can be measured over this stained area. Mean optical density (MOD) and integrated optical density (IOD) mea- surements are obtainable with the image analysis software. The sen- sitivity of the video camera used equals, or is better than, that of the human eye, so that under suitable contrast conditions no visi- ble staining will be missed. The system can be applied to both chromogen- and fluorescence-stained cell antigens. However, some limitations from the relatively rapid fading of fluorophores during image acquisition make dye chromogens easier to use.
The development of flow cytometric methods for detection of
1143
by guest on January 9, 2014jhc.sagepub.comDownloaded from
1144 COVENTRY, NEOH, MANTZIORIS, SKINNER, ZOLA, BRADLEY
low numbers of molecules on the surface of cells (Zola et al., 1989,1990) led us to compare the sensitivity of immunoperoxidase methods with this high-sensitivity flow cytometry technique. The aim of the study was to examine cells with decreasing numbers of antibodies on their surfaces by both high-sensitivity flow cytomet- ric and immunoperoxidase methods in parallel to determine the relative sensitivity of detection of the immunoperoxidase methods with or without nickel enhancement.
Materials and Methods Cells. Peripheral blood lymphocytes (PBLs) were obtained from healthy
volunteers and isolated by centrifugation over Ficoll-hypaque (Nycomed; Oslo, Norway). Tonsil cells were also extracted from non-acutely inflamed fresh tonsillectomy specimens by mechanical dissaggregation and the mononuclear layer separated as for PBLs.
Reagents. Monoclonal antibodies (MAb) FMC 51 (CD45, IgGl), anti- Tac (anti-IL2R. IgGI), and X63 (a myeloma-derived IgGl isotype-negative control) were used. FMC 51 (CD45, IgG1) antibody to the common epi- tope of leukocyte common antigens was used as the test antibody in decreas- ing dilution. In addition, because the IL2-receptor is a molecule known to be expressed in low copy number on PBL (Ben Arabia et al., 1989; Zola et al., 1989; LeMauff et al., 1987), an antibody to interleukin-2 receptor a-chain (CD25) anti-& (Becton-Dickinson; Mountain View, CA) was used to compare the detection capability of the immunoperoxidase system with high-sensitivity flow cytomeuy. For flow cytomeuy, biotinylated horse anti-mouse antibody (Vector, Burlingame, CA; Cat. BA2000) and phyco- erythrin-streptavidin (PE-SA) (Caltag, San Francisco, CA; Cat. SA-1000, or Becton-Dickinson, Cat. 9023) were used as detection reagents. For im- munoperoxidase staining in tissue sections, avidin-biotin complex kit re- agents (Vector) were the detection reagents, diaminobenzidine (DAB Sigma, St Louis, MO) the reaction substrate, and nickel chloride the heavy metal enhancing agent.
Immunofluorescence. The high-sensitivity procedure used in these studies employed a three-step method with MAb followed by biotinylated second antibody and PE-SA. Phycoerythrin was detected with the FACS Analyzer (Becton-Dickinson). High-sensitivity PE measurements were per- formed in the Analyzer using a 546/10-nm bandpass filter for excitation, a 560-nm interference filter acting as a dichroic mirror, and emission filters 570-nm longpass and 595/63-nm bandpass ( a l a et al., 1989).
Purification and Labeling of MAb. FMC5l was purified from concen- trated culture supernatants grown in dialysis tubing as described by Sjogren-Jansson and Jeanson (1985). The advantage of the dialysis tubing method is that no irrelevant murine immunoglobulins are present in the dialysate compared with ascites fluid, so that the final labeled antibody approaches ideal purity. MAb was purified from culture fluid by HPLC (MAPS with protein A column; Bio-Rad, Richmond, CA) and radioiodi- nated by the chloramine T method. Purity was checked by running the radioiodinated antibody on an agarose electrophoretic gel, which after au- toradiography showed a single band ( a l a et al., 1990). Confirmation of purity was obtained, since only heavy- and light-chrin bands were seen when iodinated MAb was denatured with reducing agent and run on polyacryl- amide gels. The total protein concentration was determined by measuring the optical density at a wavelength of 280 nm and using an extinction c d i - cient value of 14 for a 1% solution in a 1-cm cell. In the absence of detect- able impurity, this was assumed to be the MAb antibody concentration for the purpose of calculating molarity.
Quantitative Binding Studies. The detailed methodology for the quan- titative binding studies using radioactively labeled FMC51 is described else- where (%la et al., 1990). These data were used to construct Scatchard plots
to determine the relative sensitivity in surface molecules per cell of the (high- sensitivity) flow cytomeuic methods. The FMC51-radiolabeled cells were incubated for 2-2.5 hr, re-suspended, and an aliquot taken for counting the radioactivity of the cell pellet. The remaining cells were either (a) la- beled with biotinylated horse anti-mouse second antibody and PE-SA for FACS analysis or (b) cytospun onto microscope slides for immunostaining at each antibody concentration. Fluorescence intensity was plotted against the numbers of molecules bound (using the radioactive counts determined rather than the predicted number of molecules bound per cell), and im- munoperoxidase staining was measured by image analysis.
Immunohistochemical Studies. FMC51-coated cells from the same preparations used in the fluorescence determinations, but without the fluo- rescent second antibody added, were cytospun onto slides and stained. Cell morphology was well preserved, and the cells were dispersed so that mea- surement of individual cells was easily achieved. This produced a prepara- tion of cells that were coated with primary FMC5l antibody (or X63 nega- tive control antibody) in the series of dilutions as for the suspended cells. Biotinylated horse anti-mouse second antibody and ABC complex were bound to the primary antibody and reacted with DAB substrate (plus nickel) to produce a brown (or blue-black with NiClz enhancement) reaction prod- uct which was visible by transmitted light microscopy.
Aliquots (100 pl) of antibody-coated cells from each tube were cen- trihged onto acid cleaned glass slides at 500 rpm for 12 min using a Cytospin (Shandon; Runcorn, Cheshire, UK), air-dried briefly, then incubated for 30 min with biotinylated horse anti-mouse second antibody (ABC kit; Vec- tor), washed in PBS, then incubated for 45 min with avidin complexed with biotin and peroxidase enzyme. The DAB reaction substrate Was added either with or without nickel chloride to examine the effect of heavy metal ion complexes on the overall sensitivity of detection. For nickel enhance- ment, 50 p1 of NiC12 solution (80 mg in 1 ml water) was added to 5 ml of 10 mg/ml DAB solution.
To test the immunoperoxidase methods further, a molecule known to be expressed in low copy number on the surface of freshly separated pe- ripheral blood lymphocytes, the IL2 receptor, was examined using an anti- ILZR antibody to the a-chain (Bd anti-Tac).
To 100 pl of freshly separated PBL at 10' cells/ml was added one of the following: (a) 10 p1 of anti& antibody; (b) 10 p1 of X63 culture super- natant (control); or (E) 50 ~1 of PBS-azide (control). After incubation for 30 min at 4"C, the cells were washed in PBS-azide and centrifuged in a refrigerated centrifuge for 5 min at 1800 rpm. The supernatant was removed and the cells re-suspended in 100 p1 of PBS-azide. The contents of each
Table 1. Two simil'ar experiments measuring FMCJl binding with standard brown DAB immunoberodzse staininp Molrmles per cell Man area Mean IOD
Experiment 1 Excess Ab 806 202 10,000 485 77 5000 425 56 2000 406 27
2000 428 84 1500 494 95 1000 466 79
Experiment 2
Mean AOD
0.25 0.15 0.13 0.07
0.20 0.20 0.17
X63 negative control cytospins produced no detectable staining (area and OD of zero). Values are averages of 200 cells measured. IOD. integrated optical density; AOD, average optical density. It was not possible to differentiate the specific brown DAB staining from background at <2000 moleculeslcell in Experiment 1 and <lo00 moleculeslcell in Experiment 2 .
by guest on January 9, 2014jhc.sagepub.comDownloaded from
COMPARISON OF FLOW AND VIA CYTOMETRY 1145
Table 2 . VIA mearurements of FMCSl binding with nicdel- enhanced DAB-immunoperoxi2ase rtainitzp Molecules per cell Mean area Mean [OD Mean AOD
Excess Ab 759 253 0.33 10,000 467 122 0.26 5000 5 3 5 119 0.22 2000 419 50 0.12 1000 426 36 0.08 800 395 26 0.07 600 398 29 0.07 400 346 27 0.08 200 299 14 0.05
Values are averages of 200 cells measured
tube were divided into two aliquots for (a) high-sensitivity flow cytometric measurement, and for (b) cytospinning and immunoperoxidase staining. The cytospin was set at 400 rpm for 7 min and 350 pl of 50% fetal calf serum in medium added to the 50-pl aliquot in each tube. Aliquots (100 pl) were added to each “bucket” and the cells spun onto acid-cleaned glass slides, air-dried, then nickel-immunoperoxidase-stained as previously de- scribed. Cells from the original aliquot of unlabeled cells were used alone with no antibody but with FCS to ensure that staining was not due to the addition of FCS. The use of FCS and slower cytospin speeds and times was necessary to produce good-quality cytospins of freshly isolated PBL in this part of the study.
The reaction products were examined using a video image analysis (VIA) device (MD-20, Flinders Imaging) uarvis, 1988). The captured microscopic image can be edited on the video screen and measurements performed using specifically designed software. Thresholds were chosen so that all reaction product visible to the naked eye (and video camera) was included in each measurement and the background excluded. The image analysis software enables calculation of the average optical density over a given immuno- stained area. A threshold was chosen to include all detectable reaction product visible to the human eye.
A range of filters of different color and intensity was assessed. The BGl2 filter was selected as producing the best-quality, highest-contrast image for VIA measurement of brown DAB staining and the green filter (546-nm) was best for nickel DAB staining. Threshold settings for brown DAB stain- ing needed to be set at a higher level by 10 points on the 63-level gray scale (data not shown) than those for nickel-enhanced DAB staining to pro- duce equivalent staining areas. Optical density measurements a .: each cell are integrated to provide an integrated optical density (IOD). Experi- ments were performed in parallel using either brown DAB- or NiC12- enhanced reaction products on cells from the same tubes. Both methods were compared with flow cytometry for their ability to detect small num- bers of antibodies on the surface of cells.
Results
Comparison of the Sensitiuity of Immunoperoxidase Staining and High -sensitivity Flow Cy tometry
Using High-affiity FMC51 Antibody. The reaction product was easily visible down to the dilution comparable to the tube con- taining cells with 1000 molecules of FMC5l bound to their cell surface. This level of staining was also detectable by the image anal-
1
0 10’ 102 1 o3
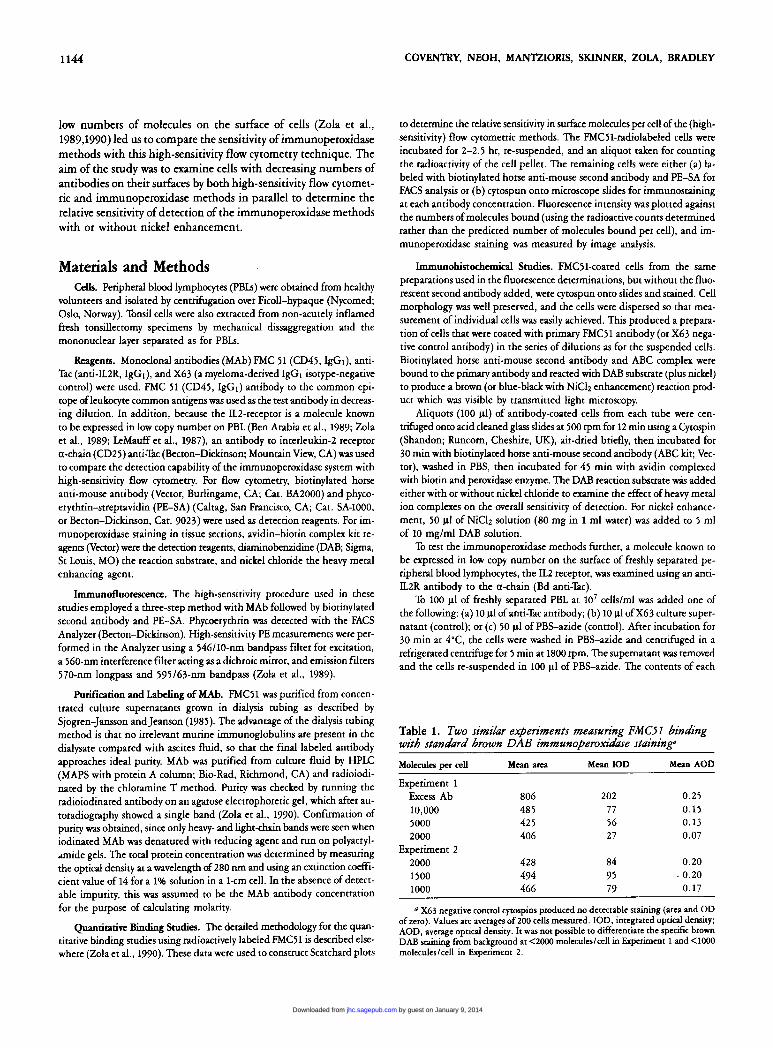
FI uorescence In tensity Figure 1. High-sensitivityflow cytometry results showing X63 negative control (faint line) and anti-ILPR anti-Tac fluorescence (solid line).
ysis apparatus, such that measurements of the area of staining and the optical density of the reaction product (intensity of staining) were possible.
The mean optical density can be calculated using the formula
MODS = IoDS/area s
where IOD, is the integrated optical density of the stained object S and the area is the area measurement of S in pixels. These mea- surements for brown DAB staining are shown in Eble l. The results from two similar experiments are shown.
Repeating the experiment using cells prepared by identical methods but with nickel chloride enhancement of the end-stage of the DAB reaction produced staining detectable to lower levels than standard DAB methods. A green filter (546-nm) was used to provide image contrast enhancement for video camera detec- tion of the nickel-DAB reaction product. These results are shown in Eble 2.
IOD differences between the two methods of DAB staining were not due solely to the difference in the color filters used, since alter- nating the filters reduced the image contrast of both brown DAB and nickel-enhanced DAB images. The filters were therefore en- hancing each type of reaction product optimally and appropriately.
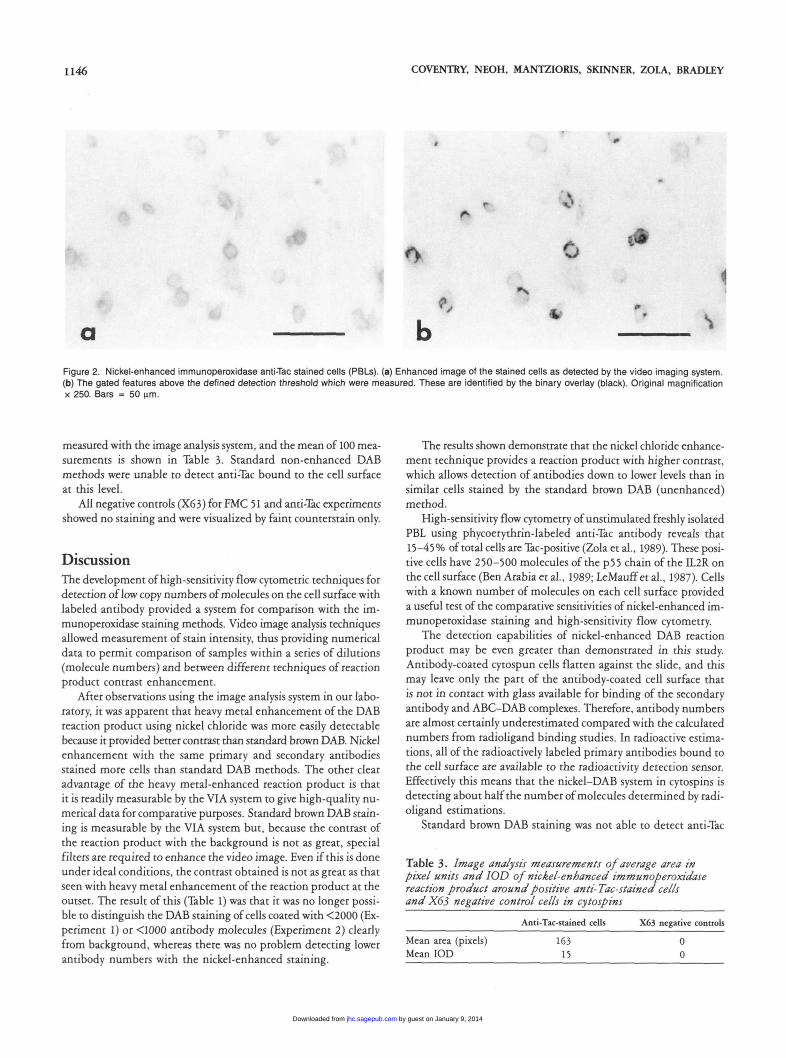
Using Anti-Tac (E2 Receptor a-Chain Antibody) to Detect Cell Membrane-bound Molecules Expressed in Low Copy Number. Nickel-enhanced immunoperoxidase methods were able to detect cells that had low numbers of anti& antibody bound to their sur- faces, whereas standard DAB did not. Approximately 43% of un- stimulated PBLs were positive for anti-Tac antibody by high- sensitivity flow cytometric methods in these studies (Figure 1). In cytospin preparations made from the same aliquot of anti-&-stained PBLs as that used for high-sensitivity flow cytometric estimations, a similar proportion of cells were Tac-positive with the nickel- enhanced method. The faint immunoperoxidase staining and the detected image are demonstrated in Figure 2. Ec-positive cells were
by guest on January 9, 2014jhc.sagepub.comDownloaded from
1146 COVENTRY, NEOH. MANTZIORIS, SKINNER, ZOLA, BRADLEY
a
# c
r
4. c
Figure 2. Nickel-enhanced immunoperoxidase anti-Tac stained cells (PELS). (a) Enhanced image of the stained cells as detected by the video imaging system. (b) The gated features above the defined detection threshold which were measured. These are identified by the binary overlay (black). Original magnification x 250. Bars = 50 pm.
measured with the image analysis system, and the mean of 100 mea- surements is shown in Table 3. Standard non-enhanced DAB methods were unable to detect anti-Tac bound to the cell surface at this level.
All negative controls (X63) for Fh4C 51 and anti-%, experiments showed no staining and were visualized by faint counterstain only.
Discussion The development of high-sensitivity flow cytometric techniques for detection of low copy numbers of molecules on the cell surface with labeled antibody provided a system for comparison with the im- munoperoxidase staining methods. Video image analysis techniques allowed measurement of stain intensity, thus providing numerical data to permit comparison of samples within a series of dilutions (molecule numbers) and between different techniques of reaction product contrast enhancement.
After observations using the image analysis system in our Iabo- ratory, it was apparent that heavy metal enhancement of the DAB reaction product using nickel chloride was more easily detectable because it provided better contrast than standard brown DAB. Nickel enhancement with the same primary and secondary antibodies stained more cells than standard DAB methods. The other clear advantage of the heavy metal-enhanced reaction product is that it is readily measurable by the VIA system to give high-quality nu- merical data for comparative purposes. Standard brown DAB stain- ing is measurable by the VIA system but, because the contrast of the reaction product with the background is not as great, special filters are required to enhance the video image. Even if this is done under ideal conditions, the contrast obtained is not as great as that seen with heavy metal enhancement of the reaction product at the outset. The result of this (Table 1) was that it was no longer possi- ble to distinguish the DAB staining of cells coated with <2000 (Ex- periment 1) or <lo00 antibody molecules (Experiment 2) clearly from background, whereas there was no problem detecting lower antibody numbers with the nickel-enhanced staining.
The results shown demonstrate that the nickel chloride enhance- ment technique provides a reaction product with higher contrast, which allows detection of antibodies down to lower levels than in similar cells stained by the standard brown DAB (unenhanced) method.
High-sensitivity flow cytometry of unstimulated freshly isolated PBL using phycoerythrin-labeled anti-Tac antibody reveals that 1 5 4 5 % of total cells are Xc-positive (&la et al., 1989). These posi- tive cells have 250-500 molecules of the p55 chain of the ILZR on the cell surface (Ben Arabia et al., 1989; LeMauff et al., 1987). Cells with a known number of molecules on each cell surface provided a useful test of the comparative sensitivities of nickel-enhanced im- munoperoxidase staining and high-sensitivity flow cytometry.
The detection capabilities of nickel-enhanced DAB reaction product may be even greater than demonstrated in this study. Antibody-coated cytospun cells flatten against the slide, and this may leave only the part of the antibody-coated cell surface that is not in contact with glass available for binding of the secondary antibody and ABC-DAB complexes. Therefore, antibody numbers are almost certainly underestimated compared with the calculated numbers from radioligand binding studies. In radioactive estima- tions, all of the radioactively labeled primary antibodies bound to the cell surface are available to the radioactivity detection sensor. Effectively this means that the nickel-DAB system in cytospins is detecting about half the number of molecules determined by radi- oligand estimations.
Standard brown DAB staining was not able to detect anti-Tac
Table 3 . Image anahsir measurements of average area in pixel units and IOD of nicrdel-enhanced immunoperoxidase reaction product around positive anti- Tac-stained cells and XG3 negative control cells in cytospins
Mean area (pixels) 163 0 Mean IOD 15 0
Anti-Tac-stained cells X63 negative controls
by guest on January 9, 2014jhc.sagepub.comDownloaded from

COMPARISON OF FLOW AND VIA CYTOMETRY 1147
staining in PBL at the levels detected by NiCIz-enhanced tech- niques. The nickel-enhanced immunoperoxidase system can de- tect -200 molecules on the cell surface. This sensitivity may actu- ally be nearer the order of 100 molecules or less when it is considered that only around half of the antibody-coated cell surface is exposed for nickel-enhanced immunoperoxidase detection in these studies.
Acknowledgment We thank Helen Weeabn for technicalassistance in the flaw cytomehy work.
Literature Cited Adams JC (1981): Heavy metal intensification of DAB based HRP reaction product. J Histochem Cytochem 29:775
Ben Arabia M-H, Moire N, Metivier D, Vaquero C, Lantt 0, Olive D, Char- pentier B, Senik A (1989): IL2 receptors on circulating natural killer cells and T-lymphocytes. J Immunol 142:490
Hsu S-Y, Soban E (1982): Color modification of diaminobenzidine (DAB) precipitation by metallic ions and its application for double immunochem- istry. J Histochem Cytochem 301079
Jarvis LR (1992): The microcomputer and image analysis in diagnostic pathol- ogy. Microsc Res Tech 21:292
Jarvis LR (1988): Microcomputer video im ge analysis. J Micrc : 15083
LeMauff B, Gascan H, Oliver D, Moreau J-4 Mawas C, Soulillou J-P (1987): Parameters of interaction of a novel monoclonal antibody (3383.1) with the human IL2-receptors: interrelationship between 3383.1, antislgc, and IL2 binding sites. Hum Immunol 19:53
Podkletnow I, Alho H (1993): Ultrasound-amplified immunohistochemistry. J Histochem Cytochem 41:51
Seveus L, Vaisala M, Syrjanen S, Sandberg M, Kuusisto A, Harju R, Sal0 J. Hemmila I, Kojola H, Soini E (1992): Time-resolved fluorescence imag- ing of curopium chelate label in immunohistochemistry and in situ hybridi- sation. Cytometry 13:329
Sjogren-Jansson E, Jeansson S (1985): Large scale production of monoclo- nal antibodies in dialysis tubing. J Immunol Methods 84359
Skinner JM, Zhao Y, Coventry B, Bradley J (1993): Review article. Video image analysis in pathology. Dis Markers 11:53
Zola H, Manttioris BX, Webster J, Kette FE (1989): Circulating human T and B lymphocytes express the p55 interleukin-2 receptor molecule (TAC,CD25). Immunol Cell Biol 67:233
&la H, Neoh SH, Mantzioris BX, Webster J, Loughman MS (1990): De- tection by immunofluorescence of surface molecules present in low copy numbers: high sensitivity staining and calibration of flow cytometer. J Im- munol Methods 135:247
by guest on January 9, 2014jhc.sagepub.comDownloaded from


![Identification and quantitation of benzo[a]pyrene-DNA adducts formed in mouse skin](https://static.fdokumen.com/doc/165x107/6333eb3bb94d623842027004/identification-and-quantitation-of-benzoapyrene-dna-adducts-formed-in-mouse-skin.jpg)