
Quantitation and mapping of tissue optical properties using modulated imaging
31
Quantitation and mapping of tissue optical properties using modulated imaging David J. Cuccia, Modulated Imaging, Inc., 1002 Health Sciences Road, Irvine, California 92612 Frederic Bevilacqua * , University of California, Irvine, Beckman Laser Institute, 1002 Health Sciences Road, Irvine, California 92612 Anthony J. Durkin, University of California, Irvine, Beckman Laser Institute, 1002 Health Sciences Road, Irvine, California 92612 Frederick R. Ayers, and University of California, Irvine, Beckman Laser Institute, 1002 Health Sciences Road, Irvine, California 92612 Bruce J. Tromberg University of California, Irvine, Beckman Laser Institute, 1002 Health Sciences Road, Irvine, California 92612 Abstract We describe the development of a rapid, noncontact imaging method, modulated imaging (MI), for quantitative, wide-field characterization of optical absorption and scattering properties of turbid media. MI utilizes principles of frequency-domain sampling and model-based analysis of the spatial modulation transfer function (s-MTF). We present and compare analytic diffusion and probabilistic Monte Carlo models of diffuse reflectance in the spatial frequency domain. Next, we perform MI measurements on tissue-simulating phantoms exhibiting a wide range of l* values (0.5 mm to 3 mm) and ratios (8 to 500), reporting an overall accuracy of approximately 6% and 3% in absorption and reduced scattering parameters, respectively. Sampling of only two spatial frequencies, achieved with only three camera images, is found to be sufficient for accurate determination of the optical properties. We then perform MI measurements in an in vivo tissue system, demonstrating spatial mapping of the absorption and scattering optical contrast in a human forearm and dynamic measurements of a forearm during venous occlusion. Last, metrics of spatial resolution are assessed through both simulations and measurements of spatially heterogeneous phantoms. Keywords structural illumination; turbid media; optical properties; diffuse optical spectroscopy; wide-field imaging; spatial frequency domain © 2009 Society of Photo-Optical Instrumentation Engineers. Address all correspondence to: David J. Cuccia, Modulated Imaging, Inc., 1002 Health Sciences Rd., Irvine, CA 92612. Tel: 949-824-8367; Fax: 949-824-6969; [email protected]. * Current address: Ircam, 1 Place Igor Stravinsky, Paris, 75001, France. NIH Public Access Author Manuscript J Biomed Opt. Author manuscript; available in PMC 2010 May 12. Published in final edited form as: J Biomed Opt. 2009 ; 14(2): 024012. doi:10.1117/1.3088140. NIH-PA Author Manuscript NIH-PA Author Manuscript NIH-PA Author Manuscript
Transcript of Quantitation and mapping of tissue optical properties using modulated imaging

Quantitation and mapping of tissue optical properties usingmodulated imaging
David J. Cuccia,Modulated Imaging, Inc., 1002 Health Sciences Road, Irvine, California 92612
Frederic Bevilacqua*,University of California, Irvine, Beckman Laser Institute, 1002 Health Sciences Road, Irvine,California 92612
Anthony J. Durkin,University of California, Irvine, Beckman Laser Institute, 1002 Health Sciences Road, Irvine,California 92612
Frederick R. Ayers, andUniversity of California, Irvine, Beckman Laser Institute, 1002 Health Sciences Road, Irvine,California 92612
Bruce J. TrombergUniversity of California, Irvine, Beckman Laser Institute, 1002 Health Sciences Road, Irvine,California 92612
AbstractWe describe the development of a rapid, noncontact imaging method, modulated imaging (MI), forquantitative, wide-field characterization of optical absorption and scattering properties of turbidmedia. MI utilizes principles of frequency-domain sampling and model-based analysis of the spatialmodulation transfer function (s-MTF). We present and compare analytic diffusion and probabilisticMonte Carlo models of diffuse reflectance in the spatial frequency domain. Next, we perform MImeasurements on tissue-simulating phantoms exhibiting a wide range of l* values (0.5 mm to 3 mm)
and ratios (8 to 500), reporting an overall accuracy of approximately 6% and 3% in absorptionand reduced scattering parameters, respectively. Sampling of only two spatial frequencies, achievedwith only three camera images, is found to be sufficient for accurate determination of the opticalproperties. We then perform MI measurements in an in vivo tissue system, demonstrating spatialmapping of the absorption and scattering optical contrast in a human forearm and dynamicmeasurements of a forearm during venous occlusion. Last, metrics of spatial resolution are assessedthrough both simulations and measurements of spatially heterogeneous phantoms.
Keywordsstructural illumination; turbid media; optical properties; diffuse optical spectroscopy; wide-fieldimaging; spatial frequency domain
© 2009 Society of Photo-Optical Instrumentation Engineers.Address all correspondence to: David J. Cuccia, Modulated Imaging, Inc., 1002 Health Sciences Rd., Irvine, CA 92612. Tel:949-824-8367; Fax: 949-824-6969; [email protected].*Current address: Ircam, 1 Place Igor Stravinsky, Paris, 75001, France.
NIH Public AccessAuthor ManuscriptJ Biomed Opt. Author manuscript; available in PMC 2010 May 12.
Published in final edited form as:J Biomed Opt. 2009 ; 14(2): 024012. doi:10.1117/1.3088140.
NIH
-PA Author Manuscript
NIH
-PA Author Manuscript
NIH
-PA Author Manuscript

1 IntroductionLight transport in tissues is a complex process due to multiple scattering and absorption. Thus,at the core of every optical technique for quantitative tissue characterization is the ability toseparate optical absorption from optical scattering effects by the detection of a remitted ortransmitted light field. This remission (or transmission) is a function of time and space, yieldingtwo general classes of quantitative techniques: time-resolved and spatially resolvedmeasurements, respectively (see Fig. 1). Time-resolved measurements are further broken downinto time-domain and frequency-domain techniques: the first measuring the temporal point-spread function (t-PSF), or spreading of a propagating pulse in time,1,2 and the latter measuringthe temporal modulation transfer function (t-MTF), or the attenuation and phase delay of aperiodically varying photon density wave.3–5 The time domain and frequency domain sharean exact Fourier transform equivalency, although each has its trade-offs when considering real-life hardware and model-fitting constraints.
In diffuse optics, spatially resolved measurements have been generally limited to the real spatialdomain. Here, the spatial point-spread function (s-PSF) is typically characterized by“multidistance” measurements,6,7 tracking the spatial dependence of a reflected or transmittedlight field generated from a point-like illumination. The Fourier transform equivalent to thereal spatial domain is the spatial frequency domain (SFD). While recent work has shown theuse of spatially structured illumination techniques for manipulating diffractive optical systems,8 little has been reported for its use in characterization of diffusive systems. 9–11
In this paper, we describe a new imaging method, modulated imaging (MI), for quantitationand wide-field mapping of turbid media in the SFD. The spatial modulation transfer function(s-MTF) of a turbid medium encodes both depth and optical property information, enablingboth quantitation and tomographic imaging of the spatially varying medium optical properties.10 In this work, we present a detailed exposition and validation of the ability of MI toquantitatively recover homogeneous tissue optical properties. We present two homogeneousforward models of diffuse reflectance in the spatial frequency domain—the first, an analyticdiffusion-based approach, and the second, a transport-based approach using Monte Carlosimulations. Next, we present reflectance measurements of tissue-simulating liquid phantomsexhibiting a wide range of absorption and scattering values. The optical properties of thesesamples are recovered by analysis with our analytic diffusion model using two inversionmethods—the first, a least-squares multifrequency fitting algorithm, and the second, a rapidtwo-frequency lookup table approach. We then apply the technique to an in vivo tissue system,producing 2-D spatial maps of the absorption and reduced scattering contrast of a humanforearm. Dynamic measurements are also acquired, demonstrating changes in forearm opticalproperties during venous occlusion. Last, we investigate metrics of spatial resolution andoptical property contrast through both simulations and measurements of spatiallyheterogeneous phantoms.
2 MI InstrumentationThe MI apparatus is shown in Fig. 2. Grayscale illumination patterns are generated using alight source in combination with a spatial light modulator (SLM). In this study, we used asimple digital projector (NEC HT1000), based on a digital micromirror-based digital lightprocessing (DLP) light engine (Texas Instruments) and an ultra high performance (UHP)mercury lamp. The projector’s color filter wheel was removed, producing a broadband “whitelight” illumination of the sample, allowing us to use interference filters for detection of a narrowwavelength band (Andover Corporation, λ=660 nm, Δλ=10 nm FWHM). To create theillumination patterns, 8-bit grayscale bitmap images are generated using MATLAB(Mathworks, Inc.). They are then placed in a PowerPoint (Microsoft, Inc.) presentation file and
Cuccia et al. Page 2
J Biomed Opt. Author manuscript; available in PMC 2010 May 12.
NIH
-PA Author Manuscript
NIH
-PA Author Manuscript
NIH
-PA Author Manuscript
automatically sequenced using the Microsoft Office ActiveX controls through an externalLabVIEW (National Instruments, Inc.) program. The diffusely reflected light is captured by a16-bit frame-transfer CCD camera (Roper Cascade 512F) capable of imaging up to 30 framesper second at full 512×512 resolution. Specular reflection is avoided by illuminating at a smallangle to normal incidence. Additionally, crossed linear polarizers can be added to further selectthe diffuse reflectance, useful for rough surfaces (such as skin), where specular light can bereflected at all angles.
The modularity of this system makes it very flexible. First, the field of view is limited only bythe magnification of the illumination and collection optics (with fundamental resolution limitsset by the physics of light transport). Second, the spectral range can be chosen by appropriateselection of light source, SLM, and imaging sensor. Last, for many applications, an MI systemhas the potential to be very low cost, capitalizing on the widespread availability of consumer-grade digital cameras and projection systems. Here, we use a research-grade 16-bit CCDsystem, but the required dynamic range for many applications can be as low as 8 bits, dependingon the required reflectance intensity (and thus optical property) resolution.
3 Theory and Measurement in the SFD3.1 Diffusion Approximation
The concept of a temporally modulated scalar photon density wave in turbid media is wellestablished—its dispersive, diffractive, and interference properties have been widely studiedand used for both quantitation and image formation.3,4,6,12–15 The notion of spatiallymodulated photon density “standing” waves, however, has mainly been considered as atheoretical construct (i.e., as the Fourier transform representation of spatial point sources andperturbations), as opposed to a practical measurement modality employing periodicillumination. Our goal here is to provide a simple conceptual framework to understand thefluence rate and reflectance properties of spatially modulated photon density plane waves inthe SFD. We formulate this within a diffusion context and then later extend the discussion totransport-based Monte Carlo simulations in order to extend the applicability of MI to lowalbedo and high spatial frequency regimes.
The time-independent form of the diffusion equation for a homogeneous medium is given by
(1)
where φ is the fluence rate, q is the source, is the transport coefficient, μeff=
(3μaμr)1/2, μa is the absorption coefficient, is the reduced scattering coefficient,and g is the cosine of the average scattering angle. Imposing a semi-infinite geometry, asdepicted in Fig. 3, we introduce a normally incident, periodically varying plane wave source:
(2)
with spatial frequencies (or repetencies) fx=(kx/2π) and fy=(ky/2π), and spatial phases α and β,extending infinitely in the tangential spatial dimensions, x and y, with some arbitrarydependence on depth, z.
Assuming a linear medium (i.e., a response proportional to the input intensity), this sinusoidalsource will give rise to a diffuse fluence rate with the same frequency and phase. (From
Cuccia et al. Page 3
J Biomed Opt. Author manuscript; available in PMC 2010 May 12.
NIH
-PA Author Manuscript
NIH
-PA Author Manuscript
NIH
-PA Author Manuscript

symmetry considerations, there should be no lateral phase shift16 for normally incident lightonto a homogeneous medium.)
(3)
Insertion of Eqs. (2) and (3) into Eq. (1) yields a 1-D second-order Helmholtz equation for thefluence rate as a function of depth, z:
(4)
where
(5)
Here, a plane wave with both x and y modulation gives rise to a wave propagating with a scalar
attenuation coefficient . Although spatial anisotropy may exist in real tissues, we focus onthe characteristics of a 1-D projection to understand simple scalar photon density waveattenuation in multiply scattering media. Consequently, the subsequent discussion considers asingle nonzero spatial frequency along the x dimension only, k=kx, with constant illuminationalong y (ky=0).
At zero spatial frequency (k=0), the effective penetration depth is equivalent to that of a
planar (constant) illumination source, δeff=(1/μeff). In general, however, (and ) arefunctions of both optical properties and spatial frequency of illumination. The 1-D form of Eq.(4) implies that the amplitude of the periodic wave, φ0(z), is independent of the tangentialspatial dimensions x and y. As Eq. (4) is identical to the diffusion equation for a planarillumination, we can use existing planar geometry solutions by simply substituting μeff with
our new term.
As in the derivation of Svaasand et al.5 for planar photon density wave reflectance, we modelan extended source as
(6)
where P0 is the incident optical power. Conceptually, this represents a spatially distributed butangularly isotropic source introduced via scattering of a collimated, forward-directed beam.The solution for the resulting fluence rate is
Cuccia et al. Page 4
J Biomed Opt. Author manuscript; available in PMC 2010 May 12.
NIH
-PA Author Manuscript
NIH
-PA Author Manuscript
NIH
-PA Author Manuscript

(7)
where a′ is the reduced albedo, and C is a constant determined by the choice of a boundarycondition. Using the partial current boundary condition,15 the flux, j, is set proportional to thefluence at the interface z=0:
(8)
Here, A is the proportionality constant, and Reff is the effective reflection coefficient. C thenbecomes
(9)
yielding the diffuse reflectance, Rd(k):
(10)
While the formulation shown is for a pure 1-D sinusoidal illumination pattern, an arbitraryillumination function can be modeled through linear superposition of sinusoids in both the xand y directions.
For a given set of optical properties, the function Rd(k) specifies the diffuse spatial modulationtransfer function (MTF) of the medium. The simplicity of Eq. (10) allows some physicalintuition of its properties. First, the frequency dependence of Rd in the SFD is an inverse
polynomial function of a single, positive-valued ratio, , which fully describes the low-pass spatial filtering properties of homogeneous turbid samples within a steady-state diffusioncontext:
(11)
The low- and high-frequency regimes have differential sensitivity to absorption and scatteringproperties, respectively. At k=0, Rd is a function only of the reduced albedo. In the additional
limit of zero absorption, and Rd→1, implying that all incident photons are
Cuccia et al. Page 5
J Biomed Opt. Author manuscript; available in PMC 2010 May 12.
NIH
-PA Author Manuscript
NIH
-PA Author Manuscript
NIH
-PA Author Manuscript

reflected back out of the turbid medium. At low spatial frequencies (k≪μeff), the absorptionhas a maximal effect on the reflectance. Approaching the high-frequency regime (k≫μeff), the
denominator μtr ( in the diffusion limit), becomes the only source of optical contrast. Bothlimits involve a ratio with respect to the transport coefficient, highlighting the natural lengthscale of light transport, l*=(1/μtr), the transport mean free path. In fact, dimensionless formsof the preceding fluence and reflectance solutions can be written in units of the transport spatialfrequency, μtr, by the two substitutions μ̂a=(μa·l*), k̂=(k·l*), and ẑ=(z/l*), where
and â′ = (1 − μ ̂a).
The diffusion approximation to the radiative transport equation is valid when
(12)
and due to the anisotropic nature of light scattering, has been observed to be accurateapproximately when
(13)
where ρ describes the distance from collimated sources. Depending on the measurementtechnique (modality, geometry, calibration method, etc.) and metric of accuracy chosen, thepractical minimum limit of ρ is approximately in the range of 3l* to 4l* (Refs. 17 and 18). Thespatial frequency analog of the transport length l* is the transport spatial frequency, exactlyequal to the transport spatial frequency (or transport coefficient), μtr=fx,tr=(ktr/2π). If we relatethe inverse of ρ as a metric of spatial frequency, then Eq. (13) can be restated as
(14)
We therefore expect the maximum spatial frequency accurately predicted by diffusion to be inthe range of 1/(3l*) to 1/(4l*), or 0.25μtr to 0.33μtr. Both albedo and source-distance
requirements of the diffusion approximation limit the ratio to be much less than one.In the following sections, we will highlight the quantitative power of this SFD diffusion modelthrough (1) comparison to Monte Carlo simulations and (2) empirical demonstration ofmeasurement accuracy in turbid phantom systems.
3.2 Monte Carlo Simulation in the SFDAlthough more computationally intensive, it is desirable to have a forward model in the SFDthat is valid for a greater range of both albedo and spatial frequency. A few transport-basedapproaches are available, including both direct numerical solution of the radiative transportequation19,20 and Monte Carlo simulation.21,22 For this paper, we have used “White” MonteCarlo (WMC) simulations23,24 of a collimated point-source illumination to generatepredictions of the spatially resolved, steady-state diffuse reflectance, Rd(ρ), for a given set ofoptical properties μa, μs, and g. This spatial point-spread function, provides an impulseresponse, and spatial frequency domain predictions of diffuse reflectance, Rd(k), are found byFourier transformation of Rd(ρ). For a radially symmetric function such as Rd(ρ), the 2-DFourier transform in the x-y plane reduces to a 1-D Hankel transform of order zero:
Cuccia et al. Page 6
J Biomed Opt. Author manuscript; available in PMC 2010 May 12.
NIH
-PA Author Manuscript
NIH
-PA Author Manuscript
NIH
-PA Author Manuscript

(15)
where J0(kr) is the zeroth-order Bessel function of the first kind. In our simulations, we binρ in n finite intervals Δρi. We can then calculate Rd(k) as
(16)
In this paper, we generated the WMC data using 107 photons, a detector numerical aperture of0.22. For all simulations, the index of refraction n and anisotropy factor g were set to 1.33 and0.71, respectively, for direct comparison with our Liposyn phantom experiments. All radialbins had a spacing of Δρ=0.09 mm, making the maximum spatial frequency greater than 5mm−1.
3.3 SimulationsDiffuse reflectance versus spatial frequency (mm−1), predicted by both the standard diffusionapproximation (dashed lines) and Monte Carlo simulations (solid lines), is plotted in Fig. 4
(top) for varying values of l*, at a constant ratio (constant a′=0.99). Observe thatas l* increases (or as μtr decreases), the diffuse MTF is rescaled toward lower spatialfrequencies, indicating that less high-frequency content is preserved. This scaling with l* isconsistent with our experience that high-scattering samples can retain very sharp (high-frequency) reflectance features. For example, reflectance from a point illumination is morelocalized in a high-scattering medium (like Spectralon, for instance), compared to a lowerscattering medium (like in vivo tissue). Moreover, the frequency scaling of Rd(fx) varies directly
with μtr, or inversely with l*. This scaling of μtr and fx is directly evident in the ratioof Eq. (11) (diffusion approximation), and thus all five diffusion curves will coincide perfectlyif plotted versus normalized spatial frequency, (fx/fx,tr)=(fx/μtr)=(fx·l*). This behavior is alsoretained in our Monte Carlo predictions to a high degree of accuracy. For instance, when plottedversus (fx/fx,tr) (not shown), all five transport-based MTF curves fall within approximately 1%of each other, and this difference decreases further as the albedo is lowered. For all followingsimulations, therefore, we will plot the reflectance versus normalized spatial frequency, (fx/fx,tr). Conveniently, μtr=1 mm−1 (l*=1 mm) is a good approximate transport coefficient formany biological tissues, so for the high-albedo curves, fx,tr can be interpreted as ~1 mm−1
spatial frequency (1-mm-spaced sinusoids).
Visual comparison of diffusion and Monte Carlo reflectance curves reveals that the diffusionsolution slightly overestimates low-frequency components and underestimates the high-frequency components of the reflectance. This is partially due to our choice of a simple, mono-exponential extended source function [Eq. (6)]. Analytical solutions that preserve higher orderspatial moments of the source are available25–27 and will be examined in future work. Definingdiffusion error as the percent difference of the diffusion prediction from Monte Carlo, we
observe (for the case of ) a diffusion error of ±12% for fx≤(2l*)−1=0.5μtr.
In Fig. 4(b), we further examine our transport and diffusion models when the albedo is
decreased, ranging the ratio from 30 (light gray lines) to 3 (black lines). Here, we plotthe diffuse reflectance (top) and the diffusion error (middle) versus normalized spatialfrequency, fx,tr. Again, diffusion overestimates reflectance at low spatial frequencies and
Cuccia et al. Page 7
J Biomed Opt. Author manuscript; available in PMC 2010 May 12.
NIH
-PA Author Manuscript
NIH
-PA Author Manuscript
NIH
-PA Author Manuscript

underestimates reflectance at high frequencies. Furthermore, all diffusion lines seem toconverge at high frequency (fx/fx,tr≈1), while an absolute offset between curves remains in thetransport prediction.
For low frequencies (below ~0.5·μtr), the diffusion error remains less than ±16% at
(a′=0.97). For the lower albedo curves, we see that the absolute diffusionpredictions are inaccurate, positively and negatively biased at low and high frequencies,respectively. In a real measurement, however, we always use a reference calibration sample(with known optical properties) to correct for these types of offsets. (See Sec. 3.4 for a detaileddescription of our calibration method.) We simulated this calibration procedure by generatingforward Monte Carlo measurement data for both sample and calibration. The resultingdiffusion error (not shown) using calibrated measurements of samples within ±25% of the
reference phantom exhibits a dramatic improvement in the shape and accuracy ofmeasured data, reducing and flattening the diffusion error compared to the original “absolute”
offsets. Specifically, we observe <10% error down to for all frequencies. This resultsuggests that one can still achieve quantitatively accurate results through measurementcalibration with a reference phantom of similar albedo.
3.4 Illumination, Imaging, and CalibrationThe diffuse MTF of a turbid system can be measured in a transmission or reflection geometry.In practice, the illumination must be a superposition of AC (spatially modulated) and DC(planar) reflectance terms (i.e., we cannot illuminate with a negative scalar intensity). Wetherefore illuminate the sample with a spatial pattern of the form:
(17)
where S0, M0, fx, and a are the illumination source intensity, modulation depth, spatialfrequency, and spatial phase, respectively. In this simple case, the pattern is constant in theorthogonal y direction. In reflection mode, the diffusely reflected intensity, I, is a sum of ACand DC components:
(18)
where the measured AC component of the reflected intensity, IAC, can be modeled as:
(19)
Here, MAC(x, fx) represents the amplitude envelope of the reflected photon density standingwave at frequency fx. Note first that an MAC can be a function of position, x, as shown in Fig.5 (top). Additionally, multiple MAC(x, fx) curves can be sampled in parallel at each y pixel rowusing a 2-D camera, allowing spatial sampling of millions of reflectance values simultaneously.
A host of signal processing schemes can be used to obtain MAC(x, fx). Here, we employ a simpletime-domain amplitude demodulation method,8,28 illuminating a sinusoid pattern three timesat the same spatial frequency, with phase offsets a=0, 2/3π, and 4/3π radians. MAC(x, fx) canthen be calculated algebraically at each spatial location, xi, by:
Cuccia et al. Page 8
J Biomed Opt. Author manuscript; available in PMC 2010 May 12.
NIH
-PA Author Manuscript
NIH
-PA Author Manuscript
NIH
-PA Author Manuscript

(20)
where I1, I2, and I3 represent the IAC image values at each location with shifted spatial phases.This differencing approach is convenient, as (1) it automatically removes features common toall three images, including the average image noise and digitization offset, and (2) it does notrequire knowledge of the spatial frequency, removing potential spatial calibration errors. Builtin to this operation is an automatic subtraction of any constant ambient light present in eachacquired image. The spatially varying DC amplitude, MDC(x), can be calculated as earlier withfx=0, or at any frequency of illumination using:
(21)
In Fig. 5, we show a schematic of a spatially varying modulated reflectance (top) and itsdemodulated AC and DC amplitude (bottom) components.
In the frequency domain, a measurement MAC(fx) is the product of (1) the source intensity,I0; (2) the MTF of the illumination and imaging optical system, MTFsystem; and (3) the trueturbid system MTF, Rd:
(22)
Therefore, we can simultaneously calibrate for the absolute intensity of the source and the MTFof the imaging system by performing a reference measurement, MAC,ref(x, fx), on a turbidphantom of known optical properties. Using a model prediction for the phantom diffusereflectance, Rd,ref,pred(fx), we can write the diffuse reflectance at each spatial location as:
(23)
This direct division-based correction for the system frequency response is an advantage of SFDmeasurement over other spatially resolved measurements, avoiding system PSF deconvolutionin the real spatial domain, which can amplify measurement noise and uncertainties. Ideally,the surface contours of the sample and the phantom should be identical or be compensatednumerically using surface profilometry.29
Last, for a given modulation frequency, there are two unknowns in Eq. (10): μa and . Weshow here how measurements at as few as two spatial frequencies can be used to separateabsorption and scattering. This is best visualized in a lookup table such as the one shown inFig. 6, where Rd(DC) and Rd(AC) correspond to diffuse reflectance measurements at zero andnonzero spatial frequencies f1 and f2, respectively. Gray and black contours correspond toconstant absorption and reduced scattering, respectively. As a visual example, the dotted linesin Fig. 6 show that if Rd(0 mm−1)=0.55 and Rd(0.5 mm−1)=0.06, then μa≈0.03 and
, respectively. Notice the strongly orthogonal relationship between theabsorption and scattering contour lines, indicating the ability to separate absorption andscattering values with maximal sensitivity. This is due to the large frequency range spannedby 0 mm−1 and 0.5 mm−1 (DC and AC) frequencies. Correspondingly, as the x- and y-axis
Cuccia et al. Page 9
J Biomed Opt. Author manuscript; available in PMC 2010 May 12.
NIH
-PA Author Manuscript
NIH
-PA Author Manuscript
NIH
-PA Author Manuscript

frequencies become closer to one another, these lines will become less orthogonal, andinversion coupling between absorption and scattering will increase. Last, both AC and DCmeasurements can be easily obtained with only three phase projections of a single illuminationfrequency [through Eqs. (20) and (21)], allowing rapid, high-resolution imaging of absorptionand scattering contrast.
3.5 Inversion MethodsWe use two inversion methods to calculate the absorption and reduced scattering frommeasurements of diffuse reflectance. First we use a “sweep” in spatial frequency space,analogous to the broadband frequency domain photon migration (FDPM) approach,30
producing an overdetermined set of measurements that can be fit to Eq. (10) via least-squaresminimization. Second, we use a rapid two-frequency lookup table method, introduced in theprevious paragraph, which uses cubic spline interpolation (the “griddata” method inMATLAB) of forward-model data at two spatial frequencies. On typical personal computers,this method is capable of millions of lookup calculations per second. In this initial work, weinvert MTF measurements at each spatial location independently with our spatiallyhomogeneous planar model. We acknowledge that while accurate for homogeneous media,this approach ignores any transverse or depth-resolved transport phenomena. We thereforeexpect significant partial volume effects in the recovered data in regions where the opticalproperties are spatially varying. For the remainder of this paper, we discuss optical propertymaps in terms of qualitative optical property contrast, in comparison to quantitative opticalproperties when measuring large spatially homogenous regions. In Sec. 5.4, we investigatefurther the resolution limits and partial volume effects of absorption and scattering contrast inthe axial and transverse directions. For lateral step-function changes in optical properties, wefind that measurements transition spatially between two quantitatively accurate values with asigmoidal-like transition region.
Figure 7 visually depicts the entire data-mining process using the in vivo forearm data describedin Sec. 4.2. Intensity data at each frequency (three phase images per frequency) aredemodulated, calibrated, and fit using Eqs. (20), (23), and (10), respectively. Data are processedseparately for each pixel, generating spatial maps of absorption and scattering opticalproperties.
Compared to other spatially resolved methods, MI acquires coincident, axial “projection”measurements of optical contrast to quantify the optical properties at each x–y spatial position,allowing a robust measurement of the average properties. Compared to “point” illuminationmeasurements, MI samples only the low spatial frequency moments of the transfer function.These low frequencies (< 1 mm−1) are sufficient for separating the absorption from thescattering optical properties, reducing sensitivity to uncertainty inherent in measuring high-frequency spatial moments (i.e., reflectance close to the source).
4 Methods4.1 Phantom Experiments
We performed a set of experiments to characterize the precision and accuracy of MI formeasuring the homogeneous absorption and reduced scattering optical properties. Sixteenturbid phantoms were constructed using a single batch of Liposyn lipid emulsion and water-soluble nigrosin dye stock solutions for the scattering and absorbing properties, respectively.In the first eight phantoms, we varied the absorption coefficient, μa, over two orders ofmagnitude (logarithmically spaced between 0.002 mm−1≤μa≤0.12 mm−1), with a constant
scattering coefficient constant at . In the second set, we linearly varied
Cuccia et al. Page 10
J Biomed Opt. Author manuscript; available in PMC 2010 May 12.
NIH
-PA Author Manuscript
NIH
-PA Author Manuscript
NIH
-PA Author Manuscript
, while holding the absorption coefficient constant atμa=0.0046 mm−1. These values were calculated based on infinite-geometry, multifrequency(50 to 500 MHz), multidistance (10 to 25 mm) frequency-domain photon migrationmeasurements15 of one of the Liposyn/nigrosin phantoms.
MI measurements were performed on each sample. Thirty spatial frequencies of illuminationwere chosen between 0 mm−1 and 0.13 mm−1, corresponding to a total of 90 images perphantom (three spatial phases per frequency). The interfrequency spacing was chosen toaccurately capture the MTF curvature of all phantoms, with finer spacing at low frequenciesand coarser spacing at high frequencies, accordingly. All measurements were taken at 660 nmwith an approximate 75×75 mm illumination area, a 50×50 mm camera field of view, and anintegration time of 100 ms. The individual phantoms were measured in a randomized order,and measurements were repeated three times to allow for statistical averaging.
Modulation images of the AC reflectance were obtained at each frequency using Eq. (20). Atfull CCD resolution, the pixel-by-pixel demodulation approach results in approximately250,000 separate measurements of reflectance per spatial frequency, highlighting the statisticalpower of the technique. As the lipid solutions were expected to be highly homogeneous, 20×20pixel binning was performed on each image to speed computation, resulting in low-resolution,15×15 pixel modulation images. The resulting 30 images provide a quantitative AC amplitudemeasurement at each of 100 spatial locations within the field of view. For calibration, a singlephantom from the entire set of 16 was chosen as the reference (second-lowest absorptionphantom). Using the reference’s known optical properties (determined from infinite-geometryFDPM measurements), we calculate a model-based prediction for the reflectance,Rd,ref,pred(fx). Then, for each spatial frequency and each spatial location, we use Eq. (23) tocalculate Rd(fx) of the sample. Having retained some low-resolution spatial data, we cancalculate a standard deviation of recovered values within an image as an indicator ofmeasurement precision.
The diffusion model of Eq. (10) was used to solve for μa and using both least-squaresminimization by a simplex search algorithm (in “fminsearch” MATLAB) and via the two-frequency lookup table approach using the lowest (0 mm−1) and highest (0.13 mm−1) spatialfrequencies. For each phantom, each spatial sampling point was separately analyzed,generating images of recovered absorption and scattering values. As these were homogeneoussamples, a mean and a standard deviation were calculated to represent each optical propertyimage result, characterizing the accuracy and precision of MI, respectively.
4.2 In Vivo Human Forearm ExperimentsMI data were collected on a normal human forearm over a 72×48 mm field of view. Four evenlyspaced spatial frequencies between 0 and 0.15 mm−1 were collected and analyzed. The imagingsystem was identical to that described earlier, except for the inclusion of a 640±10 nm bandpassdetection filter and crossed linear polarizers, which reject specular reflection from roughsurfaces and maximize our sensitivity to the diffuse component of the light. In idealized liquidphantom experiments, we have performed measurements with and without crossed polarizersand found the difference in recovered optical properties to be typically less than 2 to 3%.
In order to demonstrate the sensitivity of our system to physiological perturbations, weperformed a standard venous occlusion study on a 29×40 mm region of the volar forearm.Measurements were performed at a wavelength of 800±10 nm, near the hemoglobin isosbesticpoint of 805 nm. Measured changes in absorption at this wavelength are insensitive tooxygenation and therefore reflect only that of total hemoglobin. Multifrequency reflectancedata at 0 and 0.135 mm−1 were acquired every 4 s for a period of 13 min. After 2.5 min of
Cuccia et al. Page 11
J Biomed Opt. Author manuscript; available in PMC 2010 May 12.
NIH
-PA Author Manuscript
NIH
-PA Author Manuscript
NIH
-PA Author Manuscript

baseline acquisition, an arm cuff was pressurized to 100 mm Hg for 6.5 min and subsequentlyreleased at minute 9.
5 Results and Discussion5.1 Phantom Experiment Results
The average measured diffuse reflectance versus spatial frequency is plotted in Fig. 8, showingthe absorption variation and scattering variation measurement sets in Figs. 8(a) and 8(b),respectively. In solid black lines, we show the corresponding fits using the diffusion-basedreflectance model [Eq. (10)].
The absorption experiment data demonstrate that increasing absorption causes a decrease inreflectance, with absorption contrast residing primarily in the low-frequency regime. (Noticethat all absorption curves converge at high frequency.) Conversely, the scattering data indicatethat increasing scattering causes an increase in reflectance amplitude and a res-caling to higherspatial frequencies (i.e., a decrease in l*), with contrast apparent at all spatial frequencies.
All model-based fits of Fig. 8 (solid lines) demonstrate excellent visual agreement with thedata, with typical errors less than 0.02. This is particularly satisfying, as all measurements werecalibrated with a single reference phantom (second-lowest absorption phantom). The largestmodel-data deviation appears in the high-frequency range of the lowest scattering phantom
. This seems consistent with the l* plots of Fig. 4, where we wouldexpect model breakdown at or before fx=1/(2l*), or 0.16 mm−1.
In Fig. 9, we plot on the left and right the recovered optical properties for absorption andscattering variation measurements, respectively. Multifrequency and two-frequency lookuptable interpolation results are shown in black and gray, respectively. For each set, the variedvalue is plotted versus the expected value on the horizontal axis, and the corresponding valueheld constant is shown below on a separate axis. Error bars indicate the corresponding standarddeviations of the recovered 15×15 pixel optical property maps (not shown). Thin black linesare drawn to indicate the expected values in each experiment.
In the absorption variation experiment, recovered versus expected absorption shows excellentlinearity over two orders of magnitude, ranging from high to low albedo
. When absorption is very small, a slight overestimation trend isobserved independent of calibration choice. This trend is discussed further in Sec. 5.2. Theexperiment’s recovered scattering values show less than 10% deviation from the expected valuein all cases. Similar linearity is observed in the scattering variation experiment, albeit withslightly more fluctuation. Absorption values in this case demonstrate less than 15% deviationfrom the expected value, except in the lowest scattering (largest l*) case. Standard deviationsof the recovered 15×15 pixel optical property maps are mostly less than 1% (maps not shown),indicating both high precision and spatial uniformity over the field of view.
In Table 1, we summarize the accuracy of all recovered values by showing the average percentdeviation for multifrequency and two-frequency lookup table inverse models. On average, wehave 6% and 3% deviation in absorption and reduced scattering, respectively. The two-frequency lookup table errors are generally comparable to those of the multifrequency method.In real-world measurements of spatially heterogeneous systems, we expect that multifrequencyfits will provide a more stable measure of the average optical properties. Nevertheless, insituations where speed and/or resolution is desired, this method shows promise to provide rapidfeedback while retaining quantitative accuracy.
Cuccia et al. Page 12
J Biomed Opt. Author manuscript; available in PMC 2010 May 12.
NIH
-PA Author Manuscript
NIH
-PA Author Manuscript
NIH
-PA Author Manuscript
5.2 Separation of Absorption and ScatteringIn our inverse fitting results, the largest errors were observed for the lowest values of absorptionand scattering. As a planar imaging modality, MI samples relatively superficial volumes andtherefore short photon paths losing sensitivity to low absorption and low scattering contrastwhere the length scales of photon interaction are very long. Furthermore, the finite size ofprojection and illumination set a physical limit on the low-frequency MTF sampling. Forinstance, in the absorption experiment, we observed an overestimation of the absorption whenabsorption was very low (0.002 mm−1). In this regime, both diffusion and Monte Carlo modelspredict the diffuse reflectance to have a steep, decreasing slope at low frequency. However,the lowest four experimental illumination frequencies (including fx=0) correspond to spatialperiods larger than the projector’s illumination area (fx<0.013 mm−1). As sampling theory inthis domain enforces a frequency bandwidth greater than the fundamental illuminationfrequency, we expect inaccuracy in these lowest frequency measures. Specifically, based onthe low-pass MTF shape of Rd, we expect amplitude underestimation, and therefore absorptionoverestimation, due to the high sensitivity of absorption at low frequencies. One strategy tosystematically account for this effect is to equivalently model an illumination with a finitespatial extent.
5.3 In Vivo Human Forearm ResultsIn Fig. 7 (middle), we showed diffuse reflectance images (Rd) versus spatial frequency (fx) forthe in vivo human forearm experiment. Notice the differential contrast in diffuse reflectanceas illumination frequency increases, forming the basis for separation of absorption andscattering. In addition, high frequencies will sample a more superficial region of the tissue,which is expected to have a lower contribution from deeper vascular features. In Fig. 10, wefurther show the recovered optical property maps after multifrequency MTF fitting at eachpixel. In Fig. 10(a), we show the calibrated diffuse reflectance at fx=0 mm−1, and in Fig. 10(d), the average multifrequency diffuse reflectance data (black squares) and fit (gray line). InFigs. 10(b) and 10(c), we show spatial maps of the absorption and reduced scattering data,respectively, and in Figs. 10(e) and 10(f), we show the corresponding pixel histograms,respectively. Absorption contrast from the underlying veins is the dominant feature in theoptical property maps. A vertical feature of lowered scattering appears in the middle of theimage. This feature is coincident with a large superficial tendon, which may be actingeffectively as a light guide due to its generally higher index compared to tissue matrix.31,32
Based on a diffusion-based sensitivity analysis, we predict for this experiment 1/e samplingdepths ranging from 2 mm to 3.3 mm for low (0 mm−1) and high (0.15 mm−1) spatialfrequencies, respectively.
In the absorption map, we identify with dotted lines a region of interest containing a prominentvein. In this region, we observe 100% contrast in the recovered absorption values over the vein(0.46 mm−1) compared to the background (0.23 mm−1); in the same region, optical scatteringshowed little contrast, with ~10% spatial variation. While these data show clear separation ofabsorption and scattering optical contrast, the values derived from a homogeneous modelexhibit partial volume effects that diminish the actual absorption contrast of the vein beneaththe surface. Our current homogeneous model of reflectance prevents absolute quantitation inthe presence of lateral and depth-dependent optical properties. In the next section, however,we attempt to empirically assess these partial volume effects through edge-responseexperiments in gelatin phantoms.
Venous occlusion measurements on the volar forearm are shown in Fig. 11 and demonstratethe accumulation and dissipation of blood volume via the absorption coefficient at 800 nm.Figure 11(a) shows the diffuse reflectance map (left) and optical absorption map (right)measured at the baseline. Two regions of interest were chosen to show both global changes
Cuccia et al. Page 13
J Biomed Opt. Author manuscript; available in PMC 2010 May 12.
NIH
-PA Author Manuscript
NIH
-PA Author Manuscript
NIH
-PA Author Manuscript

over the entire image (gray lines) and changes in region absent of any obvious large vessels(black lines), presumably containing only microvasculature. Region-wise average changes inoptical properties from the baseline are shown in Fig. 11(b). Absorption (top) and reducedscattering (bottom) are respectively plotted within 40% and 10% of the correspondingmeasured baseline values. As expected, the absorption in either region begins to increasesteadily after arm cuff pressurization at minute 2.5. After release of the cuff at 9 min, absorptiondecreases to the baseline over the course of approximately 2 min. Maximal increases inabsorption were observed to be approximately 0.012 mm−1 globally and 0.017 mm−1 in themicrovascular region, corresponding to approximate 15% and 28% increases from the baseline.The larger increase in absorption observed in the microvascular region may be explained bythe fact that the microvasculature is more susceptible to pooling, while the larger vessels areless reactive. Small fluctuations in the measured reduced scattering were observed to be <5%globally and <2% for the microvascular region.
5.4 Sensitivity, Contrast, and Resolution
Detecting changes in μa and requires the corresponding change in reflectance to be abovethe measurement noise floor. We examined how a homogeneous perturbation in opticalproperties gives rise to reflectance contrast at each spatial frequency using our Monte Carloforward model. This was done by taking a numerical derivative of reflectance with respect toa change in a given optical property, generated for normalized frequencies between 0 and 1.In Fig. 12, we show the change in diffuse reflectance (ΔRd) versus normalized spatial frequency
resulting from a 1% change in absorption or scattering, for sample ratios of 100 (blacklines) and 3 (gray lines). The solid and dashed lines denote the sensitivity to absorption andreduced scattering, respectively. (Note: We use a negative absorption perturbation and apositive scattering perturbation in order to produce reflectance contrast of the same polarity.)
The sensitivity profiles in Fig. 12 reveal how changes in absorption and scattering change thereflected light at each modulation frequency, indicating that absorption contrast is attenuatedmore rapidly with frequency compared to scattering. This difference is intuitive physically, ashigh-frequency illumination should sample only short path-length phenomena, losingsensitivity to long length-scale processes such as absorption. From the graph, we observe that1% change in absorption or scattering produces at most an approximate 0.3% change in Rd.We have added dotted lines to Fig. 12 to show the approximate corresponding camera detectionlimits with 12- and 14-bit intensity resolution (i.e., the detection limit for the physical contrast—actual detection limits will depend on the noise characteristics of the particular camera/
imaging system). The figure illustrates, for example, that with at fx/fx,tr=0.1, a 12-bit measurement can resolve (in intensity) a 1% change in scattering but not absorption, while
a 14-bit camera can resolve both. For , where optical properties are closer inmagnitude, this 12-bit absorption detection criterion occurs at a higher frequency of fx/fx,tr=0.3.
The intensity resolution of the measurement can be further improved through either spatialbinning or averaging multiple acquisitions. Imaging with a high-resolution camera, therefore,allows flexibility between spatial resolution and intensity (optical property) resolution. Sourcesof noise that may limit measurement precision and accuracy include light-source fluctuation(jitter), long-time source intensity stability, and spatial nonuniformity of the projection. In ourmeasurements, we approximate a source fluctuation of approximately 0.1% for 1-s integrationtimes. Both intensity stability (~10% decrease over 4h) and spatial nonuniformity (20%) werealso present but were corrected to first order by using periodic reflectance standardmeasurements and phantom calibration (see Sec. 3.4). In the case of our human forearm
Cuccia et al. Page 14
J Biomed Opt. Author manuscript; available in PMC 2010 May 12.
NIH
-PA Author Manuscript
NIH
-PA Author Manuscript
NIH
-PA Author Manuscript

measurements, the background ratio was approximately 100. In the vein region, weobserved absorption contrast that is clearly resolved by our CCD camera.
In order to further understand the lateral and depth-dependent partial volume effects, such asthose observed in the arm mapping experiments, we performed an exploratory contrast-resolution study using heterogeneous optical phantoms. Eight homogeneous gelatin phantomswere fabricated using nigrosin as the absorber and Liposyn as the scattering agent.Heterogeneous phantoms, shown in Fig. 13(a), were assembled by placing two gelatin slabsof differing optical properties adjacent to one another. Gelatin phantoms with a 300% step in
either absorption [Fig. 13(a), left; μa,left=0.01 mm−1, μa,right=0.03 mm−1; [ ]
or scattering [Fig. 13(a), right; μa,both=0.02 mm−1; , ] weremeasured at 660 nm both directly [Fig. 13(a), top] and through a 2-mm homogeneous layer
[Fig. 13(a), bottom] with optical properties μa=0.01 mm−1, . Both were calibrated
by a homogeneous phantom with optical properties μa=0.02 mm−1, . Nine spatialfrequencies between 0 mm−1 and 0.11 mm−1 were measured and used to calculate opticalproperty maps using least-squares regression to our diffusion reflectance model.
Recovered optical property spatial profiles were averaged over the vertical direction, shownin Fig. 13(b) for absorption (top) and scattering (bottom) media. The results reveal a diffuseedge-response function that is both depth and optical property dependent. For both absorptionand scattering experiments, we observe a degradation of spatial resolution and quantitativecontrast through the homogeneous layer (gray lines) compared to that at the surface (blacklines). Specifically, the measured contrast values through the homogeneous layer areapproximately 15% and 5% of those at the surface, for absorption and scattering, respectively.This level of absorption contrast is comparable with the measured arm vein absorption in Fig.10 (approximately 0.06 mm−1), which corresponds to approximately 18% of whole bloodabsorption (assuming 70% tissue oxygen saturation). We further observe that the spatialresolution of the recovered scattering maps is consistently better than that for absorption. Putdifferently, scattering profiles appear to preserve higher spatial frequencies than those ofabsorption. This property of the measured heterogeneous media is consistent with thehomogeneous phantom MTF results shown in Fig. 8, where we noted that absorption contrastappeared mainly at low frequencies, while scattering contrast appeared at all measuredfrequencies.
Defining spatial resolution as the distance at which the edge-response contrast is reduced by a90% (all reflectance contrast remained well above our system’s minimum intensity resolution),we determined the resolution of absorption and scattering contrast to be 0.3 mm and 0.05 mm,respectively, for surface perturbations, and 0.5 mm and 0.25 mm, respectively, forperturbations 2 mm beneath the surface. Although these changes exhibit characteristics thatsuggest the capability to resolve optical contrast on small spatial scales, actual performancewill also be dependent on illumination spatial frequency and system noise. In future work, weaim to perform more rigorous contrast-resolution analyses using heterogeneous computationalmodels and phantoms to determine quantitative resolution limits as a function of depth. Ingeneral, at a given depth, we expect the depth resolution to scale with the measurementprecision and number of frequencies (# of sources), and x-y resolution to scale with the numberof spatial sampling points (# of detectors).33
6 ConclusionWe have presented a theoretical framework and instrumental platform for SFD measurementin turbid media, compared analytic diffusion and Monte Carlo–based transport forward models,
Cuccia et al. Page 15
J Biomed Opt. Author manuscript; available in PMC 2010 May 12.
NIH
-PA Author Manuscript
NIH
-PA Author Manuscript
NIH
-PA Author Manuscript

and performed quantitative measurements of phantom systems and an in vivo human forearm.In the phantom validation measurements, we demonstrate excellent accuracy in opticalproperties (approximately 6% and 3% in absorption and reduced scattering, respectively) over
a wide range of l* values (0.5 mm to 3 mm) and ratios (8 to 500). In the in vivo forearmspatial mapping, we report both imaging of optical absorption and scattering contrast withmillimeter-scale resolution and dynamic imaging of physiological perturbations in bloodvolume due to venous occlusion.
A modulated imaging (MI) system can obtain quantitative optical properties in turbidhomogeneous systems and maps of optical property contrast in tissues with a noncontactreflectance measurement. This combination of advantages make it particularly suited toimaging of static and dynamic processes in in vivo biological tissues, particularly for the fieldmedical diagnostics. In ongoing studies, we are extending the method to multispectral imagingfor quantitative functional mapping of both intrinsic and extrinsic tissue chromophores andevaluating depth-resolved imaging models, including both multilayer and tomographicapproaches.
AcknowledgmentsWe would like to express our sincere gratitude to all the people who provided advice and assistance toward this work,including Sophie Chung, Carole Hayakawa, Andrea Bassi, Katya Bhan, and Jae Gwan Kim and for support from theLaser Microbeam and Medical Program (LAMMP), an NIH Biomedical Technology Resource, Grant No. P41-RR01192; the U.S. Air Force Office of Scientific Research, Medical Free-Electron Laser Program (F49620-00-2-0371and FA9550-04-1-0101); and the Beckman Foundation. Dr. Cuccia would also like to acknowledge support from theNSF Graduate Research Fellowship Program.
References1. Welch AJ, Yoon G, van Gemert MJ. Practical models for light distribution in laser-irradiated tissue.
Lasers Surg. Med 1987;6(6):488–493. [PubMed: 3573920]2. Yoo K, Alfano R. Determination of the scattering and absorption lengths from the temporal profile of
a backscattered pulse. Opt. Lett 1990;15(5):276–278. [PubMed: 19759781]3. O’Leary MA, Boas DA, Chance B, Yodh AG. Refraction of diffuse photon density waves. Phys. Rev.
Lett 1992;69(18):2658–2661. [PubMed: 10046551]4. Fishkin JB, Gratton E. Propagation of photon-density waves in strongly scattering media containing
an absorbing semi-infinite plane bounded by a straight edge. J. Opt. Soc. Am. A 1993;10(1):127–140.[PubMed: 8478741]
5. Svaasand LO, Spott T, Fishkin JB, Pham T, Tromberg BJ, Berns MW. Reflectance measurements oflayered media with diffuse photon-density waves: a potential tool for evaluating deep burns andsubcutaneous lesions. Phys. Med. Biol 1999;44(3):801–813. [PubMed: 10211811]
6. Bonner RF, Nossal N, Havlin S, Weiss GH. Model for photon migration in turbid biological media. J.Opt. Soc. Am. A 1987;4(3):423–432. [PubMed: 3572576]
7. Farrell TJ, Patterson MS, Wilson B. A diffusion theory model of spatially resolved, steady-state diffusereflectance for the noninvasive determination of tissue optical properties in vivo. Med. Phys 1992;19(4):879–888. [PubMed: 1518476]
8. Neil MAA, Juskaitis R, Wilson T. Method of obtaining optical sectioning by using structured light ina conventional microscope. Opt. Lett 1997;22(24):1905–1907. [PubMed: 18188403]
9. Dognitz N, Wagnieres G. Determination of tissue optical properties by steady-state spatial frequency-domain reflectometry. Lasers Med. Sci 1998;13:55–65.
10. Cuccia DJ, Bevilacqua F, Durkin AJ, Tromberg BJ. Modulated imaging: quantitative analysis andtomography of turbid media in the spatial-frequency domain. Opt. Lett 2005;30(11):1354–1356.[PubMed: 15981531]
11. Joshi A, Bangerth W, Sevick-Muraca E. Noncontact fluorescence optical tomography with scanningpatterned illumination. Opt. Express 2006;14:6516–6534. [PubMed: 19516829]
Cuccia et al. Page 16
J Biomed Opt. Author manuscript; available in PMC 2010 May 12.
NIH
-PA Author Manuscript
NIH
-PA Author Manuscript
NIH
-PA Author Manuscript

12. Patterson M, Chance B, Wilson B. Time-resolved reflectance and transmittance for the noninvasivemeasurement of tissue optical properties. Appl. Opt 1989;28:2331–2336.
13. Boas DA, O’Leary MA, Chance B, Yodh AG. Scattering of diffuse photon density waves by sphericalinhomogeneities within turbid media: analytic solution and applications. Proc. Natl. Acad. Sci. U.S.A1994;91(11):4887–4891. [PubMed: 8197151]
14. Li X, et al. Near-field diffraction tomography with diffuse photon density waves. Phys. Rev. E 2000;61(4 Pt B):4295–4309.
15. Haskell RC, Svaasand LO, Tsay TT, Feng TC, McAd-ams MS, Tromberg BJ. Boundary conditionsfor the diffusion equation in radiative transfer. J. Opt. Soc. Am. A 1994;11(10):2727–2741.
16. Bassi A, Cuccia DJ, Durkin AJ, Tromberg BJ. Spatial shift of spatially modulated light projected onturbid media. J. Opt. Soc. Am. A 2008;25(11):2833–2839.
17. Yoo KM, Liu F, Alfano RR. When does the diffusion approximation fail to describe photon transportin random media? Phys. Rev. Lett 1990;64(22):2647–2650. [PubMed: 10041774]
18. Fishkin JB, Fantini S, vandeVen MJ, Gratton E. Gigahertz photon density waves in a turbid medium:theory and experiments. Phys. Rev. E 1996;53(3):2307–2319.
19. Ishimaru, A. Wave Propagation and Scattering in Random Media. New York: IEEE Press; 1978.20. Kim AD. Transport theory for light propagation in biological tissue. J. Opt. Soc. Am. A 2004;21(5):
820–827.21. Jacques, SL.; Wang, L. Monte Carlo modeling of light transport in tissues. In: Welch, AJ.; van Gemert,
MJC., editors. Optical-Thermal Response of Laser-Irradiated Tissue. New York: Plenum; 1995. p.73-99.
22. Marquet P, Bevilacqua F, Depeursinge C, de Haller EB. Determination of reduced scattering andabsorption coefficients by a single charge-coupled-device array measurement. Part I: Comparisonbetween experiments and simulations. Opt. Eng 1995;34:2055–2063.
23. Kienle A, Patterson MA. Determination of the optical properties of turbid media from a single MonteCarlo simulation. Phys. Med. Biol 1996;41:2221–2227. [PubMed: 8912392]
24. Swartling J, Pifferi A, Enejder AM, Andersson-Engels A. Accelerated Monte Carlo models tosimulate fluorescence spectra from layered tissues. J. Opt. Soc. Am. A 2003;20(4):714–727.
25. Joseph JH, Wiscombe WJ, Weinman JA. Delta-Eddington approximation for radiative flux-transfer.J. Atmos. Sci 1976;33(12):2452–2459.
26. Spott T, Svaasand LO. Collimated light sources in the diffusion approximation. Appl. Opt 2000;39(34):6453–6465. [PubMed: 18354660]
27. Carp SA, Prahl SA, Venugopalan V. Radiative transport in the delta-P1 approximation: accuracy offluence rate and optical penetration depth predictions in turbid semi-infinite media. J. Biomed. Opt2004;9(3):632–647. [PubMed: 15189103]
28. Carlson, AB. Communication Systems. New York: McGraw-Hill; 1988.29. Gioux, S.; Mazhar, A.; Cuccia, D.; Durkin, A.; Tromberg, BJ.; Frangioni, JV. Frontiers in Optics
2008/Laser Science (LS) XXIV. Rochester, NY: OSA Technical Digest (CD), paper FWP2, OpticalSociety of America; 2008. Fluorescence lifetime and spatially modulated light for image-guidedsurgery (invited).
30. Pham T, Coquoz O, Fishkin JB, Anderson E, Tromberg BJ. A broad bandwidth frequency domaininstrument for quantitative tissue optical spectroscopy. Rev. Sci. Instrum 2000;7:2500–2513.
31. Vidal BC. The part played by the mucopolysaccharides in the form birefringence of the collogen.Protoplasma 1964;59:472–479.
32. Roth S, Freund I. Optical second-harmonic scattering in rat-tail tendon. Biopolymers 1981;20(6):1271–1290. [PubMed: 7284569]
33. Markel VA, Schotland JC. Symmetries, inversion formulas, and image reconstruction for opticaltomography. Phys. Rev. E 2004;70(5 Pt 2):056616.
Cuccia et al. Page 17
J Biomed Opt. Author manuscript; available in PMC 2010 May 12.
NIH
-PA Author Manuscript
NIH
-PA Author Manuscript
NIH
-PA Author Manuscript

Fig. 1.Four measurement domains of turbid media characterization: time domain (top left), timefrequency domain (bottom left), real spatial domain (top right), and spatial frequency domain(bottom right).
Cuccia et al. Page 18
J Biomed Opt. Author manuscript; available in PMC 2010 May 12.
NIH
-PA Author Manuscript
NIH
-PA Author Manuscript
NIH
-PA Author Manuscript

Fig. 2.Modulated imaging instrument platform.
Cuccia et al. Page 19
J Biomed Opt. Author manuscript; available in PMC 2010 May 12.
NIH
-PA Author Manuscript
NIH
-PA Author Manuscript
NIH
-PA Author Manuscript

Fig. 3.Schematic of modulated illumination source (in the x direction only) and the resultingmodulated internal fluence rate with the same frequency and phase.
Cuccia et al. Page 20
J Biomed Opt. Author manuscript; available in PMC 2010 May 12.
NIH
-PA Author Manuscript
NIH
-PA Author Manuscript
NIH
-PA Author Manuscript
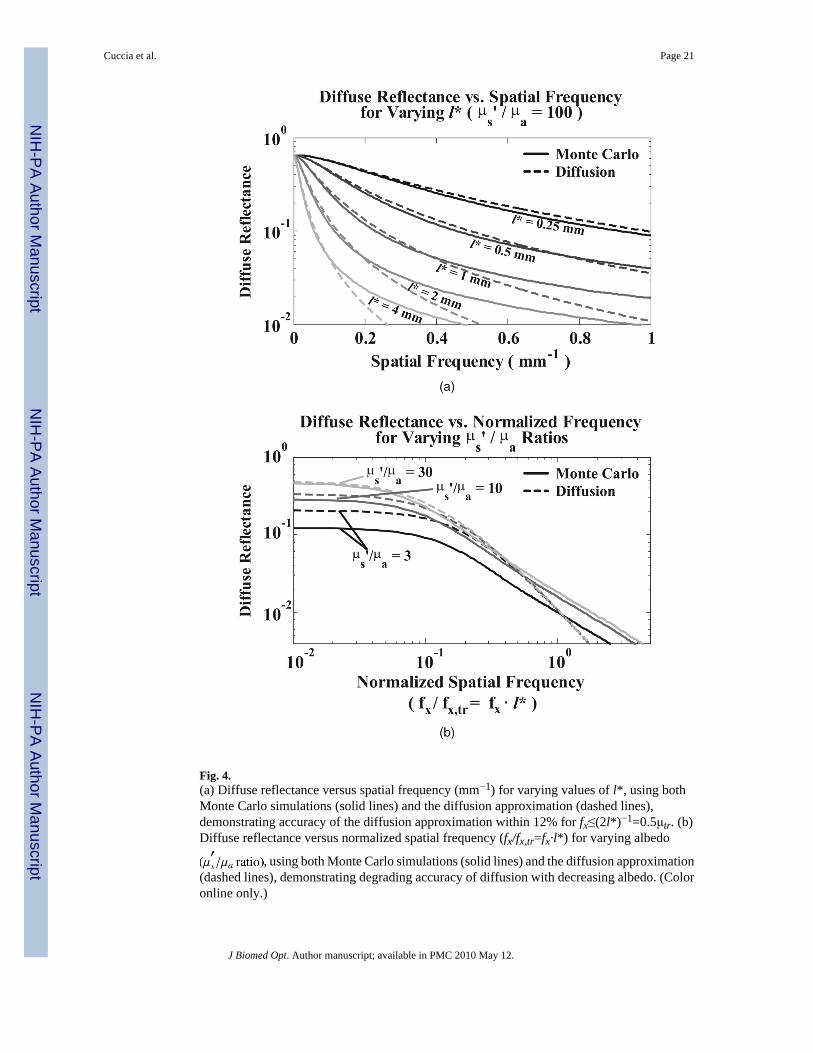
Fig. 4.(a) Diffuse reflectance versus spatial frequency (mm−1) for varying values of l*, using bothMonte Carlo simulations (solid lines) and the diffusion approximation (dashed lines),demonstrating accuracy of the diffusion approximation within 12% for fx≤(2l*)−1=0.5μtr. (b)Diffuse reflectance versus normalized spatial frequency (fx/fx,tr=fx·l*) for varying albedo
, using both Monte Carlo simulations (solid lines) and the diffusion approximation(dashed lines), demonstrating degrading accuracy of diffusion with decreasing albedo. (Coloronline only.)
Cuccia et al. Page 21
J Biomed Opt. Author manuscript; available in PMC 2010 May 12.
NIH
-PA Author Manuscript
NIH
-PA Author Manuscript
NIH
-PA Author Manuscript

Fig. 5.(a) Schematic of modulated reflectance and (b) demodulated AC and DC amplitudes.
Cuccia et al. Page 22
J Biomed Opt. Author manuscript; available in PMC 2010 May 12.
NIH
-PA Author Manuscript
NIH
-PA Author Manuscript
NIH
-PA Author Manuscript

Fig. 6.Two-frequency (DC versus AC) lookup table for rapid calculation of optical properties,generated from diffusion model forward predictions. Gray contours indicate constantabsorption, black contours indicate constant reduced scattering. Dotted lines demonstrate the
lookup method, translating DC and AC values into μa and parameters.
Cuccia et al. Page 23
J Biomed Opt. Author manuscript; available in PMC 2010 May 12.
NIH
-PA Author Manuscript
NIH
-PA Author Manuscript
NIH
-PA Author Manuscript

Fig. 7.Flow chart of MI data processing. Intensity data at each frequency (three phase images perfrequency) are demodulated, calibrated, and fit using Eqs. (20), (23), and (10), respectively.Data are processed separately for each pixel, generating spatial maps of optical properties.Images are plotted within three standard deviations of the individual image mean in order tomake them visually comparable. Notice the differential contrast in diffuse reflectance (Rd)versus spatial frequency (fx), the basis for separation absorption and scattering.
Cuccia et al. Page 24
J Biomed Opt. Author manuscript; available in PMC 2010 May 12.
NIH
-PA Author Manuscript
NIH
-PA Author Manuscript
NIH
-PA Author Manuscript

Fig. 8.Liposyn experiment data (black circles) fit to the SFD diffusion model of Eq. (10) (gray lines).(a) As absorption increases, reflectance at low spatial frequencies decreases dramatically, whilehigh-frequency data shows little sensitivity to absorption contrast. (b) Increasing scatteringgives rise to an increase in reflectance, with scattering contrast observed at all frequencies. Allresults show excellent visual agreement between measurement data and diffusion fits.
Cuccia et al. Page 25
J Biomed Opt. Author manuscript; available in PMC 2010 May 12.
NIH
-PA Author Manuscript
NIH
-PA Author Manuscript
NIH
-PA Author Manuscript

Fig. 9.(a) Recovered versus expected optical properties for (a) absorption variation and (b) scatteringvariation experiments, using both multifrequency (black lines) and 2-frequency lookup table(gray lines) fitting methods. (c) and (d) The corresponding recovered “constant” values forreduced scattering and absorption are shown respectively. Error bars indicate the correspondingstandard deviations of 15×15 pixel optical property maps (generally <1%), indicating both highprecision and spatial uniformity over the field of view. Thin black lines indicate the expectedvalues in each experiment. Circles indicate the phantom used for calibration.
Cuccia et al. Page 26
J Biomed Opt. Author manuscript; available in PMC 2010 May 12.
NIH
-PA Author Manuscript
NIH
-PA Author Manuscript
NIH
-PA Author Manuscript

Fig. 10.(a) Planar diffuse reflectance, (b) optical absorption, and (c) reduced scattering maps. (d)Average multifrequency diffuse reflectance data and least-squares fit to Eq. (10) and pixelhistograms of (e) absorption and (f) scattering maps, respectively.
Cuccia et al. Page 27
J Biomed Opt. Author manuscript; available in PMC 2010 May 12.
NIH
-PA Author Manuscript
NIH
-PA Author Manuscript
NIH
-PA Author Manuscript

Fig. 11.Venous occlusion data of the volar forearm measurement at 800 nm. (a) Diffuse reflectancemap (left) and optical absorption map (right) measured at the baseline. Dotted lines in thereflectance map indicate the regions of interest for time-course analysis. (b) Region-wiseaverage changes in optical absorption (top) and reduced scattering (bottom) are shown for thewhole image field (gray lines) and a region absent of any obvious large vessels (black lines).The larger increase in absorption observed in the microvascular region may be explained bythe fact that the microvasculature is more susceptible to pooling, while the larger vessels areless reactive. (Color online only.)
Cuccia et al. Page 28
J Biomed Opt. Author manuscript; available in PMC 2010 May 12.
NIH
-PA Author Manuscript
NIH
-PA Author Manuscript
NIH
-PA Author Manuscript

Fig. 12.Sensitivity of reflectance to 1% change in optical properties for absorption (solid lines) andreduced scattering (dashed lines) optical properties versus normalized spatial frequency.Results indicate that scattering contrast is retained at higher frequencies than absorptioncontrast. Dotted lines indicate detection thresholds for 12- and 14-bit dynamic rangemeasurements.
Cuccia et al. Page 29
J Biomed Opt. Author manuscript; available in PMC 2010 May 12.
NIH
-PA Author Manuscript
NIH
-PA Author Manuscript
NIH
-PA Author Manuscript

Fig. 13.Preliminary contrast-resolution study. (a) Gelatin phantoms with a 3× step in either absorption(left) or scattering (right) were measured directly (top) and through a 2-mm homogeneous layer(bottom). (b) Edge-response profiles for absorption (top) and scattering (bottom) media revealloss of both resolution and quantitative contrast through the homogeneous layer (gray lines)compared to that at the surface (black lines).
Cuccia et al. Page 30
J Biomed Opt. Author manuscript; available in PMC 2010 May 12.
NIH
-PA Author Manuscript
NIH
-PA Author Manuscript
NIH
-PA Author Manuscript

NIH
-PA Author Manuscript
NIH
-PA Author Manuscript
NIH
-PA Author Manuscript
Cuccia et al. Page 31
Tabl
e 1
Sum
mar
y of
reco
vere
d av
erag
e opt
ical
pro
perti
es fo
r abs
orpt
ion
and
scat
terin
g va
riatio
n ex
perim
ents
. Ove
rall
accu
raci
es o
f rec
over
ed ab
sorp
tion
and
redu
ced
scat
terin
g pa
ram
eter
s are
app
roxi
mat
ely
6% a
nd 3
%, r
espe
ctiv
ely.
Abs
orpt
ion
expe
rim
ent
Scat
teri
ng e
xper
imen
t
Ave
rage
err
or(%
)30
-freq
uenc
y fit
2-fr
eque
ncy
fitA
vera
ge e
rror
(%)
30-fr
eque
ncy
fit2-
freq
uenc
y fit
μ a e
rror
4.74
4.85
μ a e
rror
7.51
11.4
μ s′ err
or2.
982.
29μ s′ e
rror
3.05
10.2
J Biomed Opt. Author manuscript; available in PMC 2010 May 12.

![Identification and quantitation of benzo[a]pyrene-DNA adducts formed in mouse skin](https://static.fdokumen.com/doc/165x107/6333eb3bb94d623842027004/identification-and-quantitation-of-benzoapyrene-dna-adducts-formed-in-mouse-skin.jpg)