
Spatially distributed stocks, deterministic evolution, and ecological balance
Upload
khangminh22Category
view
0download
0
energies
Article
Deterministic vs. Random Modulated Interference on G3 PowerLine Communication
Waseem El Sayed 1,2,* , Piotr Lezynski 1 , Robert Smolenski 1 , Amr Madi 1,2 , Marcin Pazera 3
and Adam Kempski 1
�����������������
Citation: Sayed, W.E.; Lezynski, P.;
Smolenski, R.; Madi, A.; Pazera, M.;
Kempski, A. Deterministic vs.
Random Modulated Interference on
G3 Power Line Communication.
Energies 2021, 14, 3257. https://
doi.org/10.3390/en14113257
Academic Editor: Acha-Daza Enrique
Received: 15 April 2021
Accepted: 31 May 2021
Published: 2 June 2021
Publisher’s Note: MDPI stays neutral
with regard to jurisdictional claims in
published maps and institutional affil-
iations.
Copyright: © 2021 by the authors.
Licensee MDPI, Basel, Switzerland.
This article is an open access article
distributed under the terms and
conditions of the Creative Commons
Attribution (CC BY) license (https://
creativecommons.org/licenses/by/
4.0/).
1 Institute of Automatics, Electronics and Electrical Engineering, The University of Zielona Gora,65-417 Zielona Gora, Poland; [email protected] (P.L.); [email protected] (R.S.);[email protected] (A.M.); [email protected] (A.K.)
2 Marine Engineering Technology Department, College of Maritime Transport and Technology,Arab Academy for Science and Technology and Maritime Transport, P.O. Box 1029, Abou Keer Campus,Alexandria 21500, Egypt
3 Institute of Control and Computation Engineering, The University of Zielona Gora,65-417 Zielona Gora, Poland; [email protected]
* Correspondence: [email protected]
Abstract: Power line communication (PLC), which is often used in advanced metering infrastructure(AMI), may be disturbed by adjacent high-power converters. Due to the inherent features of this typeof communication, classic methods of improving communication reliability (filtration and circuitseparation) cannot be fully applied. Information coding (modulation) methods are used in PLC toincrease the data transfer rate and improve noise immunity. Random modulations (RanM) are usedin converters to lower emission levels. Therefore, we investigate how the converters’ modulationparameters and coding methods may affect PLC communication reliability in the paper. To this end,we employ an experimental approach. In particular, the analysis of the influence of deterministicmodulation (DetM) and (RanM) on the performance of narrowband G3-PLC is shown. We emulatedan actual situation where EMI generated by the DC/DC converter disturbed the PLC transmission.The experimental results show the transmission error rates for different operating scenarios. Thenatural (experimental) system results, due to the complexity of the disturbing signals, differ from theliterature data obtained by simulation for normalized signals.
Keywords: power line communication (PLC); electromagnetic interference (EMI); random modulation
1. Introduction
Power line communication (PLC) may be used in the smart grid, e.g., in meteringsystems [1] and industrial systems [2]. The PLC uses the existing power cables for datatransmission, which leads to reduced investment and maintenance costs. However, manyproblems can appear, especially in the PLC that works in the frequency band between2–150 kHz. Typically, the source of the problem is the high-level of electromagnetic interfer-ence (EMI). These EMI in the power grid are generated by energy receivers (electric drives,lighting, household appliances, and computers) [3] and renewable energy sources [4,5]. Inboth cases (energy consumption or generation), the sources of EMI are power electronicscircuits. The main reason is the fact that power electronics utilize a switching frequencythat may overlap with the PLC working frequency range [6,7]. Since the communicationsignals and disturbances generated by power electronic converters occur in the same fre-quency band, bandpass filters installed in communication devices cannot provide specificprotection. Thus, if the amplitude of a disturbance approaches a high enough level, com-munication errors occur [8]. The signal to noise ratio factor (SNR) usage is a commonapproach to the fast evaluation of transmission and its channel quality. However, the shapeand nature of the interference signals that do not affect SNR directly are also crucial fortheir impact on communication error rates.
Energies 2021, 14, 3257. https://doi.org/10.3390/en14113257 https://www.mdpi.com/journal/energies

Energies 2021, 14, 3257 2 of 14
In [9,10], the authors divided the PLC disturbing signals into four types: backgroundnoise, narrowband noise, periodic impulsive noise, and asynchronous noise. Communi-cation engineers typically test data transmission systems (also PLC) using standardizeddisturbing signals (white noise, periodic impulse noise, and narrowband noise). Informa-tion encoding methods are tested, e.g., BPSK, QPSK, and 8PSK, to improve data transferrates and immunity to disturbances [11]. However, the real signals are more complicatedand are a composite of these basic types [12]. Therefore, many researchers choose anexperimental approach by studying the impact of real sources (power electronic converters)on the operation of existing communication systems, specifically with the conventionaldeterministic modulation (DetM) [13–15]. In [13], where the communication data transmis-sion errors in the RS232 communication protocol were addressed based on the effect of thepower converter modulation, the study presents a mathematical model for estimating thepercentage of data transmission errors relative to the switching frequency. In [15], the studyaddressed the influence of power converter cables in the induction motor drive system onRS485 communication. The effect of the periodical pulse generated by a pulse generator onthe RS232 and RS485 using the mutual coupling between cables was addressed in [14].
On the other hand, many studies have been conducted on the application of therandomized PWM (RanM) techniques for EMI mitigation. Those randomized techniquesspread the power of the signal into a broad band of frequencies and change the shape ofthe interference spectrum [16–18]. As a result, the level of the spectrum is significantlyreduced. From the EMC point of view, utilization of a RanM is the right approach toreducing the EMI level below limits described in EMC standards [19]. However, lownumbers of studies have been conducted to check the practical effect of the RanM ontelecommunication devices [20,21]. Some studies confirm no difference between the DetMand RanM, especially in the uncoded communication systems, where the observed statisticsof communication error are comparable or inconclusive [13,21]. It has also been shownthat the reduction of the EMI level provided by randomly modulated converters resultsfrom the methodology of measurement. Changing the settings of the EMI receiver, onemay significantly change the level of the measured disturbances for pseudo-randomlymodulated converters [18]. The authors overviewed existing spread spectrum techniquesand evaluated these techniques in the class-D converter. Moreover, the authors notedthe impact of spectrum measurement on the results and the choice of spread spectrummodulation. Other studies confirm that the total power/energy of disturbances for RandMis the same as in DetM. By selecting the appropriate measurement parameters and spectrumaggregation, the exact measurements are obtained for RanM and DetM [22,23].
Considering state-of-the-art literature, the probability of data transmission error re-sulting from the interference between the power electronic device and the PLC is one ofthe critical factors conditioning reliable operation of a smart grid consisting of power elec-tronic interfaces and PLC-based AMI. The purpose of this paper is to answer an essentialquestion, i.e., what is the difference between the influence of the standard DetM and theRanM on the transmission reliability of narrowband G3-PLC? In the paper, a comparisonbetween the influence of DetM and RanM on the frame error rate in the G3-PLC systemhas been shown to an extent not previously presented in the literature. The article’s maincontribution is to show the differences between DetM and RanM regarding the impacton PLC communication systems that use advanced data encoding methods and inputselectivity. In addition, the article investigated the influence of data encoding methods onthe immunity to disturbances. The results may be surprising as the data are known fromthe literature so far are slightly different.
2. Random Modulation vs. Deterministic Modulation
Pulse width modulation (PWM) is commonly used to control a DC/DC converters.In the DetM strategy, the PWM signal is generated by comparing the reference value(related to a converters output voltage) with a carrier signal of fixed frequency. Threemain parameters can define the PWM signal: the period of the signal T (related to the

Energies 2021, 14, 3257 3 of 14
signal frequency f), the amplitude A, and the turn ON time of the signal α. The period Tremains constant with the time, as shown in Figure 1a. In the frequency domain, spectrallines occur at fixed frequencies related to the carrier frequency and multiples, as shownin Figure 1c. For RanM, some of the signal parameters change randomly, such as theswitching frequency or the duty cycle. In the RanM considered in the article, the carrierfrequency fn varies for every nth impulse (2) according to a driving signal Rn. The Rncould be sinusoidal function, triangle function, or randomized pulse amplitude modulated(PAM) function. Such RanM is called random carrier frequency Modulation with fixedduty cycle (RCFMFD). In this case, the period of the signal changes randomly, but the dutycycle remains constant with time, as shown in Figure 1b. The frequency and the duty cycleof the signal follow these equations:
fn = fPWM + ∆ f · Rn, Rn ε〈−0.5 : 0.5 〉 (1)
∆ f = fPWM · β, β ε 〈0.1 : 1 〉 (2)
where fPWM is the fundamental frequency of the randomized signal. β represents thespreading factor of the RanM signal, and Rn represents a uniform distribution of pseudo-random numbers generated between −0.5 and 0.5. This control approach provides theability of spectrum shaping according to the standard requirements. Other types of RanMtechniques are also investigated in literature [24,25]. In this paper, we utilize the RCFMFDas RanM technique for DC/DC converter due to the greatest impact on lowering the levelsof interferences [23].
Figure 1. The schematic view of signals (a) DetM in time domain, (b) RanM in time domain, and (c)both modulations in frequency domain.
3. Description of the G3-PLC Operation
In this research we focus on using the G3-PLC technology, which follows the EuropeanNorm (EN) 50065 that CENELEC established in 1992 [7]. The PLC works by modulatingthe carrier signal using M-ary Phase Shift Keying (M-PSK), which is a type of digitalmodulation scheme. Usually, the G3-PLC systems use one of three types of PSK: BinaryPSK (BPSK), Quad PSK (QPSK), and 8-PSK. The differences are due to the number ofsimultaneously coded states. The G3-PLC use the differential PSK (DPSK) in which inputinformation modulates the phase change, not the absolute value of the phase. After that,the data are distributed through multi-carrier frequencies using orthogonal frequencydivision multiplexing (OFDM) with the following physical layer (PHY) specificationsshown in Table 1 [26].

Energies 2021, 14, 3257 4 of 14
Table 1. G3-PLC specifications.
Specification G3-PLC
Frequency Range 35–91 kHzSampling Frequency fs 400 kHz
FFT size 256Length of Cyclic Prefix 30
Sub Carrier Spacing 1.5625 kHzNo. of Carriers Used 36
Max data Rate 33.4 kbpsModulation DBPSK, DQPSK, and D8PSK
Figure 2 shows the block diagram of the G3-PLC PHY layer. We can divide the PHYlayer of the G3-PLC system into three main elements:
Figure 2. The PHY layer of the G3-PLC system.
3.1. PLC Transmitter
The process of sending the data starts by getting digital information to be transmit-ted using the OFDM modulation technology. The result is a list of the amplitudes andphases that are distributed through a definite range of frequencies. After that, the dig-ital up-converter takes the digital signal from the OFDM and is multiplied by a carrierfrequency [26]. The transmitted signal is quantized using the digital-to-analog converter(D/A) inside the controller with a specific quantized step size according to the size of theD/A [27].
3.2. PLC Reciever
Demodulation of the received signal starts with passing the carrier signal througha coupling circuit to extract the PLC signal from the main grid power (220 V–50 Hz).After that, the analog signal is converted into a digital signal using an analog-to-digital(A/D) converter. Furthermore, a digital finite impulsive response (FIR) filter is used,followed by a digital down converter to extract the digital data from the carrier signal.Consequently, the data are demodulated and demapped to return to its digital binary form.
3.3. Channel
The PLC transmission channel practically represents power cables. The signal at-tenuates with the length of the line according to the properties of copper wires and theirinsulation. In the channel, the conducted electromagnetic disturbances interfere with thePLC signal through a coupling path, in addition to the additive white Gaussian noise(AWGN). The channel models are usually represented by their channel response func-tion H(f). Based on [11], the channel could be a flat channel, frequency selective channel,

Energies 2021, 14, 3257 5 of 14
or phase shift channel, according to the way that the FIR filter in the receiver recognizes it.This paper considers the coupling between the EMI disturbance and the G3-PLC throughthe mutual coupling between cables as introduced in the next section.
4. Proposed Experimental Setup
The proposed hardware setup is inspired by the EMI between power electronicsconverter and a smart meter utilizing the G3-PLC. Such a case is typical in the microgridenvironment, where renewable energy sources are installed in the same place as the smartmeter. The EMI may flow between both circuits due to the mutual coupling between circuitcables. The communication circuit consists of two G3-PLC modems representing the point-to-point communication between a specific transmitter and receiver. The circuit worksusing two Microchip ATPL360 PLC modems as shown in Figure 3, with both modemsbeing configured to work based on CENELEC-A standard frequency range and the G3-PLC mode. In addition, the line stabilization impedance network (LISN) and isolationtransformer are connected between the PLC circuit and the grid to isolate the outside EMInoise and make sure of the robustness of the results.
Figure 3. Connection diagram of the proposed experimental setup.
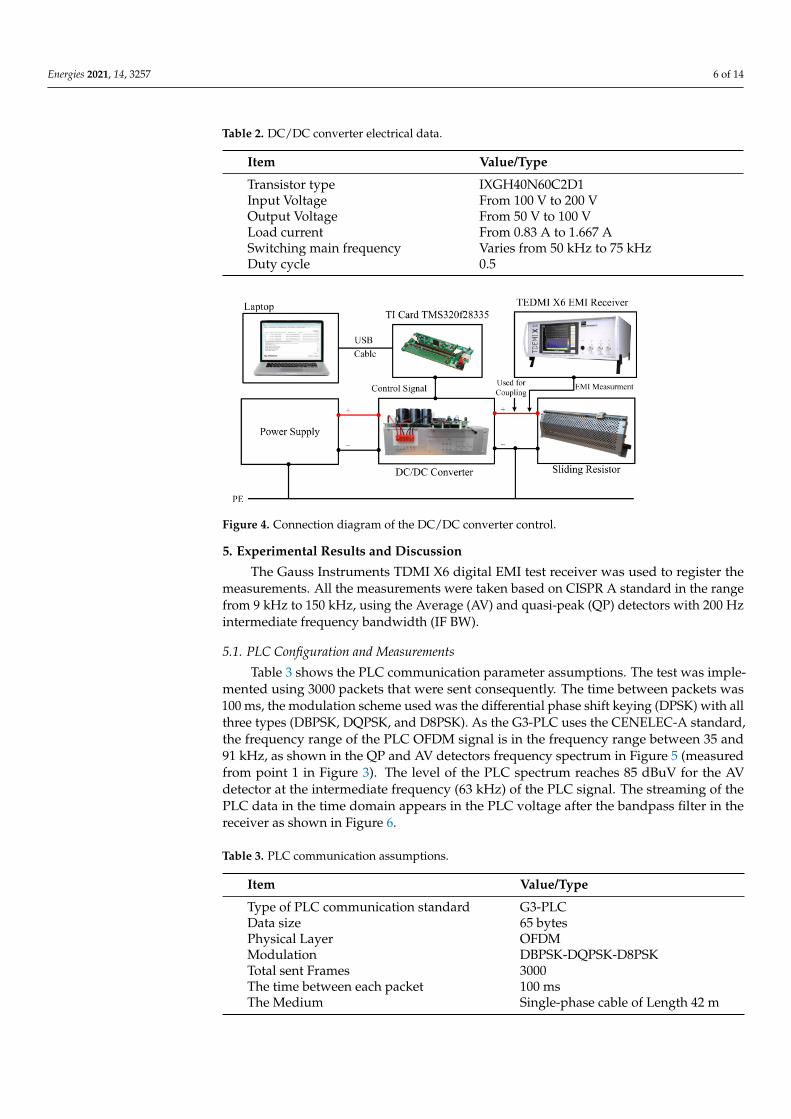
The EMI source is represented in the power connection between a DC/DC converterand the load. The load is connected to the converter using a cable of 42 m length, and thepositive line of the load is situated directly beside the PLC cables with the length as shownin Figure 3. The cable in the tests is a typical YDYp AKS 3 × 1.5 mm2 cable used indomestic installations. This connection is similar to the link in [14] and will cause theexistence of coupling between both circuits. The DC/DC converter was controlled usinga Texas Instrument TMS320F28335 digital signal processing card and was connected to avariable DC supply changing from 100 V to 200 V. Table 2 shows the electrical data for theconverter used in the setup. The DC/DC step-down converter topology was selected asan interference source due to its simple waveform of generated interference, which mightbe easily investigated. In the same context, the RanM driving signal parameters play animportant role in the shape of the generated EMI. The spreading factor of the used RanMis set at 0.4, which means that based on Equation (1), the frequency will vary around themain switching frequency between 0.8 fPWM kHz to 1.2 fPWM kHz. Figure 4 shows theconnection diagram of the proposed DC power circuit. In our implementation of the test inthe laboratory, we used a sliding resistor as the load. For both communication and powercircuits, we used copper cables of diameter 1.5 mm2.
Energies 2021, 14, 3257 6 of 14
Table 2. DC/DC converter electrical data.
Item Value/Type
Transistor type IXGH40N60C2D1Input Voltage From 100 V to 200 VOutput Voltage From 50 V to 100 VLoad current From 0.83 A to 1.667 ASwitching main frequency Varies from 50 kHz to 75 kHzDuty cycle 0.5
Figure 4. Connection diagram of the DC/DC converter control.
5. Experimental Results and Discussion
The Gauss Instruments TDMI X6 digital EMI test receiver was used to register themeasurements. All the measurements were taken based on CISPR A standard in the rangefrom 9 kHz to 150 kHz, using the Average (AV) and quasi-peak (QP) detectors with 200 Hzintermediate frequency bandwidth (IF BW).
5.1. PLC Configuration and Measurements
Table 3 shows the PLC communication parameter assumptions. The test was imple-mented using 3000 packets that were sent consequently. The time between packets was100 ms, the modulation scheme used was the differential phase shift keying (DPSK) with allthree types (DBPSK, DQPSK, and D8PSK). As the G3-PLC uses the CENELEC-A standard,the frequency range of the PLC OFDM signal is in the frequency range between 35 and91 kHz, as shown in the QP and AV detectors frequency spectrum in Figure 5 (measuredfrom point 1 in Figure 3). The level of the PLC spectrum reaches 85 dBuV for the AVdetector at the intermediate frequency (63 kHz) of the PLC signal. The streaming of thePLC data in the time domain appears in the PLC voltage after the bandpass filter in thereceiver as shown in Figure 6.
Table 3. PLC communication assumptions.
Item Value/Type
Type of PLC communication standard G3-PLCData size 65 bytesPhysical Layer OFDMModulation DBPSK-DQPSK-D8PSKTotal sent Frames 3000The time between each packet 100 msThe Medium Single-phase cable of Length 42 m

Energies 2021, 14, 3257 7 of 14
30 40 50 60 70 80 90 100 110Frequency [kHz]
40
50
60
70
80
90
100
Mag
nitu
de [
dBµV
]
QPAV
AV 85 dBuV
Figure 5. The spectrum of G3-PLC signal.
0 0.04 0.08 0.12 0.16 0.2Time (Sec)
-4
-3
-2
-1
0
1
2
3
4
Vol
tage
(V
olt)
T 0.16846
T 0.0606
Figure 6. G3-PLC signal in the time domain.
5.2. Deterministic and Random Configuration and Measurements
In this paper we consider two operating scenarios, one is the change in the amplitudeof the noise, the other is the change in the converter main switching frequency.
5.2.1. The Variation in the EMI Amplitude
The converters were programmed to work using a switching frequency of 63 kHz,equal to the intermediate frequency of the PLC OFDM signal. The selected frequency iswithin the typical operating frequency range of medium power converters. Figure 7 shows

Energies 2021, 14, 3257 8 of 14
the voltage spectrum measured directly from the load terminals in the case of DetM andRanM at 50 V and 100 V DC output voltages using the AV detector (measured from point 2in Figure 3). As shown in the figure, the difference between the output voltage spectrum inthe DetM and RanM at the fundamental frequency reaches almost 17 dB. The impact of theDC/DC converter output has its effect on the PLC circuit through the proposed couplingcircuit as shown in Figure 8. The figure shows the frequency spectrum of DetM and RanMin the case of an output voltage of 50 V and 100 V measured from the PLC side (from point1 in Figure 3) using an AV detector. The maximum magnitude of the spectrum (at the mainswitching frequency of the converter 63 kHz) reaches 81.6 dBuV for DetM and 63 dBuVfor RanM at 50 V output voltage, and it reaches 87.5 dBuV and 69 dBuV in case of 100 V.It was noticed that the difference between both output voltages is 6 dB in both cases ofmodulations at the main converter switching frequency. The difference between RanMand DetM also reaches 18.8 dB at the same point. The achieved disturbance levels in thenetwork are close to the limit levels, according to CISPR 11.
Figure 9 shows the percentage of data transmission error with the increase in theDC/DC converter output voltage ranging from 50 V to 100 V for the converter circuit in thecase of DetM and RanM, along with the change in the PLC modulation. The ratio betweenthe corrupted frames data to the sent data is calculated for every case to be the frame errorrate (FER) and is represented as a percentage and can be formulated as
FER =Broken Frames
Sent Frames× 100. (3)
The results show that data transmission FER increases with the increasing noise signalmagnitude. Moreover, both techniques have almost the same effect on the data transmis-sion streaming in all PLC modulation cases (DBPSK, DQOSK, and D8PSK). The differencebetween the DetM and RanM increases with the increase of the voltage magnitude, and themaximum difference reaches 5%. Table 4 shows the probability of G3-PLC data trans-mission FER, with the increase in output voltage for both modulations and various PLCmodulation techniques.
40 50 60 70 80 90 100 110Frequency [kHz]
40
60
80
100
120
140
160
Mag
nitu
de [
dBuV
]
DetM at 50 VRanM at 50 VDetM at 100 VRanM at 100 V
Figure 7. The frequency spectrum of DC/DC converter output at point 2 for DetM and RanM.

Energies 2021, 14, 3257 9 of 14
40 50 60 70 80 90 100 110Frequency [kHz]
30
40
50
60
70
80
90
Mag
nitu
de [
dBuV
]
DetM at 50 VRanM at 50 VDetM at 100 VRanM at 100 V
Figure 8. The frequency spectrum of DC/DC converter measured at grid terminal (point 1) for DetM and RanM.
(a) DBPSK
50 55 60 65 70 75 80 85 90 95 100Voltage [Volt]
0
10
20
30
40
FER
[%
]
DetM
RanM
(b) DQPSK
50 55 60 65 70 75 80 85 90 95 100Voltage [Volt]
0
10
20
30
40
FER
[%
]
DetM
RanM
(c) D8PSK
50 55 60 65 70 75 80 85 90 95 100Voltage [Volt]
0
10
20
30
40
FER
[%
]
DetM
RanM
Figure 9. The percentage FER for different output voltages and PLC modulation schemes in the case of using differentconverter modulations for DBPSK (a), DQPSK (b), D8PSK (c).

Energies 2021, 14, 3257 10 of 14
Table 4. The probability of data transmission error in the PLC with the increase in supply voltage.
FER (%) in the Case of DetM FER (%) in the Case of RanM
Volt dBuV DBPSK DQPSK D8PSK dBuV DBPSK DQPSK D8PSK50 81.80 2.10 3.40 4.13 63.00 4.60 2.80 4.3375 85.00 28.2 27.76 27.10 65.51 27.70 24.36 26.60100 87.00 35.43 32.46 34.16 69.00 38.07 35.00 39.23
Figure 10 shows the relation between the frequency spectrum peak (measured frompoint 1 in Figure 3). In both modulation cases, the increase in the magnitude of the noiseis followed by an increase in the percentage of FER, respectively. However, the FER isalmost the same, despite an 18 dB difference in the spectrum peak value. Figure 11 showsthe relation between the output voltage from the converter and the frequency spectrummagnitude in dBuV (measured from point 1 in Figure 3). In both DetM and RanM, the EMIreceiver IFBW is set to 200 Hz following CISPR A standard, and the relation is linear inboth cases. However, the difference between the frequency spectrum magnitude reachesalmost 18 dB between the DetM and RanM. Figure 12 shows the same result as in Figure 11,but with different IFBW configurations in the EMI receiver set at 9 kHz, the differencebetween the DetM and RanM is on average of 3.5 dBuV at all voltage points, whichconfirms the symmetry of both techniques. Consequently, a difference appears betweenboth techniques resulting from the methodology of the EMI spectrum measurement.
60 65 70 75 80 85 90 95Specrtum peak value [dBuV]
0
10
20
30
40
FER
[%
]
DetM-BPSKDetM-QPSKDetM-8PSKRanM-8PSKRanM-BPSKRanM-QPSK
The same FER (%) at 18 dB difference
Figure 10. FER Vs Magnitude in dBuV for different PLC modulation schemes in case of DetM and RanM.
5.2.2. The Variation in the Converter Main Switching Frequency at Constant EMI Noise
Figure 13 shows the FER results in the case of varying the converter main switchingfrequency around the intermediate value of the G3-PLC bandwidth from 50 kHz to 75 kHz,at a constant converter output voltage of 75 V. The G3-PLC modem is configured to workusing the BPSK. The results show that both techniques have the same effect on the G3-PLCperformance at the main switching frequency equal to the intermediate frequency of theG3-PLC (63 kHz).

Energies 2021, 14, 3257 11 of 14
50 55 60 65 70 75 80 85 90 95 100Voltage [Volt]
60
65
70
75
80
85
90
95
100
Mag
nitu
de [
dBuV
]
DetM
RanM
Figure 11. The maximum amplitude of disturbances, measured at the grid terminal (point 1, Figure 3) depending on theconverter supply voltage for different modulation schemes (DetM and Ran) for IFBW = 200 Hz.
50 55 60 65 70 75 80 85 90 95 100Voltage [Volt]
60
65
70
75
80
85
90
95
100
Mag
nitu
de [
dBuV
]
DetM
RanM
Figure 12. The maximum amplitude of disturbances, measured at the grid terminal (point 1, Figure 3) depending on theconverter supply voltage for different modulation schemes (DetM and Ran) for IFBW = 9 kHz.
In contrast, on the other frequencies near to the intermediate frequency, the RanMcauses more problems to the PLC systems than in the DetM. The randomized signalincreases the percentage of FER in the case of other frequencies due to the fast jumpingbetween the frequencies around the main switching frequency (central frequency fPWM).On the other hand, the DetM affects only specific points in the PLC bandwidth, which couldbe a sensitive point in the communication system as in the case of choosing a switchingfrequency equal to the intermediate frequency of the G3-PLC system.

Energies 2021, 14, 3257 12 of 14
(a) DetM
50 55 60 65 70 75Frequency [kHz]
0
5
10
15
20
25
30
35
FER
[%
]
(b) RanM
50 55 60 65 70 75Frequency [kHz]
0
5
10
15
20
25
30
35
FER
[%
]
Figure 13. The FER percentage vs. the variation in the main switching frequency values around theintermediate frequency of the G3-PLC bandwidth for DetM (a) and RandM (b).
6. Conclusions
The results presented in the paper focused on the impact of the DC/DC step-downconverter, treated as a source of EMI noise, on the narrowband G3-PLC. The hardware setupwas designed to provide an opportunity for comparative investigations between DetM andRanM converter modulation strategies. Furthermore, the designed hardware configurationallowed variable DC supply (interference level) and selection of different PLC phase-shiftkeying modulation and the converter main switching frequency. All the measurementswere taken in the CISPR A frequency range (9 kHz to 150 kHz) using the quasi-peak andaverage detectors. Particular advantages of RanM resulting from lowering the level of theEMI spectrum measured according to currently binding regulations may help meet the EMIlimits set by EMC standards. However, the experimental results of transmission errors haveindicated that in the analyzed frequency range, there is no significant difference betweenthe effect of DetM and RanM, despite the considerable decrease in spectrum magnitudeby RanM (which sometimes reaches 20 dB—ten times). The obtained results show arelationship between the data transmission error and the level of converter voltage, whichis linked with the disturbance energy. The influence of both modulations was also studiedin the case of various switching frequencies. The results showed that the RanM mightdeliver even more problems connected with PLC transmission reliability than the DetM.Similar results were already known in the literature for simple encrypted communicationstandards such as RS-232 or I2C. In the article, we confirmed these conclusions for PLCcommunication systems that use advanced data encoding methods and input selectivity.
We can also assume that the spectrum of disturbances measured by the receivercannot be taken as a factor for assessing the quality of the PLC communication channel.Spectrum measurement with an EMI receiver is sensitive to the nature of the measuredsignals. The change of the IFBW in measurement equipment for RanM significantlychanges the measured values of the disturbance spectrum (Figures 12 and 13). During the

Energies 2021, 14, 3257 13 of 14
measurement, disturbances in the entire communication channel should be aggregated tobe adequately assessed. Additionally, the robustness of various data encoding techniquesin PLC communication has been tested. The data transmission error is almost the same fordifferent DPSK modulation techniques (BPSK, QPSK, and 8PSK) applied in PLC devices.The observed FER values for the PLC-sent data in all the investigated DPSK modulationsare practically the same. The results may be surprising as the data from the literaturehave shown significant differences in the immunity of different DPSK coding methods todisturbances. The reason is that converters’ real signals are more complicated than typicaltest signals (white noise, harmonic signal, and periodic pulse signal).
Author Contributions: Conceptualization, W.E.S., P.L., R.S., A.M., M.P., and A.K.; methodology,W.E.S., P.L., and R.S.; software, W.E.S. and A.M.; validation, W.E.S. and P.L.; investigation, W.E.S.,P.L., and R.S.; resources, R.S., P.L., and A.K.; writing—original draft preparation, W.E.S. and P.L.;writing—review and editing, W.E.S., P.L., R.S., A.M., M.P., and A.K.; supervision, R.S. and P.L.; projectadministration, R.S.; funding acquisition, R.S. All authors have read and agreed to the publishedversion of the manuscript.
Funding: This paper is part of two projects that have received funding from the European Union’sHorizon 2020 research and innovation program under the Marie Sklodowska-Curie grant agreementsNo 812391-SCENT and No 812753-ETOPIA.
Conflicts of Interest: The authors declare no conflict of interest.
References1. Roggo, D.; Horta, R.; Capponi, L.; Eggenschwiler, L.; Decorvet, F.; Pellodi, C.; Buholzer, F. Electromagnetic interferences in smart
grid applications: A case study with power line communication smart meters and PV energy generation. CIRED Open AccessProc. J. 2017, 2017, 607–611. [CrossRef]
2. Kilani, K.; Degardin, V.; Laly, P.; Lienard, M.; Degauque, P. Impulsive noise generated by a pulse width modulation inverter:Modeling and impact on powerline communication. In Proceedings of the 2013 IEEE 17th International Symposium on PowerLine Communications and Its Applications, Johannesburg, South Africa, 24–27 March 2013; pp. 75–79.
3. Limas, M.; Agudelo-Martinez, D.; Rodríguez, J.B.; Pavas, A. Conducted emission variations using low power LED lampsconnected to other devices. In Proceedings of the 2018 18th International Conference on Harmonics and Quality of Power(ICHQP), Ljubljana, Slovenia, 13–16 May 2018; pp. 1–6. [CrossRef]
4. Jettanasen, C.; Ngaopitakkul, A. The Conducted Emission Attenuation of Micro-Inverters for Nanogrid Systems. Sustainability2020, 12, 151. [CrossRef]
5. Kotsampopoulos, P.; Rigas, A.; Kirchhof, J.; Messinis, G.; Dimeas, A.; Hatziargyriou, N.; Andreadis, K. EMC Issues in theInteraction Between Smart Meters and Power-Electronic Interfaces. IEEE Trans. Power Deliv. 2017, 32, 822–831. [CrossRef]
6. Rönnberg, S.K.; Bollen, M.H.; Amaris, H.; Chang, G.W.; Gu, I.Y.; Kocewiak, Ł.H.; Desmet, J. On waveform distortion in thefrequency range of 2 kHz–150 kHz—Review and research challenges. Electr. Power Syst. Res. 2017, 150, 1–10. [CrossRef]
7. Cano, C.; Pittolo, A.; Malone, D.; Lampe, L.; Tonello, A.M.; Dabak, A.G. State-of-the-art in Power Line Communications: Fromthe Applications to the Medium. IEEE J. Sel. Areas Commun. 2016, 8716, 1–19. [CrossRef]
8. Meyer, J.; Khokhlov, V.; Klatt, M.; Blum, J.; Waniek, C.; Wohlfahrt, T.; Myrzik, J. Overview and Classification of Interferences in theFrequency Range 2–150 kHz (Supraharmonics). In Proceedings of the SPEEDAM 2018—Proceedings: International Symposiumon Power Electronics, Electrical Drives, Automation and Motion, Amalfi, Italy, 20–22 June 2018; pp. 165–170.
9. Korki, M.; Hosseinzadeh, N.; Moazzeni, T. Performance evaluation of a narrowband power line communication for smart gridwith noise reduction technique. IEEE Trans. Consum. Electron. 2011, 57, 1598–1606. [CrossRef]
10. Di Bert, L.; Caldera, P.; Schwingshackl, D.; Tonello, A.M. On Noise Modeling for Power Line Communications. In Proceedingsof the 2011 IEEE International Symposium on Power Line Communications and Its Applications, Udine, Italy, 3–6 April 2011;pp. 283–288.
11. Llano, A.; Angulo, I.; Angueira, P.; Arzuaga, T.; De la Vega, D. Analysis of the Channel Influence to Power Line CommunicationsBased on ITU-T G . 9904 (PRIME). Energies 2016, 9, 39. [CrossRef]
12. Bojarski, J.; Smolenski, R.; Kempski, A.; Lezynski, P. Pearson’s random walk approach to evaluating interference generated by agroup of converters. Appl. Math. Comput. 2013, 219, 6437–6444. [CrossRef]
13. Bojarski, J.; Smolenski, R.; Lezynski, P.; Sadowski, Z. Diophantine equation based model of data transmission errors caused byinterference generated by DC-DC converters with deterministic modulation. Bull. Pol. Acad. Sci. Tech. Sci. 2016, 64, 575–580.[CrossRef]
14. Li, K.J.; Xie, Y.Z.; Zhang, F.; Chen, Y.H. Statistical Inference of Serial Communication Errors Caused by Repetitive ElectromagneticDisturbances. IEEE Trans. Electromagn. Compat. 2019, 62, 1160–1168. [CrossRef]

Energies 2021, 14, 3257 14 of 14
15. Chen, H.; Wang, T. Estimation of Common-Mode Current Coupled to the Communication Cable in a Motor Drive System.IEEE Trans. Electromagn. Compat. 2018, 60, 1777–1785. [CrossRef]
16. Adrian, V.; Chang, J.S.; Gwee, B.H.; Tedjaseputro, S. Spectral Analysis of Randomized Switching Frequency Modulation Schemewith a Triangular Distribution for DC-DC Converters. In Proceedings of the 2009 International Conference on Computing,Engineering and Information, Fullerton, CA, USA, 2–4 April 2009; pp. 119–122.
17. Cui, K.; Adrian, V.; Sun, Y.; Gwee, B.H.; Chang, J.S. A Low-Harmonics Low-Noise Randomized Modulation Scheme for Multi-Phase DC-DC Converters. In Proceedings of the 15th IEEE International New Circuits and Systems Conference (NEWCAS),Strasbourg, France, 25–28 June 2017; pp. 165–168.
18. Pareschi, F.; Rovatti, R.; Setti, G. EMI Reduction via Spread Spectrum in DC/DC Converters: State of the Art, Optimization, andTradeoffs. IEEE Access 2016, 3, 2857–2874. [CrossRef]
19. CENELEC-EN 55011:2016. Industrial, Scientific and Medical Equipment—Radio-Frequency Disturbance Characteristics—Limits andMethods of Measurement; CEN-CENELEC: Brussels, Belgium, 2016.
20. Crovetti, P.S.; Musolino, F. Interference of Spread-Spectrum EMI and Digital Data Links under Narrowband Resonant Coupling.Electronics 2020, 9, 60. [CrossRef]
21. Musolino, F.; Crovetti, P.S. Interference of Spread-Spectrum Switching-Mode Power Converters and Low-Frequency Digital Lines.In Proceedings of the 2018 IEEE International Symposium on Circuits and Systems (ISCAS), Florence, Italy, 27–30 May 2018; p. 5.
22. Lezynski, P.; Smolenski, R.; Loschi, H.; Thomas, D.; Moonen, N. A novel method for EMI evaluation in random modulated powerelectronic converters. Measurement 2020, 151, 107098. [CrossRef]
23. Lezynski, P. Random Modulation in Inverters With Respect to Electromagnetic Compatibility and Power Quality. IEEE J. Emerg.Sel. Top. Power Electron. 2018, 6, 782–790. [CrossRef]
24. Lai, Y.; Member, S.; Chang, Y. Novel Random-Switching PWM Technique With Constant Sampling Frequency and ConstantInductor Average Current for Digitally Controlled Converter. IEEE Trans. Ind. Electron. 2013, 60, 3126–3135. [CrossRef]
25. Mathe, L.; Lungeanu, F.; Sera, D.; Rasmussen, P.O.; Pedersen, J.K. Spread Spectrum Modulation by Using Using Asymmetric-Carrier Random PWM. IEEE Trans. Ind. Electron. 2012, 59, 3710–3718. [CrossRef]
26. Matanza, J.; Alexandres, S.; Rodriguez-Morcillo, C. Performance evaluation of two narrowband PLC systems: PRIME and G3.Comput. Stand. Interfaces 2013, 36, 198–208. [CrossRef]
27. Schwarz, M.; Gronwald, F. EMI analysis of a generic power line communication OFDM data link. In Proceedings of theEMC Europe 2011 York—10th International Symposium on Electromagnetic Compatibility, York, UK, 26–30 September 2011;pp. 625–628.
Copyright © 2022 FDOKUMEN


![[- 200 [ PROVIDING MODULATED COMMUNICATION SIGNALS ]](https://static.fdokumen.com/doc/165x107/6328adc85c2c3bbfa804c60f/-200-providing-modulated-communication-signals-.jpg)