Geological Modeling: Deterministic and Stochastic ... - CSDMS
Upload
independentCategory
view
1download
0
Surface microroughness of opticalglasses under deterministic microgrinding
John C. Lambropoulos, Tong Fang, Paul D. Funkenbusch, Stephen D. Jacobs,Michael J. Cumbo, and Donald Golini
Deterministic microgrinding of precision optical components with rigid, computer-controlled machiningcenters and high-speed tool spindles is now possible on a commercial scale. Platforms such as theOpticam systems at the Center for Optics Manufacturing produce convex and concave spherical surfaceswith radii from 5 mm to `, i.e., planar, and work diameters from 10 to 150 mm. Aspherical surfaces arealso being manufactured. The resulting specular surfaces have a typical rms microroughness of 20 nm,1 mm of subsurface damage, and a figure error of less than 1 wave peak to valley. Surface roughnessunder deterministic microgrinding conditions ~fixed infeed rate! with bound abrasive diamond ring toolswith various degrees of bond hardness is correlated to a material length scale, identified as a ductilityindex, involving the hardness and fracture toughness of glasses. This result is in contrast to looseabrasive grinding ~fixed nominal pressure!, in which surface microroughness is determined by the elasticstiffness and the hardness of the glass. We summarize measurements of fracture toughness and mi-crohardness by microindentation for crown and flint optical glasses, and fused silica. The microinden-tation fracture toughness in nondensifying optical glasses is in good agreement with bulk fracturetoughness measurement methods. © 1996 Optical Society of America
Key words: Optics manufacturing, deterministic microgrinding, microroughness, subsurface dam-age, microindentation, fracture toughness, hardness.
1. Introduction
The Center for Optics Manufacturing ~COM! at theUniversity of Rochester has made significant contri-butions in the fabrication of precision optical compo-nents by means of deterministic microgrinding withrigid, computer-controlled machining centers andhigh-speed tool spindles. Deterministic microgrind-ing is an optics manufacturing technology in whichthe infeed rate of themicrogrinding tool on the opticalworkpiece is imposed and hence determined and con-trolled. The imposed infeed rate leads to preciseknowledge of the amount of removed material whenoptical glasses are microground. Deterministic mi-crogrinding has been applied to the manufacturing of
D. Golini is with the Center for Optics Manufacturing; J. C.Lambropoulos, T. Fang, and P. D. Funkenbusch are with the Cen-ter for Optics Manufacturing and the Department of MechanicalEngineering; and S. D. Jacobs is with the Center for Optics Man-ufacturing and the Laboratory for Laser Energetics; University ofRochester, Rochester, New York 14627. M. J. Cumbo is with theOptical Coating Laboratory, Inc., Santa Rosa, California 95401.Received 14 August 1995; revised manuscript received 23 Jan-
uary 1996.0003-6935y96y224448-15$10.00y0© 1996 Optical Society of America
4448 APPLIED OPTICS y Vol. 35, No. 22 y 1 August 1996
convex and concave spherical surfaces with radiifrom 5mm to `, i.e., planar, and work diameters from10 to 150 mm have been achieved.1–5 Asphericalsurfaces have also been manufactured. Specularsurfaces, resulting after less than 5 min of determin-istic microgrinding, have a typical rms microrough-ness of less than 20 nm, 1 mm of subsurface damage,and a surface figure better than 1y2 wave peak tovalley.6 Typical infeed rates are 6–10 mmymin with2- to 4-mm bound abrasive diamond tools.An overview of the mechanics and materials issues
in deterministic microgrinding was presented byLambropoulos et al.,7 both at the structure–compo-nent levels, involving length scales from 1m to 1mm,and at the process–materials level ~1 mm to 1 nm!.The various chemomechanical interactions betweenabrasives and a glass surface can be categorized interms of various length scales describing the re-sponse of the material to chemomechanical inputs.8The bound abrasive tools used in this study consist
of single-crystal or polycrystal diamonds embedded ina bronze-type ring, typically 50 mm in diameter.The hardness of the tool can be controlled by usingvarious amounts of binder material and by varyingthe processing conditions. The size of the diamondsused in different tools varies from approximately 100

mm down to 2–4 mm. Typically, several tools areused with diamonds in this range. Each tool is usedto remove the damaged layer resulting from theprevious tool and to reduce further the surface micro-roughness. Typical tool rotation rates for deter-ministic microgrinding of optical glasses are from5000 to 30,000 rpm, whereas the work rotation ratesare from 50 to 300 rpm. Aqueous coolants are usedto facilitate themechanical and chemical action of thebound abrasive tools in deterministic microgrinding.Aspects of the tool microstructure and performancewere discussed by Khodakov and Glukhov,9 and thetool mechanical properties and microstructure, pri-marily porosity, were investigated by Funkenbuschand co-workers at the University of Rochester.10,11It is well known that ductile or brittle material
removal mechanisms may operate during micro-grinding.12–14 Mechanical factors, such as depth ofcut,15 and chemomechanical factors, such as coolantchemistry16,17 and abrasive size,16–18 may make ei-ther mode predominant. The brittle-to-ductile tran-sition occurs under loose abrasive microgrindingconditions of planar surfaces,16,17 bound abrasive mi-crogrinding in the plungemode of planar surfaces15,18or aspheres,14 and in single-point diamond turning ofplanar surfaces.19At sufficiently low depths of cut, material removal
occurs by plastic scratching. This mode of materialremoval is known as ductile or shear mode grind-ing20,21 and is characterized by low surface micro-roughness and subsurface damage, low materialremoval rates, and high residual surface stress,17which may approach the flow stress of glass in a thinsurface layer.22In contrast, when the depth of cut is high or the
abrasive size is large, brittle material removal occurs,which is characterized by high material removalrates proportional to the abrasive size,20,21,23–25 con-siderably higher surface microroughness, which in-creases with abrasive size,20,21,26 a subsurfacedamage depth generally proportional to the micro-roughness,27–30 and lower levels of surface residualstress.25–28One important aspect of deterministic microgrind-
ing is that different glasses, microground under thesame operating conditions, produce different amountsof surface microroughness and subsurface damage.This is not surprising because the mechanical prop-erties of the glasses clearly affect their response todeterministic microgrinding. The same conclusionwas reached by Edwards andHed,29 who showed thatthe mechanism for fine grinding by using bound di-amond tools depends on the properties of the glass, aswell as on the acidity of the grinding fluid, and thechemical and mechanical properties of the abrasivebond. However, Edwards and Hed,29 who groundfused silica, BK7 glass, and Zerodur, did not actuallycorrelate the observed grinding response with specificglass properties. Such a correlation was done in theseminal research of Aleinikov,27 who introduced theidea of a brittleness index to characterize the re-
sponse of glasses and ceramics under loose abrasivegrinding conditions.Whereas in loose abrasive grinding, surface
roughness correlates with glass hardness,31 in de-terministic microgrinding ~in which the infeed rateis specified!, elastic, plastic, and fracture propertiesmust all be used in predicting microroughness.Buijs and Korpel-Van Houten31 used loose abrasive~lapping! conditions ~in which the nominal pressureis constant rather than the infeed rate! and mea-sured the average surface peak-to-valley micror-oughness ~with a mechanical profilometer! in therange 2–20 mm and with a removal rate of 0.2–2 mms21. The abrasives used, SiC or Al2O3, had sizes of150 mm or 22 mm, respectively. They also showedthat the surface microroughness was proportionalto E1y2yHv, whereas the linear removal rate ~mi-crometers per second! was proportional to E5y4y~KcHv
2!, with E denoting the Young’s modulus, Kcthe fracture toughness, and Hv the Vickers micro-hardness. In this study it was envisioned that themicroroughness was proportional, if not identical,to the depth of the plastic zone on the glass surface,which in turn is determined by E and Hv when thesurface is indented by a force of constant magni-tude. However, as we show in this paper, thismodel cannot be applied to deterministic micro-grinding conditions in which the infeed rate, ratherthan the nominal pressure, is specified.To understand fully the interaction between the
grinding tool and the optical surface under determin-istic microgrinding conditions, we must look at theeffects of individual abrasive grains or groups ofgrains on the material removal rate from the opticalsurface.32 Such effects are essentially governed bythe various material chemomechanical properties ofthe glass, of the bond matrix, and of the abrasivegrain, as well as by the process parameters, such astool rotation rate and infeed rate, and are measuredin terms of the effects of material properties and pro-cess parameters on the resulting quality of theground surface, which is determined, for example, interms of the surface microroughness and subsurfacedamage.As a way to examine the correlation between me-
chanical properties and surface quality in determin-istic microgrinding, a large set of glasses were groundunder nominally identical operating conditions ~tooland work rotation rates, infeed rate, tool diameter,and diamond concentration! at the COM. In thesemicrogrinding experiments, a sufficient amount ofglass was removed so as to produce an optimal sur-face roughness. At the same time, the mechanicalproperties of the glasses were measured, spanning arelatively wide range.In what follows, we summarize the measurement
of the mechanical properties of some representativeoptical glasses, andwe show the correlation of surfacemicroroughness to glass mechanical properties underdeterministic microgrinding conditions.
1 August 1996 y Vol. 35, No. 22 y APPLIED OPTICS 4449

Table 1. Chemical Composition of the Tested Glasses ~mol. %!
Glass
SiO2 B2O3 Al2O3 Na2O K2O CaO BaO PbO Sb2O3 As2O3Schott Hoya
Fused silicaa 100F7 F7 44.75 2.4 5.7 46.85 0.3SF7 FD7 33 5 62SK7 BaCD7 39 15 5 41BK7 BSC7 68.9 10.1 8.8 8.4 2.8 1K7 C7 74 9 11 6KzF6 SbF6 54 17.1 1.1 0.3 6 21 0.5
aThe majority of the fused silica samples were Corning C7940.
2. Experimental Procedure
A. Glass Properties
The chemical composition of the tested glasses isshown in Table 1. We measured Vickers hardnessby microindentation, with load application times of15 s. The load was typically in the range 2–1000 gf~approximately 0.02–10 N, where gf is 9.81 mN!.For each load wemade five indentations, and for eachindentation we measured the impression diagonalsthree times. All glasses were measured in air.Figure 1 shows the dependence of themeasured Vick-ers hardness on the applied load for some represen-tative glasses, showing the range of hardness among
Fig. 1. Load dependence of the Vickers microhardness for someoptical glasses. The hardness was measured at loads of 2, 5, 10,25, 50, 100, 200, 500, and 1000 gf.
fused silica, borosilicate crown, and flint glasses.Note that the flint glasses are relatively soft com-pared with the crown glasses and fused silica.It is clear that the measured hardness increases at
lower loads. This is a manifestation of the indenta-tion size effect ~ISE!. We describe the ISE by follow-ing the model of Li and Bradt33 for the dependence ofthe measured hardness, Hv, on the measured diago-nal, D,
Hv 5 H`S1 1D0
D D , (1)
where H` is the hardness at large loads and D0 is aparameter describing the ISE, i.e., how the hardnessincreases with diminishing indentation diagonal D.These parameters were extracted by plotting themeasuredHv versus ~1yD!. Table 2 summarizes thecurve-fitting results. Dmin and Dmax are the small-est and largest indentation diagonals used in the fit-ting, respectively.Figure 2 compares the measured Vickers hardness
in the present study and in the study of Izumitani34to the published Knoop hardness. The two lines areparallel to each other. The offset at the small Knoophardness may be due to the fact that the junctionoffset in the Vickers indenter we used ~estimated atapproximately 1 mm from atomic force microscopy ofindentation shapes on soft materials such as ZnSe!may have been different from the one used in thestudy of Izumitani.34For the fracture toughness measurements, the
length, c, of the cracks emanating from the indenta-
Table 2. Range of Measured Indentation Diagonals and Vickers Hardnesses, and Parameters H` and D0 Describing the ISE forthe Used Optical Glassesa
GlassDmin–Dmax
~mm!Hmax–Hmin
~GPa!H`
~GPa!D0
~mm! R
BK7 11–51 7.7–6.9 6.7 6 0.1 1.6 6 0.2 0.975SF7 13–61 5.4–4.8 4.7 6 0.1 1.9 6 0.3 0.945F7 27–65 4.9–4.4 4.1 6 0.1 5.4 6 0.7 0.965SK7 15–54 7.6–6.3 5.6 6 0.1 5.6 6 0.4 0.990K7 11–57 7.8–5.6 4.7 6 0.1 6.8 6 0.5 0.988KzF6 11–59 6.8–5.3 4.6 6 0.1 5.3 6 0.6 0.972FS 6–21 12–8.8 6.9 6 0.3 5.1 6 0.6 0.994
aThe smaller diagonal corresponds to the higher hardness.
4450 APPLIED OPTICS y Vol. 35, No. 22 y 1 August 1996

tion corners was measured. Typical data are shownin Fig. 3. For the F7, SF7, and BK7 glasses, nocracks were observed for the three lowest used loadsof 2, 5, or 10 gf, but cracks were observed at 25 gf.For K7 the loads for cracking were in excess of 50 gf,with no cracks for 25 gf or lower. For KzF6 thecorresponding loads were 200 and 100 gf. Thus,from such threshold loads for cracking, it is immedi-ately clear that KzF6 had the highest threshold loadfor cracking ~the threshold being in the range 100–200 gf!, K7 had the second highest threshold ~be-tween 25 and 50 gf!, and the other glasses hadthreshold loads of approximately 25 gf.Two separate crack systems can arise fromaVickers
microindentation. For recent reviews, see Cook andPharr35 or Sakai and Bradt.36 Most ceramics with alow fracture toughness exhibit half-penny cracks, alsoknown as radial cracks. Brittle materials with smallcrack lengths, or equivalently materials with a highfracture toughness, exhibit Palmqvist cracking. Weobserve that the measured total crack size, 2c, is thedistance between crack tips on the surface trace of theradial crack.The dependence of measured crack length c on ap-
Fig. 2. Comparison of measured Hv with published values of theKnoop hardness from the Hoya and Schott glass catalogs. Theopen squares are the Vickers data from Ref. 34.
Fig. 3. Dependence of crack length c on load P for typical opticalglasses.
plied load P exhibited both effects described above.The usually assumed dependence P ; c3y2 was notexhibited; such a relationship, based on the assump-tion of point loading of a penny-shaped crack, is onlyvalid when crack size c greatly exceeds the indenta-tion half-size Dy2. In our measurements on glassesand crystals ~such as sapphire, KDP, and LiNbO3!,we had cy~Dy2! in the range 2.5–5.5. Indeed, rela-tion P ; c3y2 is only obeyed at large crack sizes,whereas at smaller crack sizes P; c. Thus, ~also seeTable 3! we used
c 5 aP2y3 1 bP. (2)
Once the dependence of crack size c on P has beenmeasured, the fracture toughness, Kc, which is a ma-terial property, can be calculated in a variety of ways,such as those of Evans and Charles,37 Evans,38 Lawnet al.,39 Anstis et al.,40 Lankford,41 Niihara et al.,42 orShetty et al.43 The reader is referred to McColm44
for further correlations.The approaches of Niihara et al.42 and Shetty et
al.43 assume the surface cracks to be of the Palmqvisttype, whereas the other approaches assume thecracks to be fully developed radial cracks. Evans38used dimensional analysis and curve fitting over arange of cy~Dy2! from 1.5 to 7 and for many ceramicmaterials ~B4C, SiC, Si3N4, WC–Co, ZnS, ZnSe, andPSZ ZrO2!. Thus, this model should be applicable toboth Palmqvist and radial cracks. According to theEvans model,38
Kc 5 HÎDy2SEHD0.4
10f ~ x!, x 5 log10S cDy2D ,
f ~x! 5 21.59 2 0.34x 2 2.02x2 1 11.23x3
2 24.97x4 1 16.32x5, (3)
whereKc is the fracture toughness,H is the hardness,D is the indentation diagonal, E is the Young’s mod-ulus, and c is the half-crack size. Lankford41 in-cluded Al2O3, soda-lime silicate glass, and NaCl tothe materials analyzed by Evans.38 Anstis et al.40examined various glasses ~glass-ceramic, soda-lime,aluminosilicate, and lead alkali!, polycrystal Al2O3and sapphire, Si3N4, SiC, Ca–PSZ ZrO2, Si, and SiC–Co. In our glass tests the range of cy~Dy2! was fromapproximately 2 to 3.8 and thus should be covered bythe Evans approach.38 For each indentation load P,
Table 3. Coefficients in Correlating Measured Crack Size cto Applied Load Pa
Glassa
~mm N22y3!b
~mm N21! R
SF7 23.2 6 0.8 0.5 6 0.4 0.99965F7 21.3 6 0.8 1.1 6 0.4 0.99954BK7 21.2 6 0.5 0.06 6 0.25 0.99982SK7 19.3 6 1 0.8 6 0.6 0.99912K7 18.4 6 1 0.3 6 0.5 0.9989KzF6 11.4 6 1.2 2.6 6 0.6 0.9982
aRelation c 5 aP2y3 1 bP is used for the six glasses tested.
1 August 1996 y Vol. 35, No. 22 y APPLIED OPTICS 4451

Table 4. Mechanical Properties of Representative Optical Glassesa
Parameter SF6 SF7 F7 BK7 SK7 K7 KzF6 FS
r ~g cm23! 5.18 3.80 3.62 2.51 3.51 2.53 2.54 2.20Tg ~°C! 426 448 437 557 643 513 444 1090E ~GPa! 56 56 55 81 84 69 52 73Hk ~200 gf! ~GPa! 3.1 3.5 3.6 5.2 4.9 4.5 3.8 6.6Kc ~MPa m1y2!Ref. 47 — 0.63 6 0.03 0.69 6 0.04 0.86 6 0.04 0.86 6 0.04 0.91 6 0.05 — —Ref. 48 0.54 6 0.04 — 0.68 6 0.04 0.86 6 0.08 — — — —Ref. 34 0.54 — — 0.85 — — — —This study — 0.67 6 0.05 0.71 6 0.07 0.82 6 0.05 0.87 6 0.10 0.95 6 0.08 1.03 6 0.03 —
Bulk KIc 0.54 — — 0.85 6 0.05 — — — 0.75 6 0.05
aAll data were reduced by using the Ref. 38 model. Ref. 47 used a load of 500 gf in air; Ref. 48 used indenting loads of 50, 100, and 200gf in anhydrous methanol; Ref. 34 used 200 gf in air. The bulk measurements of SF6 used the Ref. 49 short-rod technique. The bulkmeasurements of BK7 and fused silica were done with the double cantilever method of Ref. 50, the single edge-notch three-point bendingof Ref. 51, or the strength method, using the Knoop indent of Ref. 31.
diagonal D, and crack size c, we used the measuredvalue of the Vickers hardness corresponding to thatspecific load. We observe that all models we usedgive the same relative ranking of the fracture tough-ness of these glasses.Matsumoto45 did a similar series of microindenta-
tion fracture toughness tests and data analysis intoughened ZrO2 ~Ce–TZP!, as well as bulk fracturetoughness testing ~bulk testing with the double can-tilever beam technique gave Kc 5 10.2 MPa m1y2!.By comparing the bulk test results with the microin-dentation test results, he concluded that the analysisaccording to Palmqvist cracking was not very suc-cessful, that the Lankford41 and Niihara42 analysesoverestimated the fracture toughness, and that theEvans38 and Anstis et al.40 approaches gave resultsmost consistent with the bulk tests.We summarize the extracted fracture toughness
in Table 4, which also includes other glass mechan-ical properties. The values in the table are theaverages over all crack lengths measured. The in-dicated errors correspond to the standard deviationover the range of crack lengths measured. Figure4 shows the relation of the measured fracturetoughness with the Knoop hardness ~measured
Fig. 4. Correlation with Knoop hardness ~from Ref. 46! of themeasured Kc, extracted from c~P! with the model Ref. 38.
4452 APPLIED OPTICS y Vol. 35, No. 22 y 1 August 1996
with a load of 200 gf!, taken from the Schott Glasscatalog.46 It is seen that, in general, the silicateflint glasses ~SF6, SF56, SF7, and F7! are soft andbrittle, whereas the silicate crown glasses ~K7,BK7, SK7, and fused silica! are harder and tougher.Note, however, that antimony flint glass KzF6 hasan exceptionally high toughness, and so does lan-thanum borate glass LaK10. The effects of me-chanical properties on surface microroughness arediscussed below.We have done a literature survey to confirm that
the fracture toughness of some of the materials thatwe have tested by microindentation has also beentested by methods other than microindentation.For borosilicate crown glass BK7, Wiederhorn et
al.50 used double cantilever specimens to find a frac-ture toughness of 0.85 6 0.05 MPa m1y2 at roomtemperature. The fracture toughness of BK7 alsohas been measured in the range 0.84–0.86 MPa m1y2
by using the double cantilever method and three-point bending of edge-cracked specimens.51 Morerecently, Buijs and Korpel-Van Houten31 used athree-point bend test and Knoop indentation cracksto find 0.83 6 0.08 MPa m1y2.Our current measurements ~see Table 4! and the
use of the Evans model38 for the extraction of thefracture toughness gave 0.82 6 0.05 MPa m1y2.Cumbo’s microindentation measurements,48 withloads in the range 50–200 gf, when analyzed with theEvans model, gave for the fracture toughness of BK70.86 6 0.08 MPa m1y2 in anhydrous methanol.Cumbo’s47 older measurements in air, with a load of500 gf, gave 0.86 6 0.04 MPa m1y2 when analyzedwith the Evans model.We also note that Izumitani34 used Vickers micro-
indentation at a load of 200 gf and measured for BK7in air a crack size c 5 34.5 mm. Although no mea-surement errors were reported, when these measure-ments are reduced with the Evans model,38 themicroindentation fracture toughness for BK7 is ex-tracted as 0.85 MPa m1y2. We conclude that micro-indentation fracture measurements in BK7 glass,when reduced according to themodel by Evans,38 give

close agreement with the fracture toughness as mea-sured by various bulk methods. Various microin-dentation measurements are also self-consistent inthat they all predict the same microindentation frac-ture toughness for BK7.For flint glass SF6, the bulk fracture toughness
was measured with Barker’s short-rod technique inthe research of Androsov et al.,49 who used the Rus-sian designation TF10 for that glass. With theshort-rod technique the fracture toughness was re-ported as 0.54 MPa m1y2. More recently, Buijs andKorpel-Van Houten31 used a three-point bend testand Knoop indentation cracks to find 0.54 6 0.05MPa m1y2.Although we have not measured SF6 in this work,
Cumbo did so48 by using Vickers microindentationwith loads of 50, 100, and 200 gf. Using the modelby Evans38 to reduce the microindentation measure-ments by Cumbo, we see that the fracture toughnessof SF6 is found to be 0.54 6 0.04 MPa m1y2, which isin excellent agreement with the bulkmeasurement ofAndrosov et al.51We also note that Izumitani, in the Hoya technical
report,34 used Vickers microindentation at a load of200 gf and measured a crack size of c 5 49.2 mm.When these measurements are reduced with theEvans model,38 the microindentation fracture tough-ness is extracted as 0.54 MPa m1y2. Again, it isconcluded that microindentation fracture toughnessmeasurements of SF6 are self-consistent, and thatthey agree well with independent measurements ofthe bulk fracture toughness.For fused silica, microindentation analysis overes-
timates the actual fracture toughness.52 Such anoverestimate is attributed to the fact that fused silicais known to densify under compressive loads,53 ratherthan flow by shear. Densification is facilitated byshear stresses.54 Consequences of such densifica-tion for optics manufacturing applications, such aspolishing or grinding, are discussed by Lambropouloset al.,55 who also listed different glass types from theliterature that are known to densify.The bulk fracture toughness of fused silica has
beenmeasured by various techniques. For example,Wiederhorn56 measured 0.75 MPa m1y2 with the dou-ble cantilevermethod, which is in agreement with themeasurements by Wiederhorn et al.50; Barker57 useda short-rod technique to measure 0.735 6 0.01 MPam1y2. The study by Wiederhorn and Roberts51 usedboth double cantilever and edge-cracked three-pointbending techniques and measured 0.74–0.75 6 0.03MPa m1y2. Buijs and Korpel-Van Houten31 used athree-point bend test and Knoop indentation cracksto find 0.70 6 0.07 MPa m1y2. In the correlations tofollow, we therefore use 0.75 MPa m1y2 for the frac-ture toughness of fused silica.For other optical glasses, Izumitani in the Hoya
technical report34 used Vickers microindentation tomeasure the indentation diagonal and crack size for alarge number of optical glasses, although he did notconvert such measurements into a fracture tough-ness. Note that in Izumitani’s research the crack
length is defined as that portion of the crack traceextending beyond the end of the indentation diagonal~also see Ref. 13, p. 105, Fig. 4.32!. For some of hisglasses, Izumitani reported the crack size but not theindentation diagonal ~see Ref. 13, p. 105, Fig. 4.31!.Because these measurements are useful in correlat-ing the glass mechanical properties with the surfacequality, as described in the following sections, wehave used themodel of Evans38 to extract the fracturetoughness of these glasses from the Izumitani mea-surements. The results are summarized in Table 5.Microindentation is a convenient testing method
for measuring the mechanical properties of glasses.For optical glasses not exhibiting densification, frac-ture toughness from microindentation, by means ofthe measurement of the crack size at a fixed load, isin good agreement with bulk measurements. Fordensifying glasses, such as fused silica, microinden-tation overestimates the fracture toughness as mea-sured by bulk methods.
B. Deterministic Microgrinding
All samples prepared by deterministic microgrindingwere nominally prepared under the same conditions.Typically the final 2- to 4-mm tool was run at 15,000rpm, with a work speed of 180 rpm, an infeed rate of6 mm min21, a total material removal of 12 mm, anda dwell time after infeed of 15 s. Occasionally theseparameters were altered slightly to achieve the leastpossible roughness for a given glass. The most com-mon cutting parameter that was changed was thetotal amount of glass removed with the 2- to 4-mmtool. This value could be as low as 5 mm for somematerials and depended on the residual damagedepth from the previous tool. Occasionally, tool rpmwas reduced or dwell time was increased. Tools weretrued and dressed before each microgrinding cut.
C. Tool Property Characterization
Various hardness tools were used in the determinis-tic microgrinding experiments.59 All tools had a 75concentration of 2- to 4-mm diamonds ~18.8 vol. %!,and a Young’s modulus of 100–120 GPa. The aque-ous coolant used is commercially available under thetrade name Challenge 300 HT. As used, the coolanthad pH 5 9.5.Bond properties for bound abrasive tools are gen-
erally described in terms of the bond hardness. Thetools used in this study were bronze bonds with bondhardnesses designated as L ~softer!, N ~medium!, andT ~harder!. Bond hardness is based on an alphabet-ical scale with the hardness increasing as we movethrough the alphabet from A ~soft! to Z ~hard!. Un-fortunately, there is no universal scale for this des-ignation, nor even good agreement on what specificproperty constitutes a bond’s hardness. We have,therefore, been using some simple mechanical teststo characterize bond properties—in particular the ul-trasonic wave speed and Vickers microhardness.When an ultrasonic wave travels through a solid,
its speed ~v! is determined by the modulus ~M! anddensity ~r! of the material being traversed according
1 August 1996 y Vol. 35, No. 22 y APPLIED OPTICS 4453

Table 5. Extracted Fracture Toughness
Glass~Schott!
Ea
~GPa!Hk
a
~GPa!Hv
b
~GPa!Kc
c
~MPa =m!Kc, Bulk
c
~MPa =m!sY
d
~GPa!
F2 58 3.7 4.6 0.61 0.55 6 0.06 1.9F4 55 3.6 4.6 0.65 2.0F5 58 3.8 4.7 0.63 2.0SF1 56 3.4 ~4.3! — 0.63 6 0.09 2.1SF4 56 3.3 4.1 0.55 1.7SF5 56 3.4 4.4 0.57 1.8SF6 56 3.1 3.7 0.54 0.54 1.4SK3 83 4.8 6.1 0.77 2.5SK11 79 5.1 6.5 0.78 2.8SK15 84 4.5 6.0 0.79 2.4SK16 89 4.9 6.0 0.78 2.3BK1 74 4.8 5.8 0.82 2.5UBK7 81 5.0 ~6.2! — 0.89 6 0.01 2.6K3 71 4.7 5.6 0.79 2.4K9 ~67! ~4.4! 5.3 0.76 2.3KF4 ~66! ~4.1! 4.9 0.76 2.0LF6 60 3.9 4.8 0.72 2.0LaF2 93 4.8 ~6.0! ~0.94! 2.3LaF3 95 5.1 ~6.3! ~0.93! 2.4LaK10 111 5.8 ~7.2! ~0.95! 2.7LaK11 90 5.2 ~6.5! ~0.83! 2.5BaK2 71 4.5 ~5.6! ~0.72! 2.4BaF3 64 4.2 ~5.2! ~0.67! 2.2BaF10 78 ~4.8! 5.8 0.67 2.3BaSF2 66 4.1 ~5.1! ~0.44! 2.1BaSF8 74 ~4.2! 5.8 0.67 2.1SSK1 79 4.5 5.9 0.75 2.4SSK5 ~79! ~4.6! 5.9 0.70 2.4
aThe data for the Young’s moduli and Knoop hardness Hk ~at 200 gf! are from the Schott Optical Glass ~Ref. 46!. Parentheses in theE or Hk value show that the property was estimated from those of neighboring glasses.
bThe Vickers hardness is extracted from the measurements of Ref. 34 with a load of 200 gf. Parentheses in the Hv value indicate thatthe Vickers hardness was estimated from the correlation of Hv and Hk, similar to the one shown in Fig. 3, using the data from Ref. 34.
cParentheses in the Kc value denote that the estimated Hv for that glass was used. The bulk measurements of Kc for SF1 and UBK7are from Ref. 51, for F2 are from Ref. 31, and for SF6 are from Refs. 31 and 49.
dUniaxial yield stress sY was estimated by using the model of Ref. 58 ~see Appendix A!.
to an equation of the following form:
v 5 ÎMr . (4)
The particular modulus M measured ~Young’s mod-ulus, shear modulus, etc.! depends on the type ofwave and some geometrical details of the testing pro-cedure. For an isotropic material with only two in-dependent elastic constants, measurement of bothP-wave ~compression! and S-wave ~shear! speeds per-mits both constants to be determined. Therefore, ifwe determine the wave speed and the density of a toolmaterial, we can obtain a quantitative measure of itselastic stiffness.In the current experiments, the density could not
be measured nondestructively because the bond ma-terial was permanently fused to the stainless-steelrings during the fabrication process. Therefore, thewave speeds themselves are used as indicators ofelastic stiffness, with the assumption that the densi-ties of the tools are all similar. This is reasonablebecause the bonds were all bronze based and hadidentical diamond concentrations. The relatively
4454 APPLIED OPTICS y Vol. 35, No. 22 y 1 August 1996
small differences in the wave speeds observed ~seeFig. 5! are therefore indicative of relatively smalldifferences in elastic stiffness among the differentdesignation tools.Vickers microhardness was also measured on the
tools, using a 200-gf load. A much stronger trend inthe data is obtained in this case ~Fig. 6!, with the Tbondmicrohardness being approximately double thatof a K bond. The L bond was not measured butshould be between that of the K and N bonds. Con-siderable variation can occur among individual mi-crohardness test results as a consequence of thelocally inhomogeneous nature of the bond. The val-ues reported are therefore averages of at least fiveseparate indentations. Standard deviations for thesemeasurements were of the order of 0.1–0.2 GPa.
D. Surface Roughness and Subsurface Damage
The surface microroughness (SR) was interferomet-rically measured with the Zygo Maxim or Zygo NewView 100 interferometers. For each glass, 12–15 op-tical surfaces, prepared under the same microgrind-ing conditions, were used for the surface roughness~SR! determination with the Zygo Maxim interferom-
eter. The roughness of a smaller set of glasses ~ninesamples per glass type! was also measured with theNew View 100 interferometer.The Zygo New View 100 is a three-dimensional
imaging surface structure analyzer. It uses coher-ence scanning white-light interferometry for noncon-tact imaging and measurement of surfacemicrostructure and topography. The Zygo Maximuses the same interferometric principles, but has alaser as a light source and does not scan vertically.Because of these differences, this device cannot mea-sure absolute SR of parts with defects exceeding ap-proximately 0.5 mm. Thus the Maxim cannotmeasure surface features exceeding 0.5 mm. Therms SR values reported for microground surfaces aresubstantially lower than the actual roughness, butthey are qualitatively reliable.After microgrinding, the subsurface damage ~SSD!
was determined by first etching the samples inHF for30 s to reveal the subsurface damage. Damagedepth ismeasured by a dimpling technique, described
Fig. 5. Measured ultrasonic wave speeds for different bond hard-ness designations.
Fig. 6. Measured Vickers microhardness for different bond hard-ness designations.
by Lindquist et al.,60 in which a steel ball of radius23.81 mm is used with an abrasive to polish a dimplein the etched region. The SSD is extracted by opti-cally measuring the inner and outer radii containingthe damaged layer. These measurements, togetherwith the steel ball radius, permit the determinationof the depth to which the SSD extends. Zhou et al.61showed that the optical measurement of the SSD is ingood agreement with scanning electron microscopymeasurements for a variety of etching solutions anddurations. The SSD was measured for two differentsamples prepared under nominally identical micro-grinding conditions.The measured surface microroughness ~with the
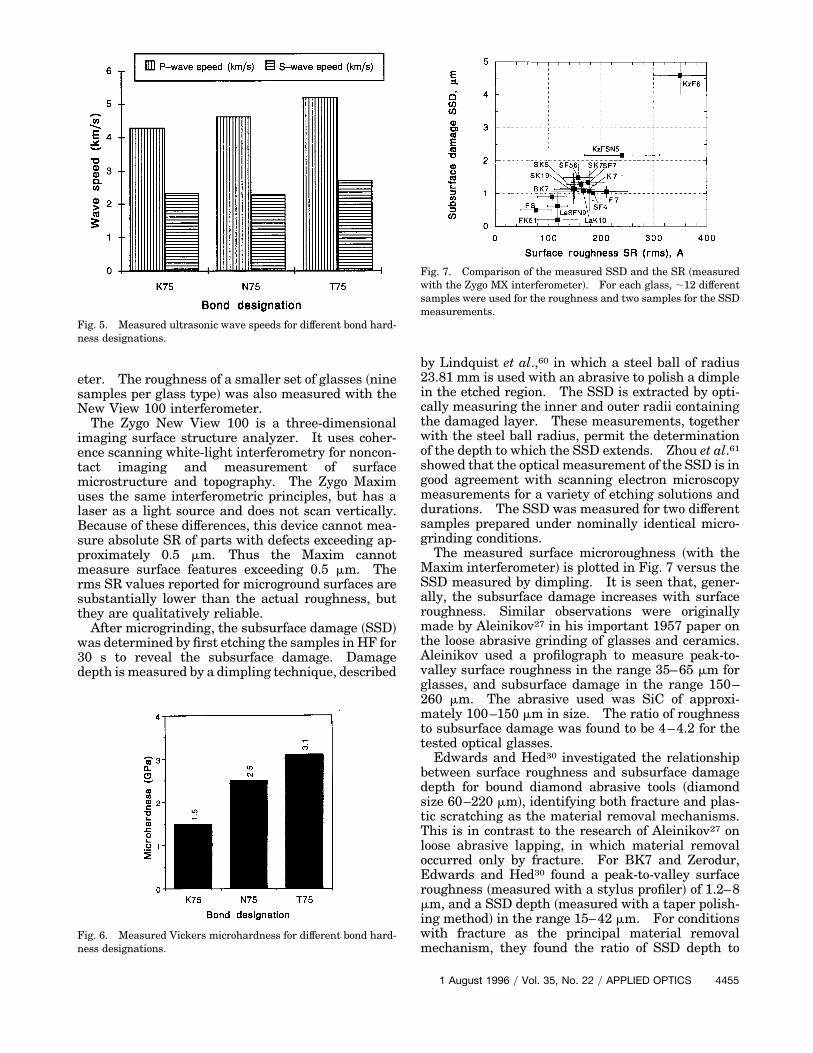
Maxim interferometer! is plotted in Fig. 7 versus theSSD measured by dimpling. It is seen that, gener-ally, the subsurface damage increases with surfaceroughness. Similar observations were originallymade by Aleinikov27 in his important 1957 paper onthe loose abrasive grinding of glasses and ceramics.Aleinikov used a profilograph to measure peak-to-valley surface roughness in the range 35–65 mm forglasses, and subsurface damage in the range 150–260 mm. The abrasive used was SiC of approxi-mately 100–150 mm in size. The ratio of roughnessto subsurface damage was found to be 4–4.2 for thetested optical glasses.Edwards and Hed30 investigated the relationship
between surface roughness and subsurface damagedepth for bound diamond abrasive tools ~diamondsize 60–220 mm!, identifying both fracture and plas-tic scratching as the material removal mechanisms.This is in contrast to the research of Aleinikov27 onloose abrasive lapping, in which material removaloccurred only by fracture. For BK7 and Zerodur,Edwards and Hed30 found a peak-to-valley surfaceroughness ~measured with a stylus profiler! of 1.2–8mm, and a SSD depth ~measured with a taper polish-ing method! in the range 15–42 mm. For conditionswith fracture as the principal material removalmechanism, they found the ratio of SSD depth to
Fig. 7. Comparison of the measured SSD and the SR ~measuredwith the Zygo MX interferometer!. For each glass, ;12 differentsamples were used for the roughness and two samples for the SSDmeasurements.
1 August 1996 y Vol. 35, No. 22 y APPLIED OPTICS 4455

peak-to-valley surface roughness as 6.4 6 1.3. Ed-wards and Hed30 also examined the review researchof Khodakov et al.28 ~unspecified glasses and grindingconditions! on bound diamond tools, and they esti-mated a ratio of subsurface damage to roughness of5.5 6 1.1 for diamond particles 6.5–40 mm in size.
3. Correlations
Here we proceed to discuss some correlations be-tween the measured surface rms microroughness SRand the material properties of the various glasses wetested. The surface roughness data are those ob-tained from parts groundwith theN75 ~medium bondhardness! tool with 2- to 4-mm diamonds and mea-sured with the Maxim interferometer. For the cor-relations we use Knoop hardness, as it isconveniently tabulated in manufacturers’ productcatalogs.46Figure 8 shows the correlation of measured SR
with the Knoop hardness, Hk ~measured at 200 gf!from the Schott Glass catalog.46 This figure showsthat, with the hardness as the correlatingmechanicalproperty, the SR increases with hardness for the flintglasses ~SF6, SF56, SF7, F7, and KzF6!, but de-creases with Hk for the silicate crown glasses ~K7,BK7, SK7, and fused silica!. This result shows thatHk alone cannot control SR. For example, KzF6 hasapproximately the same Knoop hardness as the otherflint glasses, but it shows a significantly higher sur-face microroughness.An argument may be made as to why surface
roughness should not correlate with Knoop hardnessunder conditions of deterministic microgrinding.For a fixed infeed rate, different glasses require dif-ferent force magnitudes to compress the tool againstthe glass surface. Because the force varies fromglass to glass, Knoop hardness cannot be conve-niently normalized so as to give dimensions of length~the dimensions of SR!. This obstacle is overcomewhen the fracture toughness is used in conjunctionwith the Knoop hardness, as shown below.
Fig. 8. Correlation of measured SR ~with Zygo MX interferome-ter! with the Knoop hardness published in the Ref. 46. For flintsilicate glasses the SR increases withHk; it decreases for the crownsilicate optical glasses.
4456 APPLIED OPTICS y Vol. 35, No. 22 y 1 August 1996
Figure 9 shows the correlation of the measuredsurface microroughness SRwith the length scale ~KcyHk!
2. It is now seen that the same correlation, es-sentially linear between the surface microroughnessand ~KcyHk!
2, holds for both the flint and the crownsilicate glasses, as well as lanthanum borate glassLaK10. Although not shown here, the correlationshown to hold for loose abrasive grinding,31 namelythat SR ; E1y2yH, does not correlate with our exper-imental data. The reason, of course, is that underconditions of deterministic microgrinding, the mate-rial removal rate is held constant, rather than thenominal pressure as in loose abrasive grinding.Length scale ~KcyHk!
2 may be referred to as a duc-tility index, J ~with units of length!:
J 5 SKc
HkD2. (5)
Ductility index J is a reverse analogy to the brittle-ness index used by Lawn et al.62 In that investiga-tion, surface energy Gwas used, but their results maybe recast into a form similar to ours with the identi-fication of G as the energy release rate required forcrack growth, i.e., G 5 ~1 2 n2!Kc
2yE under plane-strain crack growth conditions, where n is the Poissonratio. Ductility index ~KcyHk!
2 provides a usefulmeasure to correlate the response of various glasses:although fused silica has a typical fracture toughnessKc, it has a very high hardness, so its ductility indexis low and so is the measured surface roughness. Incontrast, KzF6 has a high fracture toughness and lowhardness, leading to a high ductility index and a highsurface roughness.The concept of quantifying the grindability of brit-
tle materials in terms of a brittleness index was firstintroduced by Aleinikov27 in his seminal research onloose abrasive grinding ~lapping!. Aleinikov definedthe brittleness index as linearly related to ~,yD!2,where D is the indentation diagonal in a Vickers
Fig. 9. Correlation of measured SR ~with Zygo MX interferome-ter! with ductility index J 5 ~KcyHk!
2 of various optical glasses.The correlation holds for both flint and crown glasses, as well asfused silica. The straight line, with slope 4.2 6 0.5 Aynm, hascorrelation R 5 0.95.

microindentation test and , is the resulting cracksize. Aleinikov used a fixed indentation load of 50gf, but it is not clear whether the crack size , he usedis the same as the crack size cwe used in our research~measured from the center of the indentation!, or thelength of the crack extending beyond the corner of theindentation, i.e., , 5 c2Dy2 in our notation. In anycase, ~,yD!2 will be a function of applied load P ~typ-ically ~,yD!2 ; P1y3!, depending inversely on the frac-ture toughness Kc, and increasing with Young’smodulus E. This implies that the brittleness indexdefined by Aleinikov27 will vary depending onwhether or not the applied load in a manufacturingoperation is large, rather than being a load-indepen-dent material property such as the ductility index~KcyHk!
2 we discussed above.Early Russian investigations in loose abrasive
grinding show that the fracture toughness, or thecrack size ,, must enter in our understanding of theprocesses governing material removal under suchconditions: Aleinikov’s research on lapping27showed that the volume removal rate was propor-tional to ,3, whereas the SSD depth ~the destroyedlayer in Aleinikov’s research! was proportional to ,.It is interesting to note that in the studies by Izumi-tani on lapping,34,63 the volume removal rate wasproportional to ,2.It is revealing to interpret in a different way our
conclusion that the measured surface microrough-ness SR scales in direct proportion to ductility index~KcyHk!
2. We use the model of Hill58 to extract frommeasured Vickers hardness Hv the uniaxial yieldstress of glass, sY ~see Fig. 10!. The procedure issummarized in Appendix A. In Fig. 10, extracteduniaxial yield stress sY is plotted versus the mea-sured Vickers hardness, including our current mea-surements and the measurements by Izumitani.34The values of sY are also shown in Table 5.From the extracted sY and fracture toughness Kc,
we next may estimate the size of the plastic zone in amode-I growing crack tip. For an elastic, perfectlyplastic material ~i.e., no strain hardening!, the total
Fig. 10. Correlation of measured Vickers hardness ~open squaresare from Ref. 34! with sY as calculated from Ref. 58.
height of the plastic zone is64
Rp < 20.35
p SKc
sYD2. (6)
Figure 11 shows that the measured surface micro-roughness is approximately equal to size Rp of theplastic zone. From this correlation, we can then pre-dict the surface microroughness as
SR , Rp < 20.35
p SKc
sYD2, (7)
where the equivalent sign denotes varies as. Weemphasize that the numerical agreement betweenthe extent of plastic zone Rp and the rms SR deter-mined with the Maxim interferometer is fortuitousbecause the Maxim interferometer only provides aqualitative measure of the surface roughness. Inany case, the size of the plastic zone at a growingcrack tip is proportional to ~KcyHk!
2, which was pre-viously identified as the ductility index. The issue ofthe precise correlation between SR and ductility in-dex ~KcyHk!
2 is further examined in Section 4 whenwe discuss the surface roughness resulting from dif-ferent tools.In addition to ductility index ~KcyHk!
2, it is possibleto use other material-dependent properties in corre-lating the surface microroughness among variousglasses. Figure 12 shows the correlation betweenthe measured microroughness SR and the criticaldepth of cut dc, defined by Bifano et al.15 as thatmaterial length scale distinguishing the transitionfrom ductile to brittle material removal mechanisms.It is surprising, however, that our measured SR in-creases with dc. It is expected that for a materialwith a low critical depth of cut dc, when the infeed pertool revolution exceeds dc, brittle removal should oc-cur, and hence a higher surface roughness. How-ever, the good correlation between SR and dc in Fig.12 may be due to the fact that ratio EyHk for the
Fig. 11. Correlation of measured SR ~with Zygo MX interferom-eter! with total height Rp of the plastic zone in a crack tip growingunder mode-I ~opening! conditions. The straight-line fit has cor-relation R 5 0.95.
1 August 1996 y Vol. 35, No. 22 y APPLIED OPTICS 4457
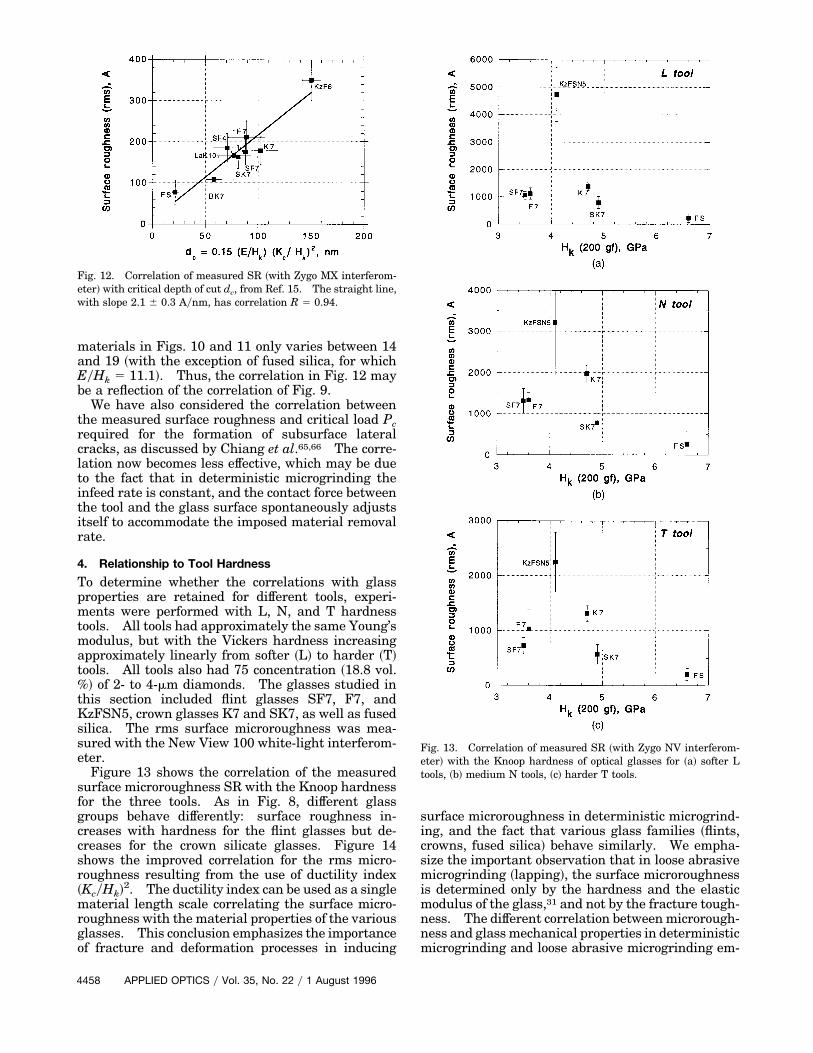
materials in Figs. 10 and 11 only varies between 14and 19 ~with the exception of fused silica, for whichEyHk 5 11.1!. Thus, the correlation in Fig. 12 maybe a reflection of the correlation of Fig. 9.We have also considered the correlation between
the measured surface roughness and critical load Pcrequired for the formation of subsurface lateralcracks, as discussed by Chiang et al.65,66 The corre-lation now becomes less effective, which may be dueto the fact that in deterministic microgrinding theinfeed rate is constant, and the contact force betweenthe tool and the glass surface spontaneously adjustsitself to accommodate the imposed material removalrate.
4. Relationship to Tool Hardness
To determine whether the correlations with glassproperties are retained for different tools, experi-ments were performed with L, N, and T hardnesstools. All tools had approximately the same Young’smodulus, but with the Vickers hardness increasingapproximately linearly from softer ~L! to harder ~T!tools. All tools also had 75 concentration ~18.8 vol.%! of 2- to 4-mm diamonds. The glasses studied inthis section included flint glasses SF7, F7, andKzFSN5, crown glasses K7 and SK7, as well as fusedsilica. The rms surface microroughness was mea-sured with the New View 100 white-light interferom-eter.Figure 13 shows the correlation of the measured
surface microroughness SR with the Knoop hardnessfor the three tools. As in Fig. 8, different glassgroups behave differently: surface roughness in-creases with hardness for the flint glasses but de-creases for the crown silicate glasses. Figure 14shows the improved correlation for the rms micro-roughness resulting from the use of ductility index~KcyHk!
2. The ductility index can be used as a singlematerial length scale correlating the surface micro-roughness with the material properties of the variousglasses. This conclusion emphasizes the importanceof fracture and deformation processes in inducing
Fig. 12. Correlation of measured SR ~with Zygo MX interferom-eter! with critical depth of cut dc, from Ref. 15. The straight line,with slope 2.1 6 0.3 Aynm, has correlation R 5 0.94.
4458 APPLIED OPTICS y Vol. 35, No. 22 y 1 August 1996
surface microroughness in deterministic microgrind-ing, and the fact that various glass families ~flints,crowns, fused silica! behave similarly. We empha-size the important observation that in loose abrasivemicrogrinding ~lapping!, the surface microroughnessis determined only by the hardness and the elasticmodulus of the glass,31 and not by the fracture tough-ness. The different correlation betweenmicrorough-ness and glassmechanical properties in deterministicmicrogrinding and loose abrasive microgrinding em-
Fig. 13. Correlation of measured SR ~with Zygo NV interferom-eter! with the Knoop hardness of optical glasses for ~a! softer Ltools, ~b! medium N tools, ~c! harder T tools.

Fig. 14. Correlation of measured SR ~with Zygo NV interferometer! with ductility index J 5 ~KcyHk!2 for various optical glasses for ~a!
softer L tools, ~b! medium N tools, ~c! harder T tools. Power-law fitting gives an exponent of 1.5 6 0.1 for the dependence of SR on J, withcorrelation R 5 0.92–0.99.
phasizes the differences between two-body and three-body abrasive processes.The results in Fig. 14, with the measurement of the
rms roughness by the New View 100 white-light in-terferometer ~NV!, are consistent with the measure-ment of the roughness with the Maxim laserinterferometer ~MX!, shown in Fig. 9. When thesurface roughness of Fig. 14 is fitted to a power-lawdependence on ductility index J 5 ~KcyHk!
2, we find
rms SR~NV! , Jm. (8)
Exponent m is m 5 1.5 6 0.1, with confidence levelsof 0.92–0.99 for the three bond hardnesses, L, N, andT. In contrast, when the SR measurements by thetwo different interferometers were correlated ~bypower-law curve fitting!, we found
rms SR~MX! ; @rms SR~NV!#n, (9)
where exponent n 5 0.62 6 0.15. The large relativeerror in exponent n is due to the larger variationbetween the two sets of measurements for therougher surfaces.Combining relations ~8! and ~9!, we conclude that
rms SR~MX! ; Jmn. (10)
As product ~mn! is 0.93 6 0.27, we conclude thatrelation ~10! predicts essentially a linear dependenceof the surface roughness measured with the Maximlaser interferometer and ductility index J. This re-sult is consistent with the independently measuredbehavior shown in Fig. 9.
5. Conclusions
We have shown that elastic ~Young’s modulus!, plas-tic ~hardness!, and fracture ~fracture toughness!properties of glasses must all be used in order tocorrelate the glass mechanical properties with thesurface quality resulting from deterministic micro-grinding with bound abrasive tools under specifiedinfeed rate ~or material removal rate! when the pro-cessing parameters ~relative speed, diamond size,and coolant! are constant.The material properties can be conveniently
grouped into a ductility index J 5 ~KcyHk!2, with the
units of length. Thus the creation of surface rough-ness is seen as a competition between fracture andflow processes. Low ductility implies low resultingroughness, which is achieved by a low fracture tough-ness or a high hardness. The ductility index wasshown to correlate surface roughness with glass me-chanical properties across glass groups such as flintand crown silicate glasses, as well as fused silica.The correlation also holds when softer, medium, orharder bond tools are used, or when the surface mi-croroughness is measured by different interferomet-ric methods.The correlation of the surface roughness with plas-
tic and fracture glass properties under deterministicmicrogrinding conditions is distinct from the correla-tion under loose abrasive ~lapping! conditions, inwhich the surface roughness is determined by theelastic and plastic glass properties. Such a distinc-tion is not surprising: deterministic microgrindingproceeds under a specified infeed rate ~i.e., materialremoval rate!, whereas lapping is under constantnominal pressure. Furthermore, lapping is a three-body abrasive process, whereas deterministic micro-grinding is mostly a two-body abrasive process inwhich features involving three-body abrasion mayoccur when a previously bound diamond abrasivegrain is separated from the retaining bond matrix.We have interpreted ductility index J, in a physi-
cally revealing way, as proportional to the size of theplastic zone near the crack tip of a crack growingunder mode-I ~i.e., opening! conditions. We haveshown that the fracture toughness of optical glassescan be conveniently measured by using Vickers mi-croindentation. Such measurement of the near-sur-face glass mechanical properties is advantageous inthat many measurements can be done on a singlespecimen. For glasses that show densification, how-ever, such as fused silica, microindentation providesan overestimate of the fracture toughness. Forglasses that deform by flow, as most optical glassescontaining network modifiers do, microindentationfracture toughness measurements are in good agree-
1 August 1996 y Vol. 35, No. 22 y APPLIED OPTICS 4459

ment with the fracture toughness as measured bybulk methods.In our study we have assumed that the mechan-
ical response of glasses may be described in terms offour fundamental properties, i.e., elastic Young’smodulus E, Poisson ratio n, plastic hardness H~Vickers Hv or Knoop Hk!, and fracture toughnessKc. Still, such a set of mechanical properties isincomplete in several aspects. For example, wehave not included hardening effects describing theincrease of the flow stress with continuing deforma-tion, or rate effects correlating the rate of subcriticalcrack growth to applied loads or stress intensityfactors,44,51,64 any chemomechanical effects on theglass properties, such as the effect of slurry chem-istry,17 or the possibility that the glass mechanicalproperties at very small depths ~say, less than 0.1mm! may be different from the measured propertieseither at deeper penetrations or by bulk methods.Of course, characterization at such low depths re-quires sophisticated experimental techniques, suchas nanoindentation. We note that subcriticalcrack growth is very sensitive to the chemical en-vironment within which crack growth occurs. Weare currently investigating the effects of variouscoolants on various glass mechanical properties.In this study we have concentrated on the correla-
tion of glass mechanical properties with surface fea-tures such as microroughness and subsurfacedamage for a variety of optical glasses, all finishedunder the same deterministic microgrinding processparameters. Of course, from the optics manufactur-ing perspective, an important complementary issue isthe combination of process parameters, such as in-feed rate, tool relative speed, coolant, and so on,which, for a given optical glass may be used in orderto predict the resulting surface microroughness orother surface features. We are currently investigat-ing the construction of such optics manufacturingmaps for deterministic microgrinding processes.We are hopeful that the successful completion of suchmaps will permit the rational prediction of the sur-face features resulting from a given combination ofprocess parameters and material properties.
Appendix A: Hill’s Extraction of Uniaxial Yield Stressfrom the Hardness
The model of Hill58 examines a spherical cavity in aninfinite solid. The cavity, originally of vanishing ra-dius, is under internal pressure p, so that its currentradius is a. The boundary between the plastic andelastic zones is at r 5 b, where r is the sphericaldistance from the cavity center. The material out-side the cavity is elastic, perfectly plastic withYoung’s modulus E, Poisson ratio n, and uniaxialstress ~in tension or compression! sY.The requirement of equilibrium and radial traction
continuity across elastic–plastic boundary r 5 b
4460 APPLIED OPTICS y Vol. 35, No. 22 y 1 August 1996
yields
p 523 F1 1 3 lnSbaDGsY. (A1)
Calculation of the elastic strains permits the deter-mination of the ~finite! radial displacements, yielding
SbaD3
5E
3~1 2 n!sY. (A2)
In the Hill model of indentation Vickers hardness,pressure p required to produce radius a is identifiedwith the average pressure under the indenter, i.e.,the hardness. Thus
p3Hv. (A3)
Relations ~A1!–~A3! and elimination of ratio bya per-mit the correlation of Vickers hardness Hv and un-iaxial yield stress sY, which is found from solving thetranscendental equation
~EyHv!
3~1 2 n!
1~sYyHv!
5 expF21 13y2
~sYyHv!G (A4)
for ratio sYyHv, in terms of measurable mechanicalproperties such as the Young’s modulus, the Vickersmicrohardness, and the Poisson ratio.
We acknowledge insightful discussions with D.Quesnel, S. J. Burns, and Y. Y. Zhou from the De-partment of Mechanical Engineering, and with A.Lindquist from the COM at the University of Roch-ester. We also acknowledge financial support by theNational Science Foundation (grant MSS-8857096).
References1. H. H. Pollicove and D. T. Moore, “Optics manufacturing tech-
nology moves toward automation,” Laser Focus World 27 (3),145–148 ~1991!.
2. H. H. Pollicove and D. T. Moore, “Center for Optics Manufac-turing overview,” inOptical Fabrication and Testing, Vol. 24 of1992 OSA Technical Digest Series ~Optical Society of America,Washington, D.C., 1992!, pp. 44–47.
3. D. Golini and W. Czajkowski, “Microgrinding makes ultra-smooth optics fast,” Laser Focus World 28 (7), 146–150 ~1992!.
4. D. Golini, A. Lindquist, M. Atwood, and C. Ferreira, “Influenceof process parameters in deterministic microgrinding,” in Op-tical Fabrication and Testing, Vol. 13 of 1994 OSA TechnicalDigest Series ~Optical Society of America, Washington, D.C.,1994!, pp. 28–31.
5. H. H. Pollicove, D. Golini, and J. Ruckman, “Computer aidedoptics manufacturing,” Opt. Photon. News 15–19 ~June 1994!.
6. J. Liedes, “Opticam SM update,” in Current Developments inOptical Design and Optical Engineering II, R. E. Fischer andW. J. Smith, eds., Proc. SPIE 1752, 153–157 ~1992!.
7. J. C. Lambropoulos, P. D. Funkenbusch, D. J. Quesnel, S. M.Gracewski, and R. F. Gans, “Mechanics andmaterials issues inoptics manufacturing,” in Proceedings of the Ninth AnnualMeeting of the American Society for Precision Engineering,~American Society for Precision Engineering, Raleigh, N.C.,1994!, pp. 370–373.
8. J. C. Lambropoulos, “Mechanical, thermal, diffusional, andgeometrical length scales in polishing and grinding,” in Pro-ceedings of the Ninth Annual Meeting of the American Society

for Precision Engineering ~American Society for Precision En-gineering, Raleigh, N.C., 1994!, pp. 97–100.
9. G. S. Khodakov and Y. A. Glukhov, “Fine grinding of opticalcomponents with a diamond tool,” Sov. J. Opt. Technol. 48,428–435 ~1981!.
10. P. D. Funkenbusch and S. M. Gracewski, “Tool property char-acterization,” presented at the Optifab 1994 Conference, Roch-ester, N.Y., 17–18 October 1994.
11. P. D. Funkenbusch, Y. Y. Zhou, T. Takahashi, D. J. Quesnel,and J. C. Lambropoulos, “Characterization of fine abrasiveparticles for optical fabrication,” in International Conferenceon Optical Fabrication and Testing, T. Kasai, ed., Proc. SPIE2576, 46–52 ~1995!.
12. A. G. Evans and D. B. Marshall, “Wear mechanisms in ceram-ics,” in Fundamentals of Friction and Wear of Materials, D. A.Rigney, ed. ~American Society for Metals, Metals Park, Ohio,1981!, pp. 441–452.
13. T. S. Izumitani, Optical Glass ~American Institute of Physics,New York, N.Y., 1986!.
14. S. Yoshida and H. Ito, “The present and future of ductile-regime grinding of optical parts,” Bull. Jpn. Soc. Precis. Eng.24, 239–243 ~1990!.
15. T. G. Bifano, T. A. Dow, and R. O. Scattergood, “Ductile-regimegrinding: a new technology for machining brittle materials,”J. Eng. Ind. 113, 184–189 ~1991!.
16. D. Golini and S. D. Jacobs, “Transition between brittle andductile mode in loose abrasive grinding,” in Advanced OpticalManufacturing and Testing, L. R. Baker, P. B. Reid, and G. M.Sanger, eds., Proc. SPIE 1333, 80–91 ~1990!.
17. D. Golini and S. D. Jacobs, “Physics of loose abrasive micro-grinding,” Appl. Opt. 30, 2761–2777 ~1991!.
18. Y. Namba and M. Abe, “Ultraprecision grinding of opticalglasses to produce super-smooth surfaces,” Ann. CIRP 42,417–420 ~1993!.
19. M. G. Schinker, “Subsurface damage mechanisms at high-speed ductile machining of optical glasses,” Precis. Eng. 13,208–218 ~1991!.
20. N. J. Brown and B. A. Fuchs, “Brittle to shear grinding modetransition for loose abrasive grinding,” Report UCRL-100043(Lawrence Livermore National Laboratory, Livermore, Calif.,1988).
21. N. J. Brown and B. A. Fuchs, “Shear mode grinding,” in 43rdAnnual Symposium on Frequency Control ~IEEE, New York,1989!, pp. 606–610.
22. J. C. Lambropoulos, T. Fang, A. Lindquist, and D. Golini,“Mechanics aspects of the Twyman effect under loose abrasivegrinding, loose abrasive microgrinding, and deterministic mi-crogrinding conditions,” Ceram. Trans. ~to be published!.
23. O. Podzimek, “Residual stress and deformation energy underground surfaces of brittle solids,” Ann. CIRP 35, 397–400~1986!.
24. O. Podzimek, “Residual stress and deformation energy underground surfaces of brittle solids,” Tech. Rep. WB-85-16~Twente University of Technology, Enschede, The Nether-lands, 1986!.
25. O. Podzimek, “Deformation energy under optical surfaces,” inHigh Power Lasers: Sources, Laser–Material Interactions,High Excitations, and Fast Dynamics, E. W. Kreutz, A. Quen-zer, and D. Schuoecker, eds., Proc. SPIE 801, 221–225 ~1987!.
26. N. J. Brown, B. A. Fuchs, P. P. Hed, and I. F. Stowers, “Theresponse of isotropic brittle materials to abrasive processes,” in43rd Annual Symposium on Frequency Control ~IEEE, NewYork, 1989!, pp. 611–616.
27. F. K. Aleinikov, “The effect of certain physical and mechanicalproperties on the grinding of brittle materials,” Sov. Phys.Tech. Phys. 27, 2529–2538 ~1957!.
28. G. S. Khodakov, V. P. Korovkin, and V. M. Altshuler, “Physical
principles of the fine grinding of optical glass with a diamondtool,” Sov. J. Opt. Technol. 47, 552–560 ~1980!.
29. D. F. Edwards and P. P. Hed, “Optical glass fabrication tech-nology. 1: fine grinding mechanism using bound diamondabrasives,” Appl. Opt. 26, 4670–4676 ~1987!.
30. D. F. Edwards and P. P. Hed, “Optical glass fabrication tech-nology. 2: relationship between surface roughness and sub-surface damage,” Appl. Opt. 26, 4677–4680 ~1987!.
31. M. Buijs and K. Korpel-Van Houten, “A model for lapping ofglass,” J. Mater. Sci. 28, 3014–3020 ~1993!.
32. A. L. Ardamatskii, “Principles of diamond tool operation,” Sov.J. Opt. Technol. 47, 613–622 ~1980!.
33. H. Li and R. C. Bradt, “The indentation loadysize effect and themeasurement of the hardness of vitreous silica,” J. Non-Cryst.Solids 146, 197–212 ~1992!.
34. T. S. Izumitani, “Lapping hardness of optical glass,” HoyaTech. Rep. HGW-O-7E ~Hoya Glass Works, Tokyo, Japan,1971!.
35. R. F. Cook and G. M. Pharr, “Direct observation and analysisof indentation cracking in glasses and ceramics,” J. Am. Ce-ram. Soc. 73, 787–817 ~1990!.
36. M. Sakai and R. C. Bradt, “Fracture toughness testing of brit-tle materials,” Int. Mater. Rev. 38, 53–78 ~1993!.
37. A. G. Evans and E. A. Charles, “Fracture toughness determi-nation by indentation,” J. Am. Ceram. Soc. 59, 371–372 ~1976!.
38. A. G. Evans, “Fracture toughness: the role of indentationtechniques,” in Fracture Mechanics Applied to Brittle Materi-als, S. W. Freiman, ed. ~American Society for Testing andMaterials, Philadelphia, Pa., 1979!, pp. 112–135.
39. B. R. Lawn, A. G. Evans, and D. B. Marshall, “Elasticyplasticindentation damage in ceramics: the medianyradial cracksystem,” J. Am. Ceram. Soc. 63, 574–581 ~1980!.
40. G. R. Anstis, P. Chanticul, B. R. Lawn, and D. B. Marshall, “Acritical evaluation of indentation techniques for measuringfracture toughness: I. direct crack measurements,” J. Am.Ceram. Soc. 64, 533–543 ~1981!.
41. J. Lankford, “Indentationmicrofracture in the Palmqvist crackregime: implications for fracture toughness evaluation by theindentation method,” J. Mater. Sci. Lett. 1, 493–495 ~1982!.
42. K. Niihara, R.Morena, and D. P. H. Hasselman, “Evaluation ofKIc of brittle solids by the indentation method with low crack-to-indent ratios,” J. Mater. Sci. Lett. 1, 13–16 ~1982!.
43. D. K. Shetty, I. G. Wright, P. N. Mincer, and A. H. Clauer,“Indentation fracture of WC-Co cermets,” J. Mater. Sci. 20,1873–1882 ~1985!.
44. I. J. McColm, Ceramic Hardness ~Plenum, New York, 1990!.45. R. L. K. Matsumoto, “Evaluation of fracture toughness deter-
mination methods as applied to ceria-stabilized tetragonal zir-conia polycrystal,” J. Am. Ceram. Soc. 70, C366–C368 ~1987!.
46. Schott Glass Catalog, ~Schott Glass Technologies, Inc., Dur-yea, Pa., 1992!, Pub. 10000.
47. M. Cumbo, The Institute of Optics, University of Rochester,Rochester, New York 14627 ~personal communication!, 1992.
48. M. Cumbo, “Chemo-mechanical interactions in optical polish-ing,” Ph.D. dissertation ~University of Rochester, Rochester,New York, 1993!.
49. I. M. Androsov, S. N. Dub, and V. P. Maslov, “Unique featuresassociated with using the indentation method for determiningthe crack resistance of brittle materials,” Sov. J. Opt. Technol.56, 691–693 ~1989!.
50. S. M. Wiederhorn, H. Johnson, A. M. Diness, and A. H. Heuer,“Fracture of glass in vacuum,” J. Amer. Ceram. Soc. 57, 337–341 ~1974!.
51. S.Wiederhorn andD. E. Roberts, “Fracturemechanics study ofskylab windows,” Rep. 10892, prepared for NASA MannedSpacecraft Center, Structures and Mechanics Division, PR1-168-022, T-5330A ~National Bureau of Standards, Washing-ton, D.C., 1972!.
1 August 1996 y Vol. 35, No. 22 y APPLIED OPTICS 4461

52. R. F. Cook and B. R. Lawn, “A modified indentation toughnesstechnique,” J. Am. Ceram. Soc. 66, C200–C201 ~1983!.
53. A. Arora, D. B. Marshall, and B. R. Lawn, “Indentation defor-mationyfracture of normal and anomalous glasses,” J. Non-Cryst. Solids 31, 415–428 ~1979!.
54. J. D. Mackenzie, “High-pressure effects on oxide glasses: I.densification in rigid state,” J. Am. Ceram. Soc. 46, 461–470~1963!.
55. J. C. Lambropoulos, T. Fang, S. Xu, and S. M. Gracewski,“Constitutive law for the densification of fused silica, withapplications in polishing and microgrinding,” in Optical Man-ufacturing and Testing, V. J. Doherty, ed., Proc. SPIE 2536,275–286 ~1995!.
56. S. M. Wiederhorn, “Fracture surface energy of glass,” J. Am.Ceram. Soc. 52, 99–105 ~1969!.
57. L. M. Barker, “Short bar specimens for KIc measurements,” inFracture Mechanics Applied to Brittle Materials, S. W.Freiman, ed. ~American Society for Testing and Materials,Philadelphia, Pa., 1979!, pp. 73–82.
58. R. Hill, The Mathematical Theory of Plasticity ~Oxford U.Press, New York, 1950!.
59. H. H. Karow, Fabrication Methods for Precision Optics ~Wiley,New York, 1993!.
4462 APPLIED OPTICS y Vol. 35, No. 22 y 1 August 1996
60. A. Lindquist, S. D. Jacobs, and A. Feltz, “Surface preparationtechnique for rapid measurement of subsurface damagedepth,” in Optical Computing, Vol. 9 of 1989 OSA TechnicalDigest Series ~Optical Society of America, Washington, D.C.,1989!, paper SMC3-1y57.
61. Y. Zhou, P. D. Funkenbusch, D. J. Quesnel, D. Golini, and A.Lindquist, “Effect of etching and imaging mode on the mea-surement of subsurface damage in microground optical glass-es,” J. Am. Ceram. Soc. 77, 3277–3280 ~1994!.
62. B. R. Lawn, T. Jensen, and A. Arora, “Brittleness as an inden-tation size effect,” J. Mater. Sci. 11, 573–575 ~1975!.
63. T. S. Izumitani and I. Suzuki, “Indentation hardness and lap-ping hardness of optical glass,” Glass Technol. 14, 35–41~1973!.
64. T. L. Anderson, Fracture Mechanics: Fundamentals and Ap-plications, 2nd ed. ~CRC Press, Cleveland, Ohio, 1995!.
65. S. S. Chiang, D. B. Marshall, and A. G. Evans, “The responseof solids to elasticyplastic indentation, I. stresses and residualstresses,” J. Appl. Phys. 53, 298–311 ~1982!.
66. S. S. Chiang, D. B. Marshall, and A. G. Evans, “The responseof solids to elasticyplastic indentation, II. fracture initiation,”J. Appl. Phys. 53, 312–317 ~1982!.
Copyright © 2022 FDOKUMEN