
Third-order nonlinear optical properties of bismuth-borate glasses measured by conventional and...
7
Third order nonlinear optical properties of bismuth zinc borate glasses B. Shanmugavelu, V. V. Ravi Kanth Kumar, R. Kuladeep, and D. Narayana Rao Citation: Journal of Applied Physics 114, 243103 (2013); doi: 10.1063/1.4858422 View online: http://dx.doi.org/10.1063/1.4858422 View Table of Contents: http://scitation.aip.org/content/aip/journal/jap/114/24?ver=pdfcov Published by the AIP Publishing Articles you may be interested in Optical properties of Dy3+ doped bismuth zinc borate glass and glass ceramics AIP Conf. Proc. 1447, 579 (2012); 10.1063/1.4710136 Optical Properties of Alkaline Earth Ions Doped Bismuth Borate Glasses AIP Conf. Proc. 1349, 545 (2011); 10.1063/1.3605974 Effect of SnO addition on optical absorption of bismuth borate glass and photocatalytic property of the crystallized glass Appl. Phys. Lett. 92, 141902 (2008); 10.1063/1.2903151 Third-order nonlinear optical properties of bismuth-borate glasses measured by conventional and thermally managed eclipse Z scan J. Appl. Phys. 101, 033115 (2007); 10.1063/1.2434940 Third-order nonlinear optical properties of chalcogenide glasses Appl. Phys. Lett. 70, 925 (1997); 10.1063/1.118443 [This article is copyrighted as indicated in the article. Reuse of AIP content is subject to the terms at: http://scitation.aip.org/termsconditions. Downloaded to ] IP: 14.139.69.34 On: Wed, 11 Jun 2014 11:09:54
-
Upload
independent -
Category
Documents
-
view
0 -
download
0
Transcript of Third-order nonlinear optical properties of bismuth-borate glasses measured by conventional and...

Third order nonlinear optical properties of bismuth zinc borate glassesB. Shanmugavelu, V. V. Ravi Kanth Kumar, R. Kuladeep, and D. Narayana Rao
Citation: Journal of Applied Physics 114, 243103 (2013); doi: 10.1063/1.4858422 View online: http://dx.doi.org/10.1063/1.4858422 View Table of Contents: http://scitation.aip.org/content/aip/journal/jap/114/24?ver=pdfcov Published by the AIP Publishing Articles you may be interested in Optical properties of Dy3+ doped bismuth zinc borate glass and glass ceramics AIP Conf. Proc. 1447, 579 (2012); 10.1063/1.4710136 Optical Properties of Alkaline Earth Ions Doped Bismuth Borate Glasses AIP Conf. Proc. 1349, 545 (2011); 10.1063/1.3605974 Effect of SnO addition on optical absorption of bismuth borate glass and photocatalytic property of thecrystallized glass Appl. Phys. Lett. 92, 141902 (2008); 10.1063/1.2903151 Third-order nonlinear optical properties of bismuth-borate glasses measured by conventional and thermallymanaged eclipse Z scan J. Appl. Phys. 101, 033115 (2007); 10.1063/1.2434940 Third-order nonlinear optical properties of chalcogenide glasses Appl. Phys. Lett. 70, 925 (1997); 10.1063/1.118443
[This article is copyrighted as indicated in the article. Reuse of AIP content is subject to the terms at: http://scitation.aip.org/termsconditions. Downloaded to ] IP:
14.139.69.34 On: Wed, 11 Jun 2014 11:09:54

Third order nonlinear optical properties of bismuth zinc borate glasses
B. Shanmugavelu,1 V. V. Ravi Kanth Kumar,1,a) R. Kuladeep,2 and D. Narayana Rao2
1Department of Physics, Pondicherry University, Puducherry 605 014, India2School of Physics, University of Hyderabad, Hyderabad 500046, Andhra Pradesh, India
(Received 8 October 2013; accepted 10 December 2013; published online 30 December 2013)
Third order nonlinear optical characterization of bismuth zinc borate glasses are reported here
using different laser pulse durations. Bismuth zinc borate glasses with compositions
xBi2O3-30ZnO-(70-x) B2O3 (where x¼ 30, 35, 40, and 45 mol. %) have been prepared by melt
quenching method. These glasses were characterized by Raman, UV-Vis absorption, and Z scan
measurements. Raman and UV-Vis spectroscopic results indicate that non-bridging oxygens
increase with increase of bismuth content in the glass. Nonlinear absorption and refraction
behavior in the nanosecond (ns), picosecond (ps), and femtosecond (fs) time domains were studied
in detail. Strong reverse saturable absorption due to dominant two-photon absorption (TPA) was
observed with both ps and fs excitations. In the case of ns pulse excitations, TPA and free-carrier
absorption processes contribute for the nonlinear absorption. Two-photon absorption coefficient (b)
and the absorption cross section due to free carriers (re) are estimated by theoretical fit of the open
aperture Z-scan measurements and found to be dependent on the amount of bismuth oxide in the
glass composition. In both ns and fs regimes the sign and magnitude of the third order nonlinearity
are evaluated, and the optical limiting characteristics are also reported. VC 2013 AIP Publishing LLC.
[http://dx.doi.org/10.1063/1.4858422]
I. INTRODUCTION
Materials that possess good nonlinear optical (NLO)
properties have received much attention because of their
potential applications in various photonic devices.1 A wide
range of materials such as crystals, nanomaterials, quantum
dots, thin films, glasses, glass ceramics, and polymers have
been investigated for their nonlinear optical properties.2–13
Among several interesting candidates for photonic applica-
tions, glasses are receiving special attention because of their
good chemical and mechanical stability and their ease in fabri-
cating waveguides and fibers. Owing to the excellent adjust-
ability of compositions, glasses can be prepared and explored
to tune the desired property for a specific application. Glasses
having large nonlinear refractive index, fast response time,
and nonlinear absorption coefficient are promising materials
for nonlinear optical devices such as ultrafast optical switches
and optical power limiters. Therefore much effort is also gone
in the development of heavy metal oxide based glasses for
photonic applications.14–16 The presence of heavy-metal
oxides such as Bi2O3, PbO, and WO3 in the glasses increase
the nonlinear refractive index of a medium. The nonlinear op-
tical properties can be tailored by choosing the appropriate
oxides with large hyperpolarizabilities and large transmit-
tance. In particular glasses containing bismuth oxide attracts
much attention because of their high refractive indices and
large transmission window in the visible and near infrared.
They are also very stable and moisture resistant. The presence
of bismuth oxide in borate, phosphate, germinates, and tellur-
ite glasses has been investigated.17–20 Among the various
glass systems borate glasses are frequently used as good host
matrices for incorporating heavy metal oxides. Recently,
Gomes et al. studied the influence of bismuth oxide in borate
glasses on third order nonlinear optical properties by conven-
tional and thermally managed eclipse Z-scan methods and op-
tical limiting measurements.21,22 They found enhancement of
two-photon absorption cross section and free carrier absorp-
tion cross section with the increase of bismuth oxide content
in the zinc borate glass. The nonlinear optical properties of the
glasses can be enhanced by increasing the amount of bismuth
oxide concentration in the sample. This drives us to optimize
the bismuth oxide content in the glass and develop new
glasses with high optical nonlinearity. Keeping this in view,
zinc borate glasses are prepared for various bismuth oxide
concentrations and reported the thermal and electrical proper-
ties recently.23,24 In the present work, the nonlinear optical
properties of glasses as a function of bismuth oxide concentra-
tion have been investigated.
II. EXPERIMENTAL DETAILS
The glasses with compositions of xBi2O3-30ZnO-(70-x)
B2O3 (where x¼ 30, 35, 40, and 45 mol. %), hereafter
denoted as BZB30, BZB35, BZB40, and BZB45 were pre-
pared by melt quenching technique using analar grade chem-
icals Bi2O3, ZnO, and H3BO3. Each batch of the chemicals
in an appropriate composition were mixed and melted in a
platinum crucible in the temperature range 900–1000 �C for
1 h. The melt was swirled frequently to ensure homogeneity.
The melt was then quickly quenched by pouring and pressing
between two stainless steel plates. The prepared glasses were
annealed to remove the thermal stress. The glasses were then
ground and finally polished to a thickness of 1 mm to make
them suitable for optical measurements. The Raman spectra
have been recorded in the range of 50–2000 cm�1 using
a)Author to whom correspondence should be addressed. Electronic mail:
[email protected]. Tel.: þ91 413 2654406. Fax: þ91 413 2655368.
0021-8979/2013/114(24)/243103/6/$30.00 VC 2013 AIP Publishing LLC114, 243103-1
JOURNAL OF APPLIED PHYSICS 114, 243103 (2013)
[This article is copyrighted as indicated in the article. Reuse of AIP content is subject to the terms at: http://scitation.aip.org/termsconditions. Downloaded to ] IP:
14.139.69.34 On: Wed, 11 Jun 2014 11:09:54

Renishaw inVia Raman microscope with 488 nm argon ion
laser. UV-visible absorption spectra were recorded using
Carry 5000 UV-Vis-NIR spectrophotometer. The nonlinear
absorption and refraction properties of the glasses are studied
using 800 nm femtosecond (fs), 532 nm picosecond (ps), and
nanosecond (ns) pulses through the standard single beam
Z-scan technique.25 The ns laser source was a frequency
doubled Nd:YAG laser (INDI-40, Spectra-Physics) with a
6 ns pulse duration and a repetition rate of 10 Hz at a 532 nm
wavelength, ps laser source was a frequency doubled,
Q-switched Nd:YAG (EKSPLA-2143a) delivering 30 ps
laser pulses at 532 nm at a repetition rate of 10 Hz and fs
laser was a Spectra-Physics Ti-sapphire regenerative ampli-
fier with �110 fs pulse duration, operated at 1 kHz repetition
rate and 800 nm wavelength. Z-scan studies were carried out
by focusing the input beam on to the sample using a lens of
120 mm focal length forming 27 lm and 40 lm spot sizes at
the focus with 532 nm and 800 nm, respectively. Similar
peak intensities were maintained in the scans to ensure iden-
tical experimental conditions for all the glass samples.
Closed aperture scans were performed at lower intensities to
avoid contribution from the higher order nonlinear effects.
The experiments were repeated more than once and the best
data were used for obtaining the nonlinear optical coeffi-
cients from the best fits.
III. RESULTS AND DISCUSSION
A. Absorption and Raman studies
The linear optical absorption spectra of the glasses are
shown in Fig. 1. The absorption edge of these glasses shifts
to longer wavelengths with increase of Bi2O3 content. The
optical band gap value of the samples were determined from
Tauc plots,26 shown in Fig. 2, and found to be 2.71 eV
(BZB30), 2.59 eV (BZB35), 2.47 eV (BZB40), and 2.13 eV
(BZB45). The optical bandgap decreases with increase of
Bi2O3 content. This indicates that increase of bismuth oxide
content increases the non-bridging oxygens (NBOs) in the
glass matrix. NBOs are oxygen atoms bonded to only one
network cation and negatively charged, which is important
for nonlinear optical materials.11
The Raman spectra of the glasses are shown in Fig. 3.
The spectra exhibit bands at 73, 136, 360, 600, 935, and
1300 cm�1. The low frequency band observed at 73 cm�1 is
the characteristic boson peak of glasses.27 The band located
at 136 cm�1 is assigned to the heavy metal ion vibrations.28
The band at 360 cm�1 is attributed to bridging anion modes
of Bi–O–Bi vibrations in the distorted BiO6 octahedra.28 The
band located at around 600 cm�1 is assigned to the Bi–O�
stretching vibration (i.e., vibration of bismuth associated
with non-bridging oxygen) of the BiO6 octahedral units.28
The band centered around 935 cm�1 is ascribed to the ortho-
borate groups.29 The band at 1300 cm�1 is due to the stretch-
ing of the terminal B–O� bonds of the pyroborate groups.29
The intensity of the band centered at around 600 cm�1
increase with the increase of Bi2O3 content, which indicates
that BiO6 groups containing NBOs increases. The band pres-
ent at 1300 cm�1 shifts to lower wavenumber side with
FIG. 1. UV-Vis absorption spectra of BZB glasses with different Bi2O3
concentrations.
FIG. 2. Tauc’s plots of BZB glasses with different Bi2O3 concentrations.
FIG. 3. Raman spectra of BZB glasses with different Bi2O3 concentrations.
243103-2 Shanmugavelu et al. J. Appl. Phys. 114, 243103 (2013)
[This article is copyrighted as indicated in the article. Reuse of AIP content is subject to the terms at: http://scitation.aip.org/termsconditions. Downloaded to ] IP:
14.139.69.34 On: Wed, 11 Jun 2014 11:09:54

decrease in intensity as the Bi2O3 content increases showing
the enhancement of asymmetric vibration.30
B. Z scan measurements
The nonlinear absorption and refraction measurements
were carried out using Ti:sapphire femtosecond laser. Figure 4
shows representative open aperture Z-scan curves of the glasses
with different Bi2O3 concentration recorded with 800 nm using
�110 fs pulses at a peak irradiance of 220 GW cm�2. A strong
reverse saturable absorption (RSA) kind of behavior is
observed for all the glass samples. The magnitude of the non-
linear absorption coefficient was determined for each sample
by analyzing the light attenuation through the sample given by
dIðzÞdz¼ �a0IðzÞ � bI2ðzÞ � cI3ðzÞ; (1)
where
Iðz; tÞ ¼ I00
x20
x2 zð Þ
!:exp
�2r2
x2 zð Þ
!:exp
�t2
s2p
!;
xðzÞ ¼ x0 1þ�
z
z0
�2" #1
2
;
z0 ¼px2
0
k:
a0 is the linear absorption coefficient, b is the two photon
absorption coefficient (TPA), c is the three photon absorption
coefficient (3PA), z0 is the Rayleigh range, x0 is the beam
waist at focus, I is the intensity as a function of r, t, and z, I00
is peak intensity at the focus of the Gaussian beam, and sp is
the input pulse width used. The differential equations are
solved numerically using Runge-Kutta fourth order method.
The differential equations are first de-coupled and then inte-
grated over time, length, and along the radial direction.
Assuming the input beam to be a Gaussian, the limits of inte-
gration for r, t, and z are varied from 0 to1, �1 to1, and
0 to L (length of the sample), respectively. Typical number
of slices used for r, t, and z are 30, 20, and 5, respectively.
The two-photon absorption coefficient b and three-photon
absorption coefficient c are then estimated through least
square fit of the experimental data. The Z-scan curves
recorded at 60 and 220 GW/cm�2 are found to be best fitted
with TPA alone and the 3PA (c) contribution is negligible.
However it is observed that c makes a small contribution at
higher intensities. The estimated value of c at 705 GW/cm�2
is found to be 0.42� 10�24 cm3 W�2 which is very low.
Observed open aperture Z-scan experimental data were
fitted with the Eq. (1) and obtained best fit parameters are
listed in Table I. Solid lines in figure represent theoretical fit
obtained by using Eq. (1). Estimated two photon absorption
coefficient values of the glasses for various Bi2O3 concentra-
tions are given in Table I. The two photon absorption coeffi-
cient increases with increase of Bi2O3 content; this can be
attributed to the increase in the NBOs content. Since NBOs
are less stable and weakly bound to the boron or bismuth
atoms, its valence electrons are easily deformable by the
laser electromagnetic field, resulting in larger nonlinear-
ities.11 The Raman and absorption studies also indicate that
NBOs increase with increase of bismuth oxide concentration
in the glasses. Figure 5 illustrates the typical closed aperture
Z-scan curve obtained for BZB45 glass sample with a peak
intensity of 9.4 GW cm2. Closed aperture Z-scan experiments
on the glass samples confirm that they exhibit positive nonli-
nearity. It may be noted that the experiments were carried
out with 1 KHz rep rate and if thermal nonlinearity was to
play a role, then negative nonlinearity might have been
observed. To eliminate the contribution of nonlinear
absorption the closed aperture data was obtained at a lower
FIG. 4. Open aperture Z-scan curves of the BZB glass samples of different
Bi2O3 concentrations with 800 nm, 110 fs pulses. Solid curves are the theo-
retical fit to the experimental data.
TABLE I. Measured values of two photon absorption coefficients (b), free carrier absorption cross section (re), and optical limiting threshold values of bis-
muth zinc borate glasses under fs, ps, and ns regimes.
k ¼ 800 nm, sp¼ 110 fs k¼ 532 nm, sp¼ 30 ps k¼ 532 nm, sp¼ 6 ns
Sample b (cm/GW) Optical limiting threshold (GW/cm2) b (cm/GW) re (�10�19 cm2) Optical limiting threshold (GW/cm2)
BZB30 0.18 61.2 7.2 58.0 0.347
BZB35 0.47 49.6 12.5 83.0 0.304
BZB40 0.78 37.4 17.8 126.0 0.225
BZB45 1.04 27.8 24.6 157.0 0.190
BZH221,22 <0.01 … 5.5 6 0.2 6.7 …
243103-3 Shanmugavelu et al. J. Appl. Phys. 114, 243103 (2013)
[This article is copyrighted as indicated in the article. Reuse of AIP content is subject to the terms at: http://scitation.aip.org/termsconditions. Downloaded to ] IP:
14.139.69.34 On: Wed, 11 Jun 2014 11:09:54

intensities and the data has been divided with the open aper-
ture data. The normalized curve is shown in Fig. 5.
The closed aperture data were fitted with the Eqs. (2)
and (3) (Ref. 25)
TCA ¼ 1� 4D/0ðz=z0Þ½1þ ðz=z0Þ2�½9þ ðz=z0Þ2�
; (2)
where D/0 is the phase change of the laser beam due to non-
linear refraction. D/0 value is estimated by fitting the experi-
mental data
n2ðcm2W�1Þ ¼ jD/0jk2pI00Lef f
: (3)
The magnitude of the nonlinear refractive index n2 evaluated
is found to be þ0.98 � 10�15 cm2 W�1 and þ1.5 � 10�15
cm2 W�1 for BZB30 and BZB45 glass samples, respectively.
It indicates that the nonlinear refractive index increases with
increase of bismuth oxide content in the glass.
Z scan measurements were also performed at 532 nm in
both ps and ns regimes. Figure 6 shows the respective open
aperture scan data of glasses with different Bi2O3 concentra-
tion obtained with 532 nm, 30 ps pulses. The reverse satura-
ble absorption is observed for all the glass samples at
4.28 GW cm�2. For the ps and ns data, the contribution due
to 3PA (c) is neglected. Observed open aperture Z-scan ex-
perimental data were fitted with the Eq. (1) (solid line in Fig.
6), and obtained best fit parameters are listed in Table I. In
this case also estimated two photon absorption coefficient
values of the glasses were found to be dependent on the
amount of bismuth oxide in the glass composition and attrib-
uted to more NBOs.
Z-scan measurements were also performed at 532 nm, 6 ns
pulses. Figure 7 shows representative open aperture Z-scan
curves of the glasses with different Bi2O3 concentration
recorded with 532 nm, 6 ns pulses at a peak irradiance of
1.18 GW cm�2. The open aperture Z-scan studies revealed
RSA behavior of the glasses with different Bi2O3 concentration.
The free carrier absorption (FCA) cross section was determined
for each sample by analyzing the light attenuation through the
samples, that is described by
dIðzÞdz¼ �a0IðzÞ � bI2ðzÞ � reNIðzÞ; (4)
where re is the free carrier absorption cross section and N
being the photogenerated free-carrier density governed by
the equation
dN
dt¼ a0IðzÞ
�hxþ bI2ðzÞ
2�hx: (5)
For a Gaussian laser pulse represented by Iðz; tÞ ¼ IðzÞexpð�t2=s2
pÞ, where sp is the laser duration, one obtains
N ¼ ½ða0spffiffiffipp
=�hxÞIðzÞ� þ ½ffiffiffiffiffiffiffiffip=2
pðbsp=2�hxÞI2ðzÞ�. After
substituting in Eq. (4), this leads to
FIG. 5. Closed aperture Z-scan curve of the BZB45 glass sample at 800 nm,
110 fs pulses. Solid line is the theoretical fit with Eq. (2).
FIG. 6. Open aperture Z-scan curves of the BZB glass samples of different
Bi2O3 concentrations with 532 nm, 30 ps pulses. Solid curves are the theo-
retical fit to the experimental data.
FIG. 7. Open aperture Z-scan curves of the BZB glass samples of different
Bi2O3 concentrations with 532 nm, 6 ns pulses. Solid curves are the theoreti-
cal fit to the experimental data.
243103-4 Shanmugavelu et al. J. Appl. Phys. 114, 243103 (2013)
[This article is copyrighted as indicated in the article. Reuse of AIP content is subject to the terms at: http://scitation.aip.org/termsconditions. Downloaded to ] IP:
14.139.69.34 On: Wed, 11 Jun 2014 11:09:54
dIðzÞdz¼ �½a0 þ bþ ðrea0sp
ffiffiffipp
=�hx� �
IðzÞ
þ ðrespbffiffiffiffiffiffiffiffip=2
p=2�hxÞI2ðzÞ�IðzÞ: (6)
The above differential equation is solved numerically using
Runge-Kutta fourth order method. Equation (6) has two pa-
rameters b and re, the values of b at 532 nm, which were
measured in the picosecond regime, were used to estimate re
through least square fit of the experimental data. Solid lines
in Figure represent a theoretical fit using Eq. (6).
The data obtained with ns pulses was fitted using Eq. (6),
and the obtained best fit parameters are listed in Table I. From
Table I one can see that the free carrier absorption cross sec-
tion increases with increase of bismuth oxide content in the
glass. The observed values of two photon absorption coeffi-
cient and free carrier absorption cross section for 532 nm
wavelength in the present work are found to be higher than
that of the previous results obtained by Gomes et al. for bis-
muth zinc borate glass with 25 mol. % of bismuth oxide.21,22
This increase is due to the presence of higher amount of bis-
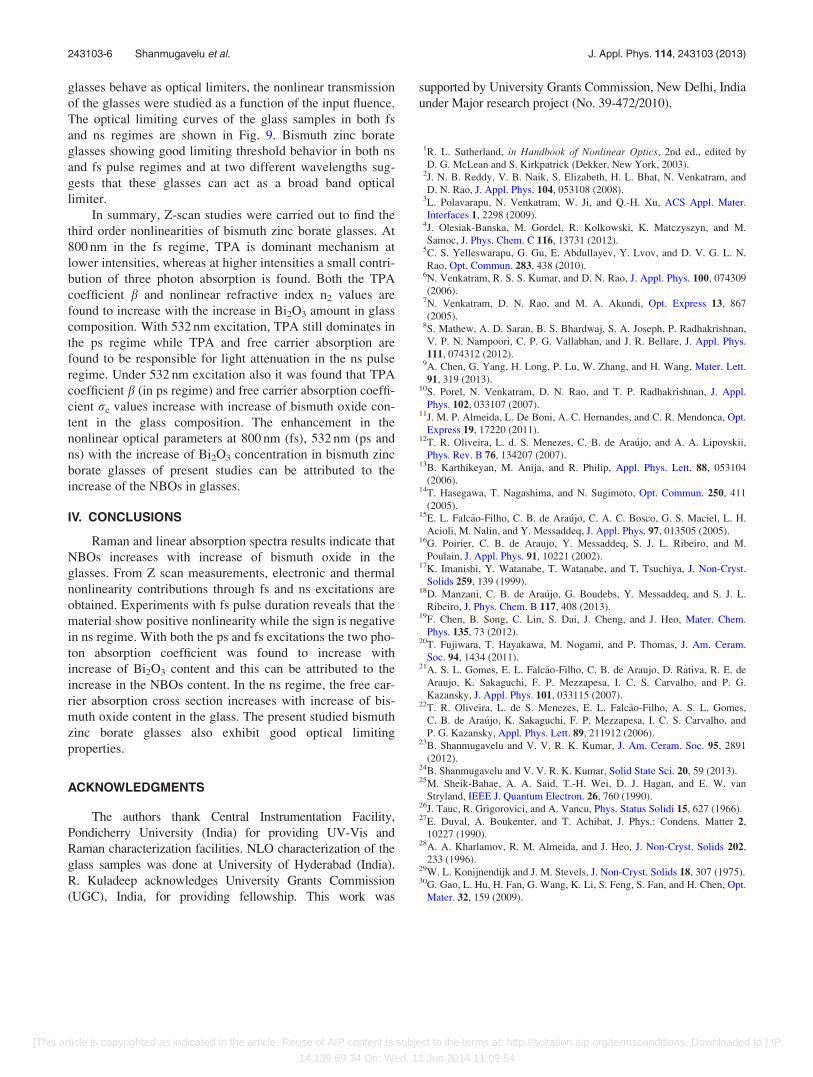
muth content in the present studied glasses. Figure 8 shows
the typical closed aperture Z-scan curve obtained for BZB45
glass sample with a peak intensity of 87 MW cm�2, nearly
symmetric profile of peak followed by a valley, indicative of
negative nonlinearity. Observation of negative nonlinearity on
excitation with ns pulses is common and is attributed to the
thermal effects in the glass generated by high fluence of ns
laser pulses. The closed aperture data was fitted with the Eq.
(2). The magnitude of the nonlinear refractive index n2 eval-
uated is found to be�6.9 � 10�12 cm2 W�1. Since the magni-
tude of the electronic nonlinearity as measured through fs
laser experiment is nearly three orders of magnitude weaker,
the measured nonlinearity in the case of ns pulses can be
mainly attributed to the thermal nonlinearity.
From the application point view, the glasses having high
nonlinear index and small two photon absorption coefficient
can be considered as a good candidate for ultra fast optical
switch in an optical fiber communications system. The
suitability of the optical switching characteristics of the
materials can be determined by its figures of merit
F ¼ 2bkn2
: (7)
The value of F must be less than 1 for a good optical switch.
The value of F for the BZB45 glass is greater than 1 at 800
and 532 nm. This is due to the presence of high two photon
absorption, which affects the optical switching performance
of the glass. Since the present glasses exhibited relatively
strong two photon absorption, they are unsuitable for optical
switching but can be used in the devices like optical limiters.
C. Optical limiting
One of the applications of reverse saturable absorbing
materials in devices is based on optical limiters. Optical lim-
iters are the materials that allow light to pass through them at
low input intensities, but limit the transmittance to a thresh-
old value at higher intensities. Optical limiters are used to
protect human eyes or optical sensors from high fluence irra-
diation. In order to check whether Bismuth Zinc Borate
FIG. 8. Closed aperture Z-scan curve of the BZB45 glass sample at 532 nm,
6 ns pulses. Solid line is the theoretical fit with Eq. (2).
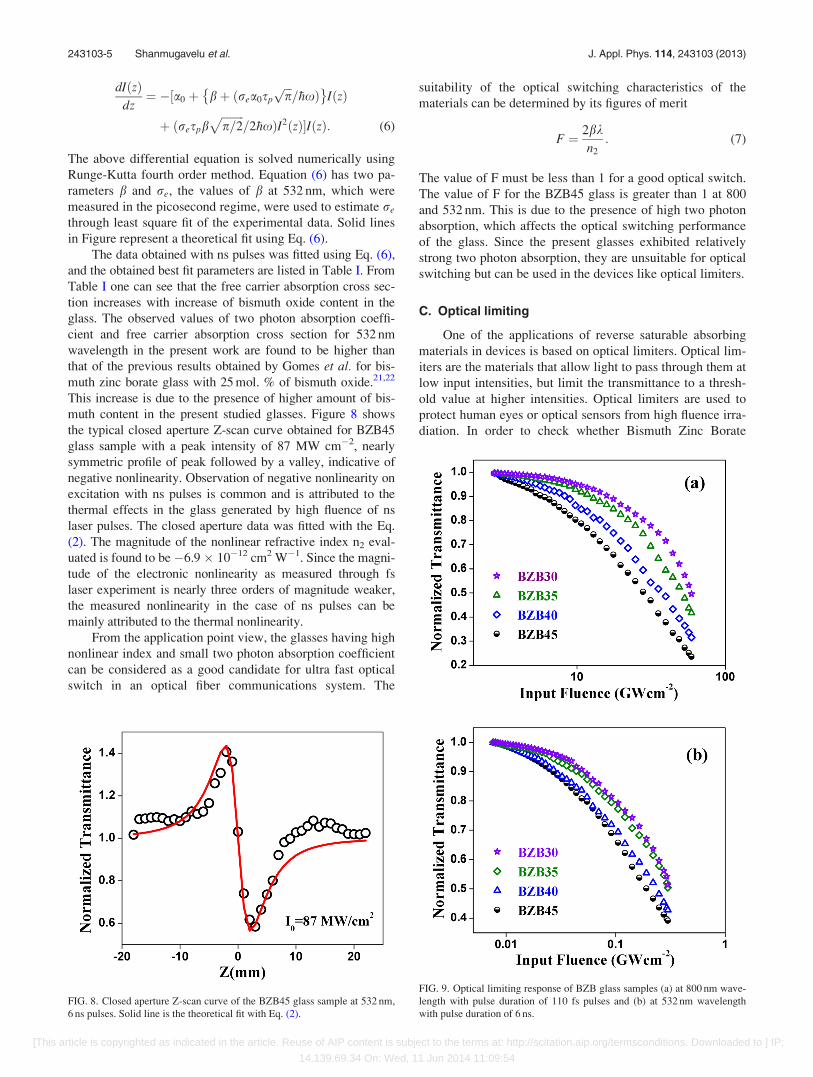
FIG. 9. Optical limiting response of BZB glass samples (a) at 800 nm wave-
length with pulse duration of 110 fs pulses and (b) at 532 nm wavelength
with pulse duration of 6 ns.
243103-5 Shanmugavelu et al. J. Appl. Phys. 114, 243103 (2013)
[This article is copyrighted as indicated in the article. Reuse of AIP content is subject to the terms at: http://scitation.aip.org/termsconditions. Downloaded to ] IP:
14.139.69.34 On: Wed, 11 Jun 2014 11:09:54
glasses behave as optical limiters, the nonlinear transmission
of the glasses were studied as a function of the input fluence.
The optical limiting curves of the glass samples in both fs
and ns regimes are shown in Fig. 9. Bismuth zinc borate
glasses showing good limiting threshold behavior in both ns
and fs pulse regimes and at two different wavelengths sug-
gests that these glasses can act as a broad band optical
limiter.
In summary, Z-scan studies were carried out to find the
third order nonlinearities of bismuth zinc borate glasses. At
800 nm in the fs regime, TPA is dominant mechanism at
lower intensities, whereas at higher intensities a small contri-
bution of three photon absorption is found. Both the TPA
coefficient b and nonlinear refractive index n2 values are
found to increase with the increase in Bi2O3 amount in glass
composition. With 532 nm excitation, TPA still dominates in
the ps regime while TPA and free carrier absorption are
found to be responsible for light attenuation in the ns pulse
regime. Under 532 nm excitation also it was found that TPA
coefficient b (in ps regime) and free carrier absorption coeffi-
cient re values increase with increase of bismuth oxide con-
tent in the glass composition. The enhancement in the
nonlinear optical parameters at 800 nm (fs), 532 nm (ps and
ns) with the increase of Bi2O3 concentration in bismuth zinc
borate glasses of present studies can be attributed to the
increase of the NBOs in glasses.
IV. CONCLUSIONS
Raman and linear absorption spectra results indicate that
NBOs increases with increase of bismuth oxide in the
glasses. From Z scan measurements, electronic and thermal
nonlinearity contributions through fs and ns excitations are
obtained. Experiments with fs pulse duration reveals that the
material show positive nonlinearity while the sign is negative
in ns regime. With both the ps and fs excitations the two pho-
ton absorption coefficient was found to increase with
increase of Bi2O3 content and this can be attributed to the
increase in the NBOs content. In the ns regime, the free car-
rier absorption cross section increases with increase of bis-
muth oxide content in the glass. The present studied bismuth
zinc borate glasses also exhibit good optical limiting
properties.
ACKNOWLEDGMENTS
The authors thank Central Instrumentation Facility,
Pondicherry University (India) for providing UV-Vis and
Raman characterization facilities. NLO characterization of the
glass samples was done at University of Hyderabad (India).
R. Kuladeep acknowledges University Grants Commission
(UGC), India, for providing fellowship. This work was
supported by University Grants Commission, New Delhi, India
under Major research project (No. 39-472/2010).
1R. L. Sutherland, in Handbook of Nonlinear Optics, 2nd ed., edited by
D. G. McLean and S. Kirkpatrick (Dekker, New York, 2003).2J. N. B. Reddy, V. B. Naik, S. Elizabeth, H. L. Bhat, N. Venkatram, and
D. N. Rao, J. Appl. Phys. 104, 053108 (2008).3L. Polavarapu, N. Venkatram, W. Ji, and Q.-H. Xu, ACS Appl. Mater.
Interfaces 1, 2298 (2009).4J. Olesiak-Banska, M. Gordel, R. Kolkowski, K. Matczyszyn, and M.
Samoc, J. Phys. Chem. C 116, 13731 (2012).5C. S. Yelleswarapu, G. Gu, E. Abdullayev, Y. Lvov, and D. V. G. L. N.
Rao, Opt. Commun. 283, 438 (2010).6N. Venkatram, R. S. S. Kumar, and D. N. Rao, J. Appl. Phys. 100, 074309
(2006).7N. Venkatram, D. N. Rao, and M. A. Akundi, Opt. Express 13, 867
(2005).8S. Mathew, A. D. Saran, B. S. Bhardwaj, S. A. Joseph, P. Radhakrishnan,
V. P. N. Nampoori, C. P. G. Vallabhan, and J. R. Bellare, J. Appl. Phys.
111, 074312 (2012).9A. Chen, G. Yang, H. Long, P. Lu, W. Zhang, and H. Wang, Mater. Lett.
91, 319 (2013).10S. Porel, N. Venkatram, D. N. Rao, and T. P. Radhakrishnan, J. Appl.
Phys. 102, 033107 (2007).11J. M. P. Almeida, L. De Boni, A. C. Hernandes, and C. R. Mendonca, Opt.
Express 19, 17220 (2011).12T. R. Oliveira, L. d. S. Menezes, C. B. de Ara�ujo, and A. A. Lipovskii,
Phys. Rev. B 76, 134207 (2007).13B. Karthikeyan, M. Anija, and R. Philip, Appl. Phys. Lett. 88, 053104
(2006).14T. Hasegawa, T. Nagashima, and N. Sugimoto, Opt. Commun. 250, 411
(2005).15E. L. Falc~ao-Filho, C. B. de Ara�ujo, C. A. C. Bosco, G. S. Maciel, L. H.
Acioli, M. Nalin, and Y. Messaddeq, J. Appl. Phys. 97, 013505 (2005).16G. Poirier, C. B. de Araujo, Y. Messaddeq, S. J. L. Ribeiro, and M.
Poulain, J. Appl. Phys. 91, 10221 (2002).17K. Imanishi, Y. Watanabe, T. Watanabe, and T. Tsuchiya, J. Non-Cryst.
Solids 259, 139 (1999).18D. Manzani, C. B. de Ara�ujo, G. Boudebs, Y. Messaddeq, and S. J. L.
Ribeiro, J. Phys. Chem. B 117, 408 (2013).19F. Chen, B. Song, C. Lin, S. Dai, J. Cheng, and J. Heo, Mater. Chem.
Phys. 135, 73 (2012).20T. Fujiwara, T. Hayakawa, M. Nogami, and P. Thomas, J. Am. Ceram.
Soc. 94, 1434 (2011).21A. S. L. Gomes, E. L. Falc~ao-Filho, C. B. de Araujo, D. Rativa, R. E. de
Araujo, K. Sakaguchi, F. P. Mezzapesa, I. C. S. Carvalho, and P. G.
Kazansky, J. Appl. Phys. 101, 033115 (2007).22T. R. Oliveira, L. de S. Menezes, E. L. Falc~ao-Filho, A. S. L. Gomes,
C. B. de Ara�ujo, K. Sakaguchi, F. P. Mezzapesa, I. C. S. Carvalho, and
P. G. Kazansky, Appl. Phys. Lett. 89, 211912 (2006).23B. Shanmugavelu and V. V. R. K. Kumar, J. Am. Ceram. Soc. 95, 2891
(2012).24B. Shanmugavelu and V. V. R. K. Kumar, Solid State Sci. 20, 59 (2013).25M. Sheik-Bahae, A. A. Said, T.-H. Wei, D. J. Hagan, and E. W. van
Stryland, IEEE J. Quantum Electron. 26, 760 (1990).26J. Tauc, R. Grigorovici, and A. Vancu, Phys. Status Solidi 15, 627 (1966).27E. Duval, A. Boukenter, and T. Achibat, J. Phys.: Condens. Matter 2,
10227 (1990).28A. A. Kharlamov, R. M. Almeida, and J. Heo, J. Non-Cryst. Solids 202,
233 (1996).29W. L. Konijnendijk and J. M. Stevels, J. Non-Cryst. Solids 18, 307 (1975).30G. Gao, L. Hu, H. Fan, G. Wang, K. Li, S. Feng, S. Fan, and H. Chen, Opt.
Mater. 32, 159 (2009).
243103-6 Shanmugavelu et al. J. Appl. Phys. 114, 243103 (2013)
[This article is copyrighted as indicated in the article. Reuse of AIP content is subject to the terms at: http://scitation.aip.org/termsconditions. Downloaded to ] IP:
14.139.69.34 On: Wed, 11 Jun 2014 11:09:54


