
Blue cathodoluminescence from thulium implanted AlxGa1−xN and InxAl1−xN
Upload
independentCategory
view
1download
0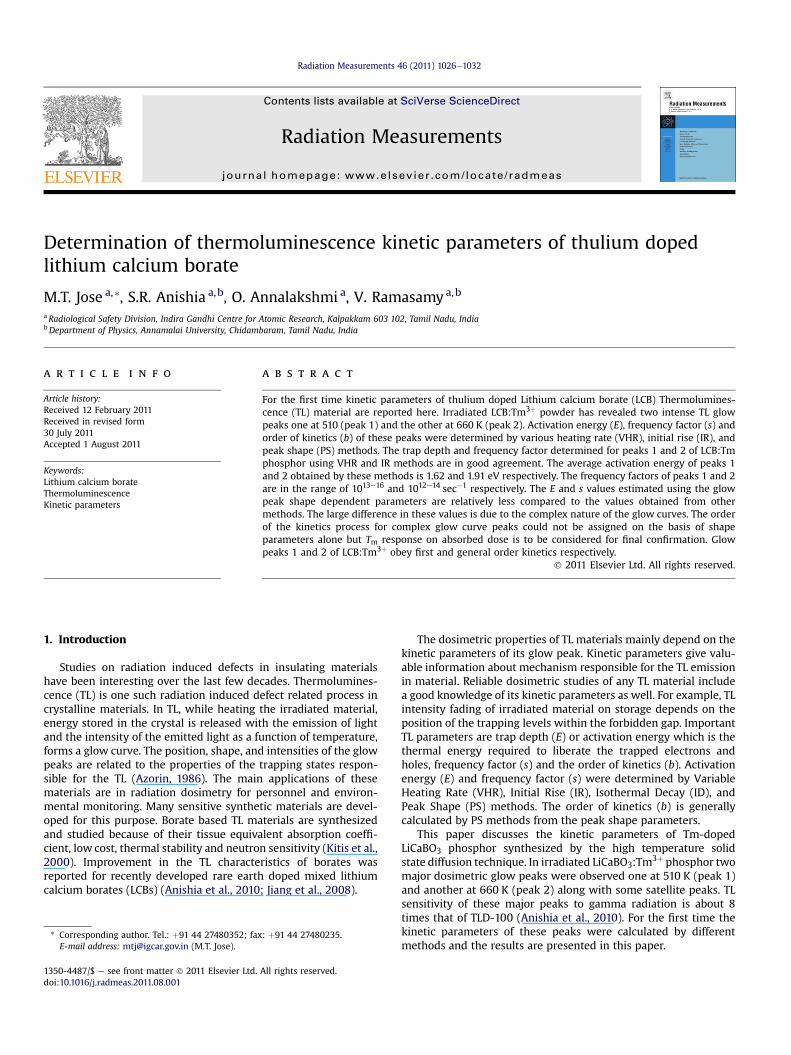
at SciVerse ScienceDirect
Radiation Measurements 46 (2011) 1026e1032
Contents lists available
Radiation Measurements
journal homepage: www.elsevier .com/locate/radmeas
Determination of thermoluminescence kinetic parameters of thulium dopedlithium calcium borate
M.T. Jose a,*, S.R. Anishia a,b, O. Annalakshmi a, V. Ramasamya,b
aRadiological Safety Division, Indira Gandhi Centre for Atomic Research, Kalpakkam 603 102, Tamil Nadu, IndiabDepartment of Physics, Annamalai University, Chidambaram, Tamil Nadu, India
a r t i c l e i n f o
Article history:Received 12 February 2011Received in revised form30 July 2011Accepted 1 August 2011
Keywords:Lithium calcium borateThermoluminescenceKinetic parameters
* Corresponding author. Tel.: þ91 44 27480352; faxE-mail address: [email protected] (M.T. Jose).
1350-4487/$ e see front matter � 2011 Elsevier Ltd.doi:10.1016/j.radmeas.2011.08.001
a b s t r a c t
For the first time kinetic parameters of thulium doped Lithium calcium borate (LCB) Thermolumines-cence (TL) material are reported here. Irradiated LCB:Tm3þ powder has revealed two intense TL glowpeaks one at 510 (peak 1) and the other at 660 K (peak 2). Activation energy (E), frequency factor (s) andorder of kinetics (b) of these peaks were determined by various heating rate (VHR), initial rise (IR), andpeak shape (PS) methods. The trap depth and frequency factor determined for peaks 1 and 2 of LCB:Tmphosphor using VHR and IR methods are in good agreement. The average activation energy of peaks 1and 2 obtained by these methods is 1.62 and 1.91 eV respectively. The frequency factors of peaks 1 and 2are in the range of 1013e16 and 1012e14 sec�1 respectively. The E and s values estimated using the glowpeak shape dependent parameters are relatively less compared to the values obtained from othermethods. The large difference in these values is due to the complex nature of the glow curves. The orderof the kinetics process for complex glow curve peaks could not be assigned on the basis of shapeparameters alone but Tm response on absorbed dose is to be considered for final confirmation. Glowpeaks 1 and 2 of LCB:Tm3þ obey first and general order kinetics respectively.
� 2011 Elsevier Ltd. All rights reserved.
1. Introduction
Studies on radiation induced defects in insulating materialshave been interesting over the last few decades. Thermolumines-cence (TL) is one such radiation induced defect related process incrystalline materials. In TL, while heating the irradiated material,energy stored in the crystal is released with the emission of lightand the intensity of the emitted light as a function of temperature,forms a glow curve. The position, shape, and intensities of the glowpeaks are related to the properties of the trapping states respon-sible for the TL (Azorin, 1986). The main applications of thesematerials are in radiation dosimetry for personnel and environ-mental monitoring. Many sensitive synthetic materials are devel-oped for this purpose. Borate based TL materials are synthesizedand studied because of their tissue equivalent absorption coeffi-cient, low cost, thermal stability and neutron sensitivity (Kitis et al.,2000). Improvement in the TL characteristics of borates wasreported for recently developed rare earth doped mixed lithiumcalcium borates (LCBs) (Anishia et al., 2010; Jiang et al., 2008).
: þ91 44 27480235.
All rights reserved.
The dosimetric properties of TL materials mainly depend on thekinetic parameters of its glow peak. Kinetic parameters give valu-able information about mechanism responsible for the TL emissionin material. Reliable dosimetric studies of any TL material includea good knowledge of its kinetic parameters as well. For example, TLintensity fading of irradiated material on storage depends on theposition of the trapping levels within the forbidden gap. ImportantTL parameters are trap depth (E) or activation energy which is thethermal energy required to liberate the trapped electrons andholes, frequency factor (s) and the order of kinetics (b). Activationenergy (E) and frequency factor (s) were determined by VariableHeating Rate (VHR), Initial Rise (IR), Isothermal Decay (ID), andPeak Shape (PS) methods. The order of kinetics (b) is generallycalculated by PS methods from the peak shape parameters.
This paper discusses the kinetic parameters of Tm-dopedLiCaBO3 phosphor synthesized by the high temperature solidstate diffusion technique. In irradiated LiCaBO3:Tm3þ phosphor twomajor dosimetric glow peaks were observed one at 510 K (peak 1)and another at 660 K (peak 2) along with some satellite peaks. TLsensitivity of these major peaks to gamma radiation is about 8times that of TLD-100 (Anishia et al., 2010). For the first time thekinetic parameters of these peaks were calculated by differentmethods and the results are presented in this paper.
M.T. Jose et al. / Radiation Measurements 46 (2011) 1026e1032 1027
2. Experimental details
Thulium doped LCB phosphor powder has been prepared bysolid state diffusion reaction method. For the synthesis, theanalytical grade lithium carbonate, calcium carbonate, magnesiumoxide, boric acid, silver nitrate, and rare earth oxides were used asraw materials. Before the characterization studies the powder wasground in an agate mortar and sieved to get uniform grains of53e150 mm sizes. TL measurements are carried out using the Risomake, TL/OSL reader (model TL/OSL-DA-20). For irradiation,a gamma chamber procured from Board of Radiation and IsotopeTechnology (BRIT), Mumbai, India, containing a 60Co source ofstrength 3.8 TBq at dose rate of 270 Gy/h was employed. All sampleirradiations were carried out at room temperature. About 2 g ofuniform grain size powder packed in a paper was loaded in a small3 mm thick walled cylindrical chamber made up of Perspex to havethe electronic equilibrium condition during irradiation inside thegamma chamber. For each measurement known amount of powder(about 10 mg) has been taken and spread as a uniform thin layerover the heating element for good thermal contact. Kineticparameters of TL glow peaks have been evaluated using threedifferent methods by the procedure explained below. (a) VariableHeating Rates (VHR) method: TL glow curves of irradiated LCB:Tm3þ
samples were recorded at different linear heating rates between 0.1and 10 K s�1 (Fig.1). Trap depth (E) and frequency factor (s) of peaksat 510 and 660 K were calculated using different sets of heatingrates and their corresponding peak maximum temperature (Tm). Bygraphical method E and s values are calculated from the linear plotof ln(b/Tm2 ) versus 1/Tm. From the slope of the linear graph one canobtain the activation energy. (b) Initial Rise (IR) method: Thismethod is based on the assumption that in the initial rising part ofthe TL glow curve T� Tm, where Tm is the maximum peaktemperature, the rate of change of trapped carrier population isnegligible. TL intensity I is proportional to exp(�E/kT) and the plotof ln I(T) versus 1/T gave straight line. From the slope of the straightline �E/k, the activation energy E can be obtained. IrradiatedLCB:Tm3þ phosphor was pre-heated at 473 and 545 K to removethe lower temperature of peaks 1 and 2 respectively. Glow curvesare acquired for these samples by heating up to 773 K at linearheating rate of 5 K s�1 (c) Peak Shape (PS) method: The order ofkinetics, frequency factor and activation energies of the glow peaks1 and 2 of LCB:Tm3þ are determined from the shape of the glowcurves acquired for gamma irradiated sample (dose of 128 Gy) atlinear heating rates from 0.1 to 10 K s�1.
50 100 150 200 250 300 350 400 450 500
0
100
200
300
400
500
g
fe
d
c
b
a
g
f
e
d
c
b
a
TL
In
ten
sit
y (
a.u
.)
Temperature (o
C)
Fig. 1. TL glow curves of gamma irradiated LCB:Tm phosphor at various heating rates:(a) 0.1; (b) 0.3; (c) 0.6; (d) 1; (e) 3; (f) 6 and (g) 10 K s�1 (Gamma dose e 128 Gy).
3. Results
3.1. Kinetic parameters
3.1.1. Variable heating rate methodThe heating rate is a fundamental experimental variable in TL
measurements. Variable heating rate methods are based on the shiftof the glow peak temperature to higher temperatures with heatingrate. The position of the glow peak temperature Tm is obtained bymeans of the derivative of RandalleWilkins equationwith respect totemperature T and equating it to zero (Azorin, 1986), and is given as�bE=kT2m
�¼ s expð�E=kTmÞ (1)
Booth and Bohun working independently have used two differentheating rates b1 and b2 and solved equation (1) to evaluate the trapdepth E and frequency factor s. The expression for E given inequation (2) is based on the experimental variation of Tm with thelinear heating rates b.
E ¼ KTm1Tm2
Tm1 � Tm2ln�b1b2
ðTm2=Tm1Þ2�
(2)
Here Tm1 and Tm2 are temperatures corresponding to the maximumTL intensities for heating rates b1 and b2, respectively. The value offrequency factor s can be evaluated by substituting E in equation (3).
s ¼ Ekexp
("Tm2ln
T2m2b2
� Tm1lnT2m1b1
#,ðTm1 � Tm2Þ
)(3)
The trap depth and frequency factors of peaks 1 and 2, calcu-lated using expressions (2) and (3) for different pairs of heatingrates b1 and b2 (0.1e10 K s�1) and their corresponding peakmaximum temperatures (Tm) are given in Table 1. The calculatedvalues of trap depth for peak 1 varied from 1.53 to 1.75 eV with themean value at 1.63 eV. The frequency factor for peak 1 is found to bein the range of 1014e16 s�1. The activation energy of peak 2 variedfrom 1.72 to 2.04 eV with the average value at 1.88 eV and s in therange of 1012e15 s�1.
Hoogenstraaten (1958) has used equation (1) and severalheating rates to evaluate E graphically, based on the position of Tmwith heating rate b. A linear relation is obtained between ln(Tm2 /b)and 1/kTm as follows:
ln�T2m=b
�¼ lnðE=skÞ þ E=kTm (4)
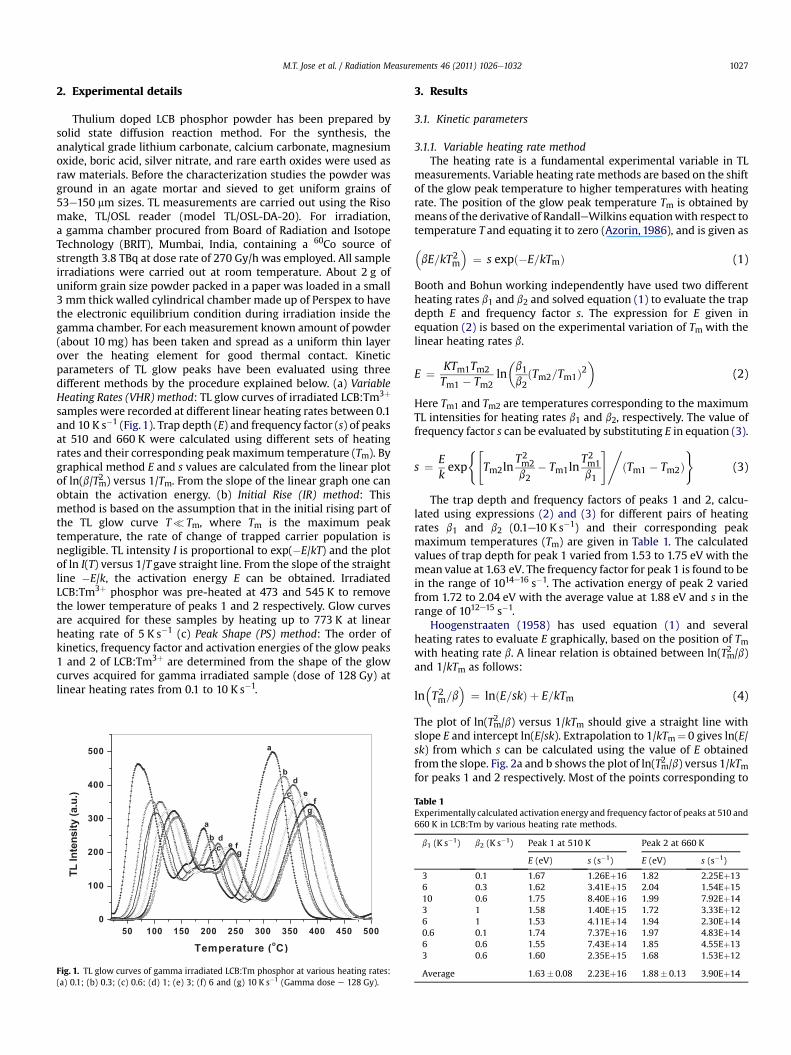
The plot of ln(Tm2 /b) versus 1/kTm should give a straight line withslope E and intercept ln(E/sk). Extrapolation to 1/kTm¼ 0 gives ln(E/sk) from which s can be calculated using the value of E obtainedfrom the slope. Fig. 2a and b shows the plot of ln(Tm2 /b) versus 1/kTmfor peaks 1 and 2 respectively. Most of the points corresponding to
Table 1Experimentally calculated activation energy and frequency factor of peaks at 510 and660 K in LCB:Tm by various heating rate methods.
b1 (K s�1) b2 (K s�1) Peak 1 at 510 K Peak 2 at 660 K
E (eV) s (s�1) E (eV) s (s�1)
3 0.1 1.67 1.26Eþ16 1.82 2.25Eþ136 0.3 1.62 3.41Eþ15 2.04 1.54Eþ1510 0.6 1.75 8.40Eþ16 1.99 7.92Eþ143 1 1.58 1.40Eþ15 1.72 3.33Eþ126 1 1.53 4.11Eþ14 1.94 2.30Eþ140.6 0.1 1.74 7.37Eþ16 1.97 4.83Eþ146 0.6 1.55 7.43Eþ14 1.85 4.55Eþ133 0.6 1.60 2.35Eþ15 1.68 1.53Eþ12
Average 1.63� 0.08 2.23Eþ16 1.88� 0.13 3.90Eþ14
M.T. Jose et al. / Radiation Measurements 46 (2011) 1026e10321028
low and high heating rates fall on the fitted line. In our TLmeasurements, sample heating is performed in a controlledmanner by placing it over a metallic strip. In contact heating thetemperature of the emitting surface of sample differs from theheater-strip. The difference in the temperature between the sampleand the heater-strip is called temperature lag. Due to slow heatingtemperature lag will be negligible at low linear heating rates.Temperature lag is further minimized by using fewer amounts(w10 mg) of small powder grains of 53e150 mm size for measure-ments. It can be inferred from Fig. 2a and b that the data pointscorresponding to the lowest and highest heating rates 0.1 and10 K s�1 fall on the fitting straight line, which means that thetemperature lag appears to be negligible in our measurements.
In the graph, slope equals to E and intercept value equals to ln(E/sk). Trap depth and frequency factor of peak 1 (510 K) estimatedfrom Fig. 2a are found to be at 1.69 eV and 1.86�1016 s�1 respec-tively. By following a similar procedure E and s values are calculatedfor peak 2 (660 K) from Fig. 2b and are found to be 1.95 eV and7.28� 1014 s�1 respectively.
3.1.2. Initial rise methodInitial risemethod first proposed by Garlick and Gibson (1948) is
the simplest method to calculate the trap depth of the TL materials.
17.5 18.0 18.5 19.0 19.5 20.0
10
11
12
13
14
15
Slope = 1.953
Intercept = -23.332
ln
(T
m
2
/ β)
1/kTm
22.5 23.0 23.5 24.0 24.5 25.0
10
11
12
13
14
15
slope =1.685
Intercept = -27.576
ln
(T
m
2
/β)
1/kTm
a
b
Fig. 2. The linear relation of ln(Tm2 /b) versus 1/kTm for (a) peak 1 (510 K) of LCB:Tmphosphor and (b) peak 2 (660 K) of LCB:Tm phosphor.
The initial rise method is based on the assumptions, that in theinitial rising part of the TL curvewhere T� Tm, the rate of change oftrapped carriers’ population is negligible. This assumption is validfor temperatures up to a cut-off temperature, corresponding to anintensity which is smaller than 10e15% of the maximum intensity(McKeever, 1985). The TL intensity I is proportional to exp(�E/kT),assuming the frequency factor to remain the same and there is nooverlapping of glow peaks, i.e.
IðTÞ ¼ C expð�E=kTÞ (5)
where C is the constant, I(T) is the TL intensity at any temperature T,when the sample is heated at a linear heating rate of b¼ dT/dt, E isthe thermal activation energy and k is Boltzmann’s constant. A plotof ln I(T) versus 1/T over the initial rise region gives a straight lineand from the slope of the straight line �E/k, activation energy E iscalculated. The important requirement for this initial rise analysis isthat the concentration of the trapped carriers remains approxi-mately constant at any instant. But beyond the cut-off temperaturethis assumption becomes invalid. However, the initial rise tech-nique can be used only when the glow peak is well defined and isclearly separated from the other peaks.
To find frequency factor (s) value, use the intercept I obtainedfrom the plot of ln I(T) versus 1/T graph for the initial rise part. Thegeneral order expression for s is given below (Rawat et al., 2009).
s ¼ antilogðI � ln A� ðb� 1Þlnðn0=NÞÞ (6)
where b is the order of kinetics, N is the total concentration of thetraps, n0 is the initial concentration of trapped electrons, I isintercept of the initial rise plot and A is the area under the TL peak.It can be assumed that n0/N¼ 1, when all traps are filled, i.e., the TLintensity has reached saturation. However for first order kineticsprocess, b¼ 1, and hence the expression for s reduces to
s ¼ antilogðI � lnðAÞÞ (7)
Thus the determination of the frequency factor value from Eq. (7) isvery simple and it requires the intercept value of initial rise plot andarea under the glow peak, both values can be obtained experi-mentally. This initial rise technique is applied only when the glowcurve is well defined and for clearly separated glow peaks.
It is very difficult to identify amaterial which has clean and clearglow peaks. So thermal cleaning has to be done to the samplebefore using the initial rise method. This cleaning can remove allthe satellite or embedded peaks. For recording the TL, LCB:Tmsamples have been irradiated near to the saturation dose of peak 2(gamma dose¼ 64 Gy). The low temperature peaks are clearedbefore recording the initial rise portion by preheating the samplesat 473 and 545 K for peaks 1 and 2 respectively. The ln I(T) versus 1/T graph for peaks 1 and 2 is given in Fig. 3a and b. The activationenergy of peaks at 510 and 660 K has been calculated from the slopeof the straight line graph. The frequency factor has been calculatedusing Eq. (7) where the antilog of the intercept value of initial riseplot and area under the peak are used. The kinetic parameter valuesobtained for peaks 1 and 2 are given in Table 2. The activationenergies of peaks 1 and 2 are 1.53 and 1.90 eV respectively. Thefrequency factor s of peaks 1 and 2 is 2.90�1013 s�1 and7.07�1012 s�1 respectively. E and s values of peaks 1 & 2 obtainedby IR and VHR methods almost match.
3.1.3. Peak shape methodThe Peak Shape (PS) method is generally called as Chen’s (1969)
method, which is used to determine the kinetic parameters of theglow peak of the TL materials. This method is mainly based on thetemperatures Tm, T1 and T2, where Tm is the peak temperature,

Table 3
0.00202 0.00204 0.00206 0.00208 0.00210 0.00212
9.0
9.2
9.4
9.6
9.8
10.0
10.2
10.4
10.6 Slope = -17622
Intercept = 46.437
ln(I)
1/T (K)
a
b
0.00166 0.00168 0.00170 0.00172 0.00174 0.00176
8.2
8.4
8.6
8.8
9.0
9.2
9.4
9.6
9.8
10.0
10.2
ln(I)
1/T (K)
Slope = -21560
Intercept = 45.87
Fig. 3. Initial rise plot of ln(I) versus 1/T for (a) 510 K peak in LCB:Tm and (b) 660 Kpeak in LCB:Tm.
M.T. Jose et al. / Radiation Measurements 46 (2011) 1026e1032 1029
while T1 and T2 are temperatures at half the intensity on theascending and descending parts of the glow peak respectively. Todetermine the kinetic parameters the following shape parametersare to be determined: the total half intensity width u¼ T2� T1, thehigh temperature half width d¼ T2� Tm and the low temperaturehalf width s¼ Tm� T1 (Garlick and Gibson, 1948). The peak shapemethod is mainly used to calculate the order of kinetics. Order ofkinetics can be evaluated from the symmetry factor (mg) of the glowpeak. mg is calculated using Eq. (8) from the known peak shapeparameters d and u.
mg ¼ d=u ¼ T2 � TmT2 � T1
(8)
Order of the kinetics depends on the glow peak shape. The value ofmg for first and second order kinetics is 0.42 and 0.52 respectively.Chen has provided a plot which gives order of kinetics of the TL
Table 2Activation energy and frequency factor evaluated for peaks 1& 2 of LCB:Tm phos-phor by different methods.
Methods Peak 1 (510 K) Peak 2 (660 K)
E (eV) s (s�1) E (eV) s (s�1)
VHR (Graph) 1.69 1.86� 1016 1.95 7.28� 1014
VHR (calculation) 1.63 2.23� 1016 1.88 3.90� 1014
IR 1.53 2.90� 1013 1.9 7.07� 1012
process, according to the value of the geometric factor (mg). Anotherparameter proposed by Balarin gives the kinetic order as a functionof the parameter
g ¼ d=s ¼ T2 � TmTm � T1
(9)
For the first order kinetics the Balarin parameter (g) ranges from 0.7to 0.8 and for the second order kinetics g varies from 1.05 to 1.20(Balarin, 1975). Generally in the first order, the process of retrap-ping is negligible and the trap should be situated very close to theluminescent centre. The characteristics of the second order peakare wider and it is more symmetric than the first order peak. Fora fixed heating rate, in first order kinetics both peak temperatureand shape are independent of the initial trapped electron concen-tration but in second order the peak temperature and shape arestrongly dependent on initial trapped charge concentration.
The order of kinetics for peak 1 and peak 2 in LCB:Tm3þ phos-phor has been determined by using the peak shape method. Asa first step, glow curves at different heating rates are recorded forthe gamma irradiated samples (dose¼ 128 Gy). The peak shapeparameters s, d, and u at each heating rate were determined fromthe temperatures T1, T2 and Tm. The symmetric factor (mg) andBalarin parameter (g) calculated for peaks 1 and 2 in LCB:Tmphosphor at different heating rates are listed in Table 3. The meanvalue of mg and g for peak 1 was 0.54� 0.02 and 1.19� 0.10respectively and these parameters predicate a second order kineticproperty. For peak 2, the mean value of mg and g was 0.43� 0.01and 0.76� 0.04 respectively and it predicates a first order kinetics.
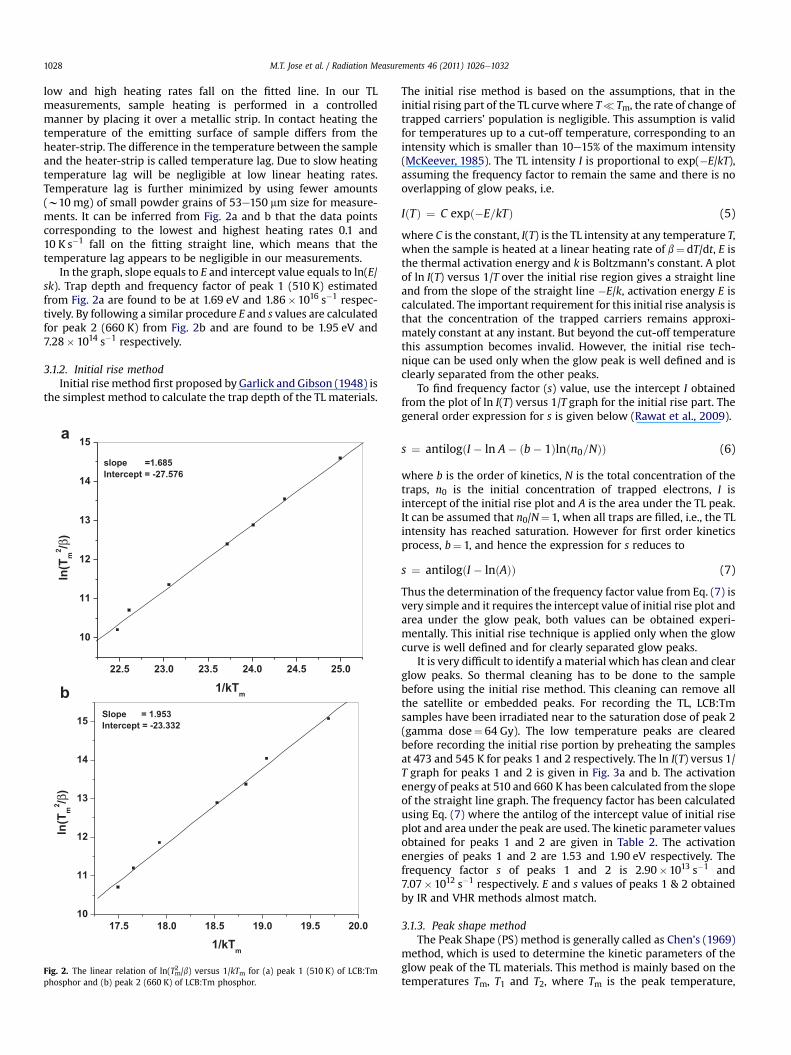
TL glow curves of LCB:Tm3þ powder exposed to differentgamma doses are shown in Fig. 4. TL intensities are not in samescale for comparison and these glow curves are given to illustratethe changes in shape and peak temperature as a function of dose. Inthe case of peak 1, no significant shift in the peak temperature isobserved which means that peak 1 obeys near first order kineticswhich contradicts the second order kinetics predicted from thepeak shape parameters mg and g. Similarly mg and g predict firstorder kinetics for peak 2 (660 K) but its glow curve showedsignificant shift in peak temperature with gamma dose (ref. Fig. 4)which means that its order of kinetics is not one. The reason for thecontradicting result is essentially due to the complex nature of theglow curve. Peaks 1 & 2 of LCB:Tm are not single well isolatedpeaks, but have shoulders on both sides of the main peak. Becauseof the presence of these shoulder peaks, depending on theirintensity and position, half width parameters d, s and u can getenhanced and in turn may introduce error in the shape parametersmg and g. Hence, for complex glow curves the behavior of Tm asa function of dose can be used as good indicator to determine theorder of kinetics. On above argument it is appropriate to assign firstand second order kinetics process for peaks 1 and 2 respectively.Therefore, in complex glow curves having satellite peaks, Tm char-acteristic on radiation dose also may be used in place of peak shapeparameters for determining the order of kinetics in TL materials.
Experimental peak parameters at various heating rates of 510 and 660 K peaks inLCB:Tm.
b (K s�1) Peak 1 at 510 K Peak 2 at 660 K
Tm (K) u d s mg g Tm (K) u d s mg g
0.1 464 83 42 41 0.51 1.02 589 82 36 46 0.44 0.780.3 476 93 51 42 0.55 1.21 609 87 38 51 0.43 0.751 489 82 46 36 0.56 1.28 626 93 40 53 0.43 0.763 503 88 49 39 0.56 1.26 647 101 44 57 0.44 0.7710 516 95 51 44 0.54 1.16 663 112 48 64 0.43 0.75
Average 0.54 1.19 0.43 0.76
100 200 300 400 500
0
40
80
120
f
f
f
e
e
e
d
d
d
c
cb
b
a
a
a
TL
In
ten
sit
y (
a.u
.)
Temperature (0
C)
Fig. 4. TL glow curves of LCB:Tm at different gamma doses: (a) 3.7 Gy; (b) 22.5 Gy; (c)75 Gy; (d) 675 Gy; (e) 1175 Gy; (f) 17,625 Gy (intensities are not in same scale forcomparison, heating rate e 10 K s�1).
Table 5Half width parameters d, s and u calculated for peak 1 and peak 2 in LCB:Tmphosphor at various heating rates from average E values obtained by VHR and IRmethods (for Peak 1, E¼ 1.61 eV & b¼ 1 and for peak 2, E¼ 1.91 eV & b¼ 2).
b (K s�1) Peak 1 at 510 K Peak 2 at 660 K
Tm (K) d s u Tm (K) d s u
0.1 464 11.3 16.1 27.7 589 26.7 25.6 52.60.3 476 11.8 17.0 29.1 609 28.6 27.3 56.21 489 12.5 17.9 30.7 626 30.2 28.8 59.33 503 13.2 18.9 32.4 647 32.2 30.6 63.210 516 13.9 19.8 34.0 663 33.8 32.1 66.3
M.T. Jose et al. / Radiation Measurements 46 (2011) 1026e10321030
The activation energy (E) can be calculated by the generalexpressions formulated by Chen (1984), valid for any kinetics, andis given by:
E ¼ cakT2ma
� ba2kTm (10)
where a stands for s, d and u respectively. ca and ba are obtainedusing the expressions given below:
cs ¼ 1:51þ 3:0�mg � 0:42
�; bs ¼ 1:58þ 4:2
�mg � 0:42
�cd ¼ 0:976þ 7:3
�mg � 0:42
�; bd ¼ 0
cu ¼ 2:52þ 10:2�mg � 0:42
�; bu ¼ 1
Activation energy E of peaks 1& 2 in LCB:Tm3þ phosphor iscalculated using equation (10) for different heating rates from 0.1 to10 K s�1. For the calculation, first and second order kinetics equa-tions (mg¼ 0.42 & 0.52) are applied for peaks 1 and 2 respectively.The mean Ed, Es and Eu values calculated for different b values aregiven in Table 4. The Ed, Es and Eu obtained for peak 1 are0.45� 0.01, 0.60� 0.03 and 0.51�0.01 eV respectively. The averagevalues of Ed, Es and Eu obtained for peak 2 are 1.42� 0.07,0.93� 0.04 and 1.16� 0.05 respectively. The inconsistency in Evalues with different half width parameters is due to error in s, d,and u values imparted by shoulder peaks. Activation energydecreases with increase in s, d, and u values. For peak 1, Ed, is thelowest that indicates the shoulder peak at upper side may havea dominant influence on the glow curve shape. Similarly for peak 2,Es is the lowest which indicates that the presence of the shoulder atthe rising part of the glow peak has a dominant influence on theglow curve shape. Half width shape parameters d, s andu of the twopeaks were calculated for different heating rates from Eq. (10),using the experimental Tm values and mean E values obtained fromVHR and IR methods. The results are tabulated in Table 5. Thesenew d, s and u values and the experimentally obtained Tm may be
Table 4Experimentally evaluated activation energy and frequency factor of 510 and 660 K peaks
Peak 1 at 510 K
Ed (eV) Es (eV) Eu (eV) s �105 s�1
0.45� 0.01 0.60� 0.03 0.51� 0.01 43.7
helpful in the deconvolution of complex glow curves by recon-structing the main and satellite peaks.
No systematic change or large variations in activation energiesare observed with heating rates suggesting that temperature lagbetween the samples and heating element is not significant up to10 K s�1. The ratios of Tm
2 /u, Tm2 /d and Tm2 /s are given in Table 6
against heating rates appear to have rather less scattered distri-bution. It is also expected that the ratio Tm
2 /a should be constant forall used heating rates for reduced temperature lag (Montalvo et al.,2004). The distribution of these ratios again confirms the goodthermal contact of the sample with heating element duringmeasurements.
The frequency factor ‘s’ can be obtained using the followinggeneral expression by substituting the E value;
s ¼ bEkT2m
expðE=kTmÞ½1þ ðb� 1Þ2kTm=E��1 (11)
where ‘b’ is order of kinetics and b is the linear heating rate. In thisexpression ‘s’ depends on Tm and in second order kinetics Tmdepends on the absorbed dose (Chen, 1969). Hence in the case ofsecond order kinetics instead of s, another quantity s00 called thepre-exponential factor which is a dose dependant quantity isobtained. s00 ¼ sn0/N where n0 is concentration of trapped electronsand N is concentration of traps. The pre-exponential factor s00 isa constant for a given dose, but varies with change in the absorbeddose, i.e. with n0. In the special case when n0¼N, i.e., the dose ofsaturation, s00 coincides with s. Frequency factor calculated usingEq. (11) for peaks 1 and 2 of LCB:Tm irradiated to 128 Gy is givenin Table 4. ‘s’ value of peaks 1 and 2 is 4.37�105 s�1 and7.47�104 s�1 respectively. First and second order of kinetics isapplied for peaks 1 and 2 respectively. At saturation dose the pre-exponential factor s00 coincides with the frequency factor s for thesecond order peak 2.
3.2. Heating rate effects on glow curve
It is experimentally observed that the maximum peak temper-ature varies as a function of linear heating rate of the sample. Ata low heating rate, the glow peak occurs at the lower temperatureand as b increases it has shifted toward higher temperature. Thevariation of Tm with different heating rates from 0.1 to 10 K s�1 forpeaks 1 and 2 in LCB:Tm is shown in Fig. 5. Tm has shifted to highertemperatures as a function of linear heating rate. For both peaks, Tmshowed sharp increase at low heating rates up to 3 K s�1 and
in LCB:Tm by PS method (irradiation dose¼ 128 Gy).
Peak 2 at 660 K
Ed (eV) Es (eV) Eu (eV) s �104 s�1
1.42� 0.07 0.93� 0.04 1.16� 0.05 7.47

0 2 4 6 8 10
80
90
100
110b
a
FW
HM
Heating rate (Ks-1
)
Fig. 6. FWHM of the glow peaks as a function of heating rates; (a) peak 1 and (b) peak2 in LCB:Tm phosphor.
Table 6Experimental value of Tm
2 /a at various heating rates for 510 and 660 K peaks inLCB:Tm.
b (K s�1) Peak 1 at 510 K Peak 2 at 660 K
Tm2 /u Tm
2 /d Tm2 /s Tm
2 /u Tm2 /d Tm
2 /s
0.1 2594 5126 5251 4231 9637 75420.3 2436 4943 5395 4167 9760 72721 2916 5198 6642 4214 9797 73943 2875 5163 6487 4145 9514 734410 2803 5221 6051 3925 9158 6868
Average 2725 5130 5965 4136 9573 7284
M.T. Jose et al. / Radiation Measurements 46 (2011) 1026e1032 1031
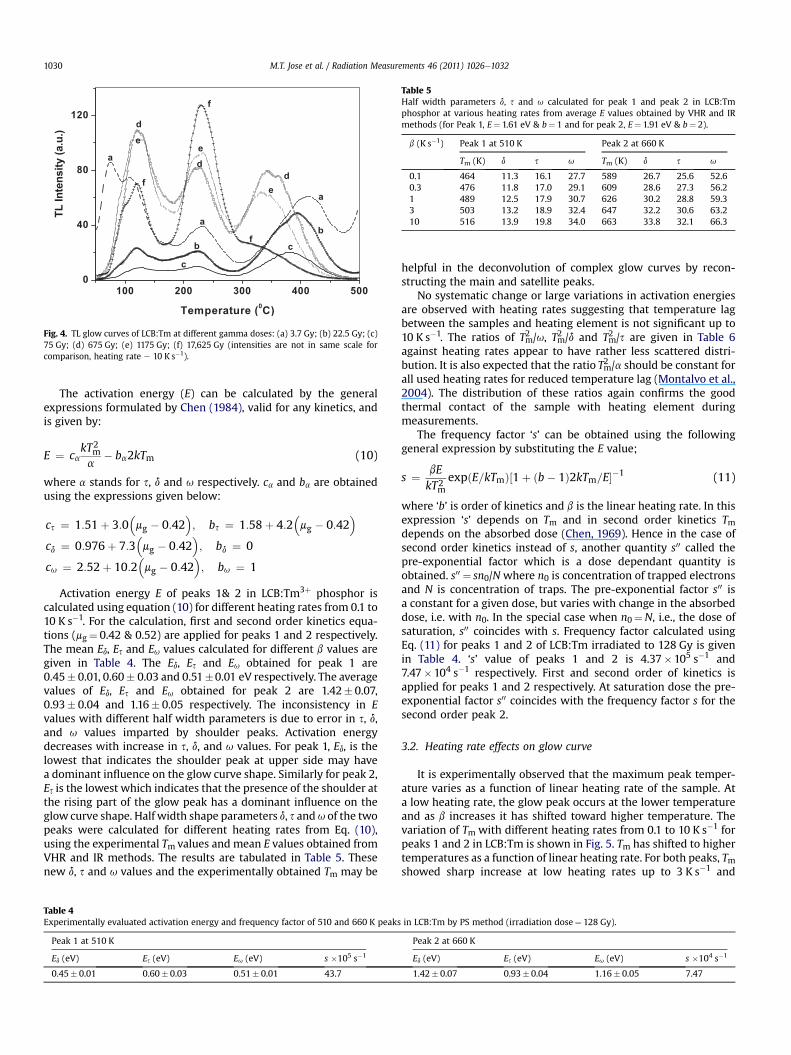
a steady increase was seen at higher heating rates. However, shapeof the glow curve has not changed with heating rate. A similarbehavior of Tm with heating rates has been reported for other TLmaterials also (Kitis et al., 1993). The shift of Tm versus heating ratecan be empirically explained by the following way. At the lowheating rate b1, the time spent by the phosphor at a temperature T1,is long enough so that an amount of thermal release of electronsdepending on half life at this temperature could take place. Asheating rate increases to b2> b1 the time spent at same tempera-ture T1 decreases and therefore the thermal release of electrons isalso decreased. Then a higher temperature T2 is needed for thesame amount of thermal release to take place at b2. In this way thewhole glow peak is shifted to higher temperatures as heating rateincreases in a manner depending on the half life and time spent ateach temperature. The behavior of the full width at half maximum(FWHM) of peaks 1 and 2 in LCB:Tm as a function of linear heatingrate is shown in Fig. 6. FWHM of peak 1 has a slow increase withb value but for peak 2 a rapid increase was seen above 1 K s�1. Kitiset al. (1993) studied the heating rate effects on the TL glow peaks ofquartz, TLD-700 and natural CaF2 and reported a similar behavior,but the difference in variation is very small for Tm shifting and it islarge in the case of FWHM.
The normalized integral area and height of peaks 1 and 2 versusheating rates are plotted in Fig. 7.The integral area of peak 2 was thearea under the peak in the temperature region from 570 to 720 K.As a general trend the TL intensity decreases as a function of linearheating rate. For peak 2, integral area showed a sharp decrease of20% from 0.1 to 0.6 K s�1, then an increase at 1 K s�1 and a slowreduction of 10% at 10 K s�1. Integral area of peak 1 is not includeddue to the complex nature of the peak. The variation of peak height
0 1 2 3 4 5 6 7 8 9 10 11
450
500
550
600
650
700
b
a
Maxim
um
peak t
em
peratu
re (
K)
Heating rate (Ks-1
)
Fig. 5. The plot between the maximum peak temperatures (Tm) as a function of linearheating rates: (a) peak 1 and (b) peak 2 of LCB:Tm phosphor.
is similar to that of integral area and it was prominent in peak 2than peak 1. Height of peak 2 is reduced by 40% and peak 1 by 25% atthe heating rate of 10 K s�1. According to Gorbics et al. (1968) bothintegral and peak height versus heating rate have decreasedbecause of the thermal quenching. Thermal quenching affects theefficiency of the glow curve with increasing heating rate. Thethermal quenching effect is more in peak 2 and its peak tempera-ture occurs at 660 K which is 150 K above peak 1.
Taylor and Lilley (1982) have proposed the intensity reductionfor peak 5 of LiF occurring probably due to the trapped species(fluorine atoms according to them) thermally released from theirtraps before there is time for peak 5 traps to be formed (MgeVdipole clusters). Different authors have given detailed explanationsfor the variation in integral and peak height TL intensity withheating rate by considering the influence for more than one situ-ation (Ogundare et al., 2005; Gokce et al., 2009). Thermalquenching effect and cluster formation of impurities with heatingrate can be taken as a possible situation for these variations. Someauthors explained this phenomenon in terms of thermal quenchingand clustering. Cluster formation has been reported in host mate-rials doped with rare earth impurities (Holsa et al., 2004; Karali
0 2 4 6 8 10
0.6
0.7
0.8
0.9
1.0
c
b
a
No
rm
olised
TL
in
ten
sit
y
Heating rate (Ks-1
)
Fig. 7. The normalized TL intensity as a function of linear heating rate in LCB:Tmphosphor: (a) integral area of peak 2, (b) height of peak 1 and (c) height of peak 2.

M.T. Jose et al. / Radiation Measurements 46 (2011) 1026e10321032
et al., 1998). The cluster formation can be a simple or a large onedepending on the heating rate or the thermal history. Ogundareet al. reported that, at some heating rates enhancement of TL due tocluster formation is greater than the total effect of reduction bythermal quenching effect on TL.
4. Discussion
The activation energies and frequency factors determined forpeaks 1 and 2 of LCB:Tm material using VHR and IR methods havebeen tabulated in Table 2. Trap depth and frequency factor calcu-lated by VHR (graphical and calculation) and IR methods which areindependent of glow peak shape or kinetic orders have givenmatching values for both peaks. The mean trap depth andfrequency factor of peak 1 and peak 2 are 1.61 & 1.91 eV and1.36�1016 & 3.75�1014 s�1 respectively.
E and s calculated by PS method showed relatively lesser valuesthan other twomethods i.e. in PS method trap depth of peaks 1 and2 is 1/3rd and 2/3rd of the values obtained by other methods. Themain reason for lower values in PS method is due to the complexnature of the glow curve. As mentioned earlier peaks at 510 and660 K have satellite peaks at rising and lowering sides of the glowcurve. These satellite peaks increase the width of the main peaksand this has resulted in the increase of half width parameters d, sand u. Activation energy decreases with increase in s, d, and u valueand it is evidently seen in our lower E values. Complex nature of thepeaks has introduced error in the determination of order of kineticsalso, i.e., b evaluated from peak shape parameters mg and g for peak1 (second order) and peak 2 (first order) is not in support with theresponse of Tm with absorbed dose. In the case of complex glowcurves, for the determination of order of kinetics, Tm response todose is a good approximation to predict particularly the first orderkinetics where no shift of Tm as a function of dose.
PS method is not suitable for the evaluation of kinetic parame-ters in complex glow curves without deconvolution of the curves.Sunta et al. discussed the limitations of peak fitting and peak shapemethods for the determination of activation energy of thermolu-minescence glow peaks. The failure of the peak shape and peakfitting methods is not because of the improper application of themethods, but is for reasons inherent in the shape of the peak itself.High values of d, s and u coupled with low value of Tm at n0/Nz 1lead to a lower value of E (Sunta et al., 1999).
5. Conclusion
The trap depth and frequency factor determined for the peaks at510 (peak 1) and 660 K (peak 2) of LCB:Tm phosphor using thevariable heating rate and initial rise methods are in good agree-ment. The mean trap depth of peak 1 and peak 2 obtained by thesemethods is 1.61 eV and 1.91 eV respectively. The frequency factor ofpeaks 1 & 2 is in the range of 1013e16 and 1012e14 s�1 respectively.VHR and IR methods are independent of glow curve shape or orderof the kinetic process. E and s from the glow peak shape dependentPS method are found to be relatively smaller than other methods.Large reduction in E and s is essentially due to the complex natureof the glow curves. Main peaks of LCB:Tm are wider due to thepresence of shoulder peaks which resulted in the increase of halfwidth parameters and subsequent reduction in E and s. For theestimation of E and s, PS method is not suitable for complex glow
peaks without deconvolution of the peaks. The order of the kineticprocess assigned from the shape parameters of complex peaks ismay be in error. Tm response to absorbed dose can be used as simplemethod to distinguish a first order or non-first order kineticprocess. Here in LCB:Tm, as a function of dose no shift in Tm isobserved for peak 1 and it obeys a first order kinetics. Butmaximum peak temperature Tm for peak 2 showed downwardmovement with dose which confirms a non-first order kineticsprocess. Heating rate effects on the glow curve shape, peaktemperature, integral and peak height and integral area studies inLCB:Tm confirmed its glow curve stability.
Acknowledgments
The authors are grateful to Dr. B. Venkatraman, Head, RSD & Dr.V. Meenakshisundaram, Head, RSS, RSD for their support andencouragement and wish to acknowledge Dr. U. Madhusoodanan,for the useful discussions.
References
Anishia, S.R., Jose, M.T., Annalakshmi, O., Ponnusamy, V., Ramasamy, V., 2010.Dosimetric properties of rare earth doped LiCaBO3 thermoluminescencephosphors. J. Lumin. 130, 1834e1840.
Azorin, J., 1986. Determination of thermoluminescence parameters from glowcurves e I. a review. Nucl. Tracks 11 (3), 159e166.
Balarin, M., 1975. Direct evaluation of activation energy from half width of glowpeaks and a special nomogram. Phys. Stat. Sol. (a) 31, K111eK114.
Chen, R., 1969. Glow curves with general order kinetics. J. Electrochem. Soc. 116,1254e1257.
Chen, R., 1984. Kinetics of Thermoluminescence Glow Peaks in Thermolumines-cence and Thermoluminescence Dosimetry. CRC Press, Boca Raton, pp. 49e88.
Garlick, G.F.J., Gibson, A.F., 1948. The electron traps mechanism of luminescence insulphide and silicate phosphors. Proc. Phys. Soc. Lond. 60, 574e590.
Gokce, M., Oguz, K.F., Karali, T., Prokic, M., 2009. Influence of heating rate onthermoluminescence of MgSiO4:Tb dosimeter. J. Phys. D: Appl. Phys. 42, 105412.5pp.
Gorbics, S.G., Nash, A.E., Attix, F.H., 1968. Thermal quenching of luminescentdosimetry phosphors. In: Proc. of 2nd Inter. Conf. on Lumin. Dosimetry, USA,587 pp.
Holsa, J., Aitasalo, T., Jungner, H., Lastusaari, M., Nittykoski, J., Spano, G., 2004. Roleof defect states in persistent luminescence materials. J. Alloys Compd. 374,56e59.
Hoogenstraaten, W., 1958. Electron traps in zinc sulphide phosphors. Philips Res.Rep., vol. 13, pp. 515e562.
Jiang, L.H., Zhang, Y.L., Li, C.Y., Pang, R., Hao, J.Q., Su, Q., 2008. Thermoluminescencecharacteristics of rare-earth doped LiCaBO3 phosphor. J. Lumin. 128, 1904e1908.
Karali, T., Rowlands, A.P., Townsend, P.D., Prokic, M., Olivares, J., 1998. Spectralcomparison of Dy, Tm and Dy/Tm in CaSO4 thermoluminescent dosimeters.J. Phys. D: Appl. Phys. 31, 754e765.
Kitis, G., Spiropulu, M., Papadopoulos, J., Charalambous, Stef, 1993. Heating rateeffects on the TL glow-peaks of three thermoluminescent phosphors. Nucl.Instr. Meth. Phys. Res. 73, 367e372.
Kitis, G., Furetta, C., Prokic, M., Prokic, V., 2000. Kinetic parameters of some tissueequivalent thermoluminescent materials. J. Phys. D: Appl. Phys. 33, 1252e1262.
McKeever, S.W.S., 1985. Thermoluminescence of Solids. Cambridge University Press,Cambridge.
Montalvo, T.R., Furetta, C., Kitis, G., Azorin, J., Vite, R.M., 2004. Influence of heatingrate on thermoluminescence of zirconium oxide UV irradiated. Radiat. Eff.Defects Solids 159, 217e222.
Ogundare, F.O., Balogun, F.A., Hussaian, L.A., 2005. Heating rate effects on thethermoluminescence of fluorite. Radiat. Meas. 40, 60e64.
Rawat, N.S., Kulkarni, M.S., Mishra, D.R., Bhatt, B.C., Sunta, C.M., Gupta, S.K.,Sharma, D.N., 2009. Use of initial rise method to analyze a general-order kineticthermo luminescent glow curve. Nucl. Instr. Meth. Phys. Res. B 267, 3475e3479.
Sunta, C.M., Feria, Ayta W.E., Piters, T.M., Watanabe, S., 1999. Limitation of peakfitting and peak shape methods for determination of activation energy ofthermoluminescence glow peaks. Radiat. Meas. 30, 197e201.
Taylor, G.S., Lilley, E., 1982. Rapid readout rate studies of thermoluminescence in LiF(TLD-100) crystals: III. J. Phys. D: Appl. Phys. 15, 2053e2065.
Copyright © 2022 FDOKUMEN