Optical absorption and heating rate dependent glass transition in vanadyl doped calcium oxy-chloride...
7
Optical absorption and heating rate dependent glass transition in vanadyl doped calcium oxy-chloride borate glasses M.S. Dahiya a , S. Khasa a,⇑ , A. Agarwal b a Department of Physics, Deenbandhu Chhotu Ram University of Science and Technology, Murthal 131039, Haryana, India b Department of Applied Physics, Guru Jambheshwar University of Science and Technology, Hisar 125001, Haryana, India highlights Glass transition temperature increases with increase in heating rate. Cl anions enter into the voids of borate network at low concentration. Cl anions contribute to the network formation at high concentrations. Prepared glasses have good thermal stability. graphical abstract article info Article history: Received 21 October 2014 Received in revised form 14 January 2015 Accepted 14 January 2015 Available online 21 January 2015 Keywords: Differential scanning calorimetry (DSC) Glasses Oxy-halides Glass transition temperature Optical band gap abstract Some important results pertaining to optical and thermal properties of vanadyl doped oxy-halide glasses in the chemical composition CaCl 2 –CaO–B 2 O 3 are discussed. These glasses have been prepared by con- ventional melt quench technique. From X-ray diffraction (XRD) profiles the amorphous nature of the doped glasses has been confirmed. The electronic polarizability is calculated and found to increase with increase in chloride content. The optical absorption spectra have been recorded in the frequency range of 200–3200 nm. Recorded spectra are analyzed to evaluate cut-off wavelength (k cut-off ), optical band gap (E g ), band tailing (B), Urbach energy (DE) and refractive index (n). Thermal analysis has been carried out for the prepared glasses at three different heating rates viz. 5, 10 and 20 °C/min. The glass transition temperature (T g ) along with thermal activation energy (E a ) corresponding to each heating rate are eval- uated from differential scanning calorimetry (DSC) thermographs. It is found that E a decrease and T g increase with increase in heating rate. The variation in T g is also observed with the substitution of calcium chloride in place of calcium oxide. The increasing and higher values of E a suggest that prepared glasses have good thermal stability. Variation in T g and E g suggests that Cl anions enter into the voids of borate network at low concentrations (<5.0%) and contribute to the network formation at high concentration (>5.0%). Ó 2015 Elsevier B.V. All rights reserved. Introduction Although the basic concepts about the structure of glasses was established by Zachariasen in 1930’s [1] but the structure of borate glasses was particularly studied by Krogh-Moe [2]. Bray and O’Keefe [3] also supported the works carried out by Krogh-Moe. Borate glasses are of technological importance due to their strong Glass Forming Ability even at the lowest cooling rates [4]. Borate glasses are assumed to have the tendency to reduce the thermal expansion and provide resistance to thermal shock at high temper- atures, which makes them suitable for fiberglass applications [5]. http://dx.doi.org/10.1016/j.molstruc.2015.01.023 0022-2860/Ó 2015 Elsevier B.V. All rights reserved. ⇑ Corresponding author. Tel.: +91 130 2484136; fax: +91 130 2484003. E-mail address: [email protected] (S. Khasa). Journal of Molecular Structure 1086 (2015) 172–178 Contents lists available at ScienceDirect Journal of Molecular Structure journal homepage: www.elsevier.com/locate/molstruc
Transcript of Optical absorption and heating rate dependent glass transition in vanadyl doped calcium oxy-chloride...

Journal of Molecular Structure 1086 (2015) 172–178
Contents lists available at ScienceDirect
Journal of Molecular Structure
journal homepage: www.elsevier .com/locate /molstruc
Optical absorption and heating rate dependent glass transitionin vanadyl doped calcium oxy-chloride borate glasses
http://dx.doi.org/10.1016/j.molstruc.2015.01.0230022-2860/� 2015 Elsevier B.V. All rights reserved.
⇑ Corresponding author. Tel.: +91 130 2484136; fax: +91 130 2484003.E-mail address: [email protected] (S. Khasa).
M.S. Dahiya a, S. Khasa a,⇑, A. Agarwal b
a Department of Physics, Deenbandhu Chhotu Ram University of Science and Technology, Murthal 131039, Haryana, Indiab Department of Applied Physics, Guru Jambheshwar University of Science and Technology, Hisar 125001, Haryana, India
h i g h l i g h t s
� Glass transition temperatureincreases with increase in heatingrate.� Cl� anions enter into the voids of
borate network at low concentration.� Cl� anions contribute to the network
formation at high concentrations.� Prepared glasses have good thermal
stability.
g r a p h i c a l a b s t r a c t
a r t i c l e i n f o
Article history:Received 21 October 2014Received in revised form 14 January 2015Accepted 14 January 2015Available online 21 January 2015
Keywords:Differential scanning calorimetry (DSC)GlassesOxy-halidesGlass transition temperatureOptical band gap
a b s t r a c t
Some important results pertaining to optical and thermal properties of vanadyl doped oxy-halide glassesin the chemical composition CaCl2–CaO–B2O3 are discussed. These glasses have been prepared by con-ventional melt quench technique. From X-ray diffraction (XRD) profiles the amorphous nature of thedoped glasses has been confirmed. The electronic polarizability is calculated and found to increase withincrease in chloride content. The optical absorption spectra have been recorded in the frequency range of200–3200 nm. Recorded spectra are analyzed to evaluate cut-off wavelength (kcut-off), optical band gap(Eg), band tailing (B), Urbach energy (DE) and refractive index (n). Thermal analysis has been carriedout for the prepared glasses at three different heating rates viz. 5, 10 and 20 �C/min. The glass transitiontemperature (Tg) along with thermal activation energy (Ea) corresponding to each heating rate are eval-uated from differential scanning calorimetry (DSC) thermographs. It is found that Ea decrease and Tg
increase with increase in heating rate. The variation in Tg is also observed with the substitution of calciumchloride in place of calcium oxide. The increasing and higher values of Ea suggest that prepared glasseshave good thermal stability. Variation in Tg and Eg suggests that Cl� anions enter into the voids of boratenetwork at low concentrations (<5.0%) and contribute to the network formation at high concentration(>5.0%).
� 2015 Elsevier B.V. All rights reserved.
Introduction glasses was particularly studied by Krogh-Moe [2]. Bray and
Although the basic concepts about the structure of glasses wasestablished by Zachariasen in 1930’s [1] but the structure of borate
O’Keefe [3] also supported the works carried out by Krogh-Moe.Borate glasses are of technological importance due to their strongGlass Forming Ability even at the lowest cooling rates [4]. Borateglasses are assumed to have the tendency to reduce the thermalexpansion and provide resistance to thermal shock at high temper-atures, which makes them suitable for fiberglass applications [5].
M.S. Dahiya et al. / Journal of Molecular Structure 1086 (2015) 172–178 173
The addition of alkali and alkaline earth oxide in borate glassesresults into the network modification which gives rise to differentnon-linear optical properties making these glasses suitable foroptoelectronic applications [6]. Many researchers studied the alkalihalide borate glasses for application as fast ion conductor [7–11]but when it came to the case of alkaline earth halide borate glasses,relatively lesser attention was paid [12–15]. Farouk et al. [12] stud-ied the CaO–B2O3–Fe2O3–CaCl2 system and concluded from theMossbauer spectroscopy results that there is a close link betweenCl� and Fe2+/Fe3+ ions and addition of CaCl2 strongly affects theFe3+/Fe2+ ratio. This indicated that Cl� ions have ability to linkthrough the glass forming network units. While studyingCaF2–B2O3 glasses, Doweidar et al. [15] found that CaF2 formsCa1/2
2+ [BO3/2F]� units in combination with different borate units.The remaining CaF2 forms its own unit in form of CaF4. Also theCa2+ ions contribute towards the ionic conductivity and act as maincharge carriers. The spectral characterization of B2O3–BaO–LiF sys-tem doped with rare earths (Nd3+/Er3+) was studied by HemalathaRudramadevi and Buddhudu [14] and found that these opticalglasses are potential materials for progress of glass lasers andoptoelectronics. Abdel-Hameed et al. [13] studied the effect offluoride ions on preparation of transparent glass ceramic in theBaO–B2O3 glass system and found that F� ions facilitates the glassformation.
The alkaline earth borate systems exhibit glass formation athigh borate contents. In MO–B2O3 (M = Ba, Ca and Mg) systemsthe glass melting temperature increases gradually as we increasethe alkaline earth content. It depicts the decrease in Glass FormingAbility (GFA) of these systems [16]. The glass formation region inalkaline earth borate glasses shrinks gradually as the size of alka-line earth cation decreases due to which the glass formation regionis narrowest in case of MgO–B2O3 systems [17]. The alkaline earthcarbonates due to their high optical transparency and thermal sta-bility can act as promising hosts to investigate effect of chemicalenvironment on optical properties [18–20]. Rojas et al. [21]reported that calcium borate glasses are useful for application asthermo luminescent dosimeter. Non-linear optical (NLO) proper-ties of the alkaline earth materials were studied by Zou et al.[22] and found that these materials are suitable for non linear opti-cal and ultraviolet applications. The above literature survey sug-gests that the alkaline earth oxy-halide borate glasses are oftechnological importance. Therefore we have prepared vanadyldoped calcium oxy-chloride borate glasses having compositionxCaCl2�(30 � x)CaO�70B2O3 + 2 mol% of V2O5 (x = 0, 2, 5, 7, 10, 12,15, 20, 25 and 30). The optical absorption and thermal propertiesof these glasses are studied and reported.
Experimental
Glass preparation
The AR/GR grade reagents of CaCl2, CaCO3, H3BO3 and V2O5 wereused as the starting chemicals. The powdered chemicals wereweighed in batches of 20 gm as per the composition in mol% by usinga digital electronic balance (CAS CAUY 220). The weighed chemicalswere crushed and mixed homogenously in an agate pestle and mor-tar for four hours. The mixture so obtained was melt at 1373 K in anelectrical muffle furnace for 45 minutes. The melt was shaken at reg-ular intervals so as to obtain fine homogeneity. Thereafter quench-ing was carried out by sandwiching the melt between twostainless steel plates to obtain glass samples in form of round discs.
XRD measurements
The XRD profiles of fine powdered samples were recorded atroom temperature (RT) on a Rigaku Miniflex-II X-ray diffractometer
in the 2h range of 20–80� at a scan rate of 2� per minute. Cu karadiations at 40 kV and 15 mA with a high speed Si strip detectorwere used as source and detectors respectively.
Optical absorption measurements
Samples having thickness between 0.5 and 1.2 mm were pol-ished to optical quality for recording of optical absorption andtransmission spectra. The spectra were recorded in the frequencyrange of 200–3200 nm at RT using a UV–Vis–NIR spectrophotome-ter (CARY 5000).
DSC analysis
The differential scanning calorimetry (DSC) of samples in bulkform was carried out in the temperature range of 200–1000 �Con a Perkin Elmer simultaneous thermal analyzer (Model STA6000). Three different heating rates (5, 10 and 20 �C/min) wereused to record the thermographs. Nitrogen was used as purgegas with a gas flow rate of 20 ml/min. The instrument was cali-brated with Indium, Silver and Calcium Oxalate as the referencematerials before recording thermographs. Complete data analysisalong with data smoothening was carried out using Pyris thermalanalysis software provided with STA 6000.
Results and discussion
Electronic polarizability (a02�) and XRD
The oxide ion polarizability (a02�) is related to theoretical optical
basicity (Kth) as
Kth ¼ 1:67 1� 1a2�
0
� �ð1Þ
where Kth is calculated by using the relation [23]
Kth ¼Ziri
Zocið2Þ
where Zi is the oxidation number of the cation i, ri is the ratio of cat-ion of a particular oxide to the total number of oxides in whole glassmatrix and Zo is the oxidation number of the anion (Zo = 2.0 for oxi-des) [24], ci is the basicity moderating parameter. It is given as:
ci ¼X
i
1:36ðxi � 0:26Þ ð3Þ
where xi is Pauling electro-negativity [25]. The values of theoreticaloptical basicity so calculated are available in literature [26].The cal-culated values of polarizability are reported in Table 1. The polariz-ability is strongly related to many microscopic and macroscopicphysical and chemical properties such as UV absorption, ionicrefraction, optical non-linearity and chemical stability. Fig. 1 showsthe variation of polarizability with corresponding CaCl2 content.The increasing trend in polarizability suggests that there is anincrease in ionic nature of the glasses. This can be explained onthe basis of the fact that optical basicity expresses the basicity ofglass in terms of the electron density carried out by oxygen. Thetrends in polarizability are in good agreement with the literature[27].
The XRD spectra for all compositions recorded at RT are shownin Fig. 2 along with the inset. It is generally considered that thenon-crystalline materials do not exhibit sharp peaks in XRD spec-tra. This is due to the non-periodic arrangement of atoms in thesesolids which does not satisfy the diffraction condition. The spectrafrom Fig. 2 exhibit absence of peaks in the prepared samples andshows broad hump which reveals the amorphous nature of these

Table 1Cut-off Wavelength (kcut-off), Polarizability (a0
2�), Optical Band Gap (Eg), Band Tailing Parameter (B), Urbach Energy (DE) and refractive index (n) of xCaCl2�(30 � x)CaO�70B2O3 + 2 mol% of V2O5 (x = 0, 2, 5, 7, 10, 12, 15, 20, 25 and 30) glasses.
Sample code x kcut-off (nm) (±2 nm) a2� r = 2 r = 3 DE (eV) n at different k (nm) (±0.02)
Eg (eV) B (cm eV)�1/2 Eg (eV) B (cm eV)�1/3 600 700 800
CCBV1 0 406 1.41 2.504 19.048 2.305 6.362 0.242 3.27 3.01 2.63CCBV2 2 406 1.43 2.513 19.148 2.309 6.417 0.245 3.37 3.11 2.69CCBV3 5 410 1.45 2.477 19.491 2.264 6.105 0.264 2.96 2.70 2.64CCBV4 7 398 1.47 2.510 18.891 2.305 6.579 0.236 3.24 3.01 2.63CCBV5 10 404 1.49 2.487 18.502 2.269 6.154 0.256 3.41 3.13 2.77CCBV6 12 404 1.51 2.483 18.887 2.264 6.224 0.260 3.43 3.17 2.75CCBV7 15 394 1.54 2.430 17.138 2.184 5.612 0.300 3.47 3.25 2.80CCBV8 20 398 1.59 2.447 17.116 2.210 5.674 0.287 3.49 3.23 2.84CCBV9 25 402 1.64 2.461 16.989 2.231 5.699 0.276 3.55 3.27 2.94CCBV10 30 406 1.70 2.462 16.731 2.232 5.638 0.275 3.75 3.41 2.98
Fig. 1. Variation of polarizability with CaCl2 content.
Fig. 2. XRD spectra of xCaCl2�(30 � x)CaO�70B2O3 + 2 mol% of V2O5 (x = 0, 2, 5, 7, 10)(CCBV1-5) glasses (inset: for x = 12, 15, 20, 25 and 30 (CCBV6-10)).
Fig. 3. Optical absorption spectra of xCaCl2�(30 � x)CaO�70B2O3 + 2 mol% of V2O5
(x = 0, 2, 5, 7, 10) (CCBV1-5) glasses (inset: for x = 12, 15, 20, 25 and 30 (CCBV6-10)).
1 For interpretation of color in Fig. 3, the reader is referred to the web version ofis article.
174 M.S. Dahiya et al. / Journal of Molecular Structure 1086 (2015) 172–178
glasses. These spectra are in resemblance with spectra available inliterature [14,28].
Optical absorption
The optical absorption spectra of polished glasses are shown inFig. 3 along with the inset. The non-sharp edge reveals glassy nat-ure. It can be observed from Fig. 3 that cut-off wavelength (kcut-off)
shows a very little shift towards red1 with increase in CaCl2 content.This shift can be attributed to the fact that substitution of CaCl2 inthe glass matrix results in increased number of non-bridging oxygenatoms. From the absorption data we calculated optical absorptioncoefficient, a(m) at various wavelengths using the relation [29]:
aðmÞ ¼ 1d
� �log
I0
It
� �ð4Þ
where d is the sample thickness and Io and It are the intensities ofincident and transmitted radiations respectively. The factor log Io/It
represents the absorbance. This data was related with optical bandgap Eg by Davis and Mott [30] and Tauc and Menth [31] through therelation:
aðmÞ ¼ Bðhm� EgÞr
hmð5Þ
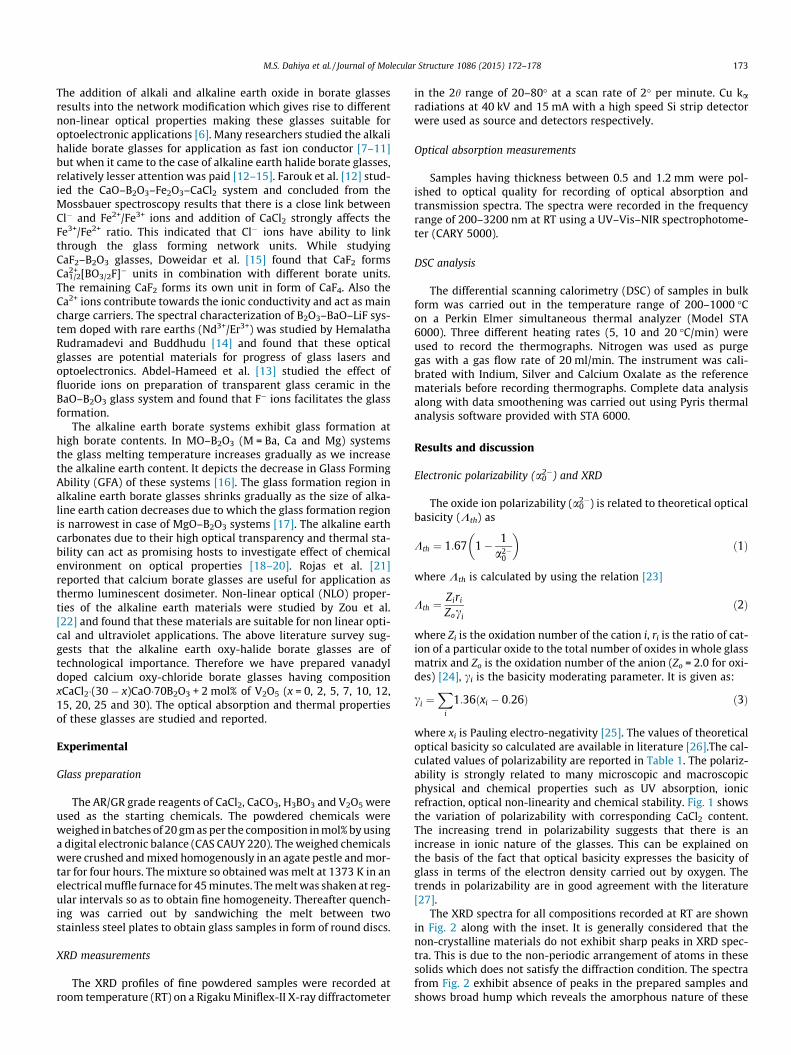
where ‘B’ is a constant and hm is incident photon energy, r is theindex parameter having different values, viz., 2, 3, 1/2 and 1/3 cor-responding to indirect allowed, indirect forbidden, direct allowedand direct forbidden transitions respectively. According to Tauc[32], the indirect allowed and forbidden transitions are valid foramorphous materials. Figs. 4 and 5 along with the insets representthe Tauc’s plots for all prepared compositions corresponding to r = 2and 3 respectively. Values of Eg corresponding to r = 2 and 3 were
th
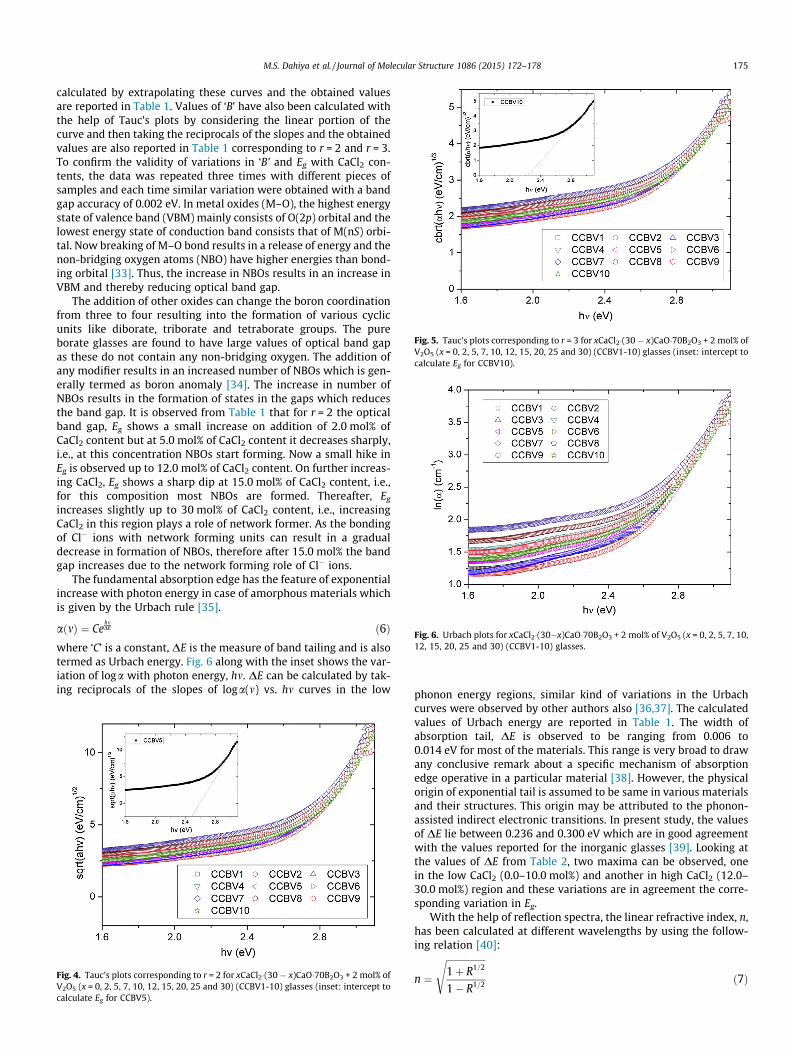
Fig. 5. Tauc’s plots corresponding to r = 3 for xCaCl2�(30 � x)CaO�70B2O3 + 2 mol% ofV2O5 (x = 0, 2, 5, 7, 10, 12, 15, 20, 25 and 30) (CCBV1-10) glasses (inset: intercept tocalculate Eg for CCBV10).
Fig. 6. Urbach plots for xCaCl2�(30�x)CaO�70B2O3 + 2 mol% of V2O5 (x = 0, 2, 5, 7, 10,12, 15, 20, 25 and 30) (CCBV1-10) glasses.
M.S. Dahiya et al. / Journal of Molecular Structure 1086 (2015) 172–178 175
calculated by extrapolating these curves and the obtained valuesare reported in Table 1. Values of ‘B’ have also been calculated withthe help of Tauc’s plots by considering the linear portion of thecurve and then taking the reciprocals of the slopes and the obtainedvalues are also reported in Table 1 corresponding to r = 2 and r = 3.To confirm the validity of variations in ‘B’ and Eg with CaCl2 con-tents, the data was repeated three times with different pieces ofsamples and each time similar variation were obtained with a bandgap accuracy of 0.002 eV. In metal oxides (M–O), the highest energystate of valence band (VBM) mainly consists of O(2p) orbital and thelowest energy state of conduction band consists that of M(nS) orbi-tal. Now breaking of M–O bond results in a release of energy and thenon-bridging oxygen atoms (NBO) have higher energies than bond-ing orbital [33]. Thus, the increase in NBOs results in an increase inVBM and thereby reducing optical band gap.
The addition of other oxides can change the boron coordinationfrom three to four resulting into the formation of various cyclicunits like diborate, triborate and tetraborate groups. The pureborate glasses are found to have large values of optical band gapas these do not contain any non-bridging oxygen. The addition ofany modifier results in an increased number of NBOs which is gen-erally termed as boron anomaly [34]. The increase in number ofNBOs results in the formation of states in the gaps which reducesthe band gap. It is observed from Table 1 that for r = 2 the opticalband gap, Eg shows a small increase on addition of 2.0 mol% ofCaCl2 content but at 5.0 mol% of CaCl2 content it decreases sharply,i.e., at this concentration NBOs start forming. Now a small hike inEg is observed up to 12.0 mol% of CaCl2 content. On further increas-ing CaCl2, Eg shows a sharp dip at 15.0 mol% of CaCl2 content, i.e.,for this composition most NBOs are formed. Thereafter, Eg
increases slightly up to 30 mol% of CaCl2 content, i.e., increasingCaCl2 in this region plays a role of network former. As the bondingof Cl� ions with network forming units can result in a gradualdecrease in formation of NBOs, therefore after 15.0 mol% the bandgap increases due to the network forming role of Cl� ions.
The fundamental absorption edge has the feature of exponentialincrease with photon energy in case of amorphous materials whichis given by the Urbach rule [35].
aðmÞ ¼ CehmDE ð6Þ
where ‘C’ is a constant, DE is the measure of band tailing and is alsotermed as Urbach energy. Fig. 6 along with the inset shows the var-iation of loga with photon energy, hm. DE can be calculated by tak-ing reciprocals of the slopes of loga(m) vs. hm curves in the low
Fig. 4. Tauc’s plots corresponding to r = 2 for xCaCl2�(30 � x)CaO�70B2O3 + 2 mol% ofV2O5 (x = 0, 2, 5, 7, 10, 12, 15, 20, 25 and 30) (CCBV1-10) glasses (inset: intercept tocalculate Eg for CCBV5).
phonon energy regions, similar kind of variations in the Urbachcurves were observed by other authors also [36,37]. The calculatedvalues of Urbach energy are reported in Table 1. The width ofabsorption tail, DE is observed to be ranging from 0.006 to0.014 eV for most of the materials. This range is very broad to drawany conclusive remark about a specific mechanism of absorptionedge operative in a particular material [38]. However, the physicalorigin of exponential tail is assumed to be same in various materialsand their structures. This origin may be attributed to the phonon-assisted indirect electronic transitions. In present study, the valuesof DE lie between 0.236 and 0.300 eV which are in good agreementwith the values reported for the inorganic glasses [39]. Looking atthe values of DE from Table 2, two maxima can be observed, onein the low CaCl2 (0.0–10.0 mol%) and another in high CaCl2 (12.0–30.0 mol%) region and these variations are in agreement the corre-sponding variation in Eg.
With the help of reflection spectra, the linear refractive index, n,has been calculated at different wavelengths by using the follow-ing relation [40]:
n ¼
ffiffiffiffiffiffiffiffiffiffiffiffiffiffiffiffiffi1þ R1=2
1� R1=2
sð7Þ
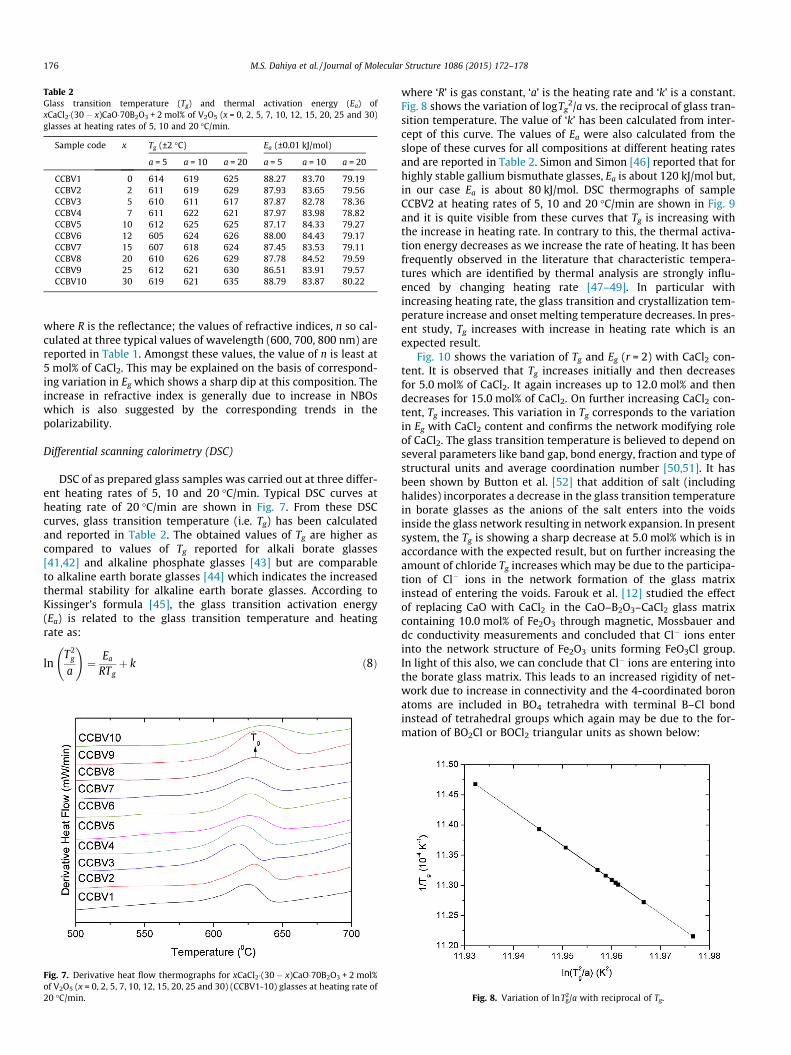
Table 2Glass transition temperature (Tg) and thermal activation energy (Ea) ofxCaCl2�(30 � x)CaO�70B2O3 + 2 mol% of V2O5 (x = 0, 2, 5, 7, 10, 12, 15, 20, 25 and 30)glasses at heating rates of 5, 10 and 20 �C/min.
Sample code x Tg (±2 �C) Ea (±0.01 kJ/mol)
a = 5 a = 10 a = 20 a = 5 a = 10 a = 20
CCBV1 0 614 619 625 88.27 83.70 79.19CCBV2 2 611 619 629 87.93 83.65 79.56CCBV3 5 610 611 617 87.87 82.78 78.36CCBV4 7 611 622 621 87.97 83.98 78.82CCBV5 10 612 625 625 87.17 84.33 79.27CCBV6 12 605 624 626 88.00 84.43 79.17CCBV7 15 607 618 624 87.45 83.53 79.11CCBV8 20 610 626 629 87.78 84.52 79.59CCBV9 25 612 621 630 86.51 83.91 79.57CCBV10 30 619 621 635 88.79 83.87 80.22
176 M.S. Dahiya et al. / Journal of Molecular Structure 1086 (2015) 172–178
where R is the reflectance; the values of refractive indices, n so cal-culated at three typical values of wavelength (600, 700, 800 nm) arereported in Table 1. Amongst these values, the value of n is least at5 mol% of CaCl2. This may be explained on the basis of correspond-ing variation in Eg which shows a sharp dip at this composition. Theincrease in refractive index is generally due to increase in NBOswhich is also suggested by the corresponding trends in thepolarizability.
Differential scanning calorimetry (DSC)
DSC of as prepared glass samples was carried out at three differ-ent heating rates of 5, 10 and 20 �C/min. Typical DSC curves atheating rate of 20 �C/min are shown in Fig. 7. From these DSCcurves, glass transition temperature (i.e. Tg) has been calculatedand reported in Table 2. The obtained values of Tg are higher ascompared to values of Tg reported for alkali borate glasses[41,42] and alkaline phosphate glasses [43] but are comparableto alkaline earth borate glasses [44] which indicates the increasedthermal stability for alkaline earth borate glasses. According toKissinger’s formula [45], the glass transition activation energy(Ea) is related to the glass transition temperature and heatingrate as:
lnT2
g
a
!¼ Ea
RTgþ k ð8Þ
Fig. 7. Derivative heat flow thermographs for xCaCl2�(30 � x)CaO�70B2O3 + 2 mol%of V2O5 (x = 0, 2, 5, 7, 10, 12, 15, 20, 25 and 30) (CCBV1-10) glasses at heating rate of20 �C/min.
where ‘R’ is gas constant, ‘a’ is the heating rate and ‘k’ is a constant.Fig. 8 shows the variation of logTg
2/a vs. the reciprocal of glass tran-sition temperature. The value of ‘k’ has been calculated from inter-cept of this curve. The values of Ea were also calculated from theslope of these curves for all compositions at different heating ratesand are reported in Table 2. Simon and Simon [46] reported that forhighly stable gallium bismuthate glasses, Ea is about 120 kJ/mol but,in our case Ea is about 80 kJ/mol. DSC thermographs of sampleCCBV2 at heating rates of 5, 10 and 20 �C/min are shown in Fig. 9and it is quite visible from these curves that Tg is increasing withthe increase in heating rate. In contrary to this, the thermal activa-tion energy decreases as we increase the rate of heating. It has beenfrequently observed in the literature that characteristic tempera-tures which are identified by thermal analysis are strongly influ-enced by changing heating rate [47–49]. In particular withincreasing heating rate, the glass transition and crystallization tem-perature increase and onset melting temperature decreases. In pres-ent study, Tg increases with increase in heating rate which is anexpected result.
Fig. 10 shows the variation of Tg and Eg (r = 2) with CaCl2 con-tent. It is observed that Tg increases initially and then decreasesfor 5.0 mol% of CaCl2. It again increases up to 12.0 mol% and thendecreases for 15.0 mol% of CaCl2. On further increasing CaCl2 con-tent, Tg increases. This variation in Tg corresponds to the variationin Eg with CaCl2 content and confirms the network modifying roleof CaCl2. The glass transition temperature is believed to depend onseveral parameters like band gap, bond energy, fraction and type ofstructural units and average coordination number [50,51]. It hasbeen shown by Button et al. [52] that addition of salt (includinghalides) incorporates a decrease in the glass transition temperaturein borate glasses as the anions of the salt enters into the voidsinside the glass network resulting in network expansion. In presentsystem, the Tg is showing a sharp decrease at 5.0 mol% which is inaccordance with the expected result, but on further increasing theamount of chloride Tg increases which may be due to the participa-tion of Cl� ions in the network formation of the glass matrixinstead of entering the voids. Farouk et al. [12] studied the effectof replacing CaO with CaCl2 in the CaO–B2O3–CaCl2 glass matrixcontaining 10.0 mol% of Fe2O3 through magnetic, Mossbauer anddc conductivity measurements and concluded that Cl� ions enterinto the network structure of Fe2O3 units forming FeO3Cl group.In light of this also, we can conclude that Cl� ions are entering intothe borate glass matrix. This leads to an increased rigidity of net-work due to increase in connectivity and the 4-coordinated boronatoms are included in BO4 tetrahedra with terminal B–Cl bondinstead of tetrahedral groups which again may be due to the for-mation of BO2Cl or BOCl2 triangular units as shown below:
Fig. 8. Variation of lnTg2/a with reciprocal of Tg.

Fig. 9. DSC curves for sample CCBV2 at heating rates of 5, 10 and 20 �C/min.
Fig. 10. Variation of Tg (a = 20 �C/min) and Eg (r = 2) with CaCl2 content (solid line isguide for eyes).
Fig. 11. Reproduced FTIR spectrographs for xCaCl2�(30 � x)CaO�70B2O3 + 2 mol% ofV2O5 (x = 0, 2, 5, 7, 10, 12, 15, 20, 25 and 30) (CCBV1-10) glasses [26].
M.S. Dahiya et al. / Journal of Molecular Structure 1086 (2015) 172–178 177
The structural investigations on these glasses were carried outand reported by Khasa et al. [26]. From this literature the datawas regenerated from figure of FTIR by applying sequentially –ATR correction, Data Tuning, Baseline Correction and Data smooth-ening using Spectrum 10 spectra analysis S/W (Provided with Per-kin Elmer Frontier FTIR). This data was used to reproduce the FTIRcurve using Origin 8.1 Pro which is shown in Fig. 11. It is clear fromFig. 11 that the reproduced FTIR spectral variations support theanomalous behavior of different optical and thermal parametersfor samples CCBV3 and CCBV7 as predicted by optical absorptionand DSC data analysis as discussed below:
Three bands are observed in all FTIR spectra in Fig. 11. The posi-tion of these bands remains almost unchanged when movingtowards increasing chloride ions concentration. Looking at theintensities of these bands which gives a quantitative idea aboutnumber of bridging and non-bridging oxygen, it can be observedthat the intensity of band 600–800 cm�1
, which is a characteristicband containing bond bending vibrations of B–O–B linkage [53,54],
is almost same for all compositions. But the intensity of bands inthe region 800–1150 cm�1 and 1150–1600 cm�1 assigned to stretch-ing vibrations of tetrahedral oxygen coordinated boron in variousborate units [55] and to linkage of boron atom with three oxygenatoms [56] respectively show a variation for sample CCBV3 andCCBV7. In case of CCBV3, a split in both these bands occurs due towhich the band 1150–1600 cm�1 shows a decrease in the intensitywhich is slightly more that the decrease in intensity of band 800–1150 cm�1. This behavior is in accordance with the variations inthermal and optical measurements which show that NBOs for sam-ple CCBV3 are more than NBOs for CCBV1 and CCBV2. Also for sam-ple CCBV7 the intensities of all three bands decrease which shows astrong structural change at this composition. This change is very wellsupported by the minimum optical band gap corresponding to thiscomposition.
Conclusions
The glasses were successfully synthesized as depicted by broadhump without any peak in XRD spectra. The trend in polarizabilitydepicted the increasing ionic nature. The indirect allowed and for-bidden optical band gaps were around 2.5 and 2.3 eV with two dipsat 5.0 and 12.0 mol% of CaCl2 content. The refractive index wasleast for 5.0 mol% of CaCl2 and decrease with increase in wave-length. There is an increasing trend in glass transition temperaturewith change in heating rate. The decrease in Tg with variation ofCaCl2 mol% from 2 to 5 mol% and 10 to 12 mol% was observedand on rest of composition there is an increase in Tg. The variationsin Tg and Eg confirmed that Cl� anions enter into the voids of boratenetwork at low concentration (less than 5%) and contribute to thenetwork formation at high concentrations of CaCl2 (more than 5%).The increasing and higher values of Ea suggest that preparedglasses have good thermal stability. The results of optical and ther-mal parameters were supported by reproduced FTIR spectrographs.
Acknowledgements
The authors are thankful to UGC, New Delhi for providing thefinancial and experimental support under the Major Research Pro-ject No. 40-461/2011(SR). The authors are also thankful to CILDCRUST, Murthal for providing the thermal measurement facilities.M.S. Dahiya is thankful to DST New Delhi for providing financialsupport under the INSPIRE Fellowship Scheme.

178 M.S. Dahiya et al. / Journal of Molecular Structure 1086 (2015) 172–178
References
[1] Z.W. Zachariasen, J. Am. Chem. Soc. 54 (1932) 3841–3851.[2] J. Krogh-Moe, Arkiv f. Kemi 14 (1959) 451–459.[3] P.J. Bray, J.G. O’Keefe, Phys. Chem. Glasses 4 (1963) 37–46.[4] K.J. Rao, Structural Chemistry of Glasses, Elsevier Pub., 2002, p. 478.[5] Donald E. Garrett, Borates: Handbook of Deposits, Processing, Properties, and
Use, Academic Press, 1998, p. 401.[6] J. Krogh-Moe, H. Jurine, Phys. Chem. Glasses 6 (1965) 30–45.[7] T. Harami, K. Handa, J. Non-Cryst. Solids 293–295 (2001) 550–555.[8] K. Srilatha, L. Pavic, A. Moguš-Milankovic, Ch. Srinivasa Rao, G. Little Flower, V.
Ravi Kumar, N. Veeraiah, J. Non-Cryst. Solids 357 (19–20) (2011) 3538–3547.[9] Yuhu Wang, Akiyoshi Osaka, Yoshinari Miura, Katsuaki Takahashi, J. Non-Cryst.
Solids 95–96 (1987) 571–576.[10] S. Khasa, V.P. Seth, P.S. Gahlot, A. Agarwal, R.M. Krishna, S.K. Gupta, Physica B
334 (2003) 347–358.[11] D. Turcotte, W.M. Risen, E.I. Kamitsos, Solid State Commun. 51 (1984) 313–
316.[12] H. Farouk, A.A. Soliman, H. Farhan, I. Kashif, A.M. Sanad, Can. J. Appl. Spectrosc.
41 (1996) 135–138.[13] S.A.M. Abdel-Hameed, N.A. Ghoniem, E.A. Saad, F.H. Margha, Ceram. Int. 31
(2005) 499–505.[14] B. Hemalatha Rudramadevi, S. Buddhudu, Ferroelectr. Lett. 36 (5–6) (2009)
109–118.[15] H. Doweidar, G. El-Damrawi, M. Abdelghani, J. Mater. Sci. 47 (9) (2012) 4028–
4035.[16] H. Rawson, Inorganic Glass Forming Systems, Academic Press, London, 1967, p.
102.[17] H. Rawson, Inorganic Glass Forming Systems, Academic Press, London, 1967, p.
107.[18] M.B. Saisudha, J. Ramakrishna, Phys. Rev. B 53 (10) (1996) 6186–6196.[19] Priyanka Srivastava, S.B. Rai, D.K. Rai, Spectrochim. Acta A 60 (3) (2004) 637–
642.[20] G. Tripathi, V.K. Rai, S.B. Rai, Appl. Phys. B 84 (2) (2006) 459–464.[21] S.S. Rojas, K. Yukimiku, A.S.S. de Camargo, L.A.O. Nunes, A.C. Hernandes, J. Non-
Cryst. Solids 352 (2006) 3608–3612.[22] Guohong Zou, Ning Ye, Ling Huang, Xinsong Lin, J. Am. Chem. Soc. 133 (2011)
20001–20007.[23] J.A. Duffy, M.D. Ingram, J. Inorg. Nucl. Chem. 37 (1975) 1203–1206.[24] S. Khasa, M.S. Dahiya, A. Agarwal, Int. J. Phys. Math. Sci. 2 (S1) (2012) 104–108.[25] L. Pauling, The Nature of Chemical Bond, Cornell University Press, New York,
1960 (Chapter 13).[26] S. Khasa, M.S. Dahiya, A. Agarwal, AIP Conf. Proc. 1536 (2013) 671–672.[27] M.A.K. Al-Fayoumi, M. Farouk, J. Alloys Comp. 482 (2009) 356–360.[28] I. Waclawska, J. Alloys Compd. 244 (1–2) (1996) 52–58.
[29] E.A. Davis, N.F. Mott, Philos. Mag. 22 (179) (1970) 903–922.[30] N.F. Mott, E.A. Davis, Electron Processes in Non-crystalline Materials, second
ed., Clarendon Press, 1979, p. 289.[31] J. Tauc, A. Menth, J. Non-Cryst. Solids 8 (8–10) (1972) 569–585.[32] J. Tauc, Amorphous and Liquid Semiconductor, Plenum, New York, 1974.[33] R. Jose, T. Suzuki, Y. Ohishi, J. Non-Cryst. Solids 352 (52–54) (2006) 5564–
5571.[34] H. Scholze, Glass-Nature, Structure and Properties, Springer-Verlag, 1991.[35] F. Urbach, Phys. Rev. 92 (1953) 1324.[36] S. Sanghi, S. Duhan, A. Agarwal, P. Aghamkar, J. Alloys Compd. 488 (2009) 454–
458.[37] S. Sanghi, S. Rani, A. Agarwal, V. Bhatnagar, Mater. Chem. Phys. 120 (2010)
381–386.[38] K.L. Chopra, S.K. Bahl, Thin Solid Films 11 (2) (1972) 377–388.[39] K. Subrahmanyam, M. Salagram, Opt. Mater. 15 (3) (2000) 181–186.[40] P. Roychoudhary, S.K. Batabyal, A. Paul, C. Basu, S. Mukherjee, K. Goswami, J.
Appl. Phys 92 (7) (2002) 3530–3539.[41] S. Khasa, V.P. Seth, S.K. Gupta, R.M. Krishna, Phys. Chem. Glasses 40 (5) (1999)
269–272.[42] S. Khasa, V.P. Seth, A. Agarwal, R.M. Krishna, S.K. Gupta, P. Chand, Mater. Chem.
Phys. 72 (3) (2001) 366–373.[43] H. Takebe, T. Harada, M. Kuwabara, J. Non-Cryst. Solids 352 (6–7) (2006) 709–
713.[44] I. Dyamant, E. Korin, J. Hormadaly, J. Non-Cryst. Solids 354 (27) (2008) 3135–
3141.[45] H. Kissinger, J. Res. Natl. Bur. Stand. 57 (4) (1956) 217–221.[46] S. Simon, V. Simon, Mater. Lett. 58 (2004) 3778–3781.[47] N. Mitrovic, S. Roth, J. Eckert, Appl. Phys. Lett. 78 (15) (2001) 2145–2147.[48] A.A. Soliman, E.M. Sakr, A. Ratep, I. Kashif, Armenian J. Phys. 3 (3) (2010) 218–
235.[49] D. Souri, J. Mater. Sci. 46 (21) (2011) 6998–7003.[50] A. Giridhar, Sudha Mahadevan, J. Non-Cryst. Solids 151 (3) (1992) 245–252.[51] M.K. Rabinal, K.S. Sangunni, E.S.R. Gopal, J. Non-Cryst. Solids 188 (1–2) (1995)
98–106.[52] D.P. Button, R. Tandon, C. King, M.H. Veléz, H.L. Tuller, D.R. Uhlmann, J. Non-
Cryst. Solids 49 (1–3) (1982) 129–142.[53] E.I. Kamitsos, G.D. Chryssikos, A.P. Patsis, M.A. Karakassides, J. Non-Cryst.
Solids 131–133 (1991) 1092–1095.[54] E.I. Kamitsos, M.A. Karakassides, G.D. Chryssikos, J. Phys. Chem. 91 (5) (1987)
1073–1079.[55] S. Sindhu, S. Sanghi, A. Agarwal, V.P. Seth, N. Kishore, Spectrochim. Acta A 64
(1) (2006) 196–204.[56] M. Maczka, A. Waskowska, A. Majchrowski, J. Kisielewski, W. Szyrski, J.
Hanuza, J. Solid State Chem. 181 (12) (2008) 3211–3216.


![Vibrational spectroscopic (FT-IR and FT-Raman) studies, HOMO-LUMO, NBO analysis and MEP of 6-methyl-1-({[(2E)-2-methyl-3-phenyl-prop-2-en-1-yl]oxy}methyl)-1,2,3,4-tetra-hydroquinazoline-2,4-dione,](https://static.fdokumen.com/doc/165x107/633494f441100cab3c07ce05/vibrational-spectroscopic-ft-ir-and-ft-raman-studies-homo-lumo-nbo-analysis.jpg)