United Kingdom -Coal MarketLine Industry Profile Coal in the United Kingdom
INTERNATIONAL FLAME RESEARCH FOUNDATION
1
18th
IFRF Members’ Conference – Flexible and clean fuel conversion to industry
Freising, Germany, 1, 2, 3 June 2015 – Paper n. 60
ADAPTIVE KINETIC MODEL FOR COAL DEVOLATILIZATION IN
OXY-COAL COMBUSTION CONDITIONS
Salvatore Iavarone1, Gianluca Caposciutti
2, Chiara Galletti
2, Leonardo
Tognotti2, Francesco Contino
3, Alessandro Parente
1, Philip J. Smith
4
1AERO THERMO MECHANICAL DEPARTMENT,
UNIVERSITÉ LIBRE DE BRUXELLES
Avenue F. D. Roosevelt 50, B-1050 Bruxelles, Belgium 2DEPARTMENT OF CIVIL AND INDUSTRIAL ENGINEERING, UNIVERSITY OF PISA
Largo L. Lazzarino 2, I-56126 Pisa, Italy 3DEPARTMENT OF MECHANICAL ENGINEERING,
VRIJE UNIVERSITEIT BRUSSELS
Boulevard de la Plaine, 2. B-1050 Bruxelles, Belgium 4INSTITUTE FOR CLEAN AND SECURE ENERGY, UNIVERSITY OF UTAH
155 South 1452 East, UT 84112 Salt Lake City, USA
ABSTRACT
The oxy-coal combustion is emerging as the most likely low-cost “clean coal” technology for
both carbon capture and NOx and SOx emissions reduction. The use of CFD tools is crucial
for cost-effective oxy-fuel technologies development and environmental concerns
minimization. The coupling of detailed chemistry and CFD simulations is still prohibitive,
especially for large-scale plants, because of the high computational effort required. So, the
development of simple and reliable kinetic mechanisms is therefore necessary.
This work presents a CFD study on coal pyrolysis, regarding implementation, validation and
comparison of different devolatilization models, assessing their capacity to predict the total
volatile yield, depending on heating rate, temperature and coal type.
1. INTRODUCTION
Nowadays, coal remains one of the most important energy sources. Fossil fuels, as coal, are
expected to continue supplying much of the energy used worldwide. Petroleum remains the
largest energy source but its share of world marketed energy consumption will fall in the
future. Among the fossil fuels, coal is the source that shows the most important growth [1].
The larger availability, the broader worldwide distribution, and lower cost, in respect to other
fossil fuels, make it a leading energy resource for the power generation in the world,
especially during economic crises as the actual one. Moreover, it will remain a major energy
resource for the next few decades [2]. Unfortunately, the use of coal is affected by an
environmental concern, not only because of its greenhouse impact, correlated to the highest
share of the carbon dioxide emissions, but also because of the emission of nitrogen and sulfur
oxides and the formation of aerosol particles. For these reasons “clean coal” technologies,
reducing the emission of pollutants, are of intense technological interest.
The emission of greenhouse gases can be reduced in several ways, e.g. improving the
efficiency of the power plant with a combined cycle, using a mixture of fuel and biomass, or
through Carbon Capture and Sequestration (CCS). Among the different technologies that can
accomplish the CO2 capture, the oxy-combustion is the most interesting: it is emerging as the
most expected low-cost technology solution for both carbon capture and simultaneous
reduction of NOx and SOx emissions and the most competitive technology option for
retrofitting existing coal-fired power plants [3]. Compared with the conventional coal
combustion, in the oxy-coal combustion air is substituted with an O2/CO2 mixture. As a
result, numerous gas properties such as density, heat capacity, diffusivity and gas emissivity
change, impacting coal reactivity. These changes result in a higher volatile release and char
burnout, flame ignition delays, improvement of CO2 separation process, lower emissions in
terms of nitrogen oxides, sulfur oxides and particulate matter [4]. The main disadvantage of
the use of an oxy-combustion plant is an overall efficiency loss, due to the presence of an air
separation unit (ASU).

INTERNATIONAL FLAME RESEARCH FOUNDATION
2
18th
IFRF Members’ Conference – Flexible and clean fuel conversion to industry
Freising, Germany, 1, 2, 3 June 2015 – Paper n. 60
The use of detailed simulation tools such as computational fluid dynamics (CFD) codes
appears necessary to allow the development of cost-effective oxy-coal technologies at a scale
sufficient to augment existing energy options. However, extending modeling capabilities to
oxy-fuel combustion conditions requires significant effort. The direct coupling of detailed
chemistry and CFD simulations is a fundamental requisite for a realistic reproduction of the
combustion process, though it is still challenging, due to extremely large number of species
and reactions (generally hundreds of species and thousands of reactions) involved in detailed
kinetic mechanisms describing coal devolatilization, char oxidation and pollutant formation
[5]. Despite the improvements in the computational capability, the coupling is prohibitive
especially for real combustors, characterized by large computational grids. For this reason, in
order to find a good compromise between the computational efforts and the chemical-
physical carefulness, it is necessary to develop simplified mechanisms able to assure the main
features of the detailed mechanism at an affordable cost. Although reduced kinetic models
can be of interest for relatively small-scale applications, the implementation of realistic
chemistry for large-scale systems requires the development of general and adaptive models,
reliable both for coal rank and operating conditions and feasible for application in Large
Eddy Simulation (LES) approach.
The devolatilization, or pyrolysis, is the first step in all the thermochemical processes
involving solid fuels and influences the overall subsequent reactions. A devolatilization
kinetic model is thus the basis of comprehensive CFD codes for studying the coal combustion
in pilot and large sized plants, optimizing the reactor and operating conditions, predicting the
formation of pollutants and their precursors [6,7]. The pyrolysis models in the literature
spread from simple approaches, such as single, parallel, multistep, or distributed kinetic
models [8-10], to complex structural phenomenological models, such as Flashchain [11],
CPD [12], and FG-DVC [13]. The simple approaches are generally applied to specific coals
and operating ranges; despite their simplicity, they are not comprehensive, because they fail
to properly predict the dependence of the volatile yield on the heating rates. The
phenomenological models include coal structure characterization, network modeling, cross-
linking reactions, and non-condensable gas, tar, and char formation and they are potentially
applicable to wide ranges of coal composition and operating conditions, being generally very
accurate, but they are computationally expensive, especially in LES framework. For these
reasons, the aim of our work was the development of a simple and accurate model feasible for
CFD applications and able to predict the devolatilization conversion under different
temperatures, heating rates and reaction times. We decided to focus our study on a
modification of the Single First Order Reaction (SFOR) model, which is the simplest and
most used kinetic approach and it can be easily included in CFD codes. The main assumption
of this approach is that the devolatilization occurs in a single step according to a first order
law:
dVM
dt= Ae
−E
RTp(VMf − VM) (1)
where VM is the volatile matter yield, t is the time, R the ideal gas constant and Tp the
absolute temperature of the particle. It requires two parameters, e.g. the pre-exponential
factor A and the activation energy E, and the final volatile matter yield VMf. The
approximation obtained with the SFOR model is not generally acceptable [14-16], but in
several recent CFD coal combustion works, the pyrolysis mechanism has been described
using one-step kinetic model [17-20]. Given the high sensitivity of kinetic constants to the
particle heating rate and final temperature, an iterative procedure between the devolatilization
model calibration and the CFD computations may produce the best results [21].
Phenomenological network models can be used for the calibration of one-step models at
heating rates larger than those in drop tube or thermal gravimetric analysis (TGA)
experiments [22-26]. To avoid the use of complex structural model and to limit the
computational efforts, we followed two different methodologies to perform an iterative
procedure, joining experimental data and CFD simulations.

INTERNATIONAL FLAME RESEARCH FOUNDATION
3
18th
IFRF Members’ Conference – Flexible and clean fuel conversion to industry
Freising, Germany, 1, 2, 3 June 2015 – Paper n. 60
2. METHODOLOGY
The experimental data of interest are derived from the pyrolysis tests carried out in the same
experimental apparatus, the Isothermal Plug Flow Reactor (IPFR) that allows severe thermal
conditions to be reached. Conversions, kinetics and other specific test parameters can be
obtained for several fuels under proven procedures that give uniform and reliable data [27].
The IPFR data on different fuels were previously uniformed and organized in the Solid Fuel
DataBase (SFDB) of IFRF, International Flame Research Foundation. The SFDB contains
more than 800 tests (devolatilization, char oxidation and nitrogen partitioning) of 270 fuels
(mostly coals, some biomasses, respective chars and some blends of the parent fuels). All the
tests have been carried out in the IPFR [28]. Each experimental result is defined by a value of
the nominal particle residence time, calculated on the basis of the reactor length and the
actual conditions, the nominal reactor temperature, the volatile matter released and the
devolatilization conversion.
The experimental data we used in this work are the results of three devolatilization tests at
1173, 1373 and 1573 K, performed on the bituminous coal Sebuku.
Figure 1. Scheme of Isothermal Plug Flow Reactor
2.1 Description of the Isothermal Plug Flow Reactor A brief description of the geometrical, operating and diagnostic parameters of the IPFR in the
site of Livorno (Italy) can be found in [27,29,30]. It is a drop tube (4.5 m total length × 0.15
m inner diameter, see Figure 1) with the heating system formed of the electrical resistances
(globally 54 kW) located on the walls, and the hot gases coming from the 60 kW burner
located at the top section of the reactor. The solid fuel particles are pneumatically injected
with a primary gas through a feeding probe inserted at different heights through one of the 19
ports available along the tube. The material is sieved and samples of size fractions comprised
in the range 40–100 μm are studied. The solid flow rate is maintained constant (up to 100
g/h). The gaseous environment (pure nitrogen or CO2 for devolatilization tests, though the
secondary gas can be formed of adjustable mixtures of N2/O2/CO2) and reactor temperature
(up to 1670 K) can be programmed. The particle residence time is estimated between 15 and
1500 ms, and heating rate between 104 and 10
5 K/s [31]. The solid residue and gaseous
products are quenched and sampled in the collection probe for online and offline analyses:
proximate, ultimate, particle size distribution and ash composition. The ash content of the
solid residue is then compared to that of the parent coal for calculating the conversion with
the ash tracer method [27].

INTERNATIONAL FLAME RESEARCH FOUNDATION
4
18th
IFRF Members’ Conference – Flexible and clean fuel conversion to industry
Freising, Germany, 1, 2, 3 June 2015 – Paper n. 60
2.2 Derivation of SFOR kinetic parameters
As discussed above, we used two approaches for deriving kinetic parameters for the SFOR
model, using CFD and IPFR data. The adoption of SFOR parameters taken from literature
can give inaccurate predictions of the coal devolatilization, because they are validated for
temperatures and heating rates lower than those typical of industrial plants.
In the first approach, the Sebuku coal particle temperature is supposed constant and equal to
the nominal IPFR temperature. The parameters are derived through an Arrhenius plot: the
kinetic rates came out from a fitting procedure of the experimental particle residual volatile
matter over residence time. The latter is derived from CFD simulations of IPFR under three
different temperatures, e.g. 1173, 1373 and 1573 K. This method is iterative: the particle
residence time is calculated twice, first from simulation of IPFR with injection of inert
particles and then from simulation of IPFR with injection of reactive particles. The method is
conventional for derivation of kinetic parameters. In the second approach, the particle
temperature history over residence time is derived from the CFD model of the IPFR, at 1173,
1373 and 1573 K. An analytical integration of the SFOR equation over time is performed,
taking into account the particle thermal history, e.g. a linear relation between temperature and
time that replaces the constant temperature, previously supposed, in the equation. An
optimization procedure, based on least square fit, is then performed on the derived correlation
between residual volatile matter and time to all the experimental data at the three different
temperatures, to derive the pre-exponential factor and the activation energy. This method
allowed us to derive kinetic parameters “sensitive” to the particle thermal history.
A schematic representation of the two methods and their connections with experimental and
CFD data is shown in Figure 2.
Figure 2. Methodological scheme
2.3 Comparison of different SFOR models
The two SFOR models, derived from the two different methods, which we define SFOR M1
and SFOR M2 from now on, are compared, performing CFD simulations of the Sebuku coal
devolatilization process in the IPFR. They are also compared to the pyrolysis model proposed
by Biagini and Tognotti [32], which is able to predict a realistic trend of released volatile
matter over particle temperatures. The Biagini’s model is a modification of the SFOR model,
obtained assuming that the final volatile matter yield, indicated in Equation 1 as VMf, is a
function of temperature:
VMf = 1 − exp (−DITp
Tst) (2)
where DI is the so-called Devolatilization Index, a dimensionless parameter specific for each
coal, Tp is the particle temperature and Tst is the proximate analysis “standard temperature”,
equal to 1223 K. The effective thermal history of the particle, estimated by a CFD model, is
considered, instead of a constant temperature. The total number of parameters in this
approach is still three, as in the original SFOR model.
INTERNATIONAL FLAME RESEARCH FOUNDATION
5
18th
IFRF Members’ Conference – Flexible and clean fuel conversion to industry
Freising, Germany, 1, 2, 3 June 2015 – Paper n. 60
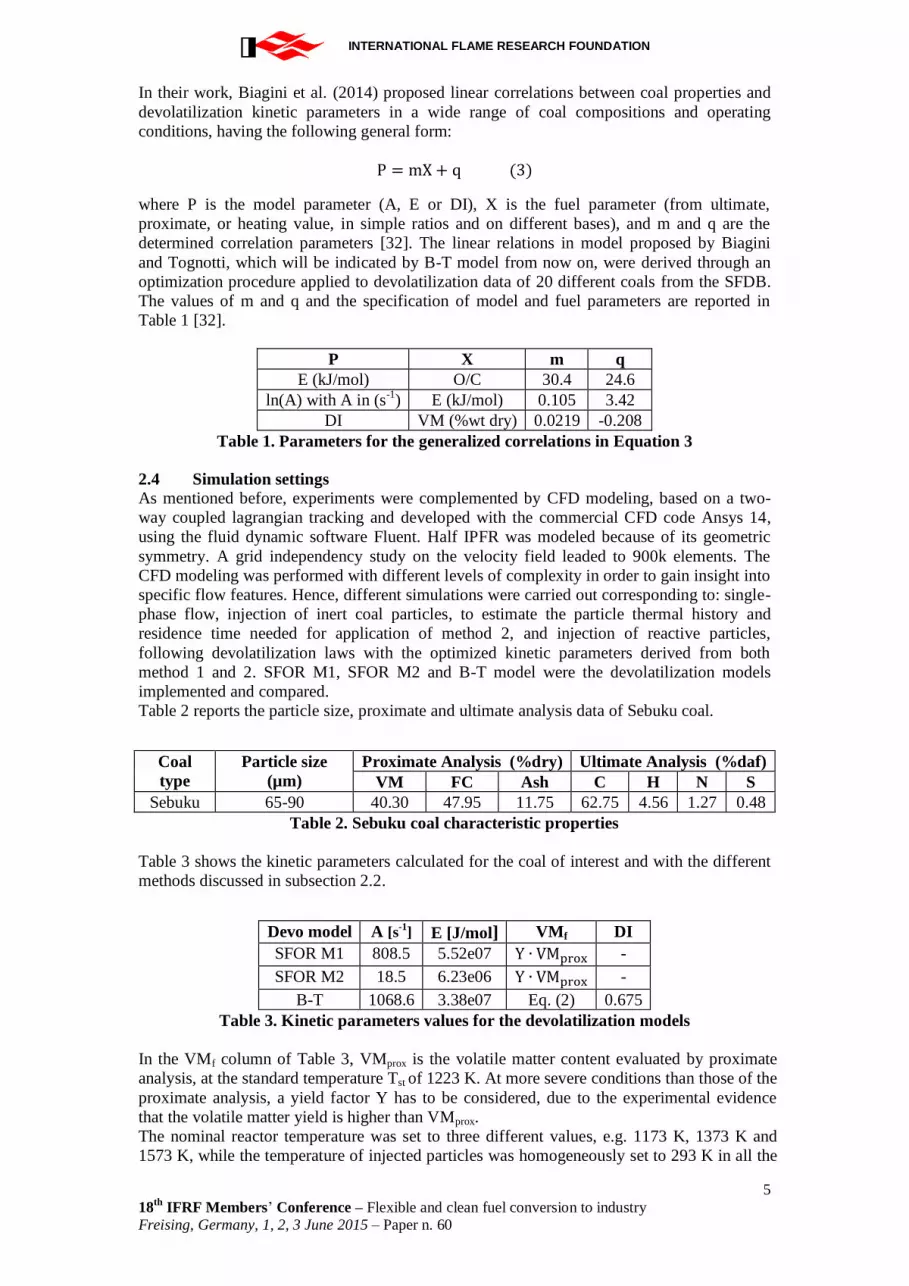
In their work, Biagini et al. (2014) proposed linear correlations between coal properties and
devolatilization kinetic parameters in a wide range of coal compositions and operating
conditions, having the following general form:
P = mX + q (3)
where P is the model parameter (A, E or DI), X is the fuel parameter (from ultimate,
proximate, or heating value, in simple ratios and on different bases), and m and q are the
determined correlation parameters [32]. The linear relations in model proposed by Biagini
and Tognotti, which will be indicated by B-T model from now on, were derived through an
optimization procedure applied to devolatilization data of 20 different coals from the SFDB.
The values of m and q and the specification of model and fuel parameters are reported in
Table 1 [32].
P X m q
E (kJ/mol) O/C 30.4 24.6
ln(A) with A in (s-1
) E (kJ/mol) 0.105 3.42
DI VM (%wt dry) 0.0219 -0.208
Table 1. Parameters for the generalized correlations in Equation 3
2.4 Simulation settings
As mentioned before, experiments were complemented by CFD modeling, based on a two-
way coupled lagrangian tracking and developed with the commercial CFD code Ansys 14,
using the fluid dynamic software Fluent. Half IPFR was modeled because of its geometric
symmetry. A grid independency study on the velocity field leaded to 900k elements. The
CFD modeling was performed with different levels of complexity in order to gain insight into
specific flow features. Hence, different simulations were carried out corresponding to: single-
phase flow, injection of inert coal particles, to estimate the particle thermal history and
residence time needed for application of method 2, and injection of reactive particles,
following devolatilization laws with the optimized kinetic parameters derived from both
method 1 and 2. SFOR M1, SFOR M2 and B-T model were the devolatilization models
implemented and compared.
Table 2 reports the particle size, proximate and ultimate analysis data of Sebuku coal.
Coal
type
Particle size
(µm)
Proximate Analysis (%dry) Ultimate Analysis (%daf)
VM FC Ash C H N S
Sebuku 65-90 40.30 47.95 11.75 62.75 4.56 1.27 0.48
Table 2. Sebuku coal characteristic properties
Table 3 shows the kinetic parameters calculated for the coal of interest and with the different
methods discussed in subsection 2.2.
Devo model A [s-1] E [J/mol] VMf DI
SFOR M1 808.5 5.52e07 Y ∙ VMprox -
SFOR M2 18.5 6.23e06 Y ∙ VMprox -
B-T 1068.6 3.38e07 Eq. (2) 0.675
Table 3. Kinetic parameters values for the devolatilization models
In the VMf column of Table 3, VMprox is the volatile matter content evaluated by proximate
analysis, at the standard temperature Tst of 1223 K. At more severe conditions than those of the
proximate analysis, a yield factor Y has to be considered, due to the experimental evidence
that the volatile matter yield is higher than VMprox.
The nominal reactor temperature was set to three different values, e.g. 1173 K, 1373 K and
1573 K, while the temperature of injected particles was homogeneously set to 293 K in all the

INTERNATIONAL FLAME RESEARCH FOUNDATION
6
18th
IFRF Members’ Conference – Flexible and clean fuel conversion to industry
Freising, Germany, 1, 2, 3 June 2015 – Paper n. 60
cases. Reynolds-averaged Navier-Stokes equations were solved using the standard κ-ε
turbulence models. The Eddy Dissipation Model was used to treat the turbulence-chemistry
interaction of the gaseous phase. Radiation was taken into account through the P1 radiation
model and Weighted Sum of Gray Gases Model (WSGG) for the spectral properties. The
particle emissivity was 0.7. A stationary solver was used to solve the equations using a second
order discretization scheme and the SIMPLE algorithms for the pressure-velocity coupling.
The steadiness of the solution with iteration was checked for convergence. All residuals were
usually below 10-4
.
3. RESULTS
Three different devolatilization models have been compared: the SFOR M1 and M2 models,
with kinetic parameters derived from method 1 and method 2, discussed in Section 2.2, and
the B-T model. Numerical results on coal particle track, residence times, thermal histories
and conversions can be obtained from CFD code.
Figure 3. Time spent by the particles to reach different reactor lengths at 1173 K (a),
1373 K (b) and 1573 K (c)
Figure 3 shows the time spent by the particles to reach different distances from the inlet at
different temperatures. These plots show how much the particles are spread inside the reactor
and have different time histories (dots). The hypothesis of isokinetic flow of particles and
gases that was made during the experiments [33] is not verified, as the experimental curve
(ideal particle mean) and CFD curve (CFD particle mean) have different slopes. Looking at
the particle thermal history, we were able to derive at different temperatures the mean heating
rate of the particles.
(a) (b)
(c)

INTERNATIONAL FLAME RESEARCH FOUNDATION
7
18th
IFRF Members’ Conference – Flexible and clean fuel conversion to industry
Freising, Germany, 1, 2, 3 June 2015 – Paper n. 60
Figure 4. Particle thermal histories at 1173 K (a), 1373 K (b), 1573 K (c)
Figure 4 shows the particle thermal history at different nominal temperatures. It can be
observed that the particles are not heated up at same ways, because of their different
diameters and tracks inside the reactor. An accurate evaluation of heating rates can be carried
out from these results. In first approximation, it was assumed to consider a linear relationship
between the particle mean temperature and time, leading to the assumption of a constant
heating rate for all the cases.
The mean residual volatile matter inside the particles over their residence time is compared
for CFD models (dashed lines) and experiments (dots) in Figures 5-7. Error bars for
experimental data, representing uncertainties, are not available. Meanwhile, error bars for
CFD data are calculated and the numerical results are shown in the form of mean VM and
corresponding standard deviations.
(a)
(a)
(b)
(c)
(b)

INTERNATIONAL FLAME RESEARCH FOUNDATION
8
18th
IFRF Members’ Conference – Flexible and clean fuel conversion to industry
Freising, Germany, 1, 2, 3 June 2015 – Paper n. 60
Figure 5. Mean residual volatile matter inside the particles over time for SFOR M1
model (a), SFOR M2 model (b) and B-T model (c) at 1173 K
At the lower temperature, namely 1173 K, Figure 5 shows the SFOR M1 model underpredicts
the volatile matter yield for the entrained reactor, as we would expect. The inclusion of the
thermal history leads to better prediction of the VM yields, for the SFOR M2 model. The B-T
model also performs reasonably, taking into account that it is not trained on the specific coal
subject of investigation.
Figure 6. Mean residual volatile matter inside the particles over time for SFOR M1
model (a), SFOR M2 model (b) and B-T model (c) at 1373 K
(c)
(a) (b)
(c)

INTERNATIONAL FLAME RESEARCH FOUNDATION
9
18th
IFRF Members’ Conference – Flexible and clean fuel conversion to industry
Freising, Germany, 1, 2, 3 June 2015 – Paper n. 60
At higher temperature, namely 1373 K, Figure 6 shows the underprediction of the SFOR M1
model becomes more severe and also the modified SFOR (SFOR M2) loses accuracy, while
the B-T model performs extremely well.
Figure 7. Mean residual volatile matter inside the particles over time for SFOR M1
model (a), SFOR M2 model (b), B-T model (c) and CPD (d) at 1573 K
At 1573 K, and so even more severe conditions, Figure 7 shows all models underpredict the
VM yield. While this is expected for the simple SFOR (SFOR M1), better results from the
models taking into account the thermal history (SFOR M2) would be expected. However, the
observed behavior is likely related to the hypothesis that was made of a constant heating rate,
which is not realistic in general and especially for the large gradients observed at the highest
temperature. As a consequence, both the SFOR M2 and B-T models are not able to take into
account the fast devolatilization observed in the experiments, which show higher conversion
than the CFD. A simulation with the CPD model was performed, to make a comparison
between simple models and a representative member of the network models class. The CPD
predict properly the VM yield, as can be seen from Figure 7. The simulation was
computationally more expensive; the CPU time was almost twice the one of the longest
performed simulation, the B-T model at 1573 K.
4. DISCUSSION
The comparison between different SFOR models allowed us to shed light on the drawbacks
of one-step models. These drawbacks can be primarily linked to the ultimate volatile yield
parameter: with a constant VMf embedded in the one-step model, the same final conversion
under different thermal conditions will be predicted, which is quite unreasonable. Even for
the models that consider a constant VMf, a yield factor Y has to be taken into account at high
heating rate conditions. This factor is higher than unity, it is assessed by experiments and
increases the value of the volatile matter content VMprox, which is evaluated by proximate
analysis at the standard temperature Tst of 1223 K. Consequently, a variable ultimate volatile
(a) (b)
(c) (d)

INTERNATIONAL FLAME RESEARCH FOUNDATION
10
18th
IFRF Members’ Conference – Flexible and clean fuel conversion to industry
Freising, Germany, 1, 2, 3 June 2015 – Paper n. 60
matter yield, depending on particle temperature, has to be taken into account in the SFOR
model.
The comparison and especially the validation of the models must be extended to other coals,
aiming to derive correlations between kinetic parameters and coal specific properties but a
lack of experimental data for kinetics of coal devolatilization, under conditions similar to
those of full-scale combustion plants, namely high temperature and heating rate, has to be
faced. To increase the number of available and useful experimental data, those collected from
the IPFR will be organized using the University of Berkeley’s PrIMe database. PrIMe
(Process Informatics Model) is a new approach for developing predictive models of chemical
reaction systems: the primary goals are collecting and storing data, validating the data and
quantifying uncertainties, and assembling the data into predictive models with quantified
uncertainties to meet specific user requirements [34]. The main feature of PrIME is the
possibility to export every database in XML format files, easy to read, modify and analyze.
The lack of experimental uncertainties is still an issue to deal with, especially for entrained
flow reactors: numerical simulation through CFD codes can be used to determine
uncertainties regarding flow of solid particles, consequent residence times, thermal histories
and conversion.
5. CONCLUSION
A numerical investigation through computational fluid dynamics of the IFRF’s entrained
reactor IPFR has been presented. In particular, the devolatilization process of Sebuku Coal
was studied. A comparison between three different pyrolysis models, namely Single First
Order Reaction models, simple and modified, was carried out. Two different approaches were
used for the derivation of SFOR kinetic parameters. SFOR M2 model, which takes into
account the particle thermal history, performs better than SFOR M1 model, that considers a
constant particle temperature, thus confirming the necessity of taking into account the heating
process of coal particles as devolatilization occurs to improve the prediction of experimental
data. Moreover, considering the dependency of ultimate volatile yield on particle temperature
gives even better results, especially at high temperature. Despite that, the models fail to
predict the volatile matter release for temperature much higher than the proximate analysis,
proving the importance of performing experiments at severe conditions, as much close as
possible to industrial furnaces one. The underprediction of particle conversion is likely
related to the hypothesis that was made of a linear dependence of particle temperature over
time, and so of a constant heating rate, which is not proper. Deriving better relations for this
dependence, so considering not constant heating rates, can improve the SFOR model
capability. A sensitivity analysis will be performed on the correlation between particle
temperature and time, and on the ultimate volatile yield function embedded in B-T model, to
assess which parameter has the most important effect on coal pyrolysis prediction.
A numerical integration of SFOR equation will be performed, using a numerical
discretization of particle thermal history, e.g. the particle temperatures taken from CFD
model at different distances from the inlet: it will allow the coupling of optimized A, E
(derived from method 2) and ultimate volatile yield function of particle temperature, to
improve the predictions of the devolatilization process.
The aim of our future work will be the development of reliable and comprehensive relations
between kinetic parameters and coal properties for more than a single coal, using the SFDB
and the PrIMe utility for the fitting and validation of modified SFOR models.
REFERENCES
[1] McKendry P., Bioresource Technologies, 83:1 55 (2002)
[2] Smeets E. M. W., Faaij A. P. C., Lewandowski I. M. and Turkenburg W. C., Progress in
Energy and Combustion Science, 33 56 (2007)
[3] Maniatis K., in Progress in thermochemical biomass conversion (Ed. A. V. Bridgwater).
Blackwell Science, p1-31, 2001
[4] Scheffknecht G., Al-Makhadmeh L., Schnell U. and Maier J., International Journal of
Greenhouse Gas Control, 5 S16, (2011)
[5] Maffei T., Kinetic model of coal combustion. PhD thesis, Politecnico di Milano, 2013

INTERNATIONAL FLAME RESEARCH FOUNDATION
11
18th
IFRF Members’ Conference – Flexible and clean fuel conversion to industry
Freising, Germany, 1, 2, 3 June 2015 – Paper n. 60
[6] Wall T., Liu Y., Spero C., Elliott L., Khare S. and Rathnam R., Chemical Engineering
Research and Design, 87 1003 (2009)
[7] Alvarez L., Gharebaghi M., Jones J. M., Pourkashanian M., Williams A. and Riaza A.,
Applied Energy, 104 653 (2013)
[8] Anthony D.B. and Howard J.B, AIChE Journal, 22:4 625 (1976)
[9] Kobayashi H., Howard J.B. and Sarofim A.F., Sixteenth Symposium (International) on
Combustion, The Combustion Institute, Cambridge, p. 411, 1977
[10] Sommariva S., Maffei T., Migliavacca G., Faravelli T. and Ranzi E., Fuel, 89 318 (2010)
[11] Niksa S. and Kerstein A.R., Energy & Fuels, 5 647 (1991)
[12] Fletcher T. H., Kerstein A. R., Pugmire R. J., Solum M. S. and Grant D. M., Energy &
Fuels, 6 414 (1992)
[13] Solomon P. R., Hamblen D. G., Serio M. A., Yu Z. Z. and Charpenay S., Fuel, 72 469
(1993)
[14] Williams A., Backreedy R., Habib R., Jones J. M. and Pourkashanian M., Fuel, 81 605
(2002)
[15] Burnham A. K. and Braun R. L., Energy & Fuels, 13 1 (1999)
[16] Niksa S., Combustion and Flame, 100 384 (1995)
[17] Maffei T., Frassoldati A., Cuoci A., Ranzi E. and Faravelli T., Proceedings of the
Combustion Institute, 34:2 2401 (2013)
[18] Alvarez L., Gharebaghi M. and Pourkashanian M., Fuel Processing Technology, 92 1489
(2011)
[19] Al-Abbas A.H., Naser J. and Dodds D., Fuel, 90 1778 (2011)
[20] Fang Q., Musa A.B., Wei Y., Luo Z. and Zhou H., Energy & Fuels, 26 313 (2012)
[21] Vascellari M., Arora R., Pollack M. and Hasse C., Fuel, 113 654 (2013)
[22] Williams A., Backreedy R., Habib R., Jones J. and Pourkashanian M., Fuel 81:5 605
(2002)
[23] Edge P., Gharebaghi M., Irons R., Porter R., Pourkashanian M., Smith D., Stephenson P.
and Williams A., Chemical Engineering Research and Design, 89:9 1470 (2011)
[24] Stein O., Olenik G., Kronenburg A., Marincola F. C., Franchetti B., Kempf A., Ghiani
M., Vascellari M. and Hasse C., Flow Turbulence and Combustion, 90:4 859 (2013)
[25] Gharebaghi M., Irons R., Ma L., Pourkashanian M. and Pranzitelli A., International
Journal of Greenhouse Gas Control, 5 S100 (2011)
[26] Vascellari M., Schulze S., Nikrityuk P., Safronov D. and Hasse C., Flow Turbulence and
Combustion 92 319, (2014)
[27] Biagini E., Bonvicini G., Coraggio G. and Faleni M., Development of the Experimental
Procedures for Advanced Biofuels Characterization in the Isothermal Plug Flow Reactor,
IFRF doc. no. G27/y/01, 2013
[28] Biagini E. and Tognotti L., Keynote: solid fuel databases: state of the art and plan of
evolution at IFRF. 17th International IFRF Member Conference, 2012
[29] Biagini E., Biasci L. and Marcucci M., Description of the Isothermal Plug Flow Reactor
and the Experimental Procedures for Combustion Studies on Solid Fuels, IFRF doc. no.
G03/y/03, 2010
[30] Biagini E., Barontini F., Bonvicini G., Coraggio G. and Tognotti L., Chemical
Engineering Transactions, 37 493 (2014)
[31] Galletti C., Giovannini L., Coraggio G. and Tognotti L., Chemical Engineering
Transactions, 32 709 (2013)
[32] Biagini E. and Tognotti L., Fuel Processing Technology, 126 513(2014)
[33] Bonvicini G., Coraggio G. and Faleni M., Coal characterization in oxy-firing conditions
using the Isothermal Plug Flow Reactor, IFRF doc. no. F112/y/01, 2013
[34] http://www.primekinetics.org/
Copyright © 2022 FDOKUMEN