
United Kingdom & Ireland Local Pages - The Church of Jesus ...

United Kingdom - Coal 0183 - 2400 - 2012
© MARKETLINE THIS PROFILE IS A LICENSED PRODUCT AND IS NOT TO BE PHOTOCOPIED Page | 1
MarketLine Industry Profile
Coal in the United Kingdom September 2013
Reference Code: 0183-2400
Publication Date: September 2013
WWW.MARKETLINE.COM
MARKETLINE. THIS PROFILE IS A LICENSED PRODUCT AND IS NOT TO BE PHOTOCOPIED
United Kingdom - Coal 0183 - 2400 - 2012
© MARKETLINE THIS PROFILE IS A LICENSED PRODUCT AND IS NOT TO BE PHOTOCOPIED Page | 2
EXECUTIVE SUMMARY
Market value The United Kingdom coal market grew by 13.6% in 2012 to reach a value of $6,419.3 million.
Market value forecast In 2017, the United Kingdom coal market is forecast to have a value of $7,522 million, an increase of 17.2% since 2012.
Market volume The United Kingdom coal market grew by 10.9% in 2012 to reach a volume of 60.9 million short ton.
Market volume forecast In 2017, the United Kingdom coal market is forecast to have a volume of 52.9 million short ton, a decrease of 13.1%
since 2012.
Geography segmentation The United Kingdom accounts for 6.6% of the European coal market value.
Market rivalry The UK coal market is tending towards increased consolidation. In 2013, Hargreaves Services took over five Scottish
Coal mines following the collapse of the company. Additionally, UK Coal, the biggest coal miner in Britain, is restructuring
its activities following the closure of Daw Mill, which represented a third of the UK Coal's revenue.

United Kingdom - Coal 0183 - 2400 - 2012
© MARKETLINE THIS PROFILE IS A LICENSED PRODUCT AND IS NOT TO BE PHOTOCOPIED Page | 3
TABLE OF CONTENTS
Executive Summary ....................................................................................................................................................... 2
Market value ............................................................................................................................................................... 2
Market value forecast ................................................................................................................................................. 2
Market volume ............................................................................................................................................................ 2
Market volume forecast .............................................................................................................................................. 2
Geography segmentation ........................................................................................................................................... 2
Market rivalry .............................................................................................................................................................. 2
Market Overview ............................................................................................................................................................ 7
Market definition ......................................................................................................................................................... 7
Market analysis .......................................................................................................................................................... 7
Market Data ................................................................................................................................................................... 8
Market value ............................................................................................................................................................... 8
Market volume ............................................................................................................................................................ 9
Market Segmentation ................................................................................................................................................... 10
Geography segmentation ......................................................................................................................................... 10
Market Outlook ............................................................................................................................................................. 11
Market value forecast ............................................................................................................................................... 11
Market volume forecast ............................................................................................................................................ 12
Five Forces Analysis .................................................................................................................................................... 13
Summary .................................................................................................................................................................. 13
Buyer power ............................................................................................................................................................. 14
Supplier power ......................................................................................................................................................... 15
New entrants ............................................................................................................................................................ 16
Threat of substitutes ................................................................................................................................................. 17
Degree of rivalry ....................................................................................................................................................... 18
Leading Companies ..................................................................................................................................................... 19
Hargreaves Services Plc .......................................................................................................................................... 19
Rio Tinto ................................................................................................................................................................... 23
Scottish Coal ............................................................................................................................................................ 26
UK Coal Production Limited ..................................................................................................................................... 27
Macroeconomic Indicators ........................................................................................................................................... 28

United Kingdom - Coal 0183 - 2400 - 2012
© MARKETLINE THIS PROFILE IS A LICENSED PRODUCT AND IS NOT TO BE PHOTOCOPIED Page | 4
Country Data ............................................................................................................................................................ 28
Appendix ...................................................................................................................................................................... 30
Methodology ............................................................................................................................................................. 30
Industry associations ................................................................................................................................................ 31
Related MarketLine research ................................................................................................................................... 31

United Kingdom - Coal 0183 - 2400 - 2012
© MARKETLINE THIS PROFILE IS A LICENSED PRODUCT AND IS NOT TO BE PHOTOCOPIED Page | 5
LIST OF TABLES
Table 1: United Kingdom coal market value: $ million, 2008–12 .................................................................................... 8
Table 2: United Kingdom coal market volume: million short ton, 2008–12 ..................................................................... 9
Table 3: United Kingdom coal market geography segmentation: $ million, 2012 ......................................................... 10
Table 4: United Kingdom coal market value forecast: $ million, 2012–17 .................................................................... 11
Table 5: United Kingdom coal market volume forecast: million short ton, 2012–17 ..................................................... 12
Table 6: Hargreaves Services Plc: key facts ................................................................................................................ 19
Table 7: Hargreaves Services Plc: key financials ($) ................................................................................................... 20
Table 8: Hargreaves Services Plc: key financials (£) ................................................................................................... 20
Table 9: Hargreaves Services Plc: key financial ratios ................................................................................................. 21
Table 10: Rio Tinto: key facts ....................................................................................................................................... 23
Table 11: Rio Tinto: key financials ($) .......................................................................................................................... 24
Table 12: Rio Tinto: key financial ratios ....................................................................................................................... 24
Table 13: Scottish Coal: key facts ................................................................................................................................ 26
Table 14: UK Coal Production Limited: key facts ......................................................................................................... 27
Table 15: United Kingdom size of population (million), 2008–12.................................................................................. 28
Table 16: United Kingdom gdp (constant 2000 prices, $ billion), 2008–12 .................................................................. 28
Table 17: United Kingdom gdp (current prices, $ billion), 2008–12 .............................................................................. 28
Table 18: United Kingdom inflation, 2008–12 .............................................................................................................. 29
Table 19: United Kingdom consumer price index (absolute), 2008–12 ........................................................................ 29
Table 20: United Kingdom exchange rate, 2008–12 .................................................................................................... 29

United Kingdom - Coal 0183 - 2400 - 2012
© MARKETLINE THIS PROFILE IS A LICENSED PRODUCT AND IS NOT TO BE PHOTOCOPIED Page | 6
LIST OF FIGURES
Figure 1: United Kingdom coal market value: $ million, 2008–12................................................................................... 8
Figure 2: United Kingdom coal market volume: million short ton, 2008–12 .................................................................... 9
Figure 3: United Kingdom coal market geography segmentation: % share, by value, 2012 ........................................ 10
Figure 4: United Kingdom coal market value forecast: $ million, 2012–17 ................................................................... 11
Figure 5: United Kingdom coal market volume forecast: million short ton, 2012–17 .................................................... 12
Figure 6: Forces driving competition in the coal market in the United Kingdom, 2012 ................................................. 13
Figure 7: Drivers of buyer power in the coal market in the United Kingdom, 2012 ....................................................... 14
Figure 8: Drivers of supplier power in the coal market in the United Kingdom, 2012 ................................................... 15
Figure 9: Factors influencing the likelihood of new entrants in the coal market in the United Kingdom, 2012 ............. 16
Figure 10: Factors influencing the threat of substitutes in the coal market in the United Kingdom, 2012..................... 17
Figure 11: Drivers of degree of rivalry in the coal market in the United Kingdom, 2012 ............................................... 18
Figure 12: Hargreaves Services Plc: revenues & profitability ....................................................................................... 21
Figure 13: Hargreaves Services Plc: assets & liabilities ............................................................................................... 22
Figure 14: Rio Tinto: revenues & profitability ............................................................................................................... 25
Figure 15: Rio Tinto: assets & liabilities ....................................................................................................................... 25
United Kingdom - Coal 0183 - 2400 - 2012
© MARKETLINE THIS PROFILE IS A LICENSED PRODUCT AND IS NOT TO BE PHOTOCOPIED Page | 7
MARKET OVERVIEW
Market definition The coal market is defined as revenues due to the sale of coal for industry and power generation.
Market volumes given within this profile are for both primary (anthracite, bituminous, and lignite) and secondary
(anthracite, bituminous, and lignite briquets but excluding metallurgical coke) coal consumption.
The market has been valued at annual average minemouth prices and does not include any transportation costs.
Any currency conversions used in the creation of this report have been calculated using constant annual average 2012
exchange rates.
For the purposes of this report, Europe consists of Western Europe and Eastern Europe.
Western Europe comprises Belgium, Denmark, France, Germany, Greece, Italy, the Netherlands, Norway, Spain,
Sweden, Switzerland, Turkey, and the United Kingdom.
Eastern Europe comprises the Czech Republic, Hungary, Poland, Romania, Russia, and Ukraine.
Market analysis The UK coal market witnessed some strong growth recently, after recovering from a steep contraction in 2009.
Significant deceleration is however expected, with annual rate not exceeding 4.5%.
The UK coal market had total revenues of $6.4bn in 2012, representing a compound annual growth rate (CAGR) of 1.1%
between 2008 and 2012. In comparison, the French market declined with a compound annual rate of change (CARC) of
-1.7%, and the German market increased with a CAGR of 4.0%, over the same period, to reach respective values of
$2.3bn and $38.8bn in 2012.
Market consumption volumes declined with a CARC of -1.4% between 2008 and 2012, to reach a total of 60.9 million
short tons in 2012. The market's volume is expected to fall to 52.9 million short tons by the end of 2017, representing a
CARC of -2.8% for the 2012-2017 period.
The performance of the market is forecast to accelerate, with an anticipated CAGR of 3.2% for the five-year period 2012
- 2017, which is expected to drive the market to a value of $7.5bn by the end of 2017. Comparatively, the French and
German markets will grow with CAGRs of 5.0% and 6.1% respectively, over the same period, to reach respective values
of $3.0bn and $52.1bn in 2017.

United Kingdom - Coal 0183 - 2400 - 2012
© MARKETLINE THIS PROFILE IS A LICENSED PRODUCT AND IS NOT TO BE PHOTOCOPIED Page | 8
MARKET DATA
Market value The United Kingdom coal market grew by 13.6% in 2012 to reach a value of $6,419.3 million.
The compound annual growth rate of the market in the period 2008–12 was 1.1%.
Table 1: United Kingdom coal market value: $ million, 2008–12
Year $ million £ million € million % Growth
2008 6,13 .8 3,874.1 4,776.3
2009 4,514.0 2,848.7 3,512.1 (26.5%)
2010 5,136.2 3,241.4 3,996.3 13.8%
2011 5,652.8 3,567.3 4,398.2 10.1%
2012 6,419.3 4,051.1 4,994.6 13.6%
CAGR: 2008–12 1.1%
SOURCE: MARKETLINE M A R K E T L I N E
Figure 1: United Kingdom coal market value: $ million, 2008–12
SOURCE: MARKETLINE M A R K E T L I N E

United Kingdom - Coal 0183 - 2400 - 2012
© MARKETLINE THIS PROFILE IS A LICENSED PRODUCT AND IS NOT TO BE PHOTOCOPIED Page | 9
Market volume The United Kingdom coal market grew by 10.9% in 2012 to reach a volume of 60.9 million short ton.
The compound annual rate of change of the market in the period 2008–12 was -1.4%.
Table 2: United Kingdom coal market volume: million short ton, 2008–12
Year million short ton % Growth
2008 64.5
2009 53.3 (17.4%)
2010 55.4 3.9%
2011 54.9 (0.9%)
2012 60.9 10.9%
CAGR: 2008–12 (1.4%)
SOURCE: MARKETLINE M A R K E T L I N E
Figure 2: United Kingdom coal market volume: million short ton, 2008–12
SOURCE: MARKETLINE M A R K E T L I N E

United Kingdom - Coal 0183 - 2400 - 2012
© MARKETLINE THIS PROFILE IS A LICENSED PRODUCT AND IS NOT TO BE PHOTOCOPIED Page | 10
MARKET SEGMENTATION
Geography segmentation The United Kingdom accounts for 6.6% of the European coal market value.
Germany accounts for a further 39.9% of the European market.
Table 3: United Kingdom coal market geography segmentation: $ million, 2012
Geography 2012 %
Germany 38,789.9 39.9
United Kingdom 6,419.3 6.6
Spain 2,438.6 2.5
France 2,347.8 2.4
Italy 1,608.4 1.7
Rest of Europe 45,576.0 46.9
Total 97,180 100%
SOURCE: MARKETLINE M A R K E T L I N E
Figure 3: United Kingdom coal market geography segmentation: % share, by value, 2012
SOURCE: MARKETLINE M A R K E T L I N E

United Kingdom - Coal 0183 - 2400 - 2012
© MARKETLINE THIS PROFILE IS A LICENSED PRODUCT AND IS NOT TO BE PHOTOCOPIED Page | 11
MARKET OUTLOOK
Market value forecast In 2017, the United Kingdom coal market is forecast to have a value of $7,522 million, an increase of 17.2% since 2012.
The compound annual growth rate of the market in the period 2012–17 is predicted to be 3.2%.
Table 4: United Kingdom coal market value forecast: $ million, 2012–17
Year $ million £ million € million % Growth
2012 6,419.3 4,051.1 4,994.6 13.6%
2013 6,473.1 4,085.0 5,036.4 0.8%
2014 6,632.4 4,185.6 5,160.4 2.5%
2015 6,924.9 4,370.1 5,387.9 4.4%
2016 7,220.8 4,556.9 5,618.2 4.3%
2017 7,522.0 4,747.0 5,852.5 4.2%
CAGR: 2012–17 3 2%
SOURCE: MARKETLINE M A R K E T L I N E
Figure 4: United Kingdom coal market value forecast: $ million, 2012–17
SOURCE: MARKETLINE M A R K E T L I N E

United Kingdom - Coal 0183 - 2400 - 2012
© MARKETLINE THIS PROFILE IS A LICENSED PRODUCT AND IS NOT TO BE PHOTOCOPIED Page | 12
Market volume forecast In 2017, the United Kingdom coal market is forecast to have a volume of 52.9 million short ton, a decrease of 13.1%
since 2012.
The compound annual rate of change of the market in the period 2012–17 is predicted to be -2.8%.
Table 5: United Kingdom coal market volume forecast: million short ton, 2012–17
Year million short ton % Growth
2012 60.9 10.9%
2013 57.1 (6.2%)
2014 56.1 (1.8%)
2015 55.0 (1.9%)
2016 54.0 (1.9%)
2017 52.9 (1.9%)
CAGR: 2012–17 (2.8%)
SOURCE: MARKETLINE M A R K E T L I N E
Figure 5: United Kingdom coal market volume forecast: million short ton, 2012–17
SOURCE: MARKETLINE M A R K E T L I N E

United Kingdom - Coal 0183 - 2400 - 2012
© MARKETLINE THIS PROFILE IS A LICENSED PRODUCT AND IS NOT TO BE PHOTOCOPIED Page | 13
FIVE FORCES ANALYSIS
The coal market will be analyzed taking coal mining companies as players. The key buyers will be taken as power
generation companies, and mining equipment suppliers and landowners/regulators as the key suppliers.
Summary
Figure 6: Forces driving competition in the coal market in the United Kingdom, 2012
SOURCE: MARKETLINE M A R K E T L I N E
The UK coal market is tending towards increased consolidation. In 2013, Hargreaves Services took over five Scottish
Coal mines following the collapse of the company. Additionally, UK Coal, the biggest coal miner in Britain, is restructuring
its activities following the closure of Daw Mill, which represented a third of the UK Coal's revenue.
The size and strength of buyers in this market, grants them significant leverage; however, the high level of dependency
on coal as a vital energy source restrains buyer power somewhat.
Supplier power is weakened, as mining equipment is specialized and manufacturers are restrained by this dependency
on what constitutes a niche demand.
Large, multinational, diversified mining companies are the dominant players. They benefit from economies of scale, with
bulk coal production translating into a minimal per unit selling price for coal.
Coal, as an energy source, faces several possible substitutes, including: oil, gas, nuclear fuels, wind power and solar
power. Some are more beneficial for the environment; however, switching would involve high investment for traditional
power generation companies.

United Kingdom - Coal 0183 - 2400 - 2012
© MARKETLINE THIS PROFILE IS A LICENSED PRODUCT AND IS NOT TO BE PHOTOCOPIED Page | 14
Buyer power
Figure 7: Drivers of buyer power in the coal market in the United Kingdom, 2012
SOURCE: MARKETLINE M A R K E T L I N E
Buyers in this market are generally power generation companies. In the UK market, buyers include both power
companies that are exclusively involved in upstream activities, such as power generation and more vertically integrated
entities, such as RWE Group, which both generates and supplies electricity to end users through its service provider
Npower. Buyers can also be industrial and retail users. Coal companies are therefore not just selling to one or two
dominant buyers, which decreases the power of buyers here.
Amongst buyers, there are also steel makers, who use coking coal in the manufacture of steel.
Due to the high coal consumption of coal-fired power generators, vertical integration between electricity generation and
coal mining is possible and one example is BHP Billiton. Also steel companies are often additionally involved in the
mining of coal. However, the capital outlay needed to integrate vertically is very high.
With markets, such as electricity, controlled at the level of regional provinces, liberalization originally led to an increase in
competition and a weakening of established players. Coal is a commodity and once certain uniform standards have been
achieved there is only limited potential for product differentiation. Competition within the market is therefore largely driven
by price, increasing the buyer power.
Overall buyer power in this market is moderate.

United Kingdom - Coal 0183 - 2400 - 2012
© MARKETLINE THIS PROFILE IS A LICENSED PRODUCT AND IS NOT TO BE PHOTOCOPIED Page | 15
Supplier power
Figure 8: Drivers of supplier power in the coal market in the United Kingdom, 2012
SOURCE: MARKETLINE M A R K E T L I N E
Suppliers in this market, include producers of mining and production equipment and land owners, amongst others.
In general, supplier power is weakened by the fact that the mining market is important to supplier s’ revenues. Mining
equipment is often highly specialized and manufacturers are restrained by this dependency on what constitutes a niche
demand.
Innovation in the mining technology and equipment allows suppliers to differentiate their services and establish some
loyalty with market players.
Major landowners and governmental bodies can also be considered as suppliers within this market in some respect. The
well recognized nature of coal as a non-renewable source of energy, transforms the region, in which reserves are
located, into a critical supply input. The legal stranglehold over access to such reserves forms the strongest supply force.
Backward integration is unlikely as market players and buyers operate in distinctly different industries.
Overall, supplier power is only moderate.

United Kingdom - Coal 0183 - 2400 - 2012
© MARKETLINE THIS PROFILE IS A LICENSED PRODUCT AND IS NOT TO BE PHOTOCOPIED Page | 16
New entrants
Figure 9: Factors influencing the likelihood of new entrants in the coal market in the United Kingdom, 2012
SOURCE: MARKETLINE M A R K E T L I N E
Large multinational mining companies act as the dominant players within the coal market. These companies derive great
advantage from economies of scale, with bulk coal production translating into a minimal per unit selling price for coal.
Smaller companies within the market may therefore struggle to compete on an equal footing. This structural inequality
pushes the market towards consolidation.
The assets required for coal mining are considerable, including a large amount of specialized machinery. This serves as
a significant entry barrier. In addition, the complex logistics of coal mining and the prohibitive start-up costs, necessary
for securing a mine, constitute a further obstruction. The lack of serious product differentiation and the absence of brand
loyalty in this area undermine the security of current actors.
Stringent environmental regulations are increasingly putting pressure on the production of coal and it is becoming
increasingly expensive for companies to comply with such regulations. Coal is said to be the most environmentally
damaging fossil fuel. Organizations, such as the European Commission, are restricting the amount of emissions that are
allowed to be produced. However coal conversion technologies, such as coal-to-liquids and coal-to-gas, are expected to
create new markets for coal supplies which could encourage new entrants.
While mining companies involved in other activities, such as metals and iron ore, can alter their portfolio to include coal,
this transition would require investment in new mines, which constitutes a high switching cost if the company does not
operate on a large scale and therefore have the funds necessary for the investment.
Despite healthy market value growth within the last few years, the production volume is expected to contract going
forward, which tends to discourage newcomers in the coal market.
The threat from new entrants is assessed as weak in the current economic climate.

United Kingdom - Coal 0183 - 2400 - 2012
© MARKETLINE THIS PROFILE IS A LICENSED PRODUCT AND IS NOT TO BE PHOTOCOPIED Page | 17
Threat of substitutes
Figure 10: Factors influencing the threat of substitutes in the coal market in the United Kingdom, 2012
SOURCE: MARKETLINE M A R K E T L I N E
Coal, in principle, faces several possible substitutes in the power generation market, including: oil, gas, and nuclear
fuels.
Other substitutes include renewable sources, i.e. wind power and solar power, geothermal energy, etc. These can be
seen as quite a strong threat with the current emphasis on utilizing more environmentally friendly fuels, but involve high
investment for traditional power generation companies in order to make the transition to renewable energy sources.
In practice, power companies can only exploit low switching costs to a limited degree. The balance of their primary
energy mix can easily be altered, shifting the emphasis in accordance with the demands or dangers of the market.
However, a wholesale switch to alternative substitutes would involve significant investment – and divestment – of highly
specialized generation facilities.
Therefore, despite an ongoing challenge from cleaner energy sources, the coal market continues to hold significant
ground. Gas prices, global instability and concern over national energy independence, and resistance to the expansion
of nuclear power, conjoin to drive coal back into a strong position. Heavy investment in cleaner coal aims to
accommodate this movement, whilst undercutting environmental opposition. The implementation of clean coal
technology (CCT) strategies, such as carbon capture and storage (CCS), within coal fired power stations, may decrease
the environmental impact of using coal and reduce the threat of more environmentally friendly substitutes moving
forward.
In the short term, EIA forecasts that electricity generation from coal should increase by about 7.0% and generation from
natural gas should fall by 3.0% in 2013, as projected coal prices to the power sector fall slightly, while natural gas prices
increase, allowing coal to regain some of its power sector generation share. The combined impact from the usage of
natural gas and renewable sources to generate power is however expected to gradually reduce the share of coal to
produce electricity to 39.0% in 2035 from the high of 49.0% in 2007.
The threat from substitutes remains moderate.

United Kingdom - Coal 0183 - 2400 - 2012
© MARKETLINE THIS PROFILE IS A LICENSED PRODUCT AND IS NOT TO BE PHOTOCOPIED Page | 18
Degree of rivalry
Figure 11: Drivers of degree of rivalry in the coal market in the United Kingdom, 2012
SOURCE: MARKETLINE M A R K E T L I N E
The coal market is tending towards increased consolidation, with a local player, UK Coal, dominating the scene. The
presence of strong players boosts the competition within the market.
Exit barriers are high, as many of the major tangible assets are highly specialized and therefore divestment is difficult.
Although some of the players have other businesses, such as mining of metals, a relative lack of diversification sustains
rivalry. Geographical diversification is, however, often achieved, insulates companies from fluctuations within particular
countries’ markets.
Despite healthy market value growth within the last few years, the production volume is expected to contract going
forward which may boost the threat of competiton.
Overall, rivalry is strong.
United Kingdom - Coal 0183 - 2400 - 2012
© MARKETLINE THIS PROFILE IS A LICENSED PRODUCT AND IS NOT TO BE PHOTOCOPIED Page | 19
LEADING COMPANIES
Hargreaves Services Plc
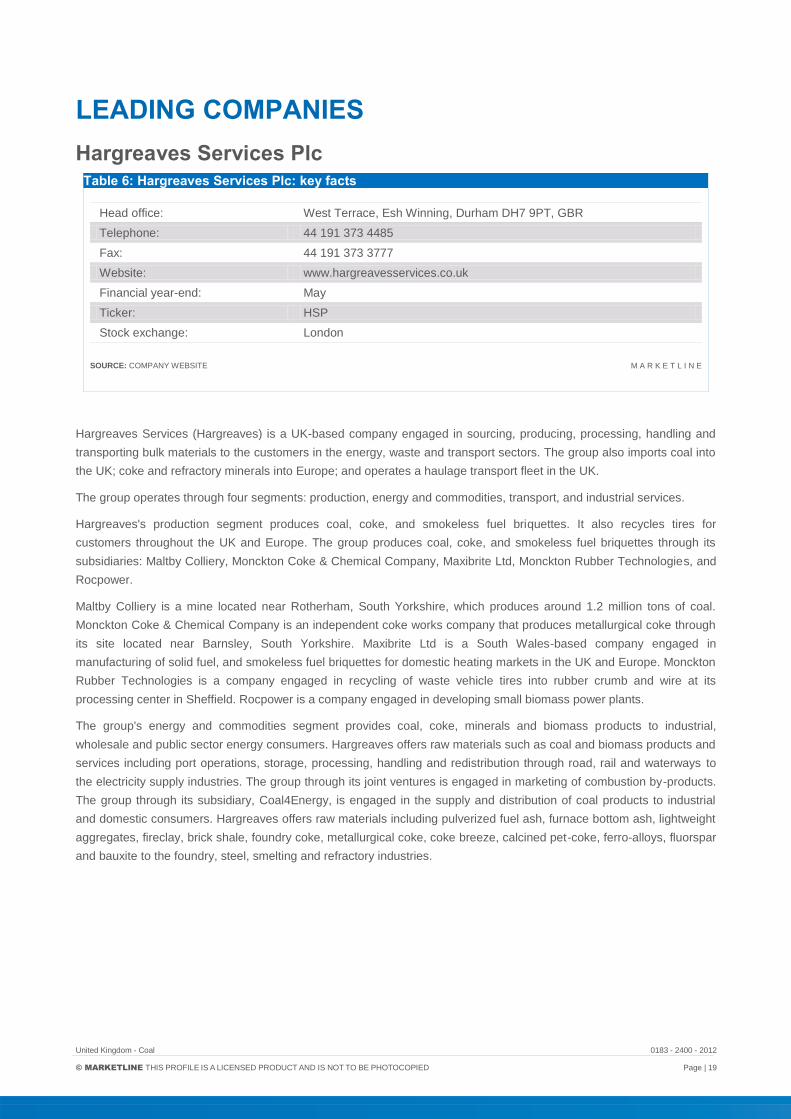
Table 6: Hargreaves Services Plc: key facts
Head office: West Terrace, Esh Winning, Durham DH7 9PT, GBR
Telephone: 44 191 373 4485
Fax: 44 191 373 3777
Website: www.hargreavesservices.co.uk
Financial year-end: May
Ticker: HSP
Stock exchange: London
SOURCE: COMPANY WEBSITE M A R K E T L I N E
Hargreaves Services (Hargreaves) is a UK-based company engaged in sourcing, producing, processing, handling and
transporting bulk materials to the customers in the energy, waste and transport sectors. The group also imports coal into
the UK; coke and refractory minerals into Europe; and operates a haulage transport fleet in the UK.
The group operates through four segments: production, energy and commodities, transport, and industrial services.
Hargreaves's production segment produces coal, coke, and smokeless fuel briquettes. It also recycles tires for
customers throughout the UK and Europe. The group produces coal, coke, and smokeless fuel briquettes through its
subsidiaries: Maltby Colliery, Monckton Coke & Chemical Company, Maxibrite Ltd, Monckton Rubber Technologies, and
Rocpower.
Maltby Colliery is a mine located near Rotherham, South Yorkshire, which produces around 1.2 million tons of coal.
Monckton Coke & Chemical Company is an independent coke works company that produces metallurgical coke through
its site located near Barnsley, South Yorkshire. Maxibrite Ltd is a South Wales-based company engaged in
manufacturing of solid fuel, and smokeless fuel briquettes for domestic heating markets in the UK and Europe. Monckton
Rubber Technologies is a company engaged in recycling of waste vehicle tires into rubber crumb and wire at its
processing center in Sheffield. Rocpower is a company engaged in developing small biomass power plants.
The group's energy and commodities segment provides coal, coke, minerals and biomass products to industrial,
wholesale and public sector energy consumers. Hargreaves offers raw materials such as coal and biomass products and
services including port operations, storage, processing, handling and redistribution through road, rail and waterways to
the electricity supply industries. The group through its joint ventures is engaged in marketing of combustion by-products.
The group through its subsidiary, Coal4Energy, is engaged in the supply and distribution of coal products to industrial
and domestic consumers. Hargreaves offers raw materials including pulverized fuel ash, furnace bottom ash, lightweight
aggregates, fireclay, brick shale, foundry coke, metallurgical coke, coke breeze, calcined pet-coke, ferro-alloys, fluorspar
and bauxite to the foundry, steel, smelting and refractory industries.

United Kingdom - Coal 0183 - 2400 - 2012
© MARKETLINE THIS PROFILE IS A LICENSED PRODUCT AND IS NOT TO BE PHOTOCOPIED Page | 20
Hargreaves's transport segment is engaged in the provision of logistics services to the individuals in the UK. The group
offers transportation services through its subsidiaries: Hargreaves Transport Services, Imperial Tankers, and Hargreaves
Waste Services. Hargreaves Transport Services is a bulk haulage operator. It operates through a fleet of around 200
vehicles that provides its services to the customers in markets including power generation, coal mining, quarrying, port
services, industrial chemicals, construction, recycling, and agriculture. The group's subsidiary Imperial Tankers is a road
tanker haulier. It transports liquid products including hazardous and non-hazardous chemicals, petroleum products,
bitumen, pitches and tars, pressurized gasses, and controlled liquid wastes. Hargreaves's subsidiary, Hargreaves Waste
Services is a bulk and roll on-off hauliers in the UK. It provides haulage and management solutions to the waste industry
and local authorities through its depots located around the UK.
The group's industrial services segment provides contract management services to the power generation, utilities,
chemicals, minerals and steel industries through its subsidiaries Norec, AJS Contracts, Killingholme Storage and
Distribution, and DWL Engineering Services. Its service offerings include: engineering design, fabrication and project
management, plant operation and maintenance, facilities management, and ash and residual product recovery services.
Hargreaves's clients in industrial services segment include: E.ON UK, Scottish Power, Scottish & Southern Energy,
International Power, EFD Energy, ConocoPhillips and Eggborough Power Ltd. In 2013, Hargreaves acquired assets of
the Scottish coal miner ATH Resources.
Key Metrics
The company recorded revenues of $1,091m in the fiscal year ending May 2012, an increase of 24.6% compared to
fiscal 2011. Its net income was $47m in fiscal 2012, compared to a net income of $39m in the preceding year.
Table 7: Hargreaves Services Plc: key financials ($)
$ million 2008 2009 2010 2011 2012
Revenues 641.6 797.2 728.6 875.2 1,090.7
Net income (loss) 20.1 29.6 32.6 39.0 46.7
Total assets 315.0 358.8 446.9 488.5 644.9
Total liabilities 239.0 245.1 304.7 306.8 428.9
Employees 1,900 1,979 2,209 2,399 2,426
SOURCE: COMPANY FILINGS M A R K E T L I N E
Table 8: Hargreaves Services Plc: key financials (£)
£ million 2008 2009 2010 2011 2012
Revenues 404.9 503.1 459.8 552.3 688.3
Net income (loss) 12.7 18.7 20.6 24.6 29.5
Total assets 198.8 226.4 282.0 308.3 407.0
Total liabilities 150.8 154.7 192.3 193.6 270.7
SOURCE: COMPANY FILINGS M A R K E T L I N E
United Kingdom - Coal 0183 - 2400 - 2012
© MARKETLINE THIS PROFILE IS A LICENSED PRODUCT AND IS NOT TO BE PHOTOCOPIED Page | 21
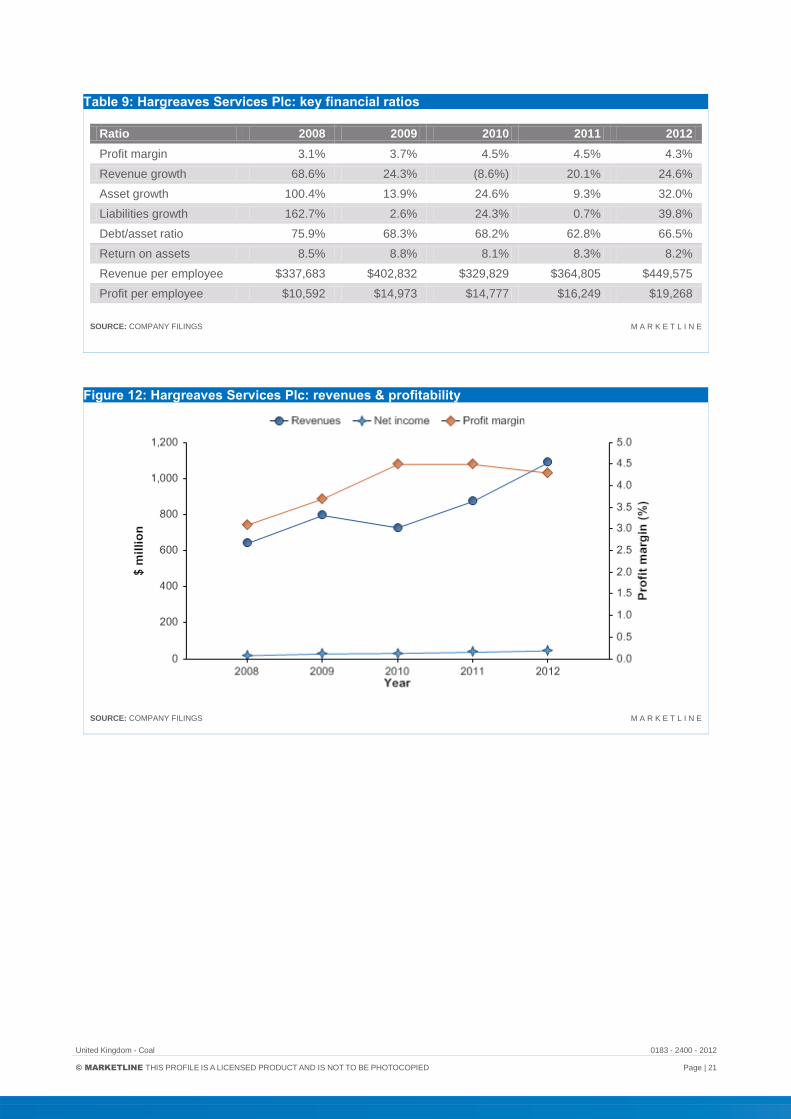
Table 9: Hargreaves Services Plc: key financial ratios
Ratio 2008 2009 2010 2011 2012
Profit margin 3.1% 3.7% 4.5% 4.5% 4.3%
Revenue growth 68.6% 24.3% (8.6%) 20.1% 24.6%
Asset growth 100.4% 13.9% 24.6% 9.3% 32.0%
Liabilities growth 162.7% 2.6% 24.3% 0.7% 39.8%
Debt/asset ratio 75.9% 68.3% 68.2% 62.8% 66.5%
Return on assets 8.5% 8.8% 8.1% 8.3% 8.2%
Revenue per employee $337,683 $402,832 $329,829 $364,805 $449,575
Profit per employee $10,592 $14,973 $14,777 $16,249 $19,268
SOURCE: COMPANY FILINGS M A R K E T L I N E
Figure 12: Hargreaves Services Plc: revenues & profitability
SOURCE: COMPANY FILINGS M A R K E T L I N E

United Kingdom - Coal 0183 - 2400 - 2012
© MARKETLINE THIS PROFILE IS A LICENSED PRODUCT AND IS NOT TO BE PHOTOCOPIED Page | 22
Figure 13: Hargreaves Services Plc: assets & liabilities
SOURCE: COMPANY FILINGS M A R K E T L I N E

United Kingdom - Coal 0183 - 2400 - 2012
© MARKETLINE THIS PROFILE IS A LICENSED PRODUCT AND IS NOT TO BE PHOTOCOPIED Page | 23
Rio Tinto
Table 10: Rio Tinto: key facts
Head office: 2 Eastbourne Terrace, London, W2 6LG, GBR
Telephone: 44 20 7781 2000
Fax: 44 20 7781 1800
Website: www.riotinto.com
Financial year-end: December
Ticker: RIO
Stock exchange: New York, Australia, London
SOURCE: COMPANY WEBSITE M A R K E T L I N E
Rio Tinto is engaged in international mining which encompasses exploring for, mining, and processing the earth's
mineral resources. The group offers products which include aluminum, coal, copper, diamonds, industrial minerals
(borax, titanium dioxide, and salt), gold, and iron ore. The group has global operations with significant businesses in
Australia, North America, South America, Asia, Europe, and South Africa.
Rio Tinto operates through eight business groups: iron ore; aluminum; coal, copper; industrial minerals; diamonds; gold;
and other operations.
Rio Tinto's iron ore group wholly owns Hamersley Iron mines in Brazil. Hamersley Iron operates ten mines including
three mines in joint venture. It also includes the Dampier Salt operations at three sites in Western Australia. Rio Tinto
has 53.0% interest in Robe River mines in Australia and 58.7% interest in Iron Ore Company of Canada. The company
has 50.35% interest in the Simandou iron ore project in Guinea.
Rio Tinto's aluminum group operates through the wholly-owned, integrated aluminum subsidiary, Rio Tinto Alcan. Rio
Tinto Alcan is one of the world's largest producers of bauxite, alumina, and aluminum. Rio Tinto Alcan provides bauxite,
alumina, specialty aluminas, and aluminum products.
The coal business group is one of the biggest suppliers of thermal and coking coal to the Asian seaborne market. Rio
Tinto Coal Australia manages eight coal mines in Queensland and New South Wales. In the US, the group operates the
Colowyo coal mine. It also offers higher-value coking, or metallurgical, coal which, when mixed in furnaces with iron ore,
produces steel.
Rio Tinto's copper group is the sixth largest supplier of copper. It has a diverse mix of operations and projects located in
North and South America, Africa, Asia, and Australia. The group offers copper, molybdenum, silver, and nickel.
The industrial minerals group comprises Rio Tinto Minerals (RTM) and Rio Tinto Iron & Titanium (RTIT). RTM is a global
leader in borates supply and RTIT is a market leader in high grade titanium dioxide. The segment provides borates,
titanium dioxide feedstocks, high purity iron, metal powders, zircon, and rutile products. It has five mines: Dampier Salt
holding 68.4% interest located at Dampier, Lake MacLeod, and Port Hedland in Western Australia; Rio Tinto Minerals -
Boron at California in the US; Rio Tinto Fer et Titane in Havre-Saint-Pierre, Quebec in Canada; QIT Madagascar
Minerals with 80% interest located at Fort-Dauphin in Madagascar; and Richards Bay Minerals with 74% interest located
at Richards Bay, KwaZulu-Natal in South Africa.
The diamonds group operates through Rio Tinto Diamonds (RTD), one of the world's leading rough diamond producers,
active in mining and sales and marketing. Rio Tinto's diamond assets comprises the Argyle diamond mine in Australia,
the Diavik diamond mine in Canada, Murowa diamonds in Zimbabwe, and the Bunder diamond project in India.

United Kingdom - Coal 0183 - 2400 - 2012
© MARKETLINE THIS PROFILE IS A LICENSED PRODUCT AND IS NOT TO BE PHOTOCOPIED Page | 24
The gold business group is one of the top 15 gold producers in the world, and the largest among the diversified miners.
Rio Tinto has interests in two of the largest gold resources, at Oyu Tolgoi and Grasberg. The Grasberg contains the
largest gold reserves in the world.
The other operations business group of Rio Tinto comprises its exploration, and technology and innovation business
groups.
The exploration group is organized into five geographically based teams in North America, South America, Australasia,
Asia, and Africa/Europe. The exploration group focuses on discovering new mineral resources to replace and/or
supplement those already mined by Rio Tinto. Its exploration teams, along with a small project generation team, are
constantly seeking new finds of these important products plus deposits of bauxite, iron ore, coal, uranium, borate, and
other industrially viable minerals.
The technology and innovation group has bases in Australia, Canada, the UK, and the US. Its role is to identify and
promote best operational technology practice across the group and to pursue step change innovation of strategic
importance to ore bodies of the future.
Key Metrics
The company recorded revenues of $50,967m in the fiscal year ending December 2012, a decrease of 15.8% compared
to fiscal 2011. Its net loss was $2,990m in fiscal 2012, compared to a net income of $5,826m in the preceding year.
Table 11: Rio Tinto: key financials ($)
$ million 2008 2009 2010 2011 2012
Revenues 54,264.0 41,825.0 56,576.0 60,537.0 50,967.0
Net income (loss) 4,609.0 5,335.0 14,324.0 5,826.0 (2,990.0)
Total assets 89,616.0 97,236.0 112,402.0 119,545.0 117,573.0
Total liabilities 67,155.0 51,311.0 47,128.0 60,337.0 59,552.0
Employees 54,264 56,894 76,894 67,930 71,219
SOURCE: COMPANY FILINGS M A R K E T L I N E
Table 12: Rio Tinto: key financial ratios
Ratio 2008 2009 2010 2011 2012
Profit margin 8.5% 12.8% 25.3% 9.6% (5.9%)
Revenue growth 82.7% (22.9%) 35.3% 7.0% (15.8%)
Asset growth (11.4%) 8.5% 15.6% 6.4% (1.6%)
Liabilities growth (10.5%) (23.6%) (8.2%) 28.0% (1.3%)
Debt/asset ratio 74.9% 52.8% 41.9% 50.5% 50.7%
Return on assets 4.8% 5.7% 13.7% 5.0% (2.5%)
Revenue per employee $1,000,000 $735,139 $735,766 $891,167 $715,638
Profit per employee $84,937 $93,771 $186,282 $85,765 ($41,983)
SOURCE: COMPANY FILINGS M A R K E T L I N E

United Kingdom - Coal 0183 - 2400 - 2012
© MARKETLINE THIS PROFILE IS A LICENSED PRODUCT AND IS NOT TO BE PHOTOCOPIED Page | 25
Figure 14: Rio Tinto: revenues & profitability
SOURCE: COMPANY FILINGS M A R K E T L I N E
Figure 15: Rio Tinto: assets & liabilities
SOURCE: COMPANY FILINGS M A R K E T L I N E
United Kingdom - Coal 0183 - 2400 - 2012
© MARKETLINE THIS PROFILE IS A LICENSED PRODUCT AND IS NOT TO BE PHOTOCOPIED Page | 26
Scottish Coal
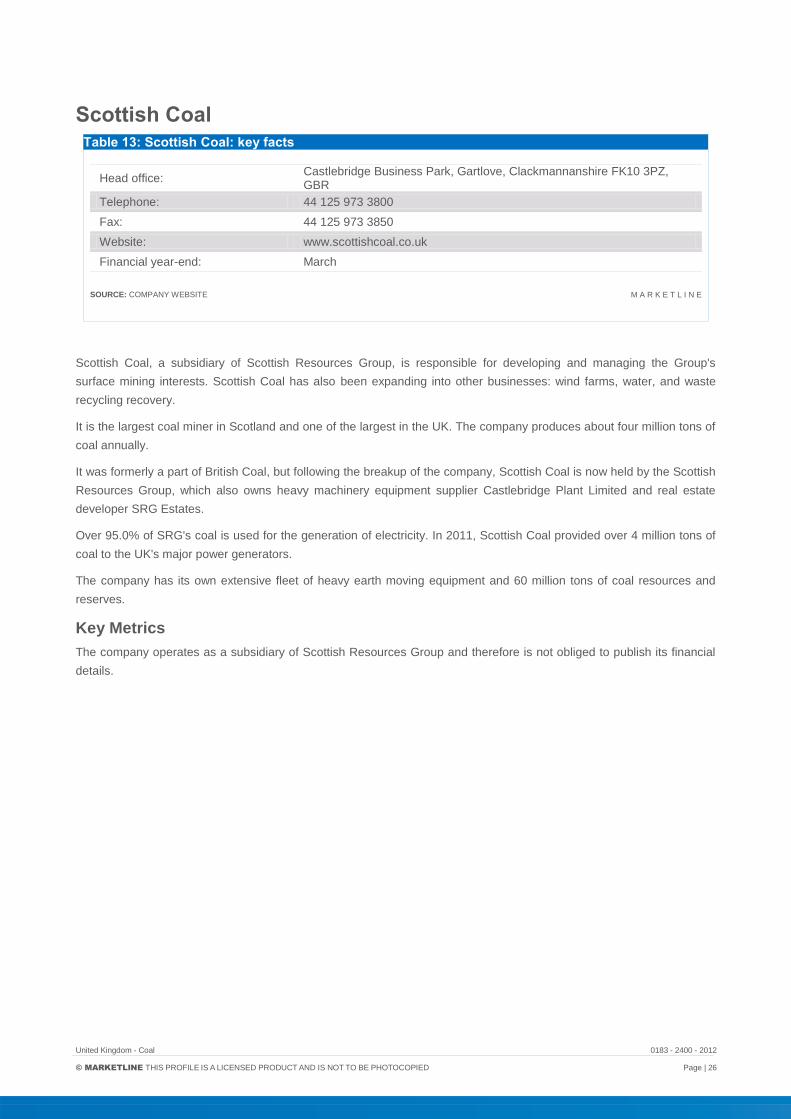
Table 13: Scottish Coal: key facts
Head office: Castlebridge Business Park, Gartlove, Clackmannanshire FK10 3PZ, GBR
Telephone: 44 125 973 3800
Fax: 44 125 973 3850
Website: www.scottishcoal.co.uk
Financial year-end: March
SOURCE: COMPANY WEBSITE M A R K E T L I N E
Scottish Coal, a subsidiary of Scottish Resources Group, is responsible for developing and managing the Group's
surface mining interests. Scottish Coal has also been expanding into other businesses: wind farms, water, and waste
recycling recovery.
It is the largest coal miner in Scotland and one of the largest in the UK. The company produces about four million tons of
coal annually.
It was formerly a part of British Coal, but following the breakup of the company, Scottish Coal is now held by the Scottish
Resources Group, which also owns heavy machinery equipment supplier Castlebridge Plant Limited and real estate
developer SRG Estates.
Over 95.0% of SRG's coal is used for the generation of electricity. In 2011, Scottish Coal provided over 4 million tons of
coal to the UK's major power generators.
The company has its own extensive fleet of heavy earth moving equipment and 60 million tons of coal resources and
reserves.
Key Metrics
The company operates as a subsidiary of Scottish Resources Group and therefore is not obliged to publish its financial
details.

United Kingdom - Coal 0183 - 2400 - 2012
© MARKETLINE THIS PROFILE IS A LICENSED PRODUCT AND IS NOT TO BE PHOTOCOPIED Page | 27
UK Coal Production Limited
Table 14: UK Coal Production Limited: key facts
Head office: Harworth Park, Blyth Road, Harworth, Doncaster, South Yorkshire, DN11 8DB
Telephone: 44 1302 751 751
Website: www.ukcoal.com
SOURCE: COMPANY WEBSITE M A R K E T L I N E
UK COAL Production Limited is involved in coal mining. The group primarily operates in the UK.
The group operates through two business segments: deep mining, surface mining.
The group operates three deep mines located in central and northern England. The group estimated total reserves of
approximately 100 million tons and produces 3.2 million tons per year. The closed/sold deep mines consist of the closed
Rossington colliery. UK COAL generates electricity from mines methane at both operating and closed sites.
The group's surface mining segment includes all mining activities at surface level together with the plant hire operations
of the group. It consists of six active coaling surface mines and consent to mine one further site. This segment produces
1.8 million tons of coal per year.
Key Metrics
UK Coal Production Limited is a private company and does not publish its financial details.
United Kingdom - Coal 0183 - 2400 - 2012
© MARKETLINE THIS PROFILE IS A LICENSED PRODUCT AND IS NOT TO BE PHOTOCOPIED Page | 28
MACROECONOMIC INDICATORS
Country Data
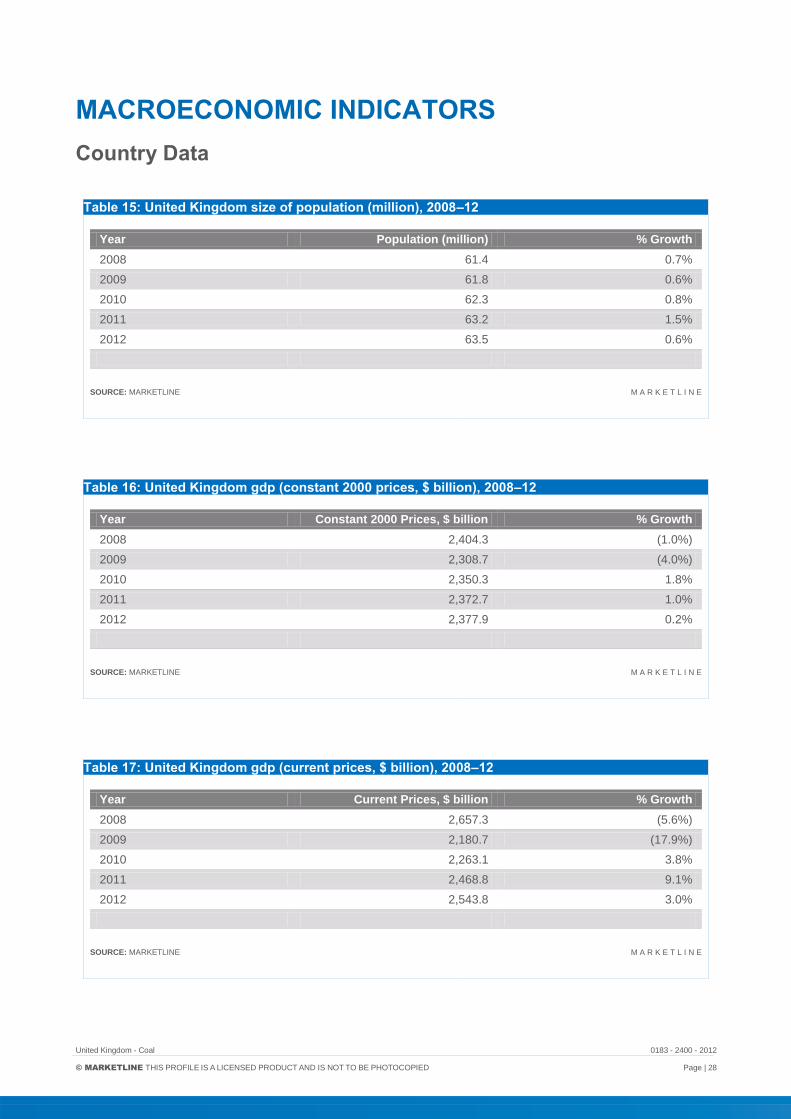
Table 15: United Kingdom size of population (million), 2008–12
Year Population (million) % Growth
2008 61.4 0.7%
2009 61.8 0.6%
2010 62.3 0.8%
2011 63.2 1.5%
2012 63.5 0.6%
SOURCE: MARKETLINE M A R K E T L I N E
Table 16: United Kingdom gdp (constant 2000 prices, $ billion), 2008–12
Year Constant 2000 Prices, $ billion % Growth
2008 2,404.3 (1.0%)
2009 2,308.7 (4.0%)
2010 2,350.3 1.8%
2011 2,372.7 1.0%
2012 2,377.9 0.2%
SOURCE: MARKETLINE M A R K E T L I N E
Table 17: United Kingdom gdp (current prices, $ billion), 2008–12
Year Current Prices, $ billion % Growth
2008 2,657.3 (5.6%)
2009 2,180.7 (17.9%)
2010 2,263.1 3.8%
2011 2,468.8 9.1%
2012 2,543.8 3.0%
SOURCE: MARKETLINE M A R K E T L I N E

United Kingdom - Coal 0183 - 2400 - 2012
© MARKETLINE THIS PROFILE IS A LICENSED PRODUCT AND IS NOT TO BE PHOTOCOPIED Page | 29
Table 18: United Kingdom inflation, 2008–12
Year Inflation Rate (%)
2008 3.6%
2009 2.2%
2010 3.3%
2011 4.5%
2012 2.8%
SOURCE: MARKETLINE M A R K E T L I N E
Table 19: United Kingdom consumer price index (absolute), 2008–12
Year Consumer Price Index (2000 = 100)
2008 108.5
2009 110.8
2010 114.5
2011 119.6
2012 123.0
SOURCE: MARKETLINE M A R K E T L I N E
Table 20: United Kingdom exchange rate, 2008–12
Year Exchange rate ($/£) Exchange rate (€/£)
2008 0.5449 0.7973
2009 0.6416 0.8921
2010 0.6475 0.8589
2011 0.6235 0.8 74
2012 0.6311 0.8111
SOURCE: MARKETLINE M A R K E T L I N E
United Kingdom - Coal 0183 - 2400 - 2012
© MARKETLINE THIS PROFILE IS A LICENSED PRODUCT AND IS NOT TO BE PHOTOCOPIED Page | 30
APPENDIX
Methodology MarketLine Industry Profiles draw on extensive primary and secondary research, all aggregated, analyzed, cross-
checked and presented in a consistent and accessible style.
Review of in-house databases – Created using 250,000+ industry interviews and consumer surveys and supported by
analysis from industry experts using highly complex modeling & forecasting tools, MarketLine’s in-house databases
provide the foundation for all related industry profiles
Preparatory research – We also maintain extensive in-house databases of news, analyst commentary, company
profiles and macroeconomic & demographic information, which enable our researchers to build an accurate market
overview
Definitions – Market definitions are standardized to allow comparison from country to country. The parameters of each
definition are carefully reviewed at the start of the research process to ensure they match the requirements of both the
market and our clients
Extensive secondary research activities ensure we are always fully up-to-date with the latest industry events and
trends
MarketLine aggregates and analyzes a number of secondary information sources, including:
- National/Governmental statistics
- International data (official international sources)
- National and International trade associations
- Broker and analyst reports
- Company Annual Reports
- Business information libraries and databases
Modeling & forecasting tools – MarketLine has developed powerful tools that allow quantitative and qualitative data to
be combined with related macroeconomic and demographic drivers to create market models and forecasts, which can
then be refined according to specific competitive, regulatory and demand-related factors
Continuous quality control ensures that our processes and profiles remain focused, accurate and up-to-date

United Kingdom - Coal 0183 - 2400 - 2012
© MARKETLINE THIS PROFILE IS A LICENSED PRODUCT AND IS NOT TO BE PHOTOCOPIED Page | 31
Industry associations
Energy Information Administration
1000 Independence Avenue, SW, Washington, DC 20585, US
Tel.: 1 202 586 8800
Fax: 1 202 586 9753
www.eia.doe.gov
World Coal Institute Cambridge House, 180 Upper Richmond Road, Putney, London SW15 2SH, UK
Tel.: 44 20 8246 6611
Fax: 44 20 8246 6622
www.wci-coal.com
Related MarketLine research
Industry Profile
Coal in Belgium
Coal in the Netherlands
Coal in Canada
Coal in Western Europe
Coal in Eastern Europe

MARKETLINE | 119 FARRINGDON ROAD | LONDON,
UNITED KINGDOM, EC1R 3DA
T: +44 161 238 4040 | F: +44 870 134 4371
df
Copyright © 2022 FDOKUMEN